
Unit-I Vehicle Performance Parameters - Government College ...
Upload
khangminh22Category
view
4download
0
R EGU LA TING THE PER FO RMAN C E
PARAM ETER S OF ACC ELE RATED
P AR TIC LES
BY
ASHRAF ALI MOHAMMED EL-SAFTAWY
A thesis submitted in partial fulfillment
of
DOCTOR OF PHILOSPHY
In
Physics
(Experimental Physics)
Department of Physics
Faculty of Science
Zagazig University
2013

Zagazig University
Faculty of Science
Physics Department
R EGU LA TING THE PER FO RMAN C E
PARAM ETER S OF ACC ELE RATED
PAR TIC LES
BY
ASHRAF ALI MOHAMMED EL-SAFTAWY
(M.Sc.)
Under the supervision of:
Prof. Dr. Ahmed Elfalaky Elsayed
Prof. of solid state physics, Faculty of science, Zagazig University
Prof. Dr. Safwat Ghaly Zakhary
Prof. of accelerators Engineering,
NRC, Atomic Energy Authority.
Prof. Dr. Magdi Safwat Ragheb
Prof. of accelerators physics, NRC,
Atomic Energy Authority.

Approval Sheet
R EGU LA TING THE PER FO RMAN C E
PARAM ETER S OF ACC ELE RATED
PAR TIC LES
BY
ASHRAF ALI MOHAMMED EL-SAFTAWY
(M.Sc.)
This thesis for Ph. D. Degree has been
Approved by:
Prof. Dr. Abdel Fattah I. Helal
(Prof. of physics, Nuclear Research Center,
Atomic Energy Authority)
Prof. Dr. Ahmed M. Youssef
(Prof. of Physics, Thebes higher institute of
Engineering, Thebes Academy )
Prof. Dr. Ahmed Elfalaky Elsayed
(Prof. of solid state physics, Faculty of science,
Zagazig University)
Date of examination: 21 / 1 / 2013.

Dedication
I dedicate this work to my wife, who embodies all those things that are noble in humanity. I am truly privileged to be in her
life. She with my sons gave me causes of happiness.

ABSTRACT
Design, fabrication and utilization of electron sources have gained
unique importance in fundamental research and industrial applications.
In any electron gun the geometry of the electrodes decides the main
beam optics comprising of uniform flow of electrons and beam waist. So
that, in the present work, A Pierce-type electron gun with spherical
anode has been numerically analyzed and validated experimentally. The
regulated output beam is applied to poly (ethylene terephthalate) PET
membrane to improve its surface wettability.
In the simulation study of the electron gun, it has been proven that,
around a certain value of the aspect ratio, the resultant beam geometry
could be suitably controlled. The minimum electric field required to
prevent beam expansion due to space charge effect has been estimated
and it is found to be proportional to the cubic root of the distance from
the anode to the target. Also, it is proved that the minimum beam radius
is realized at the minimum beam perveance and the maximum beam
convergence angle. As a result, this reveals that, the gun geometry
controls the beam emittance. The gun design analysis proposed here
helps to choose the better operating conditions suitable for low energy
electron beam bombardment and/or injection applications into plasma
medium for plasma acceleration.
Experimentally, an investigation has been made for the extraction
characteristics and beam diagnosis for the electron gun. The accelerating
voltage increases the electron beam currents up to 250 mA at
accelerating voltage 75kV and decreases the beam perveance, beam
waist and beam emittance. The minimum beam radius could be found at
the minimum beam perveance and maximum convergence angle. Also
ii
Abstract
the increase of the accelerating voltage increases the beam fluence rate
up to 1.3 x 10¹⁹ e/min.cm2 due to the increase of the extracted current.
Tracing the electron beam profile by X-Y probe scanner along the beam
line at two different places reveals that the spherical anode produces an
convergent beam. The electron beam could be suited for the two
suggested experiments in our lab, surface modifications of polymers and
plasma acceleration.
By using a low energy electrons a number of investigation are
being carried out in several areas such as, irradiation effects on surface
properties of semiconductors, metals and polymers. In this work, the
PET membranes were treated by low energy electron beam with
different fluence. The induced surface modifications and the wettability
of the electron beam treated PET membranes are studied and analyzed
by different methods. CASINO V2.481 Monte Carlo based simulation
software is used to investigate the electrons diffusion into the PET
membrane which is found to diffuse to the range 70m at accelerating
voltage 75kV. Also it is used to study the deposited energy distribution
into PET membrane. It shows that the deposited electron energy is
Gaussian distributed. Fourier transform infrared spectroscopy (FTIR)
shows the creation of hydrophilic groups on the surface which are
responsible for the increase of surface hydrophilicity and wettability.
The atomic force microscopy (AFM) observation reveals that the surface
topography changes after electron beam treatment. The increased
wettability of the PET membrane is studied by employing the contact
angle method and surface free energy analysis. The contact angle
decreases and the surface free energy increases upon electron beam
treatments. Electron beam treatment of PET film improves its
wettability, adhesion and then its biocompatibility.

ACKNOWLEDGEMENT
Praise is to ALLAH, who guided me through all my life.
Words fail to express my supreme appreciation to Prof. Dr. Ahmed
Elfalaky Elsayed (professor of solid state physics, faculty of science, Zagazig
University) for his supervision, helpful discussions and encouragement during
all stages of this work.
I am greatly honored to express my deepest gratitude to Prof. Dr.
Safwat Ghaly Zakhary (professor of accelerators engineering, NRC, atomic
energy authority) for his useful discussions, continuous assistance and valuable
supervision. His fatherly attitude has been my inspiration during the
preparation of this thesis.
Much appreciation and thanks is due to Prof. Dr. Magdi Safwat
Ragheb (professor of accelerators physics, NRC, atomic energy authority) for
his sincere advice and generous offer of his expanded experience. His
observations and comments helped this work to attain its present shape.
I would like to express my deep thanks to Dr. Nermeen Atef Halim for
her generous help and contribution in this work to its final accomplishment.
A special word of deep thanks is extended to my colleages; Prof. Dr.
Moustafa Abdelrahman for providing SIMION simulation program and
helping in its usage also Dr. Barakat Ali for providing the polymer samples
and the technicians staff, Mr. Fawzy Elshenawy, Mr. Arafa Galal, Mr.
Magdy T. Kolla, Mr. Ibrahim M. Abdelbaki and Mr. Mohamed T.
Elfasakhani for their help in solving the technical problems. Much thanks to
all the staff of accelerators and ion sources department for their good
cooperation and interest.
My parents have been of a major influence in all my success. I would
like to say big Thanks to them for everything. Finally I cannot forget to thank
whom departed from this life and left a big impact on me; Prof. Dr. Nagwa
Fahim Zahran, Eng. Fawzi Abdullah Salama and Mr. Ahmed Mohamed
Hashish (Allah bless them all and make them rest in peace).
Saftawy-Ashraf Ali El

CONTENTS
ABSTRACT
ACKNOWLEDGEMENT
LIST OF TABLES
LIST OF FIGURES
CHAPTER 1
"INTRODUCTION"
1.1. Electron emission sources…………………………………………1
1.1.1. Thermionic emission………………………………………..1
1.1.2. Field emission………………………………………………3
1.1.3. Photo emission……………………………………………...4
1.2. Beam quality parameters…………………………………………..4
1.2.1. Beam perveance…………………………………………….4
1.2.2. Beam emittance and brightness……………………………..5
1.2.3. Beam energy and energy spread…………………………....8
1.3. Industrial electron accelerators……………………………….........9
1.3.1. High voltage dc accelerators………………………………..9
1.3.1.1. Electron acceleration tubes…………………….....9
1.3.1.2. High voltage generators…………………………10
1.3.1.3. Cockcroft-Walton voltage multiplier……………10
1.3.1.4. Dynamitron……………………………………...12
1.3.2. Linear accelerators……………..………………………….12
1.3.3. Cyclotron…………………..……………………………....16
1.3.4. Synchrotron………………………………………………..17

v
Contents
1.3.5. Radio frequency accelerators……………………………..18
CHAPTER 2
"ELECTRON BEAM PROCESSING"
2.1. Physical aspects of electron beam processing……………………21
2.1.1. Penetration depth…………………………………………..21
2.1.2. Absorbed dose, beam fluence and energy fluence.………..21
2.1.3. Beam distribution uniformity and throughput...…………...23
2.2. Surface structure and wettability of materials…….……………...23
2.2.1. Surface irregularities investigation methods….…………...23
2.2.2. Hydrophilic vs. hydrophobic; meaning of contact angle….24
2.3. Radiation processing applications; selected examples…………...26
2.3.1. Radiation technology in food irradiation………………….26
2.3.2. Radiation technology in medical applications…..………...27
2.3.3. Pollution Control, Cleaning of Flue Gases and Sewage
Sludge Treatment………………………………………….28
2.3.4. Synchrotron radiation……………………………………..29
2.4. Electron beam processing of polymeric materials……………….31
2.4.1. A brief overview of polymer structure and classification…31
2.4.2. Polymer crosslinking……………………………………...35
2.4.2.1. Insulated wires and cables………………………….37
2.4.2.2. Heat-shrinkable materials…………………………..37
2.4.2.3. Hydrogels…………………………………………...38
2.4.3. Polymer degradation………………………………………38
2.4.3.1. Cellulose degradation………………………………39
2.4.3.2. Degradation of polypropylene (PP)………………...39
2.4.4. Electron beam polymer grafting...………………………..39

vi
Contents
CHAPTER 3
"EXPERIMENTAL METHODS"
3.1. Electron gun components…….………………………………….42
3.2. The vacuum system ……………………………………………..44
3.3. Electron beam and emittance measuring devices..……..………..45
3.3.1. Electron beam collector…………………………….45
3.3.2. Emittance measuring device………………………..46
3.4. Materials and experimental methods employed………………….49
3.4.1. Poly (ethylene terephthalate) (PET)………….…….49
3.4.2. Fourier transform infrared (FTIR) spectroscopy…...50
3.4.3. Atomic force microscope (AFM)…………………..51
3.4.4. Contact angle and surface free energy analysis…....52
RESULTS & DISCUSSION PART I
CHAPTER 4
“NUMERICAL SIMULATION OF BEAM FORMATION IN AN
ELECTRON GUN FOR DIFFERENT APPLICATION”
4.1. Theoretical model description……………………………………55
4.2. Gun geometry effect on electron beam perveance ………………57
4.3. Anode lens effect …..…………………………………………….59
4.4. Effect of equi-potential lines on the electron beam geometry…...63
4.5. Minimum electric field required to prevent space charge effect…65
4.6. Electron beam waist……………………………………………...66
RESULTS & DISCUSSION PART II
CHAPTER 5

vii
Contents
“INVESTIGATION OF BEAM PERFORMANCE PARAMETERS
IN A PIERCE-TYPE ELECTRON GUN”
5.1. Studying electron beam intensity and perveance………………...71
5.2. Tracing electron beam profile and emittance analysis…………...73
5.3. Electron beam fluence calculation…………………………….....80
RESULTS & DISCUSSION PART III
CHAPTER 6
“ELECTRON BEAM INDUCED MODIFICATION OF POLY
(ETHYLENE TEREPHTHALATE) MEMBRANE SURFACE”
6.1. Electron beam interaction with PET film: a simulation study…...84
6.2. FTIR analysis………………………………………………….....88
6.3. Morphological analysis: AFM results……………………………91
6.4. Wettability analysis: electron beam fluence vs. contact angle…...93
6.5. Evaluating SFE and adhesion properties of the PET film...……...94
6.5.1. One liquid model: Neumann (N) analysis………………...95
6.5.2. Two liquids model: Owens and Wendt (OW) approach for
SFE calculation……………………………………………99
SUMMARY AND CONCLUSION………………………………….105
REFFERENCES ……………………………………………………..110

ix
LIST OF TABLES
Table Title Page
5.1
Beam fitting parameters.
75
5.2 Variation of beam geometry and emittance with energy. 80
6.1 Surface roughness as a function of electron beam
fluence.
93
6.2 SFE of PET film as a function of electron beam fluence
for different measuring liquids.
97
6.3 The measuring liquids SFE and its components (OW
model).
101
6.4 Components for work of adhesion of PET film for
water (polar) and diiodomethane (non-polar).
103
LIST OF FIGURES
Figure Title Page
1.1
Thermionic electron gun.
3
1.2 Concept of beam emittance 7
1.3 Accelerator acceptance with relation to emittance
definition in phase space.
8
1.4 Accelerating tube with cup-shaped discs equipped in a
single gap accelerator.
10
1.5 Cockcroft-Walton voltage multiplier. 11
1.6 Dynamitron diagram. 12
1.7 Multi-stage high voltage linear accelerator of Wideröe-
type.
13
1.8 Alvarez type of Linear accelerators. 15
1.9 A schematic diagram of a Cyclotron. 16
1.10 A schematic diagram of a synchrotron. 18
1.11 Beam trajectories in rhodotron (a) and a real photo (b). 19
2.1 Contact angle and its relation to materials hydrophilicity
and hydrophobicity.
25
2.2 Actual medical linear accelerator used for cancer
diagnosis and treatment.
27
2.3 Electron beam plant used for wastewater treatment. 29
2.4 Synchrotron radiation accelerator complex. 30
2.5 Structure of poly ethylene (a) and PTFE (b) (the shaded
block represent the monomer unit).
31
2.6 Schematic representations of (a) random, (b) alternating,
(c) block and (d) graft copolymers.
32

xi
List of Figures
2.7 Schematic representations of (a) linear, (b) branched, (c)
crosslinked and (d) network.
33
2.8 Polymer chains crosslinking illustration: a) no
crosslinking and b) crosslinking exist.
36
3.1 The experimental apparatus components. 41
3.2 Electron gun configurations. 42
3.3 The porous cathode with the filament (a) and the spherical
anode (b).
43
3.4 Electron beam density measuring device (FC). 46
3.5 Electron beam scanner ((1) coaxial insulated rod. (2) The
upper middle flange of the field free region. (3) Motors.
(4) Metallic square sheet. (5) Screw rods. (6) Central
cuboid. (7) Sliding resistance. (8) Micro-switch. (9) Two
perpendicular cylindrical rods).
47
3.6 Molecular structure of PET film monomer. 49
3.7 Sample holder. 50
3.8 AFM working principle. 52
4.1 Electron gun and beam configuration geometry. 57
4.2 Dependence of the electron beam perveance on the
electrode geometry.
59
4.3 Dependence of the focal length of the anode lens on the
electrode geometry.
61
4.4 Dependence of the beam convergence angle on the gun
geometry.
63
4.5 Equi-potential lines distribution and the beam shape for
different accelerating voltages; a) 25kV, b) 50kV and c)
75kV.
64
4.6 Electric field distribution outside (right) and inside the
beam (left).
67
xii
List of Figures
4.7 Dependence of the minimum output beam radius on the
electrode geometry.
69
5.1 Electron beam current and perveance as a function of the
accelerating voltages.
72
5.2 Electron beam profile traced at 20mm from the anode
aperture.
73
5.3 Electron beam profile traced at 150mm from the anode
aperture.
74
5.4 Gaussian fit for beam profile traced at 150mm for
different accelerating voltages; a) 36kV, b) 48kV, c) 60kV
and d) 75kV., Where ( ____ ) is the cumulative fit peak,
(-----) is the fit peak 1 and 2, and (…) is the base line.
75
5.5 Beam radius at waist variation with beam perveance. 78
5.6 Influence of accelerating voltage on fluence rate. 81
5.7 Calibration of electron beam fluence at energy 75keV. 81
6.1 The pear of diffusion into PET film for different energies
a) 45keV, b) 60keV and c) 75keV.
85
6.2 Maximum penetration depth of electrons into PET film at
energy 75keV.
86
6.3 Top view of the electron beam absorbed energy into PET
film at 75keV accelerating voltage.
87
6.4 Cross-section view of the electron beam absorbed energy
into PET film at 75keV accelerating voltage.
87
6.5 FTIR spectra of PET film before electron beam treatment. 88
6.6 FTIR spectrum of PET film before and after electron
beam treatment; a) decrease of C=O at 1725cm-1, b)
decrease of C-H intensity at 731cm-1, c) increase of H-
C=O intensity at 2907cm-1 and d) appearance and increase
of –OH group at 3334cm-1.
90

xiii
List of Figures
6.7 AFM images of electron beam treated PET film with
different fluence.
92
6.8 Contact angle for different measuring liquids as a function
of electron beam fluence.
94
6.9 Characteristic curve for SFE of a solid as a function of
contact angle.
96
6.10 Work of adhesion of PET film with different liquids as a
function of electron beam fluence.
98
6.11 The SFE of PET film as a function of the electron beam
fluence for a) water-diiodomethane and b) glycerol-
diiodomethane.
102

Chapter 1
INTRODUCTION

Chapter 1 Introduction
CHAPTER 1
Introduction
A charged particle beam is a group of particles that have about the
same kinetic energy and move in about the same direction. The high ki-
netic energies and good directionality of charged particles in beams make
them useful for applications such as, beam lithography for micro circuits,
thin film technology, radiation processing of materials, and free electron
laser [Humphries, 1990]. Electron beam technology has a wide applica-
tion in various fields including high energy physics, industrial and mate-
rial research. Electron beams were used in such devices as cathode ray
tubes, X-ray tubes, electron microscopes, and charged particle accelera-
tors. The development of electron beam devices has long history [Bakish,
1962] and electron beam technology has undergone several changes over
the years [Schulz, 2002]. An indispensable part of each electron-optical
system is the electron gun in which a beam of accelerated electrons is
generated. Much works has been done in the design of different types of
electron guns [McGinn et al., 1991, Ohgo et al., 1991 and Iiyoshi et al.,
1995]. Depending on the applications, these guns differ widely with re-
spect to beam power, accelerating voltage, electron beam current, power
density and beam diameters [Masood et al., 2008].
1.1. Electron Emission Sources
1.1.1. Thermionic Emission
Thermionic emission is the heat flow of charge carriers from a sur-
face. This occurs because the thermal energy given to the carriers over-
comes the forces restraining it. The charge carriers can be electrons or

- 2 - Chapter 1
ions. In any solid metal, there are one or two electrons per atom that are
free to move from atom to atom. To escape from the metal, electrons ki-
netic energy must be at least equal to the work done in passing through
the surface. The minimum amount of energy needed for an electron to
leave a surface is called the work function. The work function is a charac-
teristic for the material. Thermionic currents can be increased by decreas-
ing the work function. If the heated surface forms a cathode, then at a
given temperature T (oK), the maximum current density emitted is given
by Richardson's law [Iqbal et al, 2005]:
kT
E
G
W
eTAJ 2 (1.1)
where EW is the work function, AG is a constant depending on the cath-
ode material and k is Boltzmann constant. It can be seen that the most
important parameter for thermionic emission is the work function. The
work function must be as low as possible to use a cathode at an accepta-
ble temperature. Because of the exponential function, the current increas-
es rapidly with temperature when kT<EW . Thermionic emitters are used
in electron tubes and in electron guns, as for example in klystrons, weld-
ing, industrial materials processing and in accelerators [Iqbal et al, 2005].
Thermionic electron guns may have different forms depending on
the application. All electron guns utilize an electron source of some kind
with the majority using a thermionic source as shown in fig (1.1). A
thermionic electron gun works in the following manner [Shillar, 1982]; a
positive electrical potential is applied to the anode. The filament (cath-
ode) is heated until a stream of electrons is produced. The electrons are
then accelerated by the positive potential. A negative electrical potential

- 3 - Introduction
is applied to the wehnelt cap. As the electrons move toward the anode any
ones emitted from the filaments side are repelled by the wehnelt cap to-
ward the optic axis. A collection of electrons occurs in the space between
the filament tip and the wehnelt cap. This collection is called the space
charge. Those electrons at the bottom of the space charge (nearest to the
anode) can exit the gun area through the small hole in the anode. The
voltage potential between the cathode and the anode plate accelerate the
electrons down the column and is known as the accelerating voltage.
Fig (1.1). Thermionic electron gun.
1.1.2. Field Emission
Electron field emission (EFE) is an emission of electrons induced
by external electromagnetic fields. EFE can happen from solid and liquid
surfaces, or individual atoms into vacuum or open air, or results in pro-
motion of electrons from valence to conduction bands of semiconductors.
The application of a high voltage between a fine point cathode and an an-
ode gives a sufficient energy to an electron so that it escapes from the
Filament current
supplyWehnelt
Bias
resistor
high
voltage
supply
Cross-overFilament
anode

- 4 - Chapter 1
cathode surface. This phenomenon is known as high field emission. The
current density eEJ emitted by such a point is given by:
32 2
6 71.54 10 6.83 10 W
eE
E EJ X Exp X K
E
(1.2)
where E is the electric field at the emitter, EW is the work function, K is
constant approximately equal to 1 and Ф is the electron energy. The ma-
jor disadvantage of this type of electron sources is that an excessive cur-
rent density can destroy the points either by erosion or self-heating [Iqbal
et al, 2005].
1.1.3. Photo Emission
Photons illuminating a metal surface may also liberate electrons. If
the photon has energy at least equal to the work function, then the elec-
trons will be emitted. To obtain reasonable emission with normal wave-
lengths, a low work function material is needed. Intense electron beams
require intense light sources, and lasers have been used to obtain very
short high intensity electron pulse trains intended for the generation of
microwave power of future linear colliders [Iqbal et al, 2005].
1.2. Beam Quality Parameters
1.2.1. Beam Perveance
An important parameter of the beams which characterizes the beam
intensity is the beam perveance that is determined by:

- 5 - Introduction
3
2
a
IP
U (1.3)
where I is the beam current expressed in amperes and aU is the accelerat-
ing voltage expressed in volts. If the beam current is expressed in micro-
amperes, the above parameter is sometimes called micro-perveance. It is
known from experiments and computations that in electron beams the
space charge effects become appreciable at perveance values P ≥ 10-2
μperv [Molokovsky et al, 2005].
1.2.2. Beam Emittance and Brightness
Beams extracted from different types of electron sources have to be
transmitted without any loss. It is very important that the particles strike
the target should have the parameters required for the target application.
For a beam transmission without loss of the particles, the cross section of
the beam must not exceed a given maximum value of a well defined
point. To achieve this we introduce an important quantity known as emit-
tance [Humphries, 1990 and El-Saftawy 2007]. The emittance is an im-
portant aspect for high-quality beam, which is basically defined by the
product of the width and the transverse velocity spread of the beam (re-
gion of phase space occupied by beam). If the beam is densely packed,
then the emittance is said to be low and if it is somewhat spread out, it
possess high emittance [Herrmann, 1958, Reiser, 1994 and Masood et al.,
2008].
Any electron beam is described in a six dimensional phase space
(x, y, z, px, py, pz). Where (x, y, z) represents the position of the electrons
and (px, py, pz) is the components of momentum of the electrons. The
- 6 - Chapter 1
emittance of the beam must be invariant and independent of any electro-
static or magnetic fields through which the beam passes, relates to Liovil-
le's theorem [Forrester, 1988 and Abdelrahman, 2004]. Lioville's theorem
states that the motion of charged particles under the action of conserva-
tive fields is such that the local number density in the six dimensional
phase space is a conservative quantity. If a group of ions or electrons are
accelerated through the same potential difference and traveling with small
angles relative to the z-direction, we can say that they have a very small
spread in z directed velocities and that this spread is an invariant. Then
the phase space (x, y, px, py) should be an invariant of the beam. For a
beam with cylindrical symmetry this implies that the two dimensional ar-
ea with coordinates (r, pr) should be an invariant. The transverse phase
space areas are proportional to the emittance of the beam which is conse-
quently also conserved.
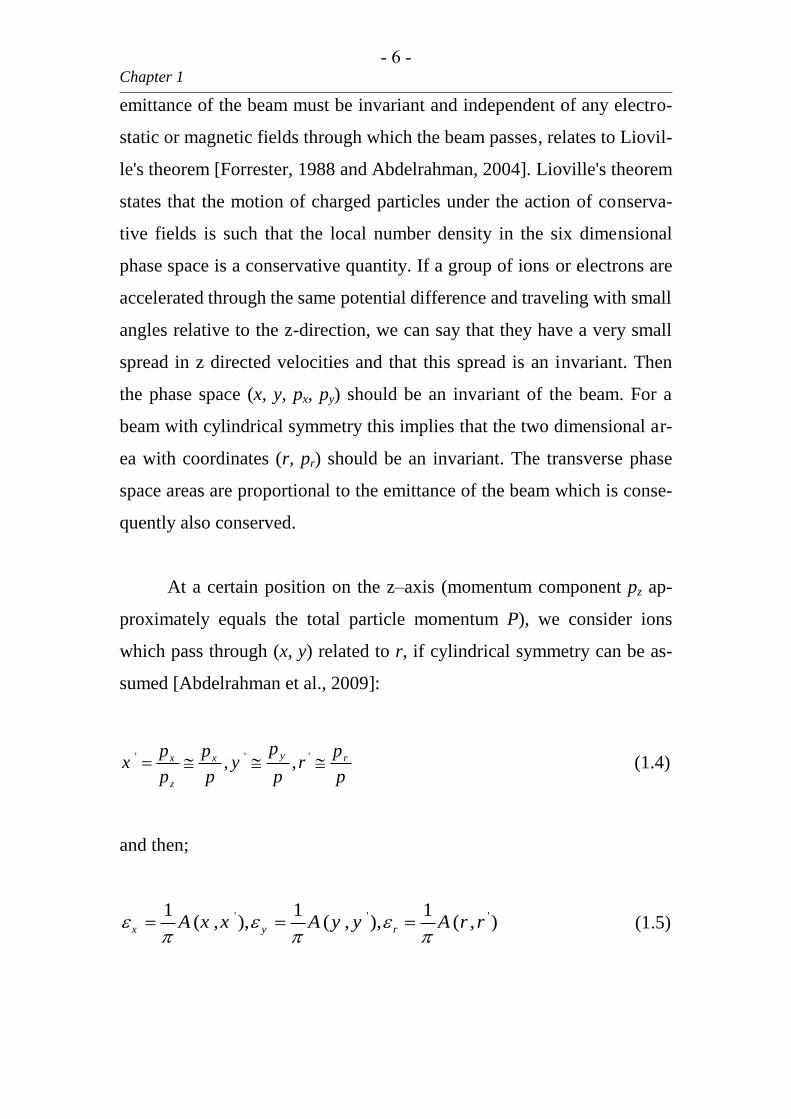
At a certain position on the z–axis (momentum component pz ap-
proximately equals the total particle momentum P), we consider ions
which pass through (x, y) related to r, if cylindrical symmetry can be as-
sumed [Abdelrahman et al., 2009]:
' ' ', ,
yx x r
z
pp p px y r
p p p p (1.4)
and then;
' ' '1 1 1( , ), ( , ), ( , )x y rA x x A y y A r r
(1.5)
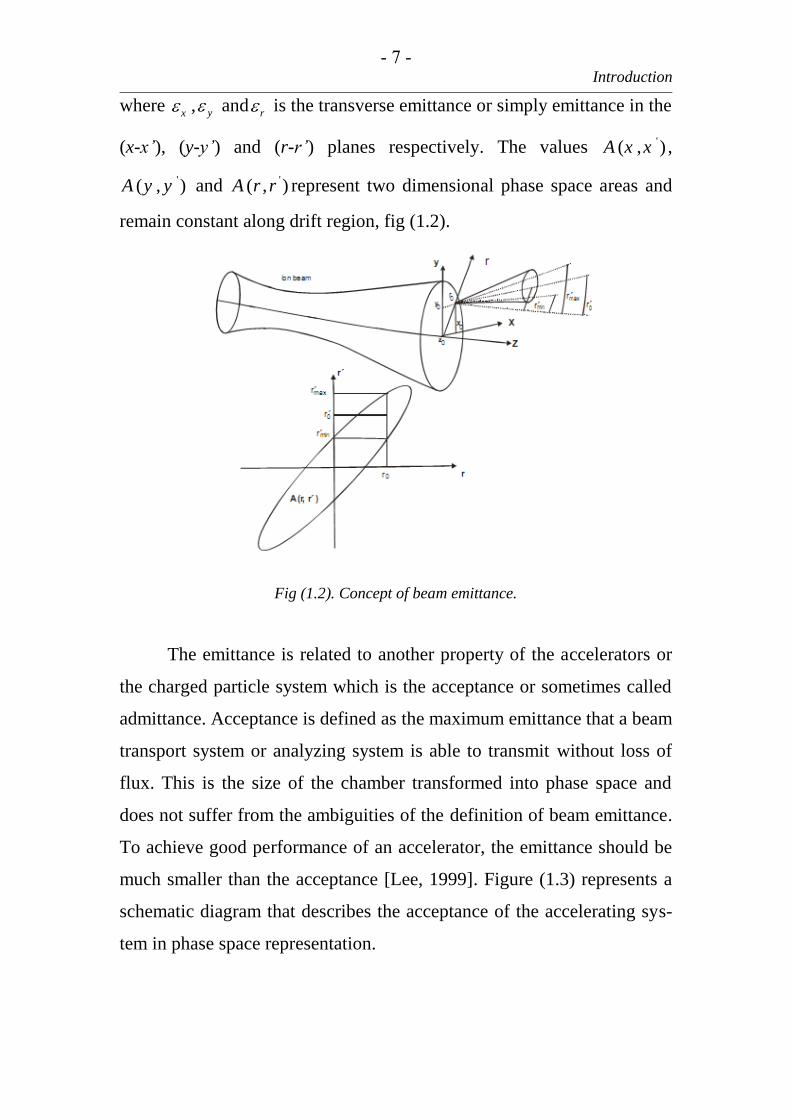
- 7 - Introduction
where x ,
y andr is the transverse emittance or simply emittance in the
(x-x’), (y-y’) and (r-r’) planes respectively. The values '( , )A x x ,
'( , )A y y and '
( , )A r r represent two dimensional phase space areas and
remain constant along drift region, fig (1.2).
Fig (1.2). Concept of beam emittance.
The emittance is related to another property of the accelerators or
the charged particle system which is the acceptance or sometimes called
admittance. Acceptance is defined as the maximum emittance that a beam
transport system or analyzing system is able to transmit without loss of
flux. This is the size of the chamber transformed into phase space and
does not suffer from the ambiguities of the definition of beam emittance.
To achieve good performance of an accelerator, the emittance should be
much smaller than the acceptance [Lee, 1999]. Figure (1.3) represents a
schematic diagram that describes the acceptance of the accelerating sys-
tem in phase space representation.

- 8 - Chapter 1
Fig (1.3). Accelerator acceptance with relation to emittance definition in phase space.
Another figure of merit used for characterizing the electron beam
quality is the beam brightness which is defined as [Winter, 1967],
2 2
2
r
IB
(1.6)
It should be noted that if the emittance is constant, the beam brightness is
also a conserved quantity [Humphries, 1990].
1.2.3. Beam Energy and Energy Spread
One of the most important characteristics of the beam is the kinetic
energy. The beam energy is determined by overall potential difference
that the beam as they travel from the source to the final aperture of the
gun. This energy, measured in electron volts, is controlled by the energy
power supplies and can range from 5 eV to 100 keV depending on the
gun [Karzmark et al, 1993].

- 9 - Introduction
The energy spread of the beam is an important parameter, that is,
the width of the energy distribution of the electrons extracted from an
electron gun. The distribution of the initial energies of the electrons creat-
ed in the source should be a minimum [Wilson et al, 1973]. There are two
factors causes the energy spread: 1- The thermal energy that depends on
the electron temperature and 2- The variation of the potential of the point
in the source where an electron is created [Vali, 1977].
1.3. Industrial Electron Accelerators
1.3.1. High Voltage DC Accelerators
1.3.1.1. Electron Acceleration Tubes
Single- and multiple-gap acceleration tubes are used in dc ac-
celerators. Such tubes consist of (fig. (1.4)) metallic discs with cen-
tral aperture for the electron beam passage. These discs are bonded
to glass or ceramic rings to make a vacuum tight assembly. The discs
are connected to a string of resistors which provide intermediate
voltage between the cathode and the grounded anode. This produces
a uniform axial electric field inside the tube for accelerating the elec-
trons [Quintal, 1972, Farrell et al., 1975]. Relatively low field gradi-
ents of 12 up to 15kV/cm are typical in industrial accelerators. The
internal sections of the discs are cup-shaped to prevent the scattered
high energy electrons striking the insulating rings. Such effect could
damage the insulators and generate non-uniform radial electric
fields, which in turn make the beam unstable [Van de Graaff et al.,
1949, and Trump, 1957].

- 01 - Chapter 1
Fig. (1.4). Accelerating tube with cup-shaped discs in a single gap accelerator.
1.3.1.2. High Voltage Generators
Direct current industrial accelerators use high voltage dc genera-
tors, which ranges from a few kV’s up to 5MV. Conventional low-
frequency, iron core transformers and rectifiers are used for voltages up
to 750 kV. Multistage cascade rectifier circuits are needed for higher
voltages. The cascade rectifier circuits may be coupled in parallel or in
series. With series-coupled systems, the rectifier stages nearer to the input
ac power supply must transmit ac power to the farther stages. This in-
creases the internal impedance of the system and the voltage drop under
load. With parallel-coupled systems, all of the rectifier stages receive the
same input ac power, which reduces the internal impedance and reduces
the voltage drop under load [Scharf, 1986].
1.3.1.3. Cockcroft-Walton Voltage Multiplier
The earliest accelerating machines built by Cockcroft and Walton
in 1932 were electrostatic accelerators [Cockcroft et al, 1932]. They im-

- 00 - Introduction
parted energy to a charged particle by making it passes through a large,
steady, high voltage potential difference. Cockcroft-Walton accelerators
transmit ac power to multiple rectifier stages through two columns of
high voltage capacitors, which are connected in series. To achieve this
voltage, Cockcroft and Walton used an electronic voltage multiplier, fig.
(1.5). The voltage multiplier consists of a series of capacitors and rectifi-
ers. The diodes worked in concert with the alternating current supplied
through the transformer such that half the rectifiers were open and half
closed. This alternately charged the capacitors. When the voltage alter-
nates, some of the charge from the previously charged capacitors is
shared by the newly charged capacitors, increasing the voltage.
For a set of two rectifiers and two capacitors, the voltage supplied
by the transformer is doubled and the set is referred to as a voltage dou-
blers. The total output voltage of the system is approximately twice the
number of voltage doublers times the transformer voltage. The voltage is
applied to an accelerating tube and the charged particles, fed into the
tube, are thus accelerated [El-Saftawy, 2007].
Fig. (1.5) Cockcroft-Walton votage multiplier.

- 02 - Chapter 1
1.3.1.4. Dynamitron
Dynamitron voltage multiplier transmits high frequency ac power
to all the rectifier stages in parallel by means of semi-cylindrical elec-
trodes which surround the high voltage column. These electrodes are
connected to a high quality transformer and induce ac voltages between
pairs of semicircular corona rings. The corona rings are connected to the
rectifier junctions [Trump, 1957]. All the rectifier stages are connected in
series between the ground and the high voltage terminal. Electron accel-
erators of this type produce high voltages ranging from 0.4 MV to 5 MV
with electron beam power up to 250 kW using compressed CF6 insulation
[Galloway, et al., 2004]. Diagram of Dynamitron is shown in fig. (1.6).
Fig (1.6). Dynamitron diagram.
1.3.2. Linear Accelerators
In linear accelerators, the accelerator tube consists of a series of cy-
lindrical electrodes called drift tubes. In the Widerӧe linear accelerator,
the electrodes are coupled to a radio frequency generator in the manner
shown in figure (1.7). The high voltage generator gives a maximum volt-
age U which is applied to the electrodes by the radio frequency, so that

- 03 - Introduction
the electrodes alternate in the sign of the voltage at a constant high fre-
quency. If the particle arrives at the gap between the electrodes in a prop-
er phase with the radio frequency such that the exit electrode has the same
charge sign as the particle and the entrance electrode the opposite, the
particles reaccelerated across the gap [El-Saftawy, 2007]. Each time the
particles are accelerated at an electrode gap, they receive an increase in
energy of qU (q is the particle charge). For n electrode gaps, the total en-
ergy acquired is nqU. Inside the drift tubes, no acceleration takes place
since the particles are in a region of equal potential [Chao, 2009].
Fig (1.7). Multi-stage high voltage linear accelerator of Wideröe-type.
In the lower part of fig (1.7), the variation of potential at point A
with time is shown. In operation, a particle in a proper phase should ar-
rive at the acceleration gap at time to. Here two cases are considered
[Chao, 2012]:
1. If a particle has less energy, it takes longer time to traverse the
drift tube and arrives late at the gap at time t2. Since the poten-
tial is now higher, it receives a greater acceleration, thereby be-
coming more in phase.

- 04 - Chapter 1
2. If a particle is too energetic it arrives too early at the gap with
time t1 and receives a smaller acceleration.
The ion source is pulsating and this bunching of the ions not only
keeps the ions in phase for acceleration but also reduces the energy
spread in the beam. When the velocity approaches light velocity, phase
stability vanishes gradually because changes in energy now becomes
changes in mass and not in velocity. Since the velocity of the beam parti-
cles are increasing as they progress down the accelerator but the oscillator
frequency remains constant, it is necessary to make the drift tubes longer
to allow the beam particles to arrive at the exit of each tube in phase with
the oscillation of the potential. Acceleration to high energies requires
relatively long acceleration tubes. The electric field between the tubes
which accelerates the particles also spreads the beam [Humphries, 1986].
The phase requirement (fig (1.7) is that the time from point A to B
must be:
2
n
n
displacement Ltime
velocity v c
(1.7)
where λ is the wavelength of the particle, c is the light velocity and Ln is
the distance from point A to B. Taking the relativistic mass increase into
consideration, it can be shown that the length of the drift tube at the nth
stage is:
1/221 ( 1)
2n
L n
(1.8)

- 05 - Introduction
where; 2 2
o o
qU zeU
m c m c (1.9)
where mo is the rest mass of the accelerated particle. When v → c, nk be-
comes > 1 and thus Ln → λ/2. The length of the drift tubes therefore be-
comes constant at high particle energies [Humphries, 1986 and Lee,
1999].
In the Alvarez linear accelerator the drift tubes are mounted in a
tank acting as a microwave resonator, figure (1.8). By varying the diame-
ter with drift tube length it is possible to achieve resonance for all drift
tubes. A powerful high-frequency radio signal is introduced into the tank
by a small antenna. The standing electromagnetic wave introduces oscil-
lating potential differences between the drift tubes in a way similar to the
Wideröe accelerator. The drift tubes are grounded in the tank wall
through their supports and no insulators are required. This permits higher
potential differences between the tubes than in the Wideröe design [Liv-
ingston et al., 1962, Sharf, 1986 and Humphries, 1986].
Fig (1.8). Alvarez type of Linear accelerators.

- 06 - Chapter 1
1.3.3. Cyclotron
The best known and one of the most successful devices for acceler-
ation of ions to millions of electron volts is the cyclotron, which was in-
vented by E. O. Lawrence in 1929. The first working model produced 80
keV protons in 1930. A cyclotron, as well as a linac, uses multiple-
acceleration by a radio frequency electrical field. However, the ions in a
cyclotron are constrained by a magnetic field to move in a spiral path.
The ions are injected at the center of the magnet between two semicircu-
lar electrodes called “Dees”. As the particle spirals outward it gets accel-
erated each time it crosses the gap between the Dees. The time it takes a
particle to complete an orbit is constant, since the distance it travels in-
creases at the same rate as its velocity, allowing it to stay in phase with
the RF. As relativistic energies are approached, this condition breaks
down, limiting cyclotrons in energy [El-Saftawy, 2007]. A schematic dia-
gram of the cyclotron is shown in fig (1.9).
Fig (1.9). A schematic diagram of a Cyclotron.
- 07 - Introduction
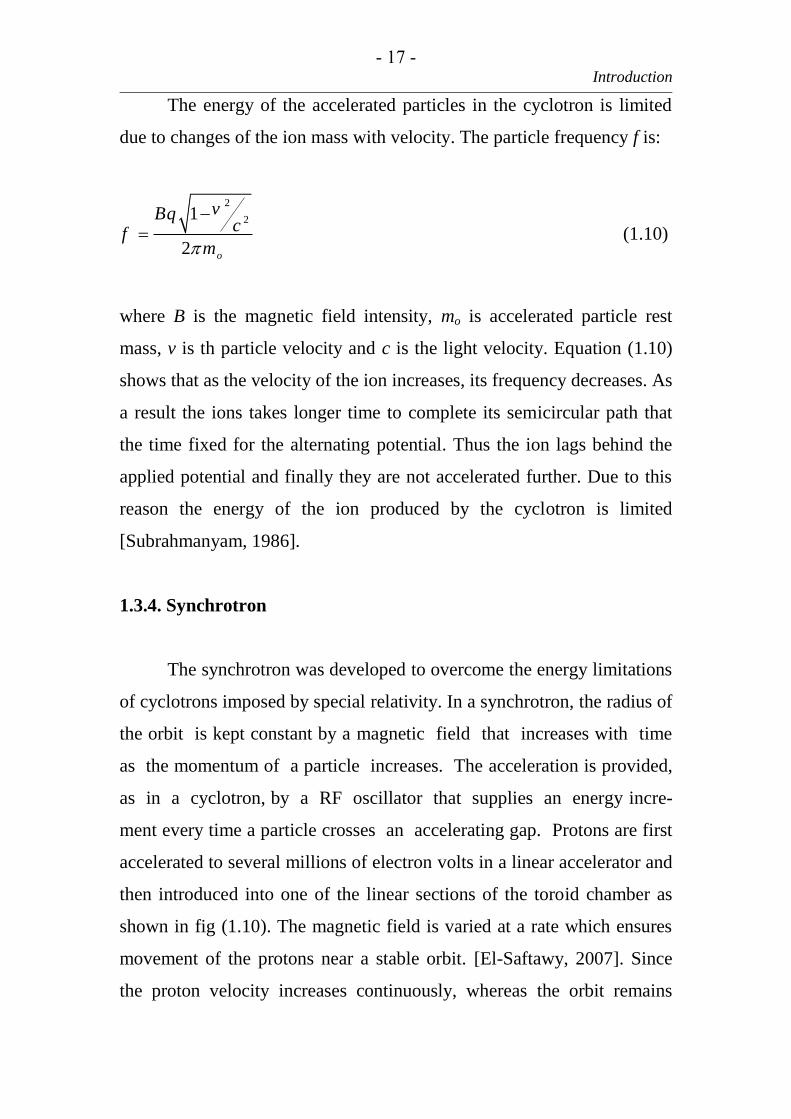
The energy of the accelerated particles in the cyclotron is limited
due to changes of the ion mass with velocity. The particle frequency f is:
2
21
2 o
vBqc
fm
(1.10)
where B is the magnetic field intensity, mo is accelerated particle rest
mass, v is th particle velocity and c is the light velocity. Equation (1.10)
shows that as the velocity of the ion increases, its frequency decreases. As
a result the ions takes longer time to complete its semicircular path that
the time fixed for the alternating potential. Thus the ion lags behind the
applied potential and finally they are not accelerated further. Due to this
reason the energy of the ion produced by the cyclotron is limited
[Subrahmanyam, 1986].
1.3.4. Synchrotron
The synchrotron was developed to overcome the energy limitations
of cyclotrons imposed by special relativity. In a synchrotron, the radius of
the orbit is kept constant by a magnetic field that increases with time
as the momentum of a particle increases. The acceleration is provided,
as in a cyclotron, by a RF oscillator that supplies an energy incre-
ment every time a particle crosses an accelerating gap. Protons are first
accelerated to several millions of electron volts in a linear accelerator and
then introduced into one of the linear sections of the toroid chamber as
shown in fig (1.10). The magnetic field is varied at a rate which ensures
movement of the protons near a stable orbit. [El-Saftawy, 2007]. Since
the proton velocity increases continuously, whereas the orbit remains

- 08 - Chapter 1
constant, the frequency of rotation increases. Therefore, in the first accel-
eration stage, the voltage frequency is varied in the same way as the fre-
quency of revolution of the protons.
Fig (1.10). A schematic diagram of a synchrotron.
1.3.5. Radio Frequency Accelerators
Radio frequency accelerators use a single, large resonant cavity. In
these types of accelerators the energy could be reached up to 5 MeV with
average beam powers up to 50 kW. The energy is gained in one path
along the axis of the toroidal cavity. The resonant frequencies are in the
range of 110 to 176 MHz and the rf power is supplied with triode tubes.
The rf system is self-tuning, so accurate cavity dimensions and tempera-
ture controls to stabilize the resonant frequency are not needed [Auslen-
der, 1990]. Higher electron energies can be obtained with a single, large
resonant cavity by accelerating the electrons repeatedly with the same
cavity. This type of accelerator is known as a Rhodotron. It employs a co-
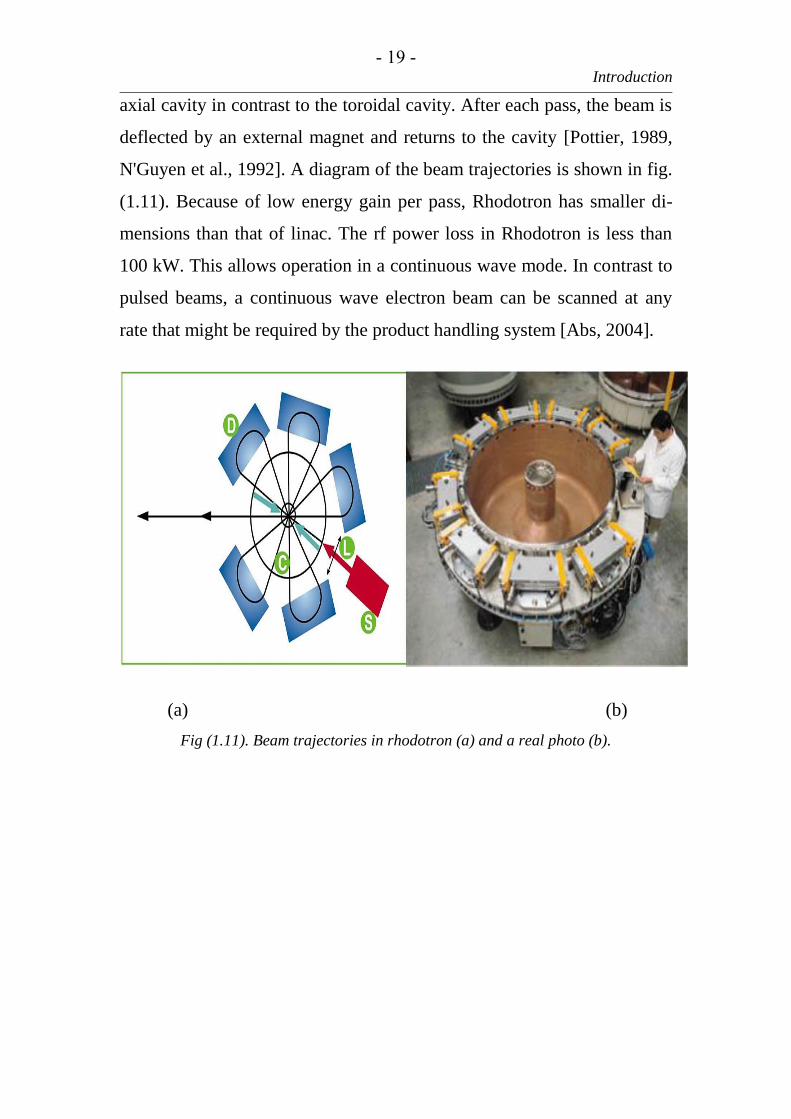
- 09 - Introduction
axial cavity in contrast to the toroidal cavity. After each pass, the beam is
deflected by an external magnet and returns to the cavity [Pottier, 1989,
N'Guyen et al., 1992]. A diagram of the beam trajectories is shown in fig.
(1.11). Because of low energy gain per pass, Rhodotron has smaller di-
mensions than that of linac. The rf power loss in Rhodotron is less than
100 kW. This allows operation in a continuous wave mode. In contrast to
pulsed beams, a continuous wave electron beam can be scanned at any
rate that might be required by the product handling system [Abs, 2004].
(a) (b)
Fig (1.11). Beam trajectories in rhodotron (a) and a real photo (b).

Chapter 2
ELECTRON BEAM PROCESSING

Chapter 2 Electron Beam Processing
CHAPTER 2
Electron Beam Processing
Radiation processing is the treatment of materials and products
with radiation or ionizing energy to change their physical, chemical or
biological characteristics. Accelerated electrons, X-rays, and gamma rays
are suitable energy sources for radiation processing [Chmielewski et al.,
2005]. Radiation processing particularly with electron beam offers some
distinct advantages in comparison with other ionizing radiation sources.
Some of these advantages are [Mark et al, 1988 and Cheremisinoff,
1998]:
1. The process is very fast, clean and can be controlled precisely.
2. There is no permanent radioactivity since the machine can be
switched off.
3. The electron beam can be steered very easily to meet the
requirements of various geometrical shapes of products to be
irradiated. X-rays and γ-rays cannot achieve this.
4. The electron beam radiation process is practically free of waste
products and hence there is no serious environmental hazard.
There are numerous research and industrial applications of
stationary and pulsed electron beams that are related to present or future
applications of the electron beam technology. Electron beam applications
are based on different physical action principles [Mehnert, 1993]:
1- Generation of strong local heating (Electron beam treatment).
2- Coulomb interaction with electrons in inorganic materials
generating molecular excitation and ionization (chemical
processing) or defects (semiconductor treatments).
3- Bremsstralung generation (materials inspection).

- 12 - Chapter 2
2.1. Physical Aspects of Electron Beam Processing
2.1.1. Penetration Depth
Penetrating power of the electron beam is related to the
accelerating voltage and the density of the processed material. Higher
voltage causes deeper penetration, and denser material reduces the depth
of penetration. The penetration of high-energy electron beams in
irradiated materials increases linearly with the incident energy. The
electron range also depends on the atomic composition of the irradiated
material. The energy deposition is caused mainly by collisions of the
incident electrons with atomic electrons. Therefore, materials with higher
electron contents will have higher absorbed doses near the entrance
surface, but lower electron ranges [Laurell et al., 2007].
2.1.2. Absorbed Dose, Beam Fluence and Energy Fluence
Absorbed dose is defined as the amount of energy deposited into a
specified mass of material. The unit of absorbed dose is Gray (Gy),
defined as the number of joules (J) of energy deposited into 1 kilogram
(kg) of material [McLaughlin et al., 1989 and McLaughlin et al., 1995].
At a fixed electron accelerating voltage, the dose is directly proportional
to the electron beam current I (mA) and inversely to the web speed v
(m/min) as follows:
ID k
v (2.1)
The k factor depends on the equipment and the accelerating voltage.

- 11 - Electron Beam Processing
The following quantities are used to describe ionizing radiation
beam: particle fluence, energy fluence, particle fluence rate and energy
fluence rate [Ding et al., 1996, Nilsson et al., 1995 and Burns et al.,
1996]. The particle fluence (measured in m-2
) is defined as the number
of particles dN incident on cross-sectional area dA and could be expressed
as: dN dA While the particle fluence rate .
(measured in m-2
s-1
) is the
increment of the fluence d in time interval dT and is expressed as:
.
d dT .
The energy fluence is the quotient of dE by dA, where dE is the
radiant energy incident on a cross-sectional area dA which is given
as: /dE dA (The unit of energy fluence is J/m2). Energy fluence is
calculated from particle fluence by using the following relation:
dNE E
dA (2.2)
where, E is the energy of the particle and dN represents the number of
particles with energy E.
The energy fluence rate .
(also referred to as intensity) is the
quotient of d by dT, where d is the increment of the energy fluence
in the time interval dT:
.
/d dT (2.3)
The unit of energy fluence rate is W/m2 or J·m
–2s
–1 [McLaughlin et al.,
1989].

- 12 - Chapter 2
2.1.3. Beam Distribution Uniformity and Throughput
Beam uniformity is a direct function of how the electron beam is
distributed over the working width. It is specified as a percent deviation
from the average value, e.g. 20kGy ± 10%. In general, electron
crosslinking accelerator provides uniformity better than ±5%; many
applications can tolerate variation of ± 10% [Laurell et al., 2007].
Throughput is a measure of the energy deposition rate and relates
directly to the amount of material that can be processed within a given
time interval. It is measured in kGy/s [Laurell et al., 2007].
2.2. Surface Structure and Wettability of Materials
2.2.1. Surface Irregularities Investigation Methods
To obtain the surface structure of a material, it is necessary to make
a series of grinding and polishing operations. The purpose of this step is
to remove the damaged surface that formed during cutting, oxidation,
mechanical polishing or other processes. As a result, a chemical reagent
or a low-energy beam must etch the surface. Because of the beam-target
interaction, previous preparation of the sample and the surface structure,
different surface features can be observed, such as [Nenadović, 2005]:
1- Topography is defined as the depth of view. It depends on the
instrument of analysis. It is a macroscopic parameter and can be
observed using an optical microscope.
2- The roughness of a material which is due to the irregularities on
the surface including heights, width and direction. It is important

- 12 - Electron Beam Processing
quantitive parameters that must be measured during material
testing. It is measured by:
i. Stylus profiling,
ii. Light scattering microscopes (optical, electron and
scanning).
iii. Atomic force microscope (AFM).
3- Surface morphology is a crucial characteristic for material
properties. It is a part of the structural characteristics of real
crystals, which depend on the nature and state of the surface. It can
be measured by:
i. Scanning electron microscope (SEM).
ii. Scanning tunneling microscope (STM).
iii. Atomic force microscope (AFM).
2.2.2. Hydrophilic vs. Hydrophobic; Meaning of Contact Angle
Hydrophilicity refers to a physical property of a material that can
transiently bond with water through hydrogen bond. The water droplet
would spread on a hydrophilic surface. Furthermore water can enter the
pores of a hydrophilic material and totally wet it. Most natural materials
are hydrophilic. Hydrophobicity refers to the physical property of a
material that repels a mass of water. Water droplet would try not to touch
large area of the surface and the shape of the droplet would be spherical.
Hydrophobic natural materials are waxes, oils and fats. The evaluation of
hydrophilicity and hydrophobicity are made through water contact angle
measurement. For hydrophilic materials, the contact angle is significantly
low. While for hydrophobic materials, the contact angle is significantly
high [Tanford, 1973, Butt et al., 2003 and McCarthy, 2006].

- 12 - Chapter 2
Contact angle measurements have been used for years to assess
surface wettability and roughness. The contact angle is defined as the
angle between the tangent to the liquid-air interface and the tangent to the
solid air interface as shown in fig (2.2) [Wenzel, 1936 and Cassie et al.,
1944]. The contact angle on an ideal small surface is known as Young's
contact angle. Neglecting the effect of gravity, the Young's angle can be
related to the interfacial surface energies of solid-vapor (s ), solid-liquid
(sl ) and liquid-vapor (
l ) by [Young, 1805]:
cos s slY
l
(2.16)
Therefore, contact angles are influenced by the specific kinds of atoms
and surface termination present at the liquid-solid-vapor interfaces.
Fig (2.1). Contact angle and its relation to materials hydrophilicity and
hydrophobicity
Surface roughness plays an equally important role in the wettability
of a surface which makes accurate measurement of Young's angle
- 12 - Electron Beam Processing
difficult. When a water droplet wets completely a rough surface on which
it sits, the impact of roughness on the contact angle is given by the
Wenzel equation [Wenzel, 1936]:
cos cosW YR (2.17)
This relates the observed contact angle on a rough surface,W , with the
roughness ratio, R, of the surface and its contact angle on a smooth
surface,Y . Since the roughness ratio compares the true surface area of a
rough surface with the surface area of a comparably sized smooth surface,
this ratio will always be larger than one. Wenzel's relation also shows that
surface roughness will decrease the contact angle for a droplet on a
hydrophilic surface or will increase the contact angle for a droplet on a
hydrophobic surface [Wenzel, 1936 and Cassie et al., 1944].
2.3. Radiation Processing Applications: Selected Examples
2.3.1. Radiation Technology in Food Irradiation
Cooked food can be stored indefinitely at room temperature if it is
packed and irradiated with a few hundred Gy. The food to be irradiated is
packed and conveyed past a source of ionizing radiation like gamma rays
or electron beams. This allows a dose of energy appropriate for
pasteurization to be absorbed by food. Food irradiation increases food
shelf lifetime without sacrifice of its quality. It can contribute to the
reduction of post-harvest loses, increase export potential of certain foods
and reduces risks of food-borne diseases without using fumigation by
chemicals, such as ethylene di-bromide, methyl bromide and ethylene

- 12 - Chapter 2
oxide. Chemical fumigation of food has been either prohibited or is being
increasingly restricted in most advanced countries for health,
environmental or occupational safety reasons. Food irradiation is a cold
process, so the food remains raw after irradiation. There is no
radioactivity or chemical residues are left over [Molins, 2001, Sommers
et al., 2006 and Farakas et al., 2011].
2.3.2. Radiation Technology in Medical Applications
At present the vast majority of cancer therapy is based on electron
accelerators. These machines are capable of producing beams of mono
energetic electrons with a depth range of 2-10 cm as the machine energies
varies between 4 and 25MeV. Electrons accelerators are used extensively
not only as biological research tool, but also as sources of radiation
therapy with X-rays and electrons. X-rays has deeper penetration depth
than electrons [Karzmark et al., 1993 and Chao, 2009]. A typical medical
linear accelerator is shown in fig (2.2).
Fig (2.2). Actual medical linear accelerator used for cancer diagnosis and treatment.
- 12 - Electron Beam Processing
There is a large need to sterilize medical materials, clothing,
dressing materials, syringes, surgical instruments,…etc. The traditional
sterilization methods is by applying steam at 150oC, this method is not
tolerated by many of low cost disposable products made from plastics
[Icre et al., 1995]. Radiation sterilization (using electron beams or γ-rays)
of one use medical disposables (surgical gloves, drapes, suture, needles
syringes, and bandages) permits the sterilization of medical supplies
which cannot be subjected to heat. Radiation processing is better than the
conventional methods and is friendly to the environment because of non-
emission of toxic gases [Icre et al., 1995].
2.3.3. Pollution Control, Cleaning of Flue Gases and Sewage
Sludge Treatment
The emission of SO2 and NOx in the atmosphere from coal and oil
burning power plants and industrial plants is one of major sources of
environmental pollution. These pollutants cause acid rain and also
contribute to the greenhouse effect. Innovative technology using electron
beams to remove SO2 and NOx was first developed in Japan and followed
by research groups in USA, Germany, Poland and China.
After the flow gas is cooled by water spray to 70oC, it is subjected
to electron beams in the presence of near stoichiometric amount of
ammonia which has been added to the flow gas prior to the irradiation
process. The SO2 and NOx are converted into their respective acids which
are subsequently converted into ammonium sulfate and ammonium
nitrate. These are then recovered by an electrostatic precipitator. The
products of this process are a useful fertilizer for agricultural purposes
[Chmielewski, 1995 and Chmielewski et al., 1995] .

- 12 - Chapter 2
The treatment of wastewater and sewage are a major problem in all
countries. Radiation can destroy toxic bacteria and permit the recycling of
water. Irradiated sludge is used on farmland as an organic fertilizer rich in
organic matter. Irradiation of garbage is used for making this waste
material available for animal food [Chmielewski et al., 1995 and Getoff,
1995]. Figure (2.3) shows an industrial electron beam plant used for
wastewater treatment.
Fig (2.3). Electron beam plant used for wastewater treatment.
2.3.4. Synchrotron Radiation
Electrons circulating at high energy in a synchrotron or a storage
ring unit emit a tangential beam of synchrotron radiation (fig (2.4)) over a
wide range of frequencies from visible wavelength into the x-ray region.
The linac generates electrons with an electron gun, and accelerates them
to an energy of 1 GeV. The accelerated electron beam is transported to
the synchrotron, which then accelerates it to 8 GeV. Next, the beam is
injected into the storage ring and stored with the energy of 8 GeV. The
stored electron beam emits synchrotron radiation at bending magnets and
at insertion devices (undulators or a wiggler). The emitted radiation is
transported through beamlines to hutches in the experimental hall and
used for experiments. Many electron rings in the energy range from 1.5 to

- 23 - Electron Beam Processing
8GeV have been built to serve as a number of experiments arranged
around their circumference with beams of synchrotron light [Lee, 1999].
Fig (2.4). Synchrotron radiation accelerator complex.
The high brilliance of tunable light source in the x-ray range
generated by electron synchrotron has a promising range of industrial
applications. A few Examples of Application of synchrotron radiation can
give an idea of the breadth of disciplines served by this tool [Altarelli,
2001]:
1. Photoemission spectroscopy and microscopy are used to
investigate the electronic properties of solids and solid surfaces.
2. Macromolecular x-ray crystallography is used to unravel the
atomic structure of biological molecules (from proteins to
viroses).
3. Synchrotron x-ray opens new vistas for medical as well as for
material sciences applications.
4. Microfabrication by lithographic techniques uses the well
collimated synchrotron light beam as a pencil to draw patterns
with features on the 0.1m scale.

- 22 - Chapter 2
2.4. Electron Beam Processing of Polymeric Materials
2.4.1. A Brief Overview of Polymer Structure and Classification
Polymers are a macromolecule consists of a set of regularly
repeated chemical units known as monomers. Within each molecule, the
atoms are bound together by covalent interatomic bonds. For most
polymers, these molecules are in the form of long and flexible chains, the
backbone of which is a string of carbon atoms [Young et al., 1991 and
Sperling, 2001]. When all the monomers are of the same type, the
resulting polymer is called a homopolymer. When the polymer chains
composed of two or more monomers, the polymer is said to be copolymer
[Gedde, 1995]. The simplest useful homopolymer is polyethylene (PE)
which represented schematically in fig (2.5a). If all the hydrogen atoms in
PE are replaced by fluorine, the resulting polymer is
polytetrafluoroethylene (PTFE) which having the trade name Teflon, fig
(2.5b) [Callister, 2001].
(a)
(b)
Fig (2.5). Structure of poly ethylene (a) and PTFE (b) (the shaded block represent the
monomer unit).
According to the production method of polymer, the copolymer
could be produced with different structures as shown in fig (2.6). If the

- 21 - Electron Beam Processing
monomers are distributed randomly in the polymer chain, the resulting
polymer is termed random copolymer, fig (2.6a). For alternating
copolymer, fig (2.6b), the two monomers alternate chain positions. A
block copolymer is one in which identical monomers are clustered in
blocks along the chain, fig (2.6c). Finally, homopolymer side branches of
one type may be grafted to homopolymer main chain that are composed
of a different monomer, such a material is termed a graft copolymer, fig
(2.6d) [Callister, 2001].
Fig (2.6). Schematic representations of (a) random, (b) alternating, (c) block and (d)
graft copolymers.
By using different starting materials and processing techniques, we
can produce polymers having different molecular structures. As
illustrated in fig. (2.7) these structures can be classified into four different
categories: (i) linear, (ii) branched, (iii) crosslinked, and (iv) network. In
linear polymers, the monomers are joined together end to end in single
chains (fig. 2.7a). The long chains are flexible and may be considered as a

- 22 - Chapter 2
mass of spaghetti. Extensive van der Waals bonding between the chains
exist in these polymers. Some of the common linear polymers are
polyethylene, polyvinyl chloride, polystyrene, nylon and the
fluorocarbons [Callister, 2001].
Fig (2.7). Schematic representations of (a) linear, (b) branched, (c) crosslinked and
(d) network.
Polymers may also have a molecular structure in which side-branch
chains are connected to the main ones, as shown schematically in fig.
(2.7b). These polymers are called branched polymers. The branches result
from side reactions that occur during the synthesis of the polymer. The
formation of side branches reduces the chain packing efficiency, resulting
in a lowering of the polymer density. In crosslinked polymers, adjacent
linear chains are joined to one and another at various positions along their
lengths as depicted in fig. (2.7c). Generally, crosslinking is accomplished
by additive atoms or molecules that are covalently bonded to the chains.
Many of the rubber materials consist of poly butadiene crosslinked with S
atoms. Trifunctional (having three active covalent bonds) monomer units
form three-dimensional networks as shown in fig. (2.7d). Polymers
- 22 - Electron Beam Processing
consisting of trifunctional units are termed network polymers. Epoxies
belong to this group [Callister, 2001].
Polymers also classified according to their properties into three
categories: i) thermoplastics, ii) rubbers (elastomers) and iii) thermosets.
Thermoplastics form the bulk of polymers in use. They consist of linear
or branched molecules and they soften or melt when heated, so that they
can be molded and remolded by heating. In the molten state, they consist
of a tangled mass of molecules. On cooling, they may form a glass (a sort
of ‘frozen liquid’) below a temperature called the glass transition
temperature, Tg, or they may crystallize. If they crystallize, they do so
only partially, the rest remaining in a liquid-like state that is usually
called amorphous, but should preferably be called non-crystalline. In
some instances, they form a liquid-crystal phase in some temperature
region [Bower, 2002].
Rubbers, or elastomers, are network polymers that are lightly
cross-linked and they are reversibly stretchable to high extensions. When
unstretched they have fairly tightly randomly coiled molecules that are
stretched out when the polymer is stretched. This causes the chains to be
less random, so that the material has lower entropy, and the retractive
force observed is due to this lowering of the entropy. The cross-links pre-
vent the molecules from flowing past each other when the material is
stretched. On cooling, rubbers become glassy or crystallize (partially). On
heating, they cannot melt in the conventional sense, i.e. they cannot flow,
because of the crosslinks [Bower, 2002].
Thermosets are network polymers that are heavily cross-linked to
give a dense three-dimensional network. They are normally rigid. They

- 22 - Chapter 2
cannot melt on heating and they decompose if the temperature is high
enough. The name arises because it was necessary to heat the first
polymers of this type in order for the cross-linking, or curing, to take
place. The term is now used to describe this type of material even when
heat is not required for the cross-linking to take place. Examples of
thermosets are the epoxy resins, such as Araldites, and the phenol- or
urea-formaldehyde resins [Bower, 2002].
When electrons with typical energies in the keV and MeV range
are absorbed into matter, secondary electrons are produced because of the
energy degradation process. By coulomb interaction of these electrons
with the atoms or molecules of the absorber, finally ions, thermalized
electrons, excited states and radicals are formed [Mehnert, 1995]. The
effect of ionizing radiation on polymeric materials can be manifested in
one of three ways [Ivanov, 1992]:
1. Molecular weight increasing (cross-linking).
2. Molecular weight decreasing (chain scissioning or degradation).
3. No significant change in molecular weight for radiation-
resistant polymer
2.4.2. Polymer Crosslinking
Crosslinking is the most widely used effect of polymer irradiation
because it can improve the mechanical, thermal and chemical qualities of
performed products as well as bulk materials [Bradley, 1984, Bly, 1988
and Tabata et al., 1991]. When polymer chains (monomers) are linked
together by chemical bonds (covalent or ionic), they lose some of their
ability to move as individual polymer chains. For example, a liquid
polymer (where the chains are freely flowing) can be turned into a "solid"

- 22 - Electron Beam Processing
or "gel" by cross-linking the chains together. These bonds are usually
referred to as "cross-links" [Singh et al., 1992, Woods et al., 1994 and
Clough et al., 1996]. Figure (2.8) shows a crosslinking illustration
example.
Fig (2.8). Polymer chains crosslinking illustration: a) no crosslinking and b)
crosslinking exist.
In polymer chemistry, when a synthetic polymer is said to be
"cross-linked", it usually means that the entire bulk of the polymer has
been exposed to the cross-linking method. The resulting modification of
mechanical properties depends strongly on the cross-link (bonds) density.
Low cross-link densities raise the viscosities of polymer melts.
Intermediate cross-link densities transform gummy polymers into
materials that have elastomeric properties and potentially high strengths.
Very high cross-link densities can cause materials to become very rigid or
glassy, such as phenol-formaldehyde materials [Mehnert, 1995].

- 22 - Chapter 2
Cross-links can be formed by chemical reactions that are initiated
by heat, pressure, or radiation. Cross-linking can be induced through
exposure to a radiation source, such as electron beam exposure, gamma-
radiation, or UV light. Cross-linking occurs when two radicals produced
on neighboring polymer units recombine. The reactive molecular mass
increase and the melting point rise [Mehnert, 1995].
2.4.2.1. Insulated Wires and Cables
One of the first commercial applications of radiation crosslinking is
the improvement of the insulation on electrical wires and cables. Many
wire manufacturers are now using this method to produce high-
performance wire for aircraft and automobiles [Ueno, 1990, Lyons, 1995
and Makkuchi, 1999]. Polyethylene, polyvinylchloride, ethylene-
propylene rubber, poly (vinylidene fluoride) and ethylene
tetrafluoroethylene copolymer are some of the materials used in this
application. Increased tolerance to overloaded conductors and high
temperature environments, fire retardation, increased abrasion resistance,
increased tensile strength, reduction in cold flow and increased resistance
to solvents and corrosive chemicals are product improvements obtainable
by this method [Loan, 1977, Bennett, 1979 and Goavec, 1979].
2.4.2.2. Heat-Shrinkable Materials
Radiation crosslinking stabilizes the initial dimensions of products
and imparts the so-called “memory” effect. Crosslinking occurs mainly in
the amorphous zones of polyethylene, but the crystalline zones determine
the stiffness of the material. The crosslinked material becomes elastic
when heated above the melting temperature of the crystalline zones,

- 22 - Electron Beam Processing
which is approximately 100 ºC. The product can then be expanded or
stretched to several times its original size. It maintains the larger
dimension when cooled, but it contracts to its original size when heated
again. Examples of commercial product using this effect are
encapsulation for electronic components, jackets for multi-conductor
cables, exterior telephone cable connectors and food packaging films
[Baird, 1977 and Ota, 1981].
2.4.2.3. Hydrogels
Uses of hydrogels include: wound dressings, soft contact lenses,
controlled-release drug delivery systems, artificial skin, water absorbents
and adsorbents for metal ions or enzymes for purification or catalysis
applications [Chmielewski et al., 2005]. Hydrogels consist of a three-
dimensional network of hydrophilic polymer chains
(polyvinylpyrolidone, polyacrylamide, polyvinylalcohol, etc.) which can
be swollen with water. The materials usually contain a much higher
amount of water than of polymer. An advantageous means of producing
hydrogels for medical applications is to start with the Polymer and water
inside of a sealed package, and then submit this solution to ionizing
radiation. The finished product thus makes use of radiation in two ways
simultaneously: crosslinking and sterilization [Rosiak et al., 1999].
2.4.3. Polymer Degradation
Simultaneously to cross-linking, polymer degradation takes place
by chain scission which leads to a decrease of the molecular mass.
Polymer degradation is a change in the properties of a polymer (tensile

- 22 - Chapter 2
strength, color, shape, etc.) under the influence of radiation (electron
beam or gamma) [Mehnert, 1995].
2.4.3.1. Cellulose Degradation
Cellulose fibers from wood pulp can be dissolved in carbon
disulfide to make a thick liquid material called viscose. Products such as
rayon fabrics and cellophane films are made from this material. The
molecular weight of natural cellulose must be reduced to enhance the
production of viscose. This is usually done by treatment with sodium
hydroxide and heat. However, degrading the cellulose by irradiation
speeds up the subsequent processes and reduces the amount of chemical
needed. These improvements reduce the cost and the environmental
pollution. A dose as low as 15 kGy is suffucuent for this application
[Stepanik et al, 1998 and Cleland et al., 1998].
2.4.3.2. Degradation of Polypropylene (PP)
PP and several other polymers can be degraded by irradiation in
air. This effect increases the melt flow and decreases the melt viscosity,
which improves extrusion processes. By blending irradiated polymer with
unirradiated material, the desirable mechanical properties can be
obtained. Relatively low doses in the range of 15 to 80 kGy are sufficient
for this application [Boynton, 1981, Williams et al., 1988 and 1998].
2.4.4. Electron Beam Polymer Grafting
Electron beam (EB) grafting is a well-known technique for
modifying the surfaces of materials for many years. Irradiation grafting is

- 23 - Electron Beam Processing
being used to control ion flow through battery separator membranes, to
modify the hydrophilic and hydrophobic properties of semi-permeable
membranes and non-woven fabrics, to enhance the biocompatibility of
materials used in the medical device area, and to impart release properties
to films and papers [Berejka, 2004].
Grafting adds a monomeric or low molecular weight moiety to a
high molecular weight formed polymer, which can be a film, a non-
woven, a micro-porous film or a bulk material, to affect various
properties. Grafting is defined as the ability to attach a different material
onto the backbone of another. With polymeric materials, the ‘different’
material is most typically a monomer and the ‘backbone’ a polymer or
other solid. A chemical bond is then formed between the grafted moiety
and the material [Berejka, 2004 and Bhattacharya et al., 2009].

Chapter 3
EXPERIMENTAL METHODS

Chapter 3 Experimental Methods
CHAPTER 3
Experimental Methods
The electron gun plays an important role in atomic, molecular, and
surface physics. Different types of electron guns have been designed for
producing different electron beam energies and shapes. In this work, the
used apparatus, shown in fig (3.1), consists of:
1. The electron gun equipment.
2. The vacuum system.
3. Electron beam and emittance measuring devices.
Fig (3.1). The experimental apparatus components.

- 24 - Experimental Methods
3.1. Electron Gun Components
The electron beam is produced from a Pierce type electron gun
with an indirectly heated cathode operating in a diode circuit as shown in
fig (3.2). The cathode consists of a nickel core metal of about 70% partly
and of a porous layer (porosity is favorable to increase the emitting
surface area) of barium and strontium oxide mixed with a few percent of
calcium oxide. The oxide layer is usually derived from a layer of
carbonate deposited on the nickel surface. The carbonate is mixed with an
organic finder for improving the bond. The diameter of the cathode is
14mm. The heating filament of the gun is made from a special alloy of
tungsten wire of 60 watts maximum power. The lowest power which can
emit electrons of several micro-amperes on the specimen was found to be
of about 20 watts. The chosen working power was around 40 watts. The
filament with the porous cathode (fig 3.3a) has to be activated before gun
operation to get rid of any contamination adsorbed to them.
Figure (3.2). Electron gun configurations.
The cathode, together with the beam shaping electrodes (Pierce
electrode with the wehnelt), is connected to a pulse modulator which
provides negative high voltage (up to 80 kV) pulses with variable pulse

- 24 - Chapter 3
repetition rates (from 31.25 to 500 counts/s) which accelerates the
electrons with a velocity of about 0.5 c (the velocity of light). The anode
is grounded to the vacuum chamber i.e. considered positive with respect
to the cathode and beam shaping electrodes (focusing electrode). A real
photo of the cathode with the electrons effect on in is shown in fig (3.3b).
(a)
(b)
Fig (3.3). The porous cathode with the filament (a) and the spherical anode (b).

- 22 - Experimental Methods
In the field free region behind the anode a chamber exists having
three flanges. One is for the beam exit and measurement, the lower one
for the vacuum extraction and the upper one for the beam scanner. The
gun section communicates with the field free space chamber through an
aperture in the anode electrode.
3.2. The Vacuum System
An important part of an accelerator is the vacuum system. By
having a low pressure, scattering of the charged particle beam could be
obtained throughout the system [Hellborg et al., 2005]. The vacuum
system used in this thesis, fig (3.1), consists mainly of:
1. Rotary mechanical pump equipped with a liquid nitrogen trap to
improve the vacuum value, this system is employed primarily to
evacuate the system up to the range of 10-3
torr.
2. Vacuum ion pump (Vacion) is employed to evacuate the system up
to values in the range of 10-7
torr.
Before the first operation of the vacion pump, it has to be cleaned
by a process known as baking. In baking the vacion is heated by an
internal or external heater in condition that the vacuum value doesn't be
lower than 10-1
torr. After baking the pump is constructed again and it is
ready for work. The vacion pump cannot work before the vacuum in the
system reaches 10-2
torr.
The pump operation is based upon gas absorption by titanium
sputtered in the magnetic field at high voltage discharge. The discharge
occurs between two parallel plates of titanium cathodes and a water
cooled porous cooper anode placed between them. The cooling of the

- 24 - Chapter 3
anode increases the starting pressure and the maximum operating pump
pressure [Ragheb, 1992].
There are many types of pressure gauges [Delchar, 1993 and
Redhead 1967]. In this work, two types of vacuum gauges are being used:
1. Thermocouple gauge which operates in the range of low and
medium vacuum range (103 -10
-3 mbar).
2. Ionization gauge which operates in the range of high and very high
vacuum (10-3
– 10-8
mbar) and couldn't be operated until the
pressure of the system is less than 10-2
mbar.
These two gauges operate in connection with vacuum gauge
controller to control the work of the two gauges and to measure the
vacuum value directly in units of pressure.
A closed auto-cooling system for the vacion pump has been
developed to cool down the temperature of the vacuum system. It also
ensures the safety of the gun against any raise of temperature by using a
temperature controlling sensor. After the temperature is raised larger than
a pre-defined value, all the system turns off automatically.
3.3. Electron Beam and emittance Measuring Devices
3.3.1. Electron Beam Collector
The electron beam collector (Faraday Cup FC) is shown in fig
(3.4). It consists of a tungsten plate (detector) with three thin cylinders of
tungsten soldered on it to detect any secondary emission of electrons.
Tungsten is used because of its high secondary emission characteristics,
which is due to its low work function. In this work, The FC is mounted at

- 24 - Experimental Methods
a distance 150 mm from the anode aperture and is connected to an
electrometer to measure the extracted electron beam current.
Fig (3.4). Electron beam density measuring device (FC).
3.3.2. Emittance Measuring Device
An electromechanical auto-trace system shown in fig (3.5) is used
to trace the electron beam density distribution [Ragheb, 1983]. The
purpose of this tracer is to scan the wire probe across the beam path (the
r-direction) and along its axis (the z-direction). The apparatus consists of
two principal symmetrical parts, one is for the r-direction and the other is
for the z-direction. The system is constructed on a metallic square sheet
(4) fixed on the upper middle flange (2) of the gun chamber. Four vertical
cooper rods screwed to the sheet (4) support the system through four
blocks fixed to the desired height.

- 24 - Chapter 3
Figure (3.5). Electron beam scanner((1)coaxial insulated rod.(2) The upper middle flange of
the field free region. (3) Motors. (4) Metallic square sheet. (5) Screw rods. (6) Central
cuboid. (7) Sliding resistance. (8) Micro-switch. (9) Two perpendicular cylindrical rods).
The coaxial insulated rod (1), guiding the motion of the wire probe,
slides in a pivot-ball housed in the central cuboid (6). This cuboid is in its
turn slides horizontally on two perpendicular cylindrical rods (9). The
whole system is aligned according to the electron beam axis, so that one
of the horizontal rods would have the beam direction and the other is
perpendicular to it. The horizontal displacement of these rods provides

- 24 - Experimental Methods
radial (r) and longitudinal (z) displacements of the wire probe. Round
motion is transferred from a motor (3) by mean of a belt and a wheel to
the screw rods (5) causing horizontal motion of one of the cylindrical
rods (9). These rods force the cuboid (6) together with the coaxial rod
toward the r- and z-direction.
Four mobile micro-switches (8) fixed to the desired positions on
the rods (9) serve to end the motion of the probe. Moving in the r- and z-
direction, the cuboid (6) strikes one of the switches and the motion of the
motor is halted. A small tip fixed on the cylindrical rods guides a sliding
resistance (7) which serves for accurate indication of the probe
displacement. The scanner probe used in the present tracer system is
0.2mm diameter tungsten wire, 100mm in length. The wire is electrically
connected to the measuring system through a vacuum-tight insulated rod
(1) guided by silphone tube. The signal from the scanning probe is
transferred to the X-Y recorder (of model BW-211) after amplification to
be plotted. These plots represents the electron beam distribution and have
Gaussian distribution shape which analyzed to yield the electron beam
diameter and emittance at different places along the beam.
As could be seen from the previous description of the beam
scanner, the scanning probe moves horizontally in the direction of the
beam (z-direction) and moves perpendicularly to the beam direction (r-
direction). In the present thesis, the scanning probe is placed at two
distances 20mm (at the beam waist) from the anode, and a set of currents
Ip values is recorded for different accelerating voltages. Then the probe is
shifted to a new distance 150mm (at the beam exit) from the anode, and
the previous procedures are repeated.

- 24 - Chapter 3
3.4. Materials and Investigation Methods Employed
3.4.1. Poly (Ethylene Terephthalate) (PET)
The semi-crystalline poly (ethylene terephthalate) (PET) film has
some excellent bulk properties, such as very good barrier properties,
crease resistance, solvent resistance, high melting point >250oC and
resistance to fatigue [Yang et al., 2009]. As could be seen in fig (3.6), the
monomer of PET film consists of four functional groups. These groups
are: two ester groups, one aromatic ring and one ethyl group. The two
ester groups with the aromatic ring constitute the terephthalate group
which in turn connects to the ethyl group to form the PET monomer.
These functional groups consist of many bonds which are: C-C, C-H, C-
O, C=O and the aromatic ring.
Figure (3.6). Molecular structure of PET film monomer.
A set of PET film samples of 1 cm2 surface area, 190 m thickness
and 1.07g/cm3 density, is treated with low energy electron beam (75keV
energy and 250mA current) under vacuum (5X10⁻⁶
torr) with different
electron beam fluence at fluence rate 1.3 X 10¹⁹
e/min cm2. The PET
membrane samples are supplied from Joint Institute of Nuclear Research
(JINR), Dubna, Russia. The samples were cleaned with dilute detergent
(acetone), repeatedly washed with distilled water in ultrasound cleaner for
15 minutes and dried in air atmosphere. The electron beam is produced

- 45 - Experimental Methods
from a Pierce-type electron gun, described in section (3.1). The sample
holder is shown in fig (3.7). It consists of a hollow stainless steel holder
in which the sample is mounted and a nut to fasten the sample.
Fig (3.7). Samples holder.
3.4.2. Fourier Transform Infrared (FTIR) Spectroscopy
Fourier transform infrared (FTIR) spectroscopy has been widely
used by many researchers to study the composition of polymers and
polymeric blends. FTIR spectroscopy provides information regarding
intermolecular interaction via analysis of FTIR spectra corresponding to
stretching or bending vibrations of particular bonds. The position at
which these peaks appear depends on the bond type [Dumitrascu et al.,
2011].
The FTIR investigations done in this work were performed on
THERMO spectrophotometer type spectrum 100. All spectra were
recorded in the range 400-4000 cm-1
with resolution 4cm-1
. The infrared
spectroscopy correlation table, which could be found at the site
http://en.wikipedia.org/wiki/Infrared_spectroscopy_correlation_table is
used in interpreting the FTIR spectrum of the PET samples.
Sample holder
Fasten nut
Sample

- 45 - Chapter 3
3.4.3. Atomic Force Microscope (AFM)
The Atomic Force Microscope (AFM) is used to image surface
structures (on nm or even sub-nm scale) and to measure surface forces.
AFM contains a microscopic tip (curvature radius of ~10-50nm) attached
to a cantilever spring. The underlying principle of AFM is the detection
of the bending of this cantilever spring as a response to external forces.
To measure such small forces one must use not only very sensitive force-
measuring springs but also very sensitive ways for measuring their
bending. In order to detect this bending, which is as small as 0.01 nm, a
laser beam is focused on the back of the cantilever. From there the laser
beam is reflected towards a position-sensitive photodetector. Depending
on the cantilever deflection, the position of the reflected beam changes.
The photodetector converts this change in an electrical signal [Khulbe,
2008]. This principle is illustrated in fig. (3.8).
AFM works in two modes; tapping and contact modes. In contact
mode, the tip makes soft physical contact with the sample as it scans the
surface to monitor changes in the cantilever deflection. The constant force
of the scanner tracing the tip across the sample causes the cantilever to
bend with the changes of the topography [Atta, 2011]. In tapping mode,
the cantilever tip is stimulated to vibrations near the resonance frequency
(~300kHz). On approach to the surface, the vibration amplitude of the
cantilever will decrease, since the interaction force with the surface shifts
the resonance frequency. Instead of scanning the sample at constant
deflection, the surface is scanned at constant reduction of the oscillation
amplitude. As a result the tip is not in mechanical contact with the surface
during the scan. The tapping mode is less destructive then the contact
mode, because the exerted forces are in the pN range [Khulbe, 2008].

- 44 - Experimental Methods
Fig (3.8). AFM working principle.
AFM is used in this thesis to characterize topographical and
roughness values of electron beam untreated and treated PET samples
surface. AFM imaging was conducted under atmospheric pressure.
Imaging was acquired in the contact mode and at constant force. This was
achieved during scanning in the x- and y- directions. Surface roughness
was assessed by AFM as a part of surface characterization and also for
further investigations into possible correlation between this parameter and
different electron beam fluence.
3.4.4. Contact Angle and Surface Free Energy Analysis
Contact angle measurement is considered one of the most
important and effectively methods for evaluating different materials
wettability [Elmofty et al., 2003]. Contact angle measurements on
cleaned surface were carried out under air at room temperature. Contact

- 44 - Chapter 3
angles on the surfaces were measured with four liquids of known surface
energy; Distilled water (H2O), Glycerol (C3H8O3), Formamide
(HCONH2) and Diiodomethane (CH2I2). These liquids were chosen to
cover the possible range from very polar liquid (water) to almost very
disperse (non-polar) liquid (diiodomethane).
In the present work, a 4 l droplet of reference liquid is projected
on the sample surface using a pipette. The photos of each droplet, lies on
the surface, were taken using a digital camera. The contact angles were
determined from the photos using the open source software ImageJ. The
value of the contact angles shown in this work are the average of at least
three measured values at three different places on the surface of each
sample. The measured contact angles were used to calculate and interpret
the surface free energy (SFE) of the PET samples. The SFE analysis will
be discussed in more details later.

Chapter 4
RESULTS &
DISCUSSION
PART I
NUMERICAL SIMULATION OF BEAM FORMATION IN AN ELECTRON GUN
FOR DIFFERENT APPLICATIONS

- 45 - Chapter 4 Results & Discussion Part I
CHAPTER 4
Numerical Simulation of Beam Formation in an Electron
Gun for Different Applications
Beams of charged particles and electron beams in particular are
being used widely in a great and continuously increasing number of
scientific instruments, electron devices and industrial facilities [Lawson,
1988, Hawks et al., 1989 and Humphries, 1990]. An indispensable part of
each electron-optical system is the electron gun in which a beam of
accelerated electrons is generated. Although the electron gun is usually
only a small fraction of the entire system, its characteristics are crucial for
the performance of the whole electron-optical column. Todays, a wide
range of electron guns is in use, which differs in design, accelerating
voltage, power, configuration of the beam and type of the emitter
[Sabchevski et al, 1996, Runa et al., 1999 and Mahapatra et al., 2005].
In order to realize the performance requirements of the applied
beam it is essential to obtain all possible knowledge of the beam from the
electron gun prior to its injection into the system. This gives the
opportunity to optimize the gun parameters according to beam
characteristics needed and to minimize the tuning time of the system
[Ragheb et al., 1996]. At the gun exit, to obtain a beam transmission
without particles loss, the cross-section of the beam must not exceed a
given maximum value of a defined point [Humphries, 1990]. To achieve
this we will introduce an important quantity known as emittance. The
emittance is an important aspect for high-quality beam, which is defined
by the product of the width and the transverse velocity spread of the beam
(region of phase space occupied by beam). If the beam is densely packed,

- 44 - Chapter 4
then the emittance is said to be low and if it is somewhat spread out, it
possess high emittance [Herrmann, 1958, Reiser, 1994 and Masood et al.,
2008].
In order to adopt the electron beam to our laboratory projects, the
surface modification of different materials and plasma acceleration
experiments, we will perform a numerical computer-aided simulation
study. According to the gun geometry, the resulting electron beam
properties will be investigated. In order to perform this theoretical
simulation, different gun models are previously studied [Hassan et al.,
2008]. The results are compared to the present electron gun design. This
is to reveal the parameters and conditions that must be followed to
maintain an appropriate output beam matched to the required application.
4.1. Theoretical Model Description
The models previously studied revealed the presence of multi
electron beam distortions. For instance using a plane extraction electrode,
an aberration arises in the extracted beams [Hassan et al., 2008]. To
overcome this divergent electron flow effect and to study the beam
control parameters, a shaped extraction electrode in spherical modeling
system will be investigated.
The Pierce gun design follows from the analysis of one dimension
electron flow between plane parallel electrodes [Pierce, 1940 and Pierce
1949]. In this analysis, Poisson equation is given by:
2
2 4o
d U J
dx (4.1)

- 45 - Results & Discussion Part I
where J is the current density, U is the accelerating voltage and o is the
permittivity of free space. The primary conditions of eq. (4.1) is
/ / 0dU dx dU dy , this means that no surface charge exist at the
beam edge which can give rise to electric fields normal to the beam
boundary [El-Saftawy, 2007]. By solving Poisson equation (4.1), Pierce
shows that the potential distribution inside the beam is given by:
2/31/3 4/33
2 2o
m J xU
e
(4.2)
where, x is the beam displacement along x-axis and m and e are the
electron mass and charge respectively. Also, the potential distribution
outside the beam is given by [Wilson et al., 1973]:
2/31/32/3
2 2 19 4cos tan
2 4 3o
m J yU z y
e z
(4.3)
where, y and z are the beam displacements along y- and z-axis
respectively. Equation (4.3) shows that, the zero potential (U=0) occurs
along a line passing through Z=0 and angle equal to (3/4)(π/2) = 67.5o
with the beam edge. An electrode which has the source potential and with
the shape of this zero equipotential forms one boundary to the fields
external to the beam. This electrode commonly known as Pierce
electrode. Pierce electrode bends electric fields to generate focusing
forces near the source. These electric forces counteract the defocusing
beam-generated forces on the edge of the beam [Humphries, 1990].

- 45 - Chapter 4
In the following analysis of the electron beam system, we will
consider the radial electrons flow in spherical coordinate system. The
cathode and the anode are parts of concentric spheres with radii of
curvatures c
R and a
R respectively. The near cathode, focusing electrode
is cup shaped with Pierce electrode inside, as shown in fig (4.1). The
region behind the anode assumes a field free region to the electrons in
which the electrons behave according to the inter-forces acting on them.
The behavior of the electron beam in this region will be discussed in
order to obtain the factors affecting the electrons motions.
Fig (4.1). Electron gun and beam configuration geometry.
4.2. Gun Geometry Effect on Electron Beam Perveance
The electrons flow in the spherical coordinates system is
characterized by [Humphries, 1990]:
3/2 3/2
2 2
16 229.34
9
oe U U
Im
(4.4)

- 45 - Results & Discussion Part I
where, I is the electrons current, e is the electronic charge, m is the
electron mass, U is the applied accelerating voltage and is the
Langmuir-Blodgett function which depends on the gun geometry as seen
in the formulae [Asi, 2001 and Tsimring 2007]:
2 3 4 5 6 0.3 0.075 0.001432 0.002161 0.00035 (4.5)
and ln( / )a c
R R is a function depending on the gun radii of curvatures
of the two electrodes. The connection between the gun geometrical
parameters ( / )a cR R and the primary angle of convergence , the
current I and the accelerating voltage U is determined by [El-Saftawy,
2007]:
2
6 3/2
2
/ 229.34 10
sinI X U
(4.6)
While the equation relating the beam current and the three halves power
of the accelerating voltage gives the perveance, in other words the gun
perveance P (in perv) is given by:
2
23/2
/ 229.34
sinIP
U
(4.7)
Equation (4.7) indicates that the perveance of the electron gun also
depends on the geometry of the electrodes system / , a cR R as shown
in fig (4.2), which indicate that the gun perveance can be controlled not
only by the accelerating voltages but also by varying the gun geometry.
Execution of the simulation shows that the beam perveance increases

- 45 - Chapter 4
slowly (fig (4.2)) until before
/ 0.75 a cR R (the saddle point) after
which the beam perveance increases very rapidly.
0.4 0.5 0.6 0.7 0.8 0.9 1.0
0
10
20
30
40 rad
rad
rad
Ra/R
c
Per
vean
ce P
(
perv
)
rad
Fig (4.2). Dependence of the electron beam perveance on the electrode geometry.
In plasma systems, the shape of the plasma meniscus controls the
output beam shape [Wilson et al., 1973 and Forrester et al., 1988], but in
thermionic electron guns, a shaping electrode (focusing electrode) is used.
This electrode has many shapes and designs according to the gun type to
avoid beam dispersion. In the present work, the gun and the focusing
electrode shape have been shown in fig (4.1). This configuration
generates a primary convergent electron beam with a primary
convergence angle .
4.3. Anode Lens Effect
The presence of an extraction electrode (anode) into the beam path
has many effects. The anode aperture modifies the electric field in that
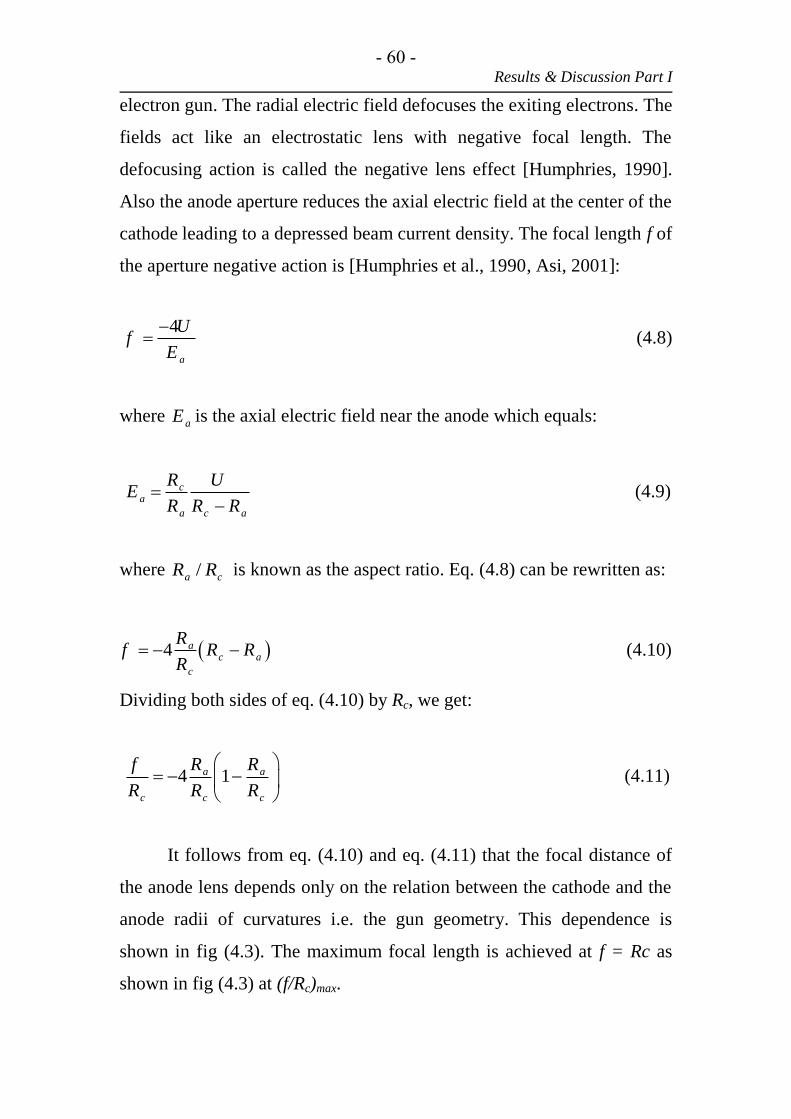
- 56 - Results & Discussion Part I
electron gun. The radial electric field defocuses the exiting electrons. The
fields act like an electrostatic lens with negative focal length. The
defocusing action is called the negative lens effect [Humphries, 1990].
Also the anode aperture reduces the axial electric field at the center of the
cathode leading to a depressed beam current density. The focal length f of
the aperture negative action is [Humphries et al., 1990, Asi, 2001]:
4
a
Uf
E
(4.8)
where aE is the axial electric field near the anode which equals:
ca
a c a
R UE
R R R
(4.9)
where
/a cR R is known as the aspect ratio. Eq. (4.8) can be rewritten as:
4 ac a
c
Rf R R
R (4.10)
Dividing both sides of eq. (4.10) by Rc, we get:
4 1a a
c c c
f R R
R R R
(4.11)
It follows from eq. (4.10) and eq. (4.11) that the focal distance of
the anode lens depends only on the relation between the cathode and the
anode radii of curvatures i.e. the gun geometry. This dependence is
shown in fig (4.3). The maximum focal length is achieved at f = Rc as
shown in fig (4.3) at (f/Rc)max.

- 56 - Chapter 4
Fig (4.3). Dependence of the focal length of the anode lens on the electrode geometry.
Due to the refracting property of the anode lens, the angle of
electron beam convergence at the exit of the gun is less than the initial
convergence angle . Angles and are connected by:
(4.12)
Here is the electron beam refracting angle due to the anode lens and
calculated from:
tan ar
f (4.13)
where, ra is the beam radius of the anode aperture and is given by:
sin a a a
r R R (4.14)
then, aR
f
(4.15)
0.3 0.4 0.5 0.6 0.7 0.8 0.90.3
0.4
0.5
0.6
0.7
0.8
0.9
1.0 (f/Rc)max
(Ra/R
c)
optimalf/
Rc
Ra/R
c

- 56 - Results & Discussion Part I
With the aid of eq. (4.14), eq. (4.15) can be rewritten as:
/
1/
a c
c
R R
f R
(4.16)
With the aid of eq. (4.16), it is easy to find the angle by plotting
a calibration diagram between
/a cR R and / cf R as seen in fig (4.3).
From eq. (4.16), it could be seen that, a parallel beam is obtained when
0 at / /a c c
R R f R . This condition is achieved when the aspect
ratio
./ 0 75a c
R R as deduced by eq. (4.11) and fig (4.3). Figure (4.4)
shows the decrease of the convergence angle with the increase of the
aspect ratio (
/a cR R ) up to a certain value [(
/a cR R )optimal = 0.75] after
which the beam lines make a crossover with the z-axis and this means
that the aberration begins to appear in the beam.
The above discussion could be summarized as follows:
1. When (
/a cR R ) = 0.75, the angle 0 , i.e. at the exit of the gun
the beam current will be parallel to the beam axis
2. When (
/a cR R ) > 0.75, the beam will be convergent.
3. When (
/a cR R ) < 0.75, the beam will be divergent.
By controlling the electron gun geometry, the shape of the output
beam can be controlled. This property is used to produce guns with
different output electron beam properties as:
1. Flood guns which produce a wide-angled beam, we will use this
type in solids and polymers surfaces treatments experiments.
2. Focusable guns which produce a small spot beam, we will use this
type in plasma acceleration experiments.

- 56 - Chapter 4
Fig (4.4). Dependence of the beam convergence angle on the gun geometry.
4.4. Effect of Equi-Potential Lines on the Electron Beam
Geometry
In order to study the effect of the equi-potential lines on the beam
geometry and shape, a computer program known as SIMION 3D version
7 has been used. The electric field distribution between the cathode and
the anode for different accelerating voltages are shown in fig (4.5).
According to the potential field lines distribution, the beam is shaped.
The field lines between the cathode and the anode which represent a
positive lens (focusing lens), the beam is focused when entering the
positive lens. Also the beam is defocused again leaving the anode
aperture and it enters the negative lens outside the gun in the field free
region. The field lines shapes and curvatures (concave or convex) are
determined according to the electrode geometry and the accelerating
voltages. In the present work, the pierce electrode with the spherical
anode form a positive lens between them resulting in a focused beam. The
0.4 0.5 0.6 0.7 0.8 0.9
0.00
0.02
0.04
0.06
0.08
0.10
0.12
0.14
0.16
0.18
rad
rad
r
ad
Ra/R
c
rad

- 55 - Results & Discussion Part I
output beam is defocused as it gets far away from the anode due to the
electric field reduction.
As could be seen in fig (4.5), the focal point of the anode lens gets
closer to the anode as the acceleration voltages increase. The focal
lengths are 120 mm, 66 mm and 20 mm at accelerating voltages 25 kV,
50 kV and 75 kV respectively. This means that the electron beam
becomes more converged, i.e. the electron beam emittance becomes very
low. The beam with low emittance will be used in the plasma acceleration
experiments; in this case the plasma tube will be mounted at the focal
point of the gun. As we get apart from the anode (in the field free region)
the electron beam become wider and the beam emittance become larger.
At this region the solids and polymers samples will be mounted for
irradiation experiments.
Fig (4. 5). Equi-potential lines distribution and the beam shape for different
accelerating voltages; a) 25kV, b) 50kV and c) 75kV.

- 54 - Chapter 4
4.5. Minimum Electric Field Required to Prevent Space
Charge Effect
A beam with appreciable space charge cannot be transported over a
long distance without using strong fields. It is of interest to have a guide
relating the rate of acceleration of the electron beams to the space charge
(i.e. beam current). From such a guide an approximate value of the
electric field which prevents beam expansion could be obtained. The
mathematical basis for the design of an electron gun follows from
analysis of one dimension flow between two parallel electrodes. One of
them is the emitter (cathode) and the other is the extractor (anode). It is
evident that the field intensity components Ez ≠ 0 & Ex=Ey=0. Also all
electrons have only one velocity νz normal to the electrode surface. The
potential distribution inside the beam can be described by the Poisson's
equation as [Wilson et al., 1973]:
2
2 1 2d (
d
2 )
z
l
o z
U J
z U (4.17)
where Uz is the potential in the plane parallel to the electrodes and
positioned at distance Z from the cathode, J is the current density of the
space charges emitted, e/m is the electron charge to mass ratio.
Equation (4.17) is a differential equation of the second order which has
the following solution:
4/3 zU A Z (4.18)
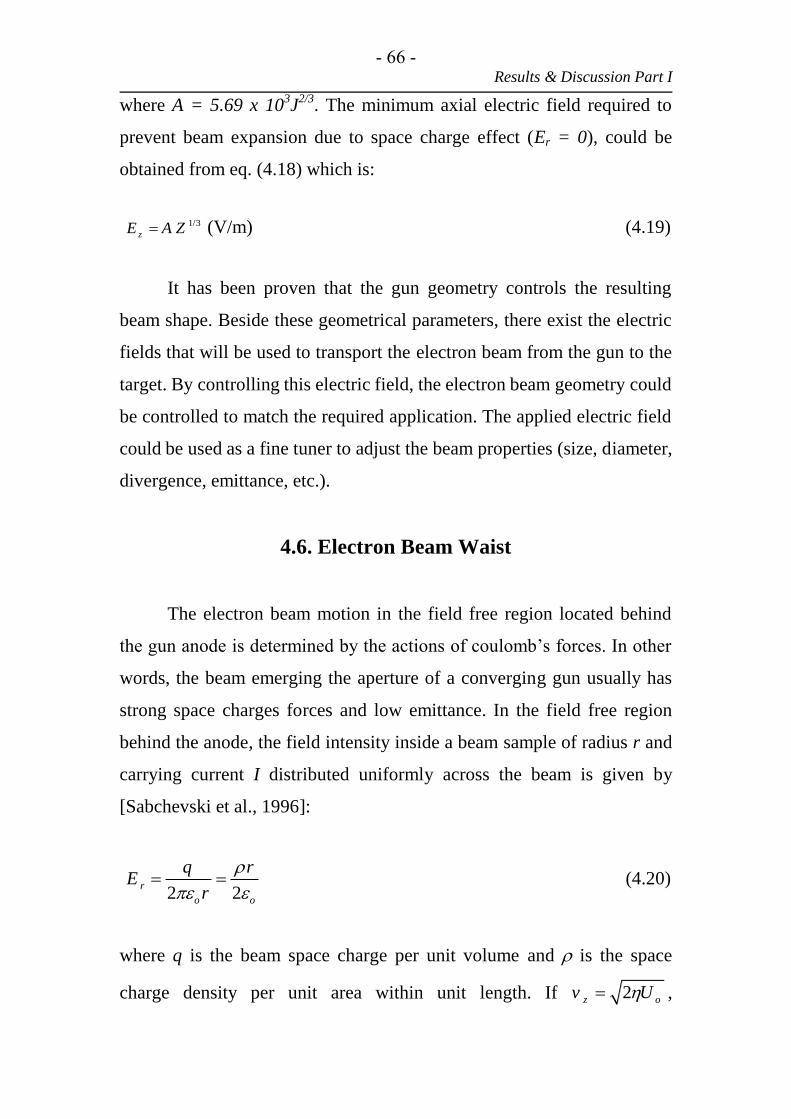
- 55 - Results & Discussion Part I
where A = 5.69 x 10³J
2/3. The minimum axial electric field required to
prevent beam expansion due to space charge effect (Er = 0), could be
obtained from eq. (4.18) which is:
1/3 zE A Z (V/m) (4.19)
It has been proven that the gun geometry controls the resulting
beam shape. Beside these geometrical parameters, there exist the electric
fields that will be used to transport the electron beam from the gun to the
target. By controlling this electric field, the electron beam geometry could
be controlled to match the required application. The applied electric field
could be used as a fine tuner to adjust the beam properties (size, diameter,
divergence, emittance, etc.).
4.6. Electron Beam Waist
The electron beam motion in the field free region located behind
the gun anode is determined by the actions of coulomb’s forces. In other
words, the beam emerging the aperture of a converging gun usually has
strong space charges forces and low emittance. In the field free region
behind the anode, the field intensity inside a beam sample of radius r and
carrying current I distributed uniformly across the beam is given by
[Sabchevski et al., 1996]:
2 2
r
o o
q rE
r
(4.20)
where q is the beam space charge per unit volume and is the space
charge density per unit area within unit length. If 2z ov U ,

- 55 - Chapter 4
2/ oJ I r and /
zJ v at the beam boundary or r (ro is the beam
radius at waist), then;
2
1
2o
r
oo U
IE
r
(4.21)
From eq. (4.20) and (4.21) it is shown that the field intensity is
inversely proportional to the beam radius inside the beam and directly
proportional to it outside the beam. In another words, as the beam radius
decreased, then the applied electric field requires to compress the beam is
large. The proportionality relation is illustrated schematically in fig (4.6).
Fig (4.6). Electric field distribution outside (right) and inside (left) the beam.
The equation of motion of the electron in the radial direction is:
2
2d
dr
rm eE
t (4.22)
Consider 1/2
d / d 2z ov z t U , by differentiating with respect to z;
2 2 2 2 2d / d d / dzr t v r z , eq. (4.22) can easily be transformed to
[Zhigarev, 1975]:

- 55 - Results & Discussion Part I
2
2 3/2
d 1 1
d 4 2 oo
r I
z r U (4.23)
In terms of the perveance and beam radius where '' 2 2 d / dr r z ,
eq. (4.23) takes the form:
'' 41.52 1 0 0
Pr x
r (4.24)
The solution of the above second differential equation gives the
minimum beam radius at the waist in terms of the envelope angle
(converging angle) and the beam perveance P at the anode as:
2326 tan
min ar r expP
(4.25)
Where P is in perv= 10-6
A/V3/2
.
The above analysis shows that, the minimum focused radius of a
beam rmin (at the beam waist) and the distance from the gun to this waist
are related to the beam slope and beam perveance. In order to achieve a
small beam size and low emittance, the beam must be of low perveance
with high initial convergence slope, as shown in fig (4.7).
From fig. (4.4) and fig. (4.7), it could be seen that, as the aspect
ratio /a cR R increases, the beam slope decreases and hence the minimum
beam radius decreases. This means that the beam emittance decreases
with the decrease of the aspect ratio. Also, as /a cR R increases, the beam

- 55 - Chapter 4
slope increases and hence the minimum beam radius increases too. This
leads to the increase of the beam emittance.
Fig (4.7). Dependence of the minimum output beam radius on the electrode geometry.
High emittance electron beam is a good choice for irradiation
experiments. In our work, it will be used in experiments of surface
modification of polymers and solids. On the other hand, Low emittance
electron beam is a desirable property for many applications. We will use
the low emittance electron beam in studying the interaction of electron
beam with plasma, which leads to the promising phenomena of plasma
acceleration.
0.02 0.04 0.06 0.08 0.10 0.12 0.14 0.16 0.180.00
0.05
0.10
0.15
0.20
0.25
0.30
0.35
0.40
0.45
0.50
0.55
0.60
P = 1 perv
P = 0.5 perv
P = 0.25 perv
r min
(cm
)
(rad)

Chapter 5
RESULTS &
DISCUSSION
PART II
INVESTIGATION OF BEAM PERFORMANCE PARAMETERS IN A
PIERCE-TYPE ELECTRON GUN

- 07 - Chapter 5 Results & Discussion Part II
CHAPTER 5
Investigation of Beam Performance Parameters in
a Pierce-Type Electron Gun
The development of electron beam devices has a long history and
electron beam technology has undergone several changes over the years
[Bakish, 1962 and Schulz, 2002]. A variety of electron beam sources has
been designed fabricated and utilized in the basic research as well as for
the industrial applications. The electron beam parameters such as
diameter, current, energy, etc. were adjusted to suit their specific
experimental requirements [Mehnert, 1996 and Mahapatra et al., 2005].
Charged particle beams from different types of sources have to be
transmitted without loss of the particles through the accelerator. It is very
important that the particles strike the target should have the parameters
required for a certain application. For a beam transmission without loss of
the particles, the cross-section of the beam must not exceed a given
maximum value of a well-defined point. To achieve this we will
introduce an important quantity known as emittance which one wants to
minimize for any given current [Humphries, 1990]. If the beam is densely
packed, then the emittance is said to be low. Whereas beam that is
somewhat spread out has high emittance [Herrmann, 1958, Reiser, 1994
and Masood et al., 2008].
Knowing the beam properties before its injection into the
accelerator saves the time needed for accelerator tuning and increases the
overall efficiency of the beam transmission [Ragheb et al., 1996]. At the
present work, the electron beam properties will be defined and regulated

- 07 - Results & Discussion Part II
to match the suggested application for the present thesis purpose
(treatment of Polymer surfaces) and for the future application (plasma
acceleration). The electron beam diagnostics done in this work include
the measurement of electron beam intensity, perveance, profile, and
hence emittance as a function the accelerating voltages. The beam fluence
and fluence rate will also be considered.
5.1. Studying Electron Beam Intensity and Perveance
Figure (5.1) shows the influence of the Accelerating voltages on
the extracted electron beam current and perveance. The electron beam
current increases from 20mA up to 250mA with the increase of the
Accelerating voltage up to 75kV, this dependency is in close agreement
with child-Langmuir [El-Saftawy, 2007]:
6 3/27.31 10 arI X Ud
(5.1)
where, ra is the beam radius at the anode exit aperture and d is the
distance between the cathode and the anode.
At higher accelerating voltages, the increase of the electron beam
current is limited and the current seems to be quasi-saturated in this
region. This quasi-saturation effect is because, the number of the
backscattered electrons increases with increasing the electron energy
[Assa'd et al., 1998 and Yadav et al., 2007].
Space charge effect in beams is conveniently characterized by the
perveance taking into account the magnitude of the beam current and the

- 07 - Chapter 5
accelerating voltage [El-Saftawy et al., 2006]. Figure (5.1) shows that the
perveance decreases with the increase of the accelerating voltage. The
beam perveance decreases from 5.7 x 10⁻²
perv down to 1.2 x 10⁻²perv
and the accelerating voltages increase from 5kV up to 75kV respectively.
For values of the perveance 210P perv the intrinsic electric field of
the beam has an appreciable effect on the motions of the electrons.
However, for values of 410P perv, the effect of space charge can be
neglected [Zigharev, 1975].
fig (5.1). Electron beam current and perveance as a function of the accelerating
voltages.
0 10 20 30 40 50 60 70 800
100
200
Accelerating Voltage Ua (kV)
Ele
ctr
on
Beam
Cu
rren
t I
(mA
)
1
2
3
4
5
6
Ele
ctr
on
Beam
Perv
ean
ce P
X1
0-2
(
perv
)

- 07 - Results & Discussion Part II
5.2. Tracing Electron Beam Profile and Emittance Analysis
Here we will trace the beam profile that describes the current
intensity distribution, the beam width, and the angular divergence of the
beam. For plasma acceleration experiment, the injected electron beam has
to be very thin, with high convergence angle and very low emittance.
These conditions are achieved at the electron beam waist that is located at
a distance 20 mm from the anode aperture (this distance is maintained
according to the simulation done previously in section (4.4)). So that, the
electron beam profile is traced at this point to find the optimum
conditions for performing the plasma acceleration experiments. The
traced profile (at accelerating voltages 36kV, 48kV, 60kV and 75kV) is
shown in fig (5.2) which is fitted to the Gaussian function, and the fitting
parameters are summarized in table (5.1).
Fig (5.2). Electron beam profile traced at 20mm from the anode aperture.
-2 -1 0 1 2
0.0
0.5
1.0
1.5
2.0
2.5
Sca
nn
ing
pro
be
cu
rre
nt
X 1
0-8 (
A)
Scanning probe position (mm)
Ua=75 kV
Ua=60 kV
Ua=48 kV
Ua=36 kV

- 07 - Chapter 5
The produced beam has to be wide to match the experiment of
electron beam treatments of materials for surface modification. The
electron beam is found to be wider and the convergence angle is larger
and hence the beam emittance is larger at the Faraday Cup (FC) i.e. target
holder. So that the beam profile is traced at distance 150mm from the
anode aperture as shown in fig (5.3). This figure shows two peaks which
are fitted Gaussian and shown in fig (5.4). The deduced fitting data are
also summarized in table (5.1).
Fig (5.3). Electron beam profile traced at 150mm from the anode aperture.
Table 1 shows the variations of the beam parameters with different
beam energies. In such a table we can see the parameters; xc is the center
of the beam and w is the beam full width at half maximum (FWHM).
Table 1 shows that;
-4 -2 0 2 4
0
10
20
30
40
50
60
Scannin
g p
robe c
urr
ent X
10
-5 (
A)
Scanning probe position (mm)
Ua= 75kV
Ua= 60kV
Ua= 48kV
Ua= 36kV

- 07 - Results & Discussion Part II
-5 0 5
0
2
4
6
8
10
12
14
16
18
20
22
Scannin
g p
robe c
urr
ent
X 1
0-5
(A)
Scanning probe position (mm)
(a)
-5 0 5
0
20
40
60
Scannin
g p
robe c
urr
ent X
10 -5
(A)
Scanning Probe position (mm)
(d)
Fig (5.4). Gaussian fit for beam profile traced at 150mm for different accelerating
voltages; a) 36kV, b) 48kV, c) 60kV and d) 75kV., Where( ____ )is the cumulative fit
peak, (-----) is the fit peak 1 and 2, and (……) is the base line.
Energy (keV) xc W(mm) xc W (mm)
Data extracted from fig
.(5.2)
Data extracted from
..4)5(fig
36 0.04 1.3 Peak 1
Peak 2
-1.27
1.33
2.64
2.50
48 0.08 1.28 Peak 1
Peak 2
-1.79
0.78
2.06
3.40
60 0.17 1.21 Peak 1
Peak 2
-1.28
1.37
2.36
2.67
75 0.15 1.19 Peak 1
Peak 2
-1.28
1.36
2.27
2.50
Table (5.1). Beam fitting parameters.
-5 0 5
0
10
20
30
40
scannin
g p
robe c
urr
ent X
10
-5 (
A)
Scanning probe position (mm)
-5 0 5
0
20
40
60
Scannin
g p
robe c
urr
ent X
10
-5(A
)
Scanning probe position (mm)
(c)

- 07 - Chapter 5
1. The beam width decreases with energy i.e. raising beam energy
focuses the beam.
2. Electron beam current intensity increases with the beam energy.
3. The beam center changes and deviates from zero point, this may
be due to the strong repulsive force which increase as the
electrons become closer to each other i.e. the beam is focused.
This is also proved by coulomb law; the force between charges
increases as the square of the distance between them decreases
too [Tippler, 2004].
Increasing the accelerating voltages, increases the axial component
of the accelerating field with respect to the transverse component which
affects the beam to spread and thus allowing the beam to become more
convergent [Abdelaziz et al., 2000]. The velocities of the electrons
emitted perpendicular to the cathode surface have two components; axial
and transverse. The axial component zv is proportional to the accelerating
energy eU where [Hassan, 1993 and Zakhary, 1995];
2z
eUv
m (5.2)
The transverse component xv is proportional to the transverse
kinetic energy kBT (kB is Boltzmann constant and T is the electrons
temperature) of the electrons which causes the spread of the beam width,
where [El-Saftawy, 2007]:
Bx
k Tv
m (5.3)

- 00 - Results & Discussion Part II
Therefore, the angle of beam divergence is found to be in the
form [Green, 1976];
Bk T
eU (5.4)
Since eU is the axial accelerating energy of the electron beam.
From such an equation, it is seen that is directly proportional to the
electron temperature and inversely proportional to the accelerating
voltage U, i.e. the increase of the accelerating voltage causes a decrease
of the beam width and emittance. As the electrons approach the axis of
the beam, the columbic repulsive force increases, this effect leads to the
escape of electrons towards the beam boundaries. This phenomenon
explains the splitting of the beam profile curves shown in fig (5.3). Under
the action of the anode lens these two peaks disappear, fig (5.2). After the
beam escapes from the anode lens field, the beam splitting appears fig
(5.3).
Figure (5.5) shows the variation of the beam radius at waist (20mm
from the anode aperture) and at the FC entrance (150mm from the anode
aperture) with the variation of the electron beam perveance. The electron
beam radius increases with the increase of the electron beam perveance.
Hence, to obtain a minimum beam waist we have to use a low perveance
beam. These results are confirmed and in a very close agreement with the
computer simulation results previously reported [section (4.6)].

- 07 - Chapter 5
Fig (5.5). Beam radius at waist variation with beam perveance.
Finally, the increase of the beam width with the increase of z and
the decrease of this width with the increase of the extracting voltages are
evident from fig (5.2) and (5.3). The beam diameter decreases with
increasing the accelerating voltage. Thus, it is possible to vary the beam
diameter for any energy over the range 1 to 75 keV. These results are in
close agreements with others [Deore et al., 2012]. The space charge effect
is believed to be the cause of the divergence of the electron beam; while
the focusing property of the anode aperture improves the beam profile
confinement i.e. focuses the electron beam.
The emittance is being roughly proportional to the ratio of
transverse velocity to axial velocity of the electron. This ratio gives the
slope of the trajectory leaving the emitting surface. If the emitting surface
1.2 1.4 1.6 1.8 2.0 2.2 2.4 2.6 2.8
0.60
0.65
0.70
0.75
0.80
P X 10-2 (perv)
Ele
ctr
on
be
am
ra
diu
s a
t w
ais
t (m
m)
2.28
2.30
2.32
2.34
2.36
2.38
2.40
2.42
2.44
Ele
ctr
on
be
am
ra
diu
s a
t F
C (
mm
)

- 07 - Results & Discussion Part II
is a circle with radius rc , then the normalized emittance is defined as
[Hassan 1993]:
2n c
kTr
m
(5.5)
and the transverse emittance x is given by:
.
,x A X X
(5.6)
The envelope of .
,A X X
is an upright ellipse with extreme
values (.
,m mx x ); then its area is.
( )m mx x , therefore:
..
x m mx x r (5.7)
For small values of tan /r z , Where; r is the beam radius
and z is the distance from the exit aperture of the beam to the scanning
probe. In this work z equal two values 20 mm and 150 mm.
The increase of the accelerating voltage decreases the width and
the divergence angle of the electron beam and hence the electron beam
emittance decreases. Table (5.2) confirms the principle which states that
the minimum beam radius is found at minimum beam perveance and
higher beam convergence (this result is confirmed previously at chapter 4
section (4.6)). In table (5.2), (1 1 1, ,r ) are the beam radius, convergence

- 77 - Chapter 5
angle and emittance at waist, and (2 2 2, ,r ) are the beam radius,
convergence angle and emittance at the entrance of FC.
Energy
(keV)
1r
(mm)
1
(mrad)
1
(mm.mrad)
2r
(mm)
2
(mrad)
2
(mm.mrad)
36 0.65 0.0325 0.0211 2.44 0.0163 0.04
48 0.64 0.0320 0.0205 2.36 0.0157 0.037
60 0.605 0.0303 0.0183 2.335 0.0155 0.036
75 0.595 0.0298 0.0177 2.295 0.015 0.034
Table (5.2) Variation of beam geometry and emittance with energy.
5.3. Electron Beam Fluence Calculation
The following quantities are used to describe an ionizing radiation
beam (electron beam): particle fluence, energy fluence, particle fluence
rate and energy fluence rate [Nilsson et al., 1995 and Burns et al., 1996].
In this work we will use the terms, electron beam fluence and fluence rate
to describe the electron beam in the irradiation of materials surfaces
experiments. According to the definitions of fluence and fluence rate
(appeared in chapter 2, section 2.1.8), these parameters have been
calculated. Figure (5.6) shows the increase of the fluence rate (number of
electrons incident on a specific area per second) with the increase of the
accelerating voltage. The maximum number of electrons enter the FC are
1.56 X 10¹⁸
electrons at accelerating voltage 75 kV. The fluence rate is in
the range from (2 x 10¹⁶
up to 2.21 x 10¹⁷
) electrons/s.cm2 at energies
between 5keV and 75keV respectively. According to the irradiation time
the electron beam fluence is calibrated at electron beam energy 75keV.
Figure (5.7) shows a straight line, its slope (1.3 x 10¹⁹
e/min.cm2)
represents the electron beam fluence rate.

- 77 - Results & Discussion Part II
Fig (5.6). Influence of accelerating voltage on fluence rate.
Fig (5.7). Calibration of electron beam fluence at energy 75keV.
0 10 20 30 40 50 60 70 800
5
10
15
20
25
Flu
ence
Rat
e d
dt
X 1
016
(e/
cm2 s)
Acceleration Voltage Ua (kV)
0 1 2 3 4 5
0
10
20
30
40
50
60
70
Flu
ence
X
1018
(e/c
m2 )
Irradiation time t (min)

Chapter 6
RESULTS &
DISCUSSION
PART III
ELECTRON BEAM INDUCED MODIFICATION OF POLY (ETHYLENE
TEREPHTHALATE)MEMBRANE SURFACE

- 28 - Chapter 6 Results and Discussion Part III
CHAPTER 6
Electron Beam Induced Modification of
Poly (Ethylene Terephthalate) Membrane Surface
Hydrophilic membrane filtration is used in several industries to
filter various liquids. These hydrophilic filters are used in the medical,
industrial, and biochemical fields to filter bacteria, viruses, proteins and
other contaminates. Unlike other membranes, hydrophilic membranes do
not require pre-wetting. Hydrophilic membrane fabric can filter liquids
and water in its dry state. Although most hydrophilic membranes are used
in low-heat filtration processes, many new hydrophilic membranes are
used to filter hot liquids and fluids [Khulbe et al., 2008].
There is a growing interest in polymers with specifically improved
surface properties like wettability, printability and biocompatibility
[Oehr, 2003 and Inagaki et al., 2004]. Many studies have been performed
to improve wettability and surface free energy (SFE) (the work required
to increase the surface area of a substance by unit area) of polymers to
overcome the problems induced by the hydrophobic nature of the
polymer. Wettability is an important characteristics for polymer materials
and in some applications a good wet surface is necessary. SFE and
wettability depend mainly on the amount of hydrophilic groups such as,
ether, ester and carboxyl groups and also on the development of the
surface roughness by forming micro-pores on the surface [Wrobel et al.,
1978].
Surface modification is a key instrument for the design of new
products and processes. Several surface modification methods are

- 28 - Results and Discussion Part III
employed to modify the polymer surface, such as chemical, thermal,
mechanical or electrical treatments [Behnisch et al., 1993]. New methods
are required to obtain polymer surface possess good wettability and high
surface energy. Electron beam processing of polymers has advantages
comparing to the previously mentioned methods because it is rapid, clean,
gas and chemical independent, non-aqueous, and environmentally
friendly method. Thus electron beam treatment is an attractive method for
improving surface properties. Poly (ethylene terephthalate) (PET) film
has some excellent bulk properties, such as very good barrier properties,
crease resistance, solvent resistance, high melting point >250oC and
resistance to fatigue [Yang et al., 2009]. However, PET is sometimes an
unsuitable material to use due to its low surface energy leading to poor
wettability and poor adhesion [Guruvenket et al., 2004 and Pandiyaraj et
al., 2008].
In the present work, PET polymer film is chosen to study further
improvement of its SFE and then its wettability by treating it with
different fluence of low energy electron beam. This technique allows the
surface modification of the material without changing its bulk properties.
To study the electron trajectories effects upon PET film, a CASINO
V2.481 (abbreviation for "monte CArlo SImulation of electroN
trajectories in sOlids") program is used. The surface modification
processes done in the present study are aimed mostly at: i) changing the
hydrophobic properties into hydrophilic ones, ii) Increasing SFE values
and hence improving adhesion properties of the materials. The surface
modifications of PET after electron beam treatment are analyzed by:
Fourier transform infrared (FTIR) spectroscopy, atomic force microscopy
(AFM) techniques, contact angle measurement, and surface free energy
(SFE) analysis.

- 28 - Chapter 6
6.1. Electron Beam Interaction with PET Film: a
Simulation Study
Before proceeding in studying the effect of electron beam upon the
PET film, we make a simulation study of the interaction between the
electron beam and the PET samples. When the incident electron beam
reaches the sample surface, electrons interact with the atoms of the
material and diffuse inside a volume called pear of diffusion [Arnoult et
al., 2010]. Here we will use a fast and easy to use modeling tool known as
CASINO V2.481. The program provides Monte Carlo simulations of
electron trajectories in matter using tabulated Mott elastic cross sections
and experimentally determined stopping powers [Hovington et al., 1997].
Figure (6.1) presents the pear shape for the interaction of low
energy electron beam (45keV, 60keV and 75keV) with the PET film. An
electron beam of diameter 10m is projected over the PET samples. The
number of simulated electrons is 20000. Figure (6.1) indicates that as the
electron beam energy increases, the electron beam depth into the PET
sample increases too.
Figure (6.2) shows the maximum penetration depth (Zmax) of the
electrons in the sample. The Zmax is shown at 70m (for electron beam
energy 75keV) after which the number of hits (interactions) start to
decrease. This means that the electrons lost their energies and stopped
completely at Z= 90m into the PET film.

- 28 - Results and Discussion Part III
(a)
(b)
(c)
Fig (6.1). The pear of diffusion into PET film for different energies a) 45keV, b)
60keV and c) 75keV.

- 28 - Chapter 6
fig (6.2). Maximum penetration depth of electrons into PET film at energy 75keV.
The energy by position distribution is a very interesting tool to
investigate the absorbed energy in the sample and has applications in the
areas of electron beam lithography, cathodoluminescence, and electron
beam induced current (EBIC). The energy by position distribution records
the amount of energy lost by the simulated electron trajectories [Drouin et
al., 2007]. The deposited energy distribution over the xy plane is shown
in fig (6.3) and xz plane is shown in fig (6.4). The energy contour lines
calculated from the center of the landing point shows the percentage of
energy not contained within the line. For example, a 10% line is the
frontier between the area containing 90% of the absorbed energy and the
rest of the sample. Also the gray shading ranges from light to dark as the
density increases [Drouin et al., 2007]. This color range proves the
Gausian distribution of the electron beam density for the Pierce-type
electron gun used in this work.
0 20000 40000 60000 80000 100000
0.000
0.002
0.004
Hits (
No
rmaliz
ed
)
Depth Z (nm)
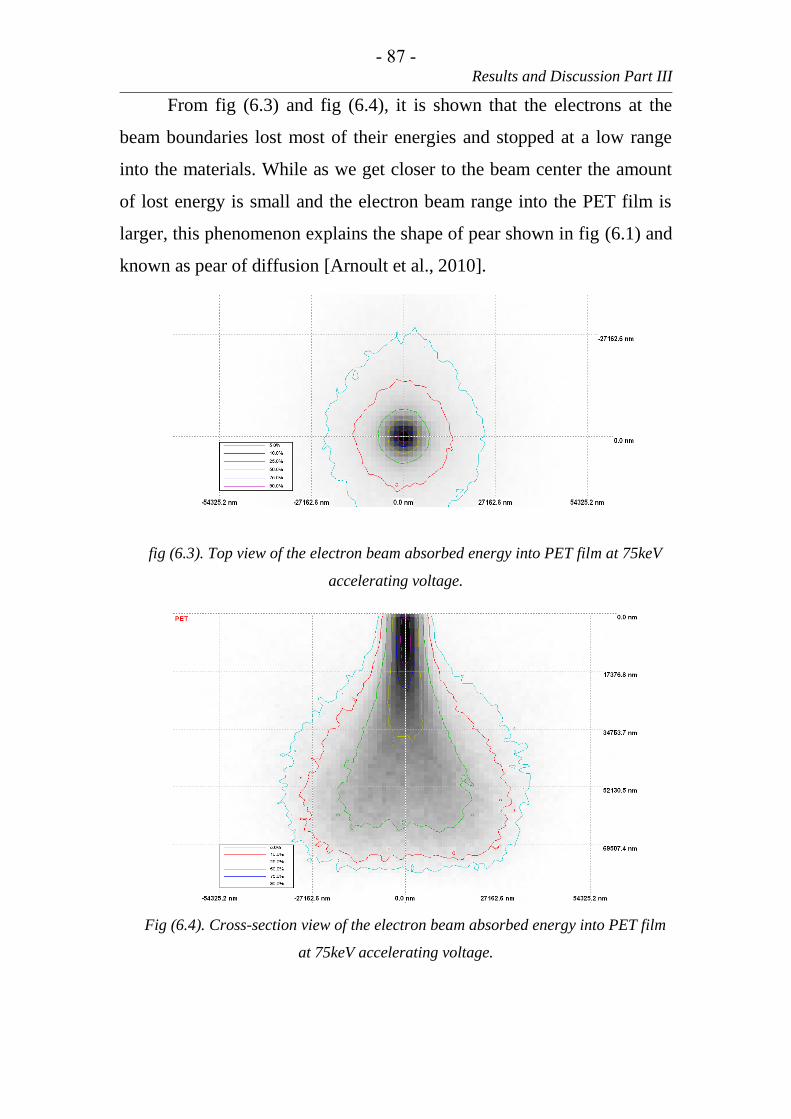
- 28 - Results and Discussion Part III
From fig (6.3) and fig (6.4), it is shown that the electrons at the
beam boundaries lost most of their energies and stopped at a low range
into the materials. While as we get closer to the beam center the amount
of lost energy is small and the electron beam range into the PET film is
larger, this phenomenon explains the shape of pear shown in fig (6.1) and
known as pear of diffusion [Arnoult et al., 2010].
fig (6.3). Top view of the electron beam absorbed energy into PET film at 75keV
accelerating voltage.
Fig (6.4). Cross-section view of the electron beam absorbed energy into PET film
at 75keV accelerating voltage.

- 22 - Chapter 6
6.2. FTIR Analysis
Fourier transform infrared (FTIR) spectroscopy has been widely
used by many researchers to study polymer composition. FTIR
spectroscopy provides information regarding intermolecular interaction
via analysis of FTIR spectra corresponding to stretching or bending
vibrations of particular bonds. The position at which these peaks appear
depends on the bond type [Dumitrascu et al., 2001]. The bonds of the
PET film exists at certain troughs which are clearly shown in fig (6.5)
which shows FTIR spectra of PET film before electron beam treatment.
Fig (6.5). FTIR spectra of PET film before electron beam treatment.
The region to the right-hand-side of fig (6.5) (from about 1500cm-1
to 500cm-1
) usually contains very complicated series of absorptions.
These are mainly due to all manner of bending vibrations within the
molecule. This region is called the finger print region [Hsu, 1997]. The
4000 3500 3000 2500 2000 1500 1000 500
-20
0
20
40
60
80
100
C-H (731cm-1)
bending ethyl
Tra
nsm
itta
nce %
Wavenumbers (cm-1)
H-C=O(2907cm-1
)C-H (3055cm
-1)
Phenyl ring
C-H (2970cm-1)
ethyl
C-H (1578cm-1
)
phenyl ring
C=O (1725cm-1)
esterC-C (1408cm
-1)
phenyl ring C-O
ester
CH2 (1471cm
-1)
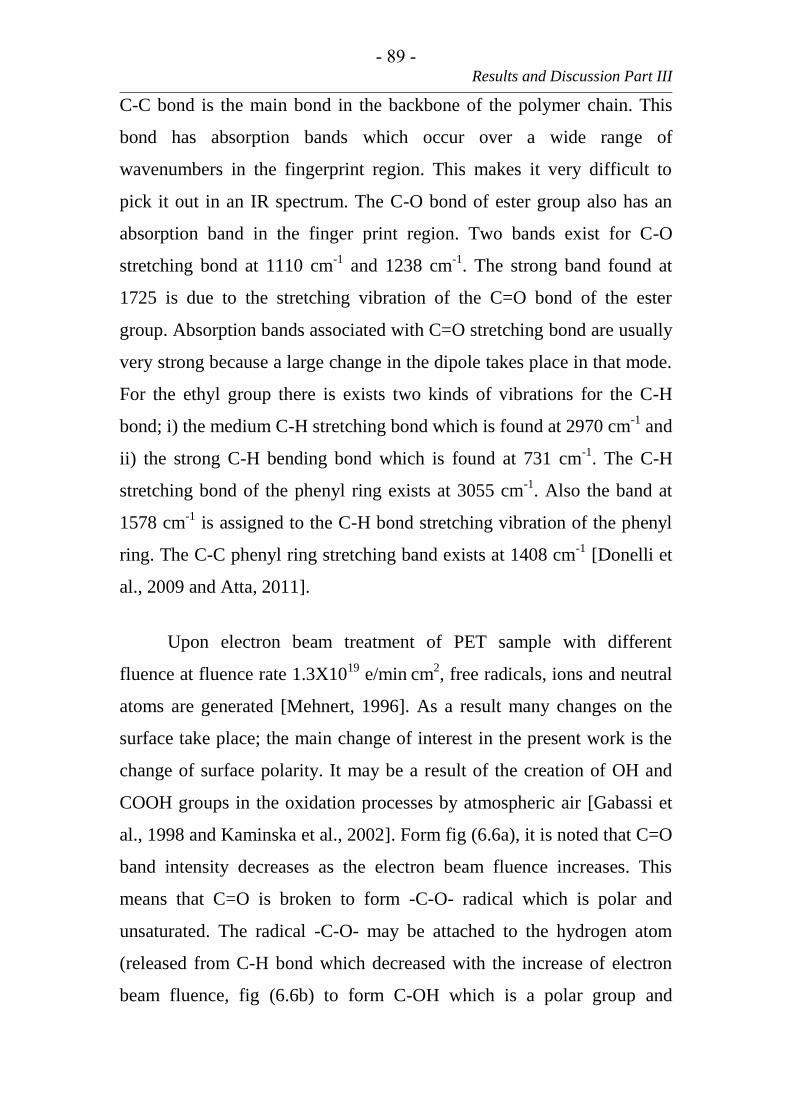
- 28 - Results and Discussion Part III
C-C bond is the main bond in the backbone of the polymer chain. This
bond has absorption bands which occur over a wide range of
wavenumbers in the fingerprint region. This makes it very difficult to
pick it out in an IR spectrum. The C-O bond of ester group also has an
absorption band in the finger print region. Two bands exist for C-O
stretching bond at 1110 cm-1
and 1238 cm-1
. The strong band found at
1725 is due to the stretching vibration of the C=O bond of the ester
group. Absorption bands associated with C=O stretching bond are usually
very strong because a large change in the dipole takes place in that mode.
For the ethyl group there is exists two kinds of vibrations for the C-H
bond; i) the medium C-H stretching bond which is found at 2970 cm-1
and
ii) the strong C-H bending bond which is found at 731 cm-1
. The C-H
stretching bond of the phenyl ring exists at 3055 cm-1
. Also the band at
1578 cm-1
is assigned to the C-H bond stretching vibration of the phenyl
ring. The C-C phenyl ring stretching band exists at 1408 cm-1
[Donelli et
al., 2009 and Atta, 2011].
Upon electron beam treatment of PET sample with different
fluence at fluence rate 1.3X10¹⁹
e/min cm
2, free radicals, ions and neutral
atoms are generated [Mehnert, 1996]. As a result many changes on the
surface take place; the main change of interest in the present work is the
change of surface polarity. It may be a result of the creation of OH and
COOH groups in the oxidation processes by atmospheric air [Gabassi et
al., 1998 and Kaminska et al., 2002]. Form fig (6.6a), it is noted that C=O
band intensity decreases as the electron beam fluence increases. This
means that C=O is broken to form -C-O- radical which is polar and
unsaturated. The radical -C-O- may be attached to the hydrogen atom
(released from C-H bond which decreased with the increase of electron
beam fluence, fig (6.6b) to form C-OH which is a polar group and

- 89 - Chapter 6
enhances the wettability of the surface. The -OH group is found at 3334
cm-1
and its intensity increases with the electron beam fluence as shown
in fig (6.6d). The polarity is also increased by increasing the intensity of
the band H-C=O (2907cm-1
), fig (6.6c). Hence the electron beam
treatment of PET films increases the surface hydrophilicity and
wettability by increasing the number of polar groups on the surface.
Fig (6.6). FTIR spectrum of PET
film before and after electron beam treatment; a) decrease of C=O at 1725cm-1
, b)
decrease of C-H intensity at 731cm-1
, c) increase of H-C=O intensity at 2907cm-1
and
d) appearance and increase of –OH group at 3334cm-1
.
745 740 735 730 725 720 715
0
75
X 1019
e/cm2
e/cm2
X 1019
e/cm2
X 1019
e/cm2
(b)
Tra
nsm
itta
nce %
Wavenumbers (cm-1)
2950 2900 2850
60
80
Tra
nsm
itta
nce %
Wavenumbers (cm-1)
X 1019
e/cm2
e/cm2
X 1019
e/cm2
X 1019
e/cm2
(c)
1800 1750 1700
0
80
X 1019
e/cm2
e/cm2
X 1019
e/cm2
Tra
nsm
itta
nce %
Wavenumbers (cm-1)
X 1019
e/cm2
(a)

- 89 - Results and Discussion Part III
6.3. Morphological Analysis: AFM Results
AFM images in fig (6.7) shows the overall morphology of both
untreated and treated samples of PET film with different electron beam
fluence. These images show a drastic change in surface morphology with
the increase of electron beam fluence. As can be seen in Fig (6.7a), the
surface of untreated film shows only minor irregularities but no
recognizable damage, these irregularities are believed to be associated
with manufacturing defects [Wong et al., 2003]. After the electron beam
treatment, the size and the numbers of the conical protuberances on the
PET film surfaces has increased with increasing fluence, fig (6.7b-d). The
increased irregularities on the surfaces which represented in the increased
protuberances roughened the treated PET Surface. The pores appear also
with increasing fluence. It is well known that the surface morphology,
especially surface roughness influences the wettability by the formation
of pores [Wrobel et al., 1978] as seen in AFM images.
The surface roughness computed from AFM images are
summarized in table (6.1) which shows the root mean square roughness
(Rrms) and the absolute surface rougness (Ra). It can be seen that the
roughness increases with fluence until fluence 4 X 10¹⁹
e/cm2 then it
decreases at higher fluence. This behavior may be attributed to the
coalescence of conical protuberances at high fluence i.e. as the number of
protuberances increases; they become closer to each other and interfere
resulting in a reduced surface area. The roughness is increased due to the
removal of top few monolayers of the polymer films, caused by the
electron beam impact on the surface. The interaction of electron beam
with the surface of polymer film causes rapid removal of low molecular
contaminants such as additives, processing aids, and adsorbed species

- 88 - Chapter 6
resulting in etching of the surface [John, 2005 and Yang et al., 2009].
This is either due to the physical removal of molecules of fragments or
the breaking up of bonds, chain scission, and degradation process. It is
well known that the surface roughness increases the surface area [Poletti
et al., 2003 and Atta, 2011] which in turn improves wettability and
bonding strength [Pandiyaraj et al., 2008].
Fig (6.7). AFM images of electron beam treated PET film with different fluence.
(a) e/cm2
(b) X 1019e/cm
2
(c) X 1019e/cm
2 (d) X 10
19e/cm
2

- 88 - Results and Discussion Part III
Table(6.1). Surface roughness as a function of electron beam fluence.
6.4. Wettability Analysis: Electron Beam Fluence vs.
Contact Angle
The contact angles allow a simple and effective evaluation of the
wettability of polymers [Extrand et al., 1997 and Chau t al., 2009]. As the
tendency of a drop to spread out over a solid surface increases, the
contact angle decreases. Thus the contact angle provides an inverse
measure of wettability [Sharfrin et al., 1960]. This fact is proved as seen
in fig (6.8), the contact angle of different liquids on PET surface
decreases with the increase of the electron beam fluence.
The decrease of contact angle is caused by the formation of
hydrophilic (polar) groups on the electron beam treated polymer which
may be explained as follows: the electron beam hits the surface and
creates radical species on the polymer surface. These species can combine
with oxygen in the air, this also contribute to increase the amount of polar
groups such as –OH, C=O and COOH on the electron beam treated PET
film (this fact is proved previously by FTIR analysis). Hence these polar
groups make the treated polymer surface become more hydrophilic and
the wettability increases compared to the wettability of untreated PET
film surface [Wei et al., 2006, Pandiyaraj et al., 2008 and Abdul-Kader et
al., 2009]. Thus the decrease of the contact angle as a function of the
Electron beam Fluence
X 1019
(e/cm-2
)
0 1.3 4 6.6
Ra (m) 17.19 ± 3 17.67 ± 3.2 24.97 ± 3.5 22.76 ± 3.3
Rrms(m) 17.99 ± 3.1 19.84 ± 4.1 26.89 ± 4.2 23.92 ± 3.7

- 88 - Chapter 6
electron beam fluence is due to the formation of new hydrophilic groups
and the oxidized layer on the polymer surface [Abdul-Kader et al., 2005,
Turos et al., 2006 and Al-Qaradawi et al., 2007].
0 1 2 3 4 5 6 7
20
30
40
50
60
70
80
Co
nta
ct A
ng
le (
de
g)
Electron beam fluence X 1019
(e/cm2)
Water
Glycerol
Formamide
Diiodomethane
Fig (6.8). Contact angle for different measuring liquids as a function of electron
beam fluence.
6.5. Evaluating SFE and Adhesion Properties of the PET
Film
The value of SFE is used to evaluate the changes occurring in the
surface layer upon its modification. The contact angle is used as a
measure to estimate SFE of solid surface (PET polymer in the present
study). Contact angle measurement with different liquids of known
surface energy (surface tension) form the basis for the calculation of the
SFE of polymers [Kwok et al., 1999]. However, the polymer SFE, or

- 88 - Results and Discussion Part III
parameters related to the SFE, can be different depending on the model
chosen.
In a situation of three phases solid-liquid-vapor interactions, there
are exist three interfacial forces. These forces are related together by
Young equation (2.16) which rewritten as [Young, 1805]:
cos s sl l
(6.1)
where, sis the SFE of a solid, sl
is the SFE corresponding to solid-
liquid interface, l is the SFE of a measuring liquid [water
272.8 / l mJ m , glycerol 2
64 / l mJ m , formamide 258 / l mJ m
and diiodomethane 250.8 / l mJ m ] [Dann, 1970] and is the contact
angle between the solid and the measuring liquid. Young equation and the
measured value of the contact angle are being used as the basis for
calculating the SFE of PET film in the present work.
6.5.1. One Liquid Model: Neumann (N) Analysis
In order to solve Young equation, Neumann assumed that value
depends on the properties of a solid and a measuring liquid and is given
by [Żenkiewicz, 2007]:
2
10.5
2
l s
sl s l s le (6.2)
For PET, β1=0.0001247 [Ward et al., 1973 and Rotenberg et al., 1983].
By substitution from eq. (6.1) into eq. (6.2), we get;
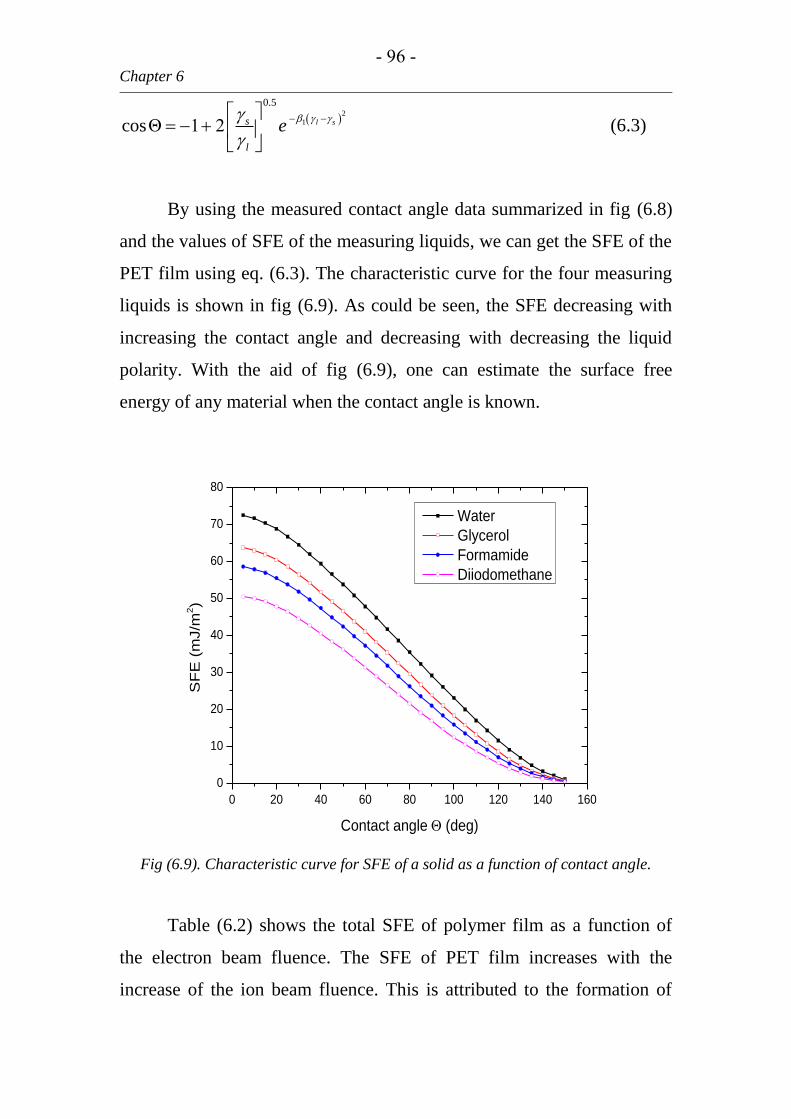
- 88 - Chapter 6
2
1
0.5
cosΘ 1 2
l ss
l
e (6.3)
By using the measured contact angle data summarized in fig (6.8)
and the values of SFE of the measuring liquids, we can get the SFE of the
PET film using eq. (6.3). The characteristic curve for the four measuring
liquids is shown in fig (6.9). As could be seen, the SFE decreasing with
increasing the contact angle and decreasing with decreasing the liquid
polarity. With the aid of fig (6.9), one can estimate the surface free
energy of any material when the contact angle is known.
Fig (6.9). Characteristic curve for SFE of a solid as a function of contact angle.
Table (6.2) shows the total SFE of polymer film as a function of
the electron beam fluence. The SFE of PET film increases with the
increase of the ion beam fluence. This is attributed to the formation of
0 20 40 60 80 100 120 140 160
0
10
20
30
40
50
60
70
80
SF
E (
mJ/m
2)
Contact angle (deg)
Water
Glycerol
Formamide
Diiodomethane

- 88 - Results and Discussion Part III
polar groups over the surface layer, which enhances the surface
wettability and adhesion. As the liquid polarity increases, the surface
polarity increases too, this is due to the interaction of the liquid dipole
moments with the surface polar groups.
Table (6.2). SFE of PET film as a function of electron beam fluence for different
measuring liquids.
The general equation correlating the wetting and bonding behaviors
at the interface of a solid-liquid-vapor system is [Papaconstantinou et al.,
2007]:
a s l slW (6.4)
where the work of adhesion aW represents the energy of interaction
between the liquid and the solid phases per unit area. By substitution
from eq. (6.1) into eq. (6.4), we get;
1 cosΘ a lW (6.5)
Electron beam Fluence X
1019
(e/cm-2
)
sγ
Water
sγ
Glycerol
sγ
Formamide
sγ
Diidomethane
0 35.19 34.2 38.8 40.8
1.3 56.8 51.69 51.19 45.12
4 67.96 60.36 54.7 48.48
6.6 68.7 60.75 55.5 48.8

- 82 - Chapter 6
Equation (6.5) shows that the work of adhesion depends on the
SFE of the measuring liquid and the contact angle which in turn depend
on the type of polymer and the morphology of the surface. Figure (6.10)
shows the variation of the work of adhesion at the interface of the
PET/liquid systems calculated according to eq. (6.5).
-1 0 1 2 3 4 5 6 7
80
90
100
110
120
130
140
150
Water
Glycerol
Formamide
Diiodomethane
Work
of adhesio
n W
a (
mJ/m
2)
Electron beam fluence X 1019
(e/cm2)
Fig (6.10). Work of adhesion of PET film with different liquids as a function of
electron beam fluence.
The work of adhesion increases with the polarity of the measuring
liquid i.e. the strongest work of adhesion is found for more polar liquids
(water). With the increase of electron beam fluence, the polar groups on
the PET film surface increases, hence the surface polarity increase. This
effect increases the interaction with polar liquids (the liquid spread out
over the surface) and hence the work of adhesion becomes stronger.

- 88 - Results and Discussion Part III
6.5.2. Two Liquids Model: Owens and Wendt (OW) Approach for
SFE Calculation
The polymer/liquid interaction is described by a wide number of
different kinds of intermolecular interactions between molecules of
polymers (solids) and liquids. Fowkes assumes that the SFE of a solid
(and of a liquid) is a sum of independent components associated with
specific interaction [Fowkes, 1964 and Fowkes, 1972]:
d p h i ab o
s s s s s s s (6.6)
where, d
s is the always existing London dispersion forces or sometimes
called non-polar forces, p
s is the polar forces of intermolecular
interactions that depend on the chemical nature of the material, h
sis the
hydrogen force (related to hydrogen bonds), i
s is the induction forces,
ab
s is the acid-base force and o
s refers to all remaining interactions.
Owens and Wendt (OW) [Owens et al., 1969] changed Fowkes
idea and assumed that, the sum of all component occurring on the right-
hand side of eq. (6.6), except d
s can be considered as associated with the
polar interaction force s
p . Thus eq (6.6) could be rewritten as:
d p
(6.7)
According to OW model, only similar components of the
respective surface energies interact. In this model the geometric mean of
the interfacial interactions is used and consequently the following
equation is obtained:

- 999 - Chapter 6
0.5 0.5
2
d d p p
sl s l s l s l (6.8)
The combination of eq. (6.1) with eq. (6.8) leads to the following
relationship:
0.50.5 0.5
0.5
1 cosΘ2 2
pd pl ls s dd
ll
(6.9)
Which represents a linear equation in the form Y = m + bX, where:
0.50.5 0.5
0.5
1 cosΘ, , 2 and 2
pd pl ls sdd
ll
Y X m b .
Equation (6.9) shows two unknowns, to solve it we have to get two
equations of two unknowns. Thus, the contact angle has to be measured
with two measuring liquids which in turn yield two equations in the form
of eq. (6.9). The liquid with a polar component should be chosen as one
of the measuring liquids and the dispersion liquid as the other one
[Żenkiewicz, 2007]. In the present work we used two sets of liquids to
fulfill this condition. These sets are water-diiodomethane and glycerol-
diiodomethane. Diiodomethane is shared in every set because of its high
dispersive property. Water is more polar than glycerol which in turn more
polar than diiodomethane. This polarity differences causes the shift in the
SFE value of the PET between the two measuring sets of liquids. The
solution of the linear equations would be affected as slightly as possible
by the errors accompanying the determination of the components d
lγ and
P
lγ [ Żenkiewicz, 2007]. The values of SFE of the measuring liquids and
its components (polar and dispersive) are shown in table (6.3)
[Żenkiewicz, 2005].

- 999 - Results and Discussion Part III
Table (6.3). The measuring liquids SFE and its components (OW model).
The change of the SFE of PET films as a function of electron beam
fluence is shown in fig (6.11) for water-diiodomethane and for glycerol-
diiodomethane. From this figure some notes could be deduced:
1. The SFE (40.25 mJ/m2) of untreated PET film is the same for both
measuring sets.
2. The SFE increases up to nearly the same value (70.95 mJ/m2 for
water-diiodomethane and 69.75 mJ/m2 for glycerol-diiodomethane)
with the increase of the electron beam fluence.
3. The electron beam effectively increases the polar component but not
the dispersive component.
4. The polar component increases due to the formation of more polar
(hydrophilic) groups on the PET film surface.
5. The dispersive component decreases due to the produced oxidation
product due to the electron beam treatment [Abdul-Kader et al.,
2009].
6. The untreated sample has polar component, this means that the PET
film is a polar polymer because it contain O bonds.
7. The large decrease in the contact angle can be attributed to the
increase of the polar component in the SFE of the modified polymer.
Liquid lγ d
lγ
P
lγ
Water 72.8 21.8 51
Glycerol 64 37 27
Formamide 58 39 19
Diiodomethane 50.8 48.5 2.3

- 998 - Chapter 6
8. The surface polarity increases which in turn enhances the wettability
and hydrophilicity of the PET film surface.
Fig (6.11). The SFE of PET film as a function of the electron beam fluence for a)
water-diiodomethane and b) glycerol-diiodomethane.
0 1 2 3 4 5 6 7
0
10
20
30
40
50
60
70
Electron beam fluence X 1019
(e/cm2)
SF
E o
f P
ET
(m
J/m
2)
Water-Diiodomethane
s
ds
ps
(a)
0 1 2 3 4 5 6 7
0
10
20
30
40
50
60
70
Glycerol-Diiodomethane
s
ds
ps
Electron beam fluence X 1019
(e/cm2)
SF
E o
f P
ET
(m
J/m
2)
(b)

- 998 - Results and Discussion Part III
According to OW model, the work of adhesion presented in eq.
(6.4) could be rewritten as [Papaconstantinou et a., 2007]:
0.5 0.5
2
d p d d p p
a a a s l s lW W W (6.10)
where, p
aW and d
aW are the polar and dispersive components of the work
of adhesion respectively. Assuming that all the dispersive forces, either of
the liquid or of the solid, are actively contributing in the wettability
performance, it is possibly to calculate the dispersive component of the
work of adhesion 0.5
2 d d d
a s lW . Then from the difference
0.5
2 p d p p
a a a s lW W W , the work of adhesion due to polar forces
could be estimated. By using the data presented in fig (6.11) and table
(6.3), the work of adhesion is calculated and summarized in table (6.4),
for the most polar liquid (water) and the most dispersive one
(diiodomethane). The work of adhesion for all other liquids will lie
between the values for water and diiodomethane, as expected in fig
(6.10).
Table (6.4). Components for work of adhesion of PET film for water (polar) and
diiodomethane (non-polar).
Electron beam
fluence X 1019
e/cm2
d
aW
p
aW aW d
aW
p
aW aW
Water Diiodomethane
0 56.2 28.7 84.9 83.8 6.1 89.9
1.3 53.7 71 124.7 80.2 15.1 95.3
4 56 72.5 128.8 83.6 15.5 99.1
6.6 54.2 87.1 141.3 80.9 18.5 99.4

- 998 - Chapter 6
As the electron beam fluence increases the surface polarity
increase, this phenomenon in turn increases the chance for more
interaction between the polar components of the liquid and the polar
components of the surface. This leads to the increase of the work of
adhesion. In table (6.4), the dispersive part of the work of adhesion is
nearly constant and the polar part increases leading to the increase of the
work of adhesion. It could be seen also that the total work of adhesion is
the same as expected in fig (6.10), this proves the validity of the results.

SUMMARY AND CONCLUSION

Summary and Conclusion
Particle accelerators and particularly electron accelerators are
developed to be used for basic research in nuclear science. They are now
used as powerful tools for applications in other branches of science as
well as in industry and medicine. Electron accelerators are used in many
applications such as polymerization of plastics, waste and flue gas
treatment and sterilization of foods and medical devices. In addition they
are used widely in hospitals for cancer diagnosis and treatment.
An indispensable part of each electron accelerator is the electron
gun in which a beam of accelerated electrons is generated. The beam
characteristics are crucial for the performance of the whole accelerator.
Therefore in the present work a Pierce-type electron gun with spherical
anode is investigated to adopt the output beam for the suggested
applications, the electron beam treatment of polymer surface in the
present work and the promising future application (plasma acceleration).
The present thesis includes six chapters. These chapters are
directed towards the production of electron beam, studying the factors
enhancing the electron beam optics and transport in the system. This is
done theoretically and experimentally. The resultant beam is applied to
poly (ethylene terephthalate) film and the induced surface modification
has been studied.
Chapter 1 introduces the basic physics of electron beam emission
types for different electron beam sources. Then a brief introduction is

- 601 - Summary and Conclusion
made to the beam quality parameters and the most common industrial
electron accelerators.
Chapter 2 deals with the factors that should be considered in
electron beam processing applications. Then some electron beam
applications are introduced such as, surface modifications of polymers,
crosslinking, degradation and polymer grafting.
Chapter 3 describes the construction of the system used in this
thesis. A full description of the system is made including the electron
gun, the vacuum system, the current and the emittance measuring devices
and the methods used for analysis of the polymer film to investigate its
surface hydrophilicity and adhesion properties.
In chapter 4, A Pierce-type electron gun with spherical anode has
been numerically computer-aided analyzed to yield an appropriate beam
with suitable properties valid for different applications. The results are:
1. By controlling the electron gun geometry, the shape (divergent,
parallel, and convergent) of the output beam can be controlled
Broad electron beam is valid for surface modification of
different materials experiments and focused electron beam is
valid for the plasma acceleration experiments.
2. The estimation of the minimum value of the axial electric field
Ez related to Er=0, enables the beam to stand against the radial
space charge effect expansion. This electric field is found to be
proportional to one thirds power of the distance from the anode
to the target (Z1/3
).

- 601 - Summary and Conclusion
3. It has been proven that the smallest beam size is achieved in
condition that the gun beam perveance is as low as possible and
the convergence slope is very high. This produces electron
beams of low emittance that is desirable in some applications.
On the other hand, high emittance electron beam could be
obtained which is favored for some other applications.
4. The design of the gun and the working conditions proposed here
helps both operators and designers of the electron guns to
choose best operating condition suitable for each application.
Chapter 5 deals with the experimental investigations done on the
Pierce electron gun. Upon investigation of the designed gun, it is found
that:
1. The accelerating voltage increases the electron beam currents up
to 250mA at accelerating voltage 75kV and decreases the beam
perveance.
2. The spherical extraction electrode (anode) is believed to
produce a convergent beam. This effect is proved by tracing the
electron beam density distribution at two different places along
the beam line.
3. The distribution of the electron beam affected by the
accelerating voltage i.e. the electron beam diameter increases
with the decrease of the accelerating voltage and vice versa.
4. The higher the accelerating voltage, the lower the beam
emittance. Electron beam emittance is preferably to be as low as
possible for the suggested plasma acceleration experiment.
While the polymer treatment experiment requires a spread out
beam with larger diameter i.e. with high emittance.

- 601 - Summary and Conclusion
5. The minimum beam radius could be found at the minimum
beam perveance and maximum convergence angle as expected
in chapter 4.
6. The electron beam fluence rate and electron fluence are
considered and calculated, these two values depend on the
accelerating voltage.
In chapter 6, the produced electron beam is used to modify PET
film surface without causing any change to the bulk properties of the film.
It has been shown that the use of electron beam upon PET is a valuable
tool to modify and control the surface properties of the materials. It could
be concluded that:
1. The electron beam range into the PET film is about 70m and
the energy deposited over the surface is distributed in a
Gaussian way and that deposited into the material is pear-
shaped diffused.
2. The possibility for the control and variation of hydrophilic and
wettability characteristics of the surface functional groups is
confirmed by the FTIR spectrum, the change in wetting with
surface energy and contact angle measurement.
3. The change of contact angle in the modified PET polymer is
due to: the formation of hydrophilic groups (its existence is
proved by FTIR analysis) on the surface and the change of
surface roughness. So that the increased wettability can be
attributed to a combined effect of, surface functionalization and
increase in surface roughness.

- 601 - Summary and Conclusion
4. The increasing of the surface energy of PET improves the
adhesion property of the surface and hence increasing its
biocompatibility.
5. Changes in the intermolecular interactions resulted in turn from
qualitative and quantitative variations in functional groups,
which occurred in the PET film surface layer due to electron
beam treatment.
It can be concluded that, by controlling the gun geometry and
regulating its operation conditions, the output electron beam geometry
can be validated for a wide range of applications. The resulting electron
beam (density and shape) could be controlled not only by the gun
geometry but also by the accelerating voltages to produce a suitable
electron beam for the target application. Finally, the interaction of the
electron beam with the PET surface changes its hydrophobic nature into
hydrophilic one i.e. it converts the surface properties from low wettability
to high wettability by decreasing the contact angle of different liquids on
the surface. The contact angle is decreased due to; the formation of
hydrophilic groups over the surface and increasing both surface
roughness and surface free energy.

REFFERENCES

- 111 -
REFERENCES
Abdelaziz M.E., Zakhary S.G. and Ragheb M.S.; Rev. Sci. Instrum. 71,
2, 2000.
Abdelrahman M.M.; Ph.D. Thesis, Institute fǜr Allgemeine Physik,
Vienna University of Technology, Vienna, 2004.
Abdelrahman M.M. and Zakhary S.G.; Brazilian J. of Physics, Vol.
39, 2, 275-279, 2009.
Abdul-Kader A.M., Madi N.K., Turos A., Jagielski J., Piątkowska A.,
Almaadeed M. and Grambole D.; Nucl. Instrum. Meth. Phys. Res. B
240, 152, 2005.
Abdul-Kader A.M., Turos A., Radwan R.M., and Kelany A.M.;
Applied Surface Science, 255, 7786-7790, 2009.
Abs M.; Radiat. Phys. Chem. Vol. 71, Issues 1-2, 287-290, 2004.
Al-Qaradawi I.Y., Madi N.K., Turos A., Abdul-Kader A.M. and
Piątkowska A.; Radiat. Phys. Chem, 76 (2), 123, 2007.
Altarelli M.; International Symposium on Utilization of Accelerators,
Săo Paulo, Brazil, 26-30 November, 2001.
Arnoult C., Sperandio C., Laachachi A., Ruch R., and Di Martino J.;
Microscopy: Science, Technology, Applications and Education, A.
Mȇndez-Villas and J. Dias (Eds), 1211-1218, 2010.
Asi A.; Proc. Charged Particle Detection, Diagnostics, and Imaging,
Delage O., Munro E. and Rouse J.A.; (Eds); SPIE Vol. 4510 P. 138-
147, 2001.
Assa’d A.M.D. and El Gomati M.M.; Scanning Microscopy Vol. 12,
No. 1, 185 – 192, 1998.
Atta A., PhD Thesis, Al-Azhar University, Faculty of Science, Cairo,
Egypt, 2011.
Auslender V.L. and Meshkov I.N.; Radiat. Phys. Chem. Vol. 35, Issues
6, 627-631, 1990.
Baird W.G.; Radiat. Phys. Chem. Vol. 9, Nos, 1-3, 225-233, 1977.
Bakish R.; "Electron Beam Technology", Wiley, New York, 1962.

- 111 -
References
Behnisch J., Hollander A. and Zimmermann H.; J. Appl. Polym. Sci.
49, 117-123, 1993.
Bennett E.W.; Radiat. Phys. Chem. Vol. 14, Nos, 3-6, 947-951, 1979.
Berejka A.J.; Electron Beam Grafting of Polymers, Advances in
Radiation Chemistry of Polymers, Proc. Of a Technical Meeting Held
at Notre Dam, Indiana, USA, 13-17 Sept, 2003, IAEA-TECDOC-1420,
p. 85-89, 2004.
Bhattacharya A., Rawlins J.W. and Ray P.; "Polymer Grafting and
Crosslinking", Wiley, New York, 2009.
Bly G.H.; "Electron Beam Processing", International Information
Associates, Yardley, PA, 1988.
Bower D.I.; "An Introduction to Polymer Physics", Cambridge
University Press, New York, 2002.
Boynton D.E.; U.S. Patent No. 4, 282, 076, 1981.
Bradley R.; "Radiation Technology Handbook", Marcel Dekker Inc.,
New York, 1984.
Burns D.T., Ding G.X., and Rogers D.W.O.; Med. Phys. 23,383–388,
1996.
Butt H., Graf K. and Kappl M.; "Physics and Chemistry of Interfaces",
Wiley, New York, 2003.
Callister, Jr. W.D.; "Fundamentals of Materials Sciences and
Engineering", Wiley, New York, 2001.
Cassie A.B.D. and Baxter S.; Trans. Faraday Soc. 40, 546, 1944.
Chao A.W.; "Reviews of Accelerator Science and Technology, Vol. 4,
Accelerators Applications in Industry and the Environment", World
Scientific Publishing Company, New Jersey, 2012.
Chao A.W.; "Reviews of Accelerator Science and Technology, Medical
Applications of Accelerators", World Scientific Publishing Company,
New Jersey, 2009.
Chau T.T., Brukard W.J., Koh P.T.L. and Nguyen A.V.; Advances on
Colloid and Interface Science Vol. 150, 2, 106-115, 2009.
Cheremisinoff N.P.; "Advanced Polymer Processing Operations", Noys
Publications, New Jersey, 1998.

- 111 -
References
Chmielewski A.G.; Radiat. Phys. Chem. Vol. 46, No. 4-6, 1057-1062,
1995.
Chmielewski A.G., Iller E. and Zimek Z.; Radiat. Phys. Chem. Vol. 46,
No. 4-6, 1063-1066, 1995.
Chmielewski A.G., Tymiński B., Iller E., Zimek Z. and radzio B.;
Radiat. Phys. Chem. Vol. 46, No. 4-6, 1067-1070, 1995.
Chmielewski A.G., Zimek Z., Bryl-Sandelewska T., Kosmal W.,
Kalisz L. and Każmierczuk M.; Radiat. Phys. Chem. Vol. 46, No. 4-
6, 1071-1074, 1995.
Chmielewski A.G., Haji-Saeid M. and Ahmed S.; Nucl. Instrum. Meth.
in Phys. Res. B 236, 44-54, 2005.
Cleland M.R., Herer A.S., Jongen Y., Abs M., Meissner J., Kerluke
D.R., Winter A.G., and Zlousic R.; AIP conference proceedings 475,
Woodbury, New York, 953-956, 1998.
Clough R. and Shalaby S. (eds.); "Irradiation of Polymers:
Fundamental and Technological Applications", ACS Books,
Washington D.C. 1996.
Cockcroft J.D. and Walton E.S.; Proc. Roy.Soc., London, A137: 229,
1932.
Dann J.R.; J. Colloid and Interface Sci. 32, 321, 1970.
Delchar T.A.; "Vacuum Physics and Techniques"; Chapman & Hall,
1993.
Deore A.V., Patil B.J., Bhoraskar V.N. and Dhole S.D.; Indian Journal
of Pure & Applied Physics, Vol 50, 482, 2012.
Ding G.X., Rogers D.W.O., and Mackie T.R.; Med. Phys. 23, 361–376,
1996.
Donelli I., Teddei P., Smet P.F., Poelman D., Nierstrasz V.A. and
Freddi G.; Biotechnology and Bioengineering, Vol. 103, August 1st,
845-856, 2009.
Drouin D., Couture A.R., Joly D., Tastet X. and Aimez V.; Scanning
Vol. 29, 92-101, 2007.
Dumitrascu M., Meltzer V., Sima E., Virgolict M., Albu M.G., Ficai
A., Moise V., Minea R., Vancea C., Scarisoreanu A. and Scarlet F.;

- 111 -
References
Digest Journal of Nanomaterials and biostructures; Vol.6, No. 4,
1793-1803, 2011.
Elmofty S.E. and Shokir E.M.; Emirates J. for Engineering Research,
8(1), 35-40, 2003.
El-Saftawy A.A., Hassan A.A., Abdelbaki M.M., Zakhary S.G. and
Awaad Z.; Arab J. Nucl. Sci. Appl., 39 (2), 189-197, 2006.
El-Saftawy A.A.; M.Sc Thesis, Faculty of Science, Zagazig University,
Zagazig, Egypt, 2007.
Extrand W.C. and Kumagi Y.; J. Colloid and Interface Science Vol.
191, 21, 378-383, 1997.
Farkas J. and Mohácsi-Farkas C.; Food Sci. Technol. 22,121-128,
2011.
Farrell S.R., Demeter L.J. and Woods P.G.; U.S. Patent No. 3, 863,
163, 1975.
Forrester A.T.; "Large Ion Beams, Fundamental of Generation and
Propagation", Wiley, New York, 1988.
Fowkes F.M.; Ind. Eng. Chem. 65, 40, 1964.
Fowkes F.M.; J. of Adhesion, 4, 155-159, 1972.
Friedel J.; Ann. Phys. No. 6, 257, 1976.
Gabassi F., Mora M. and Occhiello E.; "Polymer Surface from Physics
to Technology", Wiley, New York, 1998.
Galloway R.A., Lisanti T.F. and Cleland M.R.; Radiat. Phys. Chem.
Vol. 71, Issues 1-2, 551-553, 2004.
Gedde U.W.; "Polymer Physics", Chapman & Hall, London, 1995.
Getoff N.; Radiat. Phys. Chem. Vol. 46, No. 4-6, 1079, 1995.
Goavec P.G.; Radiat. Phys. Chem. Vol. 14, Nos, 1-2, 61-67, 1979.
Green T. S.; IEEE Trans. Nucl.Sci. 32, 918, 1976.
Guruvenket S., Mohan G.R. and Manoj K.; Applied Surface Science,
236, 278-284, 2004.
Hassan A.M.; M.Sc. Thesis, Faculty of Science, Zagazig University,
Zagazig, Egypt, 1993.

- 111 -
References
Hassan A., Elsaftawy A. and Zakhary S.G.; Nucl. Instrum. and Meth.
in Phys. Res. A 586, 148-152, 2008.
Hawkes P.W., Kasper E.; "Principles of Electron Optics", Academic
Press, London, 1989.
Hellborg R., Persson M. and Strenström K.; "Vacuum", Wiley, New
York, 2005.
Herrmann G.; J. Appl. Phys. 29 (2), 127, 1958.
Hovington P., Drouin D., and Gauvin R.; Scanning 19, 1, 1997.
Hsu S.; "Infrared Spectroscopy; Handbook of Instrumental Techniques
for analytical Chemistry", Settle F. (Editor), Prentice Hall PTR, New
Jersy, 247-283, 1997.
Humphries S. Jr.; "Principles of Charged Particle Accelerators", Wiley,
New York, 1986.
Humphries S. Jr.; "Charged Particle Beams", Wiley, New York, 1990.
Icre P., Facorat C., De Rocquigny H. and Darbord J.C.; Radiat. Phys.
Chem. Vol. 46, No. 4-6, 1099-1102, 1995.
Iiyoshi R., Maruse S. and Takematsu H.; Nucl. Instr. Meth. in Phys.
Res. A363, 284, 1995.
Inagaki N., Narushima K., Tushida N. and Miyazaki K.; J. Polym.
Sci., part B: Polym. Phys. 42, 3727, 2004.
Iqbal M. and e-Aleem F.; "Modern Trends in Physics Research", edited
by Lotfia El Nadi, IOP, 2005.
Ivanov V.S.; Radiat. Phys. Chem. Vol. 46, Nos, 4-6, 399-410, 1992.
John P.I.; "Plasma Science and the Creation of Wealth", Tata McGraw-
Hill Publishing Company Limited, New Delhi, 2005.
Kaminska A., Kaczemarek H. and Kowalonek J.; European Polymer
Journal, 38, 1915-1919, 2002.
Karzmark C.J., Nunan C.S. and Tanabe E.; "Medical Electron
Accelerators", Mc Graw Hill Inc., New York, 1993.
Khulbe K.C., Feng C.Y. and Matsuura T.; "Synthetic Polymeric
Membranes, Characterization by Atomic Force Microscopy", Springer-
Verlag, Berlin, Heidelberg, 2008.

- 111 -
References
Kwok D.Y. and Neumann A.W.; Advances on Colloid and interface Sci.
81, 167-249, 1999.
Laurell B. and Föll E.; Exhibition & conference for Radiation Curing;
Vienna/Austria, 2007.
Lawson J.D.; "The Physics of Charged-Particle Beams", 2nd
Ed.,Oxford, Claredon, 1988.
Lee S.Y.; "Accelerator Physics", World Scientific, New York, 1999.
Livingston M.S. and Blewett J.P.; "Particle Accelerators", McGraw-
Hill Inc., New York, 1962.
Loan L.D.; Radiat. Phys. Chem. Vol. 9, Nos, 1-3, 253-259, 1977.
Lyons B.J., Radiat. Phys. Chem. 45, 159, 1995.
Mahapatra S.K., Dhole S.D. and Bhorastar V.N.; Nucl. Instrum. and
Meth.in Phys. Res. A 536, 222- 225, 2005.
Makkuchi K.; in: Role of Radiation Processing in Material Science
Applications, KACST, Riyadh, Saudi Arabia, 1999.
Masood K., Iqbal M. and Zakaullah M.; Nucl. Instrum. and Meth in
Phys. Res. A 584, 9, 2008.
McCarthy T.; J. Am. Chem.Soc., 128, 9052, 2006.
McGinn J.B., Swanson L.W. and Martin N.A.; J. Vac. Sci. Technol,
B9, 2925, 1991.
McLaughlin W.L., Boyd A.W., Chadwick K.H., McDonald J.C. and
Miller A.; Dosimetry for Radiation Processing; Pub: Taylor & Francis
(Hemisphere Publishing Corporation), Basingstoke, Hampshire, UK
1989.
McLaughlin W.L. and Desrociers M.S.; Radiat. Phys. Chem. Vol. 46,
No. 4-6, 1163-1174, 1995.
Mehnert R.; in: Ulmann's Encyclopedia of industrial chemistry, Vol A22
(VEB Chemie, Weinheim, 1993.
Mehnert R.; in: Application of Particle and Laser Beams in materials
Technology, ed. P. Misaelides, NATO ASI Series E: Applied Sciences,
Vol 283, Kluwer, Dortrecht, 1995.
Mehnert R.; Nucl. Instrum. Meth. in Phys. Res. B, 113, 81, 1996.

- 111 -
References
Molins, R.; "Food irradiation – Principles and Applications", Wiley,
New York, 2001.
Molokovsky S.I. and Sushkov A.D.; "Intense Electron and Ion Beams",
Spriger-Verlag, Berlin, Heidelberg, 2005.
Nenadović T.M.; Materiali in Technologie, 39, 1-2, 2005.
N'Guyen A. and Pottier J.; U.S. Patent No. 5, 107, 221, 1992.
Nilsson B., Montelius A., and Andreo P.; Radiother. Oncol. 37, 1995.
Oehr C.; Nucl. Instrum. Meth. in phys. Res. B, 208, 40, 2003.
Ohgo T., Hara T., Hamagaki M., Ishii K. and Otsuka M.; J. Appl.
Phys.70, 4050, 1991.
Ota S.; Radiat. Phys. Chem. Vol. 18, Nos, 1-2, 81-87, 1981.
Owens D.K. and Wendt R.C.; J. Appl. Polym. Sci. 13, 1741-1747, 1969.
Pandiyaraj K.N., Selvarajan V., Deshmukh R.R. and Gao C.Y.;
Vacuum (5), 332-339, 2008.
Papaconstantinou D., Amanatides E., Mataras D., Ioannidis V. and
Nikolopoulos P.; Plasma Process. Polym, 4, 1057-1062, 2007.
Pierce J.R.; J. App. Phys. 11, 548, 1940.
Pierce J.R.; "Theory and Design of Electron Beams", Van Nostrand,
London, 1949.
Poletti G., Orsini F., Raffaele-Addamo A., Riccardi C. and Selli E.;
Applied Surface Science, 219, 311-316, 2003.
Pottier J.; Nucl. Instrum. Meth. in Phys. Res. B 40/41. 943-945, 1989.
Quintal B.S.; U.S. Patent No. 3, 702, 412, 1972.
Ragheb M.S.; M.Sc. Thesis, Faculty of Science, Alexandria University,
Alexandria, Egypt, 1983.
Ragheb M.S.; PhD. Thesis, Faculty of Science, Alexandria University,
Alexandria, Egypt, 1992.
Ragheb M.S. and Bakr M.H.S.; Radiat. Phys. Chem. 47 (5), 873, 1996.
Redhead P.A., Hobson J.B. and Kornelsen E.V.; "The Physics Basis of
Ultrahigh Vacuum", AIP, New York, 1967.

- 111 -
References
Reiser M.; "Theory & Design of Charged Particle Beams", Wiley, New
York, 1994.
Rosiak J.M. and Ulanski P.; Radiat. Phys. Chem. 55, 139, 1999.
Rotenberg Y., Borouvka L. and Neumann A.W.; J. of Colloid and
Interface Science, 93, 169-183, 1983.
Runa A.C. and Flink A.M.; Rev. Sci. Instrum. 70 (11), 4207, 1999.
Sabchevski S., Mladenov G., Titov A. and Barbarich I.; Nucl. Instrum.
Meth. in Phys. Res. A 381, 185-193, 1996.
Schulz S.W.; in: Proceeding of Electron beam 2002, International
Conference on High Power Electron Beam Technology, Vol. 1,
October 27 – 29, Hilton Head Island, SC, USA, 1-17, 2002.
Scharf W.; "Particle Accelerators and Their uses"; Harwood Academic
publishers, New York, 1986.
Sharfrin E. and Zisman W.; The Journal of Physical Chemistry, 64(5),
519-524, 1960.
Shillar S.; "Electron Beam Technology", Wiley, New York, 1982.
Silvermann J.; Radiat. Phys. Chem. Vol. 9, Nos. 1-3, 1-15, 1977.
Singh A. and Silvermann J.; "Radiation Processing Of Polymers",
Hanser, Munich, 1992.
Sommers C.H. and Fan X.; "Food Irradiation Research and
Technology", Blackwell Publishing, Ames, IA, 2006.
Sperling L.H.; "Introduction to Physical Polymer", 3rd
edition, Wiley,
New York, 2001.
Stepanik T., Rajagopal S., Ewing D. and Whitehouse R.; Radiat. Phys.
Chem. Vol. 14, Nos, 1-6, 505-509, 1998.
Subrahmanyam N.; "Atomic and Nuclear Physics", S. Chand &
Company LTD, India, 1986.
Tabata Y., Ito Y. and Tagawa S.; (eds.): "Handbook of Radiation
Chemistry", CRC Press, Boca Raton, Florida, 1991.
Tanford C.; "The Hydrophobic Effect", Wiley, New York, 1973.

- 111 -
References
Tippler P.; "Physics for Scientists and Engineers: Electricity,
Magnetism, Light, and Elementary Modern Physics" (5th ed.). W. H.
Freeman, 2004.
Trump J.G.; U.S. Patent No. 2, 785, 313, 1957.
Tsimring S.; "Electron Beams and Microwave Vacuum Electronics",
Wiley, New York, 2007.
Turos A., Abdul-Kader A.M., Grambole D., Jagielski J., Piątkowska
A., Madi N.K. and Almaadeed M.; Nucl. Instrum. Meth. in Phys.
Res. B 249, 660, 2006.
Ueno K.; Radiat. Phys. Chem. 35, 126, 1990.
Vali L.; "Atom and Ion Sources", Wiley, New York, 1977.
Van de Graaff R.J., Trump J.G. and Buchner W.W.; U.S. Patent No.
2, 460, 201, 1949.
Ward C.A. and Neumann A.W.; J. of Colloid and Interface Science, 49,
286-290, 1974.
Wei Q., Li Q., Wang X., Huang F., and Gao W.; Polymer Testing,
25(5), 717-722, 2006.
Wenzel R.; Ind. Eng. Chem. 28, 988, 1936.
Williams S.D. and Yoo H.J.; U.S. Patent No. 5, 804, 304, 1988.
Williams S.D., Yoo H.J. and Drickman M.R.; U.S. Patent No. 5, 820,
981, 1998.
Wilson R.G. and Brewer G.R.; "Ion Beams with Application to Ion
Implantation", Wiley, New York, 1973.
Winter H.P.; "Production of Multiply Charged Particles", Vol. II,
Academic Press, New York, 1967.
Wong W., Chan K., Keung K.W. and Lau K.S.; J. of Materials
Processing Technology, 132, 114-118, 2003.
Woods R.J. and Pikaev A.K.; Applied Radiation Chemistry; Radiation
Processing, Wiley, New York, 1994.
Wrobel A.M., Kryszewski M., Rakowski W., Okoniewski M and
Kubaki Z.; Polymer 19, 908, 1978.

- 111 -
References
Yadav R K and Shanker R.; J. of Physics, Vol. 68, No 3, 507-515,
2007.
Yang L., Chen J., Guo Y. and Zhang Z.; Applied Surface Science, 225,
4446-4451, 2009.
Young R.I. and Lovell P.A.; "Introduction to Polymers", 2nd
edition,
Chapman & Hall, London, 1991.
Young T.; Philos. Trans. Soc. London. 95, 65-87, 1805.
Zakhary S.G.; Rev. Sci. Instrum. 66, 12, 1995.
Żenkiewicz M.; Polimery, 50, 5, 2005.
Żenkiewicz M.; Journal of achievement in Materials and Manufacturing
Engineering, Vol. 24, 1, 137-145, 2007.
Żenkiewicz M.; Polymer Testing, 26, 14-19, 2007.
Zhigarev A.; "Electron Optics and Electron Beam Devices", Mir
Publishers, Moscow, 1975.

ملخص الرسالة
اإلألهميةنظرا معجالت وخاصة الجسيمات معجالت منفيلكترونات العديد
.يمكناألخيرةالسنواتفيالعلوموالصناعةوالطبفقدتطورهذاالعلمكثيرافياالستخدامات
اإلاستخدام معجالت كثيرةفيلكترونات البالستيكتطبيقات بلمرة النفاياتمثل ومعالجة
التخلصو وحفظاألغذيةالسامةالغازاتمن المعداتالطبية الخوتعقيم . استخدامكذلكيمكن
النوعمنالمعجالتمنتشرالسرطان،خيصومعالجةمرضشتفيلكتروناتمعجالتاإل هذا
فيالعديدمنالمستشفياتالمصرية.
رونات.كلمالإللكتنهالمصدراألساسيأبماالمعجلفيلكتروناتهوأهمجزءقاذفاإل
لمايكون.ضالمعجلككلأفكتروناتمنتظمةوجيدهكلماكانأداءلكانتعواملأداءقاذفاإل
اتجاهالنوعبيرس)مهبطزاويةميلهمعلكتروناتمنفيهذهالرسالةقمنابفحصقاذفإلذلك
5.76لكتروناتتساوىتياراإلoبيقاتلتطلللحصولعلىتيارصالحوذلككرى،ذومصعد(
المقترحة، والذياألولالتطبيق خصائصسطحيتحسوهوالرسالةهذهفيتنفيذهتم فيلمن
النوع من ا(،تريفثاالتإيثلين)بوليبوليمر والتطبيق تعجيلفيلمقترح وهو المستقبل
لكتروناتباستخداموسطمنالبالزما.اإل
موجههلدراسةالعوامستةالرسالةمكونةمن للالمؤثرةعلىكثافةوشكفصولكلها
اإل قاذف من الناتج التيار النظريةونقل المحاكاة طريق عن ذلك تم والدراسات لكترونات.
اإلوالتجارب تيار تطبيق تم كذلك الناتجالعملية. لكترونات من أفالم إيثلين)البوليعلى
وتمدراسةالتأثيراتالناتجةعلىسطحالفيلم.(تريفثاالت
األ تناولالفصل تم حيث الدراسة لتلك مقدمة يعتبر الطرقول النبعاثالمختلفة
.كذلكتمفاتاإللكتروناتالمختلفةذساستصميمقاأهيتلكالطرقالسطوح،لكتروناتمناإل
وجودة أداء عوامل تناول بعض تقديم تم وأخيرا معجالتالتيار. من المشهورة األنواع
غيرهامنمجاالتالحياة.وناعةاإللكتروناتالتيتستخدمفيالص
وادالمختلفةباستخدامالفصلالثانييتناولالعواملالتييجبمراعاتهاعندمعالجةالم
.المعجالتلتلكلكترونات.بعدذلكتماستعراضبعضالتطبيقاتالمختلفةمعجالتاإل

ص الرسالةملخ
فيالرسالة المستخدم وصفالجهاز الثالثتم قاذفةالمختلفبأجزائهفيالفصل من
وكذلكتماستعراضالطرقنبعاثيتة.قياسكثافةالتياروإلكتروناتوجهازالتفريغوجهازياإل
وذلكلتحديدالتغيراتالناتجةعلى(تريفثاالتإيثلين)البوليالمستخدمةقيفحصوتحليلفيلم
.السطح
عرفةالعواملمنالنوعبيرسوذلكلماإللكتروناتقاذفالفصلالرابعتممحاكاةفي
:كالتاليالمناسبةللحصولعلىتيارمناسبللتطبيقاتالمختلفة.وكانتالنتائج
شكلالتيارالناتجفيلكتروناتيمكنالتحكمتصميمقاذفاإلفيعنطريقالتحكم .1
مشتت،م) أو المناسبلألقطاب(،جمعمتواز التصميم اختيار عنطريق أيانه
قاذف لكتروناإيمكنتصميم أو يمكنصغيرة،تيعطىتياراتذاتأقطاركبيرة
فياستخدا تياراإلالعديدمنمها تحسينفيلكتروناتالعريضيستخدمالتطبيقات.
المواد اإلالمختلفة،خصائصأسطح وتيار يمكن المجمع فياستخدامهلكترونات
لكتروناتباستخداموسطمنالبالزما.جيلاإلعتجربةت
قوة)ناتجةعنعتأثيرشحنةالفراغنقادرةعلىمالكهربيللمجالتمتقديرأقلقيمة .2
القيمةهذهجدأنو.تشتته(فيسببتتوالتيللتيارالمكونةلكتروناتالتنافربيناإل
.للمسافةبينالمصعدوالهدفالتكعيبيتتناسبمعالجزر
لتغيرالتيارمعدشرطين:يمكنالحصولعلىتيارإلكتروناتبأقلقطرإذاتحقق .3
كونأقلمايمكنوكذلكزاويةتقاربالتيارتكونأعلىيتعجيلالجهدإلىبالنسبة
ي ما ذات تيارات ينتج بدورة هذا هنبعاثيامكن. وهيصغيره بعضفيمفضلة
يمكنالحصولعليهالكبيرةنبعاثيهاالذواإللكتروناتالتطبيقات.وفىالمقابلتيار
أخرى.تطبيقاتفيمفضلوهو
لدراسةالعواملعمليا النوعبيرسنلكتروناتمالفصلالخامستمفحصقاذفاإلفي
.وحصلناعلىالنتائجالتالية:تؤثرعلىأدائهوعلىشكلوكثافةالتيارالناتجالتي
أمبيرمللي262إلىصلتحتىاإللكتروناتتيارشدةزيدتمعزيادةجهدالتعجيل .1
ليقليكيلوفولت.وكذلكوجدأنهمعزيادةجهدالتعج6.ىعندجهدتعجيليساو
جهد.المعدلتغيرالتيارمع

ص الرسالةملخ
(عندمناطقحركتهعنطريقدراسةتوزيعكثافةالتيار)بشكلعموديعلىاتجاه .2
جمعللتيار.رىيكونمالمصعدالكرأنتأثيوجدمساره،مختلفةعلى
بمعنىأنهبزيادةجهدالتعجيليقل،التيارجيلتؤثرعلىتوزيعكثافةقيمةجهدالتع .3
.والعكسصحيحقطرالتيارالناتج
لكتروناتتجربةتعجيلاإلفيتيارااللكترونات.انبعاثيةكلمازادجهدالتعجيلقلت .4
جةلتجربةمعافيالتيارصغيرةجدابينماانبعاثيةتكونأنباستخدامالبالزمايفضل
.كبيرههيتالسطوحيفضلأنتكونانبعاث
وأعلىقيمةأقلقيمةلنصفقطرالتياروجدتعندأقلمعدللزيادةالتيارمعالجهد .6
الفصلالرابع.فينظريا.هذاالمبدأتمإثباتهلزاويةتقاربالتيار
دهتمحسابهماووجدأنهمايعتمداأيضاعلىجالجرعةتروناتومعدللكجرعةاإل .5
جهدالتعجيلنتيجةلزيادةشدةتياراإللكترونات.تزيدالجرعةمعزيادةالتعجيل.
السافي أفدسالفصل تعريضأسطح تم من تريفثاالتايثيل)البوليالم أن(ين وجد .
:االتيإلىلكتروناتلتحسينخصائصسطحالبوليمرأدىستخداماإلإ
اإل .1 مدى تساوى بطاقة المعجلة 6.لكترونات إلى وصل فولت إلكترون 2.كيلو
فيلمرميتميكرو داخل سطح(تريفثاالتإيثلين)البولى على الممتصة الطاقة وكذلك .
الهدفالبوليمرتكونموزعةعلىشكلجاوس يثبتانتوزيعكثافةالتيارعند وهذا
أوبمعنىأخر.والطاقةالممتصةداخلالبوليمرتأخذشكلالكمثرىيكونبشكلجاوس
.شكلالكمثرىنعلىكولكتروناتداخلالبوليمرياإلانتشار
طريق .2 تحليلعن الحمراء تحت األشعة FTIRطيف التحكم يمكن أنه فيوجد
hydrophilicityوwettabilityالبوليمرلسطح تم أ. عن أيضا ذلك طريقثبات
.لكتروناتالبوليمرقبلوبعدمعالجتهاباإللعيناتاالتصالدراسةطاقةالسطحوزاوية
لكتروناتناتجعن:تكونمجموعاتالبعدتعريضالعيناتلإليةاالتصزاوفيالتغير .3
للماء السطح(hydrophilic groups)محبة خشونة وزيادة السطح وتغيرعلى
.هطوبوغرافيت
االلتصاق .4 خاصية يحسن المستخدم للبوليمر السطح طاقة للسطح(adhesion)زيادة
.البيولوجييحسنتوافقهاوبالتالي

ص الرسالةملخ
6. التفيالتغيرات عنجزيئية-البينفاعالت ناتجة علية الموضوع والسائل السطح بين
والكيفيالكميالتغير للمجموعات علىالموجودة(functional groups)الوظيفية
.هلكتروناتالمعجلنتيجةمعالجةالسطحباإلوالمتكونةالسطح
الناتجعختاما، التيار وشكل فيكثافة التحكم يمكن قاذففينطريقالتحكم تصميم
التشغيللكتروناتوكذلكاإل عوامل الناتج التيار فيوذلكالستخدام هذافيتطبيقاتمختلفة.
وانتشاروتحسينخصائصااللتصاق(تريفثاالتإيثلين)البولىفيلممنالبحثتممعالجةسطح
.الخاصبهالبيولوجيوهذابدورةيحسنالتوافقالسوائلعليه

هنظيم عوامل التشغيل لجسيمات معجلت
رسالة مقدمة من
د الصفطاوىـأشرف على محم
علوم )فيزياء(الماجستير فى –بكالوريوس علوم )فيزياء(
للحصول على درجة
الفيزياء فيدكتور فلسفة
وقد تمت المناقشة العلنية والموافقة عليها
اللجنــــــــــــــــة
هالل إبراهيمأ.د. عبدالفتاح
الطاقة الذريةهيئة –البحوث النووية مركز –أستاذ الفيزياء
أ.د. أحمد محمود يوسف
طيبةأكاديمية –طيبة العالى للهندسة معهد –أستاذ الفيزياء
أ.د. أحمد الفلكى السيد
الزقازيقجامعة –العلوم كلية –أستاذ فيزياء الجوامد
1122/ 2/ 12تاريغ الموافقة

الزقازيقجامعة
كلية العلوم
قسم الفيزياء
لجسيمات معجله التشغيلتنظيم عوامل
رسالة مقدمة من
د الصفطاوىـأشرف على محم
علوم )فيزياء(الماجستير فى –بكالوريوس علوم )فيزياء(
:العلمىلجنة االشراف
أ.د. أحمد الفلكى السيد
جامعة الزقازيق( –كلية العلوم –)استاذ فيزياء الجوامد
أ.د. مجدى صفوت راغب
استاذ فيزياء المعجالت
مركز البحوث النووية
هيئة الطاقة الذرية
صفوت غالى زخارى أ.د.
المعجالت استاذ هندسة
مركز البحوث النووية
هيئة الطاقة الذرية

لجسيمات معجله التشغيلتنظيم عوامل
رسالة مقدمة من
مد الصفطاوىـأشرف على مح
علوم )فيزياء(الماجستير فى –بكالوريوس علوم )فيزياء(
للحصول على درجة
دكتور الفلسفة فى العلوم
(التجريبية)الفيزياء
قسم الفيزياء
كلية العلوم
جامعة الزقازيق
3102
Copyright © 2022 FDOKUMEN