Fecundidad parcial y frecuencia reproductiva del efectivo patagónico de merluza (Merluccius hubbsi)

RM
Ma
b
a
ARRA
KRERE
1
eSgdtvweaoofTstc
sto
((
0d
Fisheries Research 104 (2010) 64–72
Contents lists available at ScienceDirect
Fisheries Research
journa l homepage: www.e lsev ier .com/ locate / f i shres
egional variability in reproductive traits of European hakeerluccius merluccius L. populations
aria Korta a,∗, Rosario Domínguez-Petit b, Hilario Murua a, Francisco Saborido-Rey b
AZTI-Tecnalia, Herrera Kaia-Portu aldea z/g, Pasaia, Gipuzkoa 20110, SpainEduardo Cabello 6, Vigo, Pontevedra E-36208, Spain
r t i c l e i n f o
rticle history:eceived 15 December 2008eceived in revised form 19 February 2009ccepted 17 March 2009
a b s t r a c t
Multiple comparison analysis of batch fecundity (BF) and spawning fraction (SF) of European hake (Mer-luccius merluccius L.) stocks was carried out over two different regions during a 2-year-period. Femalespecimens caught by commercial fishing vessels were sampled on a monthly basis during the main
eywords:eproductive variablesuropean hake stocksegion
spawning season from January to June in the Bay of Biscay (BoB) and on the Galician Shelf (GS). Spatialand temporal studies revealed that BF and the prevalence of spawning females were significantly lowerin the BoB than on the GS. However, the data displayed the same seasonal pattern for both regions.
The results are inconclusive as to whether homogeneity between the European hake stocks in eachregion exists. The results do, however, suggest the existence of a cline between regions due to a variation
rgy dlatio
nergy allocation in the distribution of eneproductivity of both popu
. Introduction
European hake is a gadiform distributed throughout the North-ast Atlantic from Norway in the North to the Guinea Gulf in theouth, and in the Mediterranean Sea (Casey and Pereiro, 1995). Thisadiform supports significant commercial fisheries throughout itsistribution. In the European Atlantic waters, it is especially impor-ant for Spanish and French fishing fleets due to its high marketablealue. It is assumed that there are two stocks of European hakeithin its distributional area in the Atlantic; the so-called North-
rn (ICES Division IIIa, Subareas II, IV, VI and VII and Divisions VIII, b, d), and Southern stock (ICES Division VIIIc and IXa). The statusf both stocks has been described as critical in recent years due toverfishing (ICES, 2004). Therefore, a recovery plan was adoptedor the Northern stock in 2004 and for the Southern stock in 2005.he latest advice for both stocks concluded that while the Northerntock has a full reproductive capacity and is harvested sustainably,he Southern stock shows reduced reproductive capacity and itsurrent exploitation rate is unsustainable (ICES, 2008).
European hake is considered to be an indeterminate fecunditypecies (Murua et al., 1998; Murua and Motos, 2006). This meanshat through “de novo vitellogenesis”, the new pre-vitellogenicocytes are recruited to the standing yolked oocytes stock dur-
∗ Corresponding author. Tel.: +34 943 00 48 00; fax: +34 943 00 48 01.E-mail addresses: [email protected] (M. Korta), [email protected]
R. Domínguez-Petit), [email protected] (H. Murua), [email protected]. Saborido-Rey).
165-7836/$ – see front matter © 2009 Elsevier B.V. All rights reserved.oi:10.1016/j.fishres.2009.03.007
edicated to growth and reproductive investment; which may affect thens.
© 2009 Elsevier B.V. All rights reserved.
ing spawning (Hunter and Goldberg, 1980). The European hake is abatch spawner that releases the hydrated oocytes in several batchesthroughout the spawning season (Murua et al., 1998; Murua andSaborido-Rey, 2003). Hence, the potential fecundity cannot be esti-mated, but the realised population fecundity derives from theestimation of the batch fecundity (BF), the spawning fraction (SF),i.e. the proportion of spawning females per day, and the durationof the spawning season (Murua et al., 2006).
The Cap Breton Canyon in the Bay of Biscay (BoB) has beenthought to be a geographical boundary between the stocks, limit-ing exchange between the populations (ICES, 2008). Thus, the BoBdelimits the southern extent area of the Northern Stock, while theGalician Shelf (GS) defines the northern limits of the Southern stock.However, it seems that there is neither geographical nor geneticevidence to support the location of a barrier between the stocks(Mattiucci et al., 2004; Castillo et al., 2005). In fact, several previousstudies on the ecotypes of European hake species do not supportthe existence of a boundary between Northern and Southern hakestocks (Roldán et al., 1998, 1999; Lundy et al., 2000; Pineiro et al.,2007) and more conclusive studies based on biological evidence arerequired to demonstrate the separation of populations within thepresent stocks range (Lundy et al., 1999).
Inter- and intra-population variability in reproductive traits areof special importance because it affects population productivity
and, hence, the ability to sustain additional mortality. Temporaland spatial variations in fecundity and other reproductive traitsbetween years or areas have been described extensively (Kjesbu etal., 1998; Kraus et al., 2000; Nash et al., 2000; Morgan and Rideout,2008); which were postulated as being dependent on environmen-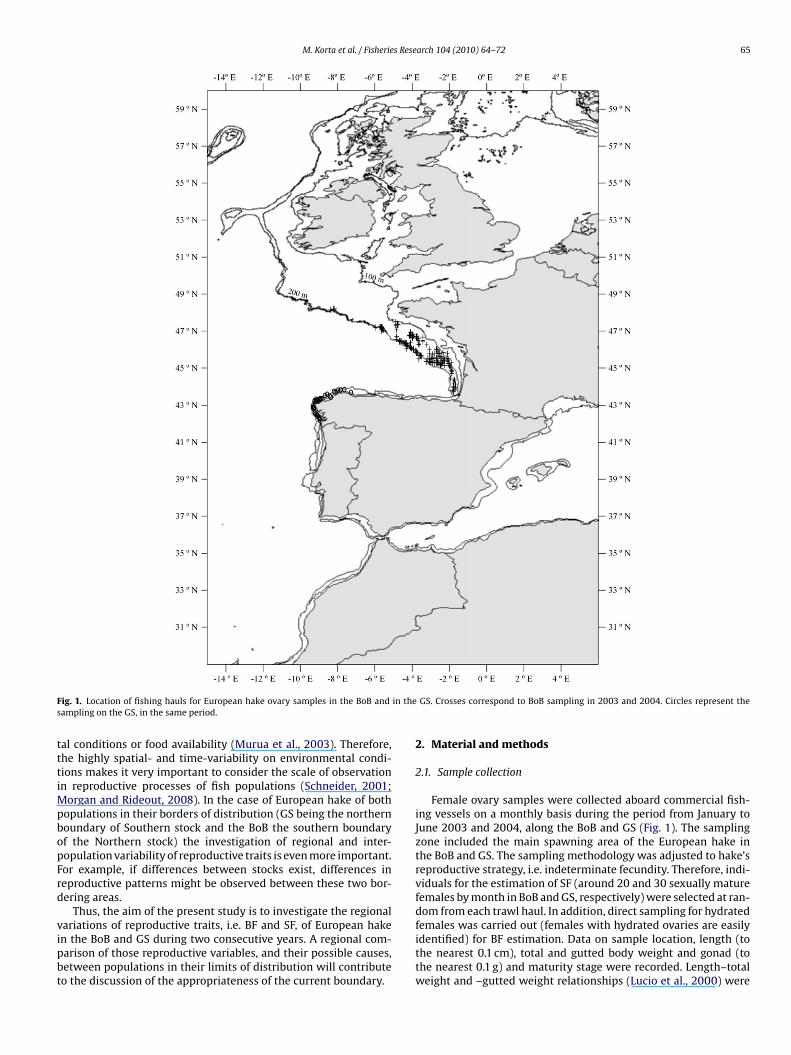
M. Korta et al. / Fisheries Research 104 (2010) 64–72 65
F in thes
tttiMpbopFrd
vipbt
ig. 1. Location of fishing hauls for European hake ovary samples in the BoB andampling on the GS, in the same period.
al conditions or food availability (Murua et al., 2003). Therefore,he highly spatial- and time-variability on environmental condi-ions makes it very important to consider the scale of observationn reproductive processes of fish populations (Schneider, 2001;
organ and Rideout, 2008). In the case of European hake of bothopulations in their borders of distribution (GS being the northernoundary of Southern stock and the BoB the southern boundaryf the Northern stock) the investigation of regional and inter-opulation variability of reproductive traits is even more important.or example, if differences between stocks exist, differences ineproductive patterns might be observed between these two bor-ering areas.
Thus, the aim of the present study is to investigate the regional
ariations of reproductive traits, i.e. BF and SF, of European haken the BoB and GS during two consecutive years. A regional com-arison of those reproductive variables, and their possible causes,etween populations in their limits of distribution will contributeo the discussion of the appropriateness of the current boundary.GS. Crosses correspond to BoB sampling in 2003 and 2004. Circles represent the
2. Material and methods
2.1. Sample collection
Female ovary samples were collected aboard commercial fish-ing vessels on a monthly basis during the period from January toJune 2003 and 2004, along the BoB and GS (Fig. 1). The samplingzone included the main spawning area of the European hake inthe BoB and GS. The sampling methodology was adjusted to hake’sreproductive strategy, i.e. indeterminate fecundity. Therefore, indi-viduals for the estimation of SF (around 20 and 30 sexually maturefemales by month in BoB and GS, respectively) were selected at ran-dom from each trawl haul. In addition, direct sampling for hydrated
females was carried out (females with hydrated ovaries are easilyidentified) for BF estimation. Data on sample location, length (tothe nearest 0.1 cm), total and gutted body weight and gonad (tothe nearest 0.1 g) and maturity stage were recorded. Length–totalweight and –gutted weight relationships (Lucio et al., 2000) were
66 M. Korta et al. / Fisheries Research 104 (2010) 64–72
Table 1European hake hydrated females sampled in the Bay of Biscay during 2003 and 2004. “na” means no available data.
Year Length class January February March April May June Total
2003 35–40 na 0 na na 1 na 140–45 na 2 1 na na na 345–50 na 13 na na 2 na 1550–55 8 16 6 na 4 na 3455–60 1 12 na 3 3 na 1960–65 4 5 1 na 3 na 1365–70 1 2 1 na 1 na 5
Total 2003 14 50 9 3 14 na 90
2004 40–45 1 0 na na na na 145–50 8 0 4 1 na 2 1550–55 2 0 9 1 1 9 2255–60 1 0 8 3 na 16 2860–65 na 0 5 4 na 10 1965–70 na 0 1 1 1 2 570–75 na 0 na na na 1 1
T
T
uw
2
iayosathwoc
2
2
o
TE
Y
2
T
2
T
T
otal 2004 12 0
otal 26 50
sed to estimate total and gutted weight for individuals where itas not possible to take the respective measurement directly.
.2. Laboratory processing and histological classification
Gonads were extracted and fixed in 4% buffered formaldehydemmediately after the sampling on board. Once in the laboratory,ll gonads were weighed (to the nearest 0.1 g) and were anal-sed following a standardised histological protocol: a cross-sectionf each ovary was dehydrated in alcohol solutions of increasingtrength and embedded after in ascending concentration of resinnd paraffin. Slices of 5 �m width were extracted from the sec-ioned historesin and paraffin blocks and, then, were stained withaematoxylin and eosin. Histological preparations of hake ovariesere read following the histological classification of ovaries based
n oocytes developmental and postovulatory follicle (POF) stagesriterion (Murua et al., 1998; Murua and Motos, 2006).
.3. Reproductive parameters
.3.1. BF estimationAs the presence of recent POFs in hydrated females indicates part
f the batch had ovulated, only ovaries with hydrated oocytes and
able 2uropean hake hydrated females sampled on the Galician Shelf during 2003 and 2004. “n
ear Length class January February
003 40–45 na na45–50 na 150–55 2 455–60 na 460–65 1 165–70 na na70–75 na na
otal 2003 3 10
004 45–50 na na50–55 4 1055–60 2 760–65 1 265–70 na 170–75 na 2
otal 2004 7 22
otal 10 32
27 10 2 40 91
36 13 16 40 181
without evidence of recent spawning were selected for the esti-mation of BF. BF is the number of hydrated oocytes spawned perbatch and relative BF (BFrel) is the number of hydrated oocytes pergram of gutted female body weight. In total, 181 and 123 hydratedovaries were captured during 6 months sampling period in BoBand in GS, respectively, in 2003/2004 period (Tables 1 and 2). BFwas estimated by the gravimetric hydrated-oocyte method (Hunterand Macewicz, 1985). Three subsamples were extracted from ante-rior, middle, and posterior thirds of the right lobe of the hydratedovary. Subsamples of approximately 0.4 g were weighed (±0.001 g)and the number of hydrated oocytes was counted in each subsam-ple using a binocular microscope. BF for each individual femalehake was then estimated as the weighted mean density of thethree subsamples multiplied by ovary mass. Hydrated oocytesare homogeneously distributed in the hake ovary (Murua et al.,2006).
2.3.2. SF estimation
The spawning stages of the hake ovary were classified histo-logically and used to estimate the proportion/fraction of spawningfemales. The spawning stages used to establish the SF on Europeanhake were characterised by hydrated and day 0 POF stage ovaries.The SF was estimated from the average prevalence of hydration and
a” means no available data.
March April May June Total
1 na na na 13 na na na 47 1 8 3 252 1 4 2 131 1 3 2 9na 1 2 2 5na na na 1 1
14 4 17 10 58
2 na 6 na 89 3 3 na 294 3 2 na 183 na na na 6na na 1 na 2na na na na 2
18 6 12 na 65
32 10 29 10 123

M. Korta et al. / Fisheries Research 104 (2010) 64–72 67
Table 3Regression coefficients derived from the linear relationship between batch fecundity and somatic variables for the Bay of Biscay and Galician Shelf.
Area n Regressions Slope SE (slope) Intercept Adjusted R-squared p-Value
Bay of Biscay 181 BF–Length 1.8027 0.2521 2.0631 0.22 <0.01BF–Total weight 0.6527 0.0848 3.1765 0.24 <0.01BF–Gutted weight 0.5794 0.0853 3.4442 0.20 <0.01BF–Ovary weight 0.8332 0.0404 3.4253 0.70 <0.01BF–Gutted GSI 0.5064 0.0658 4.6329 0.24 <0.01BF–K factor 0.0916 0.2088 5.3858 −0.00 0.66
Galician Shelf 123 BF–Length 3.0661 0.3577 −0.0996 0.37 <0.01BF–Total weight 1.1244 0.106 1.7513 0.48 <0.01BF–Gutted weight 1.0430 0.1220 2.0957 0.37 <0.01BF–Ovary weight 0.9140 0.0294 3.3027 0.89 <0.01BF–Gutted GSI 0.9994 0.0725 4.1438 0.61 <0.01
175
daSPs
y
m
e
wcit
BF–K factor 0.8
ay 0 POF stage ovaries (see Eq. (1)). The inverse of SF gives the aver-ge batch interval of the mature females (Si). Mean and variance ofF were calculated according to the Eqs. (2) and (3) developed byicquelle and Stauffer (1985), which weight each haul according toample size:
i =(number of hydrated females
+ number of day 0 POF females)/2mi
(1)
eanSF = ˙(i = 1, n)miyi
˙(i = 1, n)mi(2)
stVar(meanSF) = ˙(i = 1, n)(mi)2(yi − meanSF)
(˙(i = 1, n)(m )/n)2 · n(n − 1)(3)
i
here meanSF is the estimate of the monthly mean SF, yi is the per-entage of the average hydrated and day 0 POF ovary stage femalesn the sample of sexually mature females from the ith station, mihe number of sexually mature female sampled in the ith station,
Fig. 2. Anova comparative analysis of BF between 2003 and 2004 on BoB and GS sa
0.3269 6.9813 0.04 >0.01
n is the total number of stations and estVar(meanS) is the estimateof variance of SF.
2.4. Data analysis strategy
Firstly, BoB and GS samples were analysed separately intra- andinter-annually. Regression analysis was used to determine the rela-tionship between BF and various body descriptors such as length,total weight, gutted weight, ovary weight, gonadosomatic index(GSI; estimated as the percentage of ovary weight over femalegutted weight) and K-factor. All variables were log transformedto meet the assumption of normality. In order to analyse tem-poral variation (i.e. inter- and intra-annual) of BFrel, an ANOVAanalysis was carried out. Differences in SF were analysed by a
Pearson Chi2 test. Finally, a comparative analysis of the examinedvariables was carried out between both regions. Data from theBoB was compared to data from the GS, for each of the fecun-dity variables studied, using ANOVA, ANCOVA and Pearson Chi2 testanalyses.mples; and regional monthly comparison of BFrel in each year and each area.

68 M. Korta et al. / Fisheries Research 104 (2010) 64–72
Table 4Spawning fraction (SF) and average batch interval (Si) seasonal values for the Bay of Biscay and Galician Shelf during peak spawning in 2003 and 2004. “na” means no availabledata and SD standard deviation.
Region Year Variable January February March April May June SD
BoB
2003SF 14% 18% 8% 6% 10% naSi 7.1 5.4 13.2 17.5 9.7 naNo 20 144 83 37 90 na 44.39
2004SF 13% na 15% 8% 4% 14%Si 7.8 na 6.8 12.9 24.4 7.3No 64 na 116 60 54 217 62.14
GS
2003SF 17% 25% 19% 5% 16% 17%Si 5.8 4.0 5.3 18.8 6.2 3.0No 40 109 136 124 154 81 47.30SF 11% 22% 15% 17% 10% 8%
4.5112
3
3
3
a2avgTao1
c(1teni1
iehscpdMleF2o
TT
B
LTGOG
2004 Si 8.9No 95
. Results
.1. Reproductive parameters
.1.1. The region of BoBBF was linearly related to body descriptors (p < 0.05) (Table 3)
nd there was found to be no significant differences between years003 and 2004 (ANCOVA, p > 0.05). Therefore data were groupednd a single relationship was used to relate BF to each individualariable. The relationship which displayed the best fit was withonad weight and GSI (r2 = 0.70 and 0.25, respectively) (Table 3).he BF for females sampled in the Bay of Biscay between Januarynd June (2003 and 2004) ranged from 52 000 to 560 000 hydratedocytes for fish between 39 and 71 cm (on average BF was around70 000 hydrated oocytes per female) (Fig. 2).
A comparison of seasonal variation in BFrel showed signifi-ant differences between months when combining both years dataANOVA, n = 181, p = 0.013) (Fig. 2). The value of BFrel in January was45 hydrated oocytes g−1. This value was significantly lower thanhe value of 193 hydrated oocytes g−1 in February where the high-st level of BFrel was found. BFrel then decreased slowly throughext months reaching the lowest value of 126 hydrated oocytes g−1
n May. It increased slightly again in June to a value of43 hydrated oocytes g−1 which was close to that found in January.
There was no significant association between SF and year;n other words SF was not significantly influenced by the yearffect (Chi2 (2003–2004) = 0.6845, d.f. = 1, p = 0.408). On the otherand, the SF showed significant intra-annual variation during thepawning season in the BoB (Table 4). There was a significant asso-iation between SF and months (Chi2 (2003–2004) = 17.397, d.f. = 6,= 0.008). SF values reached a peak in winter in both years andecreased from February to their lowest levels in April 2003 anday 2004. SF then increased slightly again but to a much lower
evel. The seasonal variation trend in SF for both years is similar,xcept in May when an increasing trend was observed in 2003.emales spawned on average every 7 days from January to March003, and every 15 days from April to June of the same year. On thether hand, in 2004 females spawned every 7 days in January and
able 5he values obtained from the comparison of batch fecundity and somatic variables betwe
atch fecundity vs. Ancova p-value p-Value (slop
ength <0.01 0.004otal weight <0.01 0.001utted weight <0.01 0.002vary weight <0.01 0.116utted GSI <0.01 0.000
6.5 6.0 10.2 12.7127 96 122 38 45.68
remained at the same level up to March. Batch interval decreasedslightly to 13 days in April to decrease significantly to 25 days inMay before increasing again to 10 days on average in May and June.
3.1.2. The region of GSAs with the BoB, BF was linearly related to the body descriptors
and no significant differences were found between years in relationto the regressions (p > 0.05) thus, as in the BoB a single regressionline was used for each relationship (Table 3). BF was best fittedto gonad weight and GSI. In the same period described for the tworegions, i.e. January to June, BF range was 46 000–580 000 hydratedoocytes for female fish of 44–72 cm (mean BF was around 201 000hydrated oocytes per female) (Fig. 2).
BFrel showed also significant differences between month whencombining samples of both years (ANOVA, n = 123, p = 0.000)(Fig. 2). Monthly values on BFrel showed that highest val-ues were found during the months of February to March,with 201 and 203 hydrated oocytes g−1, respectively. BFrel thendecreased to 136 hydrated oocytes g−1 in May to increase again to179 hydrated oocytes g−1 in June, which was slightly lower that thevalue of 196 hydrated oocytes g−1 found in January, at the beginningof the spawning season.
The analysis of SF showed there was no significant associationbetween spawning fraction and years (Chi2 (2003–2004) = 0.0757,d.f. = 1, p = 0.783). But there was a significant association of SF andmonths (Chi2 (2003–2004) = 18.9653, d.f. = 6, p = 0.004). SF showeda significant peak in February of both years (Table 4). Spawningfraction increased from January to February and then decreased toApril and May. Levels of SF in 2004 remained below the levels of2003 for every month until April. After April, SF began to increaseshowing a second peak in June 2003, but decreasing until June in2004. Spawning occurred between 4 and 6 days from January toMarch 2003 and between 4 and 8 days from January to April 2004,
when a weak peak was observed (Table 4). A gradual decrease inbatch interval, reaching an average of 12 days between spawns, wasobserved in 2004. On the contrary, in 2003 a low batch interval of18 days was found in April; and then, it was increased again up toa rate of 3 days in June.en regions (n = 304).
e) p-Value (intercept) Adjusted R-squared
0.059 0.310.042 0.370.008 0.300.000 0.800.000 0.43

M. Korta et al. / Fisheries Research 104 (2010) 64–72 69
Table 6Pearson Chi2 analysis on Bay of Biscay (BoB) and Galician Shelf (GS) spawning females.
Bay of Biscay Galician Shelf
2003 Monthly 2004 Monthly
Chi2 d.f. p-Value Chi2 d.f. p-Value Chi2 d.f. p-Value Chi2 d.f. p-Value
BMonthly 9.0859 3 0.028 17.3971 6 0.008 – – – – – –
0
G––
3
oedsIwt
ncbwpalogy
w(
3
tflBiJdfJm
m
4
wwftbdBlgwt
between the regions. GSI is commonly used to quantify the repro-ductive condition in fish species; however, it is necessary to validateseveral assumptions for the application of GSI (DeVlaming et al.,1982). The use of GSI in samples of different-sized individuals will
oB 2004 0.6845 1 0.408 11.7122 5
S2003 3.5888 1 0.058 – –Monthly – – – – –
.2. Comparison between regions
Comparisons of regressions between BF and body descriptorsf both regions found that there were statistically significant differ-nces (ANCOVA, p < 0.01) (Table 5). In other words, body descriptorsisplayed a different relationship to BF in both regions, either forlope or for the intercepts, except for the case of the ovary weight.n the latter, the slope of the relationship between BF and ovary
eight was not statistically different (ANCOVA, p = 0.116) althoughhe intercept was significantly different (ANCOVA, p < 0.01).
Within each region, it was previously found that there wereo significant differences in BFrel between years and, therefore, toompare the BFrel between both areas the data for each region inoth years were pooled. As such, the BFrel between the BoB and GSas found to be statistically significant different (ANOVA, n = 304,= 0.014). Sampled fish of 60 cm in the BoB spawned on averageround 133 hydrated oocytes g−1 in the 2-year-period. The sameength adult on the GS contained around 218 hydrated oocytes g−1
n average. Hence, mean number of realised hydrated oocytes perutted weight fish batch is lower in the BoB than on the GS in eachear.
SF displayed a significant relationship to region. That is, SFas not independent of each of the regions in each year (Chi2
2003–2004) = 8.613, d.f. = 1, p = 0.003) (Table 6).
.2.1. Intra-annual variabilityWhen comparing the seasonal variation of BFrel, it was observed
hat the same monthly trend was followed in both regions (Multi-actor ANOVA; p = 0.786) (Fig. 2); however, monthly values wereower in the BoB than on the GS. For example, the average value ofFrel in January for the GS was 196 hydrated oocytes g−1 whereas
t was 146 hydrated oocytes g−1 for the BoB. BFrel increased fromanuary to February/March in the BoB as well as the GS. It thenecreased to values of 126 and 136 hydrated oocytes g−1 in May
or the BoB and GS, respectively, and increased again slightly inune remaining below BFrel average values for the peak spawning
onths.SF was not associated with the regions when compared on a
onthly basis (Chi2 test, d.f. = 1, p > 0.05 for every month analysed).
. Discussion
The factor that best explained the batch fecundity variationas gonad weight. Batch fecundity was positively related to gonadeight in both areas, and it explained 70 and 90% of the variability
or the BoB and GS, respectively. Thus, and contrary to observa-ions in other species (Jons and Miranda, 1997) gonad weight cane considered an appropriate index to quantify reproductive con-ition in European hake. The relationships between the variation in
F and length/weight were also positive; however, they explainedittle of the variability in BF in either region. This could be due toonad weight being highly variable amongst the same length/totaleight/gutted weight classes; which will be surely dependent on
he season in which the fish is captured, i.e. individual at different
.039 3.6338 1 0.057 – – –
0.0757 1 0.783 16.4026 6 0.01211.3930 6 0.077 18.9653 6 0.004
stages in the sequence of egg batch production. As the spawningseason progresses the BF, and thus ovary weight, diminishes (Muruaet al., 2006); therefore, the gonad weight may greatly vary for a fishwith the same length/gutted weight depending on the capture dateduring the spawning season, i.e. at the beginning or at the end.
On the other hand, one would expect a stronger relationshipbetween BF and GSI, as the GSI is considered an index for the gonadcondition and fecundity. In this case, it only explained 25 and 60%in the BoB and on the GS, respectively. Apart from the fact that somegutted weight was estimated and not directly measured in the BoBsamples, the regional differences encountered in the relationshipbetween BF and GSI, with lower values in the relationship betweenbatch fecundity and GSI in the BoB, could be due to the energyresources utilized for reproduction when the individuals start mat-uration. Specifically, GSI was positively correlated to length in bothregions, however smaller mature females produced larger ovariesproportional to body weight in the BoB than on the GS (Fig. 3). Thiscould be due to a differential size at maturity between the BoB andthe GS (Domínguez-Petit et al., 2008) and/or variability in energyallocation between growth and maturation (Kennedy, 2006) dur-ing mature life of individuals for the BoB and the GS. The variabilityof the ovary weight was distributed through a broad length-rangethat included those with smaller lengths in the BoB. Thus, BF wasnot as highly correlated with GSI as with ovary weight due to dif-ferences in sampled fish sizes. As a result, there were significantdifferences in ovarian weight distribution in relation to fish size
Fig. 3. The relationship between gutted female weight and ovary weight of Euro-pean hake in the BoB and on the GS. The crosses and points in the graph indicateindividual values of ovary weight by gutted weight in BoB and GS, respectively. Solidand dashed regression lines represent the relationship between ovary weight andlength variables in BoB and GS, respectively.

7 s Rese
bt(hgnmcw
tislataeieBotTfswofucsacat
fBvMWssoa1(BrscstoR
sta12piwf
0 M. Korta et al. / Fisherie
ias the estimation of reproductive condition and it is suggested inhese cases to use a more general model, the relative gonadal indexRGI) (Erickson et al., 1985; Somarakis et al., 2004). For Europeanake, ovary weight was significantly related to body size for eachonadal development stage. Moreover, the slopes for all stages didot differ significantly from unity and, thus, ovarian growth is iso-etric (unpublished data) allowing the use of GSI as a reproductive
ondition index (although in the case of the BoB the relationshipith BF is low).
Similarly, the relationship between BF and other body descrip-ors between both regions showed statistical differences and, thus,t seems that those differences may affect the productivity of thispecies in both regions. On average, a European hake of 60 cm lengthaid 170 000 and 280 000 hydrated oocytes in each batch in the BoBnd GS, respectively. The level of batch fecundity, in this study forhe BoB when compared to previous studies on fecundity in therea, revealed that hake females in 2003 and 2004 released lessggs than in 1994 (220 000 hydrated oocytes on average) and sim-lar to 1996–1998 (186 000 hydrated oocytes per batch) (Muruat al., 1998, 2006). Similarly, there were statistical differences inFrel between the BoB and the GS. In general, the average numberf oocytes per gutted body weight was lower in the BoB than onhe GS but no annual differences within each region were found.he average values of BFrel were 160 and 180 hydrated oocytes g−1
or the BoB and the GS, respectively. These results underlined theignificant regional variation on fecundity between both areas;hich may be affected by differences in environment conditions
f both regions. Velasco and Olaso (1998) reported that this specieseeds intensely in preparation of spawning, exactly when a seasonalpwelling system of a strong intensity occurs in the north-westernoast of Spanish shelf (Fraga, 1981; Prego and Varela, 1998). Theame event flows along the north coast (Botas et al., 1990; Borja etl., 1996) but weaker due to changes in the stratification of the waterolumn, which causes a lower level of productivity that modify thevailability of food (Valdes et al., 2007) and, hence, may contributeo the differences in BF between regions.
Significant intra-annual variation in BFrel per month was foundor both the BoB and the GS in both years. Seasonal variation inFrel followed the same basic trend in both regions but monthlyalues were higher on the GS. BFrel increased from January toarch and then decreased again to May in both the BoB and GS.hen comparing years, both regions in 2003 displayed a second
maller peak in BFrel in April after the main peak in January; thismaller peak was reproduced in March 2004 in both regions. Previ-us studies on the monthly variation of BFrel in the BoB have shownsimilar patter and values; during the same sampling period,
65 and 170 hydrated oocytes g−1 in 1995 and 1997, respectivelyMurua et al., 1998, 2006). These differences between BoB and GSFrel values are a result of large differences obtained between theegions in the 2004. These differences could be related to the GSIince it decreased slightly in the BoB and increased during theorresponding time period on the GS for 2004. Evidence of sea-onal and annual variation in BF underlines the important effecthese temporal changes may have on egg production and, hence,n the stock–recruitment relationship (Beverton and Holt, 1975;othschild, 1986; Kraus et al., 2000; Kjesbu et al., 1998).
Individual fecundity may be influenced on different levels byeveral factors. These include previous spawning events duringhe protracted spawning season (Hunter and Leong, 1981; Plaza etl., 2002), allocation of energy to growth and reproduction (Ware,980; Milton et al., 1994; Somarakis et al., 2006; Kennedy et al.,
007), atresia at the end of the breeding season (Saidapur, 1978) andopulation density (Bagenal, 1973; Kim et al., 2006). Other possiblymportant factors determining variation in fecundity are length andeight (Yamada et al., 1998; Wright, 2007) which may mask other
actors like environmental changes, i.e. food availability (Horwood
arch 104 (2010) 64–72
et al., 1989). Better feeding conditions may allow the fish to havehigher fecundity; i.e. excess surplus production was found in plaicepopulations as a result of beneficial feeding conditions (Kennedyet al., 2007; Nash et al., 2000), and this, could be the case for GShake when compared to BoB hake. Moreover, it seems that indi-viduals in the BoB allocated more energy to maturation at a lowerlength. It could be that young mature females in the BoB enter thespawning season in better condition than on the GS which, in turn,affects then to affront the future reproduction cost and get reducedreproduction capacity at larger sizes. This may in part explain thedifference in BF between the BoB and GS.
For the estimation of spawning fraction, some authors use day1 POF stage ovaries assuming duration of between 24 and 48 hfrom spawning for this stage (Macchi et al., 2004; Goldberg et al.,1984; Alheit et al., 1984; Murua and Motos, 2006). This criterion isapplied to avoid possible oversampling of hydrated females as theyare more vulnerable to fishing nets during spawning (Pájaro andMacchi, 2001). Furthermore, it is reported that the proportion ofPOFs changes with female length and age in some species (Shaefer,1998); however, day 1 POF stage ovaries did not show a strongrelationship with either for Argentine hake (Macchi et al., 2004).For the case of European hake, it was impossible to confirm thatrelationship; however, frequency distribution of spawning stages(hydration and POFs) during the season revealed significant vari-ability among stages. In this study, imminent (hydration stage) andrecent spawning ovary stages (day 0 POF) were chosen because theyappear within the first 24 h prior to spawning. For a comparativestudy involving different scientists in the histological reading, theywere considered the stages that could be most accurately identified.In the present application, the proportion of females spawning perday was estimated from the mean incidence of hydration and day0 POF ovary stages (Picquelle and Stauffer, 1985). Analysis done onthe hake spawning stages in this study demonstrated that therewas no significant regional influence on female spawners’ activ-ity or spawning fraction. That is, belonging to one or other regiondid not influence the proportion of spawning females. However, SFseemed to be higher in GS than BoB. Spawning activity could bemore closely related to a population’s biological requirements andthe physiological regulation to environmental conditions at a givenmoment.
It can be concluded that during the main spawning season ofthis species which has a defined spawning peak between Januaryand March/April in the Bay of Biscay (Lucio et al., 2000; Alvarezet al., 2004; Murua et al., 2006) and January and March in theGalician Shelf (Domínguez-Petit, 2007), there were differences inreproductive potential between the BoB and GS hake populations.BF on the GS remained at higher level than in the BoB. Environ-mental factors and the fishes physiological response to them, couldaffect fecundity in each of the regions. Spawners’ activity throughthe season seemed higher on the GS than in the BoB. This againcould be related to the difference in ovarian growth rates. The possi-ble origin of geographical variability in fecundity of European hakespecies may stem from GS individuals starting the spawning sea-son with greater body weight, than BoB individuals for small sizeclasses. BoB hake utilise energy for ovary development rather thanbody growth earlier in their development. In addition, GS indi-viduals had higher ovary weight relative to gutted weight thanBoB individuals. This occurred in both hydrated and non-hydratedsamples.
Finally, it can not be ruled out that the variability in fecundityand SF between European hake populations in each studied area
is due to the presence of two different stocks, however, the dif-ferences can also be attributed to different growth rates, differentenergy distributions in maturity stages and the differential evo-lution of this variables through the life-history of individuals indifferent regions due to possible phenotypic plasticity of the species
s Rese
(bta
A
EDecawdf
R
A
A
B
B
B
B
C
C
D
D
D
E
F
G
H
H
H
H
H
I
I
J
K
M. Korta et al. / Fisherie
Wright, 2007). Regional difference in reproductive estimates maye linked to adjustments in the biological rhythms of each popula-ion (Hunter and Lo, 1997), a consequence of different habitats thatct as an ecocline.
cknowledgements
The study has been carried out with financial support from theuropean Commission (QLRT-2001-01825 “RASER”), and from theepartment of Agriculture and Fisheries of the Basque Country gov-rnment. We thank our colleagues at AZTI Tecnalia and IIM whoollaborated in the biological sampling and sample analysis, as wells to the owners, skippers, and crew of the fishing vessels fromhich the samples were obtained. Thanks are also extended to Paul
e Bruyn for editing the English. This paper is contribution no. (459)rom AZTI-Tecnalia (Marine Research).
eferences
lheit, J., Alarcón, V.H., Macewicz, B.J., 1984. Spawning frequency and sex ratioin Peruvian anchovy, Engraulis rigens. Calif. Coop. Ocean. Fish. Invest. Rep. 25,43–52.
lvarez, P., Fives, J., Motos, L., Santos, M., 2004. Distribution and abundance of Euro-pean hake Merluccius merluccius (L.), eggs and larvae in the North East Atlanticwaters in 1995 and 1998 in relation to hydrographic conditions. J. Plank. Res. 26,811–826.
agenal, T.B., 1973. Fish fecundity and its relations with the stock and recruitment.Rapp. P.-V. Reun. Cons. Perm. Int. Explor. Mer. 164, 186–198.
everton, R.J.H., Holt, S.J., 1975. On the Dynamics of Exploited Fish Populations, Fish-ery Investigations, Ser. 2, vol. 19. Ministry of Agriculture, Food and Fisheries,London, 533 pp.
orja, A., Uriarte, A., Valencia, V., Motos, L., Uriarte, A., 1996. Relationships betweenanchova (Engraulis encrassicolus L.) recruitment and the environment in the Bayof Biscay. Sci. Mar. 60, 179–192.
otas, J.A., Fernández, E., Bode, A., Anadón, R., 1990. A persistent upwelling offthe central Cantabrian Coast (Bay of Biscay). Estuar. Coast. Shelf Sci. 30, 185–199.
asey, J., Pereiro, J., 1995. European hake (M. merluccius) in the North-east Atlantic.In: Alheit, J., Pitcher, T.J. (Eds.), Hake: Fisheries, Ecology and Markets. Fish andFisheries Ser. 15. Chapman and Hall, London, pp. 125–147.
astillo, A., Alvarez, P., Garcia-Vazquez, E., 2005. Population structure of Merlucciusmerluccius along the Iberian Peninsula coast. Mar. Sci. 62, 1699–1704.
eVlaming, V., Grossman, G., Chapman, F., 1982. On the use of the gonadosomaticindex. Comp. Biochem. Physiol. 73A, 31–39.
omínguez-Petit, R., 2007. Study of Reproductive Potential of Merluccius merlucciusin the Galician Shelf. Doctoral Thesis. University of Vigo (Spain). 253 pp.+ xxii.
omínguez-Petit, R., Korta, M., Saborido-Rey, F., Murua, H., Sainza, M., Pineiro, C.,2008. Changes in size at maturity of European hake Atlantic populations inrelation with stock structure and environmental regimes. J. Mar. Syst. 71, 260–278.
rickson, D.L., Hightower, J.E., Grossman, G.D., 1985. Comp. Biochem. Physiol. 81A,117–120.
raga, F., 1981. Upwelling off the Galician Coast, Northwest Spain. In: Richards,F.A. (Ed.), Coastal Upwelling. American Geophysical Union, Washington, DC, pp.176–182.
oldberg, S., Alarcon, V., Alheit, J., 1984. Postovulatory follicle histology of the Pacificsardine, Sardinops sagax, from Peru. Fish. Bull. 82, 443–445.
orwood, J.W., Greer Walker, M., Witthames, P., 1989. The effect of feeding lev-els on the fecundity of plaice (Pleuronectes platessa). J. Mar. Biol. Assoc. UK 69,81–92.
unter, J.R., Goldberg, S., 1980. Spawning incidence and batch fecundity in northernanchovy, Engraulis mordax. Fish. Bull. 77, 641–652.
unter, J., Leong, R., 1981. The spawning energetics of female northern anchovy,Engraulis mordax. Fish. Bull. 79, 215–230.
unter, J.R., Macewicz, B., 1985. Measurement of spawning frequency in multiplespawning fishes. In: Lasker, R. (Ed.), An Egg Production Method for Estimat-ing Spawning Biomass of Pelagic Fish: Application to the Northern Anchovy,Engraulis mordax, vol. 36. NOAA Tech. Rep. NMFS, pp. 79–94.
unter, J.R., Lo, N.C.H., 1997. The daily egg production method of biomass estimation:some problems and potential improvements. Ozeanografika 2, 41–69.
CES, 2004. Report of the Working Group on the Assessment of Southern Shelf Stocksof Hake, Monk and Megrim (WGHMM). ICES Advisory Committee on FisheryManagement. ICES CM 2005/ACFM: 2.
CES, 2008. Report of the Working Group on the Assessment of Southern Shelf Stocks
of Hake, Monk, and Megrim. ICES CM 2008/ACOM: 07.ons, G., Miranda, L., 1997. Ovarian weight as an index of fecundity, maturity, andspawning periodicity. J. Fish. Biol. 50, 150.
ennedy, J., 2006. Maternal effects and fecundity in plaice (Pleuronectes platessa) inthe Irish Sea. Ph.D. thesis, Department of Biological Sciences, The University ofLiverpool, Liverpool, UK.
arch 104 (2010) 64–72 71
Kennedy, J., Witthames, P.R., Nash, R., 2007. The concept of fecundity regulation inplaice (Pleuronectess platessa) tested on three Irish Sea spawning populations.Can. J. Fish. Aquat. Sci. 64, 587–601.
Kim, J., Kim, S., Choi, Y., Lee, J., 2006. Evidence of density-dependent effects on pop-ulation variation of Japanese sardine (Sardinops melanosticta) off Korea. Fish.Oceanogr. 15, 345–349.
Kjesbu, O.S., Witthames, P.R., Solemdal, P., Greer Walker, M., 1998. Temporal vari-ations in the fecundity of Arco-Norwegian cod (Gadus morhua) in response tonatural changes in food and temperature. J. Sea Res. 40, 303–321.
Kraus, G., Múller, A., Trella, K., Köster, F., 2000. Fecundity of Baltic cod, temporal andspatial variation. J. Fish Biol. 56, 1327–1341.
Lucio, P., Murua, H., Sarturtun, M., 2000. Growth and reproduction of the hake(Merluccius merluccius) in the Bay of Biscay during the period 1996–1997.Ozeanografika 3, 325–354.
Lundy, C.J., Rico, C., Hewitt, G.M., 2000. Temporal and spatial genetic variation inspawning grounds of European hake (Merlucius merluccius) in the Bay of Biscay.Mol. Ecol. 9, 2067–2079.
Lundy, C.J., Moran, P., Rico, C., Milner, R.S., Hewitt, G.M., 1999. Macrogeographicalpopulation differentiation in oceanic environments: a case study of Euro-pean hake (Merluccius merluccius), a commercially important fish. Mol. Ecol. 8,1889–1898.
Macchi, G.J., Pájaro, M., Ehrlich, M., 2004. Seasonal egg production pattern of thePatagonian stock of Argentine hake (Merluccius hubbsi). Fish. Res. 67, 25–38.
Mattiucci, S., Abaunza, P., rmadori, L., Nascetti, G., 2004. Genetic identification ofAnisakis larvae in European hake from Atlantic and Mediterranean waters forstock recongnition. J. Fish Biol. 65, 495–510.
Milton, D.A., Blazer, S.J.M., Rawlinson, N.J.F., 1994. Reproductive biology and egg pro-duction of three species of Clupeidae from Kiribati, tropical central Pacific. Fish.Bull. 92, 102–121.
Morgan, M., Rideout, R., 2008. The impact of intrapopulation variability in reproduc-tive traits on population reproductive potential of Grand Bank American plaice(Hippoglossoides platessoides) and yellowtail flounder (Limanda ferruginea). J. SeaRes. 59, 179–186.
Murua, H., Saborido-Rey, F., 2003. Female reproduction strategies of marine fishspecies of the North Atlantic. J. Northw. Atl. Fish. Sci. 33, 23–31.
Murua, H., Motos, L., 2006. Reproductive strategy and Spawning activity of theEuropean Hake Merluccius merluccius (L.) in the Bay of Biscay. J. Fish Biol. 69,1288–1303.
Murua, H., Motos, L., Lucio, P., 1998. Reproductive modality and batch fecundity ofthe European hake (Merluccius merluccius L.) in the Bay of Biscay. Calif. Coop.Ocean. Fish. Invest. Rep. 39, 196–203.
Murua, H., Lucio, P., Santurtún, M., Motos, L., 2006. Seasonal variation in egg pro-duction and batch fecundity of European hake Merluccius merluccius (L.) in Bayof Biscay. J. Fish Biol. 69, 1304–1316.
Murua, H., Kraus, G., Saborido-Rey, F., Witthames, P.R., Thorsen, A., Junquera, S., 2003.Procedures to estimate fecundity of European Hake Merluccius merluccius (L.) inthe Bay of Biscay. J. Northw. Atl. Fish. Sci. 33, 33–54.
Nash, R.D.M., Witthames, P.R., Pawson, M., Alesworth, E., 2000. Regional variability inthe dynamics of reproduction and growth of Irish sea plaice, Pleuronectes platessaL. J. Sea Res. 44, 55–64.
Pájaro, M., Macchi, G.J., 2001. Distribución espacial y estimación de la talla de primeramaduración del stock patagónico de merluza (Merluccius hubbsi) en el períodode puesta Diciembre-abril 2000–2001. Tech. Rep. INIDEP (Argentina) 100/01, 14pp.
Picquelle, S., Stauffer, G., 1985. Parameter estimation for egg production method ofanchovy biomass assessment. In: Lasker, R. (Ed.), An Egg Production Methodfor Estimating Spawning biomass of Pelagic Fish: Application to the NorthernAnchovy, Engraulis mordax. U.S. Dep. Comm., NOAA Tech. Rep. vol. 36, pp. 55–58.
Pineiro, C., Rey, J., de Pontual, H., Goni, R., 2007. Tag and recapture of Europeanhake (Merluccius merluccius L.) off the Northwest Iberian Peninsula: first resultssupport fast growth hypothesis. Fish. Res. 88, 150–154.
Plaza, G., Claramunt, G., Herrera, G., 2002. An intra-annual analysis of intermediatefecundity, BF and oocyte size of ripening ovaries of Pacific sardine Sardinops sagaxin northern Chile. Fish. Sci. 68, 95–103.
Prego, R., Varela, M., 1998. Hydrography of the Artabro Gulf in summer: westerncoastal limit of Cantabrian seawater and wind-induced upwelling at Prior Cape.Oceanol. Acta 21, 145–155.
Roldán, M.I., García-Marín, J.L., Utter, F.M., Pla, C., 1998. Population genetic structureof European hake, Meluccius merluccius. Heredity 81, 327–334.
Roldán, M.I., García-Marín, J.L., Utter, F.M., Pla, C., 1999. Genetic relationship amongMeluccius merluccius species. Heredity 83, 79–86.
Rothschild, B.J., 1986. Dynamics of Marine Fish populations. Harvard UniversityPress, Cambridge, MA.
Saidapur, S.K., 1978. Follicular atresia in the ovaries of nonmammalian vertebrates.Int. Rev. Cytol. 54, 225–244.
Schneider, D.C., 2001. The rise of the concept of scale in ecology. Bioscience 51,545–553.
Shaefer, K.M., 1998. Reproductive biology of yellowfin tuna (Thunnus albacares) inthe Easter Pacific Ocean. Inter-Am. Trop. Tuna Comm. Bull. 21, 205–272.
Somarakis, S., Ganias, K., Tserpe, G., Koutsikopoulos, C., 2004. Ovarian allometry andthe use of the gnosomatic index: a case study in the Mediterranean sardine,Sardine pilchardus. Mar. Biol. 146, 181–189.
Somarakis, S., Ganias, K., Siapatis, A., Koutsikopoulos, C., Machias, A., Papaconstanti-nou, C., 2006. Spawning habitat and daily egg production of sardine (Sardinapilchardus) in the eastern Mediterranean. Fish. Ocean. 15, 281–292.

7 s Rese
V
V
2 M. Korta et al. / Fisherie
aldes, L., López-Urrutia, A., Cabal, J., Álvarez-Ossorio, M., Bode, A., Miranda, A.,
Cabanas, M., Huskin, I., Anadón, R., Álvarez-Marqués, F., Llope, M., Rodríguez,N., 2007. A decade of sampling in the Bay of Biscay: what are the zooplanktontime series telling us? Progr. Ocean. 74, 98–114.elasco, F., Olaso, I., 1998. European hake Merluccius merluccius (L. 1758) feeding inthe Cantabrian Sea: seasonal, bathymetric and length variations. Fish. Res. 38,33–44.
arch 104 (2010) 64–72
Ware, D.M., 1980. Bioenergetics of stock and recruitment. Can. J. Fish. Aquat. Sci. 46,
1776–1784.Wright, P.J., 2007. Understanding the maturation process for field investigations offisheries-induced evolution. Mar. Ecol. Prog. Ser. 335, 279–283.
Yamada, T., Aoki, I., Mitani, I., 1998. Spawning time, spawning frequency and fecun-dity of Japanese chub mackerel, Scomber japonicus in the waters around the IzuIslands. Jpn. Fish. Res. 38, 83–89.
Copyright © 2022 FDOKUMEN