REGIONAL ENERGY SECURITY - Centro de Documentación ...
310
REGIONAL ENERGY SECURITY: RE-EVALUATING CONCEPTS AND POLICIES TO PROMOTE ENERGY INTEGRATION IN MERCOSUR Thauan dos Santos Tese de Doutorado apresentada ao Programa de Pós- graduação em Planejamento Energético, COPPE, da Universidade Federal do Rio de Janeiro, como parte dos requisitos necessários à obtenção do título de Doutor em Planejamento Energético. Orientadores: Amaro Olímpio Pereira Júnior Emilio Lèbre La Rovere Rio de Janeiro Fevereiro de 2018
-
Upload
khangminh22 -
Category
Documents
-
view
2 -
download
0
Transcript of REGIONAL ENERGY SECURITY - Centro de Documentación ...
i
REGIONAL ENERGY SECURITY: RE-EVALUATING CONCEPTS AND
POLICIES TO PROMOTE ENERGY INTEGRATION IN MERCOSUR
Thauan dos Santos
Tese de Doutorado apresentada ao Programa de Pós-
graduação em Planejamento Energético, COPPE, da
Universidade Federal do Rio de Janeiro, como parte dos
requisitos necessários à obtenção do título de Doutor em
Planejamento Energético.
Orientadores: Amaro Olímpio Pereira Júnior
Emilio Lèbre La Rovere
Rio de Janeiro
Fevereiro de 2018

ii

iii
Santos, Thauan dos
Regional Energy Security: Re-evaluating concepts and
policies to promote energy integration in Mercosur/Thauan
dos Santos. – Rio de Janeiro: UFRJ/COPPE, 2018.
XXIV, 286 p.: il.; 29,7 cm.
Orientador: Amaro Olimpío Pereira Júnior
Emilio Lèbre La Rovere
Tese (doutorado) – UFRJ/ COPPE/ Programa de
Planejamento Energético, 2018.
Referências Bibliográficas: p. 236-286.
1. Energy security. 2. Energy integration. 3. Energy
planning. I. Pereira Júnior, Amaro Olímpio et al. II.
Universidade Federal do Rio de Janeiro, COPPE, Programa de
Planejamento Energético. III. Título.

iv
‘Nuestro norte es el sur’
Joaquín Torres García

v
ACKNOWLEDGMENTS
This thesis is the result of the support of a number of people and institutions. I hope to
live up to each one of them right now.
First of all, I thank my family for their unconditional support for my choices and
decisions. To my parents, Simone and Wilson, for all the affection and opportunities. To
my brothers, Luan Santos and João Pedro, for always being with me and being my
‘partners in crime’. In particular to Luan, who accompanies me since our mother’s belly
and has been part of the most delicate moments of my life. To Júnior Diniz, my life
companion, for all support, understanding and companionship. To my grandmother,
uncles and other relatives for always being there for me. Thank you too, Toninha and
Carlin, for all prayers. Thank you all very much for everything, especially for
understanding my absence (sometimes completely) in the last months. Love you! Muito
obrigado!
I thank my friends, especially those who have been with me in recent years. I especially
emphasize Cassia Oliveira, who has always been present even from afar (danke schön!).
Thank you, Larissa Silva and Esperanza González, for the company in the first years of
our doctorate and for the friendship that went beyond COPPE/UFRJ classrooms. Thank
you, Bárbara Ramalho, Cadu Ramalho, Kalif Fatal, Bia Pereira, Ana Paula Rodriguez,
Pablo Fontes and Mariana Padilha for the relaxing moments and support. Thank you very
much, Gustavo Moura, for all your support and patience when assisting me with the
energy modeling.
To my South American friends and colleagues for helping me especially with detailed
information on their countries. ¡Muchas gracias!, Daniela Varela (Argentina), Fabiola
Rodrigues (Argentina), Diego Campoy (Argentina), Alberto Tomelin (Argentina),
Ignacio Lara (Argentina), Paola Dorado (Bolivia), Yanna Clara (Brazil), Igor Fuser
(Brazil), Felipe Botelho Tavares (Brazil), Fernando Simões Cardozo (Brazil), Renato
Queiroz (Brazil), Edmar Almeida (Brazil), Marcel Biato (Brazil), João Genésio (Brazil),
Rafael Soria (Ecuador), Victorio Oxilia (Paraguay), Ricardo Canese (Paraguay), Sara
Garay (Paraguay), Daniel F. Cabrera (Peru), Eveline Vásquez (Peru), Mauro Chavez
Rodriguez (Peru), Marisa León (Uruguay), Diego Campoy (Uruguay), William Clavijo

vi
Vitto (Venezuela), Ignacio Fernandez (Venezuela), Johana Salazar (Venezuela), Igor
Hernandez (Venezuela) and Ana Guerra (Venezuela). Thanks to you too, Christine Folch
(USA).
From my advisers, Amaro Olímpio Pereira Júnior and Emilio Lèbre La Rovere, I
appreciate all support and opportunities during my four years at COPPE. I am especially
grateful for the understanding and patience during the last months of the doctorate, a time
of great pressure and short deadlines for the three of us. I will forever be grateful to you
for this.
To the members of the doctoral defense committee, Andrea R. Hoffmann, André F. P.
Lucena, Helder Queiroz Pinto Júnior and Nivalde J. de Castro, thanks for accepting my
invitation and for contributing with commentaries that enriched this thesis. Thank you
also, Luiz F. Legey and Ricardo Cunha da Costa, for the precious reflections on the
qualification of my PhD project.
To the Institute of International Relations of the Pontifical Catholic University of Rio de
Janeiro (IRI/PUC-Rio) and the Department of Defense and International Strategic
Management of the Federal University of Rio de Janeiro (DGEI/UFRJ), particularly to
all my students and co-workers, for having given me much joy, personal growth, and job
satisfaction over the last four years. Writing a thesis is filled up with lonely moments and
being able to share this time with you, in your company, either in the classroom and/or
on university premises was fundamental to my mental health and to give me strength to
move on.
I appreciate all feedbacks and suggestions received to all my works presented and
published on different occasions since I immersed myself in the theme of energy
integration in 2012.
I also thank the opportunity to learn about energy modeling during the course of Energy
Policy for Sustainable Development and Use of the LEAP Model, from the Fundación
Bariloche (Bariloche - Argentina, June 2013) and the project of Economic and Social
Implications: Effect Gas Emission Mitigation Scenarios Greenhouse 2030 - IES Brazil
(Rio de Janeiro - Brazil, 2015-2016).
To the United Nations (UN), in particular the UN Non-Governmental Liaison Service
(UN-NGLS) and the United Nations Academic Impact (UNAI), for the opportunity to

vii
participate in events and to get in touch Agenda 2030 and the Sustainable Development
Objectives (SDG) in 2015 and 2016.
To the Federal University of Ouro Preto (UFOP), Minas Gerais (Brazil), and the Royal
Institute of Technology (KTH), Stockholm (Sweden), for their support in enabling remote
access to advanced computers for my energy modeling. Again, thank you very much for
making this work, Gustavo.
To the PPE administrative staff, particularly to Sandrinha and Paulo, for all the support,
understanding and patience in these years I was at COPPE. You made everything much
simpler and easier on PPE.
A big thanks to the Coordination for the Improvement of Higher Education Personnel
(CAPES) for the financial support in these four years. My gratitude goes to all of you
who prioritize teaching, research and extension, since I am aware that it is the (real) source
of economic growth, but also of social, political and cultural empowerment and
emancipation.
To those who believe, study and fight for regional integration, respecting our differences
and particularities. To those who understand that we should have a project of our own.
To those who, amidst so many adversities, disbeliefs and disappointments, keep going
and fighting to make it happen.

viii
Resumo da Tese apresentada à COPPE/UFRJ como parte dos requisitos necessários para
a obtenção do grau de Doutor em Ciências (D.Sc.)
SEGURANÇA ENERGÉTICA REGIONAL: REAVALIANDO CONCEITOS E
POLÍTICAS PARA PROMOVER A INTEGRAÇÃO ENERGÉTICA NO
MERCOSUL
Thauan dos Santos
Fevereiro/2018
Orientadores: Amaro Olímpio Pereira Júnior
Emilio Lèbre La Rovere
Programa: Planejamento Energético
Esta tese realiza uma revisão de conceitos e políticas relacionadas à segurança
energética e à integração regional. Dessa forma, propõe-se que o planejamento energético
nos países em desenvolvimento seja regional, incorporando as dimensões social e
ambiental da energia. Com foco nos países do Mercosul, considerando inclusive
Venezuela (2012) e Bolívia (2015), faz-se uma análise comparada geral em termos
quantitativos e qualitativos dos mercados e da infraestrutura física dos países do bloco (e
da América do Sul, como um todo). Em seguida, analisa-se o papel que as instituições
regionais, como o Mercosul e a UNASUL, desempenha na área de energia, mostrando
que sua contribuição para a integração energética da região é muito pequena. A seguir, é
proposto um índice híbrido (SEES index) para avaliar a evolução das políticas energéticas
do Mercosul no período 1990-2010. Posteriormente, usa-se o modelo OSeMOSYS-
SAMBA para simular quatro cenários de integração regional do setor elétrico, escolhido
como exemplo dada a sua relevância. Por fim, conclui-se que a integração energética do
Mercosul deve ser promovida, uma vez que reduz a necessidade de ampliação da
capacidade de geração de energia elétrica e os impactos socioambientais dos projetos na
área de energia.

ix
Abstract of Thesis presented to COPPE/UFRJ as a partial fulfillment of the requirements
for the degree of Doctor of Science (D.Sc.)
REGIONAL ENERGY SECURITY: RE-EVALUATING CONCEPTS AND
POLICIES TO PROMOTE ENERGY INTEGRATION IN MERCOSUR
Thauan dos Santos
February/2018
Advisors: Amaro Olímpio Pereira Júnior
Emilio Lèbre La Rovere
Department: Energy Planning
This thesis presents an overview of concepts and policies related to energy
security and regional integration. Follows a proposal that energy planning in developing
countries becomes regional, incorporating both social and environmental dimensions of
energy. Focusing on Mercosur countries, including Venezuela (2012) and Bolivia (2015),
a general comparative analysis is carried out, not only in quantitative and qualitative terms
of the markets, but also of the physical infrastructure of the member countries (and of
South America, as a whole). Then, comes an analysis of the role that regional institutions,
such as Mercosur and UNASUR, have played in energy integration, showing that their
contribution is very small. Next, a hybrid index (SEES index) is proposed to assess the
evolution of Mercosur’s energy policies in the period 1990-2010. Follows the application
of OSeMOSYS-SAMBA model to simulate four scenarios for the integration of the
power sector, used to illustrate the case due to its relevance. Finally, we conclude that
Mercosur’s energy integration should be promoted, since it reduces both the need to
invest in the extansions of power supply and the socio-environmental impacts associated
to electricity projects in the region.

x
INDEX
1. Introduction ........................................................................................................................... 1
1.1 General overview .............................................................................................................. 1
1.2 Objectives .......................................................................................................................... 7
1.3 Presentation of thesis structure and contents ..................................................................... 9
2. Energy security and regional integration ............................................................................. 14
2.1 Energy security ................................................................................................................ 15
2.1.1 Social dimension ......................................................................................................... 21
2.1.2 Environmental dimension ........................................................................................... 22
2.1.3 Regional dimension ..................................................................................................... 23
2.2 Regional Integration and Mercosur ................................................................................. 27
2.3 Energy integration ........................................................................................................... 35
2.3.1 Benefits and barriers.................................................................................................... 37
2.3.2 Market integration modalities ..................................................................................... 47
3. National perspectives .......................................................................................................... 61
3.1 Argentina ......................................................................................................................... 80
3.2 Bolivia ............................................................................................................................. 89
3.3 Brazil ............................................................................................................................... 98
3.4 Paraguay ........................................................................................................................ 108
3.5 Uruguay ......................................................................................................................... 119
3.6 Venezuela ...................................................................................................................... 125
4. Regional perspective ......................................................................................................... 137
4.1 Mercosur ....................................................................................................................... 137
4.2 IIRSA-UNASUR ........................................................................................................... 150
5. Energy index and modeling ............................................................................................... 164
5.1 SEES Index ................................................................................................................... 165
5.2 OSeMOSYS-SAMBA model ........................................................................................ 174
5.2.1 Assumptions .............................................................................................................. 179
5.2.2 Results ....................................................................................................................... 200
6. Conclusions and recommendations ................................................................................... 218
Appendix A. Market Coupling Initiatives ordered by the degree of harmonization ................. 225
Appendix B. International interconnections in SIEPAC ........................................................... 226
Appendix C. The GASBOL pipeline ........................................................................................ 227

xi
Appendix D. The Arco Norte Project and proposed interconnection ....................................... 228
Appendix E. The SINEA Project and proposed interconnection .............................................. 229
Appendix F. Structure of the South American Energy Treaty .................................................. 230
Appendix G. National and international input data ................................................................... 231
Appendix H. Location of the Madeira River dams ................................................................... 235
References ................................................................................................................................. 236

xii
LIST OF FIGURES
Figure 1. Structure of chapters ................................................................................................... 10
Figure 2. Expected evolution of energy markets integration...................................................... 49
Figure 3. Evolution of energy markets integration ..................................................................... 50
Figure 4. Summary of Markets Integration Modalities .............................................................. 56
Figure 5. Power plants and international interconnections in South America ........................... 69
Figure 6. Gas pipeline networks and natural gas reserves in South America ............................ 76
Figure 7. Argentine summarized energy balance (2015, in ktoe) .............................................. 83
Figure 8. Argentine energy trade, both exports and imports (2014, in 2000 US$) .................... 88
Figure 9. Bolivian summarized energy balance (2015, in ktoe) ................................................. 92
Figure 10. Bolivian energy trade, both exports and imports (2014, in 2000 US$) .................... 94
Figure 11. Brazilian summarized energy balance (2015, in ktoe) ............................................. 101
Figure 12. Brazilian energy trade, both exports and imports (2014, in 2000 US$) ................. 106
Figure 13. Paraguayan summarized energy balance (2015, in ktoe) ........................................ 110
Figure 14. Paraguayan energy trade, both exports and imports (2014, in 2000 US$) .............. 116
Figure 15. Uruguayan summarized energy balance (2015, in ktoe) ......................................... 121
Figure 16. Uruguayan energy trade, both exports and imports (2014, in 2000 US$) .............. 124
Figure 17. Venezuelan summarized energy balance (2015, in ktoe) ........................................ 127
Figure 18. Venezuelan energy trade, both exports and imports (2014, in 2000 US$) ............. 130
Figure 19. Evolution of SGT-6 and SGT-9 meeting frequencies (1996-2015) ........................ 146
Figure 20. Evolution of the UNASUR-COSIPLAN total projects (2003-2017) ...................... 162
Figure 21. Evolution of SEES in Mercosur (1990–2010) ........................................................ 170
Figure 22. OSeMOSYS blocks structure ................................................................................. 176
Figure 23. Evolution of RIS installed capacity (GW), by country (2015-2050) ...................... 204
Figure 24. Comparative evolution of net installed capacity related to RIS, by scenario, in GW
(2015-2050) ............................................................................................................................... 211
Figure 25. Comparative evolution of net generation related to RIS, by scenario, in TWh (2015-
2050) ......................................................................................................................................... 213
Figure 26. Comparative evolution of net electricity exchanges related to RIS, by scenario
(2015-2050) ............................................................................................................................... 216
Figure 27. Comparative evolution of net emissions related to RIS, by scenario, in MtCO2e
(2015-2050) ............................................................................................................................... 217

xiii
LIST OF TABLES
Table 1. Socioeconomic indicators for Mercosur countries ....................................................... 33
Table 2. Energy and environmental indicators for Mercosur, by country .................................. 64
Table 3. Production, consumption and energy surpluses and deficits, by country ..................... 65
Table 4. Electricity exchanges, between countries, in GWh (2015) .......................................... 66
Table 5. Binational Hydroelectric Power Plants in South America ........................................... 70
Table 6. Power plants and international interconnections in South America ............................. 71
Table 7. Evolution of electricity consumption, in kWh/inhabitant (1990-2015) ........................ 72
Table 8. Generation, transmission and distribution of electricity markets, by country .............. 73
Table 9. Private participation in generation, transmission and distribution, in % ...................... 74
Table 10. Gas pipeline networks and natural gas reserves in South America ............................ 77
Table 11. Reserves and resources for Mercosur, by country (2015) .......................................... 79
Table 12. Proven natural gas reserves, by country, in TCF (1990-2015) ................................... 80
Table 13. Evolution of Mercosur’s official energy institutional design (1993-2012) .............. 139
Table 14. Annual contributions and resources received in FOCEM ........................................ 144
Table 15. Comparative analysis of electric power industry in Mercosur countries.................. 148
Table 16. Comparative analysis of O&G industry in Mercosur countries ............................... 149
Table 17. UNASUR-COSIPLAN 2016 Project Portfolio, by EID ........................................... 157
Table 18. UNASUR-COSIPLAN 2016 Project Portfolio, by country and type of project ...... 158
Table 19. UNASUR-COSIPLAN 2016 Project Portfolio, by sector and type of project ......... 159
Table 20. Evolution of the UNASUR-COSIPLAN total and energy projects (2003-2017) ..... 161
Table 21. Socio-environmental-energy security (SEES) index. ............................................... 168
Table 22. OSeMOSYS-SAMBA integration scenarios general data ....................................... 181
Table 23. Reference integration scenario (RIS) detailed data .................................................. 183
Table 24. Moderate integration scenario (MIS) detailed data .................................................. 187
Table 25. Strong integration scenario (SIS) detailed data ........................................................ 192
Table 26. Evolution of RIS installed capacity and generation, by country (2015-2050) ......... 201
Table 27. Evolution of WIS installed capacity and generation, by country (2015-2050) ........ 205
Table 28. Evolution of MIS installed capacity and generation, by country (2015-2050) ........ 207
Table 29. Evolution of SIS installed capacity and generation, by country (2015-2050) .......... 209
Table 30. Comparative installed capacity and generation, by scenario (2015-2050) ............... 210
Table 31. Installed capacity of alternative scenarios, by technology, in GW (2015-2050) ...... 212
Table 32. Generation from alternative scenarios, by technology, in GW (2015-2050) ............ 214
Table 33. Electricity exchanges in SIS between countries, in TWh (2050) ............................. 215
Table 34. Electricity exchanges in SIS between countries, in TWh (2050) ............................. 216
xiv
LIST OF ACRONYMS
ABAR (Brazilian) Association of Regulatory Agencies
ABRADEE (Brazilian) Association of Electric Energy Distributors
ACL (Brazilian) Free Contracting Environment
ACR (Brazilian) Regulated Contracting Environment
ADME (Uruguayan) Electric Market Administration
AFCSE (Bolivian) Electricity Control Authority
AFD French Development Agency
AHBG (Mercosur) Ad Hoc Group on Biofuels
ALADI Latin American Integration Association
ALBA Bolivarian Alternative for the Peoples of Our America
ANA (Brazilian) National Water Agency
ANCAP (Uruguayan) National Administration of Fuels, Alcohols and Portland
Cement
ANDE (Paraguayan) National Electricity Administration
Aneel (Brazilian) National Electric Energy Agency
ANH (Bolivian) National Hydrocarbons Agency
ANP (Brazilian) National Agency of Petroleum, Natural Gas and Biofuels
APEC Asia-Pacific Economic Cooperation
API (IIRSA-COSIPLAN) Integration Priority Project Agenda
Ar Argentina
ARPEL Latin America and the Caribbean
ATC Available Transfer Capacity
ATS Alternative Trade SAMBA
BANDES Venezuela Economic and Social Development Bank

xv
BAU Business As Usual
BB Bank of Brazil
BCB Central Bank of Bolivia
BES Brazilian Electricity Sector
BG British Gas
BNDES Brazilian Development Bank
Bo Bolivia
Br Brazil
BRACIER Brazilian Committee of CIER
CAF Andean Development Corporation/Development Banck of Latin America
CAMMESA (Argentine) Wholesale Electricity Market Administrator Company
CAN Andean Community
CANDU Canadian Deuterium Uranium
CASA South American Community of Nations
CBDR Common But Differentiated Responsibilities
CEPEL (Brazilian) Electrical Energy Research Center
CES (UNASUR) South American Energy Council
CCEAR (Brazilian) Energy Trading Contract in Regulated Environment
CCEE (Brazilian) Electric Energy Trading Chamber
CCI (Brazilian) Facilities Sharing Agreements
CCS Carbon Capture and Storage
CCT (Brazilian) Transmission System Connection Agreements
CFEE (Argentine) Federal Electrical Energy Council
CGEE (Brazilian) Energy Efficiency Management Committee
CIER Regional Energy Integration Commission
c.i.f Cost Insurance and Freight
Cl Chile

xvi
CMC (Mercosur) Common Market Council
CMG (Mercosur) Common Market Group
CMSE (Brazilian) Power Sector Monitoring Committee
CNDC Bolivian National Load Dispatch Committee
CNEP (Paraguayan) National Council of Public Companies
CNPE (Brazilian) National Council of Energy Policy
Co Colombia
CO2 Carbon dioxide
CO2eq Carbon dioxide equivalent
COBEE Bolivian Power Company
COCIER Colombian Committee of CIER
CONAM (Paraguayan) National Council of the Environment
CONAMA (Brazilian) National Environment Council
CONPET (Brazilian) National Program for the Rational Use of Oil Products and
Natural Gas
COP Conference of the Parties
Corpoelec National Electricity Corporation S. A.
COSIPLAN South American Council of Infrastructure and Planning
CPST (Brazilian) Transmission Services Agreement
CSN South American Community of Nations
CSP Concentrated Solar Power
CUST (Brazilian) Contract of Use of the Transmission Systems
CWE-MC CWE Market Coupling
DEC Decision
DIT (Brazilian) Other Transmission Facilities
DNE (Uruguayan) National Energy Directorate
EBIH Bolivian Hydrocarbons Industrialization Company

xvii
EBISA Emprendimientos Energéticos Binacionales S.A.
EBS N. V. Energiebedrijven Suriname
EBY Yacyretá Binational Entity
Ec Ecuador
ECLAC (United Nations) Economic Commission for Latin America and the
Caribbean
ECSC European Coal and Steel Community
EDELAP (Argentine) Distribution Company of La Plata S.A.
EDENOR (Argentine) Distribution and Marketing Company of the North S.A
EDESUR (Argentine) South Distribution Company S.A.
EDF Electricité de France S.A
EE Energy Efficiency
E&P Exploration and Production
EID (IIRSA) Integration and Development Hubs
Eletrobras Brazilian Electric Power Company S.A.
EMCC European Market Coupling Company
EMDE Emerging Markets and Developing Economies
ENAGAS (Venezuelan) National Gas Entity
ENARGAS (Argentine) National Regulatory Entity for Gas
ENDE (Bolivian) National Electricity Company
ENRE (Argentine) National Electricity Regulatory Entity
EPE (Brazilian) Energy Research Company
ESBR Sustainable Consortium of Brazil
ETP Energy Technologies Perspectives
EU European Union
EURATOM European Atomic Energy Comunity
Exp Exports

xviii
f.o.b Free On Board
FOCEM Mercosur Structural Convergence Fund
FONPLATA Financial Fund for the Development of the Río de Plata Basin
FTZ Free-Trade Zone
GASBOL Bolivia-Brazil Gas Pipeline
GDP Gross Domestic Product
GEA Guyana Energy Agency
GHG Greenhouse Gas
GMC (Mercosur) Common Market Group
GOPLAN Technical Group of Planning Agencies
Gt Guatemala
GTB Gas TransBoliviano S.A.
GTOR Working Group of Electricity Regulatory Organizations
GVC Global Value Chains
Gy Guyana
HDI Human Development Index
HPP Hydro Power Plants
HW&L Heat, Waste & Losses
HVDC high-voltage, direct current
IBGE Brazilian Institute of Geography and Statistics
I(A)DB Inter-American Development Bank
IEA International Energy Agency
IET International Electricity Transactions
IIRSA Initiative for the Integration of Regional Infrastructure in South America
IMF International Monetary Fund
Imp Imports
IOC International Oil Companies
xix
IRENA International Renewable Energy Agency
IS Isolated Systems
LAC Latin America and the Caribbean
LAIA Latin American Integration Association
LOSSEL (Venezuelan) Organic Law on the Public Service of Electricity
LPG Liquefied Petroleum Gas
MCTIC (Brazilian) Ministry of Science, Technology, Innovation and
Communications
MDG Millenium Development Goals
ME (Bolivian) Ministry of Energy
MEM (Argentine) Wholesale Electricity Market
MER (Central American) Regional Electricity Market
Mercosur Common Market of the South
MH (Bolivian) Ministry of Hydrocarbons
MHE (former Bolivian) Ministry of Hydrocarbons and Energy
MIBEL Iberian Market
MIEM (Uruguayan) Ministry of Industry, Energy and Mining
MIC (Paraguayan) Ministry of Industry and Commerce
MINEM (Argentine/Peruvean) Ministry of Energy and Mining
MIS Moderate Integration Scenario
MMA (Brazilian) Ministry of Environment
MME (Brazilian) Ministry of Mines and Energy
MOPC (Paraguayan) Ministry of Public Works and Communications
MOU Memorandum Of Understanding
MPetroMin (Venezuelan) Ministry of the Popular Power of Petroleum and Mining
MPPEE (Venezuelan) Ministry of Popular Power for Electric Energy
MUEVE (Uruguyan) Electric Mobility Exhibition

xx
Mx Mexico
N North
NAMA Nationally Appropriate Mitigation Actions
NCRE Non-Conventional Renewable Energies
NE Northeast
NEP New Environmental Paradigm
NGCC Natural Gas Combined Cycle
NGOC Natural Gas Open Cycle
NGL Natural Gas Liquid
NGPP Natural Gas Processing Plants
NIS (Brazilian/Paraguayan/Bolivian) National Interconnected System
NPS Nord Pool Spot
OECD Organisation for Economic Co-operation and Development
O&G Oil and Gas
OLADE Latin American Energy Organization
ONS (Brazilian) National System Operator
OPEC Organization of the Petroleum Exporting Countries
OSeMOSYS The Open Source energy Modelling System
Pa Panama
PA Paris Agreement
PAC 2 (Brazilian) Growth Acceleration Program 2
PAE (IIRSA) Strategic Action Plan
PDSEN (Venezuelan) Development Plan for the National Electric System
PDVSA Petróleos de Venezuela, S.A.
Pe Peru
Petrobras Petróleo Brasileiro S.A.
Petropar Petróleos Paraguayos S.A.

xxi
PMR Partnership for Market Readiness
PPI Private Participation in Infrastructure
PPP Public-Private Partnership
PPSA (Brazilian) Pre-Sal Petróleo S.A.
PROCEL (Brazilian) National Electricity Conservation Program
PROINFA (Brazilian) Alternative Energy Sources Incentive Program
PSI (IIRSA) Sectoral Integration Processes
PV Photovoltaic Power Plant
PX Power Exchange
Py Paraguay
PWR Pressurizer Water Reactor
RE Renewable Energy
REC Recommendation
REIDI (Brazilian) Special Regime for Incentives for Infrastructure Development
RES Resolution
Rio+20 United Nations Conference on Sustainable Development
RIS Reference Integration Scenario
RNEST Abreu e Lima Refinery
RenovAr (Argentine) Renewable Energy Program
RFB Federal Revenue of Brazil
RMMA (Mercosur) Meeting of the Environment Ministers
RMME (Mercosur) Meeting of Ministers of Mines and Energy
S South
SA South America
SADI Argentine Interconnection System
SAMBA South America Model Base
SAVE (Uruguayan) Electric Vehicle Power Systems Network

xxii
SDG Sustainable Development Goal
SE4ALL Sustainable Energy for All
SEAM (Paraguayan) Secretariat of the Environment
SE/CO Southeast/Midwest
SEES Socio-Enviromental-Energy Security
SGT Working Subgroup of Mercosur
SHP Small Hydroelectric Power Plant
sieLAC Latin America and the Caribbean Energy Information System
SIEPAC Central American Electrical Interconnection System
SINEA Andean Electrical Interconnection System
SING (Chilean) Interconnected System of the Norte Grande
SMEs Small and Medium Enterprises
SPG (Brazilian) Oil, Natural Gas and Biofuels Secretariat
SSE (Brazilian) Electric Energy Secretariat
ST (Argentine) Trunk System
STAT (Argentine) High Voltage Electric Power Transport System
SIS Strong Integration Scenario
Su Suriname
TBG Transportadora Brasileira Gasoduto Bolívia-Brasil S.A.
T&D Transmission and Distribution
TGN (Bolivian) National Treasury
TGU Turbogenerator Units
TIE International Energy Transactions
TL Transmission Line
TLC Trilateral Market Coupling
TPP Thermal Power Plant
TUST (Brazilian) Tariffs for Use of Transmission System

xxiii
U3O8 Uranium
UN United Nations
UNASUR Union of South American Nations
UNDSN United Nations Sustainable Development Solutions Network
UNFCCC United Nations Framework Convention on Climate Change
UPME (Colombian) Mining and Energy Planning Unit
UREE (Venezuelan) Rational Use of Electric Power
URSEA (Uruguayan) Regulatory Unit of Services of Energy and Water
USA United States of America
UTE (Uruguayan) National Administration of Power Plants and Electric
Transmissions
Uy Uruguay
VAT Value-added tax
Ve Venezuela
VMATE (Bolivian) Vice-Ministry of High Energy Technologies
VMME (Paraguayan) Vice Ministry of Mines and Energy
VMEEA (Bolivian) Vice Ministry of Electricity and Alternative Energies
VNG Vehicular Natural Gas
YPBF Yacimientos Petrolíferos Fiscales Bolivianos S.A.
YPF (Argentine) Fiscal Oilfields S.A.
WB World Bank
WEC World Energy Council
WEO World Energy Outlook
WIS Weak Integration Scenario

xxiv
LIST OF UNITS
bbl barrel
bcm billions cubic meters
boe barrel of oil equivalent
BTU British Thermal Unit
cal calorie
g gram
G giga = 109
J Joule
k kilo = 103
kbbl/d 1000 barrels per day
kWh kilowatt-hour
m meter
M mega = 106
MMCFD million cubic feet day
MWe megawatt elétrico
MWp megawatt peak
pp percentage point
t ton
tCO2 tons of carbón dioxide
TCF trillion cubic feet
toe tons of oil equivalent
US$ American dollars
W watts

1
1. Introduction
The introduction will be divided into three sections. The first one (section 1.1) presents a
general overview of the main themes and discussions of the thesis. The second one
(section 1.2) highlights the objectives of the research, as well as its originality. Finally,
the third one (section 1.3) presents the thesis structure and contents.
1.1 General overview
Energy has been playing an essential role in the history of societies throughout the most
different ages. From the discovery of fire, to industrial revolutions, access, domination
and use of energy, it has always been strategic for human survival and well-being, as well
as for economic growth and development itself. In fact, as the binomial domain-
dependence of energy became more evident, the more obvious was the need for humans
to develop technologies and mechanisms to have their control.
It became important to have energy domain, mainly having access to different resources
‘in the backyard’, that is, domestically; however, when this was not possible, different
contractual/commercial arrangements, wars and/or interventions took place in order to
dominate it. By dominating energy and basing an entire model of production and patterns
of consumption on certain energy sources, dependence started increasing and seemed to
have no return. In this sense, the binomial domain-dependency of energy began to control
and even determine technological, economic, political, social and undoubtedly
environmental relations within and between countries.
Thus, energy has become and continues to be a priority theme in the national strategic
agenda. In effect, the terms ‘countries’ and ‘national’ were intentionally detached, since
energy has increasingly become a sensitive issue linked to state sovereignty, as it is vital
for its development. Therefore, it was essential to have guaranteed access to energy
somehow.
Since energy ccan be understood as a strategic priority sector, it needs specific planning
and policies. This is particularly true especially because energy not only provides the
production of basic goods/services, but also guarantees the well-being of the population.

2
This rationale is confirmed by the fact that many experts and policy makers already
consider energy as a public good (KARLSSON-VINKHUYEN et al., 2012, BARRETT,
2007).
Therefore, energy planning becomes paramount to guarantee energy security. However,
two issues arise that need to be reflected upon. The first one is that energy planning need
not be based solely and exclusively on a country’s own resources. In this way, it is
possible to take place at regional level, being guaranteed through arrangements such as
energy integration and/or cooperation, or even through international trade. The second
issue is related to the concept of energy security, which, again, is intrinsic and often
associated with national sovereignty and self-sufficiency.
Consequently, energy is seen from the point of view of planning and security, as, once
again, issues intrinsic to sovereignty, autonomy, independence and self-sufficiency of
States. In this sense, it is common to see the concepts of energy security as domestic
policies and priorities in the national agenda (SANTOS, 2014b). Nevertheless, there is
not even a clear consensus about the real meaning of such concept (JOHANSSON, 2012,
SANTOS et al., 2017b).
Precisely for this reason, we seek to overcome this shortcoming rooted in the energy area
itself. Thus, the proposal of this thesis is to discuss the theme from a regional logic,
understanding that different countries can achieve their goals rather through strategic
(geo)political arrangements with their neighbors. Accordingly, this thesis has a regional
rationale, which highlights, believes, suggests and sees in regional integration an
alternative to individual and state-centric management.
Notwithstanding, it is important to emphasize that regional integration is an extremely
complex concept, misunderstood and instrumentalized by different countries. Complex,
as it is discussed in the most different areas, such as Economics, Social Sciences, Political
Science, History, Geography, International Relations and Law, for example, without any
consensus about its real meaning. It is misunderstood not only by different interpretations
and approaches, but above all because it is often believed that regional integration is
synonymous of international trade. In this way, it is often seen as a strictly economic
issue, which ends up obscuring its social, political, institutional, cultural and historical
nature. Finally, it is a concept instrumentalized by different countries inasmuch as, in the
absence of commitments inherent in participating of a regional arrangement, countries in
3
some cases seek only short-term private gains, which risk the very process of regional
integration.
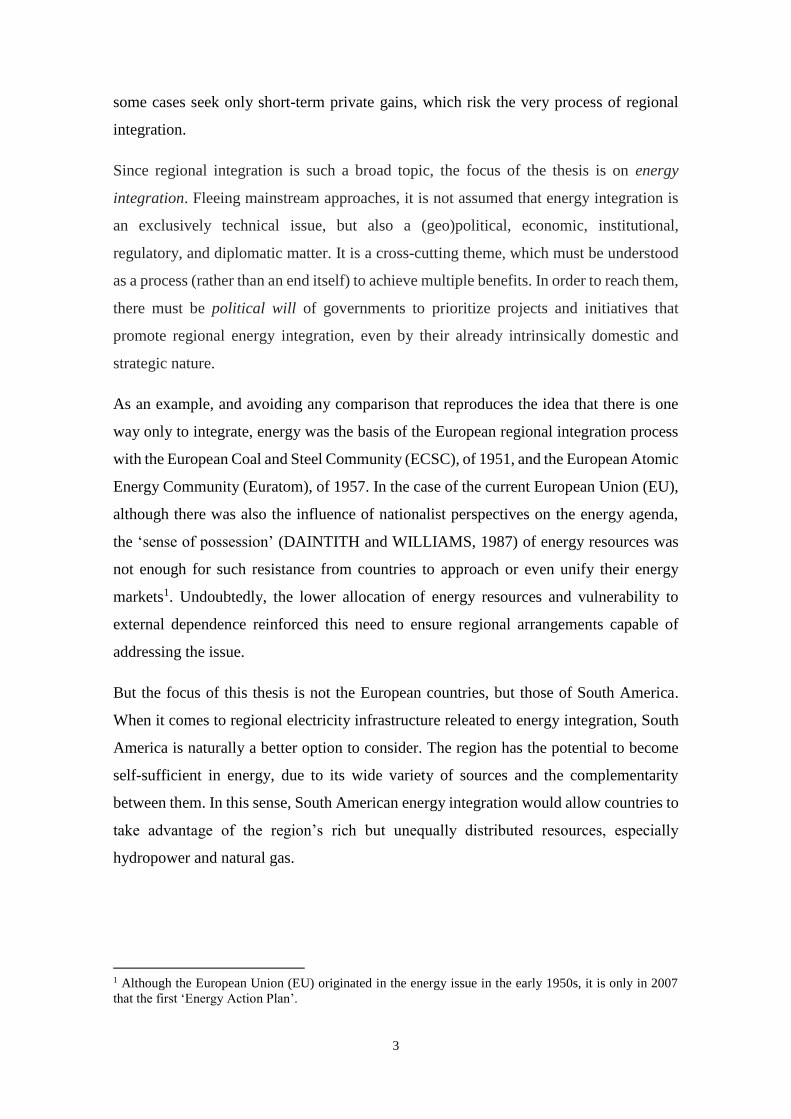
Since regional integration is such a broad topic, the focus of the thesis is on energy
integration. Fleeing mainstream approaches, it is not assumed that energy integration is
an exclusively technical issue, but also a (geo)political, economic, institutional,
regulatory, and diplomatic matter. It is a cross-cutting theme, which must be understood
as a process (rather than an end itself) to achieve multiple benefits. In order to reach them,
there must be political will of governments to prioritize projects and initiatives that
promote regional energy integration, even by their already intrinsically domestic and
strategic nature.
As an example, and avoiding any comparison that reproduces the idea that there is one
way only to integrate, energy was the basis of the European regional integration process
with the European Coal and Steel Community (ECSC), of 1951, and the European Atomic
Energy Community (Euratom), of 1957. In the case of the current European Union (EU),
although there was also the influence of nationalist perspectives on the energy agenda,
the ‘sense of possession’ (DAINTITH and WILLIAMS, 1987) of energy resources was
not enough for such resistance from countries to approach or even unify their energy
markets1. Undoubtedly, the lower allocation of energy resources and vulnerability to
external dependence reinforced this need to ensure regional arrangements capable of
addressing the issue.
But the focus of this thesis is not the European countries, but those of South America.
When it comes to regional electricity infrastructure releated to energy integration, South
America is naturally a better option to consider. The region has the potential to become
self-sufficient in energy, due to its wide variety of sources and the complementarity
between them. In this sense, South American energy integration would allow countries to
take advantage of the region’s rich but unequally distributed resources, especially
hydropower and natural gas.
1 Although the European Union (EU) originated in the energy issue in the early 1950s, it is only in 2007
that the first ‘Energy Action Plan’.

4
In contrast to Latin America2 as a whole, it consists, firstly, of a compact
geographical and physically contiguous unit (…) Secondly, the region
has extensive reserves of both renewable and non-renewable power that
can be transformed into electricity (…) Third, South America has
successful background in the field of energy infrastructure integration
(BIATO et al, 2016: 63).
In this sense, and considering the South American subcontinent, where there are several
regional integration initiatives, the particular focus of this thesis will be on the Southern
Common Market (Mercosur), an initiative that dates back to the 1990s and initially counts
on Argentina, Brazil, Paraguay and Uruguay. It should be noted that the current formation
of Mercosur encompasses more than 70% of both population and territory of South
America.
In this context, considering the fact that they are developing countries, the social
dimension inherent to energy stands out. Because they are countries whose access to
electricity is not always guaranteed to the entire population, especially in regions farthest
away from major centers and rural areas, the guarantee and universalization of access to
energy is of relevance in the energy strategy of these countries. Likewise, the region has
geographical particularities such as the Andes Mountains Range, the Amazon Forest, the
Atacama Desert and Patagonia Glaciers, which make it necessary to respect the
geophysical and environmental constraints that are imposed on the region. Therefore,
exploring regional integration as a means of guaranteeing basic rights3, such as access to
energy and respect for the environment, can be seen as an alternative and necessary
development mechanism.
Another feature of the region is the continued increase in energy demand, either through
greater access to energy services or through changes in the living, production and
consumption habits of the population. The United Nations Economic Commission for
2 It is worth noting that in Central America there is the famous and successful Central American Electrical
Interconnection System (SIEPAC) energy integration project. This infrastructure includes compensation
equipment and substations extending over 1,800 km of 230-KW transmission lines, connecting 15
substations through 28 access bays. The SIEPAC line connects Panama to Guatemala, through Costa Rica,
Nicaragua, Honduras and El Salvador, but is still far from realities such as Nordpool, Real-Time Energy
Market (PJM) and Iberian Electricity Market (MIBEL). See Appendix A. 3 Highlighted in the International Energy Charter at the Ministerial Conference (The Hague II) in 2015.
CEIA and RIBEIRO (2016) stress that energy should be seen as a right, not as a commodity – since it can
be considered as a key factor in achieving social justice (job creation, provision of basic social services,
and better income distribution).

5
Latin America and the Caribbean (ECLAC) also highlights the urbanization of certain
regions as one of the reasons why there is such an increase in energy demand. To meet
this challenge, electricity is most adaptable to urban areas, given its form of control, use
of appliances and ease of adapting it to transportation.
Therefore, countries in the region need to plan supply-side and energy-efficiency (EE)
policies to deal with these pressures. However, although there are diversity and
complementarity of resources, particularly energy resources, the region has paradoxically
an unmet demand, with frequent supply crises in the Mercosur region and limited
investments in energy infrastructure. Precisely because of this, the relationship between
the existence of natural resources and the available energy is not direct, what poses more
challenges to (regional) energy management and planning (DESIDERÁ NETO et al.,
2014).
Recently, there was the adhesion of Venezuela (2012)4 to Mercosur and Bolivia’s
adhesion as a full member is ongoing. This enlargement of the bloc (an increase in the
number of States Parties) is extremely interesting, especially when it comes to energy
endowment. According to BP, Venezuela has the largest oil reserves in the world and
already has regional energy projects such as Petrocaribe, Petroandina, Petrosur and
Petroamerica. In turn, Bolivia has the regional experience of the Bolivia-Brazil Gas
Pipeline (GASBOL) and, like Venezuela, has relevant hydroelectric potential and the
possibility of creating international interconnections with neighbouring countries.
There are many justifications for this thesis. Unlike the context of the 1970s, when the
price of oil increased with the 1973 and 1979 crises, the current global energy scenario is
distinct from that of nearly half a century ago. The International Energy Agency (IEA)
itself, in the 2014 Medium-Term Coal Market Report, draws attention to the significant
increase in coal consumption, often justified by emerging economies, to the supply of
shale gas, as well as to the discovery of new oil reserves (in addition to new exploratory
techniques that allow for greater longevity of the ‘black gold’).
Against this, and in the face of the world logic, the sustainable development imperative
and the promotion of access to clean and renewable energy lead to the need to implement
4 At the end of the research period and elaboration of the thesis, the country ended up being suspended and
kicked out from Mercosur. However, this situation is not yet clear or fully defined, which is the reason why
Venezuela has remained in the analysis.

6
new policies and energy planning, incorporating new variables and objectives into the
feasibility analysis of projects of energy infrastructure. It should be noted that energy has
recently been chosen as a goal with its own identity among the sustainable development
goals (SDG), and it is not only seen a means to achieve other goals like in the millennium
development goals (MDGs). As a first step towards meeting these new challenges, the
Sustainable Energy for All (SE4All) was formulated, which is a nonprofit organization
working with leaders in government, the private sector and civil society to drive further,
faster action toward achieving Sustainable Development Goal 7 (affordable and clean
energy).
Although many studies discuss and use the concept of energy security to reach these
energy goals, there is no consensus about its meaning, nor about the methodologies and
variables used to analyze it. It is a broad concept, generic, context-dependent and
therefore vague and often empty. Thus, it is an insufficient concept to analyze certain
cases and regions.
Albeit it is a very widespread concept, few studies work with energy security in the face
of a regional logic, mainly because of the influence of nationalist and state-centric
perspectives that prioritize strategic energy studies. Consequently, little research,
focusing on regional cooperation and integration as ways of ensuring energy goals, has
been conducted so far. When they exist, they do focus on Organisation for Economic Co-
operation and Development (OECD) countries.
With regard to Mercosur, it is often associated only with intra-bloc trade (among its
members) and, although there are sub-working groups (SGTs) dealing with energy and
environmental issues, little has been done and officially published about the region’s
energy planning.
As a direct consequence of the systematic absence of studies that overcome the national
perspective, there are few critical comparative studies in the energy sector. There are no
recent studies working with comparative energy policies within Mercosur to date.
Actually, there are some studies that encompass Latin or South American countries,
consequently they evaluate Mercosur countries, but they do not respect the official
composition of the regional bloc.

7
Finally, the research is also justified by the inexistence of papers discussing regional
energy integration, striving to promote a connection and a dialogue between contributions
from areas such as economics, international relations and energy planning, considering,
for example, economic, political, diplomatic, regulatory, physical, infrastructural,
environmental. Although it may seem obvious, it is necessary to look at the theme in its
entireness and consider its different facets and perspectives; otherwise, ignoring the cross-
cutting nature of the theme will lead to partial, biased and limited contributions.
1.2 Objectives
Therefore, the general objective of this thesis is to analyze the issue of energy integration
within the Mercosur countries, relating it to the suggested concept of regional energy
security. By defining the scope of the thesis to Mercosur, the space and time analysis are
automatically delimited. Regarding the area analyzed, it includes the original
configuration of the block (Argentina, Brazil, Paraguay and Uruguay), as well as Bolivia
and Venezuela; with regards to time analysis, the post-signing period of the Treaty of
Asunción (1991) will be evaluated to date, what will serve as a basis for the creation of
scenarios in energy modeling by 2050.
Among the specific objectives, we can highlight;
To review the evolution of the concepts of energy security and regional
integration, pointing out their contributions and limitations;
To propose the concept of regional energy security to analyze cases of regional
integration/cooperation and/or regional blocs;
To make a comparative analysis of the current energy reality of the Mercosur
countries, highlighting national initiatives related to regional integration;
To evaluate the evolution of Mercosur's regional energy security between 1990
and 2010, based on the set of own elaboration indicators that generate socio-
environmental-energy security index (SEES index); and
To create scenarios of regional electric integration, considering different premises
and projects, to measure the impact of the promotion of regional integration on
the need for new electric projects, in the expansion of installed capacity and
generation, as well as in greenhouse gas emissions (GHG).

8
The originality of the thesis lies on many issues. The thesis deepens the dynamics of
integration to the detriment of regional conflict, which itself is original and innovative –
mainly because, as already mentioned, energy issues are often considered to be associated
with autonomy, self-sufficiency and national sovereignties. In addition, and related to the
previous argument, the proposal of problematization of the concept of energy security
aims to deal with gaps that exist in the literature, although it is a widely accepted and
reproduced concept. In suggesting the SEES index, we are not only (re)defining and
offering a new approach to energy planning, but also associating it with the new
environmental paradigm (NEP) (DUNLAP and VAN LIERE, 1978, GADENNE et al.,
2011).
Because it is a analysis of (part of) South America, it is not intended to indiscriminately
apply the theories of regional integration that were created to understand the European
case, such as the neo-functionalist – which basically focuses on the relevance of
supranational institutions. In fact, intergovernmental theory will be used, which
disregards this focus and highlights the greater autonomy and sovereignty of the countries
involved in the process of regional integration.
With regard to the particular case of regional integration under analysis, it is worth noting
that this is one of the first works that considers the initial formation of Mercosur
(Argentina, Brazil, Paraguay and Uruguay), as well as Venezuela and Bolivia. Finally, it
should be noted that the methodological design and the criteria of analysis are original
and innovative, insofar as it aggregates different areas, such as international security,
regional integration, sustainable development, public policies, as well as energy
indicators/modeling. Thus, bibliographical research and theoretical development have
influences from Economic Sciences, Political Science, International Relations, Security,
Energy, Environment and Development, for example.
The assumption is that greater regional energy integration is better for the region, what
will be ratified in different chapters and sections of this thesis. In addition, another
assumption of the research is that Bolivia’s effective accession process will be finalized,
so that the country can be considered a Mercosur State Party. Finally, another assumption
is that the electrical integration is the ideal case study to be analyzed in this thesis due to
social benefits related to it.

9
1.3 Presentation of thesis structure and contents
Figure 1 shows the structure of its chapters. Note that chapters include quantitative and
qualitative primary sources such as statistics, forecast data, norms, laws, international
treaties, agreements, memorandum of understanding, regulatory frameworks, decisions,
recommendations, decree, resolutions, framework agreements, declarations, programs
and planning.

10
Figure 1. Structure of chapters
Source: Own elaboration

11
Chapter 1 is the introduction itself. It presents the theme of the research, as well as the
boundaries to the space (Mercosur) and time of analysis (1990 onward), as well as
methodology, justifications, general objective and originality of this study. It seeks to
clarify to the reader the basis on which the thesis will be conducted, as well as the
ontological (research nature), epistemological (perception of reality of research) and
methodological (research techniques and methods) choices of the research.
Chapter 2 is subdivided into 3 sections, which constitute the ‘literature review’. The
quotes are due to the fact that this chapter is much more than a simple review of what has
been discussed recently on the topics covered; in fact, it makes a critical and positioned
presentation on the following topics: energy security (section 2.1), regional integration
and Mercosur (section 2.2) and energy integration (section 2.3). Numerous papers, such
as articles, reports and chapters of national and international books have been used as a
basis for the main key concepts of this thesis. It is worth mentioning that the discussion
about the concept of energy security is focused on three dimensions: social (subsection
2.1.1), environmental (subsection 2.1.2) and regional (subsection 2.1.3). Likewise, the
debate on energy integration is subdivided into benefits and barriers (subseciton 2.3.1)
and market integration modalities (subsection 2.3.2).
Chapter 3 presents qualitative and quantitative national data and analyzes the energy
sector of the countries under study. The national and regional quantitative primary sources
are databases such as World Databank, sieLAC, ECLACstat, CIER, COCIER, BP, WEC
and national energy ministries. The chapter will be organized in two parts. The first one
provides a comparative analysis of different primary quantitative data on energy power
plants and international interconnections; private participation in generation, transmission
and distribution; and gas pipeline network and natural gas reserves in the region, for
example. The second part provides a comparative analysis on the energy sector of each
analyzed countries: Argentina (section 3.1), Bolivia (section 3.2), Brazil (section 3.3),
Paraguay (section 3.4), Uruguay (section 3.5) and Venezuela (section 3.6). There are
information such as geographical and economic overview; structure of energy markets,
separated by electricity, and oil and gas (O&G); summarized energy balance; binational
projects, whether hydroelectric plants or gas pipelines; and international (cross-border)
interconnections and international trade, for example.

12
Chapter 4 deals with the same topic from a regional perspective. It presents energy
information in the framework of Mercosur (section 4.1) and UNASUR (section 4.2) on
the basis of regional qualitative primary sources such as norms, laws, international
treaties, agreements, memorandum of understanding, regulatory frameworks, decisions,
recommendations, decree, resolutions, framework agreements, declarations, programs
and planning. About 110 primary sources of Mercosur were consulted and analyzed,
highlighting 25 Mercosur’s official energy regulations (1993-2012), as well as 66
frequency of Mercosur’ Sub-Working Group (SGT-6) Environment meetings (1996-
2015) and 16 frequency Mercosur’s of SGT-9 Energy meetings (2005-2011). Besides, 2
comparative analysis based on Chapter 3 are carried out: (i) a comparative analysis of
electric power industry in Mercosur countries; and (ii) a comparative analysis of O&G
industry in Mercosur countries. Concerning UNASUR, five main documents dealing with
the energy issue are analyzed, such as the South American Energy Treaty (2010), as well
as the last 10 IIRSA-COSIPLAN reports in order to identify the relevance of energy
projects in terms of participation in the number of projects and amount (US$ million).
Chapter 5, as well as the two previous ones, will also be divided into two main sections:
SEES index (section 5.1) and Scenario modeling (section 5.2). In the first section, it is
created a new hybrid index called socio-environmental-energy security (SEES), whose
main objective is to analyze the evolution of Mercosur energy policies in the past (1990-
2010). Then, the second section proposes energy scenarios using the Open Source Energy
Modelling System – South America Model Base (OSeMOSYS-SAMBA), a model of
planning for the expansion of long-term energy systems, whose objective is to analyze
present and possible integration scenarios in the future (2015-2050). It is divided into two
subsections, which present the key assumptions (subsection 5.2.1) and the results
(subsection 5.2.2) achieved by every modeled scenario: reference integration scenario
(RIS), weak integration scenario (WIS), moderate integration scenario (MIS) and strong
integration scenario (SIS). They consider expansion and new international
interconnection lines, new binational hydroelectric plants, new contractual arrangements
(swaps) as well as regulatory harmonization.
Finally, Chapter 6 presents the main conclusions of this thesis, as well as some
recommendations. It seeks to summarize its main findings, highlighting the need to
review regional policies on regional energy integration, including the results in the light
of the models used. Thus, it seeks to clarify the main points related to regional integration
13
associated with the energy issue in order to contribute to reduce confusion in the literature
and, consequently, to the decision making of the matter in question. Appendices with
additional information (figures, tables, and maps) are then displayed. Finally, References
that supported the thesis are presented.

14
2. Energy security and regional integration
This chapter is more than a simple ‘review of the literature’. As highlighted before in the
Introduction (Chapter 1), an effort is made to combine different approaches and
perspectives where dialogue is often non-existent, also in order to clarify the theoretical
foundations essential to the main debates proposed by this thesis. Ergo, we cite authors
from Economic Science, Political Science, International Relations, Energy Planning5,
Energy Engineering and Environmental Sciences, for example.
More than just presenting a diversity of texts, reports and papers that deal with the subject
in the last years, this chapter incites debate and reflection. It presents not only the main
concepts but also their evolution over time, as well as their inconsistencies. In addition,
at the end of each section and subsection, the author’s position on the subject is clearly
marked so that the reader understands the path through which the text is being conducted.
In this way, this chapter is divided into three sections. The first section deals with Energy
security (section 2.1), presenting the evolution of the concept, based on the context of the
1970s oil shocks. There are three subsections that highlight the relevance of incorporating
into the analysis social (subsection 2.1.1), environmental (subsection 2.1.2) and regional
(subsection 2.1.3) dimensions. This section is particularly important because it will create
the conceptual bases that will justify the creation of the SEES index (subsection 4.1), to
be detailed later.
The second section deals with the concept of regional integration (section 2.2), focusing
in particular on the Mercosur case. The section highlights the need to promote an
interdisciplinary approach to the issue, addressing and facing the complexity it demands.
A brief presentation of the historical process of creation and consolidation of Mercosur is
presented, finally introducing some data that show the regional asymmetries and intra-
bloc inequalities (within the bloc) that exist and that consequently need to be considered
in studies, projects and policies designed for the region.
Finally, the last section deals specifically with energy integration itself (section 2.3).
Being then split into two subsections, the first one deals with the benefits associated with
5 To access Energy Planning contributions, see CHEVALIER (1973), HELM (2002, 2011, 2014), MARTIN
(1974, 1988, 1990, 1992, 2000), PERCEBOIS (1986, 2008),

15
promoting energy integration, as well as its main barriers (subsection 2.3.1). Following
are different market integration modalities (subsection 2.3.2), which are then subdivided
into binational plants (HPP), interruptible flow (opportunity interchange), firm energy
contracting (flow per firm contract), market coupling (loose volume coupling, tight
volume coupling and market splitting. It is a more technical subsection, based on legal,
commercial and regulatory framework, which is too little addressed in the regional energy
integration literature for South American countries6.
2.1 Energy security7
There are various approaches to dealing with energy security. For BUZAN et al. (1998)
and WÆVER (1995, 1998), the security approach generally manifests itself through the
following three steps: (i) threat identification; (ii) emergency action proposal; and (iii)
breaking free of regular rules of security. Ergo, ‘it is by labelling something [as] a security
issue that it becomes one’ (WÆVER, 2004: 13), so the securitization becomes ‘a social
and intersubjective construction’ (TAURECK, 2006: 3).
The concept of energy security comes typically from the 20th century, more precisely
from the period of the oil shocks, when the central concern of the period was the reduction
of dependence on oil imports, particularly in OECD countries (SANTOS, 2015, UNDP,
2009, VIVODA, 2010, YERGIN, 1991). The academic debate ended up weakened with
the stabilization of the oil price (1990s), but it again played a leading role in the countries’
strategic agenda, in particular due to the increasing demand in Asia, the interruptions in
gas supply in Europe and the decarbonisation of energy systems (CHERP and JEWELL,
2014, CHESTER, 2010, HANCOCK and VIVODA, 2014, YERGIN, 2006).
In fact, price and guarantee of demand from primary sources such as oil and gas strongly
influence the literature on energy security (ANG et al., 2015, CHESTER, 2010, IEA,
2013, ISBELL, 2007, JAMASB and POLLITT, 2008, MULLER-KRAENNER, 2008,
SPANJER, 2007, UNDP, 2004, WESLEY, 2007). However, energy security is not
6 On the other hand, it is common to find studies and projects that evaluate these modalities analyzing
different existing European cases, as in BAUMANN (2014) and CRETI et al. (2010). 7 This section comes from a paper published in Energies, December 2017. See: SANTOS et al., 2017b,
“Evaluating Energy Policies Through the Use of a Hybrid Quantitative Indicator-Based Approach: The
Case of Mercosur”, Energies, v. 10, n. 12 (Dec), pp. 2140-2155.

16
limited to this. Therefore, it is essential to understand the concept, especially because it
presents a dynamic definition and dimensions that evolve as circumstances change over
time. In this sense, Chester (2010) sums up the multiple aspects of the term ‘energy
security’, noting that an inherent characteristic of the concept is risk management
(interruption, unavailable power supply, capacity failure, dependence on sources of
unsustainable energy, etc).
VAN DER HOEVEN (2011) reaffirms this argument, arguing that promoting energy
security means mitigating risks and managing the uncertainties related to the future of
energy markets. To that end, KUCHARSKI and UNESAKI (2015) stress that it is
necessary not only to define the energy system but its components and behavior in order
to perceive its vulnerabilities, risks and threats, suggesting the adoption of the complex
adaptative systems (CAS) approach.
However, according to CHERP and JEWELL (2014) the energy security concept should
take into account three main issues: ‘security for whom?’, ‘security for which values?’
and ‘security from what threats?’. Relating it to the concept of securitization, the authors
evaluate how the approach of 4As (availability, accessibility, affordability and
acceptability) influences the understanding of these issues. In raising such questions, the
authors guarantee a more critical reflection of the concept itself, as it makes room for an
analysis of the actors (consumers and producers), values and threats.
KRUYT et al. (2009) emphasize that there are four main elements in the understanding
of energy security, which are: (i) availability of energy; (ii) accessibility; (iii) costs; and
(iv) environmental sustainability. VON HIPPEL et al. (2011) also highlight four variables
that need to be incorporated into the concept, namely: (i) environment; (ii) technology;
(iii) demand side management; and (iv) sociocultural factors.
Thus, it is clear that there are several interpretations and understandings about the concept
of energy security, which has undergone changes since the 1970s. In nearly 50 years, the
International Energy Agency (IEA) has had to incorporate these changes into its own
definitions of energy security. In 1985, it is defined as ‘an adequate supply of energy at a
reasonable cost’ (IEA, 1985: 29); in 2007, however, it is stated that ‘energy security
always consists of both a physical component and a price component, (but) the relative
importance of these depends on market structure’ (IEA, 2007: 32). It is only in 2010,

17
however, that its definition includes ‘while respecting environmental concerns’ (CHERP
and JEWELL, 2014).
Today the agency’s website contains the following definition:
‘the IEA defines energy security as the uninterrupted availability of
energy sources at an affordable price. Energy security has many
aspects: long-term energy security mainly deals with timely
investments to supply energy in line with economic developments and
environmental needs. On the other hand, short-term energy security
focuses on the ability of the energy system to promptly react to sudden
changes in the supply-demand balance.’ (IEA website).
Ergo, it is clear that the environmental and investment question would be exclusively for
the long-term analysis, while the short-term ones focus on the mismatch between supply
and demand.
The World Energy Assessment stresses that energy security is more than just ensuring
the availability of abundant oil reserves at affordable prices, highlighting the need to
analyze the long-term in face of a new economic environment and the promotion of
sustainable development (UNDP, 2000). SIMS et al. (2007) show the relevance of
innovative supply-side technologies, which, by allowing new technologies to become
commercial and competitive, will make it possible to promote the participation of clean
energy at local, regional and global levels. ‘Technology innovation efforts will need to be
complemented by new market designs, new policies and by new financing and business
models, as well as technology transfer’ (IRENA, 2017b: 13).
With regard to the definition of the concept of energy security, there is a significant
tendency to present indicators to evaluate it. VON HIPPEL et al. (2011), VIVODA (2010)
and SOVACOOL (2011), for example, use this methodology to measure and compare the
evolution of energy security in the most diverse countries. In turn, LÖSCHEL et al.
(2010) are the first authors to suggest a differentiation between ex-ante and ex-post
indicators.
As in TONGSOPIT et al. (2016) and YAO and CHANG (2014), the concept of energy
security has evolved over time, addressing new issues such as efficiency, international
relations (cooperation or energy integration), environmental protection and institutional

18
dimensions. The contemporary scope of the concept goes beyond the OECD oil importers
as a proxy for the definition, emphasizing the role of non-state actors, from individual
economies to global production networks (BRIDGE, 2008, CHERP, 2012).
In this sense, there is no consensus on the concept and, consequently, on energy policies,
which vary from energy poverty to climate change (CHERP and JEWELL, 2014).
Therefore, it is not possible to have a single defined and accepted concept about energy
security. Ergo, CHESTER (2010) and VIVODA (2010) define that it is a slippery
concept, that is, hard to define universally, because it is polysemic, multi-dimensional
and context-dependent on the nature of each country/region.
ANG et al. (2015) provide an exhaustive analysis of 104 studies on energy security (peer-
reviewed journals, national agency reports, international organizations, and
business/professional associations) since 2001. They also assess whether a particular
definition is given to the concept of energy security and/or if there is an indicator to
evaluate it, as well as if it takes into account infrastructure, prices, social effects,
environment, governance and efficiency. They perceive that the average number of
studies per year increased during this period and that the percentage of qualitative and
quantitative studies is very similar, with no evidence that the subjects considered in both
groups are different.
The authors state that of the total of the studies analyzed, 80% present definitions on
energy security, without a broad acceptable consensus. Once again, it becomes clear that
it is a highly context-dependent concept, so there are sporadic references to the concept
in an abstract, vague and unfocused way (CHESTER, 2010, ANG et al., 2015), which
reinforces the argument that there is no unifying methodology to the energy security
assessment (TONGSOPIT et al., 2016).
In light of the evolution of the concept of energy security, as well as the complexity of
meanings and methodologies, it is necessary to understand three significant differences
when it comes to this subject:
Classical vs. Contemporary studies: in the 1970s and 1980s, energy security
basically meant the stable supply of cheap oil under threat of embargoes and price
manipulation by exporters (CHERP and JEWELL, 2014, YERGIN, 1988). In this
sense, the concept was very close to national values such as political and economic

19
independence, territorial integrity, sovereignty when formulating policies, and
self-sufficiency in oil. On the other hand, contemporary studies on energy security
incorporate a number of other factors, taking into account climate change
mitigation, regional agreements, equitable provision of energy services, socio-
political stability, climate change and, in general, promoting sustainable
development (CHERP et al., 2014, 2012, GOLDTHAU, 2014, YERGIN, 2006);
Developed vs. Developing countries: ANG et al. (2015) and KANCHANA and
UNESAKI (2014) emphasize the need to take into account the profile and
socioeconomic status of countries when analyzing the concept of energy security.
For more developed countries, the concept represents a resilient energy system
with uninterrupted availability of energy sources at an affordable price (WINZER,
2012) – even for less developed countries, it can be understood as access to
modern energy services (UNDP, 2011). MARTCHAMODOL and KUMAR
(2012: 653), however, extend the concept to developing countries, stating that it
refers to ‘sufficient energy supply (quantity and quality) to meet all requirements
at all times of all citizens in affordable and stable price, and it also leads to sustain
economic performance and poverty alleviation, better quality of life without
harming the environment’. In fact, it is in the developing countries where there
are the majority of energy-intensive industries producing goods (SANWAL,
2010, 2012, 2014), but despite this transition, it is still possible to find energy-
intensive industries in certain developed countries. Precisely because of the focus
of the analysis being on developing countries, such a distinction is fundamentally
important, since they will be responsible for the largest increase in emissions in
the future (SCHÜLLER, 2012); and
Short-term vs. Long-term analysis: generally, in the short and medium-term,
energy security focuses on the impacts of price shocks or unanticipated supply
disruptions, as well as on operational failures; but in the medium-term the
promotion of renewable energies (RE) can be considered to deal with dependence
on oil (KUCHARSKI and UNESAKI, 2015). On the other hand, in the long-term
it is mandatory to consider the demand profile, infrastructure, depletion of
reserves, technological innovation, climate change, adaptability of systems, and
other variables (KUCHARSKI and UNESAKI, 2014, SMIT and WANDEL,
2006). KISEL et al. (2016) suggest that the analysis should be divided into short
and long-term; for them, in the short-term, energy security can be basically

20
measured by the potential that the energy system has to deal with disturbances
(operational resilience), while in the long-term it is necessary to consider (i)
technical resilience and vulnerability; (ii) economic dependence; and (iii) political
affectability – oscillations to (geo)political influences. It is important, however, to
understand that energy policies that may lead to increased energy security in the
short-therm may not guarantee it in long-term (ANG et al., 2015). In the past, for
example, several projects have ensured short-term energy security, assumed as a
guarantee of supply, without necessarily considering their social and
environmental impacts. Itaipu Binacional, energy integration project through
binational dam between Brazil and Paraguay of the 1970s, is an example of such
reality.
In making these considerations, it is necessary to highlight the analysis of the concept of
energy security in the different countries and regions, associating it with the approaches
that fully consider their impacts on social, economic and environmental variables. This
proposal is in line with the argument of the former Secretary-General of the UN, Ban Ki-
Moon, who, taking into account the sustainable development agenda, stated that ‘the
problems we face are interdependent. Poverty, hunger, insecurity, climate change,
environmental degradation, energy scarcity – these challenges demand holistic and
integrated solutions’ (UN NEWS CENTER, 2013). In this way, nothing more appropriate
than treating the subject in an interdisciplinary and integral way. In addition, it is fully in
line with the targets of the sustainable development goal 7 (SDG 7), that seeks to ensure
access to affordable, reliable, sustainable and modern energy for all.
In this sense, the following subsections will stress the challenges to be incorporated into
energy policies, especially when it comes to the analysis of energy security in developing
countries. At the same time, beyond the social and environmental dimensions, there is a
discussion on the benefits of promoting energy security at the regional level, which
challenges the mainstream national logic of addressing the issue. It is thus suggested an
innovative and alternative approach to current policies for the promotion of energy
security, taking into account new dimensions (social and environmental) in the face of a
new (regional) approach.

21
2.1.1 Social dimension
In particular, when analyzing developing countries, it is essential to take into account
regional and national inequalities and asymmetries. Critics have already drawn attention
to social inequalities when using energy indicators for certain regions (TONGSOPIT et
al., 2016)8. To CHERP and JEWELL (2014), for example, a central issue in contemporary
studies of energy security is precisely to identify and explore the relationships between
energy systems and social values.
For developed countries, sustainability focus almost exclusively on environmental issues,
while issues such as poverty and equity are fundamentally important and urgent in
developing countries (KEMMLER and SPRENG, 2007). Ergo, considering social
indicators is essential for developing countries, such as those related to energy poverty
(PEREIRA JÚNIOR et al., 2008, SANTOS et al., 2017a, VERA and LANGLOIS, 2007).
It is therefore clear that energy indicators are not limited exclusively to energy issues
themselves. VIVODA (2010) argues that human security is among the challenges that
need to be incorporated into the new concept of energy security, emphasizing that the
conceptualization of energy security must consider the provision of basic energy services
such as access to electricity.
ANG et al. (2015) highlight the relevance of social issues in countries where energy
poverty or connectivity is a major concern. In the analysis of the Greek energy system,
ANGELIS-DIMAKIS et al. (2012) use three indicators to analyze the social dimension
(percentage of households with access to commercial energy sources, percentage of
household income spent on energy, and share of household expenditures on energy for
each income group). According to IRENA (2017b), it is worth emphasizing that the
approach to this suggested energy transition could fuel economic growth and create new
employment opportunities. Once again, the relationship between the social and energy
dimensions is clear and real.
8 Consumers are the weakest link in the energy chain.

22
2.1.2 Environmental dimension
Some authors take into consideration the issue of environmental impact in understanding
the concept of energy security, as often seen in the analysis of developed countries or in
the medium/long-term general analysis. However, what is ‘environmentally acceptable’
varies among different actors, such as local people, environmental non-governmental
organizations (NGOs), industries, and nation states (CHERP and JEWELL, 2014).
The APERC’s (2007: 6) definition on energy security is ‘the ability of an economy to
guarantee the availability of energy resource in a sustainable and timely manner with the
energy price being at a level that will not adversely affect the economic performance of
the economy’. CHESTER (2010), CHEVALIER (2006), HUGHES (2012),
KANCHANA and UNESAKI (2014), KRUYT et al. (2009), KUCHARSKI and
UNESAKI (2015), TONGSOPIT et al. (2016) and WINZER (2012) are some of the
authors who also consider the environmental and climate change impacts on energy
systems in their studies.
VON HIPPEL et al. (2011) emphasize the need to reformulate energy security policies in
order to allow them to deal with environmental issues such as climate change and global
warming, which may represent one of the main challenges to the traditional (classical
perspetive) thinking of energy security. ANG et al. (2015) argue that sustainability and
environmental issues are directly related to energy security, due to emissions that
contribute to global warming, air pollution and other risks such as forest flooding and oil
spills.
The EUROPEAN COMMISSION9 (2001) and PASQUALETTI and SOVACOOL
(2012) also stress the need to incorporate environmental concerns into energy security. In
developing an energy security index, SOVACOOL (2013) also includes environmental
sustainability as a dimension of energy security, considering indicators such as land use,
water, climate change and pollution.
As ANG et al. (2015) highlight, the weight of social and environmental effects on energy
security definitions has grown significantly, particularly post 2010 – even though they
are only about 40% of the cases analyzed. They evaluate that in recent studies the
9 Environmental protection has been an important part of the European Union’s (EU) energy policy since
its inclusion in the Single European Act of 1986 (LANGSDORF, 2011).

23
environmental dimension occupies the second area most addressed, only behind the
economic one; in turn, the social aspects occupy only the fifth position, behind 4As and
energy supply.
Moreover, the authors perceive that the weight of both themes varies greatly between
official reports, journals and other publications; the environmental theme is cited in about
40% of journals and only about 15% of official reports; in turn, the percentage of social
agenda is 30% and 40%, respectively. Ergo, it is noteworthy to reinforce how the different
sources attribute different weights to the same variables, which once again ratifies the
lack of consensus on the concept of energy security.
With regard to the current global value chains (GVC), with extraction, exploration and
production of a country fragmented in other countries and/or continents, it is essential to
consider the argument of common but differentiated responsibilities (CBDR).
In addition, OBANI and GUPTA (2016) emphasize the need to consider the current
economic recession in major economies in the North, which has several impacts both
domestically and internationally. At the same time that it reduces the anthropogenic
emissions of greenhouse gases (GHGs) in the short-term, it can increase it in the
medium/long-term associated with their recovery. Due to the uncertainty as to the net
result of these movements, as well as to the current scenario of international crisis, many
researchers are studying the effect of the recession on global climate change policy
(SHUM, 2012).
It is also worth noting that developing countries are often even more vulnerable to
environmental pollution due to weak environmental institutions and laws, population
growth, and poverty (LYNCH et al., 2017). In addition, such vulnerability is aggravated
because they have less access to funding for their development needs.
2.1.3 Regional dimension
Indeed, as CHERP and JEWELL (2014) argue, YERGIN’s (1988) classic definition of
energy security does refer to the idea of a purely national concern. This influence, present
in the mainstream of economics and international relations (IR), shaped this issue to

24
become a priority of the national agendas of each country. In this way, they represent
state-centered definitions of the concept of energy security.
Moreover, there is a clear influence of a market-centric definition, which ‘is clearly based
on the pure Walrasian market with its self-equilibrating properties. Markets are assumed
to be cleared through price adjustments’ (CHESTER, 2010: 892). This approach assigns
a limited role to States, a challenge that needs to be revised and overcome.
Therefore, another challenge that should be incorporated into the new concept of energy
security (contemporary perspective) is the consideration of the international question,
since ‘energy security policies must also address international (regional and global)
implications of energy security challenges’ (VIVODA, 2010: 5259). In fact, as stressed
by ANG et al. (2015), CEIA and RIBEIRO (2016), DEPARTMENT OF ENERGY AND
CLIMATE CHANGE (2006), GOLDTHAU and SOVACOOL (2012) and SANTOS and
VARELA (2016), countries have increasingly engaged in foreign policy and energy
diplomacy10 to ensure national energy security from different arrangements with
exporting countries – often neighboring countries.
Ergo, there are few detailed studies on regional11 energy security rather than national
energy security, although it is widely known that ‘interconnections of neighboring grids
(electricity and gas networks) into regional grids greatly enhance energy security’
(UNDP, 2000: 130). Besides, promoting regional energy security reduces costs and
ensures a more efficient use of reserves and electricity.
However, TONGSOPIT et al. (2016) and KANCHANA and UNESAKI (2014) are some
of the few authors who have quantitative studies measuring the evolution of regional
energy security, in the specific case of the Association of Southeast Asian Nations
(ASEAN). Thus, it is mandatory to stress the need to incorporate the regional approach
in energy security studies, given their collective benefits. For the region of South/Latin
America, the work carried out by CIER (2010) and MOURA (2017) stand out.
10 There is no consensus on what the concept actually means. It is mostly used in the geopolitics debate on
access to resources and points to a strategic and instrumental use of foreign policy to secure a country’s
energy supplies (GOLDTHAU, 2010). Energy diplomacy phenomenon is nothing new, but has emerged as
a powerful concept in public discourse. 11 There are fewer studies when dealing with regional agreements/blocs, although there are some that deal
with certain pre-determined regions such as Europe, Latin America, OECD countries, Southeast Asia,
among others.

25
This increased interdependence between producer and consumer countries makes the
classical definition of energy security more challenging. VAN DER HOEVEN (2011)
emphasizes the importance of energy integration in improving performance and reducing
uncertainties, even though the author does not make a proper distinction between this
policy strategy and the international trade of different energy sources. CHESTER (2010)
points out that in the 21st century access to different energy sources depends on a complex
system of global markets, vast cross-border infrastructure, and interdependencies with
financial markets and technology, given the inability of countries to be self-sufficient.
JERVIS (1978), for example, defines that the security of one state reduces the security of
another. Consequently, in view of this ‘security dilemma’, which can also be applied to
the world of energy, it makes sense to rethink an approach to ensure increased regional
energy security. VIVODA (2010) disagrees that the gain of energy security of one state
necessarily represents the loss of others, but also highlights the relevance of the regional
approach remains fundamental. This approach is consistent with KEOHANE and NYE’s
(2001) argument, which suggests the creation of institutions in order to reduce transaction
costs and promote gains in international cooperation.
Notwithstanding, CHESTER (2010) and SANTOS et al. (2016a, 2016b, 2016c) highlight
the risk of political instability when one thinks of regional energy security, as occurred
with the interruption of gas supply in GASBOL12 (between Bolivia and Brazil) and more
recently in Europe13 (Russian gas). It is worth mentioning that hindering or refusing to
sell energy to importing countries is often referred to as ‘energy weapon’ (LÖSCHEL et
al., 2010).
Relating the environmental area to the regional level, LIU, WU and HUANG (2017: 152)
argue that ‘climate change can not be addressed without global cooperation and action,
which in turn depends on an equitable distribution of responsibility’. SANWAL (2012)
12 There was nationalization of Bolivian hydrocarbons (oil and natural gas) by Decree n. 28,701/2006
(‘Héroes del Chaco’), signed by former-president Evo Morales. The case included military occupation of
the refineries, including those of Petrobras, under the allegation that foreign companies earned a lot and
paid little to the Bolivian state. This event led to a crisis in the relationship between Brazil and Bolivia,
especially since the former imported Bolivian gas since 1999 through GASBOL. 13 The European case, as well as the South American one, highlights the vulnerability of the energy security
of the countries to the need to import energy. About 65% of the gas consumed by the European Union (EU)
countries is imported, whose almost half come from Russia – and much of that total has to pass through
Ukraine. Events of disruption in the supply of Russian gas to the EU have already occurred in 2009 and
2014, but more recently the geopolitical crisis following the annexation of the Crimea by Vladimir Putin
has led the EU to review its dependency situation by considering the import of liquefied natural gas (LNG)
from the Middle East or US shale gas.

26
emphasizes that international cooperation was first suggested only in 1972 during the
World Summit on the Human Environment held in Stockholm. In this sense, such authors
rightly defend the need to consider regional cooperation and integration to achieve
sustainable development, which is particularly true for developing countries.
With this section, we hope to have made it clear that the concept of energy security is
time-dependent, space-dependent, fits almost everything and has been (re)framed since
the 1970s. It then represents an old-fashioned, context-dependent and unreliable concept,
but at the same time it has played and continues to play in some contexts an important
role in energy policy14. As the focus of the thesis precisely relies on developing countries
in the South American subcontinent, particularly Mercosur, the need to take into account
social, environmental and regional dimensions stands out.
Social dimension, because in these countries a significant part of the population does not
even have access to electricity, especially in the most isolated and/or rural regions. In
addition, it is important to consider the increase in energy demand in certain countries
(due to a more energy-intensive industrial and residential consumption), what urges the
need to offer and guarantee universal access to energy, a proposition understood as human
right. Environmental dimension, due to a series of international conventions, such as the
recent Paris Agreement and SDG 9, there is a growing need to reduce the use of non-
renewable fossil fuels and to mitigate CO2 emissions. Thus, including both social and
environmental dimensions highlights the close relationship between energy security and
sustainable development.
Regional dimension has done the link between energy security and regional integration,
because both concepts have in their nature the nationalist and state-centric characteristics.
In this way, the thesis proposes an alternative approach to state-centered policies, rooted
in concepts as state sovereignty, energy self-sufficiency and domestic energy planning.
Undoubtedly, the consideration of these three dimensions does not exclude the relevance
of the economic one (traditionally embedded in the concept of energy security).
14 Our objective is not to deny the relevance of the concept, but to present its evolution and its limitations
to discuss the theme in question. In this sense, our idea is to propose the concept of regional energy security
and, to this end, chapter 5 will evaluate the evolution of Mercosur regional energy security since its
formation through the creation of SEES index and OSeMOSYS-SAMBA modeling.

27
2.2 Regional Integration and Mercosur
The main goal of this subsection is to emphasize the time and space of this analysis.
Instead of analyzing this issue from the perspective of a country (state), here an analysis
concerning a group of states (regional blocs) will be carried out. For this purpose, it is
necessary to make some reservations to the concept of regional integration, as well as to
the consequences coming from its multiple interpretations.
First, it is important to highlight the existing confusion in the literature (even the
specialized one) about the real sense of regional integration. Economic Science, Political
Science, Social Sciences, International Relations, Geography, History and Law, for
example, have dramatic ontological, epistemological and methodological differences to
address the issue. Thus, for some it is a question of borders only, while for others it is a
trade agreement, or common social rights/identities, or free transit of people and
goods/services, or even legal harmonization.
In addition, most of the studies on the subject present a state-centric bias, i.e., it analyzes
the cases identifying in the countries (States) the only relevant actors in the process
(LACHER, 2003). Although this approach is limited, as there are other equally important
actors in the different decision-making processes, such as organized civil society, non-
governmental organizations (NGOs), public and private companies, it ends up prevailing
in the different studies and works mainly for the ease of access to data and information15.
In accordance with ECLAC (2009:1) [emphasis added], ‘regional integration is the
process through which different national economies seek mutual benefits, complementing
themselves mutually’ and it can be divided into three distinct categories: (i) economic and
commercial integration; (ii) political integration; and (iii) physical integration16.
There is a long literature that discusses the concept, policies and practices of regional
integration. In advance, it is worth noting that this literature is influenced by a Eurocentric
vision of the consolidation process of the current European Union (EU) (SÖDERBAUM,
15 To some extent, although Chapter 3 deals with subnational issues, the focus of the thesis analysis is
statecentric, so that comparisons can be made with the other studies available in the literature. 16 The existing debate on the relationship between ‘economic/comercial’’, ‘physical’, and ‘political’
integration is deep and interdisciplinary. However, the focus of this project relies on the last one, since it is
the one less present in the literature and because we believe that debates envolving physical integration is
impregnated by political and economic factors (too).

28
2013), as well as being different from the one that discusses international cooperation17,
a concept that is often used as a synonym for regional integration. Specifically regarding
Latin American literature, especially in South American countries, the role played by
presidents is often highlighted (PALESTINI and AGOSTINIS, 2018).
It is clear that integration is a process from the beginning, that is, it is not an end in itself.
Therefore, it is a governance arrangement that allows a group of states to reach an end
goal. ‘Regional integration can be understood as a multifaceted process through which
the promotion of common and joint policies in a given region is aimed at reducing the
region’s asymmetries and inequalities, as well as promoting socioeconomic well-being.”
(SANTOS and DINIZ JÚNIOR, 2017: 23).
Despite the third category listed by ECLAC (2009) being less discussed in the current
literature, it is important to note its intense relationship with the other ones, as well as its
direct impacts on socioeconomic development of countries involved in the process of
regional integration. Therefore, this thesis focus on this ‘traditional type of integration’18,
that is, physical integration, exactly due to this specificity, even because the discussions
on infrastructure investments take place at this level and such investments pave the way
for structural and significant changes in an economy.
However, it is necessary to limit the goals of this research, in order to taper off the topic
to be studied, and as a result, to ensure a great deal of detail in this analysis. In this sense,
within the range of physical integration, there are three main sectors: (i) transportation;
(ii) communications; and (iii) energy. Since ‘energy’ is transversal to all other sectors
mentioned, it is worth making it the target of this research, also due to its externalities
experienced by other sectors of a given economy – such as lowering the cost and price of
energy for the industrial, residential and service sectors.
Besides, the theoretical mainstream on regional integration in South America focus
almost exclusively on the commercial issue and considering this fact we will not focus
on it. Among the most cited works19, BOHARA et al. (2004), BUSTOS (2011), YEATS
17 Regional integration is more related to a long-term project, whose central objective is to promote
collective well-being, reducing regional asymmetries. See BÖRZEL (2016). 18 Unlike the mainstream approach of the theme of physical integration, (geo)political, social, economic
and environmental variables will not be ignored. 19 The research was carried out based on the texts mentioned and, of greater relevance, through the Web of
Science, taking into account the keys “MERCOSUR” and “MERCOSUL”.

29
(1998), OLARREAGA and SOLOAGA (1998), LEIPZIGER et al. (1997) and
FRANKEL et al. (1995) accentuate, once again, only transactions and commercial
policies as proxies for the bloc integration. BOND et al. (2001), for instance, draw a direct
line between deepened regional integration and multilateral trade agreements.
VENABLES (2003) and PUGA (1999), similarly, address only commercial issues when
they, in reality, refer to regional integration20. In this thesis, this approach will not be
followed.
The Common Market of the South (Mercosur) was founded in 1991 through the Treaty
of Asunción (TA), being driven by Brazilian and Argentinian then Presidents Fernando
Collor de Mello and Carlos Menem, respectively. Their main goals were to build up a
common market21 between Argentina, Brazil, Paraguay and Uruguay. Notwithstanding,
it is still worth noting that Mercosur is a direct consequence of a series of old bilateral
agreements between Brazil and Argentina, the return of democracy and liberalization
environment (MECHAM, 2003, SANTOS et al., 2016d). It refers to the concept of the
Latin American Free Trade Association (LAFTA), created in the 1960s, whose successor,
the Latin American Integration Association (LAIA), was founded in the 1980s.
By signing the Treaty of Asunción (TA)22, the idea was that a free-trade zone (FTZ)
would have already been established by the end of 1994 so that, subsequently, a customs
union could be established as well through progressive trade liberalization. In reality, it
is known that intra-bloc trade had significantly increased. The most immediate antecedent
of this block formation was the Brazil-Argentina Integration Act signed in 1986 between
Presidents José Sarney (Brazil) and Raúl Alfonsin (Argentina). Both of them were the
first presidents of their countries after the end of dictatorial regimes. This Act gave birth
20 It is noteworthy that the majority of the (most accessed) works on Latin/South American regional
integration date back to the 1990s and early 2000s when the theme was a regional priority. There is also
evidence of the diversity of calls for papers and journals that insist on this limited relationship between
regional integration and trade, such as the ‘Integration and Trade Journal’ of the Inter-American
Development Bank (IADB). 21 For BALASSA (1961), there would exist a steps notion in order to deepen regional integration, and it
would begin with a Free Trade Zone (FTZ), then it would come a Customs Union, followed by a Common
Market and, last but not least, an Economic and Monetary Union would take place. However, as indicated
by BERNAL-MEZA (2008), when it comes to Mercosur, it is often associated to an imperfect Customs
Union. 22 See: http://www.mercosur.int/innovaportal/file/719/1/CMC_1991_TRATADO_ES_Asuncion.pdf.

30
to the Program of Integration and Economic Cooperation (PICE) that largely influenced
South American integration policy (ARAÚJO, 2012).
Afterwards, the Treaty of Integration, Cooperation, and Development between Brazil and
Argentina was signed in 1988. An important decision adopted in the Protocol of Ouro
Preto (POP)23 was the recognition of the international juridical personality of
MERCOSUR. This recognition gives to this economic bloc the competence to negotiate,
on its own behalf, agreements with third parties, groups of countries and international
organizations.
Mercosur is frequently interpreted from this intergovernmentalist theory, since
institutions at state level prevail, that is, a bloc with no (or few) supranational character.
In this scenario, states resist to the definition and creation of top-down policies, what
gives them higher autonomy when establishing their own domestic policies.
‘“The absence of any supranational procedures keeps nation states as
the sole locus of sovereignty” seems appropriate here and presents
limits to the application of the governance model to Mercosur. In most
cases, the institutions at stake are purely intergovernmental, rather than
supranational, and function according to the principle of unanimity,
thus lacking the autonomy and independence that their European
counterparts enjoy’ (ALMEIDA MEDEIROS, 2004: 93).
It is still worth noting that the geopolitical24 and historic context of that period is very
unusual, impacting the institutional and regulatory framework of the bloc. The countries
of the region had back then used a model of Import Substitution Industrialization (ISI) in
a political scenario of national dictatorships. In this sense, the Washington Consensus in
the 1990s, as well as the redemocratization of the economies, led Mercosur to be known
as a model of ‘open regionalism’ (DOMINGUEZ, 2007, MECHAM, 2003, HIRA, 1998,
ECLAC, 1994).
This means that despite having interest in strengthening the relationship with neighboring
countries, the countries were simultaneously interested in taking advantage of expanding
international flows (trade and investment) above all, as a means of economic recovery
23 See: http://www.mercosur.int/innovaportal/file/721/1/1994_protocoloouropreto_es.pdf. 24 To deepen the relationship between geopolitics, natural resources and energy, see BRUCKMANN
(2016), RODRIGUES (2016), SENHORAS et al. (2009), BECKER (2004) and KLARE (2001).

31
after the “lost decade” (1980). As a consequence, the 1990s saw the spread of free market
economics and democracy, not least in Latin America, where military governments
dissolved. Countries began dismantling state structures, privatizing, deregulating
commercial and financial activities, and opening up their economies. This movement was
accompanied by technological and communications advances, allowing integrated global
product and factor markets to emerge through the movement of goods, services, capital
and even labor (MECHAM, 2003).
This brief introduction on the bloc formation is basically to contextualize the main goal
of this research, since it is not part of its scope to detail the historical formation of
Mercosur. Actually, from this historical review, as well as some critiques already made,
we will be able to better understand the purpose of this work.
Under this outline, it is necessary to grasp why we need to add Venezuela and Bolivia to
the analysis, from now on ‘Mercosur+2’ or ‘Mercosur 6’. SANTOS and SANTOS (2015)
discuss the temporary suspension of Paraguay from Mercosur, when “Mercosur
announced the decision of its Heads of States, in June 29th, 2012, during its 18th Meeting
of the Common Market Council, which took place in the city of Mendoza. Thereupon,
Venezuela joined the bloc in a troubled political scenario (SANTOS et al., 2016).25 Not
to forget, Venezuela was part of another integration initiative in the region, the Andean
Community (AC/CAN)26 until 2006.
Bolivia, on the other hand, ratified its Mercosur membership in July 201527, being even
depicted in the official website of Mercosur among its full members. Also, the following
piece of information is to be found in the official website:
25 ‘It gives continuity to the idea that countries need to be democratic in order to be part of this integration,
what also justifies the turmoil concerning Venezuela’s entrance in Mercosur’ (MARIANO and
RAMANZINI JR., 2012: 34). The Ushuaia Protocol in 1998 highlights the ‘democratic clause’, which
determines that countries that break the democratic rule shall be suspended from the bloc (SANTOS et al., 2017). 26 Despite its troubled political scenario, the country remains in Mercosur since December 1st, 2016. In
accordance with Mercosur’s official website, the Bolivarian Republic of Venezuela is suspended from all
rights and obligations inherent to its status as a State Party to Mercosur, in accordance with the provisions
of the second paragraph of Article 5 of the Ushuaia Protocol. Due to the fact that this is a recent happening
and this is the first time it occurs in the bloc, the country remains in the scope of this thesis. See:
http://www.mercosur.int/innovaportal/file/2485/1/2006_PROTOCOLO_ES_AdhesionVenezuela.pdf. 27 In accordance with Mercosur’s official website, the Protocol of Bolivia’s Accession to Mercosur was
already signed by all the States Parties in 2015 and is now being incorporated by the congresses of the
States Parties. Despite being already considered a full member, this information is not so accurate
throughout the whole website, since it is also found that this country is still on the path of becoming a

32
‘The Plurinational State of Bolivia signed the Protocol of Accession to
the Common Market of the South (Mercosur) on Friday, July 17 [2015]
in Brasilia. (...) The entry of Bolivia reaffirms the consolidation of the
process of integration of South America, based on the mutual
reinforcement and convergence of the different subregional integration
efforts and mechanisms. It also accommodates new trade flows,
productive integration and investments. The Plurinational State of
Bolivia will gradually adopt the normative acquis of Mercosur, no later
than four (4) years from the entry into force of said Protocol.28’.
Even briefly, we mention that there are many different integration initiatives in South
America. As already mentioned, Venezuela used to be part of CAN and Bolivia is still
listed as one of its members. Other projects, as the Initiative for the Integration of the
Regional Infrastructure of South America (IIRSA) and the Union of South American
Nations (USAN/UNASUR) also address, in a way, the energy issue.29 Therefore, this
issue will still be called upon later on in this thesis.
Table 1 presents a series of socioeconomic indicators for Mercosur and each member
country, namely: area (km2), total population (in million of inhabitants), urban population
(% of total population), life expectancy (in years), birth rate (annual average rate/1000
inhabitants), mortality rate (annual average rate/1000 inhabitants), human development
index (HDI), Gini index, gross domestic product (GDP) at current prices (billion of
dollars), global export f.o.b (million of dollars), global import c.i.f. (million of dollars),
and global balance of trade in goods (million of dollars).
member. See: http://www.mercosur.int/innovaportal/file/4054/1/2015_protocolo-adhesion-de-bolivia-al-
mcs_es.pdf. 28 See: http://www.mercosur.int/innovaportal/v/6923/2/innova.front/bolivia-ingresa-al-mercosur. 29 Not only are there projects from IIRSA in Mercosur, but IIRSA has also become a Technical Forum of
USAN recently. The predominant geoeconomic view in the conception of IIRSA should be left aside and
(instead it should exist) a geopolitical concept of regional infrastructure integration comprehending:
mobility and prioritization of the region’s continentality and maritime [potencial], occupation and political,
economic and social cohesion of areas and borders, usage of its resources in favor of an automous
development of South America (PADULA, 2011).

33
Table 1. Socioeconomic indicators for Mercosur countries
Countries Area
(km2)
Population
(Millions of
people)
Urban
Population
(%)
Life
Expectancy
(years)
Birth rate
(per 1,000
people)
Death rate
(per 1,000
people)
HDI Gini
Index
GDP at
Current Prices
(US$ bi)
Merchandise
Exports f.o.b.
(US$ bi)
Merchandise
Imports c.i.f.
(US$ bi)
Ar 2,800,400 43.8 91.9 76.0 17.36 7.57 0.827 42.7 545.5 57.7 55.6
Bo 1,098,580 10.9 68.9 69.0 23.55 7.35 0.674 45.8 33.8 7.0 8.4
Br 8,515,770 207.7 85.9 75.0 14.41 6.09 0.754 51.3 1,796.2 185.3 143.5
Pa 406,752 6.7 59.9 73.0 21.15 5.69 0.697 48.0 27.4 9.4 9.8
Uy 176,220 3.4 95.5 77.0 14.14 9.35 0.795 41.7 52.4 7.0 8.1
Ve 912,050 31.6 89.0 74.0 19.33 5.57 0.767 44.8 482.4 23.930 13.6
Source
(base-year) WB (2017) WB (2016) WB (2016) WB (2015) WB (2015) WB (2015) UNDP
(2015)
WB
(2015)1 WB (2016)2 WB (2016) WB (2016)
Source: Own elaboration based on WB Statistics and UNDP Data; GDP = gross domestic product; HDI = Human Development Index; f.o.b. = free on board (price
of merchandise made available at the place of manufacture or storage); c.i.f. = cost, insurance and freight (price includes merchandise cost and insurance and freight
costs); Merchandise imports and exports in current US$; 1 = Ar (2014) and Ve (2006); 2 = Ve (2014).
30 The value reached US$ 97.4 billion in 2012, when the oil price exceeded US$ 100/barrel.

34
Table 1 shows that there are many differences between the countries within Mercosur, in
terms of area, population and socioeconomic development. Due to these asymmetries, it
is necessary to take into account the social dimension when it comes to (energy) policies
in the region, because mitigating such asymmetries is one of the main goals of any
regional integration process (SANTOS, 2016).
Ergo, based on the historical information and quantitative data presented, it is expected
to have clarified the perspective that the thesis assumes when it comes to regional
integration. Here, regional integration is not political, neither economic/commercial, nor
physical; it is a mix of different perspectives that add up, complement each other, and
often overlap. When discussing regional integration, we do not have in mind just
exchanges and/or trade flows; in fact, we look at geopolitical, institutional, regulatory,
and social issues that are dynamic and therefore transform over time31.
In this sense, it is important to consider the current Mercosur as a consequence of a long
historical process that officially dates from the early 1990s. Although conversations and
prior agreements had already taken place in previous decades, Mercosur is indeed born
with a strong economic and commercial bias, which partly justifies the insistence on this
bilateral relationship (Mercosur-trade) to the present day. Although the social, energy and
environmental agenda, for example, has only advanced more particularly from the mid-
1990s and 2000s on, it is important to emphasize that there can be no progress of regional
integration without political will of governments (SANTOS, 2014a). Thus, regional
integration can be understood as a social phenomenon (NUTI, 2006), needing not only
the public initiative to make it viable and promote it, but the State itself can create the
bases and conditions for the participation of other actors, citizens, non-governmental
organizations (NGOs), private agents, among others.
Considering that, it is important to place this debate within the temporal scope of the
second half of the decade of 2010. In fact, unlike what has occurred especially since the
1990s, regional integration as a political process does not seem to be a priority for the
31 At this point, we insist on not using the term ‘to advance’ or ‘to develop’, because both are embedded in
a unidirectional, positivistic and hierarchical connotation. Here, as already pointed out, we avoid this kind
of approach, even because specialized literature frequently incurs this error. This type of posture almost
makes the European Union (EU) the most advanced and therefore appropriate and correct model to be
followed in most cases – which is not supported by the recently different conflicts and dilemmas that the
EU has been facing, as the pioneering case of Brexit.

35
region. The shaken relations with Venezuela can confirm this, since for the first time in
the history of Mercosur the democratic clause of the Ushuaia Protocol32 is applied to
suspend and withdraw political rights from a state party (SANTOS et al., 2017c). In
addition, especially with the political changes that occurred in Brazil in 2016, it was
evident at different times its interest in making relations in Mercosur more flexible,
raising efforts to make feasible the (old-fashioned) bilateral trade project with the
European Union (EU). More recently, Argentina’s movement of threats to leave Unasur
is also noticeable.
It is important to show that although the literature deals with the case almost exclusively
from an intra-bloc trade perspective, we concluded that Mercosur has undergone
enlargement and deepening processes along almost 30 years of its existance.
‘Enlargement’ in the sense that it had the accession of new States Parties, such as
Venezuela (mid-2012) and Bolivia (in process since 2015), as well as Associated States
(Chile, Colombia, Ecuador, Guyana, Suriname and Peru); thus, all the countries of South
America are part of Mercosur. ‘Deepening’ in the sense that although it originally had its
focus on trade, the bloc’s agenda expanded, touching social, political, environmental and
energy issues, for example.
2.3 Energy integration
After analyzing the issues related to regional integration, understanding it as a
multifaceted and dynamic process, and focusing on the Mercosur case, this section aims
to discuss the particular case of energy integration. Once again, it is important to note that
although energy integration is considered a branch of physical integration33, this thesis
understands that energy integration comprises a set of perspectives, being a physical and
infrastructure theme, but also a political, institutional, economic, social and
environmental one.
32 See:
http://www.mercosur.int/innovaportal/file/4054/1/1998_protocolo_es_ushuaiacomprodemocraticomcs-
bych.pdf. 33 According to the classification of ECLAC (2009). See section 2.2.

36
OXILIA (2009) claims that there is no precise definition on energy integration in the
current literature, suggesting that it should be interpreted as a process that involves at
least two countries and that aims at some activity part of the energy industry through a
permanent installation and based on a specific agreement that guides the relationship rules
between the parties. However, this conceptual definition does not lead to a great deal of
difficulty in coping with this theme, especially if we consider the mutual area of
intersection between energy integration and development. This interface makes this
concept become even broader.
Also, for LIMA and COUTINHO (2006: 363) ‘energy integration and, more widely,
infrastructure integration, represents the cornerstone of a new level of regional
integration’, what is perfectly in line to the central argument of this thesis. In other words,
it is defended that (energy) integration allows a series of positive externalities and benefits
with multiplier effects to take place in other sectors and in the production chain.
Still concerning the debate on the relevance of studying (energy) integration, FUSER
(2011) extends the definition to the goals of energy policies in South America, even
defending its tight relationship with the increase of the standard of living of the
population. Additionally, DIAS LEITE (2007) defends that energy and socioeconomic
development walk hand in hand, having reciprocal impacts and, under this approach, it
would be impossible not to associate such a debate with countries’ joint, long-term
national strategies.
In accordance with SANTOS et al. (2013) and SANTOS (2014a), the states deal with this
sector by taking into account ordinary notions such as energy planning, diversification of
energy matrix, and energy self-sufficiency. We note that such concepts are equally
important when linked to energy security. Particularly, the concept of self-sufficiency
ends up being a great barrier to the promotion of regional energy integration.
As a consequence of the previous section, it was possible to establish that energy
integration must be marked and analyzed not only by commercial energy flows, but also
by institutional, regulatory and political features. In this way, and as in the concept of
energy security, it was identified that there is a lot of resistance to new approaches and

37
methodologies that go beyond the strictly national and state-centric character, by either
academics or policymakers34.
There are several benefits and barriers associated with energy integration. Thus, each of
these benefits, which justify the promotion of this modality of integration, is briefly
presented and discussed below. Then, the obstacles are presented as well, showing the
reason why, despite the associated gains with integration, South America is still at an
embryonic stage35 when it comes to this topic.
2.3.1 Benefits and barriers
The South America region, in contrast to other regions of the world that have already
advanced more in this modality of integration, has a relative cultural-linguistic unity,
absence of ethnic-religious conflicts, greater agricultural area of the globe, ample supply
and diversity of resources natural36, due to the abundance of water, sun and energy
resources (CASTRO et al., 2009).
As already shown, energy integration is capable of stimulating effective regional
integration, since it has externalities and multiplier effects on other sectors of the
economy (ECLAC, 2009, SANTOS, 2014a) and on local industry (PADULA, 2011). In
addition, energy integration is able to reduce regional asymmetries, increasing social
equity (QUEIROZ and VILELA, 2011).
Due to the nature of investments associated with (physical) energy integration, it has a
medium/long term central role in regional development (FUSER, 2011). In addition, it
can be argued that since it does not and can not reproduce what has happened in other
regions, energy integration allows the integration of the region to be based on a ‘proper
view’ of how this process should be carried out (FERRER, 2006).
34 Therefore, evaluating the history of South American energy integration may mean for many to analyze
the failure of energy integration in the region. 35 The energy exchange is less than 5% of the generation of 2014, of which 93% responds to Paraguay’s
exports through its binational dams. There are interconnection infrastructures with very low utilization and
difficulties to increase the levels of interchange (CIER, 2016a). 36 The region has a rich range of energy resources but is unevenly distributed. Ergo, regional energy
integration could optimize the use of these resources (CIER, 2017c). It can also be facilitated by the absence
of major geopolitical conflicts in the region (RAMOS, 2016).
38
Given the growing need to consider different actors and institutions in the decision-
making process, especially when dealing with regional and/or subcontinental projects, the
promotion of energy integration (of Mercosur) needs to incorporate new agents into
decisions (SANTOS, 2014a). Among them, we can highlight local governments, the
private sector and the populations involved in project areas.
Particularly when it comes to integration and energy in the region, we can highlight the
existence of a diversity of multilateral entities that deal with the theme (SANTOS, 2014a,
SALOMÃO and DA SILVA, 2008), such as: Latin American Integration Association
LAIA/ALADI), the Union of South American Nations (UNASUR) and its South
American Energy Council (CES), the Initiative for the Integration of Regional
Infrastructure in South America (IIRSA), the Latin American Energy Organization
(OLADE)37, the Regional Energy Integration Commission (CIER), the Economic
Commission for Latin America and the Caribbean (ECLAC), the Andean Community of
Nations (AC/CAN), and the Common Market of the South (Mercosur) through the
Mercosur Structural Convergence Fund (FOCEM). UDAETA et al. (2016) also add the
role of Regional Association of Oil, Gas and Biofuels Sector Companies in Latin America
and Caribbean (ARPEL) and Latin American Integration Association (LAIA).
It is clear that one of the main arguments for the promotion of regional energy integration
in any region is to guarantee energy security and increase the reliability of the system
(CASTRO et al., 2015, MOREIRA and PINTO, 2013). In this sense, the countries
involved in the project would be able to deal with common demands and bottlenecks
(BERNI, MANDUCA and BAJAY, 2013), based on mutual gains. To do so, they would
need to work on a coordinated and cooperative logic (OXILIA, 2009). It would promote
economies of scale38 in the region and stimulate the more efficient allocation of (scarce)
resources, creating favorable conditions for the business environment and productive
37 OLADE defines energy integration as any process or project that involves a long-term installation,
interconnection or transaction, either binational or multinational, supported by coordinated national
policies, based on a common regulatory framework, focused on a more efficient use of energy resources or
infrastructure and aimed at meeting energy requirements regardless of the geographical location of the
different centers of supply and demand (OLADE, 2017). 38 Increasing the scale may allow the monetization of resources that until 10 years ago were not suitable to
be used on large scale, like wind and solar energies. In addition, it could provide a better use of renewable
energies (CARRASCO, 2017).

39
investment in the energy sector, as well as encouraging regional joint energy planning
(RAMOS, 2016, SANTOS, 2014a, 2014b).
Once again based on economic justification, and linked to the previous one, it is argued
that regional energy integration guarantees the joint and more rational use of shared
natural resources, existing facilities (CARRASCO, 2017) and investments to be made39
(BIATO, 2016, CEIA and RIBEIRO, 2016, CASTRO, 2011, LUYO, 2011, CAMPOS et
al., 2010, QUEIROZ and VILELA, 2010), offering a more efficient service, of higher
quality and with lower cost (CIER, 2016b, PADULA, 2011). This argument is
particularly important if one considers the importance of sustainable development40, the
fact that the direct consequence of this benefit is the reduction of operating and production
costs (ISA, 2016, RAMOS, 2016, WEINTRAUB, 2008), as well as the possible reduction
of tariffs41, precisely relevent when it comes to developing countries, which may affect
the demand for this resource.
In the case of countries in South America, particularly the Mercosur countries, the
possibility of exploring synergies derived from hydrological complementarity, as well as
different sources, has been highlighted (PAREDES et al., 2017, MOURA, 2017,
RAMOS, 2016, ZANETTE, 2013, CASTRO et. al., 2011, 2012). Thus, there is evidence
of a strong complementarity between the different pluviometric regimes in the region,
which suggests the joint planning of the dispatch of hydroelectric dams, construction of
new ventures and joint management of decision-making.
Again, in the context of South America and particularly the Southern Cone, there is a
diversity of financial sources coming from regional and international financial institutions
that have, among their portfolio of projects, those involved in the issue of energy
integration (PADULA, 2011, SANTOS, 2014a). Among them are the following: the
39 Equally, the integration in terms of energy equity helps the purpose of savings by allowing to postpone
investments in generation, to take advantage of the benefits of hydrological complementarity and resources
of the energy matrix, and to reduce operational costs to be able to transfer these savings to the final
consumer (CIER, 2016b). Therefore, investing heavily in a sector or seeking inefficient solutions will limit
the resources allocated to other areas such as health, education and other communication infrastructures,
such as roads, ports, etc. It would be a bad use from the social point of view, a loss of value and would also
delay the development (CARRASCO, 2017). 40 In the VII Latin American and Caribbean Seminar on Energy Efficiency, April 2016, in Montevideo
(Uruguay), the Executive Director of CIER, Eng. Juan José Carrasco, highlighted the importance of energy
efficiency as a pillar for sustainable development (CIER, 2016a). 41The most affordable price of energy allows a better level of international competitiveness and insertion
of the countries of the region (MAYA, 2015).

40
Inter-American Development Bank (IADB), the World Bank (WB) and its International
Finance Corporation (IFC), the Venezuela Economic and Social Development Bank
(BANDES), the Brazilian Development Bank (BNDES), the Development Bank of Latin
America/ Andean Development Corporation (CAF), the Economic Commission for Latin
America and the Caribbean (ECLAC), the Financial Fund for the Development of the Río
de Plata Basin (FONPLATA), Common Market of the South (Mercosur), through
FOCEM, and Latin American Energy Organization (OLADE)42.
It is important to consider that energy integration, as joint regional planning by states, can
(and should) prioritize renewable sources, including the incorporation of Non-
Conventional Renewable Energy (NCRE)43. This is especially possible and feasible in
Mercosur countries, given the profile of their energy matrix, therefore energy integration
in these terms can contribute to reduce CO2 emissions and fight against climate change
(CIER, 2016b, RAMOS, 2016).
Often in the literature, it is stressed the importance of Brazil44 in the region’s energy
integration process. This should be due to (i) being the largest energy market in the region,
with a consistent economic model for expanding production capacity; (ii) having borders
with 10 of the 12 countries in South America; and (iii) its previous expertise in national
energy integration, with the creation of the National Interconnected System (SIN)45
(BIATO et al., 2016).
This integration of Brazilian submarkets allowed savings of around 20% of investments
(MOREIRA and PINTO, 2013). Likewise, it should be mentioned that Brazil also has
42 More recently, it is worth noting the Chinese project known as ‘One Belt, One Road’, as well as the
country’s closer ties with countries in the region, such as Chile and Bolivia, through the Asian Infrastructure
Investment Bank (AIIB). See: https://www.telesurtv.net/english/news/Asia-and-Latin-America-Strenthen-
Economic-Ties-20170513-0003.html. 43 They have less social and environmental impact, such as the generation of energy from biomass, SHPs,
wind, solar, tidal energy, geothermal. The following are some examples of NCRE projects: biomass
cogeneration plants, plants organic waste, wind farms, small hydro passing, solar plants. 44 For many authors, Brazil would be the ‘natural candidate’ for regional leadership (MALAMUD and
SCHMITTER, 2011). It is worth mentioning that the country in fact tried to break the inertia of the regional
integration agenda with the launch of the Union of South American Nations (UNASUR) in 2008. 45 In addition to its privileged geographic location in the South American subcontinent, the Brazilian
Electric System (BES/SEB) presents a consistent and dynamic model, with very solid institutional and
economic bases and an efficient financing pattern (CASTRO, 2010). It is worth mentioning that SIN is the
largest interconnected transmission system in the world.

41
some interconnections with the neighboring countries' electricity system (MOURA et al.,
2012), which will be better presented and discussed in Chapter 3.
Notwithstanding, QUEIROZ et al. (2013) emphasize that the regional predominance in
terms of strategic resources and political power leads to a questioning and distrust of its
neighbors when it comes to Brazil’s potential hegemony in the subcontinent. Ergo, they
argue that, on the one hand, there was a greater political interest during Lula’s
governments (2003-2010) on the Union of South American Nations (UNASUR), the
Initiative for the Integration of Regional Infrastructure in South America (IIRSA) and the
investments of the Brazilian Development Bank (BNDES) and Bank of Brazil (BB) in
the sector. On the other hand, this led to an increasing fear concerning Brazil’s power in
the region46, what jeopardizes Mercosur’s own progress (BIATO, CASTRO and
ROSENTAL, 2016), since it brings to the surface the fear of other countries that would
have to operate under the aegis of a regional sub-imperialist Brazilian logic.
In this sense, the obstacles to regional energy integration begin to appear. In addition to
the issue of Brazilian hegemony in the region, there is a significant lack of convergence
and consensus on political, macroeconomic and microeconomic issues, which makes any
regional integration initiative a major challenge (BAER, CAVALCANTI and SILVA,
2002, CARRANZA, 2003, BIATO, 2016, SANTOS, 2014a). This reality ends up being
reflected in the asymmetry of development and technical and technological power
between Brazil and its neighbors, especially the smaller ones (BIATO, CASTRO and
ROSENTAL, 2016).
An obstacle to this broader integration process is the Brazilian commercial model applied
since 2004, since it relies on the sale of electricity certificates (physical guarantee),
defining a closed, planned and operated model in an optimized and centralized way. It is
not trivial to incorporate into this model the energy imported from other countries, unless
there is contractual and legal security to consider it in the long-term Brazilian energy
planning.
46 With the great participation of Brazilian banks, companies and contractors in these projects, there are
inevitably questions about the (real) intentions and Brazilian objectives with these integration projects. The
term ‘regional sub-imperialism’ (MARINI, 2012) and/or ‘bandeirantes de la XXI century’ (BIATO, 2016)
is often found in the literature on regional integration, especially among non-Brazilian Latin researchers.

42
In general, there are institutional and regulatory asymmetries that make the
implementation of energy integration projects in the region too complex and costly
(CASTRO, 2009, CEIA and RIBEIRO, 2016, QUEIROZ et al., 2013). This complexity
and diversity should be reduced in order to minimize economic uncertainties, legal
insecurities and political risks (FUSER, 2011, SOLOMÃO and DA SILVA, 2008).
Since the regulatory framework of South American countries was based on different
experiences in time and space, the current model presented by each country is quite
different, especially regarding the environment, opening up to private (and foreign)
capital and strategic planning of the sector (SANTOS, 2014a, VÉLEZ, 2005).
Consequently, institutional conditions in the region still have a major influence over the
technical, commercial and contractual relations in the integration process (QUEIROZ and
VILELA, 2010).
In this sense, these authors present some cases that clearly show the risk associated with
this obstacle: (i) the change in gas sales in Bolivia, in 2006; (ii) the interruption of
Argentina’s 2,000 MW supply, in 2007; (iii) the renegotiation of the Itaipu agreement,
requested by Paraguay; (iv) the rationing of energy in Venezuela, with consequences for
the supply of energy in Roraima; and (v) the drastic reduction in the supply of Argentine
natural gas to Chile.
The harmonization of these regulatory asymmetries has been fundamental since the
earliest stages of energy integration, when it seeked to establish common and clear trading
rules for participating countries in order to promote the energy sector’s own dynamics
(MOREIRA and PINTO, 2013, ZANETTE, 2013).
Related to that obstacle, the fear of loss of national sovereignty and political distrust are
at the root of any regional integration initiatives, particularly those that touch on sensitive
issues such as infrastructure and legal, regulatory and regulatory arrangements (BIATO,
2016). Specifically concerning the issue of energy, this fear is evident in national energy
plans, in which terms such as energy self-sufficiency and national energy sovereignty and
energy security are the priorities of every country (SANTOS, 2014a, 2014b). ‘The major
obstacle to the development of new supplies is not geology but what happens above
ground: namely, international affairs, politics, decision-making by governments (...)’
(YERGIN, 2006: 74).

43
Thus, in a similar way to what happened in Europe, it is necessary to create common
political foundations to facilitate and encourage regional energy integration. Therefore,
as electricity is a fundamental input for production of goods and services, in addition to
guaranteeing the social well-being of families, trust based on consistent political
arrangements can give the guarantees that countries need (CASTRO, 2016).
In order to avoid political risks and ‘loss of sovereignty’ in the majority of extra-national
energy projects, countries seek to promote enterprises of binational nature47. However,
the logic of these actions has almost always been subordinated to the interests of national
energy planning and not to an integrated and systemic policy for the whole region; in
other words, each country individually designs its annual energy plan, its investment
prospects, and its short/medium term interests (SANTOS, 2014a, 2014b). Despite this
hurdle, RAMOS (2016) argues that regional planning should contemplate and respect the
autonomy of the energy policies of each country, so it suggests the establishment of a
flexible commercial scheme.48.
Although in South America there is the hydroelectric plant of Salto Grande on the
Uruguay River (Ar-Uy), Itaipu on the Paraná River (Br-Py) and Yacyretá on the Paraná
River (Ar-Py) as an example of large dams (SANTOS and SANTOS, 2016, QUEIROZ
and VILELA, 2010, UDAEDA et al., 2006), it should be noted that the strong binational
profile of most of the bolder projects concerning regional energy integration can be
considered as an obstacle to effective regional/multilateral energy integration
(BERTINAT and ARELOVICH, 2012, BIATO, 2016, MOREIRA and PINTO, 2013,
SANTOS, 2014b, SENNES and PEDROTTI, 2008), but it can also be assumed as an
intermediary step for this. Most of the time, these projects are born through international
bilateral treaties, which are difficult to be legitimized (RAMOS, 2016).
Although the existence of different sources of financing can be considered as a facilitator
for regional energy integration, the cost of such loans may actually make the financing
issue a barrier (ARELOVICH, 2012, CARRASCO, 2017). It is worth mentioning that
47 ‘In South America, infrastructure constructions interconnecting the network industries of different
countries were historically based on bilateral (binational) commitments. Thus, bilateral commitments can
be considered as the basis of the institutional framework of the construction of infrastructures existing in
South America.’ (HALLACK, 2014: 354). 48 Ergo, it is necessary to evaluate the existing trade-off between prioritization of regional planning vs.
national one, as they may shock or even be incompatible.

44
ventures in the energy sector often require large initial investments, which only have
medium/long term returns (long payback).
However, since they are developing countries, they tend to have higher country risk,
which means that interest rates on loans are higher. Thus, in order to deepen South
American energy integration, it is necessary to face project financing, which should have
lower interest rates, longer paybacks, and more flexible conditionalities (SANTOS,
2014a).
Information and technological issues can also constitute barriers and obstacles to full
regional energy integration. Information on net future demand forecast, futures markets
and price estimates are basic and necessary prerequisites for national markets to be
included in a regional one (ZANETTE, 2013). Different technologies can also pose
difficulties when (i) there are differences between countries that generate, transmit and
distribute electricity at different frequencies (50Hz or 60Hz in South America); (ii)
several countries have borders on the Andes or the Amazon Rainforest, being separated
from their neighbors by geographical obstacles and/or demographic voids with a large
territorial extension; and (iii) coincidentally in the Mercosur countries, the exchange
(imports or exports) of energy with Brazilian market depends on frequency conversion.
Climatic adversities can particularly affect the hydrological regime, changing the
pluviometric regime and consequently damaging the generation of energy in the turbines
of the hydroelectric plants (CASTRO, 2010, 2011). Therefore, meteorological
uncertainty especially affects countries whose share of hydroelectric production is
significant (LANDAU, 2008a, 2008b) – as is the case of Brazil, Colombia and Paraguay.
The Brazilian blackout (power outage) of 2001 is an exemplary case of how poor resource
management and the lack of internal interconnection to promote supply in scarce areas
pose a real risk to the security of energy supply. In this way, regional energy integration
represents an alternative to energy security, since it increases the reliability and quality
of the system, reducing emergency risks and blackouts (CIER, 2016b).
The environmental issue is considered by many to be an obstacle to the advancement of
regional energy projects, either because they make the creation of certain hydropower
plants more expensive or even impossible. However, it is important to consider that South
America has the Amazon region, the current exploitation center for hydroelectric
potential. At the same time, in addition to the environmental issue itself, there is a social

45
issue associated with it in the region, since there are several riverine, indigenous and local
populations that are directly or indirectly affected by such projects. In this sense,
‘Serious damages caused by the implementation of power plants on
traditional populations of the Brazilian Amazon (Tucuruí, Balbina),
Chile (Bio Bio) and Colombia (Arru) are equally known. Binational
projects did not escape the same problem, such as the problems seen in
Yaciretá and even in Itaipu where the situation of Guarani Oco’y
remains unresolved.’ (VAINER and NUTI, 2008 apud CEIA and
RIBEIRO, 2016: 145)
Briefly, ISA (2016) points out that the key factors for regional energy integration can be
framed in the 5Rs methodology49. (i) Resources: to take advantage of available
complementarities (hydrology, demand, etc.); (ii) Rules: to make agreements and basic
harmonization of regulatory and regulatory frameworks; (iii) Networks: to develop
transmission infrastructure in a coordinated manner with national planning; (iv) Support
from governments: to ensure will and commitment, backed by policies and agreements;
and (v) Regional vision: to deepen processes of cooperation and energy integration in the
region. It is also emphasized that self-supply does not necessarily aim at optimization,
and should not lead to the protection of energy resources, what is completely in line with
thesis argument.
Recently, changes in the electric scenario have added challenges to the energy integration
of the countries, constituting great challenges even for modeling, such as ‘(i) the growing
and large scale participation of renewable sources, especially the intermittent ones; (ii)
contingency of the power source due to environmental restrictions; (iii) the strong
presence of distributed generation; and (iv) the advancement of Smart Grids in
distribution systems.’ (RAMOS, 2016: 73-74). Also noteworthy is the difficulty to
consider the storage of energy, such as batteries50, which leads to the need to consider
new technical, commercial and regulatory aspects that must be taken into account,
affecting the business model and the tariff structure (CIER, 2016b). Indeed, the increment
49 It makes sense only in Portuguese or Spanish, as resources, rules, networks, government support and
regional vision mean Regras (reglas), Redes, Respaldo dos governos (respaldo de los gobiernos) and visão
Regional (visión regional). 50 For users, they guarantee for example the increase in reliability, the increase in the quality of energy, the
reduction of the number of interruptions, the efficient use of energy, the lower cost of energy, the use of
renewable energies, and the decrease of polluting emissions. For distributors, for instance, they allow the
reduction of losses, free system capacity and decrease in investment (CIER, 2016b).

46
of new renewable sources (such as wind, solar and biomass) and the introduction of new
non-renewable sources (such as shale gas and LNG), as well as new configurations by
the demand side (energy efficiency, electric vehicle, smart grid and distributed
generation) are challenges to integrated regional energy planning.
As ‘side effects’, energy integration can lead to reduced energy self-sufficiency (energy
interdependence) and the operational autonomy of systems, which is one of the main
resistance to its implementation. Moreover, given the need for harmonization of
regulatory frameworks, the complexity of defining legal frameworks, treaties, norms and
rules, as well as possible shocks in diplomatic relations between countries, should be
highlighted. It is also possible to stress the increase in risks related to changes in the
previously agreed conditions, through interventions by governments, such as through the
definition of new legislation and taxation (subsidies and administered prices) and the
expropriation of assets.
These obstacles are reflected in the loss of energy and dynamism of the forums
responsible for the regional (energy) integration agenda, in particular in the Common
Market of the South (Mercosur) and in the Union of South American Nations (UNASUR).
Without political will, the project has no support and strength to overcome national
demands of each country (RAMOS, 2016, SANTOS, 2014a). On the other hand, when
there is political will, the regulatory frameworks will be adjusted to guarantee the most
economic and safe operation of the systems (CIER, 2016b).
From the existence of different benefits and barriers to energy integration in Mercosur,
we established that it would be necessary to deal with issues of commercial, operational
and institutional natures. Events such as nationalization of assets (Bolivia and
Venezuela), interruption of contracted energy supply (Argentina to Chile, and Venezuela
to Roraima, and Petrocaribe) and request for renegotiation of the agreement signed
(Paraguay for Brazil, in the case of Itaipu) created a bad and pessimistic history for the
advancement of the process. In addition, the relative abundance of energy resources of
the countries of the region does not push for integration, leading to (i) sub-optimal
exploitation of these resources; (ii) overestimation of the need for investments; and (iii)
underutilization of existing facilities and opportunities.
With regards to commercial nature, it is necessary to facilitate international energy
exchange and to consider risk management, especially in long-term contracts; with regard

47
to the operational nature, it is necessary to consider the regional planning and the technical
peculiarities of each market; regarding the institutional nature, it is essential to promote
regulatory harmonization and to develop regional energy alliances and treaties. We then
conclude that all these issues, in a progressive way, will guarantee the legal certainty,
credibility and transparency necessary for the execution of the projects, whose profile is
generally capital intensive and long term.
2.3.2 Market integration modalities
The main purpose of this subsection is to present the different modalities of market
integration, in order to find out which would be ideal in the case of the Mercosur countries
and South America in general. In this way, and without intending to make a deep
institutionalist analysis of theories of regional integration, it will be seen that different
modalities pass between two extremes, which can be identified with the
intergovernmentalist model and the neo-functionalist model.
Before evaluating each case, it is important to establish what is meant by institutions in
this work. By institutions it is understood a normative set oriented to certain objectives,
as well as the instruments that guarantee its execution, in order to direct the individual
behavior in a certain direction (KEGEL and AMAL, 2012). In this sense, they would
constitute the restrictions created by the societies themselves, which define the limits
where exchanges and individual choices occur, establishing rights, prohibitions and
sanctions provided by law and social conventions.
Ergo, institutions reduce uncertainties, stimulate cooperation and improve economic
coordination; at the international level, create an environment of greater predictability
and security in international relations and thus overcome problems of cooperation
between States. In both cases, they generate greater confidence over information and align
mutual expectations of agents (SANTOS, 2014a).
In a simplified way, the institutional framework based on the neofunctional model has a
strong supranational character, that is, there is a transfer of power from the countries
involved to a higher level. This is the case of some European Union (EU) institutions,
which restrict and impose targets, policies and rules on countries participating in the
regional bloc. On the other hand, the intergovernmental model has strong autonomy and

48
independence of the parties involved, so there is no assignment of sovereignty in favor of
a supranational body responsible for a top-down decision making. This case is closer to
the institutions part of Latin American integration models, where states, due to a colonial
and more recently dictatorial past, resist relinquishing national sovereignty to
supranational decision-makers.
Although there may be different possibilities for institutional arrangements in energy and
various aspects that determine the integration model (legal, political, commercial,
technical, institutional, geographical, etc.), as it has already been said, the integration
depends above all on political will. Therefore, it requires the acceptance of commitments
where regional gains prevail over national interests, thus overcoming the tension between
integration and sovereignty.
Since the second half of the 20th century, mainly since the late 1960s, joint projects have
been developed in the energy area, the oldest being the Itaipu Binacional and the energy
interconnection of Acaray, both projects carried out between Brazil and Paraguay. At the
same time, in the early 1970s, other projects were conducted, such as the construction of
the Yacyretá Binational Plant, involving Argentina and Uruguay.
From a historical point of view, the evolution of the energy markets of the region took
place as follows: (i) 1980s: the first integration works are consolidated, initiating the
relationship between agents from different countries. Basically of binational character,
the State corresponded to the exclusive responsible for the development of the sector,
assuming that the electric industry was a natural monopoly; (ii) 1990s: with the
macroeconomic and regulatory reforms, emphasis is placed on the economic efficiency
of the enterprises. Ergo, there is a request for new investments, as well as private
participation in them; and (iii) 2000s: the decade represents a significant shift in the
orientation of some countries. Consequently, there is less openness in the energy sector,
changes in certain regulatory guidelines and inclusion of subsidies. The need to ensure
security of supply as well as to reduce energy dependency is emphasized.
Thanks to the changing profile of the integration of energy markets, there is confusion
about the concepts of energy integration and cooperation, which makes these terms used
as synonyms in the literature51. In this thesis, energy cooperation corresponds to an
51 Such confusion is not limited to the energy issue, but is particularly frequent in the economic and physical
approaches to integration.

49
(intermediate) stage of the regional (energy) integration process, according to the model
theorized by ISA as indicated in the figure below.
Figure 2. Expected evolution of energy markets integration
Source: Adapted from ISA (2007); * TIE = International Energy Transactions.
Based on Figure 2, it is noted that the first four moments of the regional energy
integration process formulated (steps 0 to 3) deal with national markets that progressively
build physical interconnections between countries, and then, by the coordinated dispatch
and then integrated dispatch among them. So far, there have been distinct forms of energy
cooperation between countries; however, the next stage, that of ‘regional integration’
(step 4), which is marked by the presence of regional operator, regional administrator and
regional agents, is shaped by the existence of a regional market.
According to RUIZ-CARO (2006, 2010), it is possible to identify three types of
(economic) benefits in electric interconnection enterprises, namely: (i) Construction of
binational hydroelectric plants: they started operating around 1980 and were built by state
companies (whose costs and investments were recovered through the remuneration of the
energy generated by the plants); (ii) Firm energy sales: assures the company that sells a

50
flow of resources to cover the costs and financing of interconnection works; to the
company that buys, it assures the guarantee of supply of its demand; and (iii) Opportunity
exchange: takes advantage of marginal cost differences between interconnected systems,
without excluding the possibility of (longer term) contracts.
According to BIATO et al. (2016), there are three main modalities of energy integration
in the region. The first group incorporates binational hydroelectric dams, being less
advanced. The second group is intermediate and “only involves power purchase and sale
agreements on the spot market. It does not establish synergies capable of levering more
ambitious projects or initiatives, thus being limited to meet emergency needs and
demands with flexibility” (Ibid.: 65). The third group does not involve joint ventures, but
aim to export/import electricity through medium and long-term contracts.
Figure 3 below shows the evolution of energy markets integration suggested by Altieri
(2015). The further to the right, the more advanced is the process of integration of the
energy systems of the region.
Figure 3. Evolution of energy markets integration
Source: ALTIERI (2015)
RAMOS (2016) points out that there are two modalities of market integration: (i)
construction of binational plants; and (ii) electric interconnection between markets. The

51
first is the most used in the region, when two countries build a (border) plant for strategic,
geopolitical and/or economic reasons. This is the case of Itaipu (Br-Py, 14 GW), Salto
Grande (Ar-Uy, 1,9 GW) and Yacyretá (Ay-Py, 3,1 GW)52, in which the country with the
largest consumer market often leverages the project and, most of the time, fulfills the role
of economic viabilizer of the enterprise, guaranteeing its financing.53
These examples refer to ‘conventional’ binational dams, but there may also be joint uses
located entirely within a single country (‘non-conventional’ binational dams). This is the
case of ventures such as in Bolivia (Rio Madeira and Cachuela Esperanza) and Peru
(Inambari), since both countries lack scale in order to enable explotation and the
economic feasibility of the respective projects. However, as shown, the integration
through the construction of binational power plants can be assumed as an obstacle to the
effective integration of regional electric markets.
In turn, the electric interconnection between markets has more long-term character and
can be divided into four types. Despite its particularities, advantages and drawbacks, all
seek the same end, which is to allocate scarce cross border grid capacity in the most
efficient way (ONDŘICH, 2014).
Opportunity Interchange (interruptible flow) is the first stage, when the volume and price
offer is interruptible, usually ‘for a determined period with very specific conditions
related to the source to be provided and pre-established commercial conditions.’
(RAMOS, 2016: 81). It is then an exceptional and conjunctural energy exchange, thus
vulnerable to the momentary interests of countries involved. In every energy exchange,
economic and regulatory negotiations need to be (re)evaluated, what reduces the
dynamism of the negotiations, without substantially and structurally affecting the energy
balance of the countries involved.
The second stage of the electrical interconnection of markets is Firm Energy Contracting
(flow per firm contract), when the parties involved define bilateral contracts. ‘In Brazil,
contracting could be made in the Free Hiring Environment (ACL) or the Regulated Hiring
Environment (ACR). In ACR the transaction would be mandatorily made through
52 The presentation of binational plants and international energy interconnections in South America will be
made in Chapter 3. Appendix B presents the Central American international interconnections, as well as
the Central American Electrical Interconnection System (SIEPAC). 53 The country that provides the financing often receives reimbursement in the form of energy (or abatement
of the cost of the fee paid).

52
centralised auctions aiming to serve Utility Companies.’ (Ibid.: 94). Auctions can happen
either for new energy (longer periods) or existing energy (shorter periods).
In this case, there is influence on the price by the Short-Term Market (MCP) of each
country due to this amount of firm energy. In this way, it is up to each country to define
the price in the MCP and how to incorporate this amount into consideration. In addition,
there is more exposure and vulnerability on the exporter side, since much of the trade
rules (structure and regulation negotiation) is defined by the importer country, and it is
subject to possible penalties.
Unlike the previous case, Firm Energy Contracting already requires greater coordination
between the energy planning of the countries involved during the contract period, despite
the autonomy they still have.
Advancing in the market integration modalities, Market Coupling represents the third
stage of the electric interconnection of markets. ‘Market coupling is defined as the use of
implicit auctioning involving two or more power exchanges (PXs).’ (BAUMANN, 2014:
30). It is possible to affirm that some of its advantages are in being economically efficient,
and also provide regional incentives. Some of its drawbacks is the absence of incentive
for Transmission System Operator (TSO) to expand capacity (VAN BLIJSWIJK and DE
VRIES, 2011).
Besides, ‘the countries involved (…) shall demand at least a minimum regulatory
harmonisation when considering the energy volumes and short-term price formation of
each country, as well as volumes offered and demanded, and energy planning.’ (RAMOS,
2016: 82). It is important to stress that with not enough interconnections, ‘there will not
be a single price between the coupled countries. (...) Prices between countries will differ
for as long as bottlenecks in the transmission systems and in particular on interconnectors
remain, even after market coupling.’ (ONDŘICH, 2014).
There are three different kinds of coupling markets, the first two ones are volume-related
and the last one is price-related. Volume coupling can be defined as a ‘coordinated day-
ahead auction involving two or more power markets [where] cross-border volumes
computed by an Auction Office are transferred to the power exchanges, which consider
them as price inelastic bids into their local system.’ (ENTSO-E, 2010: 2). This form of
implicit allocation has a ‘more humble’ objective than price coupling (JANSSEN et al.,

53
2012), allowing the coupled markets to stay more independent while being coupled
(GLACHANT, 2010).
The first kind of volume coupling is the Loose Volume Coupling. In this case, ‘the volume
traded between two countries or regions is calculated in a first step and then prices are
calculated separately in a second step.’ (BAUMANN, 2014: 31).
‘Each country defines its curve relating the Marginal Cost of Operation
(CMO) and interchange (export or import curve) with price and
quantity offers. A single and common algorithm between countries
crosses export and import offers and sets the interchange flow. Thus,
each country shall be entitled to internalise the results of this singly
algorithm in the short-term market pricing, as well as commercial and
regulatory discounts in its models.’ (RAMOS, 2016: 95).
As one can imagine, in order to carry out coordinated studies, it is necessary that countries
have free access to the electromagnetic data of all others involved. Therefore, each
country must act in a non-discriminatory way between the companies that make up the
coupling so that the relationship can be reliable and lasting54.
The second kind of coupling markets is the Tight Volume Coupling.
‘[It] implies a coordinated dispatch among countries, and the
interchange is defined through a single computational model based on
simplified systems information. Each operator internalises the
interchange flow in its model and sets prices for the short-term market
in this approach. Transactions occur in each country’s short-term
market and, obviously, respect the commercial rules of the country in
which the amount is being settled. This allows national energy policies
to remain autonomous.’ (RAMOS, 2016: 83).
‘The term “tight” means in this context that the traded volume is calculated based on all
relevant information such as the amount of cross border capacity, order books of all
energy exchanges and TSOs in the coupled area.’ (TENNET, 2013 apud BAUMANN,
2014: 31). This is the main difference compared to Loose Volume Coupling, because now
the calculation is performed using all relevant information. ‘In case of a structural
54 ‘Methodologies to define import and export curves should be transparent and reproducible.’ (RAMOS,
2016: 83).

54
balance, the short-term interchange can even overcome the volume of the amount hired
generating differences that would be settled in the short-term market.’ (RAMOS, 2016:
83)55.
Last, but not least, there is also the Price Coupling as the third kind of coupling markets,
which is used the most. Price coupling was first introduced in 2006 between France,
Belgium and the Netherlands, known as Trilateral Market Coupling (TMC), having the
advantage of avoiding price56 or flow discrepancies like exports from a high price zone
to a low price zone or price differences in case of no congestion (ENTSO-E, 2010,
GLACHANT, 2010, TENNET, 2013, WEBER et al., , 2010).
‘Price coupling requires a single computational model to calculate the
Marginal Cost of Operation (CMO) of member countries and
interchange flow occurs based on detailed information of countries’
electrical energy systems. National operators internalise interchange
flows established by the model and calculate short-term prices with the
same computational model. So that this mode works, the coordination
level should be extremely high and countries lose autonomy in their
policies, thus requiring an Integrated Energy Planning comprising not
only electricity but generation sources that shall be used and how this
is related to other energy markets, such as the gas market.’ (RAMOS,
2016: 83).
The most advanced example of this model is Central West Europe (CWE), involving the
operators of France, Germany, Belgium, The Netherlands and Luxembourg, and the
electricity exchange EPEX-SPOT.
Finally, the fourth and final stage of the electric market interconnection (market
integration) is Market Splitting, corresponding to full market integration. Among its
advantages we have it being economically efficient, having increased liquidity, and
providing locational incentives. Among its drawbacks, we have the fact that there is no
55 A successful example of this approach is Nordpool’s coupling with CWE, includying
Belgium, France, Germany, Luxembourg and the Netherlands. 56 ‘A single price is not and should not be the only or even the best criterion according to which progress
towards achieving a well-functioning single market is judged. There can be, for example, situations in
which prices between the two or more countries are very similar due to abuse of dominant market power
of a dominant market participant in one or more countries’ (ONDŘICH, 2014).
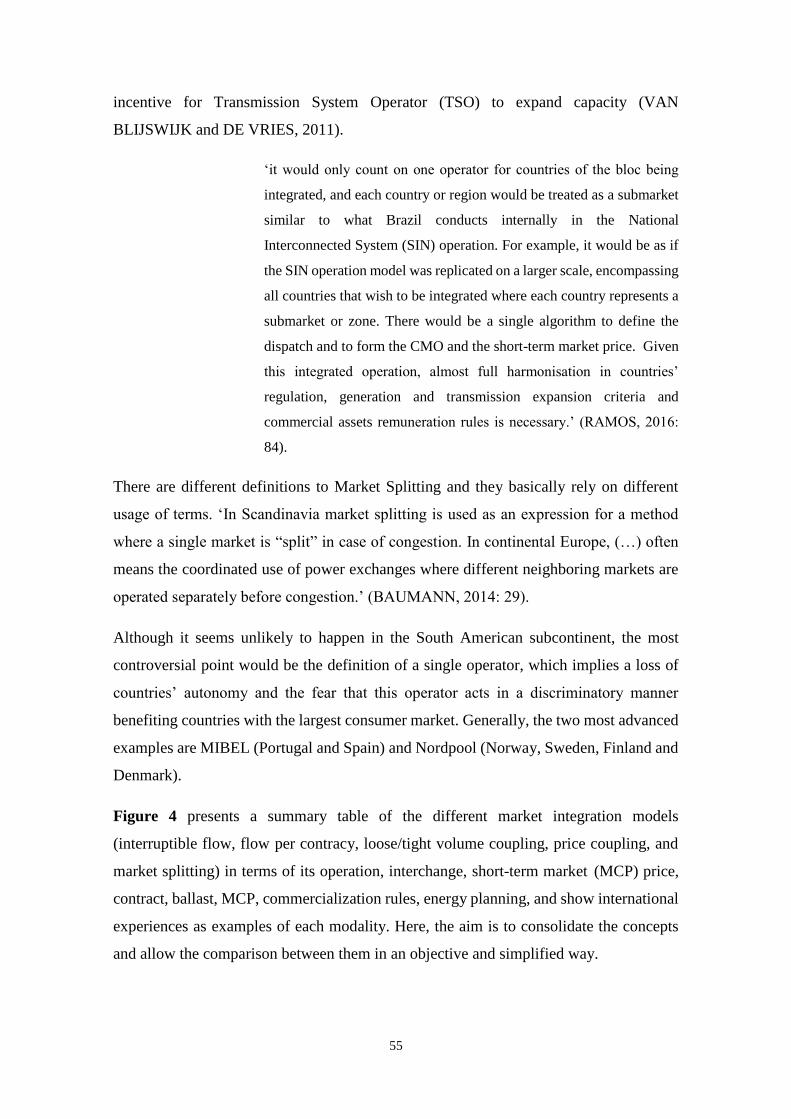
55
incentive for Transmission System Operator (TSO) to expand capacity (VAN
BLIJSWIJK and DE VRIES, 2011).
‘it would only count on one operator for countries of the bloc being
integrated, and each country or region would be treated as a submarket
similar to what Brazil conducts internally in the National
Interconnected System (SIN) operation. For example, it would be as if
the SIN operation model was replicated on a larger scale, encompassing
all countries that wish to be integrated where each country represents a
submarket or zone. There would be a single algorithm to define the
dispatch and to form the CMO and the short-term market price. Given
this integrated operation, almost full harmonisation in countries’
regulation, generation and transmission expansion criteria and
commercial assets remuneration rules is necessary.’ (RAMOS, 2016:
84).
There are different definitions to Market Splitting and they basically rely on different
usage of terms. ‘In Scandinavia market splitting is used as an expression for a method
where a single market is “split” in case of congestion. In continental Europe, (…) often
means the coordinated use of power exchanges where different neighboring markets are
operated separately before congestion.’ (BAUMANN, 2014: 29).
Although it seems unlikely to happen in the South American subcontinent, the most
controversial point would be the definition of a single operator, which implies a loss of
countries’ autonomy and the fear that this operator acts in a discriminatory manner
benefiting countries with the largest consumer market. Generally, the two most advanced
examples are MIBEL (Portugal and Spain) and Nordpool (Norway, Sweden, Finland and
Denmark).
Figure 4 presents a summary table of the different market integration models
(interruptible flow, flow per contracy, loose/tight volume coupling, price coupling, and
market splitting) in terms of its operation, interchange, short-term market (MCP) price,
contract, ballast, MCP, commercialization rules, energy planning, and show international
experiences as examples of each modality. Here, the aim is to consolidate the concepts
and allow the comparison between them in an objective and simplified way.

56
Figure 4. Summary of Markets Integration Modalities57
Source: Adapted from RAMOS (2016); MCP = short-term market; MER = (Central American) Regional
Electricity Market; LP = long run; CWE = Central West Europe.
In the Fourth Ibero-American Seminar on Renewable Energies (SIBER IV), Rafael
Ferreira, Advisor to the Presidency of the (Brazilian) Energy Research Company (EPE),
said that this future harmonization must take into account the sovereignty of each country,
identify the interface points, generate an adequate framework for investments, design a
cost structure that does not generate distortions in the short term and create mechanisms
57 To check more European market coupling initiatives, see Appendix A.

57
so that countries that are transit (which are not buyers or sellers), accept interconnection
until the Market integration (CIER, 2017a).
Ergo, it is necessary to show integration paths by sequential stages. Starting by proposing
alternatives for energy exchanges in both current interconnections and new
generation/transmission projects that allow progress in the integration process would be
an important first step. Then, go through optimization and opportunity exchanges, long-
term contracting of firm energies, coupling of markets until full market integration would
correspond to expected steps.
Notwithstanding, the region still does not have a common vision and long-term strategy
on energy integration. Each country seeks its energy self-sufficiency and secondly seeks
to sell surpluses to amortize its over-investments. These strategies have shown that they
are not safer, they are more expensive and, in turn, do not allow the development of
unconventional renewable energies to their full potential.
Considering the current regulatory frameworks of the Southern Cone countries, RAMOS
(2016) suggests: (i) Direct bilateral contracting, which in the Brazilian case could be both
in the Free Hiring Environment (ACL) and in Regulated Hiring Environment (ACR)58;
(ii) Interchange defined by the buyer and limited to the contracted value; (iii) Pricing and
trade rules should be defined in/by each country; (iv) Non-delivery of energy hired
implies purchase at MCP and payment of penalties; and (v) Energy Planning should
include partial coordination in order to safeguard an important level of independence for
countries signatory of agreements/treaties for energy integration59.
‘Short, medium and long-term integration modes should be defined
considering specific planning, operation and trade aspects for each
interchange modality, making progress in the construction of a plan for
the implementation of the necessary projects (Plants, Transmission
Lines and Substations), also preparing legal and commercial
frameworks that allow for the integration with consistent and attractive
basis for Agents, including international treaties among the countries
involved for the sake of legal security also supporting the financial and
58 In the latter case through new and/or existing energy auction. 59 ‘If Brazil is the importer, the volume hired represents generation and may ballast sales and, on the other
hand, generation charges must be paid. If Brazil is the exporter, export should be represented as load and
shall present contractual coverage with the payment of consumption charges.’ (RAMOS, 2016: 87).

58
operational safety of transactions to be conducted in the markets of each
Country involved.’ (Ibid.: 88-89).
Thus, the author flexes his commercial vision of regional energy integration, highlighting
the need for diverse planning through short, medium and long-term perspectives. In
addition, it is worth noting that no matter the deadline, different agreements must consider
the procedures and referrals applicable to exceptional cases, such as shortages and/or
energy crisis situations.
Thus, many consider that building an integrated energy market like the European one in
the South American region is unlikely to happen due to the different barriers already
presented (see subsection 2.3.1). This is aggravated, because the commercial model of
Brazil, the largest regional energy market, (i) is for physical guarantee of purchase/sale,
not for energy; and (ii) the physical guarantee can only be calculated in a modeled system
as being ‘closed in itself’. In this way, the characteristics of the Brazilian market grounded
in the concept of ‘ballast’ (physical guarantee) make integration similar to the European
model impossible to happen60. This ratifies section 2.2, which states that the models of
integration are particular and should not mimic the European one, taken as right and ideal,
therefore corresponding to what must be followed.
Given these limitations related to the architecture of the Brazilian commercial model, the
country should play an incremental role, granting a regulatory environment in which
neighboring countries that want to buy/sell electricity from the Brazilian market do so
with free access and clear and non-discriminatory rules61.
Consequently, RAMOS (2016) suggests that Brazil incorporate a list of recommendations
in order to create a favourable marketplace for regional integration: (i) Clear regulatory
mechanisms62 for energy import and export, considering the particularity of the cases; (ii)
Allow the participation of importers in electricity auctions; (iii) Encourage the
construction of projects aimed at exporting63; (iv) Financial guarantees and commercial
60 ‘Europe is the most advanced continent in this sense, having examples of integration by coupling
methodology (volume and price) and examples of full integration, which is also known as market splitting.’
(RAMOS, 2016: 93). 61 Such was the case between Colombia and Ecuador. 62 Even by the existence of possible barriers due to the nature of the operation of the Brazilian institutional
model, such as thermal dispatch out of the merit order and resulting charges, what artificially affect prices
in the short-term market and impact costs of several agents. 63 There are many power plants construction opportunities in the Amazon, as well as wind and thermal
projects in the Southern Cone region.

59
aspects as exchange rate and risk-taking; and (v) Specific allotments of the trade rules
system that can derail a commercial interchange process by adding costs affecting the
economic feasibility of the energy interchanged. However, the exclusively commercial
focus of the suggestions made by the author is clear, and it is a limitation from the point
of view of guaranteeing the goal.
‘Brazil’s integration with other Southern Cone markets with which it
has borders should be established as “Loose Volume Coupling” where
each country [has its Operator and] calculates its Marginal Cost of
Operation independently and is free to continuously set purchase and
sale prices by adding the margin it deems appropriate in relation to the
pure marginal cost in electricity connection point(s) (addition of
congestion costs, for example).’ (RAMOS, 2016: 93-94).
Again, it is perceived that the author’s proposal has limitations. Undoubtedly, this is due
to the influence of conjunctural factors and the current scenario of regional energy
integration (since the current context of Mercosur is characterized by dispatch based on
contracts). Ergo, there is no optimization between systems. Without a single operator, the
exploitation and management of the region’s natural resources will not be optimized and
therefore the subject will continue to be treated in the light of trade flows, either from
bilateral agreements or from the international energy interconnections region.
However, as discussed in section 2.2, care and caution are required when interpreting
these models in stages, which suggest the normative idea that institutionalization is
necessarily positive per se. The existence of these new rules and actors do not necessarily
guarantee the optimization of regional energy planning, since political will and respect
for the rules are fundamental requirements.
Although this caveat is taken into account, the central argument of this thesis is that, with
regard to the issue of South American energy integration, the creation and development
of these institutions would benefit the process. Certainly, like any other model, there are
simplifications and normative abstractions (the process does not necessarily have to go
through all the stages presented, which are not dated in time). The purpose of these
schemes is to present the movement expected to be achieved when there is a regional
intention to develop a model of energy integration, demonstrating the degree of political
and institutional consolidation of the steps themselves.

60
In general words, regarding market integration modalities, it was perceived that current
energy intergration in Mercosur is based on the spot market and (bilateral) contracts.
Thus, there is no effective joint regional planning, nor optimization between systems, but
only opportunities exchanges64. Although regional market splitting is desired, it is
important to consider that as long as there is not something really regional, it is necessary
that the countries at least take into account the plans of their neighbors when preparing
their energy expansion and operation plans. Undoubtedly, this will be a first step towards
a path of regional energy planning.
In general, the purpose of this chapter was to present and discuss the three main concepts
of the thesis. In proposing a related discussion between energy security and regional
integration, analyzing South American energy integration, it was emphasized that
regional energy integration is capable of promoting regional energy security. Thus, the
level of analysis were changed, surpassing the national one and proposing a regional
dimension.
After reviewing the different interpretations of the concepts discussed in the chapter, our
objective was not to establish a single definition based on the contribution of the different
disciplines that discuss each of these concepts. In fact, the idea was to present the diversity
of approaches and interpretations and, in the end, to show that our understanding of the
concept considers its multidisciplinarity feature. In this way, we consider the
environmental, social and institutional variables (politcs, culture, rules, i.e.) in a regional
dimension.
64 Cases like Itaipu, with stable and predictable long-term supply mechanisms are, unfortunately, an
exception in the region.

61
3. National perspectives
The main purpose of this chapter is to introduce the energy scenario in the Mercosur
countries. The base-year of following analysis is 2015 in order to standardize the data
depicted in upcoming tables and figures; thus, the methodology used to carry out a
comparative data analysis for the different countries is guaranteed. The national
quantitative primary sources are databases such as World Databank, sieLAC, ECLACstat,
CIER, COCIER, national energy ministries, British Petroleum (BP), World Energy
Council (WEC). In addition, the use of national and regional qualitative primary sources
such as norms, laws, international treaties, agreements, memorandum of understanding,
regulatory frameworks, programs and planning are emphasized.
The chapter will be divided as follows: first, a comparative analysis of different primary
quantitative data on energy power plants and international (cross-border)
interconnections in South America; binational hydroelectric power plants in South
America; exchanges of electric power between countries; evolution of electricity
consumption; private participation in generation, transmission and distribution; gas
pipeline network and natural gas reserves in South America; reserves and resources for
Mercosur, among others. Data and information related to electricity, natural gas, oil,
uranium and coal resources and reserves are presented respectively.
Next, Argentina (section 3.1), Bolivia (section 3.2), Brazil (section 3.3), Paraguay
(section 3.4), Uruguay (section 3.5) and Venezuela (section 3.6). At country level, the
following structure can be expected: (i) a brief geographical and economic presentation
on the six countries previously mentioned; (ii) the consequences of privatization and
institutional reform, since this is paramount when analyzing country’s energy integration;
(iii) presentation of energy markets existing structures, separated by electricity and oil
and gas (O&G); (iv) figure showing summarized energy balance in ktoe; (v) detailed
electricity sector installed capacity, with information on recent investments and projects
in electricity and renewable sources; (vi) detailed presentation of binational projects,
whether hydroelectric plants or gas pipelines; (vi) discussion of current public projects
that have not gone forward; (vii) presentation of international (cross-border)
interconnections and international trade; (viii) figure presenting energy trade, both
exports and imports; (ix) information on projects and investments in the hydrocarbon

62
sector, detailing when dealing with oil or gas; and (x) presentation of main challenges
that each country faces, as well as opportunities for new ventures. When countries do not
have enough information on any of the topics mentioned above, it is not going to be
mentioned.
It must be noted that it is not the purpose of this chapter to make a detailed energy sector
analysis at country level, nor to present the regulation of each of them, whether in
electricity or O&G sector. Actually, the goal of this inquiry is to exhibit the main
country’s geoeconomic and electroenergetic characteristics, highlighting their
relationship with regional integration. Exactly due to this reason, existing experiences in
terms of energy interconnections, as well as binational HPPs and gas pipelines will be
showed as well.
Regarding the energy sector of the countries being studied, it should be noted that reforms
in their electric industries followed a common pattern with variations of their own: (i)
vertical disintegration of the industry; (ii) transfer of assets to private sector; (iii)
separation of functions from the State and creation of independent regulatory bodies,
policy makers and management control; and (iv) rebalancing of tariffs and
reduction/targeting of subsidies. The reforms of the energy sector in Latin America and
the Caribbean (LAC) have generally implied, for many countries, the privatization of
assets, the disintegration of energy chains and a conceptual change regarding ends and
means in the public services formerly centralized within the State. In many cases, this has
implied an increase in rates or increasing needs for subsidies. In both instances, for not
prioritizing specific public policies concerning social rate and its scope, the social impact
has been and still is negative, mainly after 2003, where the scenario of international
energy prices is modified (CIER, 2013a).
It is important to mention that in addition to considering the energy market structure at
country level, when we cope with energy integration, it is crucial to draw attention to
current projects on physical infrastructure – stressing that the process of regional
integration does not necessarily imply an increase of intra-bloc trade. Having said that,
energy infrastructure and regional development have an intrinsic and close relationship

63
that needs to be highlighted65, particularly in the context of developing countries. In this
way, it is important to understand how this relationship occurs, shedding some light onto
the different variables that need to be taken into account.
Therefore, and ratifying the view presented in section 2.2 and subsection 2.3.1,
integration is not understood by increased trade flow. From the energy point of view,
deepening energy integration may lead to increased imports and exports of energy
(electricity, oil and byproducts, and gas), but this is not necessarily true66.
Considering nine South American countries over the period 1980-2005, APERGIS and
PAYNE (2010) show the causality from energy consumption to economic growth and the
fact that the region is among the world’s leader in energy sources such as oil, natural gas,
hydroelectricity and ethanol. Taking into account that these are developing countries,
some of them facing shaken economic situations, investing in energy can lead to positive
externalities for the other sectors of the economy.
In the energy policies context, especially considering investment in physical
infrastructure, it is mandatory to emphasize the role of energy cooperation and
integration67 as alternatives to national policies aimed at energy self-sufficiency
(MARES, 2008, SANTOS, 2017), by allowing a better use of resources by taking
advantages of complementarities between countries (OCHOA et al., 2013, RAMOS,
2016). As highlighted in subsections 2.3.1 and 2.3.2, it is necessary to overcome the
narrow state-centric characteristic of most national plans of the different countries.
Table 2 presents energy and environmental indicators for Mercosur. It contains electric
power consumption (kWh per capita), access to electricity (% of pop.), renewable energy
65 ‘There is a strong relationship between the quality of energy infrastructure, competitiveness, and
economic growth. (…). Blackouts and brownouts are very costly and are a disincentive to invest in
manufacturing, while the investments required to provide back-up generation lead to increased costs.
Fluctuations in voltage and power frequency also cause machine damage, financial and economic losses,
and variations in product quality.’ (YÉPEZ et al., 2016:21). 66 As noted in subsection 2.3.2, there are different dimensions of common electricity markets, namely (i)
infrastructural integration; (ii) regulatory integration; and (iii) commercial integration (PINEAU et al., 2004). 67 ‘Out of the different energy sources, the most promising one from a regional viewpoint is electricity. It
provides multiple comparative advantages: tariff modicity, employment of consolidated technologies and
other innovative ones (wind and solar) and environmental sustainability. Its largely technologically and
technically dominated characteristics favour the installation of integrated transmission networks capable of
guaranteeing continuous and uninterrupted supply of energy over long distances. Additionally, electricity
favours the inclusion of large social segments, distant from development benefits and opportunities. Both
factors explain the replacement of non-renewable and pollution-generating sources in the region since
market reforms of years 1980-90.’ (BIATO et al., 2016: 61-62).

64
consumption (%), total natural resources rents (% of GDP), emission intensity GDP US$
2010 (t/MUS$ 2010), CO2 emissions (kt) and CO2 emissions (metric tons per capita).
Table 2. Energy and environmental indicators for Mercosur, by country
Countries
Electric
power
consumption
(kWh per
capita)1
Access to
electricity
(% of
pop.)1
Renewable
energy
consumption
(%)1,3
Total
natural
resources
rents (%
of GDP)
Emission
Intensity
GDP
US$ 2010
(t/MUS$
2010)
CO2
emissions
(kt)1
CO2
emissions
(metric
tons per
capita)1
Ar 3,052 100.0 10.77 1,18 413,56 204,025 4.7
Bo 753 90.0 16.82 7,92 797,36 20,411 1.9
Br 2,601 99.7 41.81 2,91 206,30 529,808 2.6
Py 1,564 99.0 63.12 2,20 256,66 5,702 0.9
Uy 3,068 99.7 55.43 1,64 138,60 6,747 2.0
Ve 2,658 99.1 12.30 15,252 766,60 185,220 6.0
Source: Own elaboration based on World Databank and sieLAC; 1 = 2014 ; 2 = 2013; 3 = % of total final
energy consumption.
Electricity coverage in Latin America has increased substantially over the last decades,
rising from 50% of the population in 1970 to more than 95% in 2015. The 1990s
witnessed a period in which many countries had difficulties in expanding their networks,
especially in isolated and rural areas. Only a combination of political efforts has made it
possible to reach current situation, in addition to (i) the use of social tariffs and pro-
competitive regulation; and (ii) renewable technologies are becoming a relevant solution
for the rural area. Although there are high rates of electrification in the region, energy
consumption is still very low in many areas – mainly rural areas (BANAL-ESTAÑOL,
CALZADA and JORDANA, 2017)68. When it comes to electricity access, ‘electricity
needs to be affordable for consumers and tariffs should be adequate to allow service
providers to expand the grid, as well as to operate and maintain their facilities.’ (YÉPEZ
et al., 2016: 8).
68 It is important to take into account the fact that ‘energy access issues particularly affect women and
children, as well as indigenous people and AfroCaribbean populations.’ (YÉPEZ et al., 2016: 5).

65
It is very clear that access to electrification occurs on a very diverse basis, which is
expressed in the share of renewable energy consumption in each of the countries. Under
Mercosur, Paraguay reaches about 63.12% while Argentina reaches only 10.77%.
Countries such as Venezuela and Bolivia, in turn, have 15.25% and 7.92%, respectively,
of share of total natural resources rents (% of GDP)69. Undoubtedly, in absolute terms,
Brazil also stands out, but in relative terms (% of GDP), the weight of this income falls.
All data is intertwined as we consider CO2 emissions, which are related to the energy
sector of the countries, as well as their other productive sectors. Once again, the relative
and absolute differences between the Mercosur countries stand out.
Still with regard to renewable energy, noteworthy is the October publication of 2017
Renewable Energy Country Attractiveness Index (RECAI), which sets Argentina, Brazil
and Uruguay in 11th, 17th and 35th respectively. Argentina and Uruguay have improved
their position when compared with a previous index, while Brazil has worsened70.
Table 3 shows production, consumption and energy surpluses and deficits, by country.
The total production (Mtoe) and consumption (Mtoe) of Mercosur accounted for 74.5%
and 80.6% of the total in South America (SA), respectively. In addition, considering only
Mercosur, Brazil accounts for 49.6% of production and 63.6% of consumption, while
Uruguay accounts for only 0.5% of production and 1.1% of consumption.
Table 3. Production, consumption and energy surpluses and deficits, by country
Country Production
(Mtoe)
Consumption
(Mtoe)
Surplus/Deficit
(Mtoe)
Surplus/Deficit (%
Consumption)
69 As previously argued, a significant challenge arises within Mercosur, given the entrance of Venezuela
and Bolivia – since the latter has its energy production mainly based on natural gas and the former in crude
oil and by-products. On the other hand, Mercosur founding members have a predominantly hydroelectric
profile. Still, it is possible to see that the recent entrance of both Venezuela and Bolivia contributes
positively to ensuring a bigger diversification of Mercosur energy matrix and power generation mix. 70 See: http://www.ey.com/gl/en/industries/power---utilities/ey-renewable-energy-country-attractiveness-
index-our-index.

66
Ar 73 87 -14 -16%
Bo 23 9 14 156%
Br 286 299 -13 -4%
Py 7 5 2 40%
Uy 3 5 -2 -40%
Ve 185 65 120 185%
Mercosur 577 470 107 23%
Cl 14 37 -23 -62%
Co 126 35 91 260%
Ec 30 14 16 114%
Gy 0 1 -1 -100%
Pe 26 25 1 4%
Su 1 1 0 0%
SA 774 583 191 33%
Source: Own elaboration based on CIER (2017b) and MME (2016).
It is also worth noting that the positive balance presented by Mercosur (107 Mtoe) is
strongly influenced by the presence of Bolivia (+156%) and Venezuela (+185%)71. The
other extra-Mercosur countries in South America only produce 197 Mtoe and consume
113 Mtoe, respectively 34.1% and 24.0% of Mercosur’s values. Due to its relative size,
Chile stands out as a country with high external dependence on energy (-63%).
Exchanges of electric power between countries (GWh) are presented in Table 4. On the
total exports, Paraguay stands out, accounting for 41,450 GWh (93.1%) of total exports
from South America. On the import side, Brazil (34,947 GWh, 78.5%) and Argentina
(9,021 GWh, 20.3%) stand out.
Table 4. Electricity exchanges, between countries, in GWh (2015)
Countries Ar Br Co Ec Py Pe Uy Ve
Total
imports
%
imports
71 Venezuela exported slightly above 180% of its energy needs (MME, 2016).

67
Ar 229 - - 7,479 - 1,313 - 9,021 20.3%
Br 56 - - 33,971 - 7 913 34,947 78.5%
Co - - 45 - - - - 45 0.1%
Ec - - 457 - 55 - - 512 1.1%
Uy 2 - - - - - - 2 0.0%
Ve - - 3 - - - - 3 0.0%
Total
exports 58 229 460 45 41,450 55 1,320 913 44,530 100.0%
% exports 0.1% 0.5% 1.0% 0.1% 93.1% 0.1% 3.0% 2.1% 100.0% -
Source: Own elaboration based on CIER (2017b)
Mercosur countries have played a leading role in electric power exchanges in South
America. They account for 43,970 GWh (98.8%) of exports and 43,973 GWh (98.8%) of
electricity total imports from South America. In other words, they are not only the main
sources, but also the main destinations of electricity in transit in the region. This is also
one of the main reasons why this present thesis focuses on Mercosur countries, and not
on UNASUR countries.
Although the accession of potentially interesting new countries from the point of view of
energy exchanges is positive for the energy integration of the region, it is important to
consider that the more countries participate in the arrangement, the greater the existing
asymmetry. Therefore, given the recent enlargements that have taken place in Mercosur,
RODRIGUES (2012a) sheds light onto the need of (only) analyzing institutional and
regulatory issues on energy integration within and between Mercosur countries, following
HIRA (2003) and VARELA’s (2015) lead.
Figure 5, Figure 6, Table 5, Table 6 and Table 7 come from CIER (2017), whose base-
year is 2015. The document is entitled ‘Energy Information Synthesis of the CIER
Countries: Information on the energy sector in South American, Central American and
the Caribbean countries - Year 2015’.
Figure 5 shows that cross-border interconnections are spatially concentrated in the Andes
or Southern Cone, what justifies why different authors and project methodologies analyze
South American energy integration divided into two large blocs of countries. This is the
case of the famous CIER Project 15, which divides South America into Andean
Community (Bolivia, Colombia, Ecuador and Peru) and Mercosur (Argentina, Brazil,

68
Chile, Paraguay and Uruguay)72. In the following figure, it is possible to see in detail
whether the interconnections are operating/existing, under construction or under study.
In addition, we present the operating and under study HPPs.
72 Although there is a footnote in the project mentioning that countries that participate in the Mercosur and
Andean Community (CAN) groups are not necessarily members of the homonymous commercial unions,
the fact is that this methodological decision contributes to hinder regional comparative studies. This
happens because there is no formal methodological accuracy when it comes to studying and evaluating such
countries. This positioning confirms the fact that Venezuela is not considered in the region of South
America. The project report (CIER, 2011) justifies that it was not possible to include Venezuela in the study
due to the deadline limits for data delivery. Furthermore, CIER 15 makes another conceptual mistake in
referring to Mercosur and CAN as ‘commercial unions’.

69
Figure 5. Power plants and international interconnections in South America
Source: CIER (2017b).
For South America, CIER National and Regional Committees provides the data, as well
as:

70
Argentina: Ministry of Energy and Mining (MINEM);
Bolivia: National Load Dispatch Committee (CNDC);
Brazil: Ministry of Mines and Energy (MME);
Colombia: Mining and Energy Planning Unit (UPME);
Paraguay: National Electricity Administration (ANDE);
Perú: Ministry of Energy and Mines (MINEM); y
Uruguay: National Administration of Power Plants and Electric Transmissions
(UTE).
It is observed that almost all countries have interconections with a neighboring country.
However, when analyzing electricity exchanges between countries, they do not seem
relevant.
Table 5 shows the main binational hydroelectric power plants in South America. Again,
all of them are located in Mercosur countries, particularly in the Southern Cone.
Table 5. Binational Hydroelectric Power Plants in South America
Ref. Countries HPP River Installed
Capacity (MW) Status
A Br-Py Itaipu Paraná 14,000 In operation
B Ar-Uy Salto Grande Uruguay 1,890 In operation
C Ar-Py Yacyretá Paraná 3,200 In operation
D Ar-Br Garabí-Panambí Uruguay 2,200 Under study
E Ar-Py Corpus Christi Paraná 3,400 Under study
Source: Adapted from CIER (2017).
Binational plants are detailed by countries involved in the project, river, installed capacity
(MW) and status. The weight of Itaipu (14,000 MW) is evident, corresponding to 56.7%
of the total installed capacity of binational hydroelectric power plants in South America.
In addition, it should be noted that Garabí-Panambí (2,200 MW) and Corpus (3,400 MW)
are still under study, so they do not contribute to the generation of electricity and income
for the countries of that region.

71
Table 6 features the power plants and international interconnections in South America
showed in Figure 5. This table shows countries involved, location of the enterprise,
voltage (kV), installed capacity (MW) and current status with frequency. It is clear that
countries of the Andean region (Colombia, Ecuador, Peru and Venezuela) have a
frequency of 60 Hz such as Brazil, but unlike Argentina, Bolivia, Chile, Paraguay and
Uruguay, whose systems operate at 50 Hz73.
Table 6. Power plants and international interconnections in South America
Ref. Countries Location Voltage
(kV)
Installed
capacity (MW) Status
1 Co-Ve Cuestecita (Co) – Cuatricentenario (Ve) 230 150 Operating (60 Hz)
2 Co-Ve Tibú (Co) – La Fría (Ve) 115 36 Operating (60 Hz)
3 Co-Ve San Mateo (Co) – El Corozo (Ve) 230 150 Operating (60 Hz)
4 Co-Pa Cerromatoso (Co) – Panamá (Pa) (Co) 300 Under study (HDVC)
5 Co-Ec Jamondino (Co) – Pomasqui (Ec) 230 2501 Operating (60 Hz), 4 circuits
6 Co-Ec Jamondino (Co) – Pomasqui (Ec) 230 2501 Under construction (60 Hz)
7 Co-Ec Ipiales (Co) – Tulcán (Ec) 138 35/113 Operating (60 Hz)
8 Ec-Pe Machala (Ec) – Zorritos (Pe) 230 110 Operating (60 Hz)
9 Br-Ve Boa Vista (Br) – El Guri (Ve) 230/400 200 Operating (60 Hz)
10 Bo-Pe La Paz (Bo) – Puno (Pe) 230/220 150 Under study (50/60 Hz)
11 Br-Py Itaipu 500/220 14,000 Operating (60/50 Hz)
12 Br-Py Foz de Iguazú (Br) – Acaray (Py) 220/138 50 Nonoperating (60/50 Hz)
13 Ar-Py El Dorado (Ar) – Mcal. A. López (Py) 220/132 30 Operating (50 Hz)
14 Ar-Py Clorinda (Ar) – Guarambaré (Py) 220 90 Operating (50 Hz)
15 Ar-Py Yacyretá 500 3,200 Operating (50 Hz)
16 Ar-Br Rincón S.M. (Ar) – Garabí (Br) 500 2,000/2,200 Operating (50/60 Hz)
17 Ar-Br P. de los Libres(Ar) – Uruguayana(Br) 132/230 50 Operating (50/60 Hz)
18 Ar-Uy Salto Gde. (Ar) – Salto Gde. (Uy) 500 1,890 Operating (50 Hz)
19 Ar-Uy Concepción (Ar) – Paysandú (Uy) 132/150 100 Emergency Op. (50 Hz)
20 Ar-Uy Colonia Elia (Ar) – San Javier (Uy) 500 1,386 Operating (50 Hz)
21 Br-Uy Livramento (Br) – Rivera (Uy) 230/150 70 Operating (60/50 Hz)
22 Br-Uy Pte. Médici (Br) – San Carlos (Uy) 500 500 Operating (60/50 Hz)
23 Ar-Cl CT TermoAndes (Ar) – Sub.Andes (Cl) 345 633 Operating (50 Hz)
24 Ar-Bo Yaguacua (Bo) – Tartagal (Ar) 500 Under study
Source: CIER (2017b); 1 = double circuit; HVDC = high-voltage, direct current.
73 As already mentioned, this is one of the reasons why it is usual to model the region by dividing the
Andean area with that of the Southern Cone, as already highlighted.

72
Table 7 shows the evolution of electricity consumption during 1990-2015, in
kWh/inhabitant. It varies widely among Mercosur countries and has grown significantly
over the last decades.
Table 7. Evolution of electricity consumption, in kWh/inhabitant (1990-2015)
Country 1990 1995 2000 2005 2010 2015
Ar 1,459 1,882 2,438 2,871 3,367 3,575
Bo 284 378 468 521 697 849
Br 1,554 1,886 2,142 2,402 2,821 2,966
Py 641 890 1,044 1,212 1,627 2,137
Uy 1,521 1,934 2,386 2,518 2,838 3,146
Ve1 2,837 3,226 3,697 3,940 4,002 4,272
Mercosur2 1,383 1,699 2,029 2,244 2,559 2,824
Cl3 1,051 1,763 2,748 3,358 3,648 4,028
Co 1,058 1,088 983 1,058 1,209 1,371
Ec 589 734 839 1,147 1,408 1,636
Pe 444 558 776 937 1,223 1,536
AS 1,422 1,674 1,946 2,208 2,564 2,755
Source: Own elaboration based on CIER (2017); No data for Guyana and Suriname. 1 = Correspond to
2014, the latest information available; 2 = Calculated as a means of Ar, Bo, Br, Py, Uy e Ve; 3 = Does not
include Central Salta located in Argentina.
Table 8 shows the profile of generation, transmission and distribution of electricity by
country. Given the heterogeneity existing within the territory, both in terms of resources
and in the political orientation, the adopted regulatory framework has varied according to
each specific case. The nature of each activity changes greatly from country to country,
especially in the generation sector.
In general, countries can be divided into two groups. First, there is the group made up of
countries with the greatest State intervention or participation. This is the case of Bolivia,
Paraguay and Uruguay. However, this group also presents several differences within. In
the second group, Argentina and Brazil can be found. The two countries with the greatest
territorial extension on the subcontinent have a strong State participation in common in
regulatory terms, with constant changes in normative aspects. The participation in the
ownership of companies varies in the three segments. Private, public companies and even
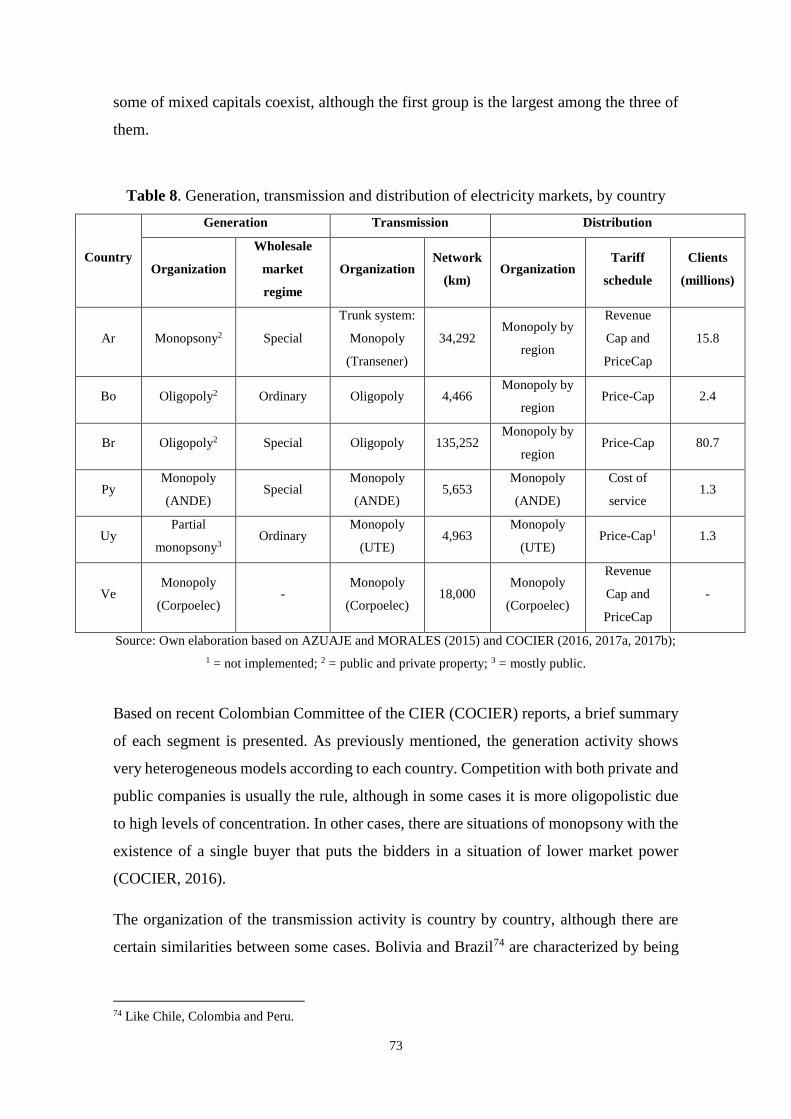
73
some of mixed capitals coexist, although the first group is the largest among the three of
them.
Table 8. Generation, transmission and distribution of electricity markets, by country
Country
Generation Transmission Distribution
Organization
Wholesale
market
regime
Organization Network
(km) Organization
Tariff
schedule
Clients
(millions)
Ar Monopsony2 Special
Trunk system:
Monopoly
(Transener)
34,292 Monopoly by
region
Revenue
Cap and
PriceCap
15.8
Bo Oligopoly2 Ordinary Oligopoly 4,466 Monopoly by
region Price-Cap 2.4
Br Oligopoly2 Special Oligopoly 135,252 Monopoly by
region Price-Cap 80.7
Py Monopoly
(ANDE) Special
Monopoly
(ANDE) 5,653
Monopoly
(ANDE)
Cost of
service 1.3
Uy Partial
monopsony3 Ordinary
Monopoly
(UTE) 4,963
Monopoly
(UTE) Price-Cap1 1.3
Ve Monopoly
(Corpoelec) -
Monopoly
(Corpoelec) 18,000
Monopoly
(Corpoelec)
Revenue
Cap and
PriceCap
-
Source: Own elaboration based on AZUAJE and MORALES (2015) and COCIER (2016, 2017a, 2017b);
1 = not implemented; 2 = public and private property; 3 = mostly public.
Based on recent Colombian Committee of the CIER (COCIER) reports, a brief summary
of each segment is presented. As previously mentioned, the generation activity shows
very heterogeneous models according to each country. Competition with both private and
public companies is usually the rule, although in some cases it is more oligopolistic due
to high levels of concentration. In other cases, there are situations of monopsony with the
existence of a single buyer that puts the bidders in a situation of lower market power
(COCIER, 2016).
The organization of the transmission activity is country by country, although there are
certain similarities between some cases. Bolivia and Brazil74 are characterized by being
74 Like Chile, Colombia and Peru.
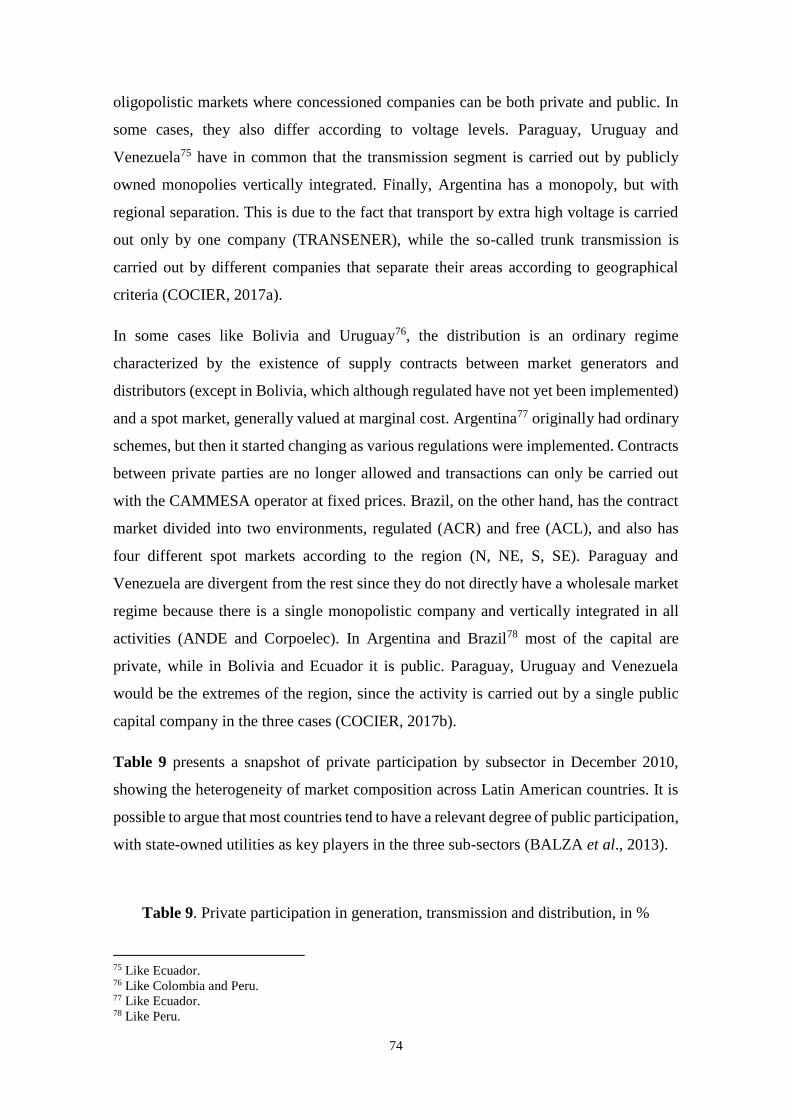
74
oligopolistic markets where concessioned companies can be both private and public. In
some cases, they also differ according to voltage levels. Paraguay, Uruguay and
Venezuela75 have in common that the transmission segment is carried out by publicly
owned monopolies vertically integrated. Finally, Argentina has a monopoly, but with
regional separation. This is due to the fact that transport by extra high voltage is carried
out only by one company (TRANSENER), while the so-called trunk transmission is
carried out by different companies that separate their areas according to geographical
criteria (COCIER, 2017a).
In some cases like Bolivia and Uruguay76, the distribution is an ordinary regime
characterized by the existence of supply contracts between market generators and
distributors (except in Bolivia, which although regulated have not yet been implemented)
and a spot market, generally valued at marginal cost. Argentina77 originally had ordinary
schemes, but then it started changing as various regulations were implemented. Contracts
between private parties are no longer allowed and transactions can only be carried out
with the CAMMESA operator at fixed prices. Brazil, on the other hand, has the contract
market divided into two environments, regulated (ACR) and free (ACL), and also has
four different spot markets according to the region (N, NE, S, SE). Paraguay and
Venezuela are divergent from the rest since they do not directly have a wholesale market
regime because there is a single monopolistic company and vertically integrated in all
activities (ANDE and Corpoelec). In Argentina and Brazil78 most of the capital are
private, while in Bolivia and Ecuador it is public. Paraguay, Uruguay and Venezuela
would be the extremes of the region, since the activity is carried out by a single public
capital company in the three cases (COCIER, 2017b).
Table 9 presents a snapshot of private participation by subsector in December 2010,
showing the heterogeneity of market composition across Latin American countries. It is
possible to argue that most countries tend to have a relevant degree of public participation,
with state-owned utilities as key players in the three sub-sectors (BALZA et al., 2013).
Table 9. Private participation in generation, transmission and distribution, in %
75 Like Ecuador. 76 Like Colombia and Peru. 77 Like Ecuador. 78 Like Peru.

75
Country Generation Transmission Distribution
Ar 73 100 66
Bo 35 87 82
Br 38 14 70
Py 0 0 0
Uy 3 0 0
Ve 0 0 0
Source: BALZA et al. (2013); Venezuela started the process of re-nationalizations in 2007 and Bolivia in
2011. In Paraguay and Uruguay, distribution refers to billing by private utilities.
Evidences based on analyzes of developing countries in the 1980s and early 2000s
highlight that good regulatory governance has a positive and statistically significant effect
on per capita generation capacity (CUBBIN and STERN, 2006), and that performance
improvements resulting from private participation depend on the presence of an effective
regulatory regime that stimulates management (ZHANG et al., 2008). However, it is
important to note that the effect of privatization on electricity prices is not clear
(NAGAYAMA, 2007, 2009).
Privatization itself does not necessarily lead to better results (such as improved labor
productivity, higher capital utilization, increased generating capacity, or higher output)
unless it is coupled with independent regulation (ZHANG et al., 2008). We are
completely in line with this argument. Nevertheless, there are studies that find that
privatization has increased access to electricity services in Argentina, Bolivia, Mexico,
and Nicaragua, particularly for lower income groups (MOOKHERJEE and McKENZIE,
2005), while others studies analyzing 10 Latin American countries (LAC) find mixed
results (ANDRES et al., 2008).
Figure 6 and Table 10 show gas pipeline networks and natural gas reserves in South
America detailing whether they are operating/existing, under construction, in project or
under study. In addition, the gas basins of the region are presented. Table 10 details the
countries involved in each gas pipeline network, location of the project, diameter (inch),
capacity (Mm3/d) and current status. As can be seen from the table, many gas pipelines
are (i) operating in limited service; (ii) nonoperating; or (iii) in interruptible operation.

76
Figure 6. Gas pipeline networks and natural gas reserves in South America
Fonte: CIER (2017b).

77
Table 10. Gas pipeline networks and natural gas reserves in South America
Ref. Countries Gas pipeline Diameter
(Inch)
Capacity
(Mm³/d) Status
1 Ar-Cl San Sebastián (Ar) – Pta. Arenas (Cl) (Bandurria) 10 4 Existing (sin. op)
2 Ar-Cl Batería de Recepción 7 – T. del Fuego 6 1,5 Operating
3 Ar-Cl Pta. Dungeness (Ar) – C. Negro (Cl) (Dungeness) 8 2 Existing (sin. op)
4 Ar-Cl El Cóndor (Ar) – Posesión (Cl) 12 2 Existing (sin. op)
5 Ar-Cl Pta. Magallanes (Ar) – Posesión (Cl) 18 1 Existing (sin. op)
6 Ar-Cl L. La Lata (Ar) – Concepción (Cl) (Gas Pacífico) 24-20 3,5 In operation on
the Argentine side
7 Ar-Cl La Mora (Ar) – Santiago (Cl) (Gasandes) 24 10 In interruptible
operation
8 Ar-Cl Cnel. Cornejo (Ar) – Mejillones (Cl) (Gasatacama) 20 9 Existing
(nonoperating)
9 Ar-Cl Gasod. Norte (Ar) – Tocopilla (Cl) (Norandino) 20 8,5 In interruptible
operation
10 Ar-Bo Ramos (Ar) – Bermejo (Bo) 8-13 1,2 Operating
11 Ar-Bo Campo Durán (Ar) – Madrejones (Bo) 24 7 Existing
(nonoperating)
12 Ar-Bo Miraflores (Ar) – Tupiza (Bo) (Puna) Under sudy
13 Ar-Br Cnel. Cornejo (Ar) – S. Paulo (Br) In project
14 Ar-Br Aldea Brasilera (Ar) – Uruguayana (Br) 24 10-15 In interruptible
operation
15 Ar-Uy Gto. Entrerriano (Ar) – Paysandú (Uy) (Del
Litoral) 10 1
Operating in
limited service
16 Ar-Uy Gto. Entrerriano (Ar) – Casa Blanca (Uy) 16 5-2 Existing
(nonoperating)
17 Ar-Uy Bs. Aires (Ar) – Montevideo (Uy) (C. del Sur) 24-18 (1) 6 Operating in
limited service
18 Bo-Br Río Grande (Bo) – S. Paulo (Br) 32 30 Operating
19 Bo-Br Río Grande (Bo) – Cuiabá (Br) (GASBOL) 18 2,8 Operating
20 Co-Ve Est. Ballena (Co) – Maracaibo (Ve) (Transcaribe) 18 4,2 Operating
21 Ar-Bo Campo Durán (Ar) – Campo Grande (Bo) (Juana
Azurduy) 24-32 27,7 Operating
Source: CIER (2017b).

78
Despite the region potential for gas integration, none of the LAC countries is explicitly
pitching for the construction of integration gas pipelines in the short or medium term.
Only Bolivia, after the construction of a smaller high capacity pipeline to increase gas
shipments to Argentina, raises the possibility to increase the capacity of shipments to
Brazil. However, it is a currently remote possibility. Its main problem is to develop and
produce on time all the gas committed in its contract with Argentina. The trend is assured
today in the export-import of LNG, which calls into question the need for more capital-
intensive investments in new gas pipelines (D’APOTE and CASTAÑOS, 2016, CAF,
2013c) and makes room for a new regional dynamic in terms of potential LNG trade
between countries.
Table 11 below presents data such as oil reserves (Gbbl), natural gas reserves (Gm³),
uranium reserves (kt), coal reserves (Mt), hydropower resources (TWh), power plant
capacity (GW) and refining capacity (kbbl/d). However, it should be noted that due to
the great uncertainty about proven, possible and probable reserves, as well as the existing
ones with respect to unconventional resources (such as shale gas)79, it becomes almost
impossible to envision a clear picture for gas integration in the region.
79 Especially for those with intention and/or decision to invest in their exploitation.

79
Table 11. Reserves and resources for Mercosur, by country (2015)
Countries
Oil
reserves
(Gbbl)1
Natural gas
reserves
(Gm³)1
Uranium
reserves
(kt)2
Coal
reserves
(Mt)1
Hydropower
resources
(TWh)3
Power
plant
capacity
(GW)
Refining
capacity
(kbbl/d)
Ar 2.4 332.0 19.0 500.0 169.0 35.8 657.0
Bo 0.4 281.0 - - 126.0 2.4 69.7
Br 13.0 429.0 309.0 7039.0 1250.0 140.9 2,278.0
Py - - - - 85.0 9.8 7.5
Uy - - - - 10.0 3.9 50.0
Ve 300.9 5,617.0 - 479.0 261.0 31.4 1,303.0
Mercosur 316.7 6,659.0 328.0 8,018.0 1,901.0 224.2 4,365.2
SA 327.7 7,256.0 333.0 14,987.0 2,842.0 277.9 5,599.0
% Mercosur/SA 96.6% 91.8% 98.5% 53.5% 66.9% 80.7% 78.0%
World 1,698.0 186,875.0 6,306.0 891,531.0 15,955.0 6,000.0 97,227.0
% Mercosur/World 18.7% 3.6% 5.2% 0.9% 11.9% 3.7% 4.5%
Fonte: Own elaboration based on CIER (2017b), MME (2016), British Petroleum (BP) and World Energy
Council (WEC); 1 measured; 2 proved and inferred; 3 technically exploitable; bbl = barrel.
Based on the data, the challenge of adding value to regional energy resources stands out.
Considering South America, Mercosur has 96.6% of oil reserves, 91.8% of natural gas
reserves, 98.5% of uranium reserves, 53.5% of coal reserves, 66.9% of hydropower
resources, 80.7% of power plant capacity and 78.0% of refining capacity. In Mercosur,
Argentina, Brazil and Bolivia catch the eye80. Venezuela has 95.0% of oil reserves, 84.4%
of natural gas reserves, 13.7% of hydropower resources, 14.0% of power plant capacity
and 29.8% of refining capacity. Brazil has 94.2% of uranium reserves, 87.8% of coal
reserves, 65.8% of hydropower resources, 62.8% of power plant capacity and 52.2% of
refining capacity. Argentina stands out because of having 8.9% of hydropower resources,
16.0% of power plant capacity and 15.1% of refining capacity.
Table 12 shows proven natural gas reserves in trillions of cubic feet (TCF) by country,
for the period between 1990 and 2015. In 2015, Mercosur has 92.5% of proven natural
gas reserves in South America, especially Venezuela (84.4% of the total). Beyond
80 It is noteworthy that Paraguay and Uruguay do not have reserves of oil, natural gas, uranium and coal.
This makes the range of energy generation possibilities in these countries more narrow, which may put
pressure on their energy security.

80
Mercosur countries, Peru and Colombia stand out with 5.7% e 1.9% of total proven
natural gas reserves in South America in 2015, respectively.
Table 12. Proven natural gas reserves, by country, in TCF (1990-2015)
Country 1990 1995 2000 2005 2010 2015
Ar 23.3 21.9 27.5 15.5 12.7 11.7
Bo 3.9 4.6 24.0 26.1 9.9 9.9
Br 4.2 5.3 7.8 10.6 14.7 15.0
Ve 121.1 143.4 146.5 152.5 192.7 198.4
Mercosur 152.5 175.2 205.8 204.7 230.0 235.0
AS 168.0 190.1 219.2 220.3 247.9 254.0
% Mercosur/AS 90.8 92.2 93.9 92.9 92.8 92.5
Source: CIER (2016); TFC = trillions of cubic feet.
Regarding the available energy data for the region, in addition to CIER’s data and reports,
the recent creation of the Latin America and the Caribbean Energy Information System
(sieLAC-OLADE) in 2017 should be mentioned81. The sieLAC-OLADE is an energy
information platform that allows OLADE to integrate, process and disseminate official
statistical, socioeconomic, legal and documental information concerning the energy
sector of its 27 member countries, based on standardized methodologies and concepts that
allow consolidation of information at the national, subregional and regional levels.
In the following subsections, we will make a brief comparative analysis of several
qualitative and quantitative variables in order to summarize projects that are related to
regional integration and recent energy policies in the different Mercosur countries. Thus,
we sought to shed light onto the inexistence of an effective regional policy for the bloc
countries, since the existing policies are heterogeneous and uncoordinated. Nevertheless,
this diversified pattern can actually encourage and promote greater regional energy
integration.
3.1 Argentina
Argentina is the second largest country in South America in terms of territorial extension
and the third according to the number of inhabitants (after Brazil and Colombia). Its
81 Infographics that will be presented for each of the countries come from this database.

81
territory comprises 2.80 million km2 with a very varied geography and different climates
due to its latitudinal amplitude and variety of reliefs. Its economy is diversified with a
large industrial and service production as well as the exploitation of natural resources.
However, following the patterns of the region, the main export item comes from the
agricultural primary sector, with soy being the main component. Its population comprises
43.8 million inhabitants and it has a per capita GDP of US$ 12,454.34 at current prices,
which is why it is included in the segment of high-income countries.
Like other countries in the region, Argentina also undergone a recent process of
privatization and institutional reform of its electricity sector. Studies find evidence that it
increases both access to and quality of service (GONZALEZ-EIRAS and ROSSI, 2007)
for lower income groups82 (MOOKHERJEE and McKENZIE, 2005).
In Argentina, the Ministry of Energy and Mining (MINEM) is responsible for the policies
and guidelines of the electricity sector. The regulation and supervision are in the hands of
the National Electricity Regulatory Entity (ENRE), although in fact the electrical
regulation is provincial (there are 24 different regulators). Wholesale Electricity Market
Administrator Company (CAMMESA) manages the wholesale electrical market and the
Federal Electrical Energy Council (CFEE) is responsible for the monitoring and follow-
up of national and municipal governments.
With regard to electricity generation, there are private and state-owned companies
utilities, Yacyretá (Ar-Py) and Salto Grande (Ar-Uy). Regarding transmission, there is
the Argentine Interconnection System (SADI), with two subsystems that compose it, the
High Voltage Electric Power Transport System (STAT) and the Trunk System (ST). The
transmission companies are Transener (only of STAT), Transba, Transpa, Transnoa,
Distrocuyo, Transnea, Transcomahue. Concerning distribution, most of the distribution
companies belong to private concessionaires and each province has its own. In Buenos
Aires, they are Distribution and Marketing Company of the North S.A (EDENOR), South
Distribution Company S.A. (EDESUR) and Distribution Company of La Plata S.A.
(EDELAP). Commercialization is controlled by CAMMESA and the studies/planning of
the electricity sector are under the authority of different MINEM secretariats, such as the
Secretariat of Strategic Energy Planning.
82 They argue the same for the Bolivian case.

82
Regarding the hydrocarbon sector, MINEM continues to be responsible for the design of
policies and guidelines. Concerning regulation and supervision, the National Regulatory
Entity for Gas (ENARGAS) regulates the gas market; there is not properly an agent
responsible for regulating the oil sector, with the normative competence of MINEM itself.
With regard to exploration and production (E&P), the Undersecretariat of Enargas is
responsible for the gas sector and the Undersecretariat for Exploration and Production of
MINEM for oil. There is great participation of Fiscal Oilfields (YPF S.A.) and private
companies such as Petrobras Argentina, Pan American Energy Sucursal Argentina, LLC
and Total Austral S.A. The refining, transportation and commercialization remain within
the Undersecretariat of Refining and Marketing of MINEM and private companies.
Figure 7 presents the Argentine summarized energy balance in 2015. Based on it, it can
be seen that the primary supply (85,351.13 ktoe) is composed of natural gas (47,011.56
ktoe, 55.1%), crude oil (26,695.42 ktoe, 31.3%), other primaries (4,361.63 ktoe, 5.1%),
hydropower (3,565.00 ktoe, 4.2%), nuclear (2,203.75 ktoe, 2.6%) and coal (1.513.77
ktoe, 1.8%). In final consumption (59,064.28 ktoe), we can see the importance of
transport (18,722.94 ktoe, 31.7%), residential (15,056.74 ktoe, 25.5%) and industrial
(13,400.04 ktoe, 22.7%), being 18.9% supplied by electricity. In Mercosur, Argentina
corresponds to 18.0% of primary supply and 16.8% of final consumption. In the total
supply, it is noted that 3.2% of crude oil, 20.3% of natural gas and 94.6% of coal are
imported. 5.8% of electricity are imported and 0.04% is exported.

83
Figure 7. Argentine summarized energy balance (2015, in ktoe)
Source: sieLAC-OLADE.
84
Argentina’s electricity sector has an installed capacity of 32,594 MW, most of which
comes from conventional thermal (19,519 MW) and hydroelectric (11,108 MW) sources.
It is followed by nuclear power with 1,755 MW and in terms of non-conventional
renewable energy (NCRE) there is not much development, with an installed capacity of
212 MW.
According to 2017 OLADE Energy Statistics Yearbook, in terms of electricity, the life
extension process of the Embalse Nuclear Power Plant is satisfactorily developed. The
reconditioning will allow it to operate for a new cycle of 30 years. In addition, the plant
will increase its power to 683 MWe, that is, 6% more than its current generation capacity.
Regarding renewable sources, Argentina launched the 2016-2025 Renewable Energy
Program (RenovAr)83, directed to the contracting in the Wholesale Electricity Market
(MEM) of electricity from renewable sources with a total requirement of 1,000 MW,
under Round 1, which would be added to the energy supply of the country, divided as
follows: 600 MW of wind, 300 MW of solar power, 65 MW of biomass, 20 MW of small
hydroelectric projects and 15 MW of biogas. With these new additions, the country would
save about US$ 300 million per year in fuel imports for electricity generation and avoid
the emission of almost 2 million tons of CO2 (MtCO2) into the atmosphere annually
(OLADE, 2017). This plan is part of the goal established with the law 27.191/201584, in
which the country should count on 20% of renewable energy generation until 2025
(CIER, 2017b).
Considering South America, Argentina is actually the last country to use its water
resources for electricity generation, with only about 30% of its electricity coming from
water sources (half the regional average). 63% of Argentine electricity comes from
thermal power plants, which mostly use gas as fuel, what represents a considerable
expenditure of foreign exchange, besides being a non-renewable resource. The country
has only a few large hydroelectric plants, two of which are binational: Yacyretá (with
Paraguay) and Salto Grande (with Uruguay).
83 See: http://www.eeeuu.mrecic.gov.ar/userfiles/v7/presentacion-energia-espanol-6%282%29.pdf. 84 See: http://asades.org.ar/aspectoslegales/ley27191.pdf.

85
The Yacyretá Binational Entity (EBY) was created in 1973 (Treaty85 of Yacyretá) to take
advantage of the hydroelectric potential of the Paraná River. The plant has 20 turbines
(3,200 MW of installed capacity). The first one went into operation in 1994 and the last
one in 1998. It is represented on the Paraguayan side by National Electricity
Administration (ANDE) and the Argentine side by Emprendimientos Energéticos
Binacionales S.A. (EBISA)86 – EBY is the dam operator. The Treaty establishes equal
rights for both parties and right of each High Contracting Party, at the cost of the work,
of 50% of the generated energy.
However, it should be noted that the experience of the binational hydroelectric plant of
Yacyretá begins with an agreement between both countries in 1926, in which they express
their interest in exploiting available hydroelectric resources in the Paraná River and the
use of the Apipé Falls. In 1958, the governments signed an agreement to carry out
technical studies (energy and navigability), and the Argentine-Paraguayan Joint
Technical Commission of Yacyretá-Apipé was formed.
In turn, Salto Grande is a project from the late nineteenth century; it was created in 1973
(when the Treaty of Limits of the Rio de la Plata was signed) to exploit the hydroelectric
potential of the Uruguay River. The first generating unit of this project came into
operation in 1979, and by 1994 the project was completely paid up. It has 14 Kaplan
turbines (1,890 MW of installed capacity) and is represented by CAMMESA, and the
other half belonging to the Uruguayan system, administered by ADME, with the Mixed
Technical Commission of Salto Grande as operator.87
One of its main antecedents is the Agreement of 1946 between Argentina and Uruguay
by which a Mixed Technical Commission was formed. The Salto Grande exploitation led
to the interconnection of the two national systems in voltage levels of 500 kV. This
85 The process of signing international treaties is characterized by a series of formalities that in most cases
involve the approval or ratification by the Congress or Legislative Assemblies of countries part of it. This
formal component prevailing in Public International Law represents great advantages in terms of
legitimacy, however it implies a great complexity and delay to the process, for limiting or reforming the
commitments assumed (ABADIE et al., 2017). 86 The Presidents of both countries signed a memorandum of understanding that includes the return of the
balances of the contributions made by Argentina during the construction of the Yacyretá Hydroelectric and
a plan to use the revenues of the dam to make investments and expand its generation capacity. This
agreement reflects a restoration of relations between both countries, postponed years ago (CIER, 2017c). 87According to its official website, Salto Grande is the most important energy producer and supplies more
than 50% of the energy consumed in Uruguay. Meanwhile, Salto Grande provides between 7 and 8% of the
energy required in Argentina.

86
interconnection was finalized under the Energy Interconnection Agreement (1974), and
then with the Agreement on Execution of the Energy Interconnection Agreement of 1983.
It is worth mentioning the Black Water Tunnel (Tunel Agua Negra) project. It is a 14 km
tunnel that will pass under the Andes mountain range, connecting Argentina and Chile. It
is part of a long-standing project that aims to optimize logistics and improve physical and
also energy connection between the Atlantic Ocean and the Pacific88 (CIER, 2017c).
There are two projects that have not yet been implemented involving Argentina: Garabí-
Panambí (Ar-Br) and Corpus (Ar-Py). In the first case, the axis of Garabí exploitation
would then be located at kilometer 863 of the Uruguay River, about 6 km downstream
from Garruchos (Argentina and Brazil). The installed capacity would be 1,152 MW,
distributed in 8 turbine-generator sets. The axis of the Panambí exploitation would be
located at kilometer 1,016 of the Uruguay River, about 10 km upstream from the localities
of Panambí (Argentina) and Porto Vera Cruz (Brazil). The installed capacity would be of
1,048 MW, distributed in 7 sets turbine-generator.89 It is worth mentioning that in 2008
and 2009 the Brazilian company Eletrobras and Argentina’s EBISA signed cooperation
agreements to jointly execute an inventory study of the Uruguay River.90
Designed still in the 1970s, Corpus is located in the triple border between Paraguay,
Brazil and Argentina. It is located on the Paraná River downstream from Itaipu and has
an installed capacity of 3,400 MW. Corpus is hydrologically linked to Itaipu and
Yacyretá, being designed to make optimal use of Itaipu Falls. In October 1979, the Itaipu-
Corpus Tripartite Agreement was signed91. ‘It is relevant to stress that the project is
situated near highly developed basins and thereby generates benefits to the Brazilian
preservation system and thermal complementarity to Argentina.’ (RAMOS, 2016: 93).
Regarding international interconnections and international trade, Argentina has
connections with four of its five neighboring countries. With Brazil there are two
interconnections: Rincón Santa María (Ar) – Garabí (Br) of greater capacity and in force
88 See: http://www.ebitan.org/proyecto.php. 89 See: http://garabipanambi.com.ar/obras_proyectadas.html. 90 Eletrobras has decided to suspend technical and environmental feasibility studies on the Garabi HPP,
pending the outcome of legal proceedings related to the AHE Panambi. The studies for Panambi were
suspended due to the injunction of the 1st Federal Court of Santa Rosa, as a result of a public action by the
Federal Public Prosecutor of the region, which was maintained by the Federal Regional Court of the 4th
Region. See: http://eletrobras.com/pt/Lists/noticias/ExibeNoticias.aspx?ID=240. 91 It results from a trilateral study whose goal was to optimize the joint use of the Paraná River (FAJARDO,
2004).

87
since the beginning of the last decade, and Paso de los Libres (Ar) – Uruguayana (Br),
much smaller and located in the Southeast of the Province of Corrientes. With Chile, the
country has the Termoandes Cobo (Ar) – Atacama (Ch) line, connected to the
Interconnected System of the Norte Grande (SING). With Paraguay, there are two
interconnections: the El Dorado (Ar) – Carlos López (Py) line and the Colrinda (Ar) –
Guarambaré (Py) line, in addition to the binational Yacyretá plant. There are three
interconnections with Uruguay: the Concepción del Uruguay (Ar) – Paysandú (Uy) line,
the Colonia Elía (Ar) – San Javier (Uy) line and the Colonia Elia (Ar) – San Javier (Uy)
line, as well as Salto Grande binational power plant. With Bolivia, the countries are not
currently interconnected, but there is mutual interest in moving forward.
As already stressed in subsection 2.3.2, in South America there is no regional or integrated
market such as the Regional Electricity Market (MER) in Central America. The
exchanges that take place between Argentina and its neighbors are given (i) under a
framework of previously established agreements such as the cases of binational dams; (ii)
private contracts between parties in which an agreed price is compensated; or (iii)
generation surpluses where companies comply with the rules of the MEM and take spot
prices (COCIER, 2016).
Figure 8 shows Argentine energy trade, both exports and imports (2014, in 2000 US$).
When it comes to exports, the crude oil to USA (US$ 387m; 64.4%) and India (US$ 79m;
13.1%) stands out, as well as oil products to Chile (US$ 83m; 34.9%) and Brazil (US$
58m; 24.4%). When it comes to imports, the gas from Bolivia (US$ 861m; 66.4%), Qatar
(US$ 202m; 15.6%) and Spain (US$ 132m; 10.2%) stand out, as well as crude oil from
Bolivia (US$ 90m; 68.7%), and electricity from Paraguay (US$ 177m; 91.7%) and
Uruguay (US$ 16m; 8.3%).

88
Figure 8. Argentine energy trade, both exports and imports (2014, in 2000 US$)
Source: IADB Energy Database based on UN COMTRADE.
Recently, the country signed a memorandum of understanding (MOU) with China,
reaffirming the will to build two nuclear power plants in Argentina with financing from
Chinese banks; one with Canadian Deuterium Uranium (CANDU) heavy water reactor
technology, which is the same one used by the Embalse plant; and the other PWR with
which a leap will be made towards enriched uranium and light water technology
(OLADE, 2017).
Regarding the hydrocarbon sector, although 89.4% of the national oil production is
distributed in 10 companies, only YPF represents almost 50% of it; in terms of natural
gas production, it represents around 35% (LARA, 2017). In 2016, proven oil reserves
were 2,167 Mbbl, with a twelve-year reach. The refining capacity is 632 kbbl/d, especially
the production of the following derivatives: diesel oil and gasoline/alcohol.
Concerning natural gas, in 2004 the first internal supply crisis took place, and
consequently supply restrictions began towards the Chilean market and the idea of
integration continued to take on new forms. As the gas supply crisis in Argentina
deepened (relieving the insufficiency of price adjustments as a mechanism to encourage
private investment), the main adjustment variable to satisfy the growing domestic demand

89
was the progressive increase in the cuts in gas supply to Chile. These cuts, which
occasionally represented 40% in some days of 2004, reached almost 60% for longer
periods in 2006 and 2007 (RUDNICK et al., 2007). Although the case of Chile is one of
the most dramatic, Argentina progressively suspended its exports to all neighboring
countries for which export infrastructure had been built, such as Brazil and Uruguay
(CAF, 2013e). It is thus perceived that international relations with the neighboring
country were affected by its domestic situation, which has already been presented as one
of the main barriers to the progress of regional energy integration (see subsection 2.3.1).
The country has great potential in the exploitation of unconventional hydrocarbon
resources, such as shale gas. For this reason, Argentina has sought to promote investments
in the non-conventional oil and gas fields of Vaca Muerta, 30,000 km2 megacamp (and
which YPF owns the concession of more than 12,000 km2), in Patagonia (south-west of
the country), which is spread over the provinces of Neuquén and Mendoza. The area is
the world’s second reserve in shale gas and the fourth in shale oil. However, it should be
noted that the exploitation of unconventional hydrocarbons comes surrounded by
environmental questions, because (i) it uses a lot of water; (ii) pollutes the water; (iii) uses
chemicals; and (iv) there is a relationship with seismic activity where wells are made.
3.2 Bolivia
The Plurinational State of Bolivia is located in the geographical center of South America
with a population of 10.9 million inhabitants over an area of 1.09 million km2. Its territory
has a very varied topography, with altitudes that vary a lot. Regarding its economy, it is
possible to mention the agricultural sector, which is one of the most important sectors in
Bolivia, with soy being the main product. The GDP per capita at current prices is US$
3,100.92, and it has a low average income level.
In Bolivia, it is possible to cite the newly created Ministry of Energy (ME), which has a
greater focus on renewable energies92. Policies and guidelines of the electricity sector are
92 This movement is in line with the goal of reducing fossil fuel consumption and increasing the indication
of renewables, with particular emphasis on hydroelectric, wind, geothermal and solar energy. In this
context, the geothermal project of Laguna Colorada located on the border with Chile can be highlighted.
Another major challenge for the Ministry of Energy is to ensure the construction of the El Bala hydroelectric
megaproject in the north of the department of La Paz, as well as the Nuclear Research and Development
Center in El Alto.

90
the responsibility of the Vice Ministry of Electricity and Alternative Energies (VMEEA)
and Vice Ministry of High Energy Technologies. Regulation and supervision are in the
hands of the Electricity Control Authority (AFCSE). The National Dispatch Committee
(CNDC) coordinates the dispatch.
With regard to electricity generation, there are private and state-owned companies
utilities, like Empresa Eléctrica Corani S.A. (CORANI), Empresa Eléctrica Guaracachi
S.A. (EGSA), Empresa Eléctrica Valle Hermoso S.A. (EVH), Bolivian Power Company
(COBEE), Empresa Rio Eléctrico S.A. (ERESA), Hidroeléctrica Boliviana S.A. (HB),
Sociedad Industrial Energética y Comercial Andina S.A. (SYNERGIA), Compañía
Eléctrica Central Bulo Bulo S.A. (CECBB), Guabirá Energía S.A. (GBE), National
Electricity Company (ENDE), ENDE Andina, Servicios de Desarrollo de Bolivia S.A.
(SDB) y SECCO Bolivia S.A. In the same way, the production of electricity in the
Isolated Systems (IS) is controlled by various companies and cooperatives, such as
ENDE, Servicios Eléctricos Tarija S.A. (SETAR), SECCO Bolivia S.A., Cooperativa
Rural de Electricidad Ltda. (CRE), Gas & Electricidad S.A. (G&E), Cooperativa de
Servicios Eléctricos de Guayaramerín Ltda. (COSEGUA) and Cooperativa Eléctrica
Riberalta Ltda. (CER). The transmission is up to ENDE Transmissión S.A. and
Interconexión Eléctrica ISA Bolivia S.A (ISA Bolivia). Private actors are responsible for
distribution, such as CRE, DELAPAZ, ELFEC, ENDE DEORURO, SEPSA, SETAR,
CESSA, ENDE DELBENI, ENDE, EMDEECRUZ. Vice-Ministry of High Energy
Technologies (VMATE) and the Bolivian Hydrocarbons Industrialization Company
(EBIH) provide studies and planning concerning the electricity sector.
Regarding the hydrocarbons sector, there is the Ministry of Hydrocarbons (MH), formerly
the Ministry of Hydrocarbons and Energy, whose regulatory agency is the National
Hydrocarbons Agency (ANH). Before, there was only one ministry, or the Ministry of
Hydrocarbons and Energy (MHE). Exploration and production (E&P) are the
responsibility of Petrobras Bolivia (Tarija, Santa Cruz and Chuquisaca Departments),
Yacimientos Petrolíferos Fiscales Bolivianos (YPBF), YPBF - Andina S.A., YBPF -
Chaco S.A., YPBF - Petroandina S.A. Refining and transmission are the responsibility of
Petrobras Bolivia (transport), YPBF Refinación S.A., YPBF Transporte S.A., YPBF
Transierra S.A., YPBF Logistica S.A, while the commercialization is controlled by YPBF
Aviación and Flamagas S.A.

91
Figure 9 presents the Bolivian summarized energy balance in 2015. Primary supply
(8,154.41 ktoe) consists of natural gas (3,813.70 ktoe, 46.8%), crude oil (3,047.58 ktoe,
37.4%), other primaries (1,081.34 ktoe, 13.3%) and hydropower (211.79 ktoe, 2.6%). In
the final consumption (6,536.02 ktoe), transport (2,793.09 ktoe, 42.7%), industrial
(1,654.76 ktoe, 25.3%), residential (1,135.46 ktoe, 17.4%) and agriculture, fishing and
mining consumers (702.16 ktoe, 10.7%) stand out, being 10.4% supplied by electricity.
Considering only the Mercosur, Bolivia corresponds to 1.7% of its primary supply and
1.9% of final consumption. It is noteworthy that 79.0% of natural gas produced are
exported and that the country stands out because it has the second largest reserves of
natural gas in the Southern Cone.

92
Figure 9. Bolivian summarized energy balance (2015, in ktoe)
Source: sieLAC-OLADE.

93
Its electricity sector is composed of two separate systems: the first one (largest) covers
the entire group of generation, transmission, distribution and consumer companies of the
National Interconnected System (NIS); while the second one (much smaller) is known as
the group of Isolated Systems (IT)93. They have together an installed capacity of around
1,890 MW from 73.3% of thermal power plants and 25.4% of hydroelectric power plants.
Regarding international trade, Art. 9 of the Electricity Law of 21/12/199494 covers
electricity exports and imports and international interconnections. It is necessary to take
into account that the price of the electricity tariff includes the energy component that is
determined by the price of gas, subsidized for domestic consumption. This subsidy
determines a cost in the domestic market lower than that of export. There are currently
no such transactions, but Bolivia plans to export electricity to Argentina as it has a
surplus95 of around 580 MW (COCIER, 2016). With respect to international
interconnections, the ENDE seeks to consolidate the interconnection with Argentina,
Brazil, Peru and Paraguay (COCIER, 2017a)96.
It is noteworthy that Bolivia has no connection to its neighboring countries (although it
is in the center of the subcontinent), albeit it shows interest in becoming ‘South American
energy heart’97. This isolation represents an opportunity for investments in international
electrical interconnection, as well as other projects to promote regional energy
integration. The Bolivian Government plans to invest around US$ 5,854 million in the
2016-2020 period and generate about 4,878 MW, of which 53,1% would be earmarked
for export, according to the Economic and Social Development Plan98.
Figure 10 shows Bolivian energy trade in terms of both exports and imports in 2014.
When it comes to exports, gas to Brazil (US$ 375m; 60.6%) and Argentina (US$ 244m;
39.4%)99 stands out, as well as crude oil to Argentina (US$ 24m; 48.0%) and China (US$
93 Similar to Brazilian case. 94 See: https://www.lexivox.org/norms/BO-L-1604.xhtml. 95 Most of this surplus is from the natural gas supply, but there is an inventoried hydroelectric potential of
over 30 GW (RAMOS, 2016). 96It is believed that interconnection with Argentina will be completed by 2018. 97In different occasions, it is mentioned the interest in generating surpluses of electricity production to
export. This decision is closely related to the diversification of the country’s own sources of income. It is
evident in the Economic and Social Development Plan 2016 - 2020, Pillar 7 (Sovereignty over our natural
resources). See: http://www.planificacion.gob.bo/pdes/. 98 See: http://www.planificacion.gob.bo/pdes/. 99 In 2015, trade movements from Bolivia to Argentina was 5.8 bcm and 10.4 bcm to Brazil. In the same
year, Bolivia produced 20.3 bcm, while Argentine and Brazil produced 36.5 bcm and 23.1 bcm,
respectively (BP, 2017).

94
20m; 40.0%). When it comes to imports, we can mention oil products from Brazil (US$
8m; 80.0%) and Peru (US$ 1m; 10.0%).
Figure 10. Bolivian energy trade, both exports and imports (2014, in 2000 US$)
Source: IADB Energy Database based on UN COMTRADE.
Regarding regional integration, although the country does not have international
interconnections, it participates in one of the most famous cases of bilateral project in the
region: the Bolivia-Brazil Gas Pipeline (GASBOL)100. Being the central axis of the
bilateral relations between both countries 101, Bolivia has exported nearly two thirds of its
natural gas production since 1999, accounting for about half of the country’s tax revenues
and generating most of its foreign currency denomination (BIATO, 2016). In addition,
Brazilian imports of Bolivian gas corresponded to 30% of the total Brazilian market
supply in 2015 (CNI, 2016)102. It is noteworthy that the Transportadora Brasileira
100 See Figure 6, where the GASBOL and Lateral-Cuiabá gas pipeline are located. The Cuiabá branch was
built to supply the local thermoelectric plant (Mário Covas TPP) and has a separate supply contract. The
Mato Grosso’s Gás Occidente is responsible for this pipeline transportation. 101 As it is Itaipu Binacional, in the case of Paraguay. 102 The volumes imported by Petrobras reached the contractual maximum, which is around 30 million
m³/day, being 80% take or pay (24 million m³/d), of which Petrobras pays or does not use natural gas. It

95
Gasoduto Bolívia-Brasil S.A. (TBG) owns and operates the Brazilian side and Gas
TransBoliviano S.A. (GTB) owns and operates the Bolivian side.103 See Appendix C.
With a total length of 3,150 km, it has its origin in Bolivia (Santa Cruz de La Sierra). Its
Bolivian extension consists of 557 km and, when entering Brazilian territory through
Corumbá-MS, it travels 2,593 km inwards, passing through 136 Brazilian municipalities
in five states: Mato Grosso do Sul, São Paulo, Paraná, Santa Catarina and Rio Grande do
Sul. At a cost of US$ 2.15 billion (US$ 1.6 billion in Brazil and US$ 400 million in
Bolivia), its transportation capacity is of 30.08 MMm³/d with a 20-year gas supply
period.104 Project funding involved four multilateral agencies and had, in addition,
BNDES participation (FRANÇA, 2015), being divided into three sections: Corumbá-
Paulínia (North), Paulínia-Guararema, and Paulínia-Canoas (South).
In 2006, under the government of Evo Morales, there was the ‘nationalization’ episode
of the Bolivian subsidiary of Petrobras105, which led Brazil to diversify its sources of
supply, whether domestic or foreign. Such an event occurred in Bolivia as a consequence
of three contexts: (i) in the political context, there was a perception that foreign investors
captured too much of generated gas rent without allowing a way to improve Bolivian
economic situation; (ii) in the economic context, especially since 2005, the international
oil prices scenario changed drastically, lowering the price of gas in different international
markets; (iii) in the technological context, technological improvements in the liquefied
natural gas (LNG) chain led to a decrease in the offer prices of this product.
As a consequence, Supreme Decree N. 28,701/2006 was issued106 by President Evo
Morales, which reversed the privatizations that took place in the 1990s in the hydrocarbon
sector. Despite pressures from different sectors of the Brazilian public sphere, President
Lula da Silva opted for the negotiation process and signed new contracts that guaranteed
the gas supply and preserved Petrobras’ main ventures in Bolivia, despite the reduction
of its profit margins (FUSER, 2010, 2015). However, it is important to note that this
breach of trust made it difficult and/or unfeasible for the negotiation of new gas
should be noted that the construction of GASBOL was one of the great developers of the natural gas market
in Brazil. 103 TBG is controlled by Petrobras and GTB by YPFB since May 1, 2008. 104 See: http://www.tbg.com.br/pt_br/o-gasoduto/informacoes-tecnicas.htm. 105 The breach of contract was euphemistically treated as ‘contract migration’, since Brazil needed imports
of Bolivian gas, since it supplied about 50% of the national demand (BIATO, 2016). 106 See: https://www.lexivox.org/norms/BO-DS-28701.xhtml.

96
prospecting contracts in Bolivia by international oil companies, it has shaken relations
between Brazil and Bolivia to date too. In this sense, Bolivia’s natural gas reserves have
been reduced, which could threaten the renewal of the Gas Agreement in 2019 (BIATO,
2016).
Considering this period of shaken negotiations with its neighbor, since 2006, with the
discovery of reserves in the Brazilian Pre-salt layer, a natural gas self-sufficiency was
projected for Brazil. However, so far, there have been major technical and economic
difficulties in harnessing the vast resources of the pre-salt, maintaining the status quo
where Brazil is remains dependent of natural gas imports from Bolivia (CNI, 2016). In
any case, the pre-salt event prompted the Bolivian state-owned YPFB to have
uncertainties regarding Brazilian intentions to renew in 2019.
The recent dramatic reduction in Petrobras’ international performance in the region is
already visible, for example, in the renewal of the gas agreement. Thus, Petrobras could
stop being a player in the purchase and distribution and, therefore, in guaranteeing the
price, so it would be up to Bolivia to negotiate directly with a number of private
companies. The immediate result of this new scenario is the following binomial: (i) lower
price; and (ii) short-term contracts.
Considering recent challenges and opportunities regarding natural gas, and based on the
2017 Yearbook Energy Statistics, the country started operating the Incahuasi Plant, in the
Municipality of Lagunillas, Department of Santa Cruz, which will inject approximately 7
Mm3/d of natural gas. This implies an increase of 12% in the national production of this
type of energy; thus, the gas supply in the domestic market and the export commitments
would be guaranteed. Government authorities informed that with the Incahuasi Plant, a
total of 104 Mm3/d of processing capacity is reached throughout the country. The
construction of this megafield demanded an investment of more than US$ 1,000 million.
Additionally, the Rio Grande LNG Plant was inaugurated, aimed at supplying natural gas
to 27 cities in the departments of Beni, La Paz, Oruro, Pando, Potosí and Santa Cruz. The
plant will send LNG in cryogenic tanks to the Regasification Satellite Stations, where the
energy goes back to gaseous state and is delivered to the distribution networks of homes,
shops, industries and service stations for vehicular natural gas (VNG). The LNG project
has the construction of the Natural Gas Liquefaction Plant, a Virtual Transport System
(cisterns) and Satellites Regasification Stations in each of the 27 cities where gas will

97
reach. This system will contribute to the development of populations where conventional
gas pipelines do not arrive at and will promote the use of natural gas, allowing the gradual
substitution of LPG and gasoline consumption. The plant is expected to process 12 Mpcd
of natural gas and produce 210 metric tons per day of liquefied natural gas.
In addition to the expansion of natural gas production and the inauguration of the LNG
plant, and similarly to the case of Peru, the construction of a binational hydroelectric plant
on the Madeira River was hampered at the beginning of the last decade by the lack of a
clearing campaign and convincing public about its benefits107 (BIATO, 2016). Similar
resistance and mistrust prevented further attempts to resume the project in 2007.
Nevertheless, as previously stated, the country intends to become the region’s ‘exporter
of electricity and has dense dialogues with Brazil aimed at jointly exploiting the potential
in the Amazon region.
It is worth mentioning the Andean Electrical Interconnection System (SINEA)108, a
project that arises from the desire to achieve a regional interconnection between countries
that make up the Andean Community (Colombia, Ecuador, Peru and Bolivia, as well as
Chile as a country associated to that entity). The aim is to create a general community
framework that allows integration in the energy market between the countries mentioned.
However, in a first stage Bolivia will participate only as an observer country. SINEA aims
to develop an Andean Electricity Corridor, creating an interconnected electrical system
between 2014 and 2024. Its planning is developed by the Technical Group of Planning
Agencies of the electricity sectors of the member countries of the Andean Community
and Chile (GOPLAN) and its regulation is within the Working Group of Electricity
Regulatory Organizations of the Andean Community and Chile (GTOR)109.
Moreover, it is worth mentioning the construction of 50 MWp photovoltaic solar power
plant Oruro, which will guarantee the supply of electricity for the National Interconnected
System (NIS). ENDE Matriz is the executing company and the project is financed by the
Central Bank of Bolivia (BCB), the French Development Agency (AFD) and the
107 Besides, there was nationalist and preservationist resistance in Bolivia, as well as reluctance of Brazilian
investors to prioritize the construction of the Cachuela Esperanza plant, located exclusively in Bolivian
territory. 108 See: http://www20.iadb.org/intal/catalogo/PE/CM%202015/15821.pdf. It should be noted that the
Galapagos Declaration (2011) creates the Council of Ministers of SINEA. See Appendix E. 109 See: https://www.enernews.com/media/briefs/integracion-electrica-regional-retos-y-
perspectivas_2016.pdf.

98
European Union (EU). The start date of the project was 2016, with the forecast of
completion in December 2018110.
It should be noted the failure of the Lliquimuni block, located in the north of the
department of La Paz, which covers an area of 156km2. The government had reported
since 2011 that the block contained 50 million barrels of oil (50 MMbbl) and one trillion
cubic feet of gas (1 TCF), according to preliminary results of a seismic exploration study
conducted by YPFB Petroandina. However, the operations of the exploratory drilling
project culminated with the discovery of ‘non-commercial’ hydrocarbon volumes,
although full exploration has required more than US$ 500 million. Despite the failure,
YPFB announced that plans to drill a second hydrocarbon well in Lliquimuni.
Another failure was the construction of the dams in the Madeira River basin. The initial
proposal was to build four plants in the region: two in the Brazilian territory (Jirau, 3,750
MW, and Santo Antonio, 3,568 MW), one in Bolivia (Cachuela Esperanza, 990 MW) and
one binational (Guajará-Mirim111, 3.000 MW), all run-of-river HPP. However, the agenda
was postponed for more than a decade, due to the erosion of bilateral relations, especially
since the nationalization of Petrobras refineries in 2006. As a result, Brazil has built the
two in its national territory, but plans for two others were on paper.
It also should be highlighted that the location of these projects facilitates the incorporation
of new energy into the Brazilian integrated grid. For Bolivia, it becomes an absolute
priority agenda, since gas exports to Brazil (reason why there was Bolivian economic
growth in the last decade) are threatened by the drop in gas prices and the depletion of
Bolivian proven reserves. By the way, it should be noted that energy integration for
Bolivia represents a vector of national development.
3.3 Brazil
The Federative Republic of Brazil is the largest country in the South American
subcontinent, both in territorial extension (8.5 million km2) and in population (207.7
million inhabitants). Due to its size, the country has noticeable regional differences and
110 See: http://www.ende.bo/NewProyectos/resena/proyecto--const.-generacion-solar-de-oruro-fase-i. 111 It will stabilize the Jirau reservoir, adding 280 average MW.

99
has a high median income level, therefore its GDP per capita at current prices is US$
8,648.05.
In Brazil, the Ministry of Mines and Energy (MME) is responsible for the electricity
sector112. Policies and guidelines are in the hands of the Presidency of the Republic, the
National Congress, the National Council of Energy Policy (CNPE) and the MME itself.
The regulation and supervision are up to the National Electric Energy Agency (Aneel)113.
State and municipal regulations are controlled by the Brazilian Association of Regulatory
Agencies (ABAR).
The National System Operator (ONS) manages the wholesale electrical market.
Accession and monitoring (national and municipal governments) is the responsibility of
the National Energy Policy Council (CNPE), the Power Sector Monitoring Committee
(CMSE), the Energy Efficiency Management Committee (CGEE) and the Electric Energy
Secretariat (SSE/MME).
Regarding electricity generation, there are private and state-owned utilities, Eletrobras114
and Itaipu Binacional (Br-Py). Regarding the transmission, there are private and state
companies, as well as in generation. There is the National Interconnected System (SIN),
subdivided into N, NE, S, SE/CO Subsystems (and isolated systems), Eletrobras,
Transmission Services Agreement (CPST), Contract of Use of the Transmission Systems
(CUST), Transmission System Connection Agreements (CCT) and Facilities Sharing
Agreements (CCI). The Brazilian electricity generation and transmission system is a large
hydro-thermo-eolic system, with a predominance of hydroelectric power plants and with
multiple owners.115
The distribution is the responsibility of the Brazilian Association of Electric Energy
Distributors (ABRADEE), Other Transmission Facilities (DIT) and Eletrobras. The
Electric Energy Trading Chamber (CCEE) and Eletrobras (majority shareholder’s
112 It is worth mentioning that, as in the case of other countries, other ministries and institutions can also
play an important role depending on the matter. As an example, we have the Ministry of Environment
(MMA), Ministry of Science, Technology, Innovation and Communications (MCTIC), including the
Federal Revenue of Brazil (RFB). 113 Depending on the matter, the National Agency for Oil, Gas and Biofuels (ANP), the Ministry of the
Environment (MMA), the National Water Agency (ANA) and the National Environment Council
(CONAMA) also play a fundamental role. 114 The company’s role in the Brazilian internationalization in the region is emphasized through investments
in neighboring countries, although the effort has translated into a slow and marginal change of scenario. 115 See: http://www.ons.org.br/pt/paginas/sobre-o-sin/o-que-e-o-sin.

100
delegation) carry out the commercialization. There is a Regulated Contracting
Environment (ACR), the Free Contracting Environment (ACL), as well as Energy
Trading Contract in Regulated Environment (CCEAR). Studies and planning of the
energy sector are the responsibility of the Energy Research Company (EPE) and the Oil,
Natural Gas and Biofuels Secretariat (SPG/MME).
The MME is also the responsible ministry for the hydrocarbon sector. The policies and
guidelines of the sector are controlled by the Presidency of the Republic, the National
Congress, the National Energy Policy Council (CNPE), as well as the MME itself. The
regulation and supervision are in the hands of the National Agency of Petroleum, Natural
Gas and Biofuels (ANP), environmental inspection agencies and the Federal Revenue of
Brazil (FRB). Concerning the exploration and production (E&P), Petrobras, International
Oil Companies (IOCs) and independent actors, supply industry to the oil sector, and
companies of the O&G value chain are the responsible entities. Petrobras and private
companies provide refining and transportation, while the commercialization is up to
traders, Petrobras and Pre-Sal Petróleo S.A. (PPSA)116.
Figure 11 presents the Brazilian summarized energy balance in 2015. Primary supply
(285,226.90 ktoe) is composed of crude oil (104,552.00 ktoe, 36.7%), other primaries
(90,964.46 ktoe, 31.9%), natural gas (39,028.90 ktoe, 13.7%), hydropower (30,853.72
ktoe, 10.8%), coal (16,006.70 ktoe, 5.6%) and nuclear (3,821.18 ktoe, 1.3%). In final
consumption (232,537.06 ktoe), transport (83,773.75 ktoe, 36.0%), industrial (81,213.58
ktoe, 34.9%), and residential consumers (24,943.13 ktoe, 10.7%) stand out, being 18.2%
supplied by electricity. In Mercosur, Brazil corresponds to 60.2% of total primary supply
and 66.3% of final consumption. Regarding supply, 14.9% is of crude oil, 41.4% natural
gas and 82.6% coal, 5.6% of electricity are imported and 0.04% are exported, 30.2% of
crude oil production are exported.
116 In the Brazilian case, Eletrobras plays an essencial role in electricity sector while Petrobras in the O&G
sector.
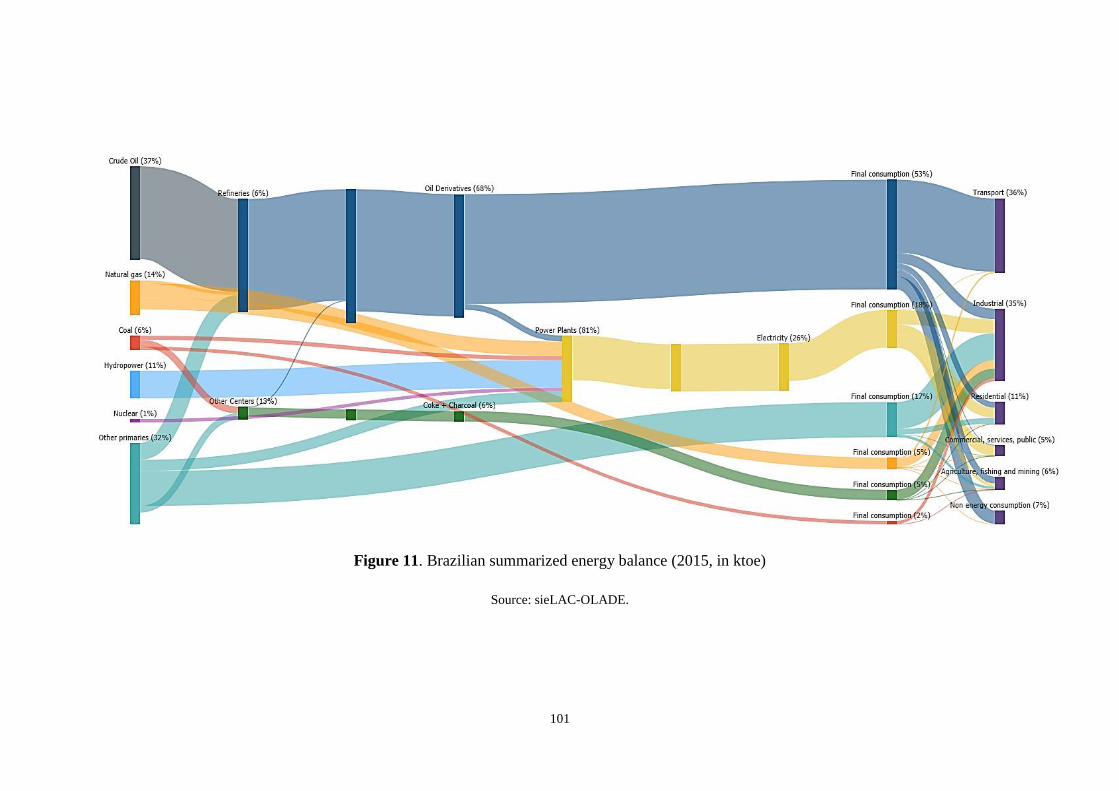
101
Figure 11. Brazilian summarized energy balance (2015, in ktoe)
Source: sieLAC-OLADE.

102
As already presented, its electricity sector is characterized by being divided into four
subsystems (North, Northeast, Southeast/Central-West and South) that interconnected
make up the National Integrated System (NIS). There is an installed capacity of 142,003
MW and hydroelectric power represents 64.9% of it. The important role of the thermal
park (18.4%) and the nuclear power plants located in Angra do Reis (1.4%) are also
highlighted. Concerning Non-Conventional Renewable Energies (NCRE), Brazil leads in
terms of installed capacity in the region, which is 21,699 MW and is composed of
biomass, wind, solar and wave.
Among the main policies in the Brazilian electricity sector, the following ones can be
mentioned: (i) energy efficiency (rational use of existing energy resources); (ii) affordable
tariff; (iii) tariff equity (to redress the uneven concentration of the negative effects of tariff
subsidies between regions); (iv) generation expansion (demand growth); (v)
diversification of the electricity matrix (reduction of hydrological risk); (vi) increased
participation of renewable sources (mitigation of emissions). It is worth mentioning that
the first auction of alternative sources took place in 2007, with small hydroelectric power
plants (SHPs) and biomass predominating. Since 2008, in reserve energy auctions
biomass, SHPs, wind (since 2009) and solar (since 2014) tend to stand out.
Among the policies that promote energy efficiency, the following draws attention: (i)
special credit lines; (ii) Labeling Programs (Procel); and (iii) Research and Development
(R&D) programs. Policies that promote affordable tariff are: (i) regulation by incentives
in the distribution segment; (ii) merit-order dispatch; and (iii) tariff flags. Regarding tariff
equity, the sectoral fund of the Energy Development Account (CDE) of the states can be
highlighted, which has been incorporated into the policies of Brazilian electricity sector
(BES) since 2013.
With regard to generation expansion, it is important to mention (i) the tariff recognition
of over-contracting by electric power distributors; (ii) centralized auctions; (iii) BNDES
financing lines; and (iv) the Special Regime for Incentives for Infrastructure
Development (REIDI). Regarding the diversification of the electricity matrix, it focuses
on (i) distributed generation; (ii) increasing natural gas generation; and (ii) incentives for
energy generation coming from domestic coal. Finally, regarding the increase in the
participation of renewable sources, we can mention (i) the Alternative Energy Sources
Incentive Program (PROINFA); (ii) discounts on the use tariffs of distribution and

103
transmission systems for consumers and generators that negotiate energy from the
incentivized sources; and (iii) reserve power auctions and auctions from alternative
sources.
According to 2017 OLADE Energy Statistics Yearbook, in terms of electricity, Belo
Monte hydroelectric plant was inaugurated in the municipality of Altamira (southwest of
Pará). Built on the Xingu River, the plant is the largest HPP in the country, the third
largest in the world (installed capacity of 11,233.1 MW)117 and its energy is already
available for the National Interconnected System118.
As presented in section 3.2, the Jirau HPP was also inaugurated, on the Madeira River,
composed of 50 turbines, with an installed capacity of 3,750 MW and an assured power
of 2,279.40 MW (currently, it is the third largest hydraulic generation plant in Brazil and
the 17th in the world). Jirau generates under the concept of run-of-river, so it does not
need a large reservoir to operate, which reduces environmental impacts associated to the
project. On the other hand, Santo Antônio hydroelectric plant advances and will have a
total of 50 turbines and an installed capacity of 3,568 MW119.
The wind generation was the one that presented a more significant expansion, with a
growth of 43.2% between November 2015 and the same month in 2016120. In the same
period there was also expansion of solar (8.4%), hydraulic (6.4%) and thermal (4.0%)
sources. The advance of renewable sources goes in the same direction of the commitment
assumed by Brazil during COP 21, of raising at least 23% to the share of renewable
energies in the electricity matrix until 2030.
Still according to the 2017 Energy Statistics Yearbook, Brazil launched the RenovaBio
initiative, aimed at expanding the participation of renewable fuels in a way compatible
with market growth and in harmony with the international commitments assumed within
the framework of COP 21. Likewise, the Chapada do Piauí Wind Power Complex was
117 With assured guarantee of 4,571 thousand average MW (MWmed), it is a run-of-river HPP. This means
that the generation will vary according to the amount of water of the Xingu River in each period of the
year. See: http://www2.aneel.gov.br/aplicacoes/hotsite_beloMonte/index.cfm?p=7. 118 The commercial operation of the second generating unit with an installed capacity of more than 611.11
MW was initiated. The liberated unit is part of the 18 generating units that will be completed and operated
gradually until 2019. 119 See:
http://ri.santoantonioenergia.com.br/santoantonioenergia/web/conteudo_pt.asp?idioma=0&conta=28&tip
o=50139. 120 It is worth mentioning the generation of direct and indirect jobs related to this industry (REN 21, 2016).

104
inaugurated in Brazil, it is made up of three wind farms, with installed capacities of 205
MW, 172.4 MW, and 59.2 MW. Consequently, as a result of the measures to stimulate
the generation of energy by the consumers themselves (micro and mini distributed
generation), Aneel registered 7,610 distributed generation connections, totaling an
installed power of 73,569 kW. Among the most used renewable energies, the solar
photovoltaic source stands out, with 7,528 connections.
Regarding energy efficiency policies, in June 2016 the incandescent lamps left the market
in Brazil. The rule applies to the import and commercialization of incandescent lamps for
general use in Brazilian territory. In addition, prohibition of selling incandescent lamps
in the country helps stimulate the adoption of efficient, more economical and durable
options, such as LED.
With these advances, Brazil ranked 2nd in hydraulic power capacity (behind China)121, 4th
in wind energy capacity (behind China, EUA and Alemanha, respectively), 3rd in solar
water heating capacity (behind China and Turquia), 2nd in biodiesel/ethanol
production122 (behind USA in both cases). This data is presented in the Renewables 2016
Global Status Report (REN 21, 2016).
It is important to highlight the role of the private sector in these cases. Within Latin
America and the Caribbean (LAC) region, the highest private participation in
infrastructure (PPI) investment was driven by Brazil123. The top market for PPI
investment in 2016 was Brazil, where US$14.2 billion in investment in the energy sector
accounted for 93% of the total transaction volume of US$15.2 billion (World Bank
Group, 2016).
Concerning binational ventures, Brazil participates in GASBOL (see subsection 3.2) and
in Itaipu Binacional (to be detailed in subsection 3.4). Regarding international electricity
121 Brazil has 8.6% of the world's hydraulic capacity in 2015, behind China (27.9%). 122 24% of global biofuel production in 2015, begind the USA (46%). 123 Investment in infrastructure with private participation in Emerging Markets and Developing Economies
(EMDEs) fell sharply in 2016. US$71.5 billion committed across 242 projects in 2016 represents a 37
percent decline in investment compared to 2015 and a 41 percent decline compared to the annual average
of US$121.4 billion over 2011 to 2015. The number of infrastructure projects with private participation in
EMDEs also declined substantially. The 242 projects recorded in 2016 is 27% lower than the number of
projects in 2015, which had 334 projects reach financial closure, and 57% lower than the annual average
of 421 projects per year over 2011–2015 (World Bank Group, 2016).

105
trade, Brazil has interconnection agreements124 with Argentina: Rincón S.M. (Ar) –
Garabí (Br), of 2,200 MW (greater capacity and in force since the beginning of the last
decade) and P. de los Libres (Ar) – Uruguayana (Br), of 50 MW; Paraguay: Itaipu energy
of 14,000 MW, and Foz de Iguazú (Br) – Acaray (Py), of 50 MW; with Uruguay:
Livramento (Br) – Rivera (Uy), 70 MW; and with Venezuela: Boa Vista (Br) – El Guri
(Ve), of 200 MW, not integrated into the interconnected system125. In fact, the exchanges
that take place between Brazil and its neighbors are largely due to pre-established
binational agreements such as that of the Itaipu binational power plant (see section 2.3).
There are also exchanges that respond to contracts between private or surplus energy, the
latter targeting the spot market (COCIER, 2016, 2017a).
Figure 12 shows Brazilian energy trade for both exports and imports in 2014. When it
comes to exports, crude oil to USA (US$ 1,296 m; 28.9%), China (US$ 1,197m; 26.7%),
India (US$ 741m; 16.5%) and Chile (US$ 648m; 14.4%) stands out, as well as biofuels
and waste to Japan (US$ 41m; 82.0%). When it comes to imports, crude oil from Nigeria
(US$ 1,897m; 87.4%), Algeria (US$ 168m; 7.7%) and Colombia (US$ 51m; 2.3%) stands
out, as well as gas from Bolivia (US$ 920m; 69.9%), Spain (US$ 92m; 7.0%) and Norway
(US$ 90m; 6.8%), coal from USA (US$ 219m; 32%) and Colombia (US$ 126m; 18.5%),
oil products from the USA (US$ 294m; 77.4%), and electricity from Paraguay (US$
413m; 100.0%).
124 Regarding interconnection, the Brazilian regulation allows international interconnections to be included
in the country’s high voltage system (SIN), which is remunerated by all generators and consumers through
annual fixed payments, known as ‘tariffs for use of transmission system’ (TUST). 125 In this case, it makes room for understanding the role for international interconnections in (Brazilian)
regions like this outside the National Interconnected System (NIS).

106
Figure 12. Brazilian energy trade, both exports and imports (2014, in 2000 US$)
Source: IADB Energy Database based on UN COMTRADE.
Regarding the hydrocarbon sector, it is important to emphasize that for the first time in
history the country ended a year with a surplus in the oil account, with a positive result
of US$ 410 million in 2016. To encourage investments in the hydrocarbon sector,
guidelines for the 14th bidding round of blocks for oil and natural gas exploitation were
approved, for the 2nd round of pre-salt block auctions and for the 4th bidding round for
marginal fields. Moreover, Brazil broke record production of natural gas and reached
111.1 Mm3/day, which represents an increase of 18% in comparison with November
2015. The total production of oil and natural gas in November was approximately 3.307
Mbep/day. In turn, oil production totaled 2.609 Mbbl/day, an increase of 9.6% in relation
to the same month in 2015. The Lula field, in the Santos Basin, was the largest producer
of oil and natural gas, producing, on average, 663.2 kbbl/day of oil and 29.2 Mm3/day of
natural gas. The volume of oil was the largest produced in a single field, surpassing the
previous record reached in September 2016, when Lula produced 639,700 bbl/día
(OLADE, 2017).
Considering the recent challenges and opportunities, the Arco Norte Project, designed by
Eletrobras, aims to build an approximately 1,800 km transmission line involving Brazil,

107
Guyana, Suriname and French Guiana126. During the Rio+20 (2012) meetings, it was
recognized as an important contribution to the Latin America and the Caribbean (LAC)
SE4ALL initiative, whose goal is to end energy poverty in the region. In 2013, the IDB
approved funding of US$ 1.9 million. Between 2014 and 2015, the baseline study (already
concluded), the pre-feasibility study, and the public consultation of identified alternatives
were carried out. It is worth highlighting the difference between the countries of the
region in terms of average generation costs (US$/MWh), since those of Guyana and
Suriname are higher than the long-term Brazilian marginal cost (US$ 56/MWh)127. See
Appendix D.
Among the challenges that lie ahead, Brazil will face difficulties concerning the
integration of large quantities of variable generation, mainly due to the lack of storage
capacity of new hydroelectric plants. However, in the LAC region there are very good
examples of integration of large amounts of non-conventional renewable energy (NCRE)
and non-manageable, like Nicaragua, Honduras, Costa Rica, Chile and Uruguay among
others, what contributed to break some myths. Among them, four stand out: (i) NCREs
could only have a small participation because they were of poor quality; (ii) NCREs are
very expensive and require subsidies; (iii) sudden variations in production make NCREs
ungovernable (this would be only true if they were concentrated in a single point); (iv)
the NCRE require a thermal backup of the same magnitude as their power to cover them
in case they could not produce (however, in the sites where a large percentage of NCRE
penetration was reached, there is a drastic reduction of thermal backup needs and a large
synergy between classical hydroelectric power station and the NCRE with regard to the
firm power) (CIER, 2016b).
Finally, another major challenge to the Brazilian electricity sector is the privatization of Eletrobras.
On January 19, 2018, the Planalto Palace released a bill with rules for privatization. The
government expects the privatization to increase the cash of the National Treasury in 2018, raising
about R$ 12.2 billion (around US$ 4 billions). Today, the Brazilian Union holds 51% of the
common stock (with voting rights) and a 40.99% stake in Eletrobras’ total capital. The government
126 The initiative needs a conversion system, since the frequency in French Guiana is 60Hz and in other
countries it is 50Hz. The national companies participating in the project are the Guyana Energy Agency
(GEA), company of Guyana; N. V. Energiebedrijven Suriname (EBS), company of Suriname; Electricité
de France S.A (EDF), company of French Guiana; Brazilian Electric Power Company S.A. (Eletrobras),
agency of Brazil. 127 See: http://www.kas.de/wf/doc/kas_20056-1442-5-30.pdf?160825232459.

108
also proposes a corporate restructuring to keep Eletronuclear and Itaipu Binacional, both
subsidiaries of Eletrobras, under control of the Union, so that they remain outside the State’s
privatization process. Currently, the company is responsible for 70,201 km of transmission lines
(47% of the national total).
In the case of Brazil, we concluded that new binational hydroelectric plants and/or
international interconnections could avoid the dispatch of thermal power plants, which
now have social (tariff increase) and environmental effects (emission increase). In
addition, the difficulty in approving new reservoir hydroelectric plants in the country has
led Brazil to finance and push the construction of (bi)national plants in other neighboring
countries or to demand regional agreements submitted to the particularities of the
Brazilian model. This behavior, to a certain extent, reinforces that regional integration
has served national objectives, making room for questioning the country’s role in this
process. The Peruvian Amazon dam (Inambari) and the Bolivian Amazon dam (Cachuela
Esperanza and Guajará-Mirim) represent cases in which the Brazilian role has been
questioned through strong popular repression.
3.4 Paraguay
Paraguay has 6.7 million inhabitants and is located in the central region of the
subcontinent. It has a territorial extension of 406.7 thousand km2 divided into two large
regions by the Paraguay River. They have different geology and topography. Agricultural
products are its main exports, among which soybean stands out in first place and with
more than 40%. The GDP per capita at current prices is US$ 4,089.55 and therefore
Paraguay can be placed within the segment of low middle-income countries.
In Paraguay, the Vice Ministry of Mines and Energy (VMME), within the Ministry of
Public Works and Communications (MOPC), is the ministry responsible for the
electricity sector. The policies and guidelines of the electricity sector are up to the
National Energy Board, the Energy Resources Directorate of VMME and the National
Electricity Administration (ANDE). The regulation and supervision are in the hands of
ANDE, the National Council of Public Companies (CNEP), the National Council of the
Environment (CONAM) and the Secretariat of the Environment (SEAM). There is no
electricity wholesale market in the country.

109
ANDE, Itaipu (14,000 MW equally shared with Brazil), Yacyretá (3,200 MW equally
shared with Argentina) and Acaray (210 MW) are responsible for the electricity
generation. With regard to transmission and distribution, ANDE is the responsable actor
in the National Interconnected System (NIS), subdivided into Eastern, Central, South,
North, West and Metropolitan Systems. Thus, ANDE constitutes a monopoly of
generation, transmission and distribution (excluding the case of binational plants). There
is no commercialization of electricity; in fact, there are special conditions for some large
consumers, included in the Decree N. 2,109/1994128, for the installation of large
consumers connected at 220 kV and 66 kV levels, and the Decree N. 12,507/2001129,
which establishes the supply conditions for a future cellulose processing plant in the south
of the country. The Energy Resources Department is responsible for the studies and
planning of the sector.
Regarding the hydrocarbon sector, it is the responsibility of the Vice Ministry of Mines
and Energy, within the MOPC, and the Ministry of Industry and Commerce (MIC), which
deal with industry policies and guidelines, as well as regulation and supervision.
Regarding exploration and production (E&P), Petróleos Paraguayos S.A. (Petropar) and
several private companies are the responsible players. The transportation is with Petropar,
while the commercialization is up to Petrobras, ESSO, COPETROL, Barcos y Rodado,
PUMA, GAS CORONA, HIPASA, SUGAS, Lima Gas, Gas del Este, Yacyretá, Acaray
Gas, COPESA, Petrogas and Norte Gas.
Figure 13 presents the Paraguayan summarized energy balance in 2015. Primary supply
(8,333.84 ktoe) is based on hydropower (5,297.83 ktoe, 63.5%), other primaries (3,036.01
ktoe, 36.4%) and (imported) coal (3.47 ktoe, 0.04%). In final consumption (4.956,46
ktoe), transport (1,892.24 ktoe, 38.2%), residential (1,336.59 ktoe, 27.0%) and industrial
consumers (1,336.53 ktoe, 27.0%) stand out, being 18.4% supplied by electricity. In
Mercosur, Paraguay corresponds only to 1.8% of primary supply and 1.4% of final
consumption. 73.8% of electricity are exported and 100% of coal are imported.
128 See: http://www.leyes.com.py/todas_disposiciones/1994/decretos/decreto_2109_94.php. 129 See: http://www.leyes.com.py/todas_disposiciones/2001/decretos/decreto_12507_01.php.

110
Figure 13. Paraguayan summarized energy balance (2015, in ktoe)
Source: sieLAC-OLADE.
111
Its electricity sector is characterized by having an installed hydroelectric capacity of 8,810
MW, which exceeds its energy needs by a large margin, placing Paraguay as a net
exporter within the region.130. This capacity comes from its two binational power stations
Itaipu and Yacyretá. In addition, there is a small thermal park that has an installed capacity
of 24 MW.
According to 2017 OLADE Energy Statistics Yearbook, for the first time in the history
of the 32 years of operation of Itaipu Binacional, the production of the plant exceeded the
43 MWh mark in the five-month period in which the binational contributed with 43,053
GWh to the electricity sector in Paraguay and Brazil.131 Additionally, the value of the
adjustment factor to be incorporated in the rate of repayment of the energy generated by
the Itaipu hydroelectric plant for 2017 was defined. The value as of 2017 was US$
1.8836/kW, which represents a reduction of 24% in relation to the one included in the
2016 tariff. In 2016, Itaipu Binacional produced a total of 103,098.37 GWh, a new world
record in annual generation.
Defeated in the Triple Alliance War, the country created a long-term strategic partnership
with Brazil in what concerns the production of hydroelectric energy. Itaipu Binacional
(Py-Br) was created in 1974 as an international company to exploit the Paraná River’s
hydroelectric potential. The plant generates foreign exchange for Paraguay’s economic
and social development while allowing Brazil to own one of the world’s most renewable
power plants, contributing 11% to Brazil’s electricity generation (BIATO, 2016).
The first generating unit of the project came into operation in 1984, having reached full
operation of the 20 turbines in 2007 (14,000 MW of installed capacity). With no sluice,
the Paraguayan side is represented by the National Electricity Administration (ANDE)
and the Brazilian side by Eletrobras. However, it is noted that the negotiations between
Brazil and Paraguay for the exploitation of hydroelectricity on the border come from the
1950s132. The base document for the project was the Treaty of Itaipu 133, signed in 1973,
130 The country is a small consumer and a major exporter of energy, just like Bolivia. 131 This generated energy would be enough to supply Brazil for 30 days and a city of São Paulo for a year
and a half. 132 The studies on the energy utilization of the region of Sete Quedas began in 1956, but during the
presidencies of Jânio Quadros (January-August 1961) and João Goulart (1961-1964), these researches have
grown (ESPÓSITO, 2012). 133 See: https://www.itaipu.gov.br/sites/default/files/u13/tratadoitaipu.pdf.

112
which established the terms and regulations that are in force until the year 2022
(RODRIGUES, 2012a).
Half of the energy generated is generated for both countries, but Paraguay does not
consume its whole share. Thus, in accordance with the Itaipu Treaty, the country can only
‘sell’ (‘ceder’ under the terms of the treaty) the surplus not consumed to Brazil, what has
been questioned several times by Paraguay134 (SANTOS et al., 2014, SANTOS et al.,
2013). According to the Itaipu Treaty, in Art. XIII, ‘energy produced by hydroelectric
development (...) shall be divided equally between the two countries, each of which shall
be entitled to acquire, as provided for Article XIV, of energy that is not used by the other
country for its own consumption’.
In 2005, compensation to Paraguay for energy destined for Brazil increased. In 2007, the
countries signed a memorandum of understanding on the company’s debt with Eletrobras
(OXILIA, 2009; RODRIGUES, 2009a). In 2009, the signing of the Joint Declaration
‘Building a New Stage in Bilateral Relations’ by Presidents Lula and Lugo raises the level
of bilateral relations, establishing a series of historical decisions: (i) multiply by three the
value of the factor of correction paid by Brazil as compensation for the surplus of Itaipu
energy not used by Paraguay; and (ii) determine the construction of a 500 kV electric
transmission line of 348 km, the first of high voltage, transporting the generated energy
to Asunción then offering basic conditions for industrial development. The understanding
raises from US$ 120 million to US$ 360 million the amount received for the energy
transferred to Brazil. The transmission line (Itaipu - Villa Hayes) was financed by Brazil
through unilateral and voluntary obligatory contributions to the Mercosur Structural
Convergence Fund (FOCEM)135 of US$ 550 millions136 (CERQUEIRA CÉSAR, 2015,
PARLASUR, 2013).
In fact, the project includes the 500 KV transmission line from Itaipu until the station of
Villa Hayes (near the city of Asunción) and the extension of the station of Villa Hayes
(500/220 KV transmission line). This additional transmission capacity allows Paraguay
134 When Brazil imports energy from Paraguay, there is a need to pay royalties and the amount associated
with the energy transfer (‘cedida’). As an alternative, the inclusion of the hydrographic basin as a criterion
for the distribution of royalties will promote more efficient water resource management, since the payment
will be distributed throughout the basin of the plant (LORENZON et al., 2017). 135 The FOCEM will be detailed in section 4.1. 136It should be noted that the transmission line was completed in 2013 and is in operation. See:
http://www.iirsa.org/proyectos/detalle_proyecto.aspx?h=860.

113
to increase the exchange of energy with Argentina through the 220 kV interconnection
between the towns of Clorinda (Ar) and Guarambaré (Py). The transmission line covers
an approximate distance of 348 km.
With Itaipu, Brazil ensured a safe and profitable source of power to feed a production
park in expansion, thus currently representing around 17% of the national consumption.
On the other hand, Paraguay ensured access to financial resources with every condition
to promote the structural transformation of its economy along with the availability of
cheap power (BIATO et al., 2016).
As stated before, it is worth noting that the sale of electricity to neighboring countries has
been one of the three pillars of the Paraguayan economy over the last thirty years
(CERQUEIRA CÉSAR, 2015). However, the construction of Itaipu was not followed by
the expansion of the electricity distribution infrastructure, missing the opportunity to
channel this resource for the promotion of industrialization (CODAS, 2009, MASI,
2011). The use in the industrial sector137 of the electricity of Itaipu and Yacyreta could
supply industries that generate up to 2 million new direct jobs, since there is the potential
to install around 465 thousand manufacturing industries that could generate that important
number of jobs in the country (GISE, 2017).
In view of this scenario, that are two challenges that come up: (i) by the structure of the
Treaty, the market for energy surplus not consumed by Paraguay has a monopsony
characteristic; and (ii) risk of Paraguay suffering from Dutch disease138, given that no
extra income is being invested in the country on a long-term logic (infrastructure, job
creation, industry, health and education, for example). Two natural endpoints for the dam
are: (i) expirantion of the Teaty in 2023; and (ii) in some decades the dam is going to be
disassembled.
In 2023, the treaty expires and the plant will be fully paid, that is, the debt of its
construction will be completely paid off. This includes the Paraguayan half, so there is
no longer the need for the country to amortize it with the sale of energy to Brazil. Paraguay
will then be free to commercialize its energy surplus from the 50% that it owns from the
137 Investment in the industrial sector development is the best alternative for the hydropower surplus use
under the analyzed conditions (BLANCO et al., 2017). 138 Many claim the same risk for the case of Venezuela (oil) and Bolivia (NG). See:
http://www.imf.org/external/pubs/ft/fandd/basics/dutch.htm.

114
generation of Itaipu as it sees fit. After 2023, each country will own half of the entire
power produced at a cost of around US$ 4/MWh.
Notwithstanding, it is unclear what will happen after 2023139. In terms of price, it will
depend, first, on how the regional macroeconomic framework goes. In the coming years,
due to the economic crisis, much more energy will enter the Brazilian electrical system
than current demand requires. Secondly, it will depend on the existence of alternative
markets that can compete with Brazil with Paraguay’s energy supply. As a way to
pressure Brazil, Paraguay regularly (falsely) claims the right to sell primarily to third
parties (Argentina and Uruguay), but the reality is that there is no legal possibility for this
(according to the Treaty), neither based on transmission infrastructure nor on demand. In
principle, one can believe that Paraguay must continue for several years to sell to Brazil,
even though there are few alternatives as long as the Paraguayan domestic demand does
not match its full amount. Thirdly, it will depend on the other sources of energy in the
Brazilian market, especially the increasing entry of alternative sources of renewable
energy (mainly wind and solar), as well as the ‘commoditization’ (and consequent
reduction) of natural gas at world scale. Finally, it will depend on the type of contract.
Brazil will be interested in a long-term contract, with a guarantee of supply, which will
also impact the price.
Still on the price issue, it could lower about 66%, a portion that goes to pay the amount
of the loans. Undoubtedly, this is not the interest of Paraguay, which already argues that
the current value is low and therefore need to be maintained. With respect to the
destination of this amount, (i) it could be split equally between Paraguay and Brazil, so
that each one could use it in the way it best suits; or (ii) create a development fund (for
the construction of other binational or regional power plants for the
electrical/technological development of the two countries). This fund could serve as a
means to deal with the technological update of the plant, that will reach 50 years of
operation in about 15 years. It is believed, however, that most will be left to both countries
to develop their infrastructure.
139 In the case of Brazil, it will depend on whether the country will prioritize a cost containment policy to
help keeping inflation under control or whether it will opt for a cash strategy for the company. On the
Paraguayan side, a competitive pricing strategy tends to prevail in order to continue attracting electro-
intensive industries to the country, especially in Brazil.

115
Although Paraguay has already informed that it will demand the totality of its energy until
2023, it is believed that the country should continue without consuming it for at least 10
years. With Paraguay’s growth, Itaipu’s growing demand for electricity in recent years
will continue. However, as already highlighted, part of the 50 Hz Itaipu energy is
transported to a converter station, the Ibiúna substation140 (São Paulo), through a
transmission system with capacity of 6,300 MW. In case of total consumption, the
converter station will be idle. Then, it could serve as a communication source between
Brazil and other countries in the region with frequency of 50Hz (for example, Argentina,
Uruguay and Bolivia), corresponding to a very important regional communication
channel that generates and transmits energy at 50Hz or 60Hz.
It should be noted that Itaipu represents about 17% of the electricity in Brazil, that is,
security in the energy supply. On the other hand, for Paraguay, hydroelectric power is a
political (national sovereignty141) and economic (source of foreign exchange) issue, just
like oil for Venezuela. Thus, there will be two ways to manage Itaipu post-2023: (i) the
most remote possibility of dividing the plant into two generating units, which would
require changes in its constituent treaty; and (ii) maintaining binational administration.
Generally, the exchanges that take place between Paraguay and its neighbors respond
largely to pre-established agreements such as the binational power stations of Itaipu and
Yacyretá. To compensate for the lack of regulatory framework, all the exchanges made
to date have been regulated by bilateral contracts (COCIER, 2016). Regarding
international interconnections, Paraguay is interconnected with Argentina through two
lines: El Dorado (Ar) – Carlos Lopez (Py) line, which has a capacity of 30 MW, the
Clorinda (Ar) – Guarambaré (Py) line, which has a 90MW capacity and has been in
existence since 1995. It is interconnected to Brazil through Foz de Iguazú (Br) – Acaray
(Py), with capacity of 50 MW. In addition, it shares a connection through its two
binational power plants, Yacyretá (3,200 MW) and Itaipu (14,000 MW) (COCIER,
2017a).
140 The station is considered to be the world’s largest high voltage direct current converter. 141 The environmental and social losses with the construction of Itaipu were immense. However, the greatest
damage was moral and political, since it strengthened the dictatorship of Alfredo Stroessner and threatened
the country’s energy sovereignty (CANESE, 2011).

116
Figure 14 shows Paraguayan energy trade, both exports and imports (2014, in 2000 US$).
When it comes to exports, electricity to Argentina (US$ 84m; 100.0%) stands out, as well
as biofuels and waste to Germany (US$ 4m; 80.0%) and UK (US$ 1m; 20.0%). When it
comes to imports, oil products from Argentina (US$ 5m; 41.7%), Bolivia (US$ 4m;
33.3%) and Brazil (US$ 2m; 16.7%) stand out.142
Figure 14. Paraguayan energy trade, both exports and imports (2014, in 2000 US$)
Source: IADB Energy Database based on UN COMTRADE.
According to the 2017 OLADE Energy Statistics Yearbook, Paraguay implemented the
redefinition of prices and quality of common diesel by means of Decree N. 4.562/2015143
that establishes new technical specifications for import and commercialization of
petroleum products in the country. With these new specifications, the quality of diesel
marketed in the country arises, a fuel that represents 63% of the total oil derivatives
consumed nationwide. On the other hand, it was announced the discovery of traces of
hydrocarbons in geological witnesses (rocks) of Pozo Jaguareté I (San Pedro), samples
142 In Figure 14, it is worth noting that Brazil does not appear as an importer of electricity. This is probably
due to the methodology of the IADB Energy Database and the nature of the Itaipu Treaty. 143 See: http://www.leyes.com.py/todas_disposiciones/2015/decretos/decreto_4562_15.php.
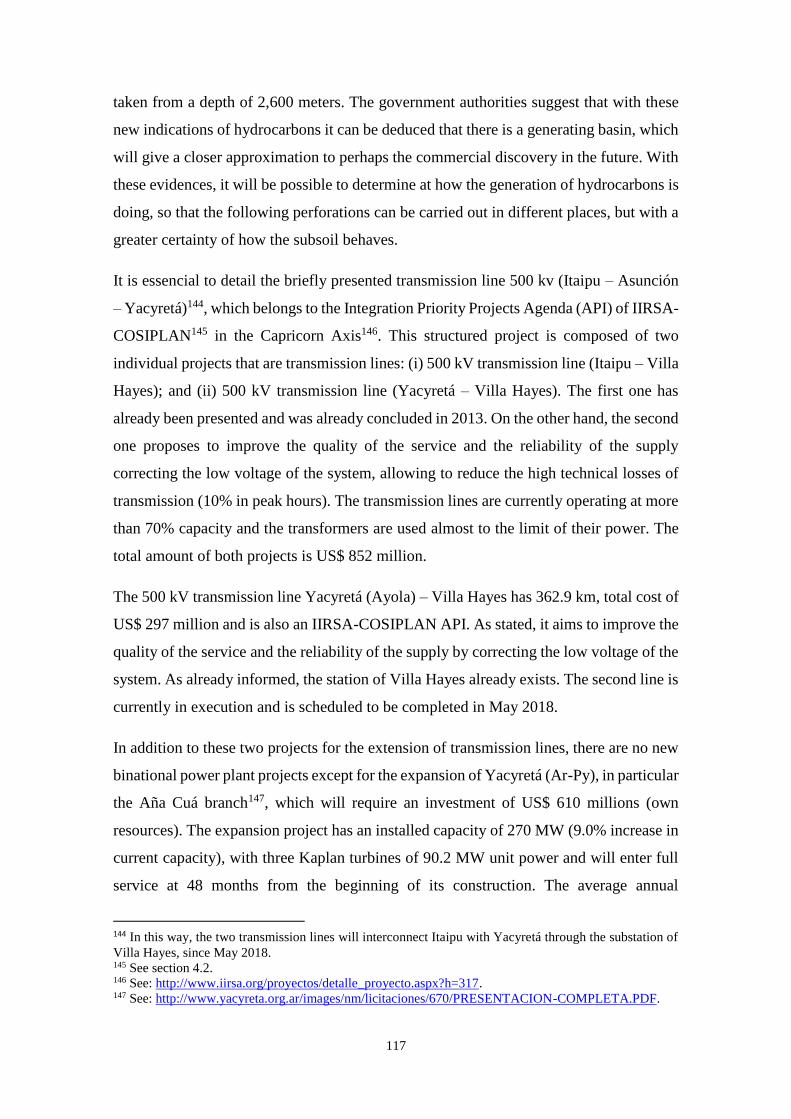
117
taken from a depth of 2,600 meters. The government authorities suggest that with these
new indications of hydrocarbons it can be deduced that there is a generating basin, which
will give a closer approximation to perhaps the commercial discovery in the future. With
these evidences, it will be possible to determine at how the generation of hydrocarbons is
doing, so that the following perforations can be carried out in different places, but with a
greater certainty of how the subsoil behaves.
It is essencial to detail the briefly presented transmission line 500 kv (Itaipu – Asunción
– Yacyretá)144, which belongs to the Integration Priority Projects Agenda (API) of IIRSA-
COSIPLAN145 in the Capricorn Axis146. This structured project is composed of two
individual projects that are transmission lines: (i) 500 kV transmission line (Itaipu – Villa
Hayes); and (ii) 500 kV transmission line (Yacyretá – Villa Hayes). The first one has
already been presented and was already concluded in 2013. On the other hand, the second
one proposes to improve the quality of the service and the reliability of the supply
correcting the low voltage of the system, allowing to reduce the high technical losses of
transmission (10% in peak hours). The transmission lines are currently operating at more
than 70% capacity and the transformers are used almost to the limit of their power. The
total amount of both projects is US$ 852 million.
The 500 kV transmission line Yacyretá (Ayola) – Villa Hayes has 362.9 km, total cost of
US$ 297 million and is also an IIRSA-COSIPLAN API. As stated, it aims to improve the
quality of the service and the reliability of the supply by correcting the low voltage of the
system. As already informed, the station of Villa Hayes already exists. The second line is
currently in execution and is scheduled to be completed in May 2018.
In addition to these two projects for the extension of transmission lines, there are no new
binational power plant projects except for the expansion of Yacyretá (Ar-Py), in particular
the Aña Cuá branch147, which will require an investment of US$ 610 millions (own
resources). The expansion project has an installed capacity of 270 MW (9.0% increase in
current capacity), with three Kaplan turbines of 90.2 MW unit power and will enter full
service at 48 months from the beginning of its construction. The average annual
144 In this way, the two transmission lines will interconnect Itaipu with Yacyretá through the substation of
Villa Hayes, since May 2018. 145 See section 4.2. 146 See: http://www.iirsa.org/proyectos/detalle_proyecto.aspx?h=317. 147 See: http://www.yacyreta.org.ar/images/nm/licitaciones/670/PRESENTACION-COMPLETA.PDF.

118
generation is 2,000 GWh and the term of execution of the works is estimated at 50
months, from the signing of the contract. From the social point of view, there are no
families to resettle and the work will demand directly and indirectly occupation of around
3,000 people.148 Also, it is worth noting that 60% of the investments needed to generate
in the Aña Cua branch are already made (dam, landfill and access). Considering the recent
challenges, the already mentioned dilemma about Annex III of the Treaty of Itaipu after
2023 stands out. Besides that, it is worth mentioning that the following paradox has been
consolidated: despite the large electricity generation and the fact that the country is the
main exporter of hydroelectric energy in the world, (i) its energy matrix is still very
unsustainable, since about 48% of total domestic consumption still comes from biomass,
about 37% of oil and only about 15% of the electric power itself (CERQUEIRA CÉSAR
and ARCE, 2014); (ii) Paraguay still has one of the lowest rates of electricity consumption
in Latin America. (BLANCO et al., 2017); and (iii), the country suffered regular
blackouts in Asunción, which led to the belief that Itaipu served mostly or exclusively
Brazilian interests (BIATO, 2016).
Due to these problems and challenges, the country can take a reactive stance on the
promotion of regional energy integration and on its position in the negotiations of Itaipu
post-2023, since they deal with issues that touch on national sovereignty. Therefore, and
considering the need of sustainable development and addressing climate change, it is
crucial that the country revises its energy matrix. As noted, although it is one of the
leading exporters of clean and sustainable energy in the region, its domestic consumption
is still heavily based on non-renewable energy and therefore contributing negatively to
CO2 emissions.
As stated, the attractiveness of Paraguay lies in its reduced production costs and the
pragmatism of its regulatory environment. In relation to Brazil and Argentina, it has low
electricity costs, low tax rates, a simplified tax system, availability and flexibility of labor
regime, lower wage costs, as well as facilities for obtaining licenses and registrations. Its
geographical proximity to the main industrial parks and consumer markets in Brazil tends
to reduce the time and cost of transportation.
In Paraguay, more than in other countries, energy is synonymous of national sovereignty.
Itaipu (14,000 MW) and Yacyretá (3,200 MW) are specific examples of successful
148 See: http://www.eby.org.ar/images/nm/Proyecto_Aa_Cua.pdf.

119
regional energy integration, although limited to binational initiative. Regarding Itaipu,
there is a great deal of uncertainty about its post-2023 future, but it is believed that the
operational status quo will be maintained: Brazil will remain the only country to be able
to consume the portion not consumed by Paraguay for at least a decade, although this
value will fall over time. As for Yacyretá, there are several projects that aim to increase
the installed capacity of the plant, in addition to projects in progress to connect it to Itaipu.
3.5 Uruguay
Uruguay is a country of 3.4 million inhabitants located in the southeastern region of the
South American subcontinent. It limits to the Northeast with Brazil, to the West with
Argentina, and has coasts both in the Atlantic Ocean and in the Río de la Plata. Its GDP
per capita at current prices is US$ 15,411.76, which places Uruguay as one of the high-
income countries in the region according to the World Bank classification. The
agricultural and livestock sector is of great importance in the national economy, although
services and tourism account for a high percentage of GDP, with the latter becoming
increasingly important.
In Uruguay, the Ministry of Industry, Energy and Mining (MIEM) is responsible for the
electric and hydrocarbon sectors. The National Energy Directorate (DNE-MIEM) is in
charge of defining the policies and guidelines of the energy sector, as well as promoting
studies and planning. Regulation and supervision are up to the Regulatory Unit of
Services of Energy and Water (URSEA). There are no State or municipal regulatory
agents and the Electric Market Administration (ADME) manages the wholesale electric
market.
With regard to electricity generation, there are private and state-owned companies, such
as UTE (state-owned company) and private power generators, in particular wind power
and thermal power generation with industrial waste biomass. Transmission and
distribution are also in the hands of the UTE, and public and private companies operate
in the commercialization. During IntegraCIER149, UTE affirmed that the Uruguayan
energy policy established the vision of energy independence in a context of regional
integration, with environmental sustainability and in response to economic development,
149 Ibero-American Energy Congress, held in November 2014.

120
towards a productive country with social justice (CIER, 2016b). Focusing on regional
energy integration, the question is how far it is possible to reconcile energy independence
with regional energy integration, since the latter leads to greater interdependence with
neighboring countries.
In hydrocarbon sector, policies, guidelines and regulation are the responsibility of
URSEA. Regarding exploration and production (E&P), the National Administration of
Fuels, Alcohols and Portland Cement (ANCAP) in association with international private
companies (Total, BP, BG, TULLOW Oil, Petrel-Schuepbach, YPF, for example) are the
responsible companies. Refining and transportation are left to Petrobras Uruguay (NG
distribution, lubricants, production and commercialization of fuels), in association with
ANCAP, while the commercialization is controlled by ANCAP DUCSA.
Figure 15 presents the Uruguayan summarized energy balance in 2015. Primary supply
(5,046.11 ktoe) is composed of other primaries (2,263.80 ktoe, 44.9%), (imported) crude
oil (1,920.10 ktoe, 38.1%), hydropower (814.11 ktoe, 16.1%), (imported) natural gas
(45.80 ktoe, 0.9%) and (imported) coal (2.30 ktoe, 0.05%). In final consumption
(4.479,32 ktoe), industrial (1,852.94 ktoe, 41.4%), transport (1,235.20 ktoe, 27.6%) and
residential consumers (796.35 ktoe, 17.8%) stand out, being 20.2% supplied by
electricity. In Mercosur, Uruguay corresponds only to 1.1% of primary supply and 1.3%
of final consumption. 100.0% of crude oil, natural gas and coal are imported. Besides,
9.6% of generated electricity are exported and 0.02% is imported.

121
Figure 15. Uruguayan summarized energy balance (2015, in ktoe)
Source: sieLAC-OLADE.

122
Its electricity sector has an installed capacity of 3,723 MW, the largest percentage coming
from hydroelectric sources (41.3%), followed by conventional thermal (31.6%) and then
renewable energy (27.1%). Although there has been a notable development in the
generation from wind and biomass sources during the last years, the production of
electricity is strongly correlated with the hydrological conditions of the year.
According to 2017 OLADE Energy Statistics Yearbook, the country launched a benefit
that will allow electrointensive industrial companies that maintain or increase their
production to obtain a discount of up to 30% in the monthly invoicing of the electric
power charge (without VAT). Additionally, in the First Electric Mobility Exhibition
(MUEVE), the existing opportunities to acquire taxis and electric vehicles were
presented. The plan also includes financial and infrastructure support for the first vehicles
of this type. Besides, the Electric Vehicle Power Systems Network (SAVE) was launched,
which will be extended in its first phase from Colonia to Chuy, passing through
Montevideo, while in its second phase it will cover all routes.
It should be noted that the country completed four consecutive years (since October 2012)
without commercial electricity imports, although Uruguay used to be dependent on
imports from neighboring countries (Argentina and Brazil). This is a consequence of the
“guidelines” implemented by the Uruguayan Government since 2005 with the objective
of arriving at an “energy independence with diversification of the matrix with renewable
and indigenous sources”, according to MIEM. In fact, between 2014 and 2016, 28 wind
farms have been inaugurated with an installed capacity of 1,212 MW. The biomass
exceeded in 2016 for the first time the oil and its derivatives in the participation of the
energy matrix, breaking a historical series of 52 years. Since 2008 biomass began to have
greater participation in the generation of electricity and biofuels, being able to triple its
value in 8 years.
2015 was the first year in which Uruguay exported energy significantly through UTE. Of
the 11.5 TWh generated in the country, 1 TWh (8.7%) was exported by UTE. In 2016,
for the first time, a private company sold energy abroad.
Uruguay launched a stimulus tool to strengthen public policy guidelines focused on the
promotion of renewable energies through the participation of private investors. The
Areaflin S.A., currently owned by UTE, opened its capital to the market by issuing shares
to small savers who can be co-owners in the society of Valentines wind farm.

123
Participation to those who wish to invest larger amounts was also allowed. In this way,
UTE has participated in the development of 34% of the wind farms in Uruguay (OLADE,
2017).
In recent years, Uruguay has incorporated renewable energy150 to its energy matrix and
recently agreed with Argentina on the sale of its shedding wind. Thanks to the growth in
the exchange between both countries, this agreement has been achieved that benefits both
nations to market the surpluses of their wind production (CIER, 2017c). In addition, the
country signed two memorandum of understanding with China, in the areas of renewable
energy and industrial cooperation. The goals are focused on the development of issues of
common interest for both countries, which support the diversification of energy sources
tending to promote economic development socially and environmentally sustainable
(OLADE, 2017).
With regard to binational projects, the country is the joint owner of Salto Grande with
Argentina, whose installed capacity is 1,890 MW151. In terms of international electricity
trade, Uruguay has interconnections with Argentina through an occasional trade
agreement with two 500 kV cross-border transmission lines and the Salto Grande
binational dam. With Brazil, since 2001 there is the Rivera (Uy) – Livramento (Br)
interconnection and there is an agreement for the use of the frequency converter signed
by UTE and Eletrobras. UTE has developed an interconnection project with Brazil,
Presidente Médici (Br) – San Carlos (Uy), of 500 MW power operating since mid-2017
(COCIER, 2016, 2017a).
Figure 16 shows Uruguayan energy trade, both exports and imports (2014, in 2000 US$).
When it comes to exports, biofuels and waste to Portugal (US$ 14m; 77.8%) and Spain
(US$ 4m; 22.2%) stand out, as well as electricity to Argentina (US$ 9m; 100.0%). When
it comes to imports, crude oil from Brazil (US$ 364m; 71.7%) and Nigeria (US$ 144m;
28.3%) stands out, as well as gas from Argentina (US$ 14m; 100.0%), and oil products
from Brazil (US$ 5m; 41.7%), Argentina (US$ 4m; 33.3%), USA (US$ 2m; 16.7%) and
Chile (US$ 1m; 8.3%).
150 Uruguay was in 3rd place in the investment in electricity and renewable fuels per unit of GDP, behind
Mauritania and Honduras, respectively (REN 21, 2016). 151 See section 3.1.

124
Figure 16. Uruguayan energy trade, both exports and imports (2014, in 2000 US$)
Source: IADB Energy Database based on UN COMTRADE.
According to 2017 OLADE Energy Statistics Yearbook, regarding the hydrocarbon
sector, Uruguay signed an agreement from which, with the consent of ANCAP, the
company British Gas (BG) made a partial transfer of their rights (50%) in block 13
offshore, in favor of Total, Exxon and Statoil.152 Government authorities define this act
as a new step in the path of offshore exploitation. Additionally, a contract was signed
whereby Total ExxonMobil, operator of block 14 of hydrocarbons exploitation in the
Uruguayan maritime platform, gives 15% of the contract it has with Uruguay to
Norwegian company Statoil.
From the geographical point of view, the country is isolated regionally, having borders
only with Argentina and Brazil. It is precisely with these only two countries that Uruguay
already has both international interconnections and binational HPP. The country has
shown signs of focusing on the export of wind energy to Argentina.
152 In this way, the hydrocarbon exploitation continues in block 13, with BG as operator and the other three
companies as non-operators.

125
3.6 Venezuela
Venezuela has 31.6 million inhabitants and is located in the northern region of the South
American subcontinent. The country borders Colombia, Brazil and Guyana, besides being
close to the Caribbean Sea. Its economy is heavily dependent on the exploitation and
export of oil, as well as the export of ores. Venezuela has in the USA, China, Colombia
and Brazil its main trading partners in both exports and imports
Although Venezuela is one of the countries with the highest degree of electrification in
Latin America, the electrification of isolated, indigenous and border communities has
represented a challenge for the Venezuelan State due to the remoteness of these places.
Bolivia and Brazil, for example, face the same problem, once both countries have isolated
systems (IS).
In Venezuela, the Ministry of Popular Power for Electric Energy (MPPEE) is responsible
for the electricicty sector and its regulation/supervision. The National Development Plan
(Plan de la Patria) Law, Second Socialist Plan of Economic and Social Development of
the Nation 2013-2019 is in charge of defining the policies and guidelines for the energy
sector, as well as promoting studies and planning. Regarding municipalities, in the
Organic Law on the Public Service of Electricity (LOSSEL, 2010), chapter III Art. 32, it
is stated that among the attributions of the municipalities it is to support the Ministry of
Popular Power with competence in matters of electricity, in the control of the quality of
the electric service in the territories that correspond to its jurisdiction. In the country, there
is no wholesale electricity market given the monopoly of the public National Electricity
Corporation S. A. (Corpoelec)153 in the generation, transmission, distribution and
commercialization of electricity. The MPPEE, through the current Institutional Strategic
Plan of the Ministry of Popular Power for Electric Power (2013-2019), is responsible for
the studies and planning of the electric sector.
Considering private investments in LAC electricity sector between 1984 and 2011,
Venezuela was the country where this amount was the lowest (US$ 142 million), being
92.9% in generation. The transmission sector did not have any private investment, as in
most other countries in the region154. In 2010, the country had neither any private
participation in the electricity sector nor in generation, transmission or distribution. This
153 Corpoelec was created in 2007, when the sector was nationalized. 154 Except Argentina, Bolivia, Brazil, Chile and Peru.

126
is due to the fact that Venezuela experienced a process of re-nationalizations in 2007
(BALZA et al., 2013).
Ministry of the Popular Power of Petroleum and Mining (MPetroMin) is responsible for
hydrocarbons sector and its policies and guidelines are controlled by the current Plan de
la Patria 2013-2017. Regulation is the responsibility of MPetroMin and the National Gas
Entity (ENAGAS). Regarding exploration and production (&P), the role of Petróleos de
Venezuela, S.A. (PDVSA) and other operators with a concession agreement stands out in
the natural gas sector; concerning the oil sector, the PDVSA monopoly plays an important
role, either autonomously or in association with other operators (mixed companies).
Refining, transportation and commercialization are also up to PDVSA155.
Figure 17 presents the Venezuelan summarized energy balance in 2015. Primary supply
(82,045.26 ktoe) is based on natural gas (39,019.20 ktoe, 47.6%), crude oil (35,775.57
ktoe, 43.6%), hydropower (6,311.16 ktoe, 7.7%), coal (622.12 ktoe, 0.8%) and other
primaries (317.21 ktoe, 0.4%). In final consumption (43,359.35 ktoe), industrial
(17,593.51 ktoe, 40.6%), transport (17,223.52 ktoe, 39.7%) and residential consumers
(5,429.17 ktoe, 12.5%) stand out, being 16.5% supplied by electricity. In Mercosur,
Venezuela corresponds to 17.3% of primary supply and 12.4% of final consumption.
74.4% of crude oil production are exported, 0.2% of natural gas is imported and 0.8% of
eletricity is exported.
155 It is worth mentioning that according to the law, the activities of exploitation, production, storage
and commercialization of natural gas can be made by the State or by private entities, whether national
or foreign. Therefore, there is no legal imposition to have a monopoly on these activities in the O&G
sector. In the case of petroleum, the law of 2001 allows the State to carry on the operations of the
industry, allowing the participation of private persons through an association agreement, in which the
State must keep more than 50% of the share capital. Despite this, in practice PDVSA is the monopoly
company of the oil sector.

127
Figure 17. Venezuelan summarized energy balance (2015, in ktoe)
Source: sieLAC-OLADE.

128
Its electricity sector has an installed capacity of 31,037 MW, of which the highest
percentage comes from non-renewable thermal (51.1%), followed by hydronergy156
(48,8%) and then wind (1.6%). In terms of generation, 59.3% is hydro, 40.6% is non-
renewable thermal, 0.06% is wind, and there has been an increase in the generation
capacity of the National Electric System (SEN) in 489 MW, as : (i) entry into operation
of unit 2 of the Fabricio Ojeda HPP - La Vueltosa (257 MW); (ii) Alfredo Salazar Plant
(60 MW); (iii) entry into service of unit 2 of the Juan Bautista Arismendi gas plant (71
MW); and (iv) Táchira Plant (40 MW).
It is important to note that based on sieLAC-OLADE data, the electricity tariff in
Venezuela (US$ 0.03/kWh) in 2015 is the lowest among Mercosur countries. Venezuela
is followed by Argentina (US$ 0.04/kWh), Paraguay (US$ 0.07/kWh), Bolivia (US$
0.11/kWh), Uruguay (US$ 0.17/kWh) and Brazil (US$ 0.17/kWh).
Regarding the Rational Use of Electric Power (UREE) in 2014, there was (i) installation
of 10,410,195 energy saving light lamps, which allowed reducing demand by 251 MW,
and benefiting 7,600,771 people in the 24 states of the country; (ii) launch of the Plan
Banda Verde for residential users, as a measure of savings to reduce demand and cultivate
the rational and efficient use of energy; (iii) completion of 24,122 information and
awareness activities in communities and educational centers, in order to strengthen the
energy saving campaign; and (iv) replacement of 13,448 air conditioning units with more
efficient technologies. Since July 2016, Operation Cambalache began157, which consists
of the replacement of high-consumption air conditioners with new ones to contribute to
rational and efficient use of electricity.
According to the official Corpoelec website158, we can mention the following projects in
operation: (i) wind measuring towers in El Anís and Chacopata; (ii) photovoltaic systems
in isolated communities in Alta Guajira, Puerto Viejo, Cúpira and Guaruchar, Corioco
and Chuao; (iii) hybrid systems in isolated communities in Los Roques; (iv) wind farms
in La Guarija; (v) mini-hydroelectric plants in Piñango, Cuao, Wonken, Arautamerú, La
Ciudadela, Kavabayén and Canaima; and (vi) solar heaters in Los Roques and La Orchila.
156 One of these hydroelectric power plants, called Simón Bolivar (Guri), has 10,235 MW of installed
capacity, representing more than 60% of all the hydroenergy used in the country. Besides, it is one of the
largest HPP in the world. 157 See: http://www.corpoelec.gob.ve/sites/default/files/informacion-cambalache.jpg. 158 See: http://www.corpoelec.gob.ve/procesos-medulares.

129
In terms of international electricity trade, Venezuela has interconnections with Colombia:
Cuestecita (Co) – Cuatricentenario (Ve), of 150 MW, Tibú (Co) – La Fría (Ve), of 80
MW, and San Mateo (Co) – El Corozo (Ve), of 150 MW. In addition, the country has an
interconnection with Brazil, Boa Vista (Br) – El Guri (Ve), of 200 MW.
In the Second Socialist Plan for Economic and Social Development of the Nation 2013-
2019159, published in 2013, we can highlight the following targets: (i) build three Thermal
Power Plant (TPP) with a total generation capacity of 2,100 MW, which will use
petroleum coke generated by the process to improve crude oil in the Orinoco Oil Belt; (ii)
strengthen the self-sufficiency electricity system in the operational fields, ensuring
national elecitricity autonomy and flexible schemes for the generation of 1,260 MW; and
(iii) expand and adapt the electric system in the western region, in the electric system in
the central region, and in the eastern electric system. Among the electricity sector
programs, we can emphasize: (i) the use of coke, gas, coal and liquids for thermal power
generation; (ii) permanent monitoring structure, through operations centers and inter-
institutional situational room; and (iii) the electricity sector’s development and
industrialization program. Among the policies of the hydrocarbon sector, the following
stand out: (i) E&P of oil and gas; (ii) oil sovereignty; (iii) hydrocarbon transformation
centers; (iv) energy matrix diversification; (v) industrialization of hydrocarbons; and (vi)
conservation of the environment.
It is worth mentioning that in the Development Plan for the National Electric System
2013-2019 (PDSEN 2013-2019)160 the goal of the installation of 149 hybrid wind-
photovoltaic systems (including Apiapá) is established, however, since these
competences were transferred to the Alternative Sources Management of Corpoelec, it
was not further developed, being the last one installed by Fundelec in 2013.161 The plan
aims to develop 613MW of renewable energy for isolated and rural communities, of
which 500 MW are wind-based. Other potential renewable resources include solar, small
hydro, bagasse cogeneration and biogas. In addition, the plan seeks to electrify 2,512 off
grid communities through solar PV and hybrid systems equivalent to 63MW.
159 See: http://www.mppp.gob.ve/wp-content/uploads/2013/09/ley_plan_patria.pdf. 160 See: http://www.mppee.gob.ve/download/publicaciones_varias/PDSEN%20web.pdf. 161 See: https://www.evwind.com/2016/07/29/el-abandono-de-los-proyectos-de-energias-renovables-en-
venezuela/.
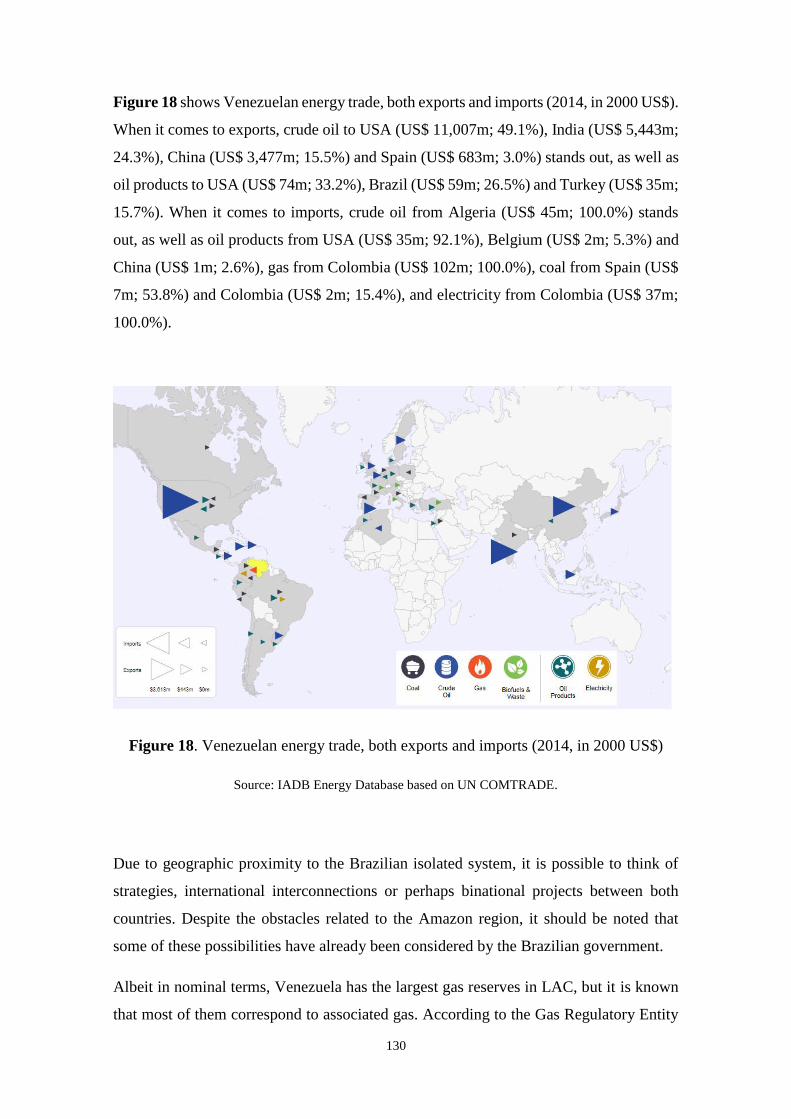
130
Figure 18 shows Venezuelan energy trade, both exports and imports (2014, in 2000 US$).
When it comes to exports, crude oil to USA (US$ 11,007m; 49.1%), India (US$ 5,443m;
24.3%), China (US$ 3,477m; 15.5%) and Spain (US$ 683m; 3.0%) stands out, as well as
oil products to USA (US$ 74m; 33.2%), Brazil (US$ 59m; 26.5%) and Turkey (US$ 35m;
15.7%). When it comes to imports, crude oil from Algeria (US$ 45m; 100.0%) stands
out, as well as oil products from USA (US$ 35m; 92.1%), Belgium (US$ 2m; 5.3%) and
China (US$ 1m; 2.6%), gas from Colombia (US$ 102m; 100.0%), coal from Spain (US$
7m; 53.8%) and Colombia (US$ 2m; 15.4%), and electricity from Colombia (US$ 37m;
100.0%).
Figure 18. Venezuelan energy trade, both exports and imports (2014, in 2000 US$)
Source: IADB Energy Database based on UN COMTRADE.
Due to geographic proximity to the Brazilian isolated system, it is possible to think of
strategies, international interconnections or perhaps binational projects between both
countries. Despite the obstacles related to the Amazon region, it should be noted that
some of these possibilities have already been considered by the Brazilian government.
Albeit in nominal terms, Venezuela has the largest gas reserves in LAC, but it is known
that most of them correspond to associated gas. According to the Gas Regulatory Entity

131
in Venezuela (ENAGAS), 70% of gas production is consumed by the oil activity itself,
mainly for its re-injection into the oil fields. The lack of natural gas in the western part of
Venezuela is one of the causes of the decline in oil production observed in that area. This
has been one of the main reasons for the construction of the gas pipeline from Colombia
(KOZULJ, 2008). Indeed, Venezeula has signed a memorandum for gas
integration/interconnection with Colombia (July 2004), Colombia and Panama (July
2006), Colombia and Ecuador (October 2007)162.
In terms of regional energy integration, the agreement that establishes the fundamental
terms and conditions for the implementation and execution of the Natural Gas Supply
Project from Venezuela to Trinidad and Tobago was signed in 2017, through a gas
interconnection from the Field Dragon, in the northeast of Venezuela, to the Hibiscus
Field, in Trinidad and Tobago163.
It is important to note that Petrosur, Petrocaribe, Petroandina and Petroamerica initiatives
are all Venezuelan-led organizations. Here, the relationship between foreign policy,
diplomacy and energy played by the Venezuelan state company PDVSA is clear, what
was already highlighted in this thesis (see subsection 2.1.3).
Petrosur is a political and commercial enabler promoted by the Bolivarian Republic of
Venezuela and, with the support of Brazil, Argentina and Uruguay, establishes
cooperation and integration mechanisms based on the complementarity of energy
resources. Petrosur seeks to minimize the negative effects of the countries of the region
in terms of energy payments, by reducing transaction costs (eliminating intermediation),
access to preferential financing and taking advantage of commercial synergies to solve
economic and social asymmetries. It was born in 1988 and it is a political platform for
alignment with Mercosur (already in the context of the Venezuela separation from CAN).
Venezuela’s stated goal with the Petrocaribe Agreement is to foster regional solidarity
and alleviate financial hardship endured by countries in the Latin America-Caribbean
162 See:
http://colombia.embajada.gob.ve/index.php?option=com_content&view=article&id=6&Itemid=9&lang=e
s. 163 See: http://www.pdvsa.com/index.php?option=com_content&view=article&id=6783:venezuela-
exportara-gas-natural-a-la-republica-de-trinidad-y-tobago&catid=2&Itemid=101&lang=es.

132
region in face of rising oil prices. Signed in 2005164, the Agreement vouches for the direct
sale of petroleum products, but there are no price concessions, since Venezuela, as a
member of OPEC, is obliged to sell its oil at market price.165 Rather, Petrocaribe allows
governments to pay for petroleum over time, so countries have up to 25 years to pay off
oil bills or can provide goods and services in exchange for oil since President Hugo
Chávez’s administration.166 However, the context of Venezuela’s crisis has turned the
numbers down significantly. The countries’s quota has dropped dramatically and the
Petrocaribe cutback is largely affecting Caribbean economies. In a scenario without
Petrocaribe financing, the region will continue to require cooperation from other oil
producers to face the rising challenges concerning energy security, since the cost of
energy in the region is one of the biggest in the world with a high dependence on fossil
fuels and a more limited access to alternative sources of electricity than most countries of
Latin America (CANUTO, 2015). Therefore, it is clear that the initiative was strongly
shaken by domestic factors within Venezuela, which corresponds to a relevant
institutional barrier (see subsection 2.3.1).
The energy integration initiative Petroandina came to terms in 2005 in Lima (Peru), as
a common platform or ‘strategic alliance’ of state oil and energy entities among Bolivia,
Colombia, Ecuador, Peru and Venezuela, in order to promote electricity and gas
interconnection, mutual provision of energy resources and joint investment in projects. In
2006, Bolivia and Venezuela announced the Petroandina creation, rising in 2007 as a
mixed binational oil company.167
Venezuela also promotes the Petroamérica initiative in 2005, a proposal for energy
integration of the peoples of the continent. Its roots come from the Bolivarian Alternative
for the Peoples of Our America (ALBA) and are based on the principles of solidarity and
complementarity between countries, as well as the fair and democratic use of resources
for the development of their peoples. In another level of integration, the agreements
framed in Petroamerica propose the integration of the state energy companies of Latin
America and the Caribbean (LAC) to operationalize the agreements and make joint
164 There are now 18 members of Petrocaribe: Antigua and Barbuda, Bahamas, Belize, Cuba, Dominica,
Dominican Republic, Granada, Guatemala, Guyana, Haiti, Honduras, Jamaica, Nicaragua, Saint Kitts and
Nevis, Saint Vincent and Grenadines, Saint Lucia, Suriname, and Venezuela. 165 See: http://www.petrocaribe.bz/services-view/key-agreements/. 166 See: https://www.as-coa.org/articles/explainer-what-petrocaribe. 167 See: http://www.ilumina.org.br/criada-a-petroandina/.

133
investments in the exploitation and commercialization of oil and natural gas. The idea of
Petroamerica is to consolidate the three previous initiatives (Petrocaribe, Petroandina and
Petrosur). One of its chief project is the proposed Southern Gas Pipeline.
According to the 2017 OLADE Energy Statistics Yearbook, in terms of the hydrocarbon
sector and in order to contribute to the balance of the global oil industry, the country
announced the implementation of a cut of 95 kbbl/day, without undermining its
international contractual commitments. The measure is framed, in compliance with the
agreement of reduction of production reached between member nations and non-members
of the Organization of the Petroleum Exporting Countries (OPEC), in 2016. The
production of crude oil in September 2016 reached a positive variation close to 2,534
Mbbl/day, due to the growth of 17 Mbbl/day of the Orinoco Oil Belt. The increase in
PDVSA’s installed processing capacity in the Orinoco Oil Belt was also announced,
through the start-up of oil treatment plants in the joint ventures Petrolera Sinovensa and
Petrocarabobo. On the other hand, the increase in gas prices was officially announced in
February 2016. The reduction of the subsidy of gasoline in Venezuela, in addition to
honest fuel prices, seeks that users actually consume the octane required by their vehicles.
Through PDVSA Gas, Venezuela executed a natural gas conversion project for two
turbogenerator units (TGU) of the Josefa Joaquina Sánchez Bastidas Complex, in the
Vargas state. This project focus on advancing the change of the energy matrix for
consumption of liquid fuels (diesel) by natural gas in the electricity sector and thereby
stabilizing the national electricity system hit by the El Niño weather phenomenon, with
clean and safe energy. Additionally, these actions allow the release of 14,620 barrels of
liquid fuel per day, which, due to its high profitability in the international market,
represents a significant foreign exchange income for the nation. Besides, with the
activation of a new compression train at the ‘Copa Macoya’ plant, PDVSA added an
additional 80 Mpc of gas to the domestic market, destined for thermogeneration and
petrochemicals; thus allowing the replacement of diesel by gas in thermoelectric plants
in the center of the country (OLADE, 2017).
Considering recent challenges and opportunities, it is worth noting that (i) the country has
never fulfilled its promise to invest in the Abreu e Lima Refinery (RNEST); (ii) it did not
go ahead with the famous ‘Southern Gas Pipeline’; and (iii) although it has led the
proposal for the creation of the Bank of the South, it has not advanced. In addition, the

134
already presented Petrocaribe, Petroandina, Petrosur and Petroamerica did not advance
fully in their objectives.
The RNEST168 started operations in 2014 with the first set of units (Train I) and is located
at the Suape Port Industrial Complex, 45 km from Recife, in Pernambuco (Brazil). It has
a processing capacity of 230,000 bpd and its main objective is to produce diesel oil (70%)
and to enable the demand for derivatives from the North and Northeast region to be met,
with a reduction in imports. A pre-agreement with Venezuela foreseeing the guarantee of
supply for this refinery has been closed but has not been implemented.
The Great Southern Gas Pipeline, also known as Venezuela-Argentina Gas Pipeline,
would correspond to a major work of South American physical energy integration. The
project would link Venezuelan reserves to the consuming centers of Brazil and Argentina
(with possible branches to Bolivia and Uruguay), creating demand for Venezuelan gas
and, in the medium term, solving the Argentine energy problem, which focus on gas and
has reserves only for another ten years (PAZ and NUNES, 2011). Launched in December
2005 at the 29th Mercosur Summit in Montevideo (Uruguay), its construction was
reaffirmed as the main work of the South American Energy Ring in April 2007, at the
First South American Energy Summit held on the island of Margarita (Venezuela). With
estimated costs of around US$ 20 billion, it should be the largest infrastructure integration
project in South America, it was planned to start working in 2009 and then it would
inaugurate the first stretches as early as 2013. However, the Great Gas Pipeline not even
reached the initial operations (JAEGER, 2016).
The Bank of the South was proposed at the end of the last decade and presents a
challenge in terms of regional financial integration. In 2014, the UNASUR foreign
ministers decided to implement the Banco do Sul with an initial capital of US$ 7 billion,
which would finance integration projects in South America169. The charter of Bank of the
South was signed in 2009 by the Presidents of Argentina, Bolivia, Brazil, Ecuador,
Paraguay, Uruguay and, Venezuela. Five countries have approved the document in their
parliaments, but Brazil and Paraguay are still processing its approval (BARROS, 2016).
168 Capable of processing the national heavy oil and imported oil from Venezuela. 169 See: https://www.cartamaior.com.br/?/Editoria/Internacional/-Banco-do-Sul-outro-legado-de-
Chavez/6/31014.

135
In the Venezuelan case, it is perceived that the macronomic problems of domestic and
international natures strongly affected the daring plans to advance as an important player
in the regional energy integration process. With initiatives involving countries throughout
Latin America and the Caribbean, Venezuela’s current scenario is that there are no
concrete integration projects. Ergo, diesel gasoline is being imported and the national gas
production is going down, without new investments.
Venezuela (as well as Uruguay) play(s) a marginal role in current regional electricity
integration. Uruguay is somewhat geographically isolated between Argentina and Brazil,
countries with which Uruguay already has binational (Salto Grande, with Argentina) and
international interconnections such as Livramento - Rivera and Presidente Médici - San
Carlos (both TL with Brazil). On the other hand, Venezuela is a politically and
economically unstable country170 due to its domestic vulnerability to the international
crude oil price. In this way, crude oil is also protagonist in its regional insertion, playing
an important role in successful initiatives (Petrosur, Petrocaribe, Petroandina and
Petroamerica) and unsuccessful projects (RNEST, Southern Gas Pipeline and Bank of the
South). We concluded that neither country is involved in major regional projects, being
outside any energy integration scenarios.
In general, this chapter showed that regional energy integration projects have been at the
mercy of the dichotomy between government policy and State policy, the macroeconomic
(inter)national context, and the asymmetric weight that projects play for the different
countries involved. Besides, institutional, regulatory and resource allocation structure
between these countries is extremely diverse and, once again, asymmetric. Finally, it is
also possible to realize the relative loss of participation of regional financing mechanisms,
such as the IDB, CAF, FONPLATA, FOCEM and BNDES, in favor of China. From a
geopolitical and geo-strategic point of view, this movement demands a prompt response
from the countries of the region, either by the resumption of regional autonomy or by
those who historically seek to represent regional leadership, as is the case of Brazil.
170 It is worth recalling the already mentioned political context in which Venezuela enters Mercosur in the
mid-2012. Since its accession, the country has been involved in political dilemmas and conflicts. In turn,
this led to the temporary and definitive suspension of the Mercosur. Therefore, it becomes clear the
relevance of political factors in this process, ratifying that regional energy integration is not an exclusively
physical and technical matter, but has a multifaceted nature.

136
Despite the diversity of issues analyzed in each of the six countries, it is also important
to consider (i) the difference between relative prices within and between countries; (ii)
the nature of tax structures; (iii) the profile of macroeconomic policies; (iv) the dynamics
of regulatory policies (energy and environmental sector); and (v) the lack of energy sector
planning in most countries in the region. In addition, the need to deepen these issues in
future studies is highlighted in order to fully map the complexity of the issue in detail.

137
4. Regional perspective
The purpose of this chapter is to add regional perspectives into the already presented
national perspectives of the Mercosur countries. Here, we use regional qualitative primary
sources such as norms, laws, international treaties, agreements, memorandum of
understanding, regulatory frameworks, decisions, recommendations, decree, resolutions,
framework agreements, declarations, programs and planning are emphasized.
The structure of the chapter is again divided into two main sections, which international
organizations that cope with energy integration in the region: Mercosur (section 4.1) and
UNASUR (section 4.2). Generally, the history, normative framework, legal and
institutional bases of the region’s energy integration will be presented, focusing on
Mercosur and UNASUR cases.
4.1 Mercosur
Section 2.2 presented and analyzed Mercosur. Here, the focus is precisely the energy
sector, highlighting (i) the institutional evolution of the matter within Mercosur; and (ii)
the role of the Working Subgroup (SGT-9). In addition, there is a brief comparative
analysis of recent energy policies with regard to policies to ensure energy security based
on the six previous sections.
As already presented in section 2.3, it is important to point out that there are huge projects
related to regional energy integration in the Mercosur region prior to the very creation of
the same171, especially in the 1970s and 1980s. The 1990s are characterized by the
creation of international electrical interconnections, although the first one (Br-Uy) dates
back to the 1960s.
Table 13 depicted the evolution of the energy institutional design within Mercosur. For
this purpose, the official Mercosur database was used, considering 25 official regulations
171 Such as the main binational hydroelectric projects Salto Grande (1979), Itaipu (1984) and Yacyretá
(1994).

138
and documents dealing with energy, electricity, oil, gas, biofuels and international
interconnections.

139
Table 13. Evolution of Mercosur’s official energy institutional design (1993-2012)
Year Document Subject
1993 MERCOSUR/GMC/RES N. 57/93172 Defines guidelines of Energy Policies in Mercosur
1996 MERCOSUR/GMC/RES N. 150/96173 Deliberates on the negotiating guidelines for Sub-Working Group N. 9 ‘Energy’
1998 MERCOSUR/CMC/DEC N. 10/98174 Regulates electric exchanges and electrical integration in Mercosur
MERCOSUR/GMC/RES N. 32/98175 Takes the project related to electrical interchanges and electrical integration to CMC
1999 MERCOSUR/CMC/DEC N. 10/99176 Promotes gas integration in Mercosur
2000 MERCOSUR/CMC/DEC N. 59/00177 Creates the Mining and Energy Sub-Working Group
MERCOSUR/CMC/DEC N. 60/00178 Institutes the high government officials forum responsible for mining and energy issues in Mercosur
2001 MERCOSUR/GMC/RES N. 33/01179 Decides on the negotiating guidelines for Sub-Working Group N. 9 ‘Energy’
172 See: http://gd.mercosur.int/SAM%5CGestDoc%5Cpubweb.nsf/1F59CE1DBE84885D0325821C00417FBB/$File/RES_057-
1993_ES_Direc.Pol%C2%A1tic.Energ.en%20el%20Mercosur_Acta_03_93.pdf. 173 See: http://gd.mercosur.int/SAM%5CGestDoc%5Cpubweb.nsf/DC522DD4A30D91D40325821C0043FE8C/$File/RES_150-1996_PT_PautaNegociaSGT%209%20-
%20Energia.pdf. 174 See: http://gd.mercosur.int/SAM%5CGestDoc%5Cpubweb.nsf/94EE66668FDE0BAC0325821C00444588/$File/DEC_010-1998_ES_Memorandum_Entend_Inter-
El%E2%80%9Act-Integ-El%E2%80%9Actrica_Acta%20%201_98.pdf. 175 See: http://gd.mercosur.int/SAM%5CGestDoc%5Cpubweb.nsf/462B920E29567CEA0325821C00445C26/$File/RES_032-
1998_ES_Proyecto_Decisi%C2%A2n%20N%C2%A7%201a%2012-98_Acta%202_98.pdf. 176 See: http://gd.mercosur.int/SAM%5CGestDoc%5Cpubweb.nsf/BF7BF0DFCFCCE83D0325821C00448089/$File/DEC_010-1999_ES_Memor-Interc-
Gas%C2%A1feros%20e%20Integ-Gas%C2%A1fera_Acta%20%202_99.pdf. 177 See: http://gd.mercosur.int/SAM%5CGestDoc%5Cpubweb.nsf/804F1F391973D2B90325821C0044B302/$File/DEC_059-
2000_ES_Reestructuraci%C2%A2n_%C3%A0rg-Dep_GMC-CCM_Acta%202_00.pdf. 178 See: http://gd.mercosur.int/SAM%5CGestDoc%5Cpubweb.nsf/F085C28C4D0C87D70325821C0044A6F5/$File/DEC_060-2000_ES_Reuni%C2%A2n%20Mtros_Minas-
Energ%C2%A1a_Acta%202_00.pdf. 179 See: http://gd.mercosur.int/SAM%5CGestDoc%5Cpubweb.nsf/6E4043127ED88AD50325821C0044C9F6/$File/RES_033-2001_ES_Pauta%20Neg-
SGT%20N%C2%A7%209_Acta%203_01.pdf.

140
2002 MERCOSUR/GMC/RES N. 32/2002180 Mercosur Technical Regulation of reference diesel specifications for exhaust emissions test
2005
FRAMEWORK AGREEMENT ON
ENERGY COOPERATION N. 19181 Proposes regional energy complementation between Mercosur States Parties and Associated States
MERCOSUR/CMC/DEC N. 07/05182 Division of the Sub-Working Group of ‘Energy and Mining’ into two subgroups
2006 MERCOSUR/CMC/RES N. 02/06183 Unique scheme for the control of natural gas use as a vehicular fuel in Mercosur
MERCOSUR/CMC/DEC N. 36/06184 Memorandum of understanding to establish a special Sub-Working Group on biofuels
2007 MERCOSUR/CMC/DEC N. 49/07185 Mercosur action plan for cooperation on biofuels and creation of Ad Hoc Group on Biofuels
2008 MERCOSUR/GMC/RES N. 36/08186 Mercosur technical regulation on minimum safety and energy efficiency requirements for household appliances that use gas
as fuel
2009 MERCOSUR/GMC/REC N. 01/2009187 General guidelines for energy efficiency in the field of Mercosur
MERCOSUR/GMC/REC N. 02/2009188 Guidelines for renewable energy sources in the Mercosur
180 See: http://gd.mercosur.int/SAM%5CGestDoc%5Cpubweb.nsf/BE852B11DFCD397E0325821C00451AC0/$File/RES_032-
2002_ES_FERR_RTM_Diesel_Emis_Gases_Acta%202_02.pdf. 181 http://www.mercosur.int/msweb/portal%20intermediario/Normas/acordos%20es/44_05_ACUERDO%20MARCO%20COMPLEMT%20ENERGETICA%20MCS-
EA_ES.pdf. 182 See: http://gd.mercosur.int/SAM%5CGestDoc%5Cpubweb.nsf/60A121B3AC78D7450325821C00454D3F/$File/DEC_007-
2005_ES_Divisi%C2%A2n%20SGT%20N%C2%A7%209.pdf. 183 See: http://gd.mercosur.int/SAM%5CGestDoc%5Cpubweb.nsf/5AAD6A34BDD4D08C0325821C00457ECC/$File/RES_002-2006_ES_ControlGasNatural.pdf. 184 See: http://gd.mercosur.int/SAM%5CGestDoc%5Cpubweb.nsf/DF5EA9534EC2D5E10325821C0048A9FF/$File/DEC_036-
2006_ES_Memorandum%20Biocombustibles.pdf. 185 See: http://gd.mercosur.int/SAM%5CGestDoc%5Cpubweb.nsf/2444DBE05DD213080325821C0048C55D/$File/DEC_049-
2007_ES_Plan%20Accion%20Biocombustibles.pdf. 186 See: http://gd.mercosur.int/SAM%5CGestDoc%5Cpubweb.nsf/B591578E286F25040325821C0045AC96/$File/RES_036-2008_ES_RTM%20GAS.pdf. 187 See: http://gd.mercosur.int/SAM%5CGestDoc%5Cpubweb.nsf/80968C4EBDC14E7C0325821C0045D53A/$File/REC_001-
2009_ES_Directrices%20Eficiencia%20Energetica.pdf. 188 See: http://gd.mercosur.int/SAM%5CGestDoc%5Cpubweb.nsf/8B20C6C0951FDAB60325821C0045DAF8/$File/REC_002-
2009_ES_Directrices%20Fuentes%20Renovables%20Energia.pdf.

141
MERCOSUR/GMC/RES N. 04/2009189 Mercosur technical regulation on low voltage electrical cables and conductors
2010
MERCOSUR/GMC/RES N. 04/2010190 Mercosur technical regulation on switches for fixed electrical installations
MERCOSUR/CMC/DEC N. 02/2010191 FOCEM project: 500 MW electric interconnection betweem Uruguay-Brazil
MERCOSUR/CMC/DEC N. 03/2010192 FOCEM project: interconnection link in 132 kV between Iberá – Paso de los Libres Norte
MERCOSUR/CMC/DEC N. 07/2010193 FOCEM project: implementation of the 500 kv system in Paraguay between Villa Hayes – Itaipu
MERCOSUR/CMC/DEC N. 11/10194 FOCEM project: proposes the mapping of Mercosur’s oil and gas production chain
2012 MERCOSUR/CMC/DEC N. 01/2012195 FOCEM project: interconnection link in 132 kV between Iberá – Paso de los Libres Norte
Source: Own elaboration based on Mercosur database; CMC = Common Market Council; GMC = Common Market Group; DEC = Decision; REC = Recommendation; RES
= Resolution.
189 See: http://gd.mercosur.int/SAM%5CGestDoc%5Cpubweb.nsf/315BDDC1F2BD9EB90325821C0045FA25/$File/RES_004_2009_ES_RTM-
Cables%20y%20Cond%20Baja%20Tensi%C2%A2n.pdf. 190 See: http://gd.mercosur.int/SAM%5CGestDoc%5Cpubweb.nsf/280DBC5CCEC30A0F0325821C00462748/$File/RES_004-
2010_ES_Interruptores%20paraInstalaciones%20El%E2%80%9Actricas.pdf. 191 See: http://gd.mercosur.int/SAM%5CGestDoc%5Cpubweb.nsf/F6867F9DDF05D55F0325821C00466B5C/$File/DEC_002-
2010_ES_Apro%20Proy%20Inter%20El%E2%80%9Ac%20Uy-Br.pdf. 192 See: http://gd.mercosur.int/SAM%5CGestDoc%5Cpubweb.nsf/0D7446B458E5DBE60325821C00514CB0/$File/DEC_003-
2010_ES_Apro%20Proy%20Inter%20El%E2%80%9Ac%20Iber%C2%A0%20PdelosLibres.pdf. 193 See: http://gd.mercosur.int/SAM%5CGestDoc%5Cpubweb.nsf/A2E3A44058091C070325821C0046570F/$File/DEC_007-2010_FERR_ES_Proyecto%20Itaipu.pdf. 194 See: http://gd.mercosur.int/SAM%5CGestDoc%5Cpubweb.nsf/94BE018BB19D175D0325821C0046A026/$File/DEC_011-
2010_ES_Proyecto%20Cadena%20Productiva%20Petroleo%20y%20Gas.pdf. 195 See: http://gd.mercosur.int/SAM%5CGestDoc%5Cpubweb.nsf/4EC1911CB9FF9E7A0325821C0046DC0D/$File/DEC_001-
2012_ES_Aprobaci%C2%A2n%20de%20recursos%20adicionales%20Proyecto%20%20Iber%C2%A0.pdf.
142
As shown, Mercosur member countries have reached agreements and memorandum on
energy issues throughout the organization’s existence, especially since the late 1990s.
Five points will be highlighted below.
In the first Mercosur document that discusses the energy issue (Resolution N. 57/1993),
Energy Policies in Mercosur are drawn. The document highlights: (i) favoring integration
between the energy markets of the States Parties, with freedom of purchase and sale of
energy companies and free transit of energy, respecting the laws in force in each country;
(ii) promotion of rational use of energy and conservation; (iii) the admission of the
possibility of binational or multilateral energy agreements within or outside the region;
and (iv) the preparation of regional integrated energy planning studies in accordance with
national macroeconomic planning. It is clear that already in the first document the
binational character that will be present in the different agreements stands out.
The second point to be highlighted is that Decision N. 10/1998 is a memorandum of
understanding regarding electrical exchanges and electrical integration in Mercosur.
There is therefore no forecast for the execution of energy transmission line projects and
the construction of gas pipelines; that would require more action and investments from
the Member States. Then, it is understood that the document, while pioneering the
integration of electricity in Mercosur, aims to remove legal and political barriers to energy
exchanges between members, not assuming the role of infrastructure expansion for the
transport of energy, which is still precarious among Mercosur countries. The third point
is that Decision N. 10/1999 bears many similarities to Decision N. 10/1998, since the text
itself appears to have been built upon it. The difference between them is that Decision N.
10/1998 addresses integration based on electricity while N. 10/1999 deals with gas
exchanges and gas integration between Mercosur States Parties (PERGHER, 2016)196.
The fourth point highlighted can be found in the Framework Agreement on Energy
Cooperation (2005). In the document, there is an interest in ‘advancing the integration
of production and transportation’, which would necessarily promote the expansion of
energy transport infrastructure, as well as joint production among Mercosur countries
(interactions already highlighted in section 2.2). However, the rest of Mercosur legislation
196 Neither Decision N. 10/1998 nor Decision N. 10/1999 became positive law and were not incorporated
into the domestic law of the respective countries. This is largely due to the intergovernmental nature of
Mercosur, which departs from the supranational profile of certain institutions of the European Union (see
section 2.2).

143
does not appear to be a normative basis for such interest, and there are only regulations
on reducing national barriers to energy exchanges. In addition, as already emphasized in
this thesis, the agreement points out great asymmetries in the sector between the Member
States of the Agreement. In its Art. 6, it is highlighted the possibility of concluding
regional, subregional or bilateral agreements in the areas of (i) commercial exchange of
hydrocarbons; (ii) interconnection of the electric transmission networks; (iii)
interconnection of pipeline networks and other hydrocarbon pipelines; (iv) cooperation
in the exploration, exploitation, and industrialization of hydrocarbons; and (v) renewable
energy sources and alternative energy sources.
The last point emphasized is that since 2012 there are no recommendations, directives,
resolutions and/or decisions on the official Mercosur website. This will be presented with
details in Figure 19.
With regard to the issue of the different projects to be developed within Mercosur, the
Fund for the Structural Convergence of Mercosur (FOCEM), which is the first solidarity
financing mechanism for the bloc countries and it aims to reduce the existing asymmetries
within them. The creation of FOCEM took place with Decision CMC N. 45/2004197. In
turn, Decision CMC N. 18/2005198 established standards for its integration and operation,
and CMC Decision N. 01/2010199 defines its current regulation. More recently, Decision
CMC N. 22/2015200 gives continuity to the Fund.
Created at the end of 2004 and operating since 2006, the FOCEM is based on a system of
contributions and distribution of resources in an inverse manner, which means that
countries with greater relative economic development make greater contributions and, at
the same time, countries with less relative economic development receive the greatest
resources in order to finance their projects. The funds are intended for countries and
197 See:
http://gd.mercosur.int/SAM%5CGestDoc%5Cpubweb.nsf/449D95325EC237700325821C0050DA08/$Fi
le/DEC_045-2004_ES_FondoConvergenciaEstructural.pdf. 198 See:
http://gd.mercosur.int/SAM%5CGestDoc%5Cpubweb.nsf/893E41876CA26A6C0325821C00510E9F/$Fi
le/DEC_018-2005_ES_FE_IntyFuncFOCEMyFortalEstrctInstit.pdf. 199 See:
http://gd.mercosur.int/SAM%5CGestDoc%5Cpubweb.nsf/8695D844309A8FD30325821C005125D5/$Fi
le/DEC_001-2010_ES_FERR1_Reglamento%20FOCEM.pdf. 200 See:
http://gd.mercosur.int/SAM%5CGestDoc%5Cpubweb.nsf/B04D3A6F6B1156AF0325821C0054AAB3/$
File/DEC_022-2015_ES_%20Renovacion%20FOCEM.pdf.

144
delivered as a non-refundable donation to finance up to 85% of the eligible value of the
projects presented. Contributions to FOCEM began in 2006, considering a total annual
amount up to 2012 of US$ 100 million. With the entry of Venezuela into Mercosur, and
until 2015, the Fund reaches US$ 127 million annually. These resources are allocated to
projects submitted by Mercosur States Parties with the criterion of benefiting the smaller
and less developed economies.201 Therefore, it is considered the central point of any
regional integration process that is to reduce regional asymmetries. This logic of
contributions and distribution of resources is presented in Table 14.
Table 14. Annual contributions and resources received in FOCEM
Country Annual contributions
(US$ millions) %
Annual resources received
(US$ millions) %
Br 70 55.12 11.55 9.09
Ar 27 21.26 11.15 9.09
Ve 27 21.26 11.50 9.06
Uy 2 1.57 36.96 29.10
Py 1 0.79 55.44 43.65
Total 127 100.00 127.00 100.00
Source: MERCOSUR (2015).
Based on Table 14, it can be seen that Brazil is the country that contributes most to
FOCEM (55.12%), while Paraguay has the least capital (0.79%). The contributions
provided by Argentina (21.26%) and Venezuela (21.26%) are quite similar. As already
explained, this logic is related to the GDP size of each country. Conversely, the annual
resources received go mainly to Paraguay (44.65%) and Uruguay (29.10%). In addition,
taking into account the distribution of funds by programs, it is noteworthy that 43% goes
to the infrastructure sector.
It is also interesting to note the existence of a Sub-Working Group within Mercosur that
specializes in energy issues (SGT-9). As presented in Table 13, it was created by
Decision N. 07/2005, which divided the then subgroup of ‘Energy and Mining’ into two
new ones. The motivations that led to this separation, according to the document, was the
distinct nature of the issues presented in both themes. Besides, some of the most relevant
documents signed in Mercosur were consequence of the SGT-9, such as those already
201 See: http://focem.mercosur.int/es/que-es-focem/.

145
discussed (Decisions N. 10/1998 and Decision N.10/1999). The existence of an Ad Hoc
Group on Biofuels (GAHB) was established by Decision N. 49/2007.
In this sense, energy integration issues are a major topic at the Meeting of Ministers of
Mines and Energy (RMME), part of the Common Market Council (CMC), as well as of
the Sub-Working Group (SGT-9)202 and Mercosur Ad Hoc Group on Biofuels (AHBG),
both subordinate to the Common Market Group (CMG). On the other hand,
environmental issues are undertaken by SGT-6, which works close to a preparatory
technical commission for the Meeting of the Environment Ministers (RMMA), having a
more political tone.
Since 2011, SGT-6 has focused on: (i) non-tariff measures related to environmental
aspects; (ii) economic competitiveness; (iii) incorporation of an environmental
component to governmental sectorial policies; (iv) mechanisms to improve
environmental management; (v) operationalization and streghtening of Mercosur
Environmental Information System; (vi) environmental sustainability, production,
substances and waste management; and (vii) keeping up-to-date with the global
environmental agenda. Figure 19 presents the evolution of SGT-6 and SGT-9 meeting
frequencies, being 66 of SGT-6 (1996-2015) and only 16 of SGT-9 (2005-2011). What it
is possible to perceive beforehand is that SGT-6 meetings have become even less frequent
and that, regarding SGT-9 meetings, there is no public information pre-2005 and post-
2011.
202 The SGT-9 was created during the period of restructuring of the energy sectors of the different countries
of the 1990s. Discussions are also being carried out within the Ad Hoc Group on Biofuels (GAHB).

146
Figure 19. Evolution of SGT-6 and SGT-9 meeting frequencies (1996-2015)
Source: Own elaboration based on the website of Mercosur
Based on the meeting minutes from 2005 to 2010 and the majority referring to the years
2000 to 2005, it can be said that the vast majority of the delegated actions were fulfilled,
but it should be noted that many were postponed or obtained partial compliance status
(MENEGHINI and VOIGT, 2011). Internal factors, such as distinct political interests
among the countries as well as the change of representatives at meetings; and external
factors, such as the involvement of other players in the energy sector (private sector, other
international institutions) and the complexity of the sector can be seen as influencing the
results. Thus, it can be concluded that SGT-9 did not act to structure and coordinate
concrete policies or projects on regional energy integration. In the analyzed period, it only
worked on (i) the harmonization of energy regulation in order to facilitate exchanges; (ii)
the elaboration of inventories on the electric sector; (iii) feeding databases to foster
decisions in other instances; and (iv) the analysis of financial, legal and tax aspects of the
sector. Although SGT-9 has daring objectives, they ended up not being reached by several
reasons.

147
In this sense, it is perceived that the SGT-9 lost some of its relevance and ceased meeting
after the creation of UNASUR Energy Council203, the corresponding technical forum, and
the negotiations of the UNASUR energy integration treaty. This is due to the nature of
Latin American regional integration processes characterized by the overlap of initiatives,
which often deal with the same theme.
Bringing this discussion to the present scenario, it is worth noting that the political-
economic fragility of some countries increases the risk of insecurity and mistrust between
countries when we talk about advancing in regional energy integration. Therefore, as
highlighted in section 2.3, it is important that there is a legal-institutional framework for
project and initiatives coordination and control in the energy sector. However, it was not
up to member countries to prioritize energy integration within Mercosur, nor did
Mercosur institutional bodies in charge of this agenda move forward. Consequently,
Mercosur countries ended up choosing to open markets to free competition and to foment
simple international interconnections and few binational plants as the grounds for energy
strategies valid for the bloc.
Jointly, there was inability of national governments and Mercosur to advance the regional
energy integration agenda. Previous sections of this chapter focused on how each of the
States Parties presented physical, market and institutional asymmetries. Thus, Table 15
and Table 16, respectively, sum up how the electric and hydrocarbon sectors vary in
Argentina, Bolivia, Brazil, Paraguay, Uruguay and Venezuela.
203 UNASUR will be presented and discussed in section 4.2.

148
Table 15. Comparative analysis of electric power industry in Mercosur countries
Co
un
try
Policy and Regulation Segments
Studies and
Planning Ministry Policies and
Guidelines
Regulation
and
Supervision
Municipal
regulators
Manage
wholesale
electric
market
Advice and
monitoring2
Generation Transmission Distribution Commercialization
Ar MINEM MINEM ENRE1 24 CAMMESA CFEE
Private and state-
owned companies,
Yacyretá, Salto
Grande
SADI Majority
private CAMMESA
Secretariats
of MINEM
Bo ME VMEEA AFCSE - CNDC - COBE, ENDE ENDE, ISA Privados
companies -
VMATE,
EBIH
Br MME CNPE ANEEL ABAR ONS
CNPE,
CMSE,
CGEE,
SSE/MME
Private and state-
owned companies,
Eletrobras, Itaipu
Eletrobras,
CPST, CUST,
CCT, CCI
ABRADEE,
DIT,
Eletrobras
CCE, ACR, ACL,
CCEAR, Eletrobras
EPE, SPG-
MME
Py VMME-
MOPC ANDE
ANDE,
CNEP,
CONAM,
SEAN
- - - ANDE, Itaipu,
Acaray, Yacyretá ANDE ANDE -
Energy
Resources
Department
Uy MIEM DNE-MIEM URSEA - ADME DNE-
MIEM
UTE, private
companies UTE UTE
UTE, private
companies DNE-MIEM
Ve MPPEE
The National
Development
Plan
MPPEE - - Corpoelec Corpoelec Corpoelec Corpoelec Corpoelec MPPEE
Source: Own elaboration; 1 = but the electrical regulation is provincial (there are 24 regulators); 2 = national and municipal governments.

149
Table 16. Comparative analysis of O&G industry in Mercosur countries
Country Ministry Policies and
Guidelines
Regulation and
Supervision Exploration and Production
Refining and
Transportation Comercialization
Ar MINEM MINEM ENARGAS (gas),
MINEM (oil)
YPF and private companies (Petrobras
Argentina, Pan American Energy
Sucursal Argentina, LLC, Total Austral)
MINEM and private
comapnies MINEM
Bo MH - ANH
Petrobras Bolivia, YPFB, YPFB Andina
S.A., YPFB Chaco S.A., YPFB
Petroandina S.A.
Petrobras Bolivia, YPFB
Refinación S.A., YPFB
Transporte S.A., YPBF
Transierra S.A., YPFB
Logistica S.A.
YPBF Aviación, Flamagas S.A
Br MME
Presidency of the
Republic, National
Congress, CNPE,
MME
ANP, environmental
inspection agencies,
RFB
Petrobras, IOCs, independent actors,
supply industry to the oil sector,
companies of the O&G
Petrobras and private
companies Traders, Petrobras, PPSA
Py
VMME-
MOPC,
MIC
VMME-MOPC, MIC VMME-MOPC, MIC Petropar and private companies Petropar
Petrobras, ESSO, COPETROL,
Barcos y Rodado, PUMA, GAS
CORONA, HIPASA, SUGAS,
Lima Gas, Gas del Este,
Yacyretá, Acaray Gas,
COPESA, Petrogas, Norte Gas
Uy MIEM DNE URSEA
ANCAP in association with international
private companies (Total, BP, BG,
TULLOW Oil, Petrel-Schuepbach, YPF)
Petrobras Uruguay (GN
distribution), in
association with ANCAP
ANCAP DUCSA
Ve MPetroMin The National
Development Plan
MPetroMin (oil),
ENAGAS (gas)
PDVSA or other concession holders
(gas), PDVSA (oil) PDVSA PDVSA
Source: Own elaboration.

150
Identifying the asymmetries that exist between the Mercosur countries, which imply
different energy policies, is fundamental to understand that the concept of energy security
is not capable of dealing with or incorporating such particularities. Thus, the following
section proposes a new concept, suggesting the adoption of different indicators to
consider new issues that are now incorporated into the energy issue, particularly when it
comes to developing countries.
Thus, although there are advances in institutional and legal matters within Mercosur
concerning regional energy integration, it can be seen that in practice little progress has
been made. More recently, it can be argued that the ongoing attempts to revive Mercosur
are concentrated in the commercial sphere, in view of efforts to negotiate a trade
agremeent with the European Union (EU). Regarding the energy policies of the Mercosur
countries, they do not follow a pattern, each country being responsible for defining its
agendas without a common regional plan. However, the recent Mercosur Social Summit
in Brazil can be seen as a positive example in this field, where dynamism is still to be
found. Thus, in the area of infrastructure, which requires medium/long-term planning and
investment, it will be necessary to wait for a more adequate political and
(macro)economic scenario.
4.2 IIRSA-UNASUR
As already discussed, Latin America is characterized by an overlap of regional integration
processes, which often deal with similar issues. In terms of energy, this occurs between
Mercosur, the Initiative for Regional Infrastructure Integration South America (IIRSA),
the Union of South American Nations (UNASUR), Regional Energy Integration
Commission (CIER)204 and the Latin American Energy Organization (OLADE).
The CIER was founded in 1964, during the first Regional Congress of Electrical
Integration (Montevideo, Uruguay). It is defined as a non-governmental organization that
204 CIER is composed of different national support committees. In the case of Brazil, the committee in
charge is the Brazilian Committee of CIER (BRACIER), created in 1966. BRACIER is a non-profit,
nongovernmental entity that currently comprises 41 companies/entities in the Brazilian electricity sector,
including the Electrical Energy Research Center (CEPEL), Eletrobras and the National System Operator
(ONS).

151
gathers 198 companies and organizations of the electricity sector in the ten South
American countries. True to its primary purpose, it promotes and leads the integration of
electricity sectors as one of the means to boost regional development and prosperity205.
The Latin American Energy Organization (OLADE) was created in the context of the
international energy crisis of 1973, it is made of 16 member countries of Latin America
and the Caribbean. It is represented in each country by the coordinators in the ministries
or energetic entities.
Both CIER and OLADE are responsible for the systematization and elaboration of energy
data and reports for LAC countries. However, they do not constitute regional integration
initiatives, although they do contribute to this in some way. In this sense, even if they
touch on energy infrastructure in some way, the focus of this section will be on the
Initiative for Regional Infrastructure Integration South America (IIRSA)206, because it is
the broadest one in the subcontinent, and consequently UNASUR. The initiative includes
coordination mechanisms among governments, multilateral financial institutions and the
private sector, and aims to coordinate investment plans and programs, as well as to
prioritize Integration and Development Hubs (EID).
The IIRSA was created during the First Meeting of South American Presidents (Brasília,
Brazil) in 2000, and the twelve countries of South America (Argentina, Bolivia, Brazil,
Chile, Colombia, Ecuador, Guyana, Paraguay, Peru, Suriname, Uruguay and Venezuela)
take part of it. It has three main areas of activity, that is, energy, transport and
communications. Among the guiding principles of IIRSA, we can highlight: (i) open
regionalism: in line with the Economic Commission for Latin America and the Caribbean
(ECLAC) concept of guaranteeing liberalization policies in relation to third parties, while
favoring the accession of new members to the agreements; (ii) Integration and
Development Hubs (EIDs); (iii) economic, social, environmental and political-
institutional sustainability; (iv) increase in the production value added; (v) information
205 It is worth noting that in the new strategic framework of the CIER, approved in the Central Committee
of Lima (April 2015), the following new concepts are defined. It defends that in 2020 CIER will be a global
reference organization recognized for its contribution to the integration and development of the Latin
American energy sector. The mission seeks to promote the integration of the regional energy sector with
emphasis on the interconnection of systems, the integration of markets, mutual cooperation between its
members, knowledge management and the promotion of sustainable businesses (CIER, 2016b). 206 IIRSA represents a multinational, multisectoral and multidisciplinary initiative that includes
coordination mechanisms between governments, multilateral financial institutions and the private sector
(BIATO, 2016). It is financed by Brazilian Development Bank (BNDES), Inter-American Development
Bank (IDB), Andean Development Corporation (CAF), and Financial Fund for the Development of the
Plata Basin (FONPLATA).

152
technology; (vi) normative convergence; and (vii) public-private coordination. By the
way, there is a strong relationship between these principles and the main criticisms of
IIRSA itself.
It is worth highlighting the relevance of the Sectoral Integration Processes (PSIs), which
aim to identify regulatory and institutional obstacles that prevent the development of basic
infrastructure in the region and propose actions to overcome them. Typically, these PSIs
seek to harmonize regulatory frameworks. Through the analysis of Table 18, we will see
the nonexistent weight of the projects associated specifically with harmonization of
regulatory frameworks within the IIRSA-COSIPLAN project portfolio 2016.
Since 2011, IIRSA was incorporated into the South American Council of Infrastructure
and Planning (COSIPLAN), which is a forum for political and strategic discussion
through consultation, evaluation, cooperation, planning and coordination of efforts and
articulation of programs and projects in order to foster regional infrastructure integration
among UNASUR207 member countries. In the same year, IIRSA creates two instruments
to guide its work for the next ten years: (i) the Strategic Action Plan 2012-2022 (PAE);
and (ii) the Integration Priority Project Agenda (APIs).
In turn, UNASUR was created on May 23 2008, when the Constitutive Treaty of the
Union of South American Nations was approved208, in which Quito (Ecuador) was the
permanent city designated to General Secretariat and Cochabamba (Bolivia) was the
permanent city designated to the Parliament. However, it is important to stress that
UNASUR is the result of a series of discussions and meetings.
In 2004, at the Meeting of Presidents of South America, held in Cuzco (Peru), the South
American Community of Nations (CSN)209 was created. The CSN was born to integrate
regional processes developed by Mercosur and the Andean Community (to avoid the
aforementioned reproduction of overlaps in regional initiatives). In 2005, in Brasília
(Brazil), and 2006, in Cochabamba (Bolivia), the heads of state of member countries
established a strategic plan to consolidate a common agenda in the region. However, it is
only in 2007, during the South American Energy Summit, on Isla Margarita (Venezuela),
207 One of the reasons why it will be necessary to evaluate UNASUR in this section. 208 See:
https://www.unasursg.org/images/descargas/DOCUMENTOS%20CONSTITUTIVOS%20DE%20UNAS
UR/Tratado-UNASUR-solo.pdf. 209 The role of regional energy integration is already highlighted in this Meeting.

153
that the heads of states changed the name of the South American Community of Nations
(CSN) to the Union of South American Nations (UNASUR).
It is noteworthy that from the very beginning energy was a priority in the UNASUR
agenda. Among the general documents, declarations, agreements, communiqués and
protocols, UNASUR signed 46 documents related to energy. The following important
energy integration frameworks will be analyzed: (i) Declaration of Caracas (2005); (ii)
Declaration of Cochabamba (2006); (iii) Declaration of Margarita (2007); (iv)
Alignments of the South American Energy Strategy (2008); and (v) structure of the South
American Energy Treaty (approved in 2010).
The Declaration of Caracas (2005), signed in Venezuela, is the first meeting of energy
ministers of the South American Community of Nations (CASA). The priority of energy
integration was defended, referring to the Consensus of Guayaquil210 (2002), in Ecuador,
when integration in the energy sector was considered essencial to success of regional
integration as a whole. Therefore, the importance of regional infrastructure for energy
transport is emphasized, as is the strategic role that energy has in the economic and social
development of South America.
The Declaration of Cochabamba211 (2006), signed in Bolivia, is often remembered as
the ‘cornerstone of the South American integration process’. The main objective was to
stimulate energy integration in order to reduce the region’s socio-economic asymmetries.
Since then, there has been concern about sustainable development. The ‘Presidential
Declaration on South American Energy Integration’ is accomplished, which is the first of
its kind, at the South American level, within the framework of developing the
institutionalization of this sector. It also represents a more far-reaching view, identifying
the principles that will guide the process of political and normative convergence in terms
of regional energy integration, as well as the dimensions that it should take into account
(CAF, 2013e).
The eight principles are the following: (i) cooperation and complementation; (ii)
sovereign right to the use of natural resources and to manage exploitation rates; (iii)
respect for the regulation of each country and the modes of ownership used by each State
for the development of its energy resources; (iv) solidarity and reciprocity; (v) purpose of
210 See: http://www20.iadb.org/intal/catalogo/PE/2010/05282.pdf. 211 See: http://www.isags-unasur.org/uploads/biblioteca/1/bb[611]ling[1]anx[1825].pdf.

154
eliminating the asymmetries between the States; (vi) respect for the sovereignty and self-
determination of peoples; (vii) territorial integrity; and (viii) common legal framework
for energy integration.
The Declaration of Margarita212 (2007) was signed at the II Meeting of Energy
Ministers of the South American Community of Nations (CSN), in Isla Margarita, and it
created UNASUR, as well as the South American Energy Council (CES)213. In addition,
based on the principles outlined in this declaration, it is suggested to prepare a proposal
for alignments of the South American Energy Strategy, the Action Plan and the Energy
Treaty of South America, documents that originally should have been discussed during
the course of the III South American Summit of Nations. As mentioned, the relationship
between UNASUR and energy is very close, even because the organization was born
during the First South American Energy Summit.
The Alignments of the South American Energy Strategy214 (2008) focus on the five
South American energy integration advices (i) emphasizing the need to increase national
and regional coordination; (ii) to extend and deepen the processes of sector integration;
(iii) to boost the search for new energy sources; (iv) to establish regional mechanisms that
help countries of the region in crisis; and (v) to establish legal and technical frameworks
to support such exchanges.
These meetings resulted in the creation of twelve guiding principles of the energy
integration strategy of UNASUR, which model the activities of the Energy Council,
namely: (i) cooperation and complementation; (ii) solidarity among peoples; (iii) respect
for the sovereignty and self-determination of peoples; (iv) sovereign right to establish
criteria for sustainable development and the use of renewable and non-renewable natural
resources, as well as to manage the rate of exploitation of these resources; (v) regional
integration in search of the complementarity of countries in the balanced use of resources
for the development of their peoples; (vi) respect for the modes of ownership that each
State uses for the development of its energy resources; (vii) energy integration as an
212 See: http://www.isags-unasur.org/uploads/biblioteca/1/bb[613]ling[2]anx[1830].pdf. 213 CES is born and it creates guidelines for the energy integration of the region. It is also worth noting that
CES is one of the oldest and most active councils of UNASUR, demonstrating again that energy integration
has been central to the project developed by the organization since verey the creation of UNASUR. 214 See:
https://www.unasursg.org/images/descargas/ESTATUTOS%20CONSEJOS%20MINISTERIALES%20S
ECTORIALES/LINEAMIENTOS%20DE%20ESTRATEGIA%20ENERGETICA%20SURAMERICAN
A.pdf.

155
important tool to promote social, economic and poverty eradication; (viii) universal
access to energy as a citizen’s right (as stressed in subsection 2.1.1); (ix) sustainable and
efficient use of the region’s resources and energy potential; (x) articulation of energy
complementarities to reduce existing asymmetries in the region; and (xii) recognition of
States, society and industry as key players in the integration process. It is then clear that
some of them are based on the eight principles of ‘Presidential Declaration on South
American Energy Integration’, created by the Declaration of Cochabamba (2006).
Based on these principles, during the same meeting that created the alignments of
UNASUR’s energy strategy, an Action Plan based on fifteen strategic action points were
proposed to be developed with the goal of expanding integration: (i) to promote security
in the energy supply of the region; (ii) to promote regional energy exchange; (iii) to
strengthen regional energy infrastructure; (iv) to implement complementation
mechanisms between national state hydrocarbon companies and other types of energy;
(v) to provide the exchange and transfer of technology, as well as the training of human
resources; (vi) to encourage regional energy development in order to provide a rational
consumption model capable of preserving the environment; (vii) to promote
industrialization and energy development and its regional complementation; (viii) to
promote harmonization of regulatory and trade processes associated with energy
integration; (ix) to incorporate the regional energy integration component into national
energy planning; (x) to promote the efficient use of energy and the exchange of
experience in this field; (xi) to boost the development of renewable and alternative
energies, such as biofuels, wind, solar, nuclear, tidal, geothermal, hydro, hydrogen,
among others; (xii) to stimulate the association between the public and private sectors;
(xiii) to support the maintenance of existing bilateral, regional and subregional
agreements, as well as to facilitate the negotiation of future agreements; (xiv) to promote
a balanced relationship between producing and consuming countries; and (xv) to advance
proposals for the convergence of national energy policies considering the legal
framework in force in each country. Noteworthy is the amount of action verbs in the
Action Plan.
Finally, the approval of the structure of the South American Energy Treaty (2010),
signed at the Declaration of Los Cardales (Argentina), should be mentioned. In fact, there

156
is an outline, not a full text on the Treaty. However, it is believed that it could represent
a milestone in South American energy integration.215 See Appendix F.
Recently, at the IV Meeting of the South American Energy Council of UNASUR (2015)
a 2015-2016 working plan was established, whose focus is to promote regional energy
and gas interconnection networks and reach regional agreements that benefit the region
in terms of energy.216 The V Meeting of the South America Energy Council of
UNASUR217 was held in (Quito) Ecuador, July 2016. In 2017, there was no CES meeting.
Although the UNASUR Energy Council is responsible for formulating general policies
that should lead to energy integration of South America, the South American Council of
Infrastructure and Planning (COSIPLAN) has been directly playing a crutial role. As
already presented, COSIPLAN belonged to the South American Regional Infrastructure
Integration Initiative (IIRSA), and it is currently part of UNASUR. It is important to
mention that the COSIPLAN Project Portfolio is a set of works with a strong impact for
regional integration and socio-economic development.
Based on official data from UNASUR-COSIPLAN (2016), the investment portfolio
estimated in 2016 is of US$ 191,420.10 million and has 581 projects. Considering this
amount, 5 (0.9%) are multinational, 94 (16.1%) are binational and 482 (83%) are
nationals. Analyzing the projects by type of financing, we note that 475 (US$ 117,691
million) are financed with pure public funding, 71 (US$ 35,926 million) with pure private
funding and 35 (US$ 37,803.1 million) with public-private or shared funding. Table 17
presents the asymmetry that exists in terms of project numbers and estimated investment
value (US$ million) in the different EIDs.
215 The only similar experience in the world is the Energy Charter of the European Union, whose elaboration
took more than ten years (SIMÕES, 2011). 216 See: http://www.iri.edu.ar/wp-content/uploads/2016/10/bo-alatina57-unasur-consejoenergetico.pdf. 217 See: http://www.iri.edu.ar/wp-content/uploads/2016/10/bo-alatina57-unasur-consejoenergetico.pdf.
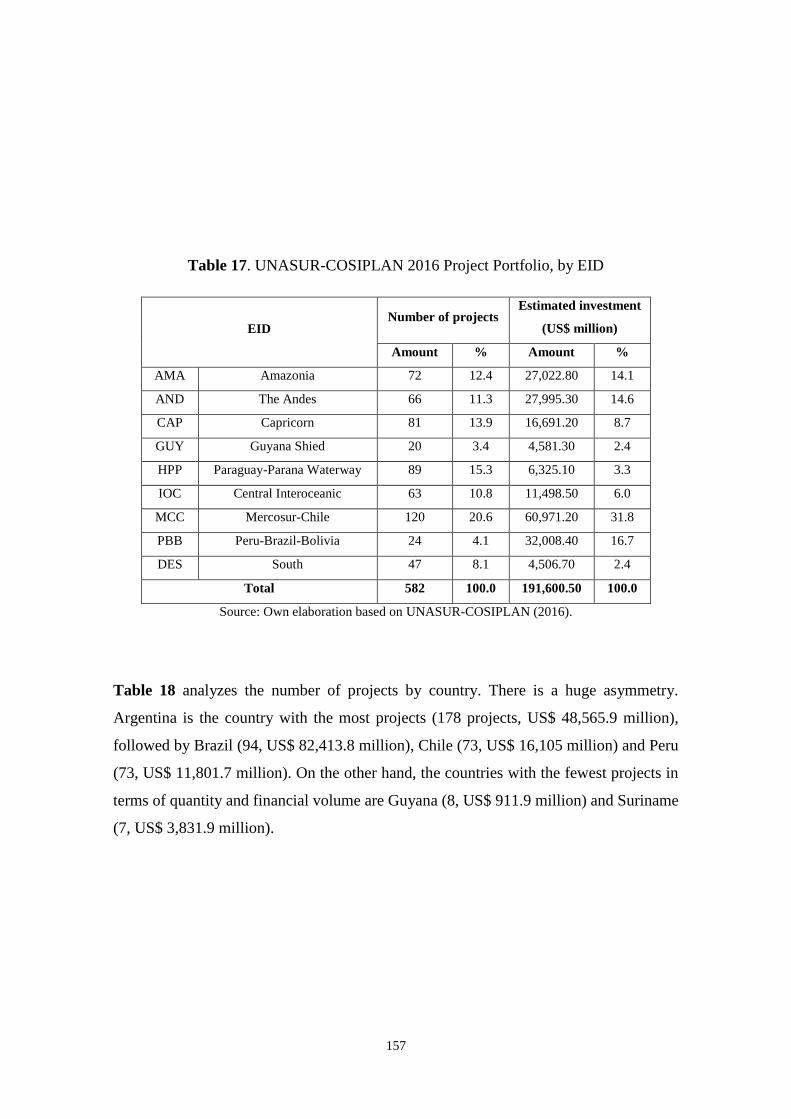
157
Table 17. UNASUR-COSIPLAN 2016 Project Portfolio, by EID
EID Number of projects
Estimated investment
(US$ million)
Amount % Amount %
AMA Amazonia 72 12.4 27,022.80 14.1
AND The Andes 66 11.3 27,995.30 14.6
CAP Capricorn 81 13.9 16,691.20 8.7
GUY Guyana Shied 20 3.4 4,581.30 2.4
HPP Paraguay-Parana Waterway 89 15.3 6,325.10 3.3
IOC Central Interoceanic 63 10.8 11,498.50 6.0
MCC Mercosur-Chile 120 20.6 60,971.20 31.8
PBB Peru-Brazil-Bolivia 24 4.1 32,008.40 16.7
DES South 47 8.1 4,506.70 2.4
Total 582 100.0 191,600.50 100.0
Source: Own elaboration based on UNASUR-COSIPLAN (2016).
Table 18 analyzes the number of projects by country. There is a huge asymmetry.
Argentina is the country with the most projects (178 projects, US$ 48,565.9 million),
followed by Brazil (94, US$ 82,413.8 million), Chile (73, US$ 16,105 million) and Peru
(73, US$ 11,801.7 million). On the other hand, the countries with the fewest projects in
terms of quantity and financial volume are Guyana (8, US$ 911.9 million) and Suriname
(7, US$ 3,831.9 million).

158
Table 18. UNASUR-COSIPLAN 2016 Project Portfolio, by country and type of project
Country Number of projects Estimated investment
(US$ million) National Binational Multinational
Ar 144 34 - 48,565.9
Bo 32 19 1 10,578.7
Br 67 24 3 82,413.8
Cl 57 17 - 16,105.0
Co 19 13 1 4,743.6
Ec 20 19 1 19,609.1
Gu 3 2 3 911.9
Py 43 22 1 18,002.6
Pe 50 21 1 11,801.7
Su 3 1 3 3,831.9
Uy 33 9 - 5,445.2
Ve 11 7 2 2,109.5
Source: Own elaboration based on UNASUR-COSIPLAN (2016).
Table 19 shows that 518 projects (89.2%) come from the transport sector (US$
133,958.90 billion), 56 projects (9.6%) energy sector (US$ 57,419.70 billion), and 7
projects (1.2%) communication sector (US$ 41.50 million). Howsoever, it is worth
mentioning that the total amount of projects in the portfolio has evolved considerably
over time. In 2003-04, for example, they were 335 projects (US$ 37,425.0 million), while
in 2010 there were 524 (US$ 96,119.2 million). As already presented, in 2016 they were
581 projects (US$ 191,420.1 million). During the whole period, projects totaled up US$
1,255.41 billion.

159
Table 19. UNASUR-COSIPLAN 2016 Project Portfolio, by sector and type of project
Sector and Subsector
Transport Energy Communications
Number
of
projects
Investment Number
of
projects
Investment Number
of
projects
Investment
Amount
(US$
million)
%
sector
%
total
Amount
(US$
million)
%
sector
%
total
Amount
(US$
million)
%
sector
%
total
Air 24 7,530.40 5.6 3.9
Road 258 63,476.50 47.4 33.2
Railway 61 47,921.40 35.8 25.0
River 76 2,892.90 2.2 1.5
Maritime 38 10,493.70 7.8 5.5
Multimodal 14 679.30 0.5 0.4
Border crossings 47 964.70 0.7 0.5
Energy generation 25 46,859.50 81.6 24.5
Interconnection of energy 31 10,560.20 18.4 5.5
Interconnection of
communications 7 41.5 100.0 0.02
Total 518 133,958.9 100.0 56 57,419.7 100.0 7 41.5 100.0
Source: Own elaboration based on UNASUR-COSIPLAN (2016).

160
In terms of funding sources, there are pure public, pure private and public/private
investment. For the transportation sector, 65% of the investments are public, 26% are
private and 9% are public/private. In the energy sector, 53% of investments are public,
3% are private and 44% are public/private, while in the transportation sector, 100% of
investments are public (UNASUR-COSIPLAN, 2016). We noticed again that in terms of
investments the profile changes a lot for each sector, highlighting the share of public
investments in the guarantee of investments in physical infrastructure in South America.
If we specifically analyze the API 2016 agenda, 89.2% of the individual API projects
correspond to the transport sector and represent 70% of the total estimated investment.
The remaining 9.6% belongs to the energy sector, with an estimated investment of 30%.
Regarding the sub-sectoral composition of the individual projects, it is observed that road
projects account for 44.4% of the API and demand about 33.2% of the total investment
(UNASUR-COSIPLAN, 2016).
Table 20 and Figure 20 show the evolution of the UNASUR-COSIPLAN total and
energy projects, in number, in value (millions US$) and share (%) during 2003-2017.
Although the total investment increased 71.3% in the period 2011 to 2017, the share of
energy projects fell 37.0% in the same period (16.2 percentage points drop).

161
Table 20. Evolution of the UNASUR-COSIPLAN total and energy projects (2003-2017)
Projects and
Investment 2003-04 2005-06 2007 2008-09 2010 2011 2012 2013 2014 2015 2016 2017
Number of projects 335 349 504 510 524 531 544 583 579 593 581 562
Energy projects 61 60 59 54 56 56 54
% energy projects 11.5 11.0 10.1 9.3 9.4 9.6 9.6
Investment (Millions
US$) 37,425.0 37,880.0 68,271.4 74,542.0 96,119.2 116,120.6 130,139.1 157,730.5 163,324.5 182,435.7 191,420.1 198,901.4
Energy investments 50,931.3 49,482.2 50,830.2 54,670.1 52,715.7 57,419.7 54,926.7
% energy
investments 43.9 38.0 32.2 33.5 28.9 30.0 27.6
Source: Own elaboration based on UNASUR-COSIPLAN (2011, 2012, 2013, 2014, 2015, 2016, 2017).

162
Figure 20. Evolution of the UNASUR-COSIPLAN total projects (2003-2017)
Source: Own elaboration based on UNASUR-COSIPLAN (2011, 2012, 2013, 2014, 2015, 2016, 2017).
Due to the intergovernmental nature of both Mercosur and UNASUR218, both institutions,
although dealing with energy issues in the regional level, end up presenting limitations to
their performance. Consequently, the main institutions that should promote regional
energy integration actually play a secondary role in proposing regional policies without
any binding enforcement mechanisms. Mercosur, through FOCEM, and UNASUR,
through UNASUR-COSIPLAN projects, provide funds for projects in infrastructure to
promote the structural convergence of the countries of the region, reducing the asymmetry
between them. Nevertheless, in spite of the number of regulations, plans, principles and
strategic alignments, the data presented in sections 3.7 and 3.8 show that energy projects
carried out by both institutions (i) are spatially concentrated in certain regions; (ii) are
few (if compared to the total available value); and (iii) have been falling over time.
218 In the intergovernmental model of Mercosur and UNASUR, National States through their respective
Ministers of Energy have been the protagonists.

163
Moreover, there are recent challenges for UNASUR. The first one is that some countries
in South America, such as Peru, Mexico and Colombia, are focused on the Pacific
Alliance. Another challenge arises from the political-economic conjuncture of certain
countries of the region, with particular emphasis on Brazil and especially on Venezuela.
Both countries play a key role in regional energy supply and demand, the first in terms of
regional imports of electricity and natural gas (from South America), and the second as
an exporter of oil and gas (for Latin America and Caribbean).
Concerning the South American Energy Treaty, it seems very ambitious and therefore
hard to move forward. So far, there is only the index. Albeit being an intergovernmental
institution, decisions in UNASUR have to be by consensus, which makes the approval of
new agendas and projects still more difficult.
Regionally, one cannot ignore the region of the Andes Mountains Range219, the Amazon
Forest, the Atacama Desert and Patagonia Glaciers since all of them represent
geographical barriers to the effective regional energy integration. Indeed, they impose
technical difficulties incurring higher costs. In addition, overlapping regional integration
initiatives make the energy integration process even more difficult, since there is no
alignment between the different institutions. These institutions sometimes have different
positions on the same issue, as occurred with regard to the existence or not of coup d’état
in Brazil between Mercosur and UNASUR.
219 Colombia seems to be the case where the Andes Mountains was overcome by interconnected electrical
systems. Albeit in a national context (rather than regional one), this experience may serve as an example
for future integration projects in Andean regions.

164
5. Energy index and modeling
This chapter, as well as the previous two, is also divided into two main sections: SEES
index (section 5.1) and OSeMOSYS-SAMBA modeling (section 5.2). In the first section,
a new hybrid index called socio-environmental-energy security (SEES) is created, whose
main objective is to analyze the evolution of the energy policies of Mercosur (countries)
in the past (1990-2010). Then, the second section proposes energy scenarios using the
Open Source Energy Modelling System - South America Model Base (OSeMOSYS
SAMBA), a model for planning for the expansion of long-term energy systems, whose
objective is to analyze present and possible integration scenarios in the future (2013-
2050). Four scenarios are modeled: reference integration scenario (RIS), weak integration
scenario (WIS), moderate integration scenario (MIS) and otimistic integration scenario
(OIS), considering expansion and new international interconnection lines, new binational
hydroelectric plants as well as new contractual arrangements (swaps).
Undoubtedly, we consider here the possible (inherent) limitations of quantitative
analytical tools. Because they assume a diversity of parameters, axioms and assumptions,
they aim to simulate and predict future scenarios and possibilities that, once the inputs of
the model are true or reasonable, are particularly useful in developing policies and
strategies that contribute to the anticipation and planning of decision makers, whether
public or private.
Scenarios methodology (i) can expand the way reseachers and policy-marks think, once
it provides a range of possible outcomes; (ii) uncover inevitable or near-inevitable futures,
considering social, political and economic trends, as well as scheduled events; and (iii)
allow people to challenge conventional wisdom thinking outside the box, mainly because
sometimes there is a very strong status quo bias (ROXBURGH, 2009). When it comes
specifically to energy scenarios, it is necessary to consider some recent challenges that
need to be added to the analysis, incorporating for example new low-carbon goals (in line
with section 2.1.2 and SEES index). This relatively new dimension of the scenarios means
that in addition to the traditional factors like technology development, demographic,
economic, political and institutional considerations, there is another aspect of the modern
energy projections related to the coverage, timing, and stringency of policies to mitigate
greenhouse gas emissions and air pollutants (PALTSEV, 2016).

165
In order to avoid incurring these potential errors and traps inherent to this methodology,
the two sections are based on a large literature review. The first one deals with existing
and published data, so its risk is reduced. The second section, in addition to literature data,
incorporates information from the expansion plans of the countries considered.
5.1 SEES Index220
As shown in section 2.1, the concept of energy security has raised controversies over its
definition, scope and approaches for decades. Studies on energy security have been
criticized for a number of reasons, including that they employ a narrow interpretation of
this concept and rarely use a systematic approach. Significant differences between studies
are observed in how energy security is evaluated qualitatively and/or quantitatively. The
latter usually considers the assembly and use of indicators, like in KANCHANA and
UNESAKI (2014), IEA (2013), MARTCHAMADOL and KUMAR (2013),
SOVACOOL et al. (2011), LÖSCHEL et al. (2010), KEMMLER et al. (2009), VERA
and LANGLOIS (2007), Department of Energy and Climate Change (2006) and IAEA
(2005). Indicators may facilitate orientation in a complex world, condensing large
amounts of information into a recognizable pattern.
As ANG et al. (2015) highlight, the weight of social and environmental effects on energy
security definitions has grown significantly, particularly post 2010 – even though they
are only about 40% of the cases analyzed. They evaluate that in recent studies the
environmental dimension occupies the second area most addressed, only behind the
economic one; in turn, the social aspects occupy only the fifth position, behind 4As and
energy supply.
Moreover, the authors perceive that the weight of both themes varies greatly between
official reports, journals and other publications; the environmental theme is cited in about
40% of journals and only about 15% of official reports; in turn, the percentage of social
agenda is 30% and 40%, respectively. Ergo, it is noteworthy to reinforce how the different
sources attribute different weights to the same variables, which once again ratifies the
lack of consensus on the concept of energy security.
220 Energies published the index in December 2017. See: SANTOS et al. (2017b).
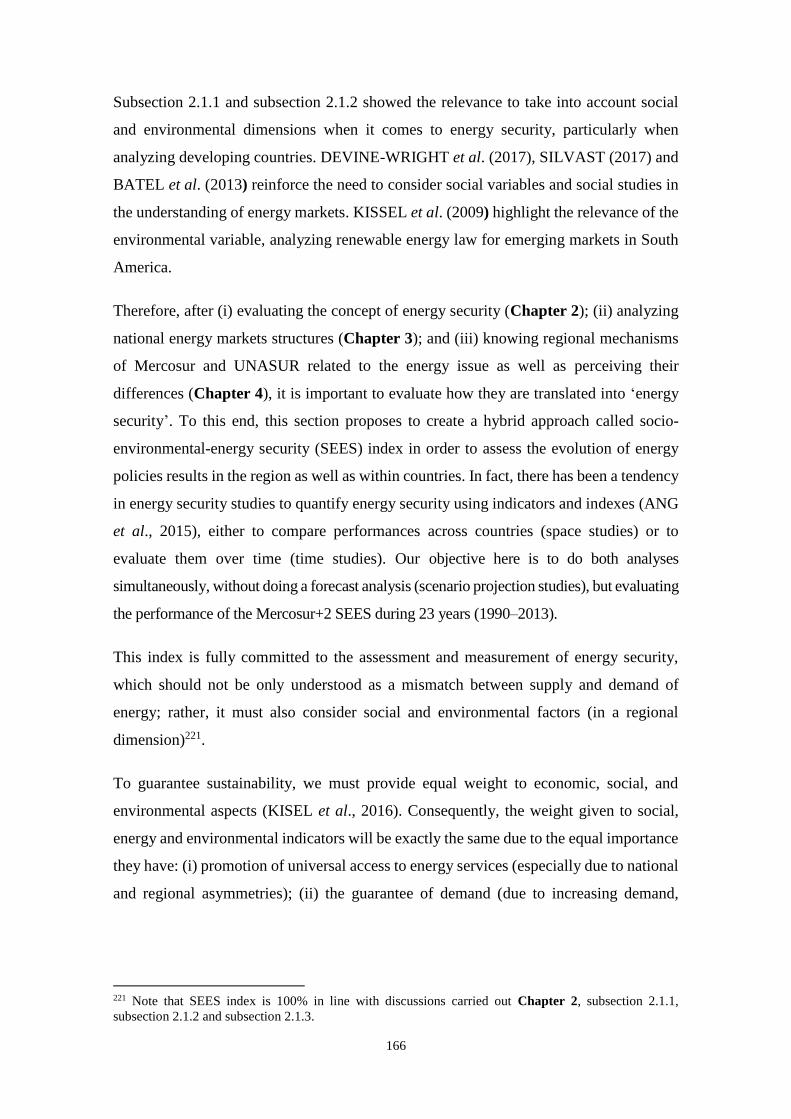
166
Subsection 2.1.1 and subsection 2.1.2 showed the relevance to take into account social
and environmental dimensions when it comes to energy security, particularly when
analyzing developing countries. DEVINE-WRIGHT et al. (2017), SILVAST (2017) and
BATEL et al. (2013) reinforce the need to consider social variables and social studies in
the understanding of energy markets. KISSEL et al. (2009) highlight the relevance of the
environmental variable, analyzing renewable energy law for emerging markets in South
America.
Therefore, after (i) evaluating the concept of energy security (Chapter 2); (ii) analyzing
national energy markets structures (Chapter 3); and (iii) knowing regional mechanisms
of Mercosur and UNASUR related to the energy issue as well as perceiving their
differences (Chapter 4), it is important to evaluate how they are translated into ‘energy
security’. To this end, this section proposes to create a hybrid approach called socio-
environmental-energy security (SEES) index in order to assess the evolution of energy
policies results in the region as well as within countries. In fact, there has been a tendency
in energy security studies to quantify energy security using indicators and indexes (ANG
et al., 2015), either to compare performances across countries (space studies) or to
evaluate them over time (time studies). Our objective here is to do both analyses
simultaneously, without doing a forecast analysis (scenario projection studies), but evaluating
the performance of the Mercosur+2 SEES during 23 years (1990–2013).
This index is fully committed to the assessment and measurement of energy security,
which should not be only understood as a mismatch between supply and demand of
energy; rather, it must also consider social and environmental factors (in a regional
dimension)221.
To guarantee sustainability, we must provide equal weight to economic, social, and
environmental aspects (KISEL et al., 2016). Consequently, the weight given to social,
energy and environmental indicators will be exactly the same due to the equal importance
they have: (i) promotion of universal access to energy services (especially due to national
and regional asymmetries); (ii) the guarantee of demand (due to increasing demand,
221 Note that SEES index is 100% in line with discussions carried out Chapter 2, subsection 2.1.1,
subsection 2.1.2 and subsection 2.1.3.

167
particularly as they are developing countries); and (iii) the environmentally sustainable
management of natural resources (renewable and non-renewable).
The data used are publicly accessible from international databases, such as World
DataBank, OECD Statistics, ECLAC Data and IEA Statistics. After defining the
indicators, data selection, normalization, weight assignment and aggregation, the SEES
composite index is generated.
The evaluation was conducted based on 15 indicators gathered from the review of
previous studies. The total of indicators is in line with the methodology performed in most
studies, since about 75% of them employ less than 20 indicators in the analysis (ANG,
CHOONG and NG, 2015). These indicators, as anticipated, were divided into three
dimensions222: social (S), energy (E) and environmental (A). Each one of them is based on
the literature on energy security, energy policy, environmental studies and international
relations. For each indicator, data ranging from 1990 to 2013 was collected for each of the
6 Mercosur+2 countries.
Due to the recent enlargements of the bloc, with the effective accession of Venezuela in
mid-2012 and Bolivia, whose ratification process has been taking place since 2015, the
former was considered in the analysis only in 2013; because of the lack of public data
from 2015, Bolivia was not considered in the SEES data analysis. In addition, although
Mercosur was formed in 1991, we use data from 1990, since some indicators were only
available for decades.
As is clear from Table 21, the energy dimension incorporates indicators relating to
(geo)political (E1 and E2) and technological (E4) matters. It is completely in line with
regional integration needs, once must take into account technical, regulatory and
commercial issues, without ignoring the relevance of the political factors that guide these
processes.
222 SEES index is related to the famous pillars of sustainability (social, economic, and environmental), as
well as energy trilemma (energy equity, energy security, and environmental sustainability).
168
Table 21. Socio-environmental-energy security (SEES) index.
Dimension Code Indicator Unit
So
cial
(S
) S1 Access to electricity, rural % of rural population
S2 Access to electricity, urban % of urban population
S3 Electricity consumption per capita kWh per capita
S4 Total final consumption (TFC) per capita toe per capita
S5 Total primary energy supply intensity toe per thousand 2005 US$
En
erg
y (
E)
E1 Fuel exports % of merchandise exports
E2 Net oil imports/GDP toe per thousand 2005 US$
E3 Total natural resources rents % of GDP
E4 Electric power transmission and
distribution losses % of output
E5 Investment in energy with private
participation current US$
En
vir
on
men
tal
(A)
A1 CO2 emission per capita tCO2/capita
A2 CO2 intensity kgCO2/2005 US$
A3 Energy related methane emissions % of total
A4 Nitrous oxide emissions in energy sector thousand metric tons of CO2
equivalent
A5 Renewable energy consumption % of total final energy
consumption
Source: SANTOS et al. (2017a, 2017b) based on data from ECLAC Statistics, IEA Statistics and
World DataBank. It should be noted that selected indicators did not show available data for 2013
(S1, S2, E3, E5, A3, A4 and A5).
Since the indicators usually have different units and scales, it is necessary to make a
transformation before aggregating them in order to generate the composite index (ANG
et al., 2015). The min-max normalization, the most popular method used in different
relevant and famous studies (TONGSOPIT et al., 2016, KHATIB, 2016,
KAMSAMRONG and SORAPIPATANA, 2014, ZHANG et al., 2013, ANGELIS-
DIMAKIS et al., 2012, EDIGER and BERK, 2011, SOVACOOL et al., 2011, CABALU,
2010, LEFÈVRE, 2010, GNANSOUNOU, 2008, GUPTA, 2008), was performed to
allow a linear transformation of the original data. Thus, a new scale, ranging from 1 to
10, is guaranteed by the process described below:

169
𝑋′ = 1 + (𝑋 − 𝑀𝑖𝑛𝐴
𝑀𝑎𝑥𝐴 − 𝑀𝑖𝑛𝐴) 𝑥 (10 − 1) (1)
where: X’ = normalized value based on 1–10 scale; X = value map; MinA = minimum
value of the data range A (1); MaxA = maximum value of the data range A (10).
It is worth mentioning that there are indicators that are inversely proportional to the scale,
that is, larger values correspond to a lower value for the socio-environmental-energy
security, therefore the maximum value has to be considered as minimum, reversing
function 1 (it is the case of S4, S5, E2, E3, E4, A1, A2, A3 e A4). Regardless of the case,
the SEES should not be understood based on the value per se, but on the relative change
of ordinal values over time.
From now on, we will briefly analyze and discuss the results of the SEES analysis in
Mercosur. Note that, unlike previous analysis considering Bolivia and Venezuela, the
previous data analysis does not include them because data and indicators for both
countries were not available from 2010 on. In addition, as already reported for 1990,
certain data are not available. Ergo, to avoid analytical bias after standardization, we
present a graphical analysis only for the period from 1990 to 2010, at five-year intervals.
Figure 21 highlights the evolution of SEES in Mercosur for the entire period under
analysis. The aggregate index varied little for the years presented, indicating a slight
downward trend. The understanding of this phenomenon comes from the detailed and
disaggregated analysis of the dimensions, since, particularly from 2005 to 2010, the
environmental dimension fell from 6.5 to 4.2, respectively. This was particularly affected
by the lack of data for indicators A3 and A4 for the year 2010223.
223 Indeed, the lack of data influences the results, affecting the graphical analysis of the SEES index.
However, the graphical presentation is maintained every five years, since the same pattern will occur in
section 5.2.

170
Figure 21. Evolution of SEES in Mercosur (1990–2010)
Source: SANTOS et al. (2017b).
The social dimension fluctuated significantly in the period, with significant declines in
1995 and 2005. This, again, was due to the lack of data in those years for indicators S1
and S2. However, it is worth noting that the trend for the social dimension is falling from
1990 to 2010, from 6.4 to 6.2 – although it grows from 1990 to 2000. Even though the
decrease is small, it is due to the reduction of S2 in Brazil (data from 2000 seem
overestimated, as in the case of Paraguay), S4 in Paraguay (which may not necessarily be
bad), and S5 in Argentina, Paraguay and Uruguay (increase the intensity of the primary
energy supply per unit of GDP).
It is important to stress that the decrease of total final consumption per capita (S4) is not
a problem itself for these countries. In fact, S4 is not included in the selection of indicators
that count negatively for SEES, since, because they are developing countries, the increase
in per capita consumption seems to be positive for this country profile. However, there
may have been a change in the final aggregate consumption pattern (more rational and/or
efficient) leading to these results.
The energy dimension, in turn, sustains a growth trend throughout the period analyzed.
Indicators E2 and E3 are mainly inverse dynamics, since if net oil exports (E2) are
positive, it means that countries are exporting more and it reflects in the income associated

171
with the exploitation of resources (E3), or that countries are importing less. In addition,
E4 falls for Brazil and Paraguay in the period analyzed due to transmission losses and
losses in distribution, whether they are technical losses (inherent to the transmission of
electricity in the network) or non-technical (energy theft, measurement errors, etc). In
both countries, there have been a number of policies aimed at reducing transmission and
distribution losses, regardless of the reasons. It should also be noted that there is no data
for E5 in the case of Paraguay (1990-2010) and Uruguay (2005 and 2010).
Considering the SEES index for the period from 1990 to 2010, it is perceived that it falls
0.5pp or 8.9%. This suggests that the absence of joint planning and policies among
Mercosur countries in the period under analysis did not contribute to the improvement of
the index, given the selected indicators.
Moreover, we must address some limitations associated with the quantitative analysis of
the data that need to be taken into account. The first one is the sensitivity of the index to
the lack of indicator data, what is actually expected from a normalization method. Second,
the selection of indicators does not take into account electricity tariffs (US$/kWh), which
could be considered in the social dimension, basically because there was no available data
to allow comparison during the whole time series. Thirdly, it should be noted that
weighing countries and indicators in the SEES index may also have an implicit bias, but
in order to avoid overestimating or underestimating certain countries’ results, we
maintained the same relative weight of each of them in the index calculation. Fourth, it
should be noted that considering private participation in investment (current dollars) may
not adequately reproduce the amount invested in the sector, especially in countries where
public participation is considerable. Fifth, the environmental dimension heavily focuses
on indicators that measures the impacts on climate change. In addition, a more detailed
analysis of the transformation of the energy matrices for this period would allow a better
understanding of the results presented by each one of the 15 indicators. Besides, the
choice of selected indicators affects the results.
Taking into account the social, environmental and regional dimensions in the formulation
of policies (link between subsection 2.1.1, subsection 2.1.2 and subsection 2.1.3 with
section 5.1), it is fundamental to evaluate the analytical trade-offs between these areas.

172
Regarding the social dimension, it is important to consider the trade-off between
access/use of energy and development of countries. At the same time that developing
countries still have regions without access to energy resources, as they develop tend to
mimic the patterns of production and consumption in developed countries (FURTADO,
1974), what greatly increases per capita energy consumption. According to IRENA
(2017b), a deep transformation of the way we produce and use energy is needed to achieve
alternative scenarios of low-carbon emissions.
Thus, it is necessary to promote a significant change in the development path of these
countries so that it becomes sustainable and responsible (ROMÁN et al., 2012). However,
it is known that many developing countries often resort to the ‘late development’
argument, giving developed countries the largest share of efforts to meet the challenges
they face – principle of common but differentiated responsibilities (CBDR).
It is worth mentioning that eradicating poverty has been a central agenda for the UN since
the Universal Declaration of Human Rights (1948). Access to energy is already assumed
as a basic right (UN, 2012, UEC, 2014) and a public good (KARLSSON-VINKHUYEN
et al., 2012) for many. In this context, and in referring specifically to the Millennium
Development Goals (MDGs), SANWAL (2014: 94) makes a critical analysis that ‘the
MDGs stressed meeting basic human needs, and ignored other preconditions for raising
living standards, for example, energy as a basic human need’. In addition, he argues that
the definition of development cooperation was narrowly defined as an aid-driven
relationship, disregarding other policies (trade, investment and technology transfer).
When updating the discussion of the MDGs for the Sustainable Development Goals
(SDGs) debate, it is known that energy gained relevance in the 2030 Agenda,
corresponding to SDG 7. Its goals include: (i) ensure universal access to affordable,
reliable and modern energy services; (ii) increase substantially the share of
renewable energy in the global energy mix; (iii) double the global rate of
improvement in energy efficiency; (iv) enhance international cooperation to
facilitate access to clean energy research and technology; and (v) expand
infrastructure and upgrade technology for supplying modern and sustainable
energy services for all in developing countries.
As is clear from the SDG 7 targets, there is a central concern about universal access to
modern energy services, the promotion of renewable energies and energy efficiency, as

173
well as increased international cooperation and infrastructure. Therefore, limiting the
global mean temperature rise to below 2°C would require an energy transition of
exceptional scope, depth and speed (IRENA, 2017b).
With regard to the environmental dimension, it is necessary to consider the trade-off
between developing countries’ economic growth and greenhouse gas (GHG) emissions.
ANG et al. (2015) argue that such a relationship will have distinct effects in the short-
term and in the long-term, so it is fundamental to take into account its irregular movement.
At times it is contrary to the trend of indicators such as energy intensity and total
emissions. Good proxies to evaluate this trend are efficiency and productivity in the
production of energy.
However, when considering environmental variables, it is necessary to take into account
another potential trade-off. By promoting the substitution of renewable alternatives to
conventional energy, it is possible to add risks and threats to the system, such as
intermittency and high operating costs. According to IRENA (2017a), amid this
accelerating transition, the variability of solar and wind energy – two key sources for
renewable power generation – presents new challenges.
When considering that these alternative energies still do not scale in certain markets, in
fact, costs remain high for many regional contexts. However, it is worth noting that
although renewables provided (only) 23% of power generation worldwide by 2014, this
share could reach 45% by 2030 with the rapid adoption of more ambitious plans and
policies (IRENA, 2016).
The regional approach perhaps presents the biggest trade-off for analysts, policy makers
and stakeholders in the world of energy. COETZEE and WINKLER (2014) and
GARIBALDI et al. (2014) show how climate policies are very strongly linked to the idea
of sovereign states (state-centered policies) in light of the concept of nationally
appropriate mitigation actions (NAMAs) that arose in the context of the United Nations
Framework Convention on Climate Change (UNFCCC) negotiations.
SANWAL (2010) and SCHÜLLER (2012) not only highlight the need to promote
international cooperation, but also advocate that it should be rethought and based on
institutions of supporting technology development and transfer. Thus, thinking about
energy and climate policy at the regional level poses a huge challenge to policy makers,

174
accustomed to doing so at the national level – although the gains associated with the
implementation of such policies at the regional level are well-known (SANTOS, 2014,
2015, 2016, 2017).
Nonetheless, as well as the trade-off of renewable energies, cross-border pipelines and
strategic transport channels, among other factors of increased complexity, can increase
the risks and uncertainties of supply disruption due to (geo)political issues, wars,
technical failures, accidents, geographic and geological catastrophes, extreme weather
events and turbulence in financial markets (BIROL, 2006, CHESTER, 2010;
KUCHARSKI and UNESAKI, 2015, UNDP, 2004, YERGIN, 2006). Precisely because
of this, energy integration should be more than a simple arrangement of integrated energy
markets and systems, but a political project with full participation of the involved parties
in order to mitigate such risks and threats.
5.2 OSeMOSYS-SAMBA model
After analyzing the results of Mercosur (countries)’s energy policies during the period
1990-2010, this section aims to model and analyze possible scenarios of energy
integration in the region, using the case of the power sector to illustrate its potential. The
power sector was considered as a case study of energy modeling, given the social
relevance of ensuring access to electricity at affordable prices, particularly when it comes
to developing countries224. In addition, as already highlighted, considering the regional
energy integration, the power sector stands out, either by the possibility of improving the
quality of life of the population, or by the previous expertise of most countries in the
region in the matter.
Unlike the previous section, Bolivia and Venezuela are considered here. Both countries
had to be removed from the previous section due to the absence of data for Venezuela
(2013 onwards) and Bolivia (which only took place in 2015, after the SEES index).
The scenarios were modeled in the Open Source energy Modelling System – OSeMOSYS
(2011) – using a new framework named South America Model Base – SAMBA (2015).
OSeMOSYS-SAMBA provides long-term cost-optimization of the power expansion
224 To access studies that consider other sectors, such as gas pipelines and oil, see CHÁVEZ-RODRÍGUEZ
(2016), GARAFFA (2016), SABBATELLA (2015), SENA (2013), RODRIGUES (2012b), CUNHA
(2010), LIZARAZU (2009) and KOZULJ (2006).

175
planning of South America countries. It is an open source, dynamic, bottom-up and multi-
year power sector framework that allows us to deal with large-scale linear programming
problems225. According to MOURA (2017), there was the following additions to
OSeMOSYS to create SAMBA: ‘(1) storage constraints (WELSCH et al., 2015); (2)
reserve margins for each country (CERVIGNI et al., 2015); and (3) annual constraints for
production inflexibility applied to generation technologies, which was developed
specifically for the implementation of SAMBA’.
As previously reported, data on existing regional infrastructure were used and the
expansion plans of the countries. The base-year is 2013226, with four scenarios built for
the period 2013–2058. Features related to population growth, electricity demand, costs,
hydro reservoirs, technological performance, reserve margin time zones and carbon
emissions were considered.
2013 is a strategic base-year for the model not only because of the relationship with SEES
index data, but because from that date we have to consider that the United Nations
General Assembly unanimously declared the decade 2014-2024227 as the Decade of
Sustainable Energy for All (SE4ALL). This stresses the relevance of energy issues for
sustainable development and for the elaboration of the post-2015 development agenda.
Figure 22 shows how the model is structured into separate functions (blocks).
225 The framework assumes an exogenously price-inelastic demand, perfect competition and perfect
foresight (MOURA, 2017, MOURA et al., 2015). 226It gives full continuity to the analysis of section 5.1, although due to the lack of data for Venezuela the
graphical analysis has only gone until 2010. 227 See: http://www.se4all.org/decade.

176
Figure 22. OSeMOSYS blocks structure
Source: HOWELLS et al. (2011).
The following features are key assumptions of the model: (i) technological changes are
provided by exogenous learning curves based on IEA ETP reports; (ii) time resolution is
12 months, divided into 4 intra-day periods and time horizon is 2013-2058, yearly steps;
(iii) reserve margin is 15% (only dispatchable technologies are able to meet it); (iv) real
discount rate is 8% and monetary values is 2013 US$; (v) there are also three time zones:
1st: Argentina, Brazil (NE, S and SE) and Uruguay; 2nd: Bolivia, Brazil (N), Chile,
Paraguay and Venezuela; and 3rd: Colombia, Ecuador and Peru; (vi) carbon electricity
intensity to be reduced in 34% by 2058 (IEA, 2014); (vii) subsidies in national fuel prices
are eliminated in the long-term, allowing convergence to international prices; (viii)
regarding losses in T&D systems, it is considered both reduction costs and increasing
efficiency of generating technologies228; and (ix) existing oil refining capacity and
international pipelines limit countries’ national supply.
Besides, and according to MOURA (2017: 22):
‘For all scenarios, the total electricity demand for each country is
assumed to increase at an annual rate compatible to reach a per capita
consumption of 5,500 kWh per year by 2058, which is comparable to
the 2012 consumption level of developed countries such as Spain (5,530
228 Losses in T&D reaches level of developed countries, between 6% and 8% in the long-term (IEA, 2012).

177
kWh), Italy (5,515 kWh) and Greece (5,380 kWh) (WORLD BANK,
2015). This assumption aims at considering the social welfare gain
arising from higher electricity consumption, given the disparities in
electricity consumption in the continent.’
The availability of natural gas for electricity generation was restricted for SAMBA
scenarios, then, producing and importing countries cannot use more than 50% of the
extracted/imported resource in the power sector. Besides, Argentina and Brazil are the
only countries expected to develop shale gas production (due to their large reserves and
land availability) and new nuclear plants.
A 34% reduction, by 2058, in the overall electricity’s carbon intensity was imposed when
structuring the SAMBA scenarios, following results achieved by IEA WEO (2014) for
non-developed countries. For Argentina, Bolivia, Brazil, Chile and Peru a maximum
installed capacity investment of large-scale electricity production using Concentrated
Solar Power (CSP) plants per year is up to 1 GW, while it is 100 MW for Colombia and
Venezuela. The same assumptions were applied to investments in large-scale solar
photovoltaic plants.
Appendix G shows national and international inputs for all 10 countries (Argentina,
Bolivia, Brazil, Chile, Colombia, Ecuador, Peru, Paraguay, Uruguay and Venezuela)229
considered in OSeMOSYS-SAMBA scenarios.
As indicated in section 2.3.2, the profile of Latin American energy integration can be
segmented into three blocks with particular characteristics. Generally, in the Central
American region, there is an integrated dispatch, integrating several countries with low
electric consumption in order to obtain an adequate scale, focusing basically on electrical
integration. In the Andean Community, there is an international electricity transaction
(EIT) dispatch, with countries having abundant energy resources. In the Southern Cone,
energy transactions are contract-based, countries have high electricity consumption and
229 Although the focus of the thesis and modeling are the Mercosur countries (Argentina, Bolivia, Brazil,
Paraguay, Uruguay and Venezuela), it is important to highlight that it was necessary to analyze South
America as a whole. This is because some Mercosur countries already have international interconnections
and transactions with extra-bloc countries, as well as the fact that in the strong integration scenario (SIS),
other extra-bloc countries will be taken into account.
178
there is abundance of energy resources (water and natural gas) and many international
interconnections.
Thus, the few studies that have quantitative modeling in the Latin/South America region
tend to focus on only one of these regional ‘blocks’230. An exponent in this theme is the
publishing of the CIER 15 Project (Study of Electricity Transactions between Andean,
Central American and Mercosur Markets: feasibility of their integration)231, which was
carried out in two parts. The participating countries were Argentina, Bolivia, Brazil,
Chile, Colombia, Costa Rica, Ecuador, El Salvador, Guatemala, Honduras, Nicaragua,
Panama, Paraguay, Peru and Uruguay (Venezuela was not included). CIER carried out
the project in consortium with PSR (Brazil), Mercados Energéticos (Argentina) and
SYNEX (Chile), being funded by own resources, CAF and the World Bank.
The first part encompassed: (i) the elaboration of the historical and critical analysis of the
existing interconnections (gas and electric power) and their evolution; (ii) the analysis of
the regulatory and institutional evolution of the electricity and gas markets in each region;
and (iii) the definition of scenarios for the development of secont part studies. The second
part englobed: (i) the preparation of demand and supply energy studies for the Andean
regions, in Central America and Mercosur, including gas and electric power over the 10-
year horizon; (ii) the analysis and evolution of benefits and costs of the integrations and
criteria and establishment for their proper attribution; and (iii) analysis of adequate
regulatory and/or commercial schemes applicable to the Andean, Central American and
Mercosur regions.
In its second part, the CIER 15 Project evaluated 12 projects, which involved the
construction of approximately 10,000 km of transmission lines and 6,500 MW of installed
generation capacity, requiring investments of US$ 5 billion. Its implementation resulted
in a reduction of operating costs of US$ 1.5 billion per year, as well as avoiding the annual
emission of 8 million tons of carbon into the atmosphere and increasing the security of
the supply of the countries involved (CIER, 2011).
Based on the current energy infrastructure of the region, on some projects suggested by
the CIER 15 Project (because many were not implemented), on the national expansion
230 However, as has been pointed out a few times in this thesis, there is no pattern with respect to the
countries participating in each of these 'blocs'. In some cases, it is considered Venezuela and/or Chile in
Mercosur. IIRSA itself considers Chile in its Mercosur axis. 231 See: http://www.cier.org/es-uy/Paginas/CIER-15.aspx.

179
plans of the countries, and on official data and in academic analyzes, four scenarios were
proposed: reference integration scenario (RIS), weak integration scenario (WIS),
moderate integration scenario (MIS) and strong integration scenario (SIS). It is important
to make clear that all scenarios are prepared by the author and are created based on official
energy expansion plans of the countries analyzed. All the measures of the four scenarios
will be presented in detail and justified in subsection 5.2.1.
5.2.1 Assumptions
Similarly to selected projects by CIER Project 15232, changes in alternative scenarios can
be classified as: (i) type I interconnection (operational security and opportunity
exchanges); (ii) type II interconnection (operational security and energy export); (iii) use
of infrastructure (‘swaps’); (iv) hydroelectric with export contracts (economies of scale);
and (v) binational plants. Regarding the nature of the alternative policies for each of the
alternative scenarios, they can be divided into the following goals: (i) diversification of
the power generation mix; (ii) consideration of socio-environmental vulnerability; (iii)
increasing in international transactions; and (iv) harmonization of regulatory frameworks.
The diversification of the power generation mix is fundamental for the improvement
of SEES index, mainly because it reduces the excessive dependence of fossil fuels, taking
into account the environmental impacts. The rationale is to diversify into other domestic
fuel types to stabilize prices at the pumps and at the same time meet carbon dioxide
emissions limits (UNCTAD, 2010) (CIER, 2017c).
It is worth mentioning that the region of South America, and Latin America in general,
has one of the cleanest power supply in the world. Therefore, the region’s renewable
energies enter the system based on their competitiveness rather than due to the need to
make it cleaner (as in most countries). This reality distances the countries of the region
from most IEA and OECD countries, for example.
Socio-environmental vulnerability will be considered in adopting physical limits, with
the inclusion of maximum emissions quotas per period, as in MOURA (2017) and
232 As well as the definition of the SEES index methodology, the presence of few quantitative studies on
the region’s energy policies suggests that the common bases are the same or similar. This allows, for
example, comparisons between the results of these scarce studies. The choice of the OSeMOSYS-SAMBA
model also has this objective, given the possibility of comparison with the recent scenarios and results of
MOURA (2017).

180
CONDE (2013). Besides, it is included in the costs (model inputs), rather fixed
(investment), variables or fuels, as well as the emission factors associated with each
technology. This may have effects, for example, on the expansion of large hydroelectric
dams, due to socio-environmental impact of their reservoirs, leading to an increase in the
cost of new large hydro plants, postponement of the beginning of the operation or even
unfeasibility.
The increase of international transactions in the elaboration of alternative scenarios
will be considered, either by increasing power and/or new international interconnections,
or by building new binational power plants. AALTO (2014), VON HIPPEL et al. (2011)
and ECLAC (2007) highlight the relevance of interconnection infrastructure in regional
integration, reinforcing the role of the regional institution/bloc in the supervision and
promotion of this objective.
Focusing on the Latin American case, AHMED et al. (2017) and SAUMA et al. (2011)
assessing ASEAN and CAN, respectively, highlight the need to enhance cross-border
trade, arguing that the electric interconnection allows reducing the need for generation
capacity reserves and, at the same time, providing a higher security level of supply.
Moreover, an important benefit of electric interconnections is the potential contribution
to reduce greenhouse gas emissions, given the better use of the resources of each country.
In line with the criticisms of this thesis regarding state-centric energy policies, PUKA and
SZULECKI (2014) propose an alternative approach to the discipline of energy economics
to better understand the cross-border electricity infrastructure, defending the relevance of
governance mechanisms, as well as political issues and discourses.
Specifically on the harmonization of regulatory frameworks, it was shown that it is
fundamental to reduce the uncertainties and risks of governments and private investors in
new regional ventures233. For this reason, it was necessary to analyze not only national
policies and projects (Chapter 3), but also the general guidelines of Mercosur and
UNASUR (Chapter 4) on the energy regulatory framework. Legal frameworks must be
accompanied by dynamic regulatory frameworks capable of adapting to technological
developments and market conditions (CAF, 2013b).
233 It is worth highlighting the recent publication by PARLAMENTO ANDINO (2015), which highlights
the need to deepen the process of harmonization of the regulatory and regulatory framework for sustainable
energy.

181
Table 22 below presents general information for each of the scenarios modeled in
OSeMOSYS-SAMBA.
Table 22. OSeMOSYS-SAMBA integration scenarios general data
Scenario Focus Measures
RIS National BAU
WIS National Reduction of HPP expansion + reduced cost of second generation biogas + distributed PV
(Br)
MIS Southern
Cone
Ar-Br: Garabí (1.152 MW) + Panambí (1.048 MW)
Ar-Py: Aña Cuá (2.000 MW) + 1st and 2nd Yacyretá expansion (1.550 MW) + Itacorá-
Itatí (1.660 MW) + Corpus (3.500 MW)
Bo: El Bala 1 e 2 (3.676 MW) + Rositas (400 MW)
Bo-Ar: TL Yaguacua - Pichanal - San Juancito (1,200 MW)
Bo-Pe: 2 TLs (1,150 MW)
Bo-Cl: TL (180 MW)
SIS South
America
Bo-Br: Cachuela Esperanza (990 MW)
Ar-Py-Br: TL (2,000 MW)
Py-Ar-Cl: ‘Swap’ of energy (200 MW)
Co-Ec-Pe-Cl-Bo: SINEA (3,120 MW)
Source: ENDE (2017), IPPSE (2017), MS (2017), LARREA et al. (2017), IMF (2016), YÉPEZ et al.
(2016), COES-SINAC (2016), SOL.bo (2017), CIER (2017c), BERTERO (2015), KOUTOUDJIAN
(2015), OLADE (2013), DAR (2011), National Expansion Plans, IIRSA, BN Americas, BID, FOCEM-
Mercosur, ENDE, ENDE Andina, Hydro Review, Consulado de Bolivia, Siemens and BN Americas.
Reference integrate scenario (RIS) corresponds to business as usual (BAU) scenario,
being the baseline scenario. It considers national expansion plans projected by Mercosur
governments (short, medium and long-term)234, in addition to 23 existing international
interconnections (see first part of Chapter 3). As it can be seen, in the reference
integration scenario (RIS), there are several policies and energy investments in (and
among) Mercosur countries, with particular emphasis on Bolivia. As highlighted in
234 Despite RIS and WIS consider only Mercosur countries, in both MIS and SIS there are transactions
between these countries and their neighbors (not only Mercosur States Parties, but also Associated States).
Thus, it was necessary to consider national expansion plans projected by all South American countries
(short, medium and long-term).

182
section 3.2, the country does not currently have energy interconnections with its
neighbors, despite being in the center of the South American subcontinent.
In the last Bolivian national strategic plan 2017-2021, the international electrical
integration has a weight of 15% (being only below the expansion and strengthening of
the transmission network, 25%). The country highlights that of these 15%, the share for
each country would be as follows: Argentina (80%), Paraguay (8%), Peru (7%) and Brazil
(5%).
Table 23 highlights some of the events considered in the reference integration scenario
(RIS).

183
Table 23. Reference integration scenario (RIS) detailed data
Country Project Investment
(US$ millions) Technology Installed capacity Year
Ar Vaca Muerta (Neuquén) 40,000 Shale gas 55 MMm3/day; 135 MMm3/day; 270 MMm3/day 2020; 2025; 2030
Electricity Losses in T&D - T&D losses 15% 2013
Bo
Miguillas 1 – Palillada (La Paz) 448
Hydro 118 MW 2019
Miguillas 2 – Umapalca (La Paz) Hydro 85 MW 2022
Misicuni (Cochabamba) 142 Hydro 120 MW 2018
Ivirizu (Cochabamba) 550 Hydro 280 MW 2022
San José 1 (Cochabamba) 245
Hydro 55 MW 2018
San José 2 (Cochabamba) Hydro 69 MW 2019
Solar Uyuni (Potosí) 94 Solar PV 60 MW 2018
Solar Yunchará (Tarija) 9.4 Solar PV 5 MW 2018
CC Entre Ríos (Cochabamba) 463 Thermal 380 MW (currently owns 100 MW) 2020
CC de Warnes (Santa Cruz de la Sierra) 406 Thermal 320 MW (currently owns 160 MW) 2020
CC Del Sur (Tarija) 463 Thermal 320 MW (currently owns 160 MW) 2020
Incahuasi Field (Santa Cruz) 1,200 Natural gas 7 Mm3/d (currently owns 4.7 Mm3/d) 2017
Electricity Losses in T&D - T&D losses 14% 2013
Br Electricity Losses in T&D - T&D losses 15% 2013
Py
TL Itaipu - Villa Hayes 555 TL 1,200 MW 2014
Rios interiores 1,140 Hydro 500 MW 2025
Electricity Losses in T&D - T&D losses 27% 2013
Uy Electricity Losses in T&D - T&D losses 19% 2013
Ve Electricity Losses in T&D - T&D losses 33% 2013
Ar-Br ‘Swap’ entre Brasil-Argentina - TL 2,000 MW 2017
Br-Uy Pte. Médici (Br) - San Carlos (Uy) 349 TL 500 MW 2017
Source: Own elaboration based on MS (2017), IMF (2016), YÉPEZ et al. (2016), BERTERO (2015), BID, FOCEM-Mercosur, ENDE, ENDE Andina, Hydro Review,
Consulado de Bolivia, Siemens, BN Americas.

184
Regarding Argentina, the growth production of Vaca Muerta is considered, mainly
located in the province of Neuquén, but also including the provinces of Río Negro, La
Pampa and Mendoza. The cumulative investment in the period 2012-2020 will be US$
40,000 million and the projected growth of shale gas production is 55 MMm3/day (2020),
135 MMm3/day (2025) and 270 MMm3/day (2030), according to BERTERO (2015).
Approximately 10% of this production is aimed at generating electricity.
It is worth mentioning that already in the reference scenario the possibility of energy swap
between Argentina and Brazil is considered, using existing transmission lines at 500 kV
of up to 2,000 MW. Electricity losses in transmission and distribution (T&D) are
considered 15% (YÉPEZ et al., 2016).
In the case of Bolivia, new hydroelectric, thermal and solar PV plants are considered for
domestic and export purposes. Among the hydropower projects, Miguillas, Misicuni,
Ivirizu and San José stand out, most of them located in the Cochabamba department. The
Miguillas hydroelectric power plant project is divided into hydroelectric power plants in
cascade, located in the department of La Paz, has a total investment of US$ 448 million
and a power of 203 MW. The first one, Miguillas 1 - Palillada, has an installed capacity
of 118 MW and starts operating in 2019. The second one, Miguillas 2 - Umapalca, has an
installed capacity of 85 MW and starts operating in 2022. The plant is in the Optimal
Expansion Plan of the Bolivian National Interconnected System 2022 and has financing
of the BCB (IMF, 2016).
The Misicuni hydroelectric plant is located in the department of Cochabamba and has a
total investment of US$ 142 million. The financing of the plant came from the IDB and
(Bolivian) National Treasury (TGN) (IMF, 2016). The dam has an installed capacity of
120 MW and starts operating in 2018. The Ivirizu hydroelectric plant is also located in
the Cochabamba department and has a total investment of US$ 550 million. It has an
installed capacity of 280 MW and it will start operating as early as 2022.
Like Miguillas, the San José hydroelectric project is also divided into two stages, totaling
US$ 245 million and 124 MW of power. Project funding came from the IDB and CAF
(IMF, 2016). It is also located in the Cochabamba department, the first phase has an
installed capacity of 55 MW and starts operation in 2018, while the second has installed
capacity of 69 MW and starts operation in 2019.

185
With regard to solar PV projects in progress in Bolivia, Solar Uyuni and Solar Yunchará
stand out. The first one is located in the province of Potosí, has a total investment of US$
94 million and a power of 60 MW. The financing of the plant came from BCB (IMF,
2016). The second PV plant is located in the province of Tarija, with a total investment
of US$ 9.4 million (ten times lower) and a power of 5 MW (twelve times lower). Both
projects go into operation in 2018.
Regarding thermal power plants, it should be noted that Siemens and ENDE Andina
signed a Memorandum of Understanding (MoU) in November 2015. It will promote the
expansion of the already existing Entre Ríos, Warnes and Del Sur thermal plants, all
starting operating in 2020, totaling 480 MW each and with BCB financing (IMF, 2016).
Entre Ríos thermal plant is located in Cochabamba department, has an investment of US$
463 million and will have its installed capacity increased by 380 MW. Warnes thermal
plant is located in Santa Cruz de la Sierra department, has an investment of US$ 406
million and will have its installed capacity increased by 320 MW. In addition, the Warnes
thermal plant will have conversion from single cycle to combined cycle. Finally, Del Sur
thermal plant is located in Tarija department, has an investment of US$ 463 million and
will also have its installed capacity increased by 320 MW.
With regard to natural gas, Incahuasi Field is located in the municipality of Lagunillas, in
Santa Cruz de la Sierra department, and has an investment of US$ 1,200 million, and
reached a production capacity of 7 Mm3/d (currently owns 4.7 Mm3/d) in 2017. It is
noteworthy that 90% of this production is aimed at exports to Argentina. Besides,
electricity losses in T&D in Bolivia are 14% (YÉPEZ et al., 2016).
As for Brazil, we stress the construction of the international interconnection Presidente
Médici (Br) - San Carlos (Uy), 420 km long and 500 kV HVDC back-to-back, due to the
difference in frequency between both countries. The transmission line costs US$ 349
million, has a transmission capacity of 500 MW and has been operating since 2017.
Electricity losses in T&D in Brazil are considered as 15%, same as Argentina (YÉPEZ et
al., 2016).
In Paraguay, there will be two transmission lines Itaipu - Villa Hayes and Yacyretá - Villa
Hayes, being only the first one considered in the RIS. The line is 348 km long, costs US$
555 million, operates at 500kV, has a maximum transmission capacity of 1,200 MW and
has been operating since the end of 2013. In the country, electricity losses in T&D are

186
considered to be 27%, reaching 19% and 33% in Uruguay and Venezuela, respectively
(YÉPEZ et al., 2016).
Weak integration scenario (WIS) is based on the reference integration scenario (RIS).
As with RIS, its focus is also national, precisely because it does not include advances of
new regional integration projects. As its name suggests, there will be no progress of any
project under study. In addition to what is considered in RIS, it considered lower hydro
expansion capacity and reduced investment costs of biogas (from second generation)
power plants and addition of distributed photovoltaic (PV) in Brazil235. Considering the
already presented nature of alternative policies, it is perceived that WIS presents
diversification of the power generation mix and considers socio-environmental
vulnerability, without having any projects that increase international transactions and/or
contribute to the harmonization of regulatory frameworks.
The maximum capacity expansion in hydro plants in Brazil was set at a lower level of up
to 200 MW per year in the Northern subsystem, 100 MW in the subsystems of the South
and Southeast and no hydro expansion in Brazil’s Northeast. Besides, distributed PV was
considered only in the electricity supply mix of Brazil to assess the impact of the
penetration of this technology in 10% of households total, due to recent new regulations.
Regarding the third measure, it was assumed that the long-term investment cost of new
biogas power plants (US$ 2.449/kW) will converge to the investment cost of bagasse
incineration plants in 2013 (US$ 1.905/kW) in Brazil (MOURA, 2017).
Moderate integration scenario (MIS), as well as the weak integration scenario (WIS),
is based on the reference integration scenario (RIS). The focus is on the moderate
expansion of Mercosur region energy integration projects, considering national hydro
projects in Bolivia and international interconnections between the countries analyzed.236
Considering the already presented nature of the alternative policies, we note that the
moderate scenario presents diversification of power generation mix, socio-environmental
vulnerability, and has (bi)national projects that increase international transactions,
without any conection to the desired harmonization of regional regulatory frameworks.
235 Although they come from different reference scenarios, the measures implemented in the Weak
Integration Scenario (WIS) are the same as the Alternative Trade Scenario (ATS) present in MOURA
(2017). 236 Thus, just like in the RIS, it is necessary to consider neighbors involved in these projects, taking the
analysis to the countries of the Southern Cone. It is indirectly considered Chile and Peru (Mercosur
Associated States since 1996 and 2003, respectively).

187
Table 24. Moderate integration scenario (MIS) detailed data
Country Project Investment
(US$ millions) Technology Installed capacity Year
Bo
El Bala 1 Component 1 (Angosto Chepete 400) 6,912
Hydro 3,251 MW 2030
El Bala 2 Component 2 (Angosto El Bala 220) Hydro 425 MW 2043
Rositas 1,000 Hydro 400 MW 2024
Bo TL with Ar, Br, Pe and Py 622 TL 8,000 MW (Br) + 700 MW (Ar) 2020*
Bo-Ar Yaguacua (Bo) - Tartagal (Ar) - San Juancito (Ar) 60 TL 1,200 MW 2019
Bo-Cl Punutuma (Bo) - Radomiro Pomic (Cl) 30,5 TL 180 MW 2021
Bo-Pe Azángaro (Pe) - Juliaca - Puno (Bo) 81,3 TL 1,000 MW 2021
La Paz (Bo) - Puno (Pe) 65 TL 150 MW 2022
Py TL Yacyretá - Villa Hayes 297 TL 300 MW 2019
Ar-Br Garabí (quota 89) 2,728 Hydro 1,152 MW 2026
Panambí (quota 130) 2,474 Hydro 1,048 MW 2026
Ar-Py
Yacyretá - Aña Cuá 610 Hydro 270 MW 2022
Yacyretá – 1st expansion (Yacyretá 3) 100 Hydro 465 MW 2023
Yacyretá – 2nd expansion (Yacyretá 7) 2,300 Hydro 1,085 MW 2027
Yacyretá - Itacorá-Itatí 6,000 Hydro 1,660 MW 2029
Corpus Christi (Pindoí) 9,000 Hydro 3,500 MW 2030
Source: Own elaboration based on ENDE (2017), IPPSE (2017), SOL.bo (2017) and KOUTOUDJIAN (2015); * 100 MW every year from 2020.

188
The only countries that have strictly national projects are Bolivia and Paraguay (although
with export purposes). As previously reported in WIS and section 3.3, Bolivia is not
interconnected with any neighboring country, despite its five international borders (with
Argentina, Chile, Brazil, Paraguay and Peru). In this sense, it is the country that has the
greatest remaining potential to promote these regional initiatives, ratifying the national
objective of making the country the regional export heart.
In Bolivia, the implementation of the El Bala hydroelectric plant, located on the Beni
River, is considered. The construction of the plant will be divided into two stages, totaling
3,676 MW of power with a total cost of approximately US$ 6,920 million (total
generation of 18,048 GWh/year). El Bala Componente 1 (Angosto Chepete 400) has
3,251 MW of installed capacity with reservoir, which at its peak extraordinary level
would have an area of 680 km2. Component 2 (Angosto El Bala 220), is run-of-river, with
a capacity of 425 MW and is located 2.5 km downstream. This component will take
advantage of the regulated and overflow waters of Component 1. The executing company
of the project is ENDE, with its own resources (IMF, 2016). It is worth mentioning that
the production of electricity will be mainly destined to be exported to the Brazilian
market. Component 1 will start operating in 2030 and component 2 in 2043237.
Finally, the last Bolivian hydroelectric plant considered in MIS is Rositas, whose
investment will be approximately US$ 1 billion and installed capacity of 400 MW. The
plant aims at supplying domestic demand, as well as exporting electricity to Brazil and
Chile (through TL of 100 MW for each country), and starts operating in 2024. As it can
be seen, Bolivia plays a fundamental role in this scenario, already having a series of
projects and initiatives considered in the reference integration scenario (RIS). The
country’s goal is to create international interconnections with Argentina, Brazil, Peru and
Paraguay totaling 1,359 km of extension. The total investment would reach US$ 622
million and the goal would be to export 8,000 MW to Brazil and 700 MW to Argentina238.
Bolivia will also create international interconnections with Argentina, Peru and Chile.
With Argentina, the interconnection will have 110 km to 500 kV, it will have a total cost
of US$ 60 million and it will link the Yaguacua (Bo) - Tartagal (Ar) - San Juancito (Ar)
237 Ende is studying a 615 km direct current transmission line from El Bala (Bo) to Montalvo (Pe), with an
exchange of up to 1,000 MW. As they are only plans without major advances, this possibility was not
incorporated in the scenario. 238 In the model, the potential enters from 2020 to 100 MW each year.

189
regions. It has a maximum transmission capacity of 1,200 MW and it will start operating
in 2019.
With Chile, the interconnection will have 150 km at 230 kV, total cost will be around
US$ 60 million and it will connect the regions Punutuma (Bo) - San Cristóbal (Bo) -
Laguna Colorada (Bo) - Radomiro Pomic (Cl). It has a maximum transmission capacity
of 180 MW and it will start operating in 2021. We must consider the diplomatic problems
between Bolivia and Chile due to the dispute over the exit to the sea. Anyway, even the
CIER 15 Project affirmed that the project is broadly attractive for the interconnected
system.
With Peru, two international interconnections are considered between the two
countries239. The first of these links Azángaro (Pe) - Juliaca - Puno (Bo), has 114 km at
220 kV, with a capacity of 1,000 MW. The estimated cost of the project is US$ 81.3
million and will come into operation in 2021. The second links La Paz (Bo) - Puno (Pe),
has 150 km at 230 kV, with a capacity of 150 MW. The estimated cost of the project is
US$ 65 million and it enters into operation in 2022. In both cases it is necessary to have
a back-to-back substation with converters, due to the difference in frequency between
both systems.
As presented in RIS, Paraguay already has Itaipu - Villa Hayes line, but now the country
will also create a Yacyretá - Villa Hayes interconnection. The transmission line has a
length of 362.9 km, costs US$ 297 million, operates at 500kV, has a maximum
transmission capacity of 300 MW and operates from 2019.
Argentina and Brazil will finally carry out the Garabí-Panambí binational hydroelectric
complex, which totals 2,200 MW of installed capacity and starts operating in 2026.
Garabí (quota 89) has a total investment of US$ 2,728 million, with 1,152 MW of power.
Panambí (quota 130) has a total investment of US$ 2,474 million, with 1,048 MW. The
construction of the plant is based on the Brazil-Argentina Treaty and its additional
protocol, which make it possible to carry out hydroelectric studies in the Uruguay River
region240. Both dams will be funded by the public sector of both countries, being part of
239 It should be noted that in order to carry out the operational studies between Bolivia and Peru, there are
difficulties in determining the price of gas that vary widely between both countries (CIER, 2013). 240 See: http://eletrobras.com/pt/AreasdeAtuacao/geracao/garabi_panambi/Tratado_Brasil_Argentina.pdf.

190
the Growth Acceleration Program 2 (PAC 2) being financed by BNDES (UDAETA et
al., 2016).
Yacyretá binational plant (Ar-Py) has four modifications to its initial project, which will
increase its installed capacity by 3,480 MW. The first is the Aña Cuá branch, with an
investment of US$ 610 million, contributing 270 MW and entering into operation in 2022.
The second is the first expansion (Yacyretá 3), with an investment of US$ 100 million,
contributing 465 MW and entering into operation in 2023. The third is the second
expansion (Yacyretá 7), with an investment of US$ 2,300 million, contributing with 1,085
MW and entering into operation in 2027. The fourth change is Itacorá-Itatí, with an
investment of US$ 6 billion, contributing with 1,660 MW and entering operation only in
2030
Argentina and Paraguay also have the entry of Corpus Christi, whose total investment
will be US$ 9 billion and installed capacity of 3,500 MW (although there would be a
viability of 3,400 MW). The Pindoí location alternative (km 1,658) rises with more
possibilities due to less flooded territory and lower environmental effects (IPPSE, 2017).
As its name suggests, strong integration scenario (SIS) is the most audacious scenario. To
be viable, there must be a series of changes, highlighted in section 2.3.1, such as: (i)
political will; (ii) diplomatic engineering; (iii) institutional development; (iv)
adaptation/harmonization of regulation related to cross-border trade; and (v)
advancement of transmission and interconnection infrastructure. Precisely because of
this, it was modeled on the moderate integration scenario (MIS), which already considers
some of these prerequisites.
Regarding this scenario, more than focusing on the expansion of installed capacity, we
seek to optimize the use of existing infrastructure in the region. It is not limited to
Mercosur countries (and their neighbors, to the extent that there are joint projects), but
the analysis is extended to all of South America. Therefore, countries such as Ecuador
and Colombia are considered, comprising almost all the States Parties and Associated
States of Mercosur, making up almost the whole of South America.
Considering the already presented nature of the alternative policies, we can see that the
SIS presents a diversification of the power generation mix, considers socio-environmental
vulnerability, has (bi)national projects that increase international transactions and

191
presupposes the desired harmonization of regional regulatory frameworks. In this sense,
this is the only scenario that acknowledges all the different natures of the alternative
policies considered in the model.
In this scenario, there are only projects involving two or more countries. Only one extra
dam is considered, although facing popular resistance to advance (Cachuela Esperanza),
given their socio-environmental impacts. At the same time, swaps are considered between
Paraguay, Argentina and Chile241. Finally, the scenario considers new international
interconnections, with Chile, Ecuador and Peru.
241 It should be noted that the reference integration scenario (RIS) already considers the possibility of
electricity (or natural gas) swaps between Argentina and Chile, as well as between Argentina and Brazil.
In the case of Chile, this mechanism occurred for the first time in October 2017, when Argentina sent 2
MMm3 of natural gas to Chile, a volume that returned to the country in the same week. In December 2017,
the ministers of energy of the two countries signed a bilateral agreement in Buenos Aires that will increase
the energy exchange, both electricity and natural gas.

192
Table 25. Strong integration scenario (SIS) detailed data
Country Project Investment
(US$ millions) Technology Installed capacity Year
Bo-Br Cachuela Esperanza (Beni) 2,460 Hydro 990 MW 2030
Ar-Py-Br (500 kV, 321 km) - TL 2,000 MW 2030
Py-Ar-Cl Swap de energía Paraguay - Argentina - Chile - TL 200 MW 2025
Co-Ec* Alférez (Co) - Jamondino (Co) - Inga (Ec) - TL 800 MW 2020
Cl-Bo* Chuquicamata (Cl) - Laguna Colorada (Bo) 30 TL 120 MW 2020
Pe-Ec* La Niña (Pe) - Daule (Ec) 522.25 TL 1,000 MW 2022
Pe-Cl* Los Héroes (Pe) - Arica (Cl) 131.5 TL 200 MW 2020
HVDC Montalvo (Pe) - Crucero (Cl) 989 TL 1,000 MW 2024
Source: Own elaboration based on CIER (2017c), LARREA et al. (2017), COES-SINAC (2016), OLADE (2013), DAR (2011), IIRSA, BN Americas; * SINEA Project.

193
Cachuela Esperanza dam (Bo-Br interconnection) will cost US$ 2,460 million, will have
990 MW of installed capacity and will start operating in 2030. The plant will be located
in the department of Beni, downstream of the Inambari project and its economic viability
depends strongly on the construction of Cachuela Esperanza. Meanwhile, Cachuela
Esperanza is located upstream of the Santo Antonio and Jirau plants in Brazil.
It is worth noting that Cachuela Esperanza is in the National Development Plan of Bolivia
(PND), with the purpose of providing electrical power to the populations located in the
far north of the country and at the same time promoting the development of the Bolivian
Amazon. As the size of the plant is very large for the Bolivian system, much of its
generation will be exported to Brazil.
However, Bolivia operates with frequency of 50 Hz and Brazil with 60 Hz, which requires
converters in the project (increases its final cost). Therefore, there are two transmission
lines between Bolivia and Brazil. One between Cachuela Esperanza (Bo) - Abuna (Br),
of 105 km and with a transmission capacity of up to 200 MW. The other line from
Cachuela Esperanza (Bo) - Porto Velho (Br), of 284 km through a double circuit of 500
kV, with an investment of US$ 792 million. The commercial and regulatory aspects
between both countries must still be agreed, but being Cachuela Esperanza a run-of-river
project, the operative agreements would be simpler (OLADE, 2013).
In the case of Cachuela Esperanza, public awareness of the importance of preserving the
environment and respecting the rights and prerogatives of local communities, especially
indigenous communities, is fundamental. An alternative to reservoirs would be to change
the project into run-of-river, as they significantly reduce the flooded area, as well as socio-
environmental impacts. This is particularly important for Brazil, since (i) the remaining
hydroelectric potential of the country is concentrated mainly in the Amazon region, whose
flat topography imposes a relation of flooded area/unfavorable energy generation; and (ii)
the country generates more than two-thirds of its energy from hydroelectricity (BIATO,
2016). However, it is necessary to consider the side effect of the absence of reservoirs on
the guarantee and stability of energy supply, especially if there is an impact and/or
pressure on the construction of plants with reservoirs in neighboring countries in the
border regions.
The Argentina-Paraguay-Brazil interconnection consists of constructing a 321 km long
500 kV line of 2,000 MW capacity, in Paraguayan territory, from Yacyretá to Itaipú. The

194
link would allow optimizing the systems of the three countries besides Uruguay, which
is interconnected with Argentina. Likewise, the probability of deficits in Brazil and
Argentina would be reduced with a reduction in GHG emissions. This project is only in
SIS because it would have to handle trade barriers linked to the Treaty of Itaipu (Br-Py),
which did not allow the sale of energy to third countries (CAF, 2012). Therefore, it was
considered that the project would only be carried out in 2030, since the discussions
regarding Itaipu will only be clarified post-2023. It should be added that the problems of
gas supply in Argentina are seasonal, due to the increased consumption for heating in
winter (May to September), while in the same period the reservoirs in Brazil are full with
some excess capacity for the system (OLADE, 2013). Here, there will be increased
capacity for connections with Villa Hayes, which is considered in both reference
integration scenario (RIS) and moderate integration scenario (MIS).
The energy swap between Paraguay, Argentina and Chile would allow the most efficient
use of energy among the countries. The purpose of this interconnection is to send
hydroelectric power from Paraguay to the northern region of Chile (SING)242, where there
is thermoelectric predominance. Given that Paraguay and Chile have no borders, the idea
is that Paraguay would increase its energy dispatch by 200 MW for Argentina, through
the binational Yacyretá plant, and Argentina in turn would send the same amount of 200
MW to Chile. It is worth adding that the Paraguay-Argentina swap does not require
investments in new transport capacity.
The transmission lines would be as as follows: Yacyretá (Py) - Resistance (Ar) - Roque
Sáenz Peña (Ar) - Monte Quemado (Ar) - Lumbreras/Cobos (Ar) - Atacama (Cl). The
swap project between Paraguay, Argentina and Chile was one of the most attractive
projects evaluated in CIER 15 Project, and it is a good example of the innovative use of
optimizing the use of existing infrastructure (CIER, 2011). In order to implement this
measure, a transmission line from Argentina to Chile with a capacity of 200 MW will be
created in 2025.
242 When it comes to Chile, it is important to stress that its reforms were implemented in the aftermath of
the protracted reduction of the gas supply from Argentina (from 2004) and the 2010 earthquake, which
disrupted energy supplies and electricity transmission. Between 2006 and 2008, gas imports fell by 88% as
a result of a curtailment of gas supply from Argentina (IEA, 2018). In fact, the gas disruption from
Argentina to Chile was one of the frequently cited emblematic cases of binational project/agreement risks.

195
The five interconnections below are part of the Andean Electric Interconnection System
(SINEA)243, which involves the CAN countries. It is necessary to consider this project in
the SIS, even considering that on April 24, 2017, Decision N. 816 was published with the
‘Regulatory framework for sub-regional interconnection of electrical systems and
electricity exchange’ among CAN countries. As such, they can be categorized in the
following manner: (i) strengthening of existing interconnections; (ii) convenient
interconnections to be developed in a bilateral scope; and (iii) convenient
interconnections to be developed in a regional scope. SINEA gathers Chile, Colômbia,
Equador e Peru, besides Bolivia as an observer (see section 3.2 and Appendix E).
Within the bilateral scope, previous studies evaluate that the following interconnection
alternatives are economically feasible: Equador - Peru, Peru - Chile (both) and Chile -
Bolivia. Ecuador - Peru and Ecuador - Colombia projects are not feasible bilaterally
because the benefits of Ecuador would not be enough to offset the investment costs of
this country (COES-SINAC, 2016). Anyway, in the strong integration scenario (SIS), all
interconnections will be considered.
Colombia-Ecuador Interconnection is another project considered in the SIS. This
interconnection is necessary to Ecuador, since the lack of investment in new generation
capacity forced the country to use thermal power plants with high operating costs, which
increased the marginal cost of the system, in addition to increasing the probability
shortage. Colombia244, for its part, has a greater diversity of generation sources
(hydroelectricity, natural gas, coal and petroleum derivatives), so its marginal costs of the
system were much lower than in Ecuador, thus creating favorable conditions for the
exchange of energy between both countries (OLADE, 2013). The suggested
interconnection links Alférez (Co) - Jamondino (Co) - Inga (Ec), has 505 km of extension
243 In 2011, the Galapagos Declaration created the Council of Ministers of SINEA. The project seeks a
feasible gradual advance with bilateral ties and has the proposed development of the Regional Electricity
Market of SINEA countries (which would require changes/adjustments of regulations between countries).
For this purpose, it suggests the following steps: (i) advance the regional electricity integration process with
the Roadmap; (ii) advance bi-national electricity interconnections to achieve regional integration; and (iii)
analyze and adopt regulatory harmonization agreement to confirm a regional electricity market in a gradual
manner. 244 Colombia signed a memorandum of understanding (MoU) with Australia that will allow the two nations
to achieve greater cooperation between their respective hydrocarbon sectors. Additionally, the country
signed a MoU with South Korea, which aims to implement a quality management system for liquid fuels
in Colombia, as well as a tracking system for fuel performance and distribution of liquefied petroleum gas
(LPG) (OLADE, 2017). It is then clear that Colombia has not been limited to the regional initiative to
promote energy integration, but also promoted partnerships and cooperation with countries outside the
region.

196
at 500 kV and maximum transmission capacity of 800 MW. It is scheduled to start
operating in 2020.
Chile-Bolivia interconnection links Chuquicamata (Cl) - Laguna Colorada (Bo), having
140 km of extension to 220 kV. It has a maximum transmission capacity of 120 MW and
is scheduled to start operating in 2020 (CIER, 2017c). Regarding the Peru-Ecuador
interconnection, it should be noted that there is already an electricity interconnection
between both countries of 100 MW, but it has not been able to be used due to regulatory
problems and limitations of the transport systems. In addition, there is also an
interconnection between Colombia and Ecuador, which is why operational studies must
take into account the three systems together (OLADE, 2013). The proposed line connects
La Niña (Pe) - Daule (Ec), has a length of 634.9 km at 500 kV. Its total cost will be US$
522.25 million, with a maximum transmission capacity of 1,000 MW and an expected
start-up in 2022.
There are two Peru-Chile interconnections. The first one interconnects Los Heroes (Pe) -
Arica (Cl), it is a back-to-back connection of 220 kV and 70 km long. With a total
investment of US$ 131.5 million, it has a maximum transmission capacity of 200 MW
and is expected to start operating by 2020. The second interconnection links HVDC
Montalvo (Pe) - Crucero (Cl) HVDC 500 kV, has 650 km in length and a total cost of
US$ 989 million. Having a maximum transmission capacity of 1,000 MW, it is expected
to start operating only in 2024.
It is important to consider that the modeling of the scenarios in OSeMOSYS-SAMBA
presents some limitations. For energy modeling, there was difficulty in accessing certain
data, particularly in the case of Venezuela. In addition, some countries did not have
energy expansion plans.
Forecasts of all sorts are usually bad at predicting sudden changes (PALTSEV, 2016),
and also difficult to make in the context of sudden changes. Consequently, it is worth
highlighting the greater uncertainty regarding the scenarios due to the political-economic
conjuncture that some countries face, particularly Brazil and Venezuela, as well as the
possible change of political orientation in some countries of South America, with new
presidential elections between 2018 and 2020.
From a modeling perspective, the ‘commoditization’ of international oil and liquid natural
gas (LNG) prices also introduces a high degree of uncertainty in the planning of energy

197
policy. The advance of LNG, in particular, may lead to a reduced need to build new gas
pipelines in the region, which is the reason why they were neither considered in any of
the scenarios, nor in the strong integration scenario (SIS). Another recent change in the
energy market is the possibility of distributed generation, which is considered in the
different scenarios mainly by the entry of solar photovoltaic generation in some countries.
However, smart grids are not considered in the model.
Furthermore, due to modeling limitations, energy integration becomes an alternative to
the need of having a complementary wind-solar-hydro energy matrix, as well as energy
storage such as reversible hydropower, batteries, generators/fast-start engines,
concentrated solar power (CSP) that accredits for the next 20 years (CIER, 2017b).
Besides, to avoid discussions related to the food-water-energy nexus, it was assumed that
only sugarcane was used for electricity generation, just like in MOURA (2017).
It is worth highlighting the methodological and operational challenge of increasing
renewable energies, such as wind and PV, in energy systems, due to the great variability
in the short and medium term. In addition, the large-scale location of the projects
considered in the scenarios is far from the main demand centers, which would require
extra reinforcements and investments in the transmission system (with the exception of
distributed PV). Thus, seasonal wind-solar-hydric complementarity, storage, batteries
and increased participation of intermittent renewables constitute technical-operational
and regulatory difficulties that increase the need for adequate energy planning, demand
management, as well as regulatory framework.
As for the scenarios themselves, it is necessary to consider some particularities. Due to
the inability to predict what will happen with the renewal of GASBOL (2019) and the
renegotiation of the Itaipu Treaty (2023), the reference integration scenario (RIS) has
assumed that the relationship between the countries involved will remain partially the
same, although Paraguay is bound to export less energy to Brazil at higher cost. It is
assumed that, regarding GASBOL, prices will converge to international prices by 2058.
Itaipu, in turn, will have its price increased until 2032, when it will converge to
international prices.
The weak integration scenario (WIS) already considers the development of some LT and
power plants in the region, since it is based on the reference integration scenario (RIS).
Therefore, it also has measures to mitigate CO2 emissions. However, the moderate
198
integration scenario (MIS) can be considered reasonably optimistic, since it already
considers certain projects whose popular resistance is significant, mainly due to socio-
environmental impacts.
On the other hand, the strong integration scenario (SIS), as its name suggests, considers
projects that seem unlikely to happen in the next 10-15 years. Precisely for this reason,
SIS is the scenario that has fewer measures. Nevertheless, not even the SIS considers
some plants that although announced, their negotiations seem to be paused as it is the case
of certain plants in Bolivia and Peru (both for export to Brazil).
The binational Guajará-Mirim (Bo-Br) dam is one of the plants that were not considered.
The project has 3,000 MW of installed capacity and costs about US$ 5 billion. It would
also create a waterway network of 4,200 km navigable and stabilize the Jirau reservoir,
adding 280 MW average generation. If the project were to advance, the objective of the
Brazilian government would be to produce an agreement in accordance with the Itaipu
Treaty. In 2016, Eletrobras and the Sustainable Consortium of Brazil (ESBR), which
operates Jirau dam, signed memorandums of studies of the plant at the border with
Bolivia. However, the only certainty of this venture up to date is its location. See
Appendix H.
However, the region potentially affected by the project has low population density, both
in Bolivia and Brazil, lacking in terms of basic services. In this context, such large
infrastructure project could be conceived as the anchor project for the implementation of
social and development policies in the region (CASTRO et al., 2017).
The potential for bilateral integration between Peru and Brazil is immense, even though
there are socio-environmental, geopolitical and institutional challenges (MOREIRA,
2016). However, Inambari dam was not considered even in the most optimistic scenario.
The Inambari Dam (Pe-Br interconnection245) has an installed capacity of 2,200 MW, is
located in the Peruvian Amazon (Cusco, Puno and Madre de Dios) and total cost of US$
4,847 million246. Of that amount, around US$ 800 million corresponds to the transmission
line with Brazil. It is located on the eastern slope of the Peruvian Andes, just 260 km
245 The Agreement between Peru and Brazil with regard to the export of energy surpluses to Brazil, signed
in June 2010, should be highlighted. See:
http://www.minem.gob.pe/minem/archivos/file/Electricidad/acuerdo%20peru%20brasil%2016%20julio%
202010.pdf. 246 Both Brazil and Peru have a frequency of 60 Hz. The back-to-back converter is required for stability
reasons (CAF, 2012).

199
away from the border with Brazil and therefore allows for the export of electricity to the
country.
The plant would have a multiannual regulatory capacity reservoir and is located upstream
of the Brazilian power stations of Santo Antonio and Jirau. Due to environmental
restrictions, these two plants are run-of-river and the Inambari dam, when it is completed,
would allow regulating the flows of the two plants mentioned on the Brazilian side of the
basin, adding 90 MW of firm power to the system (DAR, 2011). Two alternatives are
being studied to connect Inambari to the Brazilian electric system (SIN) but we rely rather
on the possibility of constructing a 500 kV transmission line of 810 km that would connect
it with the Madeira river plants in Brazil247. In modeling, it is planned to start operating
in 2025.
It should be noted that Inambari would be the largest hydro in Peru and the fifth in Latin
America. Notwithstanding, Peru has canceled the provisional license of the Inambari
consortium (UDAETA et al., 2016) due to: (i) massive rejection of the population; (ii)
rejection by institutions such as the College of Engineers, Regional Government of Puno;
(iii) rejection by the indigenous organizations and defense fronts that were constituted;
and (iv) legislation that was not yet as aggressive as today’s.248 It is estimated that about
8,000 people will be affected by the project, which has a wetland area of 377.66 km2, a
reservoir with 319 km2 of area.
Besides, the following hydroelectric plants with Peru were not considered: Sumabeni
(1,740 MW), Tambo 40 (1,286 MW), Tambo 60 (580 MW), Paquitzapango (2,000 MW),
Urubamba (940 MW), Vizcatán Mainique I (607 MW) and Cuquipampa (800 MW).
Together, these plants would add approximately 9,000 MW of installed capacity
(UDAETA et al., 2016, DAR, 2011). The dams would be located in the Peruvian
247 The proximity of Inambari to Brazilian cities such as Rio Branco and Porto Velho does not necessarily
mean that interconnection costs with Brazil are going to be reduced, since the consumption of these cities
is not enough to absorb the injected energy from Peru. Therefore, it would be necessary to transport the
difference to the southeast region of Brazil, where the large cargo centers are located. One possibility will
be to take advantage of the transmission infrastructure (HVDC lines with 2,500 km) that is being built to
evacuate the energy produced by Santo Antônio and Jirau to the Southeast (CIER, 2012). 248 See: https://ejatlas.org/conflict/represa-inambari.

200
Amazon, a region that already has a deficient electrical infrastructure, marked by the
existence of national parks, indigenous societies and socio-environmental conflicts249.
As regards the northern region of the South American subcontinent, it is noted that the
Arco Norte famous project was not considered (see section 3.3 and Appendix D). In
2012, under Rio+20, it was defined that the project would contribute to LAC SE4ALL.
In 2013, agencies, electricity companies, IDB and AFD formalized a MoU to study
collaboration possibilities for electrical interconnection. Among the expected benefits of
the initiative are: (i) increase energy security and reliability in electricity supply; (ii)
reduce generation costs (enable large generating plants and reduce investments in reserve
capacity); (iii) reduce dependence on oil (diversify the energy matrix of each country);
and (iv) guarantee economic benefits (optimize electricity supply systems and provide
lower rates to the final consumer).
With Brazil, there would be two international interconnections. The first one links Brazil
(Roraima) - Guyana, which is expected to start operating in 2025. The second one would
link (Brazil) Amapá - French Guiana and would be expected to start operations only in
2032. Both interconnections have capacity of a maximum transmission of 1,500 MW
(LARREA et al., 2017). However, the logistical challenge of this project stands out given
its geographical location. In addition, the OSeMOSYS-SAMBA model does not consider
Guyana or French Guiana, which made it impossible to consider the Arco Norte Project
in the scenario of more optimistic efforts towards integration.
5.2.2 Results
Moving on from the graphical analysis of section 5.1, which considered the period
between 1990 and 2010 interspersed every five years, this subsection will provide an
analysis with a planning horizon between 2015 and 2050250, also following the same time
249 It is important to consider other actors in this process, so as not to provide a naive analysis of the local
reality. Therefore, more than just highlighting indigenous resistance, it is crucial to understand the weight
of local economic groups that see these new projects as threatening competition for their plans and gains.
There are even those who accuse such groups of financially supporting social groups and NGOs to create
barriers to the advancement of these projects. 250 The analyzes consider different 2050 pathways, as it has been done in different reports and scenarios,
such as KPMG (2016), Europeam Comission (2016, 2011), Siemens (2014), UNCSD (2013), HONG et al.
(2013), WEC (2016, 2013, 2007), IEA (2010, 2003) and Shell (2008), mainly when it comes to
decabonizing electricity emissionsIt is important to note that although the SDG Agenda focuses on 2030,

201
interval of five years. In this way, this section will analyze each one of the four scenarios
presented, carrying out a comparative analysis whenever it is possible and relevant. Table
26 shows the evolution of installed capacity (GW) and generation (TWh) for each
Mercosur country during the period 2015-2050.
Table 26. Evolution of RIS installed capacity and generation, by country (2015-2050)
Countries Installed capacity (GW) Generation (TWh)
2015 2025 2035 2045 2050 2015 2025 2035 2045 2050
Ar 15.8% 14.3% 18.4% 19.6% 20.5% 14.3% 15.2% 15.7% 16.1% 16.2%
Bo 1.0% 1.4% 2.2% 4.0% 4.4% 0.9% 1.4% 2.1% 3.1% 3.8%
Br 62.2% 65.1% 63.2% 62.4% 61.5% 62.4% 63.0% 63.3% 63.4% 63.3%
Py 4.2% 3.8% 3.0% 2.5% 2.7% 6.3% 4.8% 4.2% 3.6% 3.7%
Uy 1.5% 1.6% 1.3% 1.0% 0.9% 1.1% 1.2% 1.1% 1.0% 0.9%
Ve 15.2% 13.9% 12.0% 10.5% 9.9% 14.9% 14.4% 13.6% 12.7% 12.2%
Mercosur 209.1 244.2 307.5 405.5 460.0 911.7 1,094.4 1,347.0 1,691.9 1,894.3
Source: Own elaboration.
In the reference integration scenario (RIS), the participation of Brazil in terms of installed
capacity, going from 130.1 GW (62.2%) in 2015 to 283.1 GW (61.5%) in 2050, is
overwhelming (growth of 117.6%)251. Despite relative stability, Argentina (186.6%) and
Bolivia (866.7%) expand their installed capacity further, while Paraguay, Uruguay and
Venezuela lose relative weight.
In Argentina, installed capacity is growing mainly due to wind onshore (from 2027 on)
and NGOC (from 2023 on, with Vaca Muerta), replacing the relevance of NGCC, which
falls significantly. Also, less intense falls in the participation of heavy fuel oil (diesel and
fuel oil) and large hydro take place.
the United Nations Sustainable Development Solutions Network (UNDSN) has already stated that SDG 13
(Climate Action) will need the development of deeper decarbonization pathways to 2050. Moreover,
modeling framework is extended to 2058 in order to avoid so called ‘edge-effect’ considerations from
affecting the reported results. 251Although this participation shows a slight tendency to fall in the other scenarios, it is possible to affirm
that this pattern is based on the four scenarios analyzed.

202
Bolivia has increased installed capacity between 2015 (2.1 GW, 1.0%) and 2050 (20.3
GW, 4.4%) due to the expansion/creation of hydroelectric plants (Miguillas 1 and 2,
Misicuni, Ivirizu, San José 1 and 2), solar plants (Solar Uyuni and Solar Yunchará) and
thermal to combined cycle plants (CC Entre Ríos, CC de Warnes and CC Del Sur). This
pressured the decline of NGOP and NGCC participation in the country, leading Bolivia
to surpass Paraguay’s installed capacity as early as 2039, reflecting national plans to make
the country the region's energy exporter.
In Brazil, installed capacity is pressured by the increase in the share of wind onshore
(from 2024 on), NGCC (from 2027 on), pulverized coal and the high (although with more
stable growth) large hydro participation. By the way, large hydro has its proportion in
national installed capacity reduced from 68.1% (2015) to 42.3% (2050).
Due to the significant weight of Itaipu in the installed capacity of Paraguay and Yacyretá
(albeit to a lesser extent), Paraguayan installed capacity changed marginally in the
analyzed period. There is participation of wind onshore (from 2044 on) and open cycle
NG (only from 2047 on). There is an increase of 43.6% of national installed capacity
between 2015 (8.8 GW, 4.2%) and 2050 (12.6 GW, 2.7%).
Similar to the Paraguayan case, Uruguay has a significant installed capacity based on
Salto Grande (with Argentina) binational plants. A significant drop in the share of heavy
fuel (from 2018) is compensated by increased biomass installed capacity (from 2020 on),
wind onshore (from 2025 on), coal (from 2026 on) and small hydro252 (from 2031 on).
There is a 33.0% increase in national installed capacity between 2015 (3.2 GW, 1.5%)
and 2050 (4.2 GW, 0.9%).
Venezuela also counts on the Guri dam installed capacity and sustained large hydro
growth, especially after 2026, which replaces heavy fuel and NGOC. There was a 43.4%
increase in national installed capacity between 2015 (31.9 GW, 15.2%) and 2050 (45.7
GW, 9.9%),
Indeed, the generation of each Mercosur country is in some way related to its installed
capacity, as well as to the level of international insertion in terms of energy integration
(number of international interconnections and binational plants). However, it is worth
mentioning the small increase accumulated in installed capacity in Uruguay (33.0%) for
252 Small hydro < 30 MW.

203
the period 2015-2050, which leads to an increase in the capacity factor of the country’s
plants (the same is true for Venezuela, because neither is involved in new projects in any
of the four scenarios).
In Argentina, the generation from NGCC stands out, which falls in 2025 (although it
remains significant until 2040). Wind onshore (from 2034 on) and large hydro (in a
continuous way, with greater weight also from 2034 on) have significant and growing
weight in Bolivia’s electricity generation; this increase in generation replaces NGOC,
small hydro and NGCC, falling to 7.0% (2050), 0.7% (2050) and 0.8% (2050)
respectively.
In the case of Brazil, the weight of large hydro (including Belo Monte, Itaipu, Madeira
and Tapajós) remains huge, despite its fall; it decreases to 47.4% (2050). The wind
generation onshore, NGCC and coal generation grow to 15.2% (2050), 10.2% (2050) and
9.2% (2050), respectively. In Paraguay, the generation of Itaipu and Yacyretá
hydroelectric plants accounts for 98.3% (2015) and 81.7% (2050), maintaining the
country’s generating matrix profile relatively stable (it loses prominency to wind onshore,
especially as of 2045).
In Uruguay, generation from large hydro (including Salto Grande) is responsible for
63.3% (2015) and 38.3% (2050), being replaced by wind onshore, coal and biomass (in
addition to wind offshore, from 2049 on). Finally, the generation of Venezuela is
progressively replaced by large hydro, which surpasses 50% of the total generation as
early as 2035. This hydro generation largely replaces generation from the NGOC.
In general, Mercosur’s installed capacity increases by 120.0% between 2015 (209.1 GW)
and 2050 (460.0 GW). The generation of Mercosur, in turn, increases 107.8% between
2015 (911.7 GW) and 2050 (1,894.3 GW).
Figure 23 shows the evolution of Mercosur’s installed capacity by country in the period
2015-2050, in TWh. It can be seen that it falls in relation to the installed capacity of South
America (SA), from 80.1% to 73.5%.

204
Figure 23. Evolution of RIS installed capacity (GW), by country (2015-2050)
Source: Own elaboration.
With the expansion of RIS installed capacity, an accumulated fall of 50.6% of the
transactions through the TL between 2015 (43.2 TWh) and 2050 (21.3 TWh) is observed,
leading to a fall in the capacity factor of TL between 2015 (4.7%) and 2050 (1.1%). This
was due to the drop in transmission of energy from Paraguay to Brazil (by Itaipu). These
results together confirm that making plans to expand installed capacity in the countries in
a disjointed and disintegrated way leads not only to the need of greater investments in
new plants, but also to the greater idleness of existing plants and TLs.
In the installed capacity shown by the weak integration scenario (WIS), similar to RIS,
Brazil also stands out. Between 2015 and 2050, Argentina’s installed capacity ranges
from 33.1 GW (15.8%) to 94.9 GW (20.4%); of Bolivia, it goes from 2.1 GW (1.0%) to
20.3 GW (4.4%); in Brazil, from 130.1 GW (62.2%) to 288.7 (62.0%); in Paraguay, from
8.8 GW (4.2%) to 12.0 GW (2.6%); in Uruguay, from 3.2 GW (1.5%) to 4.2 GW (0.9%);
finally, in Venezuela, installed capacity goes from 31.9 GW (15.3%) to 45.7 GW (9.8%).
The installed capacity of Argentina, Bolivia, Paraguay, Uruguay and Venezuela behaves
similarly to RIS, since there are no alternative measures for these countries in the WIS.
Table 27 shows the evolution of installed capacity (GW) and generation (TWh) for each
of the Mercosur countries in the period 2015-2050.

205
Table 27. Evolution of WIS installed capacity and generation, by country (2015-2050)
Countries Installed capacity (GW) Generation (TWh)
2015 2025 2035 2045 2050 2015 2025 2035 2045 2050
Ar 15.8% 14.6% 18.5% 19.4% 20.4% 14.3% 14.9% 15.5% 15.9% 16.1%
Bo 1.0% 1.4% 2.2% 3.9% 4.4% 0.9% 1.4% 2.1% 3.0% 3.7%
Br 62.2% 64.6% 63.3% 62.9% 62.0% 62.4% 63.7% 64.0% 64.2% 63.9%
Py 4.2% 3.8% 3.0% 2.4% 2.6% 6.3% 4.8% 4.1% 3.4% 3.4%
Uy 1.5% 1.6% 1.2% 1.0% 0.9% 1.1% 1.2% 1.0% 1.0% 0.9%
Ve 15.3% 13.9% 11.9% 10.3% 9.8% 14.9% 14.0% 13.3% 12.5% 12.0%
Mercosur 209.1 242.9 309.7 410.5 465.7 911.7 1,128.1 1,380.1 1,723.4 1,926.4
Source: Own elaboration.
In Brazil, the installed capacity of large hydro (including Belo Monte, Itaipu, Madeira
and Tapajós) stands out (although it is decreasing), as well as the installed capacity of
wind onshore, NGCC and biomass. As one of the alternative measures in the WIS is the
increased installed capacity of distributed PV in all 4 subsystems of the country, it can be
seen that it reaches 2.1 GW (1.2%) in 2030 and 8.8 GW (3.0%) in 2050. In terms of
generation, this value increases to 5.2 TWh (2030), 11.2 TWh (2040) and 20.3 TWh
(2050).
Another WIS alternative measure is the limit to expand large hydro in Brazil, which
means that the reduction of generation hits a record of -14.3 TWh (2044) when compared
to the generation of the same year in RIS. Finally, the last WIS particular measure
considers lower investment costs of biogas (from second generation) power plants. This
measure affects generation in Brazil (from 2041), reaching 5.7 GW (0.5% of total
generation) in 2050.
Thus, Brazil is the only country that undergoes significant changes when compared to
RIS, either in installed capacity or in generation. The drop in generation from large hydro
is offset by increased biogas, biomass and NGCC generation. Relatively to RIS, the
generation from biogas reaches 5.7 GW (2050); generation from biomass reaches 6.3 GW
(2030), 5.7 GW (2040) and 16.7 GW (2050); in the case of NGCC, the generation grows
13.0 GW (2030), 10.8 GW (2040) and 5.7 GW (2050). It can be seen that the three
alternative measures of the WIS led to greater diversification of Brazil’s power generation
mix (despite the greater increase in installed capacity) and total emissions.

206
Similar to RIS, Mercosur loses ground in South America both in terms of installed
capacity and generation, mainly due to Colombia’s growing weight in the regional energy
scenario. Again, as in RIS, extra-Mercosur countries are not considered in the scenarios
(only in MIS and WIS).
Therefore, regarding the nature of its alternative policies, WIS touches the: (i)
diversification of the power generation; and (ii) consideration of socio-environmental
vulnerability. However, in the face of a pessimistic scenario in terms of regional energy
integration, what is observed in the Mercosur region is an increase in installed capacity
of +3.7 GW (2040) and +5.7 GW (2050) and of generation of +33.7 TWh (2040) and
+32.1 TWh (2050).
In addition, we can see the fall in transactions by TL in 2045 (-1 TWh, -5.0%) and 2050
(-4.1 TWh, -19.4%), leading to the fall in the capacity factor of TLs between 2015 (4.7%)
and 2050 (0.9%). This was mainly due to the drop in energy transmission from Paraguay
to Argentina (by Yacyretá) and to Brazil (by Itaipu), as well as from Brazil to Uruguay
(TL Presidente Médice - San Carlos). These results together confirm what has been
systematically defended throughout the thesis, that is, scenarios of less integration are less
efficient from the point of view of investments in expanding regional installed capacity.
Drawing a comparison with sections 2.1. and 4.2, in this scenario of less energy
integration there would be greater interference when it comes to geography, in addition
to probably greater socio-environmental impacts.
Moreover, it also indicates higher investment and operational costs. The former as a
consequence of higher penetration of other renewables (non-hydro) technologies, such as
photovoltaic distributed, and the latter due to higher fuel spending, as the NGCC plants
become an important supply source (MOURA, 2017)253.
Regarding the moderate integration scenario (MIS), it is noteworthy that installed
capacity increases between 2015 (209.1 GW) and 2050 (455.7 GW). Despite this, the
total installed capacity of MIS is lower in 2050 than WIS (-10.0 GW). Table 28 shows
the evolution of installed capacity (GW) and generation (TWh) for each of the Mercosur
countries in the period 2015-2050.
253 Similar to what happened in the Alternative Trade SAMBA (ATS), scenario of little integration proposed
by MOURA (2017).

207
Table 28. Evolution of MIS installed capacity and generation, by country (2015-2050)
Countries Installed capacity (GW) Generation (TWh)
2015 2025 2035 2045 2050 2015 2025 2035 2045 2050
Ar 15.8% 14.2% 18.2% 20.1% 20.4% 14.3% 15.1% 14.5% 15.2% 15.5%
Bo 1.0% 1.9% 2.9% 3.5% 4.2% 0.9% 1.6% 2.4% 3.2% 3.9%
Br 62.2% 64.6% 60.9% 61.0% 61.0% 62.4% 62.8% 62.4% 62.8% 62.8%
Py 4.2% 3.9% 5.0% 3.8% 3.4% 6.3% 4.9% 6.1% 5.0% 4.6%
Uy 1.5% 1.6% 1.3% 1.0% 1.0% 1.1% 1.2% 1.1% 1.0% 0.9%
Ve 15.3% 13.8% 11.8% 10.5% 10.0% 14.9% 14.4% 13.6% 12.7% 12.2%
Mercosur 209.1 244.5 311.8 403.6 455.7 911.7 1,095.4 1,349.9 1,693.2 1,896.2
Source: Own elaboration.
In Argentina, the increase in installed capacity with the Garabí dam (1,152 MW, in 2016),
Panambí (1,038 MW, in 2016), Yacyretá - 1st expansion (465 MW, in 2023), Yacyretá -
2nd expansion (1,085 MW, in 2027), Yacyretá - Itacorá-Itatí (1,660 MW, in 2029) and
Corpus Christi (3,500 MW, in 2030), as well as NGOP (after 2032), is compensated by
the decrease in installed capacity of wind onshore (after 2027), NGCC (after 2022),
geothermal (between 2034-2043), coal (2040) and CSP (after 2046). In Bolivia, the
installed capacity of MIS compared to RIS over the period falls. Although there has been
a significant increase with the expansion and creation of new binational power plants,
especially in the 2020s and early 2030s, and a modest increase in installed coal capacity
(from 2040 onwards), it is offset by the sharp drop in installed wind capacity onshore
from 2035 and timid geothermal fall.
In Brazil, the drop in installed capacity relative to RIS is significant especially since 2035,
peaking in 2045 (-7.0 GW). In 2025, the strong increase in biomass and large hydro
installed capacity overturns the installed capacity of wind onshore and thermals that use
clean coal254. Paraguay’s installed capacity is an exception, given the expansion of
Yacyretá - Villa Hayes TL (300 MW in 2019), Yacyretá expansions (3,480 MW at the
end of 2029) and the start of the Corpus operation (3,500 MW, in 2030).
254 With carbon capture and storage (CCS).

208
Neither in Uruguay nor in Venezuela is there a significant change in the installed capacity
of the plants compared to RIS. This is strongly due to the fact that neither country is
involved in expansion projects in MIS.
Compared to WIS, Brazil’s installed capacity fell further in 2030 (-230 MW), 2040 (-8.7
GW) and 2050 (-10.5 GW), peaking in 2045 (-12.2 GW). This is due not only to Garabí-
Panambí dam (2,200 MW), but also to the fact that, unlike WIS, no ‘alternative measures’
are considered, which have led to the increase and diversification of installed capacity
and the Brazilian power generation.
In terms of generation in the MIS, it grew by 108.0% between 2015 (911.7 TWh) and
2050 (1,896.2 TWh), with the participation of the generation of Bolivia and Paraguay in
Mercosur. Although total generation relative to RIS falls to 2025, it grows up to 2050
(reaching maximum generation growth in 2041) due to new ventures particularly in
Bolivia. The fall of generation in Argentina and Brazil is compensated by Paraguay,
especially from 2035 on. Comparing the generation of the MIS with the one of the WIS,
it is perceived that it is much lower in 2050 (-30.2 TWh).
Thus, regarding the nature of its alternative policies, MIS considers the first three: (i)
diversification of the power generation mix; (ii) consideration of socio-environmental
vulnerability; and (iii) (bi)national projects that increase international transactions. Unlike
the WIS, increased integration between countries has led Mercosur to drop installed
capacity of -1.9 GW (2045) and -4.4 GW (2050) against RIS. Compared to WIS, installed
capacity fell -2.3 GW (2040), -7.0 GW (2045) and -10.0 GW (2050), while the generation
drop was -28.8 TWh (2030), -31.1 TWh (2040) and -30.2 TWh (2050).
In addition, the increase in international transactions compared to RIS was observed
through TL in 2030 (+10.8 TWh, + 34.1%), 2040 (+27.3 TWh, + 110.0%) and 2050
(+19.1 TWh, + 89.7%). This was mainly due to the increased transmission of energy from
Paraguay to Argentina (by Yacyretá) and, more timidly, from Paraguay to Brazil (by
Itaipu). Also noteworthy is the role played by the new TLs of Bolivia with Argentina,
Chile and Peru, which start operating from 2020 and correspond to about 7.3% of the total
transacted in all operation period. Again, these results confirm that more integration
scenarios are more efficient because they require less installed capacity. In MIS, Paraguay
owns special attention in terms of energy exports.

209
When it comes to the nature of its alternative policies, strong integration scenario (SIS)
touchs all of them: (i) diversification of the power generation mix; (ii) consideration of
socio-environmental vulnerability; (iii) (bi)national projects that increase international
transactions; and (iv) harmonization of regional regulatory frameworks. In this way,
installed capacity increases between 2015 (209.1 GW) and 2050 (453.7 GW), although
to a lesser extent when compared to RIS.
Table 29 shows the evolution of installed capacity (GW) and generation (TWh) for each
of the MERCOSUR countries in the period 2015-2050.
Table 29. Evolution of SIS installed capacity and generation, by country (2015-2050)
Countries Installed capacity (GW) Generation (TWh)
2015 2025 2035 2045 2050 2015 2025 2035 2045 2050
Ar 33.1 34.1 57.8 81.5 93.5 130.5 164.8 196.4 258.6 294.5
Bo 2.1 4.3 9.4 14.1 18.9 8.3 16.6 32.0 54.9 74.0
Br 130.1 157.9 188.2 243.9 275.6 568.9 688.6 840.2 1060.7 1189.7
Py 8.8 9.6 15.5 15.5 15.5 57.8 54.3 82.1 84.5 87.8
Uy 3.2 3.8 3.9 4.2 4.5 10.1 12.4 14.4 16.6 17.2
Ve 31.9 33.8 36.8 42.4 45.7 136.2 157.9 183.3 215.7 231.6
Mercosur 209.1 243.6 311.6 401.6 453.7 911.7 1,094.6 1,348.5 1,690.9 1,894.9
Source: Own elaboration.
Unlike WIS, increased integration between countries255 allows Mercosur to have a drop
in installed capacity expansion of -3.8 GW (2045) and -6.3 GW (2050) compared to RIS.
Compared to WIS, the installed capacity fell -8.9 GW (2045) and -12.0 GW (2050), while
the generation drop was -28.8 TWh (2030), -30.3 TWh (2040) and -33.8 TWh (2050).
Compared to MIS, the installed capacity fell by -1.4 GW (2040), -1.9 GW (2045) and -
2.0 GW (2050), while the generation drop was -210 GWh (2030), -2.0 TWh (2040) and -
2.2 TWh (2045).
In this way, and after presenting the results of all scenarios, the following tables and
figures will provide a comparative analysis of total installed capacity (GW) and total
255 South America as a whole, because in the SIS it is considered more than just the Mercosur countries.

210
(TWh) and technology generation, as well as electricity exchanges between countries
(TWh)256, share of international transmission lines in total generation (%), and total
emissions (MtCO2e). Table 30 below summarizes a comparative analysis between
installed (GW) and generation (TWh) capacities of the four scenarios discussed.
Table 30. Comparative installed capacity and generation, by scenario (2015-2050)
Scenarios Installed capacity (GW) Generation (TWh)
2015 2025 2035 2045 2050 2015 2025 2035 2045 2050
RIS 209.1 244.2 307.5 405.4 460.0 911.7 1,094.4 1,347.0 1,691.9 1,894.3
WIS 209.1 242.9 309.7 410.5 465.7 911.7 1,131.8 1,385.2 1,727.9 1,933.7
MIS 209.1 244.5 311.8 403.6 455.7 911.7 1,095.4 1,349.9 1,693.2 1,896.2
SIS 209.1 243.6 311.6 401.6 453.7 911.7 1,094.6 1,348.5 1,690.9 1,894.9
Source: Own elaboration.
Figure 24 shows the graphical evolution of installed capacity (GW) for each alternative
scenarios (WIS, MIS and SIS) relative to RIS; thus, each curve indicates the difference
of the values of the scenarios analyzed against RIS. It is clear the direct relationship
between greater integration and reduction of the need to increase regional installed
capacity, as highlighted in section 2.3. Against the trend of MIS and SIS, there is an
increasing trend in WIS installed capacity.
256 It is important not to use the term ‘trade’ in this type of exchange, due to the peculiarities of of energy
exchanges already highlighted.

211
Figure 24. Comparative evolution of net installed capacity related to RIS, by scenario,
in GW (2015-2050)
Source: Own elaboration.
Table 31 shows the installed capacity of Mercosur (GW) for each of the scenarios
detailed by technology. Note the large and decreasing participation of large hydro, as well
as the decrease of the participation of nuclear, diesel and fuel oil. On the other hand,
NGCC, coal, CSP and wind onshore gain traction in the regional energy matrix.

212
Table 31. Installed capacity of alternative scenarios, by technology, in GW (2015-2050)
Technology
Installed capacity (GW)
2015
2050
RIS WIS MIS SIS
Biogas 0.0% 0.0% 1.9% 0.0% 0.0%
Biomass* 4.8% 5.4% 5.9% 5.4% 5.5%
NGCC 6.2% 8.4% 8.6% 7.2% 6.8%
Clean coal 0.0% 0.0% 0.0% 0.0% 0.0%
Coal 1.8% 7.7% 7.2% 7.4% 7.6%
CSP 0.0% 4.4% 4.2% 3.8% 3.8%
Geothermal 0.0% 0.9% 0.9% 0.7% 0.7%
Diesel and fuel oil 7.5% 2.2% 1.5% 2.2% 2.0%
Nuclear 2.4% 0.3% 0.3% 0.3% 0.3%
NGOC 12.0% 4.9% 4.7% 5.8% 5.9%
PV 0.0% 0.1% 0.1% 0.1% 0.1%
Distributed PV 0.0% 0.0% 1.9% 0.0% 0.0%
Large hydro 64.8% 38.6% 36.0% 43.0% 43.2%
Small hydro 2.8% 2.1% 2.2% 2.2% 2.2%
Wind offshore 0.0% 0.0% 0.0% 0.1% 0.1%
Wind onshore 1.6% 24.7% 24.5% 21.8% 21.8%
Total 209.1 460.0 465.7 455.7 453.7
Source: own elaboration; * incineration.
It is worth noting the strong fall in the share of nuclear energy in Argentina and Brazil,
which leads us to question the approval of nuclear projects in the two countries, either
because of their real competitiveness or because of (geo)political decisions. In addition,
the participation of coal (increase) and clean coal (decrease) is highlighted, which leads
to the need to discuss the urgency to promote carbon-pricing instruments (carbon tax,
cap-and-trade or mechanisms hybrids) in the region, which would favor generation from
less carbon-intensive technologies.
Figure 25 does the same analysis of Figure 24, but based on the evolution of Mercosur
generation (TWh). Again, the previous argument is ratified as it considerably increases
the generation in WIS.

213
Figure 25. Comparative evolution of net generation related to RIS, by scenario, in TWh
(2015-2050)
Source: Own elaboration.
Analogously to Table 31, Table 32 shows the generation in Mercosur (TWh) for each of
the scenarios detailed by technology. Note the constant participation of bagasse
incineration plants. It is also noticed that despite the expansion and construction of
hydroelectric plants, the participation of large hydro falls significantly in all scenarios.

214
Table 32. Generation from alternative scenarios, by technology, in GW (2015-2050)
Technology
Generation (TWh)
2015 2050
RIS WIS MIS SIS RIS
Biogas 0.0% 0.0% 0.3% 0.0% 0.0%
Biomass* 4.8% 7.5% 8.2% 7.6% 7.7%
NGCC 7.8% 7.6% 7.8% 6.5% 6.1%
Clean coal 0.0% 0.0% 0.0% 0.0% 0.0%
Coal 1.6% 9.1% 8.8% 8.7% 9.1%
CSP 0.0% 3.7% 3.6% 3.2% 3.2%
Geothermal 0.1% 1.6% 1.6% 1.1% 1.1%
Diesel and fuel oil 2.8% 0.1% 0.1% 0.1% 0.1%
Nuclear 2.4% 0.5% 0.5% 0.5% 0.5%
NGOC 6.3% 2.8% 2.7% 3.3% 3.3%
PV 0.0% 0.0% 0.0% 0.0% 0.0%
Distributed PV 0.0% 0.0% 1.1% 0.0% 0.0%
Large hydro 76.9% 45.6% 44.5% 49.8% 49.8%
Small hydro 2.5% 2.7% 2.8% 2.7% 2.7%
Wind offshore 0.0% 0.0% 0.0% 0.1% 0.1%
Wind onshore 1.2% 18.4% 18.1% 16.3% 16.3%
Total 911.7 1894.3 1926.4 1896.2 1894.9
Source: own elaboration; * incineration.
In addition, there is an increase in international transactions with respect to RIS through
TL in 2030 (+11.4 TWh, +36.1%), 2040 (+27.3 TWh, +110.2%) and 2050 (+20.5 TWh,
+ 96.2%). This was mainly due to the increase in the energy transmission from Bolivia to
Brazil, through Cachuela Esperanza (since 2030). However, the SINEA Project, despite
its difficulties, has a marginal contribution to the installed capacity of South America
(1.2% in 2050).
Table 33 shows the electricity exchanges in SIS between South American countries in
2050. Compared to Table 4 (Chapter 3), it is possible to perceive not only the
quantitative increase in energy exchange between countries, but also the new
interconnections that operate in South America as a whole.

215
Table 33. Electricity exchanges in SIS between countries, in TWh (2050)
Country
Electricity exports (TWh)
Ar Bo Br Cl Co Ec Pe Py Uy Ve Total
imports
%
imports
Ele
ctri
city
im
po
rts
(TW
h)
Ar - 0,0 0,0 0,0 0,0 0,0 0,0 20,7 0,0 0,0 20,7 49,4%
Bo 0,0 - 0,0 0,0 0,0 0,0 0,0 0,0 0,0 0,0 0,0 0,0%
Br 0,6 2,0 - 0,0 0,0 0,0 1,4 13,5 0,2 0,1 17,9 42,7%
Cl 0,3 0,1 0,0 - 0,0 0,0 0,0 0,0 0,0 0,0 0,4 0,9%
Co 0,0 0,0 0,0 0,0 - 0,1 0,0 0,0 0,0 0,1 0,2 0,6%
Ec 0,0 0,0 0,0 0,0 0,1 - 0,0 0,0 0,0 0,0 0,2 0,4%
Pe 0,0 0,5 0,0 0,0 0,0 0,0 - 0,0 0,0 0,0 0,5 1,3%
Py 0,0 0,0 0,0 0,0 0,0 0,0 0,0 - 0,0 0,0 0,0 0,0%
Uy 0,9 0,0 0,9 0,0 0,0 0,0 0,0 0,0 - 0,0 1,9 4,4%
Ve 0,0 0,0 0,0 0,0 0,1 0,0 0,0 0,0 0,0 - 0,1 0,2%
Total
exports 1,8 2,6 0,9 0,0 0,2 0,2 1,5 34,2 0,2 0,2
41,8 100,0%
%
exports 4,4% 6,2% 2,3% 0,0% 0,6% 0,4% 3,5% 81,7% 0,4% 0,6% 100,0%
Source: own elaboration.
This is evident from Figure 34, which shows both the evolution of the electricity
exchanges (TWh) and the evolution of its capacity factor (%) for South American
countries. Despite having installed capacity expansion in most countries in the region,
transmission through international interconnections in MIS and SIS is increasing,
especially in 2035 and 2045. On the other hand, in the case of WIS, this figure falls
sharply from 43.2TWh (2015) to 17.2 TWh (2050). In spite of an increase in transactions
in TWh, the capacity factor of LTs falls in all scenarios.

216
Table 34. Electricity exchanges in SIS between countries, in TWh (2050)
Scenarios Transmission (TWh) TL capacity factor (%)
2015 2025 2035 2045 2050 2015 2025 2035 2045 2050
RIS 43,2 32,4 28,2 20,5 21,3 4,7% 3,0% 2,1% 1,2% 1,1%
WIS 43,2 34,5 29,2 19,5 17,2 4,7% 3,1% 2,1% 1,1% 0,9%
MIS 43,2 36,6 55,9 46,5 40,4 4,7% 3,3% 4,1% 2,7% 2,1%
SIS 43,2 36,2 56,6 47,6 41,8 4,7% 3,3% 4,2% 2,8% 2,2%
Source: Own elaboration.
Figure 26 shows the evolution of electricity exchanges (TWh) for the period 2015-2050
compared to the RIS. Again, the fall in WIS relative to MIS and SIS stands out.
Figure 26. Comparative evolution of net electricity exchanges related to RIS, by
scenario (2015-2050)
Source: Own elaboration.
With regard to emissions, Figure 27 shows that there is a significant fall in MIS and SIS
compared to RIS. This is due to the substitution of new thermal power generation for
more intensive use of current installed capacity (expansion and new hydroelectric plants,
increase of capacity factor of international interconnections, and advancement of
renewables sources). Thus, in line with both the discussion in subsection 2.1.2 and section

217
5.1, energy integration in Mercosur (and South America as a whole) can (and should)
consider the diversification of power generation mix and the limitation of generation
from non-renewable energies in order to unlock new sustainable growth opportunities and
to improve the resilience of energy systems (WEC, 2017).
Figure 27. Comparative evolution of net emissions related to RIS, by scenario, in
MtCO2e (2015-2050)
Source: Own elaboration.
Therefore, it is possible to notice that the change of installed capacity and generation with
the initiatives in the different scenarios is quantitative and mainly qualitative. In terms of
installed capacity, the change in RIS in 2050 is +5.7 GW (WIS), -4.4 GW (MIS) and -6.3
GW (SIS). Regarding generation, the change in RIS in 2050 is +32.1 GW (WIS), +1.9
GW (MIS) and +0.6 GW (SIS) is lower, since there are no extra assumptions about the
demand behavior between the scenarios; in fact, maintaining demand on smaller installed
capacity impacts capacity factor of existing plants and TLs.

218
6. Conclusions and recommendations
This thesis questions and challenges many issues and concepts assumed as true by the
specialized literature, which, consequently, have impacts on the different decisions of
policy makers. For this reason, it was necessary to carry out an extensive literature review
to understand how the concept of energy security results abstract and vague (in the sense
that it fits almost everything) and often ends up as instrument for specific and
disconnected purposes. The idea is not to eliminate the concept nor to disregard its
relevance, but to show its limitations and changes over the last decades. Therefore, the
thesis proposes the concept of regional energy security, which incorporates more than one
country in the analysis and, to achieve it in the context of South America (and Mercosur
in particular), an essential tool is the regional energy integration.
In turn, regional integration is often divided into categories, such as
economic/commercial, political and physical. Although this may make sense from a
pedagogical and analytical point of view, we concluded that this has a very negative
impact on the theory and practice of regional integration. This happens because energy
integration, the cornerstone of this thesis, is often associated with physical integration,
creating the illusion that it is therefore only a technical discussion. This subdivision into
categories hides the interdisciplinary, transversal, dynamic and particular features of each
experience, hindering dialogue beteen contributions from Economics, Politics,
International Relations, Law, History and Geography, for instance.
When it specifically comes to energy integration, we conclude that the concept of
integration, which is already used indiscriminately, becomes even more confusing. This
is because (i) integration is not synonymous of neither trade nor cooperation; and (ii) in
the energy world, there is a recent discussion of the integration of non-conventional
renewable energy (NCRE). Thus, the discussion of energy integration becomes more
heterogeneous and, therefore, less precise.
Another conclusion is that there is an extra blur when evaluating Mercosur, since there is
no pattern for the countries analyzed: some studies only assess its original formation
(Argentina, Brazil, Paraguay and Uruguay), others incorporate Chile, sometimes

219
Venezuela or even Bolivia. In general, the official formation of the bloc is not respected,
what makes it even more difficult to understand the literature.
It has also been argued that studies of comparative regionalism are very common in the
regional integration literature. While this may be interesting and positive, if it is not done
with caution and care, the naive notion that there is an appropriate (single) path to follow
would be reinforced, whether from the European (MIBEL and Nordpool), Asian
(ASEAN) or Central America (SIEPAC) experiences as the only ways to be pursued by
our regional energy initiatives. Therefore, we concluded that there are no one-size-fits-all
solutions when it comes to regional integration, mainly when coping with energy
integration.
From the existence of different benefits and barriers to energy integration in Mercosur,
we established that it would be necessary to deal with issues of commercial, operational
and institutional natures. Events such as nationalization of assets (Bolivia and
Venezuela), interruption of contracted energy supply (Argentina to Chile, and Venezuela
to Roraima, and Petrocaribe) and request for renegotiation of the agreement signed
(Paraguay for Brazil, in the case of Itaipu) created a bad and pessimistic history for the
advancement of the process. In addition, the relative abundance of energy resources of
the countries of the region does not push for integration, leading to (i) sub-optimal
exploitation of these resources; (ii) overestimation of the need for investments; and (iii)
underutilization of existing facilities and opportunities.
Brazil is often given the essential role in regional energy integration due to its expertise
with SIN, since it borders ten countries in South America (except Chile and Ecuador) and
because of its territorial extension. However, we established that Argentina and Bolivia
have a central role in promoting regional energy integration. The fact that they have
borders with five countries each, water resources in abundance, and large-scale
conventional and non-conventional reserves places them in a strategic position in
promoting regional (physical) energy integration. Peru also plays a significant role,
particularly due to its borders with four countries in the region and an enormous
hydroelectric potential available.
Although it is common in the literature, we should avoid proposals centered only on
Brazil, using its neighbor countries as ‘annexes’ to supply its needs. Regional energy
integration planning should be joint and participatory, taking into account the needs of

220
the different countries involved in the process. On the other hand, the recent fact that
Brazil does not have substantial threats to guarantee its energy supply, the discovery of
the pre-salt, the economic viability of new energy sources and the reduction of national
demand itself may help distort the trust other countries have placed in Brazil. In this way,
the current moment is an ideal opportunity for Brazil to return to this regional agenda,
although the conjunctural uncertainties make it difficult and delay this movement.
In general, it was possible to conclude that regional energy integration projects have been
at the mercy of three main variables: (i) the famous (and old) dichotomy between
government policy and State policy, which affects the support of certain interests in time
(even by the lack of a solid project); (ii) the macroeconomic (inter)national context, which
affects investment levels and priority agendas of these countries; and (iii) the asymmetric
weight that projects play for the different countries involved, which affects the
commitment and interest in making them regional realities. In addition, it was concluded
that the institutional, regulatory and resource endowments structure between these
countries is extremely diverse and, once again, asymmetric.
It was also established that a peculiar characteristic of Mercosur regional integration (and
South American in a broader way) is the so-called presidential diplomacy, in which there
is protagonist action of the heads of State in the definition of the objectives, principles
and foundations. In this way, the progress of the process ends up being dependent (and
vulnerable) to the domestic political situation/ideology of the countries of the region,
making a sustainable long-term project impossible.
It was also showed the relative loss of participation of regional financing mechanisms,
such as the IDB, CAF, FONPLATA, FOCEM and BNDES, in favor of China. From a
geopolitical and geo-strategic point of view, this movement demands a prompt response
from the countries of the region, either by the restoration of regional autonomy or by
those who historically seek to represent regional leadership, as in the case of Brazil.
Added to this, in practice the normative effort of Mercosur and UNASUR was not able
to overcome political, technical, economic and regulatory barriers that prevent the
advance of energy integration in Mercosur countries. Due to the intergovernmental nature
of both Mercosur and UNASUR, both institutions end up presenting limitations to their
performance. Besides, SGT-9 did not act to structure and coordinate concrete policies or
projects on regional energy integration.

221
Although Mercosur, through FOCEM, and UNASUR, through UNASUR-COSIPLAN,
provide funds for projects in regional infrastructure, energy projects carried out by both
institutions (i) are spatially concentrated in certain regions; (ii) are few (if compared to
the total available value); and (iii) have been falling over time. As an adverse result, the
region is experiencing not only the growth of Chinese influence, but the emergence of the
Pacific Alliance (Colombia, Chile, Mexico and Peru), which sought to replicate this
energy agenda on a more modest scale, seeking a true convergence of views between the
countries involved. Moreover, the South American Energy Treaty seems very ambitious
and therefore hard to move forward.
Thus, Mercosur’s profile for the energy agenda has hitherto been based on simple bilateral
energy trade agreements, energy interconnections for convenience and, at most,
international (again binational) hydroelectric and/or gas pipelines, such as Itaipu,
Yacyretá, Salto Grande and GASBOL. Ultimately, we concluded that there is no energy
integration to date that (i) considers joint regional energy planning; (ii) is concerned with
the harmonization of regulatory frameworks; and (iii) brings together producers,
distributors and regional consumers in an integrated and participatory way.
When it comes to the current scenario, regional energy integration should be (re)thought
considering renewable energies, given the wind, solar and hydro potential of the region.
More than punctually integrated in an ad hoc manner, it should be optimized taking into
account the complementarity of intermittent renewable sources, rainfall regimes and
consumption (given the seasonality of demand, with tradeoff between use of air
conditioning and heaters in the region). Therefore, we concluded that energy integration
would be an alternative to the expansion of national networks, ensuring (i) the reduction
of idle assets; (ii) less interference with geography and the environment; and,
consequently, (iii) lower socio-environmental impact.
Considering the evolution of the SEES index for the period under analysis (1990-2010),
it falls 8.9%. This suggests that the absence of joint planning and policies among
Mercosur countries did not contribute to the improvement of the index, given the selected
indicators.
Its is expected that the SEES index guides policy recommendations based on an indicator-
based approach. By doing so, we can ensure a more holistic, intersectoral and appropriate

222
approach to the subject. Thus, we established that the SEES index is completely in line
with sustainable development and climate change considering a regional logic.
After evaluating the policies of the past until the present, the OSeMOSYS-SAMBA
model was used to simulate scenarios of power sector integration in the region. As in the
construction of the SEES index, the challenge was to deal with the lack of data and energy
expansion plans in some countries. Undoubtedly, it will require political will and
‘diplomatic engineering’ to carry out the measures of each scenario in the face of such
adverse political-economic context.
The modeling exercise ratified the argument that greater electricity integration in
Mercosur (and in South America as a whole) leads to a reduction in the need to increase
installed capacity, as well as to lower geographic and socio-environmental impacts.
As seen, oil and natural gas play little role in modeled regional energy integration
modeled. Oil is an international commodity, so it is difficult to provide regional
contractual arrangements based on oil, either for priority sales or supply guarantee, when
it is a type of energy whose price is defined internationally. With regard to natural gas,
investment in physical pipeline infrastructure requires large amounts of capital, as well
as specific, dedicated assets, having a sunk cost nature; like oil, LNG facilitates access to
natural gas without necessarily needing pipeline networks. Both reasons do justify the
relative loss of Venezuela’s role in regional energy integration.
As a general challenge, the current context in which the Mercosur countries find
themselves is characterized by stagnation and economic recession.
For the time being, the political context does not favor large long-term initiatives, since
there is no convergence of strategic agendas between Mercosur countries. In addition,
there is no short-term energy demand in Brazil that motivates investments in new power
generation sources. The focus lies on Brazil, since both Eletrobras and BNDES have been
key players in the elaboration and financing of regional energy projects. However,
discussions about the privatization of Eletrobras is currently advancing and BNDES has
recently reduced its disbursements. Once again, the events add uncertainty and insecurity
to the scenario of regional energy integration.
Therefore, we need to take into account new actors and agendas, such as social,
environmental, political-diplomatic, public opinion, human rights, local communities and

223
organized civil society, in general, in the definition, implementation and realization of
different international interconnection projects, as well as the construction of the new
national, binational and/or multilateral plants. Energy, then, must be understood as a
factor of socioeconomic development and, therefore, should aim at (i) promoting
economic growth; (ii) universal access to safe, renewable and cheap energy; and (iii) to
improve the quality of life, respecting environmental limits. In this sense, State plays a
key role in conducting this process, so that it does not prioritize particular and/or exclusive
objectives of big business owners, political lobbies and contractors. Private sector is also
welcome to provide state-of-the-art projects and technologies and reducing financial
burden on government budgets, alone or through public-private partnership (PPP).
Concerning the limitations of the study, it is particularly important to note the difficulty
of finding some official national data and the energy modeling itself. One of them
concerns the formulation of SEES index, particularly the relative weight of countries and
indicators. In order to avoid overweighing one dimension against another, equal weight
was given to all indicators in each of the three dimensions. The same happened with the
weight of the countries analyzed, despite the existent asymmetry between them. For
future work, the relative weight of each indicator/country should be detailed validated on
a case-by-case basis.
Besides, a future challenge would be to expand the analysis of power sector integration
towards other energy sources as oil and natural gas, and to other key demand sectors, as
transportation. Although they were not the focus of the current analysis, these points
deserve to be discussed in the near future.
Another limitation of this thesis, particularly regarding the integration scenarios analysis,
is their vulnerability to the political-ideological and economic context of the countries of
the region. As shown, the regional integration trend has been influenced by these issues
for decades, which compromises the viability of the results presented in section 5.2.
Due to a series of assumptions, the intertemporal analysis may not consider eventual
conjunctural changes in the region. As an example, the possible advance of carbon pricing
instruments is not considered (for instance carbon tax, cap-and-trade or hybrid
mechanisms), which would favor the generation from less carbon-intensive technologies.
It is well known that some countries, such as Brazil, are analyzing implementation via

224
Partnership for Market Readiness (PMR), which will eventually influence future
modeling results.
As recommendations for future work, we suggest updating the SEES index , especially
because its results are very sensitive to the lack of data from some of the countries,
englobing any of the selected indicators. In addition, it is suggested that it incorporates
costs into the social dimension, as well as appropriate weights for each of the indicators
considered.
Regarding the scenarios of the OSeMOSYS-SAMBA model, Guyana, French Guiana and
Suriname should be also incorporated into the model in order to evaluate potential impacts
of Arco Norte project on regional energy integration. Besides, it should incorporate other
energy sources such as oil and natural gas, as well as key demand sectors like
transportation.
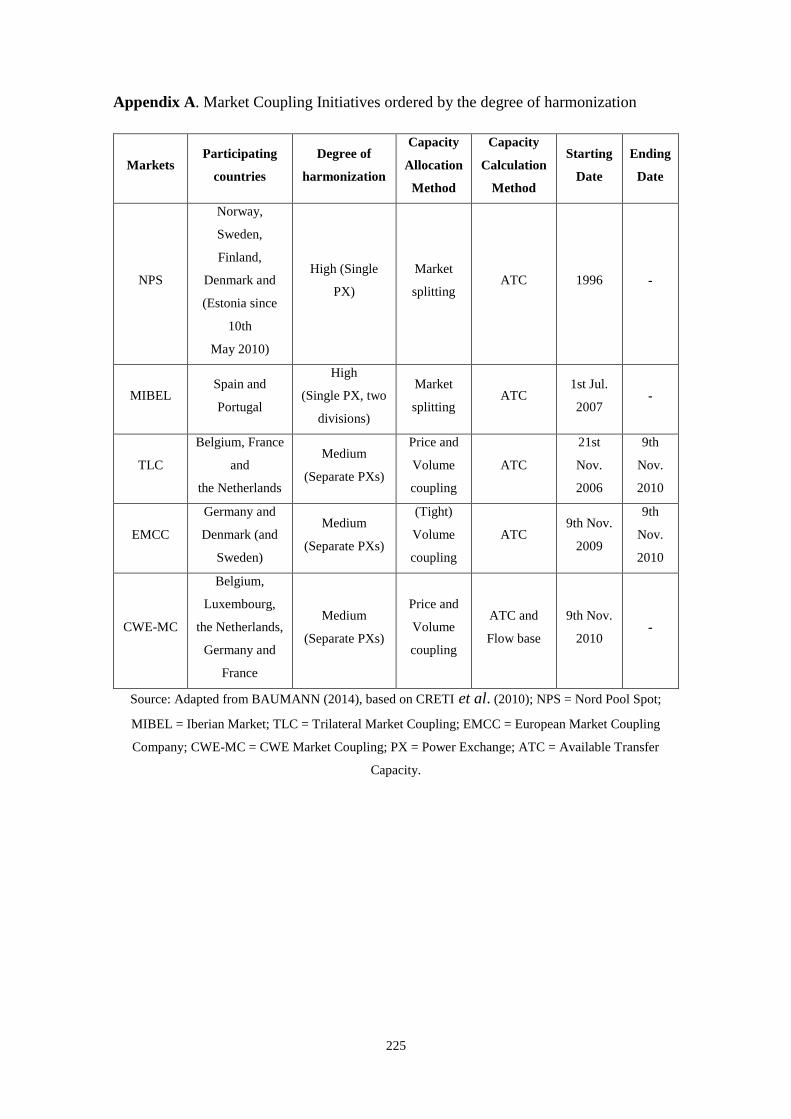
225
Appendix A. Market Coupling Initiatives ordered by the degree of harmonization
Markets Participating
countries
Degree of
harmonization
Capacity
Allocation
Method
Capacity
Calculation
Method
Starting
Date
Ending
Date
NPS
Norway,
Sweden,
Finland,
Denmark and
(Estonia since
10th
May 2010)
High (Single
PX)
Market
splitting ATC 1996 -
MIBEL Spain and
Portugal
High
(Single PX, two
divisions)
Market
splitting ATC
1st Jul.
2007 -
TLC
Belgium, France
and
the Netherlands
Medium
(Separate PXs)
Price and
Volume
coupling
ATC
21st
Nov.
2006
9th
Nov.
2010
EMCC
Germany and
Denmark (and
Sweden)
Medium
(Separate PXs)
(Tight)
Volume
coupling
ATC 9th Nov.
2009
9th
Nov.
2010
CWE-MC
Belgium,
Luxembourg,
the Netherlands,
Germany and
France
Medium
(Separate PXs)
Price and
Volume
coupling
ATC and
Flow base
9th Nov.
2010 -
Source: Adapted from BAUMANN (2014), based on CRETI et al. (2010); NPS = Nord Pool Spot;
MIBEL = Iberian Market; TLC = Trilateral Market Coupling; EMCC = European Market Coupling
Company; CWE-MC = CWE Market Coupling; PX = Power Exchange; ATC = Available Transfer
Capacity.

226
Appendix B. International interconnections in SIEPAC
Ref. Region /
Countries Place
Tension
(kV)
Installed
capacity (MW) Status
1 SIEPAC Sistema de Transmisión Regional (a) 230 300 Oper.
2 Gt-Mx S.E. Brillantes (GT) – S.E. Tapachula
(MX) (b) 400-230 200 Oper.
3 Co-Pa Cerromatoso (CO) – Panamá (PA) (c) - 400 Stud.
Source: CIER (2017b); (a) 1.800 km: 283 km in Guatemala, 286 km in El Salvador, 275 km in Honduras,
307 km in Nicaragua, 499 km in Costa Rica and 150 km in Panamá; (b) 101 km: 71 km in Guatemala and
30 km in Mexico; (c) 500 km: 220 km in Panamá, 130 km submarine, and 150 km in Colombia.

227
Appendix C. The GASBOL pipeline
Source: Adapted from Gasnet.

228
Appendix D. The Arco Norte Project and proposed interconnection
Source: LARREA et al. (2017).

229
Appendix E. The SINEA Project and proposed interconnection
Source: OLADE (2016)

230
Appendix F. Structure of the South American Energy Treaty
Part I Initial
Provisions
Fundamental principles and commitments
Definitions
Goals
Specific protocols
Scope
Part II
Frameworks
for Energy
Integration
Chapter I: Energy Infrastructure
Chapter II: Regulatory Frameworks
Chapter III: Energy Security
Chapter IV: Energy Exchanges
Chapter V: Cooperation Mechanisms
Chapter VI: Environmental Aspects
Chapter VII: Investments
Part III Institutional
Provisions
Chapter I: The South American Energy Council
Chapter II: Other institutional aspects
Definitions of Additional Protocols of regional scope and partial scope
Incorporation and deposit of the Additional Protocols
Relationship between the Treaty and the Additional Protocols
Parte V Dispute Resolution Mechanisms
Part VI General
disposition
Relationship between this Treaty and other Regional and Bilateral International Agreements
Transparency
Part VII: Final Provisions
Source: Own elaboration based on AAS (2016).

231
Appendix G. National and international input data
National data come from: Argentina (MPF, 2013; CNEA, 2015a; CNEA, 2015b;
CAMMESA, 2015a; CAMMESA, 2015b), Bolivia (AE, 2012a; AE, 2012b; AE, 2013;
MHE, 2014), Brazil (EPE, 2012; EPE, 2013; EPE, 2014a; EPE, 2014b; EPE, 2015a; EPE,
2015b; ONS, 2014; ONS, 2015a; MME, 2006; MME, 2014), Chile (CDEC SING, 2012;
CDEC SIC, 2013; MEN, 2014; MEN, 2015); Colombia (MME, 2011b; UPME, 2013;
SIEL, 2015); Ecuador (MEER, 2012; CONELEC, 2013; ARCONEL, 2014a;
ARCONEL, 2014b); Guyana (GPL, 2012); Paraguay (ANDE, 2015; VMME, 2014;
VMME, 2015); Peru (MEM, 2014; COES SINAC, 2013; COES SINAC, 2015); Uruguay
(DNE, 2013; ADME, 2015a; ADME, 2015b) and Venezuela (CNG, 2008; MPPEE,
2013a; MPPEE, 2013b; MPPEE, 2014; CORPOELEC, 2015).
Regional data come from Síntesis Informativa Energética de los países de la CIER 2013
(CIER, 2013), Panorama General del Sector Eléctrico en América Latina y Caribe
(OLADE, 2012), Apuntes Sobre la Integración Elétrica Regional y Propuestas para
Avanzar (OLADE, 2013), Potencial de Recursos Energéticos y Minerales em América
del Sur (UNASUR, 2013) and Agenda de Proyectos Prioritarios de Integración (IIRSA,
2015).
International data come from: WEO 2014 (IEA WEO, 2014), Energy Technologies
Perspectives (ETP) (IEA WEO, 2012; IEA WEO, 2014; IEA WEO, 2015), ETSAP
Technology Brief (IEA ETSAP, 2010a; IEA ETSAP, 2010b; IEA ETSAP, 2010c; IEA
ETSAP, 2010d; IEA ETSAP, 2010e; IEA ETSAP, 2013a; IEA ETSAP, 2013b; IEA
ETSAP, 2014), World Energy Perspective Cost of Energy Technologies (WEC, 2013)
and World Bank (Word Bank, 2015). US EPA (2014), USGS (2006), US EIA (2015), US
EPA (2014), WB Database, CEPALstat and UNdata.
The life span of each technology modeled in accordance with the Energy Technology
Systems Analysis Program (ETSAP) Technology Brief reports (IEA ETSAP, 2010a; IEA
ETSAP, 2010b; IEA ETSAP, 2010c; IEA ETSAP, 2010d; IEA ETSAP, 2010e; IEA
ETSAP, 2013a; IEA ETSAP, 2013b; IEA ETSAP, 2014). For fossil fuel technologies,
the thermal efficiency and its corresponding future improvements were obtained from the

232
Energy Technologies Perspectives report (IEA ETP, 2012; IEA ETP, 2014; IEA ETP,
2015).
The capital costs of each technology were identified from Energy Technologies
Perspectives reports (IEA ETP, 2012; IEA ETP, 2014; IEA ETP, 2015) and World Energy
Perspectives report (WEC, 2013). Capital costs of transmission lines were obtained from
OLADE (2013) and IEA ETSAP (2014). Investment costs were estimated using the
capital cost and a discount rate of 8% during the time period required to build each power
project. The fixed and variable costs were obtained from (WEC, 2013) and (IEA ETSAP,
2010a; IEA ETSAP, 2010b; IEA ETSAP, 2010c; IEA ETSAP, 2010d; IEA ETSAP,
2010e; IEA ETSAP, 2013a; IEA ETSAP, 2013b; IEA ETSAP, 2014). For strategic hydro
projects, the lowest cost available in literature for large hydro was considered. Finally,
capital cost reductions over time were applied for each technology according to IEA ETP
(2012), IEA ETP (2014) and IEA ETP (2015)257.
257 Except for the data in Table 24, it is important to highlight that the key assumptions of the RIS scenario
are the same as those of the RTS scenario presented in MOURA (2017). This is justified by the fact that
both models are based on the analysis of the energy integration of (of part) South America countries,
assuming 2013 as a base-year.
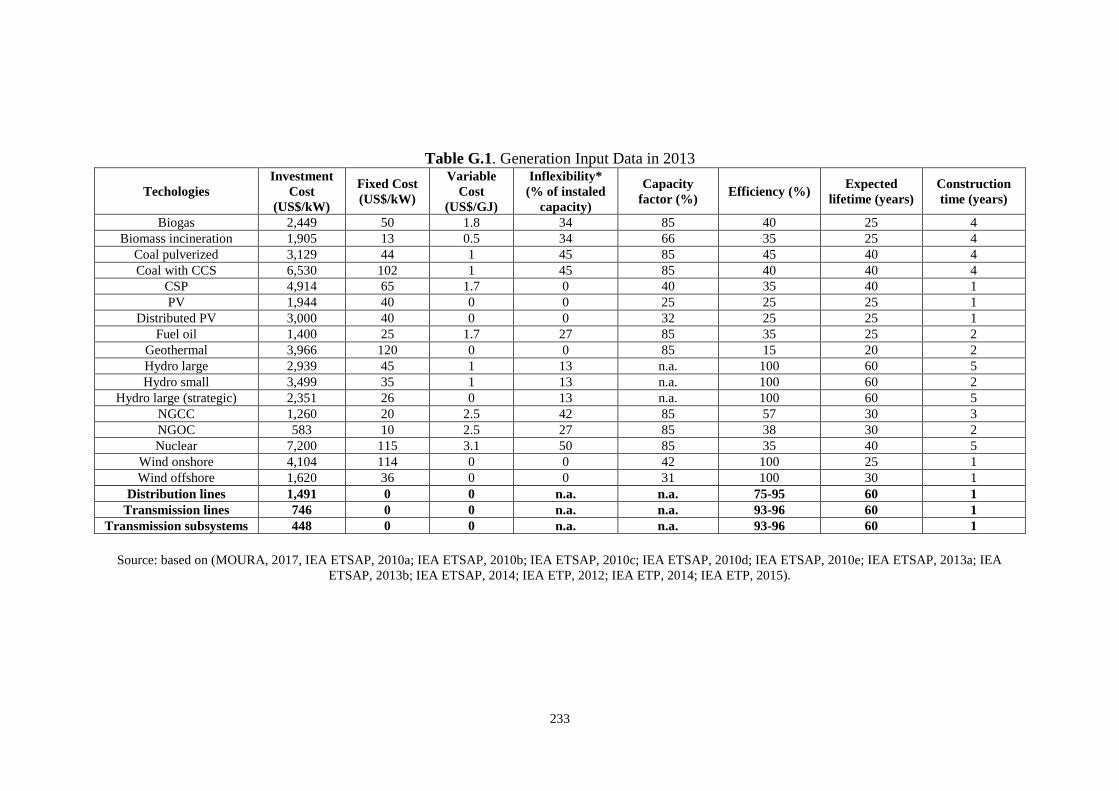
233
Table G.1. Generation Input Data in 2013
Techologies
Investment
Cost
(US$/kW)
Fixed Cost
(US$/kW)
Variable
Cost
(US$/GJ)
Inflexibility*
(% of instaled
capacity)
Capacity
factor (%) Efficiency (%)
Expected
lifetime (years)
Construction
time (years)
Biogas 2,449 50 1.8 34 85 40 25 4
Biomass incineration 1,905 13 0.5 34 66 35 25 4
Coal pulverized 3,129 44 1 45 85 45 40 4
Coal with CCS 6,530 102 1 45 85 40 40 4
CSP 4,914 65 1.7 0 40 35 40 1
PV 1,944 40 0 0 25 25 25 1
Distributed PV 3,000 40 0 0 32 25 25 1
Fuel oil 1,400 25 1.7 27 85 35 25 2
Geothermal 3,966 120 0 0 85 15 20 2
Hydro large 2,939 45 1 13 n.a. 100 60 5
Hydro small 3,499 35 1 13 n.a. 100 60 2
Hydro large (strategic) 2,351 26 0 13 n.a. 100 60 5
NGCC 1,260 20 2.5 42 85 57 30 3
NGOC 583 10 2.5 27 85 38 30 2
Nuclear 7,200 115 3.1 50 85 35 40 5
Wind onshore 4,104 114 0 0 42 100 25 1
Wind offshore 1,620 36 0 0 31 100 30 1
Distribution lines 1,491 0 0 n.a. n.a. 75-95 60 1
Transmission lines 746 0 0 n.a. n.a. 93-96 60 1
Transmission subsystems 448 0 0 n.a. n.a. 93-96 60 1
Source: based on (MOURA, 2017, IEA ETSAP, 2010a; IEA ETSAP, 2010b; IEA ETSAP, 2010c; IEA ETSAP, 2010d; IEA ETSAP, 2010e; IEA ETSAP, 2013a; IEA
ETSAP, 2013b; IEA ETSAP, 2014; IEA ETP, 2012; IEA ETP, 2014; IEA ETP, 2015).

234
Table G.2. Generation Input Data in 2058
Techologies
Investment
Cost
(US$/kW)
Fixed Cost
(US$/kW)
Variable
Cost
(US$/GJ)
Inflexibility*
(% of instaled
capacity)
Capacity
factor (%) Efficiency (%)
Expected
lifetime (years)
Construction
time (years)
Biogas 1,905 50 1.8 34 85 40 25 4
Biomass incineration 1,905 13 0.5 34 66 35 25 4
Coal pulverized 2,313 44 1 45 85 52 40 4
Coal with CCS 4,626 102 1 45 85 44 40 4
CSP 2,160 65 1.7 0 40 35 40 1
PV 972 40 0 0 25 25 25 1
Distributed PV 1,000 40 0 0 32 25 25 1
Fuel oil 1,400 25 1.7 27 85 35 25 2
Geothermal 2,508 120 0 0 85 15 20 2
Hydro large 2,939 45 1 13 n.a. 100 60 5
Hydro small 3,499 35 1 13 n.a. 100 60 2
Hydro large (strategic) 2,351 26 0 13 n.a. 100 60 5
NGCC 1,260 20 2.5 42 85 62 30 3
NGOC 583 10 2.5 27 85 42 30 2
Nuclear 6,318 115 3.1 50 85 37 40 5
Wind onshore 1,592 114 0 0 42 100 25 1
Wind offshore 1,296 36 0 0 31 100 30 1
Distribution lines 1,491 0 0 n.a. n.a. 94-97 60 1
Transmission lines 746 0 0 n.a. n.a. 95-97 60 1
Transmission subsystems 448 0 0 n.a. n.a. 95-97 60 1
Source: based on (MOURA, 2017, IEA ETSAP, 2010a; IEA ETSAP, 2010b; IEA ETSAP, 2010c; IEA ETSAP, 2010d; IEA ETSAP, 2010e; IEA ETSAP, 2013a; IEA
ETSAP, 2013b; IEA ETSAP, 2014; IEA ETP, 2012; IEA ETP, 2014; IEA ETP, 2015)

235
Appendix H. Location of the Madeira River dams
Source: Observatório Ambiental Jirau

236
References
AAS, 2016, ¿Qué es el Consejo Energético Sudamericano (CES) y cómo funciona?
Available at: http://coalicionregional.net/wp-content/uploads/2016/09/CES-1-1.pdf.
Accessed on: 11 jan. 2018.
ABADIE, F., BLANCO, G., BOUILLE, D., et al., 2017, Manual de Planificación
Energética 2017. Organización Latinoamericana de Energía (OLADE). Quito:
Ecuador. Available at: http://biblioteca.olade.org/opac-
tmpl/Documentos/old0378.pdf. Accessed on: 17 jan. 2018.
ADME, 2015a, Informe Anual 2014. Administracion del Mercado Electrico, Montevideo.
Available at:
http://www.adme.com.uy/mmee/pdf/informes/anual/InformeAnual2014.pdf.
Accessed on: 05 jul. 2017.
ADME, 2015b, Estadísticas Demanda Horaria Uruguay 2010 2011 2012 2013.
Administracion del Mercado Electrico, Montevideo Available at:
http://www.adme.com.uy/mmee/demandaprev.php. Accessed on: 06 jul. 2017.
AE, 2012a, Plan de Expansión del SIN para el Periodo 2012 – 2022 Bolivia. Autoridad
de Electricidad, La Paz. Available at: http://www.ae.gob.bo/. Accessed on: 07 jul.
2017.
AE, 2012b, Estadística Demanda Horaria Bolivia 2012. Autoridad de Electricidad, La
Paz.
AE, 2013, Generación Bruta mensual Bolivia 2013. Autoridad de Electricidad, La Paz;
2013. Available at: http://www.ae.gob.bo/. Accessed on: 06 jul. 2017.
AHMED, T., MEKHILEF, S., SHAH, R., et al., 2017, “Investigation into transmission
options for cross-border power trading in ASEAN power grid”, Energy Policy, v. 108
(September), pp. 91-101.
ALMEIDA MEDEIROS, M., 2004, “Multi Level Governance and the Problem of
Balance Within Mercosur”. In: DOMÍNGUEZ, F., OLIVEIRA, M.G.de (eds),
Mercosur: Between Integration and Democracy, Bern: Peter Lang, pp. 75-96.

237
ALTIERI, R., 2015, “A comercialização de energia elétrica no Brasil e possíveis avanços
nas fronteiras”. Workshop de Integração de Mercados, Rio de Janeiro, Brasil, 17-18
setembro 2015.
AALTO, P., 2014, “Energy market integration and regional institutions in east Asia”,
Energy Policy, n. 74, pp. 91-100.
ANDE, 2015, Datos Técnicos Generación Hidráulica. Administración Nacional de
Electricidad, Assunción Available at: http://www.ande.gov.py/generacion.php.
Accessed on: 09 fev. 2015.
ANDRES, L., GUASCH, J.L., LOPEZ AZUMENDI, S., 2008, “Regulatory Governance
and Sector Performance: Methodology and Evaluation for Electricity Distribution in
Latin America.” Public Policy Working Paper, WPS 4494. Washington, DC: World
Bank.
ANEEL, 2012, Resolução Normativa Nº 482. Agência Nacional de Energia Elétrica,
Brasília. Available at: http://www2.aneel.gov.br/cedoc/ren2012482.pdf. Accessed on:
19 mar 2015.
ANEEL, 2015a, Resolução Normativa Nº 673. Agência Nacional de Energia Elétrica,
Brasília Available at: http://www.aneel.gov.br/cedoc/ren2015673.pdf. Accessed on:
10 dec 2016.
ANEEL, 2015b, Resolução Normativa Nº 687. Agência Nacional de Energia Elétrica,
Brasília Available at: http://www2.aneel.gov.br/cedoc/ren2015687.pdf. Accessed on:
10 dec 2016.
ANG, B.W., CHOONG, W.L., NG, T.S., 2015, “Energy security: Definitions, dimensions
and indexes”, Renew. Sustain. Energy Rev., v. 42, pp. 1077–1093.
ANGELIS-DIMAKIS, A., ARAMPATZIS, G., ASSIMACOPOULOS, D., 2012,
“Monitoring the sustainability of the Greek energy system”, Energy Sustain. Dev., v.
16, pp. 51–56.
APERC, 2007, A Quest for Energy Security in the 21st Century, Resources and
Constraints. In: Asia Pacific Energy Research Centre: Tokyo, Japan.

238
APERGIS N, PAYNE, J.E., 2010, “Energy consumption and growth in South America:
Evidence from a panel error correctionmodel”. Energy Economics, v. 32, pp. 1421–
1426.
ARAÚJO, N., 2012, “AL - as ondas da integração”, Revista OIKOS, v. 11, n. 1 pp. 87-
126.
ARCONEL, 2014a, Estadística del Sector Eléctrico Ecuatoriano 2014. Agencia de
Regulación y Control de Electricidad, Quito Available at:
http://www.regulacionelectrica.gob.ec/estadistica-del-sector-electrico/boletines-
estadisticos/. Accessed on: 18 jun. 2017.
ARCONEL, 2014b, Estadística Multianual del sector electrico ecuatoriano 2005-2014.
Agencia de Regulación y Control de Electricidad, Quito. Available at:
http://www.regulacionelectrica.gob.ec/estadistica-del-sector-electrico/boletines-
estadisticos/. Accessed on: 28 sep 2017.
ARELOVICH, L., 2012, “EcoAspectos del proceso de integración energética en América
Latina. Un recorrido por la historia reciente”, Energía y equidad, v. 2, n. 3, pp. 15-26.
ARGENTINA-URUGUAY, 1974, Aprobacion del Convenio de Ejecucion del Acuerdo
de Interconexion Energetica del 12 de Febrero de 1974, dntre Uruguay y Argentina.
Decreto Ley N° 15.509. Available at: https://www.impo.com.uy/bases/decretos-
ley/15509-1983/1. Accessed on: 07 nov. 2017.
ARGENTINA-URUGUAY, 1974, Convenio de Ejecucion del Acuerdo de Interconexion
Energetica. Available at:
http://www.dne.gub.uy/documents/112315/4060070/Ley%2015_509%20Argentina%
20-%20Uruguay.pdf. Accessed on: 07 nov. 2017.
AZUAJE, F., MORALES, J., 2015. Modelado de la red de transmisión de Corpoelec
Zulia en el software ATP-EMTP - Caso: Costa Occidental y Oriental del Lago de
Maracaibo. Universidad Rafael Urdaneta. Available at:
http://200.35.84.131/portal/bases/marc/texto/2201-15-08305.pdf. Accessed on: 06
jan. 2018.

239
BAER, W., CAVALCANTI, T., SILVA, P., 2002, “Economic integration without policy
coordination - the case of MERCOSUR”, Emerging Markets Review, v. 3, pp. 269–
291.
BALASSA, B., 1961, The theory of economic integration. Londres: George Allen e
Unwin.
BALZA, L., JIMENEZ, R., MERCADO, J., 2013, Privatization, Institutional Reform,
and Performance in the Latin American Electricity Sector. Inter-American
Development Bank (IADB), Infrastructure and Environment Department, Technical
Note IDB-TN-599,. Available at:
https://publications.iadb.org/bitstream/handle/11319/6016/int3F8F.PDF?sequence=1
&isAllowed=y. Accessed on: 10 dec. 2017.
BANAL-ESTAÑOL, A., CALZADA, J., JORDANA, J., 2017, “How to achieve full
electrification: Lessons from Latin America, Energy Policy, v. 108 (Sep.), pp. 55-69.
BARRETT, S., 2007, Why Cooperate? The Incentive to Supply Global Public Goods,
Oxford University Press.
BARROS, P.S., 2016, “Banco do Sul: novos desafios para a integração financeira regional. Carta
Capital”, Blog do GR-RI. Available at: https://www.cartacapital.com.br/blogs/blog-do-grri/banco-
do-sul-novos-desafios-para-a-integracao-financeira-regional. Accessed on: 20 jan. 2018.
BATEL S, DEVINE-WRIGHT P, TANGELAND T., 2013, “Social acceptance of low
carbon energy and associated infrastructures: a critical discussion”, Energy Policy, v.
58, pp. 1–5.
BATLLE C, BARROSO LA, PÉREZ-ARRIAGA, I.J., 2010, “The changing role of the
State in the expansion of electricity supply in Latin America”, Energy Policy, v. 38,
pp. 7152–7160.
BAUMANN, D-C., 2014, Market Coupling in the Power Markets. Master dissertation,
University of St. Gallen (HSG), M.A. Banking and Finance (MBF).
BECKER, B.K., 2004, Amazônia, Geopolítica na Virada do III Milênio. Rio de Janeiro:
Garamond.

240
BRUCKMANN, M., 2016, Recursos Naturales Y La Geopolitica De La Integracion
Sudamericana. Vicepresidencia del Estado Plurinacional de Bolivia, 2ª edición.
BERNAL-MEZA, R., 2008, “Argentina y Brasil en la Política Internacional -
regionalismo y Mercosur (estrategias, cooperación y factores de tensión)”, Revista
Brasileira de Política Internacional, v. 51, n. 2, pp. 154-178.
BERNI, M.D., MANDUCA, P.C., BAJAY, S.V., 2013, “Perspectivas e Desafios para a
Integração Energética na América do Sul”. 4º Congreso de la Asociación
Lationamericana de Economía de la Energía – ALADEE, Montevideo/Uruguai.
BERTERO, R., 2015, Evolucion esperada de la produccion del yacimiento de vaca
muerta. UBA – Academia Nacional de Ingeniería. Available at:
http://www.acaingpba.org.ar/Conferencias%20Futuro%20Energetico/Presentation%2
0Logistica%20Shale%20Gas%20Rev1.pdf. Accessed on: 05 jan. 2018.
BERTINAT, P., ARELOVICH, L., 2012, “Los desafíos de la integración energética: una
introducción necesaria”, Energía y equidad, v. 2, n. 3, pp. 5-14.
BIATO, M., 2016, “Itaipu Dam’s Legacy: Inspiration for the Future”. In: CASTRO, N.J.,
ROSENTAL, R. (eds) Integration and Electric Energy Security in Latin America. 1
ed., Rio de Janeiro: Oficina de Livros, pp. 11–34.
BIATO, M., CASTRO, N.J, ROSENTAL, R., 2016, “Constraints and Perspectives of the
Energy Integration in South America”. In: CASTRO, N.J., ROSENTAL, R. (eds)
Integration and Electric Energy Security in Latin America, 1 ed., Rio de Janeiro:
Oficina de Livros, pp. 61–72.
BIROL, F., 2016, “Policy forum, the future of energy markets: world energy prospects
and challenges”, Aust. Econ. Rev., v. 39, pp. 190–195.
BLANCO, G., AMARILLA, A., MARTINEZ, A., et al., 2017, “Energy transitions and
emerging economies: A multi-criteria analysis of policy options for hydropower
surplus utilization in Paraguay”, Energy Policy, n. 108 (Sep.), pp. 312-321.
BLOCK K, 2007, Introduction to Energy Analysis. 1 ed, Techne Press, Amsterdan.

241
BOHARA, A.K., GAWANDEB, K., SANGUINETTI, P., 2004, “Trade diversion and
declining tariffs - evidence from Mercosur”, Journal of International Economics, v.
64, pp. 65-88.
BOLIVIA. Plan de Desarrollo Económico y Social Estado Plurinacional de Bolivia: en
el marco del desarrollo integral para vivir bien 2016-2020. Available at:
http://www.planificacion.gob.bo/pdes/. Accessed on: 15 jan. 2018.
BOND, E.W., SYROPOULOS, C., WINTERS, L.A, , 2001, “Deepening of regional
integration and multilateral trade agreements”, Journal of International Economics, v.
53, n. 2 (Apr), pp. 335-361.
BÖRZEL, T.A., 2016, Theorizing Regionalism, Cooperation, Integration and
Governance. In: BÖRZEL, T.A., RISSE, T. (Eds.). The Oxford Handbook of
Comparative Regionalism, Oxford University Press, pp.41-63.
BP, 2017, BP Statistical Review of World Energy June 2017. Available at:
https://www.bp.com/content/dam/bp/en/corporate/pdf/energy-economics/statistical-
review-2017/bp-statistical-review-of-world-energy-2017-full-report.pdf. Accessed
on: 13 nov. 2017.
BRASIL. Memorando de Entendimento entre a República Federativa do Brasil e a
República Oriental do Uruguai sobre o desenvolvimento de Intercâmbios Elétricos e
Futura Integração Elétrica. Available at: http://dai-mre.serpro.gov.br/atos-
internacionais/bilaterais/1997/b_126_2011-09-01-14-10-35. Accessed on: 30 Aug.
2016.
BRIDGE, G., 2008, “Global production networks and the extractive sector, governing
resource-based development”, J. Econ. Geogr., v. 8, n. 3, pp. 389–419.
BUSTOS, P., 2011, “Trade Liberalization, Exports, and Technology Upgrading:
Evidence on the Impact of MERCOSUR on Argentinian Firms”, American Economic
Review, v. 101, n. 1 (Fev), pp. 304-340.
BUZAN, B., WÆVER, O., WILDE, J., 1998, Security: A New Framework for Analysis.
Boulder, CO: Lynne Rienner.

242
CABALU, H., 2010, “Indicators of security of natural gas supply in Asia”, Energy Policy,
v. 38, pp. 218–225.
CAF, 2012, Nuevas Oportunidades de Interconexión Eléctrica en América Latina. CAF,
2 ed., Bogotá: Colombia.
CAF, 2013a, Energía: una visión sobre los retos y oportunidades en ALyC - aspectos
sociales del acceso a la energía. Corporación Andina de Fomento.
CAF, 2013b, Energía: una visión sobre los retos y oportunidades en ALyC - Eficiencia
energética. Corporación Andina de Fomento.
CAF, 2013c, Energía: una visión sobre los retos y oportunidades en ALyC - Estudio de
la oferta y demanda de energía. Corporación Andina de Fomento.
CAF, 2013d, Energía: una visión sobre los retos y oportunidades en ALyC - Informe
energético sectorial. Corporación Andina de Fomento.
CAF, 2013e, Energía: una visión sobre los retos y oportunidades en ALyC - Integración
energética. Corporación Andina de Fomento.
CAMMESA, 2015a, Informe anual 2014 CAMMESA Argentina. Compañía
Administradora Del Mercado Mayorista Eléctrico Sociedad Anónima, Buenos Aires.
Available at: http://www.cammesa.com/linfoanu.nsf/MINFOANU?OpenFrameSet.
Accessed on: 8 mar. 2016.
CAMMESA, 2015b, Estadísticas Demanda Horaria Argentina 2005 2006. Compañía
Administradora Del Mercado Mayorista Eléctrico Sociedad Anónima, Buenos Aires
Available at: http://portalweb.cammesa.com/Pages/Informes/Estadisticas1.aspx.
Accessed on: 8 mar. 2016
CAMPOS, A.F., ANDREZA, F.M.P., SOARES, J.B., PINHEIRO, M.F.B., OLIVEIRA,
R.G., 2020, “Experiências de Integração Energética na Europa, nos Países Nórdicos e
na América Central: Considerações Relevantes ao Processo de Integração Sul-
Americana”. XIII Congresso Brasileiro de Energia (XIII CBE), Anais 2010, v. I,
pp.167-184.

243
CANESE, R., 2011, La Recuperación de la Soberanía Hidroeléctrica del Paraguay: en
el marco de políticas de Estado de energía. Centro de Investigación de Energía,
Ambiente y Sociedad (CINERGIAS). Asunción: Paraguay, 6 ed..
CANUTO, O., 2015, “Oil Prices and the Future of Petrocaribe”, Huffingtonpost.
Available: http://www.huffingtonpost.com/otaviano-canuto/oil-prices-and-the-
future_b_8209010.html. Accessed on: 21 jan. 2018.
CARRANZA, M.E., 2003, “Can Mercosur survive? Domestic and international
constraints on Mercosur”, Latin American Politics and Society, v. 45, n. 2, pp. 67-103.
CARRASCO, J.J., 2017, “Actividades de la CIER para la promoción de la integración
regional”. In: CIER (2017c) Revista CIER: sin fronteras para la energía. Uruguay:
Montevideo, Edición Especial dedica a la Integración Energética, n. 74 (Nov.), pp.
167-176.
CASTRO, N.J., 2009, “O Papel do Brasil no Processo de Integração do Setor Elétrico da
América do Sul”. Texto de Discussão do Setor Elétrico (TDSE), n. 23,
GESEL/IE/UFRJ, Rio de Janeiro,.
CASTRO, N.J., ROSENTAL, R., GOMES, V.J.F., 2011, “La Integración del Sector
Eléctrico en América del Sur: Características y beneficios”. V SISEE – Seminário
Internacional do Setor de Energia Elétrica, Brasília: Fundação Alexandre de Gusmão,
pp.31-50.
CASTRO, N.J., ROSENTAL, R., GOMES, V.J.F., 2009, “A integração do Setor Elétrico
na América do Sul: Características e Benefícios”. Texto de Discussão do Setor Elétrico
(TDSE), n. 10, GESEL/IE/UFRJ, Rio de Janeiro.
CASTRO, N.J., 2011, “El Papel de Brasil en el Proceso de Integración del Sector
Eléctrico de Sudamérica”. V SISEE – Seminário Internacional do Setor de Energia
Elétrica. Brasília: Fundação Alexandre de Gusmão, pp.7-16.
CASTRO, N.J., 2010, “O Papel do Brasil no Processo de Integração do Setor Elétrico da
América do Sul”. Texto de Discussão do Setor Elétrico (TDSE), n. 23,
GESEl/IE/UFRJ, Rio de Janeiro.
244
CASTRO, N.J., 2016. “Introdução”. In: CASTRO, N.J., ROSENTAL, R. (eds).
Integration and Electric Energy Security in Latin America. Rio de Janeiro: Oficina de
Livros, pp. 13-14.
CASTRO, N.J., BRANDÃO, R,, ROSENTAL, R.R., et al., 2016, “Brazilian energy
integration in Latin America: History, current situation and perspectives”. In:
CASTRO, N.J., ROSENTAL, R. (eds.) Integration and Electric Energy Security in
Latin America. Rio de Janeiro: Oficina de Livros, pp. 159–198.
CASTRO, N.J., BRANDÃO, R., ROSENTAL, R, et al., 2015, “Integração elétrica
internacional do Brasil: Antecedentes, situação atual e perspectivas”, Texto de
Discussão do Setor Elétrico (TDSE), n. 64 (Aug), Rio de Janeiro.
CASTRO. N.J., LEITE, A.L.S., ROSENTAL, R., 2012, “Integração energética - uma
análise entre União Europeia e América do Sul”. Texto de Discussão do Setor Elétrico
(TDSE). n. 48, GESEL/IE/UFRJ, Rio de Janeiro.
CASTRO, N.J., PAIVA, I., ROSENTAL, R., et al., 2017, “Usina Hidrelétrica Brasil-
Bolívia: Projeto âncora do Plano de Desenvolvimento Regional Sustentável
Binacional”. II Encontro Brasileiro de Estudos para a Paz, João PessoaParaíba, Brasil,
20-22 setembro. Available at:
http://www.gesel.ie.ufrj.br/app/webroot/files/publications/33_castro176.pdf.
Accessed on: 05 feev. 2018.
CDEC SIC, 2013, Estadísticas de Operación 2013 Centro de Despacho Económico de
Carga Sistema Interconectado Central, Santiago. Available at: http://www.cdec-
sic.cl/anuarios/anuario2014/cdec_sic_2013.pdf. Accessed on: 01 fev 2016.
CDEC SING, 2012, Estadísticas de Operación 2013. Centro de Despacho Económico de
Carga del Sistema Interconectado del Norte Grande, Santiago Available at:
http://cdec2.cdec-
sing.cl/portal/page?_pageid=33,4121&_dad=portal&_schema=PORTAL. Accessed
on: 01 fev. 2016.
CEIA, E.M., RIBEIRO, W.G., 2016, “Legal and institutional energy integration models:
Comparison between European Union and Mercosur”. In: CASTRO, N.J.,

245
ROSENTAL, R. (eds.) Integration and Electric Energy Security in Latin America, v.
1, Rio de Janeiro: Oficina de Livros, pp. 35–60.
CERQUEIRA CÉSAR, G.R., ARCE, L.D., 2014, “Paraguay: un exportador de energía
con poca luz”, Directorio Energético Latinoamericano, Petroguía, pp. 214-215.
CERQUEIRA CÉSAR, G.R., 2015, “Integración Productiva Paraguay - Brasil: Nuevos
Pasos en el Relacionamiento Bilateral”. In: PRADO, H.S.A, ESPÓSITO NETO, T..
(eds.), Fronteiras e Relações Internacionais, 1 ed., v. 1Curitiba: Íthala, p. 151-174.
CERVIGNI R, LIDEN R, NEUMANN J, et al., 2015, Enhancing the Climate Resilience
of Africa's Infrastructure: The Power and Water Sectors. Chapter 5. Africa
Development Forum. Washington, DC: World Bank. Available at:
https://openknowledge.worldbank.org/handle/10986/21875. Accessed on: 09 Nov.
2017.
CHÁVEZ-RODRÍGUEZ, M.F., 2016, A long-term outlook for natural gas in the
Southern Cone: outcomes from the TIMES-ConoSur model. PhD thesis,
PPE/COPPE/UFRJ, Rio de Janeiro, Brazil.
CHERP, A., 2012, “Defining energy security takes more than asking around”, Energy
Policy, v. 48, pp. 841–842. Available at:
http://www.sciencedirect.com/science/article/pii/
S0301421512001322?via%3Dihub. Accessed on: 9 July 2017.
CHERP, A., ADENIKINJU A., GOLDTHAU, A., et al. (2014). “Energy and security”.
In: Global Energy Assessment, Toward a More Sustainable Future. Cambridge
University Press, Cambridge, UK and New York, NY, USA and the International
Institute for Applied Systems Analysis, Cambridge University Press, Laxenburg,
Austria, pp. 325–383 (Chapter 5).
CHERP, A., JEWELL, J., 2014, “The concept of energy security: Beyond the four As”,
Energy Policy, v. 75, pp. 415–421. Available at:
http://www.sciencedirect.com/science/article/pii/S0301421514004960?via%3Dihub.
Accessed on: 01 aug. 2017.
CHESTER, L., 2010, “Conceptualising energy security and making explicit its polysemic
nature”, Energy Policy, v. 38, pp. 887–895. Available

246
athttp://www.sciencedirect.com/science/article/pii/S0301421509007861?via%3Dihu
b. Accessed on: 26 Feb. 2017).
CHEVALIER, J-M., 1973, Le Nouvel Enjeu pétrolier. Paris: Calmann-Lévy.
CHEVALIER, J-M., 2006, “Security of energy supply for the European Union”,
European Review of Energy Markets, v. 1, n. 3 (Sep.), pp.1–20.
CIER, 2011, Proyecto CIER 15 Fase II - Informe Final. Comisión de Integración
Energética Regional, Montevideo.
CIER, 2013, Síntesis Informativa Energética de los Países de la CIER 2013. Información
del sector energético en países de América del Sur, América Central y El Caribe Datos
del año 2012. Comisión de Integración Energética Regional, Montevideo.
CIER, 2014, Síntesis Informativa Energética de los Países de la CIER 2014. Información
del sector energético en países de América del Sur, América Central y El Caribe Datos
del año 2013. Comisión de Integración Energética Regional, Montevideo.
CIER, 2015, Síntesis Informativa Energética de los Países de la CIER 2015. Información
del sector energético en países de América del Sur, América Central y El Caribe Datos
del año 2014. Comisión de Integración Energética Regional, Montevideo.
CIER, 2016, Síntesis Informativa Energética de los Países de la CIER 2016. Información
del sector energético en países de América del Sur, América Central y El Caribe Datos
del año 2015. Comisión de Integración Energética Regional, Montevideo.
CIER, 2016a, Revista CIER: sin fronteras para la energía. Comisión de Integración
Energética Regional. Uruguay: Montevideo, n. 69 (Jun.).
CIER, 2016b, Revista CIER: sin fronteras para la energía. Comisión de Integración
Energética Regional. Uruguay: Montevideo, n. 70 (Sep.).
CIER, 2017a, Revista CIER: sin fronteras para la energía. Comisión de Integración
Energética Regional. Uruguay: Montevideo, n. 72 (Mar).
CIER, 2017b, Síntesis Informativa Energética de los Países de la CIER 2017.
Información del sector energético en países de América del Sur, América Central y El

247
Caribe Datos del año 2016. Comisión de Integración Energética Regional,
Montevideo.
CIER (2017c) Revista CIER: sin fronteras para la energía. Uruguay: Montevideo, Edición
Especial dedica a la Integración Energética, n. 74 (Nov.).
CNEA, 2015a, Síntesis Del Mercado Eléctrico Mayorista De La República Argentina
2015. Comision Nacional de Energía Atómica, Buenos Aires. Available at:
http://www.cnea.gov.ar/sites/default/files/sintesis_MEM-1_2015.pdf. Accessed on:
20 Nov. 2016.
CNEA, 2015b, Centrales y Reactores. Comision Nacional de Energía Atómica, Buenos
Aires Available at: http://www.cnea.gov.ar/Centrales-Nucleares. Accessed on: 20
Nov. 2016.
CNI, 2016, Reestruturação do setor de gás natural: uma agenda regulatória.
Confederação Nacional da Indústria. Brasília: CNI.
CNG, 2008, Informe Anual 2008. Centro Nacional de Gestion del Sistema Electrico,
Caracas. Available at: http://opsis.org.ve/home3.htmlS. Accessed on: 04 Oct. 2017.
COES-SINAC, 2016, Propuesta de Actualización del Plan de Transmisión 2017-2026.
Dirección de Planificación de Transmisión, COES. Available at:
https://pt.scribd.com/document/323989897/Interconexiones-Internacionales. Accessed on: 30 Jan.
2018.
COCIER, 2016, Señales Regulatorias para la Rentabilidad e Inversión Síntesis de los
Principales Aspectos Económicos de la Regulación: Generación Energía Eléctrica.
Informe Técnico, Secretaría Ejecutiva de la CIER (May).
COCIER, 2017a, Marco Legal y Regulatorio del Sector Eléctrico en los Países de la
CIER: Transmisión de Energía Eléctrica. Informe Técnico, Secretaría Ejecutiva de la
CIER (Jul).
COCIER, 2017b, Marco Legal y Regulatorio del Sector Eléctrico en los Países de la
CIER: Distribución de Energía Eléctrica. Informe Técnico, Secretaría Ejecutiva de la
CIER (Jul.).

248
CODAS, G., 2011, “El Acuerdo Lugo-Lula del 25 de Julio de 2009 y la nueva relación
bilateral Paraguay-Brasil”. IX Curso para diplomatas sul-americanos: textos
acadêmicos. Brasília, Fundação Alexandre Gusmão, pp. 95-114.
COES SINAC, 2013, Estadística De Operación 2013. Comite de Operacion Economica
del Sistema Interconectado Nacional, Lima Available at:
http://www.coes1.org.pe/WebPages/home.aspx. Accessed on: 11 Mar. 2017.
COES SINAC, 2015, Estadísticas Demanda Horaria Peru 2011 2012 2013 2014. Comite
de Operacion Economica del Sistema Interconectado Nacional, Lima. Available at:
http://www.coes1.org.pe/WebPages/home.aspx. Accessed on: 11 Mar. 2017
COETZEE, K., WINKLER, H., 2014, “The international policy context for mitigation
actions”, Climate and Development, v. 6, Supplement 1, pp. 4–11.
COMISIÓN TÉCNICA MIXTA DE SALTO GRANDE. Documentos Fundacionales,
Leyes, Decretos, Notas Reversales, Actas, Acuerdos, Convenios. República Argentina,
Ciudad Autónoma de Buenos Aires. Junio 2013. Available at:
https://www.saltogrande.org/pdf/libro_DOCUMENTOS_Y_ANTECEDENTES.pdf.
Accessed on: 30 Aug. 2016.
CONELEC, 2013, Estadística del Sector Eléctrico Ecuatoriano 2013. Consejo Nacional
de Electricidad, Quito, 2013.
CORPOELEC, 2015, Procesos Medulares: Generación Transmisión Distribución
Comercialización. CORPOELEC, Caracas Available at:
http://www.corpoelec.gob.ve/generaci%C3%B3n. Accessed on: 27 Feb 2017.
CRETI, A., FUMAGALLI, E., FUMAGALLI, E., 2010, “Integration of electricity
markets in Europe: Relevant issues for Italy”, Energy Policy, v. 38, n. 11, pp. 6966-
6976.
CUBBIN, J., STERN, J., 2006, “The Impact of Regulatory Governance and Privatization
on Electricity Industry Generation Capacity in Developing Economies”, The World
Bank Economic Review, v. 20, n. 1, pp. 115–41.

249
CUNHA, R.P.F., 2010, O GNL e a Integração Gasífera do Cone Sul. Master thesis,
Instituto de Economia da Universidade Federal do Rio de Janeiro (IE/UFRJ), Rio de
Janeiro, Brazil.
DAINTITH, T., WILLIAMS, S.F., 1987, The legal integration of energy markets. New
York/Berlin: Walter de Gruyter, 5 ed.
D’APOTE, S., CASTAÑOS, A., 2016, La reactivación de la integración energética
regional en el cono sur. Seminario Mercosur: Juntos hacia el Mundo, 21-22 junho
2016, São Paulo: Brasil. Available at:
http://midias.cebri.org/arquivo/Paper%20preliminar%20-
%20Semin%C3%A1rio%20Merocsur%20Juntos%20Hacia%20el%20Mundo%20-
%20CEBRI.pdf. Accessed on: 02 Fev. 2018.
DAR, 2011, El acuerdo energético Perú-Brasil: los casos de Inambari y Pakitzapango.
SER. Available at: https://issuu.com/darperu/docs/acuerdo_energetico_peru_brasil.
Accessed on: 29 Jan. 2018.
DEPARTMENT OF ENERGY AND CLIMATE CHANGE, 2006, UK energy sector
indicators. Department of Energy and Climate Change, UK.
DESIDERÁ NETO, W.A., MARIANO, M.P., PADULA, R. et al., 2014, “Relações do
Brasil com a América do Sul após a Guerra Fria: política externa, integração,
segurança e energia”. In: DESIDERÁ NETO, W.A. (ed.) O Brasil e novas dimensões
da integração regional, Rio de Janeiro: Ipea, pp. 19-100.
DEVINE-WRIGHT P, BATEL S, A.Ø, SOVACOOL B et al., 2017, “A conceptual
framework for understanding the social acceptance of energy infrastructure: Insights
from energy storage”, Energy Policy, v. 107, pp. 27–31.
DIAS LEITE, A, 2007, A Energia do Brasil. Rio de Janeiro: Eselvier.
DNE, 2005, Política Energética 2005-2030. Direccion Nacional de Energia, Montevideo
Available at:
http://www.dne.gub.uy/documents/49872/0/Pol%C3%ADtica%20Energ%C3%A9tic
a%202030?version=1.0&t=1352835007562. Accessed on: 19 Dec. 2016.

250
DNE, 2013, Balance Energético Nacional 2013. Direccion Nacional de Energia,
Montevideo. Available at:
http://www.miem.gub.uy/documents/15386/5631903/1.4%20Folleto%20espa%C3%
B1ol.pdf. Accessed on 19 Dec. 2016.
DOMINGUEZ, K.R, 2007, Nuevo Regionalismo, Cooperación Energética y el
Desarrollo de uma Estrategia Energética Global hacia uma Política de Transición.
PhD dissertation, Departamento de Derecho Internacional Público y Relaciones
Internacionales, Universidad Complutense de Madrid, Espanha.
DUNLAP, R., VAN LIERE, K., 1978, “The ‘New Environmental Paradigm’: a proposed
measuring instrument and preliminary results”, The Journal of Environmental
Education, v. 9, n. 4, pp.10–19.
ECLAC, 1994. Open regionalism in Latin America and the Caribbean. Economic
integration as a contribution to changing productions patterns with social equity.
Santiago: ECLAC Books n. 39. Available at:
https://www.cepal.org/publicaciones/xml/7/4747/lcg1801i.html. Accessed on: 11 Jan.
2018.
ECLAC, 2007, Infra-estrutura na América do Sul: situação atual, necessidades e
complementaridades possíveis com o Brasil. CEPAL (Sep.).
ECLAC, 2009, Physical Infrastructure and Regional Integration. FAL Bulletin, Issue n.
280.
EDIGER, V.S, BERK, I., 2011, “Crude oil import policy of Turkey: Historical analysis
of determinants and implications since 1968”, Energy Policy, v. 39, pp. 2132–2142.
ENDE, 2017, Planes Estratégicos 2017-2021. Bolivia: Cochabamaba, enero 2017.
Available at:
http://www.endetransmision.bo/etr/files/articulos/Planificacion%20Estrategica%202
017%20-%202021.pdf. Accessed on: 29 Jan. 2018.
ENTSO-E., 2010, A decisive step towards a single European Electricity Market. 4.

251
EPE, 2012, Análise da Inserção da Geração Solar na Matriz Elétrica Brasileira. Empresa
de Pesquisa Energética, Rio de Janeiro. Available at:
http://www.epe.gov.br/geracao/documents/estudos_23/nt_energiasolar_2012.pdf.
Accessed on 17 Mar. 2016.
EPE, 2013, Plano Decenal de Expansão de Energia 2022. Empresa de Pesquisa
Energética, Rio de Janeiro. Available at:
http://www.epe.gov.br/PDEE/Forms/EPEEstudo.aspx. Accessed on: 17 Mar. 2016.
EPE, 2014a, Balanço Energético Nacional 2014 - Ano Base 2013. Empresa de Pesquisa
Energética, Rio de Janeiro Available at: https://ben.epe.gov.br/. Accessed on:18 Mar.
2016.
EPE, 2014b, Plano Decenal de Expansão de Energia 2023. Empresa de Pesquisa
Energética, Rio de Janeiro. Available at:
http://www.epe.gov.br/PDEE/Forms/EPEEstudo.aspx. Accessed on: 18 Mar. 2016.
EPE, 2014c, Plano Nacional de Energia PNE 2050. Empresa de Pesquisa Energética, Rio
de Janeiro.
EPE, 2015a, Plano Decenal de Expansão de Energia 2024. Empresa de Pesquisa
Energética, Rio de Janeiro. Available at:
http://www.epe.gov.br/PDEE/Forms/EPEEstudo.aspx. Accessed on: 18 Mar. 2016.
EPE, 2015b, Boletim Trimestral da Energia Eólica Brasil 2015. Empresa de Pesquisa
Energética, Rio de Janeiro. Available at:
http://www.epe.gov.br/geracao/Paginas/BoletimdeEnergiaE%C3%B3lica.aspx?Cate
goriaID=. Accessed on: 18 Mar. 2016.
EPE, 2016, Plano Decenal de Expansão de Energia 2025. Empresa de Pesquisa
Energética, Rio de Janeiro. Available at:
http://www.epe.gov.br/PDEE/Forms/EPEEstudo.aspx. Accessed on: 18 Mar. 2016.
EPE, 2017, Resenha Mensal do Mercado de Energia Elétrica. Empresa de Pesquisa
Energética, Rio de Janeiro. Available at:
http://epe.gov.br/ResenhaMensal/Resenha%20Mensal%20do%20Mercado%20de%2
0Energia%20El%C3%A9trica%20-%20Dezembro%202016.pdf. Accessed on: 18
Mar. 2016.

252
ESPÓSITO, T., 2012, Itaipu e as Relações brasileiro-paraguaias de 1962 a 1979:
fronteira, energia e poder. PhD dissertation, Pontifícia Universidade Católica de São
Paulo (PUC-SP), Faculdade de Ciências Sociais.
EUROPEAN COMISSION, 2012, Energy Roadmap 2050, Europena Union. Available
at:
https://ec.europa.eu/energy/sites/ener/files/documents/2012_energy_roadmap_2050_
en_0.pdf. Accessed on: 20 Dec. 2017.
EUROPEAN COMISSION, 2016, EU Reference Scenario 2016: Energy, transport and
GHG emissions Trends to 2050 Available at:
https://ec.europa.eu/energy/sites/ener/files/documents/20160713%20draft_publicatio
n_REF2016_v13.pdf. Accessed on: 21 Dec. 2017.
FAJARDO, J., 2004, Acordo tripartite Itaipu-Corpus: Ponto de inflexão entre a disputa
geopolítica e a política de cooperação, Master dissertation, Universidade Federal do
Rio Grande do Sul, Porto Alegre.
FERRER, A., 2006, Integração Regional e Desenvolvimento da América do Sul.
Transcrição da conferência organizada pelo Fórum de integração regional / IUPERJ –
28 April 2006, Observatório Político Sul Americano.
FRANKEL, J., STEIN, E., WEI, S-J, 1995, “Trading blocs and the Americas: The natural,
the unnatural, and the super-natural”, Journal of Development Economics, v. 47, pp.
61-95.
FURTADO, C., 1974, O Mito do Desenvolvimento Econômico. Rio de Janeiro: Paz e
Terra.
FUSER, I., 2010, “A (des)integração energética na América do Sul: uma crítica ao brasil-
centrismo”. IV Simpósio Lutas Sociais na América Latina: Imperialismo,
nacionalismo e militarismo no Século XXI, Londrina: UEL, pp.115-124.
FUSER, I., 2011, Segurança energética, nacionalismo de recursos e integração na
América do Sul. FFLCH-USP. Available at:
http://www.fflch.usp.br/dcp/assets/docs/SemDisc2011/Sessao_IX_Fuser.pdf.
Accessed on: 17 Aug. de 2017.

253
FUSER, I., 2015, As Razões da Bolívia: dinheiro e poder no conflito com a Petrobras pelo
controle do gás natural (2003-2007). São Bernardo do Campo, SP: EdUFABC.
GADENNE, D., SHARMA, B., KERR, D., et al., 2011, “The influence of consumers'
environmental beliefs and attitudes on energy saving behaviours”, Energy Policy, v.
39, n. 12 (Dec), pp. 7684–7694.
GARAFFA, R., 2016, Transmissão de Preços e Integração de Mercados de Gás Natural
na Europa Continental. Master thesis, PPE/COPPE/UFRJ, Rio de Janeiro, Brazil.
GARIBALDI, J. A., WINKLER, H., LA ROVERE, E. L., et al., 2014, “Comparative
analysis of five case studies commonalities and differences in approaches to mitigation
actions in five developing countries”, Climate and Development, v. 6, Supplement 1,
pp. 59–70.
GISE, 2017, Boletín sobre energía y desarrollo PARAGUAY 2023. Grupo de
Investigación en Sistemas Energéticos, Ano I, Edición n. 1. Available at:
http://www.pol.una.py/archivos/Propuesta_revista_gis_dic_2017_v9.pdf. Accessed
on: 18 Jan. 2018.
GLACHANT, J-M., 2010, “The Achievement of the EU Electricity Internal Market
through Market Coupling”, RSCAS Working Papers, v. 87, Italy.
GNANSOUNOU, E., 2008, “Assessing the energy vulnerability: Case of industrialised
countries”, Energy Policy, v. 36, pp. 3734–3744.
GOBIERNO NACIONAL DEL PARAGUAY, 2014, Plan Nacional de Desarrollo
Paraguay 2030. Available at: http://www.stp.gov.py/pnd/wp-
content/uploads/2014/12/pnd2030.pdf. Accessed on: 3 Jun. 2017.
GOLDTHAU, A., 2014, “Rethinking the governance of energy infrastructure: Scale,
decentralization and polycentrism”, Energy Res. Soc. Sci., v. 1, pp. 134–140. Available
at: http://www.sci
encedirect.com/science/article/pii/S2214629614000140?via%3Dihub. Accessed on: 4 Aug.
2017.

254
GOLDTHAU, A., 2010, “Energy Diplomacy in Trade and Investment of Oil and Gas”.
In: GOLDTHAU, A., WITTE, J.M. (eds.), Global Energy Governance: The New
Rules of the Game, Washington, D.C.: Brookings Institution Press.
GOLDTHAU, A., SOVACOOL, B.K., 2012, “The uniqueness of the energy security,
justice, and governance problem”, Energy Policy, v. 41, pp. 232–240, Available at:
http://www.sci
encedirect.com/science/article/pii/S0301421511008263?via%3Dihub. Accessed on: 5
May 2017.
GONZALEZ-EIRAS, M. ROSSI, M.A., 2007, “The Impact of Electricity Sector
Privatization on Public Health”, Research Network Working Paper, n. 524.
Washington, DC: Inter-American Development Bank. Available at
http://www.iadb.org/en/research-and-data/publicationdetails,3169.html?pub_id=r-
524. Accessed on: 10 Jan. 2018.
GPL, 2012, Guyana Power and Light 2012 Annual Report. 7Guyana Power and Light,
Georgetown. Available at: http://www.gplinc.net/pubs/anureps. Accessed on: 18 Oct.
201.
HALLACK, M.C.M., 2014, “A integração da indústria de gás natural na América do Sul:
desafios institucionais no desenvolvimento de infraestruturas de interconexão”. In:
DESIDERÁ NETO, W.A. (ed.) O Brasil e novas dimensões da integração regional,
Rio de Janeiro: IPEA, pp. 353-413.
HANCOCK, K.J., VIVODA, V., 2014, “International political economy, a field born of
the OPEC crisis returns to its energy roots”, Energy Res. Soc. Sci, v. 1, pp. 206–216.
Available at:
http://www.sciencedirect.com/science/article/pii/S2214629614000310?via%3Dihub.
Accessed on: 3 Jul. 2017.
HELM, D., 2002, “Energy policy: security of supply, sustainability and competition”,
Energy Policy, v. 30, n. 3, pp. 173-184.
HELM, D., 2011, “Peak oil and energy policy: a critique”, Oxford Review of Economic
Policy, v. 27, n. 1, pp. 68–91.

255
HELM, D., 2014, “The European framework for energy and climate policies”, Energy
Policy, v. 64, pp. 29-35.
HIRA, A., 1998, Ideas and Economic Policy in Latin America: Regional. National, and
Organizational Case Studies. Praeger, Westport.
HIRA A., 2003, “Does energy integrate?” Energy Policy, v. 31, pp. 185–199.
HIRA, A., 2003, Political Economy of Energy in the Southern Cone. Wesport,
Connectcut.
HONG, L., LUND, H., VAD, B., et al., 2013, “2050 pathway to an active renewable
energy scenario for Jiangsu province”, Energy Policy, v. 53 (Feb), pp.267-278.
HOWELLS, M, ROGNER, H, STRACHAN, N, et al., 2011, “OSeMOSYS: the open
source energy modelling system: an introduction to its ethos, structure and
development”, Energy Policy, v. 39, pp.5850–5870.
HUGHES, L, 2012, “A generic framework for the description and analysis of energy
security in an energy system”, Energy Policy, v. 42, pp. 221–231, Available at:
http://www.sci
encedirect.com/science/article/pii/S0301421511009773?via%3Dihub. Accessed on:
15 Aug. 2017).
IAEA, 2005, Energy Indicators for Sustainable Development: guidelines and
methodologies. IAEA, Vienna.
IEA, 1985, Energy Technology Policy. OECD/IEA, Paris.
IEA, 2003, Energy to 2050 Scenarios for a Sustainable Future. Paris, France. Available
at: http://www.deres.org.uy/practicas_pdf/cambio_climatico/Energy_to_2050.pdf.
Accessed on: 22 Dec. 2017.
IEA, 2007, Energy Security and Climate Policy, Assessing Interactions. OECD/IEA,
Paris (March).
IEA, 2008, Key World Energy Statistics 2008. OECD/ IEA, Paris.

256
IEA, 2010, Energy Techonology Perspectives: scenarios & strategies to 2050.
International Energy Agency, Paris, France. Available at:
https://www.iea.org/publications/freepublications/publication/etp2010.pdf. Accessed
on: 21 Dec. 2017.
IEA, 2012, Energy Statistics of OECD Countries Transmission and distribution losses.
International Energy Agency, Paris, 2012.
IEA, 2013, Map Energy Indicators Database. OECD/IEA, Paris.
IEA, 2014, World Energy Outlook 2014. IEA: Paris.
IEA, 2018, Energy Policies beyond IEA Countries: Chile. International Energy Agency,
Paris, 2018. Available at:
http://www.iea.org/publications/freepublications/publication/EnergyPoliciesBeyondI
EACountriesChile2018Review.pdf. Accessed on: 01 Fev. 2018.
IEA ETP, 2012, Energy Technologies Perspectives 2012. International Energy Agency,
Paris.
IEA ETP, 2014, Energy Technologies Perspectives 2014. International Energy Agency,
Paris.
IEA ETP, 2015, Energy Technologies Perspectives 2015. International Energy Agency,
Paris.
IEA ETSAP, 2010a, Technology Brief Biomass for Heat and Power. Energy Technology
Systems Analysis Program, Paris. Available at: http://www.iea-
etsap.org/Energy_Technologies/Energy_Supply.asp. Accessed on: 22 Jul. 2017.
IEA ETSAP, 2010b, Technology Brief Coal-Fired Power. Energy Technology Systems
Analysis Program, Paris. Available at: http://www.iea-
etsap.org/Energy_Technologies/Energy_Supply.asp. Accessed on: 22 Jul. 2017.
IEA ETSAP, 2010c, Technology Brief Gas-Fired Power. Energy Technology Systems
Analysis Program, Paris Available at: http://www.iea-
etsap.org/Energy_Technologies/Energy_Supply.asp. Accessed on: 22 Jul. 2017.

257
IEA ETSAP, 2010d, Technology Brief Geothermal Heat and Power. Energy Technology
Systems Analysis Program, Paris. Available at: http://www.iea-
etsap.org/Energy_Technologies/Energy_Supply.asp. Accessed on: 22 Jul. 2017.
IEA ETSAP, 2010e, Technology Brief Hydropower. Energy Technology Systems
Analysis Program, Paris. Available at: http://www.iea-
etsap.org/Energy_Technologies/Energy_Supply.asp. Accessed on: 22 Jul. 2017.
IEA ETSAP, 2010f, Technology Brief Nuclear Power. Energy Technology Systems
Analysis Program, Paris. Available at: http://www.iea-
etsap.org/Energy_Technologies/Energy_Supply.asp. Accessed on: 22 Jul. 2017.
IEA ETSAP, 2013a, Technology Brief Concentrating Solar Power. Energy Technology
Systems Analysis Program, Paris. Available at: http://www.iea-
etsap.org/Energy_Technologies/Energy_Supply.asp. Accessed on: 23 Jul. 2017.
IEA ETSAP, 2013b, Technology Brief Photovoltaic Solar Power. Energy Technology
Systems Analysis Program, Paris Available at: http://www.iea-
etsap.org/Energy_Technologies/Energy_Supply.asp. Accessed on: 23 Jul. 2017.
IEA ETSAP, 2014, Technology Brief Electricity Transmission and Distribution. Energy
Technology Systems Analysis Program, Paris. Available at: http://www.iea-
etsap.org/Energy_Technologies/Energy_Supply.asp. Accessed on: 23 Jul. 2017.
IEA WEO, 2014, World Energy Outlook 2014. International Energy Agency, Paris.
IEA, 2013, Coal medium-term market report 2013: Market trends and projections to
2018. Available at:
http://www.iea.org/publications/freepublications/publication/MTcoalMR2013_free.p
df. Accessed on: 14 Oct. 2015.
IEA, 2014, Medium-Term Coal Market Report 2014Market Analysis: and Forecasts to
2019. Available at: http://www.iea.org/bookshop/495-Medium-
Term_Coal_Market_Report_2014. Accessed on: 10 Oct. 2015.
IMF, 2016, Bolivia: 2016 Article IV Consultation. IMF Country Report 16/387. US:
Washington, D.C. December 2016. Available at:
https://books.google.com.br/books?id=eHfqDQAAQBAJ&pg=PA40&lpg=PA40&d

258
q=termoelectrica+warnes+US$&source=bl&ots=9YR8eAvniL&sig=YMBbNfYgyQ
wioN-
Z5QZPwBwWsK8&hl=en&sa=X&ved=0ahUKEwjP8ZWcl4LZAhXHg5AKHZ0X
BoEQ6AEILDAA#v=onepage&q=del%20sur&f=false. Accessed on: 18 Jan. 2018.
IPPDH-MERCOSUL, 2014, Presentation of the MERCOSUR Institute of Public Policies
on Human Rights: cross-regional meeting for advancing the protection of children
from violence. IPPDH, Jamaica, June 30.
IRENA, 2016, REmap: Roadmap for a Renewable Energy Future, 2016 Edition.
International Renewable Energy Agency (IRENA), Abu Dhabi.
IRENA, 2017a, Planning for the Renewable Future: Long-term modelling and tools to
expand variable renewable power in emerging economies. International Renewable
Energy Agency (IRENA), Abu Dhabi.
IRENA, 2017b, Perspectives for the energy transition: investment needs for a low-carbon
energy system. International Renewable Energy Agency (IRENA), Abu Dhabi.
ISA, 2016, Integración eléctrica regional: Retos y Perspectivas Visión. Estrategias y
programas a nivel global. October 2016. Available at:
https://www.enernews.com/media/briefs/integracion-electrica-regional-retos-y-
perspectivas_2016.pdf. Accessed on: 12 Jan. 2018.
ISBELL, P., 2007, “Security of supply”, Oxford Economic Forum, v. 71 (Nov.), pp. 3–6.
JAEGER, B.C., 2016, “O Grande Gasoduto do Sul: impactos sobre a integração regional
e o desenvolvimento sul-americano”, Conjuntura Global, v. 5 n. 2 (Mai./Ago.),
pp.271-292.
JAKOB, M., STECKEL, J. C., FLACHSLAND, C., et al., 2015, “Climate finance for
developing country mitigation: blessing or curse?”, Climate and Development, v. 7, n.
1, pp. 1–15.
JAMASB, T., POLLITT, M., 2008, “Security of supply and regulation of energy
networks”, Energy Policy, v. 36, pp. 4584–4589, Available at:
http://www.sciencedirect.com/science/article/pii/
S0301421508004874?via%3Dihub. Accessed on: 17 Jun. 2017.

259
JANSSEN, T., REBOURS, Y., DESSANTE, P., 2012, “Tight Volume Coupling:
Analytical Model, Adverse Flow Causality and Potential Improvements”, RSCAS EUI
Working Paper, v. 9, European University Institute.
JERVIS, R., 1978, “Cooperation under the security dilemma”, World Politics, v. 30, n. 2,
pp. 167–174.
JOHANSSON, B., 2013, “A broadened typology on energy and security”, Energy, v. 53,
pp.199-205.
KANCHANA, K., UNESAKI, H., 2014, “ASEAN Energy Security – An Indicator-based
Assessment”, Energy Procedia, v. 56, pp. 163–171.
KAMSAMRONG, J., SORAPIPATANA, C., 2014, “An assessment of energy security
in Thailand’s power generation”, Sustain. Energy Technol. Assess., v. 7, pp. 45–54.
KARLSSON-VINKHUYEN, S., JOLLANDS, N., STAUDT, L., 2012. “Global
governance for sustainable energy: the contribution of a global public goods
approach”, Ecological Economics, v. 83, pp. 11-18.
KEMMLER, A., SPRENG, D., 2007, “Energy indicators for tracking sustainability in
developing countries”, Energy Policy, v. 35, pp. 2466–2480, Available at:
http://www.sciencedirect.com/
science/article/pii/S0301421506003557?via%3Dihub. Accessed on: 3 Sep. 2017).
KEOHANE, R.O., NYE, J.S., 2001, Power and Interdependence. Third edition
Longman, New York.
KHATIB, J., 2016, Energy, Environmental & Sustainable Ecosystem Development,
World Scientific Publishing Co. Pte. Ltd.: Singapore.
KISEL, E., HAMBURG, A., HÄRM, M., et al., 2016, “Concept for Energy Security
Matrix”, Energy Policy, v. 95, pp. 1–9. Available at:
http://www.sciencedirect.com/science/
article/pii/S0301421516302038?via%3Dihub. Accessed on: 27 Aug. 2017).

260
KISSEL, J.M., HANITSCH, R., KRAUTER, S.C.W., 2009, “Cornerstones of a
renewable energy law for emerging markets in South America”, Energy Policy, v. 37,
pp. 3621–3626.
KLARE, M.T., 2001, Resource Wars: the new landscape of global conflict. New York:
Metropolitan Books.
KOUTOUDJIAN, G., 2014, Analizando opciones para el avance de la integración
energética en el Cono Sur: Proyectos Garabí y Panambí. CEARE, 8-9 de Mayo,
Asunción, Paraguay.
KOZULJ, R., 2006, “La integración gasífera latinoamericana: una prospectiva cargada
de incertidumbres”, Nueva Sociedad, v. 204, pp. 104-118.
KOZULJ, R., 2008, Situación y perspectivas del gas natural licuado en América del Sur.
Serie Recursos Naturales e Infraestructura, ECLAC. Chile: Santiago de Chile (Feb.).
Available at:
http://repositorio.cepal.org/bitstream/handle/11362/6330/S0800091_es.pdf?sequence
=1. Accessed on: 16 Dec. 2017.
KPMG, 2016, 2050 Energy Scenarios. Available at:
https://www.energynetworks.org/assets/files/gas/futures/KPMG%20Future%20of%2
0Gas%20Main%20report%20plus%20appendices%20FINAL.pdf. Accessed on: 20
Dec. 2017.
KRUYT, B., VAN VUUREN, D.P., DE VRIES, H.J.M., et al., 2009, “Indicators for
energy security”, Energy Policy, v. 37, pp. 2166–2181. Available at:
http://www.sciencedirect.com/
science/article/pii/S0301421509000883?via%3Dihub. Accessed on: 3 Aug. 2017.
KUCHARSKI, J., UNESAKI, H., 2014, “Adaptability and Energy Security, A Complex
Adaptive Systems Approach”. Unpubl Manuscr.
KUCHARSKI, J., UNESAKI, H., 2015, “A Policy-oriented Approach to Energy
Security”, Procedia Environ. Sci., v. 28, pp. 27–36. Available at:
http://www.sciencedirect.com/science/article/
pii/S1878029615002170?via%3Dihub. Accessed on: 18 Jul. 2017).

261
LACHER, H. 2003. “Putting the state in its place: The critique of state-centrism and its
limits”, Review of International Studies, v. 29, n. 4, pp. 521-541.
LANDAU, G, 2008a, “Brasil”. In: WEINTRAUB, S., HESTER, A., PRADO, V. R.
(eds.). Cooperação Energética nas Américas: entraves e benefícios. Rio de Janeiro:
Elsevier, pp.235-268.
LANDAU, G., 2008a, La crisis energética de América del Sur, Archivos del Presente, n.
47, pp. 111-122.
LARA, I.F., 2017, Situación Energética en Argentina. Asuntos del Sur. Buenos Aires.
LARREA, S., TEIXEIRA, A.B., COVA, B., et al., 2017, Arco Norte Electrical
Interconnection Component II: pre-feasibility study. Inter-American Development
Bank. Available at:
https://publications.iadb.org/bitstream/handle/11319/8599/Arco_Norte_Electrical_Int
erconnection_Study_Component_II_Pre_Feasibility_Study.PDF?sequence=3&isAllo
wed=y. Accessed on: 25 Jan. 2018.
LEFÈVRE, N., 2010, “Measuring the energy security implications of fossil fuel resource
concentration”, Energy Policy, v. 38, pp. 1635–1644. Available at:
https://www.sciencedirect.com/
science/article/pii/S0301421509000858. Accessed on: 30 Nov. 2017.
LEIPZIGER, D.M., FRISCHTAK, C., KHARAS, H., et al., 1997, “Mercosur -
Integration and Industrial Policy”, The World Economy, v. 20, n. 5 (Ago), pp. 585-
603.
LIMA, M.R.S., COUTINHO, M.V, 2006, “Integração Moderna”, Análise de Conjuntura
Observatório Político Sul-Americano – OPSA, n. 1 (Jan).
LIU, L., WU, T., HUANG, T., 2017, “An equity-based framework for defining national
responsibilities in global climate change mitigation”, Climate and Development, v. 9,
n. 2, pp. 152–163.
LIZARAZU, G.A., 2009, “Gas Integration in South America and Liquefied Natural Gas”,
Revista de Humanidades y Ciencias Sociales, v.15, n. 1-2, pp.1-41.

262
LORENZONA, A.S., RIBEIRO, C.A.A.S., SANTOS, A.R., et al., 2017, “Itaipu
royalties: The role of the hydroelectric sector in water resource management”, Journal
of Environmental Management, v. 187, n. 1 (Feb.), pp. 482-489.
LÖSCHEL, A., MOSLENER, U., RÜBBELKE, D.T.R., 2010, “Energy security:
Concepts and indicators”, Energy Policy, v. 38, pp. 1607–1608. Available at:
http://www.sciencedirect.com/
science/article/pii/S0301421509001657?via%3Dihub. Accessed on: 20 Oct. 2017).
LUYO, J. E. “Reformas de Tercera Generación para la Integración Energética en América
Latina”. V SISEE – Seminário Internacional do Setor de Energia Elétrica. Brasília:
Fundação Alexandre de Gusmão, 2011, pp.17-30.
LYNCH, M.J., LONG, M.A., STRETESKY, P.B., et al., 2017, Green Criminology:
Crime, Justice, and the Environment. Oakland, California: University of California
Press.
MALAMUD, A., SCHMITTER, P. C. “The Experience of European Integration and the
Potential for Integration in South America”. In: WARLEIGH-LACK, A.,
ROBINSON, N., ROSAMOND, B. (eds). New Regionalism and the European Union.
Dialogues, Comparisons and New Research Directions. London and New York:
Routledge, 2011, pp. 135-157. Available at:
http://www.ics.ul.pt/rdonwebdocs/ICS_AMalamud_Experience_CLI.pdf. Accessed
on: 25 Sep. 2017.
MALAMUD, A., 2003, “Presidentialism and Mercosur: A Hidden Cause for a Successful
Experience”. In: FINN, L. (ed.). Comparative Regional Integration: Theoretical
Perspectives. Aldershot: Ashgate.
MARES, D., 2008, “Energy, Development and Regional Integration”. In: ARNSON, C.J,
FUENTES C, ARAVENA F.R. et al. (eds.). Energy and Development in South
America: Conflict and Cooperation, pp. 61–72.
MARIANO, M.P., RAMANZINI JR., H., 2012, “Uma análise das limitações estruturais
do Mercosul a partir das posições da política externa brasileira”, Revista de Sociologia
e Política, Curitiba, v. 20, n. 43 (Oct), pp. 23-41.
MARINI, R.M., 1969[2012] Subdesenvolvimento e revolução. Florianópolis: Insular.

263
MARTCHAMADOL, J., KUMAR, S., 2013, “An aggregated energy security
performance indicator”, Appl. Energy, v. 103, pp. 653–670. Available at:
http://www.sciencedirect.com/science/
article/pii/S0306261912007337?via%3Dihub. Accessed on: 20 Aug. 2017.
MARTIN, J-M. 1974, “L'energie et le desarroi post-industriel - essai sur la croissance de
l'energie”, Energy Policy, v. 2, n. 3, pp. 256-257.
MARTIN, J-M., 1988, “L'intensité énergétique de l'activité économique dans les pays
industrialisés: les évolutions de très longue période livrent-elles des enseignements
utiles?” Economies et sociétés, Série EN, v. 4, pp. 9-27.
MARTIN, J-M., 1990, L'économie mondiale de l'énergie. Paris: a Découverte, Collection
Repères.
MARTIN, J-M., 1992, Economie et politique de l'énergie. Paris: A.Colin, Collection
Cursus.
MARTIN, J-M., 2000, Le changement des technologies de l’énergie: genèse, modalités
et hipothèses explicatives. In: BOURGEOIS, B. et al. (Eds.), Énergie et changement
technologique. Paris: Éditions Économica, pp. 17-61.
MASI, F., 2011, Paraguay: cuando la energía no es igual a desarrollo. Available at:
http://oered.org/es/component/content/article/170-paraguay-cuando-la-energia-no-es-
igual-aldesarrollo.html. Accessed on: 20 Oct. 2016.
MAYA, C., 2015, “Integrácion de Mercados: Caso Colombia”. In: Workshop de
Integração de Mercados, Rio de Janeiro 17-18 setembro 2015.
MECHAM, M, 2003, “Mercosur - A Failing Development Project”, International Affairs,
v. 79, n. 2, pp. 369-387.
MEER, 2012, Plan Maestro De Electrificación 2012-2021 Ecuador. Ministerio de
Electricidad y Energia Renovables, Quito Available at:
http://www.regulacionelectrica.gob.ec/wp-
content/uploads/downloads/2015/12/PME-2012-2021.pdf. Accessed on: 30 Jun. 2017.
MEM, 2014a, Atlas Eólico Del Peru. Ministerio de Energia y Minas, Lima. Available at:
http://www.osinergmin.gob.pe/seccion/centro_documental/Institucional/Estudios_Ec

264
onomicos/Otros-Estudios/Atlas-Eolico/AtlasEolicoLibro.pdf. Accessed on: 1 Jul.
2017.
MEM, 2014b, Plan Energético Nacional 2014-2025. Ministerio de Energia y Minas,
Lima Available at: http://www.minem.gob.pe/minem/archivos/2ResEje-2014-
2025%20Vf.pdf. Accessed on: 1 Jul. 2017.
MEM, 2015. RenovAR, Plan de Energías Renovables - Argentina 2016–2025. Available
at: http://www.embassyofargentina.us/fil/ckFiles/files/presentacion-energia-espanol-
6(2).pdf. Accessed on: 5 May 2017.
MEN, 2014, Balance Nacional de Energia 2013. Ministerio de Energía, Santiago.
Available at:
http://antiguo.minenergia.cl/minwww/opencms/14_portal_informacion/06_Estadistic
as/Balances_Energ.html. Accessed on: 1 Jul. 2017.
MEN, 2015, Interconexión Eléctrica Regional (Internacional) Chile. Ministerio de
Energía, Santiago, 2015.
MENEGHINI, E.M., VOIGT, M.R., 2011, O Mercosul e atuação do SGT9 energia: uma
avaliação dos processos de integração energética no âmbito do mercado comum.
PMUC-FAPESC.
MERCOSUR, 1991, Tratado de Asunción: tratado para la Constitución de una Mercado
Comun entre la Republica Argentina, La Republica Federativa del Brasil, la Republica
del Paraguay y la Republica Oriental del Uruguay. Available at:
http://www.mercosur.int/innovaportal/file/719/1/CMC_1991_TRATADO_ES_Asun
cion.pdf. Accessed on: 03 Apr. 2015.
MERCOSUR, 1994, Protocolo de Ouro Preto: Adicional al Tratado de Asunción sobre
la Estructura Institucional del MERCOSUR. Available at:
http://www.mercosur.int/innovaportal/file/721/1/1994_protocoloouropreto_es.pdf.
Accessed on: 03 Apr. 2015.
MERCOSUR, 1998, Memorando de entendimento relativo aos intercâmbios elétricos e
integração elétrica no Mercosul. Buenos Aires: CMC. Avaliable at:
http://www.mercosur.int/msweb/Normas/normas_web/Decisiones/PT/Dec_010_098

265
_Memorando%20Entend%20Interc%C3%A2mbio%20Integ%20El%C3%A9trica%2
0MCS_Ata%201_98.PDF. Accessed on: 05 Jan. 2018.
MERCOSUR, 1998, Protocolo de Ushuaia sobre Compromiso Democrático en el
MERCOSUR, la Republica de Bolivia y la Republica de Chile. Available at:
http://www.mercosur.int/innovaportal/file/4054/1/1998_protocolo_es_ushuaiacompr
odemocraticomcs-bych.pdf. Accessed on: 09 Sep. 2015.
MERCOSUR, 1999, Memorando de entendimento relativo aos intercâmbios gasíferos e
integração gasífera entre os Estados Partes do Mercosul. Montevidéu: CMC.
Available at:
http://www.mercosur.int/msweb/Normas/normas_web/Decisiones/PT/Dec_010_099
_Memo%20Interc%20Gas%C3%ADferos%20Integ%20Gas%C3%ADfera_Ata%20
2_99.PDF. Accessed on: 05 Jan. 2018.
MERCOSUR, 2002, Protocolo de Olivos. Available at:
http://www.mercosur.int/innovaportal/file/722/1/2002_protocoloolivossolucontrover
sias_es.pdf. Accessed on: 28 Oct. 2015.
MERCOSUR, 2005, Acordo-Quadro sobre Complementação Energética Regional entre
os Estados Partes do Mercosul e Estados Associados. Montevidéu: Mercosul.
Available at: http://daimre.serpro.gov.br/atos-internacionais/multilaterais/acordo-
quadro-sobre-complementacaoenergetica-regional-entre-os-estados-partes-do-
mercosul-e-estados-associados-1/. Accessed on: 05 Jan. 2018.
MERCOSUR, 2005, Divisão do subgrupo nº 9 ‘Energia e Mineração. Assunção: CMC.
Available at:
http://www.mercosur.int/msweb/Normas/normas_web/Decisiones/PT/CMC_2005-
06-19_NOR-DEC_07_PT_Divis%C3%A3o%20SGT%20N%C2%BA%209.PDF.
Accessed on: 05 Jan. 2018.
MERCOSUR, 2007, Plano de ação do MERCOSUL para a cooperação em matéria de
biocombustíveis. Assunção: CMC. Available at:
http://www.mercosur.int/innovaportal/v/634/1/secretaria/decisiones_2007. Accessed
on: 05 Jan. 2018.

266
MERCOSUR, 2012, Protocolo de Adhesión de la República Bolivariana de Venezuela
al MERCOSUR. Available at:
http://www.mercosur.int/innovaportal/file/2485/1/2006_PROTOCOLO_ES_Adhesio
nVenezuela.pdf. Accessed on: 12 Aug. 2014.
MERCOSUR, 2015, Protocolo de Adhesión del Estado Plurinacional de Bolivia al
MERCOSUR. Available at:
http://www.mercosur.int/innovaportal/file/4054/1/2015_protocolo-adhesion-de-
bolivia-al-mcs_es.pdf. Accessed on: 28 Apr. 2016.
MHE, 2014a, Memoria Anual Bolivia 2014. Ministerio de Hidrocarburos y Energia, La
Paz. Available at: http://www2.hidrocarburos.gob.bo/index.php/memorias-e-
informes-de-gestion.html. Accessed on: 4 Jun, 2017.
MHE, 2014b, Plan Eléctrico del Estado Plurinacional de Bolivia 2025. Ministerio de
Hidrocarburos y Energia, La Paz. Available at: http://www2.hidrocarburos.gob.bo.
Accessed on: 4 Jun, 2017.
MILLS, R.M., 2008. The Myth of the Oil Crisis: Overcoming the Challenges of
Depletion, Geopolitics, and Global Warming. Westport, CT: Praeger.
MIEM, 2008. Política Energética 2005–2030. Available at:
www.dne.gub.uy/documents/49872/0/Política%20Energética%202030?version=1.0
&t=1352835007562. Accessed on: 7 May 2017.
MINISTERIO DEL PODER POPULAR DE PETRÓLEO. Plan Siembra Petrolera
2005–2030 (PDVSA), Venezuela, 2005. Available at:
http://www.pdvsa.com/index.php?tpl=interface.sp/design/readmenuprinc.tp
l.html&newsid_temas=32. Accessed on: 12 Jul. 2017.
MHE, 2012ª, Plan de Expansión del Sistema Interconectado Nacional 2012–2022,
Estado Plurinacional de Bolivia. Available at: http://archive.is/kPz02. Accessed on: 23
Jun. 2017.
MHE, 2012b. Plan de Universalización Bolivia con Energía 2010–2025, Estado
Plurinacional de Bolivia. Available at:
http://www2.hidrocarburos.gob.bo/index.php/plan-de-universalizacion-bolivia-con-
energia-2010-2025.html. Accessed on: 29 Jul. 2017.
267
MHE, 2012c, Política de Energías Alternativas, Estado Plurinacional de Bolivia.
Available at: http://www2.hidrocarburos.gob.bo/index.php/politica-de-energias-
alternativas.html. Accessed on: 1 Aug. 2017.
MME, 2006, Perspectivas de Integração Elétrica com os Países Vizinhos. Foro de
Integración Energética Regional, Ciudad de Mexico. Available at:
http://www.olade.org/fier2007/Documents/PDF-11.pdf. Accessed on: 17 Mar. 2017.
MME, 2007, Plano Nacional de Energia 2030. Available at:
http://www.epe.gov.br/PNE/20080512_2.pdf. Accessed on: 28 Jul. 2017.
MME, 2011a, Plano Nacional de Eficiência Energética. Available at:
http://www.orcamentofederal.gov.br/projeto-esplanada-sustentavel/pasta-para-
arquivar-dados-do-pes/Plano_Nacional_de_Eficiencia_Energetica.pdf. Accessed on:
4 Aug. 2017.
MME, 2011b, Setor Eléctrico Nacional Informe Sectorial sobre la Evolución de la
Distribución y Comercialización de Energía Eléctrica en Colombia. Ministerio de
Minas y Energia, Bogotá. Available at:
http://www.siel.gov.co/LinkClick.aspx?fileticket=L9AASwJjMz8=. Accessed on: 5
Aug 2017.
MME, 2014, Boletim Mensal de Monitoramento do Sistema Elétrico Brasileiro.
Ministério de Minas e Energia, Brasília. Available at:
http://www.mme.gov.br/web/guest/secretarias/energia-eletrica/publicacoes/boletim-
de-monitoramento-do-sistema-eletrico. Accessed on: 25 Oct. 2017
MOOKHERJEE, D., McKENZIE, D., 2005, “Paradox and Perception: Evidence from
Four Latin American Countries.” In: BIRDSALL, N.,. NELLIS, J. (eds.) Privatization
Reality Check: Distributional Effects in Developing Countries. Washington, DC:
Center For Global Development.
MORAES, M.L., SANTOS, T., 2014, “Focem e Assimetrias Infraestruturais no
Mercosul: as principais características apresentadas nos últimos anos”, Revista de
Estudos Sociais, v. 16, pp. 85-110.
MOREIRA, J.M.L., PINTO, R.T.S., 2013, “Integração energética ou integração de
mercados: qual é a melhor solução para a comercialização de energia elétrica?” 4º

268
Congreso de la Asociación Lationamericana de Economía de la Energía – ALADEE,
Montevideo/Uruguai.
MOREIRA, P.F., 2016, Brazil-Peru energy integration: History, Challenges and Future
Perspectives. In: CASTRO, N.J., ROSENTAL, R. (eds.) Integration and Electric
Energy Security in Latin America. Rio de Janeiro: Oficina de Livros, pp. 97–135.
MOURA, G.N.P., 2017, Long-term Power Systems Integration Using OSeMOSYS
SAMBA - South America Model Base - and the Bargaining Power of Countries: A
Cooperative Games Approach. PhD dissertation, PPE/COPPE/UFRJ, Rio de Janeiro,
Brasil.
MOURA, G.N.P., HOWELLS, M., LEGEY, L., 2011, “SAMBA” the Open Source South
American Model Base: a Brazilian perspective on long term power systems investment
and integration. Working Paper Series, KTH-dESA/15/8/11.
MOURA, G.N.P., LEGEY, L.F.L., PEREIRA JÚNIOR, A.O., 2012, “Diagnóstico do
Sistema Elétrico de Transmissão Brasileiro Relacionado à Comercialização de Energia
Elétrica com Países da América do Sul”. XIV Congresso Brasileiro de Energia (XIV
CBE), v. 3, pp.1079-1100.
MPF, 2013, Balance Energetico Nacional 2013. Ministerio de Planificacion Federal,
Invercion Publica y Servicios, Buenos Aires. Available at:
http://www.energia.gov.ar/contenidos/verpagina.php?idpagina=3366. Accessed on:
17 Dec 2016.
MPPEE, 2013a, Anuario Estadistico 2013 Sector Electrico Venezolano Cifras ano 2012.
Ministerio del Poder Popular para la Energía Eléctrica, Caracas Available at:
www.mppee.gob.ve. Accessed on 23 Nov 2016.
MPPEE, 2013b, Plan de Desarrollo del Sistema Eléctrico Nacional PDSEN 2013-2019.
Ministerio del Poder Popular para la Energía Eléctrica, Caracas. Available at:
www.mppee.gob.ve. Accessed on 23 Nov 2016.
MPPEE, 2014, Anuario Estadistico 2014 Sector Electrico Venezolano Cifras ano 2013.
Ministerio del Poder Popular para la Energía Eléctrica, Caracas. Available at:
www.mppee.gob.ve. Accessed on 23 Nov 2016.

269
MULLER-KRAENNER, S., 2008, Energy Security, Re-measuring the World. Earthscan,
London.
NAGAYAMA, H., 2007, “Effects of Regulatory Reforms in the Electricity Supply
Industry on Electricity Prices in Developing Countries”, Energy Policy, v. 35 (Feb.),
pp. 3440–3462.
NAGAYAMA, H., 2009, “Electric Power Sector Reform Liberalization Models and
Electric Power Prices in Developing Countries” Energy Economics, v. 31, n. 3 (May),
pp. 463–72.
NARAYANAMURTI, V., ANADON, L., BREETZ, H., 2011, Transforming the Energy
Economy: Options for Accelerating the Commercialization of Advanced Energy
Technologies. Available at: http://Media.Cigionline.Org, Accessed on: 20 Nov. 2016.
NUTI, M.R., 2006, Integração Energética na América do Sul: escalas, planejamento e
conflitos. PhD dissertation, IPPUR/UFRJ.
OBANI, P.C., GUPTA, J., 2016, “The impact of economic recession on climate change:
eight trends”, Climate and Development, v. 8, n. 3, pp. 211–223.
OCHOA C, DYNER I, FRANCO C.J., 2013, “Simulating power integration in Latin
America to assess challenges, opportunities, and threats”, Energy Policy, v. 61, pp.
267–273.
OLADE, 2012, Panorama General del Sector Eléctrico em América Latina y el Caribe.
Organización Latino Americana de Energía, Quito. Available at:
http://biblioteca.olade.org/iah/fulltext/Bjmbr/v32_2/old0277.pdf. Accessed on: 14
May 2016.
OLADE, 2013, Apuntes sobre la Integración Eléctrica Regional y Propuestas para
Avanzar.. Available at: http://www.olade.org/wp-
content/uploads/2015/08/INTEGRACI%C3%93N-EL%C3%89CTRICA-
REGIONAL-Y-PROPUESTAS-PARA-AVANZAR.pdf. Accessed on: 29 Dec. 2018.
OLADE, 2016, XI-FIER 06 Sistema de Interconexión Eléctrica Andina (SINEA).
Available at: https://www.slideshare.net/OladeComunicacin/xifier-06-sistema-de-
interconexin-elctrica-andina-sinea. Accessed on: 01 Feb. 2018.

270
OLADE, 2017, Anuario de 2017 Estadísticas Energéticas. Quito: Ecuador.
OLARREAGA, M., SOLOAGA, I., 1998, “Endogenous tariff formation: The case of
Mercosur”, World Bank Economic Review, v. 12, n. 2 (May), pp. 297-320.
ONDŘICH, J., 2014, Will market coupling lead to one European power market? Energy
Transition: the Global Energiewend. Available at:
https://energytransition.org/2014/07/will-market-coupling-lead-to-one-european-
power-market/. Acessed on: 10 Jan 2018.
ONS, 2014, Energias Naturais Afluentes dos Subsistemas. Operador Nacional do Sistema
Elétrico, Rio de Janeiro.Available at:
http://www.ons.org.br/operacao/enas_subsistemas.aspx. Accessed on: 18 Dec 2016.
ONS, 2015a, Estatísticas Demandas Horárias Subsistemas Elétricos Brasileiros 2010
2011 2012 2013 2014. Operador Nacional do Sistema Elétrico, Rio de Janeiro, 2015.
ONS, 2015b, Energia Armazenada Reservatórios Dados Mensais 2013. Operador
Nacional do Sistema Elétrico, Rio de Janeiro. Available at:
http://www.ons.org.br/historico/energia_armazenada_out.aspx. Accessed on: 18 Dec
2016.
OSeMOSYS, 2015, The Open Source Energy Modelling System OSeMOSYS. Royal
Institute of Technology, Stockholm. Available at: www.osemosys.org. Accessed on:
15 Jan 2017.
OXILIA, V.E., 2009, Raízes Socieconômicas da Integração Energética na América do
Sul: análise dos projetos Itaipu Binacional, Gasbol e Gasandes, PhD dissertation,
Programa de Pós-Graduação em Energia, Universidade de São Paulo (USP), São
Paulo, Brasil.
PADULA, R., 2013, “Una Concepción de la Integración Regional, el Papel de la
Infraestructura y de la Ocupación de Espacios”. In: COSTA, D. (ed.). América del Sur:
integración e infraestructura. Capax Dei: Rio de Janeiro, pp.207-288.
PALESTINI, S., AGOSTINIS, G., 2018, “Constructing regionalism in South America:
The cases of sectoral cooperation on transport infrastructure and energy”, Journal of
International Relations and Development, v. 21, Issue 1, pp. 46-74.
271
PALTSEV, S., 2016, Energy Scenarios: The Value and Limits of Scenario Analysis. MIT
Center for Energy and Environmental Policy Research (CEEPR), Massachusetts
Institute of Technology (MIT). Cambridge: USA, April 2016. Available at:
http://ceepr.mit.edu/files/papers/2016-007.pdf. Accessed on: 29 Jan. 2018.
PAREDES, J.R., SCHAEFFER, R., SZKLO, A., 2017, Contribución de las energías
renovables a la seguridad energética en América Latina. Banco Interamericano de
Desarrollo, BID.
PARLAMENTO ANDINO, 2015, Revista El Cóndor: Hacia un Marco Regulatorio de
Energía Sostenible. Quito: Ecuador. Available at:
http://expertosenred.olade.org/integracion/documentos/revista-el-condor-hacia-un-
marco-regulatorio-de-energia-sostenible/. Accessed on: 16 Oct. 2017.
PARLASUR. MERCOSUR inaugura línea de transmisión entre Itaipú y Asunción. 2013.
Available at:
https://www.parlamentomercosur.org/innovaportal/v/7861/1/parlasur/mercosur-
inaugura-linea-de-transmision-entre-itaipu-y-asuncion.html. Accessed on: 22 Jan.
2018.
PASQUALETTI, M.J., SOVACOOL, B.K., 2012, “The importance of scale to energy
security”, J Integr Environ Sci, v. 9, pp. 167–180.
PAZ, A., NUNES, R., 2011, “Buscando as Complementaridades: diagnósticos das
interconexões energéticas sul-americanas”. In: COSTA, Darc (ed.). América do Sul:
integração e infraestrutura. 1ª Edição. Rio de Janeiro: Capax Dei, 2011, pp. 99-142.
PERCEBOIS, J., 1986, “Gas market prospects and relationship with oil prices”, Energy
Policy, v. 14, n. 4, pp. 329-246.
PERCEBOIS, J., 2008,” Electricity Liberalization in the European Union: Balancing
Benefits and Risks”, The Energy Journal, v. 29, n. 1, pp. 1-20.
PEREIRA JÚNIOR, A.O., SOARES, J.B., OLIVEIRA, R.G., QUEIROZ, RP., 2008,
“Energy in Brazil: Toward sustainable development?”, Energy Policy, v. 36, pp. 73–
83.

272
PERGHER, H., 2016, “A integração energética na América do Sul: uma análise das
políticas de integração energética promovidas no Mercosul e na Unasul”, RICIC, v. 3,
n. 6, pp. 58-82.
PINEAU, P-O., HIRA, A, FROSCHAUER, K., 2004, “Measuring international
electricity integration - a comparative study of the power systems under the Nordic
Council, MERCOSUR, and NAFTA”, Energy Policy, v. 32, pp. 1457–1475
PUGA, D., 1999, “The rise and fall of regional inequalities”, European Economic Review,
v. 43, pp. 303-334.
PUKA L., SZULECKI, K., 2014, “The politics and economics of cross-border electricity
infrastructure: A framework for analysis”, Energy Research & Social Science, v. 4,
pp. 124–134.
QUEIROZ, R., TAVARES, F. B., VILELA, T., 2013, “O Papel do Brasil como Ator
Regional Energético: obstáculos e desafios institucionais”. 4º Congreso de la
Asociación Lationamericana de Economía de la Energía, Montevideo/Uruguai.
QUEIROZ, R., VILELA, T., 2010, “Energy integration in South America: motivations,
obstacles and achievements”. Blog Infopetro. Available at:
http://infopetro.wordpress.com/2010/05/24/energyintegration-in-south-america-
motivations-struggles-and-achievements/. Accessed on: 16 Nov. 2016.
RAMOS, D.S., 2016, “Electricity Markets Regional Integration: Conceptual Basis,
Potential Benefits and Opportunities for the Southern Cone”. In: CASTRO, N.J.,
ROSENTAL, R. (eds.) Integration and Electric Energy Security in Latin America. Rio
de Janeiro: Oficina de Livros, pp. 73–98.
REN21, 2017, Renewables 2017 Global Status Report. Paris: REN21 Secretariat.
RODRIGUES, B.S., 2016, Geopolítica dos recursos naturais estratégicos sul-
americanos. Rio de Janeiro: Editora MUltifoco, 1ª Edição.
RODRIGUES, L.A., 2009, “A Integração Energética e o Reordenamento das Relações
na Bacia do Prata: O Caso de Itaipu”. In: BERTONI, L. (Ed.). La matriz energética en
el siglo XXI. 1ª ed. Buenos Aires: Dunkel.

273
RODRIGUES, L.A., 2012a, Análise Institucional e Regulatória da Integração de
Energia e os Demais Membros do MERCOSUL. Master dissertation, Programa de Pós-
Graduação em Energia (IEE/USP), São Paulo, Brasil.
RODRIGUES, F.T., 2012b, “Evaluando la integración energética entre Chile y Argentina
entre 1994-2009: El caso del Gasoducto Gas Andes. Master thesis, Buenos Aires,
Argentina.
ROMÁN, M., LINNÉR, B-O., MICKWITZ, P., 2012, “Development policies as a vehicle
for addressing climate change”, Climate and Development, v. 4, n. 3, pp. 251–260.
ROXBURGH, C., 2009, The use and abuse of scenarios. McKinsey & Company. Available
at: https://www.mckinsey.com/business-functions/strategy-and-corporate-
finance/our-insights/the-use-and-abuse-of-scenarios. Accessed on: 28 Jan. 2018.
RUDNICK, H., MORENO, R., TAPIA, H. et al., 2007, Abastecimiento de Gas Natural.
Pontificia Universidad Católica de Chile, Departamento de Ingeniería Eléctrica,
IEE3372 Mercados Eléctricos.
RUIZ-CARO, A., 2006, Cooperación e integración energética en América Latina y el
Caribe. Serie Recursos Naturales e Infraestrutura, 106. Santiago de Chile: CEPAL.
RUIZ-CARO, A., 2010, Puntos de conflicto de la cooperación e integración energética
en América Latina y el Caribe. Serie Recursos Naturales e Infraestrucutura, 148.
Santiago de Chile: CEPAL.
SABBATELLA, I., 2015, “Integración petrolera y gasífera en Suramérica”. In: KARG,
J.M., et al., (Eds.) Del no al Alca a Unasur: diez años después de Mar del Plata. 1ª Ed.,
Ciudad Autónoma de Buenos Aires: Ediciones del CCC (Centro Cultural de la
Cooperación Floreal Gorini), pp. 165-186.
SALOMÃO, L.A., DA SILVA, J.M., 2008, Integração Energética do Subcontinente:
novas oportunidades e desafios. Ministério de Relações Exteriores: Seminário sobre
Integração, 12 de março de 2008, Brasília, Brasil.
SANTOS, M.J., FERREIRA, P., ARAÚJO, M. et al., 2017, “Scenarios for the future
Brazilian power sector based on a multi-criteria assessment”, Journal of Cleaner
Production, v. 167 (Nov.), pp. 938-950.

274
SANTOS, R.S.S., SANTOS, R.M., 2015, “Os Vinte e Quatro Anos do Sistema de
Solução de Controvérsias do Mercosul e o Caso de Suspensão do Paraguai”,
Seqüência, v. 36, n. 70, pp.253-279.
SANTOS, T., SANTOS, L., O.LIVEIRA, C., 2013, “Energy Security and Binational
Cooperation: a Case Study of the Itaipu Dam”, Integration and Trade – Interamerican
Development Bank, v. 17, pp. 105-115.
SANTOS, T., 2014a, Integração Energética na América do Sul: desdobramentos do
desenvolvimento institucional. Master thesis, Instituto de Relações Internacionais,
Pontifícia Universidade Católica do Rio de Janeiro (IRI/PUC-Rio), Rio de Janeiro,
Brasil.
SANTOS, T., 2014b, “A Critical Deconstruction of Myths and Misunderstandings about
Energy Integration in South America”. V Simpósio de Pós-Graduação em Relações
Internacionais (V SimpoRI), UERJ, Rio de Janeiro.
SANTOS, T., SANTOS, L., PEREIRA JÚNIOR, A.O., 2014, “The Electricity Sector In
Paraguay And Its Regulation Framework: Analysis and Perspectives”. IX Congresso
Brasileiro de Planejamento Energético (IX CBPE), Florianópolis.
SANTOS, T., 2015, “Segurança Energética no MERCOSUL+2, desafios e
oportunidades”. Revista Oikos, Rio de Janeiro, v. 14, pp. 5–18.
SANTOS, T., 2016, “Integração Regional e Segurança Energética: O caso do
MERCOSUL+2”. I. ENEPI, v. 1, pp. 534–550.
SANTOS, T., SANTOS, L., 2016, “Energy integration in MERCOSUR: Itaipu
Binacional emblematic case”. In: CASTRO, N.J., ROSENTAL, R. (eds.) Integration
and Electric Energy Security in Latin America. Rio de Janeiro: Oficina de Livros, pp.
136–158.
SANTOS, T., VARELA, I., 2016, “A Diplomacia Brasileira a Serviço da Segurança
Energética”. V Congresso Internacional do NUCLEAS, Rio de Janeiro.
SANTOS, T., PORTO, L.F.S., BENTO SILVA, N. et al., 2016a, “MERCOSUL+2 e
Segurança Energética, uma análise comparada das interpretações do conceito e das
275
políticas energéticas nacionais”. Proceedings of the IX ENABED-Encontro Nacional
de Estudos de Defesa, 6–8 July, v. 9, Florianópolis, Brazil.
SANTOS, T., SILVA JÚNIOR, C.H.F., SILVA E SILVA, et al., 2016b,
“MERCOSUL+2 e Segurança Energética: Uma Análise Comparada das Interpretações
do Conceito e das Políticas Energéticas Nacionais”. XIII Congresso Acadêmico sobre
Defesa Nacional (XIII CADN), v. 1, pp. 348-358, Rio de Janeiro, Brazil.
SANTOS, T., VARELA, I., TEIXEIRA, J.V., BETZLER, R., 2016c, “Economia Política
da Energia: o gás natural russo e a dependência europeia”. III Encontro Brasileiro de
Estudos Estratégicos e Relações Internacionais (III EBERI), Niterói, Brazil.
SANTOS, T., CAMPOS JÚNIOR, C.H., LIMA, P.V., FIGUEIREDO, A..C.M., 2016d,
“(Des)Ordem Democrática da (Des)Integração Regional: (des)constitucionalização do
MERCOSUL em matéria de impeachment”, Revista Densidades, v. 20, pp. 13-40.
SANTOS, T., 2017, “Integração Energética: mais do que apenas um tema econômico e
técnico, um tema político”. In: CARVALHO, G., ROSEVICS, L. (eds.). Diálogos
Internacionais: Reflexões Críticas do Mundo Contemporâneo, 1ed., Rio de Janeiro:
Perse, v. 1, pp. 177-186.
SANTOS, T., PEREIRA JÚNIOR, A.O., LA ROVERE, E.L., 2017a, “Beyond the Energy
Security Concept: socio-energo-environmental security (SEES) as a more suitable
approach to Mercosur+2”. 6th Latin American Energy Economics Meeting, Rio de
Janeiro, Brazil.
SANTOS, T., PEREIRA JÚNIOR, A.O., LA ROVERE, E.L., 2017b, “Evaluating Energy
Policies Through the Use of a Hybrid Quantitative Indicator-Based Approach: The
Case of Mercosur”, Energies, v. 10, n. 12 (Dec), pp. 2140-2155.
SANTOS, T., RODRIGUEZ LEITE, A.P.M, SANDES, C., 2017c, MERCOSUL e
“Protocolo(s) de Ushuaia: cláusula democrática para quem?”. FoMerco, UFBA,
Salvador, Brazil.
SANWAL, M., 2010, “Climate change and global sustainability: The need for a new
paradigm for international cooperation”, Climate and Development, v. 2, n. 1, pp. 3–
8.

276
SANWAL, M., 2012, “Rio +20, climate change and development: the evolution of
sustainable development (1972–2012)”, Climate and Development, v. 4, n. 2, pp. 157–
166.
SANWAL, M., 2014, “The post-2015 global agenda: are the political decisions on climate
change shifting to a new forum in the United Nations as it comes together with
sustainable development and security?”, Climate and Development, v. 6, n. 2, pp. 93–
95.
SAUMA, E., JERARDINO, S., BARRIA, C., et al., 2011, “Electric-systems integration
in the Andes community: Opportunities and threats”, Energy Policy, v. 39, pp. 936-
949.
SCHÜLLER, D., 2012, “Technology transfer mechanisms and international cooperation
to combat climate change”, Climate and Development, v. 4, n. 2, pp. 78–87.
SENA, M.F.M., 2013, Retorno Sobre Investimento Energético (EROI) da Cadeia
Produtiva do Petróleo Extrapesado Venezuelano. PhD thesis, PPE/COPPE/UFRJ, Rio
de Janeiro, Brazil.
SENHORAS, E.M., MOREIRA, F.A., VITTE, C.C.S., 2009, “A agenda exploratória de
recursos naturais na América do Sul: da empiria à teorização geoestratégica de
assimetrias nas relações internacionais”. 12º Encuentro de Geógrafos de América
Latina, Montevideo, Uruguai.
SENNES, R., PEDROTI, P., 2008, “Entre la geopolítica y la geoeconomía: la energía en
las relaciones latinoamericanas”. In: LAGOS, R. (ed.), América Latina: Integración o
Fragmentación?, Buenos Aires: Edhasa, pp. 527-567.
SHAFFER, B., 2009, Energy Politics, Philadelphia, PA: University of Pennsylvania
Press.
SHELL, 2008, Shell energy scenarios to 2050. Available at:
https://rjohnwilliams.files.wordpress.com/2016/02/shell-energy-scenarios2050.pdf.
Accessed on: 20 Dec. 2017.
SHUM, R.Y., 2012, “Effects of economic recession and local weather on climate change
attitudes”, Climate Policy, v. 12, n. 1, pp. 38–49.

277
SIEL, 2015, Estadísticas y variables de generación. Sistema de Información Eléctrico
Colombiano, Bogotá.Available at:
http://www.siel.gov.co/Inicio/Generaci%C3%B3n/Estad%C3%ADsticasyvariablesde
generaci%C3%B3n/tabid/115/Default.aspx. Accessed on: 19 Mar. 2017.
SIEMENS, 2014, Living energy: energy scenario 2050. Available at:
https://www.siemens.com/content/dam/internet/siemens-com/customer-
magazine/old-mam-assets/print-archiv/2/living-energy/living-energy-no10-may-
2014.pdf. Accessed on: 20 Dec. 2017.
SILVAST, A., 2017, “Energy, economics, and performativity: Reviewing theoretical
advances in social studies of markets and energy”, Energy Research & Social Science,
v. 34, pp. 4–12.
SIMÕES, A.J.F., 2011, Integração: sonho e realidade na América do Sul. FUNAG,
Brasília, Brazil.
SIMS, R.E.H., SCHOCK, R.N., ADEGBULULGBE, A., et al., 2007, “Energy supply”.
In: Climate Change 2007, Mitigation. Contribution of Working Group III to the Fourth
Assessment Report of the Intergovernmental Panel on Climate Change. United
Kingdom and New York.
SMIT, B., WANDEL, J., 2006, “Adaptation, adaptive capacity and vulnerability”, Glob.
Environ. Chang., v. 16, pp. 282–92, Available at:
http://www.sciencedirect.com/science/article/pii/S0959378006000410?via%3Dihub.
Accessed on: 8 June 2017.
SÖDERBAUM, F., 2013, “What’s Wrong with Regional Integration? The Problem of
Eurocentrism”, European University Institute, EUI Working Paper RSCAS 64.
SOL.bo, 2017, Sistema de represas Chepete-El Bala: Bases para un posicionamiento
político. Available at: https://soberaniaylibertad.org/wp-
content/uploads/2017/09/Sistema-de-represas-Chepete-El-Bala-Bases-para-un-
posicionamiento-politico.pdf. Accessed on: 31 Jan. 2018.
SOVACOOL, B.K., 2011, “Evaluating energy security in the Asia Pacific: Towards a
more comprehensive approach”, Energy Policy, v. 39, pp. 7472–7479.

278
SOVACOOL, B.K., 2012, “The methodological challenges of creating a comprehensive
energy security index”, Energy Policy, v. 48, pp. 835–840.
SOVACOOL, B.K., 2013, “An international assessment of energy security performance”,
Ecol Econ, v. 88, pp. 148–158.
SOVACOOL, B. K., MUKHERJEE, I., 2011, “Conceptualizing and measuring energy
security, a synthesized approach”, Energy, v. 36, n. 8, pp. 5343–5355.
SOVACOOL B.K., MUKHERJEE, I., DRUPADY, I.M., et al., 2011, “Evaluating energy
security performance from 1990 to 2010 for eighteen countries”, Energy, v. 36, pp.
5846–5853, Available at:
https://www.sciencedirect.com/science/article/pii/S0360544211005809. Accessed on:
01 Dec. 2017.
SPANJER, A., 2017, “Russian gas price reform and the EU-Russia gas relationship,
incentives, consequences and European security of supply”, Energy Policy, v. 35, pp.
2889–2898. Available at:
http://www.sciencedirect.com/science/article/pii/S0301421506004101?via%3Dihub.
Accessed on: 25 Jan. 2017.
TAURECK, R., 2006, “Securitization theory and securitization studies”, Journal of
International Relations and Development, v. 9, pp. 53–61.
TENNET, 2013, Market coupling - Variants. Available at:
http://www.tennet.eu/de/en/grid-projects/international-
projects/marketcoupling/variants.html. Accessed on: 18 Jan. 2018.
TONGSOPIT, S., KITTNER, N., CHANG, Y., et al., 2016, “Energy security in ASEAN:
A quantitative approach for sustainable energy policy”, Energy Policy, v. 90, pp. 60–
72, Available at:
http://www.sciencedirect.com/science/article/pii/S030142151530197X?via%3Dihub.
Accessed on: 3 Sep. 2017.
TRATADO DE YACYRETÁ, 1973, Tratado de Yacyretá y normas complementarias.
Available at: http://www.yacyreta.org.ar/docum/2006/tratadodeyacyreta.pdf. Acessed
on: 26 Nov. 2017.

279
UDAEDA, M.E.M., BURANI, G.F., FAGÁ, M.T.W., et al., 2006, “Ponderação analítica
para da integração energética na América do Sul”. Revista Brasileira de Energia, v.
12, n. 2, pp. 1-19.
UDAETA, M.E.M., SILVA, V.O., GALVÃO, et al., 2016, “Analysis of Energy
Integration and the Transboundary Superstructure in South America”, Journal of
Business and Economics, v. 7, n. 1, pp. 21-43.
UEC, 2014, Documento Final da Conferência Ministerial (“A Haia II”): sobre a carta
internacional a energia. Bruxelas. Energy Charter Secretariat. Available at:
https://energycharter.org/fileadmin/DocumentsMedia/Legal/Final_Text_International
_Energy_Charter_BRA.pdf. Accessed on: 18 Jul. 2017.
UN, 2012, The Future We Want: Outcome Document of the United Nations Conference
on Sustainable. Development. New York, United Nations.
UN, 2015, Energy Statistics: Electricity Profiles. United Nations, New York Available
at: http://unstats.un.org/unsd/energy/Eprofiles/default.htm. Accessed on: 28 Oct.
2017.
UN (2017), UN SE4All – Global Tracking Framework.
UN News Center, 2013, Press Statement. August 23.
UNASUR, 2006, Declaração de Cochabamba. Bolívia: UNASUL. Available at:
http://www.comunidadandina.org/documentos/dec_int/declaracion_cochabamba.htm
. Accessed on: 05 Jan. 2018.
UNASUR, 2007, Declaração de Margarita. Venezuela: UNASUL. Available at:
http://www.comunidadandina.org/documentos/dec_int/declaracion_margarita.pdf.
Accessed on: 05 Jan. 2018.
UNASUR, 2008a, Anteproyecto de lineamientos para la estratégia energética
suramericana. Caracas: UNASUR. Available at:
https://www.unasursg.org/images/descargas/ESTATUTOS%20CONSEJOS%20MIN
ISTERIALES%20SECTORIALES/LINEAMIENTOS%20DE%20ESTRATEGIA%
20ENERGETICA%20SURAMERICANA.pdf. Accessed on: 05 Jan. 2018.

280
UNASUR, 2008b, Declaración Del I Consejo Energético de Suramérica. Caracas:
UNASUR. Available at: http://www.iri.edu.ar/wp-content/uploads/2016/10/bo-
alatina57-unasur-consejoenergetico.pdf. Accessed on: 06 Jan. 2018.
UNASUR, 2011, Tratado Constitutivo de la Unión de Naciones Suramericanas. Quito,
Equador: UNASUR). Available at:
http://www.unasursg.org/images/descargas/DOCUMENTOS%20CONSTITUTIVOS
%20DE%20UNASUR/Tratado-UNASUR-solo.pdf. Accessed on: 06 Jan. 2018.
UNASUR, 2013, Potencial de Recursos Energéticos y Minerales em América del Sur.
Unión de Naciones Suramericanas, Quito. Available at:
http://www.unasursg.org/uploads/3c/c7/3cc78ee394cd00b8b28a8f4c6df5e567/Poten
cial-Recursos-Energeticos-y-Minerales-en-AS.pdf. Accessed on: 07 Jan. 2018.
UNASUR, 2014, V Reunión Ordinaria del Cosiplan. Montevidéu: Cosiplan/UNASUR.
Available at:
http://www.iirsa.org/admin_iirsa_web/Uploads/Documents/cn25_montevideo14_Car
tera_COSIPLAN_2014.pdf. Accessed on: 07 Jan. 2018.
UNASUR-COSIPLAN, 2012, Cartera de Proyectos del COSIPLAN 2012. Available at:
http://www.iirsa.org/admin_iirsa_web/Uploads/Documents/Informe%20de%20la%2
0Cartera%20de%20Proyectos%20del%20COSIPLAN%202012.pdf. Accessed on: 08
Jan. 2018.
UNASUR-COSIPLAN, 2013, Cartera de Proyectos del COSIPLAN 2013. Available at:
http://www.iirsa.org/admin_iirsa_web/Uploads/Documents/lb13_completo_alta.pdf.
Accessed on: 08 Jan. 2018.
UNASUR-COSIPLAN, 2014, Cartera de Proyectos del COSIPLAN 2014. Available at:
http://www.iirsa.org/admin_iirsa_web/Uploads/Documents/cn25_montevideo14_Car
tera_COSIPLAN_2014.pdf. Accessed on: 08 Jan. 2018.
UNASUR-COSIPLAN, 2015, Cartera de Proyectos del COSIPLAN 2015. Available at:
http://www.iirsa.org/admin_iirsa_web/Uploads/Documents/CARTERA_InformeVer
sionFinal_Espa%C3%B1ol_2015.pdf. Accessed on: 08 Jan. 2018.

281
UNASUR-COSIPLAN, 2016, Cartera de Proyectos del COSIPLAN 2016. Available at:
http://www.iirsa.org/admin_iirsa_web/Uploads/Documents/Cartera%202016_web.pd
f. Accessed on: 08 Jan. 2018.
UNASUR-COSIPLAN, 2017, Cartera de Proyectos del COSIPLAN 2017. Available at:
http://www.iirsa.org/admin_iirsa_web/Uploads/Documents/CARTERA_DIGITAL.p
df. Accessed on: 08 Jan. 2018.
UNCTAD, 2010, The future energy matrix and renewable energy - implications for
energy and food security. Trade and Development Commission, Multi-year Expert
Meeting on Commodities and Development Second session Geneva, 24-25 March.
UNCSD, 2013, Sustainable development scenarios for Rio+20: A Component of the
Sustainable Development in the 21st Century (SD21) project. New York: United
Nations Department of Economic and Social Affairs, Division for Sustainable
Development. Available at:
https://sustainabledevelopment.un.org/content/documents/793SD21%20scenario%20
report.pdf. Accessed on: 21 Dec. 2017.
UNDP, 2000, World Energy Assessment, energy and the challenge of sustainability.
UNDP, New York.
UNDP, 2004, World Energy Assessment, overview 2004 update. UNDP, New York.
UNDP, 2009, The Energy Access Situation in Developing Countries, a review focusing
on the Least Developed Countries and Sub-Saharan Africa. New York.
UNDP, 2011, UNDP and energy access for the poor, Energizing the Millennium
Development Goals. United Nations Development Programme, New York.
UPME, 2013, Plan De Expansion De Referencia Generacion - Transmisión 2013-2027,
Colombia. Unidad de Planeacion Minero Energetica Ministerio de Minas y Energia,
Bogotá. Available at:
http://www.upme.gov.co/Docs/Plan_Expansion/2013/Plan_GT_2013-
2027_Vdefinitiva.pdf. Accessed on: 27 Feb. 2017.
282
US EIA, 2015, International Energy Source Data: Petroleum, Natural Gas, Coal and
Electricity. US Energy Information Administration, Washington. Available at:
http://www.eia.gov/beta/international/. Accessed on: 18 Jun. 2017.
US EPA, 2014, Emission Factors for Greenhouse Gas Inventories. US Environmental
Protection Agency, Washington. Available at:
http://www.epa.gov/ghgreporting/documents/pdf/2013/documents/memo-2013-
technical-revisions.pdf. Accessed on: 18 Jun. 2017.
USGS, 2006, World Coal Quality Inventory: Bolivia, Ecuador, Paraguay, and Uruguay.
United States Geological Survey, Reston. Available at:
http://pubs.usgs.gov/of/2006/1241/Chapter%208-
Bolivia_Ecuador_Paraguay_Uruguay.pdf. Accessed on: 21 Mar. 2017.
VAINER, C., NUTI, M., 2008, A integração energética sul-americana: subsídios para
uma agenda socioambiental. Brasília: INESC.
VAN BLIJSWIJK, M., DE VRIES, L.J., 2011, Managing congestion in the Dutch
transmission grid. Delft University of Technology, Delft, the Netherlands.
VAN DER HOEVEN, M., 2011, “Ensuring energy security in times of uncertainty”,
World Energy Insight, Available at:
www.firstmagazine.com/DownloadSpecialistPublicationDetail.508.ashx. Accessed
on: 15 Aug. 2016.
VARELA, D., 2015, “Libre Tránsito de Energía en el Mercosur”. 5th Latin America
Energy Economics Meeting (ELAEE), Medellín, Colombia, 16-18 March.
VÉLEZ, J.A.O., 2005, Condições Econômicas e Institucionais para a Integração
Energética na América do Sul. Master dissertation, IE/UFRJ, Rio de Janeiro, Brazil.
VENABLES, A.J., 2003, “Winners and losers from regional integration agreements”, The
Economic Journal, v. 113, n. 490 (Out), pp. 747-761.
VERA, I., LANGLOIS, L., 2007, “Energy indicators for sustainable development”,
Energy, v. 32, pp. 875–882.
VIVODA, V., 2010, “Evaluating energy security in the Asia-Pacific region: A novel
methodological approach”, Energy Policy, v. 38, pp. 5258–5263. Available at:

283
http://www.sciencedirect.com/science/article/pii/S030142151000399X?via%3Dihub.
Accessed on: 20 Feb. 2017.
VIVODA, V., 2009, “Resource nationalism, bargaining and international oil companies,
challenges and change in the new millennium”, New Political Econ., v. 14, pp. 517–
534, Available at:
http://www.tandfonline.com/doi/abs/10.1080/13563460903287322. Accessed on: 15
Jun. 2017.
VMME, 2014, Balance Nacional de Electricidad 2013 Paraguay. Vice Ministerio de
Minas y Energía, Assunción Available at:
http://www.ssme.gov.py/vmme/pdf/balance2013/BalanceEnergeticoNacional2013.pd
f. Accessed on: 19 Mar. 2017.
VMME, 2015, Balance Nacional de Electricidad 2014 Paraguay. Vice Ministerio de
Minas y Energía, Assunción Available at:
http://www.ssme.gov.py/vmme/pdf/balance2014/Balance%20Energetico%20Nacion
al%202014-Final-3.pdf. Accessed on: 19 Mar. 2017.
VON HIPPEL, D., SUZUKI, T., WILLIAMS, J.H., et al., 2011, “Energy security and
sustainability in Northeast Asia”, Energy Policy, v. 39, pp. 6719–6730. Available at:
http://www.sciencedirect.com/science/article/pii/S0301421509005138?via%3Dihub.
Accessed on: 18 Sep. 2017.
WÆVER, O., 1995, “Securitization and Desecuritization”. In: LIPSCHUTZ, R. (ed.). On
Security. New York: Columbia University Press, pp. 46–86.
WÆVER, O., 1998, “Security, Insecurity and Asecurity in the West-European NonWar
Community”. In: ADLER, E., BARNETT, M. (eds.). Security Communities,
Cambridge: Cambridge University Press, pp. 69–118.
WÆVER, O., 2004, Aberystwyth, Paris, Copenhagen: New Schools in Security Theory
and the Origins between Core and Periphery. Montreal: ISA Conference, March.
WEBER, A., GRAEBER, D., SEMMIG, A., 2010, Market Coupling and the CWE
Project. Zeitschrift für Energiewirtschaft, 7.

284
WEC, 2007, Deciding the Future: Energy Policy Scenarios to 2050, London, UK.
Available at:
http://81.47.175.201/flagship/attachments/WE_scenarios_study_online.pdf. Accessed
on: 20 Dec. 2017.
WEC, 2013, World Energy Scenarios: composing energy futures to 2050. Available at:
https://www.worldenergy.org/publications/2013/world-energy-scenarios-composing-
energy-futures-to-2050/. Accessed on: 20 Dec. 2017.
WEC, 2013, World Energy Perspective Cost of Energy Technologies. World Energy
Council, London. Available at: https://www.worldenergy.org/wp-
content/uploads/2013/09/WEC_J1143_CostofTECHNOLOGIES_021013_WEB_Fin
al.pdf. Accessed on: 29 Apr. 2017.
WEC, 2015, Average electricity consumption per electrified household 2014. World
Energy Council, London. Available at: https://www.wec-
indicators.enerdata.eu/household-electricity-use.html. Accessed on: 28 Feb. 2017.
WEC, 2016, World Energy Scenarios 2016. Available at:
https://www.worldenergy.org/wp-content/uploads/2016/10/World-Energy-Scenarios-
2016_Full-Report.pdf. Accessed on: 20 Dec. 2017.
WEC, 2017, World Energy Scenarios 2017: Latin America & the Caribbean Energy
Scenarios, London, UK. Available at: https://www.worldenergy.org/wp-
content/uploads/2017/05/LAC-Scenarios_Full-Report_FINAL.pdf. Accessed on: 20
Dec. 2017.
WEINTRAUB, S., 2008, “Introdução”. In: WEINTRAUB, S., HESTER, A., PRADO, V.
R. (eds.). Cooperação Energética nas Américas: entraves e benefícios. Rio de Janeiro:
Elsevier, pp.1-40.
WELSCH, M., HOWELLS, M., HESAMZADEH, M., et al., 2015, “Supporting security
and adequacy in future energy systems – the need to enhance long-term energy
system models to better treat issues related to variability”, Int J Energy Res., v. 39,
pp. 377–396.
WESLEY, M., 2007, Energy Security in Asia, Routledge, London, UK.

285
WINZER, C., 2012, “Conceptualizing energy security”, Energy Policy, v. 46, pp. 36–48.
Available at:
http://www.sciencedirect.com/science/article/pii/S0301421512002029?via%3Dihub.
Acessed on: 9 Sep. 2017.
WORLD BANK, 2015, Electric power consumption (kWh per capita). World Bank,
Washington. Available at:
http://data.worldbank.org/indicator/EG.USE.ELEC.KH.PC. Accessed on: 19 Apr.
2017.
YAO, L., CHANG, Y., 2014, “Energy security in China: A quantitative analysis and
policy implications”, Energy Policy, v. 67, pp. 595–604. Available at:
http://www.sciencedirect.com/
science/article/pii/S0301421513013116?via%3Dihub. Accessed on: 10 Aug. 2017.
YEATS, A.J., 1998, “Does Mercosur’s trade performance raise concerns about the effects
of regional trade arrangements?”, World Bank Economic Review, v. 12, n. 1 (Jan), pp.
1-28.
YÉPEZ, A., LEVY, A., VALENCIA J., A.M., 2016, The Energy Sector: opportunities
and challenges. IDB Technical Note 967.
YERGIN, D., 1988, “Energy Security in the 1990s”, Foreign Affairs, v. 67, n. 1, pp. 110–
132.
YERGIN, D., 1991, The Prize, The Epic Quest for Oil, Money, and Power. Simon &
Schuster, New York.
YERGIN, D., 2006, “Ensuring Energy Security”, Foreign Affairs, v. 85, n. 2, pp. 69-82.
ZANELLA, C.K., 2009, Energia e integração: oportunidade e potencialidades da
integração gasífera na América do Sul. Ijuí: Ed. Unijuí.
ZANETTE, A.L., 2013, “Eletricity integration in South America and the lessions from
international experiences”. 4º Congreso de la Asociación Lationamericana de
Economía de la Energía – ALADEE, Montevideo/Uruguai.
ZHANG, Y–F., PARKER, D., KIRKPATRICK, C., 2008, “Electricity Sector Reform in
Developing Countries: An Econometric Assessment of the Effects of Privatization,

286
Competition and Regulation”, Journal of Regulatory Economics, v. 33, n. 2, pp. 159–
78.
ZHANG, H-Y., JI, Q., FAN, Y., 2013, “An evaluation framework for oil import security
based on the supply chain with a case study focused on China”, Energy Econ, v. 38,
pp. 87–95.