
Reduction of geometric and intensity distortions in echo-planar imaging using a multireference scan
11
Reduction of Geometric and Intensity Distortions in Echo-Planar Imaging Using a Multireference Scan Xin Wan, Grant T. Gullberg, Dennis L. Parker, Gengsheng L. Zeng Echo-planar imaging (EPI) is very sensitive to patient-induced field inhomogeneity caused by susceptibility changes be- tween different anatomical regions. This results in geometric and intensity distortions in the image, especially near tissue/ air and tissue/bone interfaces. A new approach is presented to reduce geometric and intensity distortions in EPI. A phase- encoded multireference scan is used to estimate the ampli- tude and phase errors in the measured signals due to the field inhomogeneity. The EPI data is corrected using both the am- plitude and phase of the measured errors. This technique has been evaluated using EPI pulse sequences implementedwith conventional gradients and implemented with imaging sys- tems that have special resonating gradientsand fast analog to digital converters. The results in both phantom and human studies show that in the absence of object motion the new correction technique can effectively reduce the geometric and intensity distortions. Key words: echo-planar imaging; rapid imaging; geometric distortion; phase correction. INTRODUCTION Echo-planar imaging (EPI) was first proposed by Mans- field in 1977 (1) and since then variations of the original echo-planar pulse sequence have been developed (2, 3). A single-shot echo-planar pulse sequence can acquire, in less than 100 ms, all of the data points required for reconstruction of a two-dimensional (2D) image after a single radiofrequency (RF) excitation pulse. This elimi- nates many of the physiological motion artifacts caused by cardiac activity, blood flow, bowel peristalsis, breath- ing, or the voluntary movements of severely ill or unco- operative patients. Additionally, EPI is useful for obtain- ing a true T,-weighted contrast (spin-echo EPI) or true T2*-weighted contrast (gradient echo EPI) independent of any T, weighting, because the repetition time can be made arbitrarily long. However, the long echo readout time required by EPI combined with large internal mag- netic field inhomogeneity caused by susceptibility differ- ences near tissuelair and tissuetbone interfaces result in large geometric and intensity distortions in single-shot EPI images. Thus, it is important to develop methods that can reduce these severe image artifacts if EPI is to be an effective diagnostic tool. MRM 32932-944 (1997) From the Medical Imaging Research Laboratory, Department of Radiology, University of Utah, Salt Lake City, Utah. Address correspondence to: Grant T. Gullberg, Ph.D.. Medical Imaging Research Laboratory, Department of Radiology, University of Utah School of Medicine, Salt Lake City, UT 84132. Received February 19,1996; revised December 6,1996; accepted Decem- ber 13, 1996. Copyright 0 1997 by Williams B Wilkins All rights of reproduction in any form reserved. 0740-3194/97 $3.00 EPI is very sensitive to patient-induced field inhomo- geneity. Even though the EP imaging time is short, the EPI data sampling time of 100 ms is long compared with that of conventional imaging sequences where typically data are acquired during an 8-ms interval following each repeated RF excitation. The T,* is quite short near tissue/ air and tissuelbone interfaces because of the large sus- ceptibility differences between these regions. The signals from regions near these interfaces dephase quickly rela- tive to those from homogeneous tissue regions. The longer the data sampling time, the larger the differences in phase of the spins between regions of large suscepti- bility differences. The resulting amplitude and phase dispersions produce both geometric and intensity distor- tions in the EPI magnitude images. In addition, even in regions of fairly uniform magnetic field, the T2*decay in the signal intensity during the long data sampling time in single-shot EPI results in deterioration of spatial resolu- tion. Various methods have been proposed to correct for geometric and intensity distortions caused by patient- induced field inhomogeneity. Weisskoff and Davis (4) and Jezzard and Balaban (5) suggested that geometric distortions in EPI could be corrected using a field map calculated from offset spin echo images. In principle, this method should correct geometric distortions provided an accurate field map can be obtained: however, it is hard to determine phase changes near tissue/air and tissuetbone interfaces because of phase wrapping that results from using the arctangent function in calculating the field map. Also, the offset spin-echo pulse sequence used to measure the field inhomogeneity is very different from an EPI pulse sequence. In fact, because of the fast readout gradient transitions in the EPI sequence, eddy currents will result, which will in turn cause additional field inhomogeneity. Thus, the magnetic field inhomogeneity, which is mapped during the field measurement se- quence, will be different from the field that actually occurs during the EPI sequence. Bowtell et al. (6) pro- posed a correction method based on two images acquired in opposite phase encoding directions. This technique should also be able to correct geometric distortions caused by susceptibility differences. However, this tech- nique may have blurring artifacts near the edge of the image because of T2* decay. In this work, we present a new method to reduce geometric and intensity distortions in single-shot EPI. Instead of measuring the field inhomogeneity, this method uses a set of reference scans, which we refer to as a multireference scan (7). to calculate phase and ampli- tude errors for every sample in the EPI data relative to measurements for the same phase encoding values ob- tained at the center of the spin echo. These measured errors are applied to the acquired EPI data to correct 932
-
Upload
independent -
Category
Documents
-
view
3 -
download
0
Transcript of Reduction of geometric and intensity distortions in echo-planar imaging using a multireference scan

Reduction of Geometric and Intensity Distortions in Echo-Planar Imaging Using a Multireference Scan Xin Wan, Grant T. Gullberg, Dennis L. Parker, Gengsheng L. Zeng
Echo-planar imaging (EPI) is very sensitive to patient-induced field inhomogeneity caused by susceptibility changes be- tween different anatomical regions. This results in geometric and intensity distortions in the image, especially near tissue/ air and tissue/bone interfaces. A new approach is presented to reduce geometric and intensity distortions in EPI. A phase- encoded multireference scan is used to estimate the ampli- tude and phase errors in the measured signals due to the field inhomogeneity. The EPI data is corrected using both the am- plitude and phase of the measured errors. This technique has been evaluated using EPI pulse sequences implemented with conventional gradients and implemented with imaging sys- tems that have special resonating gradients and fast analog to digital converters. The results in both phantom and human studies show that in the absence of object motion the new correction technique can effectively reduce the geometric and intensity distortions. Key words: echo-planar imaging; rapid imaging; geometric distortion; phase correction.
INTRODUCTION
Echo-planar imaging (EPI) was first proposed by Mans- field in 1977 (1) and since then variations of the original echo-planar pulse sequence have been developed (2, 3). A single-shot echo-planar pulse sequence can acquire, in less than 100 ms, all of the data points required for reconstruction of a two-dimensional (2D) image after a single radiofrequency (RF) excitation pulse. This elimi- nates many of the physiological motion artifacts caused by cardiac activity, blood flow, bowel peristalsis, breath- ing, or the voluntary movements of severely ill or unco- operative patients. Additionally, EPI is useful for obtain- ing a true T,-weighted contrast (spin-echo EPI) or true T2*-weighted contrast (gradient echo EPI) independent of any T, weighting, because the repetition time can be made arbitrarily long. However, the long echo readout time required by EPI combined with large internal mag- netic field inhomogeneity caused by susceptibility differ- ences near tissuelair and tissuetbone interfaces result in large geometric and intensity distortions in single-shot EPI images. Thus, it is important to develop methods that can reduce these severe image artifacts if EPI is to be an effective diagnostic tool.
MRM 32932-944 (1997) From the Medical Imaging Research Laboratory, Department of Radiology, University of Utah, Salt Lake City, Utah. Address correspondence to: Grant T. Gullberg, Ph.D.. Medical Imaging Research Laboratory, Department of Radiology, University of Utah School of Medicine, Salt Lake City, UT 84132. Received February 19,1996; revised December 6,1996; accepted Decem- ber 13, 1996.
Copyright 0 1997 by Williams B Wilkins All rights of reproduction in any form reserved.
0740-3194/97 $3.00
EPI is very sensitive to patient-induced field inhomo- geneity. Even though the EP imaging time is short, the EPI data sampling time of 100 ms is long compared with that of conventional imaging sequences where typically data are acquired during an 8-ms interval following each repeated RF excitation. The T,* is quite short near tissue/ air and tissuelbone interfaces because of the large sus- ceptibility differences between these regions. The signals from regions near these interfaces dephase quickly rela- tive to those from homogeneous tissue regions. The longer the data sampling time, the larger the differences in phase of the spins between regions of large suscepti- bility differences. The resulting amplitude and phase dispersions produce both geometric and intensity distor- tions in the EPI magnitude images. In addition, even in regions of fairly uniform magnetic field, the T2* decay in the signal intensity during the long data sampling time in single-shot EPI results in deterioration of spatial resolu- tion.
Various methods have been proposed to correct for geometric and intensity distortions caused by patient- induced field inhomogeneity. Weisskoff and Davis (4) and Jezzard and Balaban (5) suggested that geometric distortions in EPI could be corrected using a field map calculated from offset spin echo images. In principle, this method should correct geometric distortions provided an accurate field map can be obtained: however, it is hard to determine phase changes near tissue/air and tissuetbone interfaces because of phase wrapping that results from using the arctangent function in calculating the field map. Also, the offset spin-echo pulse sequence used to measure the field inhomogeneity is very different from an EPI pulse sequence. In fact, because of the fast readout gradient transitions in the EPI sequence, eddy currents will result, which will in turn cause additional field inhomogeneity. Thus, the magnetic field inhomogeneity, which is mapped during the field measurement se- quence, will be different from the field that actually occurs during the EPI sequence. Bowtell et al. (6) pro- posed a correction method based on two images acquired in opposite phase encoding directions. This technique should also be able to correct geometric distortions caused by susceptibility differences. However, this tech- nique may have blurring artifacts near the edge of the image because of T2* decay.
In this work, we present a new method to reduce geometric and intensity distortions in single-shot EPI. Instead of measuring the field inhomogeneity, this method uses a set of reference scans, which we refer to as a multireference scan (7). to calculate phase and ampli- tude errors for every sample in the EPI data relative to measurements for the same phase encoding values ob- tained at the center of the spin echo. These measured errors are applied to the acquired EPI data to correct
932
Reduction of Geometric and Intensity Distortion in EPI 933
either phase only or both amplitude and phase errors. We show that this correction technique works for changes in image intensity between the multireference scan and the EPI scan. Although the multireference scan requires many RF excitations, it can then be applied to the large image data sets obtained in functional MR and contrast bolus studies. However, the technique will probably not work for complicated object motion like cardiac motion.
The multireference correction technique is evaluated using data obtained from an EPI pulse sequence with conventional gradients (EPI-CG) on the GE 1.5 T SIGNA system (GE Medical Systems, Milwaukee, WI). The EPI-CG sequence acquires data during both the flat and ramping parts of the readout gradient. Also, the new correction method was evaluated using an EPI sequence (EPI-ANMR) with the ANMR system (Advanced NMR Systems, Inc., Wilmington, MA]. The EPI-ANMR pulse sequence samples the data during a fast sinusoidal switching gradient with a variable sampling rate so that the k-space is uniformly sampled. It is shown that this correction technique effectively reduces both geometric and intensity distortions.
THEORY Geometric Distortion in EPI
In contrast with conventional MR techniques, where the acquisition of each line in k-space requires an RF exci- tation pulse, the EPI sequence acquires many lines of k-space in a continuous trajectory after a single RF exci- tation. The components of k, and k, are given by (8-10)
111
k,(t) = y G,(t')dt' 121 I: where y is the gyromagnetic ratio (2.68 X 10' rad s-l T-' for protons), and CJt) and GJt) are the time varying gradi- ent fields in the x and y directions which are also called readout and phase encoding directions, respectively.
90' 180'
RF 0 Slice r\ PI-
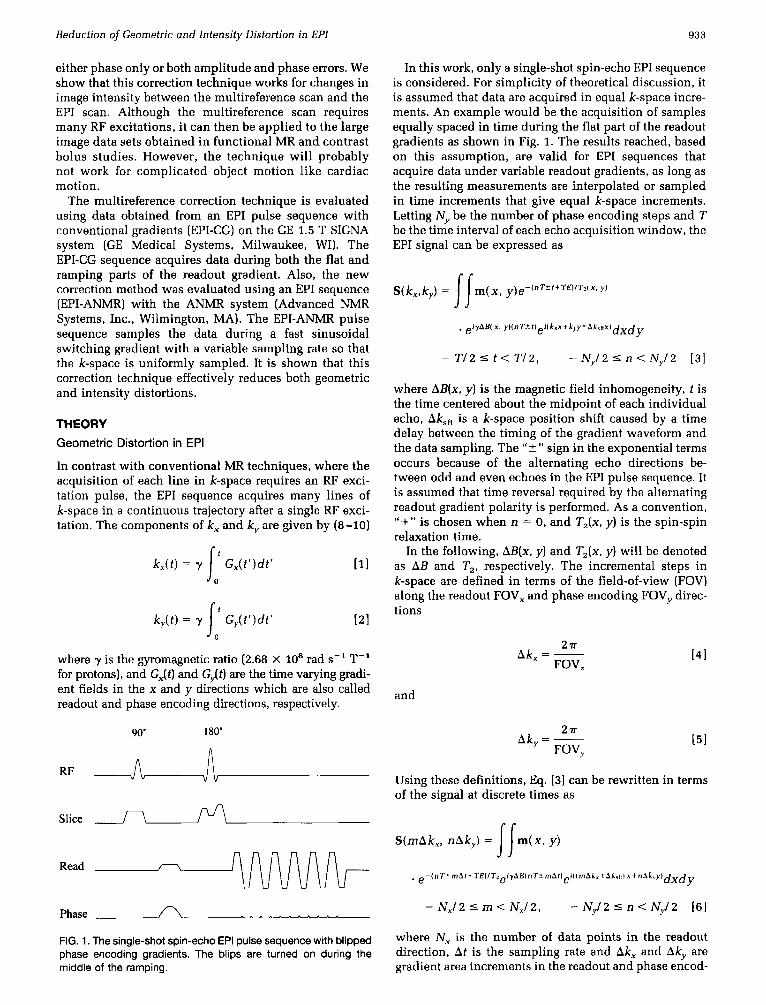
Read -n m m Phase r\ * . . . . . . FIG. 1. The single-shot spin-echo EPI pulse sequence with blipped phase encoding gradients. The blips are turned on during the middle of the ramping.
In this work, only a single-shot spin-echo EPI sequence is considered. For simplicity of theoretical discussion, it is assumed that data are acquired in equal k-space incre- ments. An example would be the acquisition of samples equally spaced in time during the flat part of the readout gradients as shown in Fig. 1. The results reached, based on this assumption, are valid for EPI sequences that acquire data under variable readout gradients, as long as the resulting measurements are interpolated or sampled in time increments that give equal k-space increments. Letting N, be the number of phase encoding steps and T be the time interval of each echo acquisition window, the EPI signal can be expressed as
where AB(x, y ) is the magnetic field inhomogeneity, t is the time centered about the midpoint of each individual echo, Ak,, is a k-space position shift caused by a time delay between the timing of the gradient waveform and the data sampling. The "2'' sign in the exponential terms occurs because of the alternating echo directions be- tween odd and even echoes in the EPI pulse sequence. It is assumed that time reversal required by the alternating readout gradient polarity is performed. As a convention, "+" is chosen when n = 0, and TJx, y ) is the spin-spin relaxation time.
In the following, AB(x, y] and TJx, y) will be denoted as AB and T,, respectively. The incremental steps in k-space are defined in terms of the field-of-view (FOV) along the readout FOV, and phase encoding FOV, direc- tions
and
141
Using these definitions, Eq. [3] can be rewritten in terms of the signal at discrete times as
S(mAk,, nAky) = m(x, y ) 55 - N x / 2 5 m < N J 2 , - Ny/ 2 I n < N,/ 2 161
where N, is the number of data points in the readout direction, A t is the sampling rate and Akx and Aky are gradient area increments in the readout and phase encod-
934 Wan et al.
ing directions, respectively. Equation [6] can be rewritten as
,-,-
S(mAk,, nAk,.) = m(x, y)@( ? mAf) J J where
and
q(r(nT) = eiYAB"r [91
are phase terms varying with time along the readout (frequency) and phase encoding directions, respectively.
Depending on the distribution of the field inhomoge- neity, both phase terms @(?mat) and V(nT) can cause phase distortions and position shifts of the signal mea- surements in k-space along the readout and phase encod- ing directions. The time shift term eziAksfix causes k-space shifts in the opposite directions for even and odd echoes. The relative position shift in k-space between even and odd echoes, because of alternating readout gradients, leads to the so-called N/2 ghost. In general, the distorted phases result in geometric and intensity distortions in the image. In addition to the ghosting artifact, regions with field inhomogeneity will be misregistered in posi- tion, modulated in intensity and scaled in size (11) ac- cording to Eq. [7]. Since T is at least N, times greater than Af, the geometric and intensity distortions are much worse in the phase encoding direction because the phase accumulation is proportional to time. Also, the T, decay term causes a blurring artifact in echo-planar images and hence spatial resolution loss (11). However, the geomet- ric and intensity distortions result mainly from phase errors.
Reduction of Ghost Using a Single Reference Scan
The N/2 ghost due to the position shift in k-space (-t
Ak,,) can be reduced by using a nonlinear phase correc- tion technique based on a single reference scan (12-14). The reference scan is performed by turning off the blipped phase encoding gradients of the EPI pulse se- quence. A uniform position shift in k-space corresponds to a phase shift in the image space (Fourier-shift theorem) in the one-dimensional ( ID) case. Because of the com- plexity of the field inhomogeneity distribution, the posi- tion shifts of k-space data are not uniform and the corre- sponding phase shifts in the image space are nonlinear.
The nonlinear phase errors can be evaluated by com- paring each of the 1D Fourier transforms (projections) of the single reference scan echoes with respect to the 1 D Fourier transform of the echo acquired near the spin- echo center based on the following equation:
Ad4x) = arg(%(x)/%(x)) [ lo1 where s , ( x ) is the I D Fourier transform of the nth line of the measured reference scan, S,(k,), and s,(x) is the 1D Fourier transform of the chosen data line of the reference
scan, S,(k,). S,(k,) can be acquired as close as possible to the echo time of the spin echo and will thereby suffer least from phase distortions. It is assumed in Eq. [ lo ] that the projections are only phase distorted. This assumption is true only if the field inhomogeneities AB(x, y) are small enough so that the contribution from q(n7') in Eq. [7] can be ignored.
The nonlinear phase correction can be applied to the measured EPI data as follows
S'( x, nAk,,) = S( x, nAkv)e'A6n"' [111
where S'(x, nAk,,) is the corrected I D Fourier transform of the nth line of the measured EPI data S(k,, nAk,.). This correction will be denoted as CORRECTION -TECH- NIQUE 1 hereafter. The second Fourier transform is then performed in the phase encoding direction following the nonlinear phase correction to produce the final image. This correction technique corrects the position shift of k-space data (? Aksft) caused by the time shift and, thus, reduces the N / 2 ghost artifact. The phase term in Eq. [11] also corrects some of the extra distortion caused by the inhomogeneity term, @(?rnAt).
Reduction of Geometric and Intensity Distortions Using a Mu It i reference Scan
The phase error q(nT) term in Eq. [7] cannot be cor- rected using the nonlinear phase correction based on the single reference scan mentioned in the previous section. Because this term results in a linear phase shift for the k-space signal in the phase encoding direction, the slope of which is proportional to the field inhomogeneity, the resulting artifact is a direct geometric (and potentially intensity) distortion of the image due to the field inho- mogeneity. Because of the position dependence of the phase error terms, Eq. [6] cannot be directly simplified. However, a relationship between the measured signal, S, and the undistorted signal, So, can be written as:
S(mAk,, nAk,) = F(m, n)S,,(mAk,y, nAk,.) [12]
with
where F(m, n) is a complex number and S,(mAk,, nAk,) is the signal that has the same frequency and phase encoding as S(mAk,, nAk,), but with minimal decay and phase errors. We note that if AB and T, were constant as a function of position, Eq. [I21 would give an analytical solution for F(m, n). To the extent that AB and T, are slowly varying functions of position, the factor F(m, n ) is a valid approximation.
The factor, F ( m , n ) , is the relationship between the signal that would be measured at the time of the echo center and the signal obtained at its actual time of mea- surement. The relationship must be determined sepa- rately for each line of k-space. One way to accomplish this is to repeat the EPI pulse sequence N , times without
Reduction of Geometric and Intensity Distortion in EPI 935
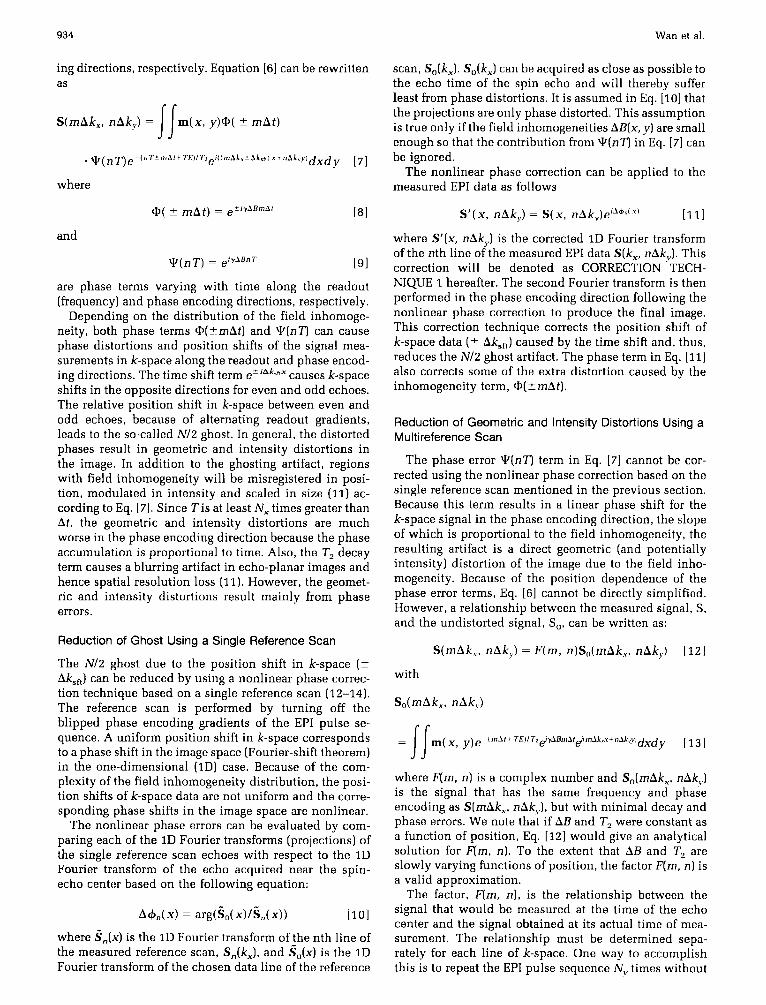
phase encoding blips during the readout period. As shown in Fig. 2, during the ith reference scan, (i-1) phase encoding blips are played out before readout gradients so that all data from the ith excitation are phase encoded equally, where i = n + NJ2 + 1. The data of the ith reference scan can be expressed as
YY'dxdy [14]
where 1 = -NJ2 , -NJ2 + 1, . . ., N J 2 - 1 correspond to the first, second, . . ., NYth echo, &d so on.
. eiyABOTzmAt) i(rnAk,x+nAk e
Based on Eq. [12], a filter can be formulated as
F-'(m, n) = R,(mAk,, nAk,)lR,(mAk,y, nAk!,) [15]
where F-'(m, n) is the reciprocal of F(m, n). Once the filter F-'(m, n) is evaluated for all m and n, a corrected EPI data set can be obtained by
S'(mAk,, nAk,) = F-'(m, n)S(mAk,, nAkJ [16]
Since the corrected EPI data, S'(mAk,, nAky), have min- imal decay and phase error, the geometric and intensity distortions in the image will be greatly reduced.
The position shift between odd and even echoes in k-space results in a linear phase shift in the readout direction in the projection space (p-space) data that al- ternates in sign as a function of the phase encoding index. Here, the p-space is defined as the 1D Fourier transform along the readout direction of k-space (12). This position shift can be corrected by calculating the phase correction from the multireference scan in the projection space (p-space). The correction is performed using a p-space filter defined as
P- ' (m' , n) = R,(m'Ax, nAk,)lR,(m'Ax, nAk,) [17]
where h,(m'Ax, nAk,) and kn(m'Ax, nAk,,) are the p- space projections of R,(mAk,, nAky) and R,(mAk,, nhk,) , respectively. A nonlinear phase correction can be applied to the projections of the EPI data using only the
90" 180"
RF L Slice r\ N
argument of P-'(m', n). This step corrects the echo po- sition shift and some of the distorted phases. The phase corrected projections are transformed back to the k-space where the filter F-'(m, n) can be applied to correct ad- ditional phase distortions.
The filter described by Eq. [15] will be very sensitive to noise in regidns where the magnitude of the denominator is close to zero. This spike-like behavior of the filter results in magnification of noise. The spikes can be re- moved, for example, by applying a median filter to F ' ( m , n) before the data correction.
It should be pointed out that the proposed geometric distortion correction based on a multireference scan is exact if the noise is ignored and the image intensity distribution, m(x, y), is unchanged between the reference scan and EPI scan. For a dynamically changing image intensity distribution with no object motion, this correc- tion still should be a good approximation based on the fact that the geometric information of the image is mainly contained in the phases of the k-space signal (15).
METHODS AND MATERIALS EPI-CG Pulse Sequence
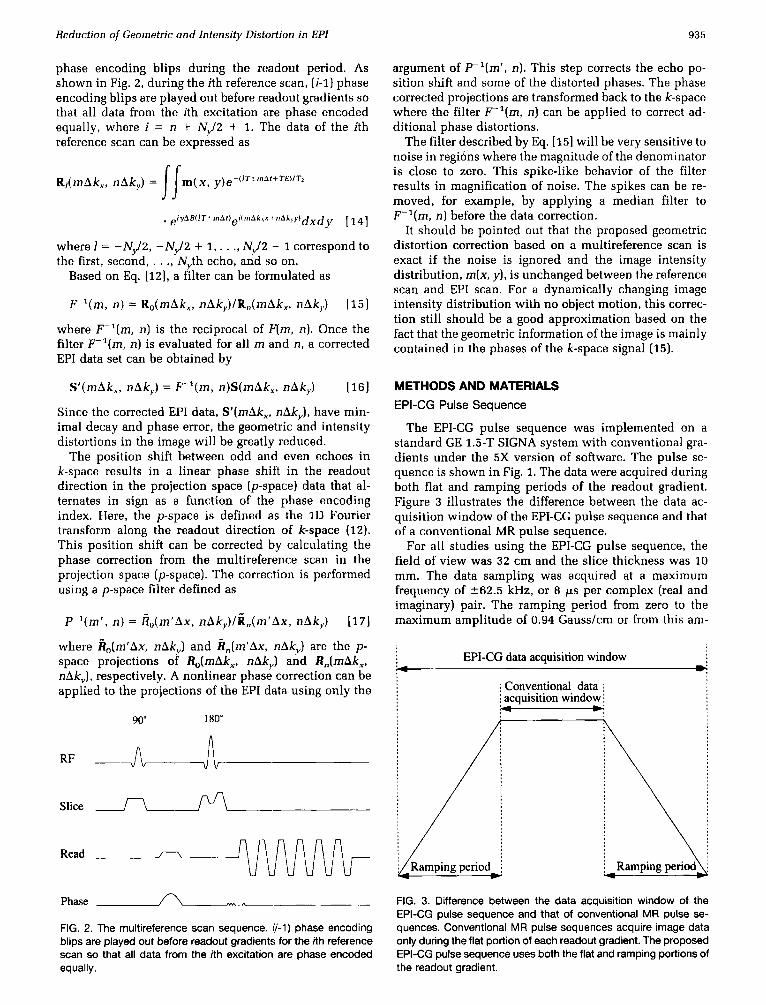
The EPI-CG pulse sequence was implemented on a standard GE 1.5-T SIGNA system with conventional gra- dients under the 5X version of software. The pulse se- quence is shown in Fig. 1. The data were acquired during both flat and ramping periods of the readout gradient. Figure 3 illustrates the difference between the data ac- quisition window of the EPI-CG pulse sequence and that of a conventional MR pulse sequence.
For all studies using the EPI-CG pulse sequence, the field of view was 32 cm and the slice thickness was 10 mm. The data sampling was acquired at a maximum frequency of 262.5 kHz, or 8 ps per complex (real and imaginary) pair. The ramping period from zero to the maximum amplitude of 0.94 Gausslcm or from this am-
EPI-CG data acquisition window I
CIonventional data icquisition window -
\ Ramping period
Phase A.L FIG. 2. The multireference scan sequence. (i-1) phase encoding blips are played out before readout gradients for the ith reference scan so that all data from the ith excitation are phase encoded equally.
FIG. 3. Difference between the data acquisition window of the EPI-CG pulse sequence and that of conventional MR pulse se- quences. Conventional MR pulse sequences acquire image data only during the flat portion of each readout gradient. The proposed EPI-CG pulse sequence uses both the flat and ramping portions of the readout gradient.
936 Wan et al .
plitude to zero was 500 ps. The width of the flat portion of the readout window was 520 ws (65 complex pairs). The phase encoding gradient was a half sine pulse of 160 ps with an amplitude of 0.07 Gausslcm centered halfway along each ramping period of the readout gradient. Sixty- four echoes, each having 190 data points, were acquired for each image for a total data acquisition time of 97.28 ms. The TE was 102 ms and the TR was 1000 ms. The single-shot EPI image was obtained first followed by the acquisition of the phase encoded multireference scan.
One phantom study was performed using a cylindrical plastic bottle filled with water. The bottle was positioned with the long axis of the bottle parallel to the axis of the main magnetic field. The EPI-CG pulse sequence was used to obtain a transaxial slice orthogonal to the axis of the magnetic field. The readout direction was anterior/ posterior (up/down in the image).
A second phantom study was performed using a coax- ial cylindrical phantom filled with water. This phantom was positioned upright with its long axis perpendicular to the main field. The EPI-CG sequence was used to obtain a coronal slice of the coaxial cylinder, for which the S/I phase encoding direction was parallel to the main magnetic field. The readout direction was right/left.
One study was performed on a healthy volunteer. The EPI-CG sequence was used to give a transaxial slice through the cerebellum and temporal lobes. A fat satura- tion pulse was used to reduce chemical shift artifacts between fat and water. The image was obtained with an effective TE of 120 ms and a TR of 1000 ms.
As an example to test the effectiveness of the proposed correction technique for a changing image intensity dis- tribution, a dynamic study using Gd-DTPA contrast agent was performed on a patient. A 10-mm transaxial slice of the brain was imaged with an effective TE of 115 ms and a TR of 1000 ms. One hundred twenty EPI-CG images were acquired. The patient received 0.1 mmol/kg of Gd- DTPA as a 10-s bolus injection in a dorsal vein of the hand, which was started 10 s after the start of the pulse sequence.
90' 180"
Slice r\ M
Phase
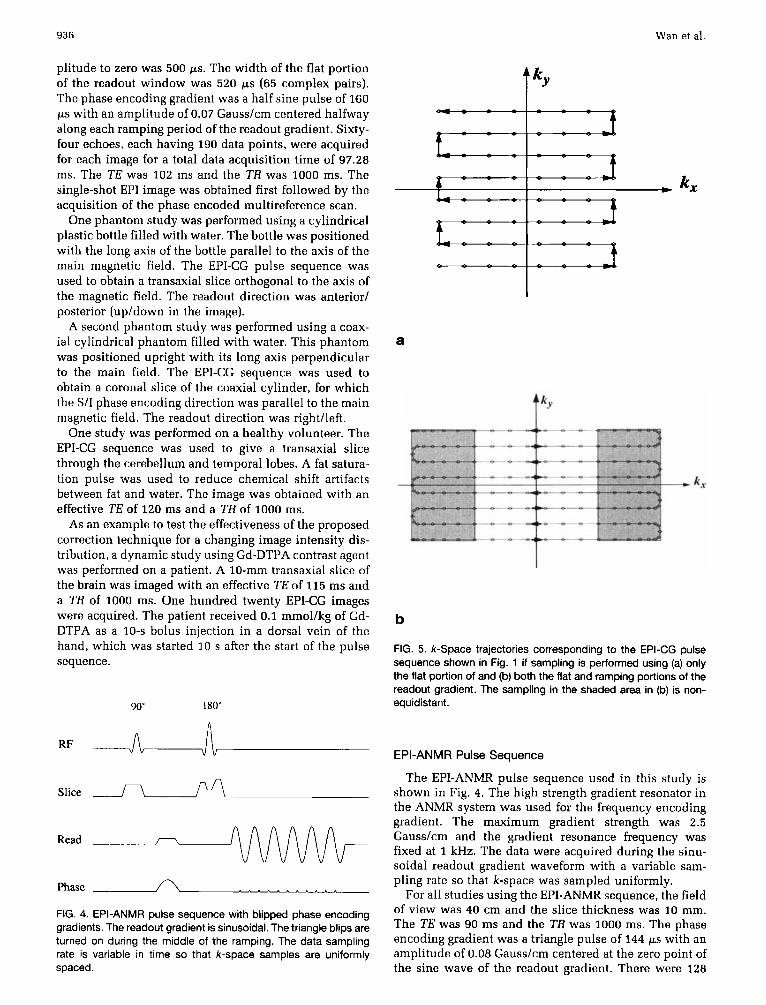
FIG. 4. EPI-ANMR pulse sequence with blipped phase encoding gradients. The readout gradient is sinusoidal. The triangle blips are turned on during the middle of the ramping. The data sampling rate is variable in time so that k-space samples are uniformly spaced.
t ky
a
tky
b
FIG. 5. k-Space trajectories corresponding to the EPI-CG pulse sequence shown in Fig. 1 if sampling is performed using (a) only the flat portion of and (b) both t h e flat and ramping portions of the readout gradient. The sampling in the shaded area in (b) is non- equidistant.
EPI-ANMR Pulse Sequence
The EPI-ANMR pulse sequence used in this study is shown in Fig. 4. The high strength gradient resonator in the ANMR system was used for the frequency encoding gradient. The maximum gradient strength was 2.5 Gauss/cm and the gradient resonance frequency was fixed at 1 kHz. The data were acquired during the sinu- soidal readout gradient waveform with a variable sam- pling rate so that k-space was sampled uniformly.
For all studies using the EPI-ANMR sequence, the field of view was 40 cm and the slice thickness was 10 mm. The TE was 90 ms and the TR was 1000 ms. The phase encoding gradient was a triangle pulse of 144 ps with an amplitude of 0.08 Gauss/cm centered at the zero point of the sine wave of the readout gradient. There were 128
Reduction of Geometric and Intensity Disfortion in EPI 937
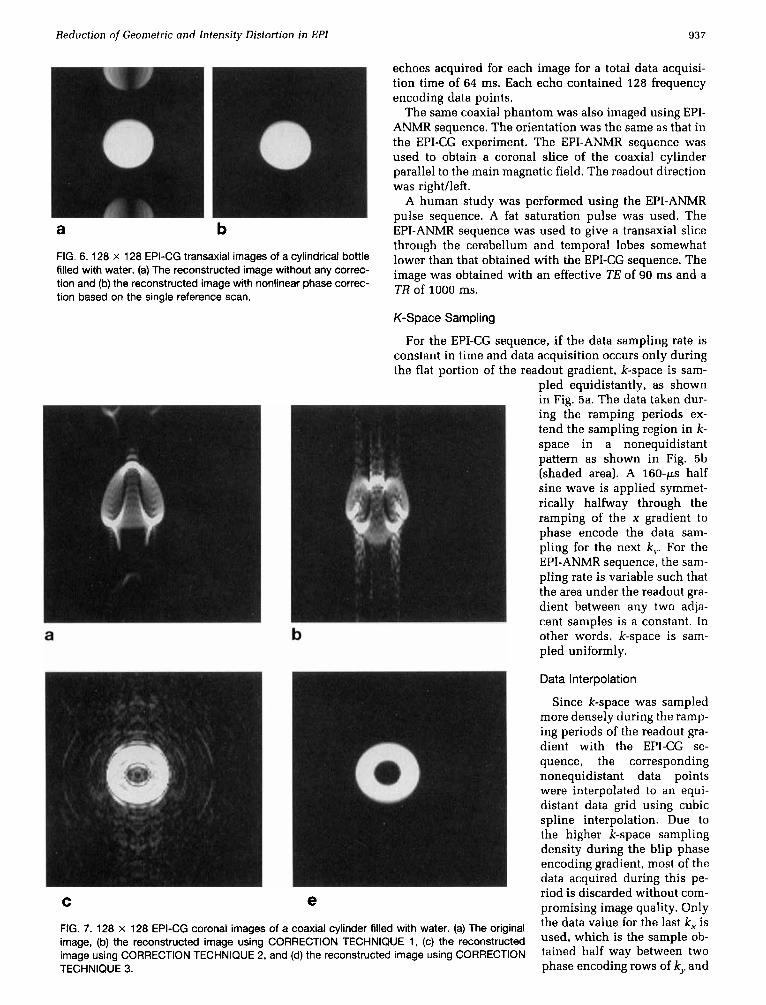
a b FIG. 6. 128 x 128 EPI-CG transaxial images of a cylindrical bottle filled with water. (a) The reconstructed image without any correc- tion and (b) the reconstructed image with nonlinear phase correc- tion based on the single reference scan.
echoes acquired for each image for a total data acquisi- tion time of 64 ms. Each echo contained 128 frequency encoding data points.
The same coaxial phantom was also imaged using EPI- ANMR sequence. The orientation was the same as that in the EPI-CG experiment. The EPI-ANMR sequence was used to obtain a coronal slice of the coaxial cylinder parallel to the main magnetic field. The readout direction was right/left.
A human study was performed using the EPI-ANMR pulse sequence. A fat saturation pulse was used. The EPI-ANMR sequence was used to give a transaxial slice through the cerebellum and temporal lobes somewhat lower than that obtained with the EPI-CG sequence. The image was obtained with an effective TE of 90 ms and a TR of 1000 ms.
a b
K-Space Sampling
For the EPI-CG sequence, if the data sampling rate is constant in time and data acquisition occurs only during the flat portion of the readout gradient, k-space is sam-
pled equidistantly, as shown in Fig. 5a. The data taken dur- ing the ramping periods ex- tend the sampling region in k- space in a nonequidistant pattern as shown in Fig. 5b (shaded area). A 1 6 0 - c ~ ~ half sine wave is applied symmet- rically halfway through the ramping of the x gradient to phase encode the data sam- pling for the next k,,. For the EPI-ANMR sequence-, the sam- pling rate is variable such that the area under the readout gra- dient between any two adja- cent samples is a constant. In other words, k-space is sam- pled uniformly.
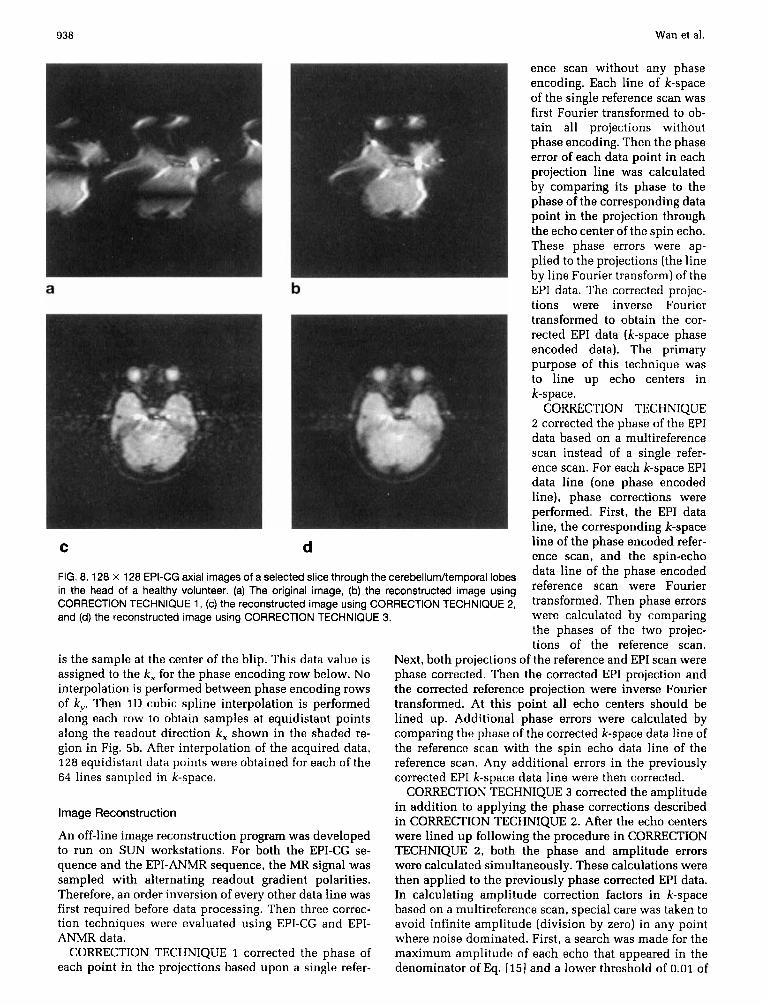
e FIG. 7. 128 x 128 EPI-CG coronal images of a coaxial cylinder filled with water. (a) The original image, (b) the reconstructed image using CORRECTION TECHNIQUE 1, (c) the reconstructed image using CORRECTION TECHNIQUE 2, and (d) the reconstructed image using CORRECTION TECHNIQUE 3.
Data Interpolation
Since k-space was sampled more densely during the ramp- ing periods of the readout gra- dient with the EPI-CG se- quence, the corresponding nonequidistant data points were interpolated to an equi- distant data grid using cubic spline interpolation. Due to the higher k-space sampling density during the blip phase encoding gradient, most of the data acquired during this pe- riod is discarded without com- promising image quality. Only the data value for the last k, is used, which is the sample ob- tained half way between two phase encoding rows of k, and
938 Wan et al.
a b
d
FIG. 8. 128 x 128 EPI-CG axial images of a selected slice through the cerebelludtemporal lobes in the head of a healthy volunteer. (a) The original image, (b) the reconstructed image using CORRECTION TECHNIQUE 1 , (c) the reconstructed image using CORRECTION TECHNIQUE 2, and (d) the reconstructed image using CORRECTION TECHNIQUE 3.
is the sample at the center of the blip. This data value is assigned to the k,y for the phase encoding row below. No interpolation is performed between phase encoding rows of k,. Then ID cubic spline interpolation is performed along each row to obtain samples at equidistant points along the readout direction k, shown in the shaded re- gion in Fig. 5b. After interpolation of the acquired data, 1 2 8 equidistant data points were obtained for each of the 64 lines sampled in k-space.
Image Reconstruction
An off-line image reconstruction program was developed to run on SUN workstations. For both the EPI-CG se- quence and the EPI-ANMR sequence, the MR signal was sampled with alternating readout gradient polarities. Therefore, an order inversion of every other data line was first required before data processing. Then three correc- tion techniques were evaluated using EPI-CG and EPI- ANMR data.
CORRECTION TECHNIQUE 1 corrected the phase of each point in the projections based upon a single refer-
ence scan without any phase encoding. Each line of k-space of the single reference scan was first Fourier transformed to ob- tain all projections without phase encoding. Then the phase error of each data point in each projection line was calculated by comparing its phase to the phase of the corresponding data point in the projection through the echo center of the spin echo. These phase errors were ap- plied to the projections (the line by line Fourier transform) of the EPI data. The corrected projec- tions were inverse Fourier transformed to obtain the cor- rected EPI data (k-space phase encoded data). The primary purpose of this technique was to line up echo centers in k-space.
CORRECTION TECHNIQUE 2 corrected the phase of the EPI data based on a multireference scan instead of a single refer- ence scan. For each k-space EPI data line (one phase encoded line), phase corrections were performed. First, the EPI data line, the corresponding k-space line of the phase encoded refer- ence scan, and the spin-echo data line of the phase encoded reference scan were Fourier transformed. Then phase errors were calculated by comparing the phases of the two projec- tions of the reference scan.
Next, both projections of the reference and EPI scan were phase corrected. Then the corrected EPI projection and the corrected reference projection were inverse Fourier transformed. At this point all echo centers should be lined up. Additional phase errors were calculated by comparing the phase of the corrected k-space data line of the reference scan with the spin echo data line of the reference scan. Any additional errors in the previously corrected EPI k-space data line were then corrected.
CORRECTION TECHNIQUE 3 corrected the amplitude in addition to applying the phase corrections described in CORRECTION TECHNIQUE 2. After the echo centers were lined up following the procedure in CORRECTION TECHNIQUE 2, both the phase and amplitude errors were calculated simultaneously. These calculations were then applied to the previously phase corrected EPI data. In calculating amplitude correction factors in k-space based on a multireference scan, special care was taken to avoid infinite amplitude (division by zero] in any point where noise dominated. First, a search was made for the maximum amplitude of each echo that appeared in the denominator of Eq. [15J and a lower threshold of 0.01 of
Reduction of Geometric and Intensity Distortion in EPI 939
a b C
d e f
h i
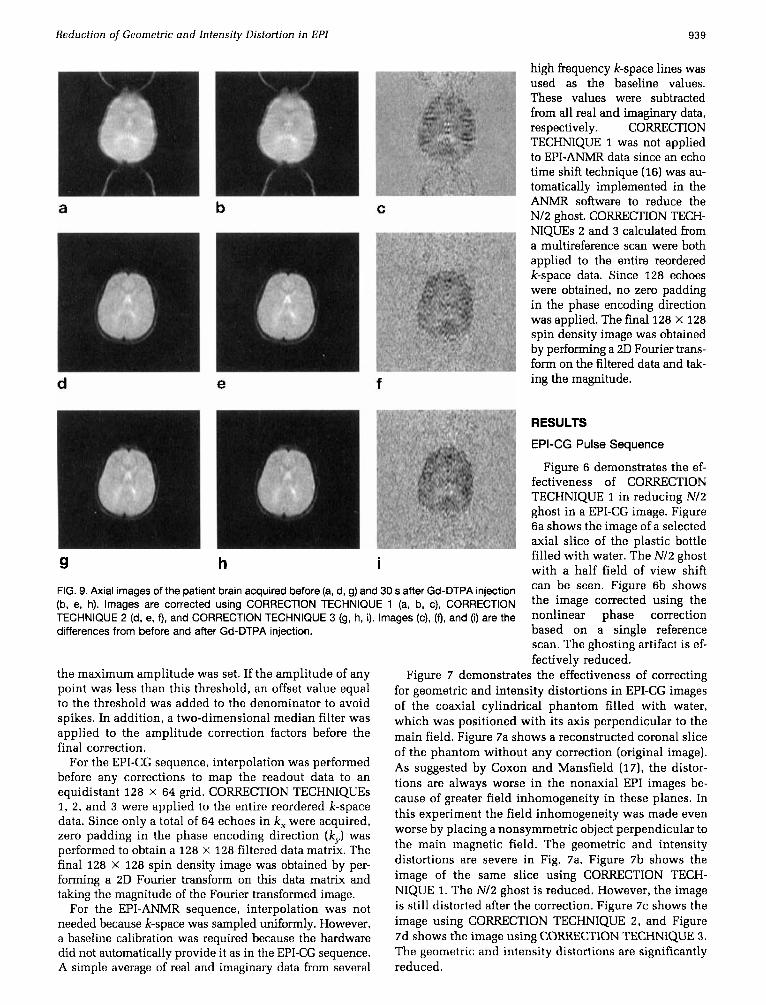
FIG. 9. Axial images of the patient brain acquired before (a, d, g) and 30 s after Gd-DTPA injection (b, e, h). Images are corrected using CORRECTION TECHNIQUE 1 (a, b, c), CORRECTION TECHNIQUE 2 (d. e, 9. and CORRECTION TECHNIQUE 3 (9, h, i). Images (c). (9, and (i) are the differences from before and after Gd-DTPA injection.
the maximum amplitude was set. If the amplitude of any point was less than this threshold, an offset value equal to the threshold was added to the denominator to avoid spikes. In addition, a two-dimensional median filter was applied to the amplitude correction factors before the final correction.
For the EPI-CG sequence, interpolation was performed before any corrections to map the readout data to an equidistant 1 2 8 X 64 grid. CORRECTION TECHNIQUES 1, 2, and 3 were applied to the entire reordered k-space data. Since only a total of 64 echoes in k, were acquired, zero padding in the phase encoding direction (k,) was performed to obtain a 128 x 128 filtered data matrix. The final 128 X 128 spin density image was obtained by per- forming a 2D Fourier transform on this data matrix and taking the magnitude of the Fourier transformed image.
For the EPI-ANMR sequence, interpolation was not needed because k-space was sampled uniformly. However, a baseline calibration was required because the hardware did not automatically provide it as in the EPI-CG sequence. A simple average of real and imaginary data from several
high frequency k-space lines was used as the baseline values. These values were subtracted from all real and imaginary data, respectively. CORRECTION TECHNIQUE 1 was not applied to EPI-ANMR data since an echo time shift technique (16) was au- tomatically implemented in the ANMR software to reduce the
NIQUES 2 and 3 calculated from a multireference scan were both applied to the entire reordered k-space data. Since 128 echoes were obtained, no zero padding in the phase encoding direction was applied. The final 128 X 128 spin density image was obtained by performing a 2D Fourier trans- form on the filtered data and tak- ing the magnitude.
NI2 ghost. CORRECTION TECH-
RESULTS
EPI-CG Pulse Sequence
Figure 6 demonstrates the ef- fectiveness of CORRECTION TECHNIQUE 1 in reducing NI2 ghost in a EPI-CG image. Figure 6a shows the image of a selected axial slice of the plastic bottle filled with water. The NI2 ghost with a half field of view shift can be seen. Figure 6b shows the image corrected using the nonlinear phase correction based on a single reference scan. The ghosting artifact is ef- fectively reduced.
Figure 7 demonstrates the effectiveness of correcting for geometric and intensity distortions in EPI-CG images of the coaxial cylindrical phantom filled with water, which was positioned with its axis perpendicular to the main field. Figure 7a shows a reconstructed coronal slice of the phantom without any correction (original image). As suggested by Coxon and Mansfield (171, the distor- tions are always worse in the nonaxial EPI images be- cause of greater field inhomogeneity in these planes. In this experiment the field inhomogeneity was made even worse by placing a nonsymmetric object perpendicular to the main magnetic field. The geometric and intensity distortions are severe in Fig. 7a. Figure 7b shows the image of the same slice using CORRECTION TECH- NIQUE 1. The NI2 ghost is reduced. However, the image is still distorted after the correction. Figure 7c shows the image using CORRECTION TECHNIQUE 2, and Figure 7d shows the image using CORRECTION TECHNIQUE 3. The geometric and intensity distortions are significantly reduced.
940 Wan et al.
a
b
healthy volunteer and Fig. 8b shows the image of the same slice reconstructed using CORRECTION TECHNIQUE I. Severe susceptibility arti- facts are observed because of the existence of airttissue and bonettissue interfaces. The N/2 ghost is reduced with the nonlinear phase correction. Figure 8c shows the same image recon- structed using CORREC-
1 TION TECHNIQUE 2 and 1 2 Figure 8d illustrate the same (x i 04) image reconstructed using
0
128
96
64
32
0 0 1 2 3
04)
CORRECTION TECHNIQUE 3, which are both based on a multireference scan. In both cases, geometric and inten- sity distortions are dramati- cally reduced.
Figure 9 shows results from a patient who received the contrast agent Gd-DTPA. Figures 9a and 9b am images before and 30 s after the Gd- DTPA injection both recon- structed using CORREC- TION TECHNIQUE 1. Figure 9c is the subtraction of Figs. 9a and 9b showing that the image intensity decreased when the contrast agent passed through the brain. Figures gd-gf and 9g-9i show the corresponding im- ages reconstructed using CORRECTION TECHNIQUE
NlQUE 3, respectively. Geo- metric and intensity distor- tions can be recognized in the images in Figs. 9a and 9b. With the proposed correc- tion technique, geometric and intensity distortions are reduced even when the im- age intensity distribution changes between the acquisi- tion of the reference scan and the EPI scan (Figs. 9e and gh). The subtraction images (Figs. 9f and 9i) show a sim-
2 and CORRECTION TECH-
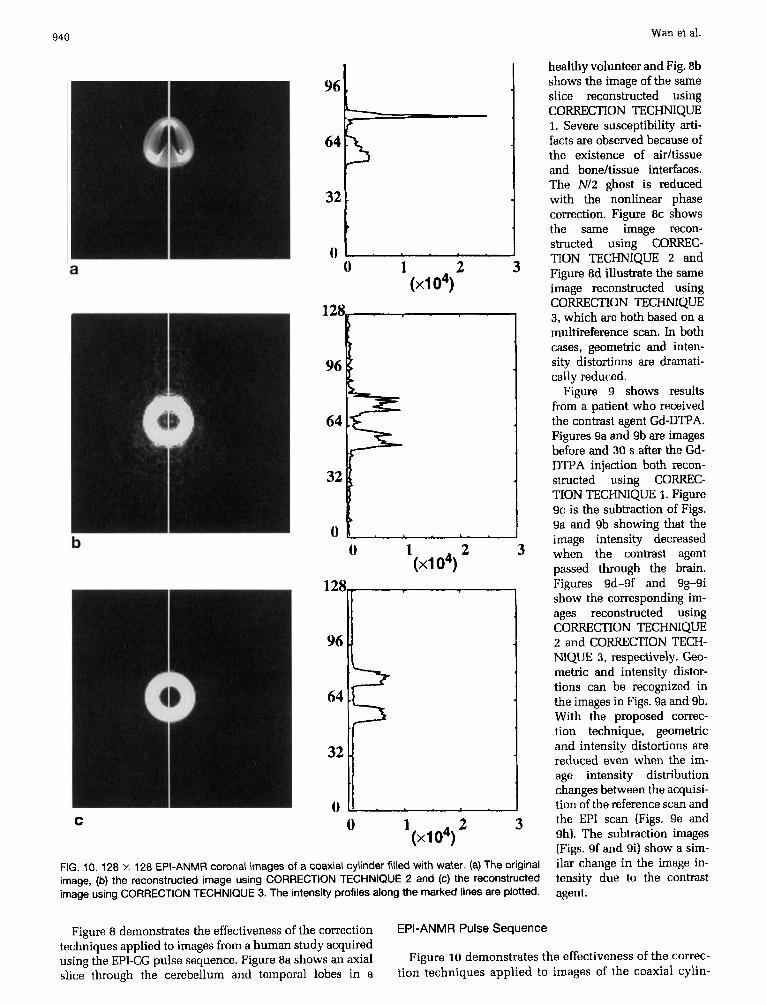
FIG. 10. 128 x 128 EPI-ANMR coronal images of a coaxial cylinder filled with water. (a) The original image, (b) the reconstructed image using CORRECTION TECHNIQUE 2 and (c) the reconstructed image using CORRECTION TECHNIQUE 3. The intensity profiles along the marked lines are plotted.
ilar change in the image in- tensity due to the conbast agent.
Figure 8 demonstrates the effectiveness of the correction techniques applied to images from a human study acquired using the EPI-CG pulse sequence. Figure 8a shows an axial slice through the cerebellum and temporal lobes in a
EPI-ANMR Pulse Sequence
Figure 10 demonstrates the effectiveness of the correc- tion techniques applied to images of the coaxial cylin-
Reduction of’ Geometric and Intensity Distortion in EPI 94 1
DISCUSSION
a b
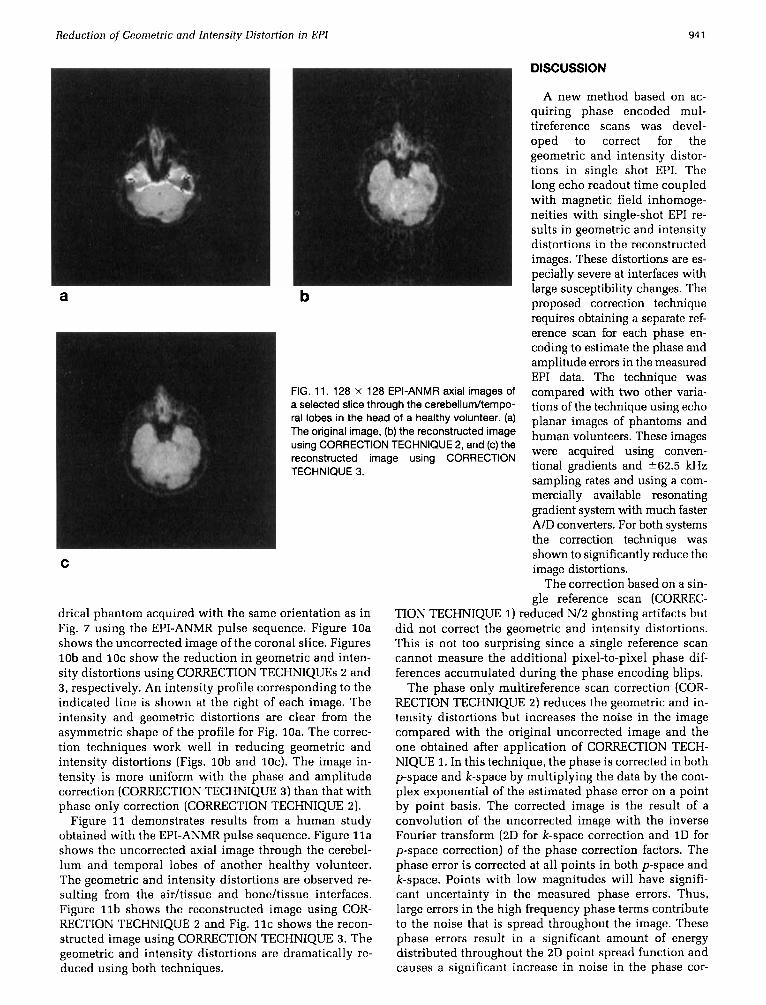
FIG. 11. 128 x 128 EPI-ANMR axial images of a selected slice through the cerebelludtempo- ral lobes in the head of a healthy volunteer. (a) The original image, (b) the reconstructed image using CORRECTION TECHNIQUE 2, and (c) the reconstructed image using CORRECTION TECHNIQUE 3.
C
drical phantom acquired with the same orientation as in Fig. 7 using the EPI-ANMR pulse sequence. Figure 10a shows the uncorrected image of the coronal slice. Figures lob and 1Oc show the reduction in geometric and inten- sity distortions using CORRECTION TECHNIQUES 2 and 3 , respectively. An intensity profile corresponding to the indicated line is shown at the right of each image. The intensity and geometric distortions are clear from the asymmetric shape of the profile for Fig. 10a. The correc- tion techniques work well in reducing geometric and intensity distortions (Figs. lob and 1Oc). The image in- tensity is more uniform with the phase and amplitude correction (CORRECTION TECHNIQUE 3) than that with phase only correction (CORRECTION TECHNIQUE 2).
Figure 11 demonstrates results from a human study obtained with the EPI-ANMR pulse sequence. Figure l l a shows the uncorrected axial image through the cerebel- lum and temporal lobes of another healthy volunteer. The geometric and intensity distortions are observed re- sulting hom the aidtissue and bondtissue interfaces. Figure 1 l b shows the reconstructed image using COR- RECTION TECHNIQUE 2 and Fig. I l c shows the recon- structed image using CORRECTION TECHNIQUE 3. The geometric and intensity distortions are dramatically re- duced using both techniques.
A new method based on ac- quiring phase encoded mul- tireference scans was devel- oped to correct for the geometric and intensity distor- tions in single shot EPI. The long echo readout time coupled with magnetic field inhomoge- neities with single-shot EPI re- sults in geometric and intensity distortions in the reconstructed images. These distortions are es- pecially severe at interfaces with large susceptibility changes. The proposed correction technique requires obtaining a separate ref- erence scan for each phase en- coding to estimate the phase and amplitude errors in the measured EPI data. The technique was compared with two other varia- tions of the technique using echo planar images of phantoms and human volunteers. These images were acquired using conven- tional gradients and 262.5 kHz sampling rates and using a com- mercially available resonating gradient system with much faster A/D converters. For both systems the correction technique was shown to significantly reduce the image distortions.
The correction based on a sin- gle reference scan (CORREC-
TION TECHNIQUE 1) reduced N/2 ghosting artifacts but did not correct the geometric and intensity distortions. This is not too surprising since a single reference scan cannot measure the additional pixel-to-pixel phase dif- ferences accumulated during the phase encoding blips.
The phase only multireference scan correction (COR- RECTION TECHNIQUE 2) reduces the geometric and in- tensity distortions but increases the noise in the image compared with the original uncorrected image and the one obtained after application of CORRECTION TECH- NIQUE 1. In this technique, the phase is corrected in both p-space and k-space by multiplying the data by the com- plex exponential of the estimated phase error on a point by point basis. The corrected image is the result of a convolution of the uncorrected image with the inverse Fourier transform (2D for k-space correction and I D for p-space correction) of the phase correction factors. The phase error is corrected at all points in both p-space and k-space. Points with low magnitudes will have signifi- cant uncertainty in the measured phase errors. Thus, large errors in the high frequency phase terms contribute to the noise that is spread throughout the image. These phase errors result in a significant amount of energy distributed throughout the 2D point spread function and causes a significant increase in noise in the phase cor-
942 Wan et al.
rected images. To reduce the noise caused by high fre- quency phase errors, a test reconstruction was performed using only the central 32 lines of the phase correction matrix with the outer phase correction values effectively set to zero. In this correction, the noise external to the corrected object was significantly reduced. The distor- tion of the object was also significantly reduced. How- ever, there remained a significant amount of noise and ghosting due to spread of the object in the phase encod- ing direction.
The phase and amplitude multireference scan correc- tion (CORRECTION TECHNIQUE 3) has better noise properties. The improved noise performance is probably due to the care taken to avoid the effects of small denom- inator values in the filter in Eq. 1151. As described above, a small offset was added to the denominator where the values approached zero, and a two dimensional median filter was used to remove any residual noise spikes. We hypothesize that the offset correction could also be used in CORRECTION TECHNIQUE 2 to remove spurious phase values and, thus, improve the resulting noise char- acteristics.
The current implementation of this distortion correc- tion technique does not make good use of all the refer- ence scan measurements. Only two out of each 64 mea- sured echoes are used in the determination of the phase and phase/amplitude correction factors for each single line of k-space. It is likely that a more efficient use of the reference scan measurements can be developed such that these correction coefficients can be determined with a significant reduction in noise errors.
Although the discussion in this paper was limited to spin-echo EPI, the proposed multireference technique could be used in gradient-echo EPI. In gradient-echo EPI, the first echo always has the minimum amplitude and phase errors. The correction factors can be calculated by comparing all echoes to the first echo instead of the echo nearest the spin-echo center, as is done in the spin-echo EPI application. However, it is not expected that the technique could improve on any residual susceptibility distortions present in standard gradient echo imaging.
The multireference correction technique proposed in this paper is especially useful with dynamic studies. The technique requires N,, excitations to acquire a multiref- erence scan. Although the acquisition of the multirefer- ence scan is relatively long compared with the acquisi- tion of one echo-planar image, it is not so long compared with the large number of images acquired of the same slice in dynamic studies involving the use of contrast agents and in functional MRI studies. To reduce motion sensitivity during acquisition of the multireference scan, it might be desirable in the future to implement an addi- tional navigator echo in addition to the multireference scan.
The correction technique presented in this paper will be affected by patient motion. However, to the extent that
patient motion is eliminated, we have found that the proposed correction technique can adequately correct for susceptibility induced geometric and intensity distor- tions and that the correction seems to work when applied to the images in dynamic sequences where the image intensity is changing due to contrast bolus passage or activation studies. We believe that the corrected images provide more accurate anatomical information that is very important for clinical diagnosis. As the demand increases for the application of diffusion and perfusion imaging, it becomes more and more important to solve the image quality issues that are present with echo- planar imaging.
REFERENCES 1. P. Mansfield, Multi-planar image formation using NMR spin echoes.
J. Physics C. 10, L5-L58 (1977). 2. B. Chapman, R. Turner, R. J. Ordidge. M. Doyle, M. Cawley, R. Coxon,
P. Glover, P. Mansfield, Real-time movie imaging from a single car- diac cycle by NMR. Mogn. Reson. Med. 5, 246-254 (1987).
3. C. B. Ahn, J. H. Kim, Z. H. Cho, High-speed spiral-scan echo planar NMR imaging-[. IEEE Trans. Med. Irnoging MI-5, 2-7 (19861.
4. R. M. Weisskoff, T. L. Davis, Correcting gross distortion on echo planar images, in “Proc., SMRM, 11th Annual Meeting, 1992,” p. 4515.
5. P. Jezzard, R. S. Balaban, Correction for geometric distortion in echo planar images from B, field variations. Mogn. Reson. Med. 34,65-73 (1995).
6 . R. Bowtell, D. 1. 0. Mclntyre, M-J. Commandre, P. M. Glover, P. Mansfield. Correction of geometric distortion in echo planar images, in “Proc., SMR, 2nd Annual Meeting, 1994,” p. 411.
7. X. Wan, G. T. Gullberg, D. L. Parker, Reduction of geometric distor- tion in echo-planar imaging using a multi-reference scan, in “Proc.. SMR, 3rd Annual Meeting, 1995.” p. 103.
8. D. B. Twieg, The k-trajectory formulation of the NMR imaging process with applications in analysis and synthesis of imaging methods. Med.
9. S. Ljunggren, A simple graphical representation of Fourier based PhyS. 10, 610-621 (1983).
10.
11.
12.
13.
14.
15.
16.
17.
imaging methods. 1. Mogn. Reson. 54. 338-343 (1983). K. F. King, P. R. Moran, A unified description of NMR imaging, data-collection strategies and reconstruction. Med. Phys. 11, 1-14 (1984). F. Farzaneh. S. J. Riederer. N. 1. Pelc, Analysis of T2 limitations and off-resonance effects on spatial resolution and artifacts in echo-planar imaging. Mogn. Reson. Med. 14, 123-139 (1990). H. Bruder. H. Fischer, H.-E. Reinfelder. F. Schmitt. Image reconstruc- tion for echo planar imaging with nonequidistant k-space sampling. Magn. Reson. Med. 23, 311-323 (1992). D. A. Feinberg, K. Oshio, GRASE (gradient- and spin-echo) imaging: a new fast clinical imaging technique. Radiology 181, 597-602 (1991). K. Oshio, D. A. Feinberg. GRASE (gradient- and spin-echo) MR im- aging: a novel fast MRI technique. Magn. Reson. Med. 20, 344-349 (1991). J. S. Lim, “Two-dimensional Signal and Image Processing.” P T R Prentice-Hall, Englewood Cliffs, 1991. G. C. MaKinnon, Ultrafast interleaved gradient-echo-planar imaging on a standard scanner. Mogn. Reson. Med. 30, 609-616 (1993). R. Coxon, P. Mansfield. EPI spatial distortion in non-transverse planes, in “Proc.. SMRM. 8th Annual Meeting, 1989.” p. 361.