Reducing Restrictive Housing Use in Washington State
121
REDUCING RESTRICTIVE HOUSING USE IN WASHINGTON STATE RESULTS FROM THE 2016-2020 STUDY “UNDERSTANDING AND REPLICATING WASHINGTON STATE’S SEGREGATION REDUCTION PROGRAMS,” CONTRACT NO. K11273 Keramet Reiter, JD, PhD With: Kelsie Chesnut, PhD; Gabriela Gonzalez, MA; Justin Strong, MA; Rebecca Tublitz, MPP; Dallas Augustine, MA; Melissa Barragan, PhD; Pasha Dashtgard, MA; Natalie Pifer, JD, PhD 2021 The findings, opinions, conclusions, and recommendations expressed in this report are those of the authors and do not necessarily reflect the views of the Washington Department of Corrections, nor the Langeloth Foundation, which supported this research. The authors thank the Washington Department of Corrections, especially: Secretary Sinclair and former secretaries Warner, Pacholke, Morgan, Becker-Green, and Vail; the Washington Department of Research, including Paige Harrison, Vasiliki Georgoulas-Sherry, and Kevin Walker; and, finally, Tim Thrasher, who served as the DOC project contact and coordinator throughout. David Lovell served as a project consultant and led the quantitative data analysis piece of this project; Joseph Ventura trained the team and consulted on BPRS assessments; and Lorna Rhodes served as an project adviser in the early stages of planning. The authors are especially grateful to those prisoners and staff who participated in interviews and thank them for generously sharing their experiences and insights, without which this report would not have been possible. 1
-
Upload
khangminh22 -
Category
Documents
-
view
2 -
download
0
Transcript of Reducing Restrictive Housing Use in Washington State
REDUCING RESTRICTIVE HOUSING USE IN WASHINGTON STATE RESULTS FROM THE 2016-2020 STUDY “UNDERSTANDING AND REPLICATING WASHINGTON STATE’S SEGREGATION REDUCTION PROGRAMS,” CONTRACT NO. K11273
Keramet Reiter, JD, PhD
With: Kelsie Chesnut, PhD; Gabriela Gonzalez, MA; Justin Strong, MA; Rebecca Tublitz, MPP; Dallas Augustine, MA; Melissa Barragan, PhD; Pasha Dashtgard, MA; Natalie Pifer, JD, PhD
2021
The findings, opinions, conclusions, and recommendations expressed in this report are those of the authors and do
not necessarily reflect the views of the Washington Department of Corrections, nor the Langeloth Foundation,
which supported this research. The authors thank the Washington Department of Corrections, especially: Secretary
Sinclair and former secretaries Warner, Pacholke, Morgan, Becker-Green, and Vail; the Washington Department of
Research, including Paige Harrison, Vasiliki Georgoulas-Sherry, and Kevin Walker; and, finally, Tim Thrasher, who
served as the DOC project contact and coordinator throughout. David Lovell served as a project consultant and led
the quantitative data analysis piece of this project; Joseph Ventura trained the team and consulted on BPRS
assessments; and Lorna Rhodes served as an project adviser in the early stages of planning. The authors are
especially grateful to those prisoners and staff who participated in interviews and thank them for generously
sharing their experiences and insights, without which this report would not have been possible.
1
TABLE OF CONTENTS
EXECUTIVE SUMMARY .................................................................................................................................................. 4
(1) RESEARCH PRACTICES ........................................................................................................................................... 4
(2) PATTERNS IN RESTRICTIVE HOUSING USE .................................................................................................................. 5
(3) CONDITIONS IN RESTRICTIVE HOUSING ..................................................................................................................... 5
(4) STAFF EXPERIENCES IN RESTRICTIVE HOUSING ............................................................................................................ 6
(5) PRISONER EXPERIENCES IN RESTRICTIVE HOUSING ....................................................................................................... 6
KEY RECOMMENDATIONS ................................................................................................................................................ 7
INTRODUCTION AND CONTEXT .................................................................................................................................... 9
METHODS ................................................................................................................................................................... 10
QUANTITATIVE DATA COMPILATION ................................................................................................................................ 11
SURVEY DESIGN & ADMINISTRATION ............................................................................................................................... 13
INTERVIEW DESIGN & ADMINISTRATION .......................................................................................................................... 14
QUALITATIVE DATA ANALYSIS ........................................................................................................................................ 18
FINDINGS .................................................................................................................................................................... 19
PATTERNS & CONDITIONS IN RESTRICTIVE HOUSING USE ..................................................................................................... 19
Fluctuations in Populations and Lengths of Stay in IMUs ................................................................................. 20
Racial disproportionalities ................................................................................................................................ 23
Behavioral Profiles: Gang Affiliation and Serious Infractions ............................................................................ 26
Existing Policy Reform Supports Further Restrictive Housing Reductions ........................................................ 28
IMPACTS ON STAFF ....................................................................................................................................................... 31
Appreciation for IMU Staff Culture ................................................................................................................... 32
Negative Effects on Staff of IMU Work ............................................................................................................. 33
Staff Desire for Policy Input .............................................................................................................................. 35
Staff Objections to IMU R eforms ...................................................................................................................... 37
IMPACTS ON PRISONERS ................................................................................................................................................ 40
Trusting Staff to Be Responsive ........................................................................................................................ 40
Programs: Access Challenges and Unrealized Potential ................................................................................... 41
2

Social Contact Policies ....................................................................................................................................... 43
Health ................................................................................................................................................................ 46
Long-Term Management Challenges in the IMU .............................................................................................. 50
Re-Entry ............................................................................................................................................................ 51
EPILOGUE: ONGOING REFORMS, 2018-2021 ............................................................................................................. 55
APPENDICES ................................................................................................................................................................ 58
A: CLASSIFICATION OF DOC PRISONER CONFINEMENT STATUS ON INDEX DATES BY LOCATION AND CUSTODY LEVEL ...................... 58
B: ESTIMATES OF RESTRICTIVE HOUSING CAPACITY, 1999-2020 ......................................................................................... 59
C: JUSTICE QUARTERLY ARTICLE ..................................................................................................................................... 60
D: PLOS ONE ARTICLE ................................................................................................................................................9 1
E: AMERICAN JOURNAL OF PUBLIC HEALTH ARTICLE......................................................................................................... 112
3

EXECUTIVE SUMMARY
This report represents the culmination of a four-year-long collaboration between the
Washington Department of Corrections (DOC) and Keramet Reiter, as Principal Investigator,
based at the University of California, Irvine (UCI). The Langeloth Foundation funded the
research, and the Washington Department of Corrections and its Office of Research, along with
Tim Thrasher, Mission Housing Administrator, facilitated both data sharing and collection at
every step. One central research question guided our work: How, and with what effects, has Washington DOC reduced its reliance on restrictive housing?
To answer this question, the UCI team collected and analyzed: administrative data describing
the entire DOC population at six snapshot intervals between 2002 and 2017; 315 paper surveys
of prisoners and staff in Intensive Management Units (IMUs); 186 interviews (ranging between
45 minutes and three hours in length) with a random sample of prisoners on maximum custody
status in IMUs; and 77 interviews (of similar durations as the prisoner interviews) with a
strategic, convenience sample of staff in IMUs.
In this executive summary, we highlight our major findings in five key areas: (1) research
practices, (2) patterns in restrictive housing use in the 2000s, (3) conditions in restrictive
housing, (4) staff, and (5) prisoner experiences. And we provide a series of brief
recommendations following closely from these findings. In the full report, we discuss the
research protocols, findings, and recommendations in more detail.
(1) RESEARCH PRACTICES
• Washington DOC’s commitment to collecting relevant data and sharing that data with
researchers is integral to its reform agenda.
• The unprecedented scope and scale of data collected and analyzed in this project
demonstrates the feasibility of sustained researcher-practitioner collaborations working towards improved prison practices.
• Over hundreds of hours on site conducting surveys and interviews (under Mission
Housing Administrator Tim Thrasher’s expert coordination), our research team
efficiently accomplished our target goals for data collection and felt safe throughout.
4

(2) PATTERNS IN RESTRICTIVE HOUSING USE
• DOC has implemented an array of reforms in pursuit of three goals: (1) reducing the
number of people in restrictive housing, (2) reducing the length of time individuals spend
in restrictive housing, and (3) mitigating the harms of the harsh conditions of restrictive
housing. Over the 2010s, DOC has indeed made improvements in all three areas.
• The number of people on maximum custody status in IMUs across the state has
fluctuated from a low of 149 (in 2002) to a peak of 472 (in 2011). By 2014, reforms had
cut this peak population nearly in half, to 283. But the population increased again, by
more than 20 percent over the next three years, rising back to 342 in 2017.
• While IMU populations have fluctuated, mean lengths of stay in IMUs (for those at all
custody statuses) have decreased steadily since 2011: maximum custody prisoners now
spend an average of 214 days in IMUs, 133 days less than in 2011.
• Although mean lengths of stay in the IMU fell significantly after 2011, an increasing proportion of people experience IMU confinement across snapshots, and cumulative
time spent in the IMU increased steadily between 2002 and 2017.
• Both Hispanic prisoners and Hispanic-affiliated gang members are increasingly over-represented in the max custody-IMU population, relative to their representation in the
general prison population, over the 2002-2017 period.
(3) CONDITIONS IN RESTRICTIVE HOUSING
• The IMUs function with less day-to-day violence and more person-to-person humanity than they did two decades ago, as described by staff, and seen in comparison with data
Lorna Rhodes and David Lovell collected 20 years ago.
• Access to counselors, mental health care, and a diversity of programming has increased.
• People are in the IMU for specific, identifiable reasons and receive regular,
individualized assessments regarding their continued IMU placement.
• Those prisoners on maximum custody status in the IMU for extended periods represent
substantial management challenges (e.g., histories of repeated attacks on staff or of
serious mental illness). Washington DOC officials are national leaders in piloting
alternatives.
5
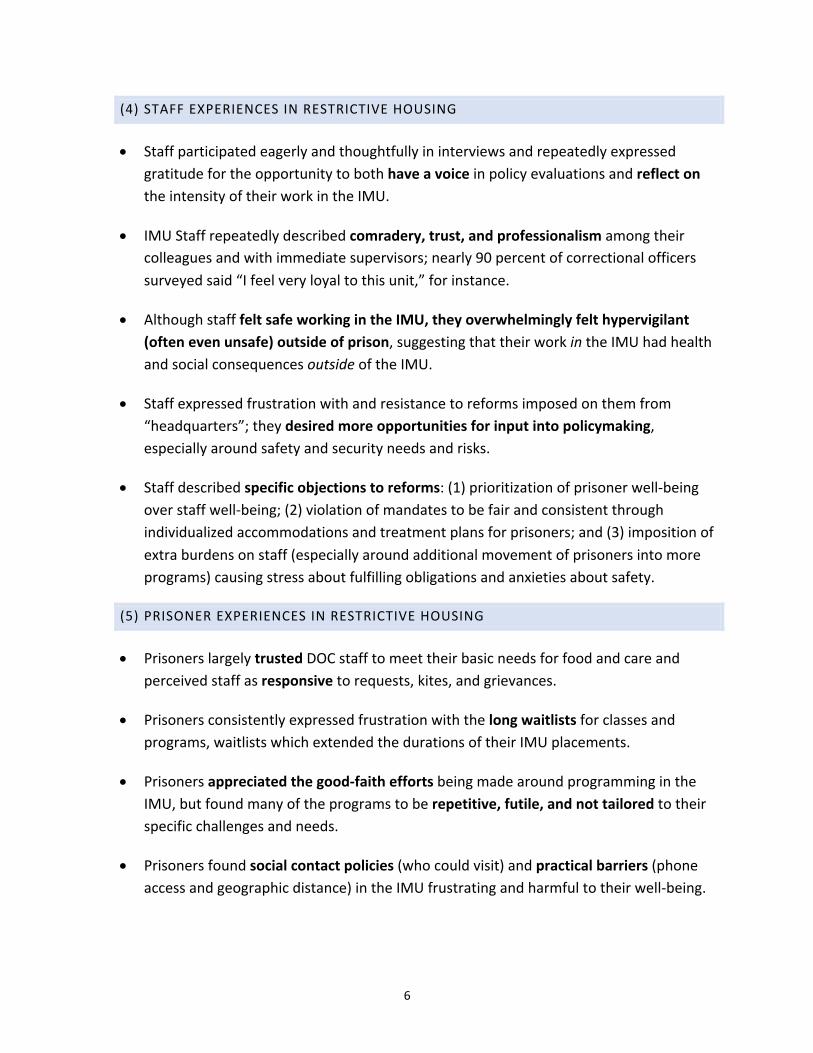
(4) STAFF EXPERIENCES IN RESTRICTIVE HOUSING
• Staff participated eagerly and thoughtfully in interviews and repeatedly expressed
gratitude for the opportunity to both have a voice in policy evaluations and reflect on the intensity of their work in the IMU.
• IMU Staff repeatedly described comradery, trust, and professionalism among their
colleagues and with immediate supervisors; nearly 90 percent of correctional officers
surveyed said “I feel very loyal to this unit,” for instance.
• Although staff felt safe working in the IMU, they overwhelmingly felt hypervigilant (often even unsafe) outside of prison, suggesting that their work in the IMU had health
and social consequences outside of the IMU.
• Staff expressed frustration with and resistance to reforms imposed on them from
“headquarters”; they desired more opportunities for input into policymaking,
especially around safety and security needs and risks.
• Staff described specific objections to reforms: (1) prioritization of prisoner well-being
over staff well-being; (2) violation of mandates to be fair and consistent through
individualized accommodations and treatment plans for prisoners; and (3) imposition of
extra burdens on staff (especially around additional movement of prisoners into more
programs) causing stress about fulfilling obligations and anxieties about safety.
(5) PRISONER EXPERIENCES IN RESTRICTIVE HOUSING
• Prisoners largely trusted DOC staff to meet their basic needs for food and care and
perceived staff as responsive to requests, kites, and grievances.
• Prisoners consistently expressed frustration with the long waitlists for classes and
programs, waitlists which extended the durations of their IMU placements.
• Prisoners appreciated the good-faith efforts being made around programming in the
IMU, but found many of the programs to be repetitive, futile, and not tailored to their
specific challenges and needs.
• Prisoners found social contact policies (who could visit) and practical barriers (phone
access and geographic distance) in the IMU frustrating and harmful to their well-being.
6
• Prisoners in the IMU frequently experienced: clinically significant symptoms of depression, anxiety, and guilt; serious mental illness and self-harming behavior; IMU-
induced symptoms of social isolation, loss of identity, and sensory hypersensitivity;
skin irritations and weight fluctuations; un-treated and mis-treated chronic conditions;
and musculoskeletal pain.
• Prisoners in the IMU were often just trying to make it through, but upon release back
into the general prison population, they continued to deal with the ongoing mental and
physical challenges experienced while in the IMU.
KEY RECOMMENDATIONS
RESEARCH PRACTICES
• Maintain long-standing commitment to systematically collecting robust data about
DOC policy and practice and collaboratively sharing and analyzing this data with
external, independent researchers.
PATTERNS IN RESTRICTIVE HOUSING USE
• Continue to carefully track all forms of restrictive housing use, including number of
people confined, rates of confinement, average and cumulative lengths of stay, and
the over-representation of Hispanic prisoners.
• Continue work to reduce overall restrictive housing populations but also the
frequency with which people experience these conditions, lengths of stay in these
conditions, and disparate impact of these conditions on Hispanic prisoners.
• The racial disproportionality in IMU placements raises questions about the
relationship between race, gangs, and prison behavioral histories, and suggests an
area ripe for further policy attention.
CONDITIONS IN RESTRICTIVE HOUSING
• Continue work to mitigate the harms of restrictive housing, including provision of
counseling, healthcare, group activities and programs, and individualized
assessments of placement decisions.
7
STAFF EXPERIENCES
• Seek out and integrate IMU staff perspectives into reform initiatives.
• Provide regular opportunities for staff to reflect on the challenges of work in the
IMU (with supervisors, counselors, and researchers).
• Develop resources to address the unique stress of being hypervigilant outside of the
IMU.
PRISONER EXPERIENCES
• Shorten wait times to participate in IMU programs.
• Leverage existing programming infrastructure (personnel, classrooms) to develop
more substantively useful content for IMU prisoners.
• Continue to develop and support social contact for IMU prisoners
• Address and mitigate the ongoing physical and mental harms associated with IMU
placements, especially by reducing barriers to accessing healthcare and improving
the quality of treatment.
COMMITMENT TO REFORM
• Maintain the Mission Housing Administrator position, which is focused on
implementing restrictive housing reform.
• Consider implementing similar “mission housing” positions at the institutional level,
to facilitate ongoing, individualized attention to address the intersection of health
and behavioral challenges among the highest security prisoners in the most
restrictive conditions of confinement.
• Develop state-level agreements to permit transfer of seriously mentally ill prisoners
from custody-oriented facilities to healthcare-oriented facilities.
8

INTRODUCTION AND CONTEXT
The project, at the broadest level, sought to understand Washington State’s widely touted
reduction in solitary confinement use, at both the level of quantitative, administrative data, and
at the level of lived experience, for prisoners and staff. The core claim: in 2013, Washington had
reduced their solitary confinement population by more than half, and implemented additional
reforms to shorten terms in segregation, refocus on rehabilitation, reframe responses to self-
harming prisoners, and systematically intervene in prison-based violence through programs like
Operation Place Safety.1 We started this project with two key questions:
(1) What policies has Washington State implemented to reduce its reliance on restrictive
housing?
(2) What are the impacts – on both prisoners and staff – of Washington state’s restrictive
housing reduction program?
To answer these questions, we:
• Analyzed 15 years of administrative data: six record sets of the entire DOC population
on evenly-spaced snapshot intervals (July 1, 2002, 2005, 2008, 2011, 2014, and 2017),
including subject-level demographic records (N=57,130), event-level records of
admissions and releases (266,266), prison sentences (230,833), custody assignments
(1.2 million), infractions (630,088), and inter-facility movements (2.4 million).
• Administered paper surveys to prisoners on maximum custody status living in and staff
working in IMUs totaling: 225 paper surveys collected from prisoners and 90 from
custody and non-custody staff.
• Conducted in-depth, qualitative interviews: (1) 106 interviews with a random sample of
maximum custody prisoners housed across all five of DOC’s IMUs in the summer of
2017; (2) 80 one-year follow-up interviews with 2017 participants still incarcerated in
the summer of 2018; (3) 77 interviews with a strategic convenience sample of custody
and non-custody staff working in and supervising IMUs in the summer of 2017.
1 See Bernie Warner, Dan Pacholke, and Carly Kujath, Operation Place Safety: First Year in Review, Jun. 1, 2014 (Washington State Department of Corrections), available online at: https://www.doc.wa.gov/docs/publications/reports/200-SR002.pdf.
9

• Collected DOC policies and reports about restrictive housing reform in the 2000s,
conducted dozens of informal conversations with former DOC leadership to identify
policy changes and goals, and observed multiple classification committee meetings
during visits to Washington state to administer surveys and conduct interviews.
During both our survey administration and qualitative interview data collection phases, we
worked with the Mission Housing Administrator to bring 8-9 research staff on site over multiple
days at each IMU in the state in 2017, and then at each prison housing year-one research
participants in 2018. At each institution, staff worked with each other and the Mission Housing
Administrator to figure out how to move prisoners into secure interview rooms on and off
IMUs. The cooperation was phenomenal, and across hundreds of hours of interviews, our
research staff uniformly felt comfortable and safe. This project, unprecedented in
While this report reviews in great detail preliminary scope and scale, relied on findings from analyses of both interviews and Washington State DOC’s administrative data, a broader implication of this partnership, commitment to
extended partnership deserves acknowledging at the transparency, and vision for reform.
outset. What Washington leadership at headquarters
and in the Research Department facilitated with this project is unprecedented in scope and
scale in prison research in the United States. In facilitating this work, Washington DOC has, first,
extended and amplified its reputation as a sought-after partner in research-practitioner
collaborations, building on the collaborations between DOC and the University of Washington
in the late 1990s and early 2000s around mental health and solitary confinement. And
Washington DOC has, second, proven that research like this is eminently possible. The critical
insights here would not have been possible to discern without the bigger picture investments in
transparency and improvement to which Washington DOC is committed. While prisoners, staff,
and administrative data itself point the way to possible policy recommendations to improve the
operation of Washington prisons, these insights are all-the-more-important for other prison
systems, which provide less room for analytic insights but offer more room for improvement.
METHODS
This study sought to systematically evaluate Washington DOC’s use of long-term isolation, over
time, through rigorous application of mixed methods. Comprehensive research studies about
restrictive housing use over more than a few years in any given state are rare, and analyses
incorporating qualitative interviews with prisoners and staff are rarer still. Only a few studies
exist of specific “supermax” facilities; one of these, conducted in the Washington DOC, was
10
completed more than 10 years ago.2 A few additional studies have sought to analyze statistics
about durations of confinement, racial impacts of isolation, violence in isolation, and recidivism
rates post-release from isolation in several different states.3 This study, then, breaks new
ground for researchers and policymakers alike. For this reason, we share here a detailed
description of our methods, in hopes that this research will serve as a model for both future
studies and ongoing researcher-practitioner collaborations.
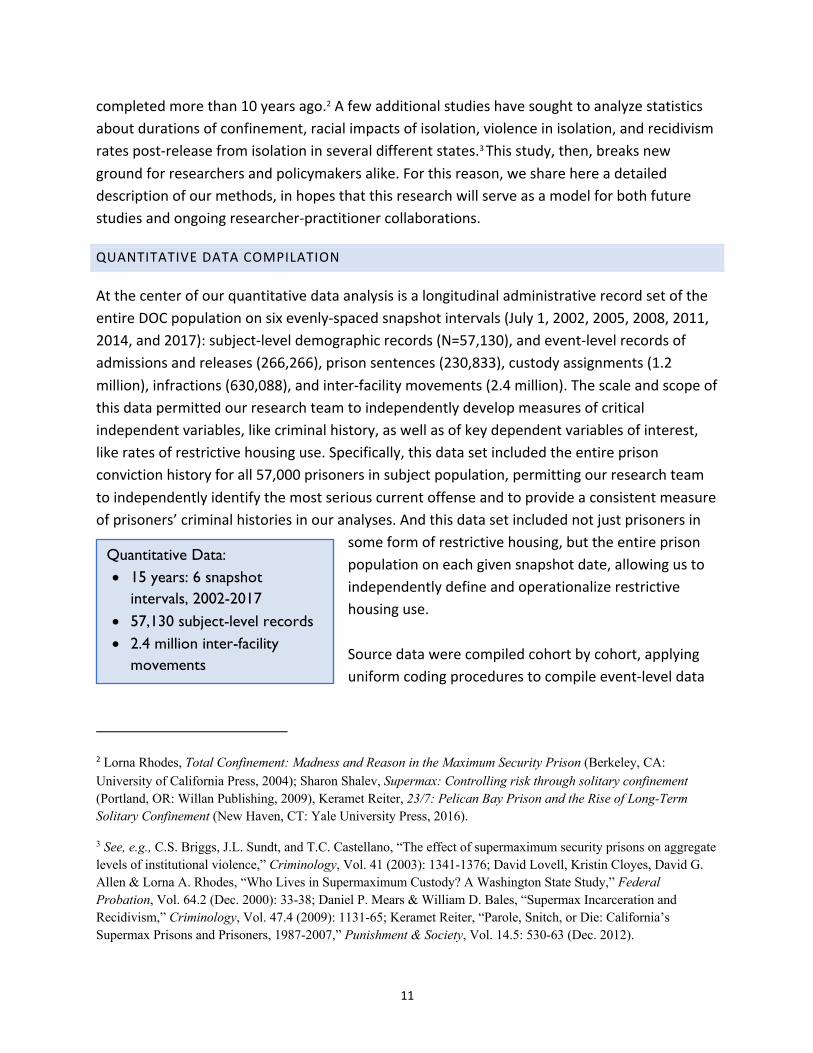
QUANTITATIVE DATA COMPILATION
At the center of our quantitative data analysis is a longitudinal administrative record set of the
entire DOC population on six evenly-spaced snapshot intervals (July 1, 2002, 2005, 2008, 2011,
2014, and 2017): subject-level demographic records (N=57,130), and event-level records of
admissions and releases (266,266), prison sentences (230,833), custody assignments (1.2
million), infractions (630,088), and inter-facility movements (2.4 million). The scale and scope of
this data permitted our research team to independently develop measures of critical
independent variables, like criminal history, as well as of key dependent variables of interest,
like rates of restrictive housing use. Specifically, this data set included the entire prison
conviction history for all 57,000 prisoners in subject population, permitting our research team
to independently identify the most serious current offense and to provide a consistent measure
of prisoners’ criminal histories in our analyses. And this data set included not just prisoners in
some form of restrictive housing, but the entire prison
population on each given snapshot date, allowing us to
independently define and operationalize restrictive
housing use.
Source data were compiled cohort by cohort, applying
uniform coding procedures to compile event-level data
Quantitative Data: • 15 years: 6 snapshot
intervals, 2002-2017 • 57,130 subject-level records • 2.4 million inter-facility
movements
2 Lorna Rhodes, Total Confinement: Madness and Reason in the Maximum Security Prison (Berkeley, CA: University of California Press, 2004); Sharon Shalev, Supermax: Controlling risk through solitary confinement (Portland, OR: Willan Publishing, 2009), Keramet Reiter, 23/7: Pelican Bay Prison and the Rise of Long-Term Solitary Confinement (New Haven, CT: Yale University Press, 2016).
3 See, e.g., C.S. Briggs, J.L. Sundt, and T.C. Castellano, “The effect of supermaximum security prisons on aggregate levels of institutional violence,” Criminology, Vol. 41 (2003): 1341-1376; David Lovell, Kristin Cloyes, David G. Allen & Lorna A. Rhodes, “Who Lives in Supermaximum Custody? A Washington State Study,” Federal Probation, Vol. 64.2 (Dec. 2000): 33-38; Daniel P. Mears & William D. Bales, “Supermax Incarceration and Recidivism,” Criminology, Vol. 47.4 (2009): 1131-65; Keramet Reiter, “Parole, Snitch, or Die: California’s Supermax Prisons and Prisoners, 1987-2007,” Punishment & Society, Vol. 14.5: 530-63 (Dec. 2012).
11

into a subject-level dataset. We computed the housing location and custody status of every
prisoner in the system throughout each admission, length of stay (LOS) at each location, and
subject-level summaries of numbers and rates of relevant events, such as infractions.
Compilation codes were tested and modified until they yielded consistent and plausible counts
and summary statistics (e.g., no negative values for LOS or rates) across all prisoners in six
snapshot cohorts. We also used inferential statistics (e.g., chi-square and t-tests) to test for
differences across cohorts and groups.
We measured restrictive housing use by examining the intersection of custody status and
location: identifying all prisoners assigned to maximum custody status (the highest level of
custody classification in DOC), all prisoners housed in Intensive Management Units (the most
secure housing units in DOC), and focusing, in particular, on individuals at the intersection of
this status and location. Appendix A includes a matrix detailing more specifically how we
operationalized and measured restrictive housing use in DOC. In a meeting with Research
Department Staff on December 7, 2020, we confirmed this operationalization was consistent
with how DOC research staff are measuring restrictive housing use in DOC currently.
Our operationalization of restrictive housing potentially undercounts one category of individual
in restrictive housing: those who are neither assigned a maximum custody status nor housed in
an IMU, but are, nonetheless, in some form of segregation (likely administrative or disciplinary).
Our analysis of prisoners’ confinement status used movement records to distinguish periods in
IMU from time spent either in other specialized facilities or in the general prison population
(“general population”), but excluded within facility movements from one bed or cell to another
(likely 50 million in number for our subjects). A prisoner placed in segregation prior to transfer
to an IMU or assignment of maximum custody status would not be captured in our counts.
Since 2015, the Research Department has had a flag in OMNI for “ad seg status” which allows
them to better capture this population that we do not observe; this flag was not present in the
data obtained from DOC and no such flag exists for the pre-2015 data we analyze.
In order to better account for the variation in both restrictive housing capacity and
characteristics over the entire fifteen years of our data set, we worked closely with Kevin
Walker and Tim Thrasher to identify both (1) IMU capacity and (2) restrictive housing capacity
within non-IMU facilities over the entire 15-year-period of our study. Appendix B includes a
table with our estimates of these capacities.
We also systematically collected and categorized restrictive-housing oriented policy reforms
and reports between 2011 and 2017, peak periods of reform and focus of this study.
12
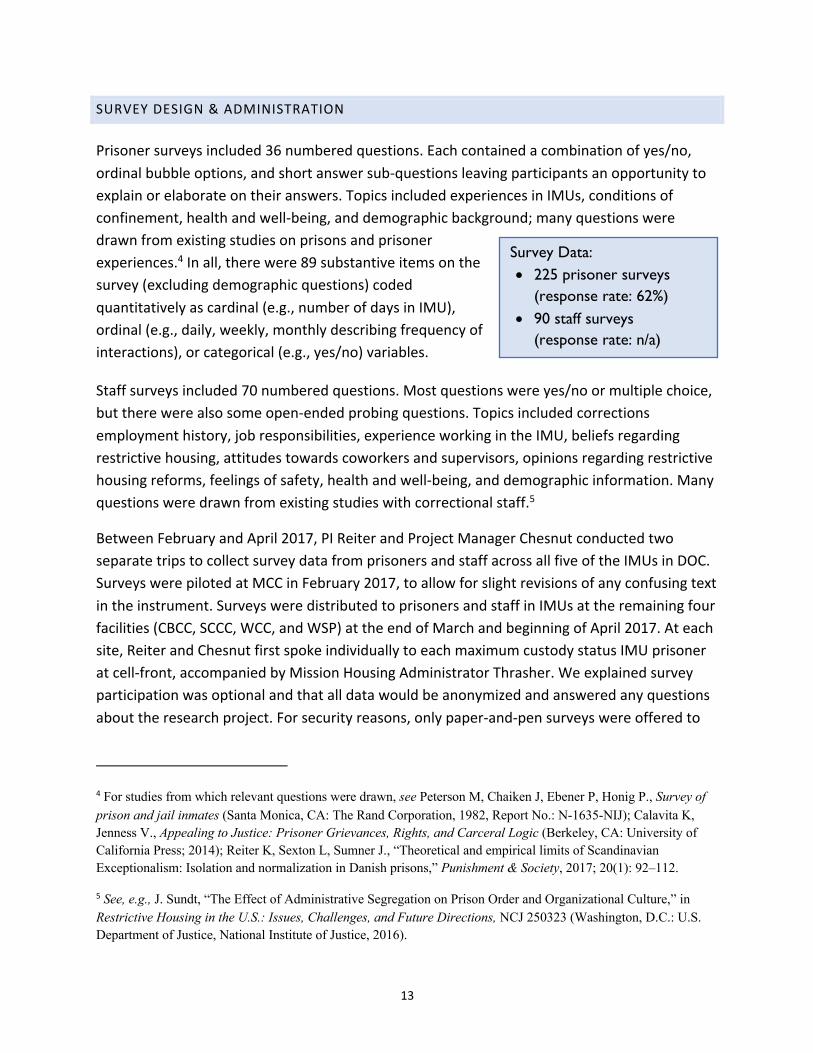
SURVEY DESIGN & ADMINISTRATION
Survey Data: • 225 prisoner surveys
(response rate: 62%) • 90 staff surveys
(response rate: n/a)
Prisoner surveys included 36 numbered questions. Each contained a combination of yes/no,
ordinal bubble options, and short answer sub-questions leaving participants an opportunity to
explain or elaborate on their answers. Topics included experiences in IMUs, conditions of
confinement, health and well-being, and demographic background; many questions were
drawn from existing studies on prisons and prisoner
experiences.4 In all, there were 89 substantive items on the
survey (excluding demographic questions) coded
quantitatively as cardinal (e.g., number of days in IMU),
ordinal (e.g., daily, weekly, monthly describing frequency of
interactions), or categorical (e.g., yes/no) variables.
Staff surveys included 70 numbered questions. Most questions were yes/no or multiple choice,
but there were also some open-ended probing questions. Topics included corrections
employment history, job responsibilities, experience working in the IMU, beliefs regarding
restrictive housing, attitudes towards coworkers and supervisors, opinions regarding restrictive
housing reforms, feelings of safety, health and well-being, and demographic information. Many
questions were drawn from existing studies with correctional staff.5
Between February and April 2017, PI Reiter and Project Manager Chesnut conducted two
separate trips to collect survey data from prisoners and staff across all five of the IMUs in DOC.
Surveys were piloted at MCC in February 2017, to allow for slight revisions of any confusing text
in the instrument. Surveys were distributed to prisoners and staff in IMUs at the remaining four
facilities (CBCC, SCCC, WCC, and WSP) at the end of March and beginning of April 2017. At each
site, Reiter and Chesnut first spoke individually to each maximum custody status IMU prisoner
at cell-front, accompanied by Mission Housing Administrator Thrasher. We explained survey
participation was optional and that all data would be anonymized and answered any questions
about the research project. For security reasons, only paper-and-pen surveys were offered to
4 For studies from which relevant questions were drawn, see Peterson M, Chaiken J, Ebener P, Honig P., Survey of prison and jail inmates (Santa Monica, CA: The Rand Corporation, 1982, Report No.: N-1635-NIJ); Calavita K, Jenness V., Appealing to Justice: Prisoner Grievances, Rights, and Carceral Logic (Berkeley, CA: University of California Press; 2014); Reiter K, Sexton L, Sumner J., “Theoretical and empirical limits of Scandinavian Exceptionalism: Isolation and normalization in Danish prisons,” Punishment & Society, 2017; 20(1): 92–112.
5 See, e.g., J. Sundt, “The Effect of Administrative Segregation on Prison Order and Organizational Culture,” in Restrictive Housing in the U.S.: Issues, Challenges, and Future Directions, NCJ 250323 (Washington, D.C.: U.S. Department of Justice, National Institute of Justice, 2016).
13

the maximum custody prisoner population; surveys were distributed first thing in the morning
and collected a few hours later by Reiter and Chesnut. We also provided stamped, self-
addressed envelopes upon request for those participants who wanted additional time. In total,
we distributed surveys to all 363 prisoners on maximum custody status in the IMU in spring of
2017; prisoners returned 225 surveys, for a response rate of 62%.
Following survey distribution to the prisoners, we held an informal question-and-answer
session with custody staff on the unit, to introduce ourselves and the research project. Staff,
like prisoners, were informed that the survey was optional, anonymized, and only aggregated
results would be shared with DOC. We then distributed paper surveys to custody and non-
custody staff working in each IMU. We encouraged staff to return the surveys to us before we
left each facility, but we also provided staff with self-addressed, stamped envelopes upon
request. For staff, we also shared digital copies of the survey through e-mail following each site
visit. We also made a special effort to seek out non-custody staff working in the IMU, such as
medical staff, mental health workers, classification counselors, and program facilitators. In
order to be as inclusive as possible, we repeated this process again in the afternoon following
shift change and left copies of the surveys with self-addressed stamped envelopes for the
graveyard shift. In all, staff returned 90 surveys. Calculating a response rate for this strategic
convenience sample is not possible, because we sought to reach staff across all three shifts;
included non-custody staff, like nurses and educators, who sometimes work across units; and
distributed surveys in person and via e-mail.
The surveys served a dual purpose in the research project. First, they provided a baseline
understanding of the challenges of living and working in Washington IMUs, as well as of the
attitudes towards recent reforms, which was critical to the research team as we developed
interview instruments and conducted interviews. Second, they gave the research team an
opportunity to introduce the research project to prisoners and staff, laying the groundwork for
interview participation in subsequent months.
INTERVIEW DESIGN & ADMINISTRATION
The qualitative prisoner interview instrument consisted of 96 numbered semi-structured
questions. Questions included a combination of yes/no options and probing, open-ended
follow-ups. Topics included: conditions of daily life (prior to and during isolation), perceived
state of physical and mental health, access to medical treatment, and experiences with
required programming in the IMU. Where possible, included questions replicated those asked
in existing studies on prisons and prisoner experiences. Fourteen of the questions making up
the Brief Psychiatric Rating Scale (BPRS), a standardized scale used to identify indicators of
serious mental illness, were embedded within the interview instrument. In total, 40 of the
14

substantive items on the interview instrument (excluding 10 demographic questions and 14
embedded questions designed to establish BPRS scores and/or assess orientation) were coded
quantitatively as cardinal (e.g., How much does it cost Interview Instruments: to see a doctor or dentist?) or categorical (e.g., Have • Questions about conditions, you noticed any changes in your health since you health, programming, reforms, have been in this IMU?) variables. Such questions demographics always included open-ended follow-up questions • Embedded Brief Psychiatric (e.g., Can you describe those changes?). We first used Rating Scale (BPRS) assessment the interview instrument at the smallest IMU in for prisoners Washington, interviewing 15 prisoners. We then
revised both the wording and ordering of questions for maximum clarity and engagement in the
remaining 91 interviews we conducted across the four other IMUs in the state.
The condensed year-two instrument contained approximately 70 questions. The questions
largely replicated the year-one questions – but excluded the questions about background
demographic and experiences over time in prison, and adjusted some other questions to
address prisoners’ current (and often different) housing status. As part of both initial and
follow-up instruments, interviewers administered the BPRS psychological assessment both
during (for the 14 self-report questions) and immediately following (for the 10 observational
items regarding a participant’s demeanor, engagement, and speech) interviews. For the 14 self-
report questions embedded in the interview guide, interviewers asked about the presence of
symptoms in the two weeks prior, per BPRS standard. Importantly, this means that BPRS scores
certainly undercount symptoms experienced intermittently, or outside of that two-week time
window.
The qualitative staff interview instrument consisted of 87 numbered semi-structured questions.
As with the prisoner interview instrument, these questions included a combination of yes/no
questions and probing, open-ended follow-up questions. Topics included: IMU policies, job
responsibilities, personal safety, health, relationships with coworkers and supervisors,
restrictive housing reforms, and demographic information.
All interviewers underwent an extensive training process, including more than 20 hours of
meetings to learn about conditions in Washington IMUs and to develop the interview
instruments. Interviewers completed an additional 20 hours of a standardized training protocol
for administering the BPRS in clinical settings: 16 hours of in-person symptom assessment
training sessions in year one with a leading expert in BPRS research—Dr. Joe Ventura, and four
hours of refresher training prior to the year-two interviews. Using a set of seven standardized
BPRS training videos of patient interviews, the research team viewed and rated each video and
15

discussed their ratings compared to “Gold Standard” training ratings. Ratings were analyzed for
interrater reliability. Dr. Ventura conducted an interrater reliability analysis and confirmed that
trained raters met the minimum standard of an ICC = .80 or greater for the BPRS. A Quality
Assurance check of symptom assessment reliability was conducted between the study years
2017 and 2018; no major rater drift was found, and feedback was provided to the assessment
team when needed to clarify symptom rating guidelines. This procedure represents the
standard training protocol for anyone administering the BPRS in clinical settings. In addition, to
ensure appropriate administration of the BPRS in a prison setting, Dr. Ventura accompanied the
research team on the first leg of the first visit to MCC in year one. Dr. Ventura co-conducted
interviews with several team members and was available to clarify questions throughout the
length of the trip. In sum, this extensive training sought to ensure that the 13 team members
over the two years (9 women and 4 men; 9 white and 4 non-white), all faculty (4) or doctoral
students (9) with expertise in prisons and prior interview experience in secure confinement
settings, identified and addressed any pre-existing assumptions about the population being
studied and minimized any possible bias as a result of inconsistent interpretation or application
of questions and assessments.
In adherence to research protocols for vulnerable subjects, prisoners participating in this
research were specifically informed that participation was voluntary and would not involve
incentives, administrative or otherwise; that refusal would not affect them adversely; and that
all information shared would be protected and anonymized unless it pertained to “an imminent
security-related threat.” To identify potential participants, the Mission Housing Administrator
provided a list of all prisoners on maximum custody status at a given IMU a day or two prior to
the research team’s visit to that IMU. Chesnut then randomized that list of prisoners, in order
to identify a list and order of potential research participants (with the target goal of
interviewing roughly one-third of maximum custody status prisoners in each IMU). To recruit
participants, a research team member approached potential participants at cell-front,
explained the study, and noted whether the prisoner would be interested in participating.
Willing prisoners were escorted one-by-one to a confidential area (monitored visually but not
aurally by DOC staff), consented, and interviewed by one or two members of the research
team. In all, 106 prisoners participated in interviews; 39 percent of the prisoners approached
for participation refused, comparable to similar studies of incarcerated people.6 Interviews
ranged in length from 45 minutes to 3 hours.
6 D. Lovell, “Patterns of disturbed behavior in a supermax prison,” Criminal Justice & Behavior, Vol. 35.8: 985–1004 (2008); M. Berzofsky & S. Zimmer, National Inmate Survey (NIS-4): sample design evaluation and recommendations
16

Immediately following year-one interviews, interviewers asked participants whether they
consented to the research team reviewing their medical files and to participating in one-year
follow-up interviews. All participants agreed orally to re-interviews, and all but two (n = 104)
consented in writing to medical file reviews. At Interviews Completed: the conclusion of each prisoner interview in both • Random sample of prisoners, year year one and year two, interviewers completed one: 106 ratings for each of the 24 BPRS items. Following • Follow-up prisoner interviews, interviews, interviewers reviewed consenting year two: 80 participants’ paper medical files for histories of • Strategic convenience sample of diagnoses, prescriptions, and substance abuse staff, year one: 77 status; DOC additionally provided electronic
administrative health and disciplinary files for all 104 consenting participants, as well as
comparable, population-level data for all people incarcerated in the system in July 2017.
In year two, the UCI research team attempted to re-interview all of the year-one participants
who were still incarcerated within Washington DOC. In total we conducted 80 re-interviews.
Only 4 participants refused re-interviews; 1 died; and 21 were unavailable because of
institutional transfers or being on parole. This drop-out rate is low compared to similar studies.7
In year two, 28 participants were in the IMU, and 52 were back in the general prison
population. These year-two follow-up interviews lasted between 45 minutes and two hours.
During the research team’s return visits to each IMU in the state in year two, the team made
presentations to IMU staff about the research findings from year one, including the results of
the year-one staff interviews. Unlike prisoners, staff were not randomly selected for interviews
during year one. Rather, a strategic, convenience sample of custody and non-custody staff was
identified. Efforts were made to interview custody staff from all three shifts, non-custody staff
(medical and programming), and supervisory staff at all five facilities. Staff at each facility were
informed ahead of time about scheduled interview trips and encouraged by DOC administrative
leadership to participate if they felt comfortable. Once on site at each facility, UCI team
(US Department of Justice, Bureau of Justice Statistics, 2018), https://www.bjs.gov/content/pub/pdf/NIS4DesignRecommendations.pdf.
7 J.H. Kleschinsky, L.B. Bosworth, S.E. Nelson, E.K. Walsh, H.J. Shaffer, “Persistence pays off: follow-up methods for difficult-to-track longitudinal samples,” J Stud Alcohol Drugs, Vol. 70.5:751–761 (2009); B. Western, A. Braga, D. Hureau, C. Sirois, “Study retention as bias reduction in a hard-to-reach population,” Proc Natl Acad Sci USA, Vol. 113.20: 5477–5485 (2016).
17

members directly approached staff (usually in the afternoon or on the second day of interviews
on site, after the work of identifying and moving prisoners into interview rooms was underway)
to identify willing interview participants. Staff were informed participation was voluntary and
would not involve incentives, administrative or otherwise; that refusal would not affect them
adversely; and that all information shared would be protected and anonymized. In all, 77 staff
from across all five IMUs and headquarters participated in interviews. Staff included
correctional officers, supervisors, mental and medical health practitioners, program and
educational instructors, and institutional and headquarters leadership. Since staff were
strategically sampled, and many staff interviewed worked both in the IMU and in other units
within the prison, a refusal rate cannot readily be calculated for the staff interviews. Staff
interviews lasted between 30 minutes and 3 hours.
All interviews were assigned a randomly generated identifier, digitally recorded, transcribed,
translated (1 interview was conducted in Spanish), systematically stripped of identifying details
(names, dates of birth), and entered into Atlas-ti for analysis (as discussed further below). All
identifiable data collected for this research, including interview audio recordings, transcripts,
BPRS score sheets, medical file notes, and administrative data, was stored either in a locked
filing cabinet in a locked office of the university or in a secure server space, accessible only
through multi-factor identification to a subset of study team members participating in data
cleaning and linking. The University of California IRB approved this study, as did the Washington
DOC research department.
QUALITATIVE DATA ANALYSIS
To develop a codebook for analyzing these hundreds of hours of interview data, six team
members open-coded 24 transcripts (4 each) line-by-line, inductively exploring how participants
understood restrictive housing, generating an initial list of over 500 codes.8 These codes were
further refined and categorized, then condensed into 176 codes, organized into 9 thematic
code groups: IMU Relations, Use of Force, Safety, Health, IMU Culture, IMU Policy, IMU
Conditions, Enduring the IMU, and Prison Work Issues. After a round of pilot coding, in which
each team member completed one initial transcript coding and one recoding, coding
discrepancies were reconciled. Team members then coded within code groups of interest, such
as “Enduring the IMU” and “IMU Conditions.” Coders met bi-weekly for 6 months to resolve
8 K. Charmaz, Constructing Grounded Theory: A Practical Guide through Qualitative Analysis (Thousand Oaks, CA: Sage Publications; 2006); Y. Chun Tie, M. Birks, K. Francis, “Grounded theory research: A design framework for novice researchers,” SAGE open medicine, 7: 1-8 (2019).
18
discrepancies. Given this intensive, thematically-grounded process, no statistics were calculated
for intercoder agreement.
BPRS data were imported into SPSS and Stata to generate descriptive statistics, including the
comparative prevalence of significant ratings on BPRS items and factors among three groups of
prisoner interview participants: year-one participants, year-two participants housed in the IMU,
and year-two participants housed in the general population. Fisher’s exact test and McNemar’s
test were performed to evaluate the relationships between BPRS ratings across housing
location, time, race/ethnicity, and gang status.
FINDINGS
We collected a large amount of robustly detailed data for this project and are still in the process
of analyzing and synthesizing across the administrative data, surveys, and interview transcripts.
To date, the UCI research team has published three peer-reviewed articles based on this
research: two drawing primarily on the prisoner
interviews in leading public health journals, the Initial Publications: American Journal of Public Health and PLOS One, 1. Reiter et al., American Journal of
Public Health (2020) and one drawing primarily on DOC administrative 2. Strong et al., PLOS One (2020) data in a leading criminology journal, Justice 3. Lovell et al., Justice Quarterly (2020) Quarterly. All three articles are included as
appendices to this report. In addition to
summarizing findings from those articles here, we include as-yet unpublished findings from our
analyses of administrative data and our surveys and interviews with prisoners and staff. We
present three categories of findings: (1) patterns and conditions in restrictive housing use, (2)
impacts on staff, and (3) impacts on prisoners.
PATTERNS & CONDITIONS IN RESTRICTIVE HOUSING USE
Over the 2010s, DOC implemented an array of reforms in pursuit of three goals we focus on
analyzing here. First, DOC sought to reduce the number of people in restrictive housing.
Second, DOC sought to reduce the length of time individuals spend in restrictive housing. Third,
DOC sought to mitigate the harms of the harsh conditions of restrictive housing. Our analysis
indeed finds improvements in each of these three areas of focus, though we also identify
fluctuations in the degree of improvement, barriers and challenges to implementing these
improvements, and additional areas that might deserve to be the focus of additional reforms.
We focus in this section primarily on our analysis of administrative data: the six cohorts of
snapshot data at three-year-intervals between 2002 and 2017, along with restrictive-housing
oriented policy reforms and reports we collected as part of our analysis. We concentrate
19

particularly on maximum custody status in the IMU, the central focus of our study. However,
where relevant, we also present findings on other population in the IMU. As we detail in our
2020 Justice Quarterly article (Appendix C), where we published some of the initial findings
presented here, a range of custody statuses and housing locations are highly relevant to
understanding overall restrictive housing use. For instance, those on maximum custody status
outside of an IMU and those not on maximum custody status in an IMU both experience
restrictive housing conditions and also reflect the range of behavioral challenges and security
threats DOC is managing at any given time.
FLUCTUATIONS IN POPULATIONS AND LENGTHS OF STAY IN IMUS
Overall, the maximum custody population in IMUs in Washington state was lower in 2017 (342
prisoners) than at its peak in 2011 (472 prisoners). However, over the entire period of our
quantitative data analysis, there were many fluctuations in this population, from a low of 149
prisoners in 2002 to another dip to 283 prisoners in 2014. Figure 1 presents the number of
prisoners in IMUs by custody status from 2002 to 2017. These numbers suggest that the widely
touted reductions in the DOC maximum custody IMU population, which inspired this study,
were not sustained over the course of the study. Those in IMU who were not on maximum
custody status—largely those held on administrative or disciplinary segregation—saw similar
variation in population over time, peaking in 2008 and falling somewhat in subsequent years.
Figure 1. Prisoners in IMU by Custody Status, 2002-2017
800
700
s r 600
en 177
osi 500 337
r 260
Pf 291
o 400
r e 300
mb 144
Nu 472
200 105 338 342
283 100 228
149
0 2002 2005 2008 2011 2014 2017
IMU-Max IMU, Adminstrative/Disciplinary Segregation
As a proportion of the total prison population, those held in IMUs peaked in 2008, when 3.9
percent of the prison population was housed in an IMU. That proportion was substantially
20

similar in 2011, before dropping slightly in 2014 and 2017. Figure 2 presents the percentage of
the total prison population held in IMU, by custody status.
Figure 2. Percentage of Total Prison Population in IMU by Custody Status, 2002-2017
3% 2.7%
2.0%
0.9%
1.4%
1.6%
0.9%
1.9%
1.0%
1.7%1.4%1%
2%
% o
f Pri
son
Popu
altio
n 1.9%
0.7%
0% 2002 2005 2008 2011 2014 2017
IMU, Maximum Custody IMU, Adminstrative/Disciplinary Segregation
Ave
rage
Day
s in
IMU
Reductions in the average length of stay (LOS) for prisoners on maximum custody status in the
IMU were more sustained than the 2014 population reductions. Figure 3 presents the average
number of days in the IMU by custody status. For those on maximum custody status in the IMU
on the 2017 snapshot date, the average LOS in the IMU was 214 days, lower than even in 2002
(average LOS: 227 days), and a dramatic decrease from the 2011 peak average LOS of nearly
348 days. This represents a reduction in average lengths of IMU stays of more than four months
– an impressive policy intervention. Similarly, the average LOS in IMU for those held in IMUs but
not on maximum custody status on the snapshot date (likely those on administrative or
disciplinary segregation) saw a sustained decrease across the study period, from an average of
114 days in 2002 to 71 days in 2017.
Figure 3. Average Length of Stay in IMU (Days) by Custody Status and Confinement Location, 2002-2017
348 326
214
128117115 91
7166
306 284
227
2002 2005 2008 2011 2014 2017
IMU, Maximum Custody IMU, Adminstrative/Disciplinary Segregation
21

These reductions in the average IMU LOS, however, is only one measure of how much time
prisoners are spending in IMUs. Another measure of time-in-the-IMU is cumulative: over a
prisoner’s entire sentence, how much time Figure 4. Average Cumulative Days Spent in IMU by All Prisoners, 2002-2017 will he spend in an IMU setting?9 Across the
entire Washington prison population, 90 cumulative time spent in an IMU has 80 increased steadily, from an average of 43
Cum
ulat
ive
Day
s in
IMU
in IMU declined in recent years for the maximum custody population, a greater share of the
incarcerated population experienced placement in an IMU.
This analysis suggests two critical areas of focus Figure 5. Percentage of All Prisoners Spending at Least One Day in an IMU, 2002-2017 IMU reform. First, reductions in IMU
populations and lengths of stay must be 34%33%tracked over time to analyze whether they are
sustained. Second, rates of IMU use represent
% o
f Pri
son
Popu
altio
n
another critical measure in assessing IMU
reform, in addition to populations and lengths
of stay. In our 2020 Justice Quarterly article, we
hypothesize that IMU capacity is closely tied to
IMU use, noting that IMU populations increase
with increasing bed capacity and decrease with
decreasing bed capacity; this hypothesis
requires further analysis and deserves further
policy attention.
24% 25% 28%
30%
2002 2005 2008 2011 2014 2017
70
60
50
40
30
20
10
0
2002 2005 2008 2011 2014 2017
days in 2002, to almost double that, at 82
days on average in 2017 (see Figure 4).
Indeed, a greater proportion of people in
DOC experienced IMU confinement over
time. In 2002, 24% of the prison population
had spent at least one day in an IMU. By
2017, over one-third (34%) of the prison
population had spent time in an IMU (Figure
5). In short: while the average length of stay
9 For each snapshot year, cumulative length of stay in IMU is measured from the beginning of each prisoner’s current sentence up until the snapshot date.
22

In sum, the 2014 reductions in maximum custody IMU populations in Washington have not been sustained. Average lengths of stay in IMU for the maximum custody population have steadily decreased since 2011, but more prisoners in Washington DOC experience IMU
confinement each year. Decreasing IMU capacity and reducing lengths of stay are both key to
sustaining decreases in IMU populations.
RACIAL DISPROPORTIONALITIES
While Washington DOC had some successes in reducing IMU use, especially in reducing average
lengths of stay, the racially disproportionate impact of the IMU has increased dramatically since
2002. The racial disproportion of the IMU actually peaked in 2014, when the IMU population
had recently declined. Figure 6 presents the racial/ethnic makeup of the IMU maximum custody
and general prison populations. In 2014, 37 percent of
maximum custody IMU prisoners were Hispanic, as
compared to only 12 percent of the general prison
population. As the maximum custody IMU population
increased, this racial disproportionality decreased
slightly; in 2017, 27 percent of maximum custody IMU
prisoners were Hispanic, as compared to only 13 percent of the general prison population.
Figure 7 presents the racial/ethnic disproportionality of the IMU maximum custody population
relative to the general prison population. Hispanic gang members were similarly over-
represented in the maximum custody IMU population in these years (see Figure 8).
This racial disproportionality in maximum custody IMU placements raises questions about the
relationship between race, gangs, and prison behavioral histories (especially infraction rates),
and suggests an area ripe for further policy attention. We look forward to conducting further
analyses of the administrative data to better understand how these various predictors of
maximum custody status IMU classifications interact over time.
Between 2005 and 2017, Hispanic prisoners were 2-3 times as likely to be in the IMU as in the general prison population.
23

Figure 4. Racial and Ethnic Make-Up, IMU Maximum Custody and General Prison Population, 2002-2017
White, Non-Hispanic Latino/Hispanic
70% 70%
2002 2005 2008 2011 2014 2017 2002 2005 2008 2011 2014 2017
General Population General Population IMU-Max IMU-Max
Black, Non-Hispanic Other, Non-Hispanic
70% 70%
60% 60%
50% 50%
40% 40%
30% 30%
2002 2005 2008 2011 2014 2017 2002 2005 2008 2011 2014 2017
General Population IMU-Max General Population IMU-Max
0%
10%
20%
30%
40%
50%
60%
0%
10%
20%
30%
40%
50%
60%
0%
10%
20%
0%
10%
20%
24

-
Figure 5. Racial/Ethnic Disproportionality in the IMU Maximum Custody Population, 2002-2017 D
ispro
port
iona
lity
Ratio
3.5
3.0
2.5
2.0
1.5
1.0
0.5
0.0 2002 2005 2008 2011 2014 2017
White, Non-Hispanic Black, Non-Hispanic Other/Unknown Hispanic
How to read this chart
Disproportionality ratios (DR) greater than one reflect disproportionate representation in the IMU Maximum Custody population, relative to the general population.
DR equal to one reflects equal representation in IMU Maximum Custody and general population groups.
DR lower than one reflects an under representation of the racial/ethnic group.
25

BEHAVIORAL PROFILES: GANG AFFILIATION AND SERIOUS INFRACTIONS
While our analysis demonstrates that racial disproportionality steadily increased among maximum custody IMU prisoners over the study period, especially relative to the general prison population, overall behavioral profiles among both general population and maximum custody IMU prisoners fluctuated over the study period.
First, in the general population, the overall proportion of prisoners identified as gang affiliated increased only slightly over the study period, from 19 percent to 24 percent of all prisoners. While the overall proportion of gang-affiliated prisoners in the IMU was about 3 times higher, this proportion also increased only slightly over the study period, from 60 percent to 67 percent of all maximum custody IMU prisoners. In the general population, white- and black-affiliated gang members remained relatively stable over the study period (4-5 percent of the population and 9-10 percent of the population, respectively). In the maximum-custody IMU population, white- and black-affiliated gang membership fluctuated somewhat across the snapshot years, while Hispanic-affiliated gang membership increased substantially, from 21 percent in 2002 to 32 percent in 2017. Relative to their share of general population, Hispanic-affiliated gang members were consistently over-represented in the maximum-custody IMU population, making up nearly 40 percent of the population in both 2008 and 2014. Figure 8 displays this fluctuating over-representation of Hispanic-affiliated gang members, while Figure 9 displays the racial breakdown of gang-affiliates in the maximum custody IMU population.
Figure 6. Affiliation with Hispanic/Latino Gangs in IMU
Maximum Custody and General Populations
Between 2002 and 2017, Hispanic-affiliated gang membership in the general prison population doubled from 4 percent to 8 percent and in the maximum custody IMU population doubled from 21 percent to a peak of 40 percent in 2014.
45%
40%
35%
30%
25%
20%
15%
10%
5%
0% 2002 2005 2008 2011 2014 2017
General Population IMU-Max
26

Figure 7. Gang Affiliation in the IMU Maximum Custody Population, by Type of Gang
45%
40%
35%
30%
25%
20%
15%
10%
5%
0% 2002 2005 2008 2011 2014 2017
Hispanic-Affiliated Black-Affiliated White-Affiliated Other Gang
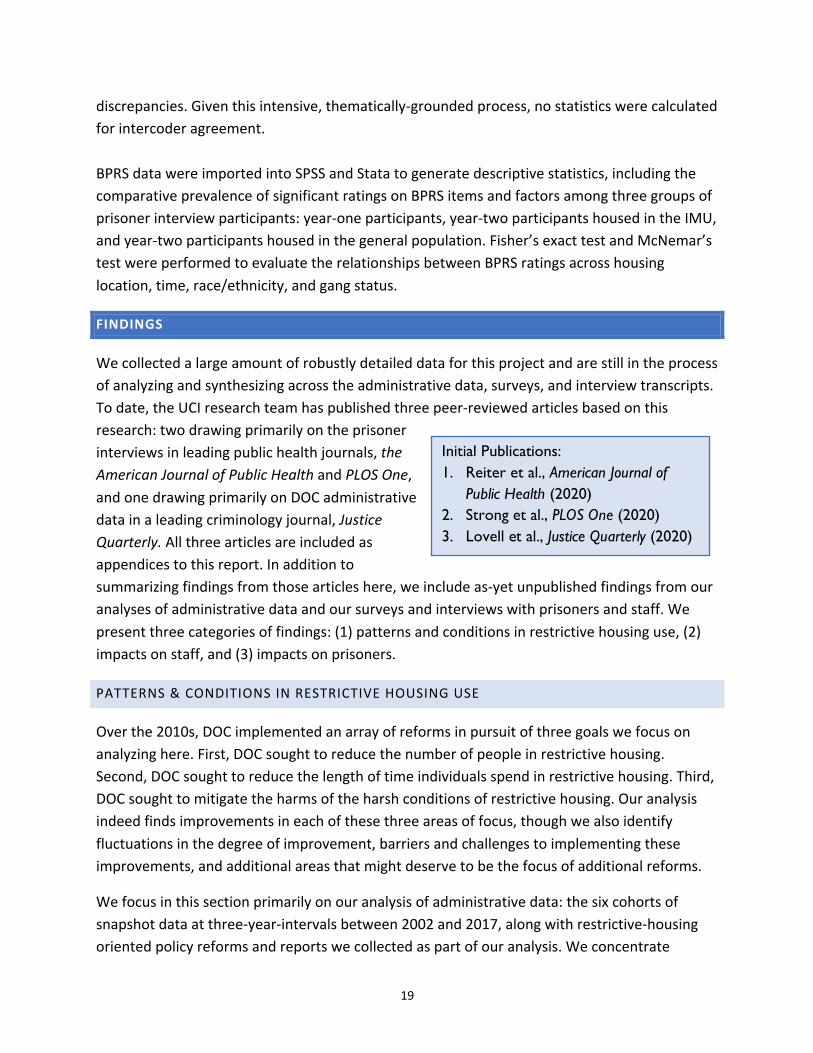
Second, in the general population, overall annual infraction rates decreased slightly over the study period (from an average of 1.3 infractions per year in 2002 to an average of 1.1 in 2017). Figure 10 displays average annual overall infraction rates, as well as counts of violent assaults and staff assaults for the maximum custody IMU and general prison populations. Average numbers of violent infraction and staff assaults remained low and stable at an average of 0.5 violent infractions per year and 0.1 staff assaults per
Annual infraction rates, and counts year in the general population. Between 2005 and of both violent and staff
2017, infraction rates in the maximum custody IMU infractions, were fairly stable over population were fairly stable. However, overall time in both the general prison infraction rates in the maximum custody IMU population and the maximum population were about 5-6 times higher than in the custody IMU population from 2005 general prison population. Following a peak of 8.3 in 2002, the mean annual infraction rate for the maximum custody IMU population fluctuated between 4 and 5 infractions per year, while the average number of violent infractions hovered around 3, and the average number of staff assaults hovered just under one. The relative stability of serious misconduct in both the general and the maximum custody IMU populations (as compared to the instability of the IMU population over this period) raise questions about whether and how infractions are related to maximum custody IMU placements – questions we look forward to addressing in future analyses.
27
Figure 8. In-Prison Violations, IMU Maximum Cu stody and General Population, 2002-2017
IMU Maximum Custody General Population
9 9
8 8
s n 7 7
oitca 6 6
rfnI f 5 5
o e ta 4 4
R/tn 3 3
uC
o
2 2
1 1
0 0 2002 2005 2008 2011 2014 2017 2002 2005 2008 2011 2014 2017
Annual Infraction Rate Annual Infraction Rate Violent Infractions (Count) Violent Infractions (Count) Staff Assaults (Count) Staff Assaults (Count)
EXISTING POLICY REFORM SUPPORTS FURTHER RESTRICTIVE HOUSING REDUCTIONS
Over the 2010s, Washington DOC enacted an impressively wide range of reforms in order to achieve the reductions in IMU populations and lengths of stay described above. These reforms also sought to mitigate the harshness of the conditions in IMUs, or restrictive housing. Table 1, below, provides our summary of the reforms we learned about in conversations with DOC leadership, staff, and prisoners, as well as through searches of policy documents archived on the DOC website. These reforms included (a) institutionally-oriented reforms, like altering conditions of confinement, especially through providing new programming opportunities for prisoners in the IMU, (b) organizational restructuring, designed to facilitate delivering these new programs, and (c) individually-focused reforms to support behavioral modification, better mental health care, and alternatives to IMU placements. Dan Pacholke, who was the Secretary of Corrections during the early planning stages of this project, co-authored a 2015 report, More
28

Than Emptying Beds, which describes many of these reforms in more detail: centralize decision-making, implement programming in segregation, and support staff.10
Our interviews with prisoners and staff confirmed that these reforms were making a difference day-to-day in terms of the overall operation and individual experience of living and working in the IMUs. Specifically, staff and prisoners described the IMUs as largely feeling safe and also providing at least some access to critical resources, like healthcare.
Table 1. Categories and Types of Washington DOC Restrictive Housing Reform, as identified in 2017
Conditions of Confinement
Organizational Restructuring
Behavior Modification
Mental Health Preventative
Congregate Programming
Creation of a Mission Housing Administrator
Cognitive Behavioral Therapy (in-cell)
Elimination of self-harm infractions
Alternative sanctions
Level System Mission-Based Housing Units
& Teams
Individual Behavior Management
Program (IBMP)
Disruptive Hygiene Protocol
Alternative Specialized
Housing Units (TRU, WRU)
Increased Elective access to
programming (GED,
Redemption,
Facility Risk Management
Teams
Chemical dependency class
counselors, MH staff
(attending to
Operation Place Safety (2013-14)
Book Club) prisoner-staff ratios)
Nature Immersion
(Blue) Room
Indeterminate sentencing
Transition/Step-down Unit
From staff, we consistently heard that there was less day-to-day violence and more person-to-person humanity than in the early 2000s. Staff described how, prior to recent reforms, in the IMUs, cell extractions were common. “It was completely rocking and rolling,” was a phrase we heard repeatedly. But by 2017, cell extractions and other violent prisoner-staff encounters were rare. One staff member we interviewed mourned the change, acknowledging “I really enjoyed cell extractions,” but he also said he knew the culture change represented an improvement in everyone’s well-being: “Is it actually good for everyone to do that stuff, you know what I mean? No. The answer is no.” This acceptance of non-violent de-escalation as the
10 Dan Pacholke & Sandy Mullins, More Than Emptying Beds: A Systems Approach to Segregation Reform (Washington, D.C.: Bureau of Justice Assistance, 2015), No. NCJ249858, https://bja.ojp.gov/sites/g/files/xyckuh186/files/publications/MorethanEmptyingBeds.pdf.
29

status quo was especially noticeable in comparison with data Lorna Rhodes and David Lovell collected 20 years ago. Prisoners also agreed that cell extractions were rare; as one noted: “We're not doing a lot of cell-extractions here. I haven't seen a cell-extraction since I've been here. So compared to the California system, and the Federal system – I was teamed [extracted
from my cell] just to give me fluids.” Our pre-interview Staff and prisoners described the IMUs as largely feeling safe and also providing at least some access to critical resources, like healthcare.
surveys confirmed these qualitative descriptions: a majority of staff (just over 60 percent of respondents) reported they “did not feel unsafe” working in the IMU, and even more prisoners (75 percent of respondents) reported that they had never felt unsafe in the IMU.
From prisoners, we consistently heard that they had access to counselors, mental health care, and a diversity of other programs. Although prisoners frequently expressed concerns about the quality and frequency of healthcare they received, they also consistently reported that they were able to access at least some care: filing and receiving responses to medical kites, seeing medical staff regularly, and getting adequate care for major illnesses and terminal diseases like cancer. For instance, in our pre-interview surveys, more than 50 percent of prisoners reported seeing medical staff daily. One prisoner’s comments were representative: “I do trust the mental health staff, yes; I just believe that they should do more.” But another said he appreciated the level of care in his current IMU: “I would say that this one addresses certain mental health issues better than others; you know? They’re more quick to deal with the mental health here with more one-on-one.”
Overall, in our interviews with prisoners and staff, as well as in our observations of custody classification committee meetings, we saw that those prisoners remaining on maximum custody status in the IMU for extended periods
• Prisoners are in the IMU for had well-documented histories of severe
specific, identifiable reasons. behavioral issues. We interviewed prisoners who
• Prisoners receive regular, had repeatedly attacked staff, prisoners who had individualized assessments regarding repeatedly harmed themselves through actions their continued IMU placement. like head banging and swallowing sharp objects, • Treatment and custody staff work and prisoners who had been in the IMU so long together to develop targeted they did not want to return to the general prison interventions with the goal of population. In observations in IMUs and at transitioning even the most headquarters, we witnessed compassionate behaviorally challenging and risky custody and treatment staff grappling with how to individuals out of the IMU. design individualized plans to address and overcome these behavioral challenges – from weekly check-ins with headquarters leadership to the provision of tailored incentives for exercise equipment and art supplies. In particular, the
30

Mission Housing Administrator is familiar with every individual in the IMU, regularly assessing and documenting justifications for their placem ent; institutionalizing such individual-level knowledge and attention is critical to maintenance of existing progress and continued reform.
In sum, prisoners are in the IMU for specific, identifiable reasons; prisoners receive regular, individualized assessments regarding their continued IMU placement by a classification committee; and treatment and custody staff work together to develop targeted interventions with the goal of transi tioning e ven the most behavioral ly chall enging and risk y i ndividuals out of the IMU. This is in stark contrast to other systems, like California, where hundreds of prisoners have spent years in restrictive housing with little or no evidence of unresolved or severe behavioral issues justifying their continued maintenance in highly restrictive conditions.
Still, administrative data suggests that Washington DOC ’s 2014 IMU population reductions have not been sustained, that an increasing proportion of people in DOC experience IMU
confinement over the study period, and that Washington DOC is a leader among state this confinement has a racially correctional systems in restrictive housing disproportionate impact. Moreover, as we reform; administrative leaders have built a detail below, prisoners and staff raised a solid foundation for continued reforms – number of concerns with both IMU conditions including IMU population reductions, and reforms . decreases in IMU sentences, and improvements in conditions. Nonetheless, Washington DOC has laid a solid
foundation for continued reforms – including IMU population reductions, decreases in IMU sentences, and improvements in conditions – with the policy changes they have implemented over the last five years, especially. Both individual- and institution-level reforms have enabled the successes DOC has achieved to date . Indeed, these reforms demonstrate that Washington is a leader among state correctional systems in seeking to understand how prisoners end up in restrictive housing for extended periods; designing programs to change IMU -stay trajectories; and implementing alternati ve pathways that shift patterns of restrictive housing placements across institutions.
IMPACTS ON STAFF
In this section, we focus on our analysis of (1) the 90 surveys we collected from staff working in IMUs and (2) the 77 interviews we conducted with sta ff working in or supervising. Among the 90 staff completing sur veys: 74 per cent were mal e, 66 pe rcent were married, 84 perce nt were white, and their average age was 44. Among the 77 staff completing interviews: 74 percent were male, 57 percent were marrie d, 84 percent were white, and their average age was 42.
31

Because we do not have overall demographics of staff in W ashington DOC, we cannot compare the demographics of our interview participants to the overall demographics of DOC staff.
We highl ight four the mes from our surveys of and interviews with staff. Each theme suggests areas where DOC is supporting and encouraging IMU staff as well as areas where DOC is already well-positioned to make further improvements to staff well- being: positive aspects of IMU staff culture; negative effects of working in the IMU on staff ; staff desire for input into IMU policies and procedures; and specific staff objections to IMU reforms.
APPRECIATION FOR IMU STAFF CULTURE
IMU staff repeatedly described comradery, trust, and professionalism among their colleagues and with immediate supervisors – both in the ir sur vey response s and duri ng i nterviews. Nearly 90 percent of correctional officers surveyed said “I feel very loyal to this unit, ” for instance. On average, staff described being satisfied with their
IMU staff largely like their jobs, trust jobs: 75 percent said they were mostly or very
their colleagues and immediate satisfied, and 64 percent said they would take the supervisors, and feel safe at work. same job again. Likewise, 75 percent reported that This satisfaction and professionalism their immediate supervisors frequently asked for can and should be leveraged in their opinions about problems (describing t he implementing IMU reforms. frequency as either “sometimes” or “always”). And two-thirds of staff (67 percent) reported feeling safe working in the IMU.
In our informal conversations and formal interviews with staff, we repeatedly observed and heard staff expressing trust and appreciation for their colleagues in the IMU. In some cases, our presence required additional staffing on the units, and many “regular” IMU staff noted how working with staff unfamiliar with IMU routines and relationships was disruptive, in contrast to their usual trusting relationship with their “regular” IMU colleagues. One staff member ’s comment succinctly represents the perspectives of correctional officers, who appreciate working in the highly controlled IMU environment, with trusted partners:
I think IMU is one of the safest places to work in the whole prison system. I mean, they're locked down 23 out of 24 hours a day; you're escorting them with another person; they're in restraints. Yeah, things can happen. Sure, the y can make weapons. Sure, they can do – but they can do that out there more easily. To me, you know what you have in an IMU and you got some – at least you got a partner there with you, under the circumstances.
32

In sum, IMU staff largely like their jobs, tr ust their colleagues and immediate supervisors, and feel safe at work . This solid foundation of satisfaction and professionalism is a significant asset to DOC leadership work ing with line staff to communicate about and implement IMU reforms.
NEGATIVE EFFECTS ON STA FF OF IMU W ORK
Although staff described feeling safe in the IMU, satisfaction with the work, and loyalty and trust in their colleagues, they also described negative effects of working in the IMU environment, especially ongoing negative mental and physical health consequences. Among the 90 staff completing surveys, the average staff member reported their overall health was good (a rating of 3 out of 5). A significant minority of staff (one quarter), however, reported their overall health was poor or fair (a rating of 1 or 2 out of 5). While their self-assessments of their overall health varied, staff consistently reported high levels of stress: the average staff member reported their overall stress level as moderate (a rating of 2 out of 3), and one -third of all respondents reported the ir overall stress levels as high (a rating of 3 out of 3). Staff consistently reported that these high stress levels affected their overall health: 80 percent of staff reported that stress had affected their health either “some” or “a lot” (a rating of 2 or 3 out of 3) in the past year. Overall, staff thought DOC failed to address correctional officers’ physical and mental health concerns; they consistently disagreed with positive statements like “ DOC provides adequate services to me et correctional officers’ physical health needs .” Additional investments in supporting staff well-being could be both well received and impactful.
Comments on the surveys and our subsequent interviews with staff in IMUs provided context for these overall reports about high stress levels in the IMU. First, staff perceived having greater – and more unreasonable – obligations during a workday in the IMU than elsewhere in the prison. For example, one correctional officer wrote: “IMU staff do twice as many duties as regular staff. They never get compensated for all the extra wor k and stress.” This sentiment of imbalanced workload across units was echoed by another custody staff respondent: “Staff are
consistently overworked in the IMUs. They are IMU staff identified key stressors: required to do a job that requires twice the work of 1. Being overworked by additional a correctional officer working e lsewhere. Staff deal
responsibilities with a lot of stress but are still reprimanded for 2. Being institutionally undervalued calling in sick.”
and under-supported 3. Needing to be hypervigilant at Second, while staff often reported trusting,
work and at home collaborative relationships with their immediate supervisors, they perceived institutional leadership
as unsympathetic and indifferent to the unique stressors of working (and feeling overworked) in the IMU. Specifically, correctional officers criticized DOC in general for not providing support
33
for staff and, thereby, undermining safety in the IMU. As one officer said (and m any others echoed): “This place does not care about staff. All they care about is making things look good and keeping the offenders happy at all costs. This results in COs sa ying screw it and not caring anymore which makes things unsafe.”
Third, while staff largely reported feeling safe at work in the IMU, they also reported being hypervigilant on the job, and also at home, off the job. Correctional officers reported that they were aware of the pervasiveness of risk in their work: “We all have to understand that when we take a job like this anything can happen at any time. That is the risk that we all take. This job is not for everybody.” Nearly all (98%) survey respondents agreed or strongly agreed that they “always have to keep it in mind that t rouble could happen any time” while at work . Moreover, respondents’ levels of stress and perceptions of risk were strongly correlated : those respondents who reported they worked in “dangerous jobs” and were always dealing with “some sort of crisis” were also more likely to report higher stress levels.
Importantly, staff seemed to struggle with leaving these anxieties, hypervigilant states of mind, and stressors at work. Staff consistently described being on edge and worried about their safety outside of work. As one staff member said:
I definitely notice like going to … fairs and that kind of stuff, in the summer with the family … I’m definitely looking around a lot more. Even going to like banks, I look around a lot more. I constantly – my head’s constantly on a swivel and I’ m in a place I don’ t really know, I’ m definitely looking – grocery store, I’ m constantly looked down – standing in the checkout line because there ’s a million people standing there and you’ re constantl y look ing around, lik e, oh y eah, that guy’s done time, that guy has done time. Like, it ’s - you can – it’s really weird when definitely get a sense for that kind of stuff. And definitely keep an eye out.
Another described how this habit of “looking around” and “keeping an eye out” was both a source of stress and a necessity for safety: “My wife gives me a hard time about it all the time. She's, like, ‘Do you ever turn the dirt bag meter off? ’ … And it may drive her nuts, but i t keeps my family safe.” One of the most common manifestations of this hypervigilance staff described Messaging about steps WADOC
is taking to value and support was being sure to sit in corners and face out looking at staff is critical; some of these doors: “In a restaurant, I can’ t sit with my back to a steps should involve addressing group of people.” And another said: “I won’ t let people pervasive hypervigilance and its
get behind me .” A growing body of literature about effects on stress. correctional officer health suggests this pervasive
34

hypervigilance among correctional officers has long-term traumatic effects; our data suggests that working in the IMU may exacerbate these effects. 11
In sum, our surveys of and interviews with staff revealed specific stress ors associated with work in the IMU: the pressure of additional responsibilities and feeling overworked, a sense of being institutionally undervalued and under -supported, and percepti ons of high risk leading to persistent hypervigilance even outside of work. These specific sources of stress, in turn, suggest areas where DOC could intervene to mitigate stress. For instance, messaging about steps DOC is taking to value and support staff and about DOC awareness of the additional work pressures some reforms entail, could mitigate stress, improve the culture of IMUs, and even facilitate acceptance of future reforms. For instance, to the extent reforms actually reduce risk o r violence in the IMU, communicating this clearly to staff could mitigate some of the hypervigilance that makes their work and home lives stressful.
STAFF DESIRE FOR P OLICY INPUT
Staff expressed frustration with and resistance to reforms imposed on them fr om “headquarters.” In our survey of staff, most staff across all facilities (63 percent) said that they “often find it difficult to agree with this Department’ s policies on important issues.” Likewise, in our interviews with correctional officers and serge ants (45 of our 77 staff interviews), the majority (80 percent) reported that they experienced tension and conflict around IMU policies. Indeed, while three -quarters of staff reported that their immediate supervisors frequently asked for their opinions, two-thirds reported that higher level administrators either “never” or “rarely” asked for the ir opini ons.
However, when we asked staff to elaborate on what was wrong with IMU policies and reforms, they almost always focused on the process by which reforms we re introduced, rathe r than on the substance of the policy. They described simply being told that a policy had changed, without either being asked whether they agreed with the change or understanding why the policy had changed. Specifically, correctional officers and sergeants complained that administrative decision-makers above them were out of touch with the r eality of cur rent operations: “They just make the decision … but we really don’ t have any say or influence how those kinds of decision are made. They ’re made by administrators that haven’ t been unit staff
11 See Lois James & Natalie Todak, “Prison employment and post-traumatic stress disorder: Risk and protective factors,” American Journal of Industrial Medicine, Vol. 61.9 (2018): 725-32.
35

in a long, long time. That don’ t remember, or they forgot where they came from.” Staff interpreted their lack of opportunities for input as some combination of leadership being lazy and uncaring: “Lik e, ‘why are they having us do this? Don’ t they understand that this is a bad idea; you know?’ You know, the option is either they do understand it’ s a bad idea and they don't care, or they don’ t know and they’ re you know, can’ t be bothered to ask.”
On the other hand, when unit managers or other leadership staff solicited the opinions of line staff about policy implementation, the staff tended to be more accepting and less critical of the policy. For instance, in one facility, a staff member described a policy change to allow porters on third shift in restrictive housing , and how the sergeant and correctional unit supervisor (CUS) consulted the correctional officers about how to implement the policy: “So, what they did is, the sergeant and the CUS came and ta lked to the staff and said, ‘Who would you guys recommend? They have to be IMS program. They have to be level four. And they have to infraction-free.’ Fine. So, we all picked, as a group … He was super polite, model inmate.” While the correctional staff we re not involved in the formal policy decision to install porters on third shift, administrators made room for correctional officers’ input and involvement by allowing them to choose who that person would be. By involving correctional officers in that proce ss, they increased staff support for and buy-in to the policy change.
Indeed, our research team heard repeatedly from staff that simply having the opportunity to talk with us about their work, express their opinions, and reflect on their experiences, was a comfort and a relief, “like a weight off their shoulders.” Staff told us this individually duri ng interviews and communicated this during our de-briefs with unit leadership at the end Staff wanted more input into policy –to have
of each site visit in the summer of 201 7. The a chance to air their opinions and to have
eager and thoughtful participation by staff in input into mechanisms of policy
our interviews provides yet another implementation on the ground.
indication of their interest in and wi llingness to engage in conversations about policy reform. In fact, bringing in outside researchers to systematically seek input from staff (as DOC frequently d oes), whether in the form of surveys or interviews, might be one way to increase both staff perce ptions that they have a voice in policy processes and their willingness to implement new policies.
In sum, survey responses, interview analyses, and informal conversations all suggest that the manner in which reform and policy changes are presented to sta ff matters: the more the policy is explained and the more staff input is solicited in the reform process, especially as to the details and mechanisms of policy implementation, the more likely staff will be to support and facilitate reform implementation.
36

STAFF OBJECTIONS TO I MU R EFORMS
While staff most frequently complained about the manner in which reforms were introduced, and especially about their lack of input in policy implementation, they also described specific objections to reforms – largely in terms of the impact these reforms had on their day -to-day work and their percepti ons of whether or not staff safety and well- being were being pr ioritized.
First, staff perceived many reforms as prioritizing prisoner well-being over staff well-being. IMU staff described IMU prisoners as the “worst of the worst” – the least deserving of the undeserving. And they repeatedly described any new or additional benefits to prisoners – whether additional commissary items, more time out of cell, or more programming opportunities – as being risky and harmful to staff. In some cases, staff perceived the reforms, or benefits to prisoners, as pushing staff into new job roles for w hich they lacked both time and training. For instance, one correctional officer said: “I mean, usually we come here and we have to do our job, which is, you know, the yard showers and all that and, you know, guys say they program, and we don’ t have time to figure out what they’ re programming. I mean, that’ s not our job description .” And another correctional officer described feeling as if he was expected to “do more with less” : “You know, the other big thing with the removal of staff is the addition of programs; you know? So it seems like the classic managerial approach of do more with less, and that’s, you know, never well received by the people that have to do the more with less.” In other words, staff tended to see rehabilitative -oriented reforms as both a burden and oppositional to their fundamental job role – to maintain safety and security.
Second, staff perceived reforms addressing individual prisoners’ special needs, like ext reme mental illness, as inconsistent. In fact, staff repeatedly described individualized treatment as dangerous – encouraging prisoners to exploit and manipulate the rules to their own benefit. For instance, one correctional officer described his objecti ons to a protocol for responding to instances of feces-smear ing in the IMU : “It is a
Staff characterized reforms as inconsistent, manipulation point, and they figured that out. risky, and dangerous. Avoiding publicly
Hey, on a Tuesday and Thursday we don’ t contradicting staff and communicating have yard and showers. Well, I want to take a more systematically about the benefits of shower, so I’m going to smear feces on t he reform for staff could minimize resistance. wall so I can go get my shower. That’ s how that works. And we have to do i t.” Other correctional officers objected to provision of things like a nerf ball for throwing, or soap for carving – both individualized attempts to address specific behavioral problems – as opening the door for other prisoners to make new demands, both adding to officers’ daily list of obligations and making security harder to maintain.
37

Third, staff described how reforms prioritizing prisoners’ needs undermined their ability to safely manage a difficult population. For instance, one correctional officer described his frustration with trying to enforce the rules and being undermined, or chastised, by supervisors, who were prioritizing prisoner well- being:
Lots of the time we ’re more nervous about getting in trouble for refusing guys. If you ask them (about) yard and shower and they don’ t answer and you ask them multiple times and raising your voice to hopefully get their reaction, then turn around and you refuse them, and then all of a sudden they ’re bitching and moaning about it, and then all of a sudden now they’ re getting it. It’ s just one of those things where it gets discouraging, but it ’s – I can only do my job.
Another correctional officer described frustration with reforms seeking to limit the imposition of infractions and sanctions within the IMU : “Now you try to correct an inmate ’s actions – I’ ve seen a lot of my infractions get thrown out, not even processed … to where we’ re not holding the people responsible. And that becomes a safety risk for us. Because the inmates don’ t show that same respect.” In sum, correctional officers emphasize consistency as a tool for both maintaining their own authority and minimizing manipulation by prisoners.
Staff did not simply describe how and why they objected to IMU reforms. They also described how they resisted these reforms, undermining policy implementation by: “ burning” prisoners on out-of-cell time, breaking rules, adhering to the letter rather than the spirit of a policy, and encouraging grievances against leadership. Often, correctional officers justifi ed non-compliance or undermining policies as the only way to compensate for a lack of resources, such as staff shortages and time limitations, during a shift. When describing this kind of undermining of policies, interviewees contextualized these strategie s as coping strategies, necessary to mitigate resource issues; staff explained that additional programming and movement required more time and careful planning over the course of a shift. For example, one correctional officer described how he purposefully tried to reduce movement during his shift, by asking about yards and showers as early as possible. He elaborated about this tactic :
It often results in the pri soner fi ling a gr ievance with the i nstitution. Howeve r, custody staff are aware of this and encourage these kinds of grievances, as they provide evidence for their argument that administration are making unrealistic demands on them with the introduction of new policies and programs in restrictive housing units.
Not all IMU correctional officers were so resistant to reform, however. For instance, another officer (a sergeant) described IMU policies as changing frequently, but characterized adapting to those changes as part of his job: “I adapt pretty well with the change. You have to, around
38

here. It’ s changing every day . . . Whether it’ s a good change or not, you’ re going to have your personal opinion and I sometimes don’ t agree but, again, I’ m a person who adapts to change.” This same office r, in fact, articulately described the importance of orienting re spectfully rather than punitive ly to prisoners in the IMU:
I just always treat them as I would want to be treated or how I was raised, which is with communication and just being respectful . . . I’ll try to give you an example. Like somebody will say, ‘ That guy’s not going to get out of his cell.’ I’ m going to say, ‘ Why?’ He’ s going to say, ‘ Because he was arguing with me and he ’s a threat, now.’ I go, ‘Well, why not work wi th the guy and talk to him to tr y to come up with a better resolution? ’ . . . Rather than just no movement and pi ss him off some more, because no movement’ s not going to teach him any different than he ’s already doing. I mean, if you’ re swearing and cussing at me, you got your arms out and your fists going at me, that’ s not going to h elp you by having no movement. Talking it out’s going to help you more. So, I’ m more of a – I guess I’m a littl e more libe ral on that part.
While some staff we interviewed described this kind of “respectful” or “liberal” approach as “drinking the K ool-Aid” of reform arguments coming from headquarters, plenty of others asserted at least acceptance of, if not also support for, the “respectful” approach. As David Lovell noted, comparing interviews he conducted in the early 2000s to those he conducted as part of our team in 2017, “A hell of a lot has changed. I did not hear the same stories about neglect and abuse.” 12
In sum, understanding the specific objections staff raised to existing reforms is critical to minimizing resistance and encouraging successful implementation of future reforms. Indeed, the specific objections staff raised to reforms suggest important areas where communication between line staff and supervisors could be clarified and improved:
• The perceived contradiction between rehabilitation and saf ety could be acknowledged and addressed in communicating with staff about reforms.
• The possibilities for simultaneously improving both prisoner and staff well- being through reform could be emphasized.
12 Conversation with David Lovell, Feb. 24, 2021, notes on file with author.
39

• Supervisors and non-custody staff advocating for indiv idualized interventions need to (1) address line staff concerns with inconsistency in treatment and policy and (2) strategize to avoid undermining line staff’ s authority in day-to-day interactions.
IMPACTS ON PRISONERS
In this section, we focus on our analysis of the interviews we conducted with a random sample of 106 maximum custody status IMU prisoners in the summer of 2017 and re -interviews conducted with 80 of these participants still incarcerated in the summer of 20 18. Where relevant, we also include some findings from the 225 surveys we collected from prisoners in IMUs in the spring of 2017. Our random sample of 106 prisoner interview participants had a mean age of 35; mean stay of 14.5 months in IMU; and mean of 5 prior convictions resulting in prison sentences. Forty -two percent of our participants were white; 12 percent were African American; 23 percent were Latino; 23 percent were “Other.” There were no significant differences between our participants and all people held in IMU s at the time of our interviews. People in the general prison population at the time of our interviews, however, were notably different than those held in IMU as they are older, less violent in terms of criminal history, serving shorter sentences, less likely to be gang -affiliated, and less likely to be Latino.
In this section, we highlight six themes from our interviews with prisoners. Each suggests areas where Washington DOC is supporting and encouraging IMU prisoners as well as areas wher e DOC is already well-positioned to make further improvements to prisoner well-being: trust, access to programs, social contact policies, health (both physical and mental), long-term management challenges, and reentry.
TRUSTING STA FF TO B E RESPONSIVE
A central theme of our interviews was that prisoners largely trusted DOC staff to meet their basic needs for food , care, and safety . Prisoners consistently expressed confidence that things like kites, grievances, and mail would be handled and delivered in good faith . They understood processes for communicating needs and concerns, and expected to receive timely (if not always
satisfactory) responses to their requests and Prisoners in WADOC frequently complaints. Indeed, when we asked prisoners if they described experiences of basic
trusted staff, from correctional officers to healthcare procedural justice: they understood providers, they said things like “I got a lot of respect for the rules, trusted processes, and them,” and “they’ re OK ,” and “they are just doing their mostly respected staff. job.” While prisoners did not describe staff as friends or
advocates, neither did they describe them as enemies or opponents. This is surprising. In many prison settings in which our team has conducted research, we have witnessed and documented
40
more adversarial relationships between prisoners and staff, with less trust that policies and procedures will be followed, devoid of respect expressed in simple phrases like “they’ re OK .”
To be clear : prisoners frequently complained about the answers they received to kites, the quality of medical care they received, and the way some staff treated them. But their complaints tended to focus on procedures and policies rather than on individual instances of mistreatment. This suggests a baseline of trust in process. The idea that rules are transparently knowable and fairl y appl ied is often called procedural justice; people who experience procedural justice are more likely to pe rceive rules and institutions as legitimate, and, therefore, to follow those rules and comply with institutional policies.13 The baseline of trust – and associated perception of procedural justice – we documented among IMU prisoners reflects an existing infrastructure and institutional culture that can facilitate further reform, like sharing new information and gaining buy -in for new policies and procedures.
PROGRAMS: ACCESS CHALLENGES AND UNREALIZED POTENTIAL
In our visits to IMUs across Washington over two years and in our conversations with prisoners and staff, we learned about a dizzying arr ay of programs available to prisoners in the IMU: A2A, ACT, chemical dependency, reading groups, and in-cell course work. Although prisoners were often eager to participate in these programs, both in order to make their IMU time productive and in order to fulfill the requirements for release from the IMU, they were frustrated with long program waitlists. Prisoners described wait times of six months or more in order to get into programs or courses they were required to take before leaving the IMU. They under stood that a variety of factors contributed to these long wait times, including : time to be transferred to the
designated programming IMU, limited Prisoners experienced waiting for I MU- number of seats available for each program, based programs as extra punishment. and program duration. WADOC could communicate more clearly with prisoners about how programming For many participants, waiting to get into waitlists are organized, and how waiting programs was the most frustrating aspect of affects IMU stays and good time. their housing in IMU , because they
experienced the wait times as an extra punishment – one they feared would extend their overall time in prison – actually making the day-to-day conditions of their confinement harder to bear. First, prisoners worried that they were either losing good time while waiting for programming, or receiving additional
13 Tom R. Tyler, “Procedural Justice, Legitimacy, and the Effective Rule of Law,” Crime & J ustice, Vol. 30: 283-357 (2003).
41

punishments by being “pushed bac k” onto longer wait lists. As time spent in the IMU can impact prisoners’ early release dates, long progr am wai t times wer e pe rceived as an e xtra punishment, essentially adding to a prison sentence. This is a place where DOC could build on the foundation of trust and procedural justice described in the prior section to simply communicate more clearly with prisoners about how waitlists are constructed and whether and how they are impacting good time and release dates .
Second, prisoners described the time waiting for programs as not just frustrating, because it amounted to more time spe nt in the IMU, and sometimes eve n more time in prison, but also “taxing mentally.” They described waiting in the IMU as “dead time, ” leaving one prisoner feeling like a “dog in a cage, ” and another feeling “anger all the time.” Yet another prisoner described doing the same set of packets three different times while waiting for a spot in face -to-face class, like A2A.
Once prisoners were able to enroll in programs, they often found the content disappointing in specific ways: too r epetitious (“the same content over and over again”), not compatible with daily life in the IMU, and structured to prior itize a pragmatic attitude over a learning mindset. One prisoner described this pragmatic mindset: “If they put them in the Hole – they ’re going to do their Hole time, they ’re going to their little program,
WADOC has built an but they’re going to do what they want to do. They’re impressive infrastructure to already set in their ways, and nothing ’s really going to support IMU programming, but change them.” And another explained: “They force it the content of those programs
upon you, which automatically makes an individual want could be improved to be more to rebel .” Prisoners also noted the tensions between relevant to IMU prisoners. what programs teach and the challenges participants face in the general prison population. For many , the e mphasis on be havioral change clashed with a prison environment that hindered application of pro-social skills and strategies. As one prisoner said: “ But, let’s be honest, this isn’ t – it didn't help you, didn’ t change you none.” Another explained that people often made -up scenarios for role-playing interactions just to complete the program, rather than actually engaging with real-life experiences and events.
In addition to these general critiques of IMU programs as (1) prioritizing just getting through in order to get out of the IMU and (2) not acknowledging the everyday challenges of prison life, prisoners described more specific shortcoming of curricula. In some cases, prisoners said they had to complete too much of the curriculum alone in their cells: “It’s meant to be a program where it’s supposed to be done with other people where you can sit in a group and talk. And they have us do it in our cells. So, that right there itself, I mean, how does that work .” In other cases, prisoners described the programs as loosely adapted from programs designed for juveniles; in fact, a number of participants had experienced the same curriculum while
42

incarcerated as juveni les. Prisoners repeatedly expressed a hope that the curriculum could be more tailored to the adult setting. Prisoners also noted that program materials were not always translated for non-English speakers or useful for prisoners who were illiterate. In these instances, programming was counterproductive to the goals of reform .
While participants were critical of the programming, they expressed this criticism in the context of wanting to use their IMU time productively, being eager for classes and learning opportunities, and appreciating the good- faith efforts of DOC in providing programming opportunities. Indeed, DOC is in a particularly positive position, having developed the infrastructure for programming in the IMU, the personnel to staff this space, and even the interest among prisoners to take advantage of programming. Figuring out how to get more meaningful content into this existing infrastructure should be relatively easy compared to the immense work that has already been done to build the infrastructure for and interest in programming among both prisoners and staff .
SOCIAL CONTACT POLICIES
In the restrictive c onditions of the IMU, one set of policies was both especially troubling to prisoners and especially likely to jeopardize their well-being during and after their IMU placements: policy r estrictions on whom they could be in contact with while in the IMU and practical barriers to making contact with even those people on their permitted contact lists.
Specifically, prisoner s frequently told us that, while in the IMU, they were only permitted to receive visits from immediate family members : parents, siblings, legal spouses, and chi ldren. Prisoners understood DOC’ s definition of family as excluding: unwed partners; children prisoners are participating in raisin g, who were not legally or biologically their own; close friends; and other individuals playing important roles in prisoners’ lives. While there may be
many valid security and management reasons for Prisoners experienced barriers to limiting visitation for IMU residents, the immediate -communication – especially restricted family-only rules in the IMU impose additional visitation possibilities and limited
layers of isolation on prisoners who have no phone access – as some of the
immediate family , those who have a strong hardest parts of doing IMU time. Both connection with extended family members (e.g., prisoners’ mental health and their re-aunts, uncles, cousins), and those who have entry prospects deteriorate when
family ties and social bonds fray. nurtured strong bonds with friends, colleagues, or mentors. For instance, one prisoner participant,
who had been in foster care , described his frustration with not being able to have a visit with a critical mentor: “I have a mentor from the streets who works in a non-profit center for LGBTQ people. He’ s not my immediate relative, so he can’ t come here to visit me .” Even when
43

prisoners had immediate family who we re e ligible to visit, geographic di stance and une xpected lockdowns thwarted visitation plans. T he prisoners we interviewed repeatedly identified visitation protocols and distance as two primary factors preventing face -to-face contact with support networks during periods of isolation.
Indeed, practical barriers, including both the location of the IMUs a nd the challenges of regularly accessing the phone in the IMU, also disrupted IMU residents’ abilities to maintain connections with their outside support networks. While prisoners on mainline may place a phone call throughout various hours each day – except for during count and meals – telephone access in the IMU is reduced to one hour, five times a week during recreational time. In the IMU, this recreational time varies daily and might not occur at all on certain days of the week. Even when prisoners did get into the yard, they complained that the phones were unreliable: a line would be dead, or the person on the other end of the line would not be able to hear them, for instance. So a prisoner wishing to speak regularly even to an immediate family member, l ike a child or spouse, might not be able to maintain any kind of consistent communication. As one participant described:
When I was in isolation last time , that put tension [on my marriage] . My wife and I were used to having three phone calls a day and we were al ways se nding emails back and forth and getting contact visits on a weekly basis. When I got [placed in solitary confinement] , little by little, I noticed that there was distance growing between us … My marriage didn’ t work out after that.
These rule-based and practical barriers to social contact, and the resulting frayed familial and social networks, have documented consequences for prisoners’ well-being in and out of the IMU. Among the random sample of prisoners we interviewed, the weaker prisoners’ familial attachments, the more likely they were to have mental health problems. Of those prisoners who reported strong familial attachments, only 15 percent had a history of self-harm. But of those prisoners who did not report strong familial attachments, 85 percent had a history of self -harm.14 Indeed, our analysis suggests that maintaining social bonds is critical to surviving time in the IMU. Strong social bonds both allow prisoners to embody roles as part of social webs beyond that of “ convict” and provide material and emotional support, advocacy, and psychological stability. A robust body of social science confirms this finding, docume nting how
14 To calculate this, we linked histories of self-harm from BPRS and medical records (a yes/no binary variable) to interview transcripts. In coding in terview transcripts, we identified those participants who had described having “strong” family b onds and m aintaining re gular family c ommunications, and w e identified those participants who described having limited or no communication with family.
44

social bonds facilitate successful re-entry after prison and l ong-term criminal desistance.15 In sum, facilitating the maintenance of existing social bonds for prisoners in the IMU will likely mitigate the mental health impacts of the restrictive conditions and facilitate more successful re-entry into the general prison population and society.
One possible way to facilitate maintenance of social bonds could be through provision of tablets i n the IMU. In fact, in our year -two interviews, prisoners described being able to communicate with the outside world – especially with JPAY players they had missed in the IMU – as the greatest form of freedom post-IMU. During our second-year interviews with prisoners no longer in the IMU, several participants we re even compelled to retrieve their JPAY players to show to us. The player proved critical to re -entry, facilitating immediate contact with prisoners’ friends and family. Such communication was
IMU prisoners described JPAY players especially important for those whose loved ones as critical to easing their re-entry into lived out of state or could not visit in-person. And the general prison population.
the JPAY technology especially facilitated Providing some access to tablets in intergenerational communication with younger the IMU could mitigate some of the family members – like nieces and nephews – who frayed social bonds prisoners are less inclined to handwrite letters or talk on the describe experiencing there. phone. Former IMU prisoners described writing electronic messages, sharing and saving photos, and engaging in video calls. By providing access to the outside world, JPAY players gave prisoners an opportunity to reflect on, process, and express their experiences to those they cared about most. As one participant explained: “ Like it’s easier to text than write than actually – ‘ cause you’ re able to take a moment, reflect on what you want to say than when you’re having a conversation. So, it’ s a lot easier. It also builds relationships.” JPAY players were also a source of entertainment for prisoners in (re)constructing their daily routines. Being able to listen to music or play games on their devices
15 Cochran, J.C., “Breaches in the wall: Imprisonment, social support, and recidivism,” Journal of Research in Crime and Delinquency, 51.2 (2014): 200-229; Cochran, J.C. and Mears, D.P., “Social isolation and inmate behavior: A conceptual framework for theorizing prison visitation and guiding and assessing research,” Journal of Criminal Justice, 41.4 (2013): 252-261; Liu, S., Pickett, J.T. and B aker, T., “Inside the black box: Prison visitation, the costs of offending, and inmate social capital,” Criminal Justice Policy Review, 27.8 (2016): 766-790; Martinez, D.J. and Christian, J., “The familial relationships of former prisoners: Examining the link between residence and informal support mechanisms,” Journal of Contemporary E thnography, 38.2 (2009): 201-224; Mills, A. and Codd, H., “Prisoners' families and offender management: Mobilizing social capital,” Probation Journal, 55.1 (2008): 9-24; Naser, R.L. and La Vigne, N.G., “Family support in the prisoner reentry process: Expectations and realities,” Journal of Offender Rehabilitation, 43.1 (2006): 93-106; Swanson, C., Lee, C.B., Sansone, F.A. and Tatum, K.M., “Prisoners’ perceptions of father-child relationships and social support,” American Journal of Criminal Justice, 37.3 (2012): 338-355; Wallace, D., Fahmy, C., Cotton, L., Jimmons, C., McKay, R., Stoffer, S. and Syed, S., “Examining the role of familial support d uring prison and after r elease on post-incarceration mental health,” International Journal of Offender Therapy and Comparative Criminology, 60.1 (2016): 3-20.
45

helped break up the monotony as prisoners re -adjusted to general population. Players also helped prisoners plan for the future, whether org anizing their legal or other personal affairs.
That said, p risoners also described problems with JPAY players. For many prisoners , the costs of the players and video messaging were prohibitive (even if chea per than travel costs for in- person visits). P risoners who only took advantage of the JPAY kiosks wished for the increased communication with family and friends facilitated by an individual player. JPAY expenses create inherent inequities in communication, which are, in turn, likely to affect re -entry. J PAY use is also contingent upon technological capacity. For instance, many participants shared stories of frustration and anxiety when they could not use their player after the prison Wi-Fi went down.
In sum , the communication and entertainment potentials of tablets make the devices valuable to prisoners adjusting to life outside of the IMU and might also repair social bonds otherwise frayed by IMU placements. Acce ss, costs, and capacity , however, would have to be addressed in expanding the benefits of tablets to pr isoners during and post-IMU. The use of JPAY players (or other tablets) during IMU placement is worth further consideration. To be clear, tablets are not an appropriate replacement for in- person visitation, even in the IMU; they simply have potential as an additional resource to further support the social contacts and bonds that mitigate the harms of restrictive housing.
HEALTH
Our interviews with IMU prisoners and, especially, our systematic applica tion of the Brief Psychiatric Rating Scale during these interviews, established that time in the IMU has significant physical and mental health consequences for prisoners. In two articles published in leading public health journals, the American Journal of Public He alth and PLOS ONE, we detail the mental and physical health consequences of IMU time; we include those articles as Appendices D and E, respectively, and we summarize the fin dings here.
First, prisoners in the IMU reported high rates of psychiatr ic symptoms, suicide attempts, and incidents of self-harm, and were more
We found high rates of serious mental health than twice as likely to have a serious problems in the IMU: mental illness designation as prisoners in
• 1 in 4 IMU prisoners had clinically significant the general prison population. Our initi al symptoms of depression and anxiety. sample of 106 participants had a mean • 1 in 2 IMU prisoners had clinically significant BPRS rating of 37 and a median rati ng of psychiatric distress. 33 (out of a possible range from 24 to • IMU prisoners were 2x as likely as GP 168), suggesting mild psychiatric prisoners to have an SMI designation. symptoms among the study population
46

at the time of our interviews. Analysis of individual BPRS items showed clinically significant ratings (of 4 or higher of a possible 7) for as much as one quarter of the population sampled, especially for the depression and anxiety symptoms. Further analysis of BPRS factors (measuring 3-4 symptoms commonly associated with one another), as opposed to individual items, provided additional evidence of clinically significant psychiatric distress in as much as half of the population sampled, as with the depression-anxiety-guilt-somatization (DAGS) factor. See Table 2 below for a summary of these findings. Importantly, the BPRS assesses only symptoms experienced in the last two weeks, so BPRS scores may well undercount psychiatric symptoms experienced intermittently over longer periods.
Administrative data support the finding of long-term psychological distress. Among our respondents, 19 percent had serious mental illness (SMI) designations, 22 percent had a documented suicide attempt, and 18 percent had documentation of other self-harm, all at some point during their incarceration, either before or during their time in the IMU. Moreover, respondents with SMI designations were more likely to report positive symptoms and slightly more likely to report all other factored symptoms than non-SMI respondents (See Table 3 in the AJPH article for more details). These findings support the validity of the BPRS assessments.
Qualitative interview data revealed symptoms not otherwise captured by the BPRS and medical files. Two classes of symptoms were reported by a majority of respondents: toll of being in the IMU (80% of respondents; cumulatively, the topic was mentioned 359 times) and the psychological consequences of social isolation (73% of respondents; cumulatively, the topic was mentioned 192 times). Two additional symptoms were as prevalent as other clinically significant BPRS items, like anxiety: references to sensory hypersensitivity (16% of respondents mentioned this at least once) and loss of identity (25% of respondents mentioned this at least once). Given these findings, in year two follow-up interviews with prisoner participants, we also included PC-PTSD-5 instrument questions to assess the prevalence and severity of post-traumatic stress disorder (PTSD). Within the month preceding the interview, more than 40 percent of participants (44 of 79) indicated 3 or more symptoms of PTSD, the baseline score for establishing a probable PTSD diagnosis. As discussed further in the re-entry section below, these symptoms of PTSD were closely linked to earlier experiences in the IMU.
Second, prisoners in the IMU reported high rates of physical health problems associated with their confinement in the IMU. In 2017, 15 percent of interview participants reported having clinically significant somatic concerns (concerns “over present bodily health”) on the BPRS assessment. In the 2018 re-interview sample, of the 80 respondents re-interviewed in the second year of the study, 12.5 percent reported clinically significant ratings of somatic concerns. Of those who reported a clinically significant somatic concern in 2017 and who were re-interviewed in 2018, 25 percent indicated a persistence of clinically significant somatic
47

concerns in 2018. Of those who were still in IMU in 2018, 21 percent reported clinically significant somatic concerns, compared to just 8 percent of those housed in the general prison population. While the descriptive data appear to demonstrate higher proportions of somatic
Table 2. BPRS Symptom and Factor Prevalence 2017 and 2018
2017 (N=106) IMU 2018 (N=28) Non IMU 2018 (N=52) - Symptoms16 Depression 24.50% 25.00% 15.38%
(n=26) (n=7) (n=8) Anxiety 24.50% 32.14% 28.85%
(n=26) (n=9) (n=15) Somatic Concern 15.10% 21.43% 7.69%
(n=16) (n=6) (n=4) Guilt 17.90% 17.86% 7.69%
(n=19) (n=5) (n=4) Hostility 11.30% 17.86% 17.31%
(n=12) (n=5) (n=9) Hallucinations 9.40% 14.29% 11.54%
(n=10) (n=4) (n=6) Excitement 10.40% 14.29% 7.69%
(n=11) (n=4) (n=4) Factors17
Positive 16.00% 17.90% 13.50%
(n=17) (n=5) (n=7) Negative 4.70% 3.60% 3.80%
(n=5) (n=1) (n=2) DAGS 49.10% 42.90% 48.10%
(n=52) (n=12) (n=25) Mania 17.00% 14.30% 17.30%
(n=18) (n=4) (n=9)
16 Only clinically significant symptoms (rating of 4 or higher) that were reported by 10% or more of the sample are presented. 17 Factors combine 3-4 different symptoms commonly associated with one another. Positive = hallucinations, unusual thought content and conceptual disorganization; Negative = blunted affect, emotional withdrawal, and motor retardation; DAGS = depression, anxiety, guilt and somatization; Mania = elevated mood, distractibility, motor hyperactivity, and excitement.
48

concerns in IMU settings, the difference was not statistically significant at the 95 percent confidence level (p = 0.09; Fisher’s exact test).
Data from our 225 initial surveys collected from IMU prisoners also indicated high rates of concerns with physical health among the IMU population. Of the 225 survey respondents, 63 percent expressed health concerns; 48 percent were taking medication; 17 percent had arthritis; and 8 percent had experienced a fall in solitary confinement. And 82 percent replied “yes” to the question “Have you experienced any changes in yourself?” while in the IMU.
Based on these high rates of reported concerns with physical health, both among survey respondents, and on the BPRS assessments of interview subjects, we systematically analyzed all references to physical health concerns in the prisoner interview transcripts. Through this analysis, we identified three pervasive physical health concerns among IMU prisoners: skin irritations, weight fluctuations, and musculoskeletal pain.
Participants described rashes, dry and flaky skin, and fungus developing in isolation. They understood these conditions as being directly associated with poor air and water quality, irritating hygiene products, and a lack of sun exposure inherent to IMU conditions of confinement. Likewise, participants described the interrelationship between a lack of nutritious food or adequate calories in the IMU, feelings of lethargy and being too overwhelmed to do anything but lie around all day, and rapid weight fluctuations experienced during periods spent in the IMU. Participants described their weight going down with regular and social exercise routines and going up with exercise-induced injuries or periods of lethargy. Concerns around exercise, diet, and the associated body weight fluctuations, like concerns with skin irritations, highlight the interdependence of physical and mental wellbeing for prisoners in the IMU. Finally, participants spoke frequently about one specific, chronic ailment in solitary confinement: musculoskeletal pain. While participants attributed their musculoskeletal pain to a range of causes from physical injury to arthritis, bursitis, and sciatica, they consistently experienced this pain as untreated and interfering (physically and mentally) with even those few, limited activities available to them in the IMU.
In addition to specifying these physical health concerns, participants described multiple barriers to receiving adequate healthcare in the IMU. First, prisoner respondents worried about being punished with additional time in the IMU for activating an emergency response, if staff ultimately deemed
We found common patterns of physical health problems in the IMU: • Skin irritations • Weight fluctuations • Musculoskeletal pain
Barriers to receiving adequate healthcare in the IMU: • Fear of incurring more IMU time • Lack of privacy • $4 co-pay
49
their health issue to be non- emergent. This fear prevented them from seeking care, even when they were experiencing concern ing symptoms, like heart palpitations. Second, prisoner respondents worried about the lack of privacy available to them if they sought or needed any form of healthcare: needing to hand a medical kite to a correctional officer passing by, needing to speak with a nurse at “cell-front” in e arshot of other s, or submitting to a restrained “escort” to a medical treatment area. The lack of privacy was a particular deterrent to seeking mental health care, due to stigma around mental illness in prison and fear of b eing targeted by other prisoners as a result of their seeking mental health treatment. Third, prisoner respondents were dissuaded from seeking care by the $4 co-pay for a non-emergency medical appointment (for non-indigent prisoners). Because of IMU polici es capping overall prisoner spending for any need (whether healthcare, food, or toiletries), this $4 co-pay represented a larger proportion of their available money in the IMU than in the general population and so represented an additional barrier to seeki ng care from within the IMU. Physical and mental health concerns in the IMU might be mitigated and reduced by addressing some of these barriers to IMU residents seeking and accessing care.
LONG-TERM MANAGEMENT CHALLENGES IN TH E IMU
While we have focused in much of this section on common and prevalent experiences across our random sample of interview subjects, a small subset of the people we interviewed had different experiences in the IMU and presented different challenges to DOC . For instance, we interviewed IMU pri soners who had re peatedly assaul ted staff, repeatedly se riously harmed themselves, or repeatedly committed serious rule violations as soon as they were released from the IMU in self-described efforts at sabotage. In other words, these prisoners r eflect a small group of those with ongoing or severe behavioral challenges. DOC officials were actively engaged with following the behavioral trajectories of these prisoners, meeting with them individually, and investigating options to shorten their time in IMU . This is laudable.
Another population that presents serious long-Washington is well-positioned to pilot term management challenges for DOC are STG -and promote new initiatives focusing identified prisoners. Among the random sample of on viable placement and programming
IMU prisoners we interviewed, nearly one -third alternatives for IMU prisoners with (29 percent) had been in the IMU for at least one ongoing, severe behavioral challenges. year. Of these , more than half (55 percent) were
STG members or affiliates. Of these, three were awaiting out- of-state transfer due to ongoing , serious STG-related activity. Again, these are small numbers of prisoners, but they represent significant management challenges, absorbing DOC time and resources, and driving up key restrictive housing metrics, like average lengths of stay, frequency of cycling in and out of the IMU, and the racial disproportionality of IMU placements (see Figures 8 and 9 above).
50

To date, much solitary confinement reform nationwide has ignored such difficult cases, focusing instead on the more widespread over-use of solitary confinement for prisoners who have not committed serious rule violations, as with prisoners serving indefinite solitary confinement terms in California prisons due to gang status labels (prior to the Ashker reforms), or prisoners who have spent extended terms in solitary confinement for non-serious or single infractions. Having successfully reduced IMU populations (albeit with some fluctuations) and lengths of IMU terms, Washington is well-positioned to pilot and promote new initiatives focusing on viable placement and programming alternatives for IMU prisoners with ongoing, severe behavioral challenges. As Washington officials know too well, no single solution is likely to address the wide range of behavioral challenges among those individuals who have experienced repeated, extended IMU placements.
One commonality we noticed among IMU “long-termers” was that they often felt they had nothing (more) to lose through misbehavior, whether they had histories of serious violence against themselves or others. To the extent Washington officials are able to provide hope and resources to these prisoners, these prisoners’ calculations about the desirability of violence shift. For instance, providing one IMU prisoner with a nerf ball to throw, another with soap to carve, and scheduling weekly headquarter check-ins with a third, at least anecdotally reduced misbehavior and violence. In future research, we look forward to further analyzing both these specific cases and broader DOC efforts to address individual and group behavioral challenges.
RE-ENTRY
IMU prisoners overwhelmingly looked forward to being released back into the general prison population. They associated re-entering the general population with improved access to clothing, food, hygiene products, exercise, programming, and medical care. And transitioning back to the general population offered opportunities to feel “human” again: “Well, it allows you to have contact. It allows you to be human. It allows you to see what people do on a daily basis that come from the field or to work, and allow me to sub-act that. Allowing you to copy what is considered human.”
But re-entry came with challenges and anxieties, too. Prisoners reported significant difficulty readjusting to regular social contact upon leaving solitary confinement. Transitioning to multiple-person housing, or a particularly bustling unit, is challenging to navigate after having extremely limited interactions with people for months or years. Something as simple as shaking hands represents a significant amount of contact for someone just released from IMU. Prisoners also develop different privacy expectations while in isolation, which can make re-entry feel like a “thousand eyes are watching you.” Re-adjusting to life in general population also entailed a level of choice and personal
51

responsibility not typically exercised in isolation ; prisoners described the challen ges of anticipating transfer to a new location, figuring out the day -to-day processes of their new unit, and acclimating to the work and social norms of a new group of correctional staff and fellow prisoners. Transitioning back into the general population, with new norms and fewer restrictions, disrupted the consistent (and sometimes rigid) routines prisoners had developed to manage their time in solitary confinement.
BPRS and PTSD scores confirmed ongoing Mental health symptoms experienced challenges with the mental health problems in the IMU persisted after release, prisoners experienced in the IMU. For along with new symptoms indicative instance, in year -two interviews, of PTSD. Former IMU prisoners,
therefore, face ongoing mental health respondents not in the IMU experienced needs and challenges. higher rates of clinically significant anxiety
(as scored through the BPRS) than they had in the IMU (See Table 2 above). And prisoners in our study not in the IMU in year two frequently described extreme sensitivity to any amount of noise, feeling overwhelmed by the amount of movement and stimulation they experience d in the general population, intrusive thoughts (like triggered memories and flashbacks), and an inability to stop experiencing symptoms of guilt and blame . Each of these experiences are consistent with symptoms of post-traumatic stress disorder (PTSD). While IMU p risoners were often just trying to make it through, upon release back into the ge neral prison population, they continued to deal with the ongoing mental and physical challenges first experienced in the IMU. The l ack of sensor y stimulation and social interaction in the IMU seemingly promotes rumination and fixation on traumatic, disturbing, or distressing memories, and this rumination lingers even after leaving the IMU .
One prisoner respondent’ s description of this constellation of symptoms, which make the transition from the IMU to the general prison population difficult, is representa tive:
When you isolate us , you kind of deprive us of those sensories everyday you know? Like since I’ve been here … I’ ve noticed like loud noise makes me feel, I don’ t like it . If there’ s too much stuff going on, I find myself I get all irritated. If ther e’s a l ot of people I ge t weirded out if the re’s too much activity going on I kind of can’ t be around it. It’ s just it paranois me I don’t know why. It’ s only happened since I’ ve been in here this time. I think it’ s because I’ ve been isolated for as long a s I have been. Things that I’m not used to k ind of throws me through a loop.
Likewise, staff described how they observed these adjustment difficulties in prisoners leaving the IMU:
52

I think they’re uncomfortable being out of restraints around people … I don’t think they know what to do. For example, I used to watch them come out of IMU and in general population housing unit, they’d come to me and it would be strange for them to … have somebody walk up and say, “Hey, man, how’s it going?” and touch them. They’re not used to people touching them … All that noise and all those people around them and having to share a cell with somebody and have somebody so close, they’re not used to that. Those are effects of long-term restrictive housing. I think they improve but – I mean, I’ve watched that happen over and over again.
Prisoners contemplating release from the IMU not into the general prison population, but instead onto the streets, experienced significant anxiety about this looming transition. As one prisoner described:
Most people get released to the streets get a chance to go to … at least get out of the hole because they don’t want to release people to the streets from the hole because that causes safety risks. For me, they don’t have any options … My DOC officer is coming to pick me up . . . it’s not like I wanted it to happen but he’ll probably put me in handcuffs until I get to the office and actually wait to release me because, until I’m out of their custody, I’m still a security risk.18
While we know DOC sought to ensure prisoners transitioned from the IMU into general population prior to release to the streets, this was not possible in every case. Understanding the challenges prisoners experience upon leaving the IMU, and their anxieties about release, are, therefore, especially important to designing transition and release plans.
Our analysis shows that solitary confinement produces a unique cluster of mental health symptoms – including but not limited to cognitive decline, anxiety, depression, hallucinations, and PTSD.19 Our interviews revealed an additional layer of difficulty for prisoners reentering the
18 While we sought to interview prisoners who had paroled between our year-one and year-two interviews, we were not able to make contact with any of these individuals and so cannot systematically analyze actual experiences of release-to-the streets.
19 Arrigo, B. A., & Bullock, J. L. (2008). The psychological effects of solitary confinements on prisoners in supermax units: Reviewing what we know and recommending what should change. International Journal of Offender Therapy and Comparative Criminology, 52(6), 622-640. doi: 10.1177/0306624X07309720; Grassian, S. (2006). Psychiatric effects of solitary confinement. Washington Journal of Law & Policy, 22, 325–383; Grassian, S., & Friedman, N. (1986). Effects of sensory deprivation in psychiatric seclusion and solitary confinement. International Journal of
53

general prison population (and mainstream society) from the IMU. The more time a person spends in solitary confinement, the more difficult their transition back into the general prison population. Importantly, our analyses of rates of IMU placement in DOC (discussed in particular in the first findings section of this report on patterns in restrictive housing use) suggest that (1) large numbers of prisoners experience IMU placements during their stay in DOC and (2) many prisoners cycle in and out of the IMU. This suggests that these long -term effects of IMU placements may be common, if not pervasive, among DOC prisoners.
In sum, prisoners described, and sta ff observed, common challenges transitioning from the IMU back into the general prison population, or back onto the streets . Still, those prisoners who had spent extended periods of time (years rather than months) in the IMU , but who were ulti mately able to transition back into the gene ral prison populati on descr ibed significantly impr oved quality of life and well-being in their new surroundings.
For instance, our team interviewed one prisoner, who spent a total of one year in the IM U. When our team re -interviewed this prisone r i n 2018, he was at a camp, at the lowest security level in the system, grateful for his “freedom, ” back in communication with his family, and feeling ready for his looming release date (within the year of the interview ): “Everything’s turned around real fast from being in the cell . . . to just being almost like out in the world . . . They're just letting you know that I'm getting closer and closer to finally getting out.” Our team interviewed another prisoner, who spent a total of two years in the IMU, during which time he had no contact with his family, and had engaged in repeated serious self-harm, resulting in multiple surgeries. When our team re -interviewed this prisoner in 2018, he was living in the general prison population with a cellmate, had re -established a relationship with his young daughter While prisoners face ongoing mental
and her mother, and had not engaged in self-harm health needs following IMU stays,
in months. many also appreciate increased family connections, exhibit better behavior,
In many cases, prisoners pointed to a specific staff and experience overall improvements member who had gotten to know them, expressed in well-being after leaving the IMU. concern for their well-being, and advocated for targeted interventions , like family contact , or transitional programs to facilitate transitioning out of the IMU. Such targeted, individualized treatment interventions, often coordinated by Program Managers at the institution- level, or the Mission Housing Administrator from
Law and P sychiatry, 8(1), 49-65; Haney, C., & Lynch, M. (1997). Regulating prisons of the future: A psychological analysis of supermax and so litary c onfinement. New York Review of Law and Social Change, 23, 101-195.
54

headquarters, were critical to intervening to get some of the longer-term IMU prisoners back into the general prison population. For instance, one Program Manager said:
I follow up with all of my offenders. When they leave and go to the other institution after they’ve been out of here for three months, I’ll go and visit them at their other institutions and see how they’re doing . . . We’ve had a couple that’ve gone through the program twice and a lot of people are looked down on that and go, ‘Oh, if they didn’t learn the first time, why is he going to learn a second time?’ Well, hey, it might take somebody four or five times before they get it. Especially if they’re between that 28 to 38 age range.
Likewise, the Mission Housing Administrator, who follows individual maximum-custody IMU placements throughout the entire Washington DOC system, noted: “We have hundreds of success stories of people who have gotten out of IMUs.” He said he “get(s) calls from moms every once in awhile” thanking him for giving their sons a chance by letting them out of the IMU. And, he added, he has “a drawer full of letters from people saying thank you.”
Such stories stand as important reminders that even prisoners once thought to be unmanageable can improve outside of the IMU and learn to thrive in our communities, even in spite of the many documented mental health challenges associated with having spent time in solitary confinement.
EPILOGUE: ONGOING REFORMS, 2018-2021
While data collection for this research project formally concluded in 2018, reform efforts within Washington DOC continued. The Mission Housing Administrator continued to oversee all cases of long-term maximum custody IMU placements and to develop individualized interventions – from regular phone calls and exchanges of letters to facilitating more family contact – to assist in transitioning people out of the IMU. Between 2018 and 2020, Washington DOC partnered with the Vera Institute of Justice to pursue further restrictive housing reform (and also joined a partnership with AMEND to improve overall correctional culture).20 In 2021, Vera Institute reported that overall restrictive housing use decreased by nearly ten percent between 2018
20 See PRESS RELEASE: The Washington State Department of Corrections Partners with the Vera Institute to Focus on Restricted Housing Reforms, May 16, 2019, https://www.doc.wa.gov/news/2019/05162019p.htm.
55

and 2020, and average and medium lengths of stay in IMU on maximum custody status decreased significantly, by 18 and 33 percent, respectively. 21
Although the onset of COVID in early 2020 set som e of Washington DOC continues these restrictive housing reduction efforts back, Washingt on to develop and implement DOC continues to implement additional reforms designed to strategies to reduce reliance
(1) further reduce reliance on restrictive housing on restrictive housing and (eliminating the sanction of disciplinary segregation, improve conditions of shortening the maximum time in administrative segregation confinement in IMUs. from 47 to 30 days, implementing “earned time credits” for
people assigned to maximum custody, and piloting new hearings processes to divert ser iously mentally ill prisoners from restrictive housing ) and (2) improve conditions of confinement within restrictive housing units (increasing out- of-cell time, implementing plans to t rack these increases through a program called Pipe, permitting a broader range of visitors beyond immediate family, and notifying emergency contacts when prisoners are placed in restrictive housing). In addition to these reforms, Washington DOC has been and plans to continue “re -purposing” IMU units for other less restrictive “missions” like “safe harbor” units for gang dropouts, transition units for people moving between IMU and general population, and a potential unit for people with traumatic brain injur ies. As the Mission Housing Administrator said, “we are trying to take r estrictive housing beds away, so they can’ t be filled.” 22
DOC has also been working to address IMU staff concerns. DOC established a Steering Committee in 2018, including line staff, m ental health professionals, and correctional managers, to help to develop and implement IMU -related policies. By including line staff, t his Committee directly addresses staff desi res, documented in this repor t, to be hear d and to have more input in IMU -related policy decisions. In addition, DOC developed a training handbook especially for IMU staff, and now requires staff with IMU posts to complete a training program associated with this handbook within 6 months of beginning work in an IMU. In sum, DOC has
21 Rachel Friedrich, “Washington Corrections Continues Restrictive Housing Reforms,” Oct. 28, 2020, https://www.doc.wa.gov/news/2020/10282020.htm; see a lso Vera Institute of Justice, Safe Prisons, Safe Communities: From Isolation to Dignity and Wellness Behind Bars, Closing Memo – December 2020 (on file with author).
22 See Vera Institute of Justice, Safe Prisons, Safe Communities: From Isolation to Dignity and Wellness Behind Bars, Closing Memo – December 2020 (on file with author); conversation with Tim Thrasher, Feb. 19, 2021 (notes on file with author).
56

laid a strong groundwork from which to continue to implement many of the recommendations identified in the executive summary to this report.
57

APPENDICES
A: CLASSIFICATION OF DOC PRISONER CONFINEMENT STATUS ON INDEX DATES BY LOCATION AND CUSTODY LEVEL
Legend 5 MaxIMU 4 OthIMU 3 Max SOU/ITP 2 Max, Other
1 GP 0 UNK
IMU SOU CBCC OTH FIELD UNK PRISON
4 MAX 5 3 3 2 0 0
CUSTODY 3 CLO 4 1 1 1 1 1
LEVEL 2 MED 4 1 1 1 1 1
1 OTH 4 1 1 1 1 1
0 UNK 4 0 0 0 0 0
G17 Custody Population by Index Location and Custody Level
IMU SOU CBCC OTH PRISN FIELD UNK TOTALS
4 MAX 342 30 22 18 0 0 412
CUSTODY 3 CLO 77 56 400 988 32 0 1553
LEVEL 2 MED 103 74 43 3441 43 0 3704
1 OTH 69 149 16 10,811 550 0 11,595
0 UNK 12 0 0 470 146 51 679
TOTALS 603 309 481 15,728 771 51 17,943
58

B: ESTIMATES OF RESTRICTIVE HOUSING CAPACITY, 1999-2020
1999 2002 2005 2008 2011 2014 2017 2020
Local RH Units AHCC
CRCC
TRU
WCCW
WSR-3a
WSR-3
WSP-4
64
0
40
40
72
80
101
64
0
40
40
72
80
101
64
0
40
40
0
80
101
64
0
0
40
0
80
101
32
100
0
40
0
0
101
32
100
0
40
0
0
0
32
100
0
40
0
0
0
32
0
0
40
0
0
0
Local RH Units Total
397 397 325 285 273 172 172 142
IMUs (Ad. Seg. Beds) CBCC-IMU
MCC-IMU
MICC-IMU
SCCC-IMU
WCC-IMU
WSP-IMU (N)
WSP-IMU (S)
CRCC IMU
124(62)
0
64(0)
0
124(62)
96(0)
0
0
124(62)
0
64(0)
96(48)
124(62)
96(0)
0
0
124(62)
0
64(0)
96(48)
124(62)
96(0)
0
0
124(62)
100(100)
64(0)
96(48)
124(62)
96(0)
200(100)
0
124(62)
100(100)
0
96(48)
124(62)
96(0)
200(100)
0
124(62)
100(100)
0
96(48)
124(62)
96(0)
200(100)
0
124(62)
100(0)
0
96(0)
124(62)
96(0)
200(100)
0
124(62)
100(0)
0
96(0)
124(62)
96(0)
200(100)
100(70)
IMUs Total 408 552 552 952 888 888 740 770
Sum Local RH + IMUs
805 949 877 1237 1163 1060 912 912
59
C: JUSTICE QUARTERLY ARTICLE
See next page
60

For Peer Review Only
Justice Quarterly
Opening the Black Box of Solitary Confinement through Researcher-Practitioner Collaboration:
A Longitudinal Analysis of Prisoner and Solitary Populations in Washington State, 2002-17
Journal: Justice Quarterly
Manuscript ID RJQY-2020-0181.R2
Manuscript Type: Original Article
Keywords: Restrictive housing, Solitary confinement, Gangs, Prison
The Version of Record of this manuscript has been published and is available in Justice Quarterly, published online Dec. 21, 2020, https://doi.org/10.1080/07418825.2020.1853800.
URL: http://mc.manuscriptcentral.com/rjqy

123456789101112131415161718192021222324252627282930313233343536373839404142434445464748495051525354555657585960
Page 1 of 29 Justice QuarterlyTable 1. Washington DOC Population Characteristics, 2002-2017
Cohort 2002 2005 2008 2011 2014 2017
Age at Snapshot (in Years) 18 to 25 21% 19% 17% 16% 13% 11% 26 to 35 33% 33% 32% 34% 35% 34% 36 to 45 29% 29% 28% 25% 26% 27% Over 45 17% 20% 23% 25% 27% 28%
Gender Female 7% 8% 8% 8% 8% 8%
Male 93% 92% 92% 93% 92% 92% Race/Ethnicity
White, Non-Hispanic 60% 63% 62% 60% 61% 60% Black, Non-Hispanic 21% 19% 19% 19% 18% 18%
Hispanic 12% 10% 11% 12% 13% 14% Other/Unknown 7% 8% 9% 9% 9% 9%
Most Serious Offense at Conviction Violent, Non-Sex 41% 42% 44% 46% 46% 48%
Sex 17% 17% 20% 20% 20% 19% Property 15% 17% 18% 19% 20% 19%
Drug/Other 25% 23% 18% 15% 14% 13% Missing 2% 1% 0% 0% 0% 0%
Sentence Length (in Months) Mean 87.9 89.1 94.8 99.8 101.7 100.9
Standard Deviation 104.8 107.1 112.1 117.3 120.4 124.6 Gang Affiliation by Racial/Ethnic STG
White 5% 5% 6% 6% 5% 5% Black 9% 9% 9% 10% 10% 10%
Hispanic 4% 5% 6% 8% 9% 9% Other 1% 1% 2% 2% 2% 2%
No Gang Affiliation 81% 80% 78% 75% 74% 74%
Total Prison Population 15,907 16,852 17,308 17,288 17,625 17,943 Source: Authors’ Calculations. Washington State Department of Corrections
URL: http://mc.manuscriptcentral.com/rjqy

For Peer ReviewOnly
123456789101112131415161718192021222324252627282930313233343536373839404142434445464748495051525354555657585960
350
Justice Quarterly Page 2 of 29
Figure 1. Percentage Change in IMU-Max Population, IMU-Max Length of Stay (LOS), and Total Prison Population (Indexed at 2002), Washington DOC, 2002-2017
100
150
200
250
300
Perc
enta
ge C
hang
e fr
om 2
002
50
0 2002
(=100) 2005 2008
Snapshot Year 2011 2014 2017
IMU-Max Population IMU-Max LOS Total Prison Population
URL: http://mc.manuscriptcentral.com/rjqy
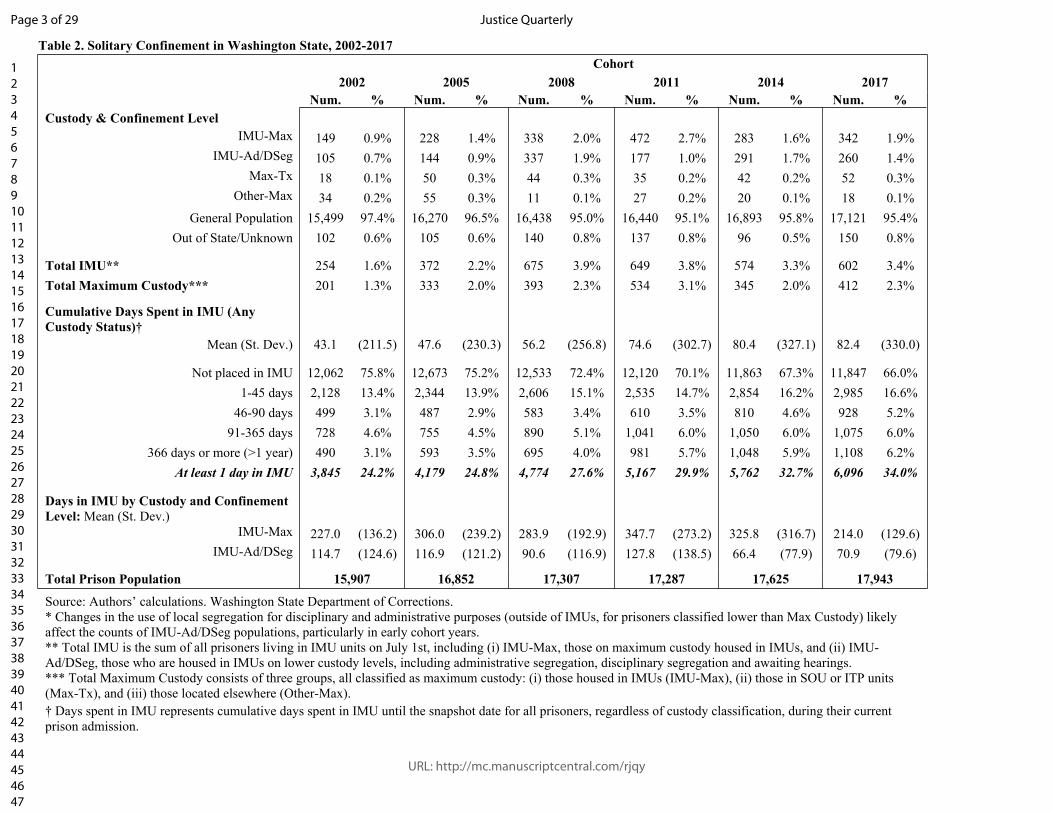
48495051525354555657585960
1234567891011121314151617181920212223242526272829303132333435363738394041424344454647
Page 3 of 29 Justice Quarterly
Table 2. Solitary Confinement in Washington State, 2002-2017
2002 Num. %
Custody & Confinement Level IMU-Max 149 0.9%
IMU-Ad/DSeg 105 0.7% Max-Tx 18 0.1%
Other-Max 34 0.2% General Population 15,499 97.4%
Out of State/Unknown 102 0.6%
2005 Num. %
228 1.4% 144 0.9% 50 0.3% 55 0.3%
16,270 96.5% 105 0.6%
Cohort 2008 2011
Num. % Num. %
338 2.0% 472 2.7% 337 1.9% 177 1.0% 44 0.3% 35 0.2% 11 0.1% 27 0.2%
16,438 95.0% 16,440 95.1% 140 0.8% 137 0.8%
2014 Num. %
283 1.6% 291 1.7% 42 0.2% 20 0.1%
16,893 95.8% 96 0.5%
2017 Num. %
342 1.9% 260 1.4% 52 0.3% 18 0.1%
17,121 95.4% 150 0.8%
Total IMU** Total Maximum Custody***
254 201
1.6% 1.3%
372 333
2.2% 2.0%
675 393
3.9% 2.3%
649 534
3.8% 3.1%
574 345
3.3% 2.0%
602 412
3.4% 2.3%
Cumulative Days Spent in IMU (Any Custody Status)†
Mean (St. Dev.) 43.1 (211.5) 47.6 (230.3) 56.2 (256.8) 74.6 (302.7) 80.4 (327.1) 82.4 (330.0)
Not placed in IMU 1-45 days
46-90 days 91-365 days
366 days or more (>1 year) At least 1 day in IMU
12,062 2,128 499 728 490
3,845
75.8% 13.4% 3.1% 4.6% 3.1% 24.2%
12,673 2,344 487 755 593
4,179
75.2% 13.9% 2.9% 4.5% 3.5% 24.8%
12,533 2,606 583 890 695
4,774
72.4% 15.1% 3.4% 5.1% 4.0% 27.6%
12,120 2,535 610
1,041 981
5,167
70.1% 14.7% 3.5% 6.0% 5.7% 29.9%
11,863 2,854 810
1,050 1,048 5,762
67.3% 16.2% 4.6% 6.0% 5.9% 32.7%
11,847 2,985 928
1,075 1,108 6,096
66.0% 16.6% 5.2% 6.0% 6.2% 34.0%
Days in IMU by Custody and Confinement Level: Mean (St. Dev.)
IMU-Max IMU-Ad/DSeg
227.0 114.7
(136.2) (124.6)
306.0 116.9
(239.2) (121.2)
283.9 90.6
(192.9) (116.9)
347.7 127.8
(273.2) (138.5)
325.8 66.4
(316.7) (77.9)
214.0 70.9
(129.6) (79.6)
Total Prison Population 15,907 16,852 17,307 17,287 17,625 17,943
Source: Authors’ calculations. Washington State Department of Corrections. * Changes in the use of local segregation for disciplinary and administrative purposes (outside of IMUs, for prisoners classified lower than Max Custody) likely affect the counts of IMU-Ad/DSeg populations, particularly in early cohort years. ** Total IMU is the sum of all prisoners living in IMU units on July 1st, including (i) IMU-Max, those on maximum custody housed in IMUs, and (ii) IMU-Ad/DSeg, those who are housed in IMUs on lower custody levels, including administrative segregation, disciplinary segregation and awaiting hearings. *** Total Maximum Custody consists of three groups, all classified as maximum custody: (i) those housed in IMUs (IMU-Max), (ii) those in SOU or ITP units (Max-Tx), and (iii) those located elsewhere (Other-Max). † Days spent in IMU represents cumulative days spent in IMU until the snapshot date for all prisoners, regardless of custody classification, during their current prison admission.
URL: http://mc.manuscriptcentral.com/rjqy

5
10
15
20
25
30
35
40
45
50
55
60
Justice Quarterly Page 4 of 29Table 3. Comparison of IMU-Max and General Prison Populations, Washington DOC, 2002-2017
Cohort 1 2002 2005 2008 2011 2014 2017 2 IMU- Gen. IMU- Gen. IMU- Gen. IMU- Gen. IMU- Gen. IMU- Gen. 3 Max Pop. Max Pop. Max Pop. Max Pop. Max Pop. Max Pop.4
Background Characteristics 6 Age at Snapshot (Years)*** 7 18 to 25 36% 21% 24% 19% 31% 16% 24% 15% 19% 13% 20% 11% 8 9
26 to 35 36 to 45
40% 17%
33% 29%
40% 22%
32% 29%
43% 15%
32% 29%
45% 18%
34% 26%
41% 20%
34% 26%
47% 20%
34% 27%
11 Over 45 7% 17% 13% 20% 12% 23% 13% 25% 19% 27% 13% 29% 12 Race/Ethnicity***13 14
Black, Non-Hispanic Hispanic
19% 20%
21% 11%
16% 22%
19% 10%
15% 30%
19% 10%
20% 29%
19% 12%
14% 37%
18% 12%
17% 27%
18% 13%
16 Other/Unknown 13% 7% 8% 8% 6% 9% 7% 9% 5% 9% 9% 9% 17 White, Non-Hispanic 48% 60% 55% 63% 49% 62% 44% 61% 44% 62% 47% 60% 18 Most Serious Offense at 19 Conviction***
21 22
Violent, Non-Sex Sex
68% 15%
41% 17%
66% 14%
42% 17%
70% 9%
43% 20%
74% 11%
45% 21%
78% 8%
45% 20%
75% 7%
48% 20%
23 Property 8% 16% 10% 17% 14% 19% 11% 19% 10% 20% 11% 20% 24 Drug/Other 9% 25% 9% 23% 7% 18% 4% 16% 4% 14% 7% 13%
Missing26 Age of First Conviction
1% 2% 0% 1% 0% 0% 0% 0% 0% 0% 0% 0%
27 (Years)***28 29 Under 18
18 to 25
12% 69%
4% 45%
9% 69%
3% 45%
10% 69%
3% 45%
10% 65%
3% 46%
8% 67%
3% 46%
8% 69%
3% 45%
31 Over 25 20% 51% 22% 52% 21% 52% 25% 51% 25% 51% 23% 52% 32 In-Prison Behavioral Profile 33 Gang Affiliation by34 Racial/Ethnic STG***
36 37
White Black
14% 22%
4% 9%
21% 14%
5% 9%
20% 12%
5% 9%
15% 14%
5% 10%
15% 11%
5% 10%
14% 16%
4% 10%
38 Hispanic 21% 4% 22% 4% 39% 5% 33% 7% 40% 8% 32% 8% 39 Other 3% 1% 1% 1% 1% 2% 3% 2% 4% 2% 4% 2%
41 No Gang Affiliation 40% 81% 43% 81% 28% 79% 36% 76% 31% 75% 33% 76%
42 Annual Infraction Rate*** 43 44 Mean 8.3 1.3 5.1 1.1 5.3 1.1 4.2 1.0 4.7 1.0 4.9 1.1
St. Dev. 7.6 2.4 7.8 1.8 5.4 2.0 4.9 1.7 5.9 1.8 6.7 1.9 46 Violent Infractions*** 47 48 Mean 4.0 0.5 3.3 0.4 3.3 0.5 3.0 0.5 3.3 0.5 3.0 0.5
49 St. Dev. 5.8 1.5 4.5 1.4 4.2 1.5 4.0 1.6 4.3 1.6 3.4 1.6 Staff Assaults***
51 52 53
Mean St. Dev.
1.2 3.3
0.1 0.4
0.7 2.2
0.0 0.4
0.7 2.0
0.0 0.4
0.7 2.1
0.1 0.5
0.8 2.5
0.1 0.5
0.6 2.0
0.1 0.5
54 Total Population 149 15,499 228 16,270 338 16,438 472 16,440 283 16,893 342 17,121
56 Source: Authors' calculations. Washington State Department of Corrections. 57 *** Statistically significant differences between IMU-Max and General Population (Gen. Pop.) at p<.001 (for categorical, chi square; for 58 numeric, t-test) 59
URL: http://mc.manuscriptcentral.com/rjqy

123456789101112131415161718192021222324252627282930313233343536373839404142434445464748495051525354555657585960
For Peer Review Only
Page 5 of 29 Justice Quarterly
Opening the Black Box of Solitary Confinement through Researcher -Practitioner Collaboration:
A Longitudinal Analysis of Prisoner and Solitary Populations in Washington State, 2002-17
Abstract: This article presents a rare longitudinal analysis of solitary confinement use in one state prison system: spanning 2002-2017 in the Washington Department of Corrections (DOC). An ongoing partnership with DOC officials facilitated methodological and conceptual improvements, allowing us to construct a dataset that provides a rich description of who is in solitary confinement, for how long, and why. Operationalizing solitary confinement as the intersection of the most serious custody status with the most restrictive housing location, we describe significant changes in ethnic composition and behavioral profiles of people in solitary confinement and in frequency and duration of solitary confinement use. These results suggest how particular policy interventions have affected the composition, numbers, and lengths of stay in solitary confinement. Combining longitudinal analysis and iterative engagement with DOC officials, we provide a roadmap for better understanding solitary confinement use in the United States now and in the future.
Tens of thousands of prisoners across the United States experience solitary confinement
annually (ASCA-Liman, 2015, 2018; Beck 2015). Prisoners generally spend no more than an
hour per day outside of cells the size of a wheelchair-accessible bathroom stall, and eat cold
meals alone, with limited access to natural light, phones, family visits, or any human touch.
Prisoners live not days, but months and years under such conditions. In tandem with mass
incarceration, the use of solitary confinement expanded drastically across the United States in the
1980s and 1990s, often in modern, hyper-secure, “supermax” facilities (Reiter 2016; Riveland,
1999; Sakoda & Simes 2019). Though integral to incarceration since the prison was “born” and
perpetually controversial (Foucault 1977; Haney & Lynch 1997; Smith, 2006; Rubin & Reiter
2018), solitary confinement has come under renewed scrutiny in the last decade (Reiter 2018;
ASCA-Liman, 2015). Federal and state correctional systems have begun to experiment with
mitigation and alternative programs. Here, we focus on a 15-year period during which the
Washington Department of Corrections (DOC) attempted to confront these issues and ask
whether and how a prison system might reduce its use of solitary confinement.
URL: http://mc.manuscriptcentral.com/rjqy

123456789101112131415161718192021222324252627282930313233343536373839404142434445464748495051525354555657585960
Justice Quarterly Page 6 of 29
Solitary in Washington State
The question of whether a prison system might change direction, including how the
practice of solitary confinement might be constrained, has animated criminological scholarship
over decades (e.g., Jacobs 1977; Liebling 1999; Petersilia 1991; Rhodes 2004; Reiter 2016;
Rubin & Reiter 2018). A longitudinal, quantitative dataset with which to assess these questions,
however, is rare. Our dataset, analyzed in collaboration with practitioner partners, allows us to
look both at individual faFor Peer Review Only ctors, such as how many gang members with violent infraction histories
are placed in solitary confinement for how long in any given year, and at institutional factors,
including demographic shifts and policy changes, which influence behavioral patterns (Toch
1977; Liebling 1999; Toch & Adams 1989; Haney 2018).
Where scholars have used point-in-time datasets to examine the relationship between
individual and institutional factors in understanding the use and effects of solitary confinement,
controversies abound over how to define and operationalize the practice (Kurki & Morris 2001;
Naday et al. 2008; Mears et al. 2019; Reiter 2016). We identify which prisoners are subjected
to the aversive conditions described above in terms of two factors: 1) whether they are living in
units engineered to lock them down (location) and 2) the rules governing how long they stay,
their conditions of confinement, and movement (custody status). Here, these measurement
principles are applied to a rich administrative dataset to ask: 1. Who is in solitary confinement,
for how long, and why? 2. How, if at all, do their individual characteristics, including ethnicity,
gang status, and b ehavioral profiles change over time? 3. What patterns emerge from this
analysis? We show how the distribution and extent of solitary confinement use in Washington
has shifted with institutional vicissitudes in demographics, capacity, gang management policies,
programming, and classification systems.
Trajectories of Solitary Confinement Placement
URL: http://mc.manuscriptcentral.com/rjqy 2
123456789101112131415161718192021222324252627282930313233343536373839404142434445464748495051525354555657585960
Page 7 of 29 Justice Quarterly
Solitary in Washington State
Estimates of how many people experience solitary confinement annually range from
68,000 prisoners to 18% of all prisoners in the United States, or over 250,000 people (ASCA-
Liman 2015; Beck 2015). To address definitional debates underlying conflicting estimates,
Mears et al. recently suggested a four-dimensional conceptual framework – goal, duration,
quality, and intentionality – to describe the constellation of factors that make up solitary
confinement (or “restric
o define solitary confinement, a
conceptually and et
For Peer Review Only tive housing”) practices (2019: 1434). The operational focus of our
alternative approach allows us to bypass arguments about how t
hically controversial practice. Rather, our operational definition applies the
near-universal correctional functions of classification and movement to identify the sites and
subjects of solitary confinement from correctional tracking records. These methods permit
consistent, robust a nalyses of who is subjected to solitary confinement and the association of this
experience with institutional misconduct and other factors.
Previous studies have reached conflicting conclusions about whether solitary confinement
has a disparate impact on groups defined by race or ethnicity. Studies focusing on patterns in
disciplinary infractions and solitary confinement placements over four to six years tend to find
minimal disparities (Cochran et al. 2018; Tasca & Turanovic 2018), while point-in-time
comparisons of demographics of solitary confinement units with general population units
consistently find non-white prisoners over-represented in solitary confinement (Schlanger 2012;
Reiter 2012). A recent study analyzed a survey that asked state prison systems to self-report
solitary confinement and gang-affiliated populations; prisoners classified as gang members were
over-represented in solitary confinement across the United States (Pyrooz & Mitchell 2019).
The study does not m ention race, but others have noted the longstanding ties between race and
gangs in U.S. prisons (Berger 2014; Bloom & Martin 2013; Reiter 2016), strengthening Pyrooz
3 URL: http://mc.manuscriptcentral.com/rjqy

123456789101112131415161718192021222324252627282930313233343536373839404142434445464748495051525354555657585960
For Peer Review Only
Justice Quarterly Page 8 of 29
Solitary in Washington State
and Mitchell’s recommendation to “integrate measures of gang affiliation into correctional
research” (2019: 22), as we do in our analysis.
The relationship between solitary confinement and institutional order is also contested (e.g.,
Briggs, Sundt and Castellano 2003; Lovell, Johnson & Cain 2007). One recent study among
men in a three-year cohort in a mid-western DOC found that disciplinary segregation was
associated with a greater probability of misconduct (Labrecque & Smith 2019), but another
study, among men in a two-year cohort in the Oregon DOC, found that disciplinary segregation
was not a significant predictor of subsequent institutional misconduct (Lucas & Jones 2017).
Our dataset permits an evaluation of longer-term patterns of misconduct, in and out of solitary
settings.
One recent study expanded the usual short periods of analysis described in preceding studies
about both race and misconduct, using nearly a decade (1987-96) of data from Kansas: a prison
system small enough (5-7,000 prisoners) to allow tracing of bed-level data to examine individual
correlates of solitary confinement placement, such as race, and also patterns in frequency and
duration of solitary confinement over time (Sakoda & Simes 2019). Our study takes an even
broader scale approach: examining populations in and out of solitary confinement over 15 years,
with 15,000 or more prisoners per cohort, following particular individuals and groups over
decades of criminal and correctional history.
Attending to broader institutional forces at play over our study period is critical to our
approach. Lynch recently argued that in studies of sentencing, findings are often
“operationalized as a single end-stage outcome that is unmoored from the social, organizational,
and institutional forces that help produce a class of defendants to be sentenced” (2020: 1159).
This critique could just as readily be applied to studies of solitary confinement (e.g., Cochran et
URL: http://mc.manuscriptcentral.com/rjqy 4
123456789101112131415161718192021222324252627282930313233343536373839404142434445464748495051525354555657585960
For Peer Review Only
Page 9 of 29 Justice Quarterly
Solitary in Washington State
al. 2018; Logan et al. 2017) in which disparities in outcomes and differences in personal and
behavioral characteristics of prisoners are analyzed with limited attention to institutional patterns
such as fluctuations in bed capacity, shifts in demographic make-up, and reforms or
retrenchments in policies governing solitary confinement placement and release. Our
longitudinal dataset allows us to generate individual-level and aggregate statistics on histories
and outcomes during incarceration, and to place findings in the context of broader institutional
forces shaping those patterns.
The administrative dataset analyzed here was collected as part of a multi-method project, also
using ethnographic, interview, and archival data, to evaluate solitary confinement use over time
in Washington (DOC) (Reiter et al. 2020). This project extends a decades-long collaborative
relationship between researchers and DOC: first between the University of Washington (UW)
and DOC through the Mental Health Collaboration (Allen et al., 2001); later in a UW-led multi-
method systematic survey of Washington’s solitary confinement population in 1999-2000
(Lovell et al. 2000; Rhodes 2004; Lovell 2008); and finally, in this study, replicating and
extending the 2000 study in collaboration with an original member of both previous studies.
In rates of overall incarceration and solitary confinement use, Washington DOC is below
average: it has the 12th lowest rate of incarceration among the states (Kaeble & Cowhig 2018),
and as of 2018, its reported proportion of population in “restrictive housing” (2.3%) was half the
national average (4.5%) (ASCA-Liman 2018: 13).1 In terms of willingness to collaborate with
researchers, however, Washington DOC is above average: current and former DOC leadership
have agreed there are knowledge gaps around solitary confinement, invited scholars and
advocates alike to analyze and critique policies in order to address these gaps, and participated
actively in collaborations: both facilitating access to the administrative data underlying the
5 URL: http://mc.manuscriptcentral.com/rjqy

123456789101112131415161718192021222324252627282930313233343536373839404142434445464748495051525354555657585960
For Peer Review Only
Justice Quarterly Page 10 of 29
Solitary in Washington State
analyses presented here and helping to interpret results. In particular, Eldon Vail and Dan
Pacholke, nationally recognized correctional policy experts, led Washington DOC during part of
our study period and consulted with us on interpretation of findings.
Research about solitary confinement use has been produced through practitioner-researcher
collaborations in a number of states, including Colorado (O’Keefe et al. 2011), Florida (Mears
& Bales 2009), Kansas (Sakoda & Simes 2019), and Oregon (Pyrooz et al. 2020). Few,
however, have attempted the quantitative and qualitative depth of this project, which is more
comparable to the New York studies of Toch and colleagues (e.g., Toch & Adams 1989; Toch
1977), conducted as the new “supermax” era was coming upon us in the 1980s, or the California
studies by Petersilia on re-entry and community supervision (e.g., Petersilia 2009). Ours
represents an intergenerational academic-practitioner collaboration spanning both eras.
Data and Methods
This analysis draws on a longitudinal administrative record set of the entire DOC
population on six evenly-spaced snapshot intervals (July 1, 2002, 2005, 2008, 2011, 2014, and
2017): subject-level demographic records (N=57,130), and event-level records of admissions and
releases (266,266), prison sentences (230,833), custody assignments (1.2 million), infractions
(630,088), and inter-facility movements (2.4 million). Discussions with DOC research office
partners about how best to meet the data needs of our study, exemplifying our academic-
practitioner collaboration, led to two major expansions of the scope and power of this dataset.
First, to assess how solitary confinement populations had changed since the 2000 UW study,
we requested archival information on prisoners in any form of solitary confinement on our
snapshot dates. Lacking ready capacity to identify these prisoners, DOC offered to provide data
for all prisoners in custody on these dates, leaving it to us to identify who was in solitary
URL: http://mc.manuscriptcentral.com/rjqy 6

123456789101112131415161718192021222324252627282930313233343536373839404142434445464748495051525354555657585960
For Peer Review Only
Page 11 of 29 Justice Quarterly
Solitary in Washington State
confinement and when. Our willingness to pick our own apples from the DOC data tree led to a
30-fold expansion of our subject pool, permitting longitudinal comparisons between solitary
confinement and general population prisoners. Second, DOC provided us all Washington prison
sentences in the entire history of prisoners in our vastly expanded dataset, rather than only the
index offense data we had requested. Although information about currently active convictions
accompanies prisoners as they move through DOC, retrospectively retrieving links between court
and correctional records is complicated by the multiplicity of charges, sentencing policies, and
admission statuses that may apply. Recognizing a systematic problem when we showed them a
pattern of missing data, DOC provided the entire prison conviction history for the 57,000 prisoners
in our expanded subject population, allowing us both to identify the most serious current offense
and to provide a consistent measure of prisoners’ criminal histories.
Source data were compiled cohort by cohort, applying uniform coding procedures to
compile event-level data into a subject-level dataset. We computed the facility location and
custody status of every prisoner in the system throughout each admission, length of stay (LOS) at
each location, and subject-level summaries of numbers and rates of relevant events, such as
infractions. Compilation codes were tested and modified until they yielded consistent and
plausible counts and summary statistics (e.g., no negative values for LOS or rates) across all
prisoners in six snapshot cohorts. We also use some inferential statistics (e.g., chi-square and t-
tests) in the analyses we present to test for differences across cohorts and groups.
Terminology. In Washington DOC policy (2020: 320.250), maximum custody status is the
highest level of custody classification. Maximum custody prisoners are assessed in formal
hearings to pose a sufficient risk to safety – whether their own or others – to warrant holding
them for an extended period in a maximum-security location, isolated by architecture, procedure,
7 URL: http://mc.manuscriptcentral.com/rjqy

For Peer Review Only
123456789101112131415161718192021222324252627282930313233343536373839404142434445464748495051525354555657585960
Justice Quarterly Page 12 of 29
Solitary in Washington State
and staffing. As legal expert Fred Cohen notes, maximum custody is a risk-based classification,
justified as a preventive measure rather than a punitive sanction (2008). In Washington DOC,
prisoners first enter solitary confinement through short-term administrative segregation (Ad-
Seg) placements, usually awaiting adjudication following an infraction. Infraction of a specific
prison rule may result in a disciplinary hearing and the sanction of a disciplinary segregation (D-
Seg) placement. Alternatively, multiple infractions, other behavior patterns, or an extended stay
in administrative segregation may lead to a re-classification as maximum custody (Max).
In DOC, Intensive Management Units (IMUs) are the most secure housing facilities. The
term “supermax” is not a category of institution in DOC; instead the state has five IMUs, located
at Clallam Bay Corrections Center (CC), Monroe CC, Washington CC (“Shelton”), Stafford
Creek CC, and the Washington State Penitentiary (called Walla Walla or the “concrete mama”
(Hoffman & McCoy, 2018)). IMUs feature distinct security perimeters with advanced
technology for controlling entrances, gates, and doors; strict procedures for prisoner movement;
and no normal occasions for prisoners to share space with others unless shackled. Though exact
conditions (like cell size and degree of access to natural light) vary across IMUs, the uniformly
restrictive conditions impose intense isolation (often for extended periods of time) comparable to
conditions in other state supermaxes. IMUs are adjacent to the “main institution” (a correctional
center or complex may have multiple facilities, or stand-alone buildings, sharing a common
Superintendent) to allow escorting prisoners on foot without delay. As a Lieutenant at Shelton
said during a prison visit: “Nothing happens fast around here except going to the IMU.”
Transfers between facilities are recorded in DOC’s movement records, allowing us to
identify who was placed in IMUs and for how long. Transfers in and out of cells within a facility,
however, are recorded as housing changes: likely 50 million in number for our subjects, vastly
URL: http://mc.manuscriptcentral.com/rjqy 8

123456789101112131415161718192021222324252627282930313233343536373839404142434445464748495051525354555657585960
For Peer Review Only
Page 13 of 29 Justice Quarterly
Solitary in Washington State
exceeding our and DOC’s ability to retrieve and compile, absent unlimited resources.2 Therefore,
inter-facility movement records in our data do not capture prisoners isolated on Ad-Seg or D-Seg
status (Ad/DSeg status) inside a main institution. Importantly, Ad/DSeg prisoners, who were
living under comparably stringent conditions as IMU-Max prisoners, in two decrepit segregation
units within the main institutions at two of Washington’s oldest prisons – Walla Walla and
Monroe – are not captured in our data. These two units, with a combined capacity of 250, closed
in 2011, but were replaced (and then some) by 200 new IMU beds at each prison. Our inability
to identify all such Ad/DSeg prisoners through movement records requires caution in how the
terms “IMU” versus “solitary confinement” are used in our findings. Because of this limitation,
we center our trend and comparative analyses on the maximum custody group, who are reliably
identified over the entire course of our study period and whose long-term presence in maximum
security settings raises the sharpest ethical issues (Lovell 2014).
Results
To contextualize findings on the size and characteristics of Washington’s solitary
confinement population, we first describe overall patterns in the state prison population between
2002 and 2017. Table 1 displays counts and demographic, crime type, sentence length, and gang
affiliation characteristics for the entire prison population incarcerated on each of the six snapshot
dates. Washington State’s prison population grew by 13%, despite changes in sentencing policy
(SHB2338, 2002) that were expected to reduce imprisonment by lessening penalties and
providing treatment alternatives for drug-related offenses. The proportion of prisoners
incarcerated for drug or other offenses declined substantially, while those incarcerated for
violent, non-sexual offenses increased by nearly 17% between 2002 and 2017 (p<.001).3
Reflecting the shift toward more violent offenses, average sentence lengths increased
9 URL: http://mc.manuscriptcentral.com/rjqy

For Peer Review Only
123456789101112131415161718192021222324252627282930313233343536373839404142434445464748495051525354555657585960
Justice Quarterly Page 14 of 29
Solitary in Washington State
significantly, as did the average age of prisoners. The proportion of Hispanic prisoners increased
by 17%, while the proportion of Black, non-Hispanic prisoners decreased by 16% (p<.001), and
White, non-Hispanic representation remained stable.4
Affiliation with security threat groups (STG), or prison gangs, increased as well: in 2017,
over one in four prisoners (26%) was identified as a member of an STG, up from 19% in 2002.
The growth of gang affiliation was not equally distributed across racial and ethnic groups.5
While rates of gang affiliation for White, non-Hispanic prisoners remained relatively low over
the fifteen-year period, gang affiliation among prisoners of color increased substantially:
between 2002 and 2017, the proportion of Black, non-Hispanic prisoners classified as gang-
affiliated rose from 35% to 41%; for Hispanic prisoners, from 28% to 53%, a sharp increase with
substantial consequences for solitary confinement practices.
[TABLE 1 NEAR HERE]
Disentangling the Solitary Population. Table 2 presents trends in solitary confinement use by
both custody status (classification) and location (facility). We distinguish four groups either
classified at the highest custody level (Maximum, labeled “Max”), or located in the most
restrictive locations (IMUs). At the center of our analysis are prisoners both classified Max and
housed in IMUs (denoted by IMU-Max). Next are prisoners who have not been reclassified
Max, but are housed in IMUs for administrative or disciplinary segregation (IMU-Ad/DSeg).
Third, for treatment purposes, some Max prisoners are housed at the Special Offender Unit
(SOU) at Monroe, designed to address serious behavioral health needs, or at the Inmate
Transitional Pod (ITP) at Clallam Bay, a program-focused unit for prisoners transitioning out of
solitary confinement (denoted by Max-Tx). Finally, a residual group of Max prisoners could not
URL: http://mc.manuscriptcentral.com/rjqy 10

123456789101112131415161718192021222324252627282930313233343536373839404142434445464748495051525354555657585960
Page 15 of 29 Justice Quarterly
Solitary in Washington State
For Peer Review Only
be assigned a facility type because, on the snapshot date, they were on hospital or court release,
or awaiting transfers to an IMU, SOU, or ITP (Other-Max).6
Solitary confinement use (in IMU-Max, IMU-Ad/Dseg, and Total IMU) far outpaces
population growth over our study period in the state, growing at least 130% (in IMU-Max),
compared to a 13% growth in the state prison population. As explained earlier, IMU-Max
represents a clearly defined population, with reliable snapshot counts for prisoners subjected to
long-term solitary confinement over the entire study period, but it excludes prisoners in Ad/DSeg
either in the IMU, or in other within-facility units, not identifiable in the between-facility
movement records we analyze. Figure 1 illustrates differences in rates and patterns of growth in
IMU-Max and total prison populations, accompanied by changes in average length of stay (LOS)
for the IMU-Max group on their snapshot date assignments.
[TABLE 2 & FIGURE 1 ABOUT HERE]
One-day counts capture those physically held in IMUs on snapshot dates, and demonstrate
that a small, but increasing proportion of Washington’s prison population was held in solitary
confinement across snapshots, in both IMU-Max and IMU-Ad/DSeg groups. One-day counts,
however, do not account for movement in and out of IMUs at other points. To better understand
both the prevalence and duration of placement in solitary, we used event-level movement
information to calculate the cumulative amount of time each prisoner spent in solitary
confinement from admission to snapshot date. Over the study period, a majority of prisoners in
DOC in each snapshot cohort were never placed in solitary confinement, but a substantial and
growing proportion of prisoners had spent time in these units. The proportion of prisoners
spending at least one day in an IMU between their prison admission and snapshot dates had
increased from 24.2% in 2002 to 34% in 2017. Prisoners in 2002 spent an average of 6 weeks in
11 URL: http://mc.manuscriptcentral.com/rjqy
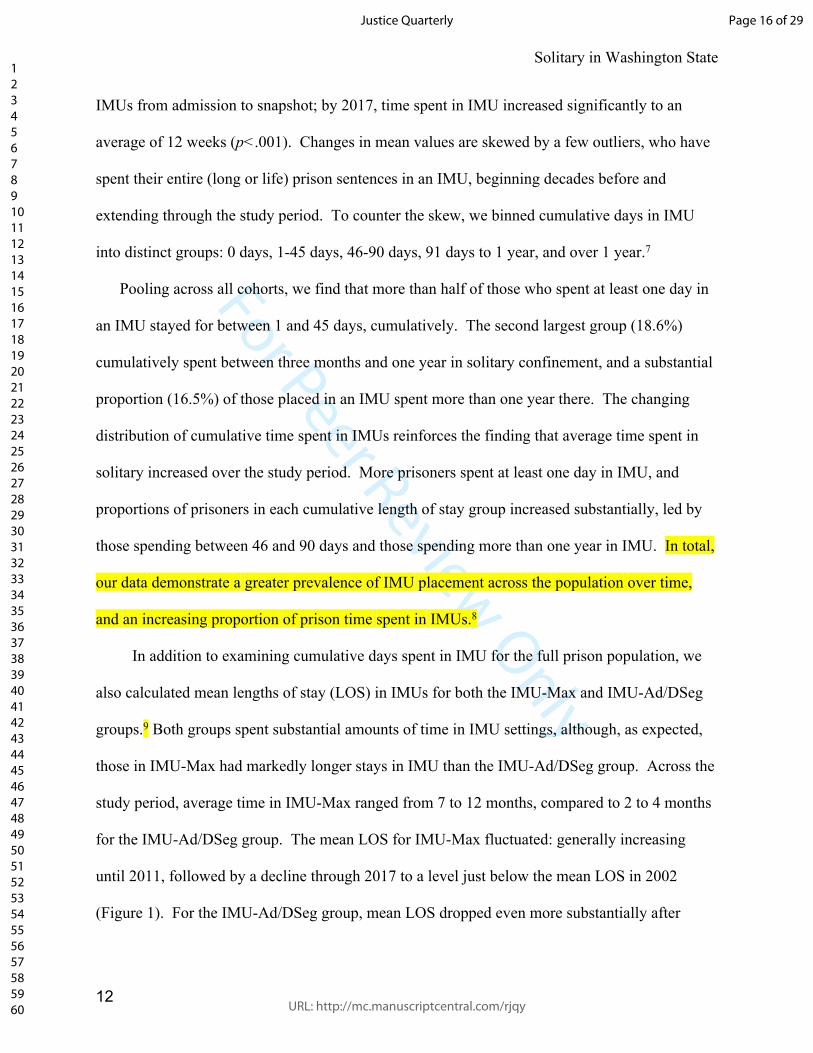
For Peer Review Only
123456789101112131415161718192021222324252627282930313233343536373839404142434445464748495051525354555657585960
Justice Quarterly Page 16 of 29
Solitary in Washington State
IMUs from admission to snapshot; by 2017, time spent in IMU increased significantly to an
average of 12 weeks (p<.001). Changes in mean values are skewed by a few outliers, who have
spent their entire (long or life) prison sentences in an IMU, beginning decades before and
extending through the study period. To counter the skew, we binned cumulative days in IMU
into distinct groups: 0 days, 1-45 days, 46-90 days, 91 days to 1 year, and over 1 year.7
Pooling across all cohorts, we find that more than half of those who spent at least one day in
an IMU stayed for between 1 and 45 days, cumulatively. The second largest group (18.6%)
cumulatively spent between three months and one year in solitary confinement, and a substantial
proportion (16.5%) of those placed in an IMU spent more than one year there. The changing
distribution of cumulative time spent in IMUs reinforces the finding that average time spent in
solitary increased over the study period. More prisoners spent at least one day in IMU, and
proportions of prisoners in each cumulative length of stay group increased substantially, led by
those spending between 46 and 90 days and those spending more than one year in IMU. In total,
our data demonstrate a greater prevalence of IMU placement across the population over time,
and an increasing proportion of prison time spent in IMUs.8
In addition to examining cumulative days spent in IMU for the full prison population, we
also calculated mean lengths of stay (LOS) in IMUs for both the IMU-Max and IMU-Ad/DSeg
groups.9 Both groups spent substantial amounts of time in IMU settings, although, as expected,
those in IMU-Max had markedly longer stays in IMU than the IMU-Ad/DSeg group. Across the
study period, average time in IMU-Max ranged from 7 to 12 months, compared to 2 to 4 months
for the IMU-Ad/DSeg group. The mean LOS for IMU-Max fluctuated: generally increasing
until 2011, followed by a decline through 2017 to a level just below the mean LOS in 2002
(Figure 1). For the IMU-Ad/DSeg group, mean LOS dropped even more substantially after
URL: http://mc.manuscriptcentral.com/rjqy 12
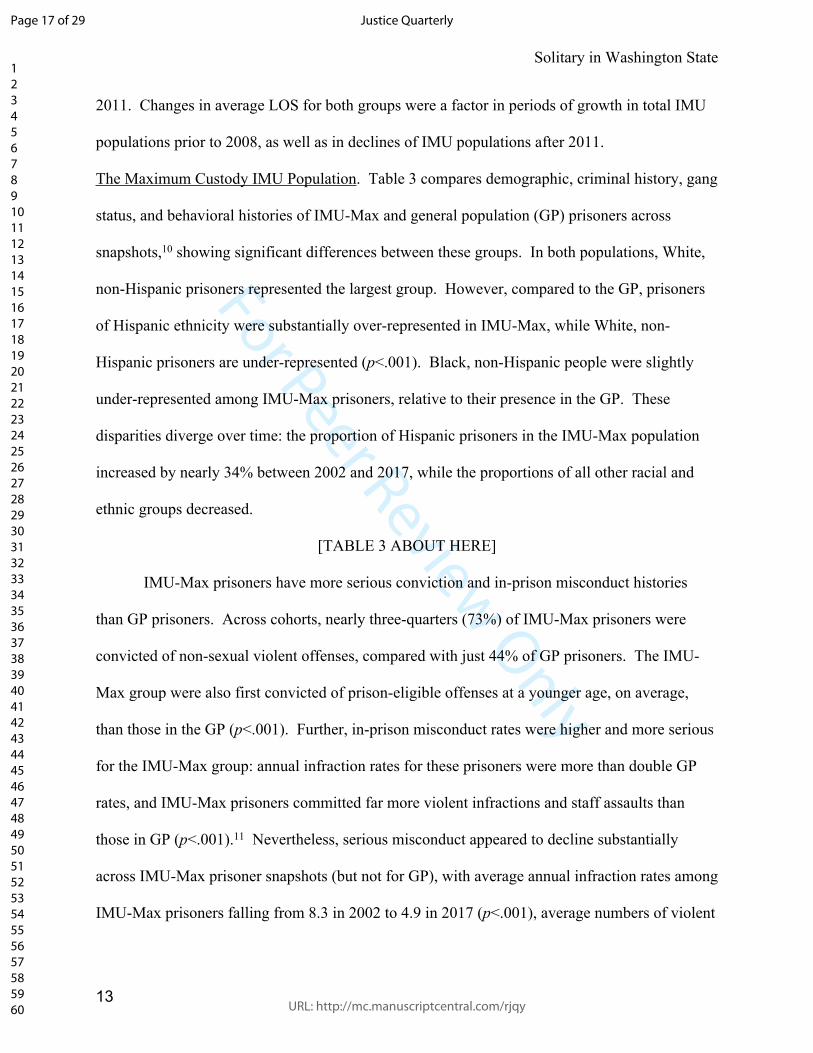
123456789101112131415161718192021222324252627282930313233343536373839404142434445464748495051525354555657585960
For Peer Review Only
Page 17 of 29 Justice Quarterly
Solitary in Washington State
2011. Changes in average LOS for both groups were a factor in periods of growth in total IMU
populations prior to 2008, as well as in declines of IMU populations after 2011.
The Maximum Custody IMU Population. Table 3 compares demographic, criminal history, gang
status, and behavioral histories of IMU-Max and general population (GP) prisoners across
snapshots,10 showing significant differences between these groups. In both populations, White,
non-Hispanic prisoners represented the largest group. However, compared to the GP, prisoners
of Hispanic ethnicity were substantially over-represented in IMU-Max, while White, non-
Hispanic prisoners are under-represented (p<.001). Black, non-Hispanic people were slightly
under-represented among IMU-Max prisoners, relative to their presence in the GP. These
disparities diverge over time: the proportion of Hispanic prisoners in the IMU-Max population
increased by nearly 34% between 2002 and 2017, while the proportions of all other racial and
ethnic groups decreased.
[TABLE 3 ABOUT HERE]
IMU-Max prisoners have more serious conviction and in-prison misconduct histories
than GP prisoners. Across cohorts, nearly three-quarters (73%) of IMU-Max prisoners were
convicted of non-sexual violent offenses, compared with just 44% of GP prisoners. The IMU-
Max group were also first convicted of prison-eligible offenses at a younger age, on average,
than those in the GP (p<.001). Further, in-prison misconduct rates were higher and more serious
for the IMU-Max group: annual infraction rates for these prisoners were more than double GP
rates, and IMU-Max prisoners committed far more violent infractions and staff assaults than
those in GP (p<.001).11 Nevertheless, serious misconduct appeared to decline substantially
across IMU-Max prisoner snapshots (but not for GP), with average annual infraction rates among
IMU-Max prisoners falling from 8.3 in 2002 to 4.9 in 2017 (p<.001), average numbers of violent
13 URL: http://mc.manuscriptcentral.com/rjqy

123456789101112131415161718192021222324252627282930313233343536373839404142434445464748495051525354555657585960
For Peer Review Only
Justice Quarterly Page 18 of 29
Solitary in Washington State
infractions decreasing from 4 to 3 (p<.05), and average numbers of staff assaults decreasing from
1.2 to 0.6 (p<.05).
Gang members were substantially over-represented in IMU-Max compared to GP (66%
to 22%, pooled across all snapshot years). While the prevalence of gang membership grew in
both groups over time, patterns of gang affiliation across racial-ethnic sub-categories behaved
differently within the IMU-Max and GP groups. Among GP prisoners, the proportion of those
affiliated with Hispanic gangs grew by 118% from 2002 to 2017; among IMU-Max prisoners,
Hispanic gang membership grew substantially (55%), but at a lower rate than in the GP. Black
gang membership, on the other hand, grew by just 7% in the GP, but fell by 24% among IMU-
Max prisoners. Explaining these patterns is outside the scope of the present analysis, but the
scale of divergence in patterns across both racial-ethnic sub-categories of gang affiliates and GP
and IMU-Max populations merits future attention.
Discussion
Our findings draw on an especially robust dataset, including: (1) multiple individual
characteristics like gang status, and infraction rates, each one of which has constituted the sole
focus of previous analyses; (2) snapshot data that covers both the entire prison population and
each individual’s entire criminal and incarceration history; and (3) a fifteen-year period of
analysis over six snapshot dates, a longer time period than in previous studies of solitary
confinement. Such a rich dataset makes a succinct analysis of a subset of findings challenging to
present. Here, we focus on our analytic methods, an overview of the characteristics of people in
and out of solitary confinement, and overall patterns in solitary confinement use.
First, we measure the sites, subjects, and varieties of solitary confinement in terms of the
intersection of location and custody status. This operational taxonomy, along with the prisoner
URL: http://mc.manuscriptcentral.com/rjqy 14

123456789101112131415161718192021222324252627282930313233343536373839404142434445464748495051525354555657585960
For Peer Review Only
Page 19 of 29 Justice Quarterly
Solitary in Washington State
characteristics associated with solitary confinement placements, was achieved by developing an
extensive population analysis script that compiled a correctional dataset tracking events,
movements, and dispositions into an analytic dataset permitting analysis of patterns of prisoner
behavior and facility placements over time. Our multi-generational researcher-practitioner
collaboration with Washington DOC facilitated both obtaining and interpreting this data. In turn,
we hope our operational taxonomy will facilitate more precise measurements of solitary
confinement use, applicable and comparable across the vicissitudes of different correctional
systems’ varied labels for security levels, housing locations, and solitary confinement practices
(e.g., Mears et al. 2019).
Second, we provide an overview and comparison of characteristics of people in solitary
confinement, focusing on the specifically targeted IMU-Max group to provide a clear contrast to
general population prisoners. Over time, the average IMU-Max prisoner was increasingly likely
to be older, Hispanic, convicted of a violent offense, and gang affiliated, but decreasingly likely
to have assaulted a staff member. Like Pyrooz & Mitchell (2019), we find gang members over-
represented in solitary confinement relative to their representation in the general prison
population. We also find that Hispanic prisoners are increasingly over-represented in solitary
confinement, providing evidence of the racially disproportionate impact of solitary confinement
(e.g., Sakoda & Simes 2019; Schlanger 2012; Reiter 2012). Our longitudinal analysis shows this
disproportion steadily increasing over time, at a faster rate than gang membership in the general
prison system, which increased only slightly over our period of analysis. As in other studies
finding misconduct associated with solitary confinement placement (e.g., Labrecque & Smith
2019), we find that prisoners in solitary confinement have significantly and consistently higher
annual infraction, violent infraction, and staff assault rates than general population prisoners.
15 URL: http://mc.manuscriptcentral.com/rjqy

For Peer Review Only
123456789101112131415161718192021222324252627282930313233343536373839404142434445464748495051525354555657585960
Justice Quarterly Page 20 of 29
Solitary in Washington State
However, all three measures of infractions, despite remaining fairly stable throughout the
system, generally declined in IMU-Max over time.
Rendering population patterns visible also renders visible new questions about what
combination of individual behavior patterns and institutional policies produce the changes we
see. Have IMU-Max prisoners become less violent and dangerous? Have institutional policies
about identifying gang members and behavioral or affiliation criteria for max custody changed?
When the UW solitary confinement study was conducted 20 years ago, pioneering experiments
in relaxing the stringency of solitary confinement conditions and supporting prisoners in
changing course had begun at Shelton (Rhodes, 2004); at that time, Washington DOC leaders
justified IMUs as a necessary response to White Supremacist groups, and IMU reforms focused
on mitigating organized attacks and challenges to correctional authority by these groups. The late
2010s brought another round of reforms attempting to relax the stringent conditions of solitary
confinement; this time factional rivalries among gang-affiliated Hispanic prisoners first justified
IMU placements and then became the focus of reform efforts (Warner et al. 2014). This
relationship between shifts in prison population demographics, behavior patterns, and
correctional attention to specific sub-categories of gangs perceived as particularly dangerous
deserves further analysis, but identifying the relevant trends, as we do here, is a first step.
Third, we see changing patterns in solitary confinement use over time. Overall, the
prevalence and duration of solitary confinement grew across Washington’s prison population
between 2002 and 2017. The raw numbers and rates of both Max custody status prisoners and
prisoners in IMU locations more than doubled from 2002 to 2017. And an increasing proportion
of people throughout the system experienced solitary confinement: in 2017, more than 1 in 3
prisoners had spent at least a day in solitary compared to 1 in 4 in 2002. This trend echoes and
URL: http://mc.manuscriptcentral.com/rjqy 16

For Peer Review Only
123456789101112131415161718192021222324252627282930313233343536373839404142434445464748495051525354555657585960
Page 21 of 29 Justice Quarterly
Solitary in Washington State
quantifies Sakoda & Simes’ argument that solitary confinement is a “normal event during
imprisonment” (2019: 2). Although rates of solitary confinement use increased overall, average
lengths of stay in solitary confinement (which peaked in 2011 in tandem with the peak years of
solitary confinement use in Washington) decreased. By 2017, average lengths of stay on IMU-
Max and IMU-Ad/DSeg (along with the standard deviations) were the shortest they had been in
the state since 2002. This analysis reveals that Washington DOC had some success in reducing
its use of solitary confinement from peak levels, and especially in shortening lengths of stay in
these conditions. But what forces facilitated or constrained these reductions?
The dramatic shifts we document in both numbers of people in solitary confinement and
durations of stays – without any associated dramatic shifts in the usually assumed behavioral
predictors of solitary confinement, like overall institutional rates of gang membership or violent
infractions – suggest the influence of other institutional factors (cf Lynch 2020). While
additional analysis is needed, we can, thanks to our iterative conversations with DOC officials,
suggest two institutional factors that influenced rates and durations of solitary confinement use
during periods of abrupt change: bed capacity increases and local-level rehabilitative
programming changes.
First, between 2000 and 2008, while DOC’s expanding capacity was continually
outpaced by population growth (despite legislative changes intended to reduce imprisonment,
WSIPP, 2006), IMU capacity in Washington expanded by 520 beds. Three years later, in 2011,
both IMU-Max counts and average LOS peaked. Both then decreased in tandem with decreasing
IMU capacity: down 212 beds as of 2017, as some units were re-purposed for other special
groups, such as parole violators, and managed with far less restrictive protocols. While the
relationship between capacity, IMU counts, and length of stay deserves its own focused analysis,
17 URL: http://mc.manuscriptcentral.com/rjqy

123456789101112131415161718192021222324252627282930313233343536373839404142434445464748495051525354555657585960
For Peer Review Only
Justice Quarterly Page 22 of 29
Solitary in Washington State
we have taken the first step by identifying relevant trends. These findings suggest that
constraining capacity is likely a key to long-term reductions in solitary confinement, along with
reducing lengths of stay and rate of assignments into maximum security settings like IMUs.
Second, between 2011 and 2014, Washington DOC built upon previous, local initiatives
at Clallam Bay and Walla Walla IMUs, embarking on an effort to “reinvent what segregation can
be”: partnering with Vera Institute of Justice, eliminating some aversive disciplinary policies,
and introducing facility-specific missions and group rehabilitative programming across IMUs
(Neyfakh, 2015). Both the temporary drop in IMU-Max populations in 2014, and the more
sustained decreases in average lengths of stay for this population between 2011 and 2017 are tied
to these interventions.
The correctional population analysis presented in this study exemplifies an approach to
research and collaboration suited to improving the ability of corrections systems to track changes
in prisoner characteristics, lengths of stay, and overall rates of placement in various forms of
solitary confinement. Rendering such patterns visible strengthens researcher-practitioner
collaboration, revealing in Washington’s case what is working, i.e., sustained reductions in
lengths of solitary confinement stays; and what is not working, i.e., less sustained reductions in
rates of solitary confinement use. By displaying institutional patterns, our collaborative research
findings also suggest avenues of analysis to improve outcomes for prisoners and in prison
settings.
MAIN TEXT WORD COUNT: 6,082
URL: http://mc.manuscriptcentral.com/rjqy 18

123456789101112131415161718192021222324252627282930313233343536373839404142434445464748495051525354555657585960
For Peer Review Only
Page 23 of 29 Justice Quarterly
Solitary in Washington State
References
Allen, D.G., Lovell, D.G., & Rhodes, L.A. Correctional mental health: a research agenda. In J.J.
Fitzpatrick, P.A. White, eds., Psychiatric Mental Health Nursing Research Digest. New York:
Springer, pp. 180-184.
Association of State Correctional Administrators and the Arthur Liman Public Interest Program,
Yale Law School (ASCA-Liman) (2015). Time-In-Cell: The ASCA-Liman 2014 National
Survey of Administrative Segregation in Prison (Aug.). Retrieved from
https://law.yale.edu/sites/default/files/area/center/liman/document/asca-
liman_administrativesegregationreport.pdf
__ (2018). Reforming restrictive housing: The 2018 ASCA-Liman nationwide survey of time-in-
cell. Report issued by the Association of State Correctional Administrators (ASCA) & the
Liman Center for Public Interest Law at Yale Law School. Retrieved from
https://law.yale.edu/sites/default/files/area/center/liman/document/asca_liman_2018_restrictiv
e_housing_released_oct_2018.pdf
Beck, A. J. (2015). Use of restrictive housing in U.S. prisons and jails, 201112. Washington, DC:
Bureau of Justice Statistics, Government Printing Office. Retrieved from
https://www.bjs.gov/content/pub/pdf/urhuspj1112.pdf.
Berger, D. (2014). Captive Nation: Black Prison Organizing in the Civil Rights Era. Chapel Hill:
University of North Carolina Press.
Bloom, J. and W.E. Martin (2013). Black Against Empire: The History and Politics of the Black
Panther Party. Berkeley: University of California Press.
Briggs, C.S., J.L. Sundt, and T.C. Castellano (2003). “The effect of supermaximum security
prisons on aggregate levels of institutional violence,” Criminology, Vol. 41: 1341-1376
19 URL: http://mc.manuscriptcentral.com/rjqy

123456789101112131415161718192021222324252627282930313233343536373839404142434445464748495051525354555657585960
For Peer Review Only
Justice Quarterly Page 24 of 29
Solitary in Washington State
Cochran, J.C., E. L. Toman, D. P. Mears & W. D. Bales (2018). Solitary Confinement as
Punishment: Examining In-Prison Sanctioning Disparities. Justice Quarterly, 35(3): 381-411.
Cohen, Fred. 2008. Penal isolation: beyond the seriously mentally ill. Criminal Justice and
Behavior 35(8), 1017-1047.
Foucault, M. (1977) Discipline and Punish: The Birth of the Prison. New York: Pantheon Books.
Haney, Craig. “The Psychological Effects of Solitary Confinement: A Systematic Critique,”
Crime and Justice, 47, no. 1 (2018), pp. 365-416.
Haney, C. & Lynch, M. 1997. Regulating prisons of the future: A psychological analysis of
supermax and solitary confinement. NYU Review of Law & Social Change, 23: 477–570.
Hoffman, E. & McCoy, J. 2018. Concrete Mama: Prison Profiles from Walla Walla. Seattle, WA:
University of Washington Press.
Kaeble D, Cowhig M. (2018). Correctional Populations in the United States, 2016. Vol 25121.
US Department of Justice, Bureau of Justice Statistics. 2018.
Kurki, L. & N. Morris. (2001). The Purposes, Practices, and Problems of Supermax Prisons. Crime
and Justice 28: 358-424.
Labrecque, R. M., & Smith, P. (2019). Assessing the impact of time spent in restrictive housing
confinement on subsequent measures of institutional adjustment among men in prison. Criminal
Justice and Behavior, 46(10): 1445-1455.
Liebling, A. (1999). “Doing Research in Prison: Breaking the Silence?” Theoretical Criminology
Vol. 3:147–73.
Logan, M.W., B. Dulisse, S. Peterson, M.A. Morgan, T.M. Olma, P. Paré. (2017). Correctional
shorthands: Focal concerns and the decision to administer solitary confinement. Journal of
Criminal Justice, 52: 90-100.
URL: http://mc.manuscriptcentral.com/rjqy 20

123456789101112131415161718192021222324252627282930313233343536373839404142434445464748495051525354555657585960
For Peer Review Only
Page 25 of 29 Justice Quarterly
Solitary in Washington State
Lucas, J. W., & Jones, M. A. (2019). An analysis of the deterrent effects of disciplinary segregation
on institutional rule violation rates. Criminal Justice Policy Review, 30(5), 765-787.
Lovell, D.G., 2008. Patterns of disturbance in a supermax population. Criminal Justice and
Behavior 35(8), 985-1004.
Lovell, D.G. (2014). Isolation Vignettes: Practical applications of strict scrutiny. The Correctional
Law Reporter 26(1), 3.
Lovell, D.G., Cloyes, K.C., Allen, D.G. & Rhodes, L.A. 2000. Who lives in super-maximum
custody? A Washington State study. Federal Probation, 64(2): 33-38.
Lovell, D.G., C. Johnson, K.C. Cain. 2007. Recidivism of Supermax Prisoners in Washington
State. Crime and Delinquency, 53(4): 633-56.
Lynch, M. (2019). Focally Concerned About Focal Concerns: A Conceptual and Methodological
Critique of Sentencing Disparities Research. Justice Quarterly. 36(7): 1148-1175.
Mears, D. P., Hughes, V., Pesta, G. B., Bales, W. D., Brown, J. M., Cochran, J. C., & Wooldredge,
J. (2019). The new solitary confinement? A conceptual framework for guiding and assessing
research and policy on “Restrictive housing”. Criminal Justice and Behavior, 46(10), 1427-
1444.
Mears, D.P. & W.D. Bales (2009). Supermax Incarceration and Recidivism. Criminology, 47(4):
1131-66.
National Institute of Justice (NIJ) (2016). Restrictive Housing in the U.S.: Issues, Challenges, and
Future Directions. Washington, D.C.: National Institute of Justice,
https://www.ncjrs.gov/pdffiles1/nij/250315.pdf.
21 URL: http://mc.manuscriptcentral.com/rjqy
123456789101112131415161718192021222324252627282930313233343536373839404142434445464748495051525354555657585960
For Peer Review Only
Justice Quarterly Page 26 of 29
Solitary in Washington State
Neyfakh, L. 2015. What do you do with the worst of the worst? Slate, 4/3/2015;
https://slate.com/news-and-politics/2015/04/solitary-confinement-in-washington-state-a-
surprising-and-effective-reform-of-segregation-practice.html .
O’Keefe, Maureen L., Kelli J. Klebe, Alysha Stucker, Kristin Sturm & William Leggett (2011). One
Year Longitudinal Study of the Psychological Effects of Administrative Segregation, Document
No. 232973. Washington, D.C.: National Criminal Justice Research Service, National Institute
of Justice, www.ncjrs.gov/pdffiles1/nij/grants/ 232973.pdf.
Petersilia, J. (1991). Policy Relevance and the Future of Criminology. Criminology, 29(1): 1-15.
__ (2009). When Prisoners Come Home: Parole and Prisoner Re-entry. New York: Oxford
University Press.
Pyrooz, D. C. & M. M. Mitchell (2019). The Use of Restrictive Housing on Gang and Non- Gang
Affiliated Inmates in U.S. Prisons: Findings from a National Survey of Correctional Agencies.
Justice Quarterly, 37(4): 590-615.
Pyrooz, D.C., R.M. Labrecque, J.J. Tostlebe, & B. Useem (2020). Views on COVID-19 from Inside
Prison: Perspectives of High-security Prisoners. Justice Evaluation Journal, doi
10.1080/24751979.2020.1777578.
Reiter, K. (2012). Parole, Snitch, or Die: California’s Supermax Prisons and Prisoners, 1987-2007.
Punishment & Society, 14(5): 530-63.
__ (2016). 23/7: Pelican Bay Prison and the Rise of Long-Term Solitary Confinement (New Haven:
Yale University Press).
__ (2018). “After Solitary Confinement.” Studies in Law, Politics and Society, Vol. 77: 1-29.
Reiter, K., J. Ventura, D. Lovell, D. Augustine, M. Barragan, T. Blair, K. Chesnut, P. Dashtgard,
G. Gonzalez, N. Pifer, J. Strong (2020). “Psychological Distress in Solitary Confinement:
Symptoms, Severity, and Prevalence, United States, 2017-18,” American Journal of Public
URL: http://mc.manuscriptcentral.com/rjqy 22

123456789101112131415161718192021222324252627282930313233343536373839404142434445464748495051525354555657585960
For Peer Review Only
Page 27 of 29 Justice Quarterly
Solitary in Washington State
Health, Vol. 110: S52-S56
Rhodes, L.A. (2004). Total Confinement: Madness and Reason in Maximum Security. Berkeley,
CA: University of California Press.
Riveland, C. (1999). Supermax prisons: Overview and general considerations. Washington, DC:
National Institute of Corrections, http://static.nicic.gov/Library/014937.pdf .
Rubin, A. T., & Reiter, K. (2018). Continuity in the Face of Penal Innovation: Revisiting the
History of American Solitary Confinement. Law & Social Inquiry. Vol. 43:4: 1604-1632.
Sakoda, R.T. & Simes, J.T. (2019). Solitary Confinement and the U.S. Prison Boom. Criminal
Justice Policy Review, doi: 10.1177/0887403419895315.
Schlanger M. (2012). Prison segregation: Symposium introduction and preliminary data on racial
disparities. Michigan Journal of Race & Law, 18: 241.
Smith, Peter S. 2006. The Effects of Solitary Confinement on Prison Inmates: A Brief History and
Review of the Literature. In Michael Tonry (ed.), Crime and Justice, 34, 441-528.
State of Washington. SHB1765, 1993.
Tasca, Melinda & J. Turanovic (2018). Examining Race and Gender Disparities in Restrictive
Housing Placements. National Institute of Justice W.E.B. Du Bois Program of Research on
Race and Crime Project Summary,Doc. No.: 252062,
https://www.ncjrs.gov/pdffiles1/nij/grants/252062.pdf.
Toch, Hans. (1977). Living in Prison: The Ecology of Survival. New York: Free Press.
Toch, H. & Adams, K. w Grant, D. (1989). Coping: Maladaptation in prisons. Washington, DC:
Transaction Publishers; revised as, Acting Out, American Psychological Association, 2002.
23 URL: http://mc.manuscriptcentral.com/rjqy

123456789101112131415161718192021222324252627282930313233343536373839404142434445464748495051525354555657585960
For Peer Review Only
Justice Quarterly Page 28 of 29
Solitary in Washington State
Warner, B., D. Pacholke, & C. Kujath. (2014). Operation Place Safety: First Year in Review
(Washington State Department of Corrections),
https://www.doc.wa.gov/docs/publications/reports/200-SR002.pdf.
WSIPP (Washington State Institute for Public Policy). (2006). Evidence-Based Public Policy
Options to Reduce Future Prison Construction, Criminal Justice Costs, and Crime Rates,
https://www.wsipp.wa.gov/ReportFile/952/Wsipp_Evidence-Based-Public-Policy-Options-to-
Reduce-Future-Prison-Construction-Criminal-Justice-Costs-and-Crime-Rates_Full-
Report.pdf.
Acknowledgements: The research presented here utilized a confidential data file from the Washington Department of Corrections. This study would not have been possible without the support of the research and correctional staff in the Washington DOC, especially Eldon Vail, Bernard Warner, Dan Pacholke, Dick Morgan, Jody Becker-Green, Steve Sinclair, Paige Harrison, Vasiliki Georgoulas-Sherry, Bruce Gage, Ryan Quirk, and Tim Thrasher. Formerly of the University of Washington, Lorna Rhodes served as a project mentor, and L. Clark Johnson provided critical advice at early stages of data compilation. At the University of California, Irvine, Keely Blissmer helped to compile the literature review; Dallas Augustine, Melissa Barragan, Pasha Dashtgard, Gabriela Gonzalez, and Justin Strong all participated in data collection and analysis at various stages of this project. Note: The views expressed here are those of the authors and do not necessarily represent those of the Washington DOC or other data file contributors. Any errors are attributable to the authors.
Funding Details: This work was supported by the Langeloth Foundation and approved by the Institutional Review Board at the University of California, Irvine (HS 2016-2816).
Disclosure Statement: None of the authors have conflicts of interest to declare.
1 In a timely example of how relevant the analysis in the instant study is, DOC research staff recently noted that they “had some concerns” with these numbers as originally reported and have revised them upwards, re-calculating that, in 2015, 3.4% of the state prison population was in “restrictive housing” according to the ASCA-Liman Definition, and, in 2017, 4.1% of the state prison population was in “restrictive housing” by this definition. E-mail communication with DOC Department of Research, dated Sept. 25 and Sept. 28, 2020, on file with authors. The ASCA-Liman report defines “restrictive housing” as “separating prisoners from the general population and holding them in cells for an average of 22 or more hours per day for 15 continuous days or more.” 2 Intra-facility housing changes and periods spent in recently decommissioned internal solitary confinement units are better captured in our related, intensive field study dataset of 106 solitary confinement prisoners (Reiter et al., 2020). 3 General crime types were derived from DOC codes in the administrative data. Violent, non-sex offenses include murder, manslaughter, robbery, and assault; sex offenses include rape, sexual assault, child molestation, and failure to register as a sex offender; property crimes include arson, burglary, theft, forgery, trafficking, and possession of
URL: http://mc.manuscriptcentral.com/rjqy 24

123456789101112131415161718192021222324252627282930313233343536373839404142434445464748495051525354555657585960
For Peer Review Only
Page 29 of 29 Justice Quarterly
Solitary in Washington State
stolen property; drug crimes include manufacturing, delivering or possession with intent to distribute, and possession of a controlled substance. 4 To avoid confusion, we follow DOC's terminology with the term 'Hispanic', which DOC codes separately from race as ‘Hispanic Origin’ (Y/N); but we apply these data to define mutually exclusive categories: “White, non-Hispanic” includes any individual whose race is listed as White and who is not classified as Hispanic Origin; “Black, non-Hispanic” includes any individual whose race is listed as Black and not identified as Hispanic; “Hispanic” includes any individual whose ethnicity is listed as Hispanic or Latino, regardless of any other racial identification; “Other/Unknown” includes any individual whose race is listed as Asian/Pacific Islander, Native American/American Indian, Other, Unknown and whose ethnicity is not Hispanic. 5 Rates of gang affiliation by racial/ethnic group were generated by dividing the total number of members in each racial/ethnic group identified as an STG member by the total number of prisoners of each racial/ethnic group. Table 1 displays the STG membership by racial/ethnic affiliation of STGs, grouped from detailed STG data provided by DOC. STGs identified as “White” affiliated included Biker, Skinhead, White Supremacist and Security Threat Concern; “Black” affiliated included Black Gangster Disciples, Blood, Crip, and Vice Lord; “Hispanic” affiliated included Norteño, Sureño, Paisas, La Fuma, Cuban, and Hispanic-Other; “Other” affiliated included Asian and Other. 6 Our original analysis identified an even larger proportion of prisoners in this “Other-Max” group; our practitioner collaborators thought more than 10% was an unlikely proportion of prisoners to be assigned max custody status but still awaiting placement in an IMU or similar facility, and encouraged us to evaluate whether some of those “Other-Max” prisoners were housed out-of-state. Indeed, when we examined individual cases in the original movement files, we found this was true, leading us to better specify and exclude those prisoners in our sample, of any custody status, who were housed out of state. 7 Here, the 45-day cut point reflects institutionally-mandated administrative hearings required to extend or release an individual from administrative segregation. Likewise, for those classified as Max, (re-)classification reviews only happen every 6-12 months, as reflected in the overall longer mean lengths of stay for IMU-Max, as opposed to IMU-Ad/DSeg groups. Both represent examples of policies driving patterns in lengths of stay. 8 This analysis uses the person (in custody as of the snapshot date) as the unit of analysis. Even if a single person has multiple stays in an IMU during the current admission up to the snapshot date, they would be counted only once as “having spent at least one day in an IMU”. We further examined the average percentage of days spent in an IMU out of the total number of days in prison up to the snapshot date for each cohort, finding an increasing proportion of prison time spent in IMUs across the cohorts. While not presented here in detail, this finding reinforces the trends in the cumulative time spent in IMU and average LOS analyses. 9 Unlike the cumulative days in IMU calculations, the average length of stay by classification and confinement levels presented here do not cumulate days in IMU facilities. Here, each placement in a distinct IMU facility is analyzed as a separate placement term. Thus, if one prisoner is placed in IMU facility A, and subsequently moved to IMU facility B, the length of stay in each placement will be counted separately. (To the extent individuals have consecutive stays across multiple IMUs, then, these numbers might undercount average lengths of total stay.) Length of stay is calculated from admission date in the current incarceration up until the snapshot date. 10 The general population (GP) excludes: prisoners housed in IMUs, prisoners with a max custody classification held in other locations (i.e., those in SOU, ITP, or “Other Locations”), prisoners held out of state, and prisoners whose locations or custody statuses were unknown. 11 Violent infractions include seven infraction types: aggravated assault on another offender, fighting, possession of a weapon, aggravated assault on a staff member, sexual assault of a staff member, assault on another offender, sexual assault of another offender, and assault on a staff member.
25 URL: http://mc.manuscriptcentral.com/rjqy

D: PLOS ONE ARTICLE
See next page
91

ID
ID
a1111111111
a1111111111
a1111111111
a1111111111
a1111111111
PLOS ONE
OPEN ACCESS
Citation: Strong JD, Reiter K, Gonzalez G, Tublitz R, Augustine D, Barragan M, et al. (2020) The body in isolation: The physical health impacts of incarceration in solitary confinement. PLoS ONE 15 (10): e0238510. https://doi.org/10.1371/journal. pone.0238510
Editor: Andrea Knittel, University of North Carolina at Chapel Hill, UNITED STATES
Received: February 19, 2020
Accepted: August 18, 2020
Published: October 9, 2020
Peer Review History: PLOS recognizes the benefits of transparency in the peer review process; therefore, we enable the publication of all of the content of peer review and author responses alongside final, published articles. The editorial history of this article is available here: https://doi.org/10.1371/journal.pone.0238510
Copyright: © 2020 Strong et al. This is an open access article distributed under the terms of the Creative Commons Attribution License, which permits unrestricted use, distribution, and reproduction in any medium, provided the original author and source are credited.
Data Availability Statement: Data cannot be shared publicly because the administrative data we analyze in this paper is drawn from a confidential data file, shared with the research team for the
RESEARCH ARTICLE
The body in isolation: The physical health
impacts of incarceration in solitary
confinement
Justin D. Strong 1☯*, Keramet Reiter1☯ , Gabriela Gonzalez1‡, Rebecca Tublitz1‡,
Dallas Augustine1‡, Melissa Barragan1‡, Kelsie Chesnut 1‡, Pasha Dashtgard2‡,
Natalie Pifer3‡, Thomas R. Blair4‡
1 Department of Criminology, Law and Society, University of California, Irvine, Irvine, California, United
States of America, 2 Department of Psychological Sciences, University of California, Irvine, Irvine, California,
United States of America, 3 Department of Criminology and Criminal Justice, The University of Rhode Island,
Kingston, Rhode Island, United States of America, 4 Department of Psychiatry, Southern California
Permanente Medical Group, Downey, Los Angeles, California, United States of America
☯ These authors contributed equally to this work.
‡ These authors also contributed equally to this work. GG and RT are joint assistant authors on this work.
Abstract
We examine how solitary confinement correlates with self-reported adverse physical health
outcomes, and how such outcomes extend the understanding of the health disparities associ-
ated with incarceration. Using a mixed methods approach, we find that solitary confinement is
associated not just with mental, but also with physical health problems. Given the dispropor-
tionate use of solitary among incarcerated people of color, these symptoms are most likely to
affect those populations. Drawing from a random sample of prisoners (n = 106) in long-term
solitary confinement in the Washington State Department of Corrections in 2017, we con-
ducted semi-structured, in-depth interviews; Brief Psychiatric Rating Scale (BPRS) assess-
ments; and systematic reviews of medical and disciplinary files for these subjects. We also
conducted a paper survey of the entire long-term solitary confinement population (n = 225
respondents) and analyzed administrative data for the entire population of prisoners in the
state in 2017 (n = 17,943). Results reflect qualitative content and descriptive statistical analy-
sis. BPRS scores reflect clinically significant somatic concerns in 15% of sample. Objective
specification of medical conditions is generally elusive, but that, itself, is a highly informative
finding. Using subjective reports, we specify and analyze a range of physical symptoms expe-
rienced in solitary confinement: (1) skin irritations and weight fluctuation associated with the
restrictive conditions of solitary confinement; (2) un-treated and mis-treated chronic conditions
associated with the restrictive policies of solitary confinement; (3) musculoskeletal pain exac-
erbated by both restrictive conditions and policies. Administrative data analyses reveal dispro-
portionate rates of racial/ethnic minorities in solitary confinement. This analysis raises the
stakes for future studies to evaluate comparative prevalence of objective medical diagnoses
and potential causal mechanisms for the physical symptoms specified here, and for under-
standing differential use of solitary confinement and its medically harmful sequelae.
PLOS ONE | https://doi.org/10.1371/journal.pone.0238510 October 9, 2020 1 / 20

PLOS ONE The body in isolation
limited purpose of evaluating patterns of solitary confinement use in the Washington department of corrections. If any researchers wish to obtain a similar data file from the Washington department of corrections, the authors of this paper would be happy to consult with those researchers about the request and the process for obtaining the data. In theory, the administrative data file used in this study could be accessed again by future researchers. Researchers would need to contact the Washington department of corrections. Here is the process and relevant contacts: https://www. Doc.Wa.Gov/information/data/research. Htm#requests. We confirm the authors have no special access privileges others would not have to the data underlying our study, beyond patient negotiations with the Washington department of corrections about exactly what data would be shared for what purposes
Funding: KR received a Langeloth Grant from the Jacob and Valeria Langeloth Foundation. https:// www.langeloth.org/. The funders had no role in study design, data collection and analysis, decision to publish, or preparation of the manuscript.
Competing interests: The authors have declared that no competing interests exist.
Introduction
The health implications of solitary confinement have received increasing attention in recent
years [1, 2]. Although both the conditions and terms defining solitary confinement are con-
tested, the practice generally involves being locked in a cell alone, for 22 or more hours per
day, with extremely limited access to human contact and communication [3, 4]. Until recently,
however, research on the health consequences of solitary confinement has focused almost
entirely on the negative impacts on mental health [4–8]. While initial studies focused on the
effects of sensory deprivation [9–11], recent work has examined the impacts of social depriva-
tions [12, 13]. Such studies have found that placement in solitary confinement has been associ-
ated with symptoms of increased psychological distress, such as anxiety, depression, paranoia,
and aggression [14–16]. A 2018 study, for instance, found that prisoners who had spent time
in solitary confinement were three times as likely to exhibit symptoms of post-traumatic stress
disorder (PTSD) than those who had not [17]. Some researchers, however, have argued that
the psychological harms of solitary confinement are limited or unverified [18, 19]. The analy-
ses on which such opinions rely have, in turn, been criticized for neglecting existing literature
and for other serious methodological concerns, including an inability to isolate exposure to
solitary confinement, lack of specificity about variability and comparability in actual condi-
tions of confinement, and the inapplicability of psychological assessment scales in the prison
context [1, 20].
In a study examining the lived experiences of solitary confinement in Washington state, we,
too, focused on documenting the mental health impacts of the practice, through qualitative
interviews with a random sample of 106 prisoners in long-term solitary confinement, applica-
tion of a Brief Psychiatric Rating Scale (BPRS) assessment at two points in time with those pris-
oners, review of medical health records, and analysis of administrative data. To our surprise,
however, we found that, after anxiety and depression, the third most common significant
health symptoms experienced by our subjects were “somatic concerns,” defined by the BPRS
as “concerns over present bodily health” [21]. This observation led us to examine our data sys-
tematically for evidence of the impacts of solitary confinement on physical health, and to con-
sider the implications of such impacts for understanding the health disparities enacted by
solitary confinement, and by incarceration more broadly.
Existing research on the physical health impacts of incarceration demonstrates the need for
further study of both the medical effects of isolation and its racially disparate impacts, espe-
cially considering that there are roughly 80,000 people in isolation units nationwide, and this
population includes a disproportionate number of racial minorities relative to the overall
prison population [22]. Outside of prison, health disparities by race and ethnicity are well
attested by existing epidemiologic research [23]. Notably, Black and other racial/ethnic minor-
ities consistently show lower life expectancies and worse mental health outcomes than whites
[24–27]. Health disparities persist, and are magnified, among the incarcerated population,
where people of color are disproportionately represented [28–30]. In particular, people in
prison are at higher risk than the general population for substance use disorders, psychiatric
disorders, victimization, and chronic infectious diseases such as HIV and hepatitis C [31–34].
Incarceration has also been shown to exacerbate chronic illnesses such as obesity [35], hyper-
tension, and asthma [36, 37, 29], and formerly incarcerated people experience disparately
adverse health outcomes more generally [38]. The interaction between the disparate impacts
of race and incarceration on health mean that mass incarceration itself has been identified as a
social determinant of health for Black men in the United States [39, 40].
Solitary confinement amplifies the disproportionately adverse effects of mass incarceration
on people of color. Depending on the composition of the prison system, Blacks and/or Latinos
PLOS ONE | https://doi.org/10.1371/journal.pone.0238510 October 9, 2020 2 / 20
PLOS ONE The body in isolation
are often over-represented in solitary confinement relative to their (over)representation in the
general prison population [40–44]. Any concentrated health disadvantages affecting people in
prison, and especially people of color, is potentially even more concentrated among those liv-
ing in solitary confinement. Moreover, existing evidence suggests that conditions of solitary
confinement exacerbate health problems and pose a significant public health risk [45, 42].
Studies reporting the physical health impacts of solitary confinement have tended to focus
on issues like self-harm and suicide [46, 47, 8]. One recent study has examined the cardiovas-
cular health burdens of solitary confinement [45]. A growing body of neuroscience literature
has examined the effects of solitary confinement on the brains of lab animals, documenting
that lab animals in isolated environments have “a decrease in the anatomical complexity of the
brain” compared to those in more enriched environments [48, 49] (p70). One recent study
found similar effects in Antarctic expeditioners: a shrinking hippocampus, hypothesized to be
a result of the isolated and monotonous environment [50]. Such neuroscience research has
been used in litigation to argue that there is likely a similar effect on humans imprisoned in
solitary confinement [51, 48, 49]. The associations between solitary confinement, self-harm,
and lab animals’ brain structure suggest comorbidity between mental health and physical
injury in solitary confinement [1, 48].
The physical effects of solitary confinement manifest well beyond release from isolation,
and from incarceration overall. One recent study has examined post-release mortality (from
all causes, including suicide, murder, and drug overdose) associated with previous time in soli-
tary confinement: people who had spent time in solitary confinement in North Carolina
between 2000 and 2015 were 24% more likely to die in their first year after release than former
prisoners who had not spent time in solitary confinement [52]. Similarly, a 2020 study found
that Danish people who had spent time in solitary confinement had higher mortality within
five years of being released from prison compared to those who never spent time in solitary
confinement [53]. This mortality risk associated with solitary confinement exceeds the already
high mortality risk associated with incarceration and release from prison [52–54].
In sum, while many studies have examined the relationship between incarceration and
health, and some studies have examined the relationship between solitary confinement and
mental health, the existing literature lacks analysis of disparate physical health outcomes across
levels and severity of confinement [2], especially within isolation, and for incarcerated people
of color. To our knowledge, this article is the first of its kind to consider associations between
solitary confinement and a range of physical health problems, and to incorporate explicit con-
sideration of racial health disparities.
Methods and materials
To explore the physical health problems experienced in isolation, we draw upon a research
study of people in long-term solitary confinement in the Washington State Department of
Corrections (WADOC). The study consists of four dimensions of participant data: 1. surveys
of prisoners in solitary confinement; 2. in-depth interviews with a random sample of prisoners
in solitary confinement; 3. reviews of the medical (covering mental and physical health) files,
as well as the disciplinary records, for this subset of prisoners; and 4. administrative data for
the entire 2017 prison population provided by the WADOC. Data was collected in 2017 and
2018.
Setting
WADOC is a mid-sized state prison system, with the 12th lowest rate of incarceration of the 50
United States [20]. The state and its prison system have a reputation for being progressive,
PLOS ONE | https://doi.org/10.1371/journal.pone.0238510 October 9, 2020 3 / 20

PLOS ONE The body in isolation
including engaging in reforms to minimize the use of solitary confinement statewide, and for
inviting independent academic researchers to evaluate conditions and programs [20, 55–57].
Five of the state’s 12 prison facilities have an Intensive Management Unit (IMU), an all-male
unit or building, housing people in solitary confinement (with highly restricted access to com-
missary, phones, radios, televisions, visitors, and roughly 10 hours per week out-of-cell) for
durations ranging from months to years. Our study focused on people within the IMUs on
“maximum custody status”: the highest security level assigned to state prisoners housed in the
IMU for an indeterminate period, usually following one or more rule violations, with return to
the general prison population contingent on meeting specific benchmarks.
Participant sampling
First, paper surveys were distributed in-person (and collected on the same day) to all 363 peo-
ple on maximum custody status in the five state IMUs in the spring of 2017. Next, during the
summer of 2017, roughly one-third (29%) of all 363 people on maximum custody status in
IMUs were interviewed, selected from randomly ordered lists of the population of each IMU.
One year later (2018), all participants from our initial random sample, who were still incarcer-
ated one year later, including those no longer housed in the IMU, were re-interviewed. We
also reviewed paper medical and disciplinary files for each consenting, year-one interview par-
ticipant. Interviews, file reviews, and observations were conducted over two separate three-
week periods in the summers of 2017 and 2018, by a total of 13 research team members.
Finally, we received administrative data on all people within the state prison system as of July
1, 2017.
Research team training
All interviewers underwent an extensive training process, including more than 20 hours of
meetings to learn about conditions in Washington IMUs and develop the interview instru-
ment. Interviewers completed an additional 20 hours of a standardized training protocol for
administering the BPRS in clinical settings: 16 hours of in-person symptom assessment train-
ing sessions with a leading expert in BPRS research—Dr. Joe Ventura—in year one, and four
hours of refresher training prior to the year-two interviews. Dr. Ventura conducted an interra-
ter reliability analysis confirming trained raters met the minimum standard of an ICC = .80 or
greater for the BPRS. This extensive training sought to ensure that the 13 team members (9
women and 4 men; 9 white and 4 non-white), all faculty (4) or doctoral students (9) with
expertise in prisons and prior interview experience in secure confinement settings, identified
and addressed any pre-existing assumptions about the population being studied and mini-
mized any possible bias as a result of inconsistent interpretation or application of questions
and assessments. Eight of the authors on this paper participated in interviews; two participated
only in data analysis.
Interviews
On site in the Washington State IMUs, after the random sample was drawn and willing partici-
pants identified, prison staff escorted participants, one at a time, to a confidential area (moni-
tored visually but not aurally by WADOC staff). Prior to conducting interviews, interviewers
informed participants that participation was voluntary and would not involve incentives,
administrative or otherwise; that refusal would not affect them adversely; and that all informa-
tion shared would be protected and anonymized, unless it pertained to “an imminent security-
related threat.” (In the highly restrictive setting of the IMU, any incentive beyond providing
human contact and an attentive listener would both run the risk of being an undue influence,
PLOS ONE | https://doi.org/10.1371/journal.pone.0238510 October 9, 2020 4 / 20

PLOS ONE The body in isolation
coercing participation, and be administratively prohibited.) Participants provided oral consent
to participate in the interview. Immediately following interviews, interviewers asked partici-
pants whether they consented to the research team reviewing their medical files and to partici-
pating in one-year follow-up interviews. All participants agreed orally to re-interviews, and all
but two (n = 104) consented in writing to medical file reviews. Following interviews, interview-
ers reviewed consenting participants’ paper medical files for histories of diagnoses, prescrip-
tions, and substance abuse status; WADOC additionally provided electronic administrative
health and disciplinary files for all 104 consenting participants, as well as comparable, popula-
tion-level data for all people incarcerated in the system in July 2017.
All identifiable data collected for this research, including interview audio recordings, tran-
scripts, BPRS score sheets, medical file notes, and administrative data, was stored either in a
locked filing cabinet in a locked office of the university or in a secure server space, accessible
only through multi-factor identification to a subset of study team members participating in
data cleaning and linking. The University of California, Irvine, Office of Research Institutional
Review Board approved this study (HS 2016–2816), and the WADOC Research Department
reviewed this approval.
Data collection instruments
The initial paper survey of people confined in the WADOC IMU consisted of 36 numbered
questions (each containing a combination of yes/no, ordinal bubble options, and short answer
sub-questions leaving participants an opportunity to explain or elaborate on their answers)
about experiences in IMUs, conditions of confinement, health and well-being, and demo-
graphic background, drawing from existing studies on prisons and prisoner experiences [58–
62]. Survey in S1 Text. In all, there were 89 substantive items on the survey (excluding demo-
graphic questions) coded quantitatively as cardinal (e.g., number of days in IMU), ordinal (e.g.,
daily, weekly, monthly describing frequency of interactions), or categorical (e.g., yes/no) vari-
ables. In this paper, we report on the results of a sub-set of five quantitatively coded items relat-
ing to health from this larger survey. This survey functioned as a pilot instrument for the in-
person interviews, allowing us to ensure questions were clear and relevant, yielding responses
comparable across subjects and institutional contexts, and providing our interviewers with a
baseline description of participants’ experiences prior to conducting qualitative interviews.
The qualitative interview instrument consisted of 96 numbered semi-structured questions
(each containing a combination of yes/no questions and probing, open-ended follow-up ques-
tions) seeking elaboration on responses from the survey questions and also drawing from
existing studies on prisons and prisoner experiences [60–63], including conditions of daily life
(prior to and during isolation), perceived state of physical and mental health, access to medical
treatment, and experiences with required programming in the IMU, among other topics.
Interview instrument in S2 Text. We first used the instrument at the smallest IMU in Wash-
ington, interviewing 15 prisoners, and we then revised both the wording and ordering of ques-
tions for maximum clarity and engagement in the remaining 91 interviews we conducted
across the four other IMUs in the state. In total, 40 of the substantive items on the interview
instrument (excluding 10 demographic questions and 18 embedded questions designed to
establish BPRS scores and/or assess orientation) were coded quantitatively as cardinal (e.g.,
How much does it cost to see a doctor or dentist?) or categorical (e.g., Have you noticed any
changes in your health since you have been in this IMU?) variables. Such questions always
included open-ended follow-up questions (e.g., Can you describe those changes?). Transcribed
responses to those open-ended follow-up questions, which related in any way to physical
health, constitute the central source of data analyzed in this paper.
PLOS ONE | https://doi.org/10.1371/journal.pone.0238510 October 9, 2020 5 / 20

PLOS ONE The body in isolation
Interviews ranged in length from 45 minutes to three hours. Follow-up interviews lasted
between 45 minutes and two hours. The condensed year-two instrument contained approxi-
mately 70 questions, largely replicating the year-one questions, but excluding the background
demographic questions and questions about experiences over time in prison, and adjusting
some questions to address prisoners’ current (and often different) housing status.
As part of both initial and follow-up instruments, interviewers administered the BPRS psy-
chological assessment both during (for the 14 self-report questions) and immediately following
(for the 10 observational items regarding a participant’s demeanor, engagement, and speech)
the interviews. For self-report questions (14 items), embedded in the interview guide, inter-
viewers asked about the presence of symptoms in the two weeks prior, per BPRS standard [20].
Interviews were assigned a randomly generated identifier, audio recorded (with permis-
sion), professionally transcribed in Microsoft Word, translated (in one case, from Spanish into
English) by research team members, systematically stripped of identifying information, and
then systematically checked against the original audio by the original interviewer(s). Interviews
were linked, by random identifier to BPRS score sheets (which were scanned and entered into
Microsoft Excel for descriptive statistical analysis), scanned medical file review notes, and
WADOC administrative data.
Data analysis & reporting
BPRS and other administrative data were imported into Statistical Package for Social Science
(SPSS) (IBM, Armonk, NY) and Stata (StataCorp LLC, College Station, TX) to generate
descriptive statistics, including the comparative prevalence of significant ratings on BPRS
items and factors relating to physical health and demographics of the sample interview popula-
tion as compared to: the IMU population, the overall state prison population, and the overall
population of the state itself. Fisher’s exact test and McNemar’s test were performed to evaluate
the relationships between BPRS ratings across housing location, time, and race/ethnicity; chi
square tests of homogeneity were performed to compare racial/ethnic distributions in the
IMU population, the general prison population, and the Washington state population. The
demographic data utilizes a confidential data file from the WADOC.
Transcribed interviews were analyzed using Atlas-ti (ATLAS.ti Scientific Software Develop-
ment GmbH, Berlin, Germany). Six team members, who had also conducted interviews,
engaged in an iterative and recursive coding process. Consistent with the tenets of constructivist
grounded theory, coders inductively explored how participants make meaning of their experi-
ences (here: their time in solitary confinement) [63, 64]. This process included initial, line-by-
line open-coding of a subset of transcripts, which generated a list of 214 codes, grouped into 11
major categories (e.g., Health) with sub-themes (e.g., physical health) [63]. Some of these initial
codes and categories corresponded with specific questions on our interview instrument (most
relevant for the instant analysis: question 29 concerned medical “kites,” and questions 30, 31,
and 38 concerned physical health and somatic concerns). However, open-ended questions also
yielded responses related to these topics and were so coded. Given the constraints of the prison
setting (in-person contact is expensive and time-consuming; mail contact is not confidential
because of prison censoring policies), participants have not provided systematic feedback on
their transcripts or our findings. However, the year-two interviews did give research team mem-
bers an opportunity to discuss year-one themes with participants.
All quotations presented in this paper were initially identified in the first phase of our cod-
ing process by one of three (out of our initial 214) codes: “somatic concerns,” “physical health,”
or “kites” (the standard, slang term for a paper form handed to a correctional officer to request
medical attention). Two coders then used intermediate focused coding techniques to
PLOS ONE | https://doi.org/10.1371/journal.pone.0238510 October 9, 2020 6 / 20

PLOS ONE The body in isolation
re-code these 319 quotes, exploring the relationship between solitary confinement condi-
tions and policies and physical health problems, “transform[ing] basic data into more abstract
concepts and allowing the theory to emerge from the data” [64 p. 5].
Notes from reviewing participants’ paper medical files corroborate details from the qualita-
tive analysis that systematically anchors this data. Each participant has been assigned a pseudo-
nym and, because we are also exploring the racially disparate impact of the health problems we
identify, we specify each quoted participant’s self-identified race or ethnicity. We linked quota-
tions to specific racial/ethnic identities only after quotations were selected for inclusion in this
manuscript, as representative of the themes we identified in coding.
Results
In total, 225 prisoners in IMU (62%), responded to our in-person survey. The refusal rate of
initial interviews was 39% (67 out of 173 approached), comparable to similar studies of prison-
ers [15, 58, 59, 65]. The drop-out rate of our sample for the one-year follow-up interviews was
comparable to other studies at 25%: there were 4 refusals; 21 institutional, out-of-state, and
parole transfers precluding follow-up; and one death [58–61]. Our random sample of 106 (all-
male) IMU prisoners reflects a mean age of 35; mean stay of 14.5 months in IMU; mean of 5
prior convictions resulting in prison sentences. Among our participants 42% were white; 12%
were African American; 23% were Latino; 23% were “Other.” There were no significant differ-
ences between our participants and all people held in IMU at the time of our sample. People in
the general prison population at the time of our sample are notably different as they are older,
less violent in terms of criminal history, serving shorter sentences, less likely to be gang-affili-
ated, and less likely to be Latino than those held in IMU [20]. (We discuss racial differences
across these populations further in the final results sub-section.)
Prevalence of somatic concerns
As an initial basis for describing physical symptoms experienced in solitary confinement, we
present a quantitative analysis of the prevalence of somatic concerns in our random sample of
106 people held in IMU, and the variability of these concerns across time and housing location.
In 2017, 15% of participants reported having clinically significant (formally defined as a sever-
ity of 4 or higher out of a possible 7) somatic concerns (formally defined as “concern over pres-
ent bodily health”) on the BPRS assessment [21]. In the 2018 re-interview sample, of the 80
respondents re-interviewed in the second year of the study, 12.5% reported clinically signifi-
cant ratings of somatic concern.
While ratings of clinically significant somatic concern mostly varied within participants
over time, our analysis indicated some persistence of somatic issues across the two assessment
periods. Of those who reported clinically significant somatic concern in 2017 and who were
re-interviewed in 2018 (12 respondents; 4 were unavailable for re-interview), 25% (3 respon-
dents) indicated a persistence of clinically significant somatic issues in 2018. An exact McNe-
mar’s test revealed no statistically significant relationship between the proportion of
respondents reporting clinically significant somatic concerns in 2017 and 2018 (p = 0. 0). In the initial 2017 assessment, all study subjects were housed in IMU. At the time of re-
interview in 2018, 52 respondents had moved into the general prison population, while 28
remained in IMU. Of those who were still in IMU in 2018, 21% (6 of 28) reported clinically sig-
nificant somatic concerns, compared to just 8% of those housed in the general prison popula-
tion (4 of 52). While the descriptive data appear to demonstrate higher proportions of somatic
concern in IMU settings, the difference was not statistically significant at the 95% confidence
PLOS ONE | https://doi.org/10.1371/journal.pone.0238510 October 9, 2020 7 / 20

PLOS ONE The body in isolation
level (p = 0.09; Fisher’s exact test). No significant differences were observed in the distribution
of clinically significant somatic concern ratings across racial and ethnic groups.
Complementing the BPRS assessment data from the random sample of 106 individuals in
IMU custody, survey data collected from the full IMU population in 2017 further indicated the
prevalence of somatic concerns among this population. Of the 225 survey respondents, 63%
expressed health concerns; 48% were taking medication; 17% had arthritis; and 8% had experi-
enced a fall in solitary confinement. Importantly for the analysis of emerging symptoms in par-
ticular, 82% replied “yes” to the question “Have you experienced any changes in yourself?”
while in the IMU. These survey results, like the BPRS somatic concern results, benefit from tri-
angulation with our qualitative data.
Specifying physical symptoms
We identify three categories of physical symptoms people experience in solitary confinement,
each associated with different aspects of IMU housing: symptoms associated with deprivation
conditions, symptoms associated with deprivation policies limiting access to healthcare, and
chronic musculoskeletal pain exacerbated by the intersection of deprivation conditions and
deprivation policies. In each category, we analyze how the institution of solitary confinement
shapes both physical health outcomes and perceptions of health for people housed in solitary
confinement, revealing both the mechanisms of physical health deterioration and the accentu-
ated comorbidity of physical and mental health in solitary confinement.
Deprivation conditions. Our participants described a range of physical ailments directly
connected to the conditions of their confinement, especially the various deprivations of movement,
provisions (from food to toiletries), and human contact inherent in the institutional restrictions
defining solitary confinement. Skin irritations and weight fluctuations were the most common of
these; participants experienced both as co-morbid with anxiety and other health issues.
Participants described rashes, dry and flaky skin, and fungus developing in isolation. They
understood these conditions as being directly associated the poor air and water quality, irritat-
ing hygiene products, and lack of sun exposure inherent to their conditions of solitary confine-
ment. People in the IMU (unlike those in the general prison population) usually cannot
purchase or trade for alternative, higher-quality hygiene products; their cells have limited nat-
ural light (at best, a window far above eye-level; at worst, no window); and even the exercise
areas frequently have limited natural light. Indeed, research has documented how isolation can
cause vitamin D deficiency due to lack of natural light exposure [66].
As Joseph (white) explained, an ostensibly trivial physical problem, like dandruff, can
inspire a sense of helplessness in the IMU:
Well I try not to [think about] what happens to my body. . .Because you’re going to obsess
on it probably. . .Minor things become huge when you’re in segregation, and so, something
that you–you as being free in society can alleviate by going to, you know, to [the store] or
whatever, and just get a dandruff shampoo. You can’t do that here. And kiting medical and
telling them “Hey, I have a severe problem with dermatitis, and my head’s itching and I’ve
got bleeding scabs on my head,” or whatever the case may be, there’s nothing that we can
do here. You’re SOL [shit out of luck].
Joseph’s inability to treat his skin irritations himself led to both helplessness and obsessive-
ness, further exacerbating the discomfort and potential health consequences of the issue. This
case illustrates how a free person’s flaky skin or minor embarrassment becomes a potentially
severe medical problem in solitary confinement, entailing bleeding scabs on the scalp.
PLOS ONE | https://doi.org/10.1371/journal.pone.0238510 October 9, 2020 8 / 20

PLOS ONE The body in isolation
Participants frequently experienced fluctuations in body weight and, as with skin irritations,
connected these symptoms to conditions inherent to solitary confinement. What started as
simple observations about diet, exercise, and appearance often turned into analyses of the
impact of conditions of confinement on physical, as well as mental health. Simon (Black) dis-
cussed being “real worried” about his weight:
The only reason I know they’re not really giving us the calorie needs they’re supposed to
give us, is because I feel like I’m losing more muscle than I am fat. And to lose more muscle
than fat is because you’re not getting the nutrients that you need.
Not only is weight loss a significant source of anxiety for Simon, but he connects the depri-
vations of confinement–the lack of nutritious food and sufficient calories–to physical changes
in his body. Whether his explanation is correct, or simple lack of physical activity is more likely
to explain the changes accurately, IMU confinement ostensibly produced the change.
Participants also described restricting their own dietary intake, beyond the already limited
rations (usually calculated to meet the minimum daily calorie intake standards), for a variety
of reasons, from the quality of the food to their emotional state. Michael (Latino) described
being suspicious of staff having tampered with his food: “I got my breakfast bowl and there
was a tear on the plastic. [. . .] Sometimes your mind plays tricks on you, like they’re trying to
poison you or something.” While Michael noted that his suspicions were likely just in his
mind, Philip (Black) asserted: “They was poisoning my food–they control everything. They
can even manipulate the water. I’m so fucking serious; this place is highly technologically
advanced.” For those like Michael and Philip, psychological states associated with the condi-
tions of confinement (e.g., suspiciousness, paranoia, and potentially psychosis) caused them to
restrict their food intake, resulting in weight loss. Indeed, both Michael and Philip had docu-
mented diagnoses of mental illness in their medical files; bipolar disorder and undifferentiated
schizophrenia respectively. Food restrictions can, of course, lead to more imminently danger-
ous conditions, such as dehydration, electrolyte imbalances, or renal failure–none of which are
likely to be subject to objective evaluation in the IMU, as we discuss further in the next sub-
section on the impacts of deprivation policies.
Some prisoners made a more direct connection between their mental health, their dietary
intake, and their physical health. For instance, Kai (Native American), said:
I don’t work out because I have a problem breathing . . .This is the first time I’ve ever done
a program [IMU term] where I’ve felt like I was breaking. Because before I’d be working
out. . . Now, I’m stuck in this . . .I’m battling mentally with everything going on. Which
affected my body, effects my eating sometimes. I’ll just take the [food] tray but I’ll flush the
stuff down the toilet.
As Kai suggests, in the IMU, exercise functions not only as a means to practice physical fit-
ness, but also to provide structure for people to manage both their days and the mental strain of
being in isolation. When asked a general question, like “how are you doing in the IMU?” many
participants, like Kai, referenced whether or not they were engaging in exercise as a way to
gauge how they were faring overall. People like Kai shared feelings of lethargy, or feeling too
overwhelmed to do anything but lie around all day, induced by long periods in solitary confine-
ment. Their weight fluctuated during these cycles: going down with regular and social exercise
routines, going up with exercise-induced injuries or periods of lethargy. Concerns around exer-
cise, diet, and the associated body weight fluctuations, like concerns with skin irritations, high-
light the interdependence of physical and mental wellbeing for prisoners in the IMU.
PLOS ONE | https://doi.org/10.1371/journal.pone.0238510 October 9, 2020 9 / 20

PLOS ONE The body in isolation
Deprivation policies. Our participants described multiple situations in which official
IMU policies and unofficial IMU practices exacerbated their physical ailments, especially their
chronic health problems. Such policies and practices included the prioritization of security
over care in emergency situations, disruptions in care upon transfer into the IMU, and over-
whelming administrative hurdles to accessing care in the first place. If prisons are largely
unequipped to provide the appropriate care and environment for chronic medical problems
[67, 31], our findings reveal both the specific mechanisms by which solitary confinement poli-
cies amplify the usual bureaucratic challenges of accessing healthcare in prison and the kinds
of physical health problems that go unaddressed as a result.
First, in cases of medical emergencies, people housed in the IMU have response buttons in
their cells they can press to alert staff. However, many of the people we interviewed both
doubted whether staff would respond swiftly enough in an actual emergency and worried
about being punished with additional time in the IMU for activating an emergency response,
if medical staff ultimately deemed their problem non-emergent. Indeed, prisoners perceived
IMU policies as systematically prioritizing incapacitation over medical attention. Carl (white)
described an incident where he experienced delayed care and was pepper sprayed after having
suffered from a seizure, all because he was unable to comply with orders to stand following the
episode:
I had a serious seizure. And I was laying on the floor, and I had defecated. I was laying in a
puddle of puke. . .Well, [the guards] had come to the door, and I guess they had called med-
ical. . .and they were standing there for 45 minutes yelling, “Stand up and cuff up so we can
give you medical attention.” They did not pop the door and go in there and give me medical
attention. And so, unknown to me, they popped the cuff port, and they sprayed OC [pepper
spray] in there. And then they came in. They noticed that I was unconscious, and finally a
nurse looked at my medical file and she’s, like, “he’s epileptic.”
In the tense environment of the IMU, where staff manage people with histories of violating
prison rules, assaulting staff, and, often, serious mental health needs, immediate security con-
cerns readily take priority over assessing medical histories and providing healthcare.
Second, simply being transferred into the IMU often disrupted care in dangerous ways. For
instance, Julian (Hawaiian) described how, when he was transferred into a new solitary con-
finement unit, he had to restart the process of seeking treatment for (and even simple acknowl-
edgement of) recurring kidney stones. Whereas he had fought and been able to receive x-rays
and medication to help manage his kidney pain at his prior institution, he now found this fight
to be futile at his new facility: “They’re just going to take me out of room, take me over there to
medical, and they’re going to be like, oh here’s the hot water or hot bag or whatever.” And
Tony (Native American/white) described a battery of physical and mental health issues–an
enlarged prostate, a painful cyst that needed to be surgically removed, varicose veins, “chronic
suicidal thoughts,” anxiety, and depression–all requiring medications, which he had difficulty
maintaining access to in the IMU. For instance, he described how both his Amitriptyline,
which partly treated his periodic limb movement sleep disorder, and his seizure medication,
Dilantin, were both discontinued in the IMU, resulting in serious injuries to his foot and head.
Third, a number of bureaucratic hurdles and barriers discouraged people in the IMU from
attempting to access healthcare at all, even in potentially life-threatening situations. In order to
see a medical professional, people isolated in the IMU must fill out a paper request (a “kite”)
and hand it to a correctional officer passing by, or report a concern to a nurse, who makes
daily rounds passing by each cell in the IMU. The medical response happens either “cellfront,”
with the person talking to the medical professional through his cell door, in earshot of others
PLOS ONE | https://doi.org/10.1371/journal.pone.0238510 October 9, 2020 10 / 20

PLOS ONE The body in isolation
held in solitary confinement, or “by escort,” with the person in handcuffs and leg-cuffs, if not
also belly chains and a hood, usually accompanied by at least two to four correctional officers,
to a medical treatment area. Vitamins and over-the-counter medications like Tylenol, or as-
needed medications like asthma inhalers, are kept outside of the cell and available only at spec-
ified times, or, again, by paper kite request. Throughout WADOC, people must pay $4 for
non-emergency medical care (unless they are indigent, in which case WADOC provides care
without a co-pay), but people held in the IMU have more restrictive caps on their overall
spending for any needs, including healthcare, food, and toiletries, proportionally raising the
relative cost of seeking care for non-emergency symptoms.
These policies, in combination with negative perceptions about the quality of care available
to them, dissuaded participants from seeking medical services. Deon (Black) described new
and unfamiliar “breathing problems” and rising “blood pressure” in IMU, but felt that seeking
medical attention would be useless:
It’s pointless for me to knock on the window and ask the nurse, “Hey, nurse, do this.”
Because every time I knock on the window–it is pointless because the only thing the DOC
wants is money. It is money. . . I think people in the cell should be important. . . And it’s a
long time but I’d just rather wait till I get out.
Later in the interview, Deon links his rising blood pressure to his isolation: “I never had
blood pressure problems until I went to this IMU.” Because Deon does not expect to be treated
with care or dignity, he avoids medical treatment. As a result, his new breathing issues and ris-
ing blood pressure went unnoticed by medical staff, and Deon did not find out the cause.
Blake (white), described experiencing unfamiliar physical health symptoms in the IMU, for
which he was also hopeless about receiving any medical assistance:
I’ve been told I have a heart murmur, but for, like, last two weeks. . .I’ve been feeling my
heart, like, feeling weird like it flutters once in a while. . .[I] just don’t tell nobody. . .because
they won’t do nothing about it unless you’re actually having a heart attack, or unless you
declare a medical emergency. . .they’ll pull you out, take your vitals, and then charge you 4
bucks. . . If I have a heart attack or don’t have a heart attack, it don’t matter.
Not only did Blake, like Deon, doubt whether a prison medical provider would believe him
and try to help him, but he was further dissuaded from seeking treatment by the $4 institution-
ally-imposed cost for non-emergency treatment. Four dollars is arguably worth much more in
prison that it would be even to a destitute person on the outside, and worth more still to some-
one in the IMU. Under WADOC policy, people in IMU are only allowed to spend $10 per
week on store items, such as coffee, pastries, and deodorant. The $4 medical fee would absorb
nearly half of this weekly spending cap. Blake might have had clinically insignificant, subjective
palpitations, or the onset of atrial fibrillation following an undiagnosed myocardial infarction;
his confinement status rendered clarification functionally unavailable.
Like many other participants, Deon and Blake expressed a sense of futility about seeking
medical assistance while in the IMU, dissuaded by bureaucratic hurdles from perceived dis-
missiveness and indignity (exemplified in the problem of dual loyalty [67]) to actual costs of
care. Futility, in turn, led to non-evaluation of emerging medical problems. Still, Deon and
Blake expressed a passive acceptance of their situation: “it’s pointless,” and “it don’t matter.”
This hopelessness reflects a precarity unique to solitary confinement: wondering whether med-
ications would be provided and refills renewed, whether the severity of ailments would be
acknowledged, and whether medical emergencies would be addressed or, instead, treated as
PLOS ONE | https://doi.org/10.1371/journal.pone.0238510 October 9, 2020 11 / 20

PLOS ONE The body in isolation
security threats. As our participants’ experiences suggest, solitary confinement carries the
additional punishment of substandard access to health care.
Exacerbating musculoskeletal pain. Participants spoke frequently about one specific,
chronic ailment in solitary confinement: musculoskeletal pain. The experiences of people in
solitary confinement with chronic musculoskeletal pain reveal how the prior two categories of
symptoms we analyze, those associated with deprivation conditions and those associated with
deprivation policies in solitary confinement, interact to exacerbate physical health problems.
While participants attributed their musculoskeletal pain to a range of causes from physical
injury to arthritis, bursitis, and sciatica, they consistently experienced this pain as untreated
and interfering (physically and mentally) with even those few, limited activities available to
them in solitary confinement.
For instance, Victor (Latino) described his frustrations with attempts to get care, let alone
relief, from the pain of his sciatica:
I’ve been told I have nothing wrong with me, but I have been hurt, and they took x-rays of
my back, and they found that the disks are in there or something that’s triggering some
nerves. And I still got a little bit of time left, and they just opened up an Ibuprofen right
now. And that stuff doesn’t work. So, what can you do?
Victor’s medical file highlights persistence of chronic pain in his back and hips and notes
that he avoided sitting down for longer than 5–10 minutes. Not only did participants describe
untreated pain, but they described the anxiety associated with the lack of treatment. Isaac
(Black/Latino) described how he experienced both quad and hamstring pain in the IMU, and
how this escalated his physical health concerns: “I’ll start thinking like oh, I’m laying in bed
too much. Maybe my muscles are starting to rot, you know, eating on themselves.” In a similar
sentiment, Tim (white) stated, “My body is like–I can’t explain it. Like my skeleton, feels like
my skeleton’s broken or something.” While Victor must bear persistent pain and the anxiety
that he will likely have to continue to suffer, Isaac and Tim’s experiences are more reflective of
somatization, or the expression of psychological distress through physical symptoms [69].
These participants highlight the complex comorbidity between musculoskeletal pain and men-
tal health in isolation, an inverse experience of physical pain. Tyler (white), discussing his sco-
liosis, made a direct connection between his untreated pain and his mental health: “Mental
health and things that go through your head just because of this, when you got pain shooting
up into your brain, and you guys aren’t fixing it.”
Pain and anxiety, in turn, interfered with other aspects of IMU existence. Craig (white)
described how an untreated knee injury was causing him “moderate to severe pain,” in combi-
nation with anxiety about how he would re-enter society when released directly from solitary
confinement; together these experiences interfered with his everyday activities, including his
ability to communicate with his family. “I was in the middle of actually writing my mom a let-
ter, and I was going to tell her about, you know, they still haven’t done anything with my
knee. . .I couldn’t write the letter anymore. I just got so mad. I was so mad I really couldn’t
even focus on anything.” Craig’s medical file affirms his complaint, documenting knee swell-
ing and chronic extension tendonitis, but also indicating no abnormalities were found.
People living in solitary confinement are left with very few options to effectively manage
persistent pain, which appears to foster more maladaptive behavior, such as rumination, stress,
and despair, within a highly restrictive and stimuli-depleted environment [68–71]. Along with
bearing the institutional monotony, medical precariousness, and procedural strictures of soli-
tary confinement, one’s own body becomes a challenge to withstand [72, 73].
PLOS ONE | https://doi.org/10.1371/journal.pone.0238510 October 9, 2020 12 / 20

PLOS ONE The body in isolation
Racial/Ethnic disproportionalities
We now turn to reporting the race and ethnic disparities in the Washington state prison popu-
lation overall (compared to the statewide adult population), and in solitary confinement spe-
cifically (compared to the general prison population). These disparities suggest that the
various mechanisms by which solitary confinement impacts health and well-being are likely to
be disproportionately experienced across race and ethnic lines.
We analyze administrative data provided by WADOC and Census Bureau population esti-
mates. Black, non-Latino individuals represented only 3.7% of adults in Washington state in
2017, but they comprised 17.9% of the general prison population [74]. Similarly, Latino indi-
viduals represented 10.3% of the statewide adult population, but 13.6% of the prison popula-
tion. Conversely, both White, non-Latinos and Asian/Pacific Islanders, Native Americans, and
mixed-race individuals (grouped within “Other/Unknown”) were somewhat under-repre-
sented in the general prison population relative to the statewide adult population (see Fig 1).
Differences in racial and ethnic composition of the general prison population and the state-
wide adult population are statistically significant (p < .001; chi-square test for homogeneity).
Within prison walls, we find evidence of further racial and ethnic disproportionalities in
housing placement. Comparing those housed in restrictive IMU confinement to those housed
in the general population, we find that prisoners who self-identify as “Latino, Any Race” and
“Other/Unknown” ethnicity are over-represented in IMU. To characterize the scale of differ-
ences in the racial/ethnic composition of the IMU and general prison populations, we calcu-
lated disproportionality, or prevalence, ratios as the proportion of each racial/ethnic group in a
given population, divided by the proportion of that racial/ethnic group in the reference popu-
lation. Here, Latinos are over-represented within the IMU participant group by a factor of 1.7
relative to their representation in the general prison population, and those grouped in the
“Other/Unknown” category are over-represented in the IMU sample by a factor of 2.6, relative
to the general prison population. Conversely, White, non-Latino individuals are under-repre-
sented in the IMU sample relative to the general prison population. Likewise, and in contrast
to the gross disproportionality documented in the general prison population, Black, non-
Latino individuals are moderately under-represented in the IMU sample, relative to the gen-
eral prison population: 11.3% of the IMU sample identified as Black, non-Latino, compared
with 17.9% of the general prison population. The difference in the racial and ethnic composi-
tion of those in long-term solitary confinement compared with the general population was sta-
tistically significant (p < .001; chi-square test for homogeneity).
Discussion
A popular analogy likens prison to a chronic illness: it disrupts daily life, interrupts routines
[72], spreads risk like a contagious disease [75], and models like an epidemiological problem
[76, 30]. While the study of the physical effects of incarceration has developed over the last
decade, there is a serious gap in the literature in understanding the experiences and outcomes
of physical health in isolation. We are just beginning to understand the medical correlates of
solitary confinement, their comorbidity with mental health, and overall implications for pris-
oners’ suffering [72]. Integrating surveys, interviews, BPRS scores, medical and disciplinary
file reviews, and administrative data, the scale and array of our research represents one of the
more robust studies of solitary confinement to date [20]. The multi-method research presented
here offers a first step not only towards understanding some typical medical problems of soli-
tary confinement, but also towards understanding the analytical challenges of an environment
in which physical and psychological problems are immediately concomitant, and objective
clarification is often unavailable.
PLOS ONE | https://doi.org/10.1371/journal.pone.0238510 October 9, 2020 13 / 20

�
PLOS ONE The body in isolation
Fig 1. Racial and ethnic composition of IMU sample, general prison population, and Washington State, 2017. U.S. Census Bureau,
Population Division. Annual Estimates of the Resident Population by Sex, Age, Race, and Hispanic Origin for the United States and
States: April 1, 2010 to July 1, 2017. 2018 Jun. † Authors’ calculations. The total prison population file included 17,943 individuals in
DOC prison custody on July 1, 2017. For comparison purposes, the “general prison population” excludes those returned to prison on
violations of release or sentence conditions, those in an IMU unit on the index date, and those on a maximum custody status (n = 1,970),
as well as those in the IMU sample (n = 106). ‡ No significant differences in racial/ethnic composition were found between the IMU
sample and larger IMU population on the index date using race/ethnicity data from DOC. These data reflect self-reported race/ethnicity
during participant interviews. ^ Other/Unknown includes individuals of two or more races, Asian/Pacific Islander, Native American/
Alaska Native, and unknown race/ethnicity information.
https://doi.org/10.1371/journal.pone.0238510.g001
We find that solitary confinement constitutes not just a mental but also a physical health
risk. It exacerbates well-documented physical health “symptoms” of incarceration, from dis-
ruptions of daily life and routines, to undiagnosed, untreated, or mis-treated ailments [1, 30,
38]. These initial symptoms, in turn, produce other risks: to the extent respondents are accu-
rately reporting weight fluctuations in solitary confinement, this physical symptom has detri-
mental health implications; weight fluctuation, itself, is associated with adverse cardiovascular
and psychological outcomes [77, 78]. Likewise, musculoskeletal pain increases multimorbidity,
and its sequelae are tightly unified in their impact on disability [79].
These health concerns likely have a grossly disparate impact on communities of color: just
as incarceration is a health stratifying institution for prisoners, their families, and communi-
ties, so, too, does solitary confinement appear to exacerbate racial health inequities. While we
find that Black, non-Latino individuals are moderately under-represented in the IMU sample,
relative to the general prison population, we find that Latino and Other/Mixed Race prisoners
are disproportionately over-represented in solitary confinement in WADOC, just as other
PLOS ONE | https://doi.org/10.1371/journal.pone.0238510 October 9, 2020 14 / 20
PLOS ONE The body in isolation
studies have documented disproportionately high representations of racial and ethnic minori-
ties in other states’ uses of solitary confinement [22, 41, 43]. We further find that prisoners of
all races describe similar physical health challenges and complaints while in solitary confine-
ment. In sum, people of color face a disproportionate risk of being placed in solitary confine-
ment; such racial disparities, in turn, mean that the physical health symptoms associated with,
or possibly caused by, these conditions of confinement are likely to fall disproportionately on
certain groups. Though we do not explore other risk factors for over-representation in solitary
confinement in this paper, we and others have documented serious mental illness [20, 80],
transgender identification [81], and pregnant women [82] as particularly vulnerable to both
incarceration and solitary confinement, suggesting additional sub-groups who might face dis-
proportionate and unique risks of physical health problems in solitary confinement.
If anything, the evidence we present here understates the prevalence and intensity of the symp-
toms we document. First, Washington State is a progressive system actively engaged in both limit-
ing the application and the duration of solitary confinement and developing measures to mitigate
its harmful effects, from better mental health training for correctional staff to more sustained
group contact for prisoners in IMUs; conditions, and their physical effects, are undoubtedly
worse in many, if not most, other states [20, 42, 44]. Second, the BPRS somatic concerns scores
we present focus on the two weeks prior to assessment, so likely underrepresent the cumulative
incidence of somatic concerns in the study sample over time. Third, our exceptionally large ran-
dom sample size for an in-depth, mixed methods study of a solitary confinement population was
still not powered to establish statistically significant differences between interview subjects in the
IMU in year one (2017) and those out of the IMU in year two (2018)–otherwise important com-
parison groups for understanding differences in either somatic concerns measures, or physical
symptom specifications. Fourth, both the Washington state population and state prison popula-
tion have proportionately more white people than some other states and prisons, where racial dis-
parities in both prison and solitary confinement may be even more significant.
While our findings do not establish either how prevalent the symptoms and mechanisms of
suffering we specified are among people in solitary confinement, as compared to the general
prison population, or whether solitary confinement in fact directly causes these symptoms,
recent research suggests that at least some of the symptoms our respondents reported, like
hypertension, are significantly associated with long-term isolation [83, 45]. Although the evi-
dence is clear that solitary confinement poses serious health risks [54, 45], our research high-
lights the importance of continuing to document and analyze these risks, especially from a
multi-method perspective triangulating administrative population-level data with objective
scales like the BPRS, subjective descriptions of experiences from surveys and interviews, and
corroboration from medical file reviews.
First, documenting physical health problems provides a critical means to elucidate the sever-
ity of deprivations in treatment, environmental conditions, and exercise and nutrition [84, 85]
inherent in solitary confinement. If incarceration is experienced fundamentally through control
and restriction of the body, this is all the more true in solitary confinement, where prisoners are
subjected to extreme forms of control while being entirely reliant on others for accessing basic
necessities, from food to healthcare. Our participants experienced the deprivations of solitary
confinement as exacerbating their health problems, which shaped their health experiences as
punitive. Otherwise medically trivial conditions quickly become grave in solitary; “dandruff”
can become a bleeding scalp wound, a four-dollar co-payment blurs the difference between sub-
jective palpitations and an unstable arrhythmia, and unused muscles “rot.” Physical suffering
reveals itself to be a crucial dimension of experience in solitary confinement.
Second, to the extent physical symptoms, in particular, are more familiar, more readily
labeled, and less stigmatized than mental health issues, they may provide a window into other,
PLOS ONE | https://doi.org/10.1371/journal.pone.0238510 October 9, 2020 15 / 20
PLOS ONE The body in isolation
less physically tangible pains of confinement, in solitary or elsewhere [84, 85]. The visuality of
spectacular forms of suffering in carceral institutions is only made possible by and through
mundane phenomenon that our participants elucidate through their discussions of everyday
physical experiences [86]. Indeed, attending to people’s physical health in solitary confinement
reveals the irreducible relationship between the body, mental health, and highly restrictive
conditions of confinement. Whether they exercise to the point of physical debilitation to keep
their minds busy, refuse to eat because they do not trust their food is safe, or avoid medical
care out of a hopelessness of being treated with dignity, the physical and psychological are inti-
mately bounded in people’s experiences in prison. Examining physical suffering in solitary
confinement, then, becomes a tool for understanding suffering in prison more broadly, and
especially the comorbidity of physical and mental suffering.
Third, the challenges we document in identifying and specifying physical symptoms in soli-
tary confinement reveal not just the interrelationship between symptoms, conditions, and poli-
cies, but institutional mechanisms exacerbating both the identification and treatment of
physical problems in prison. In many cases, our respondents had no hope of establishing what
was physically wrong with them, let alone whether the conditions of their confinement caused
the physical ailments, because they either could not get or avoided medical treatment. While
both community standard and continuity of care is an issue in prison generally [67], solitary
confinement widens these service gaps. The phenomenon of dual loyalty, which describes how
the patient-provider relationship within prison can be subsumed by correctional directives of
control and mistrust of incarcerated people [67], is acutely relevant in the context of solitary
confinement, where both control and mistrust are especially prevalent [87, 88].
In sum, examining solitary confinement and documenting its affects provides an important
magnifying lens for understanding prison and its affects more broadly, not only in elucidating
the mechanisms of harm, but also in developing responses to mitigate these harms. Ninety-five
percent or more of all prisoners will eventually return home to our communities [4, 5]; and
many will have spent time in solitary confinement. Nearly one-in-five people in prison spends
time in solitary confinement each year, and one-in-ten spends 30 days or more in these condi-
tions [3]. These numbers will only increase in the face of the global COVID-19 pandemic,
which has justified facility-wide “lockdowns,” imposing restrictions similar to those in soli-
tary-confinement, in prisons across the United States, as well as actual solitary confinement
placements for infected and exposed prisoners [89]. To the extent that solitary confinement
undercuts treatment and care in and beyond prison, it undermines the public health of those
incarcerated and those returning to our communities.
Supporting information
S1 Text. IMU survey.
(PDF)
S2 Text. Interview instrument.
(DOC)
S1 Checklist. Consolidated criteria for reporting qualitative studies (COREQ): 32-item
checklist.
(DOCX)
S1 Quotations.
(DOCX)
PLOS ONE | https://doi.org/10.1371/journal.pone.0238510 October 9, 2020 16 / 20

PLOS ONE The body in isolation
Author Contributions
Conceptualization: Justin D. Strong, Keramet Reiter.
Formal analysis: Justin D. Strong, Keramet Reiter, Gabriela Gonzalez, Rebecca Tublitz.
Methodology: Justin D. Strong, Gabriela Gonzalez, Rebecca Tublitz.
Project administration: Justin D. Strong.
Writing – original draft: Justin D. Strong, Keramet Reiter, Gabriela Gonzalez, Rebecca
Tublitz, Dallas Augustine, Melissa Barragan, Kelsie Chesnut, Pasha Dashtgard, Natalie
Pifer, Thomas R. Blair.
Writing – review & editing: Justin D. Strong, Keramet Reiter, Dallas Augustine, Melissa Bar-
ragan, Kelsie Chesnut, Pasha Dashtgard, Natalie Pifer, Thomas R. Blair.
References
1. Haney C. The psychological effects of solitary confinement: A systematic critique. Crime and Justice.
2018 Mar 1; 47(1):365–416.
2. Massoglia M, Pridemore WA. Incarceration and health. Annu Rev Sociol. 2015 Aug 14; 41:291–310.
https://doi.org/10.1146/annurev-soc-073014-112326 PMID: 30197467
3. Beck AJ. Use of restrictive housing in US prisons and jails, 2011–12. [Internet] Washington DC: US
Department of Justice. 2015 [cited 2020 July 14]. 1 p. Available from: http://www.ncjrs.gov/App/
publications/abstract.aspx?ID=271350
4. Administrators. Association of State Correctional Administrators, Yale Law School Arthur Liman Public
Interest Program. Aiming to reduce time-in-cell: reports from correctional systems on the numbers of
prisoners in restricted housing and on the potential of policy changes to bring about reforms. New
Haven: 2016 Nov. [cited 2020 July 14] 106 p. Available from: https://law.yale.edu/sites/default/files/
area/center/liman/document/aimingtoreducetic.pdf
5. Arrigo BA, Bersot HY, Sellers BG. The ethics of total confinement: a critique of madness, citizenship,
and social justice. New York, New York: Oxford University Press; 2011. 320 p.
6. Haney C, Lynch M. Regulating prisons of the future: A psychological analysis of supermax and solitary
confinement. NYU Rev. L. & Soc. Change. 1997; 23(4):477–570.
7. Grassian S. Psychiatric effects of solitary confinement. Wash. UJL & Pol’y. 2006; 22:325–84.
8. Kupers TA. What to do with the survivors? Coping with the long-term effects of isolated confinement.
Crim Justice Behav. 2008 Aug; 35(8):1005–16.
9. Griffin E. Breaking men’s minds: Behavior control and human experimentation at the federal prison in
marion. J of Prisoners on Prison. 1993; 4(2):1–8. Formatted Online Version 2006 Available at: http://
jpp.org/documents/back%20issues/JPP_4_2_TEXT.pdf
10. Heron W. The pathology of boredom. Sc. Am. 1957 Jan; 196(1):52–57.
11. McCoy AW. Science in Dachaus shadow: HEBB, Beecher, and the development of CIA psychological
torture and modern medical ethics. J. Hist. Behav. Sci. 2007 Sep.; 43(4):401–17. https://doi.org/10.
1002/jhbs.20271 PMID: 17912716
12. Guenther L. Solitary confinement: Social death and its afterlives. Minneapolis: University of Minnesota
Press; 2013. 368 p.
13. Reiter K. 23/7: Pelican Bay prison and the rise of long-term solitary confinement. New Haven: Yale Uni-
versity Press; 2016. 312 p.
14. Lovell D. Patterns of disturbed behavior in a supermax population. Crim Justice Behav. 2008 Aug; 35
(8):985–1004.
15. Grassian S. Psychopathological effects of solitary confinement. Am J Psychiatry. 1983 Nov; 140
(11):1450–4. https://doi.org/10.1176/ajp.140.11.1450 PMID: 6624990
16. Grassian S, Friedman N. Effects of sensory deprivation in psychiatric seclusion and solitary confine-
ment. Intl J Law and Psychiatry. 1986 Jan 1; 8(1):49–65.
17. Hagan BO, Wang EA, Aminawung JA, Albizu-Garcia CE, Zaller N, Nyamu S, et al. History of solitary
confinement is associated with post-traumatic stress disorder symptoms among individuals recently
released from prison. J of Urban Health. 2018 Apr 1; 95(2):141–48.
PLOS ONE | https://doi.org/10.1371/journal.pone.0238510 October 9, 2020 17 / 20

PLOS ONE The body in isolation
18. O’Keefe ML, Klebe KJ, Stucker A, Sturm K, Leggett W. One year longitudinal study of the psychological
effects of administrative segregation. [Internet] Colorado Springs: Colorado Department of Corrections,
Office of Planning and Analysis; 2010. [cited 2020 July 14]. 150 p. Available at: https://www.ncjrs.gov/
pdffiles1/nij/grants/232973.pdf
19. Walters GD. Checking the Math: Do Restrictive Housing and Mental Health Need Add Up to Psycholog-
ical Deterioration?. Crim Justice Behav. 2018 Sep; 45(9):1347–62.
20. Reiter K, Ventura J, Lovell D, Augustine D, Barragan M, Blair T, et al. Psychological Distress in Solitary
Confinement: Symptoms, Severity, and Prevalence in the United States, 2017–2018. Am J Public
Health. 2020 Jan; 110(S1):S56–62. https://doi.org/10.2105/AJPH.2019.305375 PMID: 31967876
21. Ventura J, Lukoff D, Nuechterlein KH, Liberman RP, Green MF, Shaner A. Brief Psychiatric Rating
Scale (BPRS) expanded version (4.0): Scales, anchor points, and administration manual. Int J Methods
Psychiatr Res, 1993; 3: 227-244.
22. Nolan, D, Amico, C. Solitary by the Numbers [Internet]. Frontline; 2017 Apr 18 [cited on 2020 Jul 14].
Available from http://apps.frontline.org/solitary-by-the-numbers/
23. Wu Z, Schimmele CM. Racial/ethnic variation in functional and self-reported health. Am J Public Health.
2005 Apr; 95(4):710–16. https://doi.org/10.2105/AJPH.2003.027110 PMID: 15798134
24. Hummer RA. Black-white differences in health and mortality: A review and conceptual model. The
Sociological Quarterly. 1996 Jan 1; 37(1):105–25.
25. Lillie-Blanton M, Laveist T. Race/ethnicity, the social environment, and health. Soc Sci Med. 1996 Jul;
43(1):83–91. https://doi.org/10.1016/0277-9536(95)00337-1 PMID: 8816013
26. Western B. Punishment and inequality in America. New York, New York. Russell Sage Foundation;
2006. 264 p.
27. Williams DR, Collins C. US socioeconomic and racial differences in health: patterns and explanations.
Annu Rev Sociol. 1995 Aug; 21(1):349–86.
28. Rogers RG. Living and dying in the USA: sociodemographic determinants of death among blacks and
whites. Demography. 1992 May 1; 29(2):287–303. PMID: 1607053
29. Binswanger I. A., Redmond N., Steiner J. F., & Hicks L. S. Health disparities and the criminal justice sys-
tem: an agenda for further research and action. J Urban Health, 2012 Feb; 89(1):98–107. https://doi.
org/10.1007/s11524-011-9614-1 PMID: 21915745
30. Wildeman C, Wang EA. Mass incarceration, public health, and widening inequality in the USA. Lancet.
2017 Apr 8; 389(10077):1464–74. https://doi.org/10.1016/S0140-6736(17)30259-3 PMID: 28402828
31. Rich JD, Wakeman SE, Dickman SL. Medicine and the epidemic of incarceration in the United States.
N Engl J Med. 2011 Jun 2; 364(22):2081–83. https://doi.org/10.1056/NEJMp1102385 PMID: 21631319
32. Baillargeon J, Black SA, Pulvino J, Dunn K. The disease profile of Texas prison inmates. Ann Epidemiol.
2000 Feb 1; 10(2):74–80. https://doi.org/10.1016/s1047-2797(99)00033-2 PMID: 10691060
33. Solomon L, Flynn C, Muck K, Vertefeuille J. Prevalence of HIV, syphilis, hepatitis B, and hepatitis C
among entrants to Maryland correctional facilities. J Urban Health. 2004 Mar 1; 81(1):25–37. https://doi.
org/10.1093/jurban/jth085 PMID: 15047781
34. Ojikutu BO, Srinivasan S, Bogart LM, Subramanian SV, Mayer KH. Mass incarceration and the impact
of prison release on HIV diagnoses in the US South. PloS one. 2018 Jun 11; 13(6):e0198258. https://
doi.org/10.1371/journal.pone.0198258 PMID: 29889837
35. Massoglia M. Incarceration as exposure: the prison, infectious disease, and other stress-related ill-
nesses. J Health Soc Behav. 2008 Mar; 49(1):56–71. https://doi.org/10.1177/002214650804900105
PMID: 18418985
36. Houle B. The effect of incarceration on adult male BMI trajectories, USA, 1981–2006. J Racial Ethn
Health Disparities. 2014 Mar 1; 1(1):21–8. https://doi.org/10.1007/s40615-013-0003-1 PMID: 24812594
37. Maruschak LM. Medical Problems of Prisoners [Internet]. Washington DC: Bureau of Justice Statistics;
2008 Apr 28 [cited on 2020 Jul 14]. Available from https://bjs.gov/content/pub/pdf/mpp.pdf.
38. Baquero M, Zweig K, Angell SY, Meropol SB. Health behaviors and outcomes associated with personal
and family history of criminal justice system involvement, New York City, 2017. Am J Public Health.
2020 Mar(0):e1–7.
39. Fox AD, Anderson MR, Bartlett G, Valverde J, MacDonald RF, Shapiro LI, et al. A description of an
urban transitions clinic serving formerly incarcerated persons. J Health Care Poor Underserved. 2014
Feb; 25(1):376–82. https://doi.org/10.1353/hpu.2014.0039 PMID: 24509032
40. Nowotny KM, Kuptsevych-Timmer A. Health and justice: framing incarceration as a social determinant
of health for Black men in the United States. Sociol Compass. 2018 Mar; 12(3):e12566.
41. Tasca M, Turanovic J. Examining race and gender disparities in restrictive housing placement. Wash-
ing D.C. (US): National Institute of Justice; 2018. 21 p. Report No.: 252062.
PLOS ONE | https://doi.org/10.1371/journal.pone.0238510 October 9, 2020 18 / 20
PLOS ONE The body in isolation
42. Cloud DH, Drucker E, Browne A, Parsons J. Public health and solitary confinement in the United States.
Am J Public Health. 2015 Jan; 105(1):18–26. https://doi.org/10.2105/AJPH.2014.302205 PMID: 25393185
43. Schlanger M. Prison segregation: Symposium introduction and preliminary data on racial disparities.
Mich. J. Race & L. 2012; 18(1):241–50.
44. Reiter KA. Parole, snitch, or die: California’s supermax prisons and prisoners, 1997–2007. Punishm
Soc. 2012 Dec; 14(5):530–63.
45. Williams BA, Li A, Ahalt C, Coxson P, Kahn JG, Bibbins-Domingo K. The cardiovascular health burdens
of solitary confinement. J Gen Intern Med. 2019 Oct 1; 34(10):1977–80. https://doi.org/10.1007/
s11606-019-05103-6 PMID: 31228050
46. Dye MH. Deprivation, importation, and prison suicide: combined effects of institutional conditions and
inmate composition. J Crim Justice. 2010 Jul 1; 38(4):796–806.
47. Kaba F, Lewis A, Glowa-Kollisch S, Hadler J, Lee D, Alper H, et al. Solitary confinement and risk of self-
harm among jail inmates. Am J Public Health. 2014 Mar; 104(3):442–7. https://doi.org/10.2105/AJPH.
2013.301742 PMID: 24521238
48. Lobel J, Akil H. Law & neuroscience: The case of solitary confinement. Daedalus. 2018 Oct;1; 47(4):61–75.
49. Zigmond MJ, Smeyne RJ. Use of animals to study the neurobiological effects of isolation. In: Lobel J,
Smith PS, editors. Solitary confinement: Effects, practices, and pathways toward reform. New York:
Oxford University Press; 2020. [cited 2020 Jul 14]. Chapter 13.
50. Stahn AC, Gunga HC, Kohlberg E, Gallinat J, Dinges DF, Kuhn S. Brain changes in response to long
Antarctic expeditions. N Engl J Med. 2019 Dec 5; 381(23):2273–5. https://doi.org/10.1056/
NEJMc1904905 PMID: 31800997
51. Smith DG. Neuroscientists make a case against solitary confinement: prolonged social isolation can do
severe, long-lasting damage to the brain. Scientific American: Mind. 2018 Nov 9 [cited 2020 Jul 14].
Available from: https://www.scientificamerican.com/article/neuroscientists-make-a-case-against-
solitary-confinement/
52. Ranapurwala SI, Shanahan ME, Alexandridis AA, Proescholdbell SK, Naumann RB, Edwards D Jr,
et al. Opioid overdose mortality among former North Carolina inmates: 2000–2015. Am J Public Health.
2018 Sep; 108(9):1207–13. https://doi.org/10.2105/AJPH.2018.304514 PMID: 30024795
53. Wildeman C, Andersen LH. Solitary confinement placement and post-release mortality risk among for-
merly incarcerated individuals: a population-based study. Lancet Public Health. 2020 Feb 1; 5(2):e107–
13. https://doi.org/10.1016/S2468-2667(19)30271-3 PMID: 32032555
54. Brinkley-Rubinstein L, Sivaraman J, Rosen DL, Cloud DH, Junker G, Proescholdbell S, et al. Associa-
tion of restrictive housing during incarceration with mortality after release. JAMA Netw Open. 2019 Oct
2; 2(10):e1912516. Available from: https://jamanetwork.com/journals/jamanetworkopen/article-
abstract/2752350 https://doi.org/10.1001/jamanetworkopen.2019.12516 PMID: 31584680
55. Kaeble D, Cowhig M. Correctional populations in the United States, 2016. Washington, DC: Depart-
ment of Justice, Office of Justice Programs, Bureau of Justice Statistics; 2018. 14 p. Report No.: NCJ
251211.
56. Phipps PA, Gagliardi GJ. Washington’s dangerous mentally ill offender law: program selection and ser-
vices: Interim Report. Olympia, WA: Washington State Institute for Public Policy; 2003 May. 37 p.
Report No.: 03-05-1901.
57. Rhodes LA. Pathological effects of the supermaximum prison. Am J of Public Health. 2005 Oct; 95
(10):1692–5.
58. Peterson M, Chaiken J, Ebener P, Honig P. Survey of prison and jail inmates. Santa Monica, CA: The
Rand Corporation. 1982 Nov. Report No.: N-1635-NIJ.
59. Calavita K, Jenness V. Appealing to Justice: Prisoner Grievances, Rights, and Carceral Logic, Berke-
ley, CA: University of California Press; 2014.
60. Kleschinsky JH, Bosworth LB, Nelson SE, Walsh EK, Shaffer HJ. Persistence pays off: follow-up meth-
ods for difficult-to-track longitudinal samples. Journal of studies on alcohol and drugs. 2009 Sep; 70
(5):751–61. https://doi.org/10.15288/jsad.2009.70.751 PMID: 19737500
61. Western B, Braga A, Hureau D, Sirois C. Study retention as bias reduction in a hard-to-reach popula-
tion. Proceedings of the National Academy of Sciences. 2016 May 17; 113(20):5477–85.
62. Reiter K, Sexton L, Sumner J. Theoretical and empirical limits of Scandinavian Exceptionalism: Isolation
and normalization in Danish prisons. Punishment & Society, 2017; 20(1): 92–112.
63. Charmaz K. Constructing Grounded Theory: A Practical Guide through Qualitative Analysis. Thousand
Oaks, CA: Sage Publications; 2006.
64. Chun Tie Y, Birks M, Francis K. Grounded theory research: A design framework for novice researchers.
SAGE open medicine. 2019 Jan; 7:1–8.
PLOS ONE | https://doi.org/10.1371/journal.pone.0238510 October 9, 2020 19 / 20

PLOS ONE The body in isolation
65. Berzofsky M. and Zimmer S. 2018 National Inmate Survey (NIS-4): Sample Design Evaluation and Rec-
ommendations. Washington, D.C.: U.S. Department of Justice, Bureau of Justice Statistics, 2017.
66. Nwosu BU, Maranda L, Berry R, Colocino B, Flores CD Sr, Folkman K, et al. The vitamin D status of
prison inmates. PloS one. 2014 Mar 5; 9(3):e90623. https://doi.org/10.1371/journal.pone.0090623
PMID: 24598840
67. Pont J, Enggist S, Stover H, Williams B, Greifinger R, Wolff H. Prison health care governance: guaran-
teeing clinical independence. American journal of public health. 2018 Apr; 108(4):472–6. https://doi.org/
10.2105/AJPH.2017.304248 PMID: 29470125
68. Brosschot JF, Gerin W, Thayer JF. The perseverative cognition hypothesis: A review of worry, pro-
longed stress-related physiological activation, and health. Journal of psychosomatic research. 2006
Feb 1; 60(2):113–24. https://doi.org/10.1016/j.jpsychores.2005.06.074 PMID: 16439263
69. Stemmet L, Roger D, Kuntz J, Borrill J. Ruminating about the past or ruminating about the future—
which has the bigger impact on health? An exploratory study. Current Psychology. 2018 Jan 13 1–7.
70. Laws B, Crewe B. Emotion regulation among male prisoners. Theoretical Criminology. 2016 Nov; 20
(4):529–47.
71. Greer K. Walking an emotional tightrope: Managing emotions in a women’s prison. Symbolic Interac-
tion. 2002 Feb; 25(1):117–39.
72. Choudhry K, Armstrong D, Dregan A. Prisons and Embodiment: Self-Management Strategies of an
Incarcerated Population. Journal of Correctional Health Care. 2019 Oct; 25(4):338–50. https://doi.org/
10.1177/1078345819880240 PMID: 31722608
73. Western B. Homeward: Life in the year after prison. Russell Sage Foundation; 2018 May 4.
74. U.S. Census Bureau, Population Division. Annual Estimates of the Resident Population by Sex, Age,
Race, and Hispanic Origin for the United States and States: April 1, 2010 to July 1, 2017. 2018 Jun
75. Lum K, Swarup S, Eubank S, Hawdon J. The contagious nature of imprisonment: an agent-based
model to explain racial disparities in incarceration rates. Journal of the Royal Society Interface. 2014
Sep 6; 11(98):20140409.
76. Dumont DM, Brockmann B, Dickman S, Alexander N, Rich JD. Public health and the epidemic of incar-
ceration. Annual review of public health. 2012 Apr 21; 33:325–39. https://doi.org/10.1146/annurev-
publhealth-031811-124614 PMID: 22224880
77. Zhang Y, Hou F, Li J, Yu H, Li L, Hu S, et al. The association between weight fluctuation and all-cause
mortality: A systematic review and meta-analysis. Medicine. 2019 Oct; 98(42).
78. Sørensen TI, Rissanen A, Korkeila M, Kaprio J. Intention to lose weight, weight changes, and 18-y mor-
tality in overweight individuals without co-morbidities. PLoS medicine. 2005 Jun 28; 2(6):e171. https://
doi.org/10.1371/journal.pmed.0020171 PMID: 15971946
79. Blyth FM, Briggs AM, Schneider CH, Hoy DG, March LM. The global burden of musculoskeletal pain—
where to from here?. American journal of public health. 2019 Jan 01; 09(1):35–40.
80. Patler C, Sacha JO, Branic N. The black box within a black box: Solitary confinement practices in a sub-
set of U.S. immigrant detention facilities. Journal of Population Research. 2018 Dec 35;4. https://doi.
org/10.1007/s12546-018-9209-8
81. Andasheva F. Aren’t I a Woman: Deconstructing Sex Discrimination and Freeing Transgender Women
from Solitary Confinement. FIU L. Rev. 2016; 12:117.
82. Knittel AK. Resolving health disparities for women involved in the criminal justice system. North Carolina
medical journal. 2019 Nov 01; 80(6):363–6. https://doi.org/10.18043/ncm.80.6.363 PMID: 31685574
83. Hawkley Test., Ashker v. Governor of California, No. 4:09-cv-05796-CW (N.D. California, 2015).
84. Sexton L. Penal subjectivities: Developing a theoretical framework for penal consciousness. Punish-
ment & Society. 2015 Jan; 17(1):114–36.
85. Crewe B, Warr J, Bennett P, Smith A. The emotional geography of prison life. Theoretical Criminology.
2014 Feb; 18(1):56–74.
86. Corcoran MS. Spectacular suffering: Transgressive performance in penal activism. Theoretical Crimi-
nology. 2019 Jan 11; https://doi.org/10.1177/1362480618819796
87. Glowa-Kollisch S, Graves J, Dickey N, MacDonald R, Rosner Z, Waters A, et al. Data- driven human
rights: using dual loyalty trainings to promote the care of vulnerable patients in jail. Health Hum Rights.
2015 Jun 1; 17(1):124–35.
88. Blair TR, Reiter KA. Letter to the editor and author response: Solitary confinement and mental illness.
Perspectives. 2015 Jul; 2.
89. Cloud D, Augustine D, Ahalt C, Williams B. The ethical use of medical isolation–not solitary confine-
ment–to reduce COVID-19 transmission in correctional settings. AMEND. 2020 April.
PLOS ONE | https://doi.org/10.1371/journal.pone.0238510 October 9, 2020 20 / 20
E: AMERICAN JOURNAL OF PUBLIC HEALTH ARTICLE
See next page
112

AJPH OPEN-THEMED RESEARCH
Psychological Distress in Solitary Confinement: Symptoms, Severity, and Prevalence in the United States, 2017–2018
Keramet Reiter, PhD, JD, Joseph Ventura, PhD, David Lovell, PhD, MSW, Dallas Augustine, MA, Melissa Barragan, MA, Thomas Blair, MD, MS, Kelsie Chesnut, MA, Pasha Dashtgard, MA, EdM, Gabriela Gonzalez, MA, Natalie Pifer, PhD, JD, and Justin Strong, MA
Objectives. To specify symptoms and measure prevalence of psychological distress among incarcerated people in long-term solitary confinement.
Methods. We gathered data via semistructured, in-depth interviews; Brief Psychiatric
Rating Scale (BPRS) assessments; and systematic reviews of medical and disciplinary files for 106 randomly selected people in solitary confinement in the Washington State
Department of Corrections in 2017. We performed 1-year follow-up interviews
and BPRS assessments with 80 of these incarcerated people, and we present the
results of our qualitative content analysis and descriptive statistics. Results. BPRS results showed clinically significant symptoms of depression, anxiety, or
guilt among half of our research sample. Administrative data showed disproportionately
high rates of serious mental illness and self-harming behavior compared with general prison populations. Interview content analysis revealed additional symptoms, including
social isolation, loss of identity, and sensory hypersensitivity. Conclusions. Our coordinated study of rating scale, interview, and administrative data
illustrates the public health crisis of solitary confinement. Because 95% or more of all incarcerated people, including those who experienced solitary confinement, are even-tually released, understanding disproportionate psychopathology matters for de-veloping prevention policies and addressing the unique needs of people who have
experienced solitary confinement, an extreme element of mass incarceration. (Am J
Public Health. 2020;110:S56–S62. doi:10.2105/AJPH.2019.305375)
few procedural protections, limited available alternative responses, and no external over-sight.2 Researchers and policymakers are therefore limited not only in access to data and populations, but also by these populations’ fluidity.
A standard instrument for assessing psy-chological impacts of incarceration is the Brief Psychiatric Rating Scale (BPRS). Originally developed to rate the severity of symptoms in hospitalized psychiatric patients and track changes in status over time,13,14 the BPRS is increasingly used for research within carceral settings.12,15,16,17 The current scale assesses 24 observable or self-reported symptoms. Extensive research on the BPRS’s reliability and validity confirms its efficacy in identify-ing indicators of serious mental illness.14
In Washington State, interviewers ad-ministered the BPRS to a random sample of 87 incarcerated people during qualitative interviews (and also conducted 122 medical chart reviews),1,9,15 concluding that solitary confinement reveals “a concentration of some of the most important negative effects of the entire prison complex.”1(p1692) In a widely cited subsequent study, in Colorado, the BPRS was included in a battery of tests designed to measure psychological “con-structs” associated with solitary confinement (for 270 matched participants), but generated
Long-term solitary confinement expanded across the United States in the 1980s; by
1997, nearly every state had built a “super-max,” creating an estimated total of 20 000 new solitary cells.1,2 Human rights agencies characterize the practice as torture3,4; policy analysts criticize it as expensive and ineffec-tive.2,4 Yet the epidemiological basis for understanding solitary confinement is weak. Current estimates of the annual US solitary confinement population vary from 80 000 to 250 000.5,6 Likewise, the conditions (how much isolation with how few privileges), purposes (discipline, protection, or institu-tional security), and labels (administrative segregation, supermax, restrictive housing, intensive management) defining solitary confinement are contested.2,5,6 Many studies document psychological harms of
S56 Research Peer Reviewed Reiter et al.
segregation, including associations between solitary confinement and self-harm, anxiety, depression, paranoia, and aggression, among other symptoms,7–9 but other recent find-ings suggest that psychological impacts are limited.10–12 Correctional officials use solitary confinement at their discretion, often with
ABOUT THE AUTHORS Keramet Reiter is with the Department of Criminology, Law, and Society and the School of Law, University of California, Irvine. Joseph Ventura is with the Department of Psychiatry and Biobehavioral Sciences, University of California, Los Angeles. David Lovell is with the School of Nursing, University of Washington, Seattle. Dallas Augustine, Melissa Barragan, Kelsie Chesnut, and Gabriela Gonzalez are doctoral candidates in the Department of Criminology, Law, and Society, University of California, Irvine. Thomas Blair is with the Department of Psychiatry, Southern California Permanente Medical Group, Downey. Pasha Dashtgard is a doctoral student in the Department of Psychological Science, University of California, Irvine. Natalie Pifer is with the Department of Criminology and Criminal Justice, University of Rhode Island, Kingston. Justin Strong is a doctoral student in the Department of Criminology, Law, and Society, University of California, Irvine.
Correspondence should be sent to Keramet Reiter, 3373 Social Ecology II, Irvine, CA 92697 (e-mail: [email protected]). Reprints can be ordered at http://www.ajph.org by clicking the “Reprints” link.
This article was accepted September 5, 2019. doi: 10.2105/AJPH.2019.305375
AJPH Supplement 1, 2020, Vol 110, No. S1

AJPH OPEN-THEMED RESEARCH
few reliable results. The study relied on a pencil-and-paper test, the Brief Symptom Inventory, “a 53-item self-report measure . . . to assess a broad range of psychological symptoms,” and concluded that people in solitary confinement sometimes experienced improvements in their psychological well-being, and those with mental illnesses did not deteriorate over time.11(p52)
Our study builds on these investigations, relying not only on psychometric instruments but also on mental and physical health and dis-ciplinary records and in-depth interview data to assess the psychological well-being of 106 ran-domly sampled incarcerated people in long-term solitary confinement in the Washington State Department of Corrections (WADOC) from 2017 to 2018. Triangulation of sources gives this study a robust basis for understanding the psy-chological effects of solitary confinement.
METHODS WADOC is a midsized (39th highest rate
of incarceration in the United States), fully state-funded correctional system with a long history of inviting academic researchers to independently evaluate carceral practice.1,9,18,19
Fieldwork was conducted over 2 separate 3-week periods in the summers of 2017 and 2018, by a total of 13 research team mem-bers (9 women and 4 men) all affiliated with the University of California, Irvine. In total, 106 incarcerated people were inter-viewed in 2017, and 80 incarcerated people were reinterviewed in 2018. We also collected medical and disciplinary data, including serious mental illness (SMI) and self-harm data.
Sample and Data Collections WADOC has 5 geographically dispersed
intensive management units (IMUs); people in these all-male units have usually violated an in-prison rule and are in solitary confinement for durations ranging from months to years, with highly restricted access to phones, radios, televisions, time out of cell, and visitors. As a result of WADOC efforts to reform and re-duce IMU use, the population in these units fluctuated, with a high of more than 600 (in 2011) to a low of 286 incarcerated people (in 2015) on “maximum custody” status: for indeterminate terms, contingent on meeting
specific benchmarks.20 In 2017, when the initial sample for this research was drawn, there were 363 maximum custody status people assigned to the IMU.
We selected participants from a randomly ordered list in proportion to the population of each IMU, accounting for 29% of the total population in each of the 5 units. For recruitment and consent processes, see Ap-pendix A (available as a supplement to the online version of this article at http://www. ajph.org). The interview refusal rate was 39% (67 out of 173 approached), comparable to similar studies of incarcerated people.9,21
The 96-question semistructured interview instrument included a range of questions used in previous studies on incarcerated people’s experiences,22,23 covering condi-tions of daily life, physical and mental health treatment, and IMU programming. BPRS self-report items were embedded throughout the interview; we evaluated observational items immediately following each in-terview.24 Interviews lasted between 45 minutes and 3 hours.
Following interviews, participants were given an option to consent to medical file reviews and to participate in 1-year follow-up interviews. All participants consented to rein-terviews, and all but 2 participants (n = 104) consented to medical file reviews. Following year-1 interviews, WADOC provided elec-tronic administrative health and disciplinary files for all 104 consenting participants (along with comparable, population-level data for the prison system in 2017).
In summer 2018, the research team returned to Washington and reconsented and reinterviewed every available participant —notably including those no longer housed in the IMU—for a total of 80 reinterviews. Because of refusals (n = 4), institutional trans-fers and parole (n = 21), and 1 death, we were unable to follow-up with 26 respondents (25%). This drop-out rate is low compared with similar studies.25,26 Follow-up interviews lasted between 45 minutes and 2 hours. The condensed year-2 instrument contained ap-proximately 70 questions, with variation by current housing status.
For the steps taken to protect vulnerable imprisoned research participants and details of the training research team members com-pleted, establishing high interrater reliability in administering the BPRS,24 see Appendix A
(available as a supplement to the online version of this article at http://www. ajph.org).
Data Analysis All interviews were assigned a randomly
generated identifier, digitally recorded, transcribed in Microsoft Word (Microsoft Corporation, Redmond, WA), translated (1 interview was conducted in Spanish), systematically stripped of identifying details (names, dates of birth), and entered into Atlas-ti (ATLAS.ti Scientific Software De-velopment GmbH, Berlin, Germany) for analysis. See Appendix A for an explanation of the thematically grounded, open-coding process.27 We entered all BPRS paper rating sheets, completed following year-1 and year-2 interviews, into Microsoft Excel (Microsoft Corporation, Redmond, WA). We linked each participant’s BPRS rating, by random identifier, to extracted data from qualitative interviews, medical file reviews, and administrative data from WADOC.
Relevant variables extracted from ad-ministrative health data included SMI, a critical classification because it implies that treatment is medically necessary and, there-fore, is an obligation of the prison system while the person is under its care. WADOC operationally defines SMI by standardized criteria combining diagnosis, medication, and frequency of psychiatric encounters, and history of suicide attempts or other self-harm.
We then imported BPRS and other administrative data into SPSS version 26 (IBM, Armonk, NY) to generate descriptive statistics, including prevalence of clinically significant ratings on BPRS items and factors (subscales of co-occurring symptom groups), including positive symptoms (un-usual thought content, hallucinations, con-ceptual disorganization), negative symptoms (blunted affect, emotional withdrawal, motor retardation), depression-anxiety-guilt symptoms (including somatic concerns; DAGS), and mania (excitability, elevated mood, hyperactivity, distractibility).14 We ran correlational analyses (cross-tabs and t test) to evaluate the relationships between BPRS ratings and other independent assess-ments of well-being, such as existing diagnosis of SMI.
Supplement 1, 2020, Vol 110, No. S1 AJPH Reiter et al. Peer Reviewed Research S57

—
AJPH OPEN-THEMED RESEARCH
RESULTS See Table 1 for summary characteristics of
the all-male participant population (there are
TABLE 1 Characteristics of Sample of People in Solitary Confinement Compared With General Prison Population: Washington State Department of Corrections, 2017
no women in IMUs in WADOC) and the IMU Population (n = 106) General Population (n = 16 465)a
general WADOC population. As in other Age, y studies of solitarily confined incarcerated Mean 35 40 people,6 our sample was generally younger, Median 34 38 more violent (in terms of criminal history), and Range 20–65 18–94 serving longer sentences than those in the general population. Latinos and gang affiliates are both overrepresented in our IMU sample, likely because of the salience of conflicts among rival Latino factions as an institutional security concern.2 Although our IMU par-ticipants differed from the general prison population, there were no significant differences in either demographic variables or criminal history characteristics between our random
Race/ethnicity, % (no.)
White
African American
Latino
Other
IMU length of stay
Mean
Median
Range
42 (44)
12 (12)
23 (24)
23 (24)
14.5 mo
6 mo
< 1 wk–151 mo
59 (9746)
18 (2935)
14 (2276)
9 (1508)
. . .
. . .
. . .
sample and the overall IMU population, Current offense category, % (no.)
except that our participant pool was slightly Murder and manslaughter 17 (18) 16 (2623)
older than the overall IMU population. Sex offenses 12 (13) 19 (3195)
Robbery and assault 57 (60) 34 (5608)
Property offenses 8 (9) 18 (2933) Range and Prevalence of Drugs or other 6 (6) 13 (2106)
Psychological Symptoms Identified Prison convictionsb
Our initial sample of 106 participants had a Mean 5 4 mean BPRS rating of 37 and a median rating Median 4 3 of 33 (possible range from 24 to 168), sug- Range 1–18 1–27 gesting mild psychiatric symptoms among the study population at the time of our inter-views.14 However, analysis of individual scale items showed clinically significant ratings (of 4 or higher of a possible 7) for as much as one quarter of the population sampled, especially for the depression and anxiety symptoms (Table 2). Further analysis of BPRS factors, as opposed to individual items, provided
Prison length of stay, mo
Mean
Median
Range
Ever in prison gang,c % (no.)
Yes
No
Missing
103
72
3–456
60 (64)
36 (38)
4 (4)
97
45
2–600
32 (5410)
68 (11 659)
. . .
additional evidence of clinically significant Serious mental illness,d % (no.) 19 (16) 9 (1589)
psychiatric distress in as much as half of the Self-harm attempt,e % (no.) 18 (17) Not available population sampled (i.e., DAGS factor; Suicide attempt,e % (no.) 22 (22) Not available Table 2).
Administrative data support the finding Note. IMU = intensive management unit.
of long-term psychological distress. Among aGeneral population data excludes 761 categories returned to prison for techn
nonsentenced and 718 resentencical violations of conditions on un
ed incarcerated people. Both derlying drug or sex offenses,
our respondents, 19% had SMI designations, a politically selective and narrow set of offenses that would distort the general population primary
22% had a documented suicide attempt, and offense profile.
18% had documentation of other self-harm, bNumber of convictions to prison, excluding out-of-state convictions, often significant for IMU residents.
all at some point during their incarceration, cGang status was self-reported. Figure is calculated from 102 respondents
ided for 85 respondents; figure i
who disclosed this information.
either before or during their time in the IMU dSerious mental illness data were prov s calculated from this sample.
(Table 1). Moreover, respondents with SMI eSelf-harm and suicide data were provided for 94 respondents; figure is calculated from this sample.
designations were much more likely to re-port positive symptoms and slightly more likely to report all other factored symptoms Qualitative interview data revealed and will be considered exhaustively in sub-than non-SMI respondents (Table 3). These symptoms not otherwise captured by the sequent analyses). Two classes of symptoms
ndents:findings support the validity of the BPRS BPRS and medical files. (Such data will be were reported by a majority of respoassessments. used illustratively here, for reasons of space, descriptions of the severity of the emotional
S58 Research Peer Reviewed Reiter et al. AJPH Supplement 1, 2020, Vol 110, No. S1

—
–
—
–
TABLE 2 Brief Psychiatric Rating Scale Symptom and Factor Prevalence: Washington State Department of Corrections, 2017 2018
IMU 2017 (n = 106), % (No.) IMU 2018 (n = 28), % (No.) Non-IMU 2018 (n = 52), % (No.)
Symptomsa
Depression 24.50 (26)
Anxiety 24.50 (26)
Somatic concern 15.10 (16)
Guilt 17.90 (19)
Hostility 11.30 (12)
Hallucinations 9.40 (10)
Excitement 10.40 (11)
25.00 (7) 15.38 (8)
32.14 (9) 28.85 (15)
21.43 (6) 7.69 (4)
17.86 (5) 7.69 (4)
17.86 (5) 17.31 (9)
14.29 (4) 11.54 (6)
14.29 (4) 7.69 (4)
Factorsb
Positive 16.00 (17) 17.86 (5) 11.54 (6) stitution taking over their identity:
Negative 4.70 (5) 0 (0) 1.92 (1) I’ve been in the hole so long that it defines the DAGS 49.10 (52) 53.57 (15) 36.54 (19) person. If you’ve been in the box for so long, you Mania 17.00 (18) 14.81 (4) 17.31 (9) can’t play well with others. . . . We’re so confined
Note. DAGS = depression, anxiety, guilt, and somatization; IMU = intensive management unit; in that box. It’s like a safety blanket. (Eli).
mania = elevated memotional withdrawal, and motor retarand conceptual disorganization. aOnly clinically significant symptoms (raof the sample are presented.
ood, distractibility, motor hyperactivity, and excitement; dation; positive = hallucinations, unu
ting of 4 or higher) that were repor
negative = blunted affect, sual thought content,
ted by 10% or more
Another respondent echoed a frequent complaint about the lack of mirrors con-tributing to the loss of identity:
bFactors combine 3
toll of being in the cumulatively, the times) and feeling
or 4 different symptoms that are
IMU (80% of respondents; topic was mentioned 359 s of social isolation (73%
commonly associated
And this quotatiisolation:
You’re not around
with one another.14
on exemplifies social
people. I’m around
This IMU has mirrors in the cell. The majority of them do not. And it gets really stressful when you can’t even see your own reflection. . . . I mean when you can’t even look at yourself, you lose some of your self-identity. (Eric)
of respondents; cmentioned 192 ticerpt exemplifies descriptions:
I bet you couldn’t the stuff you got tpain. There’s a lo[and] I’ve been doadapt to their surrthis life, I don’t [tpseudonym, as wi
TABLE 3 SerioPrevalence: Was
Positive
Negative
DAGS
umulatively, the t
the “emotional t
walk in my shoes beo endure behind these walls of t you got to go through . . . ing this for 11 years . . oundings, but to get hink] you can. (Michth all subsequent qu
us Mental Illness Shington State De
SMI (n
opic was mes). This interview ex-
oll”
cause all
. people used to ael, a otations)
tatus and 20partment of
= 16), % (No
50 (8)
6.30 (1)
56.30 (9)
somebody right noand shackles on like dehumanizing. No human being, I feel land it does have an while you’re sitting
Two additional alent as other clinicitems like anxiety: hypersensitivity (16
17 Brief Psychiatric
.)
w with handcuffs I’m an animal. It’s human contact. As [a] ike we’re meant to socialize, effect on your mentality in the cell. (Chase)
symptoms were as prev-ally significant BPRS references to sensory % of respondents
Rating Scale Factor Corrections, 2017 2018
Non-SMI (n = 69), % (No
10.14 (7)
4.40 (3)
47.80 (33)
Comparing Symptoms in and out of Solitary Confinement (2018)
Of the 80 respondents reinterviewed in the second year of this study, 28 were in IMU custody and 52 were in the general prison population. These 2 subpopulations provide important comparison groups between IMU residents and people in the general popula-tion, because all initially entered the study through a random sample of IMU residents. These subpopulations also provide a longi-tudinal view of how incarcerated people experience IMU conditions over 1 year and how they recover from these conditions .) as they re-enter the general population. In Table 2, we compare, cumulatively by sub-population, symptom and factor scores in 2017 for IMU residents to 2018 scores for
Mania
Populationa
Note. DAGS = deprehyperactivity, and excitement; negative positive = hallucinatmental illness. aMental health data
ssion, anxiety, guilt,
18.75 (3)
18.80 (16)
= blunted affeht content, anions, unusual thoug
were available only for 85 of 10
and somatization; mania = elevated mct, emotional withdrawd conceptual disorgan
13 (9)
81.20 (69)
ood, distractibility, motor al, and motor retardation; ization; SMI = serious
6 sampled incarcerated people.
IMU respondents and respondents not in the IMU. For respondents still in the IMU in 2018, all clinically significant symptoms that were prevalent among at least 10% of the pop-ulation were at least as prevalent in 2018, and 2 clinically significant factor scores were more prevalent (positive, DAGS). For respondents
Supplement 1, 2020, Vol 110, No. S1 AJPH Reiter et al. Peer Reviewed Research S59
AJPH OPEN-THEMED RESEARCH
mentioned this at least once) and loss of identity (25% of respondents mentioned this at least once). Respondents discussed hy-persensitivity to sounds, smells, “[and . . .] tiny things” (Giovanni). In particular, the sounds of doors opening and closing aggravated many respondents:
All you got to do is hold it. I mean, you don’t got to slam it. It’s like [correctional officers] showing their power. . . . That ain’t cool. You wouldn’t do that in your house, would you? (Tyler).
Respondents also talked about the in-

AJPH OPEN-THEMED RESEARCH
not in the IMU in 2018, the prevalence of clinically significant symptoms varied from more prevalent than in the 2017 sample (e.g., anxiety) to less prevalent (e.g., somatic con-cerns and guilt), and factor scores were either lower (i.e., positive, negative, DAGS) or similar (for mania) for respondents not in the IMU in 2018. Despite having an excep-tionally large sample size for a study of a solitary confinement population, our study was not powered to establish statistically significant dif-ferences between the 2017 and 2018 data sets.
DISCUSSION In this study, we combined qualitative
interview data with structured, quantitative measures of psychological and psychiatric outcomes in solitary confinement among 106 randomly sampled incarcerated people in Washington State, documenting both a wide range and high prevalence of symptoms of psychological distress. We highlight 4 major implications of this.
First, while the overall BPRS ratings we analyzed indicated limited psychological distress, as documented in earlier studies,11,12
a closer examination of specific items and factors revealed that as many as half of re-spondents had at least 1 clinically significant symptom within the BPRS anxiety–depression factor. Because other studies using the BPRS in solitary confinement settings employed earlier 18-item versions of the scale,15 used the scale in combination with other scales,11 or analyzed only total ratings,12 our findings are not directly comparable with those in other BPRS studies. However, our findings are consistent with other studies, including findings that 20% or more of Washington incarcerated people in solitary exhibited a “marked or severe degree of distress,”15(p774) and that more than half of California incarcerated people in soli-tary reported “symptoms of psychological distress.”28(p133) Our findings therefore high-light the importance of analyzing specific components of BPRS scores, and not only aggregates, which mask variation in both prevalence and severity of specific symptoms.
Second, administrative data confirmed that our participants had relatively high rates of documented mental health problems, including rates of SMI and self-harming behavior (Table 1). SMI rates, typically
estimated at 10% to 15% of prison pop-ulations,8,29 are measured at 9% in Wash-ington’s general prison population but 20% in our IMU sample. Likewise, our qualitative data confirmed that people in solitary con-finement experience symptoms specific to those conditions not captured in standard psychiatric assessment instruments.30 Both findings suggest an affirmative answer to the question of whether solitary confinement is associated with more and worse psycho-pathology than general population confine-ment. As longitudinal case studies have illustrated,9,30 disproportionate representa-tion of incarcerated people with psychopa-thology in solitary confinement reflects the interaction of clinical and security factors in prison custody decisions: solitary confine-ment responds to behavior expressing psy-chopathology, often undiagnosed, and also aggravates the propensity of some incarcer-ated people to break down or act out.31 For these reasons, the causal role of solitary confinement is not established by aggre-gate comparisons of IMU and non-IMU populations.
Third, the comparisons we were able to make across multiple sources of data allowed us to identify a broader range of symptoms of distress than studies that have focused on only 1 or 2 sources of data, such as administrative data,8 psychiatric assessments,11 or qualitative interviews.28,30 Symptoms such as anxiety and depression were especially prevalent in this population, along with symptoms os-tensibly specific to solitary confinement, such as sensory hypersensitivity and a perceived loss of identity (as found in other studies exploring solitary-specific symptoms7,9,15,28,30,32).
Finally, consistent with previous studies,11,12
we found that the prevalence of psychiatric distress did not significantly increase over time for incarcerated people that either stay or are released from the IMU 1 year later. Yet our qualitative data suggest that the BPRS may not be capturing actual psychopathology, as re-spondents pointed to psychiatric distress—in profoundly existential terms, as in the pre-viously mentioned quotations regarding selfhood and identity—beyond the 2-week time period evaluated by the BPRS and outside the scope of the instrument. More-over, although symptoms were not cumula-tively found to worsen, they did persist at high rates, for incarcerated people in and out of the
IMU, in 1-year follow-up assessments. These latter findings are also consistent with other studies, underscoring the need for additional research comparing incarcerated people’s ex-periences across different contexts and over time.1,7,15,28,32
Limitations Five specific limitations are especially
notable. First, although our initial sample was relatively large for a solitary confinement population, our 1-year follow-up group, especially the number of respondents remaining in solitary confinement in the second year, was relatively small, limiting our ability to establish statistically significant findings about change over time and across contexts from BPRS data. Second, as our interview results revealed, the BPRS does not capture the full spectrum of psychiatric distress incarcerated people experience in solitary confinement. Third, assessments of psycho-logical well-being would ideally occur at multiple times, beyond the 2 we were able to conduct within the constraints of this mul-timethod study. Fourth, Washington State is not representative of most state prison systems in terms of the prevalence of people with mental illnesses in solitary confinement, as WADOC has undertaken reforms in both treatment of mental illness and imposition of solitary confinement over the past 20 years, including reforms designed to divert people with serious mental illness to specialized treatment units.33 Moreover, these reforms have radically improved systematic mental health record-keeping; we would expect not only a lower prevalence of psychiatric symp-toms and less deterioration in WADOC in IMUs but also a higher rate of documentation of those symptoms that are present. Finally, although people in solitary confinement may exhibit distinctive or disproportionately severe psychopathology, causal inference regarding the relationship between solitary confinement and psychopathology is beyond the analysis we are able to perform here.
Conclusions and Implications We found a wide range and high preva-
lence of symptoms of psychiatric distress in this population, including BPRS symptoms associated with anxiety and depression among
S60 Research Peer Reviewed Reiter et al. AJPH Supplement 1, 2020, Vol 110, No. S1

AJPH OPEN-THEMED RESEARCH
as many as half of our participants, adminis-trative indicators of SMI among at least one fifth of our participants, and condition-specific symptoms, such as feelings of extreme social isolation, in well more than half of our participants. Moreover, these symptoms persisted in the second year for participants in and out of solitary confinement.
If we study people in solitary confinement solely with instruments validated with non-incarcerated populations, such as the BPRS, we may fail to capture the extent of incare-cerated people’s psychological distress. A re-spondent’s rating on a given symptom may not be “high enough”; symptoms may not be experienced within the instrument’s desig-nated time frame; or the discursive strategies incarcerated people use to articulate their suffering might not correspond with clinical language. Moreover, past research reveals that incarcerated people develop coping mecha-nisms for solitary,1,2,32 and these, along with the fact that speaking openly about psycho-logical distress conflicts with institutional norms of self-protection in prison,1,2,30 likely contribute to a systematic underreporting of distress. These are critical limitations of standardized assessments of incarcerated people whose symptoms may fluctuate sub-stantially in presence and severity during time in solitary.1,7,32 Apart from symptoms or their severity, this fluctuation, itself, is an integral aspect of incarcerated people’s psychological distress,34 but a need for repeated measure-ment makes it especially difficult to capture.
Our findings still point to the importance of using standardized instruments, which provide a baseline for assessing and inter-preting the psychological effects of solitary confinement. Nonetheless, additional sources of evidence—interviews, clinician observa-tions, staff observations, medical files—are crucial for capturing the range of symptoms that people in solitary exhibit, and those symptoms’ prevalence, duration, and severity over time. Without the benefit of mixed methods and improved instruments, re-searchers and policymakers alike will con-tinue not only to lack desired data but also to not know what data we lack. Increasing the transparency of both conditions of con-finement and the associated health effects is critical to both question formulation and data gathering.
As 5% to 15% of the United States’ 1.6 million incarcerated people are held in solitary confinement for at least part of their incar-ceration,5,6 and virtually all of those people will be released, all members of society have a vested interest in limiting the induction of psychopathology suggested by findings such as those presented here. At least some of the symptoms we described here, including identity loss and hypersensitivity, resulted directly from specific conditions of confine-ment, such as the absence of mirrors and the repetitive slamming of doors. To the extent that solitary is meant to make people more manageable, its association with psychopa-thology calls into question its usefulness, let alone its justice. And to the extent that solitary confinement has any causative role in psychopathology, our collective goal should be prevention.
CONTRIBUTORS K. Reiter served as principal investigator on this study, led data collection and analysis, and conceptualized and led the writing of this article. J. Ventura trained the study team in applying the Brief Psychiatric Rating Scale (BPRS), consulted on data collection and analysis, and participated in writing this article. D. Lovell consulted on study design and data collection, led the analysis of administrative data, and participated in writing this article. D. Augustine, M. Barragan, K. Chesnut, P. Dashtgard, G. Gonzalez, N. Pifer, and J. Strong participated in project design, participant interviews, data analysis, and writing of this article. K. Chesnut also served as project manager and, with P. Dashtgard, participated in administrative data and BPRS analysis. T. Blair consulted on data analysis and participated in writing this article.
ACKNOWLEDGMENTS Funding for this research was provided by the Langeloth Foundation.
The research presented here utilized a confidential data file from the Washington Department of Corrections (DOC). This study would not have been possible without the support of the research and correctional staff in the Washington DOC, especially Bernard Warner, Dan Pacholke, Dick Morgan, Jody Becker-Green, Steve Sinclair, Paige Harrison, Vasiliki Georgoulas-Sherry, Bruce Gage, Ryan Quirk, and Tim Thrasher. Alyssa Cisneros, Emma Conner, and Rosa Greenbaum contributed to study design, interviewed participants, and analyzed data for this project. Leida Rojas, Elena Amaya, and Keely Blissmer helped to clean and organize data. Rebecca Tublitz analyzed administrative data. Lorna Rhodes served as a project mentor. Multiple anonymous reviewers provided detailed critical feedback that improved this piece significantly. Finally, the incarcerated people who shared their experiences with us made this study possible.
Note. The views expressed here are those of the authors and do not necessarily represent those of the Washington DOC or other data file contributors. Any errors are attributable to the authors.
CONFLICTS OF INTEREST None of the authors have conflicts of interest to declare.
HUMAN PARTICIPANT PROTECTION This study was approved by the institutional review board at the University of California, Irvine (HS 2016-2816).
REFERENCES 1. Rhodes LA. Pathological effects of the supermaximum prison. Am J Public Health. 2005;95(10):1692–1695.
2. Reiter K. 23/7: Pelican Bay Prison and the Rise of Long-Term Solitary Confinement. New Haven, CT: Yale University Press; 2016.
3. United Nations. Solitary confinement should be banned in most cases, UN expert says. UN News Centre. October 18, 2011. Available at https://news.un.org/en/ story/2011/10/392012-solitary-confinement-should-be-banned-most-cases-un-expert-says. Accessed October 22, 2019.
4. Cloud DH, Drucker E, Browne A, Parsons J. Public health and solitary confinement in the United States. Am J Public Health. 2015;105(1):18–26.
5. Association of State Correctional Administrators and the Arthur Liman Public Interest Program, Yale Law School. Aiming to reduce time-in-cell: reports from correctional systems on the numbers of prisoners in restricted housing and on the potential of policy changes to bring about reforms, Nov. 2016. Available at: https:// law.yale.edu/sites/default/files/area/center/liman/ document/aimingtoreducetic.pdf. Accessed April 23, 2019.
6. Beck AJ. Use of restrictive housing in US prisons and jails, 2011–12. Bureau of Justice Statistics. 2015. Available at: https://www.bjs.gov/content/pub/pdf/urhuspj1112. pdf. Accessed April 23, 2019.
7. Haney C. The psychological effects of solitary con-finement: a systematic critique. Crime Justice. 2018;47(1): 365–416.
8. Kaba F, Lewis A, Glowa-Kollisch S, et al. Solitary confinement and risk of self-harm among jail inmates. Am J Public Health. 2014;104(3):442–447.
9. Lovell D. Patterns of disturbed behavior in a supermax prison. Crim Justice Behav. 2008;35(8):985–1004.
10. Morgan RD, Smith P, Labrecque RM, et al. Quantitative syntheses of the effects of administrative segregation on inmates’ well-being. Psychol Public Policy Law. 2016;22(4):439–461.
11. O’Keefe ML, Klebe KJ, Metzner J, Dvoskin J, Fellner J, Stucker A. A longitudinal study of adminis-trative segregation. J Am Acad Psychiatry Law. 2013; 41(1): 49–60.
12. Walters GD. Checking the math: do restrictive housing and mental health need add up to psychologi-cal deterioration? Crim Justice Behav. 2018;45(9):1347–1362.
13. Overall JE, Gorham DR. The brief psychiatric rating scale. Psychol Rep. 1962;10(3):799–812.
14. Ventura J, Nuechterlein KH, Subotnik KL, Gutkind D, Gilbert EA. Symptom dimensions in recent-onset schizophrenia and mania: a principal components analysis of the 24-item Brief Psychiatric Rating Scale. Psychiatry Res. 2000;97(2-3):129–135.
15. Cloyes KG, Lovell D, Allen DG, Rhodes LA. Assessment of psychosocial impairment in super-maximum security unit sample. Crim Justice Behav. 2006;33(6):760–781.
16. Hassan L, Birmingham L, Harty MA, et al. Prospective cohort study of mental health during imprisonment. Br J Psychiatry. 2011;198(1):37–42.
Supplement 1, 2020, Vol 110, No. S1 AJPH Reiter et al. Peer Reviewed Research S61

AJPH OPEN-THEMED RESEARCH
17. Senior J, Birmingham L, Harty MA, et al. Identifi-cation and management of prisoners with severe psy-chiatric illness by specialist mental health services. Psychol Med. 2013;43(7):1511–1520.
18. Kaeble D, Cowhig M. Correctional Populations in the United States, 2016. Vol 25121. US Department of Justice, Bureau of Justice Statistics. 2018. Available at: https://www.bjs.gov/content/pub/pdf/cpus16.pdf. Accessed April 23, 2019.
19. Phipps P, Gagliardi G. Washington’s dangerous mentally ill offender law: program selection and services, interim report. Washington State Institute for Public Policy. 2003. Available at: http://www.wsipp.wa.gov/ ReportFile/836/Wsipp_Washingtons-Dangerous-Mentally-Ill-Offender-Law-Program-Selection-and-Services-Interim-Report_Full-Report.pdf. Accessed April 23, 2019.
20. Neyfakh L. What do you do with the worst of the worst? Slate. April 2015. Available at: https://slate.com/ news-and-politics/2015/04/solitary-confinement-in-washington-state-a-surprising-and-effective-reform-of-segregation-practice.html. Accessed April 23, 2019.
21. Berzofsky M, Zimmer S. 2018 National Inmate Survey (NIS-4): sample design evaluation and recom-mendations. US Department of Justice, Bureau of Justice Statistics. 2017. Available at: https://www.bjs.gov/ content/pub/pdf/NIS4DesignRecommendations.pdf. Accessed April 23, 2019.
22. Calavita K, Jenness V. Appealing to Justice: Prisoner Grievances, Rights, and Carceral Logic. Berkeley, CA: University of California Press; 2014.
23. Reiter K, Sexton L, Sumner J. Theoretical and empirical limits of Scandinavian Exceptionalism: isolation and normalization in Danish prisons. Punishm Soc. 2017; 20(1):92–112.
24. Ventura J, Lukoff D, Nuechterlein KH, Liberman RP, Green MF, Shaner A. Brief Psychiatric Rating Scale (BPRS) expanded version (4.0): scales, anchor points, and administration manual. Int J Methods Psychiatr Res. 1993;3:227–244.
25. Kleschinsky JH, Bosworth LB, Nelson SE, Walsh EK, Shaffer HJ. Persistence pays off: follow-up methods for difficult-to-track longitudinal samples. J Stud Alcohol Drugs. 2009;70(5):751–761.
26. Western B, Braga A, Hureau D, Sirois C. Study re-tention as bias reduction in a hard-to-reach population. Proc Natl Acad Sci USA. 2016;113(20):5477–5485.
27. Charmaz K. Constructing Grounded Theory: A Practical Guide Through Qualitative Analysis. Thousand Oaks, CA: Sage Publications; 2006.
28. Haney C. Mental health issues in long-term solitary and “supermax” confinement. Crime Delinq. 2003;49(1): 124–156.
29. James DJ, Glaze LE. Mental Health Problems of Prison and Jail Inmates. Washington, DC: Bureau of Justice Statistics; 2006.
30. Toch H, Adams K. Acting Out: Maladaptation in Prisons. Washington, DC: American Psychological Asso-ciation; 2002.
31. Reiter K, Blair T. Superlative subjects, institutional futility, and the limits of punishment. Berkeley J Criminal Law. 2018;23(2):162–193.
32. Rhodes L. Total Confinement: Madness and Reason in a Maximum Security Prison. Berkeley, CA: University of California Press; 2004.
33. Guy A. Locked up and locked down: segregation of inmates with mental illness, 2015: Disability Rights Washington. Available at: https://www. disabilityrightswa.org/wp-content/uploads/2017/12/ LockedUpandLockedDown_September2016.pdf. Accessed April 23, 2019.
34. Reiter K, Koenig KA. Extreme Punishment: Compar-ative Studies in Detention, Incarceration and Solitary Con-finement. New York, NY: Palgrave MacMillan; 2015.
S62 Research Peer Reviewed Reiter et al. AJPH Supplement 1, 2020, Vol 110, No. S1

Appendix A: Additional Methods Details
Protecting Vulnerable Populations
In adherence to research protocols for vulnerable subjects, prisoners participating in this
research were specifically informed that participation was voluntary and would not involve
incentives, administrative or otherwise; that refusal would not affect them adversely; and that all
information shared would be protected and anonymized unless it pertained to “an imminent
security-related threat.” To recruit participants, a research team member approached each
prisoner at his cell-front, explained the study, and invited him to interview. Willing prisoners
were escorted singly to a confidential area (monitored visually but not aurally by WADOC staff),
consented, and interviewed by one or two members of the research team.
All identifiable data collected for this project, including interview audio recordings,
transcripts, BPRS score sheets, medical file notes, and administrative data, was stored either in a
locked filing cabinet in a locked office or in a secure server space, accessible only through multi-
factor identification to a subset of study team members participating in data cleaning and linking.
The University of California IRB approved this study, as did the WADOC research department.
Brief Psychiatric Rating Scale Training and Application
At the conclusion of each interview in both year one and year two, interviewers
completed ratings for each of the 24 BPRS items. For self-report questions, interviewers asked
about the presence of symptoms in the previous two weeks, per BPRS standard.26 The research
team completed 16 hours of in-person, structured, symptom assessment training sessions with an
expert in BPRS research (co-author Ventura) prior to the year-one interviews, and completed
four hours of refresher training prior to the year-two interviews, for a total of 20 hours of
training.26 Using a set of seven standardized BPRS training videos of patient interviews, the

research team viewed and rated each video and discussed their ratings compared to “Gold
Standard” training ratings. Ratings were analyzed for interrater reliability. All research team
members met the minimum standard of an ICC=.80 or greater for the BPRS. A Quality
Assurance check of symptom assessment reliability was conducted between the study years 2017
and 2018; no major rater drift was found, and feedback was provided to the assessment team
when needed to clarify symptom rating guidelines. This procedure represents the standard
training protocol for anyone administering the BPRS in clinical settings.
Coding Process
To develop our codebook, six team members open-coded 24 transcripts (4 each) line-by-
line,27 generating an initial list of over 500 codes. These codes were further refined and
categorized, then condensed into 176 codes, organized into 10 code groups. After a round of
pilot coding, in which each team member completed one initial transcript coding and one re-
coding, coding discrepancies were reconciled. Team members then coded within code groups of
interest, such as “Enduring the IMU” and “IMU Conditions.” Coders met bi-weekly for 6 months
to resolve discrepancies. Given this intensive, thematically-grounded process, no statistics were
calculated for intercoder agreement.
WADOC Disclosures
The research presented here utilizes a confidential Data File from the Department of
Corrections (DOC) located within the Washington Department of Corrections. The views
expressed here are those of the author(s) and do not necessarily represent those of the DOC or
other Data File contributors. Any errors are attributable to the author(s).