Reducing postneonatal mortality in West Virginia: a statewide intervention program targeting risk...
7
Reducing Postneonatal Mortality in West Virginia: A Statewide Intervention Program Targeting Risk Identified at and after Birth David Z. Myerberg, MD, Robert G. Carpenter, PhD, Cynthia F. Mverberg, RN, Christine M. Bnrtton, Charles W. Bailey, and Bany' E. Fink Introduction In 1982, an internal report for the West Virginia State Health Department (R.S.C. Pearson and R. Parkinson, Re- port to Infant Tracking Working Group, June 30, 1982) showed that many infants at great risk of postneonatal mortality received little or no medical care. Similar findings have been reported elsewhere in the United States' 2 suggesting that many postneonatal deaths in socially disadvan- taged groups are potentially preventable with adequate health care.3-5 Based on results of previous stud- ies,k- we hypothesized that systematically identifying infants at high risk of postneo- natal mortality and ensuring that these infants received adequate health care would reduce mortality. So in 1985, because postneonatal mortality was exces- sive in West Virginia, we set up the first statewide system to identify, set care plans for, and track high-risk infants. This report describes the significant drop in postneonatal mortality that fol- lowed. Methods Sheffield Birth Score. Those scoring 530 or more (top 15Cc) were designated as high-score infants. Second, whether in- fants had been scored or not, physicians registered infants as high risk who had or developed any of the following clinical risk factors: (1) infant was the sibling of an infant who died of sudden infant death syndrome; (2) infant had an apparcnt life-threatening event: (3) infant had a tracheostomy; (4) infant had cardiac dis- ease that put him or her at high risk for unexpected death; and (5) infant had a narcotic-addicted mother. Interventions Two intervention programs ran con- currently: one for each identification system. Infants with high scores were offered a specific schedule of physician visitation. Infants registered as clinically at risk were evaluated with a standard protocol, were designated "protocol in- fants," and received various treatments including a home apnea and bradycardia monitor when appropriate. Funding for the office visits of high- score infants and for testing and home monitoring equipment for protocol in- fants was prearranged with Medicaid and Risk Identification A preliminary retrospective study of postneonatal deaths in West Virginia (1980-1983), with four risk factors from the Sheffield Birth Score6 available on birth certificates, showed that 50% of the infants who died had scores above the 85th population percentile. This observa- tion led us to adopt the entire Sheffield Birth Score as a risk predictor of postneo- natal mortality in West Virginia. At-risk infants were identified in two ways. First, all infants born in participat- ing hospitals were scored according to the At the time of the study. David Z. Myerberg. Cynthia F. Myerberg, Christine M. Britton. and Barry E. Fink were with the Department of Pediatrics, West Virginia University. Morgan- town. WVa. Robert G. Carpenter is with the London School of Hygiene and Tropical Medicine, London. England. Charles W. Bailey is with the West Virginia Department of Health. Charleston. WVa. Requests for reprints should be sent to Christine M. Britton, West Virginia Birth Score Office, Department of Pediatrics. PO Box 9218, West Virginia University. Morgan- town. WV 26506-9218. This paper was accepted August 23. 1994. American Journal of Public Health 631
Transcript of Reducing postneonatal mortality in West Virginia: a statewide intervention program targeting risk...

Reducing Postneonatal Mortality inWest Virginia: A StatewideIntervention Program Targeting RiskIdentified at and after Birth
David Z. Myerberg, MD, Robert G. Carpenter, PhD, Cynthia F. Mverberg, RN,Christine M. Bnrtton, Charles W. Bailey, and Bany' E. Fink
IntroductionIn 1982, an internal report for the
West Virginia State Health Department(R.S.C. Pearson and R. Parkinson, Re-port to Infant Tracking Working Group,June 30, 1982) showed that many infantsat great risk of postneonatal mortalityreceived little or no medical care. Similarfindings have been reported elsewhere inthe United States' 2 suggesting that manypostneonatal deaths in socially disadvan-taged groups are potentially preventablewith adequate health care.3-5
Based on results of previous stud-ies,k- we hypothesized that systematicallyidentifying infants at high risk of postneo-natal mortality and ensuring that theseinfants received adequate health carewould reduce mortality. So in 1985,because postneonatal mortality was exces-sive in West Virginia, we set up the firststatewide system to identify, set care plansfor, and track high-risk infants.
This report describes the significantdrop in postneonatal mortality that fol-lowed.
Methods
Sheffield Birth Score. Those scoring 530or more (top 15Cc) were designated ashigh-score infants. Second, whether in-fants had been scored or not, physiciansregistered infants as high risk who had ordeveloped any of the following clinicalrisk factors: (1) infant was the sibling of aninfant who died of sudden infant deathsyndrome; (2) infant had an apparcntlife-threatening event: (3) infant had atracheostomy; (4) infant had cardiac dis-ease that put him or her at high risk forunexpected death; and (5) infant had anarcotic-addicted mother.
Interventions
Two intervention programs ran con-currently: one for each identificationsystem. Infants with high scores wereoffered a specific schedule of physicianvisitation. Infants registered as clinicallyat risk were evaluated with a standardprotocol, were designated "protocol in-fants," and received various treatmentsincluding a home apnea and bradycardiamonitor when appropriate.
Funding for the office visits of high-score infants and for testing and homemonitoring equipment for protocol in-fants was prearranged with Medicaid and
Risk IdentificationA preliminary retrospective study of
postneonatal deaths in West Virginia(1980-1983), with four risk factors fromthe Sheffield Birth Score6 available onbirth certificates, showed that 50% of theinfants who died had scores above the85th population percentile. This observa-tion led us to adopt the entire SheffieldBirth Score as a risk predictor of postneo-natal mortality in West Virginia.
At-risk infants were identified in twoways. First, all infants born in participat-ing hospitals were scored according to the
At the time of the study. David Z. Myerberg.Cynthia F. Myerberg, Christine M. Britton. andBarry E. Fink were with the Department ofPediatrics, West Virginia University. Morgan-town. WVa. Robert G. Carpenter is with theLondon School of Hygiene and TropicalMedicine, London. England. Charles W. Baileyis with the West Virginia Department ofHealth. Charleston. WVa.
Requests for reprints should be sent toChristine M. Britton, West Virginia BirthScore Office, Department of Pediatrics. POBox 9218, West Virginia University. Morgan-town. WV 26506-9218.
This paper was accepted August 23. 1994.
American Journal of Public Health 631

SCREENING
69,262 Live Births*
INTERVENTION
31,052Scored
26,482 4,570 | 45.5% linked with consistentLow Score High Score pnmary care
4F
385 324
1003With Individual Apnea Risk
Factors After Birth
294Evaluated to determine
-* treatment and need forHome Monitor
-AJI rgistered live births.
FIGURE 1-Combined program of risk-related screening and Intervention, WestVirginia births, 1985 through 1987.
third-party carriers. Neither interventionwas randomized.
Program Development
The combined identification systemswere initiated by educational programs at
local hospitals. By 1987, 30 of the 34 WestVirginia birthing hospitals and 620 associ-ated physicians participated. At scoringhospitals, newborn-nursery nurses com-
pleted the birth-score card, which in-cluded data for matching with the birth
certificate, and calculated the score. Par-ents of high-score infants were (1) in-formed by a nurse or physician that, basedon the Sheffield Birth Score, their infantswere at greater risk of health problemsthan were low-score infants; (2) asked to
link with a primary care physician of theirchoice for six office visits in the next 6months; and (3) required to sign a
statement of understanding approved bythe West Virginia University InstitutionalReview Board.
Score cards were mailed to theproject office. For high-score infants, theoffice notified the chosen physician of theinfant's risk status and supplied him or
her with a growth chart that monitorsboth attained weight and weight gain over2- and 8-week periods.9
The protocol for the care of clinicallyat-risk infants was developed by an ad hocstatewide committee. The required educa-tional program was available after Febru-ary 1985 either in hospitals or for privatestudy and included a posttest. A total of229 physicians registered infants as clini-cally at risk.
Registered infants were evaluatedwith the protocol. Some were hospitalizedlocally, and some were transferred to a
tertiary center. They received varioustreatments, which sometimes included theprovision of home apnea and bradycardiamonitors.
Record Linkage
Information from score cards, visitsto physicians, and protocol investigationswere entered into a UNISYS MAPPERdatabase and linked to birth and deathcertificate data from the state healthdepartment. Death certificate data on
West Virginia infants who died in otherstates were supplied by the NationalCenter for Health Statistics. All WestVirginia resident infants, whether or notthey were included in the monitoringprogram, were tracked for 1 year forsurvival.
Program Evaluation
Exact tests of odds ratios,10 supple-mented by logistic regression, were usedto compare postneonatal mortality invarious groups. Protocol registration in-creased with scoring. Because infants whowere eligible for the protocol but whowere not registered cannot be identified,the separate contributions to the reduc-tion in mortality of physician linkage andthe protocol cannot be determined.
Using US vital statistics,11 we evalu-ated the impact of the program on
632 American Journal of Public Health
Myerberg et al.
38,210 /Not Scored
TABLE 1-Prevalence of Risk Factors from Birth Certificates In Scored andNonscored Infants and Associated Relative Risk of PostneonatalMortality (PNM)
Scored Nonscored RelativeDifference, Risk
Risk Factor No. % No. % % of PNM
MotherAge < 20y 5251 16.9 6539 17.1 -0.2 1.6**Education < 8th grade 1392 4.5 1752 4.6 -0.1 1.3Single 6140 19.8 7609 18.5 1 .3** 2.2**Non-White 1373 4.4 1147 3.0 1.4** 2.1**
PregnancyMore than 2 previous 3827 12.3 4715 12.3 0 1 .9**
pregnanciesThree or fewer prenatal 1354 4.4 1944 5.1 -0.7** 4.0**
clinic visitsComplications of 2611 8.4 2983 7.8 0.6** 2.5**
pregnancyComplications of labor 7636 24.6 10 546 27.6 -3.0** 1.8**Multiple birth 645 2.1 690 1.8 0.3** 3.3**
InfantMale 15 909 51.2 19 727 51.6 -0.4** 1.3*Birthweight < 1500 g 301 1.0 242 0.6 0.4** 22.4**Apgar (5 min) < 5 207 0.7 245 0.6 0.1 20.4**Birth defect(s) 324 1.0 435 1.1 -0.1 8.8**
Total 31 052 100.0 38210 100.0 ... ...
Note. The very small number of missing observations, averaging 0.5%, have been included in thelargest category.*P < .05; ** P < .01.
May 1995, Vol. 85, No. 5

postneonatal mortality in West Virginiaby determining trends in standardizedmortality ratios. We hypothesized thatintervention would displace the underly-ing trend in standardized mortality ratiosdownward in West Virginia but notelsewhere. In 1985 and 1986, when theprogram was set up, it was assumed thatthe displacement would be a proportionof the shift in 1987 and 1988, computed as
the proportion of postneonatal deathsexpected among scored infants in thoseyears, taking into account the month ofbirth and the distribution of deaths by age
and month of birth.Simulation studies'2 indicate that
standardized mortality ratios for 15 years
before the start of intervention are neededto establish the trend in mortality with thesufficient certainty to ensure that, in thecase of West Virginia, the analysis has90% power for detecting a 20% drop inthe postneonatal mortality rates at the 5%level.
Standardized mortality ratios(100 x observed/expected deaths) were
therefore computed for each year from1970 through 1988 for West Virginia; fortwo similar nearby states, Kentucky andTennessee; and for the rural states ofIdaho and Indiana. Because postneonatalmortality (PNM) for Blacks is higher thanit is for non-Blacks, expected deaths werecomputed as follows:
(Non-Black births
x US non-Black PNM rate
+ Black births
x US Black PNM rate)/1000.
We included 1988 because 40% of infantswho die postneonatally in 1 year were
born the previous year, and the program
continued without changes in 1988.Trends in standardized mortality ra-
tios were analyzed by logistic regression ofobserved postneonatal mortality rateswith log (expected mortality rate) as an
offset.13 Analysis revealed that deathsreported for West Virginia in 1972were inexplicably low (standardized re-
sidual = -4.13,P < 1:26 000) and sowereexcluded. Model parameters were insig-nificantly changed by doing so. Therewere no other outliers, and after exclud-ing this observation, the test of theresidual chi-square was not significant(P > .2).
Also, using a modification of Taylorand Emery's method,'4we classified deathsas inevitable when they were due toprematurity of less than 32 weeks of
gestation with severe, unrelenting lungdisease; cerebral degeneration; viral en-
cephalitis; severe congenital viral or proto-zoa infection; severe cardiac or intestinalanomalies; myocarditis; Werdnig-Hoff-mann disease; or lung hypoplasia. Allother deaths were classified as either dueto sudden infant death syndrome or
possibly preventable. The classificationwas confirmed by review of hospital andphysician records, postmortem reports,and family interviews when necessary andwas available for all high-score and proto-col deaths and low-score deaths thoughtto have been possibly preventable.
ResultsFrom January 1, 1985, through De-
cember 31, 1987, there were 69 262 birthsregistered to West Virginia residents; thebreakdown in relation to the two interven-tion programs is shown in Figure 1.
Birth Score
A total of 31 052 infants (45% of allbirths) were scored, ofwhom 4570 (14.7%)scored high. At the start, 1612 (4.4%)infants were scored incorrectly and were
counted as not scored, amongwhom therewere only two postneonatal deaths: one
was a full-term boy who died of suddeninfant death syndrome at 1 month of age,
and the other, who was 14 weeks prema-
ture, died at 4 months of age fromcomplications of prematurity.
Table 1, which compares birth certifi-cate data of 31 052 scored and 38210nonscored infants, shows that the scoredgroup was at slightly higher risk in severalrespects, including birthweight. Figure 2shows that the postneonatal mortality ratefor scored infants was 14.1% lower thanthat for nonscored infants. After logisticcovariance adjustment for the differencesshown in Table 1, the postneonatal mortal-
American Journal of Public Health 633
Postneonatal Mortality Reduction
Low Score1.7
(46/26482)
Scored Linked With Care3.06 7.7
/(95/31052) / (16/2079)
Birthhs High Score3.34 10.7t
(231/69262) (49/4570)
Non-Scored Not Linked3.56* 13.2t
(136/38210) (33/2491)
.p=.13; alusted=0.04tP<.0001$p=.046; ascusted=O.014*t# one sided exact test
Note. Significance was determined by the one-sided exact test, and P values were adjusted bylogistic regression.
FIGURE 2-Postneonatal mortality rates in West Virginia, 1985 through 1987.
TABLE 2-Postneonatal Death Rates in High- and Low-Score Subpopulations,West Virginia Residents, 1985 through 1987
Death Rate per 1000 Live Births (No. Deaths)
High Score Low Score Odds RatioCategory of PNM (n = 4570) (n = 26 482) (95% Cl)
Overall 10.8 (49) 1.7 (46) 6.23 (4.2, 9.3)SIDS 4.6 (21) 0.4 (11) 11.16 (5.4, 23.2)Possibly preventable 3.3 (15) 0.7 (18) 4.87 (2.5, 9.7)SIDS and possibly preventable 8.0 (36) 1.1 (29) 7.26 (4.4,11.9)
Note. Total number of deaths = 95. PNM = postneonatal mortality; SIDS = sudden infant deathsyndrome.
May 1995, Vol. 85, No. 5

Myerberg et al.
ity rate for scored infants was 21.5% lowerthan that for nonscored infants (P = .039).The postneonatal mortality rate in high-score infants was 6.3 times greater thanthat in low-score infants (P < .0001).High-score infants linked with plannedcare had a postneonatal mortality rate
41.6% lower than that of high-scoreinfants not linked with planned care
(P = .046 by the one-sided exact test,
which was appropriate because the possi-bility that intervention might increasemortality was not hypothesized). Tabula-tions showed that linked and nonlinkedinfants were similar with respect to mostcovariables, and after logistic covarianceadjustment, the postneonatal mortalityrate of linked infants was 50.0% less thanthat of nonlinked infants (P = .014).
Table 2 shows the predictiveness ofthe birth score in relation to sudden infantdeath syndrome and possibly preventabledeaths. The specificity of the high score
was 15% (i.e., the proportion of infantswho were scored high). The sensitivity ofthe high score for sudden infant deathsyndrome was 66%, and for possiblypreventable deaths, itwas 45%. The mean(± SD) birth score for the population was449 ± 78; for infants dying of suddeninfant death syndrome, it was 563 ± 53;and for infants with possibly preventabledeaths, it was 526 ± 68. Only 2 of the 32infants dying of sudden infant deathsyndrome and 5 of the 35 infants with
possibly preventable deaths had scores
below the population mean. There were
no sudden infant death syndrome or
possibly preventable deaths in the 27% ofthe population with lowest scores.
Protocol
Figure 1 shows that 1003 infants wereregistered statewide as protocol infants,constituting 1% of nonscored infants,1.2% of low-score infants, 4.1% of high-score nonlinked infants, and 8.8% ofhigh-score linked infants (P < .0001). Ofthese protocol infants, 375 were pretermand had an apparent life-threateningevent and 390 were full term and had an
apparent life-threatening event; 94 were
siblings of infants who had died of suddeninfant death syndrome; and 144 hadtracheostomies, high-risk cardiac condi-tions, narcotic-addicted mothers, or com-
binations of these.Table 3 shows postneonatal mortality
by weight category for preterm andfull-term infants who had an apparentlylife-threatening event, all protocol infants,and all other infants of comparableweight. Twenty two (21.9 per 1000)protocol infants died postneonatally (oddsratio = 7.3,P < .001). Of the 22,9 died ofsudden infant death syndrome and six hadpossibly preventable deaths, so protocolinfants had a statistically significant risk ofsudden infant death syndrome and pos-
sible preventable death (P < .001). Pre-term and full-term infants with apparentlylife-threatening events were significantlyat risk of sudden infant death syndrome(P < .05), and full-term infants with ap-
parently life-threatening events were sig-nificantly at risk of possibly preventabledeath (P < .05). Protocol postneonatalmortality rates were similar in non-scored,low-score, high-score, and linked groups(P > .2), but were lowest in the linkedgroup.
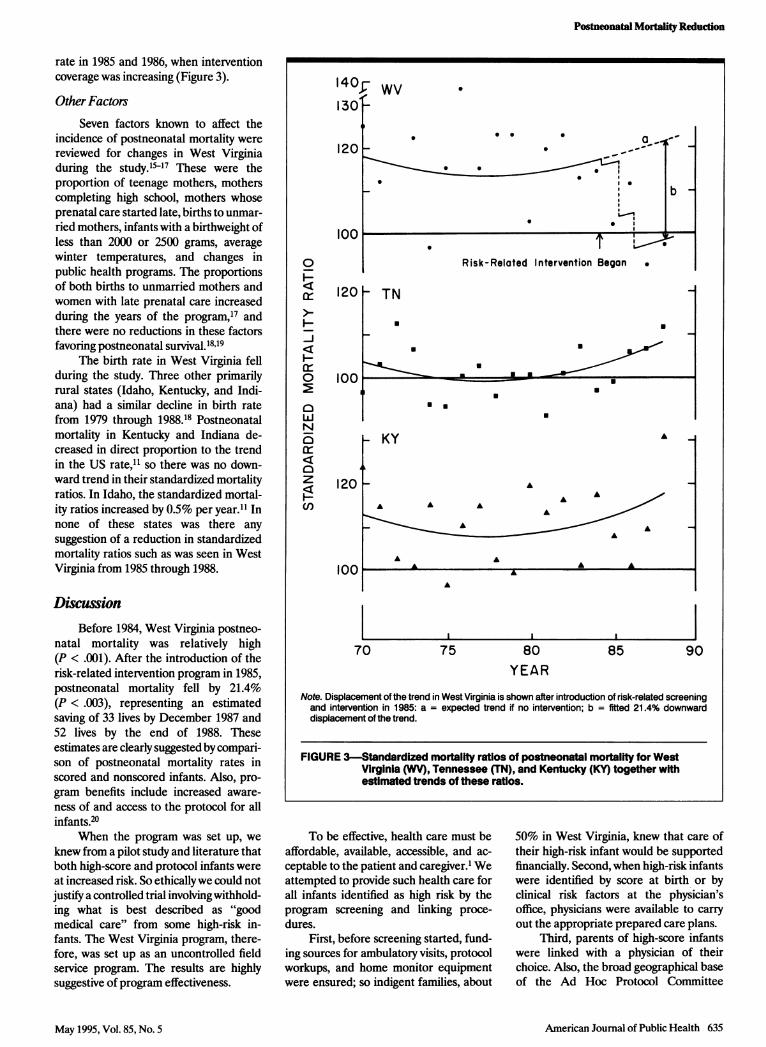
Overall Mortality
From 1970 through 1984, the stan-dardized mortality ratios for West Vir-ginia averaged 118.7 (95% CI = 113.4,124.4). In 1987 through 1988, when theintervention program was established, thestandardized mortality ratio was 96.1(95% CI = 80.8, 114.4). The differencewas 19.2% (95% CI = 3.9%, 32.1%;P < .02), which is not explained by a
simple linear trend. In the nearby states ofTennessee and Kentucky, standardizedmortality ratios were close to the state
average in 1987 and increased in 1988.From 1970 through 1984 the average
standardized mortality ratios for Tennes-see and Kentucky were 110.7 and 101.9,respectively, which were significantly dif-ferent from West Virginia's average ratioof 118.7, (P < .001). The underlying trendin the standardized mortality ratios was
quadratic (P < .01), representing a slightfall in the mortality ratios in the early1970s and a rise in the late 1980s. Thistrend was most apparent in the Tennesseestandardized mortality ratios (Figure 3),butwas similar in all three states (P > .15).With this model, the reduction in thestandardized mortality ratios in WestVirginia in 1987 through 1988 is describedby a 21.4% downward displacement of thetrend (95% CI = 8.2%, 31.5%;P < .003).This estimated effect of intervention isslightly larger than that given previouslybecause it takes into account the upwardtrend in standardized mortality ratios in
Tennessee and Kentucky in these years.
Significance is also enhanced because this
model also takes into account the fall in
the West Virginia postneonatal mortality
May 1995, Vol. 85, No. 5634 American Journal of Public Health
TABLE 3-Postneonatal Death Rates per 1000 Live Births among Infants Registered in the Apnea Protocol and among Infantsof Other West Virginia Residents, by Birthweight and Category of Postneonatal Mortality
Death Rate per 1000 Live Births (No. Deaths)
Birthweight < 2500 g Birthweight 2 2500 g All Weights
ALTE Others Odds ALTE Others Odds Protocol Others OddsCategory of PNM (n = 390) (n = 4162) Ratio (n = 375) (n = 64 335) Ratio (n = 1 003a) (n = 68 259) Ratio
SIDS 12.8 (5) 3.6 (15) 3.6* 5.3 (2) 0.8 (50) 6.9* 9.0 (9)a 0.9 (63) 9.8**Possibly preventable 2.6 (1) 4.3 (18) 0.6 10.7 (4) 0.7 (48) 14.4** 6.0 (6)a 1.0 (65) 6.3**SIDS and possibly preventable 15.4 (6) 7.9 (33) 2.0 16.0 (6) 1.5 (98) 10.7** 15.0 (15)a 1.9 (128) 8.1 **Allb 33.3 (13) 16.1 (67) 2.1* 16.0 (6) 2.3 (145) 7.2** 21.9 (22)a 3.1 (209) 7.3**
Note. ALTE = apparent life-threatening event; PNM = postneonatal mortality; SIDS = sudden infant death syndrome.aincludes infants from other protocol categories.bAlso includes inevitable deaths.*P < .05 by Fisher's Exact Test.**P < .001 by Fisher's Exact Test.
Postneonatal Mortality Reduction
rate in 1985 and 1986, when interventioncoverage was increasing (Figure 3).
Other FactorsSeven factors known to affect the
incidence of postneonatal mortality werereviewed for changes in West Virginiaduring the study.'157 These were theproportion of teenage mothers, motherscompleting high school, mothers whoseprenatal care started late, births to unmar-ried mothers, infants with a birthweight ofless than 2000 or 2500 grams, averagewinter temperatures, and changes inpublic health programs. The proportionsof both births to unmarried mothers andwomen with late prenatal care increasedduring the years of the program,17 andthere were no reductions in these factorsfavoring postneonatal survival.18'19
The birth rate in West Virginia fellduring the study. Three other primarilyrural states (Idaho, Kentucky, and Indi-ana) had a similar decline in birth ratefrom 1979 through 1988.18 Postneonatalmortality in Kentucky and Indiana de-creased in direct proportion to the trendin the US rate,11 so there was no down-ward trend in their standardized mortalityratios. In Idaho, the standardized mortal-ity ratios increased by 0.5% per year.11 Innone of these states was there anysuggestion of a reduction in standardizedmortality ratios such as was seen in WestVirginia from 1985 through 1988.
DiscussionBefore 1984, West Virginia postneo-
natal mortality was relatively high(P < .001). After the introduction of therisk-related intervention program in 1985,postneonatal mortality fell by 21.4%(P < .003), representing an estimatedsaving of 33 lives by December 1987 and52 lives by the end of 1988. Theseestimates are clearly suggested by compari-son of postneonatal mortality rates inscored and nonscored infants. Also, pro-gram benefits include increased aware-ness of and access to the protocol for allinfants.20
When the program was set up, weknew from a pilot study and literature thatboth high-score and protocol infants wereat increased risk. So ethicallywe could notjustify a controlled trial involving withhold-ing what is best described as "goodmedical care" from some high-risk in-fants. The West Virginia program, there-fore, was set up as an uncontrolled fieldservice program. The results are highlysuggestive of program effectiveness.
140- Wv1301-
120
0
H-J
I
0
0
0
z
U,
.
S ' U U .-
II
0 lb~~~~~~~~~~~~~~
Risk-Related Intervention Began .
120 TN
U U
U
Ion EU-i11-
U *
- KY
120 _
70
A
..
A
A AA A A
A
A AA
A AA A
A
75 80 85 90YEAR
Note. Displacement of the trend in West Virginia is shown after introduction of risk-related screeningand intervention in 1985: a = expected trend if no intervention; b = fitted 21.4% downwarddisplacement of the trend.
FIGURE 3-StandardIzed mortality ratios of postneonatal mortality for WestVirginia (WV), Tennessee (TN), and Kentucky (KY) together withestimated trends of these ratios.
To be effective, health care must beaffordable, available, accessible, and ac-ceptable to the patient and caregiver.1 Weattempted to provide such health care forall infants identified as high risk by theprogram screening and linking proce-dures.
First, before screening started, fund-ing sources for ambulatory visits, protocolworkups, and home monitor equipmentwere ensured; so indigent families, about
50% in West Virginia, knew that care oftheir high-risk infant would be supportedfinancially. Second, when high-risk infantswere identified by score at birth or byclinical risk factors at the physician'soffice, physicians were available to carryout the appropriate prepared care plans.
Third, parents of high-score infantswere linked with a physician of theirchoice. Also, the broad geographical baseof the Ad Hoc Protocol Committee
American Joumal of Public Health 635
. -
May 1995, Vol. 85, No. 5

Myerberg et al.
enabled physicians to refer infants forprotocol workup to the tertiary-care cen-ter in their region. So care was acceptableto the family and the physician. Fourth,the fact that there were 620 physicianscaring for high-score infants and 229 whoidentified protocol infants made careaccessible statewide for all high-risk in-fants.
Thus, this program for high-riskinfants met Patrick et al.'s criteria1 andattempted to maximize the use of appro-priate health care. Only a large-scale,population-based program can effectivelyprevent the relatively small number ofpostneonatal deaths that are scatteredthroughout the community.
Prevention of postneonatal deathswas achieved by identifying 4570 high-riskinfants by birth score, ofwhom nearly half(45.5%) attended visits with their chosenphysician. Medicaid paid over $300 000for these visits, which represented amarked improvement in care for high-riskinfants, judging by a previous West Vir-ginia report. The postneonatal mortalityin this group (10.7 per 1000) warrantsalerting parents and physicians to theinfant's risk and expending funds toensure high-quality ambulatory care ofthese infants.
The estimated reduction of 21.4% inthe mortality of the high-score, linkedgroup implies that the discriminatingpower of the score is underestimated bythe odds ratio of 6.2, derived by compar-ing mortality in high-score and low-scoregroups. The odds ratio for mortality innonlinked (i.e., untreated) infants com-pared with low-score infants is 7.7(P < .001).
Because the score is continuous, thesize of the high-score group can be chosenin the light of resources available. Theo-retical issues in the optimal choice of cutpoint are discussed by Carpenter.'5
The protocol for infants identified asclinically at risk enabled us to educatephysicians in the community about risk,get funding for hospitalization and thepurchase of equipment needed for evalua-tion and treatment, develop statewidestandards of evaluation and care, testscreening efficacy, and attempt to preventpostneonatal mortality. Any success wasdue to face-to-face education, predefinedfunding, collaborative effort, and coordi-nated data collection.
After protocol evaluation, infantswere treated for their problems, and 522(52%) were provided with home monitorsat a cost to the state of $400 000, not
including hospital, physician, prescrip-tion, and ancillary expenses.
The cost of intervention for bothhigh-score and protocol infants must beadded to setup, running, and administra-tive costs. By the end of 1987 we estimatedthat 33 lives were saved at a cost of $1.2million: $36 363 per life during the mostcostly period, when the program started.
Other groups have tried to preventpostneonatal mortality by implementingrisk-related interventions on the basis ofscoring.6k8,21 A meta-analysis of trends instandardized mortality ratios in 8 UnitedKingdom centers, which started score-based risk-related intervention programsbetween 1973 and 1988 involving 282 919infants, showed that postperinatal mortal-ity was reduced on average by 20.6%(95% CI = 8.6%, 31.1%; P < .002).22Others have targeted clinically at-riskpatients.2325 Our program combined bothmethods into a broad-based, statewidesystem.
This program has been done on asmaller scale by Powell in Gosport andPortsmouth, England.26 The results in theGosport/Portsmouth district were similarto our results in that there was a dramaticdecline in postperinatal mortality from1982 through early 1985 associated withthe introduction of the combined risk-related intervention program. This pro-gram had some features that differedfrom ours. First, infants were scored atbirth and then at 1 month. The 1-monthscore included both social factors andfactors about apnea and feeding. Second,trained health care visitors saw all high-risk infants regularly during the first 6months of life. Third, criteria for evalua-tion of clinical risk factors and homemonitoring were different from criteriaused in West Virginia. Most important,however, the concepts of intervention fora small, high-risk proportion of the popu-lation were consistent in both programs.
The consistency of the reduction inmortality associated with these otherprograms strongly supports the conclu-sion that the reduction in mortality thatoccurred in West Virginia was a directresult of the risk-related interventionprogram. E
AcknowledgmentsThis research was supported byMCH SPRANSgrant MCJ543521, US Public Health Service,1985 through 1988.
An earlier version of this paper waspresented at the 117th Annual Meeting of theAmerican Public Health Association, Chicago,Ill, on October 23, 1989, and at the annual
meeting of the American Academy of Pediat-rics, October 13, 1992.
We thank Eileen Turbessi for researchingthe infant deaths, Christine Dempsey fortyping the manuscript, the State Department ofPublic Health for faith and financial support,and all participating nurses and physicians whovolunteered their services.
References1. Patrick DL, Stein J, Porta M, Porter CQ,
Ricketts TC. Poverty, health services, andhealth status in rural america. Milbank Q.1988;66:105-136.
2. Bazzoli G. Health care for the indigent:overview of critical issues. Health Serv Res.1986;21:353-393.
3. Jason JM, Jarvis WR. Infectious diseases:preventable causes of infant mortality.Pediatrics. 1987;80:335-341.
4. Druschel CM, Hale CB. Postneonatalmortality among normal birth weight in-fants in Alabama, 1980 to 1983. Pediatrics.1987;80:869-872.
5. Honigfeld LS, Kaplan DW. Native Ameri-can postneonatal mortality. Pediatrics. 1987;80:575-578.
6. Carpenter RG, Gardner A, Jepson M, etal. Prevention of unexpected infant death:evaluation of seven years of birth scoringand increased visiting of high risk infants toprevent unexpected infant deaths in Shef-field. Lancet. 1983;i:723-727.
7. Carpenter RG, Emery JL. Final results ofstudy of infants at risk of sudden death.Nature. 1977;268:724-725.
8. Carpenter RG, Gardner A, Harris J, et al.Prevention of unexpected infant death: areview of risk-related intervention in sixcenters.AnnNYAcad Sci. 1988;533:96-105.
9. Emery JL, Waite AJ, Carpenter RG, et al.Apnoea alarms compared with weighingscales for siblings after cot death. Arch DisChild. 1985;60:1055-1060.
10. Mehta C, Patel N. StatXact. Cambridge,Mass: Cytel Software; 1991.
11. Vital Statistics of the United States 1970-88,Vol. 2: Mortality, Part B. Hyattsville, Md:National Center for Health Statistics.
12. Carpenter RG, Taylor EM, Emery JL.Psychosocial problems associated with in-creased risk of unexpected infant death. IntJPrenatPerinatStuds. 1991;3:55-62.
13. Payne CD. The Generalized Linear Model-ing System. Oxford, England: NationalAlgorithms Group; 1986.
14. Taylor EM, Emery JL. Two year study ofthe causes of postperinatal deaths classi-fied in terms of preventability. Arch DisChild. 1982;57:668-673.
15. Carpenter RG. Scoring to provide risk-related primary health care: evaluation andup-dating during use. J R Stat Soc Ser A.1983;146(pt 1):1-32.
16. Protestos CD, Carpenter RG, McWeenyPM, Emery JL. Obstetric and perinatalhistories of children who died unexpect-edly (cot death). Arch Dis Child. 1973;48:835-841.
17. Harper RM, Hoffman HJ, eds. SuddenInfant Death Syndrome: Risk Factors andBasic Mechanisms. New York, NY: PMAPress; 1988.
18. Vital Statistics of the United States 1970-88,Vol. 1: Natology, Part B. Hyattsville, Md:National Center for Health Statistics.
636 American Journal of Public Health May 1995, Vol. 85, No. 5

Postneonatal Mortality Reduction
19. Climatology data for West Virginia. Wash-ington, DC: US Dept of Commerce;1970-1988.
20. World Health Organization. RiskApproachforMaternal and Child Health Care. Geneva,Switzerland: World Health Organization;1978. Offset publication 39.
21. Madelay, RJ, Hull D, Holland T. Preven-tion of postneonatal mortality. Arch DisChild. 1986;61:459-463.
22. Limerick SR. Sudden infant death in
historical perspective. J Clin Pathol. 1992;45(suppl):3-6.
23. Oren J, Kelly D, Shawer DC. Identificationof a high risk group for SIDS among infantswho were resuscitated for sleep apnea.Pediatrics. 1986;77:495.
24. Southall DP, Samuels MP. Strategies forthe prevention of sudden unexplainedinfant deaths based on the hypothesis thatintrapulmonary shunts with prolonged expi-
ratory apnea is a major contributory mecha-nism. JPneumatology. 1989;9(2):191-192.
25. Tudehope DI, Cleghorn G. Home monitor-ing for infants at-risk of SIDS. Aust PediatrJ. 1984;20:137-140.
26. Powell J. An Evaluation of Risk-RelatedIntervention Programme to Reduce the Rateof Possibly Preventable Postperinatal Deathsin Portsmouth and SE Hampshire HealthDistrict. Southampton, England: Universityof Southampton; 1991. Dissertation.
American Journal of Public Health 637May 1995, Vol. 85, No. 5