Reducing Highway Construction Fatalities Through Improved ...
75
8484 Georgia Avenue Suite 1000 Silver Spring, MD 20910 phone: 301.578.8500 fax: 301.578.8572 www.cpwr.com • www.elcosh.org Reducing Highway Construction Fatalities Through Improved Adoption of Safety Technologies Chinweike Eseonu John Gambatese Chukwuma Nnaji Oregon State University March 2018
-
Upload
khangminh22 -
Category
Documents
-
view
0 -
download
0
Transcript of Reducing Highway Construction Fatalities Through Improved ...

8484 Georgia Avenue
Suite 1000
Silver Spring, MD 20910
phone: 301.578.8500
fax: 301.578.8572
w w w. c p w r. c o m • w w w. e l c o s h . o rg
Reducing Highway Construction Fatalities Through Improved Adoption of Safety Technologies
Chinweike EseonuJohn GambateseChukwuma Nnaji
Oregon State University
March 2018

©2018, CPWR-The Center for Construction Research and Training. All rights reserved. CPWR is the research and training arm of NABTU. Production of this document was supported by cooperative agreement OH 009762 from the National Institute for Occupational Safety and Health (NIOSH). The contents are solely the responsibility of the authors and do not necessarily represent the official views of NIOSH.

REDUCINGHIGHWAYCONSTRUCTIONFATALITIES
THROUGHIMPROVEDADOPTIONOFSAFETY
TECHNOLOGIESWorkZoneIntrusionAlertTechnology
Submitted by: Chinweike Eseonu, Assistant Professor, School of Mechanical, Industrial
and Manufacturing Engineering John Gambatese, Professor, School of Civil and Construction
Engineering, Oregon State University Chukwuma Nnaji, PhD Candidate, School of Civil and Construction
Engineering, Oregon State University
Submittedto:TheCenterforConstructionResearchandTraining(CPWR)
(CPWRSmallStudyNo.17‐4‐PS)
i | P a g e
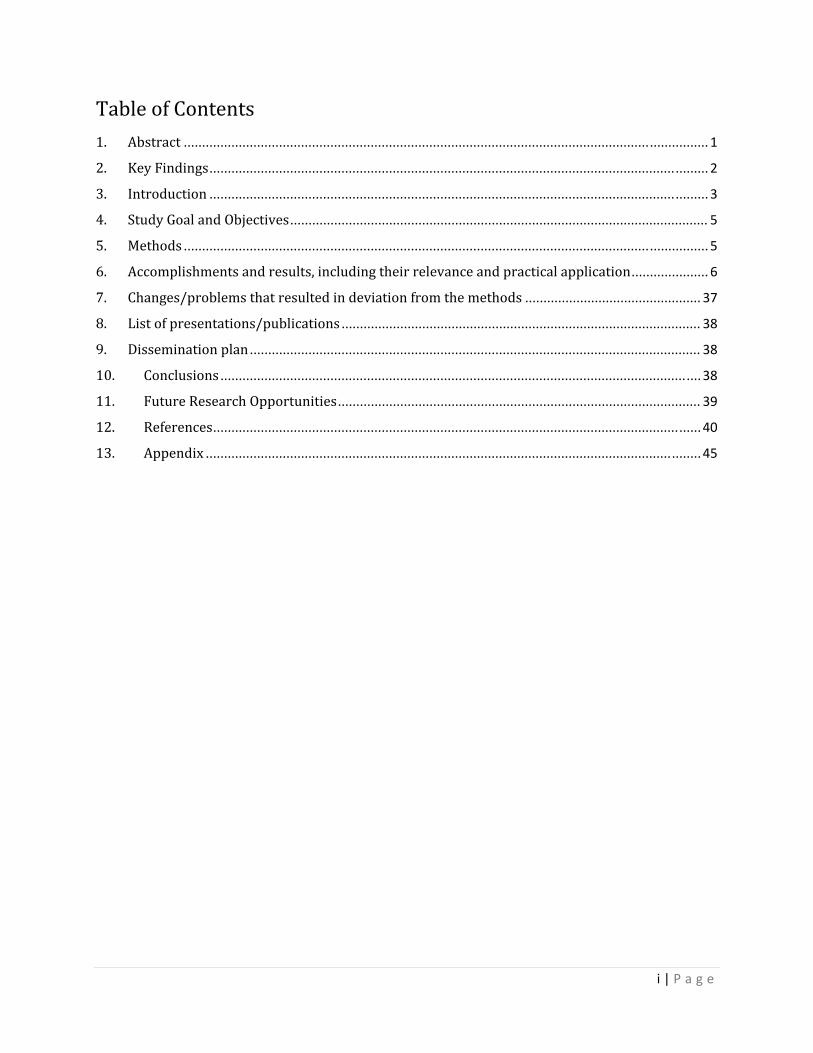
TableofContents1. Abstract ............................................................................................................................................... 1
2. KeyFindings ........................................................................................................................................ 2
3. Introduction ........................................................................................................................................ 3
4. StudyGoalandObjectives .................................................................................................................. 5
5. Methods ............................................................................................................................................... 5
6. Accomplishmentsandresults,includingtheirrelevanceandpracticalapplication ..................... 6
7. Changes/problemsthatresultedindeviationfromthemethods ................................................ 37
8. Listofpresentations/publications .................................................................................................. 38
9. Disseminationplan ........................................................................................................................... 38
10. Conclusions ................................................................................................................................... 38
11. FutureResearchOpportunities ................................................................................................... 39
12. References ..................................................................................................................................... 40
13. Appendix ....................................................................................................................................... 45

1 | P a g e
1. Abstract
Highwayconstructioniscommonlyassociatedwithhighratesofworkeraccidents.
Thesehighratesareoftenlinkedtotherequirementofworkincloseproximitytolive
trafficandheavydutyconstructionequipment.Existingtransportationresearchshows
thattechnologicalsolutions,likeWorkZoneIntrusionAlertTechnology(WZAIT)
improveworkzonesafety.However,feworganizationsinthehighwayconstruction
industryhaveadoptedthesesafetytechnologies.Industryactorsreportconcernsabout
technologyeffectiveness,costimplicationsadoptingnewtechnology,andlackof
technologyfeature‐synergy.Fewstudieshaveexploredstrategiesforimprovingwork
zonesafetytechnologyadoption,implementation,andeventualdiffusionacrossthe
highwayconstructionindustry.Tofillthisgapinresearchandpractice,thisstudy
attemptstodeveloptoolsandidentifyeffectiveprocessesthatcouldbeusedtoimprove
theadoptionofworkzonesafetytechnologiesusingworkzoneintrusiontechnologyas
acasestudy.

2 | P a g e
2. KeyFindings
I. Technological,individual,organizational,andexternalfactorsdeterminethe
extenttowhichWZITadoptionissuccessfulandsustained.
II. WZIATfinancialbenefitsoutweighassociatedcostsifthetechnologiescanprevent
between12.6%and34%oftheintrusionaccidentsthatleadtoinjuriesand
fatalities.
III. Twenty‐onefactorsinfluenceWZIATadoption(Table4).Thesefactorsarelargely
technology‐relatedandwereidentifiedthroughliteraturereviewandinterviews
withsubjectmatterexpertsemployedatcontractorfirmsanddepartmentsof
transportation.
IV. Lackofsharedlanguage/meaning/criteriabetweenendusers(construction
companies)andtechnologymanufacturers/salespeople.Eachgroupprovided
differentsafetytechnologyfeatureimportanceratings.
V. LaborcostassociatedwithWZIATcontributesasignificantfractionoftotal
implementationcost.
VI. Themostimportanttechnology‐basedfactorswere
o workercomprehensionofwarningsignal,
o adequatecoveragedistance,and
o fewornofalsenegativeandfalsepositive.
VII. Easeofuseandsubjectivenormarestrongpredictorsofaworker’sintentionto
acceptandimplementaworkzoneintrusionalerttechnology

3 | P a g e
3. Introduction
WorkZoneInjuriesandFatalities
TheconstructionindustryhasthehighestworkerfatalitylevelsintheUnitedStates.Within
construction,highwayconstructionaccountsfor16%ofthesefatalities(BLS2017).On
average,thistranslatesto121annualworkzonefatalitiesbetween2005and2014,with
onefatalityevery15hoursandoneworkzoneincident‐relatedinjuryoccurringevery16
minutes(FHWA2017).Factorssuchasdriverdistraction,weather,androadway
conditionshavebeenidentifiedasmajorcausesofworkzoneaccidents.Thevolumeof
highwayconstructionandmaintenanceprojectsisexpectedtoincreaseaseconomic
growthspurspublicandprivateinvestment.Thismeanstherearemoreworkzonesand
increasedprobabilityofharmtoworkersandmotorists.
Figure1.Basichighwayconstructionworkzonelayout(AdaptedfromITSI,2011)
Forthisreport,aworkzoneaccidentisanyincidentthatoccurswithinaworkzone.This
includesworkzoneapproachandexit.Existingresearchshowsthatmostcrashesoccur
withinthe“activityarea”(GarberandZhao,2002),whichiswheremostconstruction
workersarelocated.Activityareasinclude“work”,“traffic”,and“buffer”zones.Vehicle
intrusionpastthechannelizingdevices(pictureinsertsinFigure1)isaprimarycauseof
workerfatalities.

4 | P a g e
Figure2showsthatworker“runover”byintrudingvehiclesorconstructionequipment
istheprimarycauseofworkzonefatalities.Othercausesincludecollisionbetween
vehiclesandmobileequipment,andincidentsinwhichworkersarecaughtbetweenor
struckbyconstructionequipment.
Figure2.Distributionbycauseoffatalitybetween2005and2014(n=1209)
(AdaptedfromFHWA2017)
HowdoesTechnologyaffectWorkZoneSafety?
Recently,theFederalHighwayAdministration(FHWA)andotheragenciesimpactedby
workzoneinjuriesandfatalitiesintroducedseveralprogramstohelpcurbworkzone
fatalityrates.ExamplesofsuchprogramsaretheNationalWorkZoneAwarenessWeekand
TurningPoint.Whilepost‐programassessmentsindicateworkzonefatalitieshave
decreased,annualmotorist‐induceddeathshaveremainedrelativelystagnant(Bello2009;
Sant2014).Inresponse,regulatory,industry,andotheragenciesacrosstheUnitedStates
haveencouragedhighwayconstructionstakeholderstoadoptworkzonesafety.This
approachisbolsteredbyresearchthatshowssynergybetweentechnologyuseand
improvedworkersafety.

5 | P a g e
Inpreparingthisreport,theOregonStateUniversityteamundertookadetailedliterature
reviewofover132articles.Therewasamarkedincrease–byabout700%–inworkzone
safetytechnology(WZST)researchbetween2002and2012.Therehasalsobeenan
increaseinWZSTproduction.Asaresult,thereisaneedtoassesswhyadoptionis
significantlylowerthanWZSTresearchanddevelopment.
ExistingresearchhaslookedatWZSTperformanceasameansofassessingtheadoption
challenge.Thisincludesworktoassesseffectivenessofproximitywarningsystems(Parket
al.2015),truck‐mountedattenuators(UllmanandIragavarapu2014),andportable
changeablemessagesigns(GambateseandZhang2016).However,otherstudiesshowthat
WZSTadoptionispersistentlylowbecause1)itisdifficulttoquantifytheholisticbenefits
ofcertaintechnologiesusingadirectmeasureofeffectiveness(DMOE),2)returnon
investment(ROI)andbenefit‐costanalyses(BCA)areoftennegativeorinconclusive,and3)
thereareconflictingopinionsaboutWZSTusefulnessandeaseofuse(Fyhrie2016;Edera
etal.2013;Huebschmanetal.2003).WhileresponsestochallengeslikeROIarefocusedon
management,DMOEandopinionsabouteaseofuseandusefulnesscallfor
employee/workerfocusedstrategies.ThefollowingsectionisfocusedonaWZST–Work
Zoneintrusionalerttechnology(WZIAT)–thathasnotsuccessfullydiffusedacrossthe
highwayconstructionindustry.
WorkZoneIntrusionAlertTechnology
Workzoneintrusionalerttechnologies(WZIATs)arealert‐producingdevicesusedtowarn
workerswithinanactivityareaofanimpendingaccidentcausedbyavehicleintrudinginto
theworkzone.Theobjectiveistosecureadditionaltimeforworkerstoreactwhenan
intrusionoccurs.Firstintroducedtoworkzonesin1995,WZIATwastheproductofa
StrategicHighwayResearchProgram(SHRP)sponsoredstudy(AgentandHibbs1996).
SincetheSHRPprogram,severalWZIATshavebeendeveloped,evaluatedbydepartments
oftransportation(DOTs),andimplementedinworkzonesonanumberofhighway
projects.

6 | P a g e
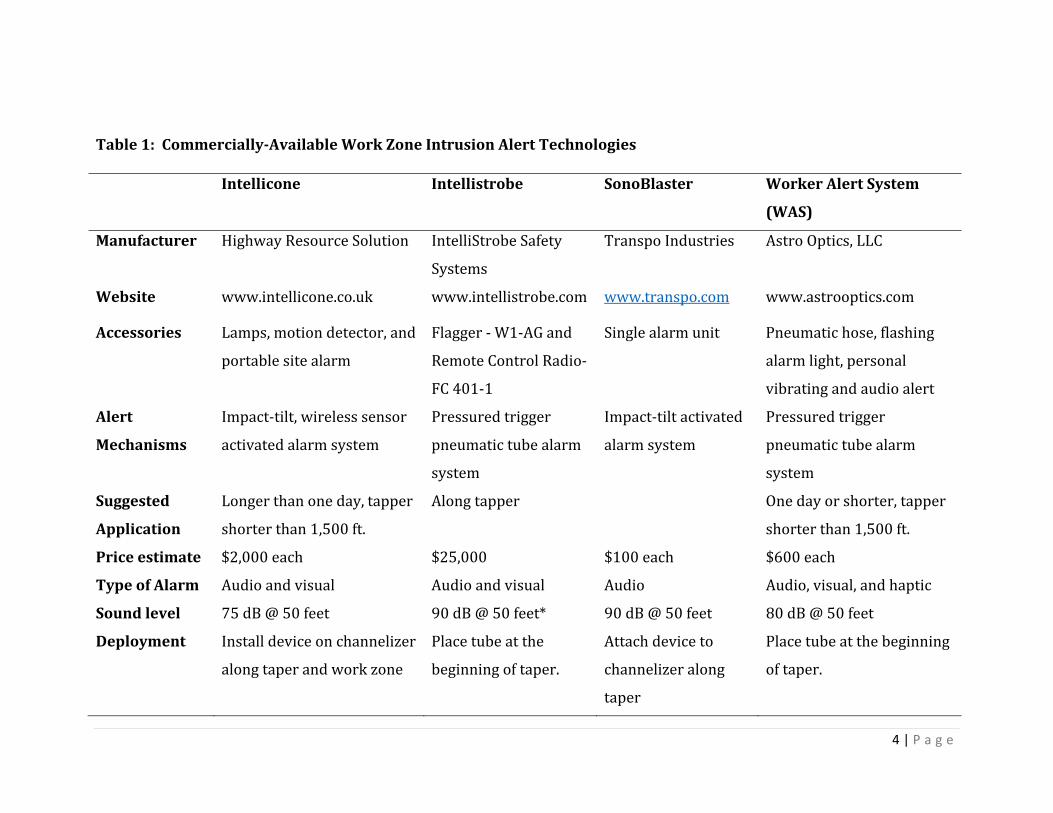
TherearecurrentlyfourcommerciallyavailableWZIATs.Table1isasummaryofthese
WZIATs,includingattributesextractedfrompastresearch(Wangetal.2011;ELWC2015;
HighwayResourceSolution2015;Gambateseetal.2017;Marksetal.2017).
InadditiontotheWZIATslistedinTable1,OldcastleMaterialsrecentlyintroducedanalert
technologynamedAdvancedWarningandRiskEvasion(AWARE).Thesystemrelieson
positionandorientationsensorsandradarstoconstantlymonitortheworkzone.While
initiallyintendedtoalertdriversoftheirintrusionintoaworkzone,thesystemisalso
beneficialforalertingworkersofintrudingvehicles.AWAREisundergoingtestingandis
notcurrentcommerciallyavailable(http://artisllc.com/highway‐safety/;
http://theasphaltpro.com/oldcastle‐aware‐system/).
DespitetheintroductionofWZIATover20yearsago,therehasbeenlimitedapplicationof
WZIATinworkzones(Wangetal.2011;Gambateseetal.2017).Thisphenomenoncould
beattributedtoseveralfactorssuchasreportedinaccuratealarms,difficultytoinstalland
retrievedevices,lackofevaluationprotocol,non‐existingbusinesscaseanalysis,andlow
productawareness(Fyhrie2016;Wangetal.2011).
4 | P a g e
Table1:Commercially‐AvailableWorkZoneIntrusionAlertTechnologies
Intellicone Intellistrobe SonoBlaster WorkerAlertSystem
(WAS)
Manufacturer HighwayResourceSolution IntelliStrobeSafety
Systems
TranspoIndustries AstroOptics,LLC
Website www.intellicone.co.uk www.intellistrobe.com www.transpo.com www.astrooptics.com
Accessories Lamps,motiondetector,and
portablesitealarm
Flagger‐W1‐AGand
RemoteControlRadio‐
FC401‐1
Singlealarmunit Pneumatichose,flashing
alarmlight,personal
vibratingandaudioalert
Alert
Mechanisms
Impact‐tilt,wirelesssensor
activatedalarmsystem
Pressuredtrigger
pneumatictubealarm
system
Impact‐tiltactivated
alarmsystem
Pressuredtrigger
pneumatictubealarm
system
Suggested
Application
Longerthanoneday,tapper
shorterthan1,500ft.
Alongtapper Onedayorshorter,tapper
shorterthan1,500ft.
Priceestimate $2,000each $25,000 $100each $600each
TypeofAlarm Audioandvisual Audioandvisual Audio Audio,visual,andhaptic
Soundlevel 75dB@50feet 90dB@50feet* 90dB@50feet 80dB@50feet
Deployment Installdeviceonchannelizer
alongtaperandworkzone
Placetubeatthe
beginningoftaper.
Attachdeviceto
channelizeralong
taper
Placetubeatthebeginning
oftaper.

5 | P a g e
4. StudyGoalandObjectives
Theprimarygoalofthisstudyistoreduceworkzoneincident(injuryandfatality)
occurrenceandseveritybyidentifyingfactorsthatdriveworkzonesafetytechnology
adoptioninthehighwayconstructionindustry.Previousresearchshowsthattechnology
utilizationincreasesworkersafety,soitisexpectedthatproactivesteps,likeeffective
worker‐centricsafetytechnologyadoption,willreduceworkzoneincidentoccurrenceand
severity.Objectivesestablishedforthestudyinordertomeettheprimarystudygoal
include:
I. Investigatehowsafetytechnologyaffectsworkersandhighwayconstructionwork
zones;
II. Developandevaluateamodelforworkzonesafetytechnologyacceptance;and
III. DevelopproposedframeworksfordeterminingfinancialimplicationsofWZIAT
adoption,andstandardizedprotocolsforevaluatingWZST‐includingWZIAT.
5. Methods
Amixed‐methodsapproachinvolvingacombinationofqualitativeandquantitative
methodswasadoptedtoinvestigatetheresearchobjectives.Specifically,anextensive
reviewofextantliteratureonWZSTwasconductedtoidentifyandassesstheeffectiveness
ofthetechnologiescurrentlyusedtoprotectworkersinconstructionworkzones.In
additiontoidentifyingtheWZSTs,theliteraturereviewprovidedanopportunitytoidentify
potentialbarriersanddriversofadoptingWZSTaswellaskeytechnologyattributesthat
influencetechnologyacceptance.Aconcurrenttriangulationprocesswhichreliedona
cross‐sectionalsurveyof,andin‐depthinterviewswith,highwayconstructionstakeholders
wasutilizedtoprovideadditionalcontextualinformationonfactorsthatinfluencethe
acceptanceofWZSTs.Lastly,acasestudyapproachwasadoptedtoprovideobservational
datarequiredtodevelopbenefit‐costanalysis(BCA)andreturnoninvestment(ROI)for
workzoneintrusionalerttechnologies.

6 | P a g e
6. Accomplishmentsandresults,includingtheirrelevanceand
practicalapplication
Toensurethattheresearchobjectivesweresufficientlymet,thefollowingresearch
questionsweredevelopedtoguidethestudy:
I. Whatarethemajorcausesofworkerfatalitiesandhowoftendotheyoccur?
II. WhatistheusefrequencyandperceivedeffectivenessofexistingWZIT?
III. Areend‐usersreceptivetotheadoptionofnewworkzonesafetytechnology
(WZIATandothertechnologies)?
IV. Whatisthecurrentprocess/protocolusedforadoptingworkzonesafety
technology(WZIATandothertechnologies)?
V. Whatfactorsimpacttheacceptance,use,anddiffusionoftechnologyinhighway
construction?
VI. Doessafetyclimateimpactsafetybehavior(decisiontoadoptatechnology)
VII. Towhatextentdoesend‐user(consumer)andsafetytechnologymanufacturer
WZSTexpectationsconverge?
VIII. DoesinvestmentinWZIATrepresentvalueformoneyforcontractorsandDOT’s?
Answerstotheresearchquestionsweredistributedacrossfiveprimarytaskswhichwere
successfullyexecutedbytheresearchers.Eachofthetasksandcorrespondingresultsare
providedbelow.
Task1:Investigatetheimpactofsafetytechnologyonworkzoneconstruction
workers
Assessinganddocumentingtheimpactofsafetytechnologiesusedinhighwayworkzones
wastheprimaryobjectiveofTask1.Inaddition,identifyingthemajorcausesofworker
fatalitiesinworkzonesandtheenablersandbarrierstoadoptionofworkzonesafety
technologywasconductedwithinthissection.Toachievetheseobjectives,theresearchers
reliedonasystematicreviewprocessusingaprovenreviewframework(Hongetal.2012;
YiandChan2014),aretrospectiveanalysisofworkerfatalitieswithinFACEdatabase,and
interviewresultsfromaprecedingstudy(Gambateseetal.2017).Intotal,132articleson

7 | P a g e
workzonesafetytechnologyassessmentwereidentifiedthroughthesystematicreview
processinvolvingfourdatabases.
PublicationtrendsshowthatthenumberofstudiesfocusedonWZSTevaluationshas
increasedsteadilyoverthepast25years.Atthesametime,thenumberoffatalitiesinwork
zoneshasreducedprogressively.Althoughdifficulttoassert,thetrend,depictedinFigure
3,suggeststhepossiblepresenceofarelationshipbetweenthelevelofinterestand
adoptionofsafetytechnologiesandthereductionofworkerfatalities.
Figure3:NumberofWorkZoneFatalitiesandWZSTEvaluationStudies
Whilethetrendinevaluationstudiesisabettermetricformeasuringthelevelofinterestin
WZST(comparedtotheactualadoptionofsuchtechnologies),anindicationofinterestis
expectedtotranslatetoactualtechnologyadoption(Davisetal.1989).

8 | P a g e
Thetechnologiesevaluatedinthearticlesreviewedprimarilyfellwithinthreecategories
basedontheobjectiveoftheWZSTasfollows:
I. Speedreductionsystems(SRS):Thesetechnologiesareusedtoreducethe
travelingspeedofmotoristsatadvancedwarningareas,transitionareas,buffer
areas,andworkareas.Thetechnologiescouldhavedirectorindirectphysical
impactonthetravelingvehicle.
II. Intrusionpreventionandwarningsystems(IPWS):Technologiessetupto
preventerrantdriversfromintrudingintoaworkzoneand/orwarnworkersof
imminentdangerduetoanintrusionintotheworkzone.
III. Workerdetectionsystems(WDS):Thesearetechnologiesimplementedinsidea
workzonetoalertworkersandequipmentoperatorsofanimminentcollision
betweenaworkerandequipment.
AsseeninFigure4,theWZSTSmostfrequentlyevaluatedwerechangeablemessage
systems(CMS),speedenforcementsystems(SE),lanemergesystems(LMS),andwarning
lights.Thesetechnologiesfallwithinthespeedreductionsystemscategory.
Figure4:NumberofEvaluationStudiesforeachWZST

9 | P a g e
Overall,theliteraturereviewindicatesthatthereisagrowinginterestintheevaluation
anduseofWZSTs.Nevertheless,findingsfromthepresentstudyindicatevarying
evaluationapproachesareexecutedforsimilarWZSTs.Thelackofminimumevaluation
requirementsforWZSTscreatesanavalancheofmethodologies,whichmakesitinherently
difficulttocomparefindingsamongstsimilarstudies.
Next,aretrospectiveanalysisofworkzoneincidentswasconductedtoassessthe
usefulnessofWZIAT.AcomprehensiveassessmentofNIOSHFatalityAssessmentand
ControlEvaluation(FACE)Programreportswasconductedbytheresearchersto
determineifWZIATcouldhaveplayedasignificantroleinpreventingthereported
fatalities.Intotal,25highwayworkzonerelatedfatalitycaseswerereportedandevaluated
byNIOSHbetween1984and2007.Although80%ofthedocumentedfatalitieswere
primarilycausedbyworkersbeingstruckbyequipment,threefatalitieswereinducedby
intrudingvehicles.Table2summarizesfactsabouteachintrusionfatality.AsseeninTable
2,usingadditionalworkzonesafetydevicessuchasworkzoneintrusionalerttechnologies
couldhaveimprovedthesurvivalrateoftheworkerskilled.
Table2:SummaryofFACEReportsofHighwayWorkZoneFatalities
CauseofFatality FACERecommendationsPossiblyPreventedby
WZIAT?
Sleepingdriverstruck
maintenanceworkerin
workzone
Periodicallymonitorandevaluate
employeeconformancewithsafe
operatingprocedures;adopt
policiesthatrequireworkersto
workonthemediansideofthe
guardrail;educatethepublic
regardingworkzonesafetyissues
YES
InstallWZIATequipped
withaudioandvibratory
alertsapproximately
400feetupstreamofthe
worker

10 | P a g e
Driverlostcontrolof
vehicleandveeredinto
theworkzonestrikinga
DOTworker
Considertheuseofsupplemental
trafficcontroldevices;consider
installingrumblestripsalongthe
roadwaypavementedgestowarn
motorists
YES
Equipworkerswith
personalalertsystems.
InstallWZIATacross
potentialentrypoints
aroundtheworkzone
Flaggerstruckby
secondarycontactfrom
trucktravelingat55
milesperhour
Considertheuseofadditional
warningsignsandtrafficcontrol
devices;provideandrequireuse
ofhand‐heldorotherportable
radiocommunicationsequipment
byflaggersatalltimes
YES
ImplementWZIATwith
speeddetectorand
personalalertsystems
withatleast600feet
transmissiondistance
Task2:DevelopframeworkforWZSTassessment,adoption,IntrusionTechnology
AcceptanceModel(ITAM),andWZSTevaluationprotocol
HighwayWorkZoneTechnologyAssessmentProcess
Giventheimportantrolesafetytechnologiesplayinkeepingworkerssafeinaworkzone,it
isessentialtocaptureinformationthatcouldhelpimprovetheadoption,implementation,
andacceptanceofusefultechnologies.DOTsplayacentralroleintheadoptionofWZST.In
somestates,DOTsincludecertaintechnologiesintothetrafficcontrolplantherebymaking
theuseofthosetechnologiesmandatoryforcontractors.Adecisionprocessmap(shownin
Figure5)detailingaworkzonesafetytechnologyacceptanceprocesswasdevelopedbased
ontheresearchers’experienceconductingevaluationstudiesonworkzonesafety
technology.Interestinadoptingaspecificworkzonesafetytechnologyisgenerally
instigatedbypeerDOTs,researchers,ormanufacturers.

11 | P a g e
ReferringtoFigure5,tobeconsideredforevaluation,thesafetytechnologyhastobe
capturedintheDOTqualifiedproductlist(QPL).AQPLisalistofproductsandsuppliers
whoseproductsareapprovedtouseonprojectswithoutadditionaldocumentationand
testing.IfthetechnologyisamongtheitemsintheQPL,theDOTevaluatesinternalinterest
intheproduct.Ifadequateinterestisachieved,theRequestforProposal(RFP)scopeis
expandedtoincludeacategorythataddressesthetechnology.Subsequently,researchers
willbeencouragedtosubmitproposalsforevaluatingtheworkzonesafetytechnology.Itis
importanttonotethattheprocessdescribedaboveisstrictlyforasituationwhereaDOTis
championingtheevaluationofaspecificworkzonesafetytechnology.Iftheideaemanates
fromaresearcher,theresearchersubmitsaResearchProblemStatement(RPS)(assuming
thereleasedRFPaccommodatestheevaluationtopic).IftheRPSissuccessful,the
researcherwillbeencouragedtosubmitafullproposal.Iftheproposalisacceptedbythe
DOT,thetechnologyisthentestedtodetermineitseffectiveness.Theassessmentusually
includesapilottestandlivetesting,andincertaincases,anextensivecosteffectiveness
analysis.Iftheproposalisrejected,theevaluationprocessisterminated.Subsequently,
followingtestingofthetechnology,areportisdevelopedtodisseminatethefindingsfrom
thestudy.Iftheworkzonesafetytechnologyisconsideredeffective,theDOTadoptsthe
technologyandmayrequirecontractorstousethetechnologyinfutureprojects.Ifthe
effectivenessofthetechnologyisnotconclusive,recommendationsthatcouldimprove
futureadoptionofthetechnologyaremadeavailable.

12 | P a g e
Figure5:DOTDecisionMapforWorkZoneSafetyTechnologyAdoption
ItisimportanttonotethatalthoughDOTsprescribetheuseofcertainsafetytechnologies
aspartofacontractrequirement,contractorscouldchoosetoutilizeadditionalsafety
technologiesinconstructionworkzones.Currently,informationontheprocessutilizedby
contractorstoarriveatacongruentdecisionforadoptingsafetytechnologyisnonexistent.
Therefore,theresearchersproposedandvalidatedaframeworkthatdescribestheprocess
ofadoptingasafetytechnology.Also,thisframeworkcouldbeimplementedwithinthe
“AssessTechnology”stageoftheDOTtechnologyacceptanceprocess.

13 | P a g e
SafetyTechnologyAdoptionFactors
Anintegrativereviewofliteratureindicatesthattechnologyadoptioncanbepredictedby
assessingseveralfactorsdistributedintofourprimarycategories:individual,
organizational,technological,andenvironmental.Atheoreticalframeworkdescribingthe
processleadingtotechnologyadoptioncanbefoundinFigure6.Projectmanagersfrom
eighthighwaycontractingorganizationswereinterviewedtovalidatetheaccuracyofthe
proposedadoptionprocess.ThesecompanieswereprimarilylocatedinthePacific
Northwestwithannualrevenuerangingbetween$10millionand$2billion.
Figure6.SafetyTechnologyAdoptionProcess

14 | P a g e
Oneprimarydeficiencyinextantliteratureassociatedwithworkzonesafetyisthelackof
someconsensusontheprimaryphasesforconductinganevaluationstudy.Anevaluation
studyisakeycomponentinthetechnologycategoryofthesafetytechnologyadoption
process.Inthenextsection,theresearcherssummarizetheprimarystepsrequiredto
conductaneffectiveWZSTevaluationstudy.Theevaluationprotocolwasdevelopedaspart
ofastudyconductedbyGambateseetal.(2017).
WZSTEvaluationProtocol
Developingatestingprotocol,groundedinscientificrigor,playsapivotalroleinvalidating
thefindingsofanevaluation‐basedstudy.AccordingtoFyrie(2016),itisessentialto
developatestingprotocolforWZSTstoimproveperceptionofusefulnesswhichcould
impactuserintentiontoadopttechnologyalongsideencouragingtheproductionof
additionalWZSTs.Inordertodeveloparigorousprocess,theresearchersreliedon
StrategicHighwayResearchProgram(SHRP)reportsandpastworkzonetechnology
evaluationreports(AgentandHibbs1996;Brownetal.2015;Marksetal.2017;Marksand
Teizer2013;Novosel2014;Parketal.2017;Teizeretal.2010;ZhangandGambatese
2017).TosuccessfullyevaluateaWZST,thestepsdepictedinFigure7arerecommended
anddescribedindetailbelow.
Figure7:WZSTEvaluationProtocol

15 | P a g e
Step1:DocumentationofTechnologies
Itisimperativetoaggregateandreviewliteratureoncurrentlyavailabletechnologiesthat
havehighpotentialforpreventinginjuriesinhighwayworkzones.Thisstepcanbe
achievedthroughacomprehensivesearchofarchivalpublicationsusingInternetsearch
engines.Theoutputofthissearchanddocumentationshouldincludetechnical
specificationsoftheWZST,associatedbenefitsofusingtheWZST,limitationstoitsuse,and
summariesoffindingsfrompriorresearchonthetechnology.
Step2:SurveyofCurrentPractice
Step2involvesconductingasurveyofhighwayconstructionandmaintenancekey
stakeholdersincludingstatedepartmentsoftransportation(DOTs),constructionand
trafficcontrolcontractors,equipmentvendors,etc.Theobjectiveofthesurveyisto
documentcurrentandrecommendedpractices,barriers,enablers,andimpactsassociated
withtheWZST.FindingsfromStep2resultintheidentificationofthestatusquoofthe
constructionindustryanditscurrentbestpracticeintermsofpreventingaccidentsthat
couldbepreventedbyimplementingtheWZST.
Step3:PilotTestingofTechnologies
BasedontheresultsofSteps1and2,asampleoffeasibletechnologiesshouldbeselected
forpilottesting.Selectionshouldconsidertechnologyavailability,cost,easeofuse,
potentialforimprovingsafety,andpotentialforincorporatingthetechnologyintypical
transportationcontrolplans.Pilottestingoftheselectedtechnologiesshouldbeconducted
undercontrolled,off‐roadwayconditions.Eachselectedtechnologyshouldbeassessedto
captureitscapabilities,andrecordhowitisimplemented.Theresultsofthepilottesting
providevitalinformationonfeasibilityofuse,capabilities,andlimitationsrelatedtoeach
technologyunderinvestigation.
Step4:SelectionofTechnologiesforLiveTesting
Followingcompletionofthepilottestingandanalysisoftheresults,Step4involves
conductingfocusgroupsessionswithkeystakeholderssuchasDOTpersonneland
constructioncontractorstoidentifyandselectspecifictechnologiestoimplementandtest

16 | P a g e
inanactiveworkzone.Feedbackoneachofthetechnologiesshouldbesolicitedfromeach
targetedgroup.Thosetechnologiesthataredeemedpromisingbythefocusgroup
participantsshouldbeselectedforfurtherevaluation.Inaddition,potentialconstruction
and/ormaintenanceprojectsonwhichtoconductlivetestingofthetechnologiesshouldbe
discussedwiththeparticipatingDOTpersonnelandcontractorsandselectedforStep5.
Step5:ImplementationandEvaluationofSelectedTechnologies
Step5involvesimplementingtheselectedtechnologiesoneachselectedcasestudyproject.
Dependingonthecasestudyprojectsselected,eachtechnologyshouldbeappliedunder
differentworkzoneconditions(e.g.,short‐termandlong‐term,daytimeandnighttime,and
stationaryandmobile).Eachselectedtechnologyshouldbeimplementedduringactual
workoperationstypicallyexperiencedonprojects.Thetestingprotocolshouldaddressa
varietyofcriteriasuchas:easeofimplementationanduse,abilitytodetectpotential
hazard,abilitytowarnofimpendinghazard,sensitivitytofalsealarms,andimpactonrisk
toworkersafety,andimplementationcost.Uponcompletionoftesting,feedbackoneach
technologyshouldbecollecteddirectlyfromtheconstructionandmaintenanceworkers
involvedineachcasestudyproject.
Next,theresearchersproposeabasictheoreticalframework–ITAM‐forcapturing
informationthatinfluencestheacceptanceandutilizationofaWZST(WZIATascasestudy)
byendusers.
IntrusionAlertTechnologyAcceptanceModel(ITAM)Structure
Consumermarketingresearchhasbenefitedgreatlyfromapplyingpredictive(forecasting)
andassessmentmodelsthatdrawfromunderstandingkeyfactorsthatinfluenceintention
toacceptaproduct.Thepresentstudycombinesthepredictivestrengthoftwowell‐
foundedtechnologyacceptanceandbehavioraltheoriesasameanstounderstandfactors
thatinfluencetheadoptionofaWZST.Althoughdesignedmainlyusingconstructs
(parameters)associatedwithWZIAT,theproposedmodelcanbeappliedtoWZSTand
othertechnologyadoptionsituationswithsimilarcharacteristics.Thetwomodelstobe
combinedareTechnologyAcceptanceModel(TAM)andTheoryofPlannedBehavior(TPB)
(Mathieson1991;VenkatechandDavis1996;Mathiesonetal.2001;Chuttur2009).Figure

17 | P a g e
8depictsthesimplifiedintrusionalerttechnologyacceptancemodel(ITAM)usedinthis
study.
Figure8:IntrusionAlertTechnologyAcceptanceModel
Theconstructsabovecanbedefinedas:
PerceivedEaseofUse(PEU):beliefthatusingatechnologywillrequirelittleeffort
SubjectiveNorm(SN):anindividual’sperceptionregardingagivenactionwhichis
significantlyinfluencedbythejudgementofsignificantothers
PerceivedUsefulness(PU):beliefthatusingatechnologywouldimprovejob
performance
BehavioralIntention(BI):anindicationofaperson’sintentiontoperformagiven
task
BIwaschoseninsteadofactualbehavior(observableresponsesuchasacceptingtousea
technology)sincetheuseoftechnologiessuchasWZIATisnotwidespread.Inaddition,
pastresearchindicatesthatinmostcases,behavioralintention,isagoodpredictorof
actualuse(Venkateshetal.2002).
Theresearcherskeptthemodelsimplegiventheexploratorynatureofthepresentstudy.
FuturestudiesshouldconsiderincludingotherTPBconstructssuchasattitudeand
perceivedbehavioralcontrol.

18 | P a g e
Task3:Collectandanalyzedatafromhighwayconstructionstakeholders
TheresearchersconductedanonlinesurveyinordertoanswerresearchquestionsV,VI,
andVII.FollowingreviewofthesurveyinstrumentandprotocolbytheOSUInstitutional
ReviewBoard(seecopyofsurveyquestionnaireintheAppendix),theresearcherspre‐
testedthereliabilityandconsistencyofthesurveyquestionsusingdatareceivedfromcivil
andconstructionengineeringstudentsatOSU.Beforecollectingstudentfeedback,a
presentationwhichincludedvideosandpicturesofworkzoneintrusionaccidents,work
zonesafetytechnologies,andresultsfromaWZIATevaluationstudywasfacilitatedand
conductedbytheresearchersforthestudents.Thepresentationwasconductedtoensure
participatingstudentshadsufficientinformationtoprovideusefulfeedbackonfactorsthat
couldinfluencetheadoptionofWZIAT.Atotalof145responseswerereceivedfrom
participatingstudentsintwodifferentcoursesofwhich135responseswereanalyzed(10
responseswereincomplete).ReliabilitytestsincludingKaiser‐Myer‐Olkin,Cronbachalpha,
andBarletttestofsphericitywereconductedtoensurethattheresearchtoolscaptured
reliableinformation.
Followingevaluationofthesurveyinstrument,thesurveyquestionnairewasdistributedto
thetargetedhighwayconstructionstakeholders.Surveyresponseswerecollectedfrom181
individuals(316,includingstudents)withinthetargetpopulation.Specifically,owner
agencies,includingDOTsandresearchinstitutions,accountedfor38%(69)ofthereceived
responseswhilegeneralcontractors,workzonesafetyconsultants,andworkzone
technologymanufacturersandvendorsaccountedfor38%(53),11%(20),and21.5%(39)
oftheresponses,respectively.Furthermore,64respondents(35%)self‐identifiedas
projectmanagerswhile37trafficengineers(20%ofrespondents)responded.Responsesto
thequestion“Areyoufamiliarwithworkzoneintrusionalerttechnology”indicatethat
mostoftheparticipantsarefamiliarwithWZIAT(80%ofthe141responsesreceivedtothe
question,approximately62%ofallrespondents).

19 | P a g e
WZIATfeature/attributeimportance(combinedandbyworkcategory)
Forsomequestions,therespondentswereaskedtoprovidetheiropinionaboutWZIAT
usingaLikert‐typescale(e.g.,1=notimportant,5=veryimportant).Whenasked“How
importantarethefollowingattributestoyourdecisiontoadoptWZIAT,”participants
indicatedthatworkercomprehensionofwarningsignal(meanresponse=4.44)and
adequatecoveragedistance(meanresponse=4.25)areconsideredthemostinfluential
attributesthatimpactthedecisiontouseaWZIAT.TheresultsaresummarizedinTable3.
Easeofstorageisconsideredtheleastimportantattribute(mean=2.94).Acomprehensive
tableoftheresultscanbefoundintheAppendix.
Table3:WZIATFeature/AttributeImportancetoAdoptionDecision
MeanResponseregardingImportanceof
Feature/Attribute
(1=notimportant,5=veryimportant)
WZIATFeatures/Attributes Contractor
(n=53)
DOT
(n=69)
Manuf.&
Vendors
(n=39)
Total
(n=316)
Workercomprehensionofwarning
signal
4.6 4.67 4.3 4.44
Adequatecoveragedistance 4.51 4.36 4.22 4.25
Driveradequatelycomprehendsvisual
andaudiowarning
4.25 4.39 3.62 4.21
Impactofwarningalertondriver 4.17 4.41 3.78 4.18
Fewornofalsealarms 4.38 4.33 4.03 4.17
Limitsworkerexposure 4.51 4.48 4.08 4.15
Multiplewarningalertsources 4.08 4.23 4.16 4.08
Reusable 4.19 3.79 4.10 4.04
Manuf.=technologymanufacturer

20 | P a g e
Differenceinmeanratingbetweengroups
Itisessentialtoconductastatisticalanalysistoverifythepresenceofanalignment
betweenthesubgroups’‐especiallycontractorsandmanufacturers–perceptionsof
importantWZIATattributes.Thisverificationcanbeachievedbyeitheraparametricor
non‐parametricindependentsamplemeantest(t‐test).First,theresearchersassessedthe
databyworkgrouptoguidetheapplicationofparametricornon‐parametrictesting.Atest
fordatanormalitywasnotconductedgiventhatthesamplesizeforeachgroupwasatleast
30(GhasemiandZahediasl2012).Levene’sTestofEqualityofvariancewasconductedto
determineiftheassumptionofhomogeneityofvariancewasviolated.Thetestreturneda
mixedresultwithsixoutofthe21factorsviolatingtheequalvarianceassumption.Takinga
conservativeapproach,theresearcherelectedtoperformanon‐parametrictwo‐sample
test–theMann‐WhitneyUTest‐toreducetheTypeIerrorrate.Table4summarizesthe
resultsfromtheMann‐WhitneyUTestbetweenresponsesreceivedfrommanufacturers
andotherworkgroups.AsseeninTable4,thelevelofimportanceassignedtoeachWZIAT
attributedifferedsignificantlyforsevenoutof21attributeswhencomparingthe
manufacturers’responsestothosereceivedfromtheDOTemployees.Thisresultindicates
thepossibilityofamisalignmentbetweentheend‐users’andmanufacturers’perceptionsof
theimportanceofeachWZIATattribute.Thisresultsuggestsaneedforheightened
involvementofDOTsandcontractorsinthedevelopmentphaseofsimilartechnologies.
Thedevelopmentofstandardtoolsthathelpbridgetheknowledgegapbetween
manufacturersandend‐usersshouldbeencouraged.

18 | P a g e
Table4:Non‐Parametrictestfordifferenceinmeanbetweengroups;Mann‐WhitneyUTest
WZIATAdoptionfactors Contractorvs.
Manufacturer
DOTvs.
Manufacturer
Contractorvs.DOT
UStatistic p‐value UStatistic p‐value UStatistic p‐value
Easeofdeployment/retrieval 973.5 0.602 1292.5 0.707 1652.5 0.317
Easytomovethetechnologyaround 728 0.032 1271 0.596 1588.5 0.176
Userfriendliness 849 0.105 1052.5 0.043 1700.5 0.45
Littleornoimpactontrafficflowandcontrolwithinworkzone 822 0.081 1332.5 0.929 1415 0.024
Limitsworkerexposure 778 0.026 1039.5 0.031 1797 0.852
Easytostore 857 0.139 1104 0.107 1771 0.755
Resistancetoenvironmentalandphysicalimpact 871.5 0.467 923.5 0.023 1482.5 0.057
Reusable 978 0.629 1019.5 0.029 1328.5 0.008
Easytomaintain 900 0.352 1185 0.53 1712.5 0.722
Extendedbatterylife 866.5 0.141 997.5 0.022 1586 0.221
Costoflaborandequipment 885.5 0.305 1167 0.385 1754 0.794
Availabilityofequipmentinthemarket 734.5 0.047 1254 0.792 1527.5 0.123
Costofreplacingparts/maintenance 956.5 0.668 1264 0.846 1755 0.796
Impactofwarningalertondriver 936 0.697 1102.5 0.207 1605.5 0.206

17 | P a g e
Workercomprehensionofwarningsignal 824.5 0.142 1018 0.043 1750.5 0.621
Multiplewarningalertsources 860 0.283 1268 0.951 1591.5 0.183
Adequatecoveragedistance 874.5 0.327 1260.5 0.907 1627 0.243
Limitedphysicalimpactonvehicle 729 0.033 1208.5 0.638 1604 0.222
Driveradequatelycomprehendsvisualandaudiowarning 725.5 0.027 869.5 0.004 1737 0.604
Fewornofalsenegativeandpositivealarms 804 0.114 1063.5 0.122 1799 0.866
Lessdependenceonexistinginfrastructure 923.5 0.621 1218 0.683 1805 0.899

19 | P a g e
Potentialimpactofsafetyclimate
Giventhatpastresearchindicatesapossiblecorrelationbetweensafetyclimateandsafety
behavior(SchwatkaandRosecrance2016),theresearchersexploredthepotential
relationshipbetweensafetyclimateandconstructionworkerdecisionstoadoptasafety
technology.Toachievethisobjective,theresearchersutilizedanadaptedversionofa
safetyclimatematurityassessmenttooldevelopedbyTheCenterforConstruction
ResearchandTraining(CPWR)alongsidethe“behavioralintention”constructoftheITAM.
Thesafetyclimatemeasuringscalehaseightleadingindicators:Demonstrating
ManagementCommitment;AligningandIntegratingSafetyasaValue;Ensuring
AccountabilityatAllLevels;ImprovingSupervisoryLeadership;EmpoweringandInvolving
Workers;ImprovingCommunication;TrainingatAllLevels;andEncouragingOwner/Client
Involvement(CPWR2015).Toutilizethescale,workersareaskedtoanswerquestions
(between3to6questions)withineachleadingindicator.Thequestionsaredesignedto
illicitresponsesregardingthecompany’scommitmentandattitudetowardssafetyusinga
scalethatrangesfrominattentivetoexemplary(seehttps://www.cpwr.com/whats‐
new/new‐safety‐climate‐assessment‐s‐cat‐websiteformoreinformationonthesafety
climatemeasuringscale).Duetothelengthofthesafetyclimatescale(36questions
requiringadecentamountofreading),theresearchersreducedthenumberofquestions
foreachleadingindicatortotwo(16intotal).Thereductionwasachievedthrough
evaluatingthestatisticalanalysisconductedbythedevelopersofthesafetyclimatescale–
selectingtheitemsineachcategorywiththehighestmeanscoreandtheleastvariance.
Atotalof53contractorscompletedthesurveysubstantially.However,onlyatotalof45of
therespondingcontractors(85%)providedsufficientinformationforexploringthe
connectionbetweensafetyclimateandadoptiondecision.
Toexplorethepotentiallinkbetweensafetyclimateandtechnologyadoption,the
researchersseparatedtherespondentsintotwogroups–“exemplary”and“below
exemplary”–usingtheaggregatemeanvalueofeachleadingindicator.Thatis,the
responsesreceivedfromeachsurveyparticipantweresummedandthendividedby16
(thetotalnumberofquestionsacrosstheeightleadingindicators).Theresearcherselected

20 | P a g e
tosetacumulativemeanthresholdof4.0andaboveas“exemplarysafetyclimate”inline
withthedesignofthesafetyclimatemeasuringtool.Ameanvaluebelow4.0was
considerednotexemplary.Twenty‐fiveofthe45respondingcontractors(56%)self‐
reportedacumulativemeanaveragegreaterthan4.0.Next,linearregressionwaschosento
investigatethelevelofimpactsafetyclimatecouldhaveonthe“behavioralintention”
construct.Toconducttheanalysis,thesafetyclimaterating(SCR)meanvalueforthetwo
groups(exemplaryandnotexemplary)werechosenasindependentvariableswhilethe
meanvalueof“behavioralintention”(BI)‐whichispartoftheITAMconstruct‐was
selectedasthedependentvariable.Priortoconductingthelinearregression,the
researcherscheckedtoverifyifanyassumptionwasviolated.Althoughthesamplesize
requirementwasmet(atleast20casesperindependentvariable),theresearchers
observedthatthedatawasnotlinearandshowedevidenceofheteroscedasticity.Giventhe
concernsidentifiedwithinthedata,theresearcherselectedtoconductanonparametric
analysisfocusingondirectionality.Spearmancorrelationwasexecutedtoinvestigatethe
directionalrelationshipbetweenSRCandBI.Althoughnotstatisticallysignificant,the
results,highlightedinTable5,indicatethatSCRfortheexemplarygrouphasapositive
correlationwithBI(γ=0.374).Table6showstherelationshipbetweenSCRandBIforthe
“belowexemplary”groupwaslessthanthatoftheexemplarygroup(γ=0.021).
Table5.CorrelationbetweenBehavioralIntention(BI)andSafetyClimateRating
(SCR)of“Exemplary”Group
Spearman'srho SCR BI
SCR CorrelationCoefficient 1.000 0.374
Sig.(1‐tailed) . 0.052
N 25 25
BI CorrelationCoefficient 0.374 1.000
Sig.(1‐tailed) 0.052 .
N 25 25

21 | P a g e
Table6.CorrelationbetweenBehavioralIntentionandSafetyClimateRating(SCR)of
“BelowExemplary”Group
Spearman'srho SCR BI
SCR CorrelationCoefficient 1.000 0.021
Sig.(1‐tailed) . 0.461
N 20 20
BI CorrelationCoefficient 0.021 1.000
Sig.(1‐tailed) 0.461 .
N 20 20
Task4:ConductfinancialanalysisforWZIAT
Onepossiblereasonfortherelativelylownumberofcommerciallyavailableintrusion
alarmtechnologiesisthelackofacost‐benefitanalysis(Fayrie2016).Furthermore,as
intrusionalarmtechnologiesrequiresomeinvestment,consumers(DOTsandcontractors)
needanempiricalframeworktodeterminethefinancialimplicationoftheintervention.To
developarobustframeworkthatprovidesparametersthatcanbeusedtojudgeifthe
investmentintheintrusionalarmisworthwhile,theresearchersreliedontheframeworks
describedbyAASHTO(2010),Theissetal.(2014),AricoandRavani(2008),andSunetal.
(2011).GiventhattheimplementationofWZIATrequiresatwo‐phaseadoptionprocess
(adoptionbystatedepartmentoftransportationandcontractor),itisimportantthat
financialmetricsspecifictotheend‐usersareconsidered.Hence,aframeworkforROI
(Contractor)andBCA(DOT)wasdeveloped.ThreeWZIATs–AWARE,Intellicone,andWAS
–wereevaluatedaspartofthefinancialanalysis.

22 | P a g e
CostofImplementingWorkZoneIntrusionAlertTechnologies
AccordingtoBoardmanetal.(2001),nineprimarystepsarerequiredinothertoconducta
basicfinancialanalysisforgovernmentinterventions,regulations,policies,programs,etc.
Thestepsare:
I. Specifythesetofalternativeprojects
II. Decidewhosebenefitsandcostscount
III. Cataloguetheimpactsandselectmeasurementindicators,orunits
IV. Predicttheimpactsquantitativelyoverthelifeperiodoftheproject
V. Monetize(adddollarvaluesto)allimpacts
VI. Discountbenefitsandcoststoobtainpresentvalues
VII. Computethenetpresentvalueofeachalternative
VIII. Performsensitivityanalysis
IX. Makerecommendationbasedonfindings
Giventhescopeofthecurrentstudy,theresearchersfocusedonthestepsrequiredto
developafinancialimplicationanalysisframeworkforeachWZIAT(StepsIII,IV,V,VI,and
VII).
StepsIIItoVinvolvetheidentification,collection,andmonetizationofinputsandoutputs
(information)requiredtoperformafinancialanalysis.Tables7and8captureessential
informationrequiredtoestimatethecostofimplementingthetechnologies.The
informationpresentedinTables7and8wasacquiredthroughinterviewswithcontractors,
reviewingliteratureonWZIATsandotherworkzonesafetytechnologies,andassessing
manufacturer’swebsitesandmanuals.

23 | P a g e
Table7.CostInputData
CostItem WorkzoneIntrusionAlert
Technology
AWARE Intellicone WAS
Capitalcost($/device) 50,000 2,000 $750
Costofrequiredaccessory/ies($) 35
Batterycost($/device) 20 15
Batterylife(weeks) 32 32
DeviceReplacementrate(%/year) 0.125 0.125 0.125
StrobeReplacementrate(%/year) 0.10 0.13
Maintenanceworkerwagerate($/h) 26 26 26
Maintenancetime(hr/week/mile) 2.1 4.2 4.2
Wageratemultiplier 1.5 1.5 1.5
Disposalcost 0 0 0
Costperday:
Maintenancecost($) 20.48 40.95 40.95
Devicecost($) 78.12 $3.13 $1.17
Sensorcost($) $0.05
Batterycost($) 0.16 0.12
Table8.CostofusingWorkZoneIntrusionAlertTechnologiesinWorkZones
CostItem WorkzoneIntrusionAlert
Technologies
AWARE Intellicone WAS
Numberofdevicespermile 1 1 8
Usedononesideofroadway 2 2 16
Usedonbothsidesofroadway 1 1 8
Numberofaccessoriespermile

24 | P a g e
Usedononesideofroadway 12 5
Usedonbothsidesofroadway 24 10
Costperdeviceperday($/day) 78.13 3.13 1.17
Costpermileperday($/mile/day) 0.17 ‐
Laborcostperdeviceperday($/day) 20.48 40.95 40.95
Costpermileperday($/mile/day)
Usedononesideofroadway 98.60 46.14 50.33
Usedonbothsidesofroadway 197.20 92.28 100.65
Costpermileperyear($/mile/year)
Usedononesideofroadway 7,888.00 3,691.00 4,026.00
Usedonbothsidesofroadway 15,776.00 7,382.00 8,052.00
InformationinTable7indicatesthatAWARE,Intellicone,andWAScost(operationand
capitalcost)$98.60,$46.14,and$50.33perday,respectively.Withtheexceptionof
AWARE,operationcostistheprimarycostdriver,notthecapitalcost(Intellicone=88.5%
andWAS=81.5%oftotalcost).Theseestimatesdoesnotincludeadditionalcostfor
personalsafetydevices;justthecostsofbuyingandoperatingthebasictechnologyare
included.Aneighty‐dayworkyearwasassumedbasedonfivework‐monthsayearand
fourwork‐daysaweek.Theworkdaywasestimatedbasedonthedurationofatypical
pavingseasoninthePacificNorthwest.Thenumberofannualworkdayswillvary
dependingonthelocation.Thecostperdaycalculationincludedastraight‐linecapitalcost
deprecationofeachtechnology.Ashelflifeofeightyearswasassumedbasedonpast
research(Theissetal.2014).Table8summarizesthecostofimplementingWZIATon
projectsusingcostpermileperyear($/mile/year).TheanalysisshowninTable8includes
calculationforoneandbothsidesofaroadwaygiventhatconstructioncouldhappen
simultaneouslyonbothsidesoftheroadway(bothdirectionsoftraffic).Thetotalcostfor
applyingtheAWARE,Intellicone,andWASinaworkzoneis$15,776,$7,382,and$8,052
permileperyear,respectively.ThefactorsusedtoarriveatthevaluesinTable8are
includedintheAppendix.

25 | P a g e
InjuryCostModel
Thefollowingstepswereundertakeninordertoestimatethecostassociatedwithwork
zoneaccidents:
I. Estimatetotalnumberofworkzoneintrusionaccidents
II. Estimateinjuryseverityofworkzoneintrusionaccidents(usingMAIS)
III. Usecomprehensivecostmethodtoassigncosttoinjuryseverity
IV. UseValueofaStatisticalLife(VSL)toestimatefractionforeachinjurycategory
V. Determineworkzoneintrusion‐inducedaccidentcost
VI. Useworkzonerequiredlengthandtypeofactivitytoseparateoutactivitiesthat
cannotimplementWZIAT
VII. Developtablethatshowstotalcostandavertedcost
Thenumberofworkzoneintrusionaccidentswasestimatedusinginformationfromthe
CaliforniaDepartmentofTransportation(Caltrans)andOregonDepartmentof
Transportation(ODOT).Theseveritylevelofworkzoneaccidentswasestimatedusingthe
MaximumAbbreviatedInjuryScale(MAIS)(AAAM2015).Thecoefficientforeachseverity
levelwasgeneratedusingtheValueofaStatisticalLife(VSL).TheVSListheadditionalcost
thatindividualsarewillingtobearforimprovingsafety(riskreduction)(Moran2016).
Table9highlightstheseveritylevelsandcostassociatedwhicheachlevel(Moran2016).
Table9.CostAssociatedwithDifferentLevelsofAccidentSeverity
MAISLevel Severity VSL(2016)
Fraction Cost(million$)
MAIS1 Minor 0.003 0.029
MAIS2 Moderate 0.047 0.45
MAIS3 Serious 0.105 1.01
MAIS4 Severe 0.266 2.55
MAIS5 Critical 0.593 5.69
MAIS6 Fatal 1.000 9.6

26 | P a g e
IntrusioncrashdatafromODOTindicatesthat165intrusion‐inducedaccidentsoccurred
between2011and2015,anaverageof33workzoneintrusionaccidentsayear.According
toWong(2010),308workzoneintrusionaccidentswerereportedinCaliforniabetween
1998and2007,averaging31workzoneaccidentsayear.Inaddition,Wong(2010)
reportedthataccidentdistributionwhenclassifiedbyworkzonedurationvaried;mobile
operationsaccountedfor49%oftheaccidents,shortdurationoperationsaccountedfor
9%,andshort‐termstationaryoperationscontributed29%ofworkzoneaccidents.
Althoughnotcurrentdata,theresearcherselectedtousethedatafromCaltrans(Wonget
al.2010)duetothesegmentationofthedataintousefulseveritylevels.Sincetheaverage
crashratesaresimilar,theresearchersassumedthatthetrendisapplicableto2017as
well.
Theoutcomesofaworkzoneintrusionledtoaminorinjury91%ofthetime.Amoderate
andseriousinjuryoccurred7%and0.0034%ofthetime,respectively.Onaverage,a
fatalityoccurredapproximately2%ofthetimewhenanaccidentoccurred.
Inagreementwithapreviousstudy(Gambateseetal.2017),somecontractorswereofthe
opinionthatWZIATshouldnotbeusedonmobileprojectsgiventheinherentneedtomove
frequently.However,someDOTpersonnelindicatedthepossibilityofusingWZIATin
mobileoperationstoimproveworkersafety.Therefore,theresearchersdecidedtoinclude
mobileoperation‐relatedaccidentsinthecostanalysisfortheBCAbutnotfortheROI.
BenefitCostAnalysis
Table10liststheinjuryseverity,injurycost,totalcosts,andtheavertedcost.TheInjury
SeverityandInjuryCostareextractedfromTable9whiletotalcostisamultipleofthe
numberofworkersinjuredwithineachinjuryseveritycategoryandinjurycost.For
instance,theTotalCostofInjurySeverity1iscalculatedbymultiplyingtheinjurycost
(0.029)withthenumberofworkerswithaminorinjury(91%of308or281).Theaverted
costrepresentspotentialcostassociatedwithavoidinganinjuryorfatalitywithinthework
durationsusingacountermeasuresuchasWZIAT.

27 | P a g e
Table10.ComparisonofWorkZoneInjuryCost(total)toPotentialAvertedCost‐
BCA
InjurySeverity
(MAIS)
InjuryCost
(million$)
TotalCost
(million$)
AvertedCosts
(million$)
1 0.029 8.128 8.128
2 0.45 9.702 9.702
3 1.01 1.041 1.041
4 2.55 0 0
5 5.69 0 0
6 9.6 59.14 59.14
Total 78.01 78.01
ExpectedYearly
Average
7.801 7.801
Theestimatedavertedcostisoptimisticsincetheunderlyingassumptionisthat
implementationofWZIATwouldpreventallinjuriesandfatalities.Duetoinsufficientdata,
itwasimpossibletoestimatetheactualfractionofpreventableworkzoneintrusion‐
inducedinjuriesandfatalitieswhenWZIATisapplied.Therefore,applyingareduction
factorwouldbeprudentinordertonotover‐estimatethepotentialofthetechnologies.
Table11highlightstheavertedcostwhenapplyingreductionfactorsrangingbetween10%
and90%.
Table11:ApplicationofConservativeFactors(BCA)
Injury
Severity
(MAIS)
Averted
Costs
(million$)
FractionofPreventableInjuriesandFatalities(million$)
10% 20% 30% 40% 50% 60% 70% 80% 90%
1 8.128 0.81 1.63 2.44 3.25 4.06 4.88 5.69 6.50 7.32
2 9.702 0.97 1.94 2.91 3.88 4.85 5.82 6.79 7.76 8.73
3 1.041 0.10 0.21 0.31 0.42 0.52 0.625 0.73 0.83 0.94
4 0 0 0 0 0 0 0 0 0 0

28 | P a g e
5 0 0 0 0 0 0 0 0 0 0
6 59.14 5.91 11.81 17.74 23.66 29.57 35.48 41.40 47.31 53.22
Total 78.01 7.80 15.60 23.40 31.20 39.01 46.81 54.60 62.41 70.20
Expected
Yearly
Average
7.801 0.78 1.560 2.34 3.12 3.90 4.68 5.46 6.24 7.02
ResultsfromthedataanalysisindicatethatWZIATtechnologyisworthwhiledependenton
atechnology’spotentialtopreventbetween12.6%and34%ofintrusion‐inducedworker
accidents(AWARE=34%,Intellicone=16.1%,andWAS=17.6%).Thesepercentagesare
theinjuryandfatalitycostequivalentofthetotalcostofpurchasingandoperatingWZIATs.
ReturnonInvestment
Thepotentialcostofinjuriesandfatalitiesassociatedwithworkzoneintrusionandthe
monetaryvalueoftheinjuriesandfatalitiesthatcouldbesavedbyimplementingWZIAT
arepresentedinTable11.UnlikeAvertedCostvaluesinTable10,AvertedCostinTable12
suggestthatitisnotfeasibletoaccrueallthepotentialbenefits(costsavings)associated
withimplementingasafetycountermeasure.Althoughthetotalcostassociatedwithwork
zoneaccidentsis$7.8millionyearly,WZIAThasthepotentialtoimpactonlyapproximately
51%oftheassociatedcost.Thisrestrictedextentofimpactisbecausethecontractors
interviewedindicatedthattheyarenotwillingtoimplementWZIATinmobileoperations–
whichaccountforapproximately49%ofinjuriesandfatalities.Theresearchersmultiplied
thetotalnumberofaccident(308)by51%todeterminethepotentialavertedcost.Itis
importanttonotethatbyapplying49%,theresearchersassumedalinearrelationship
betweenseverityandfrequencyofinjury–thatis,injuriesreducedacrosstheseverity
levelsequally‐whichisnotalwaysthecase.
Table12.ComparisonofallWorkZoneInjuryCosts(total)toPotentialAvertedCost‐
ROI
InjurySeverity
(MAIS)
InjuryCost
(million$)
TotalCost
(million$)
AvertedCosts
(million$)

29 | P a g e
1 0.029 8.128 4.145
2 0.45 9.702 4.948
3 1.01 1.041 0.531
4 2.55 0 0
5 5.69 0 0
6 9.6 59.14 30.159
Total 78.01 39.784
ExpectedYearly
Average
7.801 3.978
Inaddition,theresearchersappliedconservativefactorssimilartothoseappliedinTable
11toaccountfortheinjuriesandfatalitieswithinthe51%non‐mobileactivities.Table13
showsthataminimumavertedcostof$398,000peryearisobtainableifWZIATprevents
atleast10%ofworkzoneintrusioninjuriesandfatalities.
Table13:ApplicationofConservativeFactors(ROI)
Injury
Severity
(MAIS)
Averted
Costs
(million$)
FractionofPreventableInjuriesandFatalities(million$)
10% 20% 30% 40% 50% 60% 70% 80% 90%
1 4.15 0.42 0.83 1.24 1.66 2.07 2.487 2.90 3.32 3.73
2 4.95 0.5 0.99 1.49 1.98 2.47 2.969 3.46 3.96 4.45
3 0.53 0.05 0.11 0.16 0.21 0.27 0.319 0.37 0.42 0.48
4 0 0 0 0 0 0 0 0 0 0
5 0 0 0 0 0 0 0 0 0 0
6 30.16 3.02 6.03 9.05 12.06 15.08 18.10 21.1 24.13 27.14
Total 39.79 3.98 7.96 11.9 15.91 19.89 23.87 27.85 31.83 35.81
Expected
Yearly
Average
3.978 0.40 0.8 1.19 1.59 1.99 2.39 2.78 3.18 3.58

30 | P a g e
Ideally,theinjurycostmodelforcalculatingtheROIshouldbebasedoneachcompany’s
safetyrecord,thatis,informationonworkerfatality,losttimeinjury,andinjurywithout
losttime.Thisinformationwasnotprovidedbythecontractorsinterviewedaspartofthis
study.Therefore,theresearchersutilizedthecomprehensiveCaltransaccidentdata.To
maintainunitconsistency,contractorsinterviewedwereaskedfortheapproximate
amountofmilespavedeveryyear.Theaverageresponsefromthreecontractorswas
approximately15milesperyear.Basedonthedataanalysis,WZIATwouldbeusefulto
contractorsifthetechnologiesprevent2%‐3%ofinjuriesandfatalitiescausedby
intrudingvehicles.
AlthoughtheROIcouldhaveasignificantimpactontheadoptionofaWZIAT,ifa
technologyispartofastate’sstipulatedtrafficcontrolplan,thecontractorisrequiredto
usethetechnologyregardlessofROI.
Task5:Evaluateproposedmodelsandprotocols
Toassessthefactorsthatinfluenceaworker’sintentiontoadoptWZIAT,arangeof2‐4
variableswereusedtomeasureeachconstruct(perceivedeaseofuse,socialnorm,etc.).
Thevariableswereselectedfrompastliteratureandadaptedtofittheresearchobjective.
Utilizingvariablesfrompreviousstudiesensuredthatfaceandinternalvaliditywere
maintained.Apathanalysis–asubsetofstructuralequationmodeling(SEM)‐usingAMOS
25Graphics(AMOS25.02017)wasconductedtoanalyzethecorrelationsbetweeneach
constructandaworker’sintentiontoadoptWZIAT.ToconductSEM,asampletoconstruct
variableratioofatleast10:1isrequired.Thatis,foreveryvariabletested,atleast10cases
orrespondentsarerequired.Intotal,142respondents’(contractor=53,DOT=69,
consultants=20)providedfeedbackusedforthisanalysisleadingtoa14:1ratio(10
variables).First,areliabilitytestwasconductedtoverifydataconsistency.Resultsfromthe
Cronbachalphatestshowedthatthesurveywasgenerallyreliable(minimumα=0.65).
Next,fourprimaryhypotheseswereproposedbasedonpastresearchandtheresearcher’s
experience:

31 | P a g e
H1=Perceivedeaseofuse(PEU)ofWZIATwillpositivelyaffectbehavioral
intention(BI)toadoptWZIAT
H2=Perceivedusefulness(PU)ofWZIATwillpositivelyaffectbehavioralintention
toadoptWZIATadoptionintention
H3=Socialnorm(SN)willpositivelyaffectbehavioralintentiontoadoptWZIAT
H4=PerceivedeaseofuseofWZIATwillpositivelyaffectperceivedusefulness
AsseeninFigure9,allfourprimaryhypothesesweresupported.Thepathanalysisresults
suggestthatincreasedPUofWZIATincreaseswithanend‐user’sBItoacceptWZIAT(γ=
0.41).Inthiscase,PUcomprisesfactorssuchasthetechnology’sabilitytoprovide
adequatesafetycoverage,adequatealerts,etc.PEU‐whichrepresentsthelevelofease
associatedwithimplementingthetechnology‐alsoshowedapositiverelationshipwithBI
toacceptatechnology(γ=0.23).Thisrelationshipimpliesthatworkers’BItoaccept
WZIATisassociatedwithincreasedperceivedeaseofuse.Socialnormalsoshoweda
positivecorrelationwithbehavioralintentiontoadoptWZIAT(γ=0.34).ThePEUofWZIAT
alsocorrelatedpositivelywithPU,suggestingthatPEUplaysasignificantroleonhow
workersperceivetheusefulnessofWZIAT(γ=0.45).Thisresultisconsistentwiththe
relativelyhighratingoffactorsassociatedwithease(e.g.,easytomaintain,easeof
deployment/retrieval,andeasytomovearound)seeninAppendix.Together,PEU,PU,and
SNexplain54%ofthevarianceinanindividual’sBItoacceptWZIAT.PEUexplains21%of
thevarianceinPU.

32 | P a g e
Figure9:ResultsofHypothesisTesting
Theimplicationsoftheresultsareasfollows:
WorkersmustperceivethatusingWZIATisnotcomplicatedandwillnotrequire
extensivelearning.WZIATsthatareeasytoinstall,retrieve,move,andmaintainwill
likelybeacceptedbeforeWZIATsthataremorecomplex.
GiventhattheprimarycostdriverofusingWZIATonprojectsisthelaborcost
associatedwithmoving,retrieve,andmaintainingWZIATs,technologiesthatare
easiertousewillsignificantlyimprovethePEUandincreasetheBCAthereby
increasingtheoddsofadoption.
Supervisorsandmanagersplayanimportantroleindrivingtheacceptanceof
WZIAT(throughSN).
InordertoachievehighbehavioralintentiontoacceptWZIAT,itisessentialthe
PEU,PU,andSNarehigh.
DevelopandtestABMmodel
Agent‐BasedModeling(ABM)isaheterogeneoussimulationmethodusedtopredicta
groupleveloutputbyaggregatingindividualagentreactionsandinteractions(Hamiltonet
al.2009;RandandRust2011).Givenitsbottom‐upapproachtopredictingtheoutcome,it
isconsideredagoodtheoreticaltoolforforecastingandunderstandingtheimpactof
individualdifferencesongroupleveloutcomesinsocialscienceandmarketingresearch.

33 | P a g e
Oneobjectiveofthecurrentstudywastoinvestigatethepossibilityofcombininga
diffusionsimulationmethod‐agent‐basedmodelinthiscase‐andinformationobtained
fromatechnologyacceptancemodel.Responsesreceivedfromtheinterviewsandsurveys
wereusedtocreateconstraintsandboundariesforthesimulations.
TodeveloptheABM,itisessentialtodefinethephasesinadoption.Accordingto
InnovationDiffusiontheory,apopulationcanbedividedintothreegroupwhenassessing
technologyadoptionwithinapopulation:non‐adopters,potentialadopters,andadopters
(Leeetal.,2011).Individualswhodonotconsideranewtechnologyaretermednon‐
adopterswhilepotentialadoptersareindividualswhoconsidertheadoptionofanew
technology.Thepresentstudyfollowsasimilarpremise.Technologyadoptioncouldoccur
atanorganizationalleveland/orindividuallevel.Technologyadoptionintheconstruction
industryisconsideredmosteffectivewhenitoriginatesandexemplifiesatop‐down
dynamic(topmanagementinitiatestheadoptionprocedure)(MitropoulosandTatum
2000).Incontrast,successfultechnologyacceptance,thatis,theactualuseofthe
technology,isanemergentphenomenon–similartoabottom‐upapproach.
Forthepresentagent‐basedmodel,threeprimaryconstructs–SN,PU,andPEU–
determinetheintentionofanend‐usertomovefromanon‐adoptertoapotentialadopter.
Thisfactorscouldbeextendedtoincludeorganizationaldemographicinformationsuchas
companysize(employeesandrevenue),companytype(sub‐contractorvs.general
contractor),andindividualdemographicinformationsuchasage,experience,gender,etc.
Atransitionfromnon‐adoptertopotentialadopterisachievedwhenthepotential
constructvalueofanagentisgreaterthanorequaltoauser‐definedconstructthreshold.
Thisthreshold–thecoefficient‐indicatesameasureofsensitivity.Consistentwithfindings
inthepresentstudy,AffordabilityTheory,andpreviousstudies(Gambateseetal.2017;
Rasoulkhanietal.2017;Lynneetal.1995),costofimplementingthetechnologyis
computedastheprimaryfactorthatinfluencesanagent(andorganization)toadopta
workzonesafetytechnology(seeTable14).Affordabilityinthecontextofthepresent
studyisdefinedasthevalueofthetechnologyrelativetoitscost(ROIandBCA).Figure10
typifiesthisrelationshipbetweennon‐adopter,potentialadopter,andadopter.The

34 | P a g e
adoptedmodelingprocessissimilartothoseappliedinpastresearch(Rasoulkhanietal.
2017).
Figure10:Simulationtheoreticalframework
Tables14and15listthefactorsrequiredtodevelopandoperationalizetheagent‐based
model.ThecoefficientslistedinTable14areextractedfromthestructuralequation
modelingconductedintheprevioussectionwhilethecostinformationinTable15is
extractedfromfindingsfromthefinancialanalysis.
Table14:Coefficientandvalueofsimulationconstructs
Construct Value Coefficients
Perceivedusefulness IfYes=1,ifNo=0 0.41
Perceivedeaseofuse IfYes=1,ifNo=0 0.23
Subjectivenorm IfYes=1,ifNo=0 0.34
Table15:WZIATCostSummary
Technology Costpermile Benefitcostanalysis* Returnoninvestment*
AWARE $5,776.00 0.58 136%
Intellicone $7,382.00 1.24 106%
WAS $8,052.00 1.14 98%
*assumingeachtechnologycanprevent20%ofinjuriesandfatalities
ItisimportanttonotethatalthoughTable15suggeststhatAWAREhasanegativeBCA,
AWAREwouldlikelypreventmorethan20%ofaccidentsandfatalitiescausedbywork
zoneintrusiongivenitsadvancedtechnologyandeaseofimplementation.Twentypercent

35 | P a g e
wasselectedintheabsenceofempiricaldataandinordertocreatearangeofvaluesfor
thecomputationalmodel.
AnyLogic8.0wasutilizedtodevelopacomputationalmodelforsimulatingthechangein
worker’sbehavior.Inthismodel,onlyoneclassofagent–DOTlevel‐isincorporated.This
classofagentrepresentsthefirststepintheadoptionprocess(DOT‐>construction
company‐>constructionworkers).Ideally,themodelshouldreflectmultipleclassesof
agentstomimicthecomplexnatureoftechnologyadoptiononhighwayconstruction.
However,theapproachsufficesgiventheexploratorynatureofthepresentstudy.Future
studyshouldmodeltheinteractionsbetweenagentsusingmorecomplexconstraintsand
boundaries.
Intotal,50agents,representingeachstateDOTwereutilizedintheadoptionmodel.Astate
DOTwouldlikelyadoptaWZIATifthestateDOTbelievestheWZIATisuseful,easytouse,
orisusedbyotherstates.Todeterminethethresholdthattriggersachangeofstate(from
non‐adopter‐>potentialadopter‐>adopter),theregressioncoefficientsfromtheSEM
wereutilized.Theseconstructswereparameterizedusingstochasticcomputationandused
withinthesimulationasprobabilisticfactorsfordeterminingbehavior.Theformulabelow
showsthemathematicalexpressionofthemodel:
Br1=w1(PUr)+w2(PEUr)+w3(SNr)
Br2=w4(BCA)
WhereBr1andBr2referstothepotentialadoptionandadoptionbehaviorrespectively.Wn
representstheregressioncoefficientforeachconstruct.Thesumofthevaluesinequation
1couldrangefrom0to1withnumbersbelow0.5consideredlowandnumbersabove0.5
consideredhigh.Ifthesumoftheconstructexceeds0.5,theagentinquestionmovesinto
thenextstate(fromnon‐adoptertopotentialadopter).Aprobabilitythresholdof0.5was
selectedsimilartopreviousstudies(Scalcoetal,2017).Thesameprocessappliesto
transitioningfrompotentialadoptertoadopter.BCAwasselectedasthepreferredfinancial
metricsincetheclassofagentinquestionistheDOT.GiventhatinvestmentswithBCA
resultsabove1areconsideredpositiveinvestments,theresearcherssetatransition
thresholdof1andarangeof0.5to1.5.

36 | P a g e
TheredareainFigure11representsnon‐adopterwhileyellowandgreenrepresents
potentialadoptersandadopters.ThesimulationstartdateisMay2018anditterminatesin
January2025–approximately7yearsintotal.Thesimulationbeginswithall50state
DOTsinanon‐adopterstate.ThenumberofDOTsinthenon‐adoptersstatereducedby
about78%bytheendofthesimulationin2025.Withinasimilartimeframe,19stateDOTs
adoptedWZIAT.
Figure11:WZIATdiffusionbetween2018‐2025withinStateDOTs
Figure12depictstherateofadoptionwhentheregressioncoefficientofPU,PEU,andSNof
thetechnologiesisincreasedby15%(cumulativecoefficient).Thisincreaseresultedtoa
higherrateofadoptionbyyear2025(approximately75%ofDOTsutilizingWZAIT).The
resultsindicatesthatmorestateDOTswilladoptWZIATiftheybelievethatWZIATismore
usefulintermofitseffectiveness,durability;andiseasiertoimplement,retrieve,and
maintain.Also,resultsfromthemodelindicatesthatsocialinfluencessuchcouldbeakey
factorfordiffusiontooccur.Forinstance,astateDOTwouldbeinfluencedbythedecision
ofanotherstateDOTwithincloseproximitytoadoptWZIAT.

37 | P a g e
Figure12:IncreaseddiffusionofWZIAT.
7. Changes/problemsthatresultedindeviationfromthemethods
Whileexecutingthestudy,theresearchersencountereddifficultiesgeneratingresponses
fromworkzonesafetytechnologymanufacturersandhighwayconstructioncontractors
whichimpactsthegeneralizabilityofthestudyfindings.Althoughtheoreticallysound,the
developmentofanacceptancemodelusingABMrequiresadditionalparametersand
boundariestoensurethatallpotentialfactorsareaccountedfor.Itisimportanttonote
thatalthoughTPBandTAMwerecombinedtodevelopanacceptancemodelforWZIAT,
extendingthetheoriestoincludemodelssuchastask‐technologyfit(TTF)andtheoryof
reasonedaction(TRA)couldhelpidentifymoreconstructsthathaveanimpactonthe
acceptanceofworkzonetechnologiessuchasWZIAT.Developingthefinancialanalysis
involvedmakingsomeassumptionsforinformationthatwereunobtainable.These

38 | P a g e
assumptionswereclearlystatedandshouldbeconsideredwhengeneralizingtheresultsof
thisstudy.
8. Listofpresentations/publications
Findingsfromthisstudywillbepublishedinacademicjournalsandpresentedin
conferences,workshops,and/orseminars.
1. Nnaji, C., Gambatese, J., and Eseonu, C. (2017). “Theoretical Framework for Improving
Adoption of Safety Technology in Construction Industry.” 2018 Construction Research
Congress(CRC2018),NewOrleans,LA.[AcceptedonOctober17,2017]
2. Nnaji,C.,Lee,H.,andGambatese,J.(2017).“Canworkzoneintrusion‐inducedinjuriesand
fatalitiesbereducedefficiently?”ProfessionalSafety,ASSE[Acceptance,Jan.20,2018]
3. Nnaji,C.,Gambatese, J., Lee,H.W., andZhang,F. (2017). “Assessing the ImpactofWork
Zone Safety Technology: A Systematic Review.” Accident and Analysis and Prevention
Journal.[SubmittedtothejournalonSeptember19,2017]
9. Disseminationplan
Theresearchershavesubmittedandpublishedsectionsofthisstudyinacademicjournals
andconferenceproceedings.Theresearchersalsoplantosubmitacomprehensivejournal
paperfromthestudytoatopacademicjournal.
10. Conclusions
Workerswithinhighwayworkzonesareanat‐riskpopulationgiventheinherentlyrisky
natureoftheirjobs.Thecurrentstudyassessedtheroletechnologyplaysinimproving
workersafetyandprovidesinformationthatshouldeasetheprocessofadoptingand
implementingtechnologyonhighwayprojects.
Currenttechnologiesusedinworkzonesafetymanagementplayanessentialrolein
improvingworkersafetythroughreducingmotoristspeed,alertingequipmentdriversof
potentialcollisionwithworkers,andinformingworkersofanintrudingvehicle.The
findingsfromthepresentstudyprovideessentialinformationsuchasthekeypredictorsof
safetytechnology,financialanalysis,andprimaryfactorsthataffectauser’sintentionto

39 | P a g e
acceptaWZIATtoconstructionpractitionersinvolvedintechnologyadoptiondecision‐
making.Forinstance,thepresentstudyillustratesthesevereimpactthatlaborcosthason
theoveralldailycostofutilizingWZIAT.Reducingthetimeworkersareinvolvedin
managingaWZIATvastlyreducesthecostassociatedwithimplementingWZIAT.
Utilizingthisinformation,stakeholderscanarriveatacongruentdecisionregardingWZIAT
adoptionthatissupportedbyempiricaldataandwhichinturnimprovestheoutcome–in
thiscase,areductionininjuriesandfatalitiesinhighwayconstructionworkzones.
11. FutureResearchOpportunities
Providedbelowarerecommendationsforfutureresearchbasedonfindingsfromthe
currentstudy:
Thedevelopmentofadaptablestandardtoolsthathelpbridgetheknowledgegap
betweenmanufacturersandend‐usersshouldbeencouraged
Thereisaneedforthedevelopmentofarobustmodelforpredictingpotential
adoptionoftechnology
MonteCarlosimulationshouldbeappliedtothefinancialanalysistohelpnormalize
someassumptions
Workforcedevelopmenttrainingisneededforworkerstohelpimproveintegration
ofsafetytechnologywithinconstructionoperations

40 | P a g e
12. References
AAM(2017).“ISS,NISSandMAISMappingwithAAAM’sICDISSMap.”Associationforthe
AdvancementofAutomotiveMedicine.<https://www.aaam.org/wp‐
content/uploads/2017/06/ICD‐ISS‐Map_Instructions_May_2017.pdf>(Jan.05,
2018)
AAAM(2015).“Overview.”AssociationfortheAdvancementofAutomotiveMedicine
<https://www.aaam.org/abbreviated‐injury‐scale‐ais/>
AASHTO(2010).“UserandNon‐UserBenefitAnalysisforHighways.”AmericanAssociation
ofStateHighwayandTransportationOfficials.
<https://trid.trb.org/view/1083520>(Jan.21,2017)
Arico,M.C.,andRavani,B.(2008).AdvancedHighwayMaintenanceandConstruction
TechnologyResearchCenter.
Agent,K.,andHibbs,J.(1996).“EvaluationofSHRPWorkZoneSafetyDevices”.Kentucky
TransportationCenterResearchReport.381.KTC‐96‐30
Bello,D.(2009).“StateofWorkZoneSafety.”
<http://www.safetyandhealthmagazine.com/articles/the‐state‐of‐work‐zone‐
safety‐2>(Aug.21,2017)
Boardman,A.Greenberg,D.,Vining,A.,andWeimer,D.(2001).“Cost‐BenefitAnalysis:
ConceptsandPractice.”seconded.PrenticeHall.
BLS(2017).“Fataloccupationalinjuriescountsandratesbyselectedindustries,2015‐16.”
<https://www.bls.gov/news.release/cfoi.t04.htm>(Nov.11,2017)
Brown,H.,Sun,C.,andCope,T.(2015).“Evaluationofmobileworkzonealarmsystems.”
TransportationResearchRecord:JournaloftheTransportationResearchBoard,
(2485),42‐50.
Chuttur,M.Y.(2009).“Overviewofthetechnologyacceptancemodel:Origins,
developmentsandfuturedirections.”WorkingPapersonInformationSystems,
9(37),9‐37.

41 | P a g e
CPWR(2015).StrengtheningJobsiteSafetyClimatebyUsingandImprovingLeading
Indicators.TheCenterforConstructionResearchandTraining.
https://www.cpwr.com/safety‐culture/strengthening‐jobsite‐safety‐climate>(Jan.
12,2017)
Davis,F.D.(1989).“Perceivedusefulness,perceivedeaseofuse,anduseracceptanceof
informationtechnology.”MISquarterly,319‐340.
Edara,P.,Sun,C.,andRobertson,A.(2013).“EffectivenessofWorkZoneIntelligent
TransportationSystems.”ReportNo.InTransProject,06‐277.
ELWC(2015).“SonoBlaster–WorkZoneSafety.”<http://www.elwc.com.au/sonoblaster‐
work‐zone‐safety/>(Oct.14,2015).
FederalHighwayAdministration(2017).“FactsandStatistics–WorkZoneSafety.”
<https://ops.fhwa.dot.gov/wz/resources/facts_stats/safety.htm>.(Dec.17,2017).
Fyrie,P.(2016).“WorkZoneIntrusionAlarmsforHighwayWorkers.”AHMCTResearch
Center.
<http://www.dot.ca.gov/newtech/researchreports/preliminary_investigations/do
cs/work_zone_warning_preliminary_investigation.pdf.(April2017).
Gambatese,J.,Lee,H.,andNnaji,C.(2017).“WorkZoneIntrusionAlertTechnology:
AssessmentandPracticalGuidelines.”OregonDepartmentofTransportation
Gambatese,J.,andZhang,F.(2016).“ImpactofAdvisorySignsonVehicleSpeedsin
HighwayNighttimePavingProjectWorkZones.”TransportationResearchRecord:
JournaloftheTransportationResearchBoard,(2555),65‐71.
Garber,N.,andZhao,M.(2002).“Distributionandcharacteristicsofcrashesatdifferent
workzonelocationsinVirginia.”TransportationResearchRecord:Journalofthe
TransportationResearchBoard,(1794),19‐25.
Ghasemi,A.,andZahediasl,S.(2012).“Normalitytestsforstatisticalanalysis:aguidefor
non‐statisticians.”Internationaljournalofendocrinologyandmetabolism,10(2),
486.

42 | P a g e
Hamilton,D.J.,Nuttall,W.J.,&Roques,F.A.(2009).Agentbasedsimulationoftechnology
adoption(No.0923).EPRGWorkingPaperSeries.
HighwayResourceSolution.(2015).“Intellicone.”<http://www.intellicone.co.uk/>(Sept.
02,2015).
Huebschman,C.R.,C.Garcia,D.M.Bullock,andD.M.Abraham.(2003).“ConstructionWork
ZoneSafety.”PublicationFHWA/IN/JTRP‐2002/34.JointTransportationResearch
Program,IndianaDepartmentofTransportationandPurdueUniversity,West
Lafayette,Indiana.https://doi.org/10.5703/1288284313166
Hong,Y.,Chan,D.W.,Chan,A.P.,andYeung,J.F.(2011).“Criticalanalysisofpartnering
researchtrendinconstructionjournals.”Journalofmanagementinengineering,
28(2),82‐95.
InfrastructureTrainingandSafetyInstitute(ITSI)(2011).“ReferenceGuidetoWorkZone
TrafficControl”< https://www.osha.gov/dte/grant_materials/fy10/sh‐21004‐
10/wztc_refguide.pdf>(March21,2018)
Lee,Y.,Hsieh,Y.andHsu,C(2011).“AddingInnovationDiffusionTheorytotheTechnology
AcceptanceModel :SupportingEmployees’IntentionstouseE‐LearningSystems.”
JournalofEducationalTechnologyandSociety,14(4)
Mathieson,K.(1991).“Predictinguserintentions:comparingthetechnologyacceptance
modelwiththetheoryofplannedbehavior.”Informationsystemsresearch,2(3),
173‐191.
Mathieson,K.,Peacock,E.,andChin,W.W.(2001).“Extendingthetechnologyacceptance
model:theinfluenceofperceiveduserresources.”ACMSIGMISDatabase:the
DATABASEforAdvancesinInformationSystems,32(3),86‐112.
Marks,E.,Vereen,S.,andAwolusi,I.(2017).“ActiveWorkZoneSafetyUsingEmerging
Technologies2017”(No.UTCAReportNumber15412).

43 | P a g e
Marks,E.,andTeizer,J.(2013).“Methodfortestingproximitydetectionandalert
technologyforsafeconstructionequipmentoperation.”ConstructionManagement
andEconomics,31(6),636‐646.
Mitropoulos,P.,andTatum,C.(2000).“Forcesdrivingadoptionofnewinformation
technologies.”Journalofconstructionengineeringandmanagement,126(5),340‐
348.
Moren(2016).GuidanceonTreatmentofEconomicValueofaStatisticalLife(VSL)inU.S.
DepartmentofTransportationAnalysis–2016Adjustment.
<https://cms.dot.gov/sites/dot.gov/files/docs/2016%20Revised%20Value%20of
%20a%20Statistical%20Life%20Guidance.pdf>(Nov15,2017)
Novosel,C.(2014).“EvaluationofAdvancedSafetyPerimeterSystemsforKansas
TemporaryWorkZones.”PhDdiss.,UniversityofKansas.
Park,J.,Yang,X.,Cho,Y.K.,andSeo,J.(2017).“Improvingdynamicproximitysensingand
processingforsmartwork‐zonesafety.”AutomationinConstruction,84,111‐120.
Pegula,S.(2013).“Ananalysisoffataloccupationalinjuriesatroadconstructionsites,
2003–2010.”TheBureauofLaborStatistics.Availableat
<http://www.bls.gov/opub/mlr/2013/article/an‐analysis‐of‐fatal‐occupational‐
injuries‐at‐road‐construction‐sites‐2003‐2010.htm>(Sept.16,2017)
Park,J.,Marks,E.,Cho,Y.K.,andSuryanto,W.(2015).“Performancetestofwireless
technologiesforpersonnelandequipmentproximitysensinginworkzones.”
JournalofConstructionEngineeringandManagement,142(1),04015049.
Park,J.,Yang,X.,Cho,Y.K.,andSeo,J.(2017).“Improvingdynamicproximitysensingand
processingforsmartwork‐zonesafety.”AutomationinConstruction,84,111‐120.
Rankin,J.H.,andLuther,R.(2006).“Theinnovationprocess:adoptionofinformationand
communicationtechnologyfortheconstructionindustry.”CanadianJournalofCivil
Engineering,33(12),1538‐1546.

44 | P a g e
Rand,W.,andRust,R.T.(2011).“Agent‐basedmodelinginmarketing:Guidelinesforrigor”.
InternationalJournalofResearchinMarketing,28(3),181‐193.
Rasoulkhani,K.,Logasa,B.,Reyes,M.P.,andMostafavi,A.(2017).“Agent‐basedmodeling
frameworkforsimulationofcomplexadaptivemechanismsunderlyinghousehold
waterconservationtechnologyadoption.”InSimulationConference(WSC),2017
Winter(pp.1109‐1120).IEEE.
Sant(2014).“Work‐ZoneSafety:IntrusionAlert.”RoadandBridges
<http://www.roadsbridges.com/work‐zone‐safety‐intrusion‐alert>.(June09,
2016)
Schwatka,N.V.,andRosecrance,J.C.(2016).“Safetyclimateandsafetybehaviorsinthe
constructionindustry:Theimportanceofco‐workerscommitmenttosafety.”Work,
54(2),401‐413.
Sun,C.,Edara,P.P.,Hou,Y.,Robertson,A.,andSmith,D.(2011).“Cost‐BenefitAnalysisof
SequentialWarningLightsinNighttimeWorkZoneTapers.”UniversityofMissouri,
ReporttotheSmartWorkZoneDeploymentInitiative.
Teizer,J.,Allread,B.,Fullerton,C.,andHinze,J.(2010).“Autonomouspro‐activereal‐time
constructionworkerandequipmentoperatorproximitysafetyalertsystem.”
AutomationinConstruction,19(5),630‐640.
Theiss,L.,Miles,J.,Ullman,G.,andMaxwell,S.(2014).“PhotometricEvaluationofSteady‐
BurnWarningLightsinWorkZones”.TransportationResearchRecord:Journalof
theTransportationResearchBoard,(2458),88‐95.
Theiss,L.,Pratt,M.,Ullman,G.,andMaxwell,S.(2014).“EvaluationofCost‐Effectivenessof
Steady‐BurnWarningLightsinWorkZones.”TransportationResearchRecord:
JournaloftheTransportationResearchBoard,(2458),65‐73.
Ullman,G.,andIragavarapu,V.(2014).“AnalysisofExpectedCrashReductionBenefitsand
CostsofTruck‐MountedAttenuatorUseinWorkZones.”TransportationResearch
Record:JournaloftheTransportationResearchBoard,(2458),74‐77.

45 | P a g e
Venkatesh,V.,Speier,C.,andMorris,M.G.(2002).“Useracceptanceenablersinindividual
decisionmakingabouttechnology:Towardanintegratedmodel.”Decision
sciences,33(2),297‐316.
Venkatesh,V.,andDavis,F.D.(1996).“Amodeloftheantecedentsofperceivedeaseofuse:
Developmentandtest.”Decisionsciences,27(3),451‐481.
Wang,M.,Schrock,S.,Bai,Y.,andRescot,R.(2011).“Evaluationofinnovativetrafficsafety
devicesatshort‐termworkzones.”ReportK‐TRAN:KU‐09‐5,TheUniversityof
Kansas.
Wong,J.M.,Arico,M.C.,andRavani,B.(2011).“Factorsinfluencinginjuryseverityto
highwayworkersinworkzoneintrusionaccidents.”Trafficinjuryprevention,
12(1),31‐38.
Yi,W.,andChan,A.P.(2013).“Criticalreviewoflaborproductivityresearchinconstruction
journals.”JournalofManagementinEngineering,30(2),214‐225.
Zhang,F.,andGambatese,J.(2017).“HighwayConstructionWork‐ZoneSafety:
EffectivenessofTraffic‐ControlDevices.”PracticePeriodicalonStructuralDesign
andConstruction,22(4),04017010.
13. Appendix
AppendixA:Survey
ReducingHighwayConstructionFatalitiesthroughImprovedAdoptionofSafety
Technologies
DearParticipant,
Wewouldliketothankyoufortakingthetimetoparticipateinthissurveyentitled“ReducingHighway
ConstructionFatalitiesthroughImprovedAdoptionofSafetyTechnologies."

46 | P a g e
Thepurposeofthisstudyistodevelopatoolthatimprovestheadoptionanddiffusionofsafetyinnovations
intheconstructionindustry.Ifyouchoosetotakepartinthissurvey,youwillbeaskedtoprovidethe
followinginformation:
Perceptiononwhatfactorsinfluencestheacceptanceofworkzonesafetytechnologies·
Perceptionontheimpactofworkzonesafetytechnologies·
Personalattributessuchastitle,typeofcompany/organization,yearsofexperience,etc.
Thesurveyisexpectedtotakeapproximately15minutestocomplete.Yourresponsestothissurveyand
personalinformationprovidedwillbekeptconfidential,usedonlyforacademicpurposesrelatedtothe
study,andwillnotbedistributedtothepublic.Allidentifyinginformationconnectingrespondentstotheir
responseswillberemovedaspartofthedatacollectionprocess.Publicationsgeneratedfromtheresearch
studywillnotincludeanyinformationthatcanbeusedtoidentifyrespondents.
Ifyouhaveanyquestionsaboutthesurvey,pleasecontacttheresearcherslistedbelow.Ifyouhavequestions
aboutyourrightsorwelfareasasurveyparticipant,pleasecontacttheOregonStateUniversityInstitutional
ReviewBoard(IRB)Officeat541‐737‐8008,[email protected].
ResearchTeam:
Dr.ChinweikeEseonu(PrincipalInvestigator),Mechanical,IndustrialandManufacturingEngineering,Oregon
StateUniversity,204RogersHall,Corvallis,OR97331;Cell‐phone:541‐737‐0024;
E‐mail:[email protected]
JohnGambatese,CivilandConstructionEngineering,OregonStateUniversity,101KearneyHall,Corvallis,OR
97331;Cell‐phone:(541)737‐8913;E‐mail:[email protected]
ChukwumaNnaji,CivilandConstructionEngineering,OregonStateUniversity,101KearneyHall,Corvallis,
OR97331;Cell‐phone:(541)908‐0475;E‐mail:[email protected]
Acknowledgement:Bycontinuingthesurvey,Ihavereadtheabovedescriptionoftheresearch.IfIhadquestionsorwouldlikeadditional
information,Icontactedtheresearchersandhadallofmyquestionsansweredtomysatisfaction.Iagreetovoluntarily

47 | P a g e
participateinthisresearch.Byansweringthesurveyquestionsandrespondingtothissurvey,IaffirmthatIhavereadtheabove
information,agreetoparticipateintheresearch,andamatleast18yearsofageorolder.
SurveyQuestions
DemographicInformation
Q1Pleaseselectyourrole
OwnerAgency(e.g.OregonDOT,etc.)(1)
GeneralContractor(2)
Sub‐Contractor(3)
Consultant(6)
EquipmentManufacturer(7)
EquipmentSupplier(4)
Student(8)
Other(5)____________________
Q2Whatindustrydoyou(orhaveyou)workedin?Selectallthatapply.
HeavyCivil(1)
MarineConstruction(2)
VerticalConstruction(ResidentialandCommercial)(3)
IndustrialConstruction(4)
Other(5)____________________
Q3Selectthejobtitlethatbestdescribeswhatyoudo.
ProjectManager(1)
ProjectEngineer(2)
TrafficControlDesigner(3)
SafetyOfficer(4)
SafetyEquipmentSupplier(5)
RoadMaintenanceCrew(6)
TrafficControlConsultant(9)
TrafficControlCrew(7)
Other(8)____________________

48 | P a g e
Q4.Whatistheapproximateannualrevenueofyourcompany?
Q5.Whatisthesizeofyourcompany?(Approximatenumberofemployees)
Q6.Whichsectorwouldyoubestdescribemostofyourcompany'sprojects?(Selectallthatapply)
Residential(1)
Commercial(2)
HeavyCivil(3)
Energy(4)
Industrial(5)
Marine(6)
Q7Howmanyyearsofexperiencedoyouhaveintheconstructionindustry?
Lessthan1year(1)
1‐5years(2)
5‐10years(3)
10‐20years(4)
Morethan20years(5)
Thequestionsinthenextsectionfocusonfactorsthatcouldimpacttheuseofaworkzone
intrusionalerttechnology.Aworkzoneintrusionalerttechnology(WZIAT)isatypeofsafety
systemusedinaroadwayworkzonetoalertfieldworkersandsecuretimeforthemtoescape
whenerrantvehiclesintrudeintotheworkzone.Pleaseanswerthefollowingquestionswiththe
WZIATinmind.
Q8Areyoufamiliarwithworkzoneintrusionalerttechnology?
Definitelyyes(1)
Probablyyes(2)
Probablynot(3)
Definitelynot(4)
Q9HowimportantarethefollowingattributestoyourdecisiontoadoptWZIAT?

49 | P a g e
Not
Important
(1)
Slightly
Important
(2)
Neutral(3) Important
(4)
Very
Important
(5)
EaseofDeployment/Retrieval(1)
Easytomovethetechnologyaround(2)
UserFriendliness(learningcurve)(3)
LittleornoImpactonTrafficFlowand
Controlwithinworkzone(4)
Limitsworkerexposure(during
deployment/retrievaloftechnology)(5)
Easytostore(6)
Resistancetoenvironmentaland
physicalimpact(7)
Reusable(8)
EasytoMaintain(9)
ExtendedbatteryLife(reliability)(10)
Costoflaborandequipment(11)
Availabilityofequipmentinthemarket
(12)
Costofreplacingparts/maintenance
(13)
Impactofwarningalertondriveror
Drivercomprehensionofvisualand
audiowarning(14)

50 | P a g e
Workercomprehensionofwarning
signal(conspicuity,qualityofalarm)
(15)
Multiplewarningalertsources(audio,
visual,haptic/vibratory)(16)
Adequatecoveragedistance
(Sensor/light/sound/haptic)(17)
Limitedphysicalimpactonvehicle
(collisionwithtechnology)(18)
Driveradequatelycomprehendsvisual
andaudiowarning(19)
Fewornofalsenegativeandpositive
alarm(20)
Lessdependenceonexisting
infrastructure(21)

51 | P a g e
Q10HowdoesWZIATimpactworkers?
Strongly
disagree/
unlikely
(1)
Somewhat
disagree/
unlikely
(2)
Neither
agree/likenor
disagree/
unlikely(3)
Somewhat
agree/
likely(4)
Strongly
agree/
likely(5)
ImplementingWZIATenablesworkers
tobemoreproductive(1)
UsingWZIATimprovesworkerssafety
(2)
UsingWZIATimprovesworkquality
(3)
WZIATiseasytouse(4)
WZIATwouldhaveasteeplearning
curve(5)
WorkerswillfindWZIATeasytouse
(6)
Peoplewhoareimportanttomewould
thinkIshoulduseWZIAT(7)
IwilluseWZIATbecausepeoplewho
influencemybehavior(manager,etc.)
wouldwantmetouseit(8)
IwillencouragetheuseofWZIAT(9)
IwilllikelyincorporateWZIATinto
yourworkoperations(ifitwasmy
decisiontomake)(10)
IwillrecommendtheuseofWZIATto
myboss(11)

52 | P a g e
Thequestionsinthenextsectionfocusonsafetyclimateandculture.“Safetyclimate”isdefinedas
“thevalues,attitudes,motivations,andknowledgethataffecttheextenttowhichsafetyis
emphasizedovercompetinggoalsindecisionsandbehaviors.”(Barnes2009)Pleasekindly
indicatehowyouperceiveyourorganization'sattitudetowardsworkersafetymanagement.
Q11Inmycompany,management…
Doesnotparticipateinsafetyaudits.(1)
Onlyparticipateinsafetyauditsinresponsetoaworkerinjuryoradversesafetyevent.(2)
Participateinsafetyauditsonlywhenrequired.(3)
Initiateandactivelyparticipateininternalsafetyaudits.(4)
Activelyparticipateininternalsafetyauditsandusetheinformationformanagement
performanceevaluation.(5)
Q12Inmycompany,…
Thereisnoformalsafetymanagementsystem;safetytrendsarenotanalyzed.(1)
Thesafetymanagementsystemisreviewedandsafetytrendsareonlyanalyzedinresponseto
workerinjuryoranadversesafetyevent.(2)
Thesafetymanagementsystemisreviewedandsafetytrendsareanalyzedfromtimetotime.
(3)
Thesafetymanagementsystemisreviewedandsafetytrendsareanalyzedannuallytoensure
effectivenessandrelevance.(4)
Thesafetymanagementsystemisreviewedandsafetytrendsareanalyzedbi‐annuallyto
ensureeffectivenessandrelevance.(5)

53 | P a g e
Q13Inmycompany,…
Theprimaryfocusisonincreasingproductivityandreducingcosts.Employeesarerewarded
fortakingshortcutstomeetproductiongoals.(1)
Whenaprojectfallsbehindschedule,productionbecomesvaluedmorethansafety.(2)
Aslongasminimumsafetyrequirementsarebeingmet,productionandcostreductionarethe
mainprioritiesofaproject.(3)
Forthemostpart,safetyisnotcompromisedforthesakeofproductivity.Projectsare
completedassafelyaspossible.(4)
Safetyisnevercompromisedforproductivity,schedule,orcost.Safetytrulycomesfirst.(5)
Q14Inmycompany,management…
Doesnotinvestinsafetyprogramdevelopmentorprovideadequateresourcestoconductwork
safely.(1)
Onlyinvestsinsafetyprogramdevelopmentanddevotesminimalresourcestosafetyactivities
afteranaccidentoranadverseeventhasoccurred.(2)
Participatesinsafetyprogramdevelopmentandallocatesresourcestotheextentthatitis
requiredbyregulatoryauthoritiesortheowner.(3)
Providesadequateresourcestoensureasafeworkingenvironment.Developsasafetyprogram
thatissharedwithallemployees.(4)
Provideson‐goingfinancialsupportforongoingdevelopmentofsafetypolicies,programs,and
processes.Investsinsystemsandprocessestocontinuallyimprovethejobsitesafetyclimate.
(5)

54 | P a g e
Q15Inmycompany,…
Therearenosafetyrelatedmetricsincludedinmanagerorsupervisors’performance
evaluations.(1)
Theonlysafetymetricusedinmanagersandsupervisors’evaluationsisthenumberofworker
injuries,andoftenthatisignored.(2)
Managersandsupervisorsareheldaccountableformeetingtheminimumrequiredsafety
standards;but,poorprojectsafetyperformancecarriesfewrealconsequences.(3)
Managersandsupervisorsareprimarilyheldaccountableforlaggingsafetyindicators(e.g.,
RecordableInjuryRate),butsomeleadingindicators(e.g.,safetyclimatemetrics)havebeen
included.(4)
Managersandsupervisorsareheldaccountableforleading(e.g.,safetyclimatemetrics)and
laggingsafetyindicators.Proactivesafetyleadershipisacriticalcomponentoftheirevaluation
andpromotion.(5)
Q16Inmycompany,safetyexpectations,roles,andresponsibilities…
Arenotidentifiedorarticulatedtoindividualsworkingintheworkplace.(1)
Areonlyclarifiedafteranadversesafetyevent.(2)
AreonlysettomeetOSHArequirements.(3)
Arefrequently,clearly,andconsistentlycommunicatedtoemployees.(4)
Arediscussedwithemployeesacrosstheentirecompany,withsub‐contractors,and
owners;theyarereinforcedonadailybasis.(5)

55 | P a g e
Q17Inmycompany,…
Supervisorshavenosupervisorytrainingandhavelittleunderstandingorknowledgeof
regulatoryrequirements.(1)
Afteranincidentoccursorregulatoryactionistaken,thereisadiscussionamonghigherlevel
managementabouttheimportanceofsupervisoryleadership.(2)
SupervisorstakeOSHA30‐hourtrainingandthusarefamiliarwithOSHAregulationsbutthey
havelittleornoleadershiptraining.(3)
Supervisorsaretrainedonregulatoryguidelinesandleadership.(4)
Supervisorsareprovidedwithandrequiredtotakeleadershiptrainingthatincludestopics
suchas:howtocommunicatewith,andmotivateteammembers;howtoconductpre‐planning
meetings;andhowtoinspirecrewmemberstoalsobeproactivesafetyleaders.(5)
Q18Inmycompany,supervisors…
Manageandpunishusingintimidationandfocusonlyonindividualbehaviorwithouttaking
whatmayhavebeenafaultyprocessintoaccount.(1)
Startcaringfortheircrewandactingassafetyleadersonlyafteranincidentoccursor
regulatoryactionistaken.Thebehaviordisplayedisshort‐lived.(2)
“Talkthesafetytalk”,butoftendonotfollowtheirownadviceandexpectations.(3)
Initiateandactivelyparticipateinsafetyprogramactivitiesthatarefocusedoncontinuous
improvement.(4)
Instillasenseofsafetyownershipatalllevels,serveaseffectivesafetycommunicators,
excellentrolemodelsforsafety,andareabletocoachandteach.Safetyisinfusedintoevery
meeting.(5)
Q19Inmycompany,employees…
Feelnosenseofresponsibilityfortheirco‐employees’ortheirownsafety.(1)
Aren’tengagedinpromotingsafetyuntilafteranaccidentoccurs.(2)
Areengagedinpromotingsafetytotheextentthatisrequired.(3)
Participateinallaspectsofensuringsafeworkingconditions,beginningattheplanningand
designstages.(4)
Areempoweredandrewardedforgoingaboveandbeyondtoensuresafeworkingconditions
wheretheyalwaysfeelresponsiblefortheirandtheirco‐employeessafety.(5)

56 | P a g e
Q20Inmycompany,…
Workerfeedbackregardingsafetyconditionsandhazardreductionisnotsought.Theyjust
wantemployeesto“getthejobdone.”(1)
Employeesareaskedforsafetyadviceandfeedbackafteraninjuryoradversesafetyeventhas
occurred.(2)
Workerfeedbackregardingsafetyissoughtonlywheninitiatedbyemployeesorduring
mandatorysafetymeetings.(3)
Managementactivelyinvolvesemployeesinidentifyinghazardsandsolvingsafetyproblemsby
includingthemindailypre‐jobsafetyandcrewtask/hazardanalysis.(4)
Managementactivelyseeksworkerinputonsafety.Safetyandevennon‐safetymeetingsand
walk‐aroundsfocusonsolvingspecificproblemsidentifiedbyemployeesandothers.(5)
Q21Inmycompany,Injuryandillnessdata…
Arenotcollected,unlessthere’safatalitythatmustbereportedtoOSHAorotherentities.(1)
Arecollected,buttheyareonlyreviewedafteranadversesafetyeventhasoccurred.Issuesare
notformallytrackednorareresolutionscommunicatedacrosstheorganization.(2)
ArecollectedforthepurposeofbeingcompliantwithOSHArequirements.Supervisorspass
safetyinformationontotheircrewonlywhenrequiredbymanagement.(3)
Areregularlyandformallycollectedandsharedwithmanagersandsupervisors;supervisors
areencouragedbutnotrequiredtoshareinformationwiththeiremployees.(4)
Aregatheredthroughformalsystemsforregularlysharingandfollow‐upimprovementactions
withmanagers,supervisor,andemployees.(5)
Q22Inmycompany,…
Thereisnoadequatesafety‐relatedcommunicationeffort.(1)
Safety‐relatedcommunicationeffortsoccuronlyinresponsetoanadversesafetyevent.(2)
Safety‐relatedcommunicationeffortmeetsOSHArequirements.(3)
Safety‐relatedcommunicationeffortismadewhenthere’sanewstandardorpolicythatneeds
tobefollowed.(4)
Safetyrelatedcommunicationeffortisformalizedbothverticallyandhorizontallythroughout
thecompanyandintheworkplace.(5)

57 | P a g e
Q23Inmycompany…
Thereisnotrainingverificationprocess.(1)
Trainingcardsorcertificatesareonlyinvestigatedafteranincidenthasoccurred.(2)
TrainingisverifiedonlytotheextentrequiredbyOSHAregulations.(3)
Trainingforallemployees,includingsub‐contractors,isverifiedregularly.(4)
Trainingforallemployees,includingallsub‐contractorsisverifiedbeforeworkisconductedon
everyproject.Knowledgeandskillcompetenceareregularlyassessed.(5)
Q24Inmycompany,…
Trainershavenoformalqualifications.(1)
Becauseofjob‐siteexperiencealone,seniorlevelemployees(e.g.,foreman)areaskedto
conductsafetytraining.(2)
AformalsafetycurriculumisdevelopedandadministeredbytrainerswhomeetminimalOSHA
qualifications.(3)
Safetycurriculumisdevelopedbyhighlyqualifiedtrainers.(4)
Safetycurriculumisdevelopedandadministeredbyhighlyqualifiedandexperiencedcontent
expertswithknowledgeofadultlearningprinciples.(5)
Q25Atmyjobsite,theowner/client…
Doesnotrequiresafetypre‐qualificationsfromgeneralcontractorsorsub‐contractors;
selectionsarebasedonthelowestbid.(1)
Onlyconsiderscontractorsafetyandhealthcomeswhenanadversesafetyeventoccurs.
(2)
Reliesonfederal,state,andlocalsafetylawsforpre‐qualificationcriteria.Bidsincludea
budgetforOSHAfines.(3)
Selectscontractorsbasedonpriorsafetyandhealthperformance–aswellasbid.(4)
Selectsgeneralandsub‐contractorsbasedonsafetyprogram,practicesandclimaterather
thanlowbid.Contractorswithpoorsafetyrecordsareexcludedfrombidding.(5)

58 | P a g e
Q26Atmyjobsite,theowner/client…
Caresmostandsometimesonlyaboutlow‐costbidsandon‐timeprojectcompletion.(1)
Acknowledgesthatsafetymatters,butonlyifitdoesnotinterferewithproduction.(2)
AgreesthatsafetymattersandsupportsittothedegreethatmatchesOSHAregulations.(3)
Believessafetyisequivalenttoproductivityandcommunicatesthattoallcontractors,sub‐
contractors,supervisors,andemployees.(4)
Viewsthemselvesasultimatelyresponsibleforsafety.OftenusesanOwnerControlled
InsuranceProgrambecauseitrequiressupportingstringentsafetyandlosscontrolprocedures.
(5)
Q27Theinjuryrateinmyorganizationis...
Belowindustryaverage(1)
On‐parwithindustryaverages(2)
Aboveindustryaverage(3)
EndofSurvey

48 | P a g e
AppendixB
Contractor(n=53) DOT(n=69) Manufacturer&Vend
or(n=39)
Consultants
(n=20)
Students(n=135) Total
(n=316)
Mea
n
S.D Skew Mea
n
S.D Skew Mea
n
S.D Skew Mea
n
S.D Skew Mea
n
S.D Skew Mea
n
S.D
Easeof
Deployment/Retrie
val
4.21 0.8
4
‐1.43 4.07 0.8
6
‐1.42 4.08 0.9
8
‐1.73 4.2 0.6
2
‐0.12 3.69 0.95
8
‐0.734 3.94 0.92
6
Easytomove
around
4.26 0.8
6
‐1.50 4.09 0.8
7
‐1.41 3.95 1.0
3
‐1.75 4.3 0.5
7
‐0.038 3.85 0.92
7
‐1.014 4.01 0.90
8
UserFriendliness 3.92 0.7
3
‐1.42 3.81 0.8
6
‐1.04 4.05 1.1
2
‐1.52 4 0.4
6
0 3.9 0.99
2
‐0.783 3.91 0.91
5
LittleornoImpact
ontrafficControl
3.68 1.0
7
‐0.59 4.07 0.9
9
‐1.27 4.03 1.0
9
‐1.22 4.1 0.6
4
‐0.08 3.79 1.00
8
‐0.547 3.88 1.01
2
Limitsworker
exposure
4.51 0.7
0
‐1.04 4.48 0.7
0
‐0.99 4.08 1.0
1
‐1.45 4.2 0.5
2
0.294 3.86 0.95
5
‐0.547 4.15 0.88
9
Easytostore 2.81 0.9
8
0.40 2.74 1.0
4
0.14 3.03 0.9
9
‐0.57 2.5 0.6
9
0 3.04 0.96
9
0.21 2.9 0.98
2
Resistanceto
environmental
impact
3.72 0.8
9
‐0.44 3.42 0.8
5
‐0.19 3.83 1.0
3
‐0.65 3.25 0.5
5
0.132 3.9 0.91
6
‐0.795 3.71 0.91
3
Reusable 4.19 0.9
4
‐1.40 3.79 0.9
2
‐0.63 4.1 1.0
2
‐2.09 3.85 0.7
5
‐0.591 4.12 0.97 ‐1.137 4.04 0.95
5
EasytoMaintain 4.04 0.8 ‐0.53 3.97 0.8 ‐0.51 3.82 0.9 ‐1.23 3.6 0.6 0.712 3.92 0.93 ‐0.824 3.92 0.89

48 | P a g e
1 7 8 8 9 5
Extendedbattery
Life
3.91 0.7
4
‐0.44 3.71 0.8
8
‐0.32 4 1.0
8
‐1.74 3.8 0.7
7
‐0.403 4.02 0.91 ‐0.829 3.92 0.89
6
Costoflaborand
equipment
3.57 1.0
8
‐0.46 3.62 1.0
5
‐0.52 3.74 1.1
2
‐1.12 3.5 0.8
9
‐0.25 3.67 0.96
8
‐0.504 3.64 1.02
1
Availabilityof
equipmentinthe
market
3.85 0.8
4
‐1.11 3.59 1.0
0
‐0.39 3.53 1.0
3
‐0.77 3.35 0.8
1
0.541 3.56 0.90
3
‐0.23 3.6 0.92
8
Costofreplacing
partsmaintenance
3.6 1.0
1
‐0.53 3.59 0.9
3
‐0.21 3.5 1.0
8
‐0.74 3.3 0.8
0
0.055 3.67 0.88
9
‐0.388 3.6 0.93
8
Impactofwarning
alertondriver
4.17 0.8
9
‐1.19 4.41 0.6
3
‐0.56 3.78 1.5
3
‐1.04 4.8 0.4
1
‐1.624 4.07 0.96
7
‐0.854 4.18
0.97
8
Worker
comprehensionof
warningsignal
4.6 0.6
0
‐1.25 4.67 0.5
3
‐1.31 4.3 1.0
0
‐2.07 4.8 0.4
1
‐1.624 4.24 0.85
9
‐1.069 4.44 0.77
8
Multiplewarning
alertsources
4.08 0.7
6
‐0.41 4.23 0.7
9
‐1.00 4.16 0.9
9
‐1.81 4.2 0.6
2
‐0.12 3.96 1.05 ‐1.01 4.08 0.92
2
Adequatecoverage
distance
4.51 0.6
7
‐1.44 4.36 0.7
3
‐0.92 4.22 1.0
9
‐1.57 4.2 0.4
1
1.624 4.12 0.87
3
‐0.985 4.25 0.82
6
Limitedphysical
impactonvehicle
3.23 1.0
1
‐0.02 3.65 0.9
5
‐0.19 3.68 1.1
8
‐0.72 3.8 0.8
3
‐0.194 3.45 1.14
4
‐0.381 3.51 1.07
6
Driveradequately
comprehends
visualandaudio
warning
4.25 0.9
2
‐1.29 4.39 0.6
9
‐0.65 3.62 1.3
7
‐0.94 4.8 0.4
1
‐1.624 4.19 0.83 ‐0.677 4.21 0.90
9
Fewornofalse 4.38 0.7 ‐1.04 4.33 0.8 ‐1.33 4.03 1.0 ‐1.52 4.15 0.4 0.442 4.05 1.03 ‐0.767 4.17 0.93
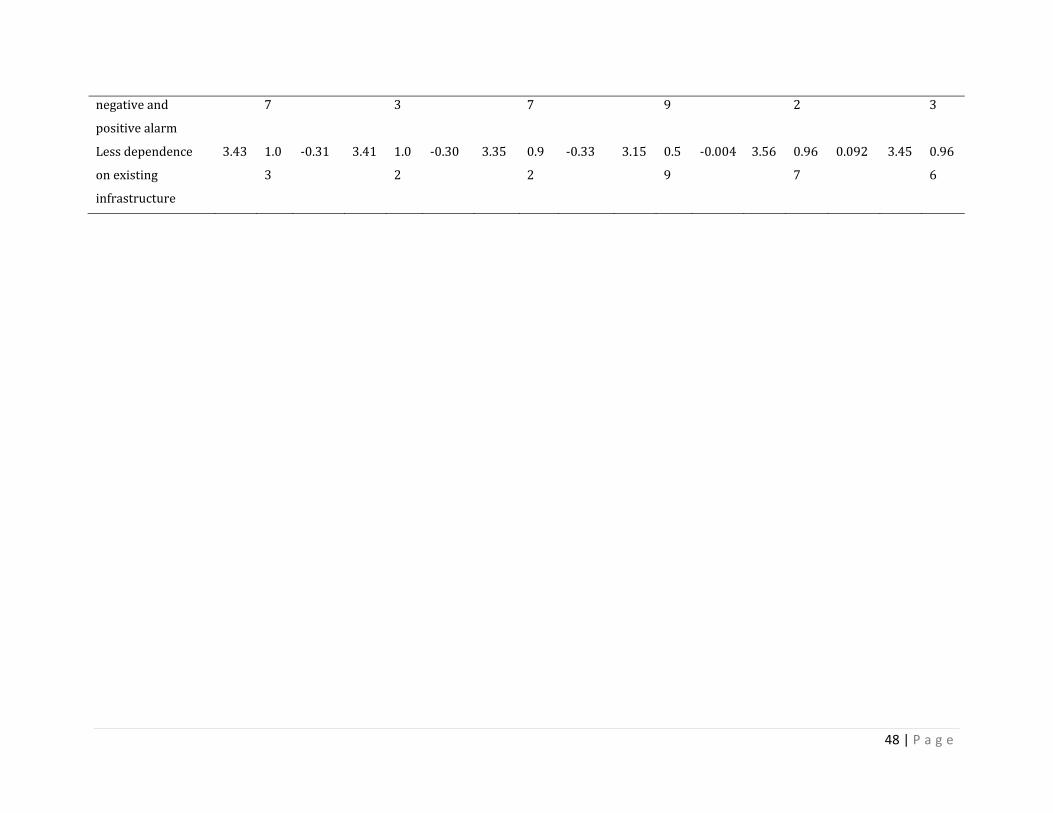
48 | P a g e
negativeand
positivealarm
7 3 7 9 2 3
Lessdependence
onexisting
infrastructure
3.43 1.0
3
‐0.31 3.41 1.0
2
‐0.30 3.35 0.9
2
‐0.33 3.15 0.5
9
‐0.004 3.56 0.96
7
0.092 3.45 0.96
6

50 | P a g e
APPENDIXC
Component Description Estimation Source
Shelflife 8yearsfor
eachdevice
Theissetal.2014,assumption
Workweek/years 20
Boliwage 26 http://www.oregon.gov/boli/WHD/PWR/Pages/PWR‐Rate‐
Publications‐‐‐2018.aspx
#ofworkday/week 4
Strobecost $35 https://www.mad4tools.com/dorman‐conelite‐led‐traffic‐
lamp‐light‐with‐cone‐bracket#tab_description_tabbed
Batterycost 2AADuracell $15 https://www.bhphotovideo.com/c/product/567719‐
REG/Duracell_MN2400B2_AAA_1_5v_Alkaline_Coppertop.html
WASPSD $100 https://www.tapconet.com/store/product‐
detail/JYab/worker‐alert‐system‐personal‐safety‐device‐
vibration‐unit?sku=TG‐WAS‐PSD
Maintenance
time/day
0.5–1.05hrs Theissetal.2014,interviewdata
Wagerate
multiplier
1.5 Theissetal.2014
#ofworkersina
workzone
10 Interviewdata

50 | P a g e
#ofmilespaved
annually(state)
170 ODOT2016reviewstatistics
#ofmilespaved
annually
(contractor)
15 Interviewdata
#ofdevicesand
accessoriespermile
Gambateseetal.2017

w w w. c p w r. c o m • w w w. e l c o s h . o rg