Reduced retention of Pittsburgh compound B in white matter lesions
8
Reduced glucose uptake and Aβ in brain regions with hyperintensities in connected white matter L. Glodzik a,b,1 , A. Kuceyeski c,1, ⁎, H. Rusinek b , W. Tsui a , L. Mosconi a , Y. Li a , R.S. Osorio a , S. Williams a , C. Randall a , N. Spector a , P. McHugh a , J. Murray a , E. Pirraglia a , S. Vallabhajosula c , A. Raj c , M.J. de Leon a a Center for Brain Health, Department of Psychiatry, New York University School of Medicine, NY, USA b Department of Radiology, New York University School of Medicine, NY, USA c Department of Radiology and The Feil Family Brain and Mind Research Institute, Weill Cornell Medical College, NY, USA abstract article info Article history: Accepted 18 June 2014 Available online 4 July 2014 Keywords: Magnetic resonance imaging Positron emission tomography Amyloid beta Aging Cerebrovascular disorders Interstitial concentration of amyloid beta (Aß) is positively related to synaptic activity in animal experiments. In humans, Aß deposition in Alzheimer's disease overlaps with cortical regions highly active earlier in life. White matter lesions (WML) disrupt connections between gray matter (GM) regions which in turn changes their acti- vation patterns. Here, we tested if WML are related to Aß accumulation (measured with PiB-PET) and glucose up- take (measured with FDG-PET) in connected GM. WML masks from 72 cognitively normal (age 61.7 ± 9.6 years, 71% women) individuals were obtained from T2-FLAIR. MRI and PET images were normalized into common space, segmented and parcellated into gray matter (GM) regions. The effects of WML on connected GM regions were assessed using the Change in Connectivity (ChaCo) score. Defined for each GM region, ChaCo is the percent- age of WM tracts connecting to that region that pass through the WML mask. The regional relationship between ChaCo, glucose uptake and Aß was explored via linear regression. Subcortical regions of the bilateral caudate, pu- tamen, calcarine, insula, thalamus and anterior cingulum had WM connections with the most lesions, followed by frontal, occipital, temporal, parietal and cerebellar regions. Regional analysis revealed that GM with more lesions in connecting WM and thus impaired connectivity had lower FDG-PET (r = 0.20, p b 0.05 corrected) and lower PiB uptake (r = 0.28, p b 0.05 corrected). Regional regression also revealed that both ChaCo (β = 0.045) and FDG-PET (β = 0.089) were significant predictors of PiB. In conclusion, brain regions with more lesions in connecting WM had lower glucose metabolism and lower Aß deposition. © 2014 Elsevier Inc. All rights reserved. Introduction Animal experiments show that interstitial concentration of amy- loid beta (Aß) increases with synaptic activity (Bero et al., 2011; Cirrito et al., 2005). Diurnal fluctuation of cerebrospinal fluid Aß42 in humans peaks in the evening and decreases at night, supporting a relationship to neuronal activity (Kang et al., 2009). Imaging tech- niques have shown that the highly active heteromodal association cortices in healthy subjects spatially overlap with patterns of Aß de- position in patients with Alzheimer's disease. A hypothesis has therefore been proposed that states that regions with high levels of connectivity and cortical activation throughout the life span may be more prone to greater Aß burden (Buckner et al., 2009; Jagust and Mormino, 2011). White matter (WM) tracts interconnect gray matter (GM) areas allowing propagation of activation from one cortical region to another (Filley, 2010). White matter lesions (WML) manifesting as areas of hy- perintense signal on MRI images are, alongside brain atrophy, the most common pathological findings associated with aging (de Leeuw et al., 2001). Regardless of the mechanism, which is debated (Scarpelli et al., 1994; Scheltens et al., 1995), WML indicate a disruption of normal pat- tern of brain connections, and have been linked to metabolic changes in distal areas and clinical symptoms (DeCarli et al., 1995; Nordahl et al., 2006). Here we test the following hypothesis: Aß load and glucose me- tabolism in a given cortical region is inversely related to the amount of connecting WM fibers with hyperintensities. Although relationships between measures of WML burden, glucose metabo- lism and Aß accumulation have been previously reported (DeCarli et al., 1995; Hedden et al., 2012; Kuczynski et al., 2008; Marchant et al., 2012; Provenzano et al., 2013; Reed et al., 2004; Sultzer et al., 2002; Tullberg et al., 2004), none consider the topology of the WM fiber network. In this study, we examine relationships be- tween WM connectivity disruption and fluorodeoxyglucose (FDG) uptake and Pittsburgh compound B (PiB) deposition on a region- wise basis. NeuroImage 100 (2014) 684–691 ⁎ Corresponding author at: 515 East 71st St., S-125, New York, NY 10065, USA. E-mail address: [email protected] (A. Kuceyeski). 1 These authors contributed equally to the manuscript. http://dx.doi.org/10.1016/j.neuroimage.2014.06.060 1053-8119/© 2014 Elsevier Inc. All rights reserved. Contents lists available at ScienceDirect NeuroImage journal homepage: www.elsevier.com/locate/ynimg
-
Upload
independent -
Category
Documents
-
view
2 -
download
0
Transcript of Reduced retention of Pittsburgh compound B in white matter lesions
NeuroImage 100 (2014) 684–691
Contents lists available at ScienceDirect
NeuroImage
j ourna l homepage: www.e lsev ie r .com/ locate /yn img
Reduced glucose uptake and Aβ in brain regions with hyperintensities inconnected white matter
L. Glodzik a,b,1, A. Kuceyeski c,1,⁎, H. Rusinek b, W. Tsui a, L. Mosconi a, Y. Li a, R.S. Osorio a, S. Williams a,C. Randall a, N. Spector a, P. McHugh a, J. Murray a, E. Pirraglia a, S. Vallabhajosula c, A. Raj c, M.J. de Leon a
a Center for Brain Health, Department of Psychiatry, New York University School of Medicine, NY, USAb Department of Radiology, New York University School of Medicine, NY, USAc Department of Radiology and The Feil Family Brain and Mind Research Institute, Weill Cornell Medical College, NY, USA
⁎ Corresponding author at: 515 East 71st St., S-125, NeE-mail address: [email protected] (A. Kucey
1 These authors contributed equally to the manuscript.
http://dx.doi.org/10.1016/j.neuroimage.2014.06.0601053-8119/© 2014 Elsevier Inc. All rights reserved.
a b s t r a c t
a r t i c l e i n f oArticle history:Accepted 18 June 2014Available online 4 July 2014
Keywords:Magnetic resonance imagingPositron emission tomographyAmyloid betaAgingCerebrovascular disorders
Interstitial concentration of amyloid beta (Aß) is positively related to synaptic activity in animal experiments. Inhumans, Aß deposition in Alzheimer's disease overlaps with cortical regions highly active earlier in life. Whitematter lesions (WML) disrupt connections between gray matter (GM) regions which in turn changes their acti-vation patterns. Here,we tested ifWML are related toAß accumulation (measuredwith PiB-PET) and glucose up-take (measuredwith FDG-PET) in connected GM.WMLmasks from 72 cognitively normal (age 61.7± 9.6 years,71% women) individuals were obtained from T2-FLAIR. MRI and PET images were normalized into commonspace, segmented and parcellated into gray matter (GM) regions. The effects of WML on connected GM regionswere assessed using the Change in Connectivity (ChaCo) score. Defined for eachGM region, ChaCo is the percent-age ofWM tracts connecting to that region that pass through theWMLmask. The regional relationship betweenChaCo, glucose uptake and Aßwas explored via linear regression. Subcortical regions of the bilateral caudate, pu-tamen, calcarine, insula, thalamus and anterior cingulumhadWMconnectionswith themost lesions, followedbyfrontal, occipital, temporal, parietal and cerebellar regions. Regional analysis revealed that GMwithmore lesionsin connecting WM and thus impaired connectivity had lower FDG-PET (r = 0.20, p b 0.05 corrected) and lowerPiB uptake (r = 0.28, p b 0.05 corrected). Regional regression also revealed that both ChaCo (β = 0.045) andFDG-PET (β = 0.089) were significant predictors of PiB. In conclusion, brain regions with more lesions inconnecting WM had lower glucose metabolism and lower Aß deposition.
© 2014 Elsevier Inc. All rights reserved.
Introduction
Animal experiments show that interstitial concentration of amy-loid beta (Aß) increases with synaptic activity (Bero et al., 2011;Cirrito et al., 2005). Diurnal fluctuation of cerebrospinal fluid Aß42in humans peaks in the evening and decreases at night, supportinga relationship to neuronal activity (Kang et al., 2009). Imaging tech-niques have shown that the highly active heteromodal associationcortices in healthy subjects spatially overlap with patterns of Aß de-position in patients with Alzheimer's disease. A hypothesis hastherefore been proposed that states that regions with high levels ofconnectivity and cortical activation throughout the life span maybe more prone to greater Aß burden (Buckner et al., 2009; Jagustand Mormino, 2011).
White matter (WM) tracts interconnect gray matter (GM) areasallowing propagation of activation from one cortical region to another
w York, NY 10065, USA.eski).
(Filley, 2010). White matter lesions (WML) manifesting as areas of hy-perintense signal on MRI images are, alongside brain atrophy, the mostcommon pathological findings associated with aging (de Leeuw et al.,2001). Regardless of the mechanism, which is debated (Scarpelli et al.,1994; Scheltens et al., 1995), WML indicate a disruption of normal pat-tern of brain connections, and have been linked tometabolic changes indistal areas and clinical symptoms (DeCarli et al., 1995; Nordahl et al.,2006).
Here we test the following hypothesis: Aß load and glucose me-tabolism in a given cortical region is inversely related to theamount of connecting WM fibers with hyperintensities. Althoughrelationships between measures of WML burden, glucose metabo-lism and Aß accumulation have been previously reported (DeCarliet al., 1995; Hedden et al., 2012; Kuczynski et al., 2008; Marchantet al., 2012; Provenzano et al., 2013; Reed et al., 2004; Sultzeret al., 2002; Tullberg et al., 2004), none consider the topology ofthe WM fiber network. In this study, we examine relationships be-tween WM connectivity disruption and fluorodeoxyglucose (FDG)uptake and Pittsburgh compound B (PiB) deposition on a region-wise basis.
685L. Glodzik et al. / NeuroImage 100 (2014) 684–691
Materials and methods
Subjects
Seventy-two subjects were studied (mean age 61.7± 9.6 years, 71%women, education 17 ± 1.9 years). All were recruited in the Center forBrain Health New York University School of Medicine, and signed IRBapproved consents for protocols investigating risk factors of cognitivedecline and Alzheimer's disease. The clinical evaluation included aninterview according to the Brief Cognitive Rating Scale and rating onGlobal Deterioration Scale (Reisberg et al., 1993). Based on clinical as-sessment, all subjects were diagnosed as cognitively healthy: with(Global Deterioration Scale of 2) or without subjective memory com-plaints (Global Deterioration Scale of 1), but not fulfilling the criteriafor mild cognitive impairment or dementia. Subjects scoring N16 onthe 17-item Hamilton Depression Scale were excluded (Bech et al.,1986). All subjects had ≥26 points on Mini Mental State Examination(Folstein, 1983). Subjects with brain pathology (tumor, neocortical in-farction), diabetes, axis I disorders and those using psychoactive medi-cations were also excluded.
A statement of written informed consent for participation in a studyof longitudinal changes in brain aging was obtained from all patientsparticipating in the study.
Imaging
MRI acquisitionImaging was performed on a 1.5 T GE scanner (GE, Milwaukee,
WI, USA). All participants received T1-weighted and FLAIR scans. T1weighted (gradient echo) MRI scans were acquired in the coronal orien-tation (repetition time = 35 ms, time to echo = 2 ms, flip angle = 60°,number of excitations = 1, slice thickness = 1.6 mm, field of view =200 mm, matrix = 256 × 192 × 124, reconstructed as 256 × 256).FLAIR images were acquired in the axial orientation (repetition time =9279 ms, time to echo = 127 ms, time to inversion = 2300 ms, flipangle = 90°, number of excitations = 1, slice thickness = 3.3 mm, fieldof view = 240 mm, matrix = 256 × 192, as 256 × 256 images).
WML segmentationWML and whole brain volumes were determined using a locally de-
veloped software package FireVoxel (https://files.nyu.edu/hr18/public).Brain parenchymavolume, VB, was obtained by automatic segmentationof T1 weighted images (Mikheev et al., 2008) and theWMLmasks wereobtained from FLAIR images, which had been corrected for signal non-uniformity with N3 algorithm (Sled et al., 1998). The WML maskwas created via the following process. A “pure WM” seed, defined asthe 1-cm3 regionwhere the coefficient of variability of signal isminimal,was identified. An initial mask M0 was then constructed from voxelswith signal N0.55 relative to the seed signal (cerebrospinal fluid spacesare excluded from further consideration). Subvoxel erosion with radius2.7 mm was then applied to the mask M0 to disconnect the head/neckmuscles and optic nerves. The program then computed the largest con-nected components of the erodedmask. A constrained growth operatorwas applied to generate the brain parenchymamaskM. The brain stem,the pons and the cerebellumwere retained inM. Subsequently, a set M′
was then constructed by applying the 3Dmorphologicfill operator toM.This was done to assure that all hypointensities located at the ventricu-lar borderwere considered. In the next step,we constructed the set L0 ofvoxels in M′ with signal above 2.5 standard deviations above the meanFLAIR signal for M. This set was than filtered to remove: (a) corticalvoxels, defined as those located within 3 mm of the surface of M;(b) small clusters of volume b12 mm3; and (c) connected regions hav-ing N50% CSF border. The result of automatic 3 mm erosion in step(a) was inspected and edited if needed.
WML volume VWML was then calculated as the product of FLAIRvoxel volume and the number of WML voxels. The fractional WML
volume (fVWML) was generated as VWML/VB. FLAIRMR-imageswere spa-tially normalized to MNI (Montreal Neurological Institute) space usingSPM, and the resulting non-linear transformation was applied to theWML mask (with nearest neighbor interpolation). Coregistrationswere checked visually for accuracy.
FDG-PET and PiB-PET acquisitionScans were performed an LS Discovery scanner; G.E. Medical Sys-
tems, Milwaukee, WI; 5.4 mm full width at half maximum, 30 cm fieldof view. Before the scanning a venous line was inserted in theantecubital vein, and subjects rested in the quiet and dim room. PiB-PET scanning started about 60 min after isotope injection and lasted30 min. In each case, 15 mCi (~550 MBq) of N-methyl(11C)2-(4′-methylaminophenyl)-6-hydroxy-benzothiazole (PiB; radiochemicalpurity N98%) was administered. The FDG scan procedure started30 min after completion of the PiB scan or on a separate day. After anovernight fast, subjects were injected with 5 mCi (~340 MBq) of 2-(18F)fluoro-2-Deoxy-D-glucose, positioned in the scanner approximate-ly 35 min after injection, and scanned for 20 min. Prior to each PET ex-amination, a 5 min CT transmission scan was acquired for attenuationcorrection. All images were corrected for photon attenuation, scatter,and radioactive decay, and reconstructed into a 512 × 512 matrixusing iterative algorithms: LS Discovery: FORE IT, Fourier rebinningfollowed byOrder Subset ExpectationMaximization, OSEM, 8 iterations,16 subsets, 3.375 mm voxel.
PiB-PET image processingThe 60–90min PiB and the 40–60min of FDG datawere used to gen-
erate summed PET images. Theywere coregistered to their correspond-ing T1-MRI using Statistical Parametric Mapping (SPM, version 8)(Ashburner and Friston, 2000). The parameters obtained from normali-zation of T1-MRI images to theMNI spacewere then applied to the FDG-PET and PiB-PET images to reslice them into common space. An auto-mated cerebellar region of interest (ROI) was used to extract the cere-bellar intensity value (Li et al., 2008). The cerebellar intensity valuewas then applied to create intensity ratio images for both types of PETimages, by normalizing each voxel to the cerebellum through image cal-culation function. Cerebellar ratio images were then used in all furtheranalyses.
The average signal for cortical and subcortical GM regionswas calcu-lated for both PiB-PET and FDG-PET images. The GM regions were de-fined by identifying voxels within SPM's MNI space GM tissue maskand then assigning each to one of the 116-regions in theMNI space Au-tomated Anatomical Labeling atlas (Tzourio-Mazoyer et al., 2002), andapplying that same regional definition to each individual's MNI spacePiB-PET and FDG-PET images so that the region assignments were uni-form for all subjects. Proximity to WMLs may also affect the functionand/or PiB deposition in a GM region. Therefore, the white matterdistance (WMD) was defined for each of the 116 regions as the averagedistance toWML. It was calculated by taking the mean of the Euclideandistance of each region's center of mass to each voxel in theWMLmask.
The NeMo Tool
The NeMo Tool (Kuceyeski et al., 2013)was used to estimate region-al and global structural connectivity changes that may result from agivenWMabnormalitymask. TheNeMo tool is based on the TractogramReference Set, which is a large set of WM streamlines created usingprobabilistic tractography in 72 normal controls (independent of thisstudy group). These streamlines are used to project given WMabnormalities onto structurally “connected” GM regions. The NeMotool reports connectivity changes in two ways: 1) local Change in Con-nectivity (ChaCo) scores that were based on a 116 region atlas and 2)global network changes based on graph theoretical metrics, i.e. efficien-cy and characteristic path length. Both of these graph metrics quantifyhow easily information flows within a network; for example if a signal
686 L. Glodzik et al. / NeuroImage 100 (2014) 684–691
movesmore easily fromnode to nodewithin a network then itwill havelarger efficiency and smaller characteristic path length. In thework pre-sented here, the lesion masks were binary so ChaCo scores were simplythe percent of tracts ending in a given GM region that pass through ab-normalWML out of the total number of tracts connecting to that GM re-gion. ChaCo scores were presented as negative values, indicating thatthe implied influence of the WML was that of disruption. This meansthat lower (more negative) values indicate more connectivity disrup-tion and larger (more positive) values indicate less connectivitydisruption.
Statistical approach
The relationship between lesions in connectingWM, Aß deposition,glucose metabolism, and proximity toWMLs were explored on an indi-vidual subject, region-wise basis. Because we were interested in the ef-fect of WM connectivity disruption, only the 5%most disrupted regionsover the population (out of 72 × 116 regions) were retained in the fol-lowing analysis. Thresholding was done on an individual region-wisebasis, i.e. scores were not averaged before thresholding. We chose thetop 5% most disrupted (regions with ChaCo b −1.67%) as the ChaCoscores were quite minimal over the population and this threshold as-sures that we are taking only the regions that had the most lesions inconnectingWMwithout excluding toomany data points. If we includedmore regions, the ChaCo scores would be greater than−1% andmay besubject to noise effects. On the other hand, if the cutoff was made morestringent, the number of included data would shrink and the resultinganalysis would have too small a number of data points to draw conclu-sions. In order to verify that the particular choice of cutoff did not undu-ly influence the overall results, we doubled and halved the chosenthreshold of 5% and compared the regression model results.
Before and after thesholding, the ChaCo scores appeared to be expo-nentially distributed and were transformed before performing statisti-cal analysis that assumes Gaussianity. A resampling scheme usedpreviously (Honey et al., 2009) was implemented. We drew N samplesfrom a standard Gaussian distribution (μ=0, σ=1), where N was thenumber of elements in the thresholded ChaCo scores. We replaced themost negative ChaCo score with the smallest normal value, the secondmost negative ChaCo score with the second-smallest normal value andso on until all ChaCo scores had been replaced with a normal value.Smaller values of the transformed ChaCo still indicate more disconnec-tion, as in the original scores.
Pearson's correlations were calculated between all of the regionalmetrics and their significance was assessed using Bonferroni correctionfor multiple comparisons (p b 0.05/6= 0.0083). The inter-relationshipof each of these values with Aß deposition was further explored vialinear regression (Draper and Smith, 1998). PiB was the dependentvariable; FDG-PET,WMD, and transformed ChaCo scoreswere the inde-pendent predictors.
Results
The mean fVWML was .37% ± .41% (median .33%, interquartile range.22%, min .01%, max 2.5%). The ChaCo scores varied across the popula-tion — Fig. 1 shows the lesion masks and the corresponding ChaCoscores for three different individuals via the glassbrain display. Theglassbrain display depicts each region as a sphere, where the size is pro-portional to the ChaCo score and the color denotes regional (corticallobe and subcortical)membership. Themean ChaCo score over the pop-ulation for each GM region is displayed via the glassbrain in Fig. 2, andboxplots of the distributions of scores over the population are given inthe bottom part of Fig. 2. Each boxplot depicts the distribution of scoresfor a particular region, color-coded with the same key as the glassbrain.Regions of the bilateral caudate, putamen, calcarine, anterior cingulum,lingual gyri and thalamuswere themost affected (had the highestmean
ChaCo scores), followed by other occipital, frontal, parietal, and tempo-ral regions.
Regions that were included in the correlation/regression analysis(top 5% of ChaCo scores) coincided largely with those that had thehighestmean ChaCo scores, unsurprisingly. Sixty-eight of the 72 individ-uals had at least one region included, and 52/90 cortical and subcorticalregionswere represented (none of the 26 cerebellar regionswere includ-ed). Significant correlations existed among all four variables (ChaCo,FDG-PET, PIB-PET, and WMD) after Bonferroni correction for multiplecomparisons. Fig. 3 shows scatter plots of each of the variables againstthe others (in the off-diagonal plots), in addition to histograms of eachvariable (in the diagonal plots). However, correlations between trans-formed ChaCo and FDG-PET (r = 0.20, p b 0.0083) and PiB-PET (r =0.28, p b 0.0083) were higher than correlations between WMD andFDG-PET (r = 0.16, p b 0.0083) and PiB-PET (r = 0.14, p b 0.0083).The highest correlations existed between PiB-PET and FDG-PET (r =0.44, p b 0.0083). We inspected the correlation between PiB-PET andFDG-PET in cortical and subcortical regionswith no lesions in connectingWM (ChaCo scores of 0), to be sure that the positive relationship foundwas not due to the thresholding of ChaCo scores. The correlation inthese regions was still positive (r = 0.20, p b 0.0013), although abouthalf of what was found in regions with some disconnection. We wouldalso like to point out that the non-parametric Spearman correlations ofthe original untransformedChaCo scoreswith the other regional imagingvariables (see Supplemental Table 1) were very similar to the Pearsoncorrelations with the transformed ChaCo scores. Therefore we believethat the underlying relationships of the variables were not fundamental-ly changed by this transform.
The final linear regression model (R2 = 0.23) indicated that bothFDG-PET and transformed ChaCo had positive relationships with PiBdeposition (Fig. 4, top). The coefficient with the smallest p-value(5.2 × 10⁻¹⁸) was FDG-PET, which was positively associated with PiB(β = 0.089 ± 0.0099) (see Fig. 4, bottom left). Transformed ChaCowas also included in the final model (p = 4.6 × 10⁻⁶), and the coeffi-cient indicated a positive relationship to PiB (β = 0.045 ± 0.0099,Fig. 4 bottom right). The same regression analysis was performed withthe top 2.5% and 10% most disconnected regions, and the results werevery similar. FDG-PET and transformed ChaCowere the only two signif-icant contributors to each model, and they both had positive regressioncoefficients. In themodel containing the top 2.5%most disconnected re-gions, the regression coefficients were: FDG-PET (0.11 ± 0.013) andChaCo (0.044 ± 0.013). In the model that included the top 10% mostdisconnected regions, the regression coefficients were: FDG-PET(0.079 ± 0.0071) and ChaCo (0.021 ± 0.0071).
Discussion
Cognitively normal elderly subjects with WML had implied connec-tivity loss mostly in subcortical regions, particularly the caudate nucle-us. Frontal and occipital lobes had some disconnection as well, withthe temporal and parietal showing little and the cerebellum showingno disruptions in connection. Most importantly, when examined on re-gion to region basis, the correlations between ChaCo, FDG-PET and PiB-PET indicate that regionswithmore lesions in connectingWMhave lessglucose metabolism and lower Aß deposition. A weaker relationshipwas also found between WMD; GM regions closer to WMLs tended tohave lower glucose consumption and lower Aß levels.
One simple explanation for our finding is that changes in the vascu-lature supplying connected WM and GM regions might have causedhypoperfusion resulting both inWML and reduction in cortical metabo-lism. However, other explanations are also plausible. Since implied con-nectivity loss was associated with lower glucose metabolism and lowerAß in connecting regions, we posit thatWML lesions are causing disrup-tion of incoming and/or outgoing electrical signals to that region, whichin turn lowers synaptic activity and (therefore?) Aß deposition. Loss ofsynapses could also explain our findings. Alternatively, regions with
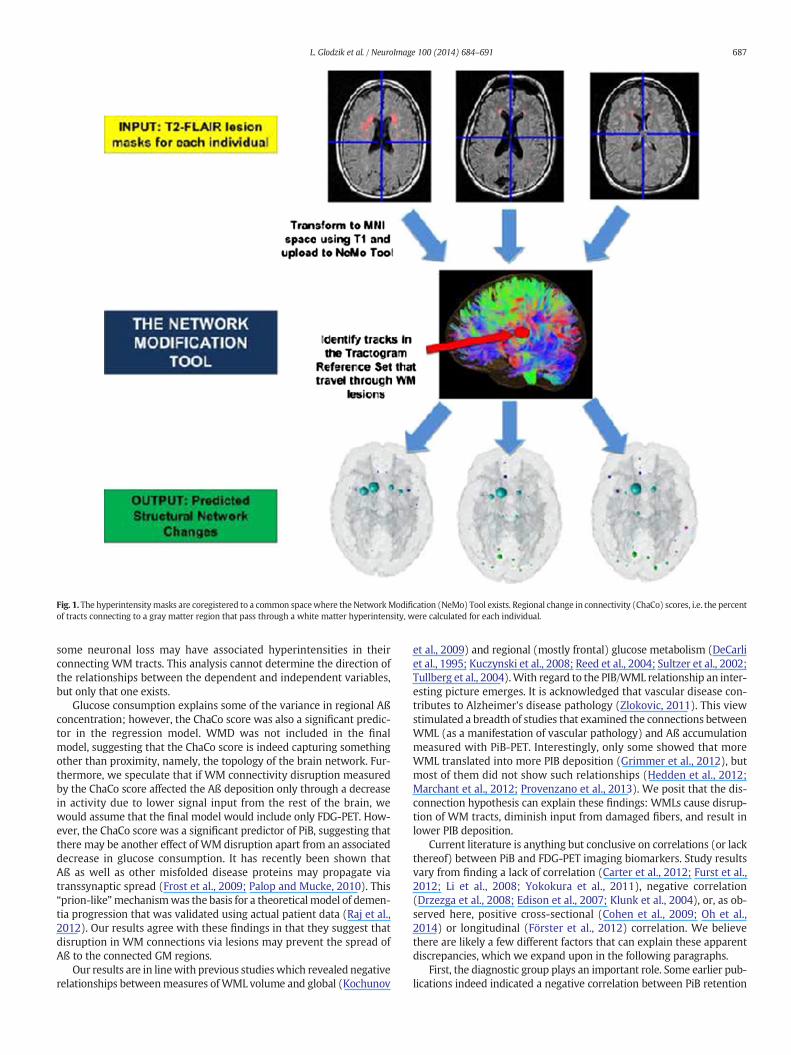
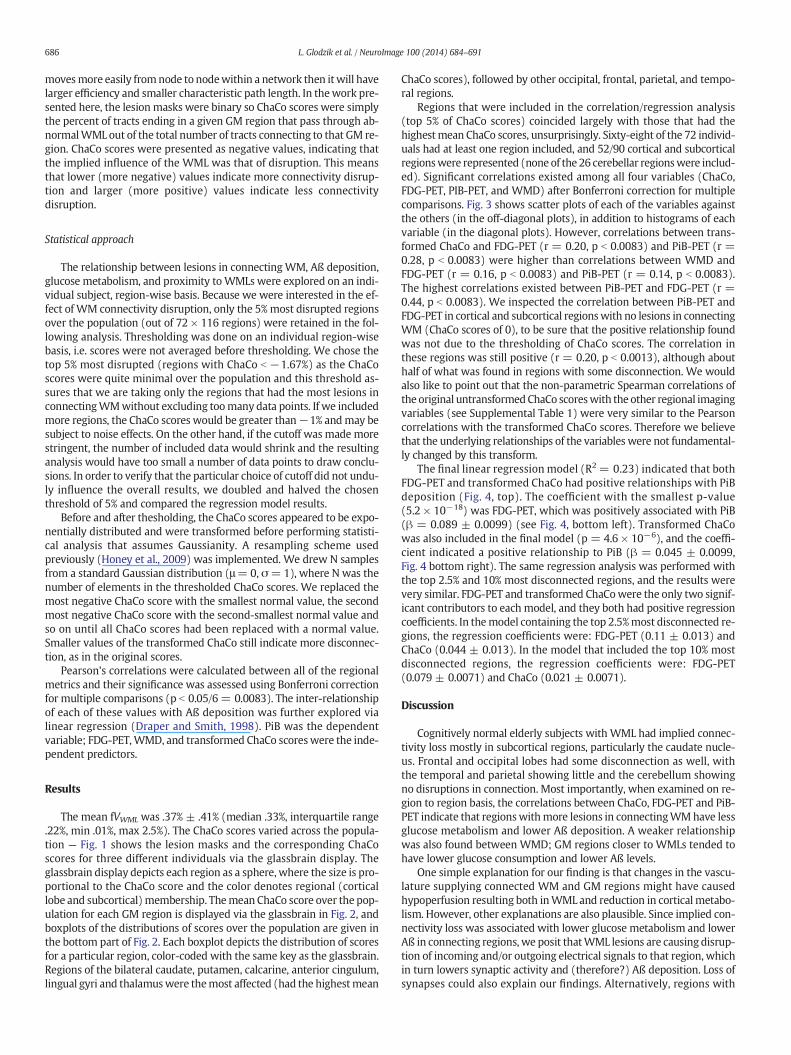
Fig. 1. The hyperintensitymasks are coregistered to a common spacewhere the NetworkModification (NeMo) Tool exists. Regional change in connectivity (ChaCo) scores, i.e. the percentof tracts connecting to a gray matter region that pass through a white matter hyperintensity, were calculated for each individual.
687L. Glodzik et al. / NeuroImage 100 (2014) 684–691
some neuronal loss may have associated hyperintensities in theirconnecting WM tracts. This analysis cannot determine the direction ofthe relationships between the dependent and independent variables,but only that one exists.
Glucose consumption explains some of the variance in regional Aßconcentration; however, the ChaCo score was also a significant predic-tor in the regression model. WMD was not included in the finalmodel, suggesting that the ChaCo score is indeed capturing somethingother than proximity, namely, the topology of the brain network. Fur-thermore, we speculate that if WM connectivity disruption measuredby the ChaCo score affected the Aß deposition only through a decreasein activity due to lower signal input from the rest of the brain, wewould assume that the final model would include only FDG-PET. How-ever, the ChaCo score was a significant predictor of PiB, suggesting thatthere may be another effect of WM disruption apart from an associateddecrease in glucose consumption. It has recently been shown thatAß as well as other misfolded disease proteins may propagate viatranssynaptic spread (Frost et al., 2009; Palop and Mucke, 2010). This“prion-like”mechanismwas the basis for a theoreticalmodel of demen-tia progression that was validated using actual patient data (Raj et al.,2012). Our results agree with these findings in that they suggest thatdisruption in WM connections via lesions may prevent the spread ofAß to the connected GM regions.
Our results are in linewith previous studieswhich revealed negativerelationships betweenmeasures ofWML volume and global (Kochunov
et al., 2009) and regional (mostly frontal) glucose metabolism (DeCarliet al., 1995; Kuczynski et al., 2008; Reed et al., 2004; Sultzer et al., 2002;Tullberg et al., 2004).With regard to the PIB/WML relationship an inter-esting picture emerges. It is acknowledged that vascular disease con-tributes to Alzheimer's disease pathology (Zlokovic, 2011). This viewstimulated a breadth of studies that examined the connections betweenWML (as a manifestation of vascular pathology) and Aß accumulationmeasured with PiB-PET. Interestingly, only some showed that moreWML translated into more PIB deposition (Grimmer et al., 2012), butmost of them did not show such relationships (Hedden et al., 2012;Marchant et al., 2012; Provenzano et al., 2013). We posit that the dis-connection hypothesis can explain these findings: WMLs cause disrup-tion of WM tracts, diminish input from damaged fibers, and result inlower PIB deposition.
Current literature is anything but conclusive on correlations (or lackthereof) between PiB and FDG-PET imaging biomarkers. Study resultsvary from finding a lack of correlation (Carter et al., 2012; Furst et al.,2012; Li et al., 2008; Yokokura et al., 2011), negative correlation(Drzezga et al., 2008; Edison et al., 2007; Klunk et al., 2004), or, as ob-served here, positive cross-sectional (Cohen et al., 2009; Oh et al.,2014) or longitudinal (Förster et al., 2012) correlation. We believethere are likely a few different factors that can explain these apparentdiscrepancies, which we expand upon in the following paragraphs.
First, the diagnostic group plays an important role. Some earlier pub-lications indeed indicated a negative correlation between PiB retention
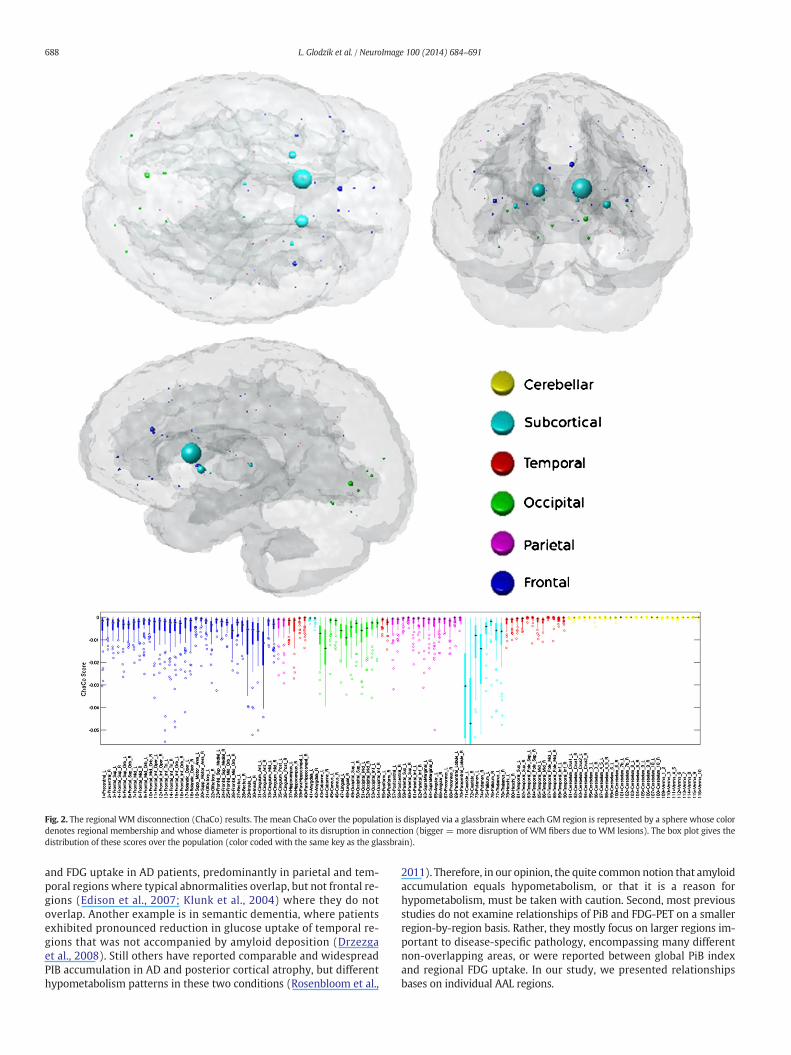
Fig. 2. The regional WM disconnection (ChaCo) results. The mean ChaCo over the population is displayed via a glassbrain where each GM region is represented by a sphere whose colordenotes regional membership and whose diameter is proportional to its disruption in connection (bigger = more disruption of WM fibers due to WM lesions). The box plot gives thedistribution of these scores over the population (color coded with the same key as the glassbrain).
688 L. Glodzik et al. / NeuroImage 100 (2014) 684–691
and FDG uptake in AD patients, predominantly in parietal and tem-poral regions where typical abnormalities overlap, but not frontal re-gions (Edison et al., 2007; Klunk et al., 2004) where they do notoverlap. Another example is in semantic dementia, where patientsexhibited pronounced reduction in glucose uptake of temporal re-gions that was not accompanied by amyloid deposition (Drzezgaet al., 2008). Still others have reported comparable and widespreadPIB accumulation in AD and posterior cortical atrophy, but differenthypometabolism patterns in these two conditions (Rosenbloom et al.,
2011). Therefore, in our opinion, the quite common notion that amyloidaccumulation equals hypometabolism, or that it is a reason forhypometabolism, must be taken with caution. Second, most previousstudies do not examine relationships of PiB and FDG-PET on a smallerregion-by-region basis. Rather, they mostly focus on larger regions im-portant to disease-specific pathology, encompassing many differentnon-overlapping areas, or were reported between global PiB indexand regional FDG uptake. In our study, we presented relationshipsbases on individual AAL regions.
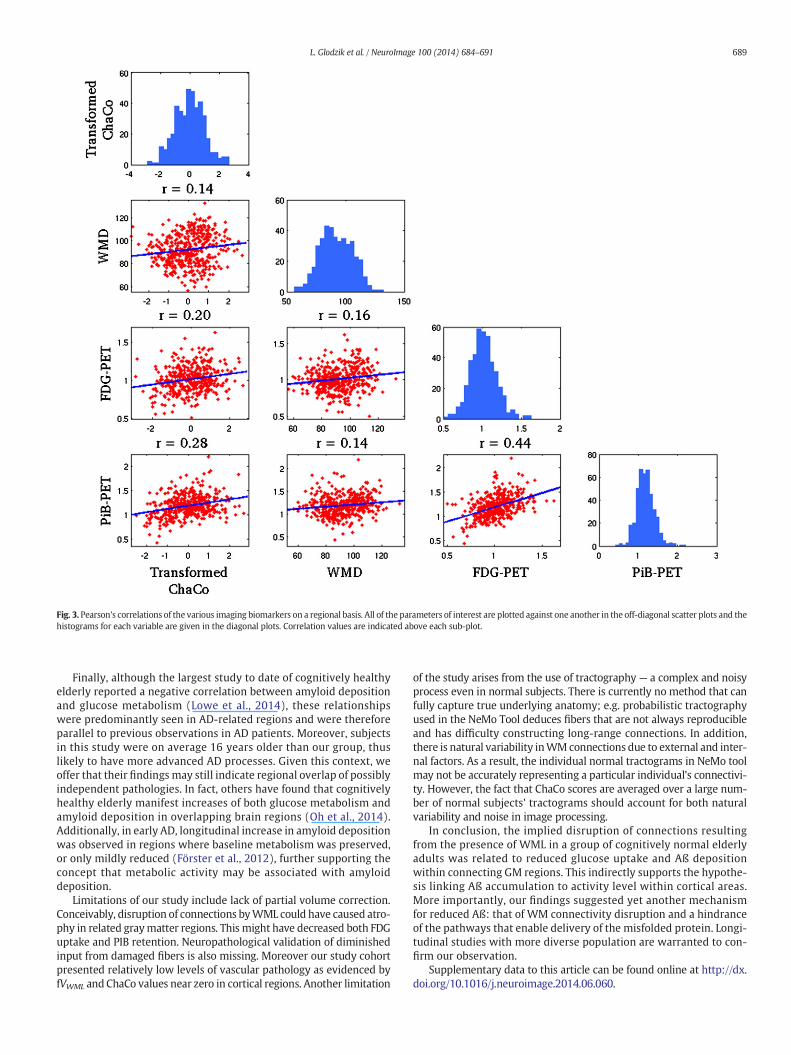
Fig. 3. Pearson's correlations of the various imaging biomarkers on a regional basis. All of the parameters of interest are plotted against one another in the off-diagonal scatter plots and thehistograms for each variable are given in the diagonal plots. Correlation values are indicated above each sub-plot.
689L. Glodzik et al. / NeuroImage 100 (2014) 684–691
Finally, although the largest study to date of cognitively healthyelderly reported a negative correlation between amyloid depositionand glucose metabolism (Lowe et al., 2014), these relationshipswere predominantly seen in AD-related regions and were thereforeparallel to previous observations in AD patients. Moreover, subjectsin this study were on average 16 years older than our group, thuslikely to have more advanced AD processes. Given this context, weoffer that their findings may still indicate regional overlap of possiblyindependent pathologies. In fact, others have found that cognitivelyhealthy elderly manifest increases of both glucose metabolism andamyloid deposition in overlapping brain regions (Oh et al., 2014).Additionally, in early AD, longitudinal increase in amyloid depositionwas observed in regions where baseline metabolism was preserved,or only mildly reduced (Förster et al., 2012), further supporting theconcept that metabolic activity may be associated with amyloiddeposition.
Limitations of our study include lack of partial volume correction.Conceivably, disruption of connections byWML could have caused atro-phy in related graymatter regions. This might have decreased both FDGuptake and PIB retention. Neuropathological validation of diminishedinput from damaged fibers is also missing. Moreover our study cohortpresented relatively low levels of vascular pathology as evidenced byfVWML and ChaCo values near zero in cortical regions. Another limitation
of the study arises from the use of tractography — a complex and noisyprocess even in normal subjects. There is currently no method that canfully capture true underlying anatomy; e.g. probabilistic tractographyused in the NeMo Tool deduces fibers that are not always reproducibleand has difficulty constructing long-range connections. In addition,there is natural variability inWMconnections due to external and inter-nal factors. As a result, the individual normal tractograms in NeMo toolmay not be accurately representing a particular individual's connectivi-ty. However, the fact that ChaCo scores are averaged over a large num-ber of normal subjects' tractograms should account for both naturalvariability and noise in image processing.
In conclusion, the implied disruption of connections resultingfrom the presence of WML in a group of cognitively normal elderlyadults was related to reduced glucose uptake and Aß depositionwithin connecting GM regions. This indirectly supports the hypothe-sis linking Aß accumulation to activity level within cortical areas.More importantly, our findings suggested yet another mechanismfor reduced Aß: that of WM connectivity disruption and a hindranceof the pathways that enable delivery of the misfolded protein. Longi-tudinal studies with more diverse population are warranted to con-firm our observation.
Supplementary data to this article can be found online at http://dx.doi.org/10.1016/j.neuroimage.2014.06.060.

Fig. 4. The model resulting from linear regression on a regional basis. PiB-PET was the dependent variable. The top panel gives the predicted versus actual PiB-PET signal, with the twobottom plots showing the adjusted response plots for the two variables included in the final model (FDG-PET and transformed ChaCo).
690 L. Glodzik et al. / NeuroImage 100 (2014) 684–691
Acknowledgments
This work was supported by a Leon Levy Foundation NeuroscienceFellowship and the following NIH grants: P41 RR023953-02, P41RR023953-02S1, R01 NS075425, 2R01AG013616-22, R01-AG035137,RC2-AG036502, P30 AG008051 and HL111724-01.
Conflicts of interest
We would like to disclose the following possible conflicts.Dr. Glodzikwas a PI on an Investigator Initiated project funded by ForestLaboratories, Inc., and received a travel grant from Roche Pharma. Drs.Mosconi, Tsui and de Leon have a patent on a technology that was li-censed to Abiant Imaging Inc. by NYU and, as such, have a financial in-terest in this license agreement and hold stock and stock options inthe company. Drs. Mosconi and de Leon have received compensationfor consulting services from Abiant Imaging. Dr. de Leon has receivedpersonal compensation for serving as a consultant for Abiant ImagingInc. (Chicago, IL). He was also a PI on a completed Investigator Initiatedproject funded by Forest Laboratories, Inc., and a completed clinical trialsupported by Neuroptix (Boston). Dr. de Leon received travel expenses
for serving on the French Alzheimer Disease Foundation and anhonorarium as a consultant to Roche Pharma. Dr. Raj receives researchsupport from EMD Serono and Biogen Idec.
References
Ashburner, J., Friston, K.J., 2000. Voxel-based morphometry—the methods. Neuroimage11, 805–821.
Bech, P., Kastrup, M., Rafaelsen, O.J., 1986. Mini-compendium of rating scales for states ofanxiety depression mania schizophrenia with corresponding DSM-III syndromes.Acta Psychiatr. Scand. Suppl. 326, 1–37.
Bero, A.W., Yan, P., Roh, J.H., Cirrito, J.R., Stewart, F.R., Raichle, M.E., Lee, J.-M., Holtzman,D.M., 2011. Neuronal activity regulates the regional vulnerability to amyloid-β depo-sition. Nat. Neurosci. 14, 750–756.
Buckner, R.L., Sepulcre, J., Talukdar, T., Krienen, F.M., Liu, H., Hedden, T., Andrews-Hanna,J.R., Sperling, R.A., Johnson, K.A., 2009. Cortical hubs revealed by intrinsic functionalconnectivity: mapping, assessment of stability, and relation to Alzheimer's disease.J. Neurosci. 29, 1860–1873.
Carter, S.F., Schöll, M., Almkvist, O., Wall, A., Engler, H., Långström, B., Nordberg, A., 2012.Evidence for astrocytosis in prodromal Alzheimer disease provided by 11C-deuterium-L-deprenyl: a multitracer PET paradigm combining 11C-Pittsburgh com-pound B and 18 F-FDG. J. Nucl. Med. 53, 37–46.
Cirrito, J.R., Yamada, K.A., Finn, M.B., Sloviter, R.S., Bales, K.R., May, P.C., Schoepp, D.D., Paul,S.M., Mennerick, S., Holtzman, D.M., 2005. Synaptic activity regulates interstitial fluidamyloid-beta levels in vivo. Neuron 48, 913–922.
691L. Glodzik et al. / NeuroImage 100 (2014) 684–691
Cohen, A.D., Price, J.C., Weissfeld, L.A., James, J., Rosario, B.L., Bi, W., Nebes, R.D.,Saxton, J.A., Snitz, B.E., Aizenstein, H.A., Wolk, D.A., Dekosky, S.T., Mathis, C.A.,Klunk, W.E., 2009. Basal cerebral metabolism may modulate the cognitive effectsof Abeta in mild cognitive impairment: an example of brain reserve. J. Neurosci.29, 14770–14778.
De Leeuw, F.E., de Groot, J.C., Achten, E., Oudkerk, M., Ramos, L.M., Heijboer, R., Hofman, A.,Jolles, J., van Gijn, J., Breteler, M.M., 2001. Prevalence of cerebral white matter lesionsin elderly people: a population based magnetic resonance imaging study. The Rotter-dam Scan Study. J. Neurol. Neurosurg. Psychiatry 70, 9–14.
DeCarli, C., Murphy, D.G., Tranh, M., Grady, C.L., Haxby, J.V., Gillette, J.A., Salerno, J.A.,Gonzales-Aviles, A., Horwitz, B., Rapoport, S.I., 1995. The effect of white matterhyperintensity volume on brain structure, cognitive performance, and cerebral me-tabolism of glucose in 51 healthy adults. Neurology 45, 2077–2084.
Draper, N.R., Smith, H., 1998. Applied Regression Analysis (Wiley Series in Probability andStatistics). Wiley-Interscience.
Drzezga, A., Grimmer, T., Henriksen, G., Stangier, I., Perneczky, R., Diehl-Schmid, J., Mathis,C.A., Klunk, W.E., Price, J., DeKosky, S., Wester, H.-J., Schwaiger, M., Kurz, A., 2008. Im-aging of amyloid plaques and cerebral glucose metabolism in semantic dementia andAlzheimer's disease. Neuroimage 39, 619–633.
Edison, P., Archer, H.A., Hinz, R., Hammers, A., Pavese, N., Tai, Y.F., Hotton, G., Cutler, D.,Fox, N., Kennedy, A., Rossor, M., Brooks, D.J., 2007. Amyloid, hypometabolism, andcognition in Alzheimer disease: an [11C]PIB and [18 F]FDG PET study. Neurology68, 501–508.
Filley, C.M., 2010. White matter: organization and functional relevance. Neuropsychol.Rev. 20, 158–173.
Folstein, M.F., 1983. The mini-mental state examination. Arch. Gen. Psychiatry 40, 812.Förster, S., Grimmer, T., Miederer, I., Henriksen, G., Yousefi, B.H., Graner, P., Wester, H.-J.,
Förstl, H., Kurz, A., Dickerson, B.C., Bartenstein, P., Drzezga, A., 2012. Regional expan-sion of hypometabolism in Alzheimer's disease follows amyloid deposition with tem-poral delay. Biol. Psychiatry 71, 792–797.
Frost, B., Ollesch, J., Wille, H., Diamond, M.I., 2009. Conformational diversity of wild-typeTau fibrils specified by templated conformation change. J. Biol. Chem. 284,3546–3551.
Furst, A.J., Rabinovici, G.D., Rostomian, A.H., Steed, T., Alkalay, A., Racine, C., Miller, B.L.,Jagust, W.J., 2012. Cognition, glucose metabolism and amyloid burden in Alzheimer'sdisease. Neurobiol. Aging 33, 215–225.
Grimmer, T., Faust, M., Auer, F., Alexopoulos, P., Förstl, H., Henriksen, G., Perneczky,R., Sorg, C., Yousefi, B.H., Drzezga, A., Kurz, A., 2012. White matterhyperintensities predict amyloid increase in Alzheimer's disease. Neurobiol.Aging 33, 2766–2773.
Hedden, T., Mormino, E.C., Amariglio, R.E., Younger, A.P., Schultz, A.P., Becker, J.A.,Buckner, R.L., Johnson, K.A., Sperling, R.A., Rentz, D.M., 2012. Cognitive profile of am-yloid burden and white matter hyperintensities in cognitively normal older adults. J.Neurosci. 32, 16233–16242.
Honey, C.J., Sporns, O., Cammoun, L., Gigandet, X., Thiran, J.P., Meuli, R., Hagmann, P.,2009. Predicting human resting-state functional connectivity from structural connec-tivity. Proc. Natl. Acad. Sci. U. S. A. 106, 2035–2040.
Jagust, W.J., Mormino, E.C., 2011. Lifespan brain activity, β-amyloid, and Alzheimer's dis-ease. Trends Cogn. Sci. 15, 520–526.
Kang, J.-E., Lim, M.M., Bateman, R.J., Lee, J.J., Smyth, L.P., Cirrito, J.R., Fujiki, N., Nishino, S.,Holtzman, D.M., 2009. Amyloid-beta dynamics are regulated by orexin and the sleep-wake cycle. Science 326, 1005–1007.
Klunk, W.E., Engler, H., Nordberg, A., Wang, Y., Blomqvist, G., Holt, D.P., Bergström, M.,Savitcheva, I., Huang, G., Estrada, S., Ausén, B., Debnath, M.L., Barletta, J., Price, J.C.,Sandell, J., Lopresti, B.J., Wall, A., Koivisto, P., Antoni, G., Mathis, C.A., Långström, B.,2004. Imaging brain amyloid in Alzheimer's disease with Pittsburgh Compound-B.Ann. Neurol. 55, 306–319.
Kochunov, P., Ramage, A.E., Lancaster, J.L., Robin, D.A., Narayana, S., Coyle, T., Royall, D.R.,Fox, P., 2009. Loss of cerebral white matter structural integrity tracks the gray mattermetabolic decline in normal aging. Neuroimage 45, 17–28.
Kuceyeski, A., Maruta, J., Relkin, N., Raj, A., 2013. The Network Modification (NeMo) Tool:elucidating the effect of white matter integrity changes on cortical and subcorticalstructural connectivity. Brain Connect. 3.
Kuczynski, B., Reed, B., Mungas, D., Weiner, M., Chui, H.C., Jagust, W., 2008. Cognitive andanatomic contributions of metabolic decline in Alzheimer disease and cerebrovascu-lar disease. Arch. Neurol. 65, 650–655.
Li, Y., Rinne, J.O., Mosconi, L., Pirraglia, E., Rusinek, H., DeSanti, S., Kemppainen, N., Någren,K., Kim, B.-C., Tsui, W., de Leon, M.J., 2008. Regional analysis of FDG and PIB-PET im-ages in normal aging, mild cognitive impairment, and Alzheimer's disease. Eur. J.Nucl. Med. Mol. Imaging 35, 2169–2181.
Lowe, V.J., Weigand, S.D., Senjem, M.L., Vemuri, P., Jordan, L., Kantarci, K., Boeve, B., Jack, C.R.,Knopman, D., Petersen, R.C., 2014. Association of hypometabolism and amyloid levels inaging, normal subjects. Neurology. http://dx.doi.org/10.1212/WNL.0000000000000467(Epub ahead of print).
Marchant, N.L., Reed, B.R., DeCarli, C.S., Madison, C.M., Weiner, M.W., Chui, H.C., Jagust, W.J.,2012. Cerebrovascular disease, β-amyloid, and cognition in aging. Neurobiol. Aging 33,1006 (e25–36).
Mikheev, A., Nevsky, G., Govindan, S., Grossman, R., Rusinek, H., 2008. Fully automaticsegmentation of the brain from T1-weighted MRI using Bridge Burner algorithm. J.Magn. Reson. Imaging 27, 1235–1241.
Nordahl, C.W., Ranganath, C., Yonelinas, A.P., Decarli, C., Fletcher, E., Jagust, W.J., 2006.White matter changes compromise prefrontal cortex function in healthy elderly indi-viduals. J. Cogn. Neurosci. 18, 418–429.
Oh, H., Habeck, C., Madison, C., Jagust, W., 2014. Covarying alterations in Aβ deposition,glucose metabolism, and gray matter volume in cognitively normal elderly. Hum.Brain Mapp. 35, 297–308.
Palop, J.J., Mucke, L., 2010. Amyloid-beta-induced neuronal dysfunction in Alzheimer'sdisease: from synapses toward neural networks. Nat. Neurosci. 13, 812–818.
Provenzano, F.A., Muraskin, J., Tosto, G., Narkhede, A., Wasserman, B.T., Griffith, E.Y.,Guzman, V.A., Meier, I.B., Zimmerman, M.E., Brickman, A.M., 2013. White matterhyperintensities and cerebral amyloidosis: necessary and sufficient for clinical ex-pression of Alzheimer disease? JAMA Neurol. 70, 455–461.
Raj, A., Kuceyeski, A., Weiner, M., 2012. A network diffusion model of disease progressionin dementia. Neuron 73, 1204–1215.
Reed, B.R., Eberling, J.L., Mungas, D., Weiner, M., Kramer, J.H., Jagust, W.J., 2004. Effects ofwhite matter lesions and lacunes on cortical function. Arch. Neurol. 61, 1545–1550.
Reisberg, B., Sclan, S., Franssen, E., Deleon, M., Kluger, A., Torossian, C., Shulman, E.,Steinberg, G., Monteiro, I., Mcrae, T., Boksay, I., Mackell, J., Ferris, S., 1993. Clinicalstages of normal aging and Alzheimer's disease: the GDS staging system. Neurosci.Res. Commun. 13, S51–S54.
Rosenbloom, M.H., Alkalay, A., Agarwal, N., Baker, S.L., O'Neil, J.P., Janabi, M., Yen, I.V.,Growdon, M., Jang, J., Madison, C., Mormino, E.C., Rosen, H.J., Gorno-Tempini, M.L.,Weiner, M.W., Miller, B.L., Jagust, W.J., Rabinovici, G.D., 2011. Distinct clinical andmetabolic deficits in PCA and AD are not related to amyloid distribution. Neurology76, 1789–1796.
Scarpelli, M., Salvolini, U., Diamanti, L., Montironi, R., Chiaromoni, L., Maricotti, M., 1994.MRI and pathological examination of post-mortem brains: the problem of whitemat-ter high signal areas. Neuroradiology 36, 393–398.
Scheltens, P., Barkhof, F., Leys, D., Wolters, E.C., Ravid, R., Kamphorst, W., 1995. Histopath-ologic correlates of white matter changes on MRI in Alzheimer's disease and normalaging. Neurology 45, 883–888.
Sled, J.G., Zijdenbos, A.P., Evans, A.C., 1998. A nonparametric method for automatic correc-tion of intensity nonuniformity in MRI data. IEEE Trans. Med. Imaging 17, 87–97.
Sultzer, D.L., Chen, S.T., Brown, C.V., Mahler, M.E., Cummings, J.L., Hinkin, C.H.,Mandelkern, M.A., 2002. Subcortical hyperintensities in Alzheimer's disease: associat-ed clinical and metabolic findings. J. Neuropsychiatry Clin. Neurosci. 14, 262–269.
Tullberg, M., Fletcher, E., DeCarli, C., Mungas, D., Reed, B.R., Harvey, D.J., Weiner, M.W.,Chui, H.C., Jagust, W.J., 2004. White matter lesions impair frontal lobe function re-gardless of their location. Neurology 63, 246–253.
Tzourio-Mazoyer, N., Landeau, B., Papathanassiou, D., Crivello, F., Etard, O., Delcroix, N.,Mazoyer, B., Joliot, M., 2002. Automated anatomical labeling of activations in SPMusing a macroscopic anatomical parcellation of the MNI MRI single-subject brain.Neuroimage 15, 273–289.
Yokokura, M., Mori, N., Yagi, S., Yoshikawa, E., Kikuchi, M., Yoshihara, Y., Wakuda, T.,Sugihara, G., Takebayashi, K., Suda, S., Iwata, Y., Ueki, T., Tsuchiya, K.J., Suzuki, K.,Nakamura, K., Ouchi, Y., 2011. In vivo changes in microglial activation and amyloiddeposits in brain regions with hypometabolism in Alzheimer's disease. Eur. J. Nucl.Med. Mol. Imaging 38, 343–351.
Zlokovic, B.V., 2011. Neurovascular pathways to neurodegeneration in Alzheimer's dis-ease and other disorders. Nat. Rev. Neurosci. 12, 723–738.