Finger-Gesture Recognition for Visible Light Communication ...
Chapter 6
Reduced Cortical Activity during Maximal Bilateral
Contractions of the Index Finger
Marijn Post, Hiske van Duinen, Anneke Steens, Remco Renken, Bart
Kuipers, Natasha Maurits and Inge Zijdewind
Published in: NeuroImage (2007): 35, 16-27


Reduced Cortical Activity during Maximal Bilateral Contractions
113
Abstract
The bilateral deficit refers to the phenomenon in which homologous muscles produce
per muscle less force when contracting simultaneously than when contracting
individually. The mechanism underlying the bilateral deficit is still unknown but the
most likely cause is a decline in the activation of motor units during bilateral
contractions. In the present study we used functional magnetic resonance imaging
(fMRI) to measure the degree of brain activity during unilateral and bilateral maximal
contractions in combination with force and EMG measurements. Subjects performed,
in a semi-randomized order, maximal isometric contractions (MVC) with the right
index finger, the left index finger and with both fingers simultaneously. During the
task, brain activation was measured with a 3 Tesla MRI scanner, in combination with
force and EMG-recordings. The most important activated areas in the brain during
the contractions were the sensorimotor cortex (precentral and postcentral gyrus),
cerebellum, premotor cortex and supplementary motor area. During bilateral
contractions, a significant decline in force and EMG values was found and detailed
analysis of the brain activation data showed that this decline was accompanied with a
significant decline in the activation of the precentral gyrus. This result suggests that
the bilateral decline is the resultant of a decline in input to the primary motor area and
shows that the main source of the bilateral deficit lies upstream of the primary motor
cortex.
Acknowledgements
The authors like to thank Koen Vaartjes for his technical support, and Anita Kuiper for
operating the MRI scanner. Part of this work was supported in the framework of the
NWO Cognition Program with financial aid from the Netherlands Organization for
Scientific Research (NWO).

Chapter 6
114
Introduction
Several studies have shown that the force production per muscle during a bilateral
contraction of homologous muscles is less than the sum of forces obtained during
unilateral contractions (Henry and Smith, 1961; Kroll, 1965; Ohtsuki, 1981; Schantz
et al., 1989; Vandervoort et al., 1984). This phenomenon is called the bilateral deficit.
This bilateral deficit has been shown in a variety of tasks, for example knee extension
(Howard and Enoka, 1991; Schantz et al., 1989), ankle plantar flexion (Kawakami et
al., 1998), elbow flexion (Howard and Enoka, 1991; Oda and Moritani, 1994), wrist
flexion (Kroll, 1965), finger flexion (Ohtsuki, 1981; Van Dieen et al., 2003), thumb
abduction (Herbert and Gandevia, 1996), and index finger abduction (Zijdewind and
Kernell, 2001). The size of the bilateral deficit depends on factors such as training
(Howard and Enoka, 1991; Kuruganti et al., 2005; Taniguchi, 1998) and limb
dominance (Kroll, 1965; Ohtsuki, 1981) but not on age or gender (Hakkinen et al.,
1997; Hernandez et al., 2003; Kuruganti et al., 2005). Furthermore, the bilateral
deficit seems to be more pronounced in movements of the upper body (Jakobi and
Chilibeck, 2001). Importantly, no deficit is present when non-homologous muscles,
such as a left elbow flexor and right knee extensor, are activated simultaneously
(Howard and Enoka, 1991).
The neurophysiological mechanisms underlying bilateral deficits have been
studied with several techniques such as: electromyography (EMG), twitch
interpolation, transcranial magnetic stimulation (TMS) and electroencephalography
(EEG). We will discuss the data obtained by these various methods below.
Surface EMG is affected by factors such as the number of active motor units
and their firing frequencies. Therefore, if a bilateral deficit is caused by differences in
the activation of the motor units a decline in force is expected to be accompanied by
parallel changes in EMG. Several studies indeed demonstrated a deficit in EMG that
was related to the changes in force (Koh et al., 1993; Oda and Moritani, 1995; Van
Dieen et al., 2003; Vandervoort et al., 1984). Other authors, however, did not find
changes in EMG during bilateral contractions (Howard and Enoka, 1991; Schantz et
al., 1989) or found a large deficit in EMG that was accompanied by a small non-
significant force deficit (Jakobi and Cafarelli, 1998). The discrepancies between the
studies are probably caused by differences in the muscle (-groups) used,
experimental set-up or tasks. No consistent conclusion about the mechanisms
underlying the bilateral deficit can be drawn from these EMG studies.

Reduced Cortical Activity during Maximal Bilateral Contractions
115
A few studies used electrical stimulation of the muscle or nerve (twitch
interpolation technique; (Jakobi and Cafarelli, 1998; Van Dieen et al., 2003) or
transcranial magnetic stimulation of the cortex (Herbert and Gandevia, 1996) to
examine the efficiency of the neural drive to the motoneuron pool during unilateral
and bilateral contractions. With these techniques a stimulus is delivered to the
muscle, nerve or cortex during a maximal contraction. When the stimulation evokes a
force increase, it is assumed that the activation of the muscle was suboptimal.
Although all studies found evidence for suboptimal neural drive in both the unilateral
and bilateral contractions, only one study found statistical evidence for a reduction in
voluntary muscle activation in bilateral contractions (Van Dieen et al., 2003). The
other two studies (Herbert and Gandevia, 1996; Jakobi and Cafarelli, 1998) just
found marginal differences.
Two studies have used EEG to examine the bilateral deficit. Oda and Moritani
(1995) studied movement-related potentials of the brain. In their study the deficit in
force and EMG during the bilateral contractions was associated with reductions in the
movement-related potential. Another EEG study, in which the bilateral reaction time
deficit - a phenomenon which is possibly related to the bilateral force deficit - was
investigated, found weaker motor cortical activity during bilateral contractions
(Taniguchi et al., 2001). Thus, these studies suggest that bilateral contractions are
accompanied by a decline in cortical excitability.
The results obtained with various techniques do not give an indisputable
explanation for the bilateral deficit. Several researchers (e.g. Van Dieen et al., 2003,
Oda and Moritani 1995, Taniguchi et al, 2001) suggest a decline in cortical
excitability while others - who do not find a bilateral deficit (e.g. Herbert and
Gandevia, 1996; Jakobi and Cafarelli, 1998) - suggest that the deficit might be
observed only in subjects who are unable to maintain their exact posture or who
activate antagonists during bilateral contractions. It is the aim of this study to
investigate the phenomenon of the bilateral deficit at various levels of motor control
simultaneously. We used functional Magnetic Resonance Imaging (fMRI) to measure
the activity in the brain during unilateral and bilateral abduction contractions of the
index finger in combination with EMG and force measurements.
Part of the data has been published as an abstract (Post et al., 2005).

Chapter 6
116
Methods
Subjects
We studied 22 healthy subjects, 10 men and 12 females (mean age 26.7 ± 6.1
years). All subjects gave their written informed consent prior to participation in this
study. Subjects were right-handed as confirmed by the Edinburgh Handedness
Inventory (Oldfield, 1971) and were free of neurological disorders. Before the start of
the experiment all subjects were included in a training session in which they were
instructed about the protocol and had to perform all contractions.
The local ethical committee of the University Hospital Groningen approved the
research procedures.
Force recording
Two custom-made MRI compatible force transducers measured the abduction force
of the index finger. Magnetic-compensated strain gauges (TML® MFLA-5.350-1L;
Tokyo Sokki Kenkyujo Co., Japan) were placed in a full bridge configuration on an
epoxy glass laminate bar (Tufnol® 10G/40 20mm diameter; RS-components number:
771-314) and registered the force. The index finger was placed parallel to the bar on
the force transducer and the proximal interphalangeal joint of the index finger was
taped to a wedge that was connected to the force transducer (see Fig. 1 for a
schematic illustration of the hand position). The ring and middle finger were taped to
the thumb to prevent changes in the hand position in relation to the force transducer.
Both force transducers (left and right hand) were connected with a silver-coated
cable to a shielded custom-made amplifier. The amplifiers were powered by lead
batteries (12V; 1.9A). The amplified signal (1000x) was sent via an optical cable to a
receiver in the operator room. The receiver was connected to a data-acquisition
interface and a laptop equipped with accompanying software (1401 micro and Spike
2 version 5.08, Cambridge Electronic Design, Cambridge, UK). The force recordings
were sampled at 500 Hz.
EMG recording
Surface electromyography (EMG) of the first dorsal interosseous (FDI) of both hands
was recorded using the BrainAmp MR plus system (Brain Products GmbH, Munich,
Germany). A detailed description of the EMG setup is given in Van Duinen et al.
(2005).

Reduced Cortical Activity during Maximal Bilateral Contractions
117
Figure 1. A) A schematic illustration of the hand position in relation to the force transducers. B)
Typical example of the force, the EMG after artefact correction (van Duinen et al., 2005) and the
rectified and smoothed EMG (100ms; rsEMG) recordings during fMRI. The lowest trace shows the
trigger pulse at the start of the scanning period (5 s). A scanning period consists of 3-s scanning and
2-s non-scanning interval (sparse-sampling). Note the small residues of the scanner noise after the
artefact correction.
The skin lying over the FDI was scrubbed and cleaned with alcohol. One EMG
electrode was placed on the belly of the FDI and a second electrode on the
metacarpophalangeal joint of the index finger. A reference electrode was positioned
on the right processus styloideus radius, and a ground electrode on the left
processus styloideus radius. All electrodes were attached to an electrode input box
connected to an analog to digital converter (BrainAmp MR plus, Brain Products

Chapter 6
118
GmbH, Munich, Germany). An optical cable transferred the signal to a PC outside the
MR room. The PC was equipped with Brain Vision Recorder (sampling rate: 5000
Hz/channel). The MRI scanner sent a trigger to the PC at the start of every scan.
Brain Vision Analyser (version 1.05.0001) was used to pre-process the data. During
pre-processing, the raw signal was corrected for the artefact of the MRI scans. First,
the two monopolar EMG signals were subtracted (bipolar signal). Next, the signal
was filtered with a high pass filter of 10 Hz. Subsequently, a template of the mean
MRI artefact was determined and subtracted from the signal (see van Duinen et al.,
2005). After pre-processing, the data was imported into Spike2 for Windows (version
5.08; Cambridge Electronic Design, Cambridge, UK).
Brain imaging
Functional-MRI was conducted using a 3 T MRI scanner (Philips medical systems,
Best, the Netherlands) equipped with echo planar imaging (EPI) capability and a
standard TR-head coil. We used a sparse-sampling protocol (3 s scanning followed
by 2 s non-scanning). This protocol was used to compare force and EMG recordings
during scanning and non-scanning intervals. Pulse sequence parameters were:
single shot EPI; 46 slices; slice thickness 3.5 mm; no gap; field of view 224 mm;
matrix scan 64; transverse slice orientation; repetition time (TR) = 5 s; echo time (TE)
= 35 ms; minimal temporal slice timing (2884 ms); flip angle 90°. A total of 108 scans
were gathered during the task (total time: 540 s). After the protocol a T1-weighted
anatomical image of the entire brain was obtained for each subject using the
following pulse sequence parameters: field of view 256 mm; matrix scan size 256 by
256; 160 slices; slice thickness 1 mm; transverse slice orientation; TE = 4.6 ms; TR =
25 ms; flip angle 30°.
Task
Each subject performed nine maximal voluntary isometric contractions (MVCs) of the
index finger in abduction direction. Three conditions were specified: abduction of the
right index finger (unilateral-right), abduction of the left index finger (unilateral-left)
and abduction of both index fingers simultaneously (bilateral). Every condition was
repeated three times in a pseudo-random order to control for order effects. Every
MVC lasted for 10 seconds followed by a 50-s rest period (total time: 540 s). The
subjects started the MVCs after an acoustic signal presented through a headphone.

Reduced Cortical Activity during Maximal Bilateral Contractions
119
Visual feedback of the produced force was projected by a beamer on a screen, which
was visible to the subjects via a mirror. During the task, subjects lay in a supine
position in the 3 Tesla MR–scanner with both arms extended and parallel to the
body.
Analysis of force and EMG data
The blood oxygen level dependent (BOLD) response in the brain is influenced by the
strength of the contraction (Dai et al., 2001; Dettmers et al., 1995; Thickbroom et al.,
1998) but probably also by the duration of the contraction. For that reason, we have
used a parameter for the EMG and force data that also includes the duration of the
contraction (area under the curve). The area under the curve was calculated for
every contraction for both the force data and the rectified EMG (rEMG; Fig. 1). In
addition, mean force and mean rEMG were determined during the plateau phase of
the contraction. The maximal force (MVC) was defined as the largest peak force of
the three contractions.
For all variables (area under the curve of force and rEMG, mean force and
mean rEMG, and MVC), a 2x2 [contraction (Unilateral, Bilateral) x hand (Right, Left)]
repeated-measures analysis of variance was used to test for differences. Level of
significance was set to P<0.05. If a significant difference was found we estimated an
effect size; the partial eta squared (ηp²).
Data are presented as means ± standard deviation (SD) in the text, as means
± standard error (SE) in the figures. Statistical analyses were performed with SPSS
12.0 for windows.
Data preprocessing and analysis brain imaging
We used SPM99 (http://fil.ion.ucl.ac.uk/spm) implemented in MATLAB (MathWorks,
Natick, MA) to process and analyse the fMRI data. For each subject functional data
were realigned to the first image. The anatomical image was normalized to a T1
template, and the resulting transformation parameters were also applied to the
functional data. Prior to analysis, functional data were smoothed with a full-width-at-
half-maximum 8 mm Gaussian kernel.
Task specific effects were estimated using a general linear model (GLM) with
a delayed boxcar. No filtering was used. The analysis consisted of two levels; the first

Chapter 6
120
level was a subject based analysis while in the second level a group based analysis
was performed.
At the first level of analysis, activation maps were generated for each of the
three contractions by contrasting the activity during the contraction versus rest
(unilateral-left >rest, unilateral-right>rest, and bilateral >rest). For every contrast a
statistical map was calculated to determine significantly activated areas (Friston et
al., 1995).
A random effects analysis was used in the second level of the analysis. To
confirm activation, the contrast images obtained in every subject were used to
perform a one-sampled t-test. Significance was set at T≥7.65 (P<0.000005, without
correction for multiple comparisons) with a spatial extent of n=20 voxels. For the
comparisons between the unilateral and bilateral contractions a paired t-test was
performed. Significance was set at T≥4.02 which is equivalent to P<0.001 without
correction for multiple comparisons (n=5 voxels). MRIcro (www.mricro.com) was
used to examine which specific brain areas were active during the tasks.
In addition, we quantified the activity during the unilateral and bilateral
contractions in distinct motor areas. Therefore we performed a region of interest
(ROI) analysis. First, we defined functionally activated regions during unilateral and
bilateral contractions. Secondly, the activated brain areas were masked with an
anatomical region (Automated Anatomical Labeled; AAL (Tzourio-Mazoyer et al.,
2002). Using this method, we have defined functionally active regions within the
precentral gyrus, postcentral gyrus, cerebellum (lobule 4, 5 and 6) and
supplementary motor area (SMA).
Subsequently, using the functional activated regions, we have determined the
activity in areas active in both unilateral and bilateral contraction (unilateral-left ∩
bilateral and unilateral-right ∩ bilateral). We use the term ‘overlap ROI’ for this area.
However, if the voxels with the strongest activation are different for the unilateral and
the bilateral contractions then the intensity would be underestimated. Therefore, we
have also determined the activity in the total area; that is the sum of the voxels
activated during the unilateral plus the voxels that are activated during the bilateral
contraction (unilateral-left U bilateral and unilateral-right U bilateral; summation ROI).
MarsBaR (Brett et al., 2002) was used to build these regions of interest for every
subject, separately .

Reduced Cortical Activity during Maximal Bilateral Contractions
121
In contrast with the other cortical regions in which the ROIs consisted of the
functional activated regions in contralateral hemisphere, the ROIs of the cerebellum
consisted of activated regions ipsilateral to the target muscles.
For the SMA, a region of interest was constructed for the left and right SMA
separately. Because the SMA is involved in both contralateral and ipsilateral
contractions the regions of interests were constructed from the activity during both
the unilateral contractions and the bilateral contraction (unilateral-left ∩ unilateral-
right ∩ bilateral; overlap ROI); a second region of interest was build from the
summation of these activated regions (unilateral-left U unilateral-right U bilateral;
summation-ROI).
Figure 2. BOLD (A), EMG (B) and force (C) measurements from simultaneous recordings in a
representative subject. Activation values (effect size in arbitrary units); A) obtained in the left
(interrupted line) and the right precentral gyrus (non-interrupted line) for each scan (5 s). B & C) Mean
values of rEMG (µV; B) and force (N; C) of the right (interrupted line) and left index finger (non-
interrupted line) for each scan (5 s). All graphs show data obtained during an abduction of the right
index finger (R), left index finger (L) or both index fingers (BI).

Chapter 6
122
The mean raw BOLD signal was extracted for all functional scans (see Fig. 2).
Subsequently, baseline activity was calculated for the scans made during rest and
subtracted from all values. Hereafter, a mean value was calculated for each contrast
(unilateral-right, unilateral-left, and bilateral) using the corresponding scans.
A 2x2 [contraction (Unilateral, Bilateral) x hemisphere (Left, Right)] repeated-
measures analysis of variance was used to detect differences between unilateral and
bilateral contractions for volumes of functional activated areas and the effect sizes in
the overlap and summation ROIs. For the SMA a 3x2 [contraction (Contralateral,
Ipsilateral, Bilateral) x hemisphere (Left, Right)] repeated-measures analysis of
variance was used. If the analysis of variance showed a significant effect, Bonferroni-
corrected post hoc tests were performed. In all statistical analyses, the level of
significance was set at P<0.05 and an effect size (ηp²) was estimated for significant
differences.
Results
Subjects
Nine subjects were excluded from further analysis because their head movements
strongly correlated with the task; one subject was excluded because this subject did
not execute the task as requested. In total, data from 12 subjects are presented in
here.
Table 1. The area (SD) under the curve for force, mean force, MVC, the area under the curve of the
rEMG, mean rEMG, and the percentage of bilateral/unilateral for unilateral and bilateral contractions
of the right and left index finger. Asterisk denotes significant difference between unilateral and
bilateral contraction (P<0.05).
Force and EMG
We used sparse sampling (3 s scanning and 2 s non-scanning) to evaluate the
effects of the MR-scanner on the force and EMG data. However, as can be seen in
figure 1 both the force and the corrected EMG data were scarcely influenced by the
Right Left
Unilateral Bilateral %Bi/Uni Unilateral Bilateral %Bi/Uni
Area force (Ns)* 236.3 (49.5) 230.3 (58.3) 97.1 (10.7) 339.2 (90.9) 323.2 (86.1) 95.5 (6.4)
Mean force (N)* 23.8 (5.6) 22.9 (5.7) 96.3 (8.4) 33.4 (9.0) 32.4 (8.6) 97.1 (6.01)
MVC (N) 26.8 (5.9) 26.4 (6.2) 98.2 (6.0) 45.3 (11.0) 44.2 (11.5) 97.4 (5.1)
Area rEMG (µVs)* 7233.4 (3152.4) 6518.5 (3290.8) 90.1 (14.7) 5892.9 (3097.6) 5818.0 (2818.0) 95.5 (11.7)
Mean rEMG (µV)* 716.4 (316.2) 651.5 (322.4) 89.9 (9.0) 567.8 (306.4) 547.9 (276.3) 97.4 (8.2)

Reduced Cortical Activity during Maximal Bilateral Contractions
123
scanner van (see also van Duinen et al., 2005). Therefore, no distinction was made
between the behavioural data collected during scanning and non-scanning intervals.
Statistical analysis of the area under the curve data obtained during unilateral
and bilateral contractions revealed significantly lower values for bilateral contractions
for both force (F(1,11)=5.114, P=0.045; ηp²=0.317) and rEMG data (F(1,11)=5.476,
P=0.039; ηp²=0.332; Table 1, Fig. 3). No interaction was found between contraction
and hand (force: F(1,11)=0.882, P=0.368; rEMG: F(1,11)=2.136, P=0.172). The
difference in area under the curve was not due to a difference in the duration of the
contraction (F(1,11)=0.305, P=0.592). This finding is supported by the significantly
lower values of the mean force (F(1,11)=4.836, P=0.05; ηp²=0.305) and mean rEMG
(F(1,11)=12.007, P=0.005; ηp²=0.522) during the bilateral contractions.
Figure 3. Areas under the
curve for force (Ns ± SEM;
A) and rectified EMG (mVs
± SEM; B) for the right and
left index finger during
unilateral ( □ ) and bilateral
( ■ ) contractions.
Furthermore, we determined the ratio between unilateral and bilateral
contractions for force and EMG data. We found significant correlations between the
ratio calculated for the force data and EMG data (right finger R2=0.744, P<0.001; left
finger R2=0.692 P<0.001; Fig. 4).
Figure 4. Scatterplot of the ratio
bilateral/unilateral (*100) for the areas under the
curve of force and rEMG during contractions of
the right (○) and left (▲) index finger. The
interrupted line represents the trend line (y =
0.5247x + 47.575; R2 = 0.6472).

Chapter 6
124
Brain imaging
Activation patterns
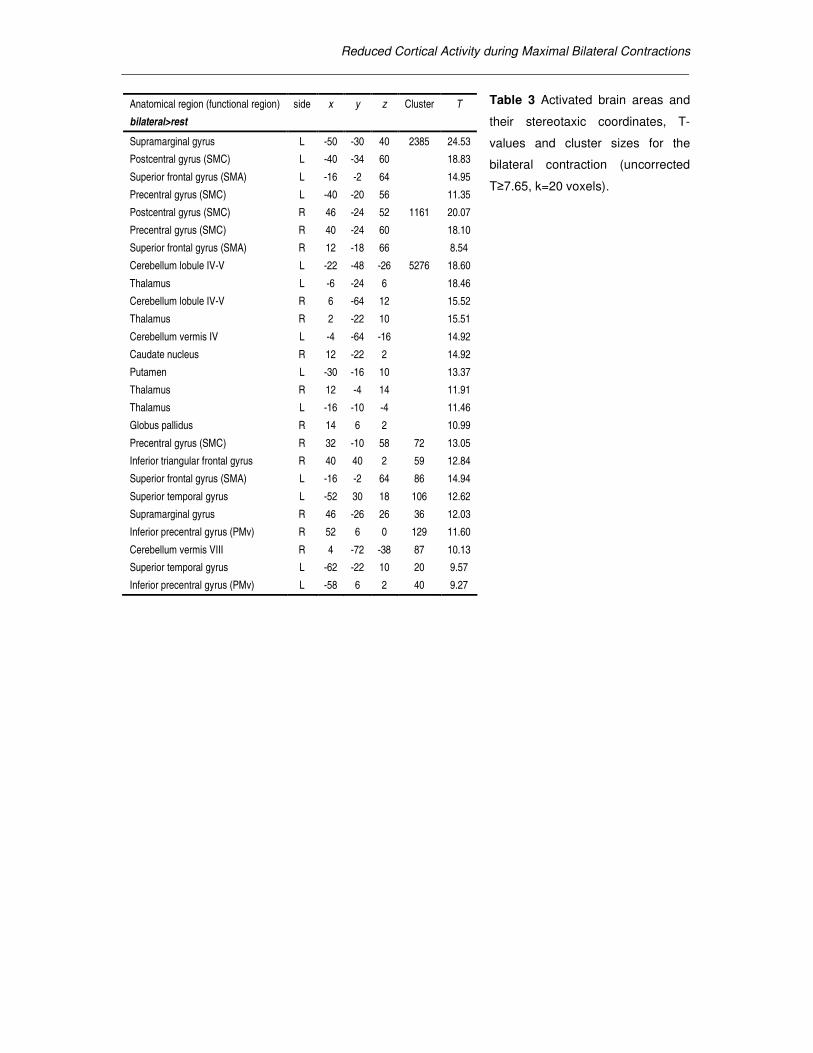
Similar brain activation patterns were found in unilateral and bilateral contractions. In
general, activated voxel clusters were found in motor, frontal (premotor), occipital,
parietal and cerebellar regions. Detailed presentation of the significantly activated
cortical regions during right, left and bilateral index finger contractions are shown in
figure 5. Activated brain areas and their stereotaxic coordinates, T-values and cluster
sizes are listed in table 2 and 3.
Unilateral versus Bilateral contractions
Cortical areas which showed significantly stronger activation during unilateral
contractions compared to bilateral contractions are listed in table 4 (see Fig. 6).
During unilateral contractions with the right index finger, the left precentral gyrus
showed more activity compared with the activity during bilateral contractions,
whereas no increase in activity in the right precentral gyrus was found during the
unilateral contractions with the left index finger. However, significantly stronger
activation was found - during unilateral contractions of the left index finger - in a voxel
cluster in the right superior frontal gyrus, partly located in the SMA. Furthermore, the
right ventral premotor area and the right superior frontal gyrus were more active in
both unilateral conditions. In comparison with the bilateral contraction the activation
during the unilateral contraction of the right index finger was stronger in the medial
cingulate gyrus, insula and calcarine fissure, whereas during the unilateral
contraction of the left index finger significant stronger activity was seen in lobule IX of
the cerebellum.

Reduced Cortical Activity during Maximal Bilateral Contractions
125
Fig
ure
5.
Sig
nific
antly a
ctivate
d a
rea
s o
verl
aid
on
axia
l slic
es o
f a T
1-w
eig
hte
d s
tan
dard
bra
in.
Pane
l A
sh
ow
s t
he
contr
ast
un
ilate
ral-
right>
rest, p
anel
B sh
ow
s unila
tera
l-le
ft>
rest
and p
ane
l C
bila
tera
l>re
st.
P
ea
k a
ctivation
s w
ith th
e corr
esp
ond
ing T
-valu
es and
th
eir
corr
esp
ondin
g a
na
tom
ical are
as a
re lis
ted
in ta
ble
2 a
nd 3
.

Chapter 6
126
Table 2 Activated brain areas
and their stereotaxic
coordinates, T-values and
cluster sizes for the right and
left unilateral contractions
(uncorrected T≥7.65,
k=20voxels).
Anatomical region (functional region) side X y z Cluster T
unilateral-right> rest
Postcentral gyrus (SMC) L -32 -34 64 1901 21.00
Supramarginal gyrus L -54 -32 36 14.10
Precentral gyrus (SMC) L -46 -16 56 12.22
Medial cingulate gyrus L -4 -10 48 11.64
Superior frontal gyrus (SMA) L -8 -4 58 8.09
Superior temporal lobe L -26 -52 62 7.96
Cerebellum lobule VI R 4 -64 -10 3957 20.10
Cerebellum lobule IV/V R 14 -48 -16 18.97
Cerebellum lobule VI L -4 -66 -16 18.94
Inferior orbicular frontal gyrus L -22 36 -6 80 10.27
Medial occipital gyrus R 44 -64 4 204 16.93
Inferior frontal gyrus pars opercularis (PMv) R 58 14 18 162 14.15
Supramarginal gyrus R 60 -34 32 170 13.65
R 42 -34 44 151 12.17
Superior frontal gyrus R 14 16 48 417 12.07
Medial cingulate gyrus L -8 8 36 11.48
Inferior frontal gyrus pars opercularis (PMv) L -46 12 24 24 11.38
Precentral gyrus (SMC) R 28 -14 54 41 11.34
Caudate nucleus R 16 -6 18 55 10.96
Putamen L -36 -4 -4 48 10.80
Cerebellum lobule IX R 8 -56 -46 20 9.92
Superior temporal gyrus L -58 -22 10 38 8.98
Precuneus R 12 -56 58 25 8.82
unilateral-left> rest
Precentral gyrus (SMC) R 38 -26 60 1034 18.80
Supramarginal gyrus R 52 -26 32 16.98
Postcentral gyrus (SMC) R 46 -24 56 15.97
Cerebellum lobule VI L -22 -52 -28 427 13.27
Cerebellum vermis VI L -6 -64 -16 11.82
Cerebellum lobule IV/V L -12 -54 -18 11.08
Supramarginal gyrus L -56 -34 36 127 13.17
Medial cingulate gyrus R 6 0 46 205 11.02
Superior frontal gyrus (SMA) R 4 -10 50 9.95
Thalamus R 18 -22 -2 181 10.99
Superior frontal gyrus (SMA) R 6 -4 68 56 10.62
Inferior parietal gyrus L -48 -40 52 31 10.24
Insula R 46 2 0 127 10.23
Inferior precentral gyrus (PMv) L -56 4 6 54 10.20
Superior parietal gyrus R 20 -54 66 24 10.15
Putamen R 32 -12 -2 23 10.11
Reduced Cortical Activity during Maximal Bilateral Contractions
Table 3 Activated brain areas and
their stereotaxic coordinates, T-
values and cluster sizes for the
bilateral contraction (uncorrected
T≥7.65, k=20 voxels).
Anatomical region (functional region) side x y z Cluster T
bilateral>rest
Supramarginal gyrus L -50 -30 40 2385 24.53
Postcentral gyrus (SMC) L -40 -34 60 18.83
Superior frontal gyrus (SMA) L -16 -2 64 14.95
Precentral gyrus (SMC) L -40 -20 56 11.35
Postcentral gyrus (SMC) R 46 -24 52 1161 20.07
Precentral gyrus (SMC) R 40 -24 60 18.10
Superior frontal gyrus (SMA) R 12 -18 66 8.54
Cerebellum lobule IV-V L -22 -48 -26 5276 18.60
Thalamus L -6 -24 6 18.46
Cerebellum lobule IV-V R 6 -64 12 15.52
Thalamus R 2 -22 10 15.51
Cerebellum vermis IV L -4 -64 -16 14.92
Caudate nucleus R 12 -22 2 14.92
Putamen L -30 -16 10 13.37
Thalamus R 12 -4 14 11.91
Thalamus L -16 -10 -4 11.46
Globus pallidus R 14 6 2 10.99
Precentral gyrus (SMC) R 32 -10 58 72 13.05
Inferior triangular frontal gyrus R 40 40 2 59 12.84
Superior frontal gyrus (SMA) L -16 -2 64 86 14.94
Superior temporal gyrus L -52 30 18 106 12.62
Supramarginal gyrus R 46 -26 26 36 12.03
Inferior precentral gyrus (PMv) R 52 6 0 129 11.60
Cerebellum vermis VIII R 4 -72 -38 87 10.13
Superior temporal gyrus L -62 -22 10 20 9.57
Inferior precentral gyrus (PMv) L -58 6 2 40 9.27

Chapter 6
128
Figure 6. Significantly activated areas for the contrasts unilateral right>bilateral (red) and unilateral
left>bilateral (yellow) overlaid on slices of a T1-weighted standard brain. Panel A shows the precentral
gyrus (red) and the SMA (yellow). The arrow in panel B shows the stronger activation of the right
ventral premotor area during the unilateral contraction with both the right (red) and left (yellow) index
finger. Peak activations with the corresponding T-values and their corresponding anatomical areas are
listed in table 4.
Table 4 Activated brain areas
and their stereotaxic
coordinates, T-values and
cluster sizes for the contrasts
unilateral-right>bilateral and
unilateral-left>bilateral
(uncorrected T≥4.05, k=5
voxels).
anatomical region side x Y z Cluster T
unilateral-right>bilateral
Medial frontal gyrus R 40 8 38 31 7.26
Superior frontal gyrus R 8 58 4 32 6.26
Medial cingulate gyrus R 2 6 44 17 5.89
Precentral gyrus L -32 -14 60 50 5.50
Inferior frontal gyrus pars opercularis (PMv) R 50 20 8 9 5.37
Insular cortex L -26 18 -16 9 5.37
Superior frontal gyrus R 22 30 50 24 4.74
Supramarginal gyrus R 50 -44 20 12 4.62
Calcarine fissure L -6 -74 14 9 4.39
unilateral-left>bilateral
Medial superior frontal gyrus R 8 56 6 19 6.91
Inferior frontal gyrus pars opercularis (PMv) R 46 16 10 17 6.41
Superior frontal gyrus (SMA) R 16 -10 62 41 5.28
Anterior superior frontal gyrus R 22 62 12 7 5.15
Cerebellum lobule IX L -12 -54 -38 5 5.03

Reduced Cortical Activity during Maximal Bilateral Contractions
129
Bilateral versus Unilateral contractions
Cortical areas which were significantly more activated during bilateral contractions
compared to unilateral contractions with their stereotaxic coordinates, T-values and
cluster sizes are listed in table 5. In the comparison bilateral>unilateral we have
focused on activity in the contralateral areas, and for cerebellum on the ipsilateral
areas. Significantly stronger activation was found in the right thalamus and left
cerebellum during the bilateral versus the left unilateral contraction.
Table 5 Activated brain areas and their
stereotaxic coordinates, T-values and
cluster sizes for the contrasts
bilateral>unilateral-right and
bilateral>unilateral-left (uncorrected
T≥4.05, k=5 voxels).
* Activity in the ipsilateral hemisphere and the contralateral hemisphere for the cerebellum is most likely due to the activation of the ‘contralateral hand’ in the bimanual task.
ROI analysis
A more quantitative examination of the cortical activity was performed using region of
interest (ROI) analyses (see Fig. 7, 8 and 9). Since the results for the data in the
overlap ROI and the summation ROI appeared to be very similar, we will only present
data of the summation ROI.
Precentral gyrus. The volume of the activated region in the precentral gyrus was not
different in the unilateral and bilateral contractions (F(1,11) =1.506; P=0.245; Fig. 7).
Yet, the intensity of the activated regions in the precentral gyrus was significantly
stronger during unilateral contractions (F(1,11)=6.283, P=0.029; ηp²=0.364; Fig. 8).
Additionally, we found that the volumes of the activated regions were larger in
the right precentral gyrus than the regions in the left precentral gyrus (F(1,11) =6.559,
P=0.026; ηp²=0.374; Fig. 7). Also, the intensity in the right precentral gyrus was
anatomical region side x Y z Cluster T
bilateral>unilateral-right
Superior frontal gyrus (SMA) R* 10 -18 52 316 17.54
Postcentral gyrus R* 28 -26 66 1776 17.47
Precentral gyrus R* 40 -24 58
Cerebellum lobule VI L* -4 -62 -20 1085 15.05
Thalamus R* 16 -20 4 569 7.69
Inferior frontal gyrus R* 28 10 30 19 7.39
Putamen R* 34 -2 -2 14 5.04
Caudate nucleus R* 18 18 16 5 4.37
bilateral>unilateral-left
Postcentral gyrus L* -36 -26 48 1464 14.81
Cerebellum lobule IV/V R* 18 -50 -24 677 12.00
Superior frontal gyrus (SMA) L* -10 -16 50 110 8.49
Cingulate gyrus L* -12 -10 44 5.52
Cerebellum lobule III L -2 -34 -24 41 5.13
Thalamus R 20 -28 -46 30 5.08
Cerebellum lobule VIII R* 24 -58 -46 8 4.77
Thalamus L* -18 -22 4 6 4.41

Chapter 6
130
significantly stronger (F(1,11)=12.767, P=0.004; ηp²=0.537; Fig. 8). No interaction
between hemisphere and contraction was found.
Figure 7. Mean volume of the functionally activated regions in the precentral gyrus (A), postcentral
gyrus (B) and cerebellum (C) during unilateral (□) and bilateral (■) contractions in the right (R) and left
(L) hemisphere.
Postcentral gyrus. Similar to the precentral gyrus, in the postcentral gyrus no
difference in the volume of the activated region between the unilateral and bilateral
contraction was found (F(1,11) =0.377, P=0.552; Fig. 7). Also no difference in intensity
of the activity was observed (F(1,11)=2.406, P=0.149; Fig. 8). A significant difference in
intensity was observed between the two hemispheres (F(1,11)=5.265, P=0.042; effect
size ηp²=0.324; no significant effect was found in the overlap ROI), pointing to a
stronger activation in the right postcentral gyrus. No effects were found in the
interaction between hemisphere and contraction.
Figure 8. Mean brain activity (effect size ± SE) in the left (L) and right (R) precentral gyrus (A), left and
right postcentral gyrus (B), and left and right cerebellum (C) measured during unilateral (□) and
bilateral (■) contractions of the index fingers.
Cerebellum. In the cerebellum no significant differences in volume or intensity was
found between the unilateral and bilateral contractions (volume: F(1,11)=0.002,
P=0.967, intensity: F(1,11)=0.365, P=0.558).

Reduced Cortical Activity during Maximal Bilateral Contractions
131
The activated region in the left cerebellum was significant larger than in the
right cerebellum (F(1,11)=5.286, P=0.042; ηp²=0.325; Fig. 7), the intensity of the
regions, however, did not differ between hemispheres (F(1,11)=0.243, P=0.632; Fig. 8).
No interaction effects were found for hemisphere and contraction.
Supplementary motor area. The region of interest of the SMA, consisted of the areas
active during both unilateral contractions and the bilateral contraction. Only 10 (out of
12) subjects showed significant activity during all contractions. The volumes of the
activated regions in the SMA (Fig. 9) showed an interaction between hemisphere and
contraction (F(2,18) =5.914, P=0.011). Additional statistical analysis revealed that the
activated regions did not differ in size in the left SMA. However, the activated regions
in the right SMA were larger during the contralateral contractions than during the
ipsilateral contractions (P=0.021; corrected for repeated measurements; Fig. 9).
Also, the intensity revealed an interaction between contraction and
hemisphere (F(1,9) =5.300, P=0.015; Fig. 9). The additional statistical analysis
revealed no difference in intensity of the activity between the contractions in the left
SMA. Yet, the intensity in the right SMA was significantly stronger during the
contralateral (P=0.003) and the bilateral contractions (P=0.015) than during the
ipsilateral contractions. Thus, the volume of the region that is activated and the
intensity of the activity are similar between the different contractions for the left SMA
while in the right SMA the volume and intensity during the ipsilateral contraction is
smaller than during the contralateral and bilateral contractions.
Figure 9. Mean volume of the activated
regions (A) and mean intensity of the
activation (effect size; B) in the SMA of the
left (□) and right (■) hemisphere during the
contraction of the contralateral (C), ipsilateral
(I) or bilateral (BI) index finger. *significant
difference at P<0.05, **significant difference
at P<0.001; corrected for repeated
measurements.

Chapter 6
132
Discussion
Our data showed that the force deficit during maximal bilateral index finger abduction
was accompanied by a decline in muscle activity (EMG) of the first dorsal interosseus
and a decline in the input to the precentral gyrus, the most important motor output
area. These findings suggest that the primary source of the bilateral deficit lies
upstream of the motor cortex.
The force decline during the bilateral contractions was comparable to an
earlier study of the same muscle group (Zijdewind and Kernell, 2001) and was
accompanied by a similar decline in EMG activity (Van Dieen et al., 2003). A decline
in EMG may relate to changes within the muscle fibers, changes in excitability of the
motoneurons, or to changes in excitability within the motor cortex. Our fMRI data
showed a significant decline in the BOLD activity in the precentral gyrus during
bilateral contractions. It is demonstrated that the BOLD response correlates stronger
with the local field potential than with the firing patterns of the active neurons
(Logothetis, 2002).This observation implies that our findings reflect a decrease in the
input to the primary motor cortex. A reduction in the input to the primary motor cortex
would be expected to result in a decline in the output to the motoneurons, and thus a
decline in EMG activity. Data obtained with EEG (Oda and Moritani, 1996) suggested
there was a decline in activity of the primary motor cortex during bilateral
contractions. Our results extend this observation and suggest that the main cause of
the bilateral deficit is not within the primary motor area but upstream of the primary
motor cortex.
Both facilitating and inhibitory effects from one hemisphere to the other (e.g
Chen, 2004) are known and it is thought that most of these inputs cross via the
corpus callosum. It is possible that the bilateral deficit is the consequence of
activation of these inhibitory transcallosal pathways.
Brain areas
The primary motor cortex (precentral gyrus) is part of a large motor network that
receives dense cortical input from several motor areas, e.g. the premotor cortex
(PM), supplementary motor area (SMA) and cerebellum. Our contrast analysis
indeed revealed more activity in the ventral premotor area (PMv) during the unilateral
contractions, whereas SMA and cerebellum only showed marginal differences. This

Reduced Cortical Activity during Maximal Bilateral Contractions
133
observation suggests that also the input to the premotor area is lower during bilateral
contractions; this may result in a lower output from the premotor area and thereby
cause the lower activation values in the primary motor cortex. Interestingly, unilateral
contractions with both the left and right hand resulted in a higher activation values for
the right PMv. A recent experiment (Aramaki et al., 2006) showed activity within this
region during the transition from mirror tapping (both index fingers simultaneously) to
parallel tapping (left index and right middle finger alternated with right index and left
middle finger) suggesting an important contribution of this area during bilateral
hemispheric interactions.
Many studies suggest that the supplementary motor area has an important
role in bilateral coordination (Cardoso de Oliveira, 2002; Rouiller et al., 1994;
Stephan et al., 1999). Nevertheless, we only found small changes in cortical activity
in this area during maximal bilateral contractions. Several other studies that looked at
the SMA during (submaximal) bilateral movements have found no difference between
unilateral or bilateral movements (Koeneke et al., 2004; Sadato et al., 1997;
Toyokura et al., 2002) while other studies found enhanced neuronal activity (Jancke
et al., 2000; Stephan et al., 1999). The SMA is, however, not only associated with
bilateral coordination, but also with initiation, programming, planning, learning, and
complexity of the motor task (Roland et al., 1980); see for review: (Picard and Strick,
1996). Hence, differences in motor task complexity could explain the discrepancies
between the various studies.
EMG and force data
Other studies that have evaluated the drive to the motoneurons during bilateral
contractions show inconsistent results. Several studies have used EMG as a
measure of the central drive (e.g. Jakobi and Cafarelli, 1998; Koh et al., 1993; Van
Dieen et al., 2003; Vandervoort et al., 1984). However, EMG-recordings can be
affected by activity in nearby synergist or even antagonist muscles. Furthermore,
force differences between unilateral and bilateral contractions are often small. In
addition, these recordings can be influenced by activity of antagonist muscles,
especially within large muscle groups. For the muscle used in this experiment, the
first dorsal interosseous, it is known that a large part of the index finger abduction
force is produced by this muscle (Chao et al., 1989). Furthermore, the antagonistic
muscles, such as the second palmar interosseous, are relatively small muscles

Chapter 6
134
compared to the first dorsal interosseous and their contribution to the surface EMG
would thus be relatively small.
Studies that have used stimulation of the cortex, nerve or muscle to evaluate
the efficiency of the corticospinal drive to the motoneuron pool found some
indications of a suboptimal drive to the motoneurons during bilateral contractions
(Herbert and Gandevia, 1996; Jakobi and Cafarelli, 1998; Van Dieen et al., 2003).
During twitch superimposition a stimulus is given during a maximal contraction and
the extra force evoked by this stimulation gives a measure of the efficiency of the
corticospinal drive. During the maximal contractions subjects are encouraged to
produce a real maximal contraction and the variability in the evoked twitch during
these contractions shows that producing a ‘real’ maximal contraction is very difficult
(Allen et al., 1995). In the fMRI environment no encouragement to the subjects can
be given during the task. Although, our subjects were trained before they went into
the scanner, it is expected that they were more prone to produce a suboptimal effort
because of lack of encouragement. From the combined literature (see for review:
Jakobi and Chilibeck, 2001) on the bilateral deficit one can conclude that producing a
suboptimal maximal contraction is more likely to occur during maximal bilateral
contractions than during maximal unilateral contractions. Therefore, it is noteworthy
that our brain activation patterns indeed reveal a decline in input to the primary motor
cortex during maximal bilateral contractions.
ROI analysis
We have chosen to define our regions of interest on the basis of 1) the summation of
the areas that are activity during both unilateral and bilateral contractions and 2) the
overlap of activity during the two contractions. The information obtained by the
analysis of the two ROIs could have different implications. We were interested in the
activity in the areas that were commonly active in both unilateral and bilateral
contractions; therefore, we have chosen to use the overlap ROI. However, if the main
activity falls outside this area the activity during a contraction is underestimated. This
was the main reason for defining a summation ROI. On the other hand, if the volume
of the active areas is significantly different between the two tasks this would
underestimate the mean activation value for the task that activates a relatively small
number of voxels. In our experimental conditions no difference in the activated
volume was seen during the unilateral and bilateral contractions, therefore, we have

Reduced Cortical Activity during Maximal Bilateral Contractions
135
focussed our analysis on the summation ROI. The fact that our statistical analysis
gave similar results for both ROIs also suggests that similar regions are activated
during unilateral and bilateral contractions and that the strongest activated regions
overlap. It is unclear however, whether this is also the case for other (motor) tasks
and therefore this potential complication should be born in mind in the analysis of
fMRI data.
In conclusion, our data showed that the reduction in force during bilateral
index finger abduction is accompanied by a decline in EMG and BOLD-response in
the precentral gyrus. As the BOLD response is modulated by the input to neurons
these results suggest that the input to the precentral gyrus is diminished during
bilateral contractions and that the most likely source of the bilateral deficit lies
upstream of the motor cortex.
Copyright © 2022 FDOKUMEN