Automated Reconstruction of Whole-Genome Phylogenies from Short-Sequence Reads
Upload
independentCategory
view
1download
0
Reconstruction and Interpretation of 3D Whole BodySurface Images
Bernard BuxtonLaura Dekker
Ioannis DourosTsvetomir Vassilev
Department of Computer ScienceUniversity College London
Gower StreetLondon WC1E 6BT
United Kingdom
Tel: ++44 20 7679 7294Fax:++ 44 20 7387 1397
e-mail: {b.buxton, l.dekker, i.douros, t.vassilev}@cs.ucl.ac.uk

Reconstruction and Interpretation of 3D Whole-Body Surface Images
In this talk we will present recent developments in techniques for the reconstruction andinterpretation of 3D human, whole-body surface images. The data captured by whole-bodyimage capture systems is typically noisy, and has areas of occlusion, such as at the branchpoints of the body. This causes a number of problems in the reconstruction of the whole bodysurface, extracting useful anthropometric information, rendering or animating body models.The use of model-based approaches, which include knowledge about human body topology,leads to improved results over general-purpose techniques. Once the body surface has beenconstructed, landmark features and anthropometric information can be extracted. Approachesto feature detection will be described, and recent results for 3D anthropometry presented anddiscussed.
Reconstruction et interprétation d'images 3D de la surface du corps entier
Nous présentons ici les développements récents des techniques de reconstruction etd'interprétation d'images de la surface du corps humain tout entier. Les données acquises parun système d'acquisition corps entier sont généralement bruitées, et ont des zones d'occlusion,par exemple aux points de jonction du corps. Ceci amène un certain nombre de problèmes lorsde la reconstruction du corps, pour extraire des données anthropométriques pertinentes,obtenir un rendu et animer des modèles du corps. L'utilisation d'approches à base de modèles,qui incluent des connaissances sur la topologie du corps humain, améliorent les résultatsquelque-soit l'objectif. Une fois la surface du corps construite, des points de repère ainsi quedes données anthropométriques peuvent être extraits. Nous décrirons des approches pour ladétection d'éléments caractéristiques, et nous présenterons et discuterons des résultats récentsd'anthropométrie 3D.
1. Introduction
In this paper we describe techniques for processing 3D surface data of the human body. Westart by discussing some uses for whole-body data; we then outline various techniques forcapturing these sets of 3D data, and some of the problems that arise in the data. We then goon to describe some of the processing steps that are required in order to make use of the data,to generate complete surface models, and then to extract size and shape information for use invarious applications. The paper concludes by describing some further uses of whole-bodymodels, such as clothing simulation and animation.
2. Uses of Whole-Body Scan Data
Recent advances in three-dimensional scanning technology have enabled the generation ofhigh-density point data sets that describe the surfaces of real objects, including animateobjects such as the human body. This means that it is now possible to produce computer-based models that describe in detail the topology and the geometry of an actual human body.Such models are of increasing importance in a number of application areas [1], in particular inthe clothing industry and in medical research where they may be used to perform fast andaccurate automatic measurements, for example, to monitor body growth, or to design clothescustomised to an individual’s body shape. With the development of sophisticated dataprocessing software, scanners will have a major impact on a wide range of applicationdomains. For example, the clothing industry will benefit from the existence of systems thatallow customers to have a 3D model of themselves and use it in the context of a “virtual try-on” application, whereby customers can see exactly how the clothes will fit on them, and evenhave a choice of sizing and styling modifications. Subsequently, data can be sent to thecutting equipment. This can ensure that the item purchased is exactly as desired, with asubsequent fall in the turnover rate that is currently the case for clothes sales. In addition, 3Dbody data is needed in health and fitness research such as: evaluation of body composition(through the automatic calculation of body volume, and therefore body density, etc), study ofnutritional disorders (e.g. obesity and anorexia), monitoring and prediction of body growth,analysis and treatment of posture and skeletal problems (osteopathy), treatment of burns andinjuries, prosthetic and cosmetic surgery, body kinetics and performance analysis. Other usesof 3D human body modelling include ergonomics, robotics (simulation), and creation ofrealistic avatars for virtual reality systems.
3. Techniques for Whole-Body Capture
Capturing high-quality, high-resolution surface images of the human body presents numerousproblems. For example, a system has to cope with factors such as:
• variable skin colour and other properties (e.g., texture, reflectance) [2];• hair has different optical properties from skin, and may be very variable;• subjects may be fully or partially clothed, and therefore the properties of clothing
should also be taken into account when designing the image capture technique;• people may move, breathe or sway, and therefore the capture time should be as short
as possible [3];• the body has a complex shape, and has areas, such as the underarms, that cannot easily
be “seen” by an imaging device [4].
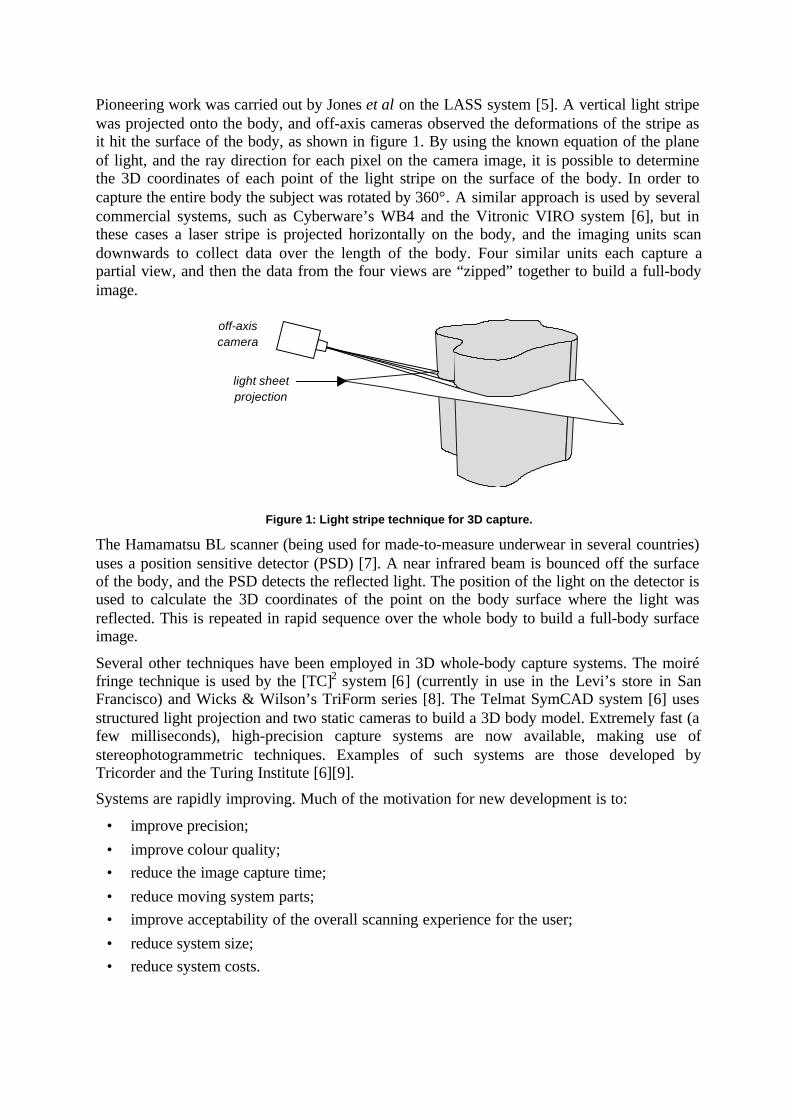
Pioneering work was carried out by Jones et al on the LASS system [5]. A vertical light stripewas projected onto the body, and off-axis cameras observed the deformations of the stripe asit hit the surface of the body, as shown in figure 1. By using the known equation of the planeof light, and the ray direction for each pixel on the camera image, it is possible to determinethe 3D coordinates of each point of the light stripe on the surface of the body. In order tocapture the entire body the subject was rotated by 360°. A similar approach is used by severalcommercial systems, such as Cyberware’s WB4 and the Vitronic VIRO system [6], but inthese cases a laser stripe is projected horizontally on the body, and the imaging units scandownwards to collect data over the length of the body. Four similar units each capture apartial view, and then the data from the four views are “zipped” together to build a full-bodyimage.
Figure 1: Light stripe technique for 3D capture.
The Hamamatsu BL scanner (being used for made-to-measure underwear in several countries)uses a position sensitive detector (PSD) [7]. A near infrared beam is bounced off the surfaceof the body, and the PSD detects the reflected light. The position of the light on the detector isused to calculate the 3D coordinates of the point on the body surface where the light wasreflected. This is repeated in rapid sequence over the whole body to build a full-body surfaceimage.
Several other techniques have been employed in 3D whole-body capture systems. The moiréfringe technique is used by the [TC]2 system [6] (currently in use in the Levi’s store in SanFrancisco) and Wicks & Wilson’s TriForm series [8]. The Telmat SymCAD system [6] usesstructured light projection and two static cameras to build a 3D body model. Extremely fast (afew milliseconds), high-precision capture systems are now available, making use ofstereophotogrammetric techniques. Examples of such systems are those developed byTricorder and the Turing Institute [6][9].
Systems are rapidly improving. Much of the motivation for new development is to:
• improve precision;• improve colour quality;• reduce the image capture time;• reduce moving system parts;• improve acceptability of the overall scanning experience for the user;• reduce system size;• reduce system costs.
light sheetprojection
off-axiscamera
4. Problems with the Data
There are a number of problems related to the quality of human body data captured by anysystem. Those problems drive the effort towards the development of human body modellingtechnology. Algorithms have been developed and improved for the last few years in order totransform a 3D body representation as captured by the hardware (typically less than perfect)to a representation that is both accurate, visually satisfying, and useful for quantitative surfaceand geometrical analysis.
It should be noted that the problems mentioned in this section are not peculiar to a particularhardware product, but are present to varying extents in any 3D dataset. Before we explainwhat the problems are, we need to define the concepts of ‘datasets’ and their quality. The‘dataset’, in this context, is a set of points in 3D space that approximately lie on the surface ofthe object scanned (in this case a human body). The density, accuracy and completeness ofthe point set are parameters determining its overall quality. If there is a problem with any ofthese attributes, the overall quality of the whole dataset is affected:
i. Density: In order for the point set to represent the continuous surface of the humanbody well enough, a sufficient number of points per unit surface area must beobtained.
ii. Accuracy: The points obtained must lie on the body to within some given tolerance.
iii. Completeness: A data set is complete, if all parts of the object surface are representedwith points of sufficient and reasonably uniform spatial density.
The first problem is noise. This is related to the range accuracy of the 3D scanning techniqueused in any particular system. Most scanners try to estimate the distance between the object’ssurface and the sensor either directly, (as the sensor does, for example, in the Hamamatsu BLScanner where position-sensitive detectors are used [7]), or through processing andcalculation on the raw data captured by the sensor (as for example, with the Wicks & Wilsonscanner that obtains stereo-matching pairs of 2D images from which 3D points are calculatedusing photogrammetric techniques). In both cases, error can be introduced in the process and,as a result, points obtained do not lie exactly on the surface. In this case, the manufacturermay provide a numerical value for the accuracy of the sensors. Moreover, the sensors mightfalsely detect a point where there is no surface (e.g., because of reflections in the scanner’sactive area, or because of false correspondences in the stereo matching photogrammetricsystems). In this case, outliers are present in the dataset and need to be detected and removedbefore the surface can be properly represented (‘cleaning’, section 5).
The second problem is related to occlusion, and affects the completeness of the data set. Ascanner can only obtain data from areas of the object that are directly visible to the sensors.This is acceptable for simple objects, but a human body is made of parts that mutuallyocclude each other, and gaps occur in occluded areas, typically the groin and armpits.
Another kind of gap occurs because of areas of the body that are not occluded, but arenevertheless invisible to the sensors. Dark-coloured surfaces such as the eyes, blackunderwear or swimwear, are typical examples. Incident light is almost completely absorbedby these surfaces, thus returning too weak a reflected signal for the sensors to register. Scalphair is another typical case of an invisible surface. In this case, it is not the colour that causesthe problem, but the irregular reflectance properties of hairy surface which diffuses incidentlight so that the light reflected back to the sensor is negligible and featureless.
Finally, the last problem is related to data registration and calibration of cameras. Typically,in order to obtain a full 360o all-around image (let alone a full 4p solid angle), a dataset is
divided into a number of subsets, also called ‘views’, equal to the number of sensor heads inthe scanner. Each view is originally expressed in a coordinate system based on the sensor’sframe of reference. This means that the spatial relations between views must be resolved, inorder that parts of the dataset can be expressed in the same frame of reference. If the preciserelative locations of the sensors are known and remain fixed, this is not difficult. Howeverthis is not the case for most systems, especially portable ones, so a further geometricalanalysis of the overlapping regions of the different views is required in order to achieve aprecise multi-view registration. For the highest accuracy and data consistency such aregistration procedure may also be carried out even when the sensor positions have beenmeasured or calibrated beforehand.
5. Processing Techniques for Human Body Modelling
The term ‘body modelling’ refers to a series of software processing techniques. Some of thesetechniques are always relevant and need to be applied to any dataset from a particular scanner.Such techniques are collectively referred to as pre-processing, and are there mostly in order toovercome the problems mentioned in the previous section. Registration of the multiple viewsis normally the first step to be taken. For instance, if data is obtained via a Hamamatsu BLScanner, points are expressed as a series of distances from the sensors. With the locations ofthe sensors and the firing angles of the illuminating lasers known from regular calibration ofthe scanner, the Cartesian coordinates of each point in 3D may be calculated, thus achieving acommon frame of reference for all points. On the other hand, in the case of a Wicks & WilsonTriForm scanner, made up of two portable parts meant to be set up by a semi-expert withoutcalibration, a geometric multiview registration consists of two steps: first, the data sets areroughly aligned manually, and then a registration algorithm is utilised so as to achieveoptimum registration.
The next step of preprocessing is cleaning [10], i.e., removal of all points in the dataset thatdo not correspond to the body surface (Figure 1a). Of course, it is necessary to detect suchpoints in order to remove them. It is therefore necessary to form a set of assumptions, which,in conjuction with the effectiveness of the algorithms, will determine the quality of cleaning.There is thus no ‘perfect’ cleaning. It can be incomplete and allow a few outliers to survive,or it can be so strong that some actual data points are lost. An obvious assumption, used forexample in the Hamamatsu BL Scanner to reject potential outliers is that points associatedwith a low intensity are unreliable because they may have been generated by multiplereflections. Potential outliers can thus be removed by a thresholding operation in the intensitydomain, but this will also, of course, also remove some weak reflections from the surface,such as from areas of dark hair. Other outliers may correspond to the scanner’s structure suchas the walls, floor, etc. These elements have known locations in space, so points thatcorrespond to them may be removed via spatial clipping. After such processes have beencarried out, the remaining outliers are normally high intensity solitary points at unusually longdistances from the main bulk of the dataset, so they can be identified and rejected through anearest-neighbour analysis (Figure 2b).
The next step after cleaning is usually surface reconstruction [11][12]. This is one of the mostdifficult and crucial processing steps, and will be discussed in detail in the next section. It isrequired in order to close the gaps in the body surface where the scanner has failed to captureany data. Also, during this step, connectivity between the remaining points (after cleaning) isestablished (Figure 2c), as well as the division of the dataset into meaningful topologicalsegments (arms, legs, torso, head).
(a) (b) (c) (d)
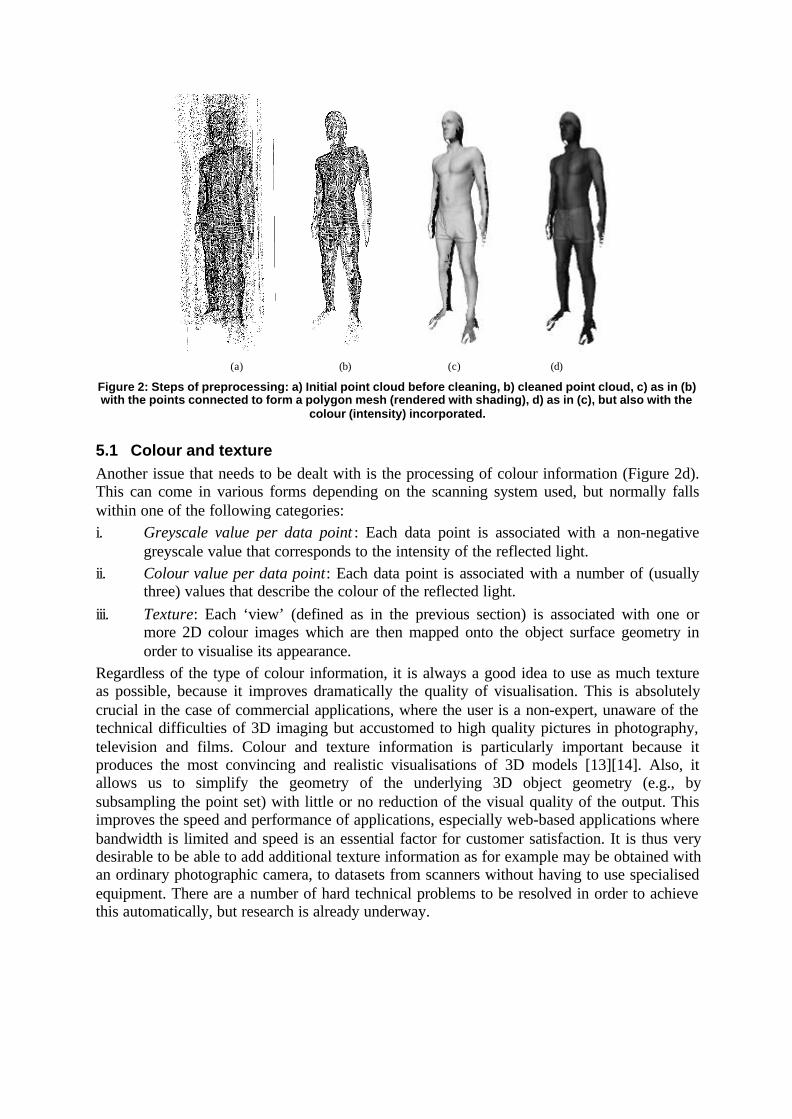
Figure 2: Steps of preprocessing: a) Initial point cloud before cleaning, b) cleaned point cloud, c) as in (b)with the points connected to form a polygon mesh (rendered with shading), d) as in (c), but also with the
colour (intensity) incorporated.
5.1 Colour and textureAnother issue that needs to be dealt with is the processing of colour information (Figure 2d).This can come in various forms depending on the scanning system used, but normally fallswithin one of the following categories:i. Greyscale value per data point : Each data point is associated with a non-negative
greyscale value that corresponds to the intensity of the reflected light.ii. Colour value per data point: Each data point is associated with a number of (usually
three) values that describe the colour of the reflected light.iii. Texture: Each ‘view’ (defined as in the previous section) is associated with one or
more 2D colour images which are then mapped onto the object surface geometry inorder to visualise its appearance.
Regardless of the type of colour information, it is always a good idea to use as much textureas possible, because it improves dramatically the quality of visualisation. This is absolutelycrucial in the case of commercial applications, where the user is a non-expert, unaware of thetechnical difficulties of 3D imaging but accustomed to high quality pictures in photography,television and films. Colour and texture information is particularly important because itproduces the most convincing and realistic visualisations of 3D models [13][14]. Also, itallows us to simplify the geometry of the underlying 3D object geometry (e.g., bysubsampling the point set) with little or no reduction of the visual quality of the output. Thisimproves the speed and performance of applications, especially web-based applications wherebandwidth is limited and speed is an essential factor for customer satisfaction. It is thus verydesirable to be able to add additional texture information as for example may be obtained withan ordinary photographic camera, to datasets from scanners without having to use specialisedequipment. There are a number of hard technical problems to be resolved in order to achievethis automatically, but research is already underway.
(a) (b) (c)
(d) (e) (f)
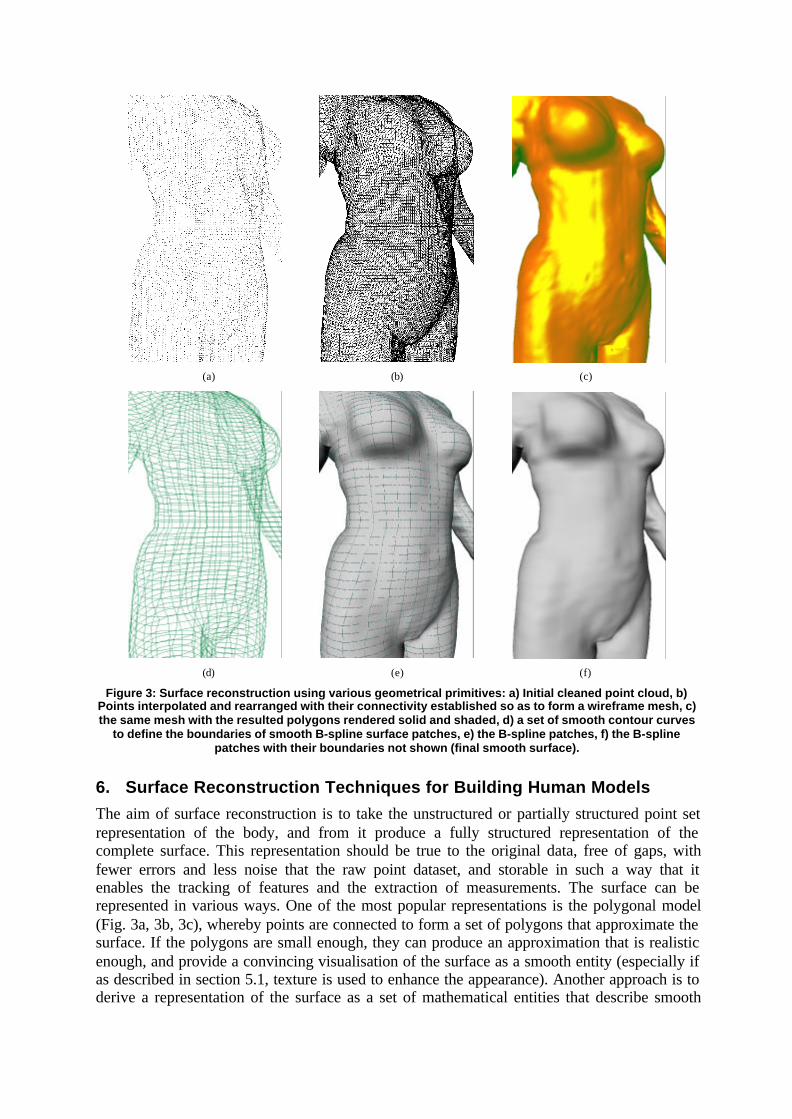
Figure 3: Surface reconstruction using various geometrical primitives: a) Initial cleaned point cloud, b)Points interpolated and rearranged with their connectivity established so as to form a wireframe mesh, c)the same mesh with the resulted polygons rendered solid and shaded, d) a set of smooth contour curves
to define the boundaries of smooth B-spline surface patches, e) the B-spline patches, f) the B-splinepatches with their boundaries not shown (final smooth surface).
6. Surface Reconstruction Techniques for Building Human Models
The aim of surface reconstruction is to take the unstructured or partially structured point setrepresentation of the body, and from it produce a fully structured representation of thecomplete surface. This representation should be true to the original data, free of gaps, withfewer errors and less noise that the raw point dataset, and storable in such a way that itenables the tracking of features and the extraction of measurements. The surface can berepresented in various ways. One of the most popular representations is the polygonal model(Fig. 3a, 3b, 3c), whereby points are connected to form a set of polygons that approximate thesurface. If the polygons are small enough, they can produce an approximation that is realisticenough, and provide a convincing visualisation of the surface as a smooth entity (especially ifas described in section 5.1, texture is used to enhance the appearance). Another approach is toderive a representation of the surface as a set of mathematical entities that describe smooth
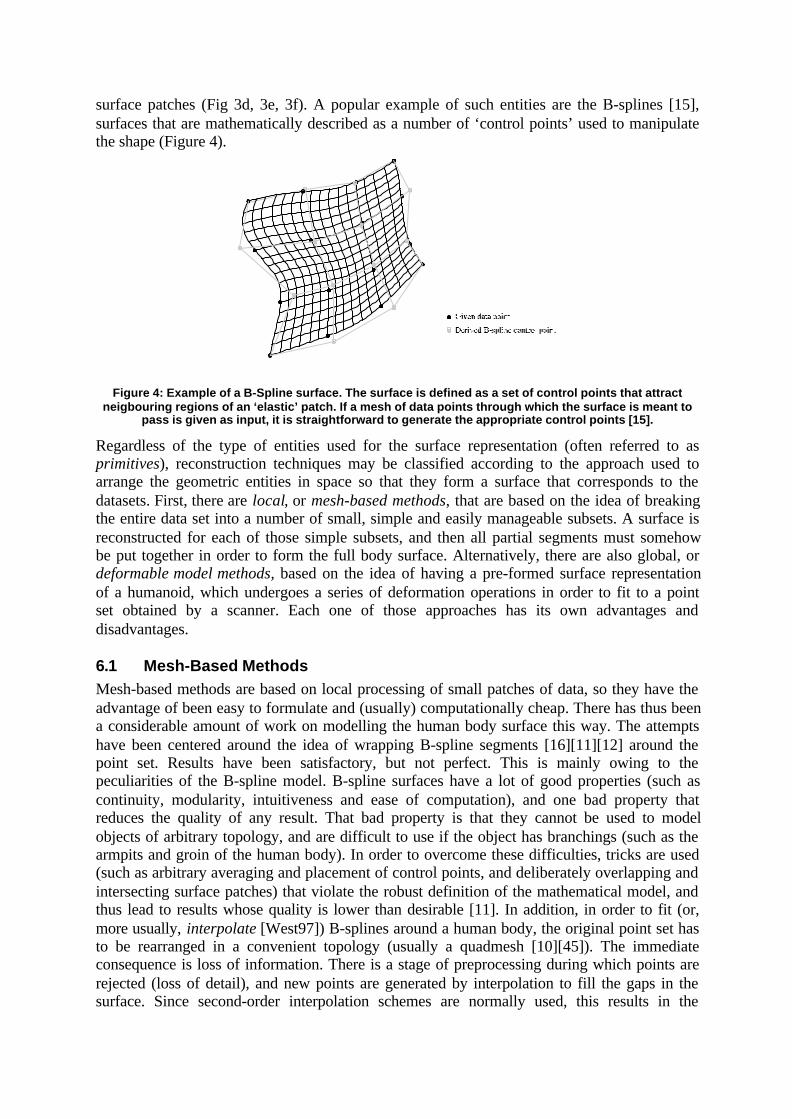
surface patches (Fig 3d, 3e, 3f). A popular example of such entities are the B-splines [15],surfaces that are mathematically described as a number of ‘control points’ used to manipulatethe shape (Figure 4).
Figure 4: Example of a B-Spline surface. The surface is defined as a set of control points that attractneigbouring regions of an ‘elastic’ patch. If a mesh of data points through which the surface is meant to
pass is given as input, it is straightforward to generate the appropriate control points [15].
Regardless of the type of entities used for the surface representation (often referred to asprimitives), reconstruction techniques may be classified according to the approach used toarrange the geometric entities in space so that they form a surface that corresponds to thedatasets. First, there are local, or mesh-based methods, that are based on the idea of breakingthe entire data set into a number of small, simple and easily manageable subsets. A surface isreconstructed for each of those simple subsets, and then all partial segments must somehowbe put together in order to form the full body surface. Alternatively, there are also global, ordeformable model methods, based on the idea of having a pre-formed surface representationof a humanoid, which undergoes a series of deformation operations in order to fit to a pointset obtained by a scanner. Each one of those approaches has its own advantages anddisadvantages.
6.1 Mesh-Based MethodsMesh-based methods are based on local processing of small patches of data, so they have theadvantage of been easy to formulate and (usually) computationally cheap. There has thus beena considerable amount of work on modelling the human body surface this way. The attemptshave been centered around the idea of wrapping B-spline segments [16][11][12] around thepoint set. Results have been satisfactory, but not perfect. This is mainly owing to thepeculiarities of the B-spline model. B-spline surfaces have a lot of good properties (such ascontinuity, modularity, intuitiveness and ease of computation), and one bad property thatreduces the quality of any result. That bad property is that they cannot be used to modelobjects of arbitrary topology, and are difficult to use if the object has branchings (such as thearmpits and groin of the human body). In order to overcome these difficulties, tricks are used(such as arbitrary averaging and placement of control points, and deliberately overlapping andintersecting surface patches) that violate the robust definition of the mathematical model, andthus lead to results whose quality is lower than desirable [11]. In addition, in order to fit (or,more usually, interpolate [West97]) B-splines around a human body, the original point set hasto be rearranged in a convenient topology (usually a quadmesh [10][45]). The immediateconsequence is loss of information. There is a stage of preprocessing during which points arerejected (loss of detail), and new points are generated by interpolation to fill the gaps in thesurface. Since second-order interpolation schemes are normally used, this results in the
surface being biased towards an elliptical shape. Subsequently, the resulting quadmeshstructures are further resampling to allow proper inter-segment connectivity (further loss ofdetail). In other words, we start with a point set that describes the surface. Owing to inevitableocclusions, this set has gaps (holes). However, where the points exist, they provide very goodand acceptably detailed information on the surface. With the existing approach [11][12][16],we sacrifice this detail for the sake of filling the gaps (Figure 3).
6.2 Deformable ModelsSurface reconstruction techniques based on deformable models are normally more intricateand complicated which means, among other things, that they tend to be slower andcomputationally expensive. In return, because they are based on much more specific priorinformation about the human body, they tend to be much more robust, and capable ofefficiently handling gaps, noise, and poorly defined datasets. As a result [14][16][17], theygenerally produce results of higher quality. Deformable modelling can be encountered in anumber of variants, but there are two main categories.
The first category, which is the original version of deformable modelling as it first appeared[18] includes techniques where the initial surface model to be deformed is arbitrary and madeby hand. The model undergoes a series of iterative deformations based on mathematicalconstraints and formulated so that the spatial distances between the model and the databecome smaller with each iteration, until the model (hopefully) converges to a shape that isthe same as the shape of the points set. These models have mostly been used in 2D, in order todetect the edges of an object on an image by closing a curve around the object. For thatreason, such models are also known as ‘snakes’.
The second category is an advanced form of the ‘snake’-type models, known as ‘ActiveShape Models’ or ‘Smart Snakes’ [18][19][20]. These models are more ‘intelligent’ in thesense that they incorporate statistical knowledge of the shape of the class of objects they aretrying to represent. This statistical knowledge is obtained from a training set formed by anumber of example scans. The scans in the training set are first aligned (normally using atechnique called ‘Procrustes Alignment’ [21][22]) and then averaged to produce a meanshape. This mean shape is also used as the initial surface that is deformed to fit the data, so ithas the additional advantage of being non-arbitrary. Therefore, if a scan has a shape similar tothose found in the training set, there is a very high chance that its surface reconstruction willbe faster and more accurate. Additionally, Principal Components Analysis is carried out onthe training set in order to find the significant modes of shape variation across the set. Thisinformation (extraction of which constitutes a whole-body size-shape analysis where the full3D information is exploited) is subsequently used to drive the deformation/fitting process.This means that the model deforms, not arbitrarily as in the previous case, but in ways presentin the training set [18], thus preventing deformation from straying and converging onto thewrong shape.
7. Interpreting Human Surface Models
There are various ways to interpret human surface models, depending on the applicationdomain. Interpretation techniques can generally be classified into: shape description,quantification, image understanding, feature detection and measurement extraction.
7.1 Shape Description and QuantificationOnce a complete and clean surface is available it is possible to add higher-level application-specific knowledge to the model, by identifying and labelling regions of the body (left lower
leg, head, etc.), contours and landmark features (seventh cervical vertebra, navel, etc.). Thesefeatures can then be used to generate articulated avatars [23], and in anthropometric analysis,to obtain qualitative and quantitative measures of size and shape. For example, in making amade-to-measure suit it is important to know the length of the arm, as measured from the baseof the neck, to the edge of the shoulder, to elbow, and down to the wrist. In analysing spinalshape, it is necessary to detect the contour of the spine from the surface shape.
7.2 Raw Data to Higher-Level KnowledgeIn order to extract the maximum amount of truly three-dimensional information from awhole-body image (as opposed to simply simulating the traditional tape measure) it isimportant to have a rich “vocabulary” of descriptive techniques. Such methods havedeveloped over the years from two-dimensional greyscale image processing, and many aredirectly applicable to surface data by simply replacing the intensity attribute with the thirdspatial dimension.
Simple shape attributes can be used in combination to describe shape characteristics of areasof the body surface, such as the mean distance of a closed contour from an ellipse, principalcomponents analysis, and other attributes illustrated below [24][25]. Such attributes make itpossible to compare shape differences across subjects.
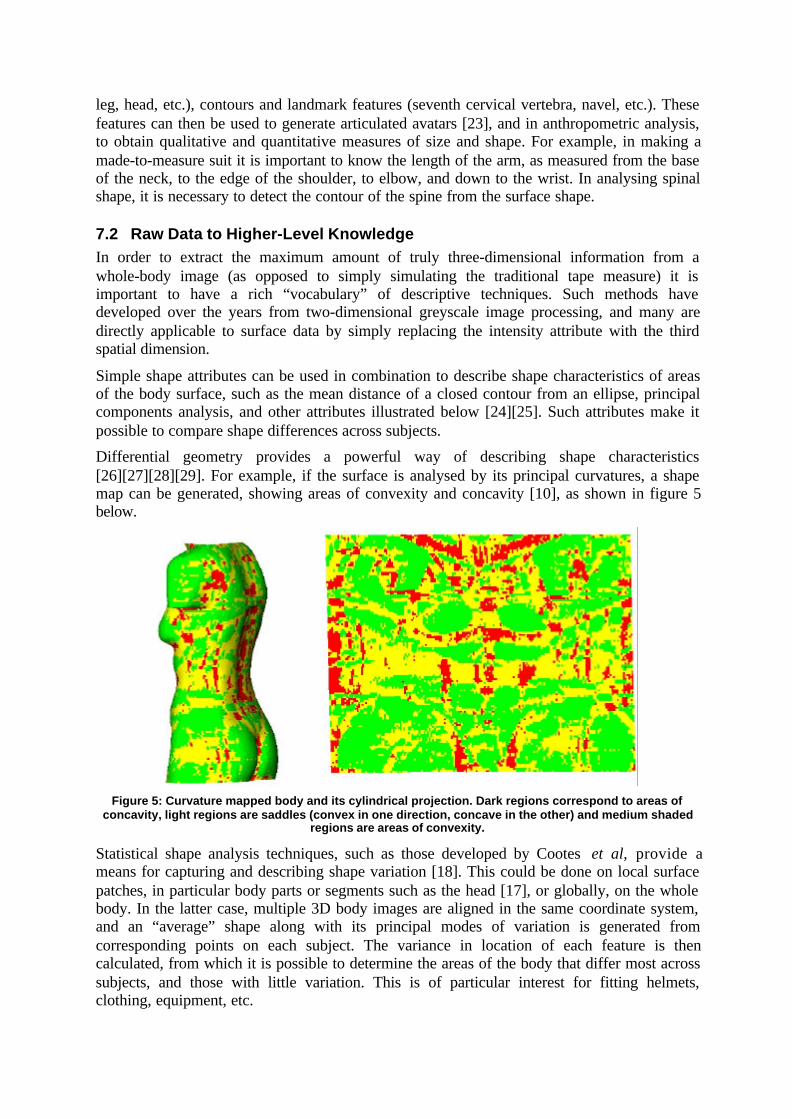
Differential geometry provides a powerful way of describing shape characteristics[26][27][28][29]. For example, if the surface is analysed by its principal curvatures, a shapemap can be generated, showing areas of convexity and concavity [10], as shown in figure 5below.
Figure 5: Curvature mapped body and its cylindrical projection. Dark regions correspond to areas ofconcavity, light regions are saddles (convex in one direction, concave in the other) and medium shaded
regions are areas of convexity.
Statistical shape analysis techniques, such as those developed by Cootes et al, provide ameans for capturing and describing shape variation [18]. This could be done on local surfacepatches, in particular body parts or segments such as the head [17], or globally, on the wholebody. In the latter case, multiple 3D body images are aligned in the same coordinate system,and an “average” shape along with its principal modes of variation is generated fromcorresponding points on each subject. The variance in location of each feature is thencalculated, from which it is possible to determine the areas of the body that differ most acrosssubjects, and those with little variation. This is of particular interest for fitting helmets,clothing, equipment, etc.

7.3 Automated Image UnderstandingUsing techniques such as those described above, a great deal can be obtained by interactivelyextracting the information of interest from a 3D image. However, ideally features should bedetected automatically, to enable fast, large-scale processing of information by machine. Thiscorresponds to the “image understanding” that goes on in the human visual system, wherebythe raw light information is interpreted into meaningful components and higher-level entities[30]. Getting a machine to perform similar tasks from a raw 3D body image is difficult formany reasons:
• the features of interest are often extremely subtle (e.g., a particular vertebra);• there is a great variation in body shape and feature characteristics across different people;• many of the features of interest are occluded (e.g., underarms);• validation of the results is difficult, because the subjects are living.
Several groups around the world have been working on this set of problems, using variousmethods, which can be broadly categorised as:
• detection of pre-placed markers (prior to scanning);• deformable templates with markers on;• pattern recognition.
These methods are described in more detail below.
7.4 Methods for Feature DetectionOne approach to feature detection is to place markers on the subject prior to scanning, and touse an image processing operation to detect the markers in the scan, by virtue of their colouror intensity characteristics. This has been done by Geisen et al [31] and Lewark and Nurre[32]. A Bayesian method is used to assign labels to the markers once they have been detected.This requires high-resolution scanners to ensure reliable detection of the markers. It hascertain drawbacks, in that the subject must be wearing clothing of a uniform colour to allowdetection, and it requires accurate placement of markers, with some intrusion on the subject,and often a considerable increase in time to process each subject. However, this approach isreliable, and can be significantly enhanced by having some operator guidance in the detectionand labelling process. This method is being used to process data collected by the CAESARproject [33].
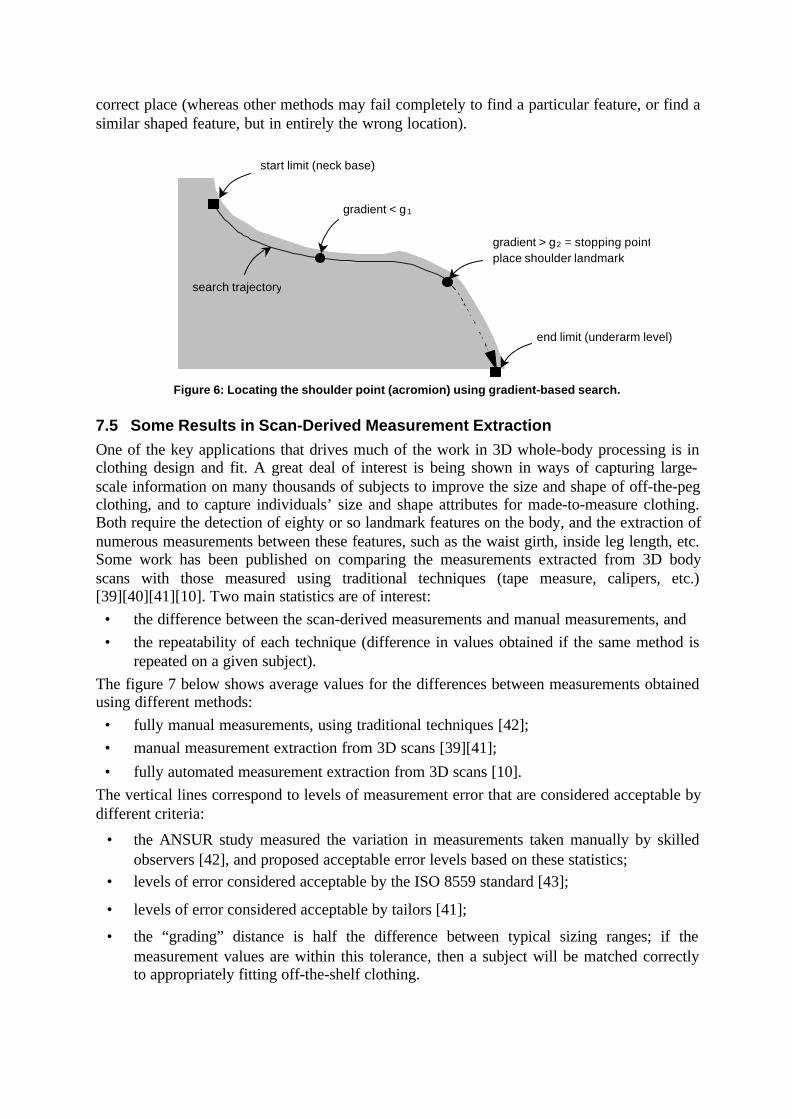
Pattern recognition methods have been used to detect features based on surface shape, usingcontextual properties [34][45][35]. Typically the processes work by localising an area tosearch for a particular feature (the context) and performing a search based on the local shapeproperties, such as curvature. This is illustrated in figure 6 below, where the system attemptsto find the end of the shoulder point based on gradients along the search trajectory. Thisapproach lends itself to machine learning, whereby the numeric search parameters areoptimised, or the entire pattern template is generated from scratch [36][37].
Another method, used successfully in some other domains (e.g., medical imaging) is to createa template, pre-marked with the information of interest, which deforms with respect to theimage data, to fit the template [38]. Statistical information (e.g., as mentioned in section 6.2)can also be used to constrain the model deformations in ways that match the characteristics ofthe human body shape [18]. The deformable template approach has the advantage ofperforming surface reconstruction in the same operation as feature detection, and should alsogive good worst case error, since the features will always be found in approximately the
correct place (whereas other methods may fail completely to find a particular feature, or find asimilar shaped feature, but in entirely the wrong location).
Figure 6: Locating the shoulder point (acromion) using gradient-based search.
7.5 Some Results in Scan-Derived Measurement ExtractionOne of the key applications that drives much of the work in 3D whole-body processing is inclothing design and fit. A great deal of interest is being shown in ways of capturing large-scale information on many thousands of subjects to improve the size and shape of off-the-pegclothing, and to capture individuals’ size and shape attributes for made-to-measure clothing.Both require the detection of eighty or so landmark features on the body, and the extraction ofnumerous measurements between these features, such as the waist girth, inside leg length, etc.Some work has been published on comparing the measurements extracted from 3D bodyscans with those measured using traditional techniques (tape measure, calipers, etc.)[39][40][41][10]. Two main statistics are of interest:
• the difference between the scan-derived measurements and manual measurements, and• the repeatability of each technique (difference in values obtained if the same method is
repeated on a given subject).The figure 7 below shows average values for the differences between measurements obtainedusing different methods:
• fully manual measurements, using traditional techniques [42];• manual measurement extraction from 3D scans [39][41];• fully automated measurement extraction from 3D scans [10].
The vertical lines correspond to levels of measurement error that are considered acceptable bydifferent criteria:
• the ANSUR study measured the variation in measurements taken manually by skilledobservers [42], and proposed acceptable error levels based on these statistics;
• levels of error considered acceptable by the ISO 8559 standard [43];
• levels of error considered acceptable by tailors [41];
• the “grading” distance is half the difference between typical sizing ranges; if themeasurement values are within this tolerance, then a subject will be matched correctlyto appropriately fitting off-the-shelf clothing.
search trajectory
start limit (neck base)
end limit (underarm level)
gradient < g1
gradient > g2 = stopping pointplace shoulder landmark
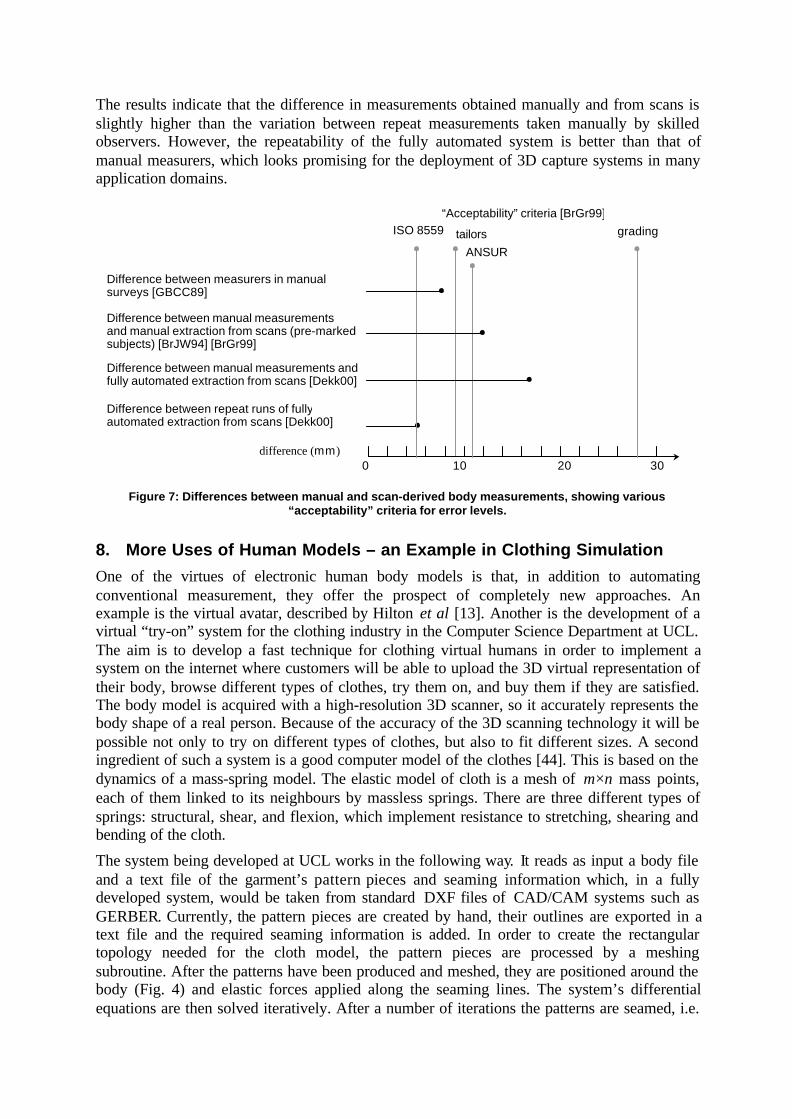
The results indicate that the difference in measurements obtained manually and from scans isslightly higher than the variation between repeat measurements taken manually by skilledobservers. However, the repeatability of the fully automated system is better than that ofmanual measurers, which looks promising for the deployment of 3D capture systems in manyapplication domains.
Figure 7: Differences between manual and scan-derived body measurements, showing various“acceptability” criteria for error levels.
8. More Uses of Human Models – an Example in Clothing Simulation
One of the virtues of electronic human body models is that, in addition to automatingconventional measurement, they offer the prospect of completely new approaches. Anexample is the virtual avatar, described by Hilton et al [13]. Another is the development of avirtual “try-on” system for the clothing industry in the Computer Science Department at UCL.The aim is to develop a fast technique for clothing virtual humans in order to implement asystem on the internet where customers will be able to upload the 3D virtual representation oftheir body, browse different types of clothes, try them on, and buy them if they are satisfied.The body model is acquired with a high-resolution 3D scanner, so it accurately represents thebody shape of a real person. Because of the accuracy of the 3D scanning technology it will bepossible not only to try on different types of clothes, but also to fit different sizes. A secondingredient of such a system is a good computer model of the clothes [44]. This is based on thedynamics of a mass-spring model. The elastic model of cloth is a mesh of m×n mass points,each of them linked to its neighbours by massless springs. There are three different types ofsprings: structural, shear, and flexion, which implement resistance to stretching, shearing andbending of the cloth.
The system being developed at UCL works in the following way. It reads as input a body fileand a text file of the garment’s pattern pieces and seaming information which, in a fullydeveloped system, would be taken from standard DXF files of CAD/CAM systems such asGERBER. Currently, the pattern pieces are created by hand, their outlines are exported in atext file and the required seaming information is added. In order to create the rectangulartopology needed for the cloth model, the pattern pieces are processed by a meshingsubroutine. After the patterns have been produced and meshed, they are positioned around thebody (Fig. 4) and elastic forces applied along the seaming lines. The system’s differentialequations are then solved iteratively. After a number of iterations the patterns are seamed, i.e.
Difference between manual measurementsand manual extraction from scans (pre-markedsubjects) [BrJW94] [BrGr99]
Difference between measurers in manualsurveys [GBCC89]
“Acceptability” criteria [BrGr99]
Difference between repeat runs of fullyautomated extraction from scans [Dekk00]
ISO 8559 tailors grading
ANSUR
difference (mm)10 20 300
Difference between manual measurements andfully automated extraction from scans [Dekk00]
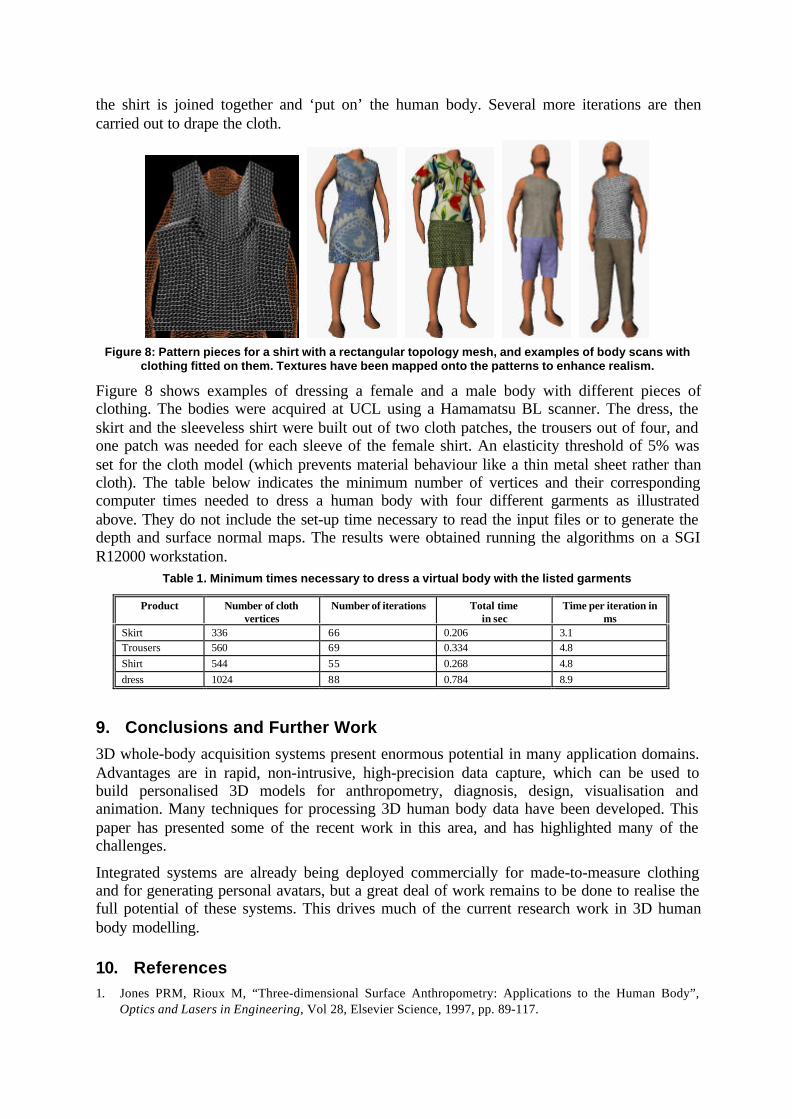
the shirt is joined together and ‘put on’ the human body. Several more iterations are thencarried out to drape the cloth.
Figure 8: Pattern pieces for a shirt with a rectangular topology mesh, and examples of body scans with
clothing fitted on them. Textures have been mapped onto the patterns to enhance realism.
Figure 8 shows examples of dressing a female and a male body with different pieces ofclothing. The bodies were acquired at UCL using a Hamamatsu BL scanner. The dress, theskirt and the sleeveless shirt were built out of two cloth patches, the trousers out of four, andone patch was needed for each sleeve of the female shirt. An elasticity threshold of 5% wasset for the cloth model (which prevents material behaviour like a thin metal sheet rather thancloth). The table below indicates the minimum number of vertices and their correspondingcomputer times needed to dress a human body with four different garments as illustratedabove. They do not include the set-up time necessary to read the input files or to generate thedepth and surface normal maps. The results were obtained running the algorithms on a SGIR12000 workstation.
Table 1. Minimum times necessary to dress a virtual body with the listed garments
Product Number of clothvertices
Number of iterations Total timein sec
Time per iteration inms
Skirt 336 66 0.206 3.1Trousers 560 69 0.334 4.8Shirt 544 55 0.268 4.8dress 1024 88 0.784 8.9
9. Conclusions and Further Work
3D whole-body acquisition systems present enormous potential in many application domains.Advantages are in rapid, non-intrusive, high-precision data capture, which can be used tobuild personalised 3D models for anthropometry, diagnosis, design, visualisation andanimation. Many techniques for processing 3D human body data have been developed. Thispaper has presented some of the recent work in this area, and has highlighted many of thechallenges.
Integrated systems are already being deployed commercially for made-to-measure clothingand for generating personal avatars, but a great deal of work remains to be done to realise thefull potential of these systems. This drives much of the current research work in 3D humanbody modelling.
10. References1. Jones PRM, Rioux M, “Three-dimensional Surface Anthropometry: Applications to the Human Body”,
Optics and Lasers in Engineering, Vol 28, Elsevier Science, 1997, pp. 89-117.

2. Rioux M, “Fundamental Limits of Optical 3D Digitizing Systems for the Measurement of the HumanBody”, Proceedings of the Workshop on 3D Anthropometry and Industrial Products Design, UniversitéParis V, Laboratoire d’Anthropologie Appliquée, Paris, 1998, pp. 3/1-3/6.
3. Corner B, Hu A, “Effect of Sway on Image Fidelity in Whole Body Digitizing”, Proceedings of SPIE 3313,1998, pp. 90-99.
4. Brunsman MA, Daanen HAM, Robinette KM, “Optimal Postures and Positioning for Human BodyScanning”, Proceedings of the International Conference on Recent Advances in 3D Digital Imaging andModeling, Ottawa, 1997, pp. 266-274.
5. Jones PRM, West G, Harris D, Read J, “The Loughborough Anthropometric Shadow Scanner (LASS)”,Endeavour Vol. 13 No. 4 New Series, 1989, pp. 164-168.
6. Daanen HAM, Van de Water GJ, “Whole body scanners”, Displays, Vol 19, Elsevier Science 1998, pp. 111-120.
7. Horiguchi C, “BL (Body Line) Scanner”, International Archives of Photogrammetry and Remote Sensing,Vol XXXII, Part 5, Hakodate 1998
8. Wicks and Wilson Ltd., TriForm 3D Scanners, 1998.9. Tricorder Technologies plc, Tricorder Digital Surface Photogrammetry, 1998.10. Dekker L, 3D Human Body Modelling from Range Data, University College London, 2000.11. Douros I., Dekker L., Buxton B., "Reconstruction of the surface of the human body from 3D scanner data
using B-splines", SPIE proceedings vol. 3640, pp234-245, San Jose, California, January 1999.12. Douros I., Dekker L., Buxton B., "An Improved Algorithm for Reconstruction of theSurface of the Human
Body from 3D Scanner Data Using Local B-spline Patches", mPeople Workshop Proceedings, IEEE-ICCV99, pp29-36, Corfu, Greece, September 1999.
13. Hilton A, Beresford D, Gentils T, Smith R, Sun W, “Virtual People: Capturing human models to populatevirtual worlds”, IEEE International Conference on Computer Animation, 1999, pp. 174-185.
14. Hilton, A., ‘Towards Model-Based Capture of a Persons Shape, Appearance and Motion’, mPeopleWorkshop Proceedings, IEEE-ICCV99, pp37-44, Corfu, Greece, September 1999.
15. Piegl,L., Tiller,W., ‘The NURBS book’, Second edition, Springer-Verlag Berlin, 1997.16. West,E., ‘B-Spline Surface Skinning for Body Scanner Data’, MRes Project Report, Department of
Computer Science, University College London, September 1997.17. Website of the MINORI project at the Eastman Dental Institute, work by Hammond, P. and Hutton, T.,
http://www.eastman.ucl.ac.uk/~dmi/MINORI/index.html18. Cootes TF, Taylor CJ, Cooper DH, Graham J, “Active Shape Models - their Training and Application”,
Computer Vision and Image Understanding, Vol 61 No 1 , Academic Press Inc., 1995, pp. 38-59.19. Cootes, T.F., DiMauro, E.C., Taylor, C.J., Lanitis, A., ‘Flexible 3D Models from Uncalibrated Cameras’,
BMVC95.20. Smyth, P.P., Taylor, C.J., Adams, ‘Automatic measurement of Vertebral Shape Using Active Shape
Models’, University of Manchester.21. Gower, J.C., ‘Statistical methods of comparing different multivariate analyses of the same data’, in
Mathematics in the Archaeological and Historical Sciences, Hodson, F.R., Kendall, D.G., Tautu, P.,Edinburgh University Press, 1971, pp138-149.
22. Golub, C.H., Reinsch, C., ‘Handbook series linear algebra. Singular value decomposition and least squaressolutions’, Numerical Mathematics, Vol.14, 1970, pp403-420.
23. Humanoid Animation Working Group, Specification for a Standard Humanoid, Version 1.1,http://ece.uwaterloo.ca/~h-anim/spec1.1/, 1999.
24. Iivarinen J, Peura M, Särelä J, Visa A, “Comparison of Combined Shape Descriptors for Irregular Objects”,Proceedings of the British Machine Vision Conference, BMVA Press, 1997, pp. 430-439.
25. Ashbrook AP, Fisher RB, Robertson C, Werghi N, “Finding Surface Correspondence for ObjectRecognition and Registration Using Pairwise Geometric Histograms”, Proceedings of the EuropeanConference on Computer Vision, 1998.
26. Asada H, Brady M, “The Curvature Primal Sketch”, IEEE Transactions on Pattern Analysis and MachineIntelligence, Vol 8, 1986, pp. 2-14.
27. Ponce J, Brady M, “Toward a Surface Primal Sketch”, Three-Dimensional Machine Vision , Kanade (ed.),Kluwer Academic Publishers, 1987, pp. 195-240.
28. Besl PJ, Surfaces in Range Image Understanding , Springer-Verlag, New York, 1988.29. Koenderink JJ, van Doorn AJ, “Surface Shape and Curvature Scales”, Image and Vision Computing , Vol 10
No 8, Butterworth-Heinemann, 1992, pp. 557-565.30. Marr D, Vision, WH Freeman and Co., New York, 1982.31. Geisen G, Mason GP, Houston V, Whitestone J, McQuiston B, Beattie A, “Automatic Detection,
Identification, and Registration of Anatomical Landmarks”, Proc. 39th Annual Meeting of the HumanFactors and Ergonomics Society, Vol 2, The Society, San Diego, 1995, pp. 750-753.

32. Lewark EA, Nurre JH, “Automated fudicial [sic] labeling on human body data”, Proceedings of SPIE 3313,1998, pp. 82-89.
33. Robinette KM, “The Civilian American and European Surface Anthropometry Resource (CAESAR)Project”, Proceedings of the Workshop on 3D Anthropometry and Industrial Products Design, Laboratoired’Anthropologie Appliqué, Université Paris V, 1998, pp. 18/1-18/3.
34. Pargas R, Staples N, Davis S, “Automated Measurement Extraction for Apparel from a 3D Body Scan”,Optics and Laser Technology, Vol 28 No 2, Elsevier Science, 1997.
35. Certain A, Stuetzle W, “Automatic Body Measurement for Mass Customization of Garments”, Proceedingsof the Second International Conference on 3-D Imaging and Modeling, National Research Council ofCanada, IEEE, 1999, pp. 405-412.
36. Poli R, “Genetic Programming for Image Analysis”, Proceedings of the First International Conference onGenetic Programming, Koza et al (eds.), MIT Press, 1996, pp. 363-368.
37. Harris C, Buxton B, “Low-Level Edge Detection Using Genetic Programming: Performance, Specificity andApplication to Real-World Signals”, Evolutionary Computation in Vision, Elsevier, 1997.
38. Davatzikos C, “Spatial Transformation and Registration of Brain Images Using Elastically DeformableModels”, Computer Vision and Image Understanding, Vol 66 No 2, Academic Press Inc., 1997, pp. 207-222.
39. Brooke-Wavell K, Jones PRM, West GM, “Reliability and Repeatability of 3-D Body Scanner (LASS)Measurements Compared to Anthropometry”, Annals of Human Biology, Vol 21 No 6, Taylor & FrancisLtd, 1994, pp. 571-577.
40. Daanen HAM, “Circumference Estimation Using 3D-Whole Body Scanners and Shadow Scanners”,Proceedings of the Workshop on 3D Anthropometry and Industrial Products Design, Laboratoired’Anthropologie Appliqué, Université Paris V, 1998, pp. 5/1-5/6.
41. Bradtmiller B, Gross ME, “3D Whole Body Scans: Measurement Extraction Software Validation”,International Conference on Digital Human Modeling for Design and Engineering, Society of AutomotiveEngineers, USA, 1999, 1991-01-1892.
42. Gordon CC, Bradtmiller B, Churchill T, Clauser CE, McConville JT, Tebbetts I, Walker RA, 1988Anthropometric Survey of U.S. Army Personnel: Methods and Summary Statistics, Anthropology ResearchProject Inc., Yellow Springs Ohio, 1989.
43. ISO 8559: Garment Construction and Anthropometric Surveys – Body Dimensions, InternationalOrganization for Standardisation, 1989.
44. Volino P., Courchesne M., Magnenat Thalmann N., "Versatile and Efficient Techniques for SimulatingCloth and other Deformable Objects", proc. Siggraph '95, 1995, pp. 137-144.
45. Dekker L, Douros I, Buxton BF, Treleaven P, “Building Symbolic Information for 3D Human BodyModelling from Range Data”, Proceedings of the Second International Conference on 3-D Digital Imagingand Modeling , IEEE Computer Society, 1999, pp. 388-397.
46. Daanen HAM, Brunsman MA, Robinette KM, “Reducing Movement Artifacts in Whole Body Scanning”,Proceedings of the International Conference on Recent Advances in 3D Digital Imaging and Modeling ,IEEE Press, 1997, pp. 262-265.
47. Kunick P, Modern Sizing and Pattern Making for Women’s and Children’s Garments, Philip KunickPublications, 1984.
48. Li P, Jones PRM, “Anthropometry-Based Surface Modelling of the Human Torso”, Computers inEngineering, American Society of Mechanical Engineers, Minneapolis, 1994, pp. 469-474.
49. Nurre JH, “Locating Landmarks on Human Body Scan Data”, International Conference on Recent Advancesin 3D Digital Imaging and Modeling, IEEE, 1997, pp. 289-295.
Copyright © 2022 FDOKUMEN