Recent quantitative changes in the use of modals and quasi-modals in the Hong Kong, British and...
25
1 Recent quantitative changes in the use of modals and quasi-modals in the Hong Kong, British and American printed press: Exploring the potential of Factiva® for the diachronic investigation of World Englishes Dirk Noël The University of Hong Kong Johan van der Auwera University of Antwerp Abstract: This chapter uses Factiva® to examine recent evolution in the occurrence of verbal modal expressions in the Hong Kong newspaper South China Morning Post, in contrast with American and British newspapers. Previous research established that the frequency of the modals is decreasing in both British and American English generally, but increasing within the pages of TIME Magazine. The present research found that American newspaper data on the recent quantitative evolution of the modals parallel the TIME data to a degree, while British newspaper data correspond with data considered to be representative of British English in its entirety. The quantitative evolutions of both the modals and the quasi-modals in the Hong Kong newspaper resemble the ones in the British newspapers. Keywords: modals and quasi-modals, constructional attrition, newspaper language, Hong Kong English, British and American English, Factiva® 1. Background 1 This article ties in with the part of the burgeoning “recent/current change in English” research 2 that is concerned with the general decline, in British and American English, of the frequency of the modal auxiliaries and the concomitant overall rise in these two varieties of the frequency of a mixed bag of verbal modal constructions we will refer to with the term “quasi-modals” 3 (Leech 2003; Smith 2003; Mair & Leech 2006; Leech et al. 2009; Leech 2013; Smith & Leech 2013; Bowie et al. 2013). More specifically, it links up with Peter Collins’s expansion of this research to other Englishes, additional “inner-circle” ones (Australian and New Zealand English), as 1 We are grateful for the feedback received from audiences of oral presentations of this work in the Research Seminar Series of the School of English of the University of Hong Kong on 3 October 2013, and at the Englishes Today 2013 conference held in Vigo, Spain, on 18-19 October 2013, as well as for comments received from the editor of this volume and a number of anonymous referees. Dirk Noël’s research was supported by an allocation from the General Research Fund of the Hong Kong Research Grants Council (Project Code HKU748213H). 2 See Leech et al. (2009) and Aarts et al. (2013), as well as the eight chapters grouped in a section entitled “Observing recent change through electronic corpora” in Nevalainen and Traugott (2012). 3 This term can be traced back to Hakutani and Hargis (1972). Other terms that have been used are “semi-modals”, “periphrastic modals”, “lexical modals”, “emerging modals” and, most recently, “emergent modals”. This last one is the term used in Geoffrey Leech’s latest contributions to thi s strand of research (Leech 2013; Smith & Leech 2013). It is modelled on Krug’s (2000) term “emerging modals” and justified as a deviation from the term he used in earlier work, “semi -modals”, by saying that it “reflects a difference in the set of verbal idioms included in this rather ill-defined category” (Leech 2013, note 2). Smith and Leech (2013: 80, note 20) recognize, however, that the members of this category can only be called “new” constructions in relative terms. We will adopt the somewhat less loaded term “quasi-modals” for that reason.
Transcript of Recent quantitative changes in the use of modals and quasi-modals in the Hong Kong, British and...
1
Recent quantitative changes in the use of modals and quasi-modals in the Hong
Kong, British and American printed press: Exploring the potential of Factiva®
for the diachronic investigation of World Englishes
Dirk Noël
The University of Hong Kong
Johan van der Auwera
University of Antwerp
Abstract: This chapter uses Factiva® to examine recent evolution in the occurrence
of verbal modal expressions in the Hong Kong newspaper South China Morning Post,
in contrast with American and British newspapers. Previous research established that
the frequency of the modals is decreasing in both British and American English
generally, but increasing within the pages of TIME Magazine. The present research
found that American newspaper data on the recent quantitative evolution of the
modals parallel the TIME data to a degree, while British newspaper data correspond
with data considered to be representative of British English in its entirety. The
quantitative evolutions of both the modals and the quasi-modals in the Hong Kong
newspaper resemble the ones in the British newspapers.
Keywords: modals and quasi-modals, constructional attrition, newspaper language,
Hong Kong English, British and American English, Factiva®
1. Background1
This article ties in with the part of the burgeoning “recent/current change in English”
research2 that is concerned with the general decline, in British and American English,
of the frequency of the modal auxiliaries and the concomitant overall rise in these two
varieties of the frequency of a mixed bag of verbal modal constructions we will refer
to with the term “quasi-modals”3 (Leech 2003; Smith 2003; Mair & Leech 2006;
Leech et al. 2009; Leech 2013; Smith & Leech 2013; Bowie et al. 2013). More
specifically, it links up with Peter Collins’s expansion of this research to other
Englishes, additional “inner-circle” ones (Australian and New Zealand English), as
1 We are grateful for the feedback received from audiences of oral presentations of this work in the
Research Seminar Series of the School of English of the University of Hong Kong on 3 October 2013,
and at the Englishes Today 2013 conference held in Vigo, Spain, on 18-19 October 2013, as well as for
comments received from the editor of this volume and a number of anonymous referees. Dirk Noël’s
research was supported by an allocation from the General Research Fund of the Hong Kong Research
Grants Council (Project Code HKU748213H). 2 See Leech et al. (2009) and Aarts et al. (2013), as well as the eight chapters grouped in a section
entitled “Observing recent change through electronic corpora” in Nevalainen and Traugott (2012). 3 This term can be traced back to Hakutani and Hargis (1972). Other terms that have been used are
“semi-modals”, “periphrastic modals”, “lexical modals”, “emerging modals” and, most recently,
“emergent modals”. This last one is the term used in Geoffrey Leech’s latest contributions to this strand
of research (Leech 2013; Smith & Leech 2013). It is modelled on Krug’s (2000) term “emerging
modals” and justified as a deviation from the term he used in earlier work, “semi-modals”, by saying
that it “reflects a difference in the set of verbal idioms included in this rather ill-defined category”
(Leech 2013, note 2). Smith and Leech (2013: 80, note 20) recognize, however, that the members of
this category can only be called “new” constructions in relative terms. We will adopt the somewhat less
loaded term “quasi-modals” for that reason.

2
well as a good selection of “outer-circle” ones (Philippine, Singapore and Hong Kong
English, bundled as Southeast Asian varieties, plus Indian and Kenyan English in
Collins 2009a, with Jamaican English added in Collins & Yao 2012).
The original observations of the attrition of modal auxiliaries and the
simultaneous growth in the frequency of the quasi-modals were first and foremost
based on data from the Brown family corpora, i.e. on a comparison of frequencies in
corpora containing texts published in the early 1960s and the early 1990s which are
considered to be representative of written British and American English (Leech 2003;
Smith 2003). The claim of the declining frequency of the modals was called into
question by Millar (2009), however, on the basis of frequency data from every single
volume of TIME Magazine published between 1923 and 2006. Leech (2011)
subsequently added extra data points to his two original ones, including data from the
turn of the 20th
century, the early 1930s and the second half of the first decade of the
21st century, and insisted that “the modals ARE declining” in “the language as a
whole”, attributing the differences between his and Millar’s results to “the limitation
of Millar’s study to one very particular genre” (Leech 2011: 549). And very recently,
Smith and Leech (2013: 83) have recognized explicitly that “the genre factor deserves
more attention”, which they illustrate on the example of differences in the frequency
climb of have to in the different subcorpora of an extended British branch of the
Brown family corpora, the highest climb being observable in the Fiction subcorpus of
each corpus, and the lowest in the Learned (academic writing) subcorpus.
Previously, only differences in frequencies from spoken and written corpora
had been taken into account in the work by Leech and his associates. In addition to
the Brown family corpora, Leech (2003) also looked at two “mini” spoken corpora
and observed that both the fall in the frequency of the modals and the rise in the
frequency of the quasi-modals during the second half of the 20th
century were steeper
in spoken language than in written language. Mair and Leech (2006) reported that a
comparison of frequency data from written and spoken American English corpora
showed quasi-modals to have a frequency of 62.5% of that of the modals in spoken
language, compared to only 17% in written language. It is on the basis of such results
that the two observed general frequency changes are argued to occur first in the
spoken language and that they are attributed to “colloquialization” when they happen
in the written language (e.g. in Leech 2013). It is on the basis of such results as well
that Collins (2009a,b) felt justified in drawing diachronic implications from frequency
differences between the spoken and written parts of the various national components
of the International Corpus of English (ICE) he made use of in his research. On the
assumption that the developments observed to be taking place in American and
British English are also taking place in other Englishes, the higher the speech to
writing ratio of the quasi-modals, the more closely these varieties resemble the
situation in American English, which is found to be “leading the way” in the rise of
the quasi-modals (Collins & Yao 2012: 46), and the more advanced these varieties are
consequently considered to be in this evolution. Conversely, a high speech to writing
ratio of the modals suggests “that they retain a degree of vitality, and consequently
that their rate of decline may be less marked – or at least delayed” (Collins & Yao
2012: 46).
It goes without saying, though, that claims about language change are best
supported by diachronic data. To date, the compilation of diachronic corpora or
Brown family-like corpora which are representative of specific New Englishes “as a
whole” has only got under way for a couple of such national varieties, however. On
the other hand, one conclusion one could draw from the altercation between Millar

3
(2009) and Leech (2011) is that it does not always make equal sense to make
undifferentiated statements about change in a national variety “as a whole”. Given the
likely importance of “the genre factor” for rates of change, or even direction of
change, descriptive adequacy will in fact be increased by a genre-specific approach.
As part of a more bottom-up tactic, there is no need, therefore, to sit around waiting
for (or to roll up one’s sleeves and start compiling) representative and well-balanced
diachronic corpora of new English varieties before embarking on investigations of
(parts of) their linguistic evolution.4 Other electronic resources might be available that
lend themselves to diachronic linguistic research even though they have not been
designed for that purpose. One of the objectives of this contribution is to explore the
usefulness of one such resource, Factiva®, a business information and research tool
owned by Dow Jones & Co which to our knowledge has to date not been exploited in
published linguistic research.
The main objective of the research reported on here, however, is to find out
whether the frequency of use of verbal modal expressions has recently gone through
the same evolution in Hong Kong English as in the two main metropolitan English
varieties, or “supervarieties”, i.e. British and American English.5 We are focussing on
Hong Kong not just because this is where one of the two authors of this contribution
resides and works, but also because Hong Kong English shows up in a special way in
Collins’s (2009a: 285-286) results: of all the national varieties he looked at, Hong
Kong English not only uses the modals that were included in his investigation most
frequently, almost doubling the frequency of either British or American English, but it
also outnumbers all other varieties except one, American English, in its use of the
quasi-modals that were counted. In other words, judging by these results, Hong Kong
English appears to be a much “modalized” variety. We will specifically focus on the
language of printed news, not just because of the desirability of a genre-based
approach and the availability of data, but also because it will allow comparison with
Millar’s (2009) results.
In the next section we will outline and motivate our research questions in
greater detail. We will then say a bit more about our research tool, Factiva®, and how
we have used it to find answers to our questions (section 3), which will be followed
by a presentation and discussion of the results of the study (section 4). We will
conclude with a short summary and an evaluation of the usefulness of Factiva® for
the investigation of the evolution of linguistic variation between national varieties of
English (section 5).
2. Problem
If the speech to writing ratios of modals and quasi-modals supplied in Collins and
Yao (2012: 46-47) are anything to go by,6 Hong Kong English is quite conservative
4 Mukherjee and Schilk (2012: 196) point out a possible conflict between ideals and reality in corpus-
based diachronic World Englishes research: “Ideally, what should be envisaged is the compilation of
diachronic corpora of New Englishes so that the description of divergence (or convergence) between
varieties across time can be based on direct evidence. It remains to be seen, however, for which
varieties adequate and sufficient data of earlier stages are available.” 5 In doing so, we are adding to the growing body of knowledge on Hong Kong English. Two volumes
on the topic are Bolton (2002) and Setter et al. (2010). 6 The figures supplied in Collins and Yao (2012) are different from those found in Collins (2009a) but
Collins (pers. comm.) has confirmed the more recent ones to be more accurate. It should also be

4
both in its retention of modals in speech, the average ratio being higher than in British
English, and in its adoption of quasi-modals, the average ratio being lower than that of
British English. Such extrapolations of synchronic facts can only be treated as
hypotheses about frequency evolutions, though, and need to be backed up by
diachronic data. The ratios are, moreover, based on frequencies in the spoken and
written sections of the ICE corpora7 used in their entirety, resulting in an abstraction
that can be far removed from what is happening in certain communicative context
types, e.g. from what journalists are doing in their newspapers or news magazines.
Conversely, as Leech (2011: 549) has argued, Millar (2009: 194) appears to
suggest that his finding of an overall pattern of growth of the modals in TIME
Magazine can be generalized, in spite of an explicit statement that “[t]he patterns of
change observed in the TIME Corpus cannot be claimed directly to hold for the
English language as a whole” (Millar 2009: 206). Leech (2011: 550) warns against
such generalizations with the example of the frequency of the progressive in the
Brown and Frown corpora: their Learned (academic writing) sections attest to a
frequency drop of over 20% during the 30 years separating them (1961 – 1991), while
in the two corpora in their entirety there is an increase of slightly over 10%. Biber and
Gray (2013: 106) link up with this exchange between Millar and Leech in an article
that “challenge[s] the assumption that historical change should be documented for the
language as a whole”, arguing that “change should be studied relative to particular
registers, rather than attempting a kind of average for English” because “register is
crucially important as a mediating factor for historical developments”. They support
this with two case studies, one on the 20th
-century evolution of the use of nouns in
different sub-registers of academic writing, and one which is of potential relevance
for what follows because it involves a comparison of the frequency evolution of a
number of constructions (direct and indirect quotation, the passive, noun + of-phrase,
and noun–noun sequences) in TIME Magazine and The New York Times. Another
recent study that connects with the discussion between Millar and Leech is one by
Bowie, Wallis and Aarts (2013), who likewise conclude that “different types of texts
may be undergoing different changes” (Bowie et al. 2013: 90).
Naturally, the relevance of text type/category, genre or register (and sub-
genre/sub-register)8 distinctions is not restricted to the supervarieties of English. As
Mukherjee and Schilk (2012: 194) point out, “while it remains useful to compare
varieties of English in their entireties with each other to identify overarching
intervarietal differences, there is a growing awareness [in New Englishes research]
that no variety is a monolithic entity and that intravarietal variation exists in all new
Englishes, for example between speech and writing […] and between individual
registers […]”. In tune with this awareness, our aim in this chapter is to contribute to
the bottom-up empirical study of the frequency evolution of modals and quasi-modals
in Hong Kong English with a study of this evolution in the Hong Kong broadsheet
press, which in practice amounts to the South China Morning Post newspaper. In
order to determine the significance of this evolution we will contrast it with the
evolution in two British newspapers, The Times and The Guardian, and two American
ones, The New York Times and The Washington Post. Another reference point is
pointed out that they are based on counts for four modals (must, should, will, shall) and four quasi-
modals (have to, have got to, be going to, want to) only. 7 For American English a comparable corpus was used because at the time ICE-US was not in
existence. (At the time of writing the present article only the written part of the corpus has been made
available.) 8 We are treating these as synonymous terms and will continue to use “(sub-)genre”.

5
Millar’s (2009) TIME Magazine-based study. Though news magazines may constitute
a different sub-genre from newspapers (cf. the Biber & Gray 2013 case study
mentioned above), our New York Times and Washington Post data will show whether
this is a relevant distinction with relation to the development we are interested in here.
Our point of departure, however, is Leech’s (2013) most recent data drawn from the
“extended” Brown family corpora.
These data show a consistent drop in the frequency of the modals as a group
(will, would, can, could, may, might, shall, should, must and need) and a consistent
increase in the frequency of the group of quasi-modals considered (BE able to, BE
going to, HAVE to, HAVE got to, WANT to, NEED to, BE supposed to and had better)9 from
the start of the 20th
century to the first decade of the 21st, both in British and in
American English, with the modals group dropping faster than the quasi-modals
group is increasing.10
The frequency of the modals group has always been, and is still,
several times that of the quasi-modals group, though the difference is getting smaller.
In American English the decline in the frequency of the modals is steeper than in
British English, but there is no statistically significant difference between the
increases of the quasi-modals groups in American and British English. Important for
what follows is that the difference between the 1990s (1991) and 21st-century (2006)
data points is consistent with the longer-term evolution.
Turning to individual modals, Leech (2013: 96-99) first repeats the earliest,
2003, observations based on the original Brown family corpora, so comparing 1960s
and 1990s data points only. In American English every modal becomes less frequent,
with medium or low-frequency ones, particularly may, must and shall, dropping the
most. In British English, on the other hand, two high-frequency ones, can and could,
display a slight frequency rise. The American data are then complemented with data
from the Corpus of Historical American English (COHA) for the 1910–2010 period,
and the Corpus of Contemporary American English (COCA) for the 1990–2010
period. The COHA data reveal that the four most common modals, would, will, can
and could, “have on the whole maintained the same frequency over the [20th
] century”,
and that the “twentieth-century record of gradual decline can actually be attributed to
the steady frequency loss of the seven lower-frequency modals, may, should, must,
might, shall, ought (to) and need(n’t)” (Leech 2013: 103). Important for what follows
is the following statement: “the decline which has affected the less common modals
over the century has in the last decade or so [2000-2010] begun to impinge on the four
commonest modals, so that the overall picture is of accelerating decline of frequency”
(Leech 2013: 103). It follows that would, will, can and could are no longer
maintaining their 20th
-century frequency. The COCA data, which also include spoken
data, do not reveal a drop in the frequency of can and could between 1990 and 2010,
however. They do for will and would, but Leech’s (2013: 104) Figure 6 shows the
decline of would to have halted in the second half of the first decade of the present
century. Leech (2013: 104) also mentions that might, and also can and could, “have
survived at roughly the same level of frequency” during the 1990–2010 period.
Leech (2013) did not look for quasi-modals in the COHA and COCA corpora.
The explanation for this is that he turned to these corpora to check Millar’s (2009)
TIME corpus-based claim that the frequency of the modal group was growing rather
than dropping, while Millar did not disagree with him on the frequency development
of the quasi-modal group. About the quasi-modals, Millar (2009: 204) simply states
9 Small caps indicate lemma forms that can inflect.
10 Leech (2013: 99) does not provide exact frequencies, only a chart, but for reasons we will explain in
the next section, token frequencies are not relevant to this study.

6
that all the ones he looked for (HAVE to, WANT to, BE going to, used to, NEED to, HAVE
got to and had better) “have risen considerably in frequency” in TIME Magazine
between 1923 and 2006, pointing out that in the case of need to “the increase is
almost tenfold”. Calculating the difference between the figures he presents in his
Table 8 for the 1990s and 2000s — because this difference will be relevant for a
comparison with our data — we end up with the results in the one but last column of
Table 1.
1990s 2000s difference significance
HAVE to 554 660 +19.13% p < 0.01
WANT to 474 649 +36.92% p < 0.0001
BE going to 173 227 +31.21% p < 0.01
NEED to 134 223 +66.42% p < 0.0001
used to 125 140 +12% n.s.
HAVE got to 23 30 +30.43% n.s.
had better 11 12 +9.09% n.s.
Table 1: Percentage difference between Millar’s (2009: 204) 1990s and 2000s
frequencies (per million words) for quasi-modals (n.s. = no statistically significant
difference, i.e. p > 0.05)11
We can observe that the four highest-frequency ones of the quasi-modals considered
kept on rising in TIME Magazine between the last decade of the previous and the first
decade of the current century, NEED to the most, the increase of the lower-frequency
ones not being statistically significant.
Where Millar (2009) differs from Leech (2003, 2013) is on the matter of the
overall frequency evolution of the modal group, which Millar found to be a rising
rather than a falling development, with an overall frequency increase of 22.9%
between 1923 and 2006. But not all modals are observed to grow more frequent.
Those that definitely do are can, could and may, two of which, can and could, were
not found to decrease by Leech (2013) either, but to maintain their frequencies in the
COHA data. However, shall, ought and must “show a considerable decline in
frequency” in TIME Magazine as well (Millar 2009: 199). If we again calculate the
difference between the 1990s and 2000s figures, presented in Millar’s Table 3, what
we get is the percentage difference in the one but last column of Table 2.
11
See the Methodology section of the chapter (section 3) for the statistical significance testing method
that was employed.

7
1990s 2000s difference significance
will 2,273.23 2,362.52 +3.93% n.s.
would 1,797.03 1,693.19 -5.78% n.s.
can 1,475.95 1,777.07 +20.40% p < 0.0001
could 1,378.39 1,342.56 -2.60% n.s.
may 937.08 931.91 -0.55% n.s.
should 521.46 593.27 +13.77% p < 0.05
might 474.23 433.34 -8.62% n.s.
must 306.69 250.59 -18.29% p < 0.05
ought 34.9 27.65 -20.86% n.s.
shall 16.09 9.26 -42.45% n.s.
Total 9,215.05 9,421.36 +2.24% n.s.
Table 2: Percentage difference between Millar’s (2009: 199) 1990s and 2000s
frequencies (per million words) for modals
Judging by the data in Table 2, the growth of the modal group in TIME Magazine has
slowed down considerably. In fact, one can hardly consider there to be any collective
growth any more. Only can appears to continue to increase in frequency around the
turn of the century, and the frequency of should has increased more in this period than
in the whole 1923-2006 period considered by Millar. Could and may seem to have
stabilised. Must is still falling. The large percentages in the case of shall and ought are
deceptive: there is no statistically significant decrease any more.
We can now ask to what extent the recent frequency evolution of modals and
quasi-modals in American, British and, of course, Hong Kong newspapers conforms
to these data. This very general question can be broken down into a more specific
series of logically ordered and motivated questions:
1. Do the American newspaper data conform more to Millar’s TIME Magazine
data than to Leech’s American language-as-a-whole data or vice versa? If the former
is the case, genre can indeed be said to play a role in the frequency evolution of verbal
modal expressions.12
However, lack of conformity between the newspaper data and
the TIME data might also point to the relevance of sub-genres. This leads us to
question 2.
2. Do the American newspaper data conform to each other more than they do to
the TIME Magazine data? If they do, newspapers constitute a sub-genre of the news
genre that can be relevantly distinguished in the frequency evolution of verbal modal
expressions.
3. Do the British newspaper data conform more to Leech’s British language-as-a-
whole data or to Millar’s TIME Magazine data? If the former, the geographical factor
is more important than the genre factor in the frequency evolution of verbal modal
expressions. This can be confirmed or disconfirmed by question 4.
4. Do the British newspaper data conform to each other more than they do to
American newspaper data? If so, the frequency evolution of verbal modal expressions
in newspapers is national variety-specific.
5. The relative importance of variety and genre having been established through
the answers to questions 1 to 4, we can finally ask: To what extent do the Hong Kong
12
We are using the term “genre” because this is the term used in the research we are connecting with.
Newspapers can be argued to comprise many different genres, however.
8
newspaper data on the frequency of the evolution of verbal modal expressions
conform to the British and American ones?
3. Methodology
As announced above, frequency data were drawn from five newspapers: two
American ones, The New York Times (henceforth, NYT) and The Washington Post
(henceforth, WP); two British ones, The Times and The Guardian; and the Hong Kong
South China Morning Post (henceforth, SCMP). These were all searched using
Factiva®, an information service product of the American publishing and financial
information firm Dow Jones & Company, which became a subsidiary of Rupert
Murdoch’s News Corp in 2007. On its homepage (www.dowjones.com/factiva/, last
accessed on 1 July 2013), Factiva is described as “the world’s most important
collection of news”, which “unlocks the paywall to critical business facts” by
accessing “thousands of sources in 28 languages from nearly 200 countries”.
Basically, it is a search engine that targets certain sources and whose search results
are texts that hopefully contain the “business facts” its corporate or academic
subscribers are looking for. However, since its search interface is, naturally, a text-
based one, there is no reason why, in academic institutions with a subscription to the
product, its use should be restricted to scholars in business looking for business facts.
In fact, with its options to search for “All of these words”, “At least one of these
words”, “None of these words” and “This exact phrase”, this interface will look very
familiar and useful to many a corpus linguist.
As will be obvious from the above, Factiva was not designed for linguistic
research, though, and the query results consequently do not come in the form of
concordance lines or token frequency counts. As just implied, they come in the form
of texts in which the search terms occur, but the search engine also counts these texts.
In other words, it provides a frequency measure that is known in corpus linguistics as
the “dispersion” of the query expression, albeit a very primitive version of it. In recent
literature dedicated to various (more sophisticated) measures of dispersion it is
considered to be a better measure of the entrenchment of an expression in a language
than raw token frequency because it disregards frequency that results from repeated
use of the query expression in only a subset of texts (see Gries 2008, 2010; Chesley &
Baayen 2010). This was not a relevant consideration in our choice of data source,
however, and indeed the kind of quantitative information Factiva can provide also has
drawbacks. In the case of frequent expressions, for instance, many occurrences will
remain uncounted, since if they occur more than once in a text they are only counted
once, and consequently the quantities generated cannot simply be put next to the
frequency-per-million-words data cited above. However, this is not to say that the two
different kinds of data do not allow any kind of comparison. If one may assume that
verbal modal expressions are not restricted by ideational text content in the same way
as certain lexis, relative differences and fluctuations in token frequency are expected
to be paralleled by relative differences and fluctuations in dispersion rates, provided
the data sources are large enough. In the Results section of this paper we will not
only compare dispersion data drawn from Factiva, we will also put these next to
frequency data from Millar’s study, because sadly Factiva does not provide access to
TIME Magazine and consequently dispersion data could not be collected for it in the
same way. The reader should keep in mind the different nature of the TIME data, but
we believe their comparison is justified, for the reason stated in this paragraph.

9
Very useful to the researcher of linguistic change is that the Factiva search
interface allows one to specify a date range for the sources accessed. The digital age is
still very new, however, and that means we cannot go back in time very far when
using this search engine to access digital versions of newspapers. In the case of the
SCMP, for instance, the furthest we can go back is 1989, and Factiva only started the
indexing of the two other Hong Kong English language newspapers, The Standard
and China Daily Hong Kong Edition in 2002 and 2010 respectively. This is the reason
we could only include one Hong Kong data source in this study.13
It is also the reason
we can only cover the last period included in Millar’s (2009) and Leech’s (2011, 2013)
research, roughly corresponding to the last decade of the 20th
century and the first
decade of the 21st.
To do so we picked three data points: 1990, 2000 and 2010. Each of these
three volumes of each of the five newspapers we are interested in was searched for the
textual occurrence of the modals can, could, may, might, must, ought to, shall, should,
will and would, and for a set of quasi-modals that is the union of the sets mentioned in
Millar (2009) and Leech (2013), viz. (BE) going to, HAVE to, (HAVE) got to, NEED to,
WANT to, BE supposed to, used to and BE able to. Only full forms of the contractible
forms were included in the searches. The query expressions for the periphrastic forms
only included the invariable parts of these forms, e.g. “supposed to” in the case of BE
supposed to. Need(n’t) was not included in the modal set because the Factiva search
system does not make it possible to automatically separate need from need to, but as
shown by Millar’s (2009) and Leech’s (2013) data need is the modal with the lowest
frequency, so that its omission will not have had a great impact on the results.14
The quantitative data Factiva can generate are limited to the count of the texts
in which the query term occurs. It does not tell one how many texts were searched. To
be able to compare and interpret the figures generated we therefore needed to find a
way to limit our searches to a known number of texts. We decided to do this by first
searching each of the three volumes of each publication for both a definite and an
indefinite article, which produced a figure representing the total number of texts in
each volume. We then included definite and indefinite articles in the queries for each
modal and quasi-modal expression, which limited these searches to the texts earlier
determined to constitute the total number of texts. The dispersion rate generated could
subsequently be expressed as a percentage share of the total number of texts. Our
comparisons, in the next section, of the dispersion of individual expressions between
data sets, i.e. between publications and between different volumes of each publication,
will be based on these percentages. As in the research by Leech and Millar we
connect with, the log likelihood test was used to determine the statistical significance
of dispersion rate differences, making use of Paul Rayson’s online log likelihood
calculator (http://ucrel.lancs.ac.uk/llwizard.html).
Another kind of quantitative data we will make reference to for the
comparison of data sets are two ratios: the ratio of the total of the dispersion figures
for all modals to the total number of texts, and the ratio of the total of the dispersion
figures for all quasi-modals to the total number of texts. The higher these ratios, the
higher is the dispersion of the group as a whole. The smaller the difference between
the two ratios, the more the dispersion rates of the two groups have come together.
13
As a Hong Kong edition of a “mainland” Chinese newspaper the status of China Daily Hong Kong
Edition as a Hong Kong newspaper is doubtful anyway. 14
Since the Factiva search engine was not designed for corpus linguistic research purposes, it does not
filter out the nouns can, must, might and will, nor cases of going to and used to where the infinitive is
purposive, or where to is a preposition. There is some noise in the quantitative data, therefore.

10
4. Results and discussion
4.1. “American English”
In line with the logical order of the research questions formulated at the end of section
2, we will first present and discuss the American data from The New York Times
(Table 3) and The Washington Post (Table 4).
[@@ TABLES 3 AND 4 TO BE INSERTED AROUND HERE]
A first observation we can make is a reassuring one with respect to the amount of trust
we can invest in our dispersion data vis-à-vis token frequency data. The frequency
rank order of the expressions listed in Tables 3 and 4 closely resembles that of
Leech’s (2003, 2013) and Millar’s (2009) data. In the case of the modals this is:
would/will > can > could > may > should > must/might > ought > shall. The slashes
indicate variation between Leech’s (2003) 1990s language-as-a-whole Frown data and
Millar’s 1990s–2000s TIME data. In Frown would is the most frequent modal and in
TIME will heads the list. Must is more frequent than might in Frown, but it is the other
way round in TIME.
The rank order in our WP data exactly mirrors that of TIME. In the case of
NYT, there is no significant difference between will and would in 1990, but would
instead of will comes out on top from 2000 (p < 0.001) as a result of a rise in the
frequency of would, the frequency of will staying stable. Judging by Leech’s (2013:
104) Figure 6, which represents the frequency change of the modals in the later 20th
and early 21st century based on COCA data, will was first on top of would, but they
changed places in the latter half of the first decade of the present century as a result of
a drop in the frequency of will. The position of would with relation to will in NYT is
therefore the same as in American English “as a whole”, unlike in WP and TIME, but
apparently as a result of a different change. In WP will has risen and would has
dropped, as they have done slightly, but not statistically significantly, in TIME
between the 1990s and 2000s (see Table 2). As to the relative positions of must and
might, these are the same in NYT, WP and TIME, might being the more frequent
modal, but judging by that same Figure 6 in Leech (2013), this is also what turned out
to be the case in the language as a whole as a result of a drop of must.
Continuing this comparison of the dispersion/frequency evolution of the
modals in American English during the previous two decades we can observe that can
increases in NYT, WP and TIME, while it stays stable in the COCA data. Could rises
in both NYT and WP, while it does not in TIME and COCA. However, it should be
observed perhaps that unlike in NYT, where there is a steady increase, the overall
increase between 1990 and 2010 in WP is the result of sharp increase between 1990
and 2000 followed by a less steep decrease between 2000 and 2010. May first rises
but then drops more steeply in WP and first rises only slightly and then stays stable in
NYT, while it stays stable in TIME and drops in COCA. Should increases in NYT, WP
and TIME, but decreases in COCA. Might rises in both NYT and WP, as it does very
slightly in COCA, but drops unsignificantly in TIME. Must seems to drop everywhere,
as do ought and shall, but the latter two do not do so in a statistically significant
fashion in TIME, and the drop of the first one is not statistically significant in WP.

11
The picture that emerges from this is the following. When comparing the start
point and the endpoint of the twenty-year period under consideration, the evolution of
the dispersion of the modals in the previous two decades is more often the same in
NYT and WP than it is different, but the development is more linear in NYT than in
WP. When the end result is the same in both papers, the evolution is not consistently
in line with that in TIME. When the two newspapers do not show the same evolution,
neither of them is consistently in line with either TIME or the language as a whole. In
other words, as far as the very recent evolution of individual modals in the American
printed press is concerned we can conclude there to be more sub-genre consistency
between the two newspapers than genre consistency with TIME. This is visualized in
Table 5, in which the shaded cells shows where the two newspapers are similar and
which of their similarities are shared with TIME.
NYT WP TIME
will
would
can
could *
may
should *
must
might
shall
ought
Table 5: Similarities in the direction of the dispersion/frequency evolution of the
modals from 1990 to 2010 between American printed news publications.
= rising dispersion/frequency (p < 0.0001, unless specified otherwise)
= falling dispersion/frequency (p < 0.0001, unless specified otherwise)
= no statistically significant difference
* p < 0.001 p < 0.05
However, when we consider the modals as a group by looking at the modals-
to-text ratios,15
we notice that there is a steady increase in the use of modals in NYT
(from 2.81 to 2.99), and that there is an overall increase in WP as well (from 2.93 to
3.1) but that this is the result of a fairly steep rise (from 2.93 to 3.43) between 1990
and 2000 followed by a more gentle fall (from 3.43 to 3.1) between 2000 and 2010.
WP had more modals than NYT in 1990, and the difference between the two
newspapers had grown bigger in 2000, but they had converged considerably by 2010.
It remains to be seen whether the change in the evolution in WP is a case of genre
convergence, but the fact is that the moderate increase between the start and the end
of the twenty-year period considered conforms more to the development in TIME (see
Table 2) than that in American English “as a whole”.
Turning to the field of the quasi-modals, we can observe exactly the same
developments. There is an overall increase in the use of quasi-modal expressions
between 1990 and 2010, which in the case of NYT is a steady increase (from a ratio of
15
Given that we are dealing with dispersion figures rather than token frequencies, this should be read
as “texts with at least one modal of a certain kind”-to-text ratio.
12
0.98 over 1.17 to 1.21) and in the case of WP again the result of a sharper increase
(from 1.14 to 1.48) followed by a less steep decline (from 1.48 to 1.22). Here too NYT
is behind WP at the start of the period, but the two newspapers have very much
converged in 2010.
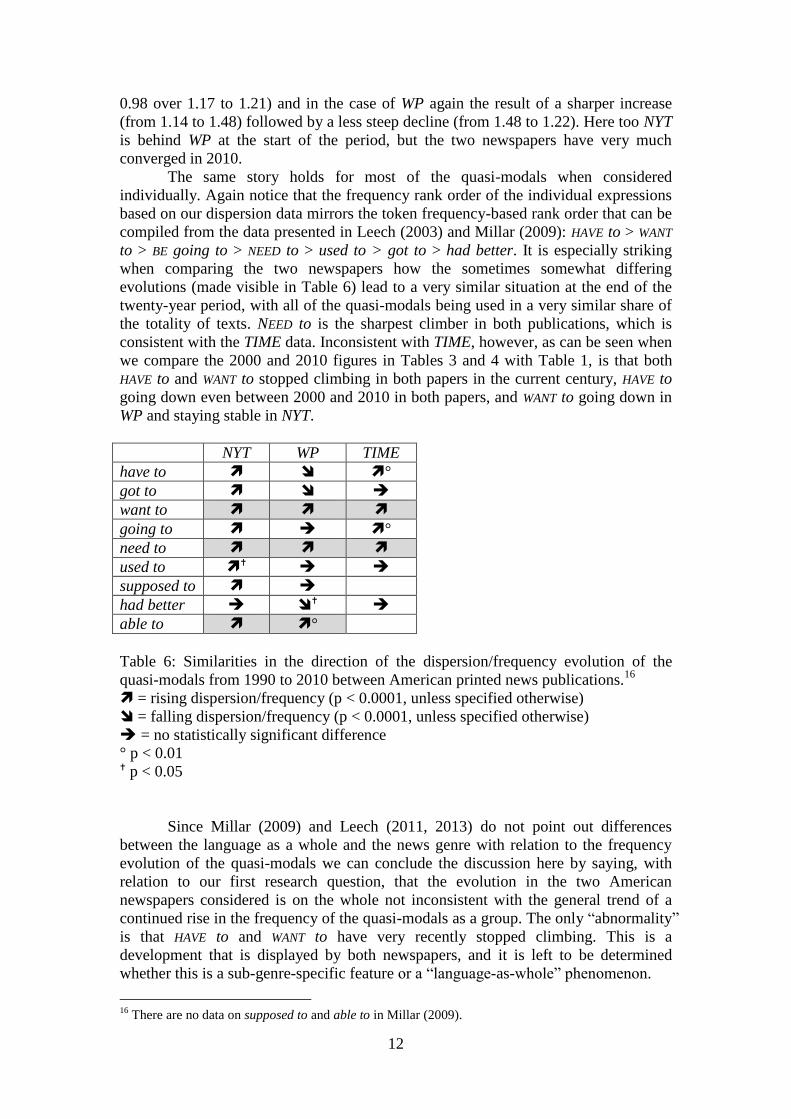
The same story holds for most of the quasi-modals when considered
individually. Again notice that the frequency rank order of the individual expressions
based on our dispersion data mirrors the token frequency-based rank order that can be
compiled from the data presented in Leech (2003) and Millar (2009): HAVE to > WANT
to > BE going to > NEED to > used to > got to > had better. It is especially striking
when comparing the two newspapers how the sometimes somewhat differing
evolutions (made visible in Table 6) lead to a very similar situation at the end of the
twenty-year period, with all of the quasi-modals being used in a very similar share of
the totality of texts. NEED to is the sharpest climber in both publications, which is
consistent with the TIME data. Inconsistent with TIME, however, as can be seen when
we compare the 2000 and 2010 figures in Tables 3 and 4 with Table 1, is that both
HAVE to and WANT to stopped climbing in both papers in the current century, HAVE to
going down even between 2000 and 2010 in both papers, and WANT to going down in
WP and staying stable in NYT.
NYT WP TIME
have to °
got to
want to
going to °
need to
used to
supposed to
had better
able to °
Table 6: Similarities in the direction of the dispersion/frequency evolution of the
quasi-modals from 1990 to 2010 between American printed news publications.16
= rising dispersion/frequency (p < 0.0001, unless specified otherwise)
= falling dispersion/frequency (p < 0.0001, unless specified otherwise)
= no statistically significant difference
° p < 0.01 p < 0.05
Since Millar (2009) and Leech (2011, 2013) do not point out differences
between the language as a whole and the news genre with relation to the frequency
evolution of the quasi-modals we can conclude the discussion here by saying, with
relation to our first research question, that the evolution in the two American
newspapers considered is on the whole not inconsistent with the general trend of a
continued rise in the frequency of the quasi-modals as a group. The only “abnormality”
is that HAVE to and WANT to have very recently stopped climbing. This is a
development that is displayed by both newspapers, and it is left to be determined
whether this is a sub-genre-specific feature or a “language-as-whole” phenomenon.
16
There are no data on supposed to and able to in Millar (2009).
13
Looking at the differences between the modal and quasi-modal ratios in
Tables 3 and 4, we see that this hardly gets smaller in NYT and grows a bit bigger
even in WP. This is definitely not what is expected to be going on in the language as a
whole, where the frequencies of both groups are predicted to be coming closer to each
other, based on the comparison of 1960s and 1990s data (Leech 2003, 2013).
We can conclude this comparison of American newspaper data with TIME
data and data on American English as a whole by answering the first two research
questions listed at the end of section 2 with 1) yes, the newspaper data conform more
to the TIME data than the language-as-a-whole data, and 2) yes, there is a certain
degree of conformity between the two newspapers which distinguishes them from
TIME. (Sub-)genre is therefore a factor in the recent frequency evolution of verbal
modal expressions.
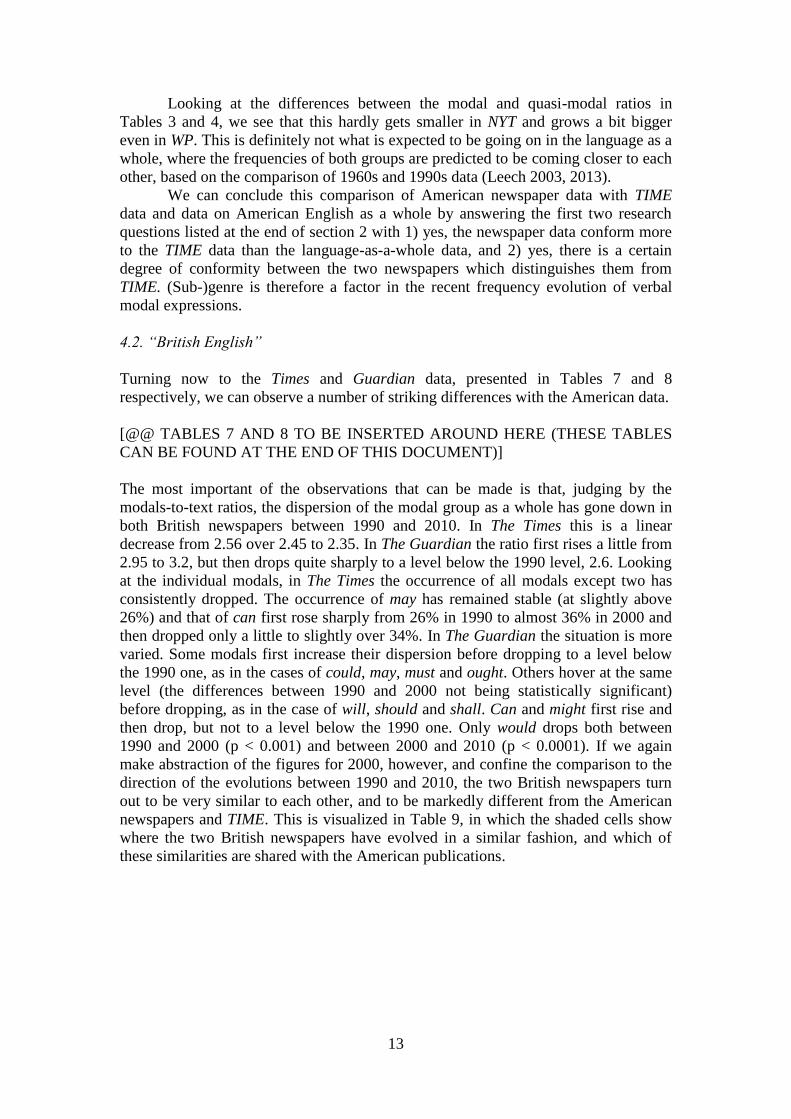
4.2. “British English”
Turning now to the Times and Guardian data, presented in Tables 7 and 8
respectively, we can observe a number of striking differences with the American data.
[@@ TABLES 7 AND 8 TO BE INSERTED AROUND HERE (THESE TABLES
CAN BE FOUND AT THE END OF THIS DOCUMENT)]
The most important of the observations that can be made is that, judging by the
modals-to-text ratios, the dispersion of the modal group as a whole has gone down in
both British newspapers between 1990 and 2010. In The Times this is a linear
decrease from 2.56 over 2.45 to 2.35. In The Guardian the ratio first rises a little from
2.95 to 3.2, but then drops quite sharply to a level below the 1990 level, 2.6. Looking
at the individual modals, in The Times the occurrence of all modals except two has
consistently dropped. The occurrence of may has remained stable (at slightly above
26%) and that of can first rose sharply from 26% in 1990 to almost 36% in 2000 and
then dropped only a little to slightly over 34%. In The Guardian the situation is more
varied. Some modals first increase their dispersion before dropping to a level below
the 1990 one, as in the cases of could, may, must and ought. Others hover at the same
level (the differences between 1990 and 2000 not being statistically significant)
before dropping, as in the case of will, should and shall. Can and might first rise and
then drop, but not to a level below the 1990 one. Only would drops both between
1990 and 2000 (p < 0.001) and between 2000 and 2010 (p < 0.0001). If we again
make abstraction of the figures for 2000, however, and confine the comparison to the
direction of the evolutions between 1990 and 2010, the two British newspapers turn
out to be very similar to each other, and to be markedly different from the American
newspapers and TIME. This is visualized in Table 9, in which the shaded cells show
where the two British newspapers have evolved in a similar fashion, and which of
these similarities are shared with the American publications.

14
Times Guardian NYT WP TIME
will
would
can
could *
may
should *
must
might
shall
ought *
Table 9: Similarities in the direction of the dispersion/frequency evolution of the
modals from 1990 to 2010 between British and American printed news publications.
= rising dispersion/frequency (p < 0.0001, unless specified otherwise)
= falling dispersion/frequency (p < 0.0001, unless specified otherwise)
= no statistically significant difference
* p < 0.001 p < 0.05
Returning to the modals-to-text ratios, and comparing them with the American
ones, we can observe that The Times uses modals the least of all four newspapers
considered so far, its highest rate (2.56) being lower than the lowest rate in the
American newspapers. The Guardian ends up using the modals less than the
American papers as well in 2010, but started from a position comparable to them in
1990. Note that based on Leech’s (2003: 228) language-as-a-whole data British texts
are not expected to contain fewer modals than American ones, so that we could be
dealing with a difference between these national varieties which is genre-specific,
though we cannot determine here whether and to what extent the genre factor might
be operative on both sides of the Atlantic.
We can conclude that as far as the overall evolution of the modals is
concerned, the two British newspapers are very different from the two American ones
in that they both display a drop, which is consistent with the development in both
British and American English “as a whole”. The evolution in The Guardian
resembled that of TIME and the American newspapers more before the turn of the
century, but then “followed” the evolution in The Times.
Turning to the quasi-modals, we can observe a linear increase in the dispersion
of the group in The Times, moving from a ratio of 0.65 over 0.82 to 0.91, while we
can again detect a rise-fall pattern in The Guardian, from 0.81 over 1.23 to 1.02, but
this time the last ratio is not lower than the first one. As in the case of the modals,
these ratios are considerably lower than the American ones, which confirms that the
British newspapers are less modalized than the American ones. As far as individual
quasi-modal expressions are concerned, we can note that the most frequent ones have
not increased any more in the current century. This is true of HAVE to and WANT to in
both newspapers, and also of NEED to in The Guardian.17
Remember that the increase
of the former two had also halted in the two American papers in this century, but that
17
NEED to might also have stabilized in The Times if it had not been for an overuse of the expression
need to know in the 2010 volume as a result of its repetition in various section titles.

15
the available data do not allow us to decide whether this is sub-genre or language-
specific.
If we make abstraction of the year 2000 data again, the picture that emerges is
as shown in Table 10, which reveals the evolution over the twenty-year period in the
two British newspapers to be quite similar to each other and also, to a slightly smaller
degree, to the American NYT, but quite different from the other American
publications.
Times Guardian NYT WP TIME
have to ° °
got to
want to
going to °
need to
used to
supposed to
had better
able to ° °
Table 10: Similarities in the direction of the dispersion/frequency evolution of the
quasi-modals from 1990 to 2010 between British and American printed news
publications.
= rising dispersion/frequency (p < 0.0001, unless specified otherwise)
= falling dispersion/frequency (p < 0.0001, unless specified otherwise)
= no statistically significant difference° p < 0.01 p < 0.05
Unlike in the American newspapers, the differences between the modal and
quasi-modal ratios grow considerably smaller in the two British newspapers, which is
what is expected to be going on still in the language as a whole, though it has only
been observed yet through a comparison of 1960s and 1990s data (Leech 2003, 2013).
Returning to the research questions listed at the end of section 2, we can
conclude this sub-section by answering the third question with yes, the British
newspaper data conform more to the language-as-a-whole data than to the TIME data,
and the fourth one with yes, the British newspapers conform more to each other than
to the American newspapers, both in their level of modalization and in the direction of
change. Both the occurrence and the frequency evolution of verbal modal expressions
in newspapers is therefore specific to national varieties.
4.3. “Hong Kong English”
We have established in the two previous sections that there are not only national
differences between the degree of modalization of newspapers which are unlikely to
be ascribable to differences in the presence of modals and quasi-modals between the
two varieties “in their entirety”, but that there are also very clear national differences
in the quantitative evolution of the modals (if not the quasi-modals to the same extent)
in newspapers which cannot be attributed to differences in that evolution in the
national varieties “as a whole”. (Sub-)genre is therefore a factor both in the degree of
modalization and in the evolution of modalization. Our analysis of the SCMP data

16
presented in Table 11 cannot therefore lead to conclusions about Hong Kong English
generally.
[@@ TABLE 11 TO BE INSERTED AROUND HERE (THESE TABLES CAN BE
FOUND AT THE END OF THIS DOCUMENT)]
As far as the general degree of modalization is concerned, the SCMP comes
closer to the British newspapers than the American ones, both in terms of their modal
group and their quasi-modal group ratios. This numerical closeness to the British data
may be seen to confirm the genre factor because things look somewhat different in the
frequency counts in the entire writing sections of the ICE corpora presented in the
study by Collins and Yao (2012: 45) already referred to above, which indicated Hong
Hong English to be the highest-scoring of all varieties considered in terms of the use
of modals, with a frequency count (of 6656 tokens per million words) considerably
higher than that of British English (6089), which in turn is higher than the American
English one (4843), and its quasi-modals count (1740) being mid-way between the
British English (1534) and the American English (1987) ones. Looking at the
sequence of both ratios in Table 11, we notice that the size of the modal group
diminished between 1990 and 2010 and that the quasi-modal group became more
sizeable, but that neither evolution happened linearly. Both the modals and the quasi-
modals 2000 ratios being the lowest ones, the SCMP was less modalized at the turn of
the century than it was ten years before or ten years later. This fall-rise pattern is quite
unique in that it was not observed in any of the other newspapers we looked at, but
just as we refrained from speculating about the possible causes of the rise-fall patterns
observed above in WP and The Guardian we will not comment on this lack of
linearity.
Considering the entire span of the twenty-year period, the dispersion of the
modal group has dropped and this conforms to what happened in the two British
newspapers rather than the two American ones. The drop in the Hong Kong paper
(0.15) is smaller than in the The Times (0.21) and The Guardian (0.35), however. In
spite of the overall drop, the dispersion of one modal, viz. can, rose considerably (up
from 29.23% to 36.15%) and that of may increased slightly (from 25.51% to 27.63%).
The former happened in the other four papers and in TIME as well, the latter did not,
nor did it in TIME in the 1990s and 2000s, as can be seen in Table 2, though it was a
big riser over the course of the whole period considered by Millar (2009: 199). The
decrease of the modal group as a whole is mainly due to a sharp fall of will (from
64.51% to 56.26%) and would (from 59.1% to 49.28%). These fall steeply in the
British papers as well, unlike in the American ones, but in the British papers the
contribution to the drop of the group is more evenly shared across its members.
Table 12 compares the dispersion/frequency evolution of the individual
modals from 1990 to 2010 in the six printed news publications considered in this
chapter. The shaded cells in the table are an indication of similarities in the evolution
between SCMP and the other publications and they reveal the evolution in SCMP to
be very similar to that in the two British papers, the developments in The Times
corresponding most often to those in SCMP (only three white cells indicating
dissimilarities). Since there is a high degree of similarity between the pattern of
change in the The Times and The Guardian, and since the patterns in the American
publications are quite different, we could say that the SCMP displays a “British”
pattern of change, though it remains to be seen whether this should be argued to be
the result of British influence.

17
SCMP Times Guardian NYT WP TIME
will
would
can
could *
may
should *
must
might
shall
ought *
Table 12: Similarities in the direction of the dispersion/frequency evolution of the
modals from 1990 to 2010 between six printed news publications.
= rising dispersion/frequency (p < 0.0001, unless specified otherwise)
= falling dispersion/frequency (p < 0.0001, unless specified otherwise)
= no statistically significant difference
* p < 0.001 p < 0.05
Turning to the quasi-modal group, we have already observed that the overall
pattern of change is one of a dispersion increase, which is true of all four newspapers
considered in the two previous sections, but the overall level of use in SCMP
approaches that in the two British papers more. Given the low level of modalization in
2000 the increase happens later than in the other papers, however. Making abstraction
of the 2000 figures, the dispersion of HAVE to did not rise between 1990 and 2010,
which is also the case in most of the other papers (NYT being the exception). The
dispersion of the two other “big ones”, WANT to and NEED to, follow the normal rise
pattern, but the lower dispersion one BE going to shows a slight decrease (p < 0.001).
The shaded cells in Table 13 make visible that the evolution of the quasi-modal group
in SCMP corresponds most with the evolution in the two British newspapers.

18
SCMP Times Guardian NYT WP TIME
have to ° ° °
got to
want to
going to * °
need to
used to
supposed to
had better
able to ° °
Table 13: Similarities in the direction of the dispersion/frequency evolution of the
quasi-modals from 1990 to 2010 between six printed news publications.
= rising dispersion/frequency (p < 0.0001, unless specified otherwise)
= falling dispersion/frequency (p < 0.0001, unless specified otherwise)
= no statistically significant difference
* p < 0.001
° p < 0.01 p < 0.05
Again ignoring the figure for 2000, the level of use of the quasi-modal group
as a whole rises less in SCMP (an increase of only 0.11) than in the two British papers
(+0.26 in The Times and +0.21 in The Guardian) and the difference between the level
of use of the modal group and the quasi-modal group becomes only marginally
smaller (-0.26, compared to -0.47 in The Times and -0.56 in The Guardian). In other
words, the two groups appear to be converging less in SCMP than in the two British
papers.
We can conclude that the quantitative evolution of verbal modal expressions
in the Hong Kong newspaper, though resembling the British development more than
the American one, is also markedly different from that in the British papers.
5. Summary and conclusion
This chapter has aimed to contribute to a bottom-up investigation of recent
grammatical change in Hong Kong English through a study of the evolution of the
frequency of use of verbal modal expressions in a Hong Kong newspaper, the South
China Morning Post. This focus on a single (sub-)genre, if not a single source, is
justified by the realization that language change can vary across genres, as was made
clear by the difference in the results of Leech (2003, 2011, 2013) and Millar (2009)
with relation to the 20th
-century evolution of the frequency of modal auxiliaries. We
have established, through a comparison of Millar’s TIME Magazine data with data on
the quantitative evolution of the modals between 1990 and 2010 in two American and
two British newspapers, that the dispersion of the modals as a group is increasing in
American printed news publications generally, in contrast to frequency data drawn
from corpora that are meant to be representative of American English as a whole, and
unlike in the British printed press. Consequently, there is a national variety-specific
genre factor at work here. Moreover, in the specifics of this evolution, the two
American newspapers resemble each other more than they do TIME Magazine.
Likewise, the British newspapers are more like each other than they are like the

19
American newspapers. We can therefore speak of variety-specific sub-genre
differences in the quantitative evolution of modal auxiliaries.
On the whole the Hong Kong newspaper data resemble the British ones quite
closely in the level of occurrence of the modals and quasi-modals, which stands in
contrast to variety-as-a-whole evidence presented in earlier research. Another
similarity is that they also display a general drop in the dispersion of the modals. The
Hong Kong newspaper differs from the British ones in a number of specifics, however.
Not all verbal modal expressions evolve in the same direction in the Hong Kong and
British press, and the convergence of the modal and quasi-modal groups is smaller in
the Hong Kong paper.
This study has revealed the commercial information tool Factiva® to be an
effective instrument for the collection of temporally distinct quantitative data for
certain text genres, which in combination with its global coverage makes it an
excellent tool for the investigation of genre-specific diachronic variation between
different national varieties of English. A major strength is the amount of data it can
generate. Major restrictions are both the very limited number of genres and the as yet
fairly narrow time-span it can cover. The former limitation is not likely to be removed;
the latter is getting better little by little, day by day.
References
Aarts, Bas, Joanne Close, Geoffrey Leech & Sean Wallis (eds.). 2013. The Verb
Phrase in English: Investigating Recent Language Change with Corpora.
Cambridge: Cambridge University Press.
Biber, Douglas & Bethany Gray. 2013. Being specific about historical change: The
influence of sub-register. Journal of English Linguistics 41(2): 104-134.
Bolton, Kingsley (ed.). 2002. Hong Kong English: Autonomy and Creativity. Hong
Kong: Hong Kong University Press.
Bowie, Jill, Sean Wallis & Bas Aarts. 2013. Contemporary change in modal usage in
spoken British English: Mapping the impact of “genre”. In English Modality:
Core, Periphery and Evidentiality, Juana I. Marín-Arrese, Marta Carretero
Lapeyre, Jorge Arús Hita & Johan van der Auwera (eds), 57-94. Berlin: De
Gruyter.
Chesley, Paula & R. Harald Baayen. 2010. Predicting new words from newer words:
Lexical borrowings in French. Linguistics 48(4): 1343-1374.
Collins, Peter. 2009a. Modals and quasi-modals in world Englishes. World Englishes
28: 281-292.
Collins, Peter. 2009b. Modals and Quasi-modals in English. Amsterdam: Rodopi.
Collins, Peter & Xinyue Yao. 2012. Modals and quasi-modals in New Englishes. In
Mapping Unity and Diversity World-wide: Corpus-based Studies of New
Englishes, Marianne Hundt & Ulrike Gut (eds), 35-53. Amsterdam: Benjamins.
Gries, Stefan Th. 2008. Dispersions and adjusted frequencies in corpora. International
Journal of Corpus Linguistics 13,(4): 403-437.
Gries, Stefan Th. 2010. Dispersions and adjusted frequencies in corpora: Further
explorations. In Corpus-linguistic Applications: Current Studies, New
Directions, Stefan Th. Gries, Stefanie Wulff & Mark Davies (eds), 197-212.
Amsterdam: Rodopi.
Hakutani, Yoshinobu & Charles H. Hargis. 1972. The syntax of modal constructions
in English. Lingua 30: 301-332.
20
Krug, Manfred. 2000. Emerging English Modals: A Corpus-based Study of
Grammaticalization. Berlin: Mouton de Gruyter.
Leech, Geoffrey N. 2003. Modality on the move: The English modal auxiliaries 1961-
1992. In Modality in Contemporary English, Roberta Facchinetti, Manfred
Krug & Frank R. Palmer (eds), 223-240. Berlin: Mouton de Gruyter.
Leech, Geoffrey. 2011. The modals ARE declining: Reply to Neil Millar’s “Modal
verbs in TIME: Frequency changes 1923–2006”, International Journal of
Corpus Linguistics 14:2 (2009), 191-220. International Journal of Corpus
Linguistics 16(4): 547-564.
Leech, Geoffrey. 2013. Where have all the modals gone? An essay on the declining
frequency of core modal auxiliaries in recent standard English. In English
modality: Core, periphery and evidentiality, Juana I. Marín-Arrese, Marta
Carretero Lapeyre, Jorge Arús Hita & Johan van der Auwera (eds), 95-115.
Berlin: De Gruyter.
Leech, Geoffrey, Marianne Hundt, Christian Mair & Nicholas Smith. 2009. Change in
Contemporary English. Cambridge: Cambridge University Press.
Mair, Christian & Geoffrey N. Leech. 2006. Current changes in English syntax. In
Handbook of English Linguistics, Bas Aarts & April McMahon (eds), 318-342.
Oxford: Blackwell.
Millar, Neil. 2009. Modal verbs in TIME: Frequency changes 1923–2006.
International Journal of Corpus Linguistics 14(2): 191-220.
Mukherjee, Joybrato & Marco Schilk. 2012. Exploring variation and change in New
Englishes: Looking into the International Corpus of English (ICE) and beyond.
In The Oxford handbook of the history of English, Terttu Nevalainen &
Elizabeth Closs Traugott (eds), 189-199. Oxford: Oxford University Press.
Nevalainen, Terttu & Elizabeth Closs Traugott (eds.). 2012. The Oxford handbook of
the history of English. Oxford: Oxford University Press.
Setter, Jane, Cathy S. P. Wong & Brian H. S. Chan. 2010. Hong Kong English.
Edinburgh: Edinburgh University Press.
Smith, Nicholas. 2003. Changes in the modals and semi-modals of strong obligation
and epistemic necessity in recent British English. In Modality in
Contemporary English, Roberta Facchinetti, Manfred Krug & Frank R. Palmer
(eds), 241-267. Berlin: Mouton de Gruyter.
Smith, Nicholas & Geoffrey Leech. 2013. Verb structures in twentieth-century British
English. In The Verb Phrase in English: Investigating Recent Language
Change with Corpora, Bas Aarts, Joanne Close, Geoffrey Leech & Sean
Wallis (eds), 68-98. Cambridge: Cambridge University Press.

21
1990 1990 % 2000 2000 % 2010 2010 % will 28153 53.44 34100 54.25 27766 53.39 would 27817 52.8 35013 55.7 29036 55.83 can 21524 40.85 27871 44.34 24875 47.83 could 19587 37.18 25244 40.16 22366 43.01 may 17671 33.54 21620 34.39 17784 34.2 might 11557 21.94 14231 22.64 13194 25.37 must 8421 15.98 9092 14.46 6974 13.41 should 12297 23.34 15126 24.06 12665 24.35 shall 404 0.77 504 0.8 256 0.49 ought to 800 1.52 921 1.47 511 0.98
M ratio 2.81 2.92 2.99
have to 15178 28.81 20201 32.14 16027 30.82 got to 1040 1.97 1778 2.83 1237 2.38 want to 11917 22.62 18456 29.36 15168 29.17 going to 6472 12.28 9744 15.5 8473 16.29 need to 5786 10.98 8514 13.54 9394 18.06 used to 4396 8.34 5591 8.89 4567 8.78 supposed to 1321 2.51 2177 3.46 1956 3.76 had better 110 0.21 134 0.21 109 0.21 able to 5247 9.96 6806 10.83 5746 11.05 Q ratio 0.98 1.17 1.21
ratio diff. 1.83 1.75 1.7
text total 52685 62859 52006
Table 3: The New York Times

22
1990 1990 % 2000 2000 % 2010 2010 % will 32233 57.35 31198 66.48 22726 60.1 would 30135 53.62 27797 59.23 19542 51.68 can 24201 43.06 26263 55.96 20403 53.96 could 21917 39 21753 46.35 15292 40.44 may 18990 33.79 18230 38.85 11935 31.56 might 10530 18.74 10624 22.64 9346 24.72 must 9527 16.95 8808 18.77 6181 16.35 should 15251 27.14 14723 31.37 11180 29.57 shall 532 0.95 463 0.99 254 0.67 ought to 1369 2.44 1245 2.65 519 1.37
M ratio 2.93 3.43 3.1
have to 18218 32.41 17914 38.17 11356 30.03 got to 1862 3.31 1846 3.93 1052 2.78 want to 15161 26.97 17505 37.3 11171 29.54 going to 9597 17.08 10137 21.6 6504 17.2 need to 6904 12.28 9327 19.88 7857 20.78 used to 4335 7.71 4421 9.42 2870 7.59 supposed to 1804 3.21 2120 4.52 1218 3.22 had better 131 0.23 147 0.31 68 0.18 able to 5817 10.35 6133 13.07 4181 11.06 Q ratio 1.14 1.48 1.22
ratio diff. 1.79 1.95 1.88
text total 56204 46928 37811
Table 4: The Washington Post

23
1990 1990 % 2000 2000 % 2010 2010 % will 19386 54.88 33057 50.4 45630 49.72 would 18029 51.04 28422 43.33 38436 41.88 can 9206 26.06 23596 35.97 31456 34.28 could 12727 36.03 21911 33.4 30312 33.03 may 9263 26.22 17329 26.42 24352 26.54 might 5508 15.59 10126 15.44 12845 14 must 5190 14.69 8710 13.28 11488 12.52 should 10101 28.59 15866 24.19 19795 21.57 shall 665 1.88 895 1.36 750 0.82 ought to 396 1.12 670 1.02 697 0.76
M ratio 2.56 2.45 2.35
have to 8739 24.74 17239 26.28 21956 23.92 got to 238 0.67 1005 1.53 1753 1.91 want to 3939 11.15 11892 18.13 16803 18.31 going to 1751 4.96 5330 8.13 8730 9.51 need to 3422 9.69 7451 11.36 20056 21.85 used to 1462 4.14 4154 6.33 5661 6.17 supposed to 270 0.76 931 1.42 1489 1.62 had better 46 0.13 121 0.18 127 0.14 able to 2996 8.48 5815 8.87 7304 7.96 Q ratio 0.65 0.82 0.91
ratio diff. 1.91 1.63 1.44
text total 35326 65592 91773
Table 7: The Times

24
1990 1990 % 2000 2000 % 2010 2010 % will 14034 62.79 26791 62.05 42031 50.97 would 13032 58.31 24288 56.26 36934 44.78 can 7517 33.63 21444 49.67 33232 40.3 could 9209 41.21 18686 43.28 29523 35.8 may 6953 31.11 14169 32.82 22485 27.26 might 3661 16.38 9892 22.91 16106 19.53 must 3799 17 7722 17.89 11240 13.63 should 7089 31.72 13669 31.66 20901 25.34 shall 371 1.66 662 1.53 899 1.09 ought to 294 1.32 688 1.59 863 1.05
M ratio 2.95 3.2 2.6
have to 6760 30.25 16090 37.27 23374 28.34 got to 223 1 1320 3.06 2125 2.58 want to 3286 14.7 12060 27.93 18734 22.72 going to 1618 7.24 5711 13.23 10213 12.38 need to 2573 11.51 7137 16.53 13790 16.72 used to 1210 5.41 4098 9.49 6201 7.52 supposed to 314 1.4 1210 2.8 1651 2 had better 45 0.2 119 0.28 111 0.13 able to 2126 9.51 5390 12.48 7614 9.23 Q ratio 0.81 1.23 1.02
ratio diff. 2.14 1.97 1.58
text total 22349 43173 82470
Table 8: The Guardian

25
1990 1990 % 2000 2000 % 2010 2010 % will 12954 64.51 19384 53.74 12663 56.26 would 11869 59.1 19105 52.96 11093 49.28 can 5869 29.23 9327 25.86 8138 36.15 could 6933 34.52 11162 30.94 7517 33.4 may 5123 25.51 8036 22.28 6219 27.63 might 2891 14.4 4090 11.34 2915 12.95 must 2473 12.31 3447 9.56 2774 12.32 should 6006 29.91 7988 22.14 6091 27.06 shall 215 1.07 204 0.57 143 0.64 ought to 144 0.72 120 0.33 61 0.27
M ratio 2.71 2.3 2.56
have to 5434 27.06 6654 18.45 5783 25.69 got to 145 0.72 204 0.57 146 0.65 want to 2712 13.5 5091 14.11 4339 19.28 going to 1181 5.88 1854 5.14 1139 5.06 need to 2089 10.4 3806 10.55 3573 15.87 used to 784 3.9 1397 3.87 1278 5.68 supposed to 179 0.89 389 1.08 380 1.69 had better 15 0.07 44 0.12 26 0.12 able to 1898 9.45 2633 7.3 2072 9.21 Q ratio 0.72 0.61 0.83
ratio diff. 1.99 1.69 1.73
text total 20082 36073 22509
Table 11: South China Morning Post