
Recent and modern marine erosion on the New Jersey outer shelf
22
Recent and modern marine erosion on the New Jersey outer shelf John A. Goff a, T , James A. Austin Jr. a , Sean Gulick a , Sylvia Nordfjord a , Beth Christensen b , Christopher Sommerfield c , Hilary Olson a , Clark Alexander d a Institute for Geophysics, John A. and Katherine G. Jackson School of Geosciences, University of Texas at Austin, 4412 Spicewood Springs Rd., Austin, TX 78759, USA b Department of Geology, Georgia State University, 340 Kell Hall, Atlanta, GA 30303, USA c College of Marine Studies, University of Delaware, 700 Pilottown Road, Lewes, DE 19958, USA d Skidaway Institute of Oceanography, 10 Ocean Science Circle, Savannah, GA 31411, USA Received 15 September 2004; received in revised form 11 February 2005; accepted 16 February 2005 Abstract Recent chirp seismic reflection data combined with multibeam bathymetry, backscatter, and analysis of grab samples and short cores provide evidence of significant recent erosion on the outer New Jersey shelf. The timing of erosion is constrained by two factors: (1) truncation at the seafloor of what is interpreted to be the transgressive ravinement surface at the base of the surficial sand sheet, and (2) truncation of apparently moribund sand ridges along erosional swales oriented parallel to the primary direction of modern bottom flow and oblique to the strike of the sand ridges. These observations place the erosion in a marine setting, post-dating the passage of the shoreface ravinement and the evolution of sand ridges that form initially in the near shore environment. Also truncated by marine erosion are shallowly buried, fluvial channel systems, formed during the Last Glacial Maximum and filled during the transgression, and a regional reflector bRQ that is N ~ 40 kyr. Depths of erosion range from a few meters to N 10 m. The seafloor within eroded areas is often marked by bribbonQ morphology, seen primarily in the backscatter data as areas of alternating high and low backscatter elongated in the direction of primary bottom flow. Ribbons are more occasionally observed in the bathymetry; where observed, crests exhibit low backscatter and troughs exhibit high backscatter. Sampling reveals that the high backscatter areas of the ribbons consist of a trimodal admixture of mud, sand and shell hash, with a bimodal distribution of abraded and unabraded sand grains and microfauna. The shell hash is interpreted to be an erosional lag, while the muds and unabraded grains are, in this non-depositional environment, evidence of recent erosion at the seafloor of previously undisturbed strata. The lower-backscatter areas of the ribbon morphology were found to be a well- sorted medium sand unit only a few 10’s of cm thick overlying the shelly/muddy/sandy material. Concentrations of well- rounded gravels and cobbles were also found in eroded areas with very high backscatter, and at least one of these appears to be derived from the base of an eroded fluvial channel. Seafloor reworking over the transgressive evolution of the shelf appears to have switched from sand ridge evolution, which is documented to ~ 40 m water depth, to more strictly erosional modification at greater water depths. We suggest that this change may be related to the reduction with water depth in the effectiveness of sediment resuspension by waves. Resuspension is a critical factor in the grain size sorting during transport by bottom currents 0025-3227/$ - see front matter D 2005 Elsevier B.V. All rights reserved. doi:10.1016/j.margeo.2005.02.015 T Corresponding author. Tel.: +1 512 471 0476; fax: +1 512 471 0999. E-mail address: [email protected] (J.A. Goff). Marine Geology 216 (2005) 275 – 296 www.elsevier.com/locate/margeo
-
Upload
independent -
Category
Documents
-
view
4 -
download
0
Transcript of Recent and modern marine erosion on the New Jersey outer shelf

Recent and modern marine erosion on the New Jersey outer shelf
John A. Goff a,T, James A. Austin Jr.a, Sean Gulicka, Sylvia Nordfjorda,Beth Christensenb, Christopher Sommerfieldc, Hilary Olsona, Clark Alexanderd
aInstitute for Geophysics, John A. and Katherine G. Jackson School of Geosciences, University of Texas at Austin,
4412 Spicewood Springs Rd., Austin, TX 78759, USAbDepartment of Geology, Georgia State University, 340 Kell Hall, Atlanta, GA 30303, USA
cCollege of Marine Studies, University of Delaware, 700 Pilottown Road, Lewes, DE 19958, USAdSkidaway Institute of Oceanography, 10 Ocean Science Circle, Savannah, GA 31411, USA
Received 15 September 2004; received in revised form 11 February 2005; accepted 16 February 2005
Abstract
Recent chirp seismic reflection data combined with multibeam bathymetry, backscatter, and analysis of grab samples and
short cores provide evidence of significant recent erosion on the outer New Jersey shelf. The timing of erosion is constrained by
two factors: (1) truncation at the seafloor of what is interpreted to be the transgressive ravinement surface at the base of the
surficial sand sheet, and (2) truncation of apparently moribund sand ridges along erosional swales oriented parallel to the
primary direction of modern bottom flow and oblique to the strike of the sand ridges. These observations place the erosion in a
marine setting, post-dating the passage of the shoreface ravinement and the evolution of sand ridges that form initially in the
near shore environment. Also truncated by marine erosion are shallowly buried, fluvial channel systems, formed during the Last
Glacial Maximum and filled during the transgression, and a regional reflector bRQ that is N ~ 40 kyr. Depths of erosion range
from a few meters to N 10 m. The seafloor within eroded areas is often marked by bribbonQ morphology, seen primarily in the
backscatter data as areas of alternating high and low backscatter elongated in the direction of primary bottom flow. Ribbons are
more occasionally observed in the bathymetry; where observed, crests exhibit low backscatter and troughs exhibit high
backscatter. Sampling reveals that the high backscatter areas of the ribbons consist of a trimodal admixture of mud, sand and
shell hash, with a bimodal distribution of abraded and unabraded sand grains and microfauna. The shell hash is interpreted to be
an erosional lag, while the muds and unabraded grains are, in this non-depositional environment, evidence of recent erosion at
the seafloor of previously undisturbed strata. The lower-backscatter areas of the ribbon morphology were found to be a well-
sorted medium sand unit only a few 10’s of cm thick overlying the shelly/muddy/sandy material. Concentrations of well-
rounded gravels and cobbles were also found in eroded areas with very high backscatter, and at least one of these appears to be
derived from the base of an eroded fluvial channel. Seafloor reworking over the transgressive evolution of the shelf appears to
have switched from sand ridge evolution, which is documented to ~ 40 m water depth, to more strictly erosional modification at
greater water depths. We suggest that this change may be related to the reduction with water depth in the effectiveness of
sediment resuspension by waves. Resuspension is a critical factor in the grain size sorting during transport by bottom currents
0025-3227/$ - see front matter D 2005 Elsevier B.V. All rights reserved.
doi:10.1016/j.margeo.2005.02.015
T Corresponding author. Tel.: +1 512 471 0476; fax: +1 512 471 0999.
E-mail address: [email protected] (J.A. Goff).
Marine Geology 216 (2005) 275–296
www.elsevier.com/locate/margeo

over large bedforms like sand ridges. Otherwise, we speculate, displacement of sand by unidirectional currents will erode the
seafloor.
D 2005 Elsevier B.V. All rights reserved.
Keywords: chirp sonar; grain size analysis; bathymetry; backscatter; sand ridges; ribbons
1. Introduction
The New Jersey continental shelf (Fig. 1) has been
studied extensively since the 1960s. It has evolved
into a premier natural laboratory both for investigating
Neogene–Quaternary stratigraphy as a function of
base-level changes, and for studying seabed evolution
in a sediment-starved setting during the most recent
Fig. 1. Bathymetric map of the mid- and outer New Jersey shelf, with contours in meters and artificial illumination from the North. Inset shows
location within the Mid-Atlantic Bight of the eastern United States. Thin-dashed lines indicate deep-towed chirp seismic profiles collected in
2001 and 2002 aboard the R/V Endeavor. Thick-dashed line indicates the location of the bBarnegat CorridorQ studies of Duncan et al. (2000)
and Duncan (2001). Bathymetry is derived from merged NGDC coastal relief model (http://www.ngdc.noaa.gov/mgg/coastal/coastal.html) and
1996 multibeam data (Goff et al., 1999). Locations of seismic images in Fig. 10a and b are shown.
J.A. Goff et al. / Marine Geology 216 (2005) 275–296276
transgression. Seafloor processes active today create
deposits that provide modern analogs for stratigraphy
observed in seismic records and outcrops. For
example, transgressive sand sheets are thought to be
a source for sand bodies that serve as reservoir rocks
for hydrocarbons (e.g., Ainsworth et al., 1999;
Posamentier, 2002). The modern middle and outer
shelf off New Jersey can be thought of as a major
seismic horizon in formation and a principal boundary
in the eventual sequence stratigraphy, waiting only for
the next eustatic sea-level fall to seal its morphology
beneath a new prograding sediment accumulation.
This paper presents the results of a detailed
examination of shelfal erosion that has occurred in
the present transgressive marine setting. Our study
area is located on the New Jersey shelf between the
Mid-shelf (at ~ 50 m water depth) and Franklin (at
~ 100 m water depth) scarps (Fig. 1). Analysis is
based on an extensive new chirp seismic reflection
data set (Fig. 1) combined with analyses of grab
samples and short cores (Fig. 2), in addition to the
multibeam bathymetry and backscatter data (Fig. 2)
collected earlier. The new data have been collected as
part of the Office of Naval Research’s bGeoclutterQ
program, an effort to investigate acoustic returns
recorded on active sonar systems and interpreted as
potential targets (e.g., submarines), but which in fact
arise from the natural environment. Although marine
erosion has been observed on the middle shelf, in
conjunction with continued sand ridge evolution (e.g.,
Stubblefield and Swift, 1976; Snedden et al., 1999),
on the outer shelf we have identified both localized
a
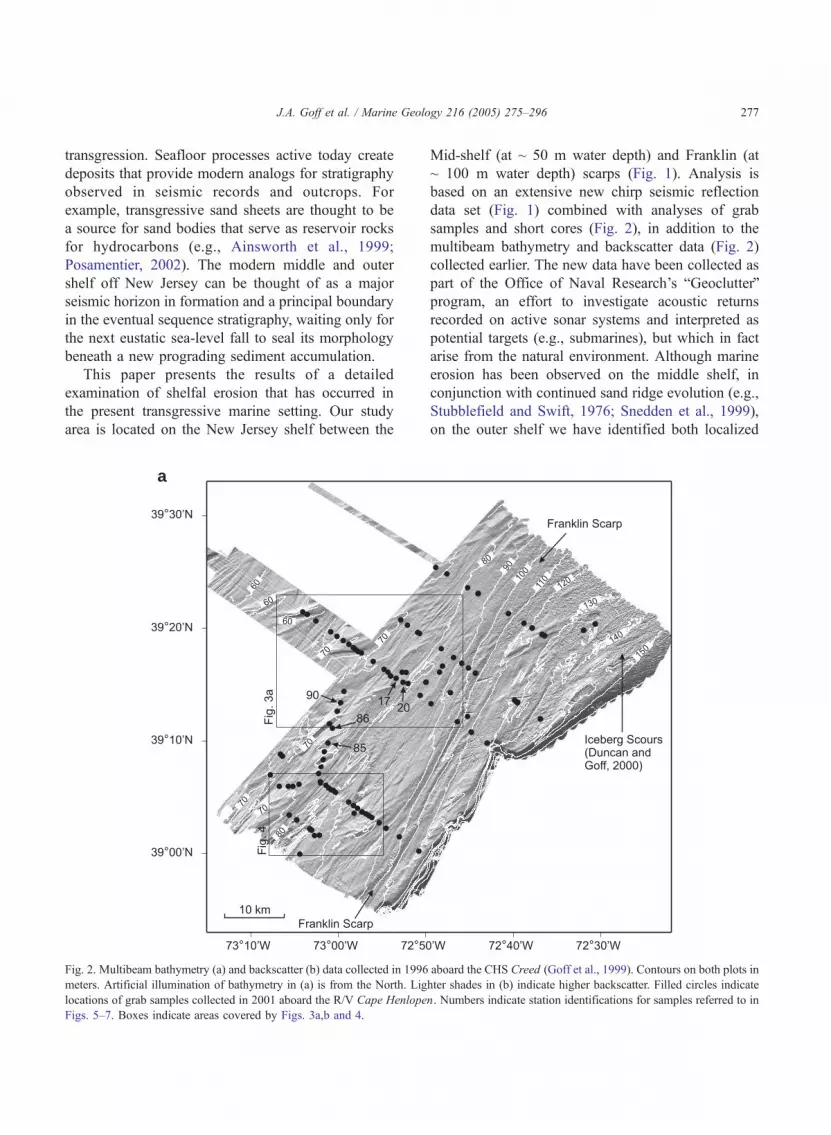
Fig. 2. Multibeam bathymetry (a) and backscatter (b) data collected in 1996 aboard the CHS Creed (Goff et al., 1999). Contours on both plots in
meters. Artificial illumination of bathymetry in (a) is from the North. Lighter shades in (b) indicate higher backscatter. Filled circles indicate
locations of grab samples collected in 2001 aboard the R/V Cape Henlopen. Numbers indicate station identifications for samples referred to in
Figs. 5–7. Boxes indicate areas covered by Figs. 3a,b and 4.
J.A. Goff et al. / Marine Geology 216 (2005) 275–296 277

and widespread erosion that evidently postdates sand
ridge construction and evolution. These results have
important implications for efforts to model the
formation of shelf strata (e.g., Syvitski and Hutton,
2001), and also lead to questions regarding the
preservability of a transgressive sand sheet in the
stratigraphic record (e.g., Posamentier, 2002).
2. Background: sand ridge evolution
The modern seafloor of the New Jersey shelf has,
as its most prominent constituent, sand ridges, which
represent the primary seabed morphology along most
of the Atlantic continental shelf of the United States
(e.g., Swift et al., 1972). Sand ridges are ~ 1–12 m
tall, spaced ~ 1–5 km apart and are ~ 2–20 km long
(e.g., Swift and Field, 1981; Figueiredo et al., 1981;
Stubblefield et al., 1984; Goff et al., 1999). They form
as shoreface-attached bedforms, oriented oblique to
the shoreline, with angles of ~ 10–608 toward the
dominant along-shore current direction (e.g., McKin-
ney et al., 1974; Swift and Field, 1981; Figueiredo et
al., 1981; Snedden et al., 1994).
A number of hypotheses have been proposed for
the formation of sand ridges along the shoreface (e.g.,
Swift and Field, 1981; McBride and Moslow, 1991;
Boczar-Karakiewicz and Bona, 1986; Huthnance,
1982; Trowbridge, 1995), but thus far without
definitive resolution (see Goff et al., 1999 for a
review). Better understood, however, is the observa-
tion that, once formed, sand ridges become detached
from the adjacent shoreface as sea level rises and
continue to evolve in form, size and grain size
distribution (e.g., Stubblefield and Swift, 1976; Swift
and Field, 1981; Figueiredo et al., 1981; Snedden et
al., 1999). In general, as water depth increases, sand
ridges increase in height, width and area, become
b
Fig. 2 (continued).
J.A. Goff et al. / Marine Geology 216 (2005) 275–296278

more asymmetric (with steeper down-current flanks),
and exhibit lower contrast in grain size between their
up-current and down-current flanks with respect to the
primary coastal flow. These evolutionary processes
have been examined in detail during intensive coring
and 3.5 kHz seismic programs on the New Jersey
shelf that penetrated these ridges in 4–40 m water
depths (e.g., Stubblefield and Swift, 1976; Rine et al.,
1991; Snedden et al., 1999). These studies document
ridge evolution by way of dune-forming processes,
i.e., erosion on the up-current flank, and deposition on
the down-current flank. Subsequent enlargement of
sand ridges in deeper waters is presumably accom-
plished through merging of smaller ridges and
excavation of underlying Pleistocene sands. These
studies confirm that swales between ridges are
erosional features, with excavation up to several
meters below the Holocene sand sheet.
The detailed morphology of sand ridges on the
middle and outer New Jersey shelf has been examined
by Goff et al. (1999), based on multibeam bathymetry
and backscatter data. In water depths less than ~ 40–
50 m, sand ridges exhibit a backscatter asymmetry;
higher backscatter, presumably indicative of coarser
grain sizes, occurs on up-current flanks. Such a grain
size asymmetry would be expected for active dune-
form features, with coarser material preferentially on
eroding flanks. This pattern has also been observed in
samples collected on sand ridges in nearshore as well
as mid-shelf settings (e.g., Swift and Field, 1981;
Stubblefield and Swift, 1981). Up-current flanks also
tend to be less steep and exhibit secondary transverse
bedforms, a feature seen commonly in modern sand
ridge systems (e.g., off Sable Island, as documented
by Dalrymple and Hoogendoorn, 1997). As with the
earlier studies referenced above, Goff et al. (1999)
have concluded that sand ridges in mid-shelf water
depths are still actively evolving.
At water depths N 50 m, however, Goff et al.
(1999) have observed that the asymmetry in back-
scatter between up-current and down-current sand
ridge flanks disappears, replaced by a pattern of
greater backscatter (larger grain sizes?) along crests,
and lower backscatter in swales. Such a pattern has
been predicted by Swift and Field (1981) to be
indicative of a moribund sand ridge, based upon their
expectation that crests would gradually become more
winnowed of fine-grained sediments relative to
swales. Furthermore, sand ridges in deeper waters of
the New Jersey shelf display no evidence of either a
consistent sense of asymmetry in their flanks or
secondary transverse bedforms (Goff et al., 1999).
Kenyon et al. (1981) have also noted, in observations
of sand ridges in the North Sea, that sand waves cease
to be present on the backs of sand ridges in 50–60 m
water depths; they have inferred from these observa-
tions that the ridges are moribund at these depths.
Goff et al. (1999) have speculated that these obser-
vations are indicative of a fundamental change in the
evolution of sand ridges with increasing water depth:
in this deep-water stage, sand ridge surfaces become
armored through the winnowing process against
continued dune-form evolution.
3. Seafloor morphology and bottom
characterization
3.1. Multibeam bathymetry and backscatter
A multibeam bathymetry and backscatter survey
was conducted in 1996 on the middle and outer New
Jersey shelf (Figs. 2 and 3; Goff et al., 1999) as part of
the Office of Naval Research’s STRATAFORM
program (Nittrouer, 1999). This survey employed a
95 kHz, Simrad EM1000 multibeam system mounted
on the CHS Creed. Because incidence angles of this
hull-mounted system are typicallyN308, and because
seafloor slopes are generally much less than 18, the
resultant backscatter map is predominantly a response
to variations in surface roughness and/or sedimentary
properties (Jackson et al., 1986), rather than to
bedform slope (Goff et al., 1999).
Two fabrics dominate the seafloor morphology
between ~ 50 m and 100 m water depths: ~ ENE–
WSW trending sand ridges and ~ NE–SW trending
striations, identified as flow-parallel bribbonsQ by Goff
et al. (1999) using the definition of McLean (1981)
(Fig. 3). The dominant current direction is toward the
SW, with peak velocities of N 40 cm/s measured
during several moderate winter storms (McClennen,
1973; Butman et al., 1979). The two seafloor fabrics
do not coexist spatially; ribbons inhabit low-lying
regions between and around clusters of smooth-sided
ridges. A similar relationship was observed by
Reynaud et al. (1999) in a survey of a large (~ 30 m
J.A. Goff et al. / Marine Geology 216 (2005) 275–296 279

high, ~ 5 km wide, ~ 60 km long) sand bank at ~ 140–
170 m water depth west of the English Channel. The
crests of the sand bank appear moribund, with a
coarse grained, high backscattering lag and no active
bedform formation, whereas the lower flanks of the
bank are finer grained, and exhibit abundant dunes
and sand ribbons that appear to be modern responses
to the strong tidal currents that sweep the area.
The low-lying areas of the outer New Jersey shelf
can sometimes be identified as large swales that are,
like the ribbons that floor them, oriented NE–SW,
oblique to the trend of the ridge crests. The ribbon-
Fig. 3. Enlarged portions of multibeam bathymetry (a) and backscatter (b) illustrating several of the primary morphological features discussed in
the text. Locations are shown in Fig. 2. Contours on both plots in meters. Artificial illumination of bathymetry in (a) is from the North. Lighter
shades in (b) indicate higher backscatter. Locations of seismic images in Figs. 9, 11, 12 and 13b are shown in (a).
J.A. Goff et al. / Marine Geology 216 (2005) 275–296280

floored swale identified in the NW corner of Fig. 3a
appears to truncate the sand ridge cluster on its SE
flank. Each type of feature has a characteristic
backscatter response. As noted above, sand ridges
tend to have higher backscatter along their crests (the
sand ridge in the NW corner of Fig. 3a,b is a clear
example), in contrast to sand ridges in shallower
water, where up-current flanks tend to exhibit higher
backscatter (Goff et al., 1999). Ribbons are less
consistent in their response, but crests tend to display
lower backscatter than valleys (Goff et al., 1999).
Clusters of elongated pits ~ 0.5–1.5 km wide, ~ 1–3
km long and up to 10 m deep have been mapped in the
SW part of the multibeam survey (Fig. 4; Goff et al.,
1999). Like the ribbons, these are oriented ~ NE–SW,
along the SW-directed mean current flow direction
(McClennen, 1973; Vincent et al., 1981). The pits are
asymmetric, with steeper slopes on their down-current
ends. These pits represent the strongest evidence,
based on morphology alone, for recent erosion. Goff et
al. (1999) have noted a morphological similarity to
erosional blow-out pits in subaerial desert settings
(e.g., Cooke and Warren, 1973; Thomas, 1989). In
such arid settings, a window in otherwise erosion-
resistant ground vegetation can lead to the formation of
an erosive pit in underlying unconsolidated sands.
These pits migrate downwind by progressively under-
cutting the vegetative cover. This analogy would be apt
in the submarine setting if the subsurface strata are
more easily eroded than seafloor sediment, the latter
perhaps armored as a result of winnowing.
A series of elongated sand-wave fields are present
in the SE corner of Fig. 4, along the top of the
Franklin Scarp. These features, discussed earlier by
Goff et al. (1999), are indicative of high bottom
velocities of ~1 m/s (e.g., Kenyon, 1970; Ashley,
1990). Essentially identical features have been inves-
tigated by Knebel and Folger (1976) near the head of
Wilmington Canyon, ~ 100 km to the SW. Both sets
of features exhibit morphologic and grain size
asymmetries consistent with the SW-directed flow
direction. Knebel and Folger (1976) have inferred that
these sand waves are modern features.
3.2. Grab samples
Nearly 100 grab samples were collected aboard the
R/V Cape Henlopen in 2001 (Fig. 2), then analyzed
Fig. 4. Enlargement of SW portion of multibeam data in a region of elongated scour pits (circled). Location is shown in Fig. 2a. Contours are in
meters, and artificial illumination is from the North. Ribbons, ridges and some outer-shelf sand waves (discussed in Goff et al., 1999) are also
identified. The locations of Core 77 (which sampled clay clasts) and the seismic image in Fig. 14 are also shown.
J.A. Goff et al. / Marine Geology 216 (2005) 275–296 281

by Goff et al. (2004) for grain size distribution. In
correlating measures of the resultant grain size histo-
grams to backscatter intensity, they conclude that the
backscatter response of the seafloor (Fig. 2b) is
dominated by the coarse-grained fraction (grain sizes
larger than ~ 4 mm) over mean grain size. The bright
backscatter areas associated with ribbon morphology
(Fig. 3b) are dominated by shell hash (Fig. 5a), while
a few particularly bright backscatter areas (Fig. 3b)
are mostly gravel (Fig. 5b), with rounded cobbles in
some cases N 5 cm in diameter. Grain size histograms
from both high and low backscatter regions of the
ribbon morphology are shown in Fig. 6. The brighter
backscatter sediments are very poorly sorted, in fact
trimodal in their distribution, with significant percen-
tages of both mud and coarse material in addition to
predominant medium sands. Due to the lack of
modern sedimentation on the shelf (e.g., Swift et al.,
1972), the mud in these samples must have been
derived from previously undisturbed strata at these
locations. The lower backscatter sediments are, in
contrast, composed of well-sorted, medium sands,
with negligible amounts of fine or coarse material.
Eighteen hydraulically dampened (slow insertion)
cores, 24�70 cm in length, were also collected aboard
the Cape Henlopen cruise in 2001. The surficial shell
hash prevented core penetration in some areas. One
core (Station 18; Fig. 2) penetrated 23 cm through the
lower backscatter, medium sand to a muddy, sandy
shell hash layer below. Assuming similar stratigraphy
throughout the ribbon morphology, we infer from this
evidence that this layer of shell hash exists broadly
throughout the ribboned regions, either exposed at the
seafloor or covered in places by a thin layer of
medium sand organized in a flow-parallel trend.
Grain size histograms from sediments gathered at
higher and lower backscatter regions of sand ridge
Fig. 5. Photographs of coarse sieve (N4 mm) material sampled at stations 20 (a) and 90 (b). Note the presence of whole shells, shell hash, and
gravel with occasional cobbles. See Fig. 2 for location.
Fig. 6. Grain-size histograms for Stations 17 and 20, representing,
respectively, low and high backscatter regions of ribbon-type
seafloor morphology (Figs. 2 and 3). Values shown include the
overall mean grain size and the percentages of both fine (b63 Am)
and coarse (N4000 Am) fractions. The high backscatter regions are
trimodal, with significant portions of coarse material (shell hash and
gravel) and mud along with medium sand. The low backscatter
regions are well-sorted medium sand. The two samples display
negligible differences in mean grain size.
J.A. Goff et al. / Marine Geology 216 (2005) 275–296282

morphology are presented in Fig. 7. In these areas,
both the higher and lower backscatter sediment
distributions are unimodal. Compared to the lower
backscatter sediments, the higher backscatter sedi-
ments are deficient in grain sizes b 375 Am and
enriched in grain sizes N 500 Am; this observation is
consistent with Goff et al. (1999) speculation that the
high backscatter crests of these outer-shelf sand ridges
are winnowed relative to intervening swales.
Grab samples from both ribbon and sand ridge
environments (Fig. 2) have also been examined for
foraminiferal and mineralogical content. The ribbon-
dominated environments are characterized by a
bimodal benthic foraminiferal population: an inner
shelf (~ 0–50 m water depth), abraded and probably
relict population, and a middle shelf (~ 50–100 m
water depth) population with better preservation,
probably in situ. The preservation of these samples
is variable; replacement by pyrite occurs and is an
indicator of diagenesis. The mineralogy of samples
within the ribbon environments also reflects at least
two populations of quartz grains: (1) angular and clear
and (2) rounded, frosted and often iron-stained. The
second population is indicative of grains that have
been reworked, either at the present-day seafloor or
possibly within glaciers and then transported to the
shelf as ice-rafted debris. The first population,
however, provides evidence of a fresh source, i.e.,
material derived from previously unreworked sedi-
ments in strata being eroded at the seafloor.
Foraminiferal populations in the sand ridge sam-
ples are either absent or very rare and abraded; where
they occur, they indicate a relict, inner shelf environ-
ment. The mineralogy of the sand ridges is dominated
by subrounded quartz grains with lithic fragments.
Hence, unlike the mixed grains in the ribbon
morphology, grains of the sand ridge sediments at
the seafloor have all been reworked.
4. The shallow stratigraphy of the New Jersey shelf
The interpretation of the New Jersey shelf shallow
stratigraphy (Fig. 8) provides a primary constraint on
the timing of erosion and the nature of material being
excavated for seafloor features. Our understanding of
this stratigraphy has evolved considerably over the
last several decades as more samples have been
obtained and more data have been collected with
newer and higher resolution acoustic imaging sys-
tems. More complete descriptions and references are
available from Duncan et al. (2000), Duncan (2001),
and Gulick et al. (2005).
The bRQ horizon (Fig. 8) is a regionally recog-
nized, high-amplitude reflection that forms the base
of the outer shelf wedge. The origin of this surface is
uncertain, but its age (~ 40 kyr) is well constrained
to predate the latest sea level regression. The outer
shelf wedge is a prograding series of offlapping
strata deposited on the bRQ horizon as a regressive
deposit. The bChannelsQ horizon (bCQ, Fig. 8) marks
an incised valley system that erodes into both the
outer shelf wedge and bR.Q Fill ages of ~ 12.5 kyr
indicate that these channels were active during the
latest lowstand and then filled as the shoreline
migrated through this region. The bTQ horizon (Fig.
8) is an intermittent reflection that, in its most
consistent manifestation, caps channel-fill strata and
occasionally truncates the bChannelsQ horizon. Dun-
can et al. (2000) interpret bTQ as the transgressive
ravinement surface associated with Holocene sea-
level rise. This horizon represents a critical chro-
nostratigraphic boundary: the passage from shoreface
to marine sedimentary environment.
Other than the sediments sequestered in channel
fills, the surficial sand sheet, ranging from ~ 0 to 20 m
Fig. 7. Grain-size histograms for stations 85 and 86, representing,
respectively, high and low-backscatter regions within the sand
ridge-type seafloor morphology (Figs. 2 and 3). Values shown
include the overall mean grain size and the percentages of both fine
(b63 Am) and coarse (N4000 Am) fractions. Compared to the
samples in Fig. 6, these samples are unimodal, though skewed, and
well-differentiated by their mean grain sizes.
J.A. Goff et al. / Marine Geology 216 (2005) 275–296 283

thick, represents the only Holocene deposition on the
New Jersey shelf. Transferred from the shoreface to
the inner shelf during transgression, these sands are
organized primarily into oblique sand ridges. Net
sediment input to the middle and outer shelf is
negligible at present (e.g., Swift et al., 1972);
processes active on the shelf primarily involve
continued reworking and erosion of the sand sheet,
driven by storm waves and bottom currents (e.g.,
Swift et al., 1972).
The seaward edge of the mid-shelf wedge (Fig. 8;
Knebel et al., 1979; Milliman et al., 1990) forms a
prominent topographic feature on the New Jersey
shelf: the Mid-Shelf Scarp (MSS; Fig. 1), or bshoreQ
(e.g., Swift et al., 1980), sometimes referred to as the
Tiger Scarp (e.g., Knebel et al., 1979) or Fortune
bshoreQ (e.g., Dillon and Oldale, 1978). Thought for
decades to represent a fossil shoreface associated
with a sea-level stillstand (e.g., Veatch and Smith,
1939; Emery and Uchupi, 1972; Dillon and Oldale,
1978; Swift et al., 1980), high-resolution seismic
data has since shown it to be depositional in origin
(Knebel et al., 1979; Milliman et al., 1990; Duncan,
2001). Uchupi et al. (2001) have speculated that the
mid-shelf wedge could be a subaerial deposit
associated with massive outflows from breached
glacial lakes along the Hudson Valley that were
known to have occurred, between ~ 19 and 12 kyr,
during glacial retreat. However, using high resolution
chirp data collected along the Barnegat Corridor
where it crosses the scarp (Figs. 1 and 2), Duncan
(2001) ascertained that at least the outer part of the
wedge consists of a prograding sequence that lies
above the bTQ horizon (the bHoloceneQ mid-shelf
wedge in Fig. 8), and should therefore have been
deposited in the transgressive marine environment:
perhaps ~ 9–10 kyr or later based on eustatic curves,
after the postulated lake collapses. The inner part of
the mid-shelf wedge also includes a substantial
thickening of the Pleistocene sediments between
bRQ and bTQ (the bPleistoceneQ mid-shelf wedge in
Fig. 8; Duncan, 2001). Dates for these muddy
sediments (Fig. 8) are derived from Knebel et al.
(1979).
5. Observations related to marine erosion in chirp
seismic data
The seismic data considered here comprise 2-D
ultra-high resolution chirp profiles collected over a
broad region of the middle and outer New Jersey
shelf south of the Hudson Shelf Valley and Canyon
(Fig. 1). Track line spacing varied from 50 m to 1
km. Shallowly buried incised-valley systems, which
were considered as possible sources of acoustic
clutter, were the primary targets of the survey
(Nordfjord et al., 2005). The data were collected
using a deep-towed chirp sonar aboard the R/V
Endeavor cruise EN359 in August–September, 2001.
Additional data in the southern part of the survey
area (Fig. 1) were collected with the same system
aboard Endeavor during cruise EN370 in May, 2002.
This system is well suited for high-resolution
imaging of the shallow, complex late Quaternary
stratigraphy of the New Jersey shelf. The source
emitted swept-frequency signals of 1–4 kHz and 1–
15 kHz. The 1–4 kHz data employed in this study
Fig. 8. Schematic illustration of the primary stratigraphic units and horizons discussed in the text, as interpreted by Duncan et al. (2000) and
Duncan (2001) in the context of radiometric ages available at that time. The profile is based on data along the Barnegat Corridor (Fig. 1),
spanning ~50 km; vertical exaggeration is very high.
J.A. Goff et al. / Marine Geology 216 (2005) 275–296284

have vertical resolution of ~ 20 cm, with a penetration
in places of N 30 m below the sea floor.
Schlumberger’s Geoquest IESXR software was
utilized in the interpretation of seismic profiles and
mapping horizons. In this manuscript, we focus
specifically on seismic evidence for marine erosion
of the outer New Jersey shelf, the most recent stage in
its evolution.
5.1. Outcropping horizons
The truncation of strata at the seafloor provides
direct evidence for erosion. Truncation of the bTQ
horizon in particular indicates erosion in the marine
setting, after the shoreface migrated across the region.
Fig. 9 displays a chirp seismic cross-section through
the eroded flank of a sand ridge, where both the bTQ
and bRQ horizons outcrop at the seafloor. This profile is
adjacent to the Barnegat Corridor profile (Fig. 1)
presented by Duncan et al. (2000), along which the
truncation of these horizons was first documented. In
Fig. 9, we observe the truncation of bRQ by bChannelsQ
incisions, and the capping of those incisions by the bTQ
horizon. (The seismic signal becomes increasingly
attenuated under the sand ridge.) The bTQ and bRQ
horizons outcrop along the NW flank of the sand
ridge, at a ~ 4–5 km-wide, ribbon-floored swale
oriented NE–SW (Fig. 3a). As noted earlier, this
swale is oblique to the more ENE–WSW trend of the
sand ridges. A minimum of ~ 4 m of marine erosion,
the distance between the projected outcrop of bTQ
and the floor of the swale, is documented (Fig. 9).
Steepening of the seafloor occurs between the
outcropping bTQand bRQ horizons, whereas the seafloor
flattens below the bRQ horizon (Fig. 9). This geometry
may be related to the different material properties of the
units bounded by these horizons. Samples taken from
between bTQ and bRQ are mostly fine-grained muds/
clays (Knebel and Spiker, 1977; Buck et al., 1999;
Nordfjord et al., 2002), whereas above bTQ lies the
surficial sand sheet of medium to coarse grains, and
below bRQ are coarse grained and nearly lithified
sediments (Davies et al., 1992, Nordfjord et al.,
2002). If the clays between bTQ and bRQ are not
overconsolidated, they will be more easily eroded than
the sands above and below.Where a more erodable unit
outcrops from below a resistant unit, the seafloor will
have a higher gradient because it is easily excavated
downwards while being constrained from eroding
laterally by presence of the overlying unit. The lithified
coarse sands below bRQ would also clearly impede
further excavation, so the swale will instead grow
laterally by preferential erosion of the finer-grained
unit and undercutting of the resistant sand sheet above.
Another ~ 8–9-km-wide erosional swale is present
seaward of the MSS, north of a sharp bend in its strike
(Fig. 1). Seismic cross-sections across the scarp,
forming the NW flank of the swale, and across the
edge of a sand ridge complex forming the SE flank,
are displayed in Fig. 10. Again, we recognize the three
Fig. 9. Deep-towed chirp seismic image (1–4 kHz) across the SW flank of an erosional swale, which truncates a sand ridge complex. See Fig. 3
for location. Seismic horizons bRQ, bTQ and bChannelsQ (C) are identified. Minimum depth of marine erosion (~4 m) is noted as the difference
between maximum swale depth and projection of bTQ. The steepening of the seafloor between the bTQ and bRQ outcrops is also noted. Depth
conversion is based on water velocity (1500 m/s).
J.A. Goff et al. / Marine Geology 216 (2005) 275–296 285
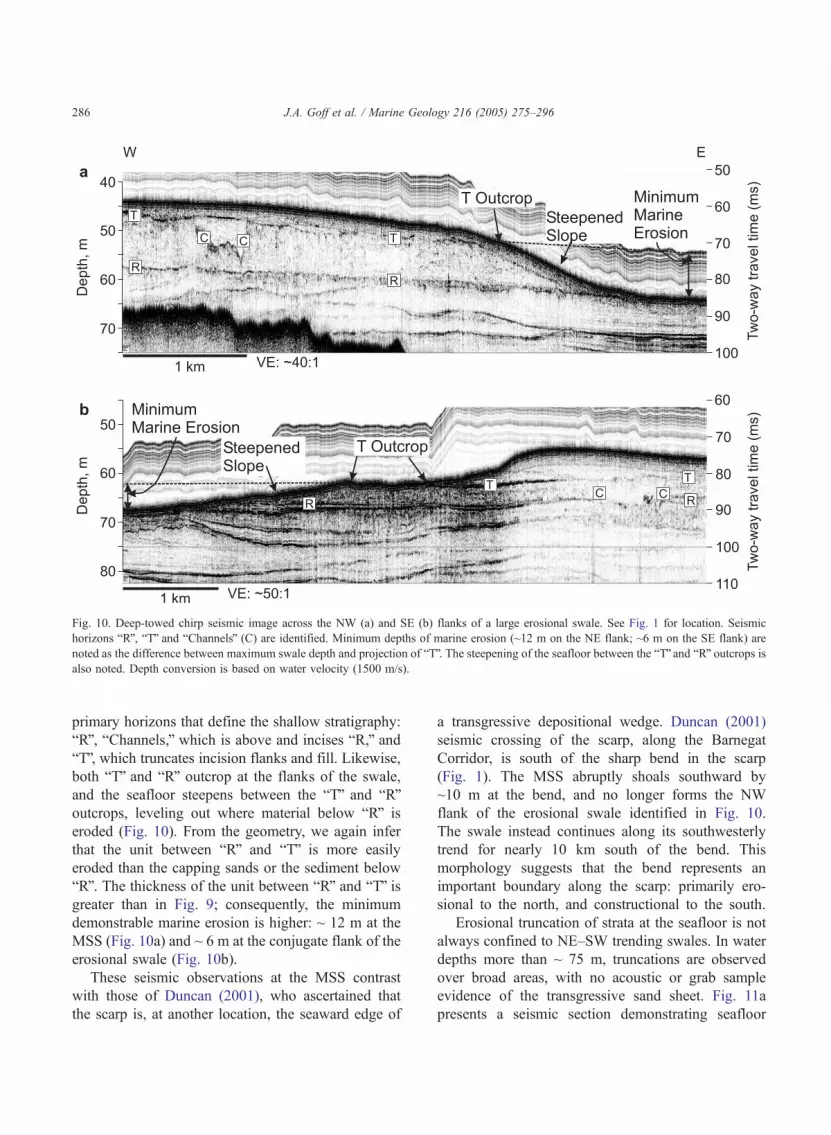
primary horizons that define the shallow stratigraphy:
bRQ, bChannels,Q which is above and incises bR,Q and
bTQ, which truncates incision flanks and fill. Likewise,
both bTQ and bRQ outcrop at the flanks of the swale,
and the seafloor steepens between the bTQ and bRQ
outcrops, leveling out where material below bRQ is
eroded (Fig. 10). From the geometry, we again infer
that the unit between bRQ and bTQ is more easily
eroded than the capping sands or the sediment below
bRQ. The thickness of the unit between bRQ and bTQ is
greater than in Fig. 9; consequently, the minimum
demonstrable marine erosion is higher: ~ 12 m at the
MSS (Fig. 10a) and ~ 6 m at the conjugate flank of the
erosional swale (Fig. 10b).
These seismic observations at the MSS contrast
with those of Duncan (2001), who ascertained that
the scarp is, at another location, the seaward edge of
a transgressive depositional wedge. Duncan (2001)
seismic crossing of the scarp, along the Barnegat
Corridor, is south of the sharp bend in the scarp
(Fig. 1). The MSS abruptly shoals southward by
~10 m at the bend, and no longer forms the NW
flank of the erosional swale identified in Fig. 10.
The swale instead continues along its southwesterly
trend for nearly 10 km south of the bend. This
morphology suggests that the bend represents an
important boundary along the scarp: primarily ero-
sional to the north, and constructional to the south.
Erosional truncation of strata at the seafloor is not
always confined to NE–SW trending swales. In water
depths more than ~ 75 m, truncations are observed
over broad areas, with no acoustic or grab sample
evidence of the transgressive sand sheet. Fig. 11a
presents a seismic section demonstrating seafloor
Fig. 10. Deep-towed chirp seismic image across the NW (a) and SE (b) flanks of a large erosional swale. See Fig. 1 for location. Seismic
horizons bRQ, bTQ and bChannelsQ (C) are identified. Minimum depths of marine erosion (~12 m on the NE flank; ~6 m on the SE flank) are
noted as the difference between maximum swale depth and projection of bTQ. The steepening of the seafloor between the bTQ and bRQ outcrops is
also noted. Depth conversion is based on water velocity (1500 m/s).
J.A. Goff et al. / Marine Geology 216 (2005) 275–296286

truncation of the bChannelsQ horizon, dipping strata
within the outer shelf wedge, and the basal bRQ
horizon. The bTQ horizon outcrops at the NW end of
the section; the surficial sand sheet is otherwise absent
throughout this area with up to ~ 7 m of indicated
minimum marine erosion. We also find that ribbon
morphology (Figs. 2 and 11b) is only present where
the sand sheet is absent; we can therefore use
backscatter data to infer sand sheet absence where
we have no other seismic constraints.
There is no evident correlation between bathymetry
and the alternations of high and low backscatter (Fig.
11b) that define the ribbons here. This observation is
not surprising given the core evidence. As noted
above, the lower backscatter portions of ribbons in the
area covered by Fig. 11 represent a thin (~ 20–30 cm)
layer of medium sand overlying a surficial shell hash
layer that accounts for the high backscatter; this
thickness represents a small contribution to the ~ 1–2
m undulations evident on the profile. However, some
ribbons do exhibit clear bathymetric expressions (Fig.
3a; Goff et al., 1999); these ribbons tend to be more
linear than those that exhibit only a backscatter
signature (see the following section).
5.2. Channel remnants
Erosion of channel-fill strata has resulted in both
bathymetric and backscatter expressions of channels
fills at the seafloor in a few locations. The gravel
mound identified in Fig. 3 is one prominent example.
The mound was imaged by a hull-mounted chirp
system on the R/V Endeavor. These data are not
nearly of the same quality as the towed system, but
they nevertheless reveal primary structure beneath the
mound (Fig. 12): a prominent undulating reflector that
outcrops at the seafloor on either side of the mound.
The depth of this basal reflector is similar to the bases
Fig. 11. (a) Deep-towed chirp seismic image across the landward edge of the outer shelf wedge, which outcrops at or near the seafloor. See Fig.
3 for location. Seismic horizons bRQ and bChannelsQ (C) are identified. Minimum depth of marine erosion (~7 m) is noted as the difference
between maximum swale depth and projection of bTQ. Depth conversion based on water velocity (1500 m/s). (b) Filtered backscatter (solid) and
residual multibeam bathymetry (dashed) values sampled along the same profile as (a), which is within ribbon-type seafloor morphology,
identified by the alternations between high and low backscatter. Bathymetry profile was detrended with a linear regression. No evident
correspondence can be found in this example between backscatter variations associated with ribbon morphology and bathymetric variations.
J.A. Goff et al. / Marine Geology 216 (2005) 275–296 287
of presumed fluvial channels mapped elsewhere in the
survey area (Duncan et al., 2000; Nordfjord et al.,
2005). Subhorizontal reflectors lie above this reflector
within the mound, suggestive of fill strata within
incisions elsewhere; two of these reflectors are also
truncated by the seafloor. Rounded cobbles sampled
from this gravel-prone mound (Fig. 5b) are compat-
ible with the type of lithology expected from the
thalweg of a fluvial channel. All of this evidence
suggests that this structure is the eroded remnant of a
fluvial channel, 2–2.5 km wide, contemporary with
and similar in scale to channels mapped just to the
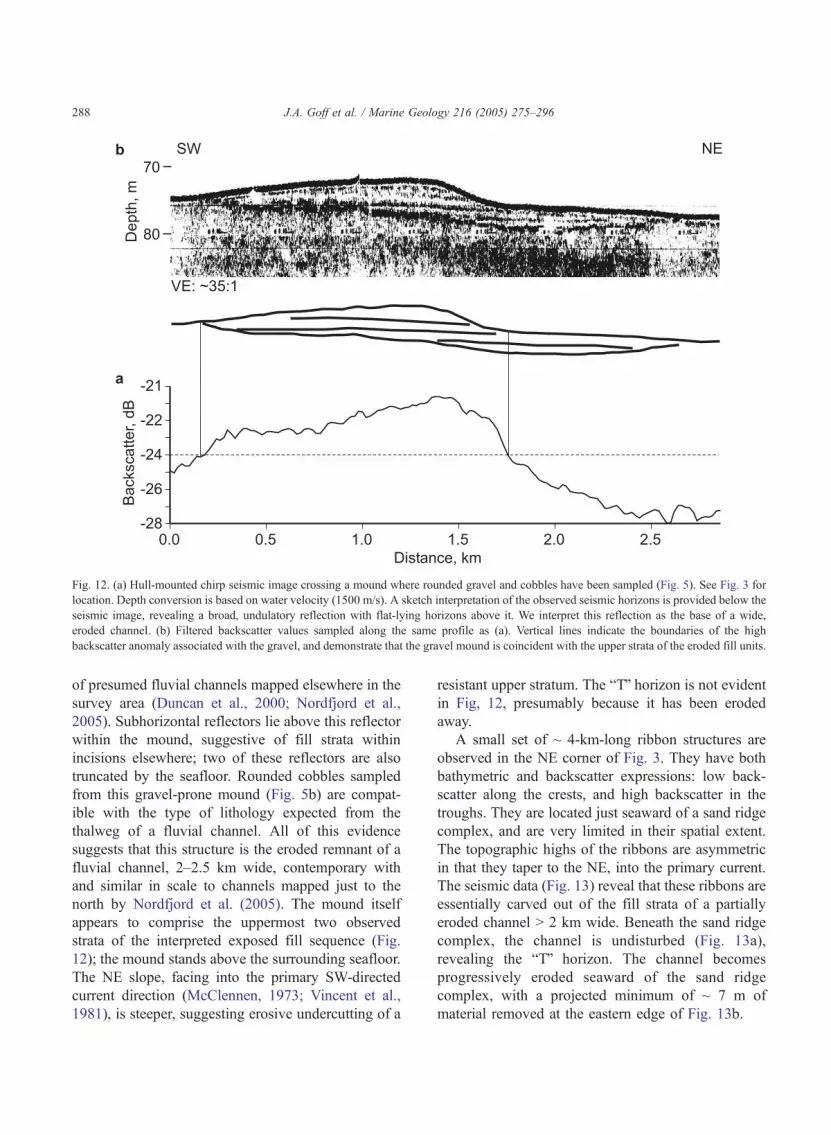
north by Nordfjord et al. (2005). The mound itself
appears to comprise the uppermost two observed
strata of the interpreted exposed fill sequence (Fig.
12); the mound stands above the surrounding seafloor.
The NE slope, facing into the primary SW-directed
current direction (McClennen, 1973; Vincent et al.,
1981), is steeper, suggesting erosive undercutting of a
resistant upper stratum. The bTQ horizon is not evident
in Fig, 12, presumably because it has been eroded
away.
A small set of ~ 4-km-long ribbon structures are
observed in the NE corner of Fig. 3. They have both
bathymetric and backscatter expressions: low back-
scatter along the crests, and high backscatter in the
troughs. They are located just seaward of a sand ridge
complex, and are very limited in their spatial extent.
The topographic highs of the ribbons are asymmetric
in that they taper to the NE, into the primary current.
The seismic data (Fig. 13) reveal that these ribbons are
essentially carved out of the fill strata of a partially
eroded channel N 2 km wide. Beneath the sand ridge
complex, the channel is undisturbed (Fig. 13a),
revealing the bTQ horizon. The channel becomes
progressively eroded seaward of the sand ridge
complex, with a projected minimum of ~ 7 m of
material removed at the eastern edge of Fig. 13b.
Fig. 12. (a) Hull-mounted chirp seismic image crossing a mound where rounded gravel and cobbles have been sampled (Fig. 5). See Fig. 3 for
location. Depth conversion is based on water velocity (1500 m/s). A sketch interpretation of the observed seismic horizons is provided below the
seismic image, revealing a broad, undulatory reflection with flat-lying horizons above it. We interpret this reflection as the base of a wide,
eroded channel. (b) Filtered backscatter values sampled along the same profile as (a). Vertical lines indicate the boundaries of the high
backscatter anomaly associated with the gravel, and demonstrate that the gravel mound is coincident with the upper strata of the eroded fill units.
J.A. Goff et al. / Marine Geology 216 (2005) 275–296288

Fig. 13. Deep-towed chirp seismic image across (a) uneroded and (b) eroded portions of a major trunk channel (Nordfjord et al., 2005). See Fig.
3 for location. Seismic horizons bTQ and bChannelsQ (C) are identified. Minimum depth of marine erosion (~7 m) is noted as the difference
between maximum swale depth and projection of bTQ. Depth conversion is based on water velocity (1500 m/s). (c) Filtered backscatter (solid)
and multibeam bathymetry (dashed) values sampled along the same profile as (b), which is within one of a few regions of the survey where
ribbon-type morphology, identified by the alternations between high and low backscatter, correlates fairly well to bathymetric variations. As
noted with vertical dashed lines, the lowest backscatter anomalies correlate with ribbon crests (marked with connecting vertical lines), likely
indicating that the crests are finer-grained/depositional. See text for additional discussion.
J.A. Goff et al. / Marine Geology 216 (2005) 275–296 289

5.3. Erosion pits
The deep-towed chirp seismic data reveal that the
erosion pits (Figs. 4 and 14) are excavated out of the
laminated strata of the outer shelf wedge, often
creating depressions N 10 m deep. The bChannelsQ
horizon and fill strata are also truncated within some
of the pits. Grab samples within the pits are clay rich.
Around the pits, a surficial sand sheet is not evident
from the seismic data; no bTQ horizon is observed and
the buried channels are truncated by the seafloor. The
seafloor is instead largely covered by ribbon mor-
phology (Fig. 4), alternating between sediment
distributions similar to those shown in Fig. 6.
Abundant coarse material is present at or near the
seafloor. Core 77, taken just south of an erosion pit
field (Fig. 4), penetrated through a ~ 10-cm-thick
surface layer of medium sands and shells to sample
clay clasts mixed with medium sand. Such a
stratigraphy would support our hypothesis for the
formation of these pits as downstream-progressing
features which continue to undermine a surficial
armoring layer. Clay clasts are known to be indicative
of vigorous erosion in the presence of sand, which in
this core may be a remnant of the transgressive
ravinement. Alternatively, Fulthorpe and Austin
(2004) suggest that the vigorous erosion indicated
by Core 77 occurred before the transgression, a result
of possible massive outflows during glacial lake
collapse ~ 14–19 kyr.
6. Discussion
6.1. Timing and extent of marine erosion
Our analysis indicates a genetic relationship
between marine erosion and morphologic structures
oriented along the primary direction of bottom
current flow: large swales that cut across the sand
ridge trend, asymmetric erosional pits and ribbons.
The swales and pits represent direct excavations of
seabed sediment. The large swales are (where
mapped with high resolution swath data) also floored
by ribbon morphology. Our primary stratigraphic
constraint on the timing of this erosion comes from
the truncation of the transgressive ravinement surface
(bTQ) at the seafloor (Figs. 9–11): the erosion
therefore post-dates the passage of the shoreline
and the formation of the Holocene sand sheet. By
this constraint alone, it is possible that the erosion
occurred in the near-shore environment as, for
example, within the swales of near-shore sand ridges,
which are observed in some cases to excavate below
the ravinement (e.g., Snedden et al., 1994). However,
the scale (N5 km wide) and orientation (contour
parallel) of the erosional swales on the outer New
Jersey shelf have no known analogy in the near-
shore, inner shelf or middle shelf environments,
which are dominated by sand ridge morphology
trending oblique to the contours, with swale widths
generally less than ~ 2 km. Nor have asymmetric
Fig. 14. Deep-towed chirp seismic image across some of the erosional scour pits, within the Outer Shelf Wedge. The deepest pit shown here is
over 10 m deep. See Fig. 4 for location. Seismic horizons bRQ and bChannelsQ (C) are identified.
J.A. Goff et al. / Marine Geology 216 (2005) 275–296290

erosion pits been observed in those depths. While
sand ridges are known to be active and evolving up
to ~ 40 m water depth (e.g., Stubblefield and Swift,
1976; Rine et al., 1991; Snedden et al., 1999;
Snedden and Dalrymple, 1999; Goff et al., 1999),
those on the outer New Jersey shelf are apparently
moribund (as evidenced by the pattern of greater
grain sizes at their crests, and lack of secondary
bedforms on their flanks; Goff et al., 1999);
furthermore, sand ridges are truncated in some cases
by the large erosional swales. We infer, therefore,
that such swale erosion post-dates the evolution of
sand ridges. By these morphological arguments, we
argue that the swales and pits are largely products of
water depths at or near present levels, although it is
possible that such marine erosion initiated at
locations that had been previously eroded.
Ribbons with clear bathymetric expression, such as
those shown in Fig. 13b,c, may also be derived by
excavation. However, most of the ribbons observed in
the survey area are constructional in nature, produced
by a thin, patchy layer of medium sand overlying a
shell hash layer with mud and sand. The overlying
sand may have been derived from the underlying
shelly/muddy/sand layer. Evidence from grab sample
suggests that the shelly/muddy/sand layer is a direct
product of erosion. The shells themselves are presum-
ably a lag, the immovable detritus of meters of material
removed from the seafloor at these locations. Much of
the shell hash may, in fact, have been concentrated at
the ravinement surface itself (e.g., Posamentier, 2002)
prior to marine erosion. Because of the lack of modern
sediment input to the New Jersey shelf (e.g., Swift et
al., 1972), the muds that are incorporated in this layer
must be derived from the underlying Pleistocene strata
being eroded. The bimodal distribution of abraded and
fresh sand grains indicates excavation of previously
undisturbed sediment mixed with reworked sand. Both
observations are strong indicators that erosion in these
locations is ongoing; otherwise, the fines would be
winnowed and the grains abraded rapidly. These
ribbons, while constructional, can therefore be con-
sidered indirect indicators of modern erosion. We also
assume that gravel patches (Figs. 2a and 3) represent
erosional lags.
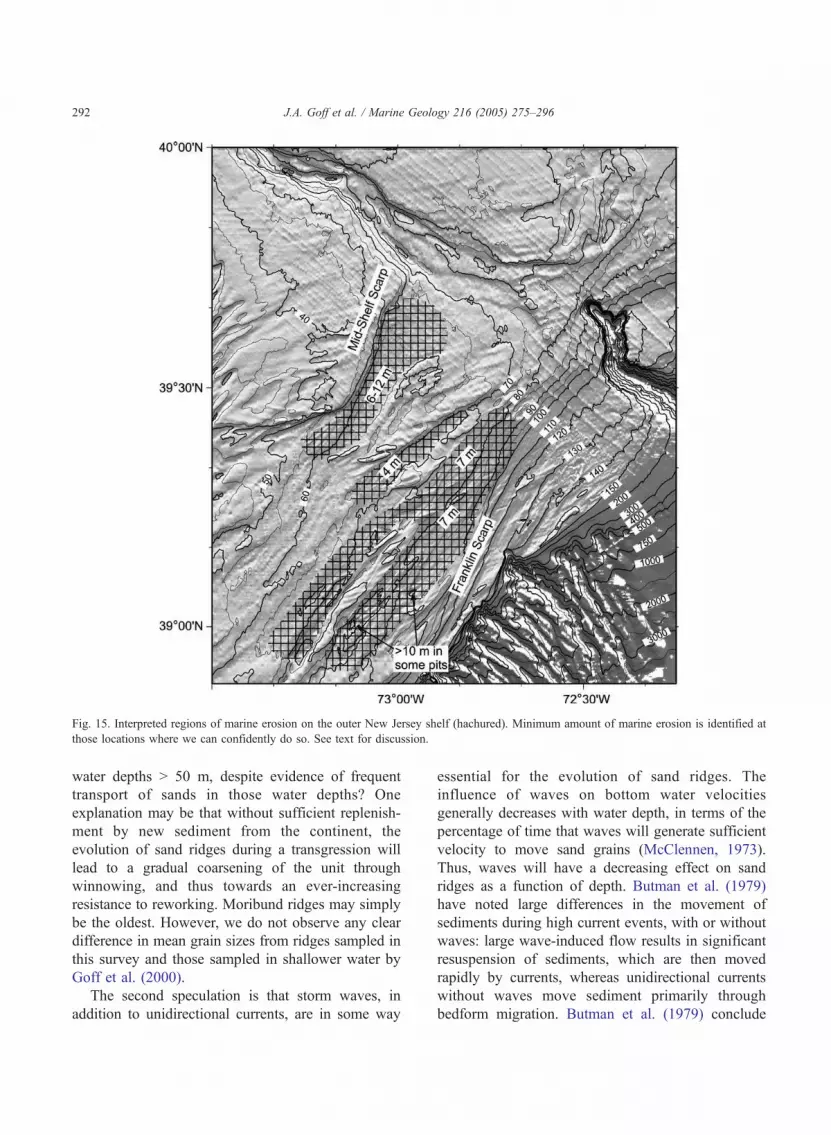
Based on the seismic data and inferences from
morphology, we have generated an interpretive map
indicating areas of significant marine erosion on the
New Jersey outer shelf, between the Franklin and
Mid-Shelf scarps (Fig. 15). At minimum, several to
~ 10 m of sediment have been removed by this
erosion, and perhaps more, depending on the preex-
isting thickness of the transgressive sand sheet in
these areas.
6.2. Transition from sand ridge evolution to marine
erosion
The evolution of sand ridge morphology docu-
mented throughout the inner and middle shelf (e.g.,
Stubblefield and Swift, 1976; Swift and Field, 1981;
Figueiredo et al., 1981; Snedden et al., 1994, 1999;
Snedden and Dalrymple, 1999) comes to an end on
the outer shelf. In water depths N 50 m, sand ridges
appear morphologically moribund, perhaps shielded
against further sediment transport (i.e., reworking) by
the coarse armor of winnowed sands. However, as
noted above, the seafloor shows evidence of recent
and modern marine erosion over broad areas of the
outer shelf, in some cases demonstrably cutting sand
ridges (Fig. 9).
That the outer shelf is experiencing erosion today
is perhaps not surprising, given earlier oceano-
graphic observations. Peak bottom current velocities
of over 40 cm/s have been measured in this region
(McClennen, 1973; Butman et al., 1979), with mean
flows during storm events in excess of 30 cm/s
(Butman et al., 1979). Although these velocities are
not theoretically considered adequate to initiate
movement of sand grains coarser than ~ 200 Am
(e.g., Miller et al., 1977), Butman et al. (1979) note
in their discussion that orbital wave motion and
bottom roughness will increase bottom stress,
enhancing the ability of unidirectional currents to
move sand grains. Butman et al. (1979) have
photographed several episodes of sediment move-
ment and resuspension on the New Jersey outer
shelf associated with peak current and/or wave
activity. These observations document that, under
typical winter conditions, sediment transport at the
depths considered here is frequent. In addition,
elongated sand wave fields toward the shelf edge
(Fig. 4; Knebel and Folger, 1976) provide morpho-
logical evidence of strong current velocities.
An important outstanding question that needs to be
addressed is: why do sand ridges cease to evolve in
J.A. Goff et al. / Marine Geology 216 (2005) 275–296 291
water depths N 50 m, despite evidence of frequent
transport of sands in those water depths? One
explanation may be that without sufficient replenish-
ment by new sediment from the continent, the
evolution of sand ridges during a transgression will
lead to a gradual coarsening of the unit through
winnowing, and thus towards an ever-increasing
resistance to reworking. Moribund ridges may simply
be the oldest. However, we do not observe any clear
difference in mean grain sizes from ridges sampled in
this survey and those sampled in shallower water by
Goff et al. (2000).
The second speculation is that storm waves, in
addition to unidirectional currents, are in some way
essential for the evolution of sand ridges. The
influence of waves on bottom water velocities
generally decreases with water depth, in terms of the
percentage of time that waves will generate sufficient
velocity to move sand grains (McClennen, 1973).
Thus, waves will have a decreasing effect on sand
ridges as a function of depth. Butman et al. (1979)
have noted large differences in the movement of
sediments during high current events, with or without
waves: large wave-induced flow results in significant
resuspension of sediments, which are then moved
rapidly by currents, whereas unidirectional currents
without waves move sediment primarily through
bedform migration. Butman et al. (1979) conclude
Fig. 15. Interpreted regions of marine erosion on the outer New Jersey shelf (hachured). Minimum amount of marine erosion is identified at
those locations where we can confidently do so. See text for discussion.
J.A. Goff et al. / Marine Geology 216 (2005) 275–296292
that wave-induced bottom currents result in much
larger bottom stresses compared to unidirectional
flow, a conclusion that is consistent with modeling
predictions (e.g., Komar, 1976). Resuspension may be
critical to the dune-form evolution of the sand ridge,
allowing grains, while they are transported along the
primary flow direction, to be sorted in relation both to
their fall velocities and with respect to differences in
bottom shear stress associated with lee and stoss
flanks of the ridge. Unidirectional flows without wave
resuspension will, in contrast, simply move sediment
along the bottom, a process that does not allow for
sorting over the large scales associated with sand
ridges. Therefore, water depth, rather than age, would
be the determining factor in shutting off the evolution
of sand ridges. We suspect that both factors, pro-
gressive armoring and increasing water depth, lead to
the shutdown of sand ridge evolution as transgression
progresses.
7. Conclusions
In this paper, we have documented widespread
marine and likely modern erosion on the outer shelf
off New Jersey, through analysis of chirp seismic
and grab sample data, as well as seafloor morphol-
ogy. The chirp seismic data provide a key strati-
graphic constraint by defining the presence and
lateral extent of the bTQ horizon, interpreted by
Duncan et al. (2000) as the transgressive ravinement
surface, which serves as the base of the transgressive
sand sheet. The sand sheet is emplaced on the
ravinement surface after the shoreline migrates
landward during a sea-level rise, and is organized
seaward of the shoreface into oblique sand ridges
that continue to evolve as sea level continues to rise
(e.g., Swift et al., 1972).
Truncation of the bTQ horizon at the seafloor
indicates that erosion has occurred in the trans-
gressive marine setting, after migration of the
shoreface across this region. A number of earlier
studies have observed basal reflector truncations
within sand ridge swales in middle shelf settings,
and such erosion is therefore presumed to be
associated with the continued evolution of these
features (e.g., Stubblefield and Swift, 1976; Rine et
al., 1991; Snedden et al., 1999). However, our data
have revealed unexpected marine erosion located
within large swales oriented ~ NE–SW, along the
SW-directed primary current flow (McClennen,
1973; Vincent et al., 1981) and cross-cutting the
oblique-to-flow sand ridge orientation on the outer
shelf. This erosion is therefore not associated with
sand ridge development. Since the geomorphology of
outer shelf sand ridges (i.e., higher grain sizes at
crests, indicative of winnowing, and lack of secon-
dary transverse bedforms on flanks) likely indicates
that they are moribund, the marine erosion we
observe on the outer shelf appears to post-date these
sand ridges.
Other important stratigraphic indicators of recent
erosion included exposures at the seafloor of: (1)
buried fluvial channels (formed at or near the LGM)
and fills (emplaced during the transgression), (2) outer
shelf wedge laminated strata (deposited ~ 40–27 kyr),
and (3) the regional bRQ horizon (formed in part by
erosion of material older than ~ 40 kyr). We estimate
minimum depths of marine erosion ranging from a
few meters to N 10 m.
Flow-parallel ribbon morphology appears to be
genetically linked to eroded surfaces. Where the
ribbons have both bathymetric and backscatter
expressions, their morphology appears to represent
an excavation of seabed material. However, much of
the ribboned areas have clear expression only in the
backscatter data; these features have been found to
represent alternations between a shelly, muddy sand
(yielding high backscatter) and a thin layer (~ 20–30
cm) of well-sorted medium sand (yielding low
backscatter) drifted atop the shelly, muddy sand.
The shell hash presumably represents an erosional
lag, in part perhaps a remnant of the transgressive
ravinement surface; whereas the presence of mud
and unabraded mineral grains indicates modern
excavation of Pleistocene sediments stratigraphically
older than the transgressive sand sheet. Rounded
gravels are also observed in other areas of the
seafloor, some notably from near the base of eroded
fluvial channels, but one large patch broadly
distributed (Fig. 2b). These are all probable erosional
lags.
An important question immediately arises from
the previous conclusion: why do sand ridges become
moribund on the outer shelf, when there is ample
evidence of sufficient modern bottom currents and
J.A. Goff et al. / Marine Geology 216 (2005) 275–296 293

wave forcing to move and erode sands (e.g.,
McClennen, 1973; Butman et al., 1979)? One
speculation we raise centers on progressive sand
ridge evolution, suggesting that continued reworking
with time eventually winnows the sand ridges to the
point where they are armored against further grain
movement. However, there is no clear difference in
grain sizes between middle (Goff et al., 2000) and
outer shelf sand ridges sampled here to justify that
claim. Alternatively, water depth may play a central
role in reducing the influence of storm waves, which
create far larger bottom stresses than unidirectional
currents (e.g., Komar, 1976) and are much more
likely to suspend sediment grains (Butman et al.,
1979). We suggest that suspension of sediments is
critical to the progressive sorting of grain sizes
during sediment transport by currents and, ultimately,
the continued evolution of sand ridges in deeper
water.
Acknowledgements
The authors thank the science parties and crews
aboard the CHS Creed, RV Cape Henlopen and RV
Endeavor cruises. We particularly thank S. Schock
and his associates at Florida Atlantic University for
their collaboration on collection of the chirp seismic
data, and Steffen Saustrup of UTIG for his work in
processing the data. We owe a great debt of gratitude
to ONR program managers who have seen the
Geoclutter program through, including Joe Kravitz,
Jeff Simmen and Tom Drake. Comments by Craig
Fulthorpe of UTIG, and reviews by Don Swift of Old
Dominion University, an anonymous reviewer and the
Marine Geology editor on earlier drafts helped to
improve the text. This work was funded by ONR
under grants N00014-0-1-0844 and N00014-4-1-
0038. UTIG contribution #1756.
References
Ainsworth, R.B., Sanlung, M., Duivenvorden, S.T.C., 1999.
Correlation techniques, perforation strategies, and recovery
factors: an integrated 3-D reservoir modeling study, Sirikit
Field, Thailand. AAPG Bull. 83, 1535–1551.
Ashley, G.M., 1990. Classification of large-scale subaqueous
bedforms: a new look at an old problem. J. Sediment. Petrol.
60, 160–172.
Boczar-Karakiewicz, B., Bona, J.L., 1986. Wave-dominated
shelves: a model of sand-ridge formation by progressive,
infragravity waves. In: Knight, R.J., McLean, J.R. (Eds.), Shelf
Sands and Sandstones, Canadian Society of Petroleum Geolo-
gists, Memoir vol. II, pp. 163–179.
Buck, K.F., Olson, H.C., Austin Jr., J.A., 1999. Paleoenvironmental
evidence for latest pleistocene sea level fluctuations on the New
Jersey outer continental shelf: combining high-resolution
sequence stratigraphy and foraminiferal analysis. Mar. Geol.
154, 287–304.
Butman, B., Noble, M., Folger, D.W., 1979. Long-term observa-
tions of bottom current and bottom sediment movement on
the mid-Atlantic continental shelf. J. Geophys. Res. 84,
1187–1205.
Cooke, R.U., Warren, A., 1973. Geomorphology in Deserts.
University of California Press, Berkeley. 374 pp.
Dalrymple, R.W., Hoogendoorn, E.L., 1997. Erosion and deposition
on migrating shoreface-attached ridges, sable island, eastern
canada. Geosci. Can. 24, 25–36.
Davies, T.A., Austin Jr., J.A., Lagoe, M.B., Milliman, J.D., 1992.
Late quaternary sedimentation off new jersey: new results using
3-D seismic profiles and cores. Mar. Geol. 108, 323–343.
Dillon, W.P., Oldale, R.N., 1978. Late quaternary sea-level curve:
reinterpretation based on glaciotectonic influence. Geology 6,
56–60.
Duncan, C.S. 2001. Late Quaternary Stratigraphy and Seafloor
Morphology of the New Jersey Continental Shelf, PhD Thesis,
University of Texas, p. 222.
Duncan, C.S., Goff, J.A., Austin, J.A., Fulthorpe, C.S., 2000.
Tracking the last sea level cycle: seafloor morphology and
shallow stratigraphy of the latest quaternary new jersey middle
continental shelf. Mar. Geol. 170, 395–421.
Emery, K.O., Uchupi, E., 1972. Western North Atlantic Ocean:
Topography, Rocks, Structure, Water, Life, and Sediments.
American Associon of Petrolium Geologists, Tulsa. 532 pp.
Figueiredo, A.G., Swift, D.J.P., Stubblefield, W.L., Clarke, T.L.,
1981. Sand ridges on the inner Atlantic shelf of North America:
morphometric comparisons with huthnance stability model.
Geo-Mar. Lett. 1, 187–191.
Fulthorpe, C.S., Austin Jr., J.A., 2004. Shallowly buried,
enigmatic seismic stratigraphy on the new jersey outer shelf:
evidence for latest pleistocene catastrophic erosion? Geology
32, 1013–1016.
Goff, J.A., Swift, D.J.P., Duncan, C.S., Mayer, L.A., Hughes-Clarke,
J., 1999. High resolution swath sonar investigation of sand ridge,
dune and ribbon morphology in the offshore environment of the
new jersey margin. Mar. Geol. 161, 309–339.
Goff, J.A., Olson, H.C., Duncan, C.S., 2000. Correlation of sidescan
backscatter intensity with grain-size distribution of shelf sedi-
ments, new jersey margin. Geo-Mar. Lett. 20, 43–49.
Goff, J.A., Kraft, B.J., Mayer, L.A., Schock, S.G., Sommerfield,
C.K., Olson, H.C., Gulick, S.P.S., Nordfjord, S., 2004. Seabed
characterization on the new jersey middle and outer shelf:
J.A. Goff et al. / Marine Geology 216 (2005) 275–296294

correlability and spatial variability of seafloor sediment proper-
ties. Mar. Geol. 209, 147–172.
Gulick, S.P.S., Goff, J.A., Austin Jr., J.A., Alexander Jr., C.R.,
Nordfjord, S., Fulthorpe, C.S., 2005. Basal inflection-controlled
shelf-edge wedges off New Jersey track sea-level fall. Geology
33 (5), 429–432.
Huthnance, J.M., 1982. On one mechanism forming linear sand
banks. Estuar. Coast. Mar. Sci. 14, 277–299.
Jackson, D.R., Winebrenner, D.P., Ishimaru, A., 1986. Application
of the composite roughness model to high frequency bottom
scattering. J. Acoust. Soc. Am. 79, 1410–1422.
Kenyon, N.H., 1970. Sand ribbons of European tidal seas. Mar.
Geol. 9, 25–39.
Kenyon, N.H., Belderson, R.H., Stride, A.H., Johnson, M.A., 1981.
Offshore tidal sandbanks as indicators of net sand transport and
as potential deposits. Spec. Publ. Int. Assoc. Sedimentol. 5,
257–268.
Knebel, H.J., Folger, D.W., 1976. Large sand waves on the Atlantic
outer continental shelf around Wilmington Canyon, off eastern
United States. Mar. Geol. 22, M7–M15.
Knebel, H.J., Spiker, E., 1977. Thickness and age of surficial sand
sheet, Baltimore canyon trough area. Am. Assoc. Pet. Geol.
Bull. 61, 861–871.
Knebel, H.J., Wood, S.A., Spiker, E.C., 1979. Hudson river:
evidence for extensive migration on the exposed continental
shelf during pleistocene time. Geology 7, 254–258.
Komar, P.D., 1976. The transport of cohesionless sediments on
continental shelves. In: Stanley, D.J., Swift, D.J.P. (Eds.),
Marine Sediment Transport and Environmental Management-
John Wiley, New York, pp. 107–125.
McBride, R.A., Moslow, T.F., 1991. Origin, evolution and
distribution of shoreface sand ridges, Atlantic inner shelf,
U.S.A. Mar. Geol. 97, 57–85.
McClennen, C.E., 1973. New Jersey continental shelf near bottom
current meter records and recent sediment activity. J. Sediment.
Petrol. 43, 371–380.
McLean, S.R., 1981. The role of non-uniform roughness in the
formation of sand ribbons. Mar. Geol. 42, 49–74.
McKinney, T.F., Stubblefield, W.F., Swift, D.J.P., 1974. Large-scale
current lineations on the central new jersey shelf: investigation
by side-scan sonar. Mar. Geol. 17, 79–102.
Miller, M.C., McNave, I.N., Komar, P.D., 1977. Threshold of
sediment motion under unidirectional currents. Sedimentology
24, 507–527.
Milliman, J.D., Jiezao, Z., Anchun, L., Ewing, J.I., 1990. Late
quaternary sedimentation on the outer and middle new jersey
continental shelf: result of two local deglaciations? J. Geol. 98,
966–976.
Nittrouer, C.A., 1999. STRATAFORM: overview of its design and
synthesis of results. Mar. Geol. 154, 3–12.
Nordfjord, S., Gulick, S.P., Austin Jr., J.A., Goff, J.A., Fulthorpe,
C.S., 2002. Late Quaternary Incisions and Related Shallow
Subsurface Stratigraphy on the New Jersey Mid-Outer Shelf:
Preliminary Results from Ultra-High Resolution Chirp Sonar
Images—Part I. Eos Trans. AGU 83, Fall Meet. Suppl., Abstract
OS71C-0299.
Nordfjord, S., Goff, J.A., Austin Jr., J.A., Sommerfield, C.K., 2005.
Seismic geomorphology of buried channel systems on new
jersey shelf: assessing past environmental conditions. Mar.
Geol. 214, 339–364.
Posamentier, G.W., 2002. Ancient shelf ridges—a potentially
significant component of the transgressive systems tract: case
study from offshore northwest Java. AAPG Bull. 86, 75–106.
Reynaud, J.-Y., Tessier, B., Berne, S., Chamley, H., Debatist, M.,
1999. Tide and wave dynamics on a sand bank from the deep
shelf of the western channel approaches. Mar. Geol. 161,
229–259.
Rine, J.M., Tillman, R.W., Culver, S.J., Swift, D.J.P., 1991.
Generation of late Holocene ridges on the middle continental
shelf of New Jersey, USA—evidence for formation in a mid-
shelf setting based on comparison with a nearshore ridge. Spec.
Publ. Int. Assoc. Sedimentol. 14, 395–423.
Snedden, J.W., Dalrymple, R.W., 1999. Modern shelf sand ridges:
from historical perspective to a unified hydrodynamic and
evolutionary model. In: Bergman, K.M., Snedden, J.W. (Eds.),
Isolated Shallow Marine Sand Bodies: Sequence Stratigraphic
Analysis and Sedimentologic Interpretation, SEPM Special
Publication, vol. 64, pp. 13–28.
Snedden, J.W., Tillman, R.W., Kreisa, R.D., Schweller, W.J.,
Culver, S.J., Winn Jr., R.D., 1994. Stratigraphy and genesis of
a modern shoreface-attached sand ridge, Peahala Ridge, New
Jersey. J. Sediment. Res. B 64, 560–581.
Snedden, J.W., Kreisa, R.D., Tillman, R.W., Culver, S.J.,
Schweller, W.J., 1999. An expanded model for modern shelf
sand ridge genesis and evolution on the new jersey atlantic
shelf. In: Bergman, K.M., Snedden, J.W. (Eds.), Isolated
Shallow Marine Sand Bodies: Sequence Stratigraphic Analysis
and Sedimentologic Interpretation, SEPM Special Publication,
vol. 64, pp. 147–163.
Stubblefield, W.L., Swift, D.J.P., 1976. Ridge development as
revealed by sub-bottom profiles on the central new jersey shelf.
Mar. Geol. 20, 315–334.
Stubblefield, W.L., Swift, D.J.P., 1981. Grain size variation across
sand ridges, new jersey continental shelf. Geo-Mar. Lett. 1,
45–48.
Stubblefield, W.L., McGrail, D.W., Kersey, D.G., 1984. Recog-
nition of transgressive and post-transgressive sand ridges on the
jersey continental shelf. In: Tillman, R.W., Siemers, C. (Eds.),
Siliciclastic Shelf Sediments, Society of Economic Paleontolo-
gists and Minerologists, Tulsa, pp. 1–23.
Swift, D.J.P., Field, M.E., 1981. Evolution of a classic sand ridge
field: Maryland sector North American inner shelf. Sedimento-
logy 28, 461–482.
Swift, D.J.P., Kofoed, J.W., Saulsbury, F.P., Sears, P., 1972.
Holocene evolution of the shelf surface, central and
southern Atlantic shelf of north america. In: Swift, D.J.P,
Duane, D.B., Pilkey, O.H. (Eds.), Shelf Sediment Transport:
Process and Pattern, Dowden, Hutchinson & Ross, Stroudsburg,
Penn, pp. 499–574.
Swift, D.J.P., Moir, R., Freeland, G.L., 1980. Quaternary rivers on
the new jersey shelf: relation of seafloor to buried valleys.
Geology 8, 276–280.
J.A. Goff et al. / Marine Geology 216 (2005) 275–296 295

Syvitski, J.P.M., Hutton, E.W.H., 2001. 2D SEDFLUX 1.0 C: an
advanced process-response numerical model for the fill of
marine sedimentary basins. Comput. Geosci. 27, 717–729.
Thomas, D.S.G., 1989. Aeolian land deposits. In: Thomas,
D.S.G. (Ed.), Arid Zone Geomorphology, Halsted Press, New
York, pp. 232–255.
Trowbridge, J.H., 1995. A mechanism for the formation and
maintenance of shore-oblique sand ridges on storm-dominated
shelves. J. Geophys. Res. 100, 16071–16086.
Uchupi, E., Driscoll, N., Ballard, R.D., Bolmer, S.T., 2001.
Drainage of late Wisconsin glacial lakes and the morphology
and late quaternary stratigraphy of the New Jersey–Southern
New England continental shelf and slope. Mar. Geol. 172,
117–145.
Veatch, A.G., Smith, P.A., 1939. Atlantic submarine valleys of the
United States and the Congo submarine valley. Spec. Pap.-Geol.
Soc. Am. 49 (12) (16 pp.).
Vincent, C.E., Swift, D.J.P., Hillard, B., 1981. Sediment transport in
the New York Bight, North American Atlantic shelf. Mar. Geol.
32, 369–398.
J.A. Goff et al. / Marine Geology 216 (2005) 275–296296