Rebuilding the Great Pyramids: A Method for Identifying Control Relations in Complex Ownership...
46
Electronic copy available at: http://ssrn.com/abstract=1903941 Rebuilding the Great Pyramids: A method for identifying control relations in complex ownership structures Gur Aminadav Yoram Bachrach Konstantin Kosenko Jeffrey S. Rosenschein Yoav Wilf June 16, 2011 Abstract Identifying the corporate controller (controlling shareholder, ultimate owner) is an essen- tial prerequisite for any debate on the corporate governance of a specific firm and of entire markets. This paper aims to provide a comprehensive, precise and economically sound method for identifying control relations on the corporate level and especially in complex ownership structures. We apply weighted voting games literature as a theoretical framework for our analysis and use the Shapley-Shubik and the Banzhaf power indices to determine control rights. The core element of the proposed method, distinguishing our study from others, in solving the puzzle of corporate control, is the simultaneous analysis of both the specific ownership map within the corporation and the corporate network in which the firm is embedded. We implemented our algorithm into a Java computer program and tested it on a real-world data set of corporate ownership in the Israeli market. The direct product of the analysis of these data is a comprehensive map of control relations at every time point. We find that the corporate control relations identified by our method are richer and more accurate than those provided by different official sources. Keywords: corporate governance; control rights; corporate networks; ownership structure; power indices JEL classification: G31, G32, G34 1
Transcript of Rebuilding the Great Pyramids: A Method for Identifying Control Relations in Complex Ownership...

Electronic copy available at: http://ssrn.com/abstract=1903941
Rebuilding the Great Pyramids: A method for identifying control
relations in complex ownership structures
Gur Aminadav Yoram Bachrach Konstantin KosenkoJeffrey S. Rosenschein Yoav Wilf
June 16, 2011
Abstract
Identifying the corporate controller (controlling shareholder, ultimate owner) is an essen-tial prerequisite for any debate on the corporate governance of a specific firm and of entiremarkets. This paper aims to provide a comprehensive, precise and economically soundmethod for identifying control relations on the corporate level and especially in complexownership structures. We apply weighted voting games literature as a theoretical frameworkfor our analysis and use the Shapley-Shubik and the Banzhaf power indices to determinecontrol rights. The core element of the proposed method, distinguishing our study fromothers, in solving the puzzle of corporate control, is the simultaneous analysis of both thespecific ownership map within the corporation and the corporate network in which the firmis embedded. We implemented our algorithm into a Java computer program and tested iton a real-world data set of corporate ownership in the Israeli market. The direct product ofthe analysis of these data is a comprehensive map of control relations at every time point.We find that the corporate control relations identified by our method are richer and moreaccurate than those provided by different official sources.
Keywords: corporate governance; control rights; corporate networks; ownership structure;power indices JEL classification: G31, G32, G34
1

Electronic copy available at: http://ssrn.com/abstract=1903941
1 Introduction
Identifying the corporate controller (controlling shareholder, ultimate owner) is an essentialprerequisite for any debate on the corporate governance of a specific firm and of entire markets.The main reason for such emphasis on this process is that the controller’s identity plays acrucial role in mechanisms that policy makers use to overcome various agency problems arisingfrom the separation of ownership and control [10, 16]. An inappropriate identification strategycan result in mechanisms that are, at best, simply inadequate for the challenges facing policymakers or, at worst, counterproductive. Therefore, the purpose of the present study is to providea comprehensive, precise and economically sound method for identifying control relations thatis applicable to a wide range of studies on ownership and corporate governance as well as topractical implementations in any given market.
According to a simple but widely used analytical framework, the systems of governance acrossthe world can be broadly divided into two separate groups [32]. The first, the Anglo-Saxonsystem (frequently called the ”outsider system”), which is prevalent in the US and the UK, ischaracterized by widely dispersed ownership. The second, the ”insider system”, is relevant tomost of the rest of the world, and relies on the empirical observation of concentrated ownership.While even in the outsider system, which is the simpler of the two systems, identifying the con-trolling authority is not always a trivial task, the identification process is particularly difficultin the insider system. This complexity stems from the multiplicity of control-enhancing mech-anisms, e.g., dual shares, cross- or circular holdings, and especially stock pyramids, which areoften used to allow existing blockholders to deviate from the proportionality principle1 and toenhance control by leveraging their voting power [23, 24, 33, 19]. These complex, multilayeredstructures, in which an entity, such as an individual, a family or a company, holds significantshares of some firms that in turn hold significant shares in other corporations, make it difficultto identify the corporate controllers and render the market for control less transparent. Controlidentification instruments able to cope with that complexity are thus required, but as othershave previously noted [7], the literature still offers no consensus on which types of instrumentsare most appropriate.
In the present paper we suggest a new technique for the identification of control relations,on the corporate level and especially in complex ownership structures. In formal terms, thealgorithm described in the current study transforms any given input-output matrix of cash-flow(voting) rights2 into a Boolean matrix of control. The core element of the proposed method, andthe element that distinguishes our study from others, is an extensive examination of control re-lations that incorporates firm-specific characteristics, e.g., the firm’s shareholdings distribution,and at the same time considers the firm as embedded in a corporate network, i.e., the algorithm
1The ”proportionality principle” referring to proportionality between ultimate economic risk and control -means that share capital that has an unlimited right to participate in the profits of the company or in the residueon liquidation, and only such share capital, should normally carry control rights, in proportion to the risk carried.
2Unless cash flow rights are not equal voting rights. In such cases explicit voting rights are required.
2

considers the possibility that a firm’s corporate shareholders are controlled by the same ultimateowner and/or that they partake in cross-control relations. In other words, the aspects of controlof a certain firm and the control paths that involve that firm are treated simultaneously.
In order to develop control identification techniques, we apply weighted voting games liter-ature as a theoretical framework for our analysis and use the Shapley-Shubik and the Banzhafpower indices to determine control rights. These indices provide measures for the extent to whichan agent holding a certain proportion of the voting rights can affect the outcome of a collectivedecision by casting his vote, given the overall proportion required to win and the distributionof other voters’ rights [15]. This approach allows the measurements of control to be extendedto cases in which the majority threshold rule3 is not feasible or valid, and it provides a refinedalternative to traditionally used tests, for example, the weakest-link principle (WLP) approach[33, 39, 26, 18]. We develop a power-index-based test for control and show that the holdingsrequired in order to achieve direct control are firm-specific. Afterward, we adapt the controltest into a fully integrated algorithm able to analyze control relations in any given complexownership structure. The main contributions and features of this algorithm are summarizedas follows: 1) It provides existence and uniqueness of a solution for any market irrespective ofits size or structure; and 2) the method is flexible in parameters and assumptions, facilitatingincorporation of additional market-specific information.
Many ownership structures where shareholders make joint decisions use weighted voting (orsome weighted voting variant which can be modeled as a simple coalitional game). In suchdomains, one sometimes wants to obtain many power index results. In large and complexnetworks computational issues become an obstacle in terms of running time and accuracy [21].Thus, the practical applications of power indices for measuring shareholder voting behavior infull scale settings have not been widely adopted in the classical corporate finance literatureuntil now. In order to overcome these obstacles in our analysis we incorporated the effectiverandomized methods for approximating power indices as was recently developed by [43]. Thisrandomized approach outperforms any deterministic algorithm in terms of accuracy, and noother randomized algorithm can achieve significantly better results.
We apply the algorithm to a real database of ownership in the Israeli capital market spanningthe period of 1995-2009. For the empirical compatibility test we use an input-output matrixof cash flow rights4 of approximately 650 listed companies - the whole population of publiccompanies on the Tel Aviv Stock Exchange. The direct product of the analysis of these data isa comprehensive map of control relations at every time point. Moreover, we find that the resultsobtained through our method are more precise than those achieved with the frequently usedWLP method (for a detailed discussion see [38]. The simple WLP criterion, provided by [33],misidentifies shareholders as controllers in many cases5 , and it also fails to define and empirically
3More than half the votes.4Following the ”one-share - one-vote” principle legally adopted in Israel since 1994.5For example in a case where three unrelated shareholders A, B, and C hold 20%, 21%, 22% respectively in a
certain firm, then the WLP method would misidentify shareholder C as the firm controller.
3

identify corporate controllers in cases where the firm’s position within the corporate networkshould be considered - i.e., when additional information about the control relations among thefirm’s direct corporate shareholders is required. Our approach overcomes these obstacles andthus constitutes a more accurate alternative.
The paper is organized as follows. Section 2 presents and discusses a control concept basedupon voting (cash flow) rights. Section 3 introduces weighted voting games and power indicesin the context of shareholder votes. Section 4 provides a formal definition of control and derivesseveral related concepts. Section 5 states and explains the five central assumptions underlyingour model. Section 6 extends our formal definitions by incorporating additional informationabout the control relations among corporate shareholders. Section 7 puts forward our method-ology to identify control relations in corporate networks and intuitively describes the algorithmwe developed. Finally, Section 8 demonstrates several results from a real-world database andcompares the results of our method with the results derived from the cut-off point method.
4

2 The concept of ”control”
There is a long and rich history attached to such words as influence, authority, power and control.These terms, and especially the latter two, are often used interchangeably in many disciplinesas well as in general public parlance. Although for a great many essays distinctions among theconcepts are necessary and useful, in this section we seek to explicate the central notion that liesbehind these terms and to formulate a uniform conceptual framework. This, in order to supplythe key insights underlying our approach, and justify the use of our suggested algorithm as astandalone technique for the identification of control relations.
The question of how ”control” is conceptualized is a critical one - apart from the problemof obtaining reliable and valid information and prior to any decision regarding the identificationstrategy. Generally speaking, control is derived from power - ”the capacity to initiate, con-strain, circumscribe, or terminate action, either directly or by influence exercised on those withimmediate decision-making authority” [2]. Therefore, like the sociological concept of power,the concept of control, by itself, is elusive - it can rarely be sharply segregated or clearly defined[1]. Nevertheless, the attempt should be made.
In our study we refer to the concepts of control and power as they relate to ownership, whichis an important basis for obtaining a strategic position, and which constitutes a key factor in thedynamics of decision-making processes within a firm. Power in such settings is defined as thecapacity to influence decisions; the degree of influence depends on the complete configuration ofholdings allocated to all shareholders. Control refers to a situation in which the ownership stakeis so powerful that its influence becomes complete discretion [22]. Thus, control is an absoluteproperty, whereas voting power can be quantified. In the context of corporate control and forpractical purposes, as Berle and Means [1] initially put it, control may be said ”to lie in thehands of the individual or group who have the actual power to select the board of directors (orits majority), either by mobilizing the legal right to choose them - controlling a majority of thevotes (cash-flow rights) directly or through some legal device - or by exerting pressure whichinfluences their choice”6. Thus, since direction over the activities of a corporation is exercisedthrough the board of directors, control is restricted to major powers only, i.e. it refers to thepower of determining the broad policies for guiding a corporation and to the power of makingcrucial strategic decisions - for example, choices related to production function and/or marketsof distribution, volume and direction of investment, larger commercial and political strategies,and selection of top-management personnel, rather than decisions related to routine, day-to-dayactivities.
This definition of control encompasses, among others, situations in which control derivesfrom majority ownership. However, we do not restrict our attention to niches in which thebinary decision rule of majority control is the leading criterion for identification of the corporate
6Nonetheless, ”occasionally the major elements of control are made effective through dictation to the man-agement” [1].
5

controller. The majority control criterion is a conventional, theoretically convenient tool that isconsistent with many views regarding the establishment and maintaining of formal/legal controlin corporations [7, 17, 24]; however, it seems to be too conservative for many situations. Controlin large corporations is more often factual, depending upon a strategic position secured througha measure of ownership. Following the argument of Berle and Means (1932), factual control isless clearly defined than legal forms of control, but it nonetheless ”may exist and be maintainedover a long period, and as a corporation becomes larger and its ownership more widespread,it tends towards a position of impregnability comparable to that of legal control, a positionfrom which it can be dislodged only by virtual revolution” [1]. Factual, or effective, control,to distinguish it from the majority rule, may involve different degrees of ownership lying below50% of the cash-flow (voting) rights and may be said to exist when an individual or small groupholds a sufficient stock interest to be in a position to dominate a corporation - to attract fromscattered owners proxies sufficient to control a majority of the votes during all decision-makingprocesses7.
Since different corporations are held with different proportions of ownership, it seems tobe conceptually important to extend the measurement of control rights, beyond that based onsimple majority rule, to more general cases. In practice, however, Berle and Means and theirfollowers have relied on assumptions that eliminate the necessity to address this issue. Theyhave assumed that once a threshold of a minimum specified proportion of the stock8 is adopted,the corporation can be easily assigned to one of two types: widely held (i.e. under ”managementcontrol”), meaning that the corporation is not controlled by anyone, or ultimately controlled,i.e., one shareholder owns at least the threshold stock proportion in the corporation. In cross-country studies this approach, undoubtedly, has an enormous advantage, as it allows smoothingof different national disclosure requirements and substantially simplifies the calculation of controlrights. On the other hand, this ad hoc rule has no formal justification and does not take intoaccount the variability of ownership concentration - the concept of a universal fixed cutoff pointfor all firms is not relevant; a specific cutoff point should be applied to each individual firm ineach market at each time period, as we will elaborate later. Moreover, this simple empirical ruleof thumb constitutes a wide foundation for many serious problems in measurement of controlrights and may lead to some paradoxical results (see [38]).
On this background we argue that to completely solve the puzzle of corporate control, it iscrucial to analyze the concrete ownership map within the corporation, as well as the corporatenetwork - the web of shareholding relations among corporations - in which the firm is embedded.This must be done before one can begin to understand where control is actually located and how
7Even if the controlling shareholder’s stake is less than outright majority (50% of the stock) it can still negotiatewith other shareholders and try to form a winning coalition, e.g. by ’bribing’ them or by offering logrolling. Thecontrolling shareholder has the best chances of forming a winning coalition in the occurrence of sharp divergenceof interests vis-a-vis other shareholders [30, 8].
8Whether 20 percent - as in the original Berle and Means work - or the 10 percent criteria as adopted in mostrecent studies.
6

to identify it. The method of investigation proposed by Berle and Means, their definition andcategorization of different kinds of control, provide an essential starting point for the analysis.However, the procedures used in their study do not take into account the complete distributionof ownership within the corporate network, a crucial aspect of control. For this reason, we donot reduce the concept of control to a rigid criterion such as a cutoff point; rather, we proposea more adaptable definition. Inspired by Weber’s view of ”power” [40], we define ”control” asthe ability of an object - either an individual or a family - or an identifiable group of objects,given the concrete structure of corporate ownership and inter-corporate relationships, to realizetheir own will in any action over time, despite the resistance of other participants in that actionspace. To estimate the probability that a given individual or group controls a corporation, then,we must know who the rivals or potential rivals for control are and what assets they can bringto the struggle [28]. In other words, we must know the exact composition of corporate principalshareholdings.
This definition of control has two obvious immediate implications related to the presentstudy: First, it suggests that a specific arbitrary percentage of ownership in itself can tellus little about the potential for control that it represents. We can discover a threshold ofownership that yields control9 only by a case study of the exact pattern of ownership withinthe given corporation. Most importantly, it also implies that focusing our attention on thesingle corporation may limit our ability to see the pattern of power relationships of which acorporation is merely one element, and it may restrict our understanding of the potential forcontrol represented by a specific bloc of shares in a particular corporation. In many cases, theprincipal shareholders within the same corporation may themselves be controlled by a commonultimate owner. It is reasonable to assume that in such a situation they will act in unisonregarding the decision-making processes in the corporation. Therefore, an individual’s or agroup’s capacity for control must be a function of the distribution of direct ownership and theexistence of concerts10 among the shareholders. Identification of such complex relationships ispossible only by incorporating the analysis of the single corporation into the network contextand vice versa. In other words the simultaneous analysis of control relations is required.
The methods and procedures in our research, as well as the basic concepts and units ofanalysis, are not different from those that have been commonly employed in the past [12, 13].The discussion above established our view of control over a firm and based the manifestation ofcontrol upon shareholders’ voting power. In order to formalize the concepts of power and control,which will allow us to model decision-making processes in firms and to measure shareholders’voting power, we incorporate weighted voting games into our analytical framework.
9If such a threshold exists for a specific shareholder in a given firm.10Groups of shareholders controlled by the same ultimate owner.
7

3 Weighted voting games and power indices
3.1 Weighted voting games
Weighted voting games are special cases of simple superadditive games11. For the purposes ofthis study, we assume that in each firm, every shareholder is assigned a non-negative number,or weight, represented by its fraction of voting rights in that particular firm. Moreover, foreach firm a positive number that is not greater than one is specified as a quota such that asubset of shareholders wins the game if the sum of the weights of its participants exceeds thatquota. Denote [q;w1, . . . , wn] where q and w1, . . . , wn are nonnegative real numbers satisfying0 < q ≤
∑ni=1wi. We may think of wi as the fraction of voting rights, or weight, of shareholder
i in the set N = {1, . . . , n} of the direct shareholders in a specific firm, and q as the threshold,or quota, needed for a coalition to win in that firm. Thus [q;w1, . . . , wn] represents the simplegame v defined by:
v(S) ={
1, w(S) ≥ q0, w(S) < q
where for S ⊆ N,w(S) means∑
S⊂N wi.Therefore, each firm is characterized by an idiosyncratic decision rule, which is completely
defined by the firm’s voting majority quota q and the distribution of its shareholders’ votingrights. In this study we concentrate on the component of voting power that derives solely fromthe decision rule itself - as distinct from real-world interactions. This a priori voting powerof a shareholder under a given decision rule is regarded as the capacity of potential influenceattributed to the shareholder by virtue of the rule [34]. It is exactly this a priori voting power ofshareholders that we want to measure and later to incorporate in an operational test of controlin corporate networks.
3.2 Power measurement
A critical shareholder has a strong influence on the result of the voting game, and the prominenceof this property is related to various measures of power. The two approaches to measuring thea priori voting power of individual shareholders in weighted voting games, adopted in this
11A cooperative transferable utility (TU) game is a pair (N, v), where N := (1, . . . , n) denotes the set ofshareholders and v a function which assigns a real number to each nonempty subset or coalition of N , andv(∅) = 0. A (0− 1)− game is a game in which the function v only takes the values 0 and 1. It is a simple game ifit is not identically 0, and obeys the condition of monotonicity: v(T ) ≥ v(S) whenever T ⊇ S. In these games acoalition S of shareholders is winning if v(S) = 1, and is losing if v(S) = 0. A shareholder i is said to be criticalin a coalition S if S is winning and S\{i} is not. A TU game is superadditive if v(S ∪T ) ≥ v(S) + v(T ) wheneverS ∩ T = ∅, in simple games superadditivity is equivalent to v(S) + v(N\S) ≤ 1 for all S ⊆ N . As a collectivedecision-making procedure in a firm is specified by the voting body of shareholders and the decision rules, it canbe modeled by a (0− 1)− game whose winning coalitions are those that can make a decision without the vote ordespite the resistance of the remaining shareholders.
8

study, are those developed by Shapley and Shubik [36], by Penrose [35] and by Banzhaf[14]. The power indices provided by these studies are functions that associate with each simplesuperadditive game v a vector or power profile whose ith component is interpreted as a measureof the influence that shareholder i can exert on the outcome 12.
3.2.1 The Shapley-Shubik power index
The Shapley-Shubik power index [36] may be interpreted as a prior estimate of a voter’s expectedrelative share in a fixed prize available to the winning coalition as a measure of voting power. Forcalculation of this index, it is assumed that shareholders join a coalition in a particular order.A pivotal shareholder for a given ordering is the member whose joining turns a developingcoalition from a losing coalition into a winning coalition. The Shapley-Shubik power indexis simply the Shapley value when applied in a setting of the simple weighted voting gamev. Denote by π a permutation (reordering) of the shareholders, so π is a reversible functionπ : {1, . . . , n} → {1, . . . , n}, and by Π the set of all possible such permutations. Denote bySπ(i) the predecessors of i in π , so Sπ(i) := {j|π(j) < π(i)} . The Shapley-Shubik index isgiven by Sh(v) = (Sh1(v), . . . , Shn(v)) , where Shi(v) := 1
n!
∑π∈Π[v(Sπ(i)∪{i})− v(Sπ(i))]. In
other words, if we denote by pivi the number of orderings where shareholder i is pivotal, theShapley-Shubik power index of shareholder i is: Shi(v) := pivi
n! .
3.2.2 The Banzhaf power index
The Banzhaf power index [14, 31] may be interpreted as the probability that a given shareholderwill change an outcome of a vote by swinging, where a swing for shareholder i corresponds toa winning coalition S containing i, from which i’s defection would change the coalition fromwinning to losing. For a game v, the Banzhaf index13 of shareholder i is given by: β(v) =(β1(v), . . . , βn(v)) , where βi(v) := 1
2n−1
∑S⊂N,i∈S [v(S) − v(S\{i})]. In other words, using the
notation of swingi for the number of swings for shareholder i, the Banzhaf power index ofshareholder i is: βi(v) := swingsi
2n−1 .In the next section we propose a basic definition of control over a firm by using voting games
and power indices.
3.3 Power Indices and Computational Complexity
The applicability of the power indices to measuring power in various domains has raised thequestion of finding tractable ways to compute them. Unfortunately, this problem has a highcomputational complexity, e.g. calculating the Shapley-Shubik power index in a weighted voting
12It is possible to generalize the power indices that we apply by using any member of the class of indices thatfulfill certain relevant axioms (see e.g. [6]). They may serve for the same purpose of power measurement.
13Banzhaf actually considered the percentage of coalitions in which the shareholder is a swinger out of allwinning coalitions. This is called the normalized Banzhaf index.
9

game. A naive algorithm for computing the Shapley-Shubik power index simply examines allthe permutations of the n players, and averages the marginal contribution14 of a player in eachof them. Although calculating the marginal contribution of the player in a single permutation iseasy, there are n! permutations to consider. This is intractable even for n = 50 players, as eventhe strongest supercomputers available today cannot enumerate over such a high number of per-mutations. Computer scientists generally consider algorithms whose running time is polynomialin the size of the input as reasonably efficient algorithms, and those whose running time growssuper-polynomially (for example exponentially) as inefficient. In the case the Shapley-Shubikpower index computation, the input to the problem is the list of the weights of the players, orn integers. The naive method examines f(n) = n! permutations, and since f(n) grows fasterthan any polynomial this method is considered inefficient. Consequently, a prominent questionis whether there exists a more efficient algorithm for computing the Shapley-Shubik power in-dex in a weighted voting game. Although such improved algorithms do exist, a desirable goalis to find an algorithm whose running time is polynomial in the input size, or in other wordsan algorithm that computer scientists would consider efficient. Unfortunately, it seems such analgorithm is very unlikely to exist15. A key way of overcoming these negative results is usingan approximation algorithm which works for any weighted voting game, but only computes thepower index approximately, providing a certain guarantee regarding the error in the computa-tion. In this paper we have used the power index approximation method proposed and analyzedby [43]. This algorithm estimates the power indices and returns, with high probability, a re-sult that has a very low approximation error16. This allows us to compute power indices forhighly complex ownership structures with many firms, while guaranteeing almost no error in thecomputed power indices.
14If a player is pivotal for a permutation of the players, we say it has a marginal contribution of one, andotherwise we say she has a marginal contribution of zero. One definition of the Shapley-Shubik power index issimply the average marginal contribution a player has across all permutation.
15 [42] show that calculating the the Banzhaf index and Shapley value in weighted voting games are NP-complete problems, and [41] showed an even stronger negative result regarding the Shapley value, proving it tobe a #P -complete.
16More formally, given a game in which a player’s true power index is ψ, and given a target accuracy level εand confidence level δ, the algorithm returns an approximation ψ̂ such that with probability at least 1 − δ wehave |ψ − ψ̂| ≤ ε (i.e. the result is approximately correct, and is within a distance ε of the correct value). Thisalgorithm works by drawing a sample of k permutations (or coalitions), and testing whether the target playeris pivotal in them. The total running time is logarithmic in the confidence and quadratic in the accuracy, sothis approach provides an extremely accurate approximation and operates quickly even for games with manythousands of agents.
10

Figure 1: Simple corporate network
4 Defining control through voting games and power indices
4.1 Corporate Networks
Let the network of shareholding relationship among a set V of n firms and shareholders17 bedescribed by the n× n adjacency matrix H ∈ [0, 1](n×n).
H is defined such that hi,j > 0 represents the fraction of the stock of firm j owned (directly)by shareholder i. When hi,j > 0 we say that i is a direct shareholder of j. For each share-holder/firm j ∈ V we denote by Γ−(j) the set of direct shareholders of j i.e. Γ−(j) = {i ∈V : hi,j > 0} . When Γ−(j) = ∅ it means that j is an individual shareholder or a group ofshareholders attached by family ties. For the sake of simplicity, in both cases we will call j afamily and we denote by F the set of families in the network. Thus
∑ni=1 hi,j = 1 for every
j ∈ V \F , i.e. if j is not a family, then it is a firm and thus its shareholders jointly hold theentire stock of j. To each firm j ∈ V \F corresponds a weighted voting game gj , which is definedby the shareholders Γ−(j) with their weights {hi,j : hi,j > 0}18. Thus, the weighted votinggame gj provides a model for the decision-making process of firm j.
In Figure 1 we present a simple market with participants V = {j1, j2, j3, j4, j5} and anownership structure represented by the corresponding input-output matrix of ownership:
17Firms themselves can be and usually are shareholders of other firms (corporate shareholders) (La Porta etal., 1998).
18In other words, gj is completely represented by j’s column of the input-output matrix of ownership togetherwith firm j’s majority quota qj .
11
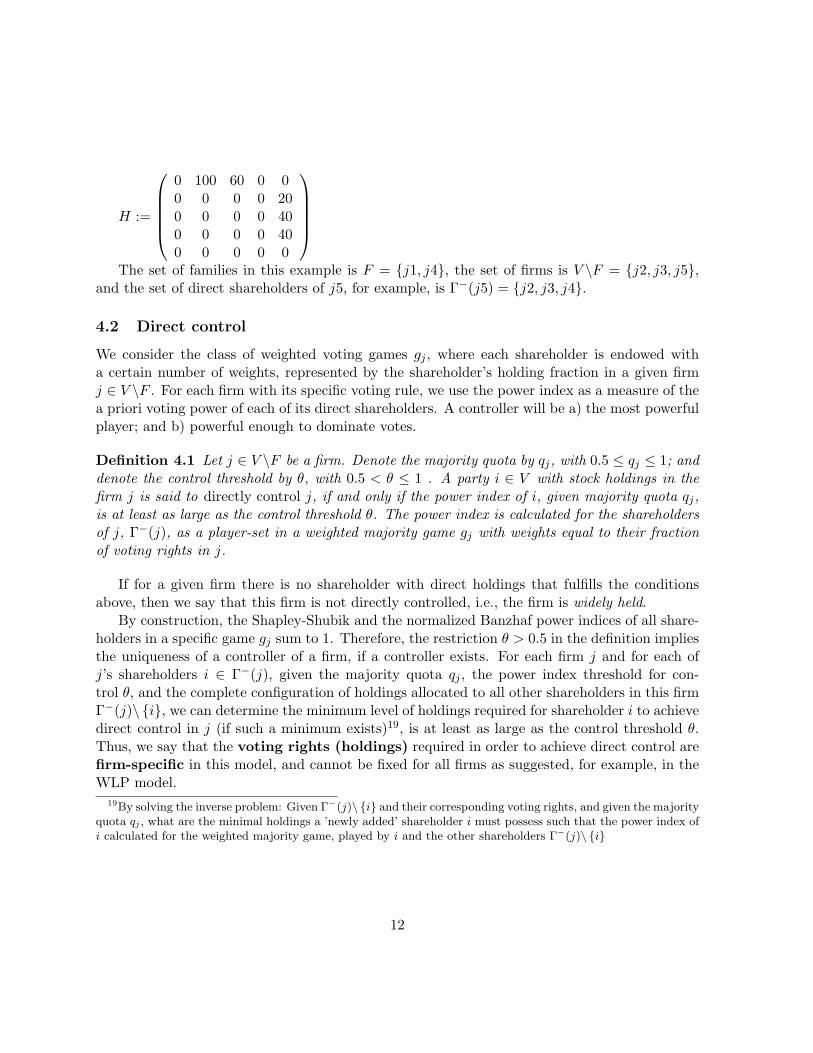
H :=
0 100 60 0 00 0 0 0 200 0 0 0 400 0 0 0 400 0 0 0 0
The set of families in this example is F = {j1, j4}, the set of firms is V \F = {j2, j3, j5},
and the set of direct shareholders of j5, for example, is Γ−(j5) = {j2, j3, j4}.
4.2 Direct control
We consider the class of weighted voting games gj , where each shareholder is endowed witha certain number of weights, represented by the shareholder’s holding fraction in a given firmj ∈ V \F . For each firm with its specific voting rule, we use the power index as a measure of thea priori voting power of each of its direct shareholders. A controller will be a) the most powerfulplayer; and b) powerful enough to dominate votes.
Definition 4.1 Let j ∈ V \F be a firm. Denote the majority quota by qj, with 0.5 ≤ qj ≤ 1; anddenote the control threshold by θ, with 0.5 < θ ≤ 1 . A party i ∈ V with stock holdings in thefirm j is said to directly control j, if and only if the power index of i, given majority quota qj,is at least as large as the control threshold θ. The power index is calculated for the shareholdersof j, Γ−(j), as a player-set in a weighted majority game gj with weights equal to their fractionof voting rights in j.
If for a given firm there is no shareholder with direct holdings that fulfills the conditionsabove, then we say that this firm is not directly controlled, i.e., the firm is widely held.
By construction, the Shapley-Shubik and the normalized Banzhaf power indices of all share-holders in a specific game gj sum to 1. Therefore, the restriction θ > 0.5 in the definition impliesthe uniqueness of a controller of a firm, if a controller exists. For each firm j and for each ofj’s shareholders i ∈ Γ−(j), given the majority quota qj , the power index threshold for con-trol θ, and the complete configuration of holdings allocated to all other shareholders in this firmΓ−(j)\ {i}, we can determine the minimum level of holdings required for shareholder i to achievedirect control in j (if such a minimum exists)19, is at least as large as the control threshold θ.Thus, we say that the voting rights (holdings) required in order to achieve direct control arefirm-specific in this model, and cannot be fixed for all firms as suggested, for example, in theWLP model.
19By solving the inverse problem: Given Γ−(j)\ {i} and their corresponding voting rights, and given the majorityquota qj , what are the minimal holdings a ’newly added’ shareholder i must possess such that the power index ofi calculated for the weighted majority game, played by i and the other shareholders Γ−(j)\ {i}
12

Figure 2: Indirect control and an ultimate owner
4.3 Indirect control
Controlled firms may and in many real-world cases indeed control other firms as dominantcorporate shareholders. We provide an extension to Definition 4.1 of direct control, by usingtransitivity, in which a shareholder indirectly controls a firm through a ”chain of direct controlrelations”.
Definition 4.2 For a shareholder/firm j1 ∈ V and a set of distinct firms {j2, . . . , jm} ⊆ V , iffor all k := 1, . . . ,m− 1 jk directly controls jk+1, then we say that j1 indirectly controls jk forall k := 2, . . . ,m.
We shall call the set P (j1, jm) := (j1j2, . . . , jm−1jm) ⊆ V ×V the control path from j1 to jm.A shareholder that indirectly controls every firm along a control path but itself is not controlledis defined as the ultimate owner of each of its indirectly controlled firms.
Definition 4.3 Given a firm j ∈ V and a shareholder u ∈ V , we say that u is the ultimateowner of j if the following two conditions hold:
1. u controls j (directly or indirectly); and
2. u is not controlled
Since a controller of a firm is uniquely determined, a firm can have one and only one ultimateowner.
The ownership structure from Figure 2 is represented by the following adjacency matrix:
13

H :=
0 100 60 0 00 0 0 0 800 0 0 0 100 0 0 0 100 0 0 0 0
In Figure 2 we recognize the set of firms to be V \F = {j2, j3, j5} and assume that the
majority quota qj = 50% for every firm in V \F , which means that a simple majority is requiredto win a vote. Furthermore, we will use the Shapley-Shubik power index (SS) and fix the powerthreshold for control θ = 0.9. Family j1 controls firm j2, since this family holds 100% of thevoting rights of firm j2. Next we will observe firm j5; it has three direct shareholders Γ−(j5) ={j2, j3, j4}, whose voting rights are taken from h•,5
20 and are represented by the voting rightsvector (80, 10, 10), together with qj5 = 50% the game gj5 is completely determined. Calculatingthe Shapley-Shubik power index of the shareholders in game gj5 yields the corresponding powerindex vector (1, 0, 0), and since Sh(j2) = 1 > θ = 0.9 we identify the corporate shareholder j2as the direct controller of firm j5. In sum, since j1 directly controls j2 and since j2 directlycontrols j5, then according to Definition 4.2 of indirect control we will say that j1 indirectlycontrols j5; the control path from j1 to j5 is given by P (j1, j5) = (j1j2, j2j5). Moreover, sincej1 is not controlled by anyone (it is a family), according to Definition 4.3 j1 is the ultimateowner of j2 and of j5.
4.4 concert of shareholders
There are cases where several shareholders of a certain firm are directly or indirectly controlledby the same ultimate owner. We name each such (maximal) subset a concert of shareholders21.In the next section we will impose an assumption about the voting patterns of concerts ofshareholders. The following example illustrates this case.
In Figure 3 assume as in Figure 2 a majority quota qj = 50% for every firm j ∈ V \F , anda Shapley-Shubik power index with a fixed power threshold for control θ = 0.9. Using similarargumentation as in the analysis of Figure 2, we can say that j1 is the ultimate owner of firmj2 and of firm j3. When we observe firm j5’s set of shareholders Γ−(j5) = {j2, j3, j4}, werecognize that {j2, j3} is a concert of shareholders, since the two firms have the same ultimateowner (j1) and since it is a maximal set, as no other shareholder of j5 has j1 as its ultimateowner.
Definition 4.4 Let C be a subset of shareholders in some firm j. We say that C is a concertof shareholders if the following three conditions hold:
20The column of H representing the voting rights of the shareholders of firm j5. An entry of 0 in column j5means that the shareholder in that particular row has no direct holdings in j5, e.g. j1.
21Inspired by the definition in the City Code on Takeovers and Mergers (the Code), persons acting in concertare persons who, pursuant to an agreement or understanding (whether formal or informal), co-operate to obtainor consolidate control of a company or to frustrate the successful outcome of an offer for a company.
14

Figure 3: Concert of Shareholders
1. There exists one and only one vertex u, where u is the ultimate owner of each member ciof C.
2. For each ci ∈ C, there exists a control path P (u, ci) from u to ci such that P (u, ci) doesnot contain the firm j.
3. C is a maximal set for which conditions (1.) and (2.) hold.
The set of shareholders of a certain firm may contain several concerts of shareholders. How-ever, given the uniqueness of control relations and of the ultimate owner, these concerts mustbe disjoint sets.
Remark : We can weaken condition (1.) in Definition 4.4 by requiring that u only indirectlycontrol each member ci of C, i.e. u is not required to be an ultimate owner, and thus can becontrolled. In this case we say that C is a weak concert of shareholders.
4.5 Cycles
Real corporate networks may contain cross shareholdings (two companies that posses a stakeof each other’s shares), or in the general case be cyclic with respect to shareholdings. In somecases the shareholdings among the firms in a cycle are significant enough to be considered controlrelations by Definition 4.1. This setting might give rise to a simple closed control cycle of firmshaving direct control relations, where none of the firms contained in the closed cycle is controlleddirectly or indirectly by a shareholder outside the cycle. Formally we define:
Definition 4.5 A simple closed control cycle is a set of firms {j1, . . . , jn} ⊆ V \F for which thefollowing conditions hold:
15

Figure 4: A closed control cycle
1. For all k, l := 1, . . . ,m, jk indirectly controls jl
2. For all k := 1, . . . ,m, jk has no ultimate owner.
It is clear from Figure 4 that firm j1 controls firm j2, which controls firm j3, and that j3in turn controls j1. The presence of closed control cycles creates an ambiguity about the actualpower of a corporate shareholder j1 to dominate votes in a firm j2 that it controls, if in additionj2 controls j1 directly or indirectly. We address this issue in the next section by imposing anassumption about the validity of control in such cases.
16

5 Assumptions
So far we have introduced a single-firm-level mechanism for identifying control relations andprovided auxiliary definitions for indirect control, control path, concert of shareholders andclosed control cycle. In this section we shift our attention to the corporate-network level ofanalysis and extend our mechanism to complex ownership structures. Our approach relies onthe following five central assumptions:
Assumption 5.1 Control relations are effectively transitive.
We assume that indirect control relations effectively function as direct control relations. Thatis, if a shareholder is powerful enough to control a certain firm, and that firm in turn has directcontrol over another firm, we assume that the controller of former has the equivalent ability torealize its own will in any decision-making process in either firm. This concept of transitivity ofcontrol is assumed to extend further along possible control paths, such that the ultimate ownerhas the dominant say in major issues under vote in each firm that it indirectly controls.
Assumption 5.2 The unobserved minority shareholders do not participate in votes.
Specifically, we assume that the total unobserved voting rights are dispersed over an infinitelylarge number of ’minor’ owners. Then, following the argument of Grossman and Hart [37], wepostulate that shareholders with a very small stake would in most cases abstain from partici-pating in voting and company meetings, since the social benefit to monitoring by participationis far larger than the private benefit to any individual. In other words, because of the ’freerider’ problem not all shareholders will participate in the process of decision-making - it is thusmainly a contest between the large shareholders. Therefore, we normalize to 1 the fraction oftotal observed holdings in every firm j ∈ V \F .Consequently, if firm j is not a family, then itsobserved shareholders are assumed to hold together the entire stock of j.22
Assumption 5.3 Shareholders within the same concert vote in the same direction.
The meaning of this assumption is that we impose a departure from the equal probabilityassumption for coalitions in which some shareholders in a firm are controlled by the sameultimate owner. In other words, a pre-coalition structure is assumed to exist in this case witha priori unions of shareholders, where each such union votes as one bloc. We assume that theobligation to vote in a certain direction is dictated by the ultimate owner. Thus, if a certaincorporate shareholder is a member of a concert, a deviation from the concert into anothercoalition is likely to be correlated with severe negative payoffs. The concept of a priori unionsor pre-coalitions implies that certain coalitions will not form at all, i.e. will have a probability
22It is possible to incorporate models for the voting patterns of the unobserved dispersed shareholders insteadof normalizing (see [44, 11]).
17

of zero of forming (because shareholders that are controlled by the same ultimate owner cannotappear in separate coalitions). However, an underlying assumption for the indices we use tomeasure the power of an agent presupposes equal probability for each coalition. In order toavoid deviating from this independence assumption regarding power indices we will refer to suchblocs of shareholders (concerts) as one voter, i.e., a bloc whose weight is equal to the sum of theweights of its members. Thus, for each bloc we will calculate the power index of the entire blocrather than the individual index of each member [5, 4, 20].
Assumption 5.4 Shareholders outside concerts and different concerts vote independently.
The only systematic pre-determined coalition structure in our model is the one derived fromcontrol relations, i.e., the concert of corporate shareholders (in which shareholders controlledby the same ultimate owner vote in the same direction). In our technical analysis we will notconsider non-systematic ad-hoc unions or alliances based on incidental or temporary conver-gence of interests. Such non-systematic occurrences are random, and consequently any furthercorrelation in the pattern of voting by shareholders requires imposing extra assumptions andrestrictions on the distribution of the coalition’s formation. In cases where voting behavior isnot dictated by an external authority, and since interests are usually hidden, not measurable,and diverge and converge randomly, extra assumptions about the temporary voting tendenciesof shareholders are extremely difficult to justify without further data about the preferences ofthese shareholders. Therefore, we shall adopt the independence assumption regarding the votingpatterns outside concerts of shareholders.
Assumption 5.5 Control relations in a ”closed control cycle” cancel each other.
Closed control cycles raise a difficult issue in analyzing control relations, since they create ambi-guity about the corporate shareholders’ power to dominate votes in firms belonging to the samecycle. We assume that the closed control cycle structure neutralizes the effects of the directcontrol relations composing the cycle. Otherwise, if we take j1 and j2 to be corporate share-holders such that j1 indirectly (directly) controls j2 and vice versa, then regarding the relationsbetween these two firms as control relations according to our conceptual framework would becounterintuitive and ambiguous, especially when the interests of j1 and j2 diverge. Therefore,we will not consider the control relations of closed control cycles of firms in our results. Theexception is the case where at least two firms within a control cycle are directly controlled bythe same ultimate owner. Since this ultimate owner is not subordinated to any of the cyclefirms, it can thus impose decisions through direct and indirect control relations. This case canreflect the interpretation that companies in dominated cross-ownership structures are linked byhorizontal cross-holdings of shares that reinforce and entrench the power of a ’central’ controller[24], which in our case is the ultimate owner.
18

Figure 5: A control cycle with an ultimate owner
In Figure 5 j1 is the ultimate owner of firms {j2, j3}, {j1, j2} is the controlling concert23 ofshareholders in firm j3, and {j1, j3} is the controlling concert of shareholders in firm j2.
23For a detailed discussion of control by a concert, see Section 6.1.
19
6 Extending the definitions by using concerts of shareholders
In this section we refine our formal model to accommodate control by a concert of shareholders.We apply the assumptions stated in the previous section to control by a concert of shareholdersin order to provide extended definitions for indirect control, control path and closed controlcycle. These definitions will become useful in Section 7 when we present our method.
6.1 Control by a concert of shareholders
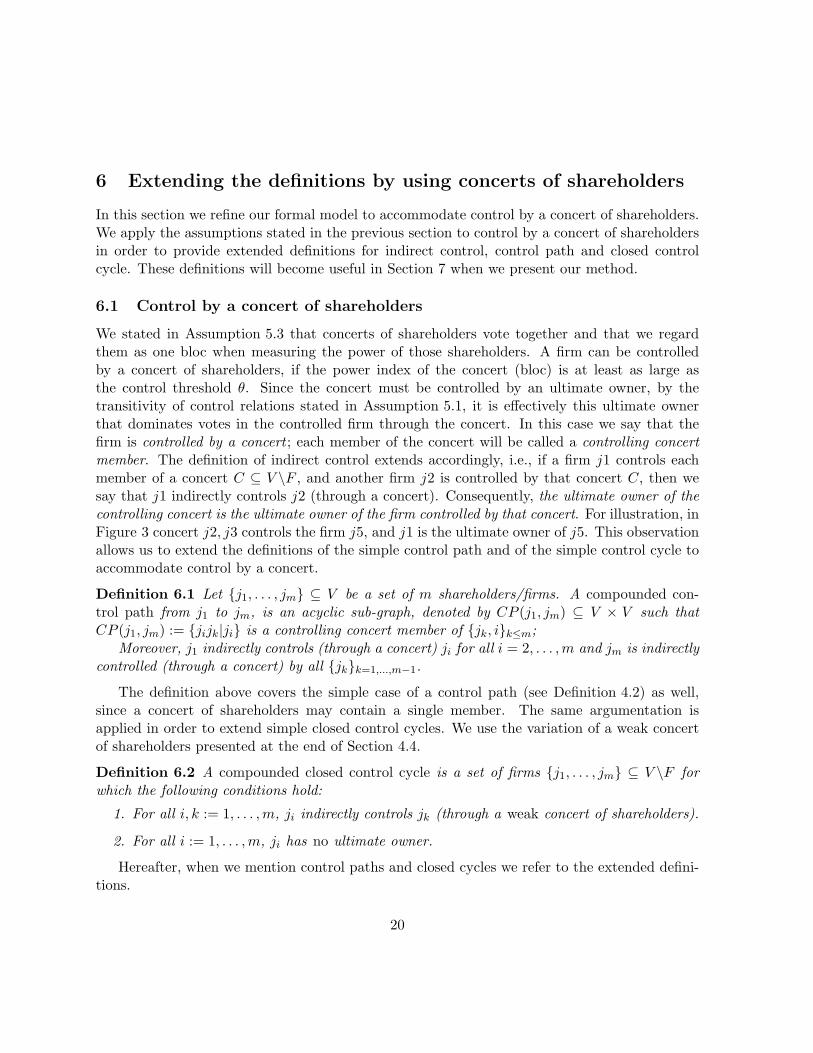
We stated in Assumption 5.3 that concerts of shareholders vote together and that we regardthem as one bloc when measuring the power of those shareholders. A firm can be controlledby a concert of shareholders, if the power index of the concert (bloc) is at least as large asthe control threshold θ. Since the concert must be controlled by an ultimate owner, by thetransitivity of control relations stated in Assumption 5.1, it is effectively this ultimate ownerthat dominates votes in the controlled firm through the concert. In this case we say that thefirm is controlled by a concert ; each member of the concert will be called a controlling concertmember. The definition of indirect control extends accordingly, i.e., if a firm j1 controls eachmember of a concert C ⊆ V \F , and another firm j2 is controlled by that concert C, then wesay that j1 indirectly controls j2 (through a concert). Consequently, the ultimate owner of thecontrolling concert is the ultimate owner of the firm controlled by that concert. For illustration, inFigure 3 concert j2, j3 controls the firm j5, and j1 is the ultimate owner of j5. This observationallows us to extend the definitions of the simple control path and of the simple control cycle toaccommodate control by a concert.
Definition 6.1 Let {j1, . . . , jm} ⊆ V be a set of m shareholders/firms. A compounded con-trol path from j1 to jm, is an acyclic sub-graph, denoted by CP (j1, jm) ⊆ V × V such thatCP (j1, jm) := {jijk|ji} is a controlling concert member of {jk, i}k≤m;
Moreover, j1 indirectly controls (through a concert) ji for all i = 2, . . . ,m and jm is indirectlycontrolled (through a concert) by all {jk}k=1,...,m−1.
The definition above covers the simple case of a control path (see Definition 4.2) as well,since a concert of shareholders may contain a single member. The same argumentation isapplied in order to extend simple closed control cycles. We use the variation of a weak concertof shareholders presented at the end of Section 4.4.
Definition 6.2 A compounded closed control cycle is a set of firms {j1, . . . , jm} ⊆ V \F forwhich the following conditions hold:
1. For all i, k := 1, . . . ,m, ji indirectly controls jk (through a weak concert of shareholders).
2. For all i := 1, . . . ,m, ji has no ultimate owner.
Hereafter, when we mention control paths and closed cycles we refer to the extended defini-tions.
20

Figure 6: A compounded closed control cycle
6.2 Changes in the control threshold
Incorporating the analysis of the single corporation into the network context depends on thecomplete distribution of ownership within the corporate network. There are cases in which aconcert controls a firm for some control threshold θHigh, but does not control the same firm for alower threshold θLow. This is possible since a low enough control threshold like θLow may inducethe creation of other concerts of shareholders whose voting rights are sufficiently large to rivalthe original concert (that controlled the firm for the higher threshold condition θHigh) and thusto eliminate its control or even to become the controller instead.
We focus on the extraction of a corporate network presented in Figure 7, where {j2, j3, j4, j5, j6, j7, j8, j10}are firms and {j1, j9} are families. Assume that for some control threshold θLow = 0.6 we iden-tify family j1 as the controller of all the firms {j2, j3, j4, j5, j6, j7, j8} which thus constitute aconcert of shareholders C in firm j10. Since the concert C holds together 54% of the votingrights, it has a power index of 1 which is greater than θLow in firm j10. Therefore, this concertcontrols the firm j10 and it follows that in this case j1 is the ultimate owner of firm j10. Letus now choose a higher control threshold θHigh = 0.7 (such that θHigh = 0.7 > θLow = 0.6)and such that the power index of family j1 would be too small to control any of the firms{j2, j3, j4, j5, j6, j7, j8}. Those firms will no longer constitute the concert C in j10 as beforeand thus the voting distribution within the firm j10 is different from the case of θLow by beingmore scattered (since the concert C is eliminated) and thus presenting a weaker opposition tofamily j9. Given this more scattered distribution, family j9 has a power index of 0.75 in firmj10 which is greater than θHigh = 0.7, thus it would be identified as the controller (and ultimateowner) of firm j10 as opposed to the case of θLow. The effect of a control threshold change onthe control status of a firm, when taking the corporate network into consideration, is more com-plex to analyze than the case of a single firm and its shareholders when neglecting the network
21

Figure 7: Extraction of a corporate network to illustrate the network effect of a change in thecontrol threshold
structure. This is because changing the control threshold involves not only the direct effect -the control threshold of the voting game within a specific firm, but also the indirect networkeffect - through voting games in other firms and their influence on the creation of concerts ofshareholders in that firm. In other words, the original voting game in a firm j, gj (W1, q, θ1),changes into the voting game gj (W2, q, θ2), where Wi, i = 1, 2, is the set of weights of the directconcerts of shareholders, and q is the majority quota in this firm. The direct effect is due tothe change of θ1 into θ2, whereas the indirect effect is represented by the change of W1 into W2.Following the example of Figure 7 we have gj10 (W1, 50%, 0.6) where W1 = {54%, 46%}, andgj10 (W2, 50%, 0.7) where W2 = {7%, 7%, 8%, 8%, 8%, 8%, 8%, 46%}.
22

Figure 8: Example of a simple market
7 The algorithm
We present here a fully integrated algorithm that is able to analyze control relations in any com-plex ownership structure, and to transform a given input-output matrix of ownership (cash-flowrights) into a corresponding Boolean matrix of control. For this purpose we will use the specificmarket model from Figure 8 as a visual simplification to accompany an intuitive presentation ofour method. For a formal description see Appendix A. The input-output matrix of ownership
describing the market in Figure 8 is: H :=
0 100 60 0 00 0 0 0 200 0 0 0 400 0 0 0 400 0 0 0 0
Step 1 - Power index test for control: Assume a majority quota qj = 50% for every firm
j ∈ V \F and a Shapley-Shubik power index test with θ = 0.9. By considering that shareholdersoutside concerts and different concerts vote independently, as stated in Assumption 5.4), wecalculate the power index24 of the shareholders in each of the firms {j2, j3, j5}, which yields thematrix of power P , defined such that pi,j represents the power index of shareholder i in firm j.
24Although power analysis has been very restricted due to computational considerations, recent work [43] hasprovided means to overcome this difficulty using tractable approximating power indices with a very high accuracy.We have used the algorithms suggested in that work to perform our analysis, which is heavily based on powerindex computation.
23

Figure 9: Updated network after clustering and replacing concerts of shareholders
P :=
0 1 1 0 00 0 0 0 2/30 0 0 0 1/60 0 0 0 1/60 0 0 0 0
From column 2 we learn that family j1 controls firm j2, since p1,2 = 1 > θ = 0.9. By the
same argumentation, family j1 controls firm j3. However, since none of the shareholders of firmj5 has a power index that is at least as large as θ = 0.9, this company is not controlled.
Thus, the temporary Boolean matrix of control C after step 1 is:
C :=
0 1 1 0 00 0 0 0 00 0 0 0 00 0 0 0 00 0 0 0 0
C is defined such that ci,j = 1 if and only if shareholder i is a member of a concert that
controls the firm j.Step 2 - Ultimate owners: For each controlled firm we find its ultimate owner by climbing
up the (compounded) control paths that lead to the controlled firm. Once the ultimate owneris identified, we update the pair (Firm,UltimateOwner) to an ultimate-owners information setU , defined by U := {(j, u) ⊆ V × V : u is the ultimate owner of firm j}. Thus, in our example,U = {(j2, j1), (j3, j1)}. If a firm is involved in a closed control cycle then it is not added to theinformation set, since it has no ultimate owner.
Step 3 - Concerts of shareholders:For the set of shareholders of each firm j, i.e. Γ−(j), we use the ultimate-owners infor-
mation set U to find concerts of shareholders. We then calculate the voting power of each
24

Figure 10: Identified Control Relations
concert by summing the shareholders’ weights, assuming that they vote in the same direction(Assumption 5.3). Furthermore, we replace the concert with its ultimate owner, which effectivelycontrols the concert’s decisions, as suggested in Assumption 5.1. In our example, when observ-ing firm j5’s set of shareholders Γ−(j5) = {j2, j3, j4} as well as the set U = {(j2, j1), (j3, j1)}we can qualify {j2, j3} as a concert of shareholders. Summing up the voting rights of j2 andj3 and replacing them with j1 yields the updated network represented in Figure 9 and in thecorresponding updated matrix Hupdated.
Hupdated :=
0 100 100 0 600 0 0 0 00 0 0 0 00 0 0 0 400 0 0 0 0
We then carry out a second iteration, repeating steps 1 and 2, which results in:
P :=
0 1 1 0 10 0 0 0 00 0 0 0 00 0 0 0 00 0 0 0 0
C :=
0 1 1 0 10 0 0 0 00 0 0 0 00 0 0 0 00 0 0 0 0
U = {(j2, j1), (j3, j1), (j5, j1)}Repeating step 3 in order to update the ownership matrix for concerts will not change
25

Hupdated, since the concerts’ structure is the same as before. Therefore, P , C and U will alsonot change, since they are derived from Hupdated. This outcome will thus remain fixed for allsubsequent iterations, and therefore the algorithm has converged into a solution. The controlrelations in the market in our example are represented by Figure 10 and by the correspondingBoolean matrix of control B25,26.
B :=
0 1 1 0 00 0 0 0 10 0 0 0 10 0 0 0 00 0 0 0 0
The algorithm is not additive in the sense that during the iterative process the number
of ”adjusted” corporate shareholders in the updated matrix of ownership does not necessarilydiminish as a result of clustering firms into concerts of shareholders and replacing them with theircorresponding ultimate owners. An intuitive reason is that that it might take several iterationsuntil a concert is identified, and a concert that, in early iterations, appears to control a firmmight ”lose” its control in a later iteration. This might occur because of the formation of anotherrival concert of shareholders. Furthermore, losing control over a certain firm might cause otherconcerts to break, form, or lose or gain control in other firms that are connected to the originalfirm throughout the network. However, the total number of identified control relations in eachiteration cannot be smaller than the number of that iteration. Since the number of shareholderswithin the network is finite (which is the case in real-world situations) and thus the numberof possible control relations is bounded, our algorithm always converges to a solution that canbe obtained after a finite number of iterations. Under the assumptions stated in section 5, weformulate the theoretical principle of our method as follows: Let the network of shareholdingrelationships among a set V of n firms and shareholders be described by the n × n adjacencymatrix H ∈ [0, 1]n×n as defined in Section 4.1. Given a majority quota q ∈ (0, 1] and powerindex threshold θ ∈ (0.5, 1], denote by Ψ a mapping Ψ : [0, 1]n×n × (0, 1]× (0.5, 1]→ {0, 1}n×n :(H, q, θ) 7→ Ψ(H, q, θ) := F from the initial input-output matrix of holdings H to a sub-networkof control relations F described by the n×n adjacency matrix F ∈ {0, 1}n×n. The set VC ⊆ V isthe set of firms and shareholders participating in control relations. If a firm is not controlling orcontrolled, then it is represented as a disconnected vertex, i.e. for all s ∈ V \VC we have Fsj = 0and Fjs = 0, j = 1, . . . , n. F satisfies the following: A firm j is controlled by shareholder i ifand only if i is a member of a concert of shareholders controlling firm j. Formally, Fij = 1 ifand only if there exists B := Γ−VC
(j) ⊆ Γ−V (j) - a concert of shareholders (possibly with only oneshareholder) in firm j such that PowerIndexj(B) > θ and i ∈ B. In other words, the powerindex of the concert B to which shareholder i is associated, when calculated as one bloc in thegame gj with majority quota q, is greater than θ. The control matrix F , which represents all
25A firm/shareholder that does not participate in control relations (family j4 in this example) will have allentries in its corresponding row and column equal zero, and will not be included in the solution.
26Notice that h2,5 = 1 and also h3,5 = 1, which means that firm j5 is controlled by a concert.
26

control relations, is a directed network where each edge links each shareholder of a controllingconcert to the controlled firm in a direct control relation. This network is composed of disjointmaximal connected components. Each maximal connected component is arranged as a directedtree with a specific shareholder as the root (the ultimate owner).
Proposition 7.1Given the ownership matrix H,a majority quota q and a power index threshold θ, as definedabove, then the algorithm proposed in this section and formally in Appendix A:
1. Converges to a solution (control network) after a finite number of iterations.
2. This solution is exclusive (or correct) in the sense that every identified control relationbetween a shareholder (concert) and a firm is valid, and no other shareholder (concert)can be the controller of that firm (it also excludes the possibility that the firm is widelyheld).
3. The solution is exhaustive, in the sense that it identifies all control relations.
In other words our algorithm accepts H, q and θ as inputs and its output is the control matrixFAlgo with the above properties. Thus, the mapping Ψ exists and is well defined, and Ψ(H, q, θ) =F can be identified with our algorithm’s output of control matrix, FAlgo. That is, F = FAlgo.
Proof: In Appendix B.
27

8 Application and Results
We implemented our algorithm into a Java computer program and tested it on a real-world dataset of holdings in the Israeli market between the years 1995 and 2009. In this section we provideseveral results based on our algorithm.
Our source is the ownership data for 650 listed Israeli companies - the whole populationof publicly traded firms on the Tel Aviv Stock Exchange. Our sample comes from the TelAviv Stock Exchange electronic reports on ownership distribution in each listed company, andspecifically the data regarding the percentage holdings of the principal shareholders (partiesof interest with a holding over 5 percent). At the first stage we identified on average 2300owners (i.e., potential controllers) per month. These owners are heterogeneous, and include localindividuals (55%), private companies (21%), foreign owners (10%), publicly traded companies(8%) and trusts and partnerships (6%). Since the available official information does not includeholdings in private companies we added data on ultimate owners of these companies27, whichwe collected manually from the Registrar of Companies’ database in the Ministry of Justice.In cases where identification was successful, we re-attributed the shareholdings held by privatefirms to their ultimate owners. If we could not identify the ultimate owner, then the privatecompanies’ shareholdings remained unchanged. Next, we examined the extended set of allindividual shareholders and clustered them, when possible, into groups defined by family ties.We assumed that every family votes and owns its shares collectively SAF2. The adjusted set ofcorporate owners comprised 2700 parties of interest on average for each month. According toassumption 1 the unobserved minority shareholders do not participate in votes; therefore, wenormalized the total shareholdings of parties of interest in each firm to 100 percent28.
8.1 Controlled public firms for different control thresholds
We examined the percentage of controlled public firms out of the total number of public firms foreach month between April 1995 and April 2009. We ran the algorithm four times, with controlthresholds of θ = 1 and θ = 0.5 + ε, the highest and lowest boundaries for the control thresholdrespectively: two runs with the Shapley-Shubik power index (denoted SS in the figure); as wellas two runs with the Banzhaf power index (denoted B in the figure). Figure 11 summarizes theresults of those runs across consecutive time points.
28

Figure 11: Percentage of controlled public firms for different control thresholds
29

Figure 12: Ultimate owners and controlled public firms in maximal control components contain-ing at least two public firms in the Israeli market for April 2009
30

8.2 Maximal control components containing at least two public firms in theIsraeli market for April 2009.
In Figure 12 the vertices represent firms and shareholders, and the edges represent controlrelations29. Shareholders within the same tree that are located above a firm and are connected toit by edges are the controlling concert of that firm, and the root of the tree is the ultimate owner.Since we identified many firms participating in control relations, for the clarity of illustration, wechose to visualize only ultimate owners and public firms in control components that containedat least two controlled public firms (and thus removed the private firms from the figure).
8.3 Comparison with the cut-off point method
In this section we examine the results of our method vs. the results derived from cut-off pointmethod on a real-world data set of holdings in the Israeli market. For the application of ourmethod, we chose the Shapley-Shubik power index with control threshold parameter θ = 0.75 ;and for the cut-off method we followed the widely-used 20% rule - i.e. the corporate controller(ultimate owner) was identified if this shareholder’s direct and indirect voting rights in the firmexceeded 20 percent [33]. The following table summarizes the comparison of the main resultsand refers to the control status of listed Israeli companies as of April 2009:
Table 1: Comparison of the empirical results provided by the power indices based method andthe 20% cut-off point rule, April 2009.Category Algorithm SS 0.75 20% cut-off
1 Total number of identified controlled firms 425 5342 Identified as controlled in ONLY one method 13 1223 Identified as controlled in both methods 4124 - out of which (3) firms with different ultimate owner 315 - Identified with the same controller and ultimate owner 381
The analysis of the results shows that both methods identify the same controllers and ulti-mate owners for 381 (category 5) firms. However, for a total of 166 firms (categories 2 and 4) theresults are significantly different. Such difference, at the sampled time point (April 2009), ac-counted for 25% of the total market value30. A more detailed analysis of the discrepancy betweentwo methods is provided below. As can be seen from Table 1, the ”cut-off method” identifies
27This procedure is not essential for using our method. Running the algorithm without incorporating the”adjusted” shareholding data would still yield correct results with respect to the input information.
28Precise knowledge or different assumptions regarding the voting patterns of the unobserved minority can beeasily incorporated instead of normalizing.
29After running the algorithm for θ = 0.830Not including ”Teva”.
31

Figure 13: First example of a weakness of the 20% cut-off-rule in accurately identifying control
Figure 14: Shapley-Schubik Power Index of Controllers Identified by the 20% cut-off rule only
122 controlled firms, or 8.6% in terms of market value, that are considered non-controlled by themethod presented in this paper. A careful examination of the ownership structure of these firmsreveals that in most cases despite the fact that controller holds a significant stake (more than20% by construction) there are other shareholders that hold large blocks as well and thus arepresenting a potential strong opposition to the controller. In these situations the distributionof power among the rest of the shareholders questions the possibility of the identified controller(by the cut-off method) to effectively exercise control.
Figure 13 shows a true representative case in which the 20% cut-off method identified acontroller and our method did not.
The histogram in Figure 14 shows the power index of the controllers in the 122 firms thatthe cut-off method identifies as controlled, which are considered non-controlled by our method.The most important implication of Figure 14 is that in about 85% of those firms the controller,who was identified (only) by the 20%-rule, has a power index lower than 0.5. In other words,due to the distribution of power in those firms, the assumed controller does not achieve a pivotal
32

Figure 15: Second example of a weakness of the 20% cut-off-rule in accurately identifying control.The cut-off method identified j5 as the controller and ultimate owner of j6, however since j1controls the concert j2,j3 they are likely to vote as one block with 24% which matches exactlythe stake of j5. Therefore, our method identified firm j6 as not controlled.
position in more than 50% of the cases. Accepting the fact that such a shareholder controls afirm by virtue of voting rights (holdings) is not in accord with our definition of effective control.Moreover, the cut-off method does not examine the entire sub-networks in which firms areembedded, and thus misses the fact that some non-controlling shareholders may form concertsand thus vote in the same direction. This leads again to a different distribution of power andto a greater potential opposition to the shareholder who was identified as a controller.
Figure 15 shows a true representative case in which the 20% cut-off method identified acontroller and our method did not.
Regarding the 13 companies which are identified as controlled by using our method and aswidely-held by the cut-off rule, we find that the total market value of these firms exceeds 6.3%- this in comparison with 8.6% of 122 companies identified as controlled by cut-off method only- and that their market activity is concentrated primarily in banking, computers and electronicsectors. A fascinating observation, however, is that the list of these companies includes one ofthe two biggest Israeli banks - Bank ”Hapoalim”. In this case as well as in the rest of the casesin which our method uniquely identifies corporate controllers and the cut-off method does not,the controller holds less than 20% of the corporate voting rights but, in line with the proposedmethodology, is powerful enough to obtain effective control of the firm.
The last bone of contention between two methods is the discrepancy about the identity ofultimate owners. We find that among 31 firms (10.25% of total market value) four relativelybig companies (7.23% of total market value) are affiliated with 3 different business groups,while in 27 other cases the ultimate owners are not the same. Besides the numerical differencesprovided in this section, the implications of choosing the identification strategy is of concern.
33
The discrepancy about the controller’s identity between the two methods 31 in our particularexample raises concerns about the robustness of empirical analysis related to corporate gover-nance in other cases. Thus, for example, identifying the largest blockholder as a controller inthe presence of other large shareholders is questionable. The phenomena of multiple dominantshareholders which is well documented in different studies [33, 25] and appears also in 122 com-panies in our example above has different implications than the existence of a single ultimateowner. These implications are linked strongly to shareholders power, corporate performance,valuation and governance issues in companies with concentrated ownership [27, 9, 29, 3] In suchcases, the misspecification of the corporate control structure, while using the cut-off method,can lead, at best, to biased or insignificant empirical results. In other scenarios, however, aninappropriate identification strategy can result in mechanisms that are simply inadequate for thechallenges facing policy makers while coping with the consequences of principal-agent problems,or even counterproductive. Despite the fact that by using the cut-off method one can simplifythe calculation process of identifying control relations and especially those in complex owner-ship structures, adopting more accurate and methodologically based approach - as provided inthis paper - seems to significantly reduce many potential sources of bias and to avoid seriousmeasurement errors.
31In the Israeli case we find disagreement between the two methods for 166, or 25% from the total populationof listed companies and 25% of total market capitalization.
34

9 Summary and conclusions
In the present study we provide a new method for identifying control relations on the corporatelevel and especially in complex ownership structures. We argue that a complete identificationof such relations is possible only by incorporating the analysis of the single corporation into thenetwork context and vice versa. In other words, in order to obtain the exact and comprehensivemap of corporate control in any given market, the aspects of control of a particular firm and thecontrol paths that involve that firm must be treated simultaneously. For this purpose we applyweighted voting games as a theoretical framework for our analysis and use the Shapley-Shubikand the Banzhaf power indices to determine the voting power of shareholders. Given the exactdistribution of voting rights in a specific firm we define the direct controller as the shareholderwho is pivotal in most decision making processes. Subsequently, from our definition of directcontrol we derive the following essential concepts: indirect control, ultimate owner, concert ofshareholders and control cycle. These concepts allow us to shift our focus to the corporate-network level of analysis and extend our mechanism to complex ownership structures. Ourapproach for the identification strategy relies on five central assumptions: 1) control relationsare effectively transitive; 2) the unobserved minority shareholders do not participate in votes;3) shareholders within the same concert vote in the same direction; 4) shareholders outsideconcerts and different concerts vote independently; and 5) control relations in a ”closed controlcycle” cancel each other out. We integrate our analytical framework and assumptions to presentan algorithm that is able to analyze control relations in any complex ownership structure, andprove that if the number of firms within the network is finite (which is the case in real-worldsituations) then there always exists a solution that can be obtained after a finite number ofiterations, and it is unique. Thus, our algorithm is well defined. In the next stage we implementour algorithm into a Java computer program and test it on a real-world data set of monthlyholdings in the Israeli market between the years 1995 and 2009. For the empirical compatibilitytest we use an input-output matrix of cash flow rights of approximately 650 listed companies -the whole population of public companies on the Tel Aviv Stock Exchange. The direct productof the analysis of these data is a comprehensive map of control relations at every time point.Moreover, we find that the corporate control relations identified by our method are richer andmore accurate than those provided by different official sources (e.g. Israel Securities Authority,Banking Supervision department in the Bank of Israel, etc.).
35

References
[1] Berle Adolf A. and Gardiner Means. The modern corporation and private property. HarcourtBrace and World, New York,NY, 1932.
[2] Dahl Robert A. The concept of power. Behavioral Science, 20:201–215, 1957.
[3] Edmans Alex and Gustavo Manso. Governance through trading and intervention: A theoryof multiple blockholders. Review of Financial Studies, forthcoming, 2010.
[4] Alonso-Meijide, Jos M., and Carlos Bowles. Modification of the banzhaf value for gameswith a coalition structure. Annals OR, 109(1-4):213–227, 2002.
[5] Alonso-Meijide, Jos M., and Carlos Bowles. Generating functions for coalitional powerindices: An application to the imf. Annals OR, 137(1):21–44, 2005.
[6] Laruelle Annick and Federico Valenciano. Shapley-shubik and banzhaf indices revisited.Mathematics of Operations Research, 126(1):89104, 2001.
[7] Chapelle Ariane and Ariane Szafarz. Controlling firms through the majority voting rule.Physica A, 335:509–529, 2005.
[8] Peleg B. Coalition formation in simple games with dominant players. International Journalof Game Theory, 10(1):11–33, 1981.
[9] Maury C. Benjamin and Anete Pajuste. Multiple large shareholders and firm value. Journalof Banking and Finance, 29:1813–1834, 2005.
[10] Jensen Michael C. and William H. Meckling. Theory of the firm: Managerial behavior,agency costs and ownership structure. Journal of Financial Economics, 3(4):305–360, 1976.
[11] Leech Dennis. Corporate ownership and control: A new look at the evidence of berle andmeans. Oxford Economic Papers, 39(3):534–551, 1987.
[12] Leech Dennis. The relationship between shareholding concentration and shareholder votingpower in british companies: a study of the application of power indices for simple games.Management Science, 34(4):509–527, 1988.
[13] Leech Dennis. An empirical comparison of the performance of classical power indices.Political Studies, 50(1):1–22, 2002.
[14] Banzhaf John F. Weighted voting doesnt work: A mathematical analysis. Rutgers LawReview, 19:317343, 1965.
36

[15] Dan S Felsenthal and Moshe Machover. The measurement of voting power: Theory andpractice, problems and paradoxes. Edward Elgar, Northampton, MA, 1998.
[16] Demsetz Harold and Kenneth Lehn. The structure of corporate ownership: Causes andconsequences. Journal of Political Economy, 93(6):1155–1177, 1985.
[17] Hauswald Robert B.H.and Ulrich Hege. Ownership and control in joint ventures: Theoryand evidence. Journal of Finance, 11:42–64, 1980.
[18] Almeida Heitor, Sang Yong Park, Marti G. Subrahmanyam, and Daniel Wolfenzon. Thestructure and formation of business groups: Evidence from korean chaebols. Journal ofFinancial Economics, 99:447–475, 2010.
[19] Almeida Heitor and Daniel Wolfenzon. Should business groups be dismantled? the equilib-rium costs of efficient internal capital markets. Journal of Financial Economics, 79:99–144,2006.
[20] Holler Manfred J. and Stefan Napel. Local monotonicity of power: Axiom or just a property.Quality and Quantity, 38:637–647, 2004.
[21] Glattfelder James. Ownership networks and Corporate Control: Mapping Economic Powerin a Globalized World. PhD thesis, ETH, Zurich, Swiss, 2010.
[22] Cubbin John and Dennis Leech. The effect of shareholder dispersion on the degree of controlin british companies: theory and measurement. Economic Journal, 93:351–369, 1983.
[23] Morck Randall K., Daniel Wolfenzon, and Bernard Yeung. Corporate governance, economicentrenchment, and growth. Journal of Economic Literature, 43:657–722, 2005.
[24] Bebchuk Lucian A.and Reiner H. Kraakman and George G. Triantis. Stock pyramids, cross-ownership, and dual class equity. In Randall K. Morck, editor, Concentrated CorporateOwnership. University of Chicago Press, Chicago, Ill, 2000.
[25] Laeven Luc and Ross Levine. Complex ownership structures and corporate valuations. TheReview of Financial Studies, 21(2):579–604, 2008.
[26] Faccio Mara and Larry H. P. Lang. The ultimate ownership of western european corpora-tions. Journal of Financial Economics, 65:365–395, 2002.
[27] Bennedsen Martin and Daniel Wolfenzon. The balance of power in closely held corporations.Journal of Financial Economics, 58:113–139, 2000.
[28] Zeitlin Maurice. Corporate ownership and control: The large corporation and the capitalistclass. The American Journal of Sociology, 79(5):1073–1119, 1974.
37

[29] Attig Najah, Omrane Gudhemai, and Dev Mishra. Multiple large shareholders, controlcontests, and implied cost of equity. Journal of Corporate Finance, 14:721–737, 2008.
[30] Baron David P. and John A. Ferejohn. Bargaining in legislatures. The American PoliticalScience Review, 83(4):1181–1206, 1989.
[31] Dubey Pradeep and Lloyd S. Shapley. Mathematical properties of the banzhaf power index.Mathematics of Operations Research, 4(2):99–131, 1979.
[32] La Porta Rafael, Florencio Lopez de Silanes, and Andrei Shleifer. Law and finance. Journalof Political Economy, 106:1113–1155, 1998.
[33] La Porta Rafael, Florencio Lopez de Silanes, and Andrei Shleifer. Corporate ownershiparound the world. Journal of Finance, 54:471–517, 1999.
[34] Felsenthal Dan S. and Mosh Machover. A priori voting power: What is it all about?Political Studies Review, 2:1–23, 2004.
[35] Penrose Lionel S. The elementary statistics of majority voting. Journal of the RoyalStatistical Society, 109(1):5357, 1946.
[36] Shapley Lloyd S. and Martin Shubik. A method for evaluating the distribution of power ina committee system. American Political Science Review, 48(3):787792, 1954.
[37] Grossman Sanford and Oliver Hart. Takeover bids, the free-rider problem, and the theoryof the corporation. Bell Journal of Economics, 11:42–64, 1980.
[38] Edwards Jeremy S.S. and Alfons J. Weichenrieder. Control rights, pyramids, and themeasurement of ownership concentration. Journal of Economic Behavior and Organization,72:489–508, 2009.
[39] Claessens Stijn, Simeon Djankov, and Larry H.P. Lang. The separation of ownership andcontrol in east asian corporations. Journal of Financial Economics, 58(1-2):81–112, 2000.
[40] Max Weber. Economy and Society: An Outline of Interpretative Sociology. Bedminster,New York, NY, 1968.
[41] Deng Xiaotie and Christos H. Papadimitriou. On the complexity of cooperative solutionconcepts. Mathematics of Operations Research, 19(2):257266, 1994.
[42] Matsui Yasuko and Tomomi Matsui. Np-completeness for calculating power indices ofweighted majority games. Theoretical Computer Science, 263(1-2):305310, 2001.
[43] Bachrach Yoram, Evangelos Markakis, Ariel D. Procaccia, Ezra Resnick, Jeffrey S. Rosen-schein, and Amin Saberi. Approximating power indices: Theoretical and empirical analysis.Journal of Autonomous Agents and Multi-Agent Systems, 20(2):105–122, 2010.
38

[44] Crama Yves and Luc Leruth. Control and voting power in corporate networks: Conceptsand computational aspects. European Journal of Operational Research, 178:879893, 2007.
39

A The Algorithm
We present Algorithm 1, which is our main algorithm for calculating control graphs. Inthis algorithm, we maintain a set of pairs, namely PairsGroup, in which every pair representsa control relation. We build this set iteratively until it stops changing, and together with themarket itself, it represents the control graph in the market. In every iteration the algorithm usesthe following methods sequentially (the complexity measures relate to the number of companiesin the market):
In Algorithm 2 , for every company, we go over every control component we have identified sofar (represented by the root of the control component) and sum its holdings in the companyas follows. We sum the holdings of the mothers in the control component, and then replacethose mothers by attributing their direct holdings (the summed mothers’ holdings) to theroot of the control component. This is done in order to convey the coalition’s holdings,which are relevant when referring to the power division among the company shareholders.The complexity of this algorithm is O(N2).
In Algorithm 3 , we simply go over each company, and change the holdings of its currentmothers according to the scores given to them by the chosen test. In tests that require anexponential number of calculations, we use an approximation algorithm that calculates thevoting power over 1
ε2log(1
δ ) samples, where ε is the required accuracy, and δ is the requiredconfidence level. We denote this number of samples as k. Therefore, the complexity ofthis algorithm is O(Nk).
In Algorithm 4 , for each company, we leave only dominating mothers, i.e., we delete theholdings of mothers that are not dominant according to the given test and threshold. Wenote that there cannot be more than one dominant mother, and therefore if two mothers’holdings are above the control threshold and are the same, both of them will be deleted.The complexity of this algorithm is O(N2).
In Algorithm 5 , we deal with the special case of control cycles. We do this by going over everyroot (which inherently cannot be a part of a cycle), and then recursively going through thegraph (DFS - Depth-first search), while keeping track of the route throughout the searchin order to know when a cycle is reached. We then check if it is a true control cycle, andthen unify the new cycle with the other correlated ones. The complexity of this algorithmis O(N2).
In Algorithm 6 , we extract the new control relations from the process, and create a set ofpairs NextPairGroup. The complexity of this algorithm is O(N2).
Eventually, due to the fact that the paths of control, represented through PairsGroup,constantly grow until the algorithm stops; we conclude that the main loop in the algorithm runs
40

O(N) time. Therefore, the complexity of our main algorithm is O(kN2) for markets with largebreadth (i.e. many companies hold every company in the market), and O(N3) for those withsmall breadth.
Algorithm 1 Attaches the controlling root to each company1: procedure CreateDominationTrees(Market)2: NextPairsGroup←() . Holds pairs of companies and their attached roots so far3: while NextPairsGroup6=PairsGroup do4: PairsGroup←NextPairsGroup5: NewMarket←V alidCoalitionJoining(Market, PairsGroup)6: NewMarket←RunTest(NewMarket, TestType, Threshold,Majority)7: NewMarket←DirectControlRelation(newMarket, Threshold)8: NewMarket←DealWithCycles(newMarket, PairsGroup)9: NextPairsGroup←SingleControllerThroughPathes(newMarket)
10: end while11: Return PairsGroup,Market12: end procedure
41

Algorithm 2 For every company, removes mothers from the same coalition, and puts an edgefrom the root with the sum of holdings
1: procedure ValidCoalitionJoining(Market, PairsGroup)2: for comp in companies(NewMarket) do3: Pcomp←Mothers(comp)4: PcompPairsGroup←AttachRoot(Pcomp, PairsGroup)5: for root in Roots(PcompPairsGroup) do6: if root6=comp then7: PcompRoot←sons(PcompPairsGroup, root) . comp’s parents ∩ root’s
descendants8: sum←Sum the direct holdings of PcompRoot in comp9: in Market, Delete all holdings of companies from PcompRoot in comp
10: in Market, Add holdings for root in comp, that equal to sum11: end if12: end for13: end for14: Return Market15: end procedure16:
17: procedure AttachRoot(CompanySet, PairsGroup)18: NewPairsGroup←()19: for p in CompanySet do20: if there exists Z s.t. (z, p)∈PairsGroup then21: Add (z, p) to NewPairsGroups22: else23: Add (p, p) to NewPairsGroups24: end if25: end for26: return NewPairsGroup27: end procedure
42

Algorithm 3 Runs the required voting test on every mother set, and updates their holdingsaccording to their power index
1: procedure RunTest(Market, TestType, Threshold,Majority)2: for company in companies(Market) do3: weights←MotherHoldings(company)4: votingPower←test results for running TestType, with weights, Threshold and Ma-
jority as input5: in Market, change that holdings of the mothers in company to be their voting power6: end for7: return Market8: end procedure
Algorithm 4 Deletes relations that do not represent control relations1: procedure DirectControlRelation(Market, Threshold)2: for company in Companies(Market) do3: for mother in Mothers(company) do4: if Holdings(mother, company) < Threshold then5: in Market, DeleteHoldings(mother, company) . mother is not controlling
company6: end if7: end for8: if NumberOfMothers(company) > 1 then9: maximalMother←Mothers(company) . null if no unique maximum exists
10: in Market, DeleteMothers(company)11: in Market, returnMother(maximalMother, company)12: end if13: end for14: Return Market15: end procedure
43

Algorithm 5 Deals with cycles1: procedure DealWithCycles(Market, PairsGroup)2: Undominated←getUndominatedCompanies(Market, PairrsGroup)3: for company in Undominated do4: RouteList←()5: recursiveF indCycle(Market, PairsGroup, company,RouteList)6: end for7: CalculateDominationsInCycles(Market)8: Return Market9: end procedure
10:
11: procedure recursiceFindCycle(Market, PairsGroup, company.RouteList)12: if company∈RouteList then . If we closed a cycle13: newCycle←extractCycleFromRoute(List, company)14: if everyone in the cycle has the same root then . Meaning its a control cycle15: AddToCycles(Market, newCycle)16: end if17: else18: Add company to RouteList19: for daughter in daughters(company) do20: recursiveF indCycle(Market, PairsGroup, daughter,RouteList)21: end for22: end if23: end procedure24:
25: procedure AddToCycles(Market, newCycle)26: for cycle in cycles(Market) do27: if cycle∩newCycle6=∅ then28: Remove cycle from cycles(Market)29: newCycle = newCycle∪cycle30: end if31: end for32: Add newCycle to cycles(Market)33: end procedure
44

Algorithm 6 Update the pairs of control in the market1: procedure SingleControllerThroughPathes(Market)2: NextPairsGroup←()3: for company in companies(Market) do4: if company has no mothers (in Market) then5: for descendant in getAllDescendants(Market, company) do6: Add (company, descendant) to NextPairsGroup7: end for8: end if9: end for
10: Return NextPairsGroup11: end procedure
45

B Proofs
Let the network of shareholding relationships among a set V of n firms and shareholders bedescribed by the n× n adjacency matrix H ∈ [0, 1]n×n as defined in Section 4.1 where n < ∞.Fix a majority quota q ∈ (0, 1] and power index threshold θ ∈ (0.5, 1]. Further, denote by L themaximal path length among all the holdings paths in the network H, i.e. L := max{|P (y, x)| :P (y, x) ⊆ H is a directed simple path of holdings from y to x}. Where |P (y, x)| is the length ofP (y, x) defined as the number of edges in the path, and we always have L ≤ n− 1.
1. Notice that for any adjusted matrix of holdings resulting from each iteration (after joiningconcerts and replacing them by the root) the maximal length of holdings path cannot belarger than L - the maximal length of holdings path in the original matrix, H. Thus, thealgorithm, by construction, converge after at most L steps to a solution, i.e. the solutionwill not change any more for any iteration ≥ L. The finiteness of L implies that the processterminates.
2. We show correctness (exclusive controllers) by induction over L. For L = 1, a power indextest (Shapley-Shubik or Banzhaf) with θ > 0.5 implies the uniqueness of the controllerand thus it leads to a correct solution. Assume that the statement holds for L = k − 1.For L = k , since by the induction hypothesis the matrix of holdings is fixed and correctafter k − 1 steps, we are in fact in the same case as L = 1. The last non tested nodes(the leaf in level L = k) will yield a correct solution after the power index test since itis uniquely determined with θ > 0.5. Intuitively, assume that there was a mistake duringsome iteration 1 ≤ m ≤ L, i.e. a firm is identified as controlled by some shareholder,that does not actually control it by the data in H. However, in each iteration (in ourcase iteration m), the power index test uniquely and correctly identifies controllers from agiven updated matrix of holdings Hm−1 (which is H adjusted for concerts after iterationm − 1). Then, after adjusting for concerts and applying test in iteration m, it cannot bethe case that the mistake was in iteration m, i.e. the mistake must have occurred before.By the same logic we will trace back to iteration 1, i.e. to the original matrix of holdings,H. But since the power index test is unique and correct for θ > 0.5, it cannot be the casethat the mistake was in iteration 1. A contradiction.
3. We perform a similar induction over L as in above. For L = 1 all possible control relationsare identified by the construction of the power index test with θ > 0.5 and are thus similarto the control relations in Ψ(H, q, θ) = F . Assume that the statement holds for L = k− 1.For L = k we have an updated matrix of holdings derived from all possible (and correct)control relations in level L = k − 1 by the induction hypothesis. Thus, the last test issimilar to the case of L = 1, identifying all relations in level L = k. This completes theproof.
46