
Real-Time Variable Message Sign-Based Route Guidance Consistent with Driver Behavior
33
Peeta & Gedela Real-Time Variable Message Signs Based Route Guidance Consistent With Driver Behavior Srinivas Peeta 1 and Shyam Gedela 2 1 Srinivas Peeta School of Civil Engineering Purdue University West Lafayette, IN 47907 Phone: (765) 494-2209 Fax: (765) 496-1105 E-mail: [email protected] 2 Shyam Gedela School of Civil Engineering Purdue University West Lafayette, IN 47907 Phone: (765) 494-2206 Fax: (765) 496-1105 E-mail:[email protected]
Transcript of Real-Time Variable Message Sign-Based Route Guidance Consistent with Driver Behavior

Peeta & Gedela
Real-Time Variable Message Signs Based Route Guidance Consistent With
Driver Behavior
Srinivas Peeta1 and Shyam Gedela2
1Srinivas Peeta School of Civil Engineering Purdue University West Lafayette, IN 47907 Phone: (765) 494-2209 Fax: (765) 496-1105 E-mail: [email protected]
2Shyam Gedela School of Civil Engineering Purdue University West Lafayette, IN 47907 Phone: (765) 494-2206 Fax: (765) 496-1105 E-mail:[email protected]

Peeta & Gedela
ABSTRACT
Variable Message Signs (VMS) represent a cost-effective mechanism for disseminating
information to drivers unequipped to receive personalized information. They can be used under
incidents to divert traffic to less congested areas of the network to circumvent lengthy queues,
better utilize network capacity, and improve system performance. This paper proposes and
evaluates a VMS control heuristic framework that seeks diversion under incidents to enable a
traffic system controller to favorably control traffic conditions in real-time. The framework
ensures consistency with driver diversion response behavior, is responsive to changing traffic
conditions, enables computational tractability through stage-based on-line implementation, and
ensures the spatial and temporal consistency of the displayed messages. It uses a hybrid
framework that consists of off-line and on-line components to determine the VMS messages. The
ability to display messages that are consistent with driver diversion behavior represents a
valuable tool for the controller to enhance system effectiveness by simultaneously satisfying
system-wide and individual user objectives. Real data on driver VMS response attitudes from the
Borman Expressway corridor in northwestern Indiana and simulated experiments are used to
derive insights on the practical effectiveness of the proposed VMS control heuristic.

Peeta & Gedela
INTRODUCTION
Variable Message Signs (VMS) are electronic message boards located in close proximity to
roadways. They represent a cost-effective mechanism for disseminating information to drivers
unequipped to receive personalized real-time routing information and/or guidance. Hence,
unequipped drivers can be directly influenced through VMS messages. VMS enable traffic
controllers to inform drivers in real-time about changing traffic conditions, and are commonly
used for parking guidance, control of high occupancy vehicle (HOV) lanes, safety warnings, and
flow diversion. This paper focuses on their potential use under incidents. Though VMS have
been implemented in practice for the above-mentioned uses, their effective use for route
guidance has not fully matured. Existing VMS route guidance algorithms are typically network
specific and hence lack portability. A key issue is their inability to display messages that are
consistent with driver diversion response attitudes for that traffic network. Such a capability is
critical for the system controller to enhance network performance while ensuring increased
acceptability of the suggested guidance and improving the credibility of VMS information
among drivers. Also, most algorithms have limited capabilities to dynamically reflect changing
traffic conditions, especially under incidents. The displayed messages tend to be static or quasi-
dynamic with a fixed frequency of message updates. Thereby, they cannot vary the message
update frequency as warranted by the changing traffic conditions to optimize system
performance. In addition, they do not address the important operational issue of which VMS to
activate for a particular traffic scenario, as activating all of them may not represent the best
strategy. An additional practical challenge is the need to ensure spatial and temporal consistency
among the displayed messages. The current algorithms typically cannot be deployed in real-time

Peeta & Gedela 2
either due to the lack of a suitable on-line framework or computational efficiency to meet real-
time constraints.
This research proposes to use VMS message content (in terms of the amount of
information disseminated) as a control variable to influence route diversion and seek consistency
with driver behavior. As per the approach, the message contents of the activated VMS are such
that the diversion rates generated by the VMS response attitudes of the drivers closely match
those desired by the system-wide objectives of the controller. In this context, a VMS control
heuristic is developed that determines the VMS to be activated, the messages to be displayed,
and when messages need to be updated. It is computationally tractable on-line, consistent with
driver behavior, responsive to changing traffic conditions, portable, and obviates the need for
long-term future demand and/or system state predictions. The associated implementation
framework uses a hybrid combination of off-line and on-line components to determine the
diversion rates that would optimize system performance under an incident. It then uses a driver
VMS route diversion response behavior model previously developed by the authors (1) to
determine the content of messages to be displayed consistent with the desired diversion rates.
LITERATURE REVIEW
Currently, VMS are used primarily to provide information on ambient traffic and/or weather
conditions, manage traffic in work zones, control access to HOV lanes, display safety messages,
and notify drivers about public events. Hence, their locations may not be ideal from the
perspective of motorist information needs (2). The strategic location of VMS in the network is an
important consideration because it gives the traffic manager better control over the system
compared to rule-of-thumb based location approaches. Genetic algorithm based approaches have

Peeta & Gedela 3
been proposed (3) to determine the strategic locations of VMS. This study assumes the VMS
locations to be known.
Field studies suggest that route guidance using VMS has the potential to improve system
performance more effectively compared to VMS displaying traditional descriptive information
like current weather conditions, congestion levels, and HOV lane access control. Field tests
conducted in the city of Aalborg, Denmark (4) used an automatic control strategy based on real-
time loop detector measurements for VMS-based route guidance. It included a simple rule for
computing travel times. The study results suggest perceptible improvements to the system
performance. Studies were also conducted on the 600-km freeway network around Paris (5),
aimed at modifying individual driver behavior to improve system performance. Link flow
evaluations using loop detector data were performed to estimate flow rate differences with and
without VMS. Also, traffic flow data analysis was performed for a selected link to analyze user
response variation with the VMS message type.
A common drawback of the above studies is their opaqueness to driver attitudes to
displayed VMS messages (6). It is important to consider the interactions between the drivers and
the displayed messages to enhance the effectiveness of VMS-based control strategies. A
significant factor influencing VMS driver response is the perception of the reliability of the
displayed messages. Frequent changes to the displayed messages, inconsistent messages on
consecutive message signs, and/or route prescriptions that lead to perceived unfavorable
experiences adversely affect this perception and consequently the system performance due to
reduced compliance. Driver attitudes are further affected by on-line traffic conditions and other
situational factors such as time-of-day and weather conditions (1), highlighting the fixed-point
interaction between driver response and network performance.

Peeta & Gedela 4
Existing VMS algorithms typically lack generality and address specific networks,
primarily to study driver response to VMS messages and estimate the system performance for
specific incidents. A key objective of the proposed research is to develop a framework that is
general in its scope of application. A recent effort (7) to generalize the VMS solution determines
the optimal route diversion rates using a multiple user classes dynamic traffic assignment model
(8) under the system optimal objective. These diversion rates are targeted through VMS message
display. However, the approach does not incorporate a mechanism by which the desired
diversion rates can actually be achieved consistent with driver VMS response attitudes. It
provides individual drivers personalized optimal routes to their destinations through VMS by
comparing the current path with the new diversion path and using a switching threshold. This is
operationally infeasible since VMS are constrained to display generic messages and cannot
provide information on specific routes. It also implies that the VMS display information on
incident-induced delays. The approach is used until five minutes after incident clearance, after
which the VMS are assumed to be deactivated. It also assumes that all drivers, equipped or
unequipped, who pass by a VMS are affected by the displayed information identically from a
behavioral perspective. It discounts the possibility that equipped drivers may weigh personalized
information more than the generic VMS message.
This study has some similarities with (7) in that a dynamic traffic assignment (DTA)
model (8) is used to determine the desired diversion rates. However, the underlying mechanism
to determine these diversion rates is different. Also, unlike (7), message content is a variable that
is used to seek consistency between system objectives and driver response behavior. Information
on incident-induced delays is only one of the many possible VMS message contents considered
for display under an incident. Lesser or greater amount of detail on the incident and/or guidance
is used to generate different diversion rates through VMS (1). The proposed approach updates

Peeta & Gedela 5
VMS messages based on the current incident status and ambient traffic conditions. Thereby, the
message update frequency is a variable and the displayed message content can change with time.
Hence, a VMS may be deactivated before or substantially after incident clearance. The study
assumes that equipped drivers are not influenced by the VMS and follow personalized paths
specified by an information service provider. While reasonable, this assumption can be
behaviorally limiting because equipped drivers may use both personalized and generic (VMS)
information to make diversion decisions. However, the proposed approach is not limited by this
assumption as it uses current traffic flow measurements to determine the desired diversion rates.
Also, it can incorporate more general behavioral models vis-a-vis response to information for
equipped drivers.
PROBLEM STATEMENT
Given a traffic network G(N,A), with n∈N nodes and a∈A arcs, user class fractions, variable
message signs at pre-specified locations, a VMS driver diversion response model (1), and an
incident clearance time prediction model (9), the traffic system controller seeks to determine the
time-dependent VMS messages to be displayed during the horizon of interest (typically under
incidents) that address some system-wide objectives and are consistent with driver VMS
response behavior. Implicit in this problem is the usage of message content as a control variable
to achieve the desired diversion rates. The problem consists of determining: (i) the VMS to be
activated for message display, (ii) the messages to be displayed, and (iii) the frequency at which
messages should be updated, so that unequipped drivers diverting based on their VMS diversion
response attitudes satisfy some system-wide objectives of the traffic controller. The user class
fractions are based on unequipped and equipped drivers. However, equipped drivers may further

Peeta & Gedela 6
be categorized into classes such as user equilibrium (UE) objective drivers and system optimal
(SO) objective drivers.
METHODOLOGY
Overall Approach
Figure 1 illustrates the overall approach for determining the VMS messages that are consistent
with the desired diversion rates and driver VMS response behavior. An incident triggers the
incident clearance time prediction model (9) which estimates the time to incident clearance. The
current traffic conditions on the network are obtained from the traffic control center (TCC). The
VMS control heuristic is activated to determine the desired diversion rates that satisfy some
system-wide objectives of the controller. For the various VMS to be activated according to this
heuristic, the message contents that generate the closest match between the desired diversion
rates and the diversion rates obtained from the VMS driver response model (1) for that network
are used to determine the messages to be displayed. The VMS control heuristic is used to
determine when messages should be updated. The procedure ends when all VMS are deactivated.
VMS Driver Response Model
The VMS driver response model (1) determines the probability of diversion in response to
different VMS message contents. It is developed using data from a stated preference (SP) survey
in the associated network. Logit models are developed for drivers’ diversion decisions. Table 1
illustrates the relationship between VMS message content and the propensity to divert for a SP

Peeta & Gedela 7
survey conducted in the Borman Expressway corridor in northwestern Indiana. The responses
were recorded on a five point Likert scale, where 1 meant low willingness to divert and 5 meant
high willingness to divert. The analysis suggests that content in terms of the level of detail of
relevant VMS information significantly affects the willingness to divert. Hence, different
diversion rates can be induced using different message contents. The SP survey (1) revealed that
other significant factors influencing VMS route diversion decisions include socioeconomic
characteristics (gender, age, education level, and household size), network spatial knowledge
(regular driver in the region, familiarity with alternative routes), trip type (work or non-work),
amount of delay, and confidence in the displayed information. Detailed descriptions of the
survey design, dependent variables, and the VMS driver response models are provided in (1).
VMS Control Heuristic
The VMS control heuristic determines the optimal diversion rates at the various activated VMS
for unequipped drivers under current network conditions. Its primary objective is to obtain new
path assignment proportions for unequipped drivers whose initial paths (historical paths) include
the incident link. In the absence of any information, these drivers follow their initial paths.
However, VMS upstream of the incident link can be used to divert them from these paths by
providing routing information that aids incident management.
The VMS control heuristic ensures that the VMS are inactive before an incident and after
the effects of an incident have dissipated. It uses the VMS driver response model to determine
the messages to be displayed. The VMS locations to be activated are determined by comparing
diversion rates with threshold activation criteria. Messages are updated based on traffic data and
incident clearance status feedback. The VMS control heuristic consists of three sub-algorithms

Peeta & Gedela 8
that follow a sequential logic to determine: (i) the VMS that should be activated, (ii) the
messages to be displayed on the active VMS, and (iii) when the VMS messages should be
updated. The sub-algorithms are as follows:
The Activation Algorithm
The Activation algorithm uses a set of heuristic rules to determine the VMS to be activated for
displaying messages. These rules activate only those VMS for whom the required diversion rates
to improve system performance exceed a pre-specified threshold. This eliminates the need to
activate VMS which do not significantly influence system performance. This aspect is
computationally attractive from an operational standpoint.
The algorithm scans all origin-destination (O-D) pairs in the network to identify incident-
affected paths. From this set, the K most used paths, in terms of path flows, between each O-D
pair that include the incident link are identified. Any VMS on these paths are activated if they
satisfy at least one of the following activation criteria: (i) VMS is within R minutes of incident
link, and (ii) VMS is within Y miles of the incident. Here, R and Y are pre-determined
parameters for that network.
The K most used paths that include the incident link are obtained using current network
data. R is determined using the time-dependent path travel times and is a more robust filter
criterion than Y because it better reflects the ambient traffic conditions. It could, for example, be
a percentage of the path travel time from the origin node to the upstream node of the incident-
affected link, or a measure based on the predicted incident clearance time. It can be time-
dependent to reflect improvements in the network performance due to the VMS strategies
adopted in previous intervals, and hence enhances the efficiency of the VMS control heuristic.
While the use of Y is less meaningful in congested situations, it can be a useful threshold in the

Peeta & Gedela 9
absence of time-dependent network data. Also, it is useful when addressing incidents involving
hazardous material spills which require the quarantine of a region.
The Message Display Algorithm (MDA)
The Message Display algorithm, illustrated in Figure 2, determines the messages to be displayed
on the activated VMS based on the system controller objectives. In the figure, T denotes the
length of the planning horizon. A multiple user classes deterministic DTA algorithm (8), (10), is
used to determine the optimal path assignment proportions under the incident based on the SO
objective while assuming that all drivers, including the unequipped ones, are SO drivers (case 1).
This represents the benchmark for the best system performance under that incident. The path
assignment proportions are also computed under the incident based on the SO objective using the
actual user class fractions (case 2). The path assignment proportions from the two scenarios are
used to determine the desired diversion rates, and consequently the messages to be displayed on
the VMS. This is done by comparing the path assignment proportions from case 2 with the
desired path assignment proportions from case 1. If the proportions are larger in case 2 compared
to case 1 for the incident-affected VMS paths, unequipped users could be induced to switch from
those paths through appropriate VMS messages. Hence, the objective of the MDA is to seek the
network flow pattern under case 1. The percentage diversions of unequipped drivers from the
VMS links represent the desired diversion rates. However, a single VMS may lie on different
paths requiring different diversion rates. Since only one message can be displayed on the VMS
for all such paths, a combined measure of these diversion rates has to be considered for
operational purposes. From the limited experiments conducted in this study, an average of these
diversion rates represents a good proxy for the desired diversion rate. The diversion rate from the
VMS driver response model that is closest to the desired diversion rate for a particular VMS is
used to determine the message to be displayed.

Peeta & Gedela 10
The Update Frequency Algorithm
The displayed VMS messages need to be updated over time to reflect changes in the incident
situation and/or traffic flow conditions. For example, progress in incident clearance may increase
capacity on the incident link leading to an increased ability to route traffic through the incident
area. Similarly, improved traffic conditions in the vicinity of the incident due to prior VMS
messages may require the updating of the messages displayed. The Update Frequency algorithm
determines when such updates should occur (that is, when to invoke the MDA). It does so by
monitoring at regular intervals the incident clearance status and the flow conditions in the
incident vicinity. The length of the monitoring interval depends on the specific network and the
incident status. Hence, the Update Frequency algorithm can aid the efficiency of the VMS
control heuristic and its effectiveness vis-à-vis system performance. The logic of the Update
Frequency algorithm is as follows:
Incident Link: If the incident link capacity in the monitoring interval τ is α% different from that
of interval (τ-1), where α is a pre-set time-dependent threshold, the MDA is invoked.
Ambient Traffic Conditions: If the incident link conditions do not warrant an update, the ambient
traffic conditions in its vicinity are analyzed by computing the updated instantaneous path travel
times on the K most used paths from each origin node to the incident link upstream node. If the
difference in the path travel times for β of these paths in two successive monitoring intervals
exceeds γ%, the MDA is invoked. Here, β and γ are pre-specified thresholds.
If neither update criteria trigger an update, the current messages are retained. Incident
clearance time prediction models (1), (9) are used to estimate the remaining incident clearance
time and project when the messages are likely to be deactivated.
VMS Control Heuristic Implementation

Peeta & Gedela 11
The proposed VMS control heuristic is implemented using a hybrid framework (11) consisting of
off-line and on-line components. The off-line component addresses the computationally
intensive aspects and the on-line component uses an efficient rolling horizon implementation that
circumvents future state predictions. The rolling horizon implementation is ideal from the
perspective of on-line deployment (8) because of the computational time savings obtained by
using a truncated planning horizon.
Off-line component: The computationally intensive off-line component determines the
benchmark time-dependent SO path assignment proportions using a deterministic DTA
algorithm for several probable incident scenarios and a mean O-D demand. These sets of path
assignment proportions are stored for use by the on-line component to determine the desired
diversion rates in a computationally efficient manner.
On-line component: Figure 3 illustrates the rolling horizon implementation of the VMS control
heuristic. It is a stage-based approach illustrating the on-line nature of the VMS control heuristic.
A stage is a truncated portion of the planning horizon, implying lesser computational effort. The
planning horizon is divided into several stages. If an incident and/or high congestion is detected
in the current stage the VMS control heuristic is executed to determine the desired diversion
rates and the messages to be displayed in the next stage. In the absence of incidents and/or high
congestion, the deterministic DTA model is used to determine the optimal path assignment
proportions. The current stage is incremented and the messages determined in the previous stage
are implemented for a roll period, which is a sub-interval of a stage. The network data collected
from detectors is used to repeat this process in the next stage.
Figure 4 illustrates a typical cycle of the VMS control heuristic using the rolling horizon
framework. The flow of logic in the figure is for the stage i in which the incident is first detected.

Peeta & Gedela 12
It is used to determine the messages to be implemented in stage i+1. The inputs are the predicted
O-D desires of drivers departing in this stage and the historical paths for the unequipped drivers.
The VMS messages are assumed to influence only the unequipped drivers. The Activation
algorithm determines the VMS locations for activation. The Message Display Algorithm
determines the message to be displayed by mapping diversion rates onto actual messages through
the driver diversion response model (1), (9).
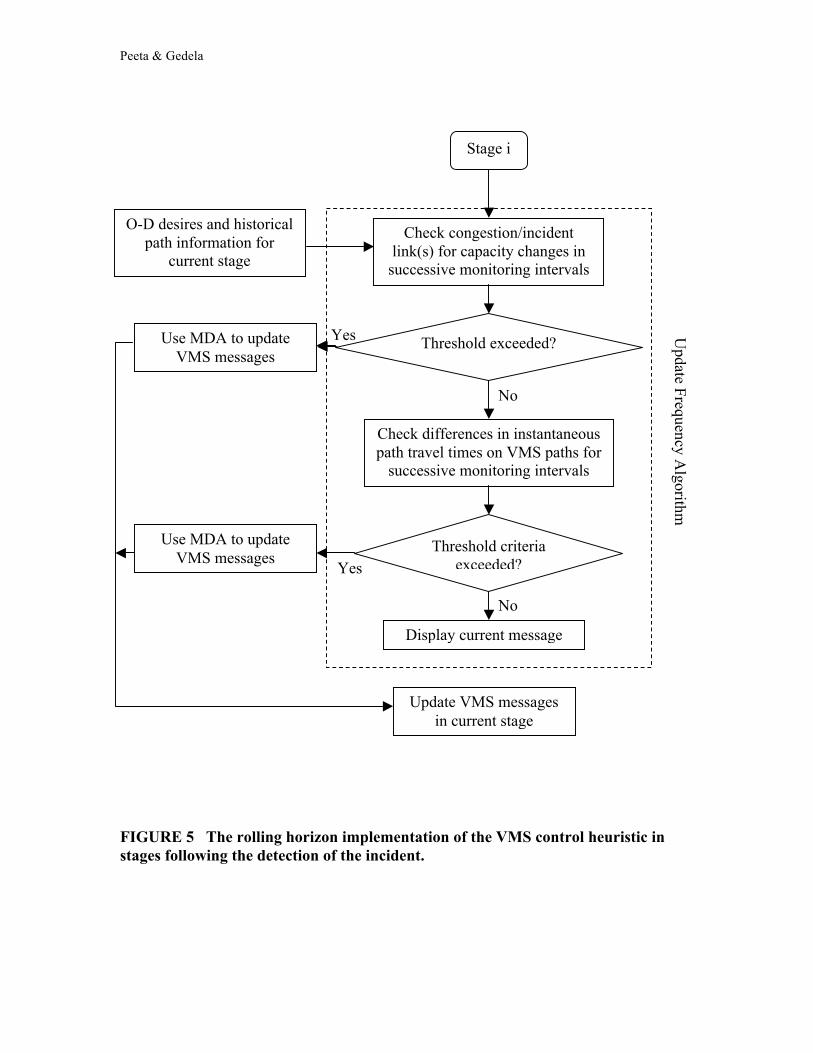
Figure 5 illustrates the execution of the VMS control heuristic in any stage subsequent to
the stage in which the incident is detected. The Update Frequency algorithm is executed for each
monitoring interval and is used for updating messages within the current stage using the update
criteria. The monitoring interval is a sub-interval of the current roll period. If neither of the
update criteria are satisfied the messages remain unchanged.
The control heuristic is repeated until all VMS are deactivated implying that the adverse
effects of the incident on the network have dissipated. A computationally attractive feature of
this approach is that the MDA is activated only when deemed necessary by the Update
Frequency algorithm. Additionally, the parameters in the Update Frequency algorithm can be
adjusted to vary the frequency of MDA activation to suit the resources of the traffic controller.
The Consistency Issue
Ideally, the solution generated through the VMS control heuristic is favorable to all drivers since
it factors in the diversion of the unequipped drivers. However, temporal and spatial
inconsistencies in the messages displayed may arise during the practical implementation of the
procedure. They include the display of inconsistent quantitative or qualitative information across

Peeta & Gedela 13
different VMS, both geographically and over time. The successful implementation of the VMS
control heuristic requires consistency in the displayed messages.
EXPERIMENTAL ANALYSIS
Simulation experiments were conducted to evaluate the performance of the VMS control
heuristic and obtain insights on its characteristics.
Setup
The experiments were conducted using the Borman Expressway corridor network, illustrated in
Figure 6, that consists of 197 nodes and 458 links. The Borman Expressway (I-80/94) has a high
percentage of truck traffic (ranging from 30-70%). Incidents involving trucks severely affect
network performance. Recently, the Indiana Department of Transportation (INDOT) installed an
advanced traffic management system (ATMS) on this corridor to enable VMS-based incident
management. Several experiments using realistic hypothetical scenarios were simulated to obtain
insights on the VMS control heuristic. In all cases, the corresponding system optimal solutions
(obtained by assuming all drivers as SO drivers) were used as benchmarks to evaluate the
effectiveness of the proposed VMS control heuristic. DYNASMART (12), a mesoscopic traffic
simulator, was used to conduct the experiments.
As stated earlier, the unequipped drivers are assumed to follow their historical paths in
the absence of information. The generic VMS messages are assumed to influence the routing
decisions of only the unequipped drivers, and equipped drivers follow the personalized routes
specified by the corresponding objective.

Peeta & Gedela 14
Scenario 1: Number of Incidents
This scenario seeks insights on the performance of the VMS control heuristic vis-à-vis the
number of incidents. The base case for each experiment is the corresponding benchmark 100%
SO drivers solution obtained using the multiple user classes deterministic DTA model (8). It
represents the best system performance achievable under that experiment. The VMS solution is
compared to the base case solution to infer on the effectiveness of the VMS control heuristic.
The experiments in this scenario generate approximately 57000 vehicles in the network
over a planning horizon of 35 minutes. All drivers belong to the unequipped class and their
initial paths are obtained by randomly assigning them time-dependent k-shortest paths. All
experiments consider a 75% reduction in the affected incident link capacity. The incidents start
at time 5 minutes and are assumed to be present for a 30 minute duration. In terms of the incident
locations, the single incident scenario is on the Borman Expressway (west-bound); the second
incident is on I-65 (south-bound and to the south of the Borman); the third incident is on the
Borman (east-bound); and the fourth incident is on US-20 (to the north of the Borman.).
Figure 7 illustrates the performance of the VMS heuristic under different numbers of
incidents, compared to the no-information case represented by the 100% unequipped drivers
solution. Savings ranging from 13-25% are obtained, with the best savings obtained under the
two-incident scenario. The savings decrease with increasing number of incidents. This is because
more incidents lead to a greater disruption in the traffic flow and hence drivers may benefit more
from personalized information compared to generic VMS information.
Figure 8 shows the average diversion rates for the two-incident experiment. They indicate
that diverting drivers early on during the incident has substantial benefits in terms of system

Peeta & Gedela 15
performance. Due to the early diversion, there is improvement in network performance which
manifests as reduced desired diversion rates towards the end of the incident clearance.
Scenario 2: Incident Duration
Scenario 2 experiments evaluate the performance of the VMS control heuristic with varying
incident duration (which is a proxy for incident severity). The incident characteristics are
identical to those of the two-incident case in scenario 1, with incidents of 5, 10, and 20 minutes
durations. Figure 9 illustrates the performance of the heuristic for the different incident
durations. The results indicate increased savings with incident duration suggesting that the VMS
heuristic is more effective under more severe incidents. Other experiments suggest that under
very severe incidents personalized information and coordinated strategies may be necessary to
obtain additional benefits beyond those due to generic diversion because of limited opportunities
to gain savings in highly congested networks.
Scenario 3: Congestion Level
These experiments seek insights on the effectiveness of the VMS control heuristic under varying
congestion levels. This would enable the system controller to decide whether to deploy the VMS
algorithm for different congestion situations. The two-incident case in scenario 1 is used for
these experiments. Figure 10 shows the performance of the 100% unequipped case and the VMS
heuristic under low to high congestion levels, ranging from average network speeds of 50 km/h
to 10 km/h, respectively. At low congestion levels, significant delays are not encountered.
Hence, the VMS heuristic performance, while significant (about 40% better than the

Peeta & Gedela 16
corresponding unequipped users scenario), has lesser savings than under medium congestion.
Under medium congestion, the delays are significant enough to warrant savings through VMS
diversion, further fortified by significant opportunities to switch to less congested paths. Under
high congestion, the opportunities to divert drivers to better paths through generic VMS
messages are reduced due to high network congestion levels. This is also reflected in the figure.
CONCLUDING COMMENTS
An on-line deployable VMS control heuristic is devised to address the problem of determining
the time-dependent VMS messages, display locations, and message update frequencies, to divert
unequipped drivers and enhance system performance. The implementation of the VMS control
heuristic consists of a hybrid framework of off-line and on-line components with the
computationally intensive off-line component contributing to the on-line efficiency of the
procedure. The desired optimal path assignment proportions for common incident scenarios can
be stored through off-line computation. The key advantage of the VMS control heuristic is its
consistency with driver VMS diversion response behavior using message content as a control
variable. The Message Display algorithm takes into account the driver diversion response
attitudes and the current network conditions to determine the messages to be displayed. Hence it
can potentially display different messages for similar desired diversion rates under different
ambient network conditions (time-of-day, weather conditions, etc.). The proposed heuristic is
also practically feasible as it determines a single message to be displayed by averaging desired
diversion rates. Simulation experiments highlight the effectiveness of the VMS control heuristic
under alternative real-world type scenarios.

Peeta & Gedela 17
The assumption that equipped drivers ignore the VMS messages and follow personalized
routes can be behaviorally limiting as they may make route diversion decisions using both
personalized and VMS information. From an operational perspective, the temporal and spatial
consistency of the displayed messages should be ensured for the credibility of the VMS-based
incident management. These issues represent future research directions.
ACKNOWLEDGEMENTS
This research was based on funding from the Federal Highway Administration (FHWA) and the
Indiana Department of Transportation (INDOT) through the Joint Transportation Research
Program at Purdue University. The authors are solely responsible for the findings and views
expressed in this paper. The contents of this paper do not necessarily reflect the official views of
FHWA and INDOT.
REFERENCES
1. Peeta, S., J.L. Ramos, and R. Pasupathy. Content of Variable Message Signs and On-line
Driver Behavior. In Transportation Research Record 1725, TRB, National Research Council,
Washington, D.C., 2000, pp. 102-108.
2. Benson, G. B. Motorist Attitudes about Content of Variable Message Signs. In
Transportation Research Record 1550, TRB, National Research Council, Washington, D.C.,
1996, pp. 48-57.

Peeta & Gedela 18
3. Abbas, M., and P. McCoy. Optimizing Variable Message Sign Locations on Freeways Using
Genetic Algorithms. Presented at 78th Annual Meeting of the Transportation Research Board,
Washington, D.C., 1999.
4. Mammar, S., A. Messmer, P. Jensen , M. Papageorgiou, H. Haj-Salem, and L. Jensen.
Automatic Control of Variable Message Signs in Aalborg. Transportation Research C, Vol.
4, No. 3, 1996, pp. 131-150.
5. Yim, Y. and J.L. Ygnace. Link Flow Evaluation Using Loop Detector Data: Traveler
Response to Variable Message Signs. In Transportation Research Record 1550, TRB,
National Research Council, Washington, D.C., 1996, pp. 58-64.
6. Wardman, M., P.W. Bonsall, and J.D. Shires. Driver Responses to Variable Message Signs:
A Stated Preference Investigation. Transportation Research C, Vol. 5, No. 6, 1997, pp. 389-
405.
7. Valdez-Diaz, D. M., Y. Chiu, and H.S. Mahmassani. Optimal Time-Dependent Variable
Message Sign Strategy. Presented at 79th Annual Meeting of the Transportation Research
Board, Washington, D.C., 2000.
8. Peeta, S., and H.S. Mahmassani. Multiple User Classes Real-time Traffic Assignment For
Online Operations: A Rolling Horizon Solution Framework. Transportation Research C,
Vol. 3, No. 2, 1995, pp. 83-98.
9. Ramos, J.L. Driver Response Models For Variable Message Signs Based Real Time Traffic
Operations. M.S. dissertation. Purdue University, 2000.
10. Peeta, S., and H.S. Mahmassani. System Optimal and User Equilibrium Time-Dependent
Traffic Assignment in Congested Networks. Annals of Operations Research, 60, 1995, pp.
81-113.

Peeta & Gedela 19
11. Peeta, S., and C. Zhou. Robustness of the Off-line A Priori Stochastic Dynamic Traffic
Assignment Solution for On-line Operations. Transportation Research C, Vol. 7, No. 5,
1999, pp. 281-303.
12. Mahmassani, H.S., Y. Hawas, K. Abdelghany, A. Abdelfatah, Y. C. Chiu, and Y. Kang.
DYNASMART-X: Analytical and Algorithmic Aspects. Technical Report ST067-085-Volume
II, 1998.

Peeta & Gedela 20
LEGEND
List of Figures
1. Overall approach. 2. Message display algorithm. 3. Rolling horizon implementation. 4. The rolling horizon implementation of the VMS control heuristic in the stage that the
incident is first detected. 5. The rolling horizon implementation of the VMS control heuristic in stages following the
detection of the incident. 6. Borman expressway network. 7. Comparison of VMS control heuristic performance across incident scenarios. 8. Diversion rates for VMS in two-incident scenario. 9. VMS control heuristic performance for varying incident durations. 10. VMS control heuristic performance with varying network loading levels. List of Tables
1. Effect of VMS Message Contenta

Peeta & Gedela
FIGURE 1 Overall approach.
Information dissemination (VMS)
Update time interval
VMS control
heuristic VMS driver
response model
Current network conditions
Incident clearance time prediction model
Start of incident: on-line incident log

Peeta & Gedela
FIGURE 2 Message display algorithm.
Obtain path assignment proportions for case 1 and case 2 using the deterministic DTA algorithm
Obtain the difference in path flows of unequipped and SO classes between cases 2 and 1
For positive differences, calculate the desired diversion rates for unequipped
drivers on the VMS link
Determine the VMS messages to be displayed using the driver diversion response model
No
Yes
Is t = T ?
STOP
t = t + 1
Initialize time horizon t = 1

Peeta & Gedela
FIGURE 3 Rolling horizon implementation.
No
Yes
O-D desires, initial paths under normal network
conditions
VMS control heuristic
Obtain desired diversion rates
Obtain time-dependent path assignment
proportions from the deterministic DTA model
Implement the messages/proportions
determined in previous stage
Stage = i + 1
Incident and/or high congestion levels detected ?
Stage = i
Updated traffic network data

Peeta & Gedela
FIGURE 4 The rolling horizon implementation of the VMS control heuristic in the stage that the incident is first detected.
O-D desires and initial set of feasible paths for
all vehicles in the network
Determine the VMS locations to be activated
Current path assignment proportions for all vehicles
Determine K most used paths for each O-D pair
based on path flows
Optimal path assignment proportions after altering user class fractions (by
assuming all drivers as SO)
VMS driver diversion
response model
From positive diversion rates for unequipped drivers determine
VMS messages to display Implement VMS messages for next
stage
Activation A
lgorithm
Message Display Algorithm
Determine paths between O-D pairs that include the congestion/incident link(s)
and VMS.
Stage i
Incident clearance time prediction model
Peeta & Gedela
FIGURE 5 The rolling horizon implementation of the VMS control heuristic in stages following the detection of the incident.
Yes
Yes
No
No
O-D desires and historical path information for
current stage
Check congestion/incident link(s) for capacity changes in
successive monitoring intervals
Threshold exceeded? Use MDA to update VMS messages
Check differences in instantaneous path travel times on VMS paths for
successive monitoring intervals
Threshold criteria exceeded?
Use MDA to update VMS messages
Display current message
Update VMS messages in current stage
Update Frequency A
lgorithm
Stage i

Peeta & Gedela
N
FIGURE 6 Borman expressway network.

Peeta & Gedela
FIGURE 7 Comparison of VMS control heuristic performance across incident scenarios.
0
10
20
30
40
50
60
70
1 2 3 4
Number of Incidents
% E
xcee
ding
SO
Sol
utio
n fo
rCo
rres
pond
ing
Inci
dent
Sce
nario
UnequippedVMS

Peeta & Gedela
FIGURE 8 Diversion rates for VMS in two-incident scenario.
00.10.20.30.40.50.6
5 10 15 20 25 30
Time Interval (minutes)
Div
ersi
on R
ates
VMS 1VMS 2

Peeta & Gedela
FIGURE 9 VMS control heuristic performance for varying incident durations.
0
10
20
30
40
50
60
5 min. 10 min. 20 min.
% E
xcee
ding
SO
Sol
utio
n of
the
Cor
resp
ondi
ng In
cide
ntSc
enar
io UnequippedVMS

Peeta & Gedela
FIGURE 10 VMS control heuristic performance with varying network loading levels.
020406080100120140160
Low Low Medium Medium High High% E
xcee
ding
SO
Sol
utio
n fo
rC
orre
spon
ding
Con
gest
ion
Leve
l
UnequippedVMS

Peeta and Gedela
TABLE 1 Effect of VMS Message Contenta
VMS Message
Type Message Content
Relative Willingness to Divert 1 %
2 %
3 %
4 %
5 %
1 Occurrence of accident only 13.7 33.9 26.6 13.3 12.5 2 Location of the accident only 20.2 33.1 22.6 11.3 12.9 3 Expected delay only 9.3 12.9 39.5 23.8 14.5 4 The best detour strategy only 7.7 18.5 30.2 25.0 18.5
5 Location of the accident and the best detour strategy 2.0 4.0 22.6 35.1 36.3
6 Location of the accident and the expected delay 0.8 0.8 19.8 38.3 40.3
7 Expected delay and the best detour strategy 2.0 2.0 13.7 33.5 48.8
8 Location of the accident, expected delay, and the best detour strategy 1.2 2.0 5.6 19.8 71.4
a Adapted from (1)