Reading report
53
CHAPTER I INTRODUCTION This chapter describes (1) background, (2) problems, (3) objectives of the study, and (4) significance of the study. 1. Background In this globalization era, English has been very important language. English becomes second language or foreign language in many countries. For this reason, Indonesia included English as a compulsory subject at the Junior and Senior High School. In teaching English, sometimes we found the problem. It caused students could not understand enough what teacher said. First, it is because they did not have enough vocabulary. Therefore, they got difficulties to understand and to give responses. Second, sometimes teacher did not have creative way of teaching English to improve students’ skill. Students only have acknowledgment from text book. In case, they did not have knowledge to make sentence which has same meaning in any ways. According to Eda English teacher in MTS N 1 Palembang, the seventh grade students in MTS N 1 Palembang have problem in learning English because English is a foreign language in Indonesia and the students’ lack in English vocabularies, and make them have a problem when 1
Transcript of Reading report

CHAPTER I
INTRODUCTION
This chapter describes (1) background, (2)
problems, (3) objectives of the study, and (4)
significance of the study.
1. Background
In this globalization era, English has been very
important language. English becomes second language or
foreign language in many countries. For this reason,
Indonesia included English as a compulsory subject at
the Junior and Senior High School. In teaching English,
sometimes we found the problem. It caused students
could not understand enough what teacher said. First,
it is because they did not have enough vocabulary.
Therefore, they got difficulties to understand and to
give responses. Second, sometimes teacher did not have
creative way of teaching English to improve students’
skill. Students only have acknowledgment from text
book. In case, they did not have knowledge to make
sentence which has same meaning in any ways. According
to Eda English teacher in MTS N 1 Palembang, the
seventh grade students in MTS N 1 Palembang have
problem in learning English because English is a
foreign language in Indonesia and the students’ lack in
English vocabularies, and make them have a problem when
1

they learn English. Sometimes it is hard for the
student to understand what the story means. Moreover,
when the teacher asked the student about the story that
need their ability to think little bit such as how if
they were as a main character, their opinion about the
story or what they got from the story almost all of the
student will silent and wait the teacher’s answer.
Based on the problem faced by students in learning
English, the writers try to give solution to improve
students’ skill in understanding and making sentence by
reading comprehension with contrast charts. Reading
comprehension is a multi-dimensional process that
includes the reader, the text, and factors associated
with the activity of reading (Orly and Linda, 2012).
Reading comprehension is a good way of teaching to
improve English skill because it has many activities
that can make the students really understand about the
text given.
According to Ruth and Hallie Yopp, contrast charts
may also be used to facilitate students’ thinking about
ideas prior to encountering them in story (1992:31).
These charts may also be used during reading as a means
for recording contrasting ideas or information in a
selection as it is read.” It means that contrast charts
is the right way to improve students’ skill in
2

understanding and making sentence because to make a
contrast chart students have to read many times.
In this study the writers applied contrast charts
to improve students’ reading comprehension. The writers
are interested in doing a research with title IMROVING
READING COMPREHENSION ACHIVEMENT BY USING CONTRAST
CHARTS FOR SEVENTH GRADE STUDENTS OF MTS N 1 PALEMBANG.
2. Problems of the Study
The problems of the study are formulated in the
following questions:
1) Is there any significant difference in reading
comprehension achievement of the seventh grade
students of MTS N 1 Palembang before and after
being taught using contrast chart?
2) Does contrast chart increase the students’
learning motivation?
3. Objectives of the Study
On the basis on the problems mentioned above, the
objectives of this study is to find out there is any
significant difference in reading comprehension
achievement of the seventh grade students of MTS N 1
Palembang before and after being taught using
contrast chart and to determine whether contrast
chart increase the students’ learning motivation.
3

4. Significance of the Study
1) The students especially the seventh grade
students of MTS N 1 Palembang which can improve
their English skill
2) English teachers in MTS N 1 Palembang to enrich
variety of teaching method especially in
reading comprehension
3) MTS N 1 Palembang to have students who have
good skill to increase student’s achievement in
English.
4

CHAPTER II
LITERATURE REVIEW
In this section, (1) the importance of reading
comprehension (2) concept of contrast charts, (3)
learning motivation, (4) collaborative learning, (5)
previous related study, and (6) hypotheses were
described.
2.1 The Importance of Reading Comprehension
In learning a language, especially English student
must be able to master the four language skills;
listening, speaking, reading, and writing. These four
language skills are closely related and mutually
reinforce each other. Students can be said
successfully in learning English if student can hear,
speak, read, and write in that language. These four
language skill is unity. Even the fourth can be
studied in separately. Students can learn listening
skills to enhance the skills of the third other. We
also can learn the skills of reading to improve skills
of listening, speaking, and writing. There are many
advantages that can be obtained if students learn the
skill of reading. By reading, students can interact
with the thoughts and feelings, relax, get
information, and improve our knowledge. Reading can
5

also help us to learn the experiences from others.
Students can find a variety of major events in the
culture of a nation. We can also follow developments
in science and cutting-edge technology in the world.
Moreover, reading is essential role in education.
People say that reading is the heart of education.
Reading can enrich students with a lot of vocabulary,
phrases, expressions, and terms that are very useful
in developing other language skills (listening,
speaking, writing).
According to St. Slamet Y. (2007), there are eight
functions to read. Read function include: intellectual
function, the function of trigger creativity,
practical function, recreational function, informative
function, a religious function, social function and
quiet killer function. By mastering the skills of
reading we can exploit the capabilities of other
skills in English. Thus, we increase English skills.
Moreover, with good reading skills will enable us to
study other disciplines. One of reading skill that we
have to have is reading comprehension. Reading
comprehension is an ability that must be had by person
to obtain information from written text.
Based on the importance of reading comprehension
above, whether Indonesian students have problem in
6

reading. According to Pisa 2012, Indonesia ranked at
64 from 65 countries participated in the three-year
cycle test. In reading Indonesia got score 396. The
fact that Indonesia still poor in reading is a bad
record for Indonesian people. The factor that caused
of this bad record is there are many student in
indonesia still difficult to understand about reading
comprehension. The seventh grade student in MTS N 1
Palembang although most of them lack in vocabulary
actually there are some of them little bit know any
vocabularies and know how to translate English to
Indonesia, but they still less to understand in
reading comprehension. The fact that Indonesia is not
good in reading achievement had shown that reading
comprehension is really need to Indonesian students.
2.2 Concept of Contrast Charts
Reading comprehension is a multi-dimensional
process that includes the reader, the text, and
factors associated with the activity of reading (Orly
and Linda, 2012). Reading comprehension is a good way
of teaching to improve English skill because it has
many activities that can make the students really
understand about the text given. Reading comprehension
is very important because the reader not only read the
book but get many information, so that’s why the
7

reader not only read without know or understanding
about what they have read. This inspiring the writers
to use contrast charts in order to improve students’
skill in reading comprehension.
According to Ruth and Hallie Yopp, contrast charts
may also be used to facilitate students’ thinking
about ideas prior to encountering them in story
(1992:31). These charts also can be used during
reading as a means for recording contrasting ideas or
information in a selection as it is read.” In other
way using contrast chart it will make the student to
read carefully and understand about the story very
well so, they can make sentence in contrast chart and
know about difference idea using that method. So
that’s why the writers are interested in using
contrast chart in reading comprehension to improve
student’s ability in understanding and making
sentence.
The purpose of using contrast charts is to attract
the students to read the text given so they can really
understand what the text mean is. Considering with the
problem and the purpose, the writers are interested in
using contrast charts in reading comprehension to
improve students’ ability in understanding and making
sentence.
8

2.3 Concept of Learning Motivation
Student motivation naturally has to do with
students' desire to participate in the learning
process. But it also concerns the reasons or goals
that underlie their involvement or noninvolvement in
academic activities. Although students may be equally
motivated to perform a task, the sources of their
motivation may differ.
A student who is INTRINSICALLY motivated
undertakes an activity "for its own sake, for the
enjoyment it provides, the learning it permits, or the
feelings of accomplishment it evokes" (Mark Lepper,
1988). An EXTRINSICALLY motivated student performs "IN
ORDER TO obtain some reward or avoid some punishment
external to the activity itself," such as grades,
stickers, or teacher approval (Lepper).
It is very important for the writers to get the
student’s interesting in writer’s materials, because
student’s interesting can show if the writer’s
materials is appropriate or accepted for them or not.
Student motivation is really needed to know, it can be
seen by student’s expression or attitude that they
have showed when the material has given to them.
9

In MTs N 1 Palembang the writers used material
about method of contrast chart in reading
comprehension. Therefore, the writers want to know
whether this method can help the student to improve the
students’s skill reading comprehension. And then to
know whether contrast can increase the learning
motivation of seventh grade students of MTS N 1
Palembang.
2.4 Concept of Collaborative Learning
Collaborative learning is an instructional method
in which students’ team together on an assignment. In
this method, students can produce the individual parts
of a larger assignment individually and then “assemble”
the final work together, as a team. Whether for a
semester-long project with several outcomes or a single
question during class, collaborative learning can vary
greatly in scope and objectives. Cooperative learning,
sometimes confused with collaborative learning,
describes a method where students work together in
small groups on a structured activity. Students are
individually accountable for their work but also for
the work of the group as a whole, and both products are
assessed. (http://
10

www.ion.illinois.edu/resources/tutorials/pedagogy/instr
uctionalstrategies.asp).
Collaborative skills are important in many work
and social contexts. The purpose of collaborative
learning in schools is to give learners an avenue where
they learn the skills of active listening, positive
conflict resolution and awareness/acceptance of other’s
views. For ESL learners, collaborative learning
provides a means of support from peers, with shared
effort and ownership of learning outputs. Risk taking
and participation by the ESL learner is thus encouraged
as the focus is taken away from the individual. “The
Collaborative Learner domain enables students to become
effective communicators and group members.”
(http://www.education.nt.gov.au/__data/assets/pdf_file/
0015/5244/esl_fundamentals.pdf)
2.5 Related Previous Study
Improving reading comprehension achievement by using
contrast chart was nearly same with “knowledge chart”,
method that Ogle developed at 1986. Knowledge chart is
an activity that helps students access their background
knowledge and then identify their new knowledge on a
given subject. Ogle (1986:567) says that knowledge
chart help students recognize the “priority of their
personal desire to learn over simply taking in what the
11

author has chosen to include.” In addition, knowledge
chart is not only one that was nearly same with
contrast charts. Another study which used method that
was nearly same with contrast chart is “literary report
card”. Literary report card was suggested by Johnson
and Louis (1987) to give students the opportunity to
grades to characters in a reading selection. Besides
that, it provides children with an entertaining vehicle
for analysis of characters.
Like what have explained in the first, in this
study, the writers used contrast charts in improving
reading comprehension’s achievement at MTS N 1
Palembang. There were several differences among
contrast chart, knowledge chart and literary report
card. If knowledge chart and literary report card only
focused on one thing either characters or theme,
contrast chart in other side did not focus on one
things. Contrast chart can explain about settings,
plots, other related things, or both characters and
theme. By using contrast chart the writers were
expected the students can learn in many aspects and of
course improve students’ skill in reading
comprehension.
2.6 Hypotheses
12

H0 : There is no achievement when taught
reading comprehension by
using contrast chart to the seventh grade
students at MTS N 1
Palembang.
H1 : There is significant achievement when
taught reading
comprehension by using contrast chart to
the seven grade
students at MTS N 1 Palembang.
H0 : Contrast chart did not increase the
students’ learning motivation.
HI : Contrast chart increased the students’
learning motivation.
13
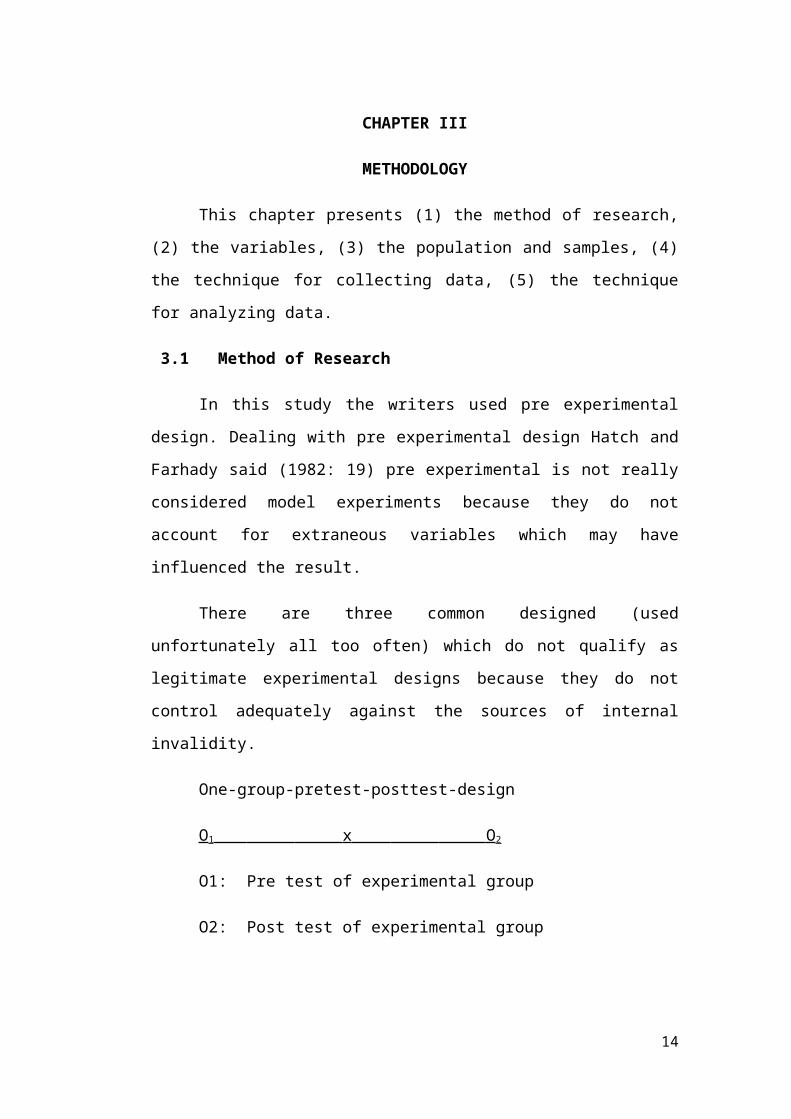
CHAPTER III
METHODOLOGY
This chapter presents (1) the method of research,
(2) the variables, (3) the population and samples, (4)
the technique for collecting data, (5) the technique
for analyzing data.
3.1 Method of Research
In this study the writers used pre experimental
design. Dealing with pre experimental design Hatch and
Farhady said (1982: 19) pre experimental is not really
considered model experiments because they do not
account for extraneous variables which may have
influenced the result.
There are three common designed (used
unfortunately all too often) which do not qualify as
legitimate experimental designs because they do not
control adequately against the sources of internal
invalidity.
One-group-pretest-posttest-design
O1 x O 2
O1: Pre test of experimental group
O2: Post test of experimental group
14

X : Treatment
3.2 Variables
According to Hatch and Farhady (1982:12) a
variable can be defined as an attribute of a person or
of an object which “varies” from person to person or
from abject to object. There are two variables to be
involved in this study, the dependent variable and
independent variable. The independent variable is the
major variable to be investigated. It is variable that
will be selected, manipulated, and measured by the
writer. On the other hand the independent variable is
what the writer observes and measure to determine the
influence of independent variable of this research. The
dependent variable of this research was the students’
achievement in reading comprehension by using contrast
chart. On the other hand, the independent variable was
the significant achievement of using contrast chart in
improving reading comprehension at MTS N 1 Palembang.
3.3 Population and Samples
3.3.1 Population
Fraenkel and Wallen said that the larger group to
which one hopes to apply the result is called the
population (1990:67). Another definition, Sugiono
15

(2011:61) said that “populasi adalah wilayah yang terdiri
atas:obyek/subyek yang mempunyai kualitas dan karakteristik tertentu
yang diterapkan oleh peneliti untuk dipelajari dan kemudian ditarik
kesimpulannya”. Population is a large group which
subject or object has characteristics to study and get
summary by the researcher.
The population of this research was seventh grade
students at MTS N 1 Palembang in the academic 2014-
2015, with a total of the students are 283 students.
TABLE 1The Population of the Study
NO CLASS TOTAL1. VII A 422. VII B 413. VII C 404. VII D 405. VII E 406. VII F 407. VII G 40
3.3.2 Samples
Sample in a research study referred to any group
on which information was obtained. In this study, the
writers choose A class of seventh grade students of MTS
N 1 Palembang. According to Fraenkel and Wallen
(1990:67), a sample in research study refers to any
16

group on which information is obtained. Total of the
population of this study is 283 students. If the
writers use all the population for this study it will
not possible. In this study, the writers will use
sample to help the writers to get the data because to
use all of the population will be hard for the writers.
Arikunto claimed that if the population less than 100,
the researcher could get 10%, 15% or 30% from all the
population, and the writers took 15% all of the
population as the sample. It means there were 42
students took as the sample.
TABLE II
The Sample of Seventh Grade Students at MTS N 1
Palembang
ClassNumber of Students
TotalMale Female
VII.
A
20 22 42
3.4 Technique for Collecting Data
To collect the data needed, the writers used
questionnaires and tests.
3.4.1 Questionnaires
17

Questionnaires were used in this study.
Questionnaires is used to facilitate students’ thinking
about their own attitudes and experiences related to
selected issues, not to elicit “correct” responses. The
writers gave two questionnaires to students, before and
after reading activities. The first questionnaire was
given to know the students’ opinion about reading and
contrast chart and the students’ problem on reading.
The second questionnaire was given to determine whether
contrast chart increase students’ motivation and
whether contrast chart solve students’ problem in
reading.
3.4.2 Test
The tests were used in this study; Tarigan
(1993:157) explain that test is a procedure that used
to collect data to know the ability and the knowledge
of the subject of the research in their lesson. There
were many kinds of test such as the multiple choice,
short answer, essay, matching question, and true-false
questions. The writers used short answer questions
because that was the most reliable way in getting some
information.
The test was given twice. It was given before
(pretest) and after (posttest) treatment. In pretest
sand posttest, the students had eight questions to be
18

answered. The writers used the same question for
pretest and posttest to know the students’ ability in
reading comprehension after being taught by using
contrast chart.
a) Pretest
Pretest was given before teaching reading. Pretest
is used to know the student’s ability to use this
method. Similar with Walter Dick, et.al (2005:147), the
pretest is administered to learners before they begin
instruction to determine whether they have previously
mastered some or all of the skills that are to be
included in the instruction.
b) Posttest
Posttest was given after the writers gave the
treatment in teaching reading. The result of posttest
was compared with the result of pretest, in order to
know the effectiveness of contrast chart to improve the
students’ ability in reading comprehension.
3.4.3 Validity
The validity refers to extent of the measurement
that can be measurement by a research instrument
(test). Best (1993:197) says that in general, a test is
valid to extent it measure what claims to measure.
There are three types of validity; content validity,
19

criterion related validity and construct validity, but
primary concern for the class achievement testing is
content validity.
Best (1993:197) describes the concept of content
validity as follows: Content validity refers to the
degree to which the best actually measure, or is
specially related to, the traits for which it was
designed. It shows adequately the best samples of the
university knowledge, attitudes, and skills that a
student is expected to master. Content validity is upon
careful examination of course textbooks, syllables,
etc.
Validity was the most important idea to consider
when preparing or selecting an instrument for use.
Content validity was concerned with was goes into the
test. Thus, the degree of content validity in a
classroom test relates to show how well the test
measures that content studied and the behavior that the
test requires.
TABLE III
Test of Specification
Objective Indicators Materials Types of
the Test
Total
Numbe
r
20

Students
can
response
the
meaning
of a text
Students
can
identify
detailed
information
from text
was given.
Narrative
text with
title “The
Town Mouse
and
Country
Mouse”
Written
test
8
3.4.4 Reliability
The realibility of the test material is evaluated
through the internal consistency reliability. It will
measure the degree to which the item or part of the
test are homogenous or consistency with each other
(Richard, et al, 1985:234). According to Tuckman
(1990:136) test reliability means that a test is
consistent. A rule made of rubber would not be reliable
ruler since it could stretch or contract to give
varying measures.
The reliability of the test material was evaluated
through in the internal consistence of reliability; it
is measure of the degree to which the items of parts of
were homogeneous or consistent with the other (Richard,
et, all, 1985:116). In this study, the Kuder-Richardson
was used; it was the way of estimating the interval
consistency of a test (Frenkel and Wallen, 1993:149).
21
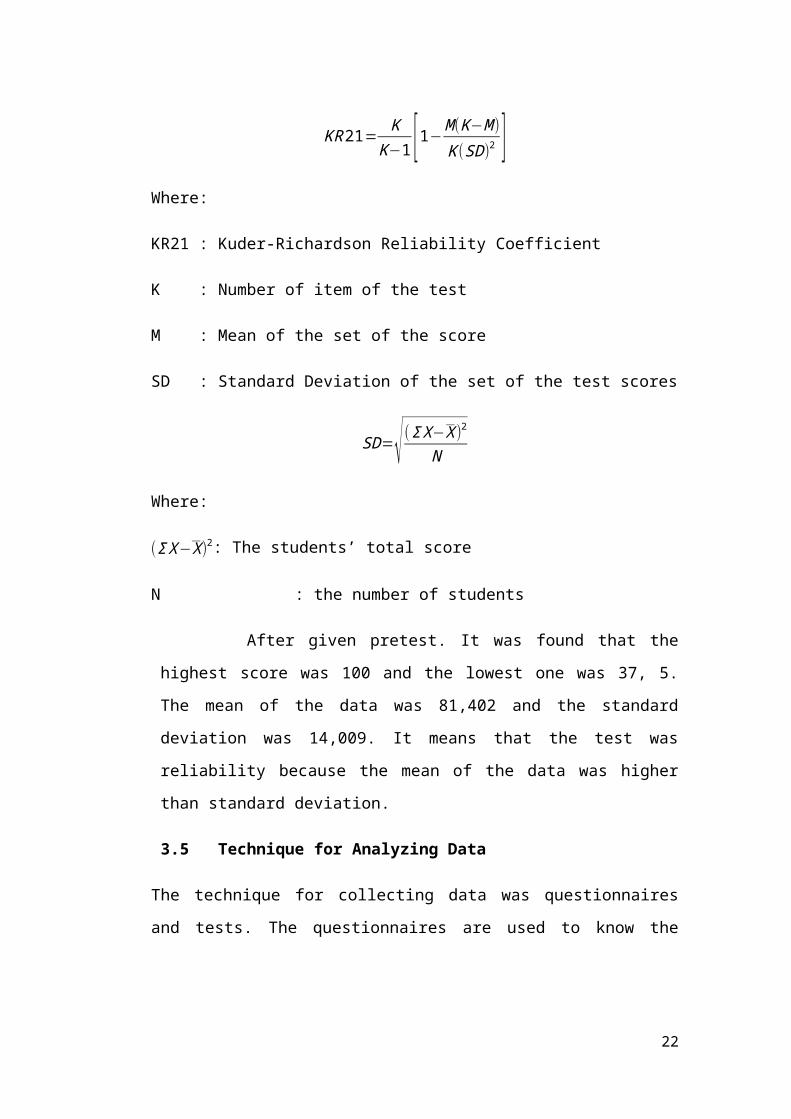
KR21=K
K−1 [1−M(K−M)
K(SD)2 ]Where:
KR21 : Kuder-Richardson Reliability Coefficient
K : Number of item of the test
M : Mean of the set of the score
SD : Standard Deviation of the set of the test scores
SD=√ (ΣX−X)2
N
Where:
(ΣX−X)2: The students’ total score
N : the number of students
After given pretest. It was found that the
highest score was 100 and the lowest one was 37, 5.
The mean of the data was 81,402 and the standard
deviation was 14,009. It means that the test was
reliability because the mean of the data was higher
than standard deviation.
3.5 Technique for Analyzing Data
The technique for collecting data was questionnaires
and tests. The questionnaires are used to know the
22

students’ opinion and the test is used to know the
students’ ability in reading comprehension. In
analyzing data the writers used percentage analysis and
matched t-test.
3.5.1 Percentage Analysis
This analysis is used to get the result of
questionnaires. The formula is; (Richard, et al,
1985:210)
X=CA¿ ×100%
Where:
X : Result of percentage
CA : Total number of students’ answer
NI : Total number of the options in a question
3.5.2 The Matched T-Test
t=X1−X2
SD
Where:
t : Value
X1 : The students’ mean score in the posttest
X́2 : The students’ mean score in the pretest
23

SD : Standard error of Differences
(Hatch and farhady, 1982:116)
24

CHAPTER IV
FINDINGS AND INTERPRETATION
In this chapter, the findings and the
interpretation are explained.
4.1 Findings
The finding result of this study are: (1) the
students’ score in pretest, (2) the students’ score in
posttest, (3) the difference score between pretest and
posttest, and (4) the data analysis of the test
through the matched t-test. In describing the finding
of the study, the data is presented here with.
4.1.1The Students’ Score in Pretest
In this study, the writers collect the data by
using test. For the first test, the writers used
pretest. According to Walter Dick, et.al (2005:147)
“The pretest is administered to learners before they
begin instruction to determine whether they have
previously mastered some or all of the skills that are
to be included in the instruction”. Pretest consisted
of eight items of short answer. The highest possible
score achieved by the students would be 100 and the
lowest would be 0. After the questions were tested to
the seventh grade students of MTS N 1 Palembang in
25

academic 2014/2015, it was found that the highest
score was 100 and the lowest one was 37,5. The mean of
the data was 81,562 and the standard deviation was
14,150.
4.1.2The Students’ Score in Posttest
For the second test, the writers used posttest.
Walter Dick, et. al, (2005:148) said that posttest is
administered following instruction, and they are
parallel to pretest, except they do not include items
on entry behaviors. Similar to the pretest, the
posttest measures objectives included in the
instruction. Posttest consisted of eight items of
short answer. In posttest the writes found that the
highest possible score achieved by the students would
be 100 and the lowest would be 0. After the questions
were tested to the seventh grade students of MTS N 1
Palembang in academic 2014/2015, it was found that the
highest score was 100 and the lowest one was 25. The
mean of the data was 85,417 and the standard deviation
was 18,780.
4.1.3 The Students’ Pretest and Posttest
After getting the treatments, the students got
difference score in the posttest score. The mean of
students’ pretest score was 81,562. The highest score
was 100, and the lowest score was 37, 5. The mean of
26

students’ posttest score was 85,417. The highest score
was 100, and the lowest score was 25.
From that result, the students’ scores in the
posttest increased. The mean of the data in the
posttest was higher than the mean of the data in the
pretest.
TABLE IV
The Differences’ Result in Pretest-Posttest
4.1.4 Question
na ires
From
questionnaires which was given to the seventh grade
students of MTS N 1 Palembang. From 41 students who
was given questionnaires the writers found that 12% of
the students started learning English since they were
27
Pretest’s-Posttest’s Result
PretestPosttes
t
Mean 81,402 85,417
Standard Error 2,187912 3,130
Median 87,5 87,5
Standard Deviation
14,010 18,780
Range 62,5 75
Sum 3337,5 3075
Count 41 36
Largest(1) 100 100
Smallest(1) 37,5 25

in kindergarten, 80,5% of the students started
learning English since they were in elementary school,
and 7,5% of the students started learning English
since they are in junior high school. The students who
like reading are 30 students or 73% of all of the
students. Generally, they like all the kind of story
but 76% of students like horror story. For frequency
of reading 41% of students read every day, 32% of
students read story at least once a week, 20% of
students read story about three until six times a week
or 12-24 times a month, and 7% of students said that
they did know how often they read.
Analysis questionnaires for questions about
reading activities divided in before and after reading
activities. (Appendix)
4.2 Interpretation
Based on the result of the pretest and posttest,
the mean of the data in pretest was 81,402 and the
highest gained score for pretest was 100.
After giving treatment, where the basal reader
approach was applied in teaching reading, especially
in reading comprehension by using contrast chart. The
mean of the data in posttest was 85,417 and the
highest gained score for posttest was 100.
28

Based on the data attained above, the mean of the
data in the pretest and posttest had a progress, the
mean of posttest was higher than mean of pretest. In
other words, taught reading comprehension for the
seventh grade students of MTS N 1 Palembang is
effective to improve students’ skill in reading
comprehension.
4.3
29

CHAPTER V
CONCLUSION AND SUGGESTION
5.1 Conclusion
After analyzing the data in chapter four, the
writers found that the mean of pretest was 81,402, and
the mean of posttest was 85,417. It means that contrast
chart method enable the seventh grade students of MTS N
1 Palembang to get better scores.
Based on the data above, it could be conluded that
the alternative hypothesis(H1) accepted and the null
hypothesis was rejected. Finally, it can be proved that
contrast chart method can improve the achivement of the
seventh grade students of MTS N 1 Palembang in reading
comprehension.
5.2 Suggestion
Considering the conclusion drawn above, the
following are some suggestion that may be useful for
the students and the English subject teacher in
teaching reading to the students.
5.2.1 The Teacher of English Subject
30

It is expected that the teacher of English subject
at MTS N 1 Palembang would; (1) find a bettter way to
make the effective strategies to reach the desire
result of teaching and learning objectives, (2) try to
contrast chart while teaching reading.
5.2.2 The Students
It is expected to the students at MTS N 1
Palembang would; (1) do a lot of reading especially to
improve the vocabulary in English, (2) pay attention to
the teacher either when teacher was explaining, or when
teacher was reading, (3) ask a few question to the
teacher, if there are any difficulties in learning
process.
31

REFERENCES
Arikunto, Suharsimi. (1998). Prosedur Penelitian Suatu
Pendekatan Praktek
(Jilid 4). Jakarta: PT. Rineka Cipta.
Dick, Walter, et.al. (2006). The Sytematic of Instructional
Design.
Fraenkel, Jack R., & Norman E. Wallen. (1993). How to
design and Evaluate
Research in Education. New York: Mc Graw-Hill Publishing
Company.
Hatch and Farhady. (1982). Research Design and Statistics for
Applied
Lingustics. Newbury House Publishers,INC. London.
Lipka, Orly & Siegel, Linda S. (2012) Reading and Writing:
An Interdisciplinary
Journal.
Retrived from http://eric.ed.gov/?id=EJ976646
Richards and Renadya. (2002). Methodology in Language
Teaching. Cambridge
University Press. USA.
Sugiono, Prof. Dr. (2001). Statistik. Bandung: Rineka
Cipta.
32

Tarigan, Henry Guntur. (1990). Membaca Sebagai Suatu
Keterampilan
Berbahasa. Bandung: Angkasa.
Tarigan, Henry Guntur. (1993). Prinsip-Prinsip Dasar Metode
Riset Pelajaran
Pembelajaran Bahasa. Bandung: Angkasa.
Tuckman, W.Bruce. (1990). Conducting Educational Research.
Hartcourt Brace
Jovanovich. New York.
Valentine, Anne. (2014). The Correlation Between Inferential
Comprehension
and Their Reading Comprehension of the Students of English
Education
Study Program FKIP Sriwijaya University Indralaya. Unpublished
undergraduate Thesis. Indralaya: Faculty Teacher
Training and Education,
Sriwijaya University, Indralaya.
Yopp, R. H., & Yopp, H. K. (1992). Literature-Based Reading
Activities_. USA.
Allyn and Bacon A Division of Simon & Schuster,
Inc.
http://www.ion.illinois.edu/resources/tutorials/
pedagogy/instructionalstrategies.as
p.
33

http://www.education.nt.gov.au/__data/assets/pdf_file/
0015/5244/esl_fundamenta
ls.pdf
34

35

36
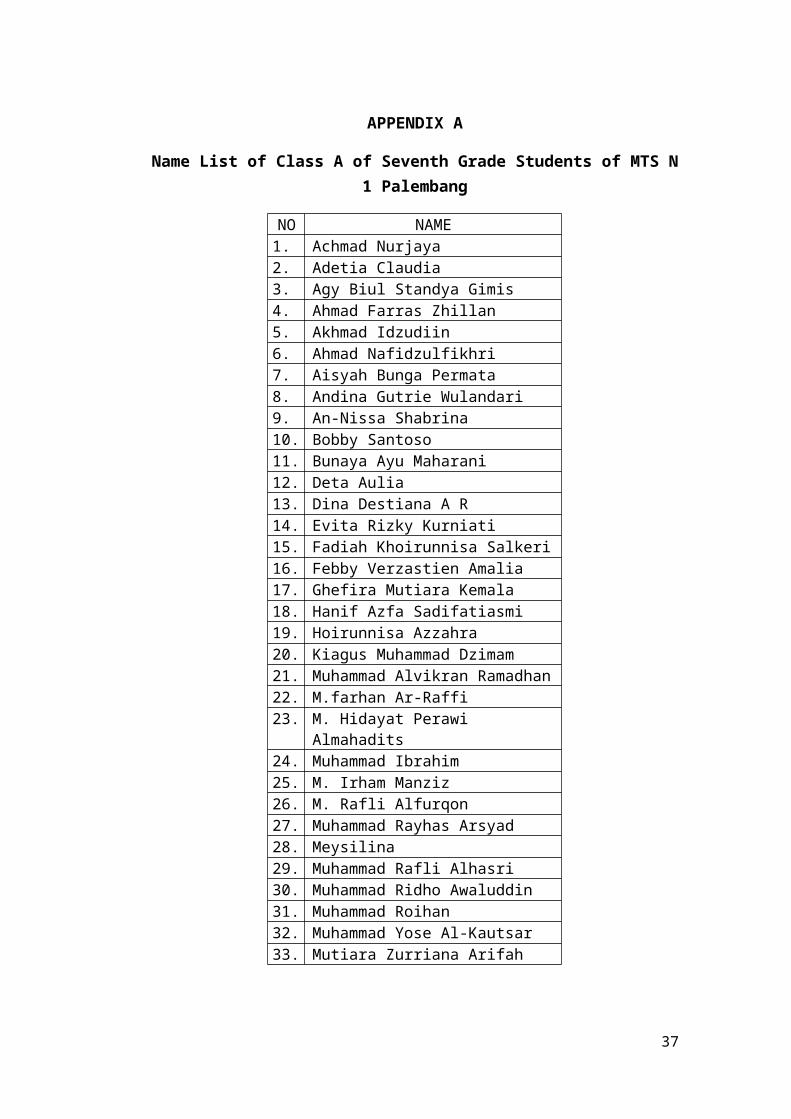
APPENDIX A
Name List of Class A of Seventh Grade Students of MTS N1 Palembang
NO NAME1. Achmad Nurjaya2. Adetia Claudia3. Agy Biul Standya Gimis4. Ahmad Farras Zhillan5. Akhmad Idzudiin6. Ahmad Nafidzulfikhri7. Aisyah Bunga Permata8. Andina Gutrie Wulandari9. An-Nissa Shabrina10. Bobby Santoso11. Bunaya Ayu Maharani12. Deta Aulia13. Dina Destiana A R14. Evita Rizky Kurniati15. Fadiah Khoirunnisa Salkeri16. Febby Verzastien Amalia17. Ghefira Mutiara Kemala18. Hanif Azfa Sadifatiasmi19. Hoirunnisa Azzahra20. Kiagus Muhammad Dzimam21. Muhammad Alvikran Ramadhan22. M.farhan Ar-Raffi23. M. Hidayat Perawi
Almahadits24. Muhammad Ibrahim25. M. Irham Manziz26. M. Rafli Alfurqon27. Muhammad Rayhas Arsyad28. Meysilina29. Muhammad Rafli Alhasri30. Muhammad Ridho Awaluddin31. Muhammad Roihan32. Muhammad Yose Al-Kautsar33. Mutiara Zurriana Arifah
37

34. Nabellah35. Novan Rahmadhani36. Nyimas Naura Nadifha37. Rachmadina Tiravitanya38. Rafika Luthfiani Novenia39. Tri Andi Sudarso40. Tri Qurrotul Aini41. Ulan Nuria Haranti42. Wahyuni Eka Putri
APPENDIX B
QUESTIONNAIRES BEFORE READING ACTIVITIES
When do you start learning English?
Kindergarten
Elementary
Junior high school
Never studied
I don’tknow
What have you learned?
Vocabularies Tenses
Making sentences I don’t know
Do you like English?
Really like
Like Just so
Don’t like
Hate
What do you think about English?
Easy Just so so Hard
**********************************************************************************
Reading Comprehension
1. Do you like reading story?
38

Really
like
Like Just
so so Don’t
like Hate
2. What kind of story do you like?
Fairy tale Legend Fable Adventure
Comedy
Horror Epic Romance Friendship Life
Magic Etc............
...............
......
3. How often do you read?
Everyday Once a
week Once a
month
3-6 times a week
6-10 times a month
15-20 times a month
Never read I don’t know
39
Questions Yes No Confuse
1. Have your teacher asked you to read story?
2. Did it make you interesting?3. Did you understand what you
read?4. Do you satisfied with the
way your teacher teach?5. Have you ever heard about
contrast chart?6. Do you think it is
interesting?

APPENDIX C
QUESTIONNAIRES AFTER READING ACTIVITIES
When do you start learning English?
Kindergarten
Elementary
Junior highschool
Never studied
I don’t know
What have you learned?
Vocabularies Tenses
Making sentences I don’t know
Do you like English?
Reallylike
Like Just so Don’t like Hate
What do you think about English?
Easy Just so so Hard
***************************************************************************************
Reading Comprehension
1. Do you like reading story?
Really like
Like Just so so
Don’t like
Hate
2. What kind of story do you like?
Fairy tale Legend
FableAdventure
Comedy
Horror Epic Romance Friendship Life
Magic Etc...............
..................
3. Hw often do you read?
Everyday Once a week Once a month40

3-6 times a week
6-10 times a month
15-20 times a month
Never read I don’t know
Questions Yes No Confuse
4. Have your teacher asked you to read story?5. Did it make you interesting?6. Did you understand what you read?7. Do you satisfied with the way your teacher
teach?8. Have you ever heard about contrast chart?9. Do you think it is interesting?10. Did it make you easier in reading?11. Do you agree if your teacher use
contrast chart in reading activities?
41

APPENDIX D
PRETEST’S MATERIAL
Name :
Class :
Emily’s Secret
Emily is eight years old. She lives in a big house. She has ahuge room. She has many toys and she has a lot of friends. But Emilyis not happy. She has a secret. She doesn’t want to tell anyoneabout her secret. She feels embarrassed. The problem is that ifnobody knows about it, there is no one can help her. Emily doesn’twrite her homework. When there is an exam – she gets sick. Shedoesn’t tell anyone, but the truth is she can’t read and write.Emily doesn’t remember the letters of the alphabet.
One day, Emily’s teacher finds out. She sees that Emily can’twrite on the board. She calls her after class and asks her to tellthe truth. Emily says, “It is true. I don’t know how to read andwrite”. The teacher listens to her. She wants to help Emily. Shetells her, “That’s ok. You can read and write if we practicetogether”. So Emily and her teacher meet every day after class. Theypractice together. Emily works hard. Now she knows how to read andwrite.
Questions:
1. Who can’t read and write?2. How old is she?3. What is her secret?4. Why doesn’t she tell anyone about her secret?5. Who is helping Emily?6. What did she do for Emily?7. Do you agree with what Emily did?8. What will you do if you were Emily?
Answers:
42

APPENDIX E
POSTTEST’S MATERIAL
Name :
Class :
Emily’s Secret
Emily is eight years old. She lives in a big house. She has ahuge room. She has many toys and she has a lot of friends. But Emilyis not happy. She has a secret. She doesn’t want to tell anyoneabout her secret. She feels embarrassed. The problem is that ifnobody knows about it, there is no one can help her. Emily doesn’twrite her homework. When there is an exam – she gets sick. Shedoesn’t tell anyone, but the truth is she can’t read and write.Emily doesn’t remember the letters of the alphabet.
One day, Emily’s teacher finds out. She sees that Emily can’twrite on the board. She calls her after class and asks her to tellthe truth. Emily says, “It is true. I don’t know how to read andwrite”. The teacher listens to her. She wants to help Emily. Shetells her, “That’s ok. You can read and write if we practicetogether”. So Emily and her teacher meet every day after class. Theypractice together. Emily works hard. Now she knows how to read andwrite.
Questions:
1. Who can’t read and write?2. How old is she?3. What is her secret?4. Why doesn’t she tell anyone about her secret?5. Who is helping Emily?6. What did she do for Emily?7. Do you agree with what Emily did?8. What will you do if you were Emily?
Answers:
43

APPENDIX F
THE ANSWER KEY FOR PRETEST-POSTTEST
1. Emily
2. Eight years old
3. She can not read and write
4. She feels embarrasment
5. Her teacher
6. She helped Emily to read and write. She taught Emily every day
after class and praticed together
7. I disagree with Emily
8. I will tell the truth and study hard to solve my own problem
44

APPENDIX G
MATERIAL DURING READING ACTIVITY
The Town Mouse and Country Mouse
Now you must know that a town mouse once upon a time went
on a visit to his cousin in the country. He was rough and
ready, this cousin, n=but he loved his town friend and made
him heartily welcome. Beans and bacon, cheese and bread, were
all he had to offer, but he offered them freely. The town
mouse rather turned up his long nose at this country fare and
said, “I cannot understand, cousin, how you can put up with
such a poor food as this, but of course you cannot expect
anything better in the country; come you with me and I will
show you how to live. When you have been in town a week you
will wonder how you could ever have stood a country life.” No
sooner said than done. The two mice set off for the town an
arrived at the town mouse’s residence late at night.
“You will want some refreshment after our long journey,” said
the polite town mouse, and took his friend into the grand
dining room. There they found the remains of fine feast, and
soon the two mice were eating up jellies and cakes and all
that was nice. Suddenly they heard growling and barking.
“What is that?” said the country mouse.
“It is only the dogs of the house,” answered the other.
“Only,” said the country mouse,” I do not like that music at
my dinner!” Just at that moment the door flew open; in came
45

two huge mastiffs; and the two mice had to scamper down and
run off.
“Good bye, cousin,” said the country mouse.
“What! Going so soon?” said the other.
“Yes,” he replied. “Better beans and bacon in peace than cakes
and ale in fear.”
46

APPENDIX H
ASSESMENT WHILE READING ACTIVITY
47

48

49

50

APPENDIX I
The Result of Questionnaires before Reading Activities
NoTeacherasked toread
It isinteresti
ng
Understanding
Satisfying withThe
Teacher
Hearing
aboutContrast
Chart
It isinterest
ing
1. 3 3 1 3 1 32. 3 3 3 3 1 33. 3 3 3 3 1 34. x x x x x x5. 2 3 3 3 2 36. 2 2 3 3 2 27. 3 2 2 3 2 28. 3 3 3 3 2 39. 3 3 3 3 3 310. 3 2 1 1 2 211. 3 3 1 3 2 112. 3 3 3 3 3 313. 3 3 2 3 1 314. 3 1 3 3 2 315. 3 3 3 3 2 316. 3 3 2 3 1 317. 3 3 3 3 1 218. 3 3 3 2 2 319. 3 3 3 3 2 220. 3 3 1 3 2 221. 3 3 2 3 2 322. 3 3 1 3 1 323. 3 3 3 3 3 324. 3 3 3 2 2 325. 2 2 2 3 2 226. 3 2 3 1 3 327. 3 2 1 3 2 228. 3 3 1 3 2 129. 3 3 3 3 2 330. 3 3 3 3 2 331. 2 2 2 3 2 232. 2 2 2 3 2 233. 3 3 3 3 1 234. 3 3 3 3 2 135. 3 2 1 3 2 2
51

36. 3 2 1 3 2 237. 3 2 3 3 2 138. 3 3 3 3 2 339. 3 3 3 3 2 340. 3 3 3 3 2 341. 3 3 3 3 3 342. 3 3 3 3 2 3Notes: 3 = yes, 2 = no, 1 = confuse
APPENDIX J
The Result of Questionnaires after Reading Activities
No 4 5 6 7 8 9 10 111. 3 3 3 3 3 3 3 32. 3 3 3 3 3 3 3 33. 3 3 3 3 3 3 1 14. x x x x x x x x5. 2 3 3 3 3 3 2 36. 3 3 3 3 3 3 2 37. 3 2 3 3 3 3 3 28. 3 3 3 3 2 3 3 39. 3 3 3 3 3 3 3 310. 3 3 3 3 3 1 3 311. 3 3 1 3 1 3 1 112. 3 3 3 3 3 3 3 313. 3 3 3 3 3 3 3 314. x x x x x x x x15. x x x x x x x x16. 3 3 3 3 3 1 1 317. x x x x x x x x18. 3 3 3 3 3 3 3 319. 3 3 3 3 3 3 3 320. 3 3 3 1 1 3 3 121. 3 3 3 3 3 3 3 322. 3 3 1 1 3 3 3 323. 3 3 3 3 3 3 3 324. 3 3 3 3 3 3 3 325. 3 3 3 1 1 3 1 226. 3 3 3 1 1 3 3 127. x x x x x x x x28. x x x x x x x x29. 3 3 3 3 3 2 3 330. 3 3 3 3 3 2 3 331. 3 3 3 3 3 3 3 3
52

32. x x x x x x x x33. 3 3 3 3 3 3 1 134. 3 3 3 3 3 3 3 335. 3 3 3 3 3 3 3 336. 3 2 3 3 3 2 3 237. 3 3 3 3 3 3 3 238. 3 3 3 3 3 3 3 339. 3 3 3 3 3 3 3 340. 3 3 3 3 3 3 3 341. x x x x x x x x42. 3 3 3 3 3 3 3 1
Notes:
4 = teacher asked to read5 = it is interesting6 = understanding7 = satisfying with the teacher8 = hearing about contrast
chart9 = it is interesting10 = it make easier11 = using contrast chart in readinG
53