RE-IMAGINING MINING TO IMPROVE PEOPLE'S LIVES
248
RE-IMAGINING MINING TO IMPROVE PEOPLE’S LIVES INTEGRATED ANNUAL REPORT 2019
-
Upload
khangminh22 -
Category
Documents
-
view
1 -
download
0
Transcript of RE-IMAGINING MINING TO IMPROVE PEOPLE'S LIVES

RE-IMAGINING MINING TO IMPROVE PEOPLE’S LIVES
INTEGRATED ANNUAL REPORT
2019

Other sources of informationYou can find this report and others, including the Sustainability Report and the Ore Reserves and Mineral Resources Report, on our corporate website.
RE-IMAGINING MINING TO IMPROVE PEOPLE’S LIVES
This is Anglo American’s clear and guiding Purpose, closely aligned with our longstanding reputation as a leader in sustainable mining and with the billions of people who rely on our products every day. At Anglo American, we are working to make a sustainable future a reality – combining integrity, creativity and smart innovation with the utmost consideration for all our stakeholders.
We are focused on enhancing the quality of our business through the disciplined allocation of capital, while staying attuned to the demands and expectations of our changing world, so that we grow our business safely, sustainably and responsibly, for the benefit of all.
INTRODUCTION AND GROUP PERFORMANCE
Strategic report01 Group performance02 At a glance04 Chairman’s statement06 Chief Executive’s statement08 Our business model10 Understanding our stakeholders12 Our material matters 14 The purpose to reward journey16 Marketplace review20 Strategic element: Portfolio 26 Strategic element: Innovation 36 Strategic element: People 42 Capital allocation44 Managing risk effectively50 Key performance indicators52 Group financial review56 De Beers60 Copper64 Platinum Group Metals (PGMs)68 Iron Ore72 Coal79 Nickel and Manganese83 Corporate and other
Governance84 Chairman’s introduction86 Directors90 Executive management92 The Board in 2019 101 Sustainability Committee 102 Nomination Committee 103 Audit Committee report 110 Directors’ remuneration report 110 Remuneration Committee 116 Directors’ remuneration policy 124 Annual report on directors’
remuneration 140 Statement of directors’
responsibilities 140 Responsibility statement
Financial statements 142 Independent auditor’s report 148 Primary statements 152 Notes to the financial statements214 Financial statements of
the Parent Company217 Summary by operation219 Key financial data220 Exchange rates and
commodity prices
Ore Reserves and Mineral Resources222 Estimated Ore Reserves224 Estimated Mineral Resources
Other information226 Glossary of terms228 Alternative Performance
Measures232 Production statistics235 Quarterly production statistics236 Non-financial data238 Disclosures related to the
recommendations of the TCFD239 Directors’ report243 Shareholder information244 Other Anglo American
publications and legal disclaimers
Cover images1. Thermal Coal’s Greenside colliery in South Africa
has installed a 90 kWh solar farm grid which is linked to the national grid. The plant produces enough energy to power all the surface offices at the mine.
2. Our metals are the essential ingredients in smartphones, electric cars and wind turbines, while also purifying traditional vehicle and other emissions.
3. Our Iron Ore business in Brazil continues to support several community projects. Here, at a school near the Minas-Rio mine site in Minas Gerais, pupils plant seedlings in the school garden’s greenhouse.
4. At Minas-Rio, equipment instructor Wanderlei de Oliveira examines data relating to the height definition training simulator featured in the background.
5. A Hyundai iX35 hydrogen fuel cell electric vehicle. The platinum catalyst in the vehicle’s fuel cell converts hydrogen to electricity, while emitting only water.
Contents
For more information, visit: www.angloamerican.com/reporting
MINING TO IMPROVE PEOPLE’S LIVES
INTEGRATED ANNUAL REPORT
20191
2
3
5
4
MINING TO IMPROVE PEOPLE’S LIVES
SUSTAINABILITY REPORT 2019

UNDERLYING EARNINGS PER SHARE◊
$2.75REVENUE
$29.9 bnUNDERLYING EBITDA◊
$10.0 bnOPERATING PROFIT
$6.2 bn
Group performance
2019
2018
$29.9 bn
$27.6 bn
2019
2018
$10.0 bn
$9.2 bn
2019
2018
$6.2 bn
$6.1 bn
2019
2018
$2.75
$2.55
PROFIT ATTRIBUTABLE TO EQUITY SHAREHOLDERS
$3.5 bnATTRIBUTABLE FREE CASH FLOW◊
$2.3 bnTOTAL DIVIDENDS PER SHARE
$1.09NET DEBT◊
$4.6 bn2019
2018
$3.5 bn
$3.5 bn
2019
2018
$4.6 bn
$2.8 bn
2019
2018
$1.09
$1.00
2019
2018
$2.3 bn
$3.2 bn
Alternative Performance Measures Words with this symbol ◊ are defined in the Alternative Performance Measures section of the Integrated Annual Report on pages 228 to 231.
GROUP ATTRIBUTABLE ROCE◊
19%TOTAL RECORDABLE CASE FREQUENCY RATE (TRCFR)
2.21NUMBER OF FATALITIES
4LEVEL 4-5 ENVIRONMENTAL INCIDENTS
02019
2018
19%
19%
2019
2018
4
5
2019
2018
2.21
2.66
2019
2018
0
1
Basis of reportingThe Anglo American plc Integrated Annual Report for the year ended 31 December 2019 is produced in compliance with UK regulations. Additionally, we have compiled this report using the Guiding Principles and Content Elements set out in the International Integrated Reporting Council’s <IR> Framework.
Integrated Reporting aims to demonstrate how companies create value sustainably over time, for a range of stakeholders – consistent with Anglo American’s Purpose, business approach and strategy. This report, therefore, includes a comprehensive overview of our material matters, in the eyes of our stakeholders, and the impact these matters have on the value we create.
Measuring performanceThroughout the Strategic Report we use a range of financial and non-financial measures to assess our performance. A number of the financial measures are not defined under IFRS so they are termed ‘Alternative Performance Measures’ (APMs). We have defined and explained the purpose of each of these measures on pages 228 to 231, where we provide more detail, including reconciliations to the closest equivalent measure under IFRS. These APMs should be considered in addition to, and not as a substitute for, or as superior to, measures of financial performance, financial position or cash flows reported in accordance with IFRS.
Reporting requirement Policies and standards Outcomes and additional information Page reference
Environmental matters Safety, Health and Environment (SHE) Way and Policy Managing our environmental impacts 32
Climate Change Policy Disclosures related to the recommendations of the TCFD 33 and 238
Energy and GHG Emissions Standard Climate change 33-34
Water Policy and Water Management Standard Water 32
Mineral Residue Technical Management Standard Mineral residue management 32
Employees Code of Conduct Building a purpose-led culture 41
SHE Way and Policy Safety 38
HIV/AIDS Policy Health 39
Human rights Human Rights Policy Human rights 34
Social matters The Social Way Social performance 34
Responsible Sourcing Standard for Suppliers Supply chain 35
Supply Chain Local Procurement Policy Supply chain 35
Anti-corruption and anti-bribery
Code of Conduct
Business Integrity Policy
Building a purpose-led culture
Business integrity
41
41
Principal risks and impact of business activity
Our business model 08-09
Our material matters 12-13
Managing risk effectively 44-49
Non-financial KPIs Key performance indicators 50-51
Units‘Tonnes’ are metric tons, ‘Mt’ denotes million tonnes, ‘kt’ denotes thousand tonnes, ‘Mct’ denotes million carats and ‘koz’ denotes thousand ounces; ‘$’ and ‘dollars’ denote US dollars and ‘cents’ denotes US cents.
Forward-looking statementsThis document includes forward-looking statements. For information regarding forward-looking statements please refer to page 244 of this document.
Non-Financial Information StatementWe aim to comply with the Non-Financial Reporting requirements contained in sections 414CA and 414CB of the Companies Act 2006. The table below is intended to guide stakeholders to where the relevant non-financial information is included within our Strategic Report. Further information on the basis of preparation of our non-financial information can be found in our Sustainability Report 2019.
Non-financial information in this report includes companies, subsidiaries and joint operations over which the Anglo American Group has management or acts as operator. It does not include independently managed operations, such as Cerrejón, Collahuasi and Samancor unless specifically stipulated where there have been significant incidents. It also excludes De Beers’ non-managed joint operations in Namibia and Botswana.
01Anglo American plc Integrated Annual Report 2019

OUR BUSINESS AT A GLANCE
(1) With the exception of Gahcho Kué, which is on an attributable 51% basis.(2) Number of operating mining assets/major projects under development per business unit.
More detailed maps can be found in the business unit reviews on pages 56 to 82.
PGMs
PLATINUM GROUP METALS
$2,000 million Underlying EBITDA◊
20% Group underlying EBITDA◊
2,051 koz Production platinum
1,386 koz Production palladium
For more information: See page 64
DIAMONDS
DE BEERS
$558 million Underlying EBITDA◊
6% Group underlying EBITDA◊
30.8 Mct Production (100% basis)(1)
For more information: See page 56
COPPER
COPPER
$1,618 million Underlying EBITDA◊
16% Group underlying EBITDA◊
2 Greenfield projects Peru (Quellaveco) Finland (Sakatti)
638 kt Production
For more information: See page 60
Anglo American is a leading global mining company, with a world class portfolio of mining and processing operations and undeveloped resources.
We provide the essential metals and minerals that enable a cleaner, greener, more sustainable world and that meet the growing consumer-driven demands of the world’s developed and maturing economies. And we do so in a way that not only generates sustainable returns for our shareholders, but that also strives to make a real and lasting positive contribution to society.
GLOBAL FOOTPRINT(2)
SOUTH AFRICA
AUSTRALIA
SINGAPORE
SHANGHAI
BOTSWANA
UNITED KINGDOM
FINLAND
BRAZIL
COLOMBIA
PERU
CANADA
CHILE
ZIMBABWE
13 2
21 2 5 6NAMIBIA
2 15
1
1
1
1
1
02 Anglo American plc Integrated Annual Report 2019
STRATEGIC REPORT AT A GLANCE

(3) Throughout this report, ‘employees’ is the average number of Group employees, excluding employees of contractors, associates’ and joint ventures’, and including a proportionate share of employees within joint operations.
(4) Includes social security costs of $182 million borne by the Group.
(5) Based on numbers disclosed within the Group’s income statement and excludes the impact of certain associates and joint ventures.
(6) See page 227 for definition.
WAGES AND BENEFITS PAID(4)
$m
Brazil 174Chile 391Other South America 46North America 80South Africa 1,751Other Africa 212Australia/Asia 441Europe 372
3,467
LOCAL PROCUREMENT SPEND(6)
$m
Brazil 93Chile 71Other South America 74North America 66South Africa 2,366Other Africa 811Australia/Asia 61Europe 217
3,759
NUMBER OF EMPLOYEES(3)
Thousand
Brazil 4Chile 4Other South America –North America 1South Africa 45Other Africa 4Australia/Asia 3Europe 2
63
TAXES BORNE(5)
$m
Brazil 178Chile 381Other South America 6North America 10South Africa 1,537Other Africa 179Australia/Asia 662Europe 82
3,035
GEOGRAPHIC OVERVIEW
CORPORATE AND OTHER
$(43) million Underlying EBITDA◊
For more information: See page 83
IRON ORE
$3,407 million Underlying EBITDA◊
34% Group underlying EBITDA◊
42.4 Mt Production iron ore – Kumba
23.1 Mt (wet basis) Production iron ore – Minas-Rio
For more information: See page 68
METALLURGICAL COAL
$1,707 million Underlying EBITDA◊
17% Group underlying EBITDA◊
22.9 Mt Production metallurgical
For more information: See page 72
THERMAL COAL
$125 million Underlying EBITDA◊
1% Group underlying EBITDA◊
26.4 Mt Production thermal – export
For more information: See page 72
NICKEL AND MANGANESE
$634 million Underlying EBITDA◊
6% Group underlying EBITDA◊
42.6 kt Production nickel
3.7 Mt Production manganese ore and alloy
For more information: See page 79
BULK COMMODITIES AND OTHER MINERALS
03Anglo American plc Integrated Annual Report 2019

During 2019, Anglo American built upon its remarkable business turnaround of the previous three years. I am pleased to report that the foundations are in place for a further step-change in operational and financial performance. The Group is taking an innovative approach by combining technology, digitalisation and sustainability to re-imagine mining. Why? To improve people’s lives – for our employees, our stakeholders and for society as a whole.
Mining with purposeAnglo American was well advanced in the formulation of its Purpose when I joined as chairman in 2017. A thorough process involving employees and numerous stakeholders brought us to an outcome which could hardly be more pertinent for our industry and for the challenges that the world is facing today.
As a major global mining company with a deep sense of responsibility, it is entirely appropriate for the Board, the executive team and all our people to be guided by such a clear Purpose. It is our duty to be true to it.
That means staying at the forefront of business sustainability – which for us means changing many of the basic physical processes of producing metals and minerals, improving how
our stakeholders experience us, and building the ever greater relevance of mined products in society’s mind.
SafetyStarting with safety, in 2019, the Group’s injury rate continued its positive trajectory trend to a new record low but, agonisingly, in our managed operations, we lost four employees in work-related fatal incidents: two people died at our Copper assets in South America, one at Metallurgical Coal in Australia and one at our Thermal Coal business in South Africa.
No company can claim to be sustainable if it is not doing its utmost to safeguard and enhance the well-being of the people who work for it. Zero harm, therefore, has always been the paramount consideration of the Board, and we must continue to strive to raise our safety performance so that we do get to, and stay at, zero.
Our Elimination of Fatalities Taskforce has completed assessments of all the sites we manage. The Taskforce’s findings and recommendations are helping us to prioritise actions to prevent incidents with the potential for loss of life and ensure that everyone who works for us returns home safely at the end of their working day.
Sustainable miningIn terms of sustainability more broadly, we are taking a distinct approach by adopting new, and combining existing, technologies to solve
mining’s challenges – with safety first, and spanning energy, water, noise, dust and emissions, to name a few.
Wrapping together technology, digitalisation and our ambitious Sustainable Mining Plan, our FutureSmart Mining™ programme has shown us the significant potential that innovation has to transform the environmental and societal footprint of our business – in many cases also embracing circular economy principles, which the Board wholeheartedly supports.
Our Sustainable Mining Plan commits us to a series of ambitious goals relating to three major areas of sustainability aligned to the UN’s 2030 Sustainable Development Goals: to be a trusted corporate leader; to create a healthy environment; and to foster and sustain thriving communities. The technologies and digitalisation that I have referred to are clearly critical enablers to our stretching healthy environment goals, particularly in relation to climate change, greenhouse gas (GHG) emissions, and water usage. I am pleased to report that we are now seeing certain of these being rolled out at scale in our operations – in Chile, in Brazil and South Africa.
Just as significantly, other technologies are helping us cater to consumers’ understandable desire to trust the provenance of the raw materials they are ultimately buying, by using blockchain, for example, to trace our diamonds all the way back through the value chain to the mine. The development of such ethical value chains is an important part of our trusted corporate leader ambition.
RE-IMAGINING MINING TO IMPROVE PEOPLE’S LIVES
STRATEGIC REPORT CHAIRMAN’S STATEMENT
As a major supplier of metals and minerals vital to the world’s transition to a more sustainable future, Anglo American has a special obligation to operate in a safe, responsible way so that our environmental and societal footprint is a positive one, both during the lifetime of our mines and beyond.”
Stuart Chambers Chairman
04 Anglo American plc Integrated Annual Report 2019

Our portfolio and performanceIn 2019, we continued to reap the benefit of the root and branch transformation of the business that Mark Cutifani and his team have led. Our much-upgraded asset portfolio and our focus on efficiency and productivity are underpinning a strong operational and financial performance.
At the operating-asset level, the turnaround has been remarkable. By way of illustration, and by comparison with 2012, physical production has increased by 12%, despite the number of assets halving, while production per employee, on a copper equivalent basis, has more than doubled.
Looking forwards, Anglo American has one of the clearest growth pathways in the sector, benefiting from a number of options within the portfolio. Our growth profile also brings the benefit of continuing the trajectory of our portfolio towards those products that are essential for a fast growing global population and a more sustainable future.
We are continuing to generate strong cash flows that we are using to invest in the future of the business and deliver sustainable returns to our shareholders. In 2019, revenue increased by 8% to $29.9 billion and underlying EBITDA increased to $10.0 billion. Profit attributable to equity shareholders was $3.5 billion, in line with 2018, and net debt increased from $2.8 billion to $4.6 billion, reflecting the current investment phase in our flagship Quellaveco project and other smaller value-adding projects.
Given our strong balance sheet, cash flows and our confidence in our funding of value-accretive growth opportunities, we deemed it appropriate at the half year to return excess cash to shareholders through a share buyback programme. This additional return of up to $1 billion recognises the resilience of our business and builds upon the $3.9 billion of cash that we will have returned to shareholders by May 2020, since reinstating the dividend in mid-2017.
Despite 2019 being a mixed year for certain product prices, the Board is recommending a final dividend of 47 cents per share, bringing the total for the year to $1.09 per share, in line with our 40% of underlying earnings payout policy and representing an increase of 9% over the total distribution for 2018.
I am pleased that the shareholder experience was again a positive one in 2019, with a Total Shareholder Return (TSR) of 31% against a FTSE 100 TSR of 17% and a FTSE 350 mining index TSR of 18%.
A still uncertain economic environmentIn 2019, markets reflected the effects of ongoing global trade tensions, with the uncertainties posed by tariffs between the US and China weighing on global economic confidence. India’s growth flagged, with the Eurozone remaining flat for the year. Manufacturing production has slowed, as have exports, with big exporting economies such as Germany and Japan being caught up in the fall-out. And, in 2020, we have seen the destabilising effects of the coronavirus outbreak.
In order to ensure that the business is resilient to what we expect to be continued geo-political uncertainties and societal change, we must also continue to focus on the high quality of our products and the value that our Marketing business is able to derive from them through its prized customer relationships.
GovernanceRightly, business is moving beyond the idea of seeking only to serve ‘shareholder value’ and is forging a wider purpose that serves the interests of all stakeholders. With trust in business at reduced levels, and as governments are seen by many to be failing to address crucial social, economic and environmental issues, and particularly climate change, broader society increasingly expects business to step up and to assume a leading role in finding solutions to the world’s pressing challenges.
These expectations are clearly evidenced by the increasing amount of capital that is being diverted into environmental, social, and governance (ESG) funds. We welcome this shift, it being aligned to our company’s Purpose and the full impact decision-making that Anglo American’s Board encourages. (See Section 172 Statement on page 10.)
In 2019, as a Board, we have again considered the interests of a wider group of stakeholders than shareholders alone in the performance of our duties. During the year, we supplemented our existing means of employee engagement by forming a Global Workforce Advisory Panel, comprising some 12 employees drawn from across our business, and chaired by our senior independent director Byron Grote. The Panel held its first meeting in October in South Africa.
Anglo American has also conducted an in-depth global survey of our roughly 60,000 direct employees and we have intensified our efforts to align the everyday experience of Anglo American to our Purpose and our Values.
Our BoardIt is vital that we have an appropriate mix of skills, experience and overall diversity around the Boardroom table. The Board must then support management in fostering a more inclusive business that reflects the Group’s footprint and the diverse workforces in our operating jurisdictions. Board members also need to be exposed to the full breadth of the business that they govern, including appropriate engagement with as broad a spectrum of our stakeholders as possible, as well as proper familiarisation with the operational and commercial aspects of the business.
In 2019, there were several changes to the Board as part of the continuous refreshment cycle. At the start of the year, Byron Grote was appointed our senior independent director, while retaining his chairmanship of the Audit Committee. In April, Marcelo Bastos, who has extensive operational and project experience in mining, particularly in South America, was appointed to the Board and the Sustainability Committee. Jack Thompson, to whom I paid tribute last year, retired from the Board at the end of the AGM and was succeeded as chair of the Sustainability Committee by Ian Ashby. In August, Nolitha Fakude stepped down to become chairman of our management board in South Africa and joined the Group Management Committee. Hixonia Nyasulu, who has highly relevant experience in the natural resources, financial services and consumer industries, joined the Board in November. Finally, Nonkululeko Nyembezi, an engineer with extensive experience spanning mining, steel, financial services, and technology, was appointed with effect from 1 January 2020.
ThanksFinally, I would like to thank all of Anglo American’s employees, the senior management team and our Board members. Their hard work and determination to continue to drive improvement and to act in accordance with our Purpose and Values are central to how this company continues to perform and to improve people’s lives.
Our Strategic ReportOur 2019 Strategic Report, from pages 2 to 83, was reviewed and approved by the Board on 19 February 2020.
Stuart Chambers Chairman
05Anglo American plc Integrated Annual Report 2019

We are unlocking the very significant additional potential that we see within the business – pushing productivity performance benchmarks, delivering volume growth from existing and new operations, and deploying FutureSmart Mining™ technologies. We are doing so safely and responsibly, maintaining strict capital discipline and creating a sustainable business in every sense.
Consistent delivery on our commitments continues to enhance Anglo American’s competitive position. We have again delivered a robust TSR for 2019 of 31%, outperforming both the FTSE 100 and the FTSE 350 mining index by some margin.
SafetyThe safety of our people is always front of mind for me, as it is for our leaders across the business. Making sure every employee returns home at the end of each day, better for having worked at Anglo American, is the vision for safety and health that drives everyone in the business. In this context, it is tragic that we continue to experience serious safety incidents, in which four of our employees died in work-related incidents in 2019 in our Copper and Coal businesses. And while 2019 saw the best safety performance in our history, our progress strengthens our determination to deliver on our commitment to zero harm.
Every individual who works at Anglo American must be unconditional about safety, no ifs and no buts. The Elimination of Fatalities Taskforce that we launched during 2018 has now covered all our managed operations, interrogating the key reasons behind fatal incidents, and is now prioritising actions to better identify and manage critical hazards to remove and reduce potential for serious and fatal incidents.
Across the breadth of our business, we recorded another all-time low total recordable safety rate, representing a 17% improvement since 2018 and a 59% improvement over the last six years. In being unconditional about safety, major safety incidents will be consigned to history, as we have shown in most of our working locations. The delivery of zero harm is about delivering this type of performance at every location and with every individual in the business.
Financial performanceIn 2019, underlying EBITDA increased by 9% to $10.0 billion, while our mining EBITDA margin was in line with the prior year at 42%. Operating profit increased by 2% to $6.2 billion, while profit attributable to equity shareholders was in line with the prior year at $3.5 billion.
The single largest contributor to EBITDA growth was our Minas-Rio iron ore operation in Brazil – ramping up and exceeding our production and cost reduction targets, generating $1.2 billion of EBITDA in 2019. Across the balance of the business, strong
precious metals and iron ore prices more than offset weaknesses in diamonds and coal and the effects of reductions in copper production through lack of water in Chile and electricity power outages in South Africa.
At the Group level, we generated attributable free cash flow of $2.3 billion, a 26% decrease, due largely to planned increased capital expenditure and higher cash tax payments.
We remain resolutely committed to our disciplined approach to capital allocation and to maintaining a sub-1.5 x net debt to EBITDA ratio. At the end of 2019, net debt on the balance sheet stood at $4.6 billion, an increase of $1.8 billion for the year, less than 0.5 x EBITDA. The increased level of net debt reflects the investments we are making in the future of the business, progressing high quality growth projects across our product portfolio, balanced with a continued focus on shareholder returns.
Our return on capital employed (ROCE) of 19% was well above our targeted 15% through-the-cycle return. While an individual year is too short a period to assess returns, our longstanding focus on cash flow covers the effectiveness of our operating initiatives, with ROCE measuring the efficiency of our capital deployment.
Combined with the proposed final dividend payment of 47 cents per share, payable in May 2020, total dividends paid to shareholders in respect of 2019 will amount to $1.09 per share, a 9% increase compared to 2018 and in line with our policy of paying out 40% of underlying earnings.
RE-IMAGINING MINING TO IMPROVE PEOPLE’S LIVES
STRATEGIC REPORT CHIEF EXECUTIVE’S STATEMENT
Anglo American stands out as a performance leader in the mining industry – we have transformed our operations and delivered significant financial improvement, while building our sustainability credentials through improving safety and environmental performance and building social partnerships. Guided by our Purpose, it is our people whose efforts bring to life the quality of our assets and our business as a whole.”
Mark Cutifani Chief Executive
06 Anglo American plc Integrated Annual Report 2019

Since we reinstated dividend payments in mid-2017, Anglo American will, by May, have returned $3.9 billion to shareholders in cash, in addition to our current share buyback programme.
Operating performanceThe implementation of our Operating Model, with our focus on efficiency and productivity improvements, continues to deliver significant safety, environmental and financial benefits. In 2019, we produced 12% more product on a copper equivalent basis from half the number of assets we had in 2012. As a result, our productivity per employee has more than doubled, supporting a 12 percentage point increase in mining margin.
Underlying cost and volume benefits were $0.4 billion – adjusted to $0.1 billion on a net basis to reflect factors beyond our control. Over seven years, we have delivered $4.7 billion of annual underlying EBITDA improvement in terms of costs and volumes. Such improvements have generally been achieved without additional capital, so we have continued to improve our ability to generate free cash flow and increase returns from existing capital employed.
Looking forward, we still believe there is significant further improvement. By 2022, we are targeting an additional $3-$4 billion annual underlying EBITDA improvement, before inflation, relative to 2017. We are starting to see this benefit come through in the numbers, including by meeting and then surpassing industry best-practice operational performance across our business; volume growth from existing and new operations; and the deployment of our FutureSmart Mining™ technologies, digitalisation and sustainability. It is this approach that is beginning to transform how we mine, process and market our products, providing ongoing step-changes in our performance.
Strategy: PortfolioThe quality, long life and growth potential of our mineral assets are the foundations of our global business. The transformed scope and quality of Anglo American’s portfolio over several years is contributing to our materially improved financial and operational performance. We will continue our discipline of divesting less attractive assets and replacing them with assets of a higher quality and cash generation profile, thereby continuing to lift the overall quality, margins and returns from the portfolio.
In recent years, we have brought on stream Grosvenor in Metallurgical Coal, Gahcho Kué at De Beers and the Minas-Rio iron ore mine, and we are well on track with the development of our new Quellaveco copper mine in Peru, with first production expected in 2022.
We have a well sequenced range of high returning, quick payback growth options across copper, PGMs, diamonds and metallurgical coal. Our attractive organic growth pipeline is a key component of the long term sustainability of our business and we will also be agile to supplement that pipeline with suitably high quality external opportunities that fit our strategy and later-cycle portfolio trajectory.
Strategy: InnovationInnovation and challenging the status quo is in our DNA as a company, part of our culture, and is at the heart of our Purpose.
We are setting out a very different future for mining – a future designed to further improve how our stakeholders experience our business, that has a much lighter environmental footprint, and that ensures the safe supply of metals and minerals that billions of people rely on in their everyday lives.
Our FutureSmart Mining™ programme brings together step-change innovation in technology, digitalisation and sustainability – working hand in hand towards a more sustainable mining configuration. When we talk about a lighter environmental footprint, we include reducing energy and water consumption, in addition to reducing our physical mining footprint. This is an integrated approach to innovation that is beginning to transform the nature and experience of mining and thereby improve people’s lives.
For instance, several of our new technologies are aimed at targeting the metal or mineral more precisely, with much less waste rock, and lower water and energy intensity, while others will ensure that our people are safely out of harm’s way through remote operations or other safety changes. These physical and digital technologies are all about mining sustainably.
Our Sustainable Mining Plan, integral to FutureSmart Mining™, commits us to a series of ambitious goals over the next decade. These goals relate to three major areas of sustainability aligned to the UN’s Sustainable Development Goals: trusted corporate leader (i.e. advocating for the highest standards of governance to drive transparency and trust in mining and mined products); thriving communities; and healthy environment.
While our environmental goals will rely on many of the technologies we are deploying, we are also thinking innovatively to create regional ecosystems of sustainable economic activity, collaborating with appropriate development partners.
Strategy: PeopleOur Purpose is aimed squarely at people and how we can do things differently to improve the lives of those that come into contact with our business and our products. This approach begins with the people closest to our business, our employees, for whom we take great care to provide fulfilling work and clarity about their roles and the part they play towards our business objectives.
During 2019, we completed a global survey of our employees, achieving above-benchmark levels of engagement of 83%. This is extremely encouraging and is based on feeling proud to work for Anglo American and recommending the company as a good place to work.
In the context of our commitment to creating an inclusive, diverse and engaging working environment that enables every person to come to work each day and give their very best, we also recently refreshed the behaviours that we expect from our employees and that relate to each of our six Values. These are important building blocks towards the high performance culture that we seek for outstanding people who believe in and are guided by our Purpose.
Mining with purposeAnglo American today is a resilient global business, with a world class asset portfolio diversified across an attractive range of products, increasingly focused on those that contribute towards a cleaner, greener, more sustainable world and that satisfy the consumer-led demands of a fast growing global population.
We recognise our role in creating a sustainable future for what are essential raw materials for modern life. We must act in a way that is aligned with society’s rightfully higher expectations of us and of business as a whole. Guided by our Purpose, we strive to always do the right thing for our employees, our diverse business stakeholders, and our shareholders who, let’s not forget, ultimately are millions of hard-working people all over the world.
Mark Cutifani Chief Executive
07Anglo American plc Integrated Annual Report 2019

OUR BUSINESS MODEL
OUR VALUES Anglo American’s Values and behaviours are at the heart of everything we do. Guided by our Purpose and our Values, we enable high performance and purposeful action.
Our Values and the way in which we, as individuals, are expected to behave are the foundation of our Code of Conduct.
HOW WE MEASURE THE VALUE WE CREATE
Safety and health Environment Socio-political People FinancialProduction Cost
For our pillars of value: See page 15
MATERIALITY AND RISK
Identifying and understanding our material matters and risks is critical in the development and delivery of
our strategy.
For our Material matters: See pages 12-13
STRATEGIC REPORT BUSINESS MODEL
OUR STRATEGYPortfolioThe quality and long life of our mineral assets are the foundation of our global business. We focus on securing and continuously improving assets that offer the most attractive long term value-creation potential, as measured by sustainable cash flow and returns.
The scale and diversity of our portfolio allow us to leverage our financial resources, technical expertise, and supplier relationships towards delivery on our full potential and to the benefit of our customers, creating a measured risk profile and supporting strong returns, through the cycle.
InnovationAcross every aspect of our business, we are thinking innovatively about how we work to ensure the safety of our people, enhance our sustainability performance, and deliver industry-leading margins and returns.
Discovery See pages 24-25
Project development See pages 24
Operating Model and P101See pages 30
FutureSmart Mining™ –Technology, Digitalisation and SustainabilitySee pages 31-35Marketing
See pages 29-30
PeopleOur people are critical to all that we do. The partnerships we build locally and globally are central to maintaining our regulatory and social licences to operate and our sustained commercial success.
We create inclusive and diverse working environments that encourage and support a high performance culture and innovative thinking.
Our Organisation Model ensures we have the right people in the right roles doing the right value-adding work at the right time, with clear accountabilities that minimise work duplication and increase capability and effectiveness.
OUR INPUTSOre Reserves and Mineral Resources: We have high quality and long life mineral assets across our businesses and across a wide geographic footprint, providing a suite of organic options for delivering value over the long term. Our Discovery teams work to discover mineral deposits in a safe and responsible way to replenish the resources that underpin our future success.
Know-how: We link our industry-leading technical and market knowledge across the Group to realise even greater value from our resource base and optimise mine production plans to ensure we provide products reliably to our customers around the world, meeting their specific technical and logistical requirements.
Relationships with stakeholders: Open and honest engagement with our stakeholders is critical in gaining and maintaining our social and regulatory licences to operate. Working within our social performance framework, it is our goal to build and sustain constructive relationships with our host communities and countries that are based on mutual respect, transparency and trust.
Other natural resources: Mining and processing activities have long been major users of water and energy. Our technical and social expertise combine to provide advice and support to our operations to mitigate their water and energy requirements, while also developing new technologies that have the potential to significantly reduce our physical and environmental footprint.
Plant and equipment: Our procurement and technical teams form strong relationships with major suppliers to deliver tailored equipment and other solutions to enable best-in-class operating performance and cost-effectiveness. We implement local procurement policies that support suppliers based in the host communities close to our operations – making a significant socio-economic contribution, as well as lowering logistics costs.
Financial: Our strong focus on productivity, cost discipline and working capital management helps to drive sustainable positive cash flows. Our financial resources are allocated to where they can deliver optimal financial returns for our shareholders.
GOVERNANCEOur governance controls ensure that
we respond effectively to those matters that have the potential to cause financial,
operational and reputational harm to our business, while acting ethically and
with integrity for the benefit of all our stakeholders.
For our Governance Report: See pages 84-140
HOW WE CREATE SHARED VALUE
Anglo American draws upon a number of key inputs that, through targeted allocation, development, extraction and marketing, create
sustainable value for our shareholders and our diverse range of stakeholders.
For our KPIs: See pages 50-51
08 Anglo American plc Integrated Annual Report 2019

OUR VALUE CHAINWe will invest in those points in the value chain that provide us with the best return on our investment, while striving to meet the highest environmental, social and governance standards. Sustainable financial value can only be created by protecting the value of our natural and human resources.
Discover: Our geologists search for and discover new sources of the minerals that make our modern lives possible. Our search falls into two categories: greenfield exploration to find entirely new resources, and brownfield exploration to identify additional resources close to existing operations. We benefit from developing and using world class expertise and leading technologies, often that we have developed ourselves, to find deposits we can develop and mine in a safe and sustainable way.
Plan and build: Before we put a spade in the ground, our geologists and engineers work together using virtual mine planning systems to design the most effective, cost-efficient, environmentally sound construction and operational mine plan. This work can take several years, depending on the complexities of the orebody, the physical environment of the site, its location relative to power and energy supplies and the route to market.
Mine: In extracting the products that we all need in our daily lives, we draw on over 100 years of mining experience. Safety comes first: our whole way of working is focused on zero harm. We plan for the lifecycle of the mine and beyond and use our own technologies for reducing waste and protecting environments. We mine copper, diamonds and platinum group metals, as well as iron ore, coal and nickel.
Process: By processing, converting and refining our raw materials we produce what customers need. As well as creating bespoke products for our customers, our processing technologies enable us to reduce waste, save water, increase efficiency, drive innovation and, by adding value to our products, support economic growth in the areas we mine.
Move and market: After processing, we then transport often enormous volumes – particularly in the cases of iron ore and metallurgical coal – of our products to where they are needed, to our customers. We use the latest logistics technologies to co-ordinate and optimise our global shipping needs to deliver on time, every time. And we use our scale and detailed knowledge of the markets for our products to offer our customers a stable supply to their exact specifications – adding value every step of the way.
End of life plan: We don’t only plan for the lifecycle of the mine – we also take great care to look beyond and determine the rehabilitation of the site and the real benefits that will be felt by local communities, long after the site is closed. The technologies we use to rehabilitate help us get it right first time, which minimises our environmental footprint, while also safeguarding cash resources.
OUTPUTSOur outputs are the products that meet the growing consumer and other demands of the world’s developed and maturing economies. Mining and processing activities also result in the unavoidable disturbance of land, generation of mineral residue, use of fresh water and energy, as well as atmospheric emissions and water discharges. We strive to minimise our footprint through our innovative technologies that are designed to support our approach to sustainable mining.
ATTRIBUTABLE FREE CASH FLOW ◊
$2.3 bnGROUP PRODUCTION GROWTH
12%Since 2012
CO2 EQUIVALENT EMISSIONS
17.7 Mt
GROUP ATTRIBUTABLE ROCE ◊
19%TOTAL WATER WITHDRAWALS
209 Mm3
OUTCOMES AND STAKEHOLDER VALUEAs we strive to deliver attractive and sustainable returns to our shareholders, we are acutely aware of the potential value creation we can offer to our diverse range of stakeholders. Through our business activities – employing people, paying taxes to governments and procuring from host communities – we make a significant and positive contribution to the countries where we operate. Beyond our direct mining activities, we create and sustain jobs, build infrastructure, support education and help improve healthcare for employees and local communities. By re-imagining mining, we are improving people’s lives.
INVESTORS
$1.4 bnTotal dividends paid and proposed
GOVERNMENTS
$3.0 bnTaxes borne
EMPLOYEES
$3.5 bnWages and benefits paid
SUPPLIERS
$3.8 bnLocal procurement expenditure
LOCAL COMMUNITIES
132,082Jobs created and maintained through enterprise development programmes since 2008
09Anglo American plc Integrated Annual Report 2019

Section 172 statement The Anglo American plc Board is cognisant of its legal duty to act in good faith and to promote the success of the Group for the benefit of its shareholders and with regard to the interests of stakeholders and other factors. These include the likely consequences of any decisions we make in the long term; the need to foster the relationships we have with all our stakeholders; the interests of our employees; the impact our operations have on the environment and local communities; and the desire to maintain a reputation for high standards of business conduct. New directors appointed to the Board in 2019 received tailored, individual briefings on these duties, and the Board received updates in 2019.
As a major mining company, the Board understands that our wide range of stakeholders (identified on page 11) is integral to the sustainability of our business, underpinning our licence to operate. In addition, the Board is conscious that expectations around our performance and contribution to society – from local to global – are both diverse and continuously evolving.
By listening to, understanding and engaging with our stakeholders, the Board endeavours to live up to their expectations, by staying true to our Purpose, acting in accordance with our Values, and delivering our strategy.
Stakeholder considerations are integral to the discussions at Board meetings and the decisions we make take into account any potential impacts on them and the environment. Like any business, we are aware that some of the decisions we make may have an adverse impact on certain stakeholders.
In 2018, the Board approved, and is holding management to account for, our Sustainable Mining Plan – a key component of our FutureSmart Mining™ programme. We are committed to a series of ambitious medium and longer term goals that are aligned to the UN’s Sustainable Development Goals. These goals are designed to make a comprehensive and lasting contribution that we expect will positively transform how our stakeholders experience our business.
The Board and its committees took a broad range of factors and stakeholder considerations into account when making decisions in the year. Decisions are made within the context of the long term factors that may impact the Group, including key competitive trends and disruptions; technology capability; and climate change considerations. For more detail on Board activity in the year, see pages 95-96. For more on the global trends that influence the mining industry and our business, see pages 16-17.
Our Purpose and Values Anglo American has long understood the role of its business in society. In 2017, we began to validate our underlying Purpose with our employees, while also consulting stakeholders and shareholders, culminating in a Board discussion to encapsulate that Purpose as being to re-imagine mining to improve people’s lives.
Anglo American provides many of the raw materials our modern society needs, combining integrity, creativity and innovation with due consideration for all our stakeholders to better connect precious resources to the people who need and value them. We work together to provide our people with better jobs, a better education and better businesses, and we are building brighter and healthier futures around our operations, in our host countries and ultimately for billions of people around the world who depend on our products every day.
Our Values: Safety; Care and Respect; Integrity; Accountability; Collaboration; and Innovation guide our behaviour and shape our culture, and are fundamental to creating enduring benefit for all our employees, shareholders, and stakeholders in a way that demonstrably improves people’s lives.
Engaging our stakeholdersHealthy stakeholder relationships help us to better communicate how our business decisions, activities and performance are likely to affect or be of significant interest to our stakeholders, and provide the opportunity to co-create effective and lasting solutions to business and other challenges.
Anglo American’s stakeholders include our host communities, governments, employees, customers, business partners, multinational organisations, industry peers, broader civil society, trade associations and suppliers, in addition to our shareholders who own the business. In some instances, we work with representatives from multi-stakeholder initiatives to provide a more collaborative and holistic view on the issues facing our industry.
Understanding our employeesOur people are critical to everything we do. We create safe, inclusive and diverse working environments that encourage and support high performance and innovative thinking. We are acutely aware that to get the best from our people, we need to understand their viewpoints and address any concerns they may raise about working for us.
We consider workforce engagement to be a priority for every leader at Anglo American; for several years, we have run regular surveys to identify areas where, for example we need to do more to ensure that colleagues feel cared for and respected. In 2019, we expanded our efforts through both listening to employees and reporting their opinions to the Board and executive management. We completed our largest-ever employee survey; created a Global Workforce Advisory Panel chaired by our senior independent director, Byron Grote; and hosted an employee Q&A session with members of the Board. The People and Governance sections of this report provide more detail on these engagements and explain the resultant outcomes.
For more information: See page 98
The Board (through its Sustainability Committee) monitors progress towards our Sustainable Mining Plan targets and how these may affect future decision-making. For example, in 2019, the Board or its Sustainability Committee discussed progress towards having all our operations assessed against credible responsible mining standards by 2025, as well as the far-reaching stakeholder engagement and environmental mitigation work at our Sakatti project in Finland. For more on the Sakatti project, see page 25 and for more on responsible mining standard certification, see page 30.
Key financial decisions in the year included approval of a share buyback of up to $1 billion, in addition to the approval of final and interim dividend payments to shareholders and the approval of a number of value-accretive projects. For more on capital allocation, see pages 42-43.
The following pages describe the ways the Board received information about our various stakeholders and the main concerns and questions raised in 2019. Throughout this Strategic Report we have sought to demonstrate how the views of our stakeholders are embedded in how we do business, guided by our clear Purpose.
UNDERSTANDING OUR STAKEHOLDERS
10 Anglo American plc Integrated Annual Report 2019
STRATEGIC REPORT UNDERSTANDING OUR STAKEHOLDERS

COMMUNITIES
SUPPLIERS AND CONTRACTORS
INDUSTRY/BUSINESS
ASSOCIATIONS
INVESTORS
EMPLOYEES
CIVIL SOCIETY (NGOS, FAITH
GROUPS, ACADEMIA)
GOVERNMENTS AND
MULTILATERAL INSTITUTIONS
CUSTOMERS
Employees How we engage
Creation of our Global Workforce Advisory Panel; ongoing dialogue between line managers and teams; global employee survey; employee presentations and Q&As; global themed engagement events (e.g. Global Safety Day); YourVoice. Ongoing dialogue through established industrial relations channels.
Significant topics raised
– Safety, health and well-being – Working conditions – Engagement and alignment with our Purpose
– Proposed changes to our operations or practices
– Opportunities for personal development.
For more information: See pages 36-41 and page 98
Customers How we engage
Business and industry forums; direct personal engagements.
Significant topics raised
– Delivery of product on agreed terms – Evidence of environmentally and socially responsible performance and risk management.
For more information: See pages 29-30
ENGAGING WITH OUR STAKEHOLDERS
Governments and multilateral institutions How we engage
Face-to-face meetings with local and national government representatives; open dialogue and ongoing advocacy work – both directly and through industry bodies; participation in inter-governmental and multilateral processes.
Significant topics raised
– Compliance with mining licence and related requirements
– Contribution to national and international developmental priorities, such as job creation, skills development, public health and (in South Africa) transformation
– Taxation policy, including royalty and carbon taxes
– Wider sustainability and development agenda, including climate change.
For more information: See pages 34-35
Industry/business associations How we engage
Engagement throughout business bodies and initiatives.
Significant topics raised
– Contributing constructively in business initiatives, with the aim of enhancing the collective business interest
– General knowledge sharing on our approach to managing material sustainability issues.
For more information: See pages 32-34
Investors How we engage
AGM, investor roadshows, one-on-one meetings, results webcasts, sustainability presentation to investors, investor days and site visits.
Significant topics raised
– Progress of major projects – Operating performance as a result of technology and innovation programmes
– View on market for Anglo American products
– Tailings storage facilities – Environmental issues – Minas-Rio recovery.
For more information: See pages 98-99
Civil society (NGOs, faith groups, academia) How we engage
One-on-one interactions; various multi-stakeholder initiatives and partnerships; open and ongoing dialogue on tax transparency.
Significant topics raised
– Transparency and accountability on sustainability issues
– Ensuring responsible governance practices and respect for human rights
– Minimising environmental and community impacts
– Investing in social and community development
– Economic contribution of mining – Sustainable tax principles.
For more information: See pages 32-35
Suppliers and contractors How we engage
Supplier events focused on particular topics; e.g. health and safety; supplier relationship management programme with strategic suppliers; local procurement and small business development initiatives; engagement via the sustainable and responsible supplier audit programme.
Significant topics raised
– Terms and conditions of contract – Increasing procurement opportunities – Ensuring the safety, health and well-being, and human rights of employees of contracting companies and suppliers.
For more information: See page 35
Communities How we engage
Ongoing site-level community relations engagement following the application of our Social Way; Groupwide complaints and grievance procedure.
Significant topics raised
– Access to jobs and supplier opportunities
– Access to skills development – Quality and availability of public services, including housing
– Environmental and health concerns – Transparency and engagement – Distribution of social investment – Tensions within and between community groups.
For more information: See pages 34-35 and our Sustainability Report
11Anglo American plc Integrated Annual Report 2019

OUR MATERIAL MATTERS
In line with best-practice corporate reporting, Anglo American’s Integrated Annual Report includes a comprehensive assessment of the principal risks facing the business, as well as those matters that both our stakeholders and we believe have a material bearing on the success of the business in both the near and long term – beginning with safety and environmental sustainability.
By engaging with our stakeholders and being aware of their perspectives, and by understanding the risks we know we face, we are better placed to make informed decisions that help support the delivery of our strategy.
Determining what is importantIdentifying and evaluating matters that are of common material interest to our stakeholders and to our business, and understanding how they may affect our ability to create value over time, are integral to our planning processes and help support the delivery of Anglo American’s strategy.
Our process for determining those matters involves three steps: consultation, analysis and approval. The consultation process in 2019 involved extensive desktop research, including: review of the Group Risk Register; global media coverage and analyst reports on Anglo American and the mining sector; and analysis of Board and executive discussions. During 2020, we will undertake the integrated materiality analysis in tandem with the in-depth sustainability materiality process we carry out every three years. The process will be led by a third party, who will liaise with external and internal stakeholders. Their findings will then be validated by the Group’s leadership and the Board’s Sustainability Committee.
At the heart of decision-makingConsideration of the wide spectrum of stakeholder and environmental interests is firmly embedded into Anglo American’s governance structures and is guided by our Purpose. Stakeholder concerns and considerations therefore feature prominently in the discussions of our Board meetings and those of its committees.
Material matters in 2019The matters identified through our materiality process were naturally numerous and wide-ranging. These were analysed and prioritised by senior management and then reviewed and approved by the Board.
In order for us to report against these material matters effectively, and demonstrate how they affect the delivery of our strategy, we have set them out under the headings listed in the table opposite.
BOARD REVIEW • Chief executive and senior management team formulate the Group’s long term strategy
• In addition to regular discussion on strategic topics, the Board dedicates a full meeting to a discussion of the Group’s strategy, addressing critical short, medium and long term issues
• Board approves critical strategic decisions and endorses the Group’s strategy
• Board reviews progress of delivery of Group’s strategic goals, as well as periodic business unit strategic reviews.
INSIGHTSGlobal trends and marketplace review
See pages 16-19
Stakeholder engagement and topics raised
See pages 10-11
Principal risks
See pages 46-49
Material matters
See pages 12-13
STRATEGYTo secure, develop and operate a portfolio of high quality and long life mineral assets, from which we will deliver leading shareholder returns. We achieve this through innovative practices and technologies – in the hands of our world class people – towards our common Purpose.
For more on our strategy: See pages 14-15
CAPITAL ALLOCATIONUnderpinning our strategy, we have a value-focused approach to capital allocation, with clear prioritisation: sustaining capital to maintain asset integrity; payment of base dividends, and then the allocation of discretionary capital to either growth investments, upgrades to our portfolio, or additional returns to shareholders.
For more information on our capital allocation approach: See pages 42-43
INSIGHTFUL AND CONSIDERED STRATEGIC DECISION-MAKING
The Board, through its role in setting the tone from the top, provides leadership to the Group and is responsible for promoting and safeguarding the long term success of the business, supporting the executive management team in its formulation and implementation of the Group’s strategy.
The duties of directors with regards to ensuring there is effective dialogue between the Group and its shareholders and stakeholders are broadening in scope, while society’s expectations of company boards also continue to grow. At Anglo American, those matters considered by the Board and our stakeholders to be of material importance, and the views of our stakeholders in relation to those matters, are integral to the Board’s discussions and decision-making, including in relation to the Group’s strategy and any evolution thereof.
For more information on the matters considered and discussed by the Board: See pages 96
Each material matter covers a number of topics and issues, and some also intersect with specific principal risks facing the Group, as identified in the Group Risk Register. Principal risks are those risks, or combination of risks, that would threaten the business model, future performance, solvency or liquidity of Anglo American and are shown with the following symbol (‡). An analysis of the Group’s principal risks, including mitigation strategies, can be found on pages 46-49 of this report.
12 Anglo American plc Integrated Annual Report 2019
STRATEGIC REPORT OUR MATERIAL MATTERS

PILLARS OF VALUE STRATEGIC ELEMENTS
Safety and health
Environment
Socio-political
People
1 Portfolio 2 Innovation
3 People
Production
Cost
Financial
MATTERS IDENTIFIED AS MATERIAL TO OUR STAKEHOLDERS AND OUR BUSINESS
Material matters Areas of impact
Safety and health ‡
Protecting the safety and health of employees, contractors, local communities and other stakeholders is a fundamental responsibility for all mining companies. While protecting our workforce from harm’s way is a moral imperative, our focus on zero harm also constitutes a direct investment in the productivity of the business and the physical integrity of our operations. A safe and healthy workforce translates into an engaged, motivated and productive workforce that mitigates operational stoppages, and reduces potential legal liabilities.
Strategic elements: 2 3
Pillars of value:
Environmental impacts and climate change
Responsible environmental management, including the monitoring and management of tailings storage facilities (TSFs) and management of water consumption and discharge, is not only a major factor in legal compliance and permitting, but also plays a significant role in improving the balance of value from mining for our local stakeholders. Anglo American goes beyond established regulatory and industry standards in many respects to ensure that our managed TSFs are held to the highest standards of safety and stewardship, sharing our experiences with others in the industry to help build and maintain trust with all our stakeholders.
Understanding the effects of climate change on our business and how they may impact our value chain is important as we strive to optimise the opportunities associated with the transition to a low-carbon future.
Strategic elements: 1 2
Pillars of value:
Meeting our commitments to business stakeholders and society
Local communities and host governments rightly expect mining to bring significant economic benefits, and our ultimate goal is to leave host communities and governments better off than when we arrived. Anglo American aims to bring enduring economic prosperity to national and local economies through employment, our supply chain and the subsequent increase in local business and commerce, and a collaborative approach to regional development.
Acting in an ethical, responsible and transparent manner is fundamental to Anglo American realising the significant business benefits gained from building trusted and constructive relationships with all our business stakeholders, and to maintaining our socio-political licence to operate.
Strategic elements: 1 2 3
Pillars of value:
Workforce culture and capability
To deliver on our strategic business objectives, we rely on a capable and engaged workforce that behaves ethically and responsibly, consistent with Anglo American’s Values and Code of Conduct; these are also essential for us to maintain our social licence to operate.
We aim to foster a high performance, inclusive culture, through an organisational structure that is fit for purpose, resourcing this structure with the right capabilities and empowering leadership to deliver the desired outcomes.
Strategic elements: 3
Pillars of value:
Operational and cost performance ‡
The mining sector continues to face operating cost inflation, including labour costs, energy costs and the natural impact of ore-grade deterioration over time.
In order to deliver our disciplined growth strategy and to maintain and improve our competitive position, Anglo American must deliver its financial improvement targets and minimise the number of unplanned operational stoppages that affect production and unit costs.
Strategic elements: 1 2 3
Pillars of value:
Political and regulatory ‡
Anglo American operates or is otherwise active in a number of countries where there is political instability and where the regulatory environment for the mining industry is uncertain.
Strategic elements: 1 2 3
Pillars of value:
Macro-economic environment ‡
Economic volatility in those countries that are major consumers of the Group’s products could have a negative impact on demand for those products. Demand may also be negatively affected by product substitution and/or fundamental shifts in market forces.
Strategic elements: 1 2
Pillars of value:
For our pillars of value: See page 15
For our strategic elements: See pages 20-41
13Anglo American plc Integrated Annual Report 2019

OUR VALUES
THE PURPOSE TO REWARD JOURNEY
Our strategy is to secure, develop and operate a portfolio of high quality and long life resource assets, from which we will deliver leading shareholder returns. We achieve this through innovative practices and technologies – in the hands of our world class people – towards our common Purpose.
Anglo American’s Values and behaviours are at the heart of everything we do. Guided by our Purpose and our Values we enable high performance and purposeful action.
Our Values and the way in which we, as individuals, are expected to behave are the foundation of our Code of Conduct.
OUR STRATEGIC ELEMENTS
1
PortfolioThe quality and long life of our mineral assets are the
foundation of our global business. We focus on securing and continuously improving assets that offer the most
attractive long term value-creation potential, as measured by sustainable cash flow and returns.
The scale and diversity of our portfolio allow us to leverage our financial resources, technical expertise, and supplier relationships towards delivery on our full potential and to the benefit of our customers, creating a measured risk
profile and supporting strong returns, through the cycle.
For more on Portfolio: See pages 20-25
2
InnovationAcross every aspect of our business, we are
thinking innovatively about how we ensure the safety of our people, enhance our sustainability performance,
and deliver enduring value for all our stakeholders.
From exploration to delivering our products to our customers, FutureSmart Mining™ is our innovation-led pathway to sustainable mining. Coupled with the best-in-class operational improvements
being delivered from our unique Operating Model and P101 programme, we are fundamentally changing the way we extract,
process and market our products, and will provide the next step-change in operating and financial performance.
For more on Innovation: See pages 26-35
PeopleOur people are critical to all that we do.
The partnerships we build locally and globally are central to maintaining our regulatory and social licences to operate and our sustained
commercial success.
We create inclusive and diverse working environments that encourage and support a high performance culture
and innovative thinking.
Our Organisation Model ensures we have the right people in the right roles doing the right value-adding work at the right time, with clear accountabilities that minimise work
duplication and increase capability and effectiveness.
For more on People: See pages 36-41
3
Capital allocationUnderpinning our strategy, we have a value-focused approach to capital allocation, with clear prioritisation: sustaining capital to maintain asset
integrity; payment of base dividends, and then the allocation of discretionary capital to either growth investments,
upgrades to our portfolio, or additional returns to shareholders.
For more on Capital allocation: See pages 42-43
OUR PURPOSEAnglo American is re-imagining mining to improve people’s lives.
Mining has a smarter, safer future.
Using more precise technologies, less energy and less water, we are reducing our physical footprint for every ounce, carat and kilogram of precious metal or mineral.
We are combining smart innovation with the utmost consideration for our people, their families, local communities, our customers, and the world at large – to better connect precious resources in the ground to all of us who need and value them.
And we are working together to develop better jobs, better education and better businesses, building brighter and healthier futures around our operations in our host countries and ultimately for billions of people around the world who depend on our products every day.
14 Anglo American plc Integrated Annual Report 2019
STRATEGIC REPORT THE PURPOSE TO REWARD JOURNEY

MEASURING DELIVERY OF OUR STRATEGYWe track our strategic progress on an ongoing basis using KPIs that are based on our seven pillars of value:
SAFETY AND HEALTH To do no harm to our workforce
ENVIRONMENT To minimise our impact on the environment
SOCIO-POLITICAL To partner in the benefits of mining with local communities and government
PEOPLE To create a sustainable competitive advantage through capable people and an effective, purpose-led, high performance culture
PRODUCTION To sustainably produce valuable product
COST To be competitive by operating as efficiently as possible
FINANCIAL To deliver sustainable returns to our shareholders
For our KPIs: See pages 50-51
BALANCED REWARDAnglo American’s directors’ remuneration policy(1) is designed to encourage delivery of the Group’s strategy and creation of stakeholder value in a responsible and sustainable manner, aligned to our Purpose. The main elements of the remuneration package are basic salary, annual bonus and Long Term Incentive Plan (LTIP).
Fixed pay Basic salary levels are reviewed annually by the Remuneration Committee, taking into account company performance, individual performance, levels of increase for the broader population and inflation. Reference may be made to the market median of FTSE 50 and natural resource companies, or other peer groups, to ensure market alignment. Pension levels are offered at market-competitive levels. New executive directors are appointed with a pension level equal to the wider workforce.
Annual bonus Annual bonus performance measures include:
• 50% on underlying earnings per share (EPS). EPS is one of the Group’s key financial measures of performance and is set on an annual basis to ensure targets are demanding yet realistic
• Individual measures which have a focus on portfolio delivery, innovation and high performing teams
• 10% on safety, health and environment (SHE) measures
• A safety deductor may be applied, to hold our business leaders personally accountable for any failures in our journey to the goal of zero harm
• To help ensure sustainable long term performance, 60% of any annual bonus is deferred into shares for a minimum of three years and is subject to malus and clawback
Long Term Incentive Plan (LTIP) The LTIP performance measures are aligned to our strategic objectives over a three-year performance period. Vested LTIP awards are subject to malus and clawback and must be held for an additional two years to encourage alignment of executive and shareholder interests.
The LTIP performance measures and weightings are:
• 70% subject to Group TSR, with two-thirds relative to the Euromoney Global Mining Index and one-third relative to the constituents of the FTSE 100 index
• 30% subject to a balanced scorecard of financial and strategic objectives, including environmental and broader sustainability targets
Shareholding targets Executive directors are expected to hold shares in the company with a value of three times salary for the CEO and two times salary for other executive directors. This encourages further alignment with shareholders.
For our KPIs: See pages 50-51
FutureSmart Mining™FutureSmart Mining™ is our innovation-led
pathway to sustainable mining. Technologies and digitalisation will fundamentally change how
we mine, process, move and market our products; and our Sustainable Mining Plan
will transform how our stakeholders experience Anglo American.
For more on FutureSmart Mining™: See pages 31-32
TechnologyWe are integrating technologies to enable safe mining, removing people from harm’s way, and to more precisely target metal and mineral with
less waste, water and energy.
For more on Technology: See page 31
DigitalisationOur vision is to create a truly smart, connected mine, transforming vast quantities of data into predictive intelligence with the ultimate aim of
creating a self-learning operation that offers new levels of safety, stability and predictability.
For more on Digitalisation: See page 31
SustainabilityOur far-reaching Sustainable Mining Plan is built around three major areas or global sustainability pillars, which are aligned to the UN’s Sustainable
Development Goals.
For more on our Sustainable Mining Plan: See pages 31-32
(1) This reflects the policy for 2019. A new remuneration policy, effective for 2020-2022, will be taken to a shareholder vote at the AGM in May 2020. For more details: See pages 110-138
15Anglo American plc Integrated Annual Report 2019

MARKETPLACE REVIEW
GLOBAL TRENDSA number of global trends influence the mining industry and our business decisions.
We understand those trends and believe our strategy: our high quality portfolio of assets; relentless approach to innovation; and talented people – combined with our business decisions aligned to our Purpose – positions us well to take advantage of commercial and other opportunities, thereby unlocking our full potential for sustainable value creation.
Moving towards a cleaner world – the transition towards lower-emission transport and energy solutions
Emerging wealth – changing demographics
What is it?
• In light of society’s concerns around the expected impacts of climate change, many countries are working to curb greenhouse gas and other noxious emissions across multiple sectors and through the entire production value chain.
• The global response includes a transition towards lower-emission transport and energy generation, two of the largest carbon-emitting sectors.
What does it mean for our industry?
• Energy generation emissions are being reduced primarily through the development of renewable energy. This will likely generate demand for steelmaking ingredients (iron ore and metallurgical coal) and copper. Measures to reduce emissions from coal-fired power plants include using higher quality thermal coal.
• In transport, reducing carbon emissions is dependent on adoption of electric vehicles (EVs). Batteries and fuel cells are the likely powertrains for EVs and both have the potential to create demand for a range of metals, including PGMs, copper, nickel and manganese. Tightening emissions standards for internal combustion engine vehicles requires more PGMs in catalytic converters.
• An increasing focus on the environmental performance of mining companies.
Delivering value through our strategy
• We mine the metals and minerals that will help the transition to a cleaner, greener, more sustainable world, including: PGMs for catalytic converters in internal combustion engines, as well as a catalyst in hydrogen fuel cells; copper used in EVs and renewable energy generation; and nickel in batteries within EVs.
• We work closely with our customers to provide the niche steelmaking products they require to achieve their environmental goals, including lump and high quality iron ore from Kumba; low impurity iron ore pellet feed from Minas-Rio; and high quality hard coking coal from our Metallurgical Coal mines in Australia.
For more on our Portfolio: See pages 20-25
For more on Innovation: See pages 26-35
What is it?
• A number of developing countries, particularly China, have experienced a period of rapid urbanisation and industrialisation over the last two decades, resulting in an unprecedented number of households entering the wealthier middle class.
• A number of other countries and regions are expected to experience greater economic maturity in the decades ahead, particularly India, south east Asia, South America and ultimately Africa.
What does it mean for our industry?
• As disposable incomes increase, so the demand for metals that are used in consumer goods (e.g. copper, nickel and manganese) may increase.
• As purchasing power increases, so too does the appetite for luxury goods and services. Demand for later-cycle products, such as PGMs and diamonds, is expected to increase.
Delivering value through our strategy
• Anglo American has a diversified product portfolio, mining products that are well placed to serve the needs of the expanding global middle class.
• We have exposure to some of the largest resource bases in both PGMs and diamonds. We also have world class copper resources in Los Bronces and Collahuasi, as well as the Quellaveco copper project in Peru. We have exposure to nickel through Barro Alto and Codemin, and as a by-product of our PGM mines.
• Our innovative market development and investment programmes aim to stimulate demand for our products and, in particular, PGMs.
For more on our Portfolio: See pages 20-25
For more on Innovation: See pages 26-35
1 2
16 Anglo American plc Integrated Annual Report 2019
STRATEGIC REPORT MARKETPLACE REVIEW

Evolving societal and regulatory expectations
A more challenging physical environment for mining
The circular economy
What is it?
• Political uncertainty and protectionist trade policies can adversely affect global economic growth and, consequently, the demand for mined products.
• These have been major factors in the significant price volatility experienced in the commodity markets in recent years.
• Governments in countries where mining is a material source of national revenue are under pressure to deliver more benefit and regulatory reform, while not deterring much-needed private sector investment.
• Mining companies are also facing greater demands and expectations from diverse stakeholder groups, with often competing interests, in the context of greater societal intolerance for poor business and sustainability practices.
What does it mean for our industry?
• The uncertain regulatory environment in some countries can lead to delays in licensing and permitting and higher taxes and royalties, all of which can deter investment in those countries.
Delivering value through our strategy
• FutureSmart Mining™ – and, within it, our approach to sustainability – is designed to help meet society’s expectations about the physical nature of mining, as well as to work with governments to advocate for progressive regulatory frameworks that encourage and support investment in modern mining.
• Our Operating Model and P101 programme are designed to put us at the forefront of established best-in-class performance – offering insulation from price and other volatility by placing us at the low end of the industry cost curves.
• The technologies we are deploying and our holistic approach to sustainability will begin to address society’s rightful expectations about water and energy consumption, further supporting our licence to operate and helping us to access previously uneconomic orebodies.
For more on Innovation: See pages 26-35
For more on Capital allocation: See pages 42-43
What is it?
• Maintaining long term supply for some metals and minerals is becoming ever more difficult for a number of reasons, including:
– Availability of both water and energy
– Declining ore grades
– Increasing infrastructure costs as mines are built in more remote locations
– The shift to underground mining as easy to access near-surface orebodies become depleted.
What does it mean for our industry?
• The factors described above are contributing to structural upward cost pressure across the mining industry.
• Consequently, mining companies face a significant challenge to reduce costs and improve productivity. Technological innovation and operational improvements are likely to be critical to achieving sustainable cost and productivity improvements and the ability to supply the market over the long term.
Delivering value through our strategy
• In recent years, Anglo American has upgraded the quality of its portfolio and is now operating a suite of high quality, long life, high margin assets across structurally attractive markets.
• Our innovation-led pathway to sustainable mining – FutureSmart Mining™ – uses innovative mining methods and technologies to overcome challenges of water, lower grades and energy constraints and reduce capital intensity and operating costs.
• Our Discovery strategy enables us to discover superior-value deposits that have the potential to enhance the production profile and competitive position of the Group over time, and which play a vital part in delivering a sustainable future.
For more on Innovation: See pages 26-35
What is it?
• One of the great challenges society faces is the over-consumption of resources. On some projections, more than 2 billion new consumers could join the global middle class by 2030 – a situation that will put further strain on the planet’s resources.
• The circular economy entails gradually decoupling economic activity from the consumption of finite resources, with the aim of eliminating waste and maximising efficiency of resources.
What does it mean for our industry?
• A decoupling of resource consumption from economic activity could lead to an overall reduction in demand for primary mined material. This trend may require the mining industry to balance activity between resource extraction and resource management in ensuring that appropriate raw materials are available, either through production or recycling.
Delivering value through our strategy
• Our participation across the value chain allows us to apply our innovations in technology and sustainability across the entire value chain, beyond only upstream production.
For more on Innovation: See pages 26-35
3 4 5
17Anglo American plc Integrated Annual Report 2019

REVIEW OF 2019
Global growth resilientFor 2019, the IMF estimated global GDP growth at 2.8%, lower than the 3.6% recorded in 2018. Year-on-year growth was maintained in most areas, despite the drag of escalating trade disputes, as well as global geo-political tensions.
Prices for a number of Anglo American’s products performed better than in 2018. Overall, platinum group metals’ exposure to stricter environmental regulations in the automotive sector proved to be a positive factor, notably for palladium.
Trade and politicsWorld economic growth was maintained in 2019 at reasonable levels despite the US-China trade dispute, with associated trade barriers and disruptions continuing to weigh on economic growth. The US economy remained buoyant, growing by 2.3% over the year (2018: 2.9%), even with the uncertainty over the USMCA trade agreement (which is set to replace the previous NAFTA deal between the US, Canada and Mexico), and headwinds resulting from the fading fiscal stimulus and ongoing trade tensions.
In China, commodity demand remained resilient, supported by government policy stimulus and a strong construction sector. This occurred even though there was slowing industrial output, which reached a 17-year low of 5% growth in May 2019, and subdued power-generation growth.
In aggregate, Chinese GDP is estimated to have grown by 6.1% in 2019 (2018: 6.6%), and is expected to be 6.0% in 2020.
Domestic demand in south east Asia has been supported by accommodative regional macro-economic policies, despite these countries having been exposed to the adverse economic impacts of reduced trade, owing to their high export orientation and strong trade integration with China. The potential for trade tariffs being implemented on the region’s exports, in addition to those on Chinese exports, remains a downside risk to growth.
Emerging-market economies faced several headwinds, including from a strong US dollar. In India, GDP growth declined to just 4.8% (2018: 6.8%), leading to India’s central bank cutting interest rates five times during 2019, with further stimulus measures expected.
In South Africa, the rand depreciated by 9% on average against the dollar against the backdrop of a slow economy, interruptions to the power supply, the precarious position of certain state-owned enterprises, and the risk of industrial action.
Markets review
DiamondsAgainst a backdrop of subdued economic growth, preliminary data for 2019 suggests consumer demand for diamond jewellery will be flat compared with 2018.
Midstream sentiment has been depressed owing to the closure of some US ‘bricks and mortar’ retail outlets, an increase in online purchasing, retailers increasing their stock held on consignment and the coinciding weakening of polished diamond prices. In response, rough diamond producers offered fewer rough diamonds, which, in turn, led to a decrease in purchases and manufacturing levels at cutting centres. This contributed to the average rough price index for diamonds decreasing by 6% in 2019, while the spot polished price index is estimated to have declined by 3%-5%.
Inventory levels are estimated to have been balanced as the trade prepared for the US Christmas selling season, supporting an improvement in midstream sentiment and rough diamond purchases towards the end of the year. Limited midstream rough diamond purchases during the second six months, along with stable consumer demand, are expected to have supported the diamond pipeline returning to a balanced, steady state by the end of 2019.
Platinum Group Metals (PGMs)PGMs prices fared well in 2019, with palladium reaching a record $1,980/oz and rhodium recording an 11-year high of $6,155/oz.
Platinum climbed from $794/oz to $971/oz over the course of the year. Increasingly strict emissions regulations supported higher PGM loadings on vehicles, particularly in China, resulting in PGM demand growth from the global automotive sector, despite weak automotive sales in many parts of the world.
Platinum demand was supported by increases in the investment and industrial segments, although it faced some headwinds, including softer jewellery sales in China, in line with the country’s slower economic growth, and weaker demand in the European and Indian light-duty diesel vehicle sector.
Palladium remained in a deficit of approximately 1.1 million ounces in 2019, while rhodium was more closely balanced.
Despite the weak automotive sector, the current vehicle sales levels, if maintained, would support palladium and rhodium, against a potential backdrop of constrained supply growth.
Primary mined platinum and palladium remained broadly flat year-on-year, at around 13 million ounces. South African output was flat at 7.1 million ounces, while secondary supply increased by 10% to 5.1 million ounces (2018: 4.7 million ounces).
18 Anglo American plc Integrated Annual Report 2019
STRATEGIC REPORT MARKETPLACE REVIEW
MARKETPLACE REVIEW CONTINUED
1.0
0.5
1.8
INDEXED 2019 PRICES
Jan 2019 Dec 2019
Pric
e In
dex,
1 J
anua
ry 2
019
= 1
.0
Thermal coal (FOB South Africa)Metallurgical coal PGMs basket
NickelIron ore (Platts 62% CFR China)
PlatinumPalladium
Change in average annual price (2019 vs 2018)
Anglo American 1%Palladium 50%Iron ore 35%PGM’s basket ($) 27%Nickel 6%Platinum (2)%De Beers price index (6)%Copper (8)%Metallurgical coal (14)%Thermal coal (27)%
Source: Anglo American Commodity Research
Anglo American basket price
CopperDe Beers price index

Base metalsGlobal refined copper consumption increased by an estimated 1.5% in 2019. However, the metal price struggled owing to slower than expected growth in China, largely as a consequence of the ongoing US-China trade dispute. The copper price decreased to an average of 272 c/lb in 2019 (2018: 296 c/lb).
Tighter environmental restrictions continue to affect copper scrap imports into China, supporting growth in apparent refined demand. In the medium term, the lean supply pipeline and the growing global middle class population should be positive for metal demand.
Nickel demand was more robust, primarily driven by a 3.3% increase in stainless steel output, the largest end-use application for nickel, resulting in an estimated deficit of 23,000 tonnes in 2019. The nickel price reached a high of 845 c/lb and averaged 632 c/lb, a 6% increase (2018: 595 c/lb).
Bulk commoditiesGlobal crude steel production is estimated to have increased by approximately 3% in 2019, supported primarily by increased output in China. While output increased by around 7%, driven by government stimulus and infrastructure investment, elsewhere several key steel markets exhibited either weak or negative growth owing to the slowdown in global economic growth generally and exacerbated by the impact of the US-China trade dispute.
Persistent supply tightness supported iron ore prices throughout 2019. In the first half, the loss of output following the Brumadinho dam disaster and adverse weather in Brazil and Australia, combined with strong steel production in China, pushed iron ore prices above $100/tonne for the first time since 2014. Prices fell back during the second six months as supply gradually recovered, with the full year benchmark CFR China 62% Fe price averaging $93/tonne (2018: $69/tonne).
Premiums and discounts for high grade and low grade ore were narrower than in 2018 due to a decrease in steel mill profitability; however, the average lump premium increased, reflecting the continued tight market. Global iron ore consumption increased by 1.7% to 2.23 billion tonnes (2018: 2.20 billion tonnes).
Metallurgical coal showed continued strength in the first half of the year, with benchmark hard coking coal (HCC) prices consistently above $200/tonne on an FOB Australia basis, owing to strong crude steel output, particularly in China. However, a combination of factors, including weakening steel markets outside of China, particularly in Europe and India; an increase in seaborne volumes from Australia; customs clearance restrictions for coal imports at Chinese ports; and weaker global thermal coal prices saw the benchmark HCC price fall significantly in the third quarter. Across the year, the average HCC benchmark price was $177/tonne (2018: $207/tonne), with global consumption of metallurgical coal increasing by 2% to 1.15 billion tonnes (2018: 1.12 billion tonnes).
Thermal coal prices were driven lower by a combination of factors, including an increase in exports from Russia and Indonesia, combined with decreased demand from Europe as significant supply growth in the gas market drove down European gas prices, displacing coal-fired power generation. For the year as a whole, the FOB South Africa price averaged $72/tonne (2018: $98/tonne).
Outlook Global economic growth is expected to remain subdued in 2020, with forecasts highly dependent on trade and broader geo-political issues. Downside risks include an escalation of the US-China ‘trade war’; worsening or a flare-up of the coronavirus; a disorderly Brexit; a continued slowdown in India; and growing economic nationalism in the form of trade barriers, capital restrictions and asset protection. While a global recession remains unlikely, a period of slower growth is likely, with the full impact of the coronavirus on commodities yet to fully play out. If there are early signs of an improving economic situation in Asia and of more positive customer sentiment, this would broadly support further upside demand for our products.
19Anglo American plc Integrated Annual Report 2019

The quality and long life of our mineral assets are the foundations of our global business. We actively manage our asset portfolio to improve its overall competitive position, continuing our trajectory towards products that support a fast growing population and a cleaner, greener, more sustainable world.
Material matters discussed in this section
Macro-economic environment
Operational and cost performance
Meeting our commitments to business stakeholders and society
Political and regulatory
At Unki mine in Zimbabwe, PGMs commissioned this smelter in 2018 to treat concentrates from the mine on site.
PORTFOLIO
STRATEGIC REPORT

HIGHLIGHTS
$1.2 billionUnderlying EBITDA contribution from Minas-Rio in 2019
Up to 30 MtpaPotential long term production from Minas-Rio, once all aspects of the operation have been optimised
~3.2 bn ROM tonnesMinas-Rio Ore Reserves at 33.5% Fe
Pillars of value
Environment
Socio-political
Financial
For our KPIs: See pages 50-51
Ultrafine feeding of iron ore in concentrate at the Minas-Rio mine site in Minas Gerais, Brazil.
Minas-Rio’s remarkable recovery Minas-Rio mine in Brazil taps into a large scale iron ore deposit, the resource base of which we have steadily extended since acquiring the asset more than a decade ago. Current estimates indicate Ore Reserves of approximately 3.2 billion ROM tonnes at 33.5% Fe(1) – and indications are that this highly prospective area has considerably more potential.
Minas-Rio’s final product is around 67% Fe grade content, significantly higher than the industry average, with low levels of contaminants. With growth in population and economic output needing to be met by growth in the supply of steel, Minas-Rio’s low impurities pellet feed is greatly in demand, being ideally suited for a cleaner steelmaking world. Furthermore, the value we attract for the product is being enhanced through our Marketing team’s expertise, which is focused on ensuring that we are a reliable and competitive provider of customer-specific, tailored products.
Minas-Rio is making a growing contribution to the Group, reflecting not only the strong ramp-up following the restart of operations in December 2018, but also cost efficiencies associated with higher ore recoveries. Our original 2019 production guidance was revised upwards during the year, with total output reaching 23.1 Mt by year end. We have begun work to take production beyond nameplate capacity of 26.5 Mtpa towards a potential 30 Mtpa by optimising all aspects of the operation.
During the suspension of the operation in 2018, when leakages were found in the 529-kilometre pipeline that transports the iron ore to the coast, we took the opportunity to review the whole operation so that, once we were able to restart, we could maximise our production ramp-up while maintaining operational stability.
We carried out a comprehensive internal inspection of the entire pipeline, replacing sections where necessary. We have installed a fibre-optic system with a variety of sensors along critical sections of the pipe to continuously monitor
performance, and have reduced the intervals for future inspections from five to two years. Further refinements were made in ore processing to enhance recoveries. We brought forward equipment and vehicle maintenance, and we retrained our workforce so that they were fully prepared for the resumption of activities.
As part of the spillage clean-up operation and subsequent rehabilitation process, and working with the authorities and our local communities, we continued to supply water to the communities, while simultaneously taking action to prevent ore slurry entering the nearby river. Today, the communities now have two water-supply options and the condition of the watercourse is better than before the spillages occurred. We also worked on rolling out emergency-preparedness plans, such as community-emergency drills and installing warning alarms in households, so that everyone is fully prepared in the unlikely event of another pipeline breach.
It was also a prerequisite for us to put safety first in the raising of the dam crest at the tailings storage facility. This facility uses a downstream construction design and takes the form of an earth-fill embankment dam, built using compacted fill materials, with no tailings used in its construction. Our comprehensive safety management programme for the tailings dam includes routine internal geo-technical inspections, geo-technical instrumentation, instrumentation-data analysis, bathymetric surveys, and audits. The facility also incorporates a new technique, which we developed in-house, that provides real-time information on the amount of water contained, as well as fibre-optic installations that provide real-time monitoring of any strain, deformation and seepage.
In securing the Operating Licence for the tailings dam raise in December 2019, Minas-Rio has achieved yet another major milestone on its journey to become a sustainably profitable, globally cost-competitive producer of high grade iron ore products.
Minas-Rio’s low impurities pellet feed is greatly in demand, being ideally suited for a cleaner steelmaking world.”
(1) See Ore Reserves and Mineral Resources Report 2019 for full details.
21Anglo American plc Integrated Annual Report 2019

PGMs
Iron Ore Copper
Nickel andManganese
Diamonds(De Beers) Met coal
Thermal coal
(1) Revenue by product based on business unit. Excludes sales of products purchased from third parties by our Marketing business.
(2) Attributable basis.
Revenue by product(1)
ASSET QUALITY: DIFFERENTIATED PORTFOLIO
Capital employed by geography(2)
Brazil
South Africa
Botswana and Namibia
Australia
Chile, Colombia and Peru Other
5%
26%
24%
20%
14%
11%
5%
24%
23%
16%
13%
13%
6%
Anglo American’s portfolio of world class mining operations and undeveloped resources – spanning diamonds (through De Beers), copper, platinum group metals, iron ore, coal, nickel and manganese – provides the metals and minerals that enable a cleaner, greener, more sustainable world.
The scale and diversity of the portfolio allow us to leverage our financial resources, technical expertise and supplier relationships towards delivery on our potential, and to the benefit of our customers. The portfolio’s depth and breadth create a measured risk profile and support strong returns through spreading our investments across diverse asset geographies and end markets.
Building strategic advantageThe primary source of competitive advantage in the mining industry is to own high quality, high margin, long life assets of scale, with positions that can be further enhanced if those assets deliver products into structurally attractive markets.
In assessing our asset portfolio, we consider:
• The stand-alone quality of individual assets, including their relative cost position and growth potential
• Our global competitive position within the individual product groups
• The additional value potential generated through our dedicated marketing expertise.
Our product groups
DiamondsDe Beers has a global leadership position in diamonds, producing around a third of the world’s rough diamonds, by value. Within its portfolio, De Beers (Anglo American: 85% interest), in partnership with the Government of the Republic of Botswana, has one of the richest diamond mines, by value, in the world at Jwaneng, and one of the largest resources, in terms of total carats, at Orapa.
De Beers’ major diamond mining assets have large, long life and scalable resources and we are continuing to invest in the existing operations to extend mining activities. The Cut-9 expansion of Jwaneng will increase the depth of the mine to 800 metres to extend the life of the mine; Debmarine Namibia has an additional custom-built diamond mining vessel in construction; and in South Africa, Venetia is transitioning underground, extending the life of mine to 2046.
The lack of significant kimberlite discoveries globally over recent years, combined with the ongoing growth in consumer demand for diamond jewellery in both mature and developing markets, points to good prospects for the diamond business. The addition of the Chidliak Diamond Resource in Canada, and the continued investment in diamond mining support technologies, will enhance De Beers’ portfolio of high quality and high margin assets and the ability of the business to flex production to prevailing demand.
Through its differentiated rough diamond distribution model, which comprises term contract Sightholders, Accredited Buyers and Auction Sales customers, De Beers has a range of insights into its customers’ demand patterns. De Beers seeks to stimulate consumer demand for diamonds through its Forevermark™ and De Beers Jewellers brands and through its participation in the Diamond Producers Association.
CopperAnglo American has a world class asset position in copper, built around its interests in two of the world’s largest copper mines – Los Bronces (a 50.1% owned operation) and Collahuasi (44% owned joint operation), with Reserve Lives of 35 years and 51 years, respectively. The resource base of these assets underpins our future near-asset growth opportunities, in addition to the tier one Quellaveco project we are developing in Peru – one of the world’s largest untapped copper orebodies, and the polymetallic Sakatti deposit in Finland.
The copper industry is expected to struggle to meet longer term demand growth, including from hybrid and electric vehicles and renewable energy, as declining grades and more challenging physical and environmental conditions, along with tougher licensing and permitting requirements, are expected to limit the industry’s ability to deliver new copper supply.
Platinum Group Metals (PGMs) Our Platinum Group Metals (PGMs) business (held through an effective 79.4% interest in Anglo American Platinum Limited) is a leading producer of platinum, palladium and the other PGMs. It mines, processes and refines the platinum basket of metals from its high quality resource base, located in one of the biggest PGM deposits – the Bushveld Complex in South Africa. It also has a significant stake in Unki – one of the world’s largest PGM deposits outside of South Africa, on the Great Dyke in Zimbabwe.
Our flagship mine, Mogalakwena, is the highest margin PGM producer in the industry and, as the only large open-pit PGM mine globally, is at the centre of a more flexible, competitive and lower risk business.
We are continuing to reposition the business around a leaner, best-in-class operating footprint at the Mogalakwena, Amandelbult and Mototolo mines in South Africa, and Unki mine in Zimbabwe, alongside our joint operation interests in the Kroondal and Modikwa mines in South Africa.
Demand for platinum is forecast to increase over time, given the ongoing trend towards cleaner-emission vehicles, driven by more stringent global emissions legislation.
22 Anglo American plc Integrated Annual Report 2019
STRATEGIC REPORT PORTFOLIO
PORTFOLIO CONTINUED

Increasing demand from the automotive industry is likely to be augmented by growing opportunities for emerging new applications, including hybrid and hydrogen fuel cell electric vehicles, while emerging countries such as India offer the potential of developing, from a relatively low base, into significant platinum jewellery markets.
We are well positioned to proactively stimulate demand for platinum, including through targeted campaigns in emerging jewellery markets; creating new investment demand for the metal as a store of value; and through direct investment in a number of companies developing new technologies that are expected to drive industrial demand for PGMs.
Iron oreAnglo American’s iron ore operations provide customers with high iron content ore, a large percentage of which is direct-charge product for steelmaking blast furnaces. In South Africa, we have a 69.7% shareholding in Kumba Iron Ore, whose Sishen and Kolomela mines produce high grade and high quality lump ore and also a premium fine ore.
In Brazil, we have developed the Minas-Rio operation (100% ownership), consisting of an open-pit mine and beneficiation plant, which produces a high grade pellet feed product, with low levels of contaminants. The iron ore is transported through a 529-kilometre pipeline to the iron ore handling and shipping facilities at the port of Açu, in which Anglo American has a 50% shareholding.
As steel producers in China and elsewhere face ever-tighter emissions legislation and are seeking ways to make their furnaces cleaner and more efficient, so the demand for higher quality iron ore products increases. The lump iron ore produced from Kumba’s operations is in particular demand and commands a premium price, owing to its excellent physical strength and high iron content (64%-65% average Fe content). Minas-Rio’s pellet feed product also commands a premium price, as its ultra-low contaminant levels and high iron content (c. 67% Fe content) are sought after by steel producers who are seeking to minimise emissions while boosting productivity.
Coal: metallurgical and thermalOur coal portfolio is geographically diverse, with metallurgical coal assets in Australia, and thermal coal assets in South Africa and Colombia. Since 2012, we have more than halved our thermal coal production footprint.
Metallurgical coal – AustraliaWe are the world’s third largest exporter of metallurgical coal for steelmaking and our operations serve customers throughout Asia, Europe and South America.
Truck operator Ricardo Guerra surveys a section of the future mining area of the Los Bronces Integrated Project.
A win-win projectLos Bronces is located in the Andes, 3,500 metres above sea level, some 65 kilometres north east of Chile’s capital, Santiago. It has been mined for more than 150 years and is one of the country’s major copper producers, producing 335,000 tonnes of copper in 2019.
But to maintain or increase copper production from current levels, Los Bronces will need access to higher grade ore. So, in July 2019, Anglo American submitted an environmental impact study to the Chilean authorities for the Los Bronces Integrated Project, and has recently started the environmental permitting process.
Los Bronces’ location in a region with glaciers means that current and future mining operations must not affect the surface of any protected area or have an impact on nearby glaciers. For the current open-pit mine, our operational continuity plans involve expanding its surface by pushing back the perimeter to access better quality mineral-bearing ore. We are extremely careful to make sure that we have no impact on glaciers, biodiversity areas or other water resources in the region.
Five kilometres away, we are proposing to develop an underground mine to exploit a contiguous deposit. We plan to use an internationally proven mining method of extracting mineral by underground blocks, which are then filled in with mainly rock and around 3% of cement mixture to ensure surface stability.
We have built in environmental considerations from the earliest planning stage to guarantee the project will have no impact on the surface
and no effect on actual water supplies. This underground phase will replace low grade ore from the current open-pit mine with higher grade ore and will utilise the existing processing plant’s capacity.
What’s more, we will use our current tailings facilities and use similar levels of water and energy as we do today. Currently, 70%-80% of total water used in processing activities is recycled – we plan to upgrade the water-recirculation system to further increase the amount of water we recycle, with no adverse impact on water quality in the region as a result of our operations. At the same time, as part of our FutureSmart Mining™ approach to technology and sustainability, we are integrating enabling technologies in fields such as bulk ore sorting and coarse particle recovery to precisely target the metal and mineral, with less water, energy and waste.
We have spent six years of study, and three years consulting with government, local communities, NGOs and other stakeholders to make sure we can safeguard nearby protected areas and surrounding glaciers, and will not increase freshwater use, or raise traffic levels on local roads – and that the project will have significant and widespread economic and other benefits.
At Anglo American, we believe that mining, which is vital to the Chilean economy, can co-exist with the conservation of the environment and particularly the presence of glaciers, while at the same time making a long-lasting contribution to the development of the surrounding communities and the country as a whole.
23Anglo American plc Integrated Annual Report 2019

Our tier one metallurgical coal assets include the Moranbah North (88% ownership) and Grosvenor (100% ownership) metallurgical coal mines, both located in Queensland. The mines are underground longwall operations and produce hard coking coal. More stringent environmental and safety regulations in China have led to a number of domestic coal mine closures and a requirement for steel producers to run cleaner, larger and more efficient blast furnaces, resulting in increased demand and prices for high quality coking coal, such as that produced by our Australian mines.
Export thermal coal – South AfricaWe have refocused our South African coal portfolio to concentrate on export markets, having successfully completed the sale of the majority of our domestic coal mines, more than halving our production footprint since 2012. We supply around 19 million tonnes of thermal coal per year to export markets.
Coal South Africa’s export product is derived from three wholly owned and wholly operated mines – Goedehoop, Greenside and Khwezela; Zibulo (73% owned); as well as from Mafube colliery, a 50:50 joint operation.
Our operations route all export coal through the Richards Bay Coal Terminal, in which we hold a 23.2% stake.
Export thermal coal – ColombiaIn Colombia, Anglo American, BHP and Glencore each have a one-third shareholding in Cerrejón, one of the country’s largest thermal coal exporters.
Nickel and manganese
NickelOur Nickel business has the capacity to produce around 45,000 tonnes per year of nickel, whose primary end use is in the global stainless steel industry. Our assets (both 100% owned) are in Brazil, with two ferronickel production sites: Barro Alto and Codemin.
ManganeseWe have a 40% shareholding in Samancor joint venture (managed by South32, which holds 60%), with operations based in South Africa and Australia.
Portfolio restructuring in the yearWe will continue to refine and upgrade our asset portfolio as a matter of course to ensure that our capital is deployed effectively to generate enhanced and sustainable returns for our shareholders.
Anglo American has transformed the quality and performance of its portfolio since 2012, halving the number of assets while producing more physical product. This transformation has been achieved through extensive
operational self-help and other efficiency work, together with the sale, placing onto care and maintenance, and closure of less attractive assets, resulting in a step-change in our operational performance, profitability and cash flow generation.
Portfolio managementIn 2019, the Group commenced, or completed, a number of transactions. We entered into a transaction, expected to complete in 2020, to provide for the equalisation of ownership across our integrated metallurgical coal operations at Moranbah North and Grosvenor through the sale of 12% in Grosvenor mine to the minority shareholders in Moranbah North. The Grosvenor mine uses Moranbah North’s coal processing infrastructure, where numerous debottlenecking, expansion and product blending options offer considerable cost, productivity and margin benefits for the integrated operation.
We also completed the two-phased restructuring plan of Atlatsa (PGMs), which entailed, among others, the acquisition of the exploration properties adjacent to Mogalakwena mine.
Namdeb Holdings, a joint operation between the Namibian government and De Beers, announced the sale of Elizabeth Bay in September 2019.
In January 2020, Anglo American announced that an agreement has been reached with the board of Sirius Minerals Plc (‘Sirius’) on the terms of a recommended cash acquisition for the entire issued and to be issued share capital of Sirius. Anglo American identified Sirius’s Woodsmith polyhalite project in North Yorkshire (the ‘Project’) as being of potential interest given the quality of the underlying asset in terms of scale, resource life, operating cost profile and the nature and quality of its product. The Project has the potential to fit well with our established strategy of focusing on world class assets, particularly in the context of Anglo American’s portfolio trajectory towards later-cycle products that support a fast growing global population and a cleaner, greener, more sustainable world. The proposed transaction is subject to regulatory and Sirius shareholder approval.
Anglo American Platinum completed the disposal of its 33% interest in the Bafokeng Rasimone Platinum Mine associate to Royal Bafokeng Resources Proprietary Limited (RBR) in December 2018, for a total consideration of around $150 million, of which approximately $110 million was deferred. The outstanding consideration, including accumulated interest, was settled in full by RBR in January 2020.
ProjectsStrict value criteria are applied to the assessment of Anglo American’s portfolio of future growth options. Where appropriate, we aim to seek partners for the development of major greenfield projects at the right time and for value, and are likely to not commit to the full development of more than one such project at any given time. The Group will continue to maintain optionality to progress with value-accretive projects.
Project execution at Quellaveco is on track, with all key milestones for 2019 achieved on schedule.
The project is expected to deliver first production in 2022, within the $5.0-$5.3 billion capital expenditure estimate (100% basis; Anglo American share: $2.5-$2.7 billion), with ramp-up in 2023. Quellaveco expects to deliver around 300,000 tonnes per annum of copper equivalent production (on a 100% basis) on average in the first 10 years of operation.
In May 2019, we announced the approval by Debmarine Namibia, a 50:50 joint operation between De Beers and the Namibian government, for the construction of a new custom-built diamond recovery vessel. At an expected total capital cost of $0.5 billion ($0.2 billion attributable to Anglo American), this new vessel will become the seventh in the Debmarine Namibia fleet. It is expected to begin production in 2022, with the capacity to add 500,000 high quality carats of annual production, a 35% increase above Debmarine Namibia’s current levels.
In July 2019, the Board approved the Aquila project to extend the life of the Capcoal underground hard coking coal operations in Queensland, Australia, by six years, to 2028. At an expected attributable capital cost of $0.2 billion, Aquila offers a high-margin extension to the mine, with an average annual saleable production of 3.5 Mt (attributable) of premium quality hard coking coal. Development work began in September 2019 and first longwall production is expected in early 2022.
Longer term, the Group has a number of future organic growth options under consideration, including expansions at Collahuasi and Los Bronces copper mines in Chile, the Mogalakwena PGMs complex in South Africa, and the Moranbah/Grosvenor metallurgical coal complex in Australia.
For more on the progress of our Quellaveco project: See page 63
DiscoveryDiscovery and Geosciences, including our exploration activities, is consolidated across the Group, covering near-asset and greenfield
24 Anglo American plc Integrated Annual Report 2019
STRATEGIC REPORT PORTFOLIO
PORTFOLIO CONTINUED

The Sakatti polymetallic project north of the Arctic Circle in Finland is currently at pre-feasibility stage.
Sakatti – responsible resource developmentSakatti is a wholly owned project, located 150 kilometres north of the Arctic Circle in Finnish Lapland, which we discovered in 2009. It lies on a rich polymetallic deposit containing base metals such as copper, nickel and cobalt, and also platinum, palladium, gold and silver. The high concentrations of these metals, combined with consistency of the deposit’s mineralisation, make Sakatti a highly attractive deposit, with significant further exploration potential.
Though still at the pre-feasibility stage, Sakatti has seen substantial progress over the past decade in geological modelling, mineral resource estimation, updating of environmental studies, and an ongoing drilling programme over the asset’s 240-kilometre2 area.
Given the location of the Sakatti deposit, in a biodiversity-protected area, Anglo American is acutely aware of its responsibility to ensure minimal impact on the environment. We have established partnerships with Flora & Fauna International and Finnish biodiversity experts, as well as local and regional representatives, and continue to engage with NGOs who are concerned about the impact of a mine in such a pristine area, in order to ensure that we are implementing best practice in our biodiversity management approach.
For example, in collaboration with Finnish drilling contractor Oy Kati Ab, we developed a closed-loop drilling system that is designed to operate in an environmentally sensitive environment. The system has substantially reduced waste and water use and thus minimises our overall environmental footprint. And we have decided to build an access tunnel with the entrance five kilometres away from the ore deposit in order to reduce disturbance to the land above ground and the impact on reindeer herders.
We also worked closely with all of our stakeholder groups – residents, land and water rights holders, reindeer herders, environmental groups and recreational users, and municipal authorities and business – to identify the most suitable place to locate the mine’s waste storage facilities and processing plant in order to protect the natural resources within the boundaries of the protected area and deliver net positive impact on biodiversity.
As the world shifts to cleaner energy, copper may well have the best fundamentals of any mined commodity for our cleaner, greener, more sustainable world of the future. Sakatti may still have a long way to go before it becomes an operating mine, but we believe it represents another big step, post-Quellaveco, in augmenting Anglo American’s impressive copper-volume growth profile.
discovery, projects, and operations. The integrated function is supporting a greater technical understanding of our world class assets, a strategic advantage that is being applied to maximise realisation of value from them, and to gain significant benefit in both near-asset and greenfield discovery work.
Anglo American was founded on world class mineral discoveries. Building on the Group’s strategy and long track record of discovery success, we are implementing a fundamentally revitalised discovery strategy that is shaping a global, diversified, risk-balanced portfolio focused on new discovery search spaces. This effort is enhancing our position as a discoverer of superior-value deposits that have the potential to improve our production profile, over time.
Quality discovery portfolioWe are concentrating on the discovery of mineral deposits in existing and new districts that are capable of delivering sustainable returns on a material scale, and which provide greater diversification and optionality for the business.
We maintain a robust and diverse discovery portfolio, including:
• Near-asset discovery projects: focused on the extensive mineral tenure around Anglo American’s existing operations, including those producing copper, PGMs, nickel, diamonds, iron ore and metallurgical coal.
• These have yielded, for example, several discoveries in the Los Bronces district in Chile. Notably, at Los Bronces Underground, discovered in 2006, ongoing drilling over the past five years has yielded an increase in reported Mineral Resources by more than 250% to c. 3.9 Bt @ 1.14% TCu (see Ore Reserves and Mineral Resources Report 2019 for full details). In other districts such as Quellaveco (Peru) and Mogalakwena (South Africa), significant new copper and PGM prospects respectively have been identified and are currently being explored and evaluated.
• Greenfield discovery projects: identifying and securing district-scale mineral tenure covering strategic, highly prospective search space in established and frontier settings. The greenfield discovery focus includes copper, diamonds (through De Beers), nickel and PGMs. The Group has active greenfield programmes in Australia, Canada, Greenland, South America (Brazil, Chile, Ecuador, and Peru), Europe (Finland), and southern Africa (Angola, Botswana, Namibia and Zambia).
Innovation and technology are at the heart of a differentiated discovery strategyBy applying leading scientific understanding of how world class mineral systems are formed at all scales, we aim to identify and create material value through discovery in the earth’s most prospective ground. A combination of established and novel proprietary technologies is crucial to Anglo American’s track record of mineral discoveries in new settings and beneath the cover of overlying material, such as younger rock sequences or desert sands. Innovative discovery technologies employed by Anglo American include the SPECTREMPLUS
airborne geophysical system, and the Low-Temperature Superconducting Quantum Interference Device (LT-SQUID) ground-based geophysical system, both developed through Anglo American-driven collaborations. SPECTREMPLUS collects high-resolution electromagnetic, magnetic, radiometric and gravity information about the sub-surface in a single airborne platform. The LT-SQUID is a highly sensitive magnetometer that is particularly useful for sensing metallic sulphide deposits in complex geological environments that otherwise lack expression at surface.
25Anglo American plc Integrated Annual Report 2019

Across every aspect of our business, we are thinking innovatively about how we work to ensure the safety of our people, enhance our sustainability performance, and deliver industry-leading margins and returns.
Material matters discussed in this section
Environmental impacts and climate change
Operational and cost performance
Meeting our commitments to business stakeholders and society
Political and regulatory
INNOVATION
FutureSmart Mining™ was a key theme at our Senior Leadership Conference, held in Barcelona, Spain during March 2019.
STRATEGIC REPORT

The primary benefit of the bulk ore sorting system is in unlocking production capacity through early rejection of waste material …leading to a reduction in overall costs per tonne, along with a decrease in tailings volume, and water and energy use.”
HIGHLIGHTS
500 tonnes/hourThroughput at the bulk ore sorting plant at our El Soldado copper operation in Chile.
2020A further two mines – Mogalakwena (PGMs) and Barro Alto (Nickel) – to implement bulk ore sorting technology in 2020.
Pillars of value
Environment
Socio-political
Production
Cost
Financial
For our KPIs: See pages 50-51
A bulk ore sorting (BOS) machine operating in the open pit at Copper’s El Soldado mine in Chile.
Bulk ore sorting – trialling innovative technologies at scaleFor around a century, the industry’s approach to the challenges presented by ageing mines and declining ore grades has been to mine deeper and to crush more and more material. This has led to the current situation where it now takes double the amount of water, and 16 times as much energy, to produce a kilogram of copper than it did in 1900. It also means that mining companies today are extracting and moving far more waste rock than ever before.
At Anglo American, we believe that continuing this approach is, quite simply, unsustainable. Business-as-usual methods cannot hope to deliver cost and productivity benefits to offset this trend and nor will they reduce our environmental footprint. We must therefore change our thinking and, through our FutureSmart Mining™ programme, we are focused on delivering step-change innovation in technology, digitalisation and sustainability.
Our first FutureSmart Mining™ Open Forums in 2015 delivered thousands of new ideas; many of which were brought together into one theme entitled Concentrating the Mine™. Targeting minimal energy, water and capital intensity, with increased precision at its heart, bulk ore sorting (BOS) is a technology at the centre of Concentrating the Mine™. After successful demonstration at our El Soldado mine in Chile, the 500 tonnes per hour plant is now fully operational and is delivering value.
The primary benefit of the BOS system is in unlocking production capacity through early rejection of waste material and, therefore, increasing the ore grade that is taken to the plant; this has led to a reduction in overall costs per tonne produced, along with a decrease in tailings volume, and water and energy use. Secondary benefits include processing-cost reduction, lower cut-off grade and a corresponding increase in mine life.
Our approach at El Soldado is to take advantage of the natural heterogeneity of orebodies and reject the waste material through using sensors, physical sorting and screens earlier in the processing value chain. Sensor technology is at
the heart of this approach and, combined with the application of big data and machine learning, we are transforming the BOS process.
Our BOS process delivers higher overall capacity than traditional ore-sorting methods. It can provide the same functionality as a permanent plant facility, but without much of the latter’s associated capital and operational expenditure. At El Soldado, the BOS semi-fixed system is essentially an all-in-one package comprised of three elements:
• Input/output equipment, which gets the material to or from the sensor
• A sensor, mounted above a conveyor belt, that determines, based on algorithms, what material is of value and what is waste
• A diverter, which directs the crushed material of value to the plant for further processing, while diverting waste in a different direction.
The BOS system fulfils two purposes: as a sorting system and a productivity booster. Significant efficiency gains are also being delivered through bringing the material-processing plant closer to the extraction site.
The BOS system has wide potential applicability across Anglo American, wherever processing costs are pivotal and ore heterogeneity is present. At El Soldado, it is already in commercial production, while Mogalakwena (PGMs) and Barro Alto (Nickel) are due to follow in 2020.
Another technology within the Concentrating the Mine™ theme is coarse particle recovery (CPR) (see case study on page 61). As with BOS, this technology delivers an easier to handle waste stream which frees capacity in the mill for additional production and further reduces water and energy consumption. CPR also enables a new approach to tailings, eliminating the need for wet tailings disposal – with demonstrations planned, including at El Soldado, during 2020. Through taking a more precise approach to mining, pre-processing and disposal, we are bringing the water-less mine closer, removing a major risk and cost from our mining operations.
27Anglo American plc Integrated Annual Report 2019

PORT
FOLI
O PEOPLE
OUR STRATEGY
INNOVATION
Operating ModelOur Operating Model is the foundation for how we plan and execute each task.
It provides the link to P101 and our FutureSmart Mining™ programme and is the glue to everything we do. Our focus on operating stability and predictability
supports safe, reliable performance and continuous improvement.
P101P101 is our transformational asset
productivity programme, systematically improving the performance of our most
value-driving mining processes and other work to set new levels of benchmark
performance. It sets the context for our progress and is critical to enable the
delivery of FutureSmart Mining™.
Marketing ModelOur Marketing Model optimises the value from our mineral resources and market positions. By fully understanding and
addressing our customers’ specific needs and leveraging our capabilities in the
financial and physical markets, we drive the right commercial decisions across the value chain – from mine to market.
Our Sustainable Mining Plan, integral to FutureSmart Mining™, supports our innovation and delivery of step change results across the entire mining value chain. From mineral discovery right through
to marketing our products to customers, we are changing how our employees and stakeholders experience Anglo American.
Our Sustainable Mining Plan is built around three Global Sustainability Pillars aligned to the UN’s Sustainable
Development Goals:
Collaborative Regional Development is at the heart of our approach and is our model for bringing long term sustainable
development opportunities to the regions around our operations.
SustainabilityTechnology and Digitalisation
CONCENTRATING THE MINE™
Greater precision, with lower energy, water
and capital intensity
– Coarse Particle Recovery
– Bulk Ore Sorting
– Ultrafine Recovery
WATER-LESS MINE
Reducing dependence on water, towards full recovery
recycling and dry tailings
– Coarse Particle Recovery
– Novel Leach
– Dry Tailings
MODERN MINE
Safe mining, removing people from harm’s way
– Continuous Hard Rock Cutting
– Remote Operation Control
– Swarm Robotics
INTELLIGENT MINE
Transforming data into predictive intelligence:
connected learning mines
– Digital Ecosystem
– Digital Twins
– Advanced Process Control
TRUSTED CORPORATE LEADER
THRIVING COMMUNITIES
HEALTHY ENVIRONMENT
SUSTAINABLE MINING PLAN
PLANNING AND IMPLEMENTATION IN PARTNERSHIP
REGIONAL SPATIAL
ANALYSIS
FutureSmart Mining™Technology, Digitalisation and Sustainability
working hand in hand.
OUR PURPOSE Re-imagining mining to improve people’s lives
28 Anglo American plc Integrated Annual Report 2019
STRATEGIC REPORT INNOVATION
INNOVATION CONTINUED

From exploration to delivering our products to our customers, FutureSmart Mining™ is our innovation-led pathway to sustainable mining: technology, digitalisation and sustainability working hand in hand. Coupled with the best-in-class operational improvements being delivered from our unique Operating Model, we are fundamentally changing the way we extract, process and market our products, and will provide the next step-change in operating and financial performance.
MarketingOur Marketing Model maximises the value from our mineral resources and market positions. We do this by fully understanding and addressing our customers’ specific needs and leveraging our capabilities in the financial and physical markets to drive the right commercial decisions across the value chain – from mine to market.
Since its creation in 2014, our Marketing business has been committed to providing physical products, logistics, freight, sales services and technical support, as well as commercial solutions, including competitive pricing and helping to respond to potential supply risks.
Our customers operate in some of the world’s most critical and diverse industries – from automotive to steelmaking, from technology and jewellery to energy production. Long term, solid relationships are of vital importance to meet – and anticipate – their needs by shaping partnerships that are mutually beneficial and help the entire value chain to evolve and flex to adjust to the demands of a rapidly changing industry landscape.
Against this backdrop, our commercial toolkit has been instrumental to our being able to successfully negotiate complex deals to secure a market for our own mineral and metals products. We have complemented our sales activities with trading and third-party sourcing capabilities, allowing us to expand our range of operations and customer solutions.
We have also reinforced our efforts to drive efficiencies across the value chain by effectively aligning production and marketing around integrated planning processes, geared toward maximising value and eliminating inefficiencies.
2019 provided new opportunities to reinforce our commitment to sustainable growth. Through our shipping department,
Anglo American joined forces with leading organisations at the forefront of the quest to decarbonise the industry, such as the Global Maritime Forum, Friends of Ocean Action and the World Economic Forum, with the objective of having commercially viable deep-sea, zero-emission vessels powered by zero-emission fuels in operation by 2030.
Our market development team continued to advance the hydrogen agenda through several initiatives. During the year, we attracted two new investors – Toyota and Plastic Omnium, the world’s leading supplier of car exterior components and modules – to our AP Ventures venture capital fund. In July, together with Platinum Group Metals Ltd,
Copper sheets destined for export from Chile. During the year, our Marketing business entered into an offtake agreement to market copper cathode originating from Chilean producer, Mantos Copper.
Marketing – broadening and strengthening its contribution to the GroupIn recent years, our Marketing business has been scaling up its business model by going beyond solely marketing the Group’s own mined products, offering value-adding and more specialised services on behalf of third parties. This strategic approach, which leverages our existing global marketing platform and broadens our service and product portfolio to provide more innovative solutions to customers and suppliers, is contributing additional value to Anglo American and our customers.
By way of example, the Marketing business has entered into an offtake agreement to market copper cathode originating from Chilean producer, Mantos Copper. The transaction fits within the agreed strategy and hurdle rates of our Sourcing and Origination business plan, with robust forecast returns even on a base-case scenario.
In the case of Mantos Copper, our Marketing business’s competitive advantage is based on a unique combination of qualities:
• Anglo American’s technical knowledge and expertise in mining
• Our decades long experience in Chile. Mantos Copper’s Mantos Blancos and Mantoverde mines were owned by Anglo American until 2015 – so we know the assets well
• We have the balance sheet strength to finance asset-backed trading initiatives
• We have the marketing experience and know-how, as well as the freight and logistics capabilities, analytical skills, financial trading capabilities, sourcing and origination experience, and working capital financing/optimisation processes for the arrangement to be value-accretive to both parties, and the end customer.
Executive head of Base Metals Marketing, Alex Schmitt, observes:
“Our competitive advantage is based on our brand, our equity flow and the ability to combine a distinct set of commercial, technical, exploration, mining and financing skills. This enables us to be strategically differentiated in the marketplace. Anglo American’s rigorous and professional risk management and capital allocation processes, the proven success of our historical trading activities, and very positive market feedback, provide a great opportunity for us to scale up our asset-backed trading ambitions, and we see the arrangement with Mantos Copper as a blueprint to offer value- accretive commercial solutions in marketing third-party copper.
“But I also want to emphasise that Anglo American takes a broader approach to value creation. Through our marketing activities, we bring benefit not only to ourselves, but to our partners, the end customer and the country of origin. We are not just traders; we are miners, with assets we know well.”
29Anglo American plc Integrated Annual Report 2019

we announced the creation of Lion Battery Technologies, a company that is commercialising lithium batteries for battery electric vehicles (BEVs), while also using PGMs to improve the performance of BEVs. On the jewellery side, in 2019, Marketing launched a men’s platinum brand in India and, together with De Beers, a platinum-only diamond bridal collection in the US. Anglo American also continues to be a major supporter of the World Platinum Investment Council, which during the year trained 2,200 managers of Agricultural Bank of China and Bank of China in platinum-investment products, which they are now rolling out to their vast customer base in the country.
Operating ModelWe believe we can build a long term sustainable competitive advantage by securing access to the best resources and through operating these assets more effectively (productive) and more efficiently (cost competitive) than our competitors.
Our Operating Model is the foundation to support us in achieving this by providing structure, stability and predictability in the way that we plan and execute every task. Unplanned work is inherently more costly, and less safe than planned work.
P101P101 is our transformational asset productivity programme that we build on top of the stability provided by the Operating Model.
It is about improving the performance of our most value-driving mining and other processes to industry best-in-class benchmarks, then pushing the capability boundary further, establishing new benchmarks for the industry in terms of efficiency and the way we work.
P101 sets the context for our progress and is critical to enable the delivery of FutureSmart Mining™.
While we have delivered a material operational turnaround in recent years, we believe there is still significant value to be delivered from the continued implementation of our Operating Model, P101, and the benefits from our technology and data initiatives, as well as the delivery of growth projects. By 2022, we expect to deliver an additional $3-$4 billion annual underlying EBITDA improvement, before inflation, relative to 2017.
Through applying our Operating Model principles and P101, our benchmark-beating asset performance programme, Unki’s performance has exceeded expectations, recording record production of platinum and palladium in 2019. Featured are settling tanks at the mine’s concentrator plant.
Unki – platinum performance and leading the way in responsible miningOur Unki PGMs mine in Zimbabwe has undergone a remarkable turnaround in its operational and financial performance over the past five years. At the heart of this improvement is a high performing team which has embraced the challenge of transforming the mine’s performance.
The team has implemented several initiatives: mining cycles and labour planning have been optimised to achieve greater equipment and labour efficiencies; lowering the mining height has led to a 7% increase in head grade; and maximising concentrator mill run time, feed rate set points and reagents used has resulted in a significant improvement in both concentrator recovery (5% higher) and throughput (26% higher). As a result, PGM output continues to increase and, in 2019, another production record was achieved, with output of 89,400 ounces of platinum and 79,200 ounces of palladium.
These efficiency improvements are being reflected in Unki’s financial performance; profitability continues to rise, while operating free cash flow has increased six-fold to $73 million.
Starting from 2020, Unki will be implementing our unique Operating Model, which is designed to further improve operational stability and reliability. The processing unit at Unki has set the P101 benchmarks for the company, while the mining team continues to drive P101 ambitions to set industry benchmarks and new standards for equipment and mining.
Recently, Unki became the first mine to publicly commit to be independently audited against the Initiative for Responsible Mining Assurance (IRMA) Standard for Responsible Mining.
The Standard has been developed over 10 years through a public-consultation process that included mining companies, customers and the ultimate downstream users of mined products, NGOs, labour unions, and communities. It covers, inter alia, working conditions, human rights, community and stakeholder engagement and environmental impact, as well as planning and financing reclamation and closure.
While IRMA is a voluntary certification system, it is also the world’s first and only global definition of what constitutes leading practice in social and environmental responsibility for large-scale mining operations. It seeks to emulate for mining what has been done with certification programmes in fair trade, agriculture, responsible forestry and sustainable fisheries.
Unki general manager, Walter Nemasasi observes that, “As a developing country, Zimbabwe faces many challenges. But we are a long term investor here, and Unki demonstrates the positive effect this investment is having on Zimbabwe. Unki’s great performance on all fronts has given us the confidence to be measured against international best practice. We look forward to Unki continuing to lead the way for the Group’s other mining operations, all of which we plan to have been assessed against credible responsible mining standards by 2025.”
30 Anglo American plc Integrated Annual Report 2019
STRATEGIC REPORT INNOVATION
INNOVATION CONTINUED

FutureSmart Mining™ One of the most explicit ways in which we are living up to our Purpose is through FutureSmart Mining™.
FutureSmart Mining™ is the blueprint for the future of our business. A future in which broad innovative thinking, enabling technologies, and collaborative partnerships will shape an industry that is safer, more sustainable and efficient, and better harmonised with the needs of our host communities and society as a whole.
Technologies and digitalisation will fundamentally change how we source, mine, process, move and market our products; and our Sustainable Mining Plan will transform how our stakeholders experience Anglo American along our entire value chain.
Technology and digitalisationThrough technologies and digitalisation, we envisage four concepts underpinning a new way of mining: Concentrating the Mine™, the Water-less Mine, the Modern Mine, and the Intelligent Mine.
Concentrating the Mine™ Concentrating the Mine™ is looking to address the need for increased precision in mining, with minimal energy, water and capital intensity. We are applying technologies including coarse particle recovery, bulk ore sorting and ultrafine recovery, that more precisely target the desired metals or minerals, delivering greater than 30% reductions in the use of water, energy and capital intensity, and producing less waste in the process, in line with our overall trajectory towards carbon neutral mining.
Water-less MineThe work we are doing on Concentrating the Mine™ is creating pathways to the Water-less Mine. Given that around 75% of Anglo American’s current asset portfolio is located in water constrained areas, it is essential that we reduce our dependence on water and associated tailings facilities. We will always need water, but we can get closer to full recovery recycling.
Two technologies we are focusing on to achieve our ambition of operating a water-less mine are coarse particle recovery and novel leaching.
Coarse particle recovery allows water to release from coarser ore particles, improving energy efficiencies and water savings by around 20%, in addition to reducing the risks associated with wet tailings.
Novel leaching technology is helping us identify ways in which we can clean up some of our old or closed tailings facilities, both
extracting the valuable residual metals and minerals, and improving their physical stability. New chemistries are now enabling us to be more specific in how we target minerals through the leaching process, significantly enhancing recoveries in lower grade ores.
Modern Mine We are developing a new generation of engineered controls to reduce the exposure of people to risk. This includes using existing technologies, such as electro-hydraulic drills, and by removing scraper winches.
From there, we can move operators further out of harm’s way and deliver efficiencies in continuous mining at depth through advancements in hard rock cutting. Automated and continuous rock-cutting vehicles safely extract the targeted ore deep underground without the need for explosive blasting. These innovations make it possible to mine lower grade ores and complex mineralogy, creating a safer and more productive environment, with lower operating costs.
Introducing remotely operated machinery will ultimately mean the removal of people from safety risk exposure, while upskilling employees in new technologies and approaches.
Intelligent MineThe Intelligent Mine is one in which vast quantities of quality data are transformed into predictive intelligence, leading to safe, fully integrated, optimised and self-learning operations. We are re-imagining the mining value chain with the power of data, from discovery, through mining, processing and asset strategy, to marketing. The aim is to bring the mining processes to a level of high performance and reduce the uncertainty and variability that characterises mining today.
We are building a digital ecosystem that underpins a digital way of working, operations are being digitised through sensors and other instrumentation, and artificial intelligence is being used to accelerate a range of processes, including predictive maintenance, longwall operations, processing and orebody characterisation.
We have already implemented predictive maintenance models that are detecting failures before they occur and reducing unplanned downtime, thereby increasing our throughput at sites including Barro Alto, Mogalakwena and Amandelbult.
In our processing plants, our machine learning digital twins are generating accurate ‘best operational recipes’ for complex processing units. This means our sites can make optimal decisions and enhance mineral recovery from each load of ore, while reducing the energy and water required.
We are using Advanced Process Control to reduce process variability and enable improvements in throughput, energy and water efficiency. For example, at Los Bronces mine, trials of the technology have improved throughput and achieved a 12% per tonne energy efficiency improvement across its three grinding mills.
Sustainable Mining PlanAs societal expectations continue to change and evolve, so mining must play its part to address the environmental challenges of a carbon-constrained world and society’s wider expectations of us as enablers of change, while we continue to meet the ever growing demand for our products.
Our Sustainable Mining Plan is designed to tackle many of these challenges, both environmental and social, and we are making encouraging progress that is changing how our employees and stakeholders experience Anglo American, in line with our Purpose.
Our far-reaching and ambitious Sustainable Mining Plan, launched in 2018 as part of FutureSmart Mining™, is built around three major areas or Global Sustainability Pillars, which are aligned to the UN’s Sustainable Development Goals:
• Developing trust as a corporate leader, providing ethical value chains, policy advocacy and improved accountability
• Building thriving communities with better health, education and levels of employment
• Maintaining a healthy environment that uses less water and delivers net positive biodiversity outcomes, ultimately moving us closer to our vision of a carbon-neutral mine.
Under each of the Global Sustainability Pillars we have a set of stretch goals. We are putting all our efforts into delivering them between now and 2030. These Global Stretch Goals are deliberately ambitious and designed to challenge us to lead and innovate.
At the heart of our Sustainable Mining Plan is Collaborative Regional Development, our model for bringing long term sustainable development opportunities to the regions around our operations.
Our innovative approach starts by identifying socio-economic development opportunities with the greatest potential in a region using spatial planning and analysis.
By working in partnership with a broad range of stakeholders, we are delivering on our commitment to building the foundations for long term, sustainable development in our host regions, far beyond the life of the mine.
31Anglo American plc Integrated Annual Report 2019

Environmental performance and climate change Our products are essential to human progress and to the transition to a low-carbon economy. Our ultimate aim is to deliver products with a net-positive impact (NPI) on biodiversity and the communities that depend on them.
We have set the following targets on water, climate change and biodiversity performance, as part of our Sustainable Mining Plan:
• We will reduce our energy use by 8% by the end of 2020, against the 2016 business-as-usual (BAU) projection, and achieve a 30% improvement in energy efficiency by 2030
• We will reduce our greenhouse gas (GHG) emissions by 22%, relative to the 2016 BAU projection, by the end of 2020, and achieve a 30% net reduction in GHG emissions by 2030
• We will reduce freshwater withdrawals by 20% by 2020, and by 50% in water-stressed areas by 2030, as an average across the Group against 2015 baseline data and definitions. We will also increase water recycling levels to 75% by 2020, while eliminating all water incidents that are Level 3 or higher
• For all sites in high-risk environments, we will have an agreed plan for delivering and measuring NPI by the end of 2020, and deliver NPI on biodiversity across Anglo American by 2030. Our NPI target means that any impact on biodiversity owing to Anglo American’s activities must be outweighed by the biodiversity gains that we achieve.
Managing our environmental impactsOur Safety, Health and Environmental management system, the SHE Way, incorporates the requirements of ISO 14001. We recently updated our standards on air quality, biodiversity, hazardous materials management, carbon and energy, and have been engaged in a gap analysis to ensure compliance across all our sites. We are also working towards integrating environmental risk management into our Group operational risk management (ORM) processes. As part of this process, we are assessing the most important environmental risks for each of our sites, developing critical controls and measuring the effectiveness of these controls through an onsite verification process.
During 2019, we made significant progress:
• We met our 2020 target of reducing GHG emissions by 22%, and continue to pursue our challenging 2020 target of reducing energy use by 8%
• Our PGM operations are on course to achieve zero waste to landfill by the end of 2020
• We made good progress incorporating environmental management into our Operating Model, including the development of an integrated data dashboard that will be fully functional by mid-2020
• We are on track for all sites in high risk environments to have biodiversity value assessments and site-specific indicators in place by the end of 2020.
We are also progressing towards full implementation of the SHE Way. By the end of 2019, 88% of our sites had completed self-assessments against its requirements and have action plans in place. In 2020, we aim for all our sites to have fully implemented the SHE Way.
Learning from environmental incidents We classify incidents on five levels, according to the consequences for the environment. Level 4-5 incidents are included in the chief executive’s quarterly performance scorecard and all Level 3-5 incidents (from moderate to significant) are reported to the Board, which addresses them through its Sustainability Committee.
In 2019, we recorded one Level 3 (moderate) environmental incident for the Group and no Level 4 and Level 5 incidents (2018: one Level 4 and five Level 3).
Full details of the one Level 3 environmental incident recorded at Unki in Zimbabwe, see our Sustainability Report, 2019.
WaterWater is a vital resource for our operations and our communities alike, and we have taken important steps to improve the way we define, account and report our water use. We take a catchment-wide, risk-based approach to water management, addressing the risks of flooding, discharge, water scarcity, mine dewatering and contamination.
Until 2020, we will report water performance under the definitions we have used since 2015. In 2020, we will re-baseline all data and will be introducing improved International Council on Mining and Metals (ICMM) aligned definitions. These will serve as a baseline to the 2030 targets.
Using the World Resources Institute’s Aqueduct tool, around 75% of our sites would fall within water-stressed areas. Work is underway to develop site and catchment-specific assessments that will provide us with a more complete understanding of business water risk.
Our Sustainable Mining Plan includes three milestones to be met by 2020:
• Reduce the abstraction of fresh water by 20%
• Increase water recycling levels to 75%
• Have no Level 3 or greater water incidents.
The first one is currently at risk due to our current water accounting challenges.
Total water withdrawals amounted to 209 million m3 (2018: 227 million m3).
Mineral residue managementManagement and storage of waste rock and the processed mineral residue known as tailings is a critical issue for our industry. It represents a social, safety and environmental challenge that we are determined to meet.
Recent catastrophic tailings dam failures have led to increased public scrutiny of all mining companies’ approach to managing and storing mineral residue.
Anglo American actively responded to the Investor Mining Tailings Safety Initiative request to encourage full disclosure from mining companies about their mineral residue storage facilities.
For more information and disclosure please see: www.angloamerican.com/tailings
Our approach to mineral residue managementTailings dams represent one of the top catastrophic risks for our business. In managing and storing tailings material, we aim for zero harm by adhering to our industry-leading Group technical standard. The standard addresses the risks that tailings storage facilities pose, and sets minimum requirements for design criteria, monitoring, inspection and surveillance. It covers both water-retaining dams and waste-rock dumps, and represents best practice in all jurisdictions where we operate.
We have encouraged an industry-wide conversation on tailings and the role that they play in the mining process. We are also committed to developing new technologies that will reduce the volume of residue that mining produces, enable more of it to be stored in a dry form, and reinforce the stability and safety of the tailings dams we operate.
During 2019, we intensified the scrutiny of our own upstream tailings dams. We conducted a Groupwide technical review to evaluate how we manage risks of instability at these facilities and shared key learnings across our operations, as well as undertaking proactive action to address any risk of instability identified.
32 Anglo American plc Integrated Annual Report 2019
STRATEGIC REPORT INNOVATION
INNOVATION CONTINUED

Climate changeClimate change is one of the defining challenges of our time. Anglo American has participated in developing climate change policy for the mining industry for almost 20 years. We believe that mines can be carbon neutral, and we are developing a pathway for achieving carbon neutrality. We are also exploring how we could work with others to influence the GHG emissions of our products throughout the value chain.
Our strategic approachClimate change considerations are part of our strategic planning and business decision-making. This includes our investment decisions, the industry associations we belong to, and the way we position Anglo American for the future.
We are exploring growth opportunities, including in copper, nickel and PGMs – the metals required for the transition to a low-carbon economy, and we have reduced our thermal coal production footprint by more than half since 2012.
Our management approach to climate change is built around five principles:
• Building internal agility and ensuring resilience to climate change
• Reducing energy use and carbon emissions throughout our business
• Understanding and responding to risks and opportunities related to the carbon lifecycle of our products, including consumer perceptions
• Developing and implementing collaborative solutions with our stakeholders
• Contributing our skills and knowledge to the development of responsible public policy.
These principles align with the vision set out by the Financial Stability Board’s Task Force on Climate-related Financial Disclosures (TCFD). Anglo American has been a TCFD supporter since September 2018. In line with the TCFD’s recommendations, in 2019, we published the report Climate Change: Our Plans, Policies and Progress. This report explored the impact of climate change across our portfolio through quantitative scenario analysis. The analysis helped us understand that our business is fundamentally resilient.
For guidance on where to find information relating to each of the TCFD’s recommendations, please see the disclosure table on page 238.
We include our performance on energy and carbon in our chief executive and business unit CEOs’ scorecards, and our 2020 GHG target is included in our 2017 Long Term Incentive Plan.
In addition to our work with the ICMM, we engage in policy processes through other local and international forums. We also have consistent and constructive
engagement with investors with an interest in climate change, including with Climate Action 100+ initiative.
At Los Bronces’ Las Tórtolas tailings dam in Chile, a pilot photovoltaic plant built over a tailings pond is the first of its kind. Its 256 panels, located on a floating island, are designed to generate 150,000 kWh of renewable electric power annually and reduce CO2 emissions by 51 tonnes a year.
Copper – renewable energy for ChileIn recent years, our Copper business in Chile has been exploring potential new ways of sourcing energy that will reduce our Scope 2 CO2 emissions. This has led to the signing of a 10-year contract with Enel Generación Chile for the supply of energy from fully renewable sources to all our managed Chilean copper operations from January 2021. Enel Generación will supply up to 3 Terawatt hours (TWh) annually, making this one of the country’s largest contracts for 100% renewable energy. This will play a significant part in helping our Copper operations reduce their total emissions by 70% – equivalent to taking 270,000 medium-sized vehicles off the roads. Collahuasi, a non-managed copper operation, also signed a 10-year, 100% renewable energy contract with Enel Generación, which is effective from April 2020.
The agreement is part of a series of initiatives by Anglo American to combat the effects of climate change by running more sustainable operations and thereby contributing to a healthier environment.
One such initiative is a pilot photovoltaic plant built over a tailings pond at Las Tórtolas – the first of its kind in the world. The 256 photovoltaic panels are located on a floating island designed to generate 150,000 kWh/year of renewable electric power and reduce CO2
emissions by 51 tonnes a year. Currently, Los Bronces recirculates between 70%-80% of its process water. The photovoltaic plant will reduce water evaporation in the area it covers by 80%, thereby increasing the water available for recirculation in the mining process. The plant also has the benefit of increasing water availability to Los Bronces – critical in an area that is currently experiencing water stress.
At the launch event in March 2019, Chile’s Mining Minister, Baldo Prokurica, observed, “Mining has diverse challenges regarding many areas, and one of them is caring for the environment. This type of initiative positions Chile at the global forefront of mining innovation for a sustainable industry – an excellent idea for mining traceability and for the efficient use of water.”
“This initiative reinforces Anglo American’s commitment to developing new mining practices that adapt and connect with the interests of neighbouring communities,” explained Los Bronces general manager Patricio Chacana. “We’ve made innovation a fundamental axis of our activity. We believe it should be a priority to re-imagine mining, challenging the way things have always been done. By actively developing new solutions and stimulating new ways of thinking and working, we move towards increasingly sustainable mining, and that benefits everyone.”
33Anglo American plc Integrated Annual Report 2019

Targets and performanceIn 2019, our operations were responsible for 17.7 million tonnes of CO2-equivalent emissions (Mt CO2e) (2018: 16.0 Mt CO2e). This represents an 11% increase, reflecting a rise in fugitive methane in Metallurgical Coal related to a change in the mining area. The increase includes an additional 1.3 Mt CO2e methane abatement initiatives implemented in the year. The total GHG reduction was 24% against our BAU scenario, which meets our 2020 target a year ahead of schedule.
Our total energy consumption increased by 3% to 87 million GJ (2018: 84 million GJ) – a 5% reduction against our BAU scenario. The rise in energy consumption, driven by the restart of production at Minas-Rio and construction progress at the Quellaveco copper project, was partly offset by lower consumption at Los Bronces, where drought affected production.
In 2019, we improved the methodology to estimate our Scope 3 emissions, which are emissions that occur from the transport and use of our products. We have estimated our Scope 3 emissions for 2019 at 226 Mt CO2e, which for the first time includes a portfolio-wide calculation.
For more information on our Scope 3 emissions see: www.angloamerican.com/sustainability-data
ECO2MAN, our energy and carbon management programme, identifies projects that can help our sites meet their targets on energy use and GHG emissions. To achieve carbon neutrality across our operations, we are focusing on radically reducing energy consumption through our FutureSmart Mining™ programme, switching to low-carbon energy sourcing and increasing the role of renewables in our energy mix.
Meeting our commitments to government and societyWe are committed to delivering a lasting, positive contribution to our host communities, beyond the life of our mines. This starts with understanding and responding to their needs and priorities. Fulfilling this commitment is critical to our long term success as a business.
Social performanceWe manage the relationship with our host communities through our social performance management system, the Anglo American Social Way. It sets out the requirements all our managed or operated sites need to meet. It also covers how we engage with communities, mitigate adverse social impacts, and pursue development opportunities.
Our industry-leading Socio-Economic Assessment Toolbox (SEAT) helps our sites comply with The Social Way. It provides tools for measuring sites’ socio-economic effects and guides their approach to managing human rights, grievances and the social impact of mine closures.
Management approachIn 2019, we developed The Social Way 3.0, an update to our management system that is designed to meet stakeholders’ evolving expectations. The updated Social Way aligns with our Sustainable Mining Plan, our Code of Conduct, and the SHE Way. Designed with our Purpose of re-imagining mining to improve people’s lives at its heart, it brings about a step-change in the way we manage sites’ overall performance and embeds respect for human rights across all aspects of how we operate.
We will roll out The Social Way 3.0 across all of Anglo American’s managed and operated sites during 2020.
Governance and performanceEvery year, we commission independent assessments of our sites’ social performance and compliance with The Social Way through the Social Way Assurance Framework. When we identify cases of non-compliance, we require the sites in question to develop and implement an immediate improvement plan. In 2019, there were no serious cases of non-compliance across the Group.
We have a Groupwide procedure for reporting social incidents and grievances, aligned with the UN Guiding Principles for Business and Human Rights.
We report all Level 3-5 (moderate to significant) social incidents to our Board and include them in the chief executive’s quarterly performance scorecard.
In 2019, we saw a significant increase in reported Level 3-5 social incidents, compared to 2018. This was driven by increased construction activity at Quellaveco, and work on an unsurfaced road at Minas-Rio that generates excessive dust. We have also responded to incidents of pipeline vibrations at Minas-Rio affecting the local community, and we are investigating potential mitigating solutions.
Human rightsGovernments, investors and civil society have increased expectations of businesses to meet their responsibilities under the United Nations Guiding Principles on Business and Human Rights and, at Anglo American, we take these expectations seriously.
Management approachOur approach to human rights is aligned with the UN Guiding Principles on Business and Human Rights, and we are committed to implementing the UN Global Compact Principles. Our global Human Rights Policy is available to employees on the company intranet and external website, and we run an annual awareness campaign around International Human Rights Day to encourage employees to read and understand the policy.
We have developed a five-year action plan to drive continuous improvement in how we identify and manage human rights risks. The plan tackles the need to build human rights expertise into our business, engaging with stakeholders, and initiatives in key risk areas such as security and human rights, and our supply chain.
Governance and performanceEvery Anglo American operation carries out an annual social risk assessment to identify human rights risks and potentially vulnerable groups. Over the past two years, we have also conducted human rights due diligence at all our sites.
We are determined to ensure that Anglo American is part of an ethical value chain that respects human rights and is free from slavery. This includes complying with the UK Modern Slavery Act of 2015 and the strengthened reporting requirements that the UK government is currently considering.
During 2019, grievances that involved human rights aspects accounted for approximately 3% of the total number of grievances received.
Socio-economic contributionAnglo American contributes to economies and society both directly and indirectly, through the taxes and royalties we pay, the jobs we create, the local workforces we upskill, the local business opportunities we generate, and the education and community health initiatives we support.
Our approach – Collaborative Regional Development (CRD)Our CRD approach, integral to our Sustainable Mining Plan, was launched in South Africa’s Limpopo province and now sits at the heart of our approach to socio-economic development. It is designed to meet the need for sustainable, regional development that does not rely solely on the employment and supply chain opportunities provided by mining.
34 Anglo American plc Integrated Annual Report 2019
INNOVATION CONTINUED

Social investmentIn 2019, our Corporate Social Investment (CSI) reached $114 million (2018: $82 million), which represents 2% of underlying earnings before interest and taxes (EBIT), less underlying EBIT of associates and joint ventures.
We focus our CSI on health, education and community development, in line with our Sustainable Mining Plan. We invested $29 million on education and training initiatives in 2019, and $12 million on health and welfare projects.
Supply chainDuring 2019, Supply Chain continued its three-year journey to Innovate Supply, Responsibly, delivering on breakthrough outcomes in several areas.
Safety performanceSupply Chain supports the Group’s Elimination of Fatalities programme through several initiatives. We firmly believe that our suppliers can be a key contributor towards achieving our zero harm ambition, and Supply Chain’s primary focus was on more robust safety-based supplier selection criteria, improved supplier safety performance management and on leveraging supplier-enabled innovation to strengthen critical controls.
Inclusive procurementAt Anglo American, our vision is to create a more inclusive Supply Chain as we seek to generate more equitably shared and sustainable prosperity in the communities around our operations.
Our vision extends to the promotion of various region/country-specific initiatives such as enhanced engagement with our designated suppliers, who include previously disadvantaged sectors of the economy in South Africa; indigenous citizens (Canada); and Aboriginal suppliers (Australia), and the promotion of in-country manufacturing and assembly of the goods we procure.
In 2019, our operations spent approximately $11.6 billion with suppliers, of which $3.8 billion was with local suppliers. Our expenditure with designated suppliers was $2.9 billion, representing 24% of total supplier expenditure, including $0.6 billion with host communities(1) in the direct vicinity of our South African operations.
Responsible sourcingIn our Responsible Sourcing Standard for Suppliers, we articulate key sustainability requirements for both our current and prospective suppliers and, through our external commitment to an ethical value chain and recognising the emergence of new risk areas such as modern slavery, we continue to update our standard to highlight key expectations of suppliers. The standard specifies requirements to protect safety, health and the environment; respect labour and human rights; increase social accountability; and conduct business fairly and with integrity.
We support suppliers to understand and identify potential risks and improve their management controls; we do this through supplier self-assessments, third-party audits and tailored supplier capacity-building programmes. Where required, corrective actions are agreed and monitored.
In 2019, we conducted self-assessments with more than 450 suppliers (2018: around 150), and on-site assessments with over 40 suppliers. In response to findings from these assessments, we have intensified our efforts to support small businesses to meet our standards, and conducted training programmes for more than 250 small and medium suppliers in South Africa.
Value delivery through supplier partnershipsWe continue to focus on delivering value for our operations through global and regional framework agreements, supplier enabled innovation and the optimisation of working capital. Through our strategic supplier partnerships, we jointly identify opportunities and deliver on our innovation roadmaps. In collaboration with the Group’s Technical team, several innovation and modernisation initiatives are being implemented in safety, mining, processing, and sustainability.
In a bid to improve efficiencies and, therefore, reduce costs across the Group’s loading and hauling units, we engaged with our original equipment manufacturer (OEM) supplier partners to determine how they can play a role in meeting our P101 objectives through deploying technical developments across priority load and haul fleets. OEM technology and innovation roadmaps, with a specific focus on technologies which are ready for deployment today, have been reviewed and are being matched to P101 load and haul productivity improvement objectives.
Supply chain digitalisationOur journey to a touchless, request-to-pay purchasing process continues through our rapidly growing adoption of electronic procurement across our business and supplier base. Digital collaboration with suppliers has more than doubled through 2019; as a result, productivity improvements are being experienced through the improved accuracy and speed at which we transact. The benefits of integrated business-to-business transactions are expected to deliver further incremental performance improvement in 2020.
(1) Host community spend reflects South African data only, following implementation of narrower definitions aimed at ensuring maximum impact on host communities in the direct vicinity of our operations.
Africa 56,191
Americas 54,567
Australia 1,541
United Kingdom 1,598
Rest of World 230
Total 114,127
%
49
48
1
1
0
$’000
GLOBAL CSI EXPENDITURE BY REGION (1)
(1) Discrepancies may occur due to rounding.
%$’000
37
25
18
10
3
2
2
2
1
0
GLOBAL CSI EXPENDITURE BY TYPE (1)
Community 41,700development
Education and training 28,625
Water and sanitation 20,664
Health and welfare 11,919
Sports, art, culture 3,003and heritage
Other 2,558
Disaster and 2,070emergency relief
Environment 1,968
Institutional 1,501capacity development
Energy and 119climate change
Total 114,127
(1) Discrepancies may occur due to rounding.
35Anglo American plc Integrated Annual Report 2019

Our people are critical to all that we do. The partnerships we build, both within Anglo American and with our stakeholders – locally and globally, are central to maintaining our regulatory and social licences to operate and our commercial success.
Material matters discussed in this section
Safety and health
Workforce culture and capability
Meeting our commitments to business stakeholders and society
Political and regulatory
PEOPLE
Kumba Iron Ore participants at Anglo American’s annual Safety Day, held in October.
STRATEGIC REPORT

In August, nearly 700 colleagues from across our South African businesses and Group functions came together in Johannesburg to attend Elevate, Anglo American’s first Groupwide inclusion and diversity event.
Getting the best out of our peopleIn recent years, and across many countries, there has been a remarkable shift in sentiment towards a more progressive vision for society. Of course, business plays an important role in society and, in the world of work, responsible companies are embracing such secular shifts. Anglo American is seeking to make its workplace fairer and more representative, where employees feel they can bring their whole and best selves, irrespective of their gender, ethnicity, religion, sexual orientation, national origin, age, or disability.
Having the best minds and inclusive leadership are crucial to finding innovative and sustainable solutions to business challenges and to embedding a high performance culture. This means drawing from the widest available talent pool, and leveraging their complementary skills and attributes to achieve breakthrough outcomes.
Our Inclusion and Diversity (I&D) strategy is a critical foundation of our Purpose of re-imagining mining to improve people’s lives, supporting us in creating a work environment where each of our people is afforded the opportunity to realise their full potential.
Tackling gender imbalanceHistorically, in the mining industry, women have been under-represented at all levels, particularly in senior roles. We are steadily redressing that: over the past three years, the proportion of women at senior management levels across the Group has increased from 15% in 2016 to 24% in 2019. Our target is to exceed 25% by the end of 2020 and aim to reach 33% by 2023.
An inclusive approachOur global employee engagement survey, I&D survey and focus groups have indicated a need to improve both physical and psychological safety,
and creating an environment free from bullying, harassment and victimisation is a significant contributor. To help achieve this, we have developed a clear and consistent global policy that we are communicating, and are providing training across Anglo American. Our aim is for everyone to understand the impact of these actions, whether intentional or not, to know the support they can access and expect if they experience such behaviour, and to embed a zero-tolerance workplace where people feel confident to report any incident of poor behaviour.
Simultaneously, we have been looking at ways to continuously improve our internal whistleblowing initiative to ensure it is an equally robust pillar supporting the Group’s I&D strategy. In 2019, we engaged a new external provider and rebranded the channel from Speak Up to YourVoice – to reflect the people-centric nature of the programme.
In such a geographically and ethnically diverse company as ours, however, there is always a danger that our Purpose, our strategy, our Values and associated behaviours are not sufficiently understood or are misinterpreted. That is why we engage in regular training and learning activities that focus on the behaviours we expect wherever we may work.
We have also redefined the behaviours underpinning our Values. Adopting a bottom-up, inclusive approach, we asked our employees and 250 senior leaders from across the Group for their views on how the Values should be refreshed and brought to life. In consequence, we have provided more clarity around what behaviours will actually drive the change required for us to become a more purposeful and high performing organisation, and our refreshed Values now focus more on the individual’s role and accountabilities.
We have redefined the behaviours underpinning our Values ... our refreshed Values now focus more on the individual’s role and accountabilities.”
HIGHLIGHTS
2.21Group Total Recordable Case Frequency Rate – a 17% improvement over 2018 and a record low.
25%Target for % of women in senior management roles across the Group by the end of 2020. We aim to reach 33% by 2023.
UNAIDS targetsTwo of the three targets set by the UN have been achieved by Anglo American, a year ahead of schedule.
Pillars of value
Environment
Socio-political
Financial
For our KPIs: See pages 50-51
37Anglo American plc Integrated Annual Report 2019

Safety comes foremost in everything we do; we train, equip and empower our people to work safely every day. We believe, too, that creating an inclusive and diverse working environment and culture that encourages and supports high performance and innovative thinking gives our business a competitive advantage.
SafetyWe have intensified our focus on the elimination of fatalities at our operations, refreshing our Values, and linking them closely with cultural change at all levels of the business.
Management approach and governanceOur approach to safety management is built on five key pillars: passionate leadership; resilient management systems; effective risk management systems; rapid organisational learning; and an engaged workforce. We manage and improve safety through our Operating Model; the SHE Way; our system of global policies, standards and guidelines; our operational risk management and assurance processes; and our learning from incidents investigative process. We have defined what ‘good’ looks like, have developed tactical plans, and we monitor progress and correlate safety improvements.
Over the past 18 months, we have conducted an audit to take a close look at safety across our Group. We have appointed an Elimination of Fatalities Taskforce to investigate catastrophic and fatal risks at our sites, and the culture that gives rise to these risks. The taskforce includes representatives from each of our business units and functions, as well as external experts who help us to learn from best practice at other businesses. The Taskforce’s findings are assisting to prioritise urgent actions to prevent serious incidents with the potential for loss of life. We have also changed our approach to communicating the tragic news of fatalities across our business to ensure we quickly communicate lessons learned to all employees.
Anglo American’s safety, health and environment results affect the performance-based remuneration of all employees in the business, and health and safety targets are included within the annual performance incentives for executive directors and senior management.
PerformanceOur safety journey in 2019 was challenging. We lost four colleagues in work-related incidents at the Group’s managed operations and one colleague at a non-managed joint operation.
We were also deeply saddened by two contractor colleagues who lost their lives in separate security-related events, 10 colleagues who died in two separate after-hours commuting-related road accidents, and one colleague who passed away while attending a voluntary off-site rescue training exercise. These fatal incidents highlight how important it is for us to continue to seek to improve the safety of everyone associated with Anglo American, including our contractors, and use influence to promote
the adoption of good safety practice at our suppliers and non-managed joint arrangements.
Fatalities are included in our reporting figures when they occur while executing work on behalf of Anglo American, and when we are responsible for working practices and health and safety standards. Of the 18 deaths reported, four are included in our occupational safety statistics, which is in line with the ICMM and internal reporting guidelines.
In 2019, the Group’s fatal injury frequency rate (FIFR) decreased to 0.017 (2018: 0.024) and our lost-time-injury frequency rate (LTIFR) decreased to 1.36 in 2019 (2018: 1.63). Our total recordable case frequency rate (TRCFR), which includes any injury that requires more than first-aid treatment, decreased to 2.21 (2018: 2.66).
201920182013 2014 2015 2016 2017
TRCFRLost-time injuries Medical treatment cases
Injuries TRCFR
0
500
250
750
1,000
1,250
1,500
1,750
2,000
0.00
1.00
2.00
3.00
4.00
5.00
6.00
LOST-TIME INJURIES, MEDICAL TREATMENT CASES AND TOTAL RECORDABLE CASE FREQUENCY RATE 2013–2019
FIFRFatal injuries
201920182013 2014 2015 2016 2017
Fatal injuries FIFR
0.000
0.005
0.010
0.015
0.020
0.025
0.030
0.035
0.040
0.045
0
2
4
6
8
10
12
14
16
0
2
4
6
8
10
12
14
16
TOTAL NUMBER OF FATAL INJURIES AND FATAL INJURY FREQUENCY RATE 2013–2019
38 Anglo American plc Integrated Annual Report 2019
STRATEGIC REPORT PEOPLE
PEOPLE CONTINUED

HealthOur approach to health and well-being will consider all aspects of health for both our employees and our host communities. We aim to achieve all relevant targets for each host community under the UN Sustainable Development Goal on health by 2030.
At Anglo American, we understand that a person’s health and well-being involve physical, social, cultural and psychological factors. In 2019, we reframed our approach to what we call Total Health. Total Health is adapted from the World Health Organization’s Healthy Workplace Model and provides our framework for managing health and wellness at Anglo American.
Our Safety, Health and Environmental management system, the SHE Way, sets out the requirements for managing occupational health risks. Together with health-related technical standards, it defines the requirements our sites must meet.
Controlling occupational exposureAs achieving good occupational health and hygiene is a vital part of meeting our target of zero fatalities, we apply the same rigour to eliminating occupational health hazards as we do to eliminating workplace safety incidents.
We provide employees and contractors with appropriate personal protective equipment, such as respiratory or hearing protection, wherever there is a risk of exposure levels exceeding safe limits. Innovation in technology is further helping us protect the health of our workforce, reduce exposure to hazards and give us early warning of when we need to take action. For example, in 2019, we continued to roll out our award-winning Operational Intelligence Suite, a real-time data analytics platform that monitors environmental conditions and the performance of our engineering controls.
We also relaunched our Occupational Hygiene Standard and expect all our sites to have implemented and complied fully with the new standard by the end of 2020.
In 2019, the number of new cases of occupational disease declined to 39 (2018: 101). We believe that this is a direct result of initiatives such as training employees to use hearing protection. Once again, we saw a reduction in new cases of life-threatening coal-workers’ pneumoconiosis in South Africa and Australia, from 5 in 2018 to 1 in 2019.
Managing TB and HIV/AIDSAt the end of 2019, we succeeded in reaching the first two objectives under the UNAIDS 90/90/90 target for all employees at Anglo American operations where we have data available. This means that 90% of our employees know their HIV status, and 90% of those identified as HIV-positive are having anti-retroviral treatment (ART). At the end
of 2019, the infection rate for TB among our employees in South Africa stood at 230 per 100,000 people, well below the 2018 national rate of 520 per 100,000 people. This is a result of high ART uptake among HIV-positive employees in addition to implementing Isoniazid Prevention Therapy, which we have distributed to over 70% of our eligible employees.
Testing for HIV at PGMs’ Amandelbult Hospital. For well over three decades, Anglo American has led the response from South African business to the country’s HIV/AIDS epidemic.
Beyond 90/90/90 – ready for the next challenge in the fight against HIVIn 2014, the Joint United Nations Programme on HIV/AIDS (UNAIDS) set its strategy for ending AIDS as a public-health threat by 2030. For Anglo American, this goal speaks to the heart of our effort to ensure our employees’ health. We have felt the impact of AIDS at first hand, particularly among our employees and host communities in South Africa.
UNAIDS set three ambitious targets for 2020: 90% of all people living with HIV would know their HIV status; 90% of those diagnosed with HIV would receive sustained ART; and 90% of those receiving ART would have viral suppression where the viral load is so low as to be undetectable. Not only was Anglo American ready to accept this challenge, we had already spent decades working to tackle the impact of HIV on our employees, their families and our host communities.
In South Africa, which has one of the world’s highest infection rates for HIV, we have been running HIV testing and treatment programmes since 2000 and, in 2002, we became one of the first companies to introduce free ART for our employees. Since the launch of the 90/90/90 targets, we have intensified our efforts, working
to reduce the stigma associated with HIV/AIDS, adopting an always-on approach to awareness and engagement, and working with the governments and health bodies to overcome resistance to HIV testing. In 2016, we signed a collaboration agreement with UNAIDS to promote HIV testing worldwide, building on the success of our employee programmes.
Our journey to eliminate AIDS as a public-health threat reached a key milestone when we achieved two of the three critical 90/90/90 targets for Anglo American employees in South Africa. Of these employees, 94% know their HIV status, and 92% of those identified as HIV-positive are having ART. The proportion of our employees with viral loads so low as to be undetectable currently varies between 80% and 90%.
These achievements are significant – but they are only part of the journey. During 2020, we will be building an action roadmap to address HIV prevention and other health challenges faced by our employees and communities. This will require new collaborations and initiatives to target the key drivers of HIV infection. In South Africa, for example, we have commissioned an in-depth study to better understand the social risk factors linked to new cases of HIV.
39Anglo American plc Integrated Annual Report 2019

Workforce culture and capabilityWe aim to attract the best people in the industry and provide professional and personal development opportunities that empower everyone to reach their full potential.
Our People and Organisation strategy is focused on achieving three outcomes:
• Creating a safe and caring environment, where every colleague experiences a work environment free of physical and psychological harm, and everyone can bring their whole and best selves to work every day
• Igniting growth and extraordinary performance, by helping all employees and teams to realise their full potential and harness it to deliver our Purpose and business strategy
• Empowering our business to achieve new possibilities, by understanding potential opportunities and disruptors, understanding the implications for our people, and enabling the business to adapt.
Our Organisation ModelOur Organisation Model is the foundation for achieving our objectives as a business. It is a set of structures, systems and processes that define the way we lead and work together to deliver safe, productive outcomes. Our Operating Model works alongside the Organisation Model to ensure we have the right people, in the right roles, doing the right work.
Performance management and continuous learningIn 2019, we introduced an innovative approach to managing the performance of about 11,000 of our employees which puts the emphasis on teams delivering against shared goals. Under TEAM+, we manage team performance against collective targets and commitments, rather than individual performance. TEAM+ promotes active collaboration and collective responsibility. It has helped to align the way that teams work with the Purpose and strategy of our business in mind and will enable faster progress in important areas, such as safety.
During the year, we launched LEARN+, a single, user-friendly interface that makes it easy for our employees and people in our host communities to access our growing range of online learning resources. This is part of our Centre of Excellence model for learning, which provides access to web-based resources, and augmented reality and virtual reality learning experiences through a single-content repository.
We spent $90 million on training in 2019 (2018: $94 million). After 12 months, 52,000 of our employees had engaged with LEARN+ content, with participants spending an average of four hours per month consuming learning content.
Developing inspiring leadersWe believe that inspiring, accountable and safety-conscious leaders are the foundations of a high performance culture. We invest in equipping leaders at all levels of the organisation with the skills they need to motivate employees and encourage their teams’ development.
We have a structured Leadership Academy to develop our leaders’ capabilities. The Academy runs five programmes, which focus on achieving our Purpose as a business, ensuring the safety of our people, and delivering industry-leading margins and returns. More than 400 leaders participated in Leadership Academy programmes in 2019.
Sourcing the skills Anglo American needsTo re-imagine mining, we need to develop new skills among our existing employees and bring new kinds of talent into our business. We are continuing to evolve our approach to talent acquisition. This includes improving our recruitment capability, investing in training and tools to eliminate unconscious bias, and launching a new applicant-tracking system. We aim to establish a consistent global recruitment process that can attract, source and anticipate the skills that the business will need in the future.
Employee engagement and workplace relationsWe recognise that there are many different aspects to employee engagement. These include the way that we work and build relationships with trade unions and other representative bodies, our success in building a diverse and inclusive working environment, and the steps we take to engage employees directly.
In 2019, we established a Global Workforce Advisory Panel to better gather views from the workforce in line with the recommendations of the revised UK Corporate Governance Code. The Panel is made up of employee representatives from each country where we have a significant presence and is chaired by our senior independent director, Byron Grote. It met for the first time in October 2019, in South Africa, and the outcomes of its discussions were shared with the Anglo American Board at its meeting in December 2019. In the future, the Panel expects to convene at least twice a year and,
along with the other established channels of communication we have with our employees, this forum should be of considerable benefit in helping the Board better understand the views of the workforce when making strategic decisions.
Our employee turnover rate was 2.3% (2018: 2.4%). New hires represented 11.3% of our permanent employees, against 10.5% in 2018.
We take a decentralised approach to working with trade unions, works councils and other representative bodies, which enables our business units to address specific regional issues and concerns affecting different areas of our business. In 2019, approximately 72% of our permanent workforce was represented by worker organisations and covered by collective bargaining agreements. There was one incident of unprotected industrial action in South Africa at PGMs’ Mototolo mine, which lasted three weeks and related to wage demands and employee concerns about medical coverage. These issues were resolved in early 2020.
In October 2019, we completed our latest employee-engagement survey, reaching more employees and gathering more detailed feedback than ever before. We received responses from 39,000 employees, representing 66% of our permanent workforce. See page 98 of the Governance report for details of the key insights to emerge from the survey.
Supporting labour rightsAnglo American has signed the United Nations Global Compact, and our Human Rights Policy commits us to the labour rights principles set out in the core conventions of the International Labour Organization. These include the right to freedom of association and collective bargaining, non-discrimination, and the eradication of child and forced labour. There were no reported incidents of under-age or forced labour at Anglo American operations during 2019.
Our Responsible Sourcing Standard stipulates that all suppliers shall respect all labour and human rights throughout their own value chain.
An inclusive and diverse environmentInclusion and diversity are essential foundations of a high performance culture. They ensure that Anglo American has access to the widest possible pool of talent, while providing all employees with opportunities to fulfil their potential.
40 Anglo American plc Integrated Annual Report 2019
STRATEGIC REPORT PEOPLE
PEOPLE CONTINUED

We have made significant progress during the past 12 months in creating a more inclusive and diverse workplace. We recognise, however, that we still have much more to do as we address the issues associated with mining being a historically male-dominated industry.
During 2019, we rolled out inclusive leadership training to all leaders globally, following the unconscious-bias training the senior leadership team received in 2018. The inclusive leadership programme puts the focus on conscious inclusion and the actions that our leaders can take to address barriers to inclusion within their own teams.
We updated our global workplace policies to reflect our commitments, by introducing global policies covering inclusion and diversity, bullying, harassment and victimisation, and flexible working.
We also launched several new initiatives designed to eliminate bullying and harassment, provide stronger support on mental health, and ensure all colleagues are comfortable in their work environment.
Towards the end of 2018, we surveyed 15,000 employees anonymously and in confidence to get a clearer picture on their diversity and to understand how inclusive our culture is. This enabled us to measure perceptions of inclusion within Anglo American for the first time and will provide a benchmark for measuring progress.
We have identified gender equality as a business imperative for Anglo American, and have set a target for 33% female representation within all management levels in every business unit and Group function, by 2023. At the end of 2019, women made up 21% of our overall workforce, compared with 20% in 2018.
We have set a similar target for 33% of our Group Management Committee and those reporting to the committee to be women by 2023. The proportion of women at this level has increased from 15% in 2016 to 24% in 2019.
We report on the gender pay gap for our UK operations, in line with legislative requirements. On 5 April 2019, our gender pay gap reporting date, women represented 53% of the 249 employees at our UK head office, and 25% of senior management roles. The average hourly pay gap was 50% and the median hourly pay gap 38%. While there has been a significant improvement in representation, our gender pay gap reflects our UK senior management population having a substantially higher proportion of men (75%) than women (25%).
At the year end, the proportion of our permanent employees aged under 30 was 12%, with 69% aged between 30 and 50, and the remaining 19% over 50 years of age. In South Africa, historically disadvantaged South Africans (HDSA) held 65% of our management positions.
Building a purpose-led cultureAnglo American expects our employees, contractors, suppliers and associates to behave ethically, always. We recognise society’s enhanced expectations that we should act with integrity and display consistent care and respect for colleagues, communities and the environment. We have aligned our Code of Conduct and Business Integrity Policy with these expectations.
We embed reminders about the Code in our regular communications with our employees, and support it with guidelines that help all our employees make the right decisions when faced with ethical dilemmas. We have appointed Code of Conduct programme managers throughout the business, who develop implementation plans to raise awareness of the Code in their business units. Internal audits are carried out on a sample basis to check that these plans are in place and being implemented. In addition, we commission external reviews of key areas of the Code. The content of the Code is reviewed on an annual basis and updated as necessary. We also review our Business Integrity Policy and procedures every two years, and update when required.
Business integrityOur Business Integrity Policy states that we will neither give nor accept bribes, nor permit others to do so in our name. We support the policy through 11 Prevention of Corruption Procedures that set out the conduct required in areas where bribery and corruption risk may be present. We have a network of business integrity implementation champions and managers across the Group, who administer this programme. Any employee can escalate concerns about business integrity through reports to their line manager, by contacting the Group Ethical Business Conduct team, or by using YourVoice, our confidential whistleblowing programme.
Our Business Integrity Policy prohibits the making of political donations of any kind on behalf of the Company. In 2019, no funds from the Anglo American Foundation, nor from our CSI expenditure, were allocated to political donations.
Addressing bribery riskWe assess bribery risks as part of the ethical risk assessments that we carry out across the Group. Our key bribery risks arise out of the use of intermediaries, and our interactions with government officials, customers, suppliers and communities. When we determine bribery risk to be high, we develop an action plan to strengthen our internal controls and manage the risk. Our Internal Audit team audits these processes and controls on a regular basis, as part of the wider business integrity audits.
WhistleblowingOur internal whistleblowing facility, which includes a telephony service and web-based portal, is operated by a new third-party service provider and was rebranded in 2019 to YourVoice. Our global programme continues to provide a confidential and secure means for our employees, business partners, and other external stakeholders to report concerns about conduct that is contrary to our Values, Purpose and integrity standards.
In 2019, 505 reports or allegations were received, covering a broad spectrum of concerns including human resource issues, such as bullying, harassment (including sexual harassment) and victimisation. A further 248 incidents were also reported that related to external procurement fraud. All reports are confidential and reporters are able to submit their disclosures anonymously. We review, assess and, where necessary, investigate all reports made.
41Anglo American plc Integrated Annual Report 2019

CAPITAL ALLOCATION
A STRONG FOCUS ON CAPITAL DISCIPLINEUnderpinning our strategy, we have a value-focused approach to capital allocation, with clear prioritisation: sustaining capital to maintain asset integrity (including Reserve Life); then the base dividend to our shareholders, determined on a 40% underlying earnings-based payout ratio; while ensuring a strong balance sheet. Based on a balanced approach, discretionary capital is then either allocated to growth investments or upgrades to our portfolio that are subject to a demanding risk framework and that meet our stringent value criteria, or is considered for additional returns to shareholders.
Disciplined capital allocation throughout the cycle is critical to protecting and enhancing returns for our shareholders’ invested capital, given the long term and capital-intensive nature of our business. Our aim is to provide a balanced offering of a strong balance sheet, which reduces risk and creates opportunity for counter-cyclical investment, attractive shareholder returns and value-adding disciplined growth.
During 2019, our focus was on continuing to improve our competitive position, progressing the construction of our Quellaveco copper project in Peru, as well as returning excess cash to shareholders through the $1 billion share buyback programme announced on 25 July 2019. We will continue to allocate the appropriate capital across our portfolio of assets, to both sustain our business and to protect and enhance value.
Balance sheet flexibilityOur capital allocation framework is underpinned by our strong balance sheet, which allows us to deliver on our commitment to base dividends and enables value-accretive discretionary capital allocation through the cycle. Our near term objective is to ensure the Group’s net debt/EBITDA ratio does not exceed 1.5 times, at the bottom of the cycle, without there being a clear plan to recover.
Net debt at 31 December 2019 was $4.6 billion (2018: $2.8 billion), resulting in a net debt/EBITDA ratio of 0.5 times, significantly lower than our target ratio. The $1.8 billion increase in net debt since 31 December 2018 has been driven primarily by a planned increase in total capital expenditure and higher distributions to shareholders, partly offset by stronger EBITDA generated during 2019. In addition, effective from 1 January 2019, and as a result of the transition to IFRS 16 Leases, there
is a requirement to include former operating leases on the balance sheet, adding $0.5 billion to the Group’s net debt.
Group liquidity levels remained conservative, with $6.3 billion of cash (2018: $6.5 billion) and $8.7 billion of undrawn committed facilities (2018: $7.3 billion). On 1 January 2019, a committed shareholder loan facility of $1.8 billion from Mitsubishi Corporation became available to Anglo American Quellaveco S.A. to meet Mitsubishi’s commitment to fund 40% of the remaining capital expenditure on the Quellaveco copper project.
In 2019, the Group issued bonds for a US dollar equivalent value of $1.0 billion. The issuances consisted of a seven-year €500 million bond and a 10-year £300 million bond. The proceeds were used, in part, to pre-fund a $0.4 billion equivalent bond maturity in June 2019. The weighted average maturity on outstanding bonds has reduced slightly to 4.5 years (2018: 5.0 years). In March 2019, Anglo American plc received upgrades from S&P Global Ratings and Moody’s Investors Service to BBB and Baa2 (both with stable outlooks) respectively.
Cash flow after sustaining capitalWe continue to focus on capital discipline and sustaining capital efficiency, while maintaining the operational integrity of all our assets. Sustaining capital comprises stay-in-business, development and stripping, and life-extension expenditure, less the proceeds from disposals of property, plant and equipment. For 2020-2022, we expect sustaining capital expenditure to be within a range of $3.2-$3.5 billion per annum as we invest in attractive life-extension projects, primarily at our diamonds, iron ore and metallurgical coal assets. Our longer term guidance of $2.8-$3.1 billion per annum remains unchanged.
In July 2019, the Board approved the Aquila project to extend the life of the Capcoal underground hard coking coal (HCC) operations in Queensland, Australia by six years to 2028. The project is a brownfield expansion that leverages off existing equipment and infrastructure to deliver a low capital intensity opportunity in prime, high margin HCC resources. With an expected attributable capital cost of $0.2 billion, the first longwall production of premium quality HCC is expected in early 2022.
Commitment to base dividendsOur clear commitment to a sustainable base dividend remains a critical part of the overall capital allocation approach and is demonstrated through our dividend policy of a 40% payout ratio based on underlying earnings, paid each half year.
Our dividend policy provides shareholders with increased cash returns upon improvement in product prices, while retaining balance sheet flexibility during periods of weaker pricing. The Group paid dividends of $0.7 billion in May 2019 (in relation to second half 2018 underlying earnings), and $0.8 billion in September 2019 (in relation to first half 2019 underlying earnings). In line with the policy, the Board proposes a final dividend of 40% of second half underlying earnings, equal to 47 cents per share, bringing the total dividends paid and proposed in respect of 2019 to $1.09 per share.
Discretionary capital optionsStrict and disciplined value criteria are applied to the assessment of future options. We will consider options to upgrade the quality of our portfolio in a measured manner and only where we see value, through inorganic opportunities and asset disposals. Where appropriate, we will seek partners on major greenfield projects at the right time and for value, and are likely to not commit to the full development of more than one such project at any given time.
Discretionary capital options
Portfolio upgrade
Future project options
Additional shareholder returns
Dis
cret
io
nary Cash f ow after
sustaining capital
base dividend
Commitment to
Balance sheet fexibility
capi
tal o
ptions
42 Anglo American plc Integrated Annual Report 2019
STRATEGIC REPORT CAPITAL ALLOCATION

In July 2019, the Board approved an additional return of up to $1 billion to shareholders via an on-market share buyback programme. This additional return recognises the resilience of our balance sheet, and our confidence in funding our portfolio of highly attractive near and medium term growth opportunities. The programme will end no later than 31 March 2020 and had returned $0.8 billion to shareholders by 31 December 2019.
During 2019, the development of the Quellaveco copper project continued to progress to plan. The Group’s share of capital expenditure in 2019 was $0.5 billion after utilising the proceeds from Mitsubishi’s subscription in 2018. We expect our share to increase to between $0.9-$1.0 billion in 2020. In 2019, we also announced the approval by Debmarine Namibia, a 50:50 joint operation between De Beers and the Namibian government, for the construction of a new custom-built diamond recovery vessel. At an expected total capital cost of $0.5 billion ($0.2 billion attributable to Anglo American), this new vessel will become the seventh in the Debmarine fleet. It is expected to begin production in 2022, with the capacity to add 500,000 high value carats of annual production.
We continue to progress studies on organic growth opportunities to improve the existing business. For example, a pre-feasibility study is underway for a debottlenecking and expansion of the Moranbah-Grosvenor coal handling and preparation plant to increase capacity by 4-6 Mtpa, as well as for expansion options for the Mogalakwena PGMs complex, the Collahuasi copper joint operation plant and the Los Bronces Underground project.
In addition, we continue to progress the application of innovative concepts and step-change technologies stemming from our FutureSmart Mining™ programme. The Group is investing $0.1-$0.5 billion per annum of discretionary capital in technology and innovation related initiatives to drive improvements across our existing portfolio of assets. Evaluation expenditure was in line with the prior year at $173 million (2018: $172 million) and expenditure on exploration activities increased by 12% to $126 million (2018: $113 million).
In 2019, our portfolio management strategy remained focused on continuously improving asset quality and our competitive position to ensure that we have a business that delivers sustainable free cash flows and returns to our shareholders. In this regard, in 2019, the Group commenced, or completed, a number of transactions. We entered into a transaction, expected to complete in 2020, to provide for the equalisation of ownership across our integrated metallurgical coal operations at Moranbah North and Grosvenor through the sale of 12% in Grosvenor mine to the minority shareholders in Moranbah North. The Grosvenor mine uses Moranbah North’s coal processing infrastructure, where numerous debottlenecking, expansion and product blending options offer considerable cost, productivity and margin benefits for the integrated operation.
We also completed the two-phased restructuring plan of Atlatsa, which entailed among others, the acquisition of the exploration properties adjacent to Mogalakwena mine.
Namdeb Holdings, a joint operation between the Namibian government and De Beers, announced the sale of Elizabeth Bay in September 2019.
In January 2020, Anglo American announced that an agreement has been reached with the board of Sirius Minerals Plc (‘Sirius’) on the terms of a recommended cash acquisition for the entire issued and to be issued share capital of Sirius. Anglo American identified Sirius’s Woodsmith polyhalite project in North Yorkshire (the ‘Project’) as being of potential interest given the quality of the underlying asset in terms of scale, resource life, operating cost profile and the nature and quality of its product. The Project has the potential to fit well with our established strategy of focusing on world class assets, particularly in the context of Anglo American’s portfolio trajectory towards later-cycle products that support a fast growing global population and a cleaner, greener, more sustainable world. The proposed transaction is subject to regulatory and Sirius shareholder approval.
Anglo American Platinum completed the disposal of its 33% interest in the Bafokeng Rasimone Platinum Mine associate to Royal Bafokeng Resources Proprietary Limited (RBR) in December 2018, for a total consideration of around $150 million, of which approximately $110 million was deferred. The outstanding consideration, including accumulated interest, was settled in full by RBR in January 2020.
Group capital expenditureCapital expenditure increased to $3.8 billion (2018: $2.8 billion), with rigorous capital discipline continuing to underpin the planning and execution of all projects.
Sustaining capital expenditure increased to $3.0 billion (2018: $2.5 billion), driven by increased stripping and development expenditure at Kumba and De Beers and a life-extension investment in Khwezela thermal coal mine in South Africa.
Growth capital expenditure increased to $0.8 billion (2018: $0.3 billion), largely due to expenditure on Quellaveco of $0.5 billion, net of Mitsubishi funding (gross expenditure at Quellaveco was $1.3 billion).
We expect total capital expenditure to increase to between $4.7-$5.2 billion in 2020, and $4.7-$5.5 billion in 2021.
CAPITAL EXPENDITURE◊
$ million 2019 2018
Stay-in-business 1,656 1,617
Development and stripping
976 796
Life-extension projects(1) 358 245
Proceeds from disposal of property, plant and equipment
(8) (162)
Sustaining capital 2,982 2,496
Growth projects(1) 847 340
Total 3,829 2,836
Capitalised operating cash flows
11 (18)
Total capital expenditure
3,840 2,818
(1) Life-extension projects and growth projects are collectively referred to as expansionary capital expenditure.
43Anglo American plc Integrated Annual Report 2019

Byron GroteChairman Audit Committee
MANAGING RISK EFFECTIVELY
Anglo American recognises that risk is inherent in all its business activities. Our risks can have a safety, financial, operational or reputational impact. Volatility in commodity markets provides a good illustration of risk inherent in our business. As understanding our risks and developing appropriate responses are critical to our future success, we are committed to an effective, robust system of risk identification, and an effective response to such risks, in order to support the achievement of our objectives.
How does risk relate to our strategy?Risks can arise from events outside of our control or from operational matters. Each of the risks described on the following pages can have an impact on our ability to deliver our strategy.
For more on the Group’s strategy: See page 14
Viability statement
ContextAn understanding of our business model and strategy is key to the assessment of our prospects. Our strategy is to:
• Secure, develop and operate a portfolio of high quality and long life assets that deliver sustainable shareholder returns
• Implement an innovation-led approach to sustainable mining from exploration to delivering products to customers
• Create an inclusive and diverse working environment to encourage and support a high performance culture and innovative thinking.
Details of our business model and strategy are provided on pages 8-9.
Although, price performance and volatility showed significant variation across the Group’s diversified product portfolio in 2019, the Group’s realised basket price across all commodities was broadly in line with the prior year. The sustainability of product prices remains uncertain, and current geo-political and macro-economic uncertainties are expected to cause continued commodity price volatility. Against that background, the Board maintains a cautious appetite for major new projects and investments – and with the proviso that they are world class orebodies and can demonstrate the clear potential to benefit from competitive cost positions and long reserve lives. Large greenfield projects are likely to be considered for syndication with other investors at the appropriate stage of a project’s development, and for value, as a means of reducing our risk profile and capital requirements.
The assessment process and key assumptionsAssessment of the Group’s prospects is based upon the Group’s strategy, its financial plan and principal risks. The Group’s focus during 2019 has been to drive efficiencies through the operations and upgrade the quality of our portfolio in order to improve cash flow generation, strengthen the balance sheet and create sustainable value through disciplined allocation of capital.
A financial forecast covering the next three years is prepared based on the context of the strategic plan and is reviewed on a regular basis to reflect changes in circumstances. The financial forecast is based on a number of key assumptions, the most important of which include product prices, exchange rates, estimates of production, production costs and future capital expenditure. In addition, the forecast does not assume the renewal of existing debt or the raising of new debt. A key component of the financial forecast and strategic plan is the life of mine plans created for each operation, providing expected annual production volumes over the anticipated economic life of mine.
The principal risks are those that we believe could prevent the Group from delivering its strategic objectives. A number of these risks are deemed catastrophic to the Group’s prospects, including the impacts of a tailings dam failure, fire and slope wall failure risks, and have been considered as part of the Group’s viability.
Assessment of viability The assessment of viability has been made with reference to the Group’s current position and expected performance over a three-year period, using budgeted product prices and
Anglo American’s assessment of strategic, operational, project and sustainable development related risks
1. Identifying risks A robust methodology is used to identify key risks across the Group – at business units, operations and projects. This is being applied consistently through ongoing implementation of a Group integrated risk management framework and associated guidelines.
2. Analysing risks and controls to manage identified risks Once identified, the process will evaluate identified risks to establish root causes, financial and non-financial impacts, and likelihood of occurrence. Consideration of risk treatments is taken into account to enable the creation of a prioritised register and in determining which of the risks should be considered as a principal risk.
3. Determining management actions requiredThe effectiveness and adequacy of controls are assessed. If additional controls are required, these will be identified and responsibilities assigned. Identification of controls associated with key risks is an important input into assurance planning.
4. Reporting and monitoringManagement is responsible for monitoring progress of actions to mitigate key risks and to determine if any such risk falls outside the limits of our risk appetite. In doing so, it is supported through the Group’s internal audit programme, which evaluates the design and effectiveness of controls. The risk management process is continuous; key risks are reported to the Audit Committee, with sustainability risks also being reported to the Sustainability Committee.
14
3 2
44 Anglo American plc Integrated Annual Report 2019
STRATEGIC REPORT MANAGING RISK EFFECTIVELY

expected foreign exchange rates. Financial performance and cash flows have then been subjected to stress and sensitivity analysis over the three-year period using a range of severe, but plausible scenarios.
Scenarios were selected for stress testing based upon an assessment of the Group’s principal risks, and each include a risk deemed catastrophic to the Group. The scenarios tested include:
• Product price reductions of up to 20% from budget prices over three years, with no offsetting foreign exchange rate improvement
• Operational incidents that have a significant impact on production at key sites in the Group
• The impact of a cyber attack upon the Group’s key information technology systems
• Technology developments affecting demand for diamonds
• Technology developments in the automobile industry affecting demand for PGMs
• Failure to achieve targeted operational performance improvements.
The Group’s liquidity (defined as cash and undrawn committed facilities) was $15 billion at 31 December 2019. This is sufficient to absorb the financial impact of each of the risks modelled in the stress and sensitivity analysis. However, if these scenarios were to materialise, the Group also has a range of additional options that enable us to maintain our financial strength, including reduction in capital expenditure, the sale of assets, raising debt or reducing the dividend.
Viability statementThe directors confirm they have a reasonable expectation that the Group will continue in operation and meet its liabilities as they fall due for the next three years. This period has been selected for the following reasons:
• The Group’s strategy and budgeting process are aligned with a three-year view
• The volatility in commodity markets in recent years makes confidence in a longer assessment of prospects highly challenging.
Emerging risksWe define an emerging risk as a risk that may become a principal risk in time but is not expected to materialise in the next five years.
Emerging risks that are currently being monitored are:
• Long term demand for minerals mined by Anglo American may change (positively or negatively) as a result of societal demands for climate change abatement and the growth of the circular economy
• Failure to replace Ore Reserve depletion in key business units through exploration, projects or acquisitions
• Liabilities incurred as a result of environmental impairments
• Failure to deliver the Sustainable Mining Plan could cause reputational damage, threaten the organisation’s licence to operate, impact future growth, and may also result in increased costs and a negative effect on the Group’s financial results
• Unexpected mine-closure liabilities that have the potential to increase costs.
The above risks are closely monitored and actively managed to minimise their threat.
Principal risksWe define a principal risk as a risk or combination of risks that would threaten the business model, future performance, solvency or liquidity of Anglo American. In addition to these principal risks, we continue to be exposed to other risks related to currency, inflation, community relations, environment, litigation and regulatory proceedings, changing social expectations, infrastructure and human resources. These risks are subject to our normal procedures to identify, implement and oversee appropriate mitigation actions, supported by internal audit work to provide assurance over the status of controls or mitigating actions. These principal risks are considered over the next three years as a minimum, but we recognise that many of them will be relevant for a longer period.
For more on principal risks: See pages 46-49
Catastrophic risksWe also face certain risks that we deem catastrophic risks. These are very high severity, very low likelihood events that could result in multiple fatalities or injuries, an unplanned fundamental change to strategy or the way we operate and have significant financial consequences. We do not consider likelihood when assessing these risks, as the potential impacts mean these risks must be treated as a priority. Catastrophic risks are included as principal risks.
For more on catastrophic risks: See page 46
Risk appetiteWe define risk appetite as ‘the nature and extent of risk Anglo American is willing to accept in relation to the pursuit of its objectives’. We look at risk appetite from the context of severity of the consequences should the risk materialise, any relevant internal or external factors influencing the risk, and the status of management actions to mitigate or control the risk. A scale is used to help determine the limit of appetite for each risk, recognising that risk appetite will change over time.
If a risk exceeds appetite, it will threaten the achievement of objectives and may require a change to strategy. Risks that are approaching the limit of the Group’s risk appetite may require management actions to be accelerated or enhanced to ensure the risks remain within appetite levels.
For catastrophic and operational risks, our risk appetite for exceptions or deficiencies in the status of our controls that have safety implications is very low. Our internal audit programme evaluates these controls with technical experts at operations and the results of that audit work will determine the risk appetite evaluation, along with the management response to any issues identified.
For more on the risk management and internal control systems and the review of their effectiveness: See pages 108-109
SummaryOur risk profile changed in 2019, mainly influenced by an evolving external environment in areas such as climate change, macro-economics, geo-political stability, stakeholder expectations, cyber threats and social unrest. We have updated our risk profile to include one new principal risk, escalating environmental, social and governance (ESG) requirements of investors and other stakeholders, based on a revised assessment. Our catastrophic risks are the highest priority risks, given the potential consequences.
45Anglo American plc Integrated Annual Report 2019

PRINCIPAL RISKS
1. Catastrophic risks
We are exposed to the following risks we deem as potentially catastrophic: tailings dam failure; slope wall failure; mineshaft failure; and fire and explosion.
Root cause: Any of these risks may result from inadequate design or construction, adverse geological conditions, shortcomings in operational performance, natural events such as seismic activity or flooding, and failure of structures or machinery and equipment.
Impact: Multiple fatalities and injuries, damage to assets, environmental damage, production loss, reputational damage and loss of licence to operate. Financial costs associated with recovery and liability claims may be significant. Regulatory issues may result and community relations may be affected.
Mitigation: Technical standards exist that provide minimum criteria for design and operational performance requirements, the implementation of which is regularly inspected by technical experts. Additional assurance work is conducted to assess the adequacy of controls associated with these risks.
Risk movement: No change.
Risk appetite: Tailings dam failure, mineshaft failure and slope and underground excavation failure risks are operating within the limits of our appetite. Fire and explosion risks are currently operating outside of our risk appetite, but actions are in progress and/or awaiting independent verification to bring these risks back within our risk appetite.
Commentary: These very high impact but very low frequency risks are treated with the highest priority.
Pillars of value:
3. Safety
Failure to eliminate fatalities.
Root cause: Inability to eliminate fatalities will result from management interventions and training initiatives failing to translate into behavioural change by all employees and contractors. Non-compliance with critical controls is a common failure in safety incidents.
Impact: Loss of life, workplace injuries and safety-related stoppages all immediately affect production, while, over the longer term, such factors are also a threat to our licence to operate.
Mitigation: All operations continue to implement safety improvement plans, with a focus on: effective management of critical controls required to manage significant safety risks; learning from high potential incidents and hazards; embedding a safety culture; and leadership engagement and accountability. An elimination of fatalities taskforce is assessing safety risks at all operations to establish further actions necessary to improve safety performance.
Risk movement: No change.
Risk appetite: Operating within the limits of our appetite.
Commentary: During 2019, there were four work-related fatalities in our managed operations, compared with five in 2018. This is still an unacceptable level. Management remains committed to the elimination of fatalities.
Pillars of value:
2. Product prices
Global macro-economic conditions leading to sustained low product prices and/or volatility.
Root cause: The most significant factors contributing to this risk at present are a continued slowdown in growth in China and other emerging markets, low growth rates in developed economies and an oversupply of commodities into the market. Other factors such as weak regional economies, fiscal crises and conflict can also influence the economic environment and contribute to weak product prices.
Impact: Low product prices can result in lower levels of cash flow, profitability and valuation. Debt costs may rise owing to ratings agency downgrades and the possibility of restricted access to funding. The Group may be unable to complete any divestment programme within the desired timescales or achieve expected values. The capacity to invest in growth projects is constrained during periods of low product prices – which may, in turn, affect future performance.
Mitigation: The successful delivery of cash improvement and operational performance targets remains the key mitigation strategy for this risk. Regular updates of economic analysis and product price assumptions are discussed with executive management and the Board.
Risk movement: Increased since 2018.
Risk appetite: Operating within the limits of our appetite.
Commentary: We believe macro-economic uncertainty has increased, primarily as a result of tensions between the US and China. This may result in price volatility in the products mined, and marketed, by Anglo American.
Pillars of value:
46 Anglo American plc Integrated Annual Report 2019
STRATEGIC REPORT MANAGING RISK EFFECTIVELY

Pillars of value:
Safety and health
Environment
Socio-political
People
Production
Cost
Financial
4. Political and regulatory
Uncertainty and adverse changes to mining industry regulation, legislation or tax rates can occur in any country in which we operate.
Root cause: The Group has no control over political acts, actions of regulators, or changes in local tax rates. Our licence to operate through mining rights is dependent on a number of factors, including compliance with regulations.
Impact: Uncertainty over future business conditions leads to a lack of confidence in making investment decisions, which can influence future financial performance. Increased costs can be incurred through additional regulations or resource taxes, while the ability to execute strategic initiatives that reduce costs or divest assets may also be restricted, all of which may reduce profitability and affect future performance. Political instability can also result in civil unrest and nullification or non-renewal of existing agreements, mining permits, sales agreements or leases. These may adversely affect the Group’s operations or performance of those operations.
Mitigation: Anglo American has an active engagement strategy with governments, regulators and other stakeholders within the countries in which we operate, or plan to operate, as well as at an international level. We assess portfolio capital investments against political risks and avoid or minimise exposure to jurisdictions with unacceptable risk levels. We actively monitor regulatory and political developments at a national level, as well as global themes and international policy trends, on a continuous basis. See pages 10-11 for more detail on how we engage with our key stakeholders.
Risk movement: No change.
Risk appetite: Operating within the limits of our appetite.
Commentary: Global economic conditions can have a significant impact on countries whose economies are exposed to commodities, placing greater pressure on governments to find alternative means of raising revenues, and increasing the risk of social and labour unrest. These factors could increase the political risks faced by the Group.
Pillars of value:
5. Corruption
Bribery or other forms of corruption committed by an employee or agent of Anglo American.
Root cause: Anglo American has operations in some countries where there is a relatively high risk of corruption.
Impact: Potential criminal investigations, adverse media attention and reputational damage. A possible negative impact on licensing processes and valuation.
Mitigation: A comprehensive anti-bribery and corruption policy and programme, including risk assessment, training and awareness, with active monitoring, is in place.
Risk movement: No change.
Risk appetite: Operating within the limits of our appetite.
Commentary: Our anti-bribery programme was strengthened in 2019 as we implemented recommendations from an external review conducted in 2018.
Pillars of value:
6. Cyber security
Loss or harm to our technical infrastructure and the use of technology within the organisation from malicious or unintentional sources.
Root cause: The number and sophistication of cyber-criminal attacks are increasing.
Impact: Theft or loss of intellectual property, financial losses, increased costs and damage to reputation.
Mitigation: We have employed a specialist third party to oversee our network security. We have achieved UK Cyber Essentials Certification and an ongoing cyber awareness programme is in place across the Group.
Risk movement: Increased since 2018.
Risk appetite: Operating within the limits of our appetite.
Commentary: Cyber security risk was re-assessed and was deemed to have increased in 2019, owing to the greater sophistication of attempted cyber attacks. While our control environment continued to strengthen, and no attack was successful on Anglo American’s network, other organisations have been targeted, resulting in significant interruption to their normal business operations.
Pillars of value:
47Anglo American plc Integrated Annual Report 2019

8. Operational performance
Unplanned operational stoppages impacting production.
Root cause: Unplanned and unexpected operational issues will affect delivery of the underlying EBITDA target. Failure to implement the Operating Model, manage cost inflation or maintain critical plant, machinery and infrastructure, will affect our performance levels. We are also exposed to risks of interruptions of power supply and the failure of third-party-owned and -operated infrastructure, e.g. rail networks and ports. Our operations may also be exposed to natural catastrophes or extreme weather.
Impact: Inability to achieve production, cash flow or profitability targets. There are potential safety-related matters associated with unplanned operational stoppages, along with a loss of investor confidence.
Mitigation: Implementation of our Operating Model, supported by operational risk management and assurance processes, is the key mitigation against this risk. Compliance with our technical standards will prevent certain operational risks occurring. Regular tracking and monitoring of progress against the underlying EBITDA targets is undertaken.
Risk movement: No change.
Risk appetite: Operating within the limits of our appetite.
Commentary: During 2019, there were no unplanned operational stoppages that had a material impact on production.
Pillars of value:
9. Water
Inability to obtain or sustain the level of water security needed to support operations over the current life of mine plan or future growth options.
Root cause: Poor water resource management or inadequate onsite storage, combined with reduced water supply at some operations as weather patterns change, can affect production. Water is a shared resource with local communities and permits to use water in our operations are at risk if we do not manage the resource in a sustainable manner.
Impact: Loss of production and inability to achieve cash flow or volume improvement targets. Damage to stakeholder relationships or reputational damage can result from failure to manage this critical resource.
Mitigation: Various projects have been implemented at operations most exposed to this risk, focused on: water efficiency; water security; water treatment; and discharge management; as well as alternative supplies. New technologies are being developed that will reduce water demand.
Risk movement: No change.
Risk appetite: Operating within the limits of our appetite.
Commentary: This continues to be a risk to the majority of our operations.
Pillars of value:
7. Future demand for diamonds
Demand for diamonds affected as production and marketing of synthetics increases.
Root cause: Technological developments have led to the production of higher quality gem synthetics. Producers and distributors of this material may attempt to sell fraudulently into the diamond pipeline (undisclosed) or market and sell as gem synthetics (disclosed), with manufacturing and distribution sources for the latter increasing.
Impact: Potential loss of rough diamond sales, leading to a negative impact on revenue, cash flow, profitability and value.
Mitigation: While research underlines consumers’ continued desire for natural diamonds owing to their inherent value, emotional connection and rarity, De Beers has a comprehensive strategy to mitigate the risk of both the entry of undisclosed synthetics into the pipeline and the potentially misleading marketing of disclosed synthetics.
In addition, measures to emphasise, protect and enhance the inherent value of natural diamonds include: increased marketing investment, including through the Diamond Producers Association, e.g. reasserting the emotional symbolism of diamonds through the Real is Rare campaign; investment in blockchain to give consumers confidence as to the natural provenance of a diamond; investment in bespoke technology to readily detect all synthetics; and the launch of Lightbox™ to reinforce with consumers the inherent difference between synthetic and natural diamonds.
Risk movement: No change.
Risk appetite: Operating within the limits of our appetite.
Commentary: We believe that production of, and demand for, disclosed gem synthetics over the natural business has increased owing to the factors described; however, De Beers’ mitigation strategies have matured over 2019 to enable us to respond to this development.
Pillars of value:
48 Anglo American plc Integrated Annual Report 2019
STRATEGIC REPORT MANAGING RISK EFFECTIVELY
PRINCIPAL RISKS CONTINUED

11. Evolving stakeholder requirements and expectations
Failure to align the business with evolving stakeholder expectations regarding ESG matters, particularly linked to climate change, fossil fuels and carbon emissions, may result in a reduced valuation of the company and/or failure to be viewed as a trusted corporate leader.
Root cause: Stakeholder requirements and expectations continue to evolve, and different stakeholder groups can have opposing requirements and expectations of us. For example, an increasing number of financial stakeholders are adopting stricter investment criteria with regards to fossil fuels and carbon emissions. This is having a growing impact on industries that are major producers, and users, of fossil fuels and which are major emitters of CO2 and other greenhouse gases. Yet such industries, particularly in poor and developing countries, are often a significant development player, helping to fast-track such countries’ economic progress, providing employment, along with valuable earnings and foreign exchange.
Impact: Potential loss of stakeholder confidence leading to negative impact on value, cash flow and profitability.
Mitigation: We have articulated our climate change plans, policies and progress and engage with key stakeholders to ensure they understand them. Our Sustainable Mining Plan includes operation-specific and Group targets for the reduction in carbon emissions, power and water usage. For more information on our climate change policy, see page 33, and for further information on how we engage with key stakeholders, see pages 10-11.
Risk movement: A new principal risk.
Risk appetite: Operating within the limits of our appetite.
Commentary: This is a new principal risk in 2019.
Pillars of value:
Pillars of value:
Safety and health
Environment
Socio-political
People
Production
Cost
Financial
10. Future demand for PGMs
Longer term demand for PGMs is affected by fundamental shifts in market forces.
Root cause: Longer term demand is at risk from declining internal combustion engine manufacturing, and a switch to battery operated vehicles instead of fuel cell electric vehicles, which continue to use higher volumes of PGMs.
Impact: A negative impact on revenue, cash flow, profitability and valuation.
Mitigation: Our PGMs business has a strategy to grow PGM demand in industrial and jewellery sectors through marketing and investment initiatives in research, product development and market development opportunities, particularly in the automotive sector and in Indian and Chinese jewellery markets.
Risk movement: No change.
Risk appetite: Operating within the limits of our appetite.
Commentary: We see this as a longer term threat to the business
Pillars of value:
49Anglo American plc Integrated Annual Report 2019

Pillar of Value Strategic Element Key Performance Indicators (KPIs) ER Target 2015 2016 2017 2018 2019
Safety and health
Innovation
People
Work-related fatal injuries(1) ER Zero Number of work-related fatal injuries 6 11 9 5 4
Total recordable case frequency rate (TRCFR)(1) ER Year-on-year reduction TRCFR 4.66 3.55 3.17 2.66 2.21
New cases of occupational disease (NCOD)(1) Year-on-year reduction NCOD 159 111 96 101 39
HIV/AIDS treatment ER 90% known status, 90% of HIV-positive employees enrolled in HIV disease management programme
% of employees in southern Africa who know their HIV status and % of employees in southern Africa who are HIV-positive and enrolled in HIV disease management programmes
68:72 88:68 83:84 88:86 94:92
Environment
Innovation Energy consumption(1) 8% saving by 2020 Measured in million gigajoules (GJ) 106 106 97 84 87
Greenhouse gas (GHG) emissions(1) ER 22% saving by 2020 Measured in million tonnes of CO2 equivalent emissions 18.3 17.9 18.0 16.0 17.7
Total water withdrawals(1) 20% saving by 2020 Measured in million m3 339 296 306 227 209
Level 4-5 environmental incidents(1)(2) ER Zero Number of Level 4-5 environmental incidents 0 0 0 1 0
Socio-political
Innovation The Social Way assessment scores(1)(3) Eliminate non-compliance Serious non-compliance (%) 1 0 1 0 0
Moderate non-compliance (%) 33 16 11 9 4
Compliant (%) 46 51 56 36 34
Good practice (%) 16 26 24 40 46
Best practice (%) 4 7 8 15 16
People
People Voluntary labour turnover Voluntary turnover expressed as % of total permanent employees 1.9 2.2 2.3 2.4 2.3
Gender diversity Women as a percentage of senior management (%) n/a 15 18 21 24
Women as a percentage of total workforce (%) 18 18 19 20 21
South Africa transformation HDSA as a percentage of management (%) 60 62 66 65 65
Production
Portfolio
Innovation
Production volumesCopper equivalent production 2019 vs 2018: +1%
De Beers – million carats 28.7 27.3 33.5 35.3 30.8
Copper – thousand tonnes(4) 709 577 579 668 638
Platinum – thousand ounces(5) 2,337 2,382 2,397 2,021 2,051
Palladium – thousand ounces(5) 1,480 1,539 1,557 1,379 1,386
Iron ore (Kumba) – million tonnes 44.9 41.5 45.0 43.1 42.4
Iron ore (Minas-Rio) – million tonnes (wet basis) 9.2 16.1 16.8 3.4 23.1
Metallurgical coal (Export coking and PCI) – million tonnes 21.2 20.9 19.7 21.8 22.9
Thermal coal (Export) – million tonnes 29.3 29.7 29.2 28.6 26.4
Cost
Portfolio
Innovation
Unit cost of productionCopper equivalent unit cost 2019 vs 2018: (6)% in $ terms
De Beers – $/carat 83 67 63 60 63
Copper – C1 unit cost, c/lb 154 137 147 134 126
Platinum – $/ounce 1,508 1,330 1,443 1,561 1,543
Kumba – $/tonne 31 27 31 32 33
Iron Ore Brazil – $/tonne (wet basis) 60 28 30 n/a 21
Metallurgical Coal – $/tonne 55 51 61 64 63
Thermal Coal – South Africa – $/tonne 39 34 44 44 45
Financial
Portfolio
Innovation
Attributable return on capital employed (ROCE)◊ ER Group attributable ROCE◊ (%) 5 11 19 19 19
Underlying earnings per share (EPS)◊ ER Group underlying EPS◊ ($) 0.64 1.72 2.57 2.55 2.75
Attributable free cash fow◊ ER Group attributable free cash flow◊ ($ million) (982) 2,562 4,943 3,157 2,324
(1) Data relates to subsidiaries and joint operations over which Anglo American has management control. In 2019 and 2018, data excludes De Beers’ joint operations in Namibia and Botswana. Prior years’ data includes De Beers’ joint operations in Namibia and Botswana.
(2) The KPI has been changed to ‘Level 4-5 environmental incidents’ to reflect the data included in the chief executive’s quarterly performance scorecard.
(3) The 2016 and 2017 Social Way data does not include operations that were divested, closed, or for which sale agreements were concluded during the period. Sites targeted for divestment were granted exemptions on selected requirements; these requirements were not assessed during 2017.
(4) Includes production from AA Norte until the date of disposal (October 2015).
KEY PERFORMANCE INDICATORS
50 Anglo American plc Integrated Annual Report 2019
STRATEGIC REPORT KEY PERFORMANCE INDICATORS

Pillar of Value Strategic Element Key Performance Indicators (KPIs) ER Target 2015 2016 2017 2018 2019
Safety and health
Innovation
People
Work-related fatal injuries(1) ER Zero Number of work-related fatal injuries 6 11 9 5 4
Total recordable case frequency rate (TRCFR)(1) ER Year-on-year reduction TRCFR 4.66 3.55 3.17 2.66 2.21
New cases of occupational disease (NCOD)(1) Year-on-year reduction NCOD 159 111 96 101 39
HIV/AIDS treatment ER 90% known status, 90% of HIV-positive employees enrolled in HIV disease management programme
% of employees in southern Africa who know their HIV status and % of employees in southern Africa who are HIV-positive and enrolled in HIV disease management programmes
68:72 88:68 83:84 88:86 94:92
Environment
Innovation Energy consumption(1) 8% saving by 2020 Measured in million gigajoules (GJ) 106 106 97 84 87
Greenhouse gas (GHG) emissions(1) ER 22% saving by 2020 Measured in million tonnes of CO2 equivalent emissions 18.3 17.9 18.0 16.0 17.7
Total water withdrawals(1) 20% saving by 2020 Measured in million m3 339 296 306 227 209
Level 4-5 environmental incidents(1)(2) ER Zero Number of Level 4-5 environmental incidents 0 0 0 1 0
Socio-political
Innovation The Social Way assessment scores(1)(3) Eliminate non-compliance Serious non-compliance (%) 1 0 1 0 0
Moderate non-compliance (%) 33 16 11 9 4
Compliant (%) 46 51 56 36 34
Good practice (%) 16 26 24 40 46
Best practice (%) 4 7 8 15 16
People
People Voluntary labour turnover Voluntary turnover expressed as % of total permanent employees 1.9 2.2 2.3 2.4 2.3
Gender diversity Women as a percentage of senior management (%) n/a 15 18 21 24
Women as a percentage of total workforce (%) 18 18 19 20 21
South Africa transformation HDSA as a percentage of management (%) 60 62 66 65 65
Production
Portfolio
Innovation
Production volumesCopper equivalent production 2019 vs 2018: +1%
De Beers – million carats 28.7 27.3 33.5 35.3 30.8
Copper – thousand tonnes(4) 709 577 579 668 638
Platinum – thousand ounces(5) 2,337 2,382 2,397 2,021 2,051
Palladium – thousand ounces(5) 1,480 1,539 1,557 1,379 1,386
Iron ore (Kumba) – million tonnes 44.9 41.5 45.0 43.1 42.4
Iron ore (Minas-Rio) – million tonnes (wet basis) 9.2 16.1 16.8 3.4 23.1
Metallurgical coal (Export coking and PCI) – million tonnes 21.2 20.9 19.7 21.8 22.9
Thermal coal (Export) – million tonnes 29.3 29.7 29.2 28.6 26.4
Cost
Portfolio
Innovation
Unit cost of productionCopper equivalent unit cost 2019 vs 2018: (6)% in $ terms
De Beers – $/carat 83 67 63 60 63
Copper – C1 unit cost, c/lb 154 137 147 134 126
Platinum – $/ounce 1,508 1,330 1,443 1,561 1,543
Kumba – $/tonne 31 27 31 32 33
Iron Ore Brazil – $/tonne (wet basis) 60 28 30 n/a 21
Metallurgical Coal – $/tonne 55 51 61 64 63
Thermal Coal – South Africa – $/tonne 39 34 44 44 45
Financial
Portfolio
Innovation
Attributable return on capital employed (ROCE)◊ ER Group attributable ROCE◊ (%) 5 11 19 19 19
Underlying earnings per share (EPS)◊ ER Group underlying EPS◊ ($) 0.64 1.72 2.57 2.55 2.75
Attributable free cash fow◊ ER Group attributable free cash flow◊ ($ million) (982) 2,562 4,943 3,157 2,324
(5) In 2019, production reflects own-mined production and purchase of metal in concentrate. Production in 2018 has been restated to exclude purchase of concentrate volumes now treated under tolling arrangement. No other years have been restated.
For full description and calculation methodology: see pages 226-227
ER Executive Remuneration KPIs with this symbol are linked to Executive Remuneration; for more information, see the Remuneration report on pages 110-138.
51Anglo American plc Integrated Annual Report 2019

Anglo American’s profit attributable to equity shareholders was in line with the prior year at $3.5 billion (2018: $3.5 billion). Underlying earnings were $3.5 billion (2018: $3.2 billion), while operating profit was $6.2 billion (2018: $6.1 billion).
Production increased by 1% on a copper equivalent basis, driven by increases at Metallurgical Coal and Minas-Rio (iron ore), which restarted operations in December 2018. These increases were partly offset by a combination of lower production at Los Bronces (copper) owing to restricted water availability due to drought conditions and De Beers (diamonds), where production was reduced in line with demand. Production was also affected by the impact of Eskom power outages on some of our South African operations.
De Beers’ rough diamond production decreased by 13% to 30.8 million carats (2018: 35.3 million carats), primarily driven by a reduction in South Africa as Venetia transitions from open pit to underground and in response to demand.
Copper production decreased by 5% to 638,000 tonnes (2018: 668,300 tonnes), with higher planned grades at Los Bronces offset by production losses owing to lower water availability due to drought conditions. Attributable production from Collahuasi increased by 1% to 248,800 tonnes (2018: 246,000 tonnes), despite planned lower grades, owing to a solid plant performance.
At our PGMs business, total platinum and palladium production (metal in concentrate) increased by 1% to 2,050,600 ounces (2018: 2,020,500 ounces), and 1,385,900 ounces (2018: 1,379,000 ounces) respectively.
GROUP FINANCIAL REVIEW
The increase in production was primarily due to higher grades and throughput at Mogalakwena and the continued ramp-up of the Dishaba Lower section at Amandelbult, partially offset by Eskom power disruptions.
At Kumba, iron ore production decreased by 2% to 42.4 Mt (2018: 43.1 Mt), mainly due to the infrastructure upgrade of Kolomela’s dense media separation (DMS) plant, with improved plant performance at Sishen in the second half of the year compensating for operational challenges earlier in the year.
Following the restart of operations at Minas-Rio in December 2018, iron ore production for the year was 23.1 Mt (2018: 3.4 Mt), reflecting the optimisation work undertaken while operations were suspended, the benefit from P101 productivity initiatives and access to the Step 3 mining area higher grade ore.
Metallurgical coal production increased by 5% to 22.9 Mt (2018: 21.8 Mt), driven by a 1.0 Mt increase at Grosvenor and a strong performance at Dawson, which offset the impact of an extended longwall move at Moranbah.
At Thermal Coal, total export production decreased by 8% to 26.4 Mt (2018: 28.6 Mt), while Nickel’s production increased by 1% to 42,600 tonnes (2018: 42,300 tonnes) and manganese ore production decreased by 3% to 3.5 Mt (2018: 3.6 Mt).
Group copper equivalent unit costs were 6% lower in US dollar terms, largely due to favourable exchange rates and the benefit of the strong performance at Minas-Rio, partially offset by lower production at De Beers and Kumba.
Financial performance
FINANCIAL PERFORMANCE2019 2018
Underlying EBITDA◊ ($ billion) 10.0 9.2
Operating profit ($ billion) 6.2 6.1
Underlying earnings◊ ($ billion) 3.5 3.2
Profit attributable to equity shareholders of the Company ($ billion) 3.5 3.5
Underlying earnings per share◊($) 2.75 2.55
Earnings per share ($) 2.81 2.80
Dividend per share ($) 1.09 1.00
Group attributable ROCE◊ 19% 19%
Underlying EBITDA◊
Group underlying EBITDA increased by 9% to $10.0 billion (2018: $9.2 billion). The Group Mining EBITDA margin◊ was in line with the prior year at 42%, reflecting the strong performance at Minas-Rio, offset by diamond midstream weakness. A reconciliation of ‘Profit before net finance costs and tax’, the closest equivalent IFRS measure to underlying EBITDA, is provided within note 2 to the Consolidated financial statements.
UNDERLYING EBITDA◊ BY SEGMENT$ million 2019 2018
De Beers 558 1,245
Copper 1,618 1,856
PGMs 2,000 1,062
Iron Ore 3,407 1,177
Coal 1,832 3,196
Nickel and Manganese 634 844
Corporate and other (43) (219)
Total 10,006 9,161
The reconciliation of underlying EBITDA from $9.2 billion in the year ended 31 December 2018, to $10.0 billion in the year ended 31 December 2019, shows the controllable factors (e.g. cost and volume), as well as those outside of management control (e.g. price, foreign exchange and inflation), that drive the Group’s performance.
UNDERLYING EBITDA◊ RECONCILIATION 2018–2019
$ billion
8
10
9
11
Price
0.4
Minas-Rio
0.6
Other
(0.1)
2019
10.0
2018
9.2
Diamond midstream weakness
(0.5)
Forex
0.8
Inflation
(0.5)
Net cost and volume
0.1
52 Anglo American plc Integrated Annual Report 2019
STRATEGIC REPORT GROUP FINANCIAL REVIEW

OtherThe $0.1 billion decrease in underlying EBITDA was driven by lower volumes in response to weaker demand at the Group’s associate, Cerrejón, as well as Voorspoed and Victor mines (De Beers) ceasing operations. Also included are charges to the income statement in respect of environmental restoration provisions. These were broadly consistent with 2018 at $0.2 billion, and primarily relate to increases at Copper and De Beers.
Underlying earnings◊
Profit for the financial year increased by 5% to $4.6 billion (2018: $4.4 billion). Group underlying earnings increased to $3.5 billion (2018: $3.2 billion), owing to a 9% increase in underlying EBITDA, offset by an increase in the profit attributable to non-controlling interests.
RECONCILIATION FROM UNDERLYING EBITDA◊ TO UNDERLYING EARNINGS◊
$ million 2019 2018
Underlying EBITDA◊ 10,006 9,161
Depreciation and amortisation (2,996) (2,784)
Net finance costs and income tax expense (2,469) (2,265)
Non-controlling interests (1,073) (875)
Underlying earnings◊ 3,468 3,237
Depreciation and amortisationDepreciation and amortisation increased by 8% to $3.0 billion (2018: $2.8 billion), owing to the impact of higher production at Minas-Rio and underground development at Metallurgical Coal, as well as the implementation of IFRS 16 Leases.
Net finance costs and income tax expenseNet finance costs, before special items and remeasurements, were $0.4 billion (2018: $0.4 billion).
The underlying effective tax rate was 30.8% (2018: 31.3%). The effective tax rate in 2019 was impacted by the relative levels of profits arising in the Group’s operating jurisdictions. In future periods, it is expected that the underlying effective tax rate will remain above the UK statutory tax rate. The tax charge for the year, before special items and remeasurements, was $1.8 billion (2018: $1.5 billion).
Non-controlling interestsThe share of underlying earnings attributable to non-controlling interests of $1.1 billion (2018: $0.9 billion) principally relates to minority shareholdings in Kumba, PGMs and Copper.
PriceAverage market prices for the Group’s basket of commodities and products increased by 1%, contributing $0.4 billion of improvement to underlying EBITDA. The average realised FOB iron ore price for Kumba’s iron ore increased by 35%, outperforming the market index owing to its higher iron content and relatively high proportion of lump ore. The price achieved for the PGMs basket increased by 27%, largely due to palladium and rhodium, which recorded increases of 48% and 73% respectively. The positive impact was partly offset by decreases in the realised prices for export thermal coal (30%), metallurgical coal (12%), and copper (4%).
Diamond midstream weaknessIn 2019, overall demand for rough diamonds was lower owing to challenges in the midstream, as a result of closure of some US ‘bricks and mortar’ retail outlets and an increase in online purchasing. The negative price and volume impact in the year was $0.5 billion, compared with 2018.
Foreign exchangeThe positive foreign exchange impact on underlying EBITDA of $0.8 billion was largely due to the weaker South African rand, Australian dollar and Brazilian real.
InflationThe Group’s weighted average CPI for the year was 3%, compared with 4% in 2018. This was principally influenced by a decrease in inflation in South Africa. The impact of inflation on costs reduced underlying EBITDA by $0.5 billion.
Net cost and volumeUnderlying cost and volume benefits were $0.4 billion. These were offset, however, by external headwinds, including the drought in Chile restricting copper production, lower sales at Kumba owing to lower domestic sales and logistics challenges, and the impact of Eskom power outages on production at PGMs. The cost and volume benefit, net of these headwinds, was $0.1 billion.
The underlying $0.4 billion cost and volume benefits were driven by a strong performance at Minas-Rio, with production significantly outperforming 2017 levels, and significant cost saving initiatives at Copper. This was partly offset by expected lower production volumes at De Beers, as Venetia transitions from open pit to underground.
Minas-RioThe increase of $0.6 billion in the Group’s underlying EBITDA reflects the recovery to 2017 performance levels from the impact of the suspension of operations at Minas-Rio for nine months in 2018.
Special items and remeasurementsSpecial items and remeasurements are a net gain of $0.1 billion (2018: net gain of $0.3 billion) and include impairment reversals of $1.0 billion at Minas-Rio (Iron Ore), offset by impairments of $0.3 billion at Cerrejón (Coal) and $0.6 billion at the export thermal coal mines in South Africa. The balance remaining principally relates to operating remeasurements and contract termination costs.
Full details of the special items and remeasurements recorded are included in note 8 to the Consolidated financial statements.
53Anglo American plc Integrated Annual Report 2019

NET DEBT◊
$ million 2019 2018
Opening net debt◊ at 1 January (2,848) (4,501)Underlying EBITDA◊ from subsidiaries and joint operations 9,139 7,827Working capital movements (50) (30)Other cash flows from operations 171 (15)Cash fows from operations 9,260 7,782Capital expenditure◊ (3,840) (2,818)Capital repayments of lease obligations (272) –Cash tax paid (2,116) (1,393)Dividends from associates, joint ventures and financial asset investments 520 738Net interest(1) (334) (315)Dividends paid to non-controlling interests (894) (837)Attributable free cash fow◊ 2,324 3,157Dividends to Anglo American plc shareholders (1,422) (1,291)Disposals 24 193Foreign exchange and fair value movements (34) (248)Other net debt movements(2) (2,670) (158)Total movement in net debt◊(3) (1,778) 1,653Closing net debt◊ at 31 December (4,626) (2,848)
(1) Includes cash outflows of $124 million (2018: outflows of $41 million), relating to interest payments on derivatives hedging net debt, which are included in cash flows from derivatives related to financing activities.
(2) Includes the IFRS 16 Leases transition adjustment of $469 million; capital expenditure on the Quellaveco project funded from the 2018 syndication transaction of $515 million; Mitsubishi’s subsequent share of Quellaveco capital expenditure of $329 million; the purchase of shares under the buyback of $777 million; and the purchase of shares for other purposes (including for employee share schemes) of $266 million.
(3) Net debt excludes the own-credit risk fair value adjustment on derivatives of $1 million (2018: $15 million).
Cash flow
Cash fows from operationsCash flows from operations increased to $9.3 billion (2018: $7.8 billion), reflecting an increase in underlying EBITDA from subsidiaries and joint operations.
Cash outflows on working capital were $50 million (2018: outflows of $30 million). Inventory increased by $434 million, reflecting planned increases at Copper and Nickel, as well as subdued sales at De Beers, particularly in the third quarter. Receivables increased by $170 million, owing to stronger product prices and the restart of operations at Minas-Rio. An increase in a customer pre-payment within PGMs, reflecting increased metal prices, and the restart of operations at Minas-Rio, contributed to an offsetting increase in payables of $554 million.
Attributable free cash fow◊
The Group generated attributable free cash flow of $2.3 billion (2018: $3.2 billion). Growth in cash flows from operations to $9.3 billion (2018: $7.8 billion) was offset by increased capital expenditure of $3.8 billion (2018: $2.8 billion) and higher tax payments of $2.1 billion (2018: $1.4 billion), principally at Kumba Iron Ore, Copper and Metallurgical Coal. Following adoption of IFRS 16 Leases, repayments of lease obligations are excluded from underlying EBITDA but remain within attributable free cash flow.
DividendsIn line with the Group’s established dividend policy to pay out 40% of underlying earnings, the Board has proposed a dividend of $0.47 per share, bringing the total dividends paid and proposed in respect of 2019 to $1.09 per share (2018: $1.00 per share).
Share buybackIn July 2019, the Board approved an additional return of up to $1 billion to shareholders via an on-market share buyback programme. This additional return recognises the resilience of our balance sheet, and our confidence in funding our portfolio of highly attractive near and medium term growth opportunities. The programme will end no later than 31 March 2020 and had returned $0.8 billion to shareholders as at 31 December 2019.
54 Anglo American plc Integrated Annual Report 2019
STRATEGIC REPORT GROUP FINANCIAL REVIEW
GROUP FINANCIAL REVIEW CONTINUED

Net debt◊
Net debt (including related derivatives) of $4.6 billion has increased by $1.8 billion, representing gearing of 13% (2018: 9%). Net debt at 31 December 2019 comprised cash and cash equivalents of $6.3 billion (2018: $6.5 billion) and gross debt, including related derivatives, of $11.0 billion (2018: $9.4 billion). The increase in net debt since 31 December 2018 was driven by $0.5 billion of additional debt arising on adoption of IFRS 16 Leases on 1 January 2019, the purchase of $0.8 billion of ordinary shares under the share buyback scheme announced in July 2019, and incorporation of Mitsubishi debt for the development of Quellaveco offsetting attributable free cash flow of $2.3 billion.
Balance sheetNet assets of the Group increased by $1.6 billion to $31.4 billion (2018: $29.8 billion), reflecting the increased profit in the year and the effect of foreign exchange on operating assets denominated in local currency, offset by dividend payments to Company shareholders and non-controlling interests. Capital expenditure of $3.8 billion was partly offset by depreciation and amortisation of $3.0 billion.
Attributable ROCE◊
Attributable ROCE was flat at 19% (2018: 19%). Attributable underlying EBIT was $5.5 billion (2018: $5.2 billion), reflecting higher prices, favourable exchange movements and the restart of operations at Minas-Rio, offset by cost and volume headwinds and inflationary pressures. Average attributable capital employed increased to $28.4 billion (2018: $27.4 billion) due to increased capital expenditure, foreign exchange movements and changes in accounting treatment arising from the adoption of IFRS 16 Leases.
Liquidity and fundingGroup liquidity remains conservative at $15.0 billion (2018: $13.9 billion), made up of $6.3 billion of cash (2018: $6.5 billion) and $8.7 billion of undrawn committed facilities (2018: $7.3 billion). On 1 January 2019, a committed shareholder loan facility of $1.8 billion from Mitsubishi Corporation became available to Anglo American Quellaveco S.A. to meet Mitsubishi’s commitment to fund 40% of the remaining capital expenditure on the Quellaveco copper project in Peru.
In March 2019, the Group issued bonds for a US dollar equivalent value of $1.0 billion. The issuances consisted of a seven-year €500 million bond and a 10-year £300 million bond. These issuances pre-funded the $0.4 billion equivalent bond maturity in June 2019. The weighted average maturity on the bonds has reduced slightly to 4.5 years (2018: 5.0 years).
The Group received an upgrade to BBB/Baa2 (stable outlook) in March 2019 from S&P Global Ratings and Moody’s Investors Service respectively.
Matured in 2019
New bondsExisting bonds
BOND MATURITY PROFILE
$ billion
2029
0.70.6
0.4
2025
0.7
2024
1.0
2028
1.4
2023
1.9
20272026
1.4
2022
1.1
2019
0.4
2020 2021
0.5
55Anglo American plc Integrated Annual Report 2019

DE BEERS
Anglo American owns 85% of De Beers, the world’s leading diamond company. The remaining 15% is owned by the Government of the Republic of Botswana (GRB). De Beers and its partners produce around one-third of the world’s rough diamonds, by value.
Bruce CleaverCEO De Beers
2019 SUMMARY
0Fatalities
3.07TRCFR
$558mUnderlying EBITDA
43%Mining EBITDA Margin
30.8 MctProduction volume
De Beers sells the majority of its rough diamonds through 10 Sight sales each year to term contract Sightholders and Accredited Buyers. It licenses its diamond brand Forevermark™ and markets and sells polished diamonds and diamond jewellery via its Forevermark™ and De Beers Jewellers businesses.
De Beers recovers diamonds from four countries: Botswana, Canada, Namibia and South Africa.
In Botswana, via a 50:50 joint operation with the GRB – known as Debswana – the company recovers diamonds from four mines, including Jwaneng, one of the world’s richest diamond mines by value. The mine’s high grade ore contributes 60%-70% of Debswana’s revenue. The $2 billion Cut-9 expansion of Jwaneng will extend the life of the mine to 2035 and is expected to yield an estimated 53 million carats(2) of rough diamonds from approximately 44 million tonnes of treated material.
In Namibia, De Beers works in 50:50 partnership with the Namibian government, where they recover both land-based diamonds (Namdeb) and offshore diamonds (Debmarine Namibia). Namibia has the richest known marine diamond deposits in the world, with Diamond Resources estimated at more than 80 million carats(2) in approximately 1.1 million k (m2) of sea-bed. Marine diamond deposits represent around 65% of the partnership’s total diamond production and 90% of its diamond resources.
In South Africa, De Beers Consolidated Mines recovers diamonds from Venetia mine in Limpopo Province. Venetia is an open-pit mine and the country’s largest producer of diamonds, contributing 40% of South
Africa’s annual diamond production. Open-pit mining at Venetia is likely to run until 2021 and the transition is already underway to convert to underground mining, which is expected to extend the life of the mine to 2046. The project is expected to treat approximately 132 million tonnes of material, containing an estimated 100 million carats(2).
In Canada, De Beers has a 51% interest in, and is the operator of, Gahcho Kué mine in the Northwest Territories, which began commercial production in 2017. The open-pit mine, with an 11-year life, can produce an average of 4.5 million carats a year, yielding an estimated total of 54 million carats(2) from approximately 33 million tonnes of material.
De Beers also develops industrial super materials through Element Six, which includes the production of laboratory grown diamonds for Lightbox Jewelry. De Beers continues to offer diamond grading and testing services through De Beers Group Industry Services.
Venetia
SOUTH AFRICA
Orapa(1)
Jwaneng
Debmarine Namibia
Damtshaa(1)
Letlhakane(1)
Namdeb
BOTSWANA AND NAMIBIA
Gahcho Kué
CANADA
(1) All managed as one operation, the ‘Orapa Regime’.(2) Refer to Anglo American plc Ore Reserves and Mineral
Resources Report 2019 for additional information.
56 Anglo American plc Integrated Annual Report 2019
STRATEGIC REPORT DE BEERS

Ramaphabana Nyaluvhani (right) farms a small plot of land in the far north of South Africa. With the support of De Beers’ AWOME programme, which provides female entrepreneurs with the skills needed to expand their business, Ramaphabana has been able to expand the area she farms and increase the range of crops she grows there.
Gender equalityInitiatives in southern AfricaResearch continues to show that investing in women and girls not only benefits business, but has an exponential effect on local development because women reinvest most of their income in their communities. This is why De Beers is continuing its commitment to gender equality through a $3 million partnership with UN Women and through being a champion of the UN’s global solidarity movement for gender equality, HeForShe.
By the end of 2019, more than 700 female micro-entrepreneurs in Namibia and South Africa had successfully completed their training under De Beers’ Accelerating Women Owned Micro-Enterprises (AWOME) programme, which forms part of the company’s partnership with UN Women. The programme, which has recently been extended to Botswana, aims to support more than 1,200 female micro-entrepreneurs across southern Africa over the next three years.
AWOME is tailored to provide female micro-entrepreneurs with the skills required to grow their businesses. Adopting a ‘train the trainer’ approach, local community members are trained in mentoring, networks, business, and life skills. They, in turn, train female entrepreneurs, enabling the programme to be sustainable. Additionally, the training enhances abilities across a range of areas, including how to access different markets, increase market share, generate income, create more jobs, and help to nurture effective decision-making, communication and negotiation skills.
Targeting regions with high levels of unemployment and limited job opportunities,
AWOME aims to create a sustainable support network and has already supported a range of micro-entrepreneurs, from diesel mechanics and children’s entertainers to farmers, hairdressers and tailors.
Beyond southern AfricaBeyond southern Africa, De Beers has made substantial progress in other aspects of its partnership with UN Women.
In Canada, the company is supporting young women studying STEM (science, technology, engineering and mathematics) subjects, sponsoring STEM science camps for girls from indigenous communities around its operations and providing scholarships for women to attend university and study STEM subjects. De Beers has also partnered with UN Women to sponsor the #GetFree tour, which toured Canadian universities in 2019, engaging students on the HeForShe movement and the importance of gender equality.
In its marketing activities, De Beers strives to be a positive force for gender equality. A new set of inclusive marketing guidelines was launched across the business in 2019, focused on avoiding the exacerbation of gender stereotypes.
Finally, De Beers’ partnership with UN Women has seen the company set a goal of achieving gender parity in its appointment rate at senior levels. The appointment rate of women into senior roles has increased from 22% at the start of the partnership with UN Women two years ago to 38% today. To accelerate meeting the target, De Beers is now embedding changes to culture and policy, including implementing employee networks, establishing reciprocal mentoring programmes and revising recruitment guidelines.
USA 36.2
China(2) 10.2
Japan 5.4
Gulf 3.2
India 2.7
Rest of World 17.9
Total 75.6
%
48
13
7
4
4
24
$bn
DIAMOND JEWELLERY DEMAND BY COUNTRY(1)
(1) Data relates to 2018 and is diamond jewellery value at retail prices.
(2) Data set does not include Hong Kong, Macau and Taiwan.
Russia 4.5
Botswana 3.7
Canada 2.5
Angola 1.6
South Africa 1.3
Namibia 1.1
DRC 0.6
Other 2.1
Total 17.4
%
26
21
14
9
8
6
4
12
$bn
ROUGH DIAMOND PRODUCTION BY COUNTRY(1)
(1) Data relates to 2018 and is rough diamond production by value.
57Anglo American plc Integrated Annual Report 2019

DE BEERS CONTINUED
2019 RESULTS2019 2018
Production volume (‘000 carats)(1) 30,776 35,297
Sales volume (‘000 carats)(1)(2) 29,186 31,656
Price ($/ct)(1)(3)(4) 137 171
Unit cost ($/ct)(1)(4)(5) 63 60
Group revenue – $m(1)(6) 4,605 6,082
Underlying EBITDA – $m(1)(4) 558 1,245
Mining EBITDA margin(1)(7) 43% 53%
Trading margin 3% 8%
Underlying EBIT – $m(1)(4) 168 694
Capex – $m(1)(4)(8) 567 417
Attributable ROCE(1) 2% 8%
Fatalities(9) 0 1
TRCFR(9) 3.07 2.48
Energy consumption – million GJ(9) 4.5 5.8
GHG emissions – Mt CO2 equivalent(9) 0.48 0.56
Total water withdrawals – million m3(9) 21.9 42.6
Employee numbers(9) 9,000 10,000
(1) Prepared on a consolidated accounting basis, except for production, which is stated on a 100% basis except for the Gahcho Kué joint operation, which is on an attributable 51% basis.
(2) Total sales volumes on a 100% basis were 30.9 million carats (2018: 33.7 million carats). Total sales volumes (100%) include De Beers Group’s joint arrangement partners’ 50% proportionate share of sales to entities outside De Beers Group from Diamond Trading Company Botswana and Namibia Diamond Trading Company.
(3) The De Beers realised price includes the price impact of the sale of non-equity product and, as a result, is not directly comparable to De Beers unit costs, which relate to equity production only.
(4) Results by country can be found in the Summary by Operation on page 217.(5) Unit cost is based on consolidated production and operating costs, excluding depreciation and operating
special items, divided by carats recovered.(6) Includes rough diamond sales of $4.0 billion (2018: $5.4 billion).(7) Excludes the impact of third-party sales, purchases and trading.(8) In 2018, includes the acquisition of Peregrine Diamonds Limited for a consideration of $87 million.(9) Data is for De Beers’ managed operations.
SafetyDuring 2019, De Beers experienced no loss of life incidents at any of its operations. The lost-time injury frequency rate decreased by 14% to 0.74 (2018: 0.86), while the total recordable case frequency rate increased by 24% to 3.07 (2018: 2.48).
De Beers’ safety programmes are informed through deep engagement and robust participation across the business. Advanced Driver Assist System safety technology has been successfully installed on light vehicles, buses and trucks at Venetia and, based on the positive results there, additional systems have been procured for trials in Botswana and Namibia.
Environmental performanceEnergy use decreased by 22% to 4.5 million GJ (2018: 5.8 million GJ) and GHG emissions by 14% to 0.48 Mt CO2e (2018: 0.56 Mt CO2e), largely owing to the closure of Victor mine. The ECO2MAN programme continues to evaluate projects for energy and GHG emissions savings.
Project Minera, where carbon is captured and stored using kimberlite waste rock, is progressing well and has been accelerated, given its importance to the business and its potential to help De Beers achieve its Carbon Neutral Roadmap. Field-scale trials have taken place at Gahcho Kué and will start with Venetia material in early 2020. Initial characterisation work has also started in Botswana.
Financial and operational reviewTotal revenue decreased by 24% to $4.6 billion (2018: $6.1 billion), with rough diamond sales falling by 26% to $4.0 billion (2018: $5.4 billion). This was due to an 8% decrease in consolidated rough diamond sales volumes to 29.2 million carats (2018: 31.7 million carats) and a 20% reduction in average realised price to $137/ct (2018: $171/ct). The reduction in realised price was driven by a 6% decline in the average rough price index and from a lower value mix of diamonds sold, in response to the weaker demand for higher value diamonds.
In response to the challenging midstream trading environment, De Beers offered increased supply flexibility to Sightholders and sold a lower value and volume of rough diamonds to the midstream, while increasing marketing expenditure to $178 million (2018: $166 million) to further drive consumer demand for diamond jewellery.
Underlying EBITDA decreased by 55% to $558 million (2018: $1,245 million) owing to lower sales volumes, a lower value sales mix
which curtailed mining margins, and the lower rough price index which reduced margins in the trading business. Profitability in the mining business was supported by improved efficiencies and cost savings; so, although there was a 13% decline in production in response to weaker demand, with the business being impacted by mining cost inflation in southern Africa, unit cost increases were limited to 5%.
58 Anglo American plc Integrated Annual Report 2019
STRATEGIC REPORT DE BEERS

MarketsA range of factors created significant challenges for rough diamond demand in 2019: in late 2018, stock market volatility and US-China trade tensions resulted in lower than expected holiday retail sales, which led to higher than anticipated stock levels in the industry’s midstream at the start of 2019. Throughout the course of 2019, the midstream inventory position was under further pressure due to the closure of some US ‘bricks and mortar’ retail outlets, and an increase in online purchasing (where inventory levels are lower), and retailers increasing their stock held on consignment. Tighter financing also affected the midstream’s ability to hold stock, all of which resulted in lower demand for rough diamonds.
In US dollar terms, global consumer demand for diamond jewellery was broadly flat in 2019. This was despite the challenges of increased uncertainty around the economic outlook owing to the continued US-China trade tensions, as well as the impact of the Hong Kong protests and certain macro-economic issues affecting consumer confidence in India.
US consumer demand remained reasonably strong, but growth in local currency terms in China and Japan was offset by the strength of the US dollar, while demand from India and the Gulf declined.
Operational performance
Mining and manufacturingRough diamond production decreased by 13% to 30.8 million carats (2018: 35.3 million carats), primarily driven by a reduction in South Africa. While trading conditions have improved somewhat since the third quarter of the year, production was lower in response to softer rough diamond demand conditions compared with 2018.
In Botswana, production was 4% lower at 23.3 million carats (2018: 24.1 million carats). Production at Jwaneng increased by 5% to 12.5 million carats (2018: 11.9 million carats) as throughput rose to partly offset a 12% decrease at Orapa to 10.8 million carats (2018: 12.2 million carats) owing to a delay in an infrastructure project and expected lower grades.
In Namibia, production decreased by 15% to 1.7 million carats (2018: 2.0 million carats). Output from the marine operation declined by 10% owing to routine planned maintenance for the Mafuta vessel. Production at the land operations decreased by 29% to 0.4 million carats (2018: 0.6 million carats) as a result of placing Elizabeth Bay onto care and maintenance in December 2018. In September 2019, the sale of Elizabeth Bay was announced.
In South Africa, production decreased by 59% to 1.9 million carats (2018: 4.7 million carats) as the mining sequence at the Venetia open pit had a higher waste to ore ratio as it moves into its final years, prior to the transition to underground. Production at Voorspoed ceased following the operation being placed onto care and maintenance in the final quarter of 2018.
In Canada, production decreased by 13% to 3.9 million carats (2018: 4.5 million carats) as Victor reached the end of its life during the second quarter of 2019, resulting in a 55% decrease in output to 0.4 million carats (2018: 0.9 million carats). Gahcho Kué maintained output at 3.5 million carats (2018: 3.5 million carats), with a planned grade reduction offset by strong plant performance.
Brands In 2019, De Beers continued to invest in its downstream brands to support the long term growth of consumer demand for natural diamonds.
De Beers Jewellers continued to upgrade and expand its retail network during 2019, as well as integrating its online and store presence into an improved combined offering.
Forevermark™ continues to grow its presence and sales worldwide. It is now available in around 2,500 retail outlets globally, with the brand being launched in Italy, Austria and Belgium during 2019. Dedicated Forevermark™-only stores are now operating in China, the US and India.
Operational and market outlookPreliminary data following the holiday retail season in 2019 indicates that stock levels in the industry’s midstream are returning to a more balanced position following stable consumer demand, especially in the US. However, risks remain to the downside, with further increases in online purchasing causing additional retailer destocking, developments in US-China trade tensions, the coronavirus which originated in China over Chinese New Year, geo-political escalation in the Middle East and the effect those may have on economic growth and consumer sentiment.
2020 production guidance is 32-34 million carats, subject to trading conditions. The higher production is driven by an expected increase in ore from the final open-pit cut at Venetia, supported by a currently anticipated improvement in trading conditions compared with 2019.
59Anglo American plc Integrated Annual Report 2019

COPPER
Ruben FernandesCEO Base Metals
From our three mining operations in Chile, we produce copper, essential to modern living and a future of clean energy and transport. Our products include copper concentrate, copper cathode and associated by-products such as molybdenum and silver. Our copper interests in Chile will soon be complemented by Quellaveco, which we are developing in Peru.
In Chile, we have interests in two major copper operations: a 50.1% interest in Los Bronces mine, which we manage and operate, and a 44% share in the Collahuasi mine; we also manage and operate the El Soldado mine and the Chagres smelter (50.1% interest in both).
In Peru, we have a 60% interest in the Quellaveco project. We approved the project for development in mid-2018 and we are progressing on track for first production in 2022, ramping up to full output the following year. During the first 10 years, production is expected to average 300,000 tonnes of copper equivalent per year, with a first- quartile cash cost of 105 c/lb.
Quellaveco
Collahuasi
Los BroncesEl Soldado
Chagres
KEY Mining operations
Smelter
Project
Uses of copperCopper’s unique properties make it a vital material for urban and industrial growth, as well as a critical component in the efforts to move to a cleaner, greener world – in terms of both renewable energy and electric transport.
Around 60% of total global demand is for electrics – wire, cables and connectors, including in vehicles and consumer electronics.
A further 20% is used in construction; for example, water pipes and roof sheets benefit from copper’s resistance to corrosion. Copper’s thermal conductivity and maleability means it is used extensively in air conditioning and refrigeration.
It may also be used in places such as in hospitals, owing to its anti-bacterial qualities. Its visual qualities account for many other applications – in buildings and everyday objects.
In the future, a growing volume of copper will likely be used in low-emission vehicles; battery electric, hydrogen fuel cell and hybrid electric vehicles all contain substantially more copper than conventional vehicles.
Copper is set to continue to be one of the essential industrial metals as society addresses the challenges of climate change, energy efficiency and the raising of living standards for the world’s growing population. The effects of ore reserve depletion across the industry, and lengthy permitting processes, are likely to result in future supply constraints.
CHILE AND PERU
2019 SUMMARY
2Fatalities(1)
1.15TRCFR – Copper Chile
0.91TRCFR – Quellaveco
$1,618 mUnderlying EBITDA(1)
44%Mining EBITDA Margin(1)
638 ktProduction volume
Aaron PunaCEO Anglo American, Chile
Tom McCulleyCEOAnglo American, Peru
(1) Includes Copper Chile and Quellaveco.
60 Anglo American plc Integrated Annual Report 2019
STRATEGIC REPORT COPPER

Construction of the Hydrofloat™ pilot-scale plant at El Soldado in Chile.
El Soldado – engineering advances in processing technologyDuring our ‘Concentrating the Mine’ workshops held in 2015 and 2016, we identified coarse particle recovery (CPR) as a key enabling technology. CPR is one of many significant breakthrough technology initiatives that has the potential to increase throughput and productivity, while simultaneously reducing our environmental footprint, through rejection of coarse gangue (near-worthless waste material), dry stacking of sand waste, minimising the production of traditional tailings and reducing overall water consumption.
Following successful testing in the laboratory and at small pilot scale at Los Bronces, we are now constructing a demonstration plant at El Soldado copper mine that uses a CPR technology called Hydrofloat™ in a new way. Here, a single, five metres in diameter Hydrofloat™ cell, the largest in the world, will treat 100% of mill throughput, with the objective of proving the waste rejection process at full scale.
Processing Development Lead, Adrian McDonald, explains: “Coarse particle recovery technology using the Hydrofloat™ is not new; it’s been used in the phosphates and coal industries for many years. The difference with this application of Hydrofloat™ is the way we
handle coarser material prior to conventional flotation, and reject the gangue while it is in sand form.”
Our in-house-developed Fast Implementation of Technology (FIT) process, which forms part of our FutureSmart Mining™ technology pathway, has been instrumental in the development of CPR in treating sulphides. FIT allows us to understand how best we can run parallel processes and models the latest development in mineralogical analyses in order to accelerate their commercial deployment. It leverages the learnings and outcomes of test work in one commodity to develop the application in other commodities.
As Adrian points out, “CPR has the potential to be a breakthrough technology in the processing of sulphides. If we can prove the process at El Soldado, Anglo American will be the first company in the world to deploy CPR successfully to reject coarse gangue on a commercial scale. If that happens, it will change the way the mining industry approaches flotation. I hope that what we’re doing at El Soldado, as early adopters, will enable Anglo American to set new standards for base-metal concentrate processing and to become the industry leaders in dry stacking. That would give us significant competitive advantage.”
China
Asia excl. China
Europe
North America
Middle East
South America and Caribbean
Russia and the Caspian
Africa
%
51
16
15
10
3
2
2
1
COPPER DEMAND BY REGION– REFINED CONSUMPTION
Global total: 23.5 Mt.
Source: Wood Mackenzie
South America and Caribbean
Asia
North America
Africa
Russia and the Caspian
Europe
Oceania
Middle East
%
42
13
13
12
8
5
5
2
COPPER SUPPLY BY REGION – COPPER IN CONCENTRATE AND LEACH
Global total: 20.9 Mt.
Source: Wood Mackenzie
Construction
Electrical network
Consumer and general
Transport
Industrial machinery
%
28
28
21
12
11
COPPER DEMAND BY SECTOR – TOTAL CONSUMPTION
Global total: 29.6 Mt. Includes direct use scrap.
Source: Wood Mackenzie
61Anglo American plc Integrated Annual Report 2019

COPPER CONTINUED
Safety
Copper ChileCopper Chile reported one recordable fatality in 2019, when Fabio Eyzaguirre Flores lost his life as the result of an electric shock. Ten colleagues also died in two separate after-hours commuting-related road accidents.
The lost-time injury frequency rate increased by 2% to 0.55 (2018: 0.54) and the total recordable case frequency rate increased by 12% to 1.15 (2018: 1.03).
During 2019, Copper Chile launched the 100 Day Safety Action campaign, and the Transportation Taskforce, focusing on the implementation of Operational Risk Management, monitoring and verification of critical controls, and implementing initiatives to prevent repeat incidents.
The actions taken to avoid repeat incidents included: re-certification of all drivers of mobile equipment; the introduction of new controls related to mobile equipment safety; and a review of controls and training. Improvements to several roads and the installation of advanced driver assistance systems for all buses are also in progress.
QuellavecoQuellaveco recorded one fatality when Cesar Wilinton Estrada Agüero lost his life as the result of a mobile equipment incident.
The lost time incident rate was 0.64 and the total recordable case frequency rate was 0.91.
Environmental performance
Copper ChileAt Copper’s Chilean operations, energy use decreased by 8% to 12.3 million GJ (2018: 13.4 million GJ) and GHG emissions decreased by 11% to 1.17 Mt CO2e (2018: 1.32 Mt CO2e). In 2019, the business signed agreements to purchase all electricity from renewable sources, which will substantially reduce GHG emissions at all Copper sites in Chile. The world’s first floating solar photovoltaic plant over a tailing storage facility pond was piloted at Las Tórtolas. It generates 86 kWhp of solar electricity and minimises evaporation in the pond-covered area. Implementation of P101 shovel initiatives is decoupling productivity from diesel use, with digital technologies highlighting fuel savings in real time.
For more information: See page 33
2019 RESULTS – COPPER CHILE2019 2018
Production volume (kt) 638 668
Sales volume (kt)(1)(2) 644 672
Unit cost (c/lb)(1)(3) 126 134
Group revenue – $m(1)(4) 5,840 5,168
Underlying EBITDA – $m(1) 1,638 1,888
Mining EBITDA margin(5) 44% 48%
Underlying EBIT – $m(1) 981 1,266
Capex – $m(1) 574 564
Attributable ROCE 24% 31%
Fatalities 1 0
TRCFR 1.15 1.03
Energy consumption – million GJ 12.3 13.4
GHG emissions – Mt CO2 equivalent 1.17 1.32
Total water withdrawals – million m3 21.7 29.5
Employee numbers 4,000 4,000
(1) Results by asset and the consolidated results for Copper can be found in the Summary by Operation on page 217.(2) Excludes 349 kt third-party sales (2018: 178 kt).(3) C1 unit cost includes by-product credits.(4) Group revenue is shown after deduction of treatment and refining charges (TC/RCs).(5) Excludes impact of third-party sales.
2019 RESULTS – QUELLAVECO2019 2018
Capex – $m(1) 494 131
Fatalities(2) 1 n/a
TRCFR(2) 0.91 n/a
Energy consumption – million GJ(2) 2.0 n/a
GHG emissions – Mt CO2 equivalent(2) 0.15 n/a
Total water withdrawals – million m3(2) 0.6 n/a
Employee numbers(2) 300 n/a
(1) Capex represents the Group’s 60% share after deducting direct funding from non-controlling interests. 2019 capex on a 100% basis was $1,338 million, of which $515 million was funded by cash from the Mitsubishi syndication transaction in 2018. Of the remaining $823 million, the Group and Mitsubishi funded their respective 60% and 40% shares via shareholder loans.
(2) Comparative data for Quellaveco is not presented as the project only reached a full year of development in 2019.
62 Anglo American plc Integrated Annual Report 2019
STRATEGIC REPORT COPPER

QuellavecoAt Quellaveco, energy consumption was 2.0 million GJ and GHG emissions were 0.15 Mt CO2e, reflecting the ramp-up of the project.
Financial and operational reviewUnderlying EBITDA decreased by 13% to $1,618 million (2018: $1,856 million), driven by a decrease in the average LME copper price and a 4% reduction in sales volumes. The lower sales reflect a 5% decrease in production, driven by the ongoing severe drought conditions in Chile, mitigated to some extent by productivity improvements, including record copper in concentrate production at Collahuasi. Unit costs decreased by 6%, to 126 c/lb (2018: 134 c/lb), the lowest since 2010, reflecting sustainable cost savings coupled with favourable movements in the Chilean peso, which fully offset the impact of inflation and lower production. At 31 December 2019, 111,213 tonnes of copper were provisionally priced at 273 c/lb (2018: 179,100 tonnes provisionally priced at 271 c/lb).
Markets2019 2018
Average market price (c/lb) 272 296
Average realised price (c/lb) 273 283
The differences between the market price and realised price are largely a function of the timing of sales across the period and provisional pricing adjustments.
The average LME cash copper price in 2019 was 8% lower at 272 c/lb (2018: 296 c/lb). Trade tensions between the US and China and measures to restrict shadow lending by the Chinese authorities contributed to slower economic growth in China, adversely affecting key copper-consuming sectors. As a result, investors were risk averse through most of the year and the weaker US dollar/Chinese renminbi exchange rate also put pressure on the copper price. However, a decrease in reported warehouse stocks and stagnant growth in global copper mine supply provided some support.
Operational performanceTotal production decreased by 5% to 638,000 tonnes (2018: 668,300 tonnes).
At Los Bronces, production decreased by 9% to 335,000 tonnes (2018: 369,500 tonnes), with planned higher grades (0.83% vs. 2018: 0.76%) offset by production losses owing to lower water availability. Chile’s central zone, where the operation is located,
continues to face unprecedented climate conditions, with 2019 being the driest year since the start of the current decade-long drought, and one of the driest years on record. Despite the lower production, C1 unit costs decreased by 7% to 135 c/lb (2018: 145 c/lb), reflecting a series of initiatives to reduce costs.
At Collahuasi, Anglo American’s attributable share of copper production increased by 1% to 248,800 tonnes (2018: 246,000 tonnes), another copper in concentrate production record, with planned lower grade (1.19% vs. 2018: 1.29%) fully compensated by a solid plant performance following the successful completion of planned three-month maintenance of Line 3 (responsible for 60% of plant throughput) during the first half of the year. C1 unit costs decreased by 5% to 100 c/lb (2018: 105 c/lb) on the back of strong production performance and lower waste stripping expensed.
The Copper business has continued to progress trials for new technology as part of the FutureSmart Mining™ programme, working towards a more sustainable future for mining. Following a successful bulk ore sorting pilot at El Soldado in Chile, units were constructed and on trial in Brazil at Barro Alto (Nickel), and in South Africa at Mogalakwena (PGMs), with plans to roll out to more sites over the next few years. The focus for early 2020 is the completion of the El Soldado coarse particle recovery demonstration plant.
Production at El Soldado increased by 3% to 54,200 tonnes (2018: 52,700 tonnes) as a result of planned higher grades (0.93% vs. 2018: 0.85%). C1 unit costs were broadly in line with 2018 at 205 c/lb (2018: 206 c/lb).
Operational outlookProduction guidance for 2020 is 620,000-670,000 tonnes, subject to water availability.
Quellaveco updateProject execution is on track at around 40% completion, with all key milestones for 2019 achieved on schedule.
The construction of Vizcachas dam, part of the water source infrastructure located approximately 90 kilometres north east of the plant, is progressing to plan, with water impoundment expected to begin during the rainy season in early 2020. Once built, the Vizcachas reservoir will bring substantial benefits to local agriculture, in addition to providing an annual average of around 20% of the water needed to sustain Quellaveco’s operations. Construction of the water pipeline from the water source to the Quellaveco site is a key activity for 2020.
In the mine area, earthworks are significantly progressed and concrete work for the primary crusher has commenced. Preparations are underway for the start of pre-stripping, to remove surface waste material, in the first half of 2020.
At the processing plant area, earthworks are complete, concrete placement is advancing to plan, and structural steel and mechanical equipment installation has commenced. Assembly of the mills is scheduled to start in 2020.
The project remains on track to deliver first production in 2022, within the $5.0-$5.3 billion capital expenditure estimate (100% basis; Anglo American share: $2.5-$2.7 billion), with ramp-up in 2023. Quellaveco expects to deliver around 300,000 tonnes per annum of copper equivalent production (100% basis) on average in the first 10 years of operation.
In 2019, capital expenditure (100% basis) totalled $1,338 million, of which $515 million was funded using the remaining proceeds from the syndication transaction with Mitsubishi in 2018, and hence is not included in reported capital expenditure. Of the remaining $823 million, the Group and Mitsubishi funded their respective 60% and 40% shares of capital expenditure via shareholder loans. Capital expenditure guidance (100% basis) for 2020 is $1.5-$1.7 billion, of which the Group’s share is $0.9-$1.0 billion.
63Anglo American plc Integrated Annual Report 2019

PLATINUM GROUP METALS (PGMs)
Chris GriffithCEO Platinum Group Metals
Anglo American is a leading producer of PGMs, essential metals for cleaning vehicle exhaust emissions and as the catalyst in electric fuel cell technology. We own and operate five mining operations in South Africa’s Bushveld complex, including Mogalakwena – the world’s largest open-pit PGMs mine, Amandelbult and Mototolo, as well as the Unki mine, in Zimbabwe. In South Africa, we also own smelting and refining operations which treat concentrates from our wholly owned mines, our joint venture operations and third parties.
(1) Excludes Twickenham and Bokoni, which were placed onto care and maintenance in 2016 and 2017, respectively.
Mogalakwena
Amandelbult
Kroondal
Johannesburg
Mototolo
Modikwa
Uses of PGMsPGMs are used in an extensive range of applications. In the automotive industry, they are in demand through both their use in catalytic converters and in fuel cell vehicle technology. Platinum, palladium and rhodium enable catalytic converters to reduce pollutants from car exhaust gases, and demand for PGMs from the car industry is expected to continue to grow, supported by stricter emissions regulations. Fuel cell electric vehicles provide a zero-emissions powertrain technology, particularly well suited to the heavy duty, long range and fleet vehicle markets.
With rising concerns about the environment and energy costs, there is also growing interest in platinum fuel cells as an alternative energy source. In some cases, platinum-based fuel cells are proving to be more cost-effective, cleaner and more reliable than alternatives such as diesel generators. Fuel cell mini-grid electrification technology is an attractive, cost-competitive alternative to grid electrification in remote rural areas and could accelerate access to electricity.
Platinum is also widely used in jewellery owing to its purity, strength, resistance to fading and ability to hold precious stones securely.
Platinum, palladium and rhodium each have a wide range of other uses in the chemical, electrical, medical, glass and petroleum industries. PGMs enable efficient production of goods, ranging from glass to fertilisers, as well as a diverse range of other products, such as cancer-treatment drugs.
We are committed to developing demand for PGMs and invest both directly and through AP Ventures, our development fund that was spun out in order to grow the funding. We are also a major participant in the Platinum Guild International (PGI) which plays a key role in supporting and growing platinum jewellery demand. Meanwhile, new technology and legislation continue to drive demand for PGMs in the vehicle manufacturing industry – through their application in both catalytic converters and fuel cells.
Unki
Bushveld Complex
SOUTH AFRICA AND ZIMBABWE SOUTH AFRICA: BUSHVELD COMPLEX(1)
2019 SUMMARY
0Fatalities
2.50TRCFR
$2,000mUnderlying EBITDA
40%Mining EBITDA Margin
2,051 kozProduction volume – platinum
1,386 kozProduction volume – palladium
64 Anglo American plc Integrated Annual Report 2019
STRATEGIC REPORT PLATINUM GROUP METALS

Anglo American is a co-sponsor of the University of Warwick’s research into anti-cancer therapies. The university recently discovered a new compound based on osmium, one of the platinum group metals, which is targeting cancer cells in a new, revolutionary way.
Sponsoring research into PGM use in anti-cancer treatmentFor over 50 years, Cisplatin and other related drugs containing PGM compounds have played an important and growing role in anti-cancer therapies. Further clinical trials into Cisplatin have extended its use and it is now probably the most widely used anti-cancer drug.
One of the most important attributes of Cisplatin, and of second and third generation drugs such as Carboplatin, Satraplatin and Picoplatin, is their ability to bind to the body’s DNA in a way that achieves an optimal balance of anti-tumour activity and low toxicity. In addition to genito-urinary disease (testicular, ovarian, cervix, and bladder) and head and neck cancer, for which Cisplatin was originally licensed in the late 1960s, it is now one of the drugs used in the chemotherapy of lung cancers, while recent clinical trials using single-agent Cisplatin in the treatment of breast cancer suggest that it may also play a part in the future in the management of this disease.
Until recently, of the six elements that make up the PGM suite of metals, platinum has been the principal contributor to PGM-based anti-cancer compounds. But because the PGM family is exceptionally good when it comes to ‘co-ordination chemistry’, being able to spawn a growing range of compounds, we are now
seeing other PGMs such as ruthenium featuring in PGM-based compounds used in cancer chemotherapy.
Osmium, for so long the ‘Cinderella’ of the PGM family because of its very limited range of applications, has now entered the scene. Anglo American is a co-sponsor of the UK’s University of Warwick’s research into anti-cancer therapies, with the university recently announcing that it has discovered a compound, named Organo-Osmium FY26. This new organo-metal compound enables cancer cells to be seen through nano-imaging, and targeted and killed, from the inside, with Organo-Osmium FY26 attacking the weakest parts of the cells. It is the first time that an osmium-based compound – and osmium is 50 times more active than Cisplatin – has been seen to target the disease in this way.
Head of PGMs market development Benny Oeyen observes, “These are very early days for osmium in the medical field but, clearly, this represents a new market for the metal, and we are keen on developing it further. We are turning osmium from being a product with few uses to one that has the potential to benefit people in very tangible ways, in line with Anglo American’s Purpose of re-imagining mining to improve people’s lives.”
Industrial 2,469
Jewellery 1,375
Automotive 1,248
Investment 1,131
Total 6,223
%
40
22
20
18
‘000 ounces
PLATINUM NET DEMAND BY SECTOR
Source: Johnson Matthey
Automotive 6,706
Industrial 1,310
Jewellery 128
Investment (58)
Total 8,086
%
83
16
2
(1)
‘000 ounces
PALLADIUM NET DEMAND BY SECTOR
Source: Johnson Matthey
65Anglo American plc Integrated Annual Report 2019

2019 RESULTS2019 2018
Platinum production volume (koz)(1) 2,051 2,021
Palladium production volume (koz)(1) 1,386 1,379
Platinum sales volume (koz)(2)(3) 2,215 2,424
Unit cost ($/Pt oz)(2)(4) 1,543 1,561
Group revenue – $m(2) 6,866 5,680
Underlying EBITDA – $m(2) 2,000 1,062
Mining EBITDA margin(5) 40% 29%
Processing and trading margin 12% 9%
Underlying EBIT – $m(2) 1,672 705
Capex – $m(2) 569 496
Attributable ROCE 38% 15%
Fatalities 0 2
TRCFR 2.50 3.00
Energy consumption – million GJ 20.1 20.0
GHG emissions – Mt CO2 equivalent 4.44 4.12
Total water withdrawals – million m3 25.1 24.4
Employee numbers 31,000 33,000
(1) Own-mined production and purchase of metal in concentrate. Comparative excludes purchase of concentrate volumes now treated under tolling arrangement.
(2) Results by asset can be found in the Summary by Operation on page 217.(3) Excludes the sale of refined metal purchased from third parties and toll material. Comparatives include purchase
of concentrate volumes now transitioned to tolling.(4) Total cash operating costs – includes on-mine, smelting and refining costs only.(5) The total PGMs mining EBITDA margin excludes the impact of the sale of refined metal purchased
from third parties, purchase of concentrate and tolling.
SafetyDuring 2019, PGMs recorded no loss of life incidents at its managed operations – a safety milestone achieved for the first time in the company’s history. The total recordable case frequency rate also decreased by 17% to 2.50 (2018: 3.00).
Environmental performancePGMs’ total energy was in line with the prior year at 20.1 million GJ, and GHG emissions increased by 8% to 4.44 Mt CO2e (2018: 4.12 Mt CO2e), as the results from Mototolo (acquired in November 2018) and Unki smelter (first year of full production in 2019) were partly offset by a number of energy reduction initiatives implemented across the business.
PGMs’ Alternate (renewable) Energy Strategy is progressing, with several projects underway, including: the installation of large-scale solar photovoltaic panels at Mogalakwena; piloting the use of hydrogen fuel cell powered mining haul trucks; and generating electricity from waste heat recovered from the converting process at the Waterval smelter.
Financial and operational reviewUnderlying EBITDA increased by 88% to $2,000 million (2018: $1,062 million), largely as a result of a 27% increase in the dollar basket price, driven primarily by stronger prices for palladium and rhodium, and a solid operational performance.
MarketsThe basket price increased by 27% in dollar terms and 38% in South African rand terms. The average platinum price decreased by 2%, recovering well in the second half owing to strong investor demand, following weaker sentiment earlier in the year. In contrast, average palladium and rhodium prices strengthened by 50% and 77% respectively, despite a fall in global light duty vehicle sales, due to strong automotive demand driven by tighter emissions regulations in key markets.
PLATINUM GROUP METALS (PGMs) CONTINUED
2019 2018
Average platinum market price ($/oz) 864 880
Average palladium market price ($/oz) 1,539 1,029
Average rhodium market price ($/oz) 3,914 2,214
US$ realised basket price ($/Pt oz)(1) 2,819 2,219
Rand realised basket price (R/Pt oz) 40,862 29,601
(1) Average US$ realised price. Excludes the impact of the sale of refined metal purchased from third parties.
66 Anglo American plc Integrated Annual Report 2019
STRATEGIC REPORT PLATINUM GROUP METALS

Operational performanceTotal platinum production (metal in concentrate) increased by 1% to 2,050,600 ounces, with total palladium output also improving by 1% to 1,385,900 ounces. This excludes the effect of the transition of Rustenburg material to a tolling arrangement in the year (2018: 464,200 platinum ounces, 231,800 palladium ounces). This result was achieved despite the impact of Eskom power outages on production, which led to a loss of approximately 17,000 platinum ounces and 13,000 palladium ounces.
Own-mined productionOwn-mined platinum and palladium production both increased by 4% to 1,378,200 ounces and 1,049,200 ounces respectively. This was largely driven by increased production across the portfolio, as well as the acquisition of the remaining 50% of Mototolo in November 2018.
Mogalakwena’s platinum production increased by 5% to 517,500 ounces, and palladium production by 3% to 557,900 ounces, owing to an increase in grade and throughput. Ore stockpiles were drawn down to supplement production, as maintenance was carried out on the North concentrator in the second quarter of 2019, and the rope shovel in the fourth quarter of 2019.
Amandelbult platinum and palladium production both increased by 2% to 453,600 ounces and 208,900 ounces respectively. Infrastructure upgrades, exacerbated by power disruptions in both the first quarter and December, were offset by an increase in mining efficiencies as the ramp-up of Dishaba Lower accelerated in the second half.
Production of both platinum and palladium from other operations increased by 5% to 407,100 and 282,400 ounces respectively. This performance reflected record production levels at Unki and increased volumes from Mototolo, which was wholly owned for the full year (acquisition of the remaining 50% of Mototolo was concluded on 1 November 2018, from which date 100% of production became own-mined production). On a 100% basis, platinum and palladium production decreased at Mototolo by 15% to 112,000 ounces and by 17% to 68,700 ounces respectively, owing to a one-off benefit in 2018 from stockpiled material that was toll-concentrated at Bokoni, a decline in grade, and unprotected industrial action in May 2019.
Joint operation platinum and palladium production (split equally between own-mined and purchase of concentrate), excluding Mototolo, both decreased by 4% to 411,400 ounces and 269,000 ounces respectively, due to safety-related stoppages at Modikwa and Eskom power disruptions affecting production at Kroondal in December 2019.
Purchase of concentrate Purchase of concentrate, excluding Sibanye material which transitioned to a tolling arrangement from 1 January 2019, decreased by 4% to 672,400 ounces in the case of platinum and by 8% to 336,700 ounces for palladium, reflecting the lower production from joint operations.
Refined production and sales volumesRefined platinum production (excluding Sibanye toll-treated metal and concentrate purchased from Sibanye) increased by 8% to 2,112,300 ounces, while refined palladium output rose by 12% to 1,428,200 ounces. The improved operational performance was partly offset by the impact of Eskom’s power disruptions during the year, including an outage at the Rustenburg refinery in December, which led to a loss of refined platinum production of 69,000 ounces and palladium production of 44,000 ounces, of which around 45,000 platinum ounces and 25,000 palladium ounces should be recovered in refined production in 2020.
Platinum sales volumes increased by 7% to 2,100,300 ounces, while palladium sales increased by 13% to 1,453,500 ounces (excluding concentrate purchased from Sibanye prior to the transition to a tolling agreement and refined metals purchased from third parties). The increase was a result of the higher comparable refined production and some drawdown in refined inventory.
Operational outlookMetal in concentrate production for 2020 is expected to be 2.0-2.2 million ounces for platinum (of which approximately 65% own-mined) and approximately 1.4 million ounces for palladium (of which approximately 65% own-mined), subject to Eskom’s power performance.
67Anglo American plc Integrated Annual Report 2019

Anglo American’s iron ore operations provide customers with high grade iron ore products which help our steel customers meet ever-tighter emissions standards. In South Africa, we have a majority share (69.7%) share in Kumba Iron Ore, while in Brazil we have developed the integrated Minas-Rio operation.
Themba MkhwanaziCEO Kumba Iron Ore
Wilfred BruijnCEO Anglo American, Brazil
Seamus FrenchCEO Bulk Commodities and Other Minerals
IRON OREKUMBA IRON ORE IRON ORE BRAZIL
2019 SUMMARY – KUMBA
0Fatalities
2.06TRCFR
$2,243mUnderlying EBITDA
50%Mining EBITDA Margin
42.4 MtProduction volume
2019 SUMMARY – IRON ORE BRAZIL (MINAS-RIO)
0Fatalities
1.48TRCFR
$1,164mUnderlying EBITDA
50%Mining EBITDA Margin
23.1 MtProduction volume (wet basis)
Kumba operates two open-pit mines – Sishen and Kolomela – both located in the Northern Cape of South Africa, producing high grade (64%-65% average Fe content) and high quality lump ore and a premium fine ore. Around 67% of Kumba’s production is lump, which commands a premium price, owing to its excellent physical strength and high iron content. Kumba is serviced by an 861-kilometre rail line to the Atlantic coast at Saldanha Bay, the iron ore export channel, managed by Transnet.
Our marketing teams work closely with our customers to blend and match our products with their needs – before shipment from Saldanha Bay to China, Japan and Europe, and now increasingly to the Middle East and India.
Our integrated iron ore operation in Brazil, Minas-Rio, consists of an open-pit mine and beneficiation plant, which produces a high grade (c. 67%) pellet feed product, with low levels of contaminants. The iron ore is then transported through a 529-kilometre pipeline to the iron ore handling and shipping facilities at the port of Açu, in which Anglo American has a 50% shareholding.
Uses of iron oreIron ore is the key raw material in steel.
Steel is the world’s most important engineering and construction material. Over half of the world’s steel is consumed by the construction industry, which includes buildings and infrastructure, such as railways and roads. Steel is also used to manufacture vehicles, machinery, household appliances and many other items associated with everyday life.
The world’s largest steel-producing country is China, making it easily the biggest importer of iron ore.
SishenKolomela
Ferroport Açu port (50% ownership)
Minas-Rio
KEY Mining operations
Other
SOUTH AFRICA BRAZIL
68 Anglo American plc Integrated Annual Report 2019
STRATEGIC REPORT IRON ORE

Fitment technician George Phirimi inspects the radar sensors, which are fitted front and rear, and cameras for the auto-braking system on a Komatsu 730 haul truck.
Technology steers trucks towards zero harmAccording to ICMM statistics, in 2018, haul trucks and other mobile equipment were involved in a third of mining industry fatalities. Through its risk assessment process, Kumba identified reducing the risk of mobile equipment machinery incidents as a priority to enable the elimination of fatalities; therefore, it made sense to focus technological innovation on the application of collision-avoidance technology (CAS) in haul trucks.
This journey began in 2014, when Kumba’s Sishen mine started developing an anti-collision system for the mine’s trackless mobile equipment. In 2019, all the Sishen mine-owned haul trucks were fitted with the latest CAS. Sishen became the first mine in South Africa to deploy this technology in an opencast mine with a fleet of large haul trucks, each with a capacity of over 200 tonnes, and in an environment where traffic management and segregation form part of the mine’s critical controls.
Kumba’s success in rolling out CAS is due to the collaboration between Sishen, the truck manufacturer Komatsu, and Hexagon Mining, a proximity-detection system supplier. Together, they were able to adapt the technology to the models of haul trucks in use at Sishen. The technology has the following features: SpeedAssist and RampAssist, which prevent trucks from over-speeding in
designated areas; AssetProtect, which disables reverse functionality when the crusher is in maintenance, and stops hoisting when the haul truck is under a powerline; and LaunchAssist, which prevents the vehicle from moving when a threat is detected in the travel path. The most impressive feature is BrakeAssist, which applies brakes to prevent imminent collisions or incidents with other CAS-fitted vehicles or infrastructure.
Since the system was deployed, BrakeAssist has intervened in several incidents involving trucks at Sishen. Furthermore, as the reporting platform is being rolled out, its reports help management identify and address the causes of unsafe driving behaviour and improve traffic management.
Kumba is now working on rolling out the collision-avoidance systems at its Kolomela mine fleet and to its contractor fleet in order to improve safety and ensure compliance with South African government regulations, which require mining operators to significantly reduce the risk associated with trackless mobile machinery. This requirement is also part of the ICMM Innovation for Cleaner Safer Vehicles Initiative.
Up to now, solutions for increasing vehicle safety in mines have been rare. For Kumba, this has been part of a drive to achieve zero harm, aimed at making the workplace safer for employees.
Australia 888
Brazil 399
China 250
Europe (incl. CIS) 236
India 218
North America 120
Other 99
Africa 91
Other South America 31
Total 2,332
%
38
17
11
10
9
5
4
4
2
Mt
MINED IRON ORE BY REGION
Source: Wood Mackenzie
38%17%11%10%9%5%4%4%2%
China 1,310
Europe (incl. CIS) 285
Other Asia 242
India 191
Middle East 69
North America 67
South America 53
Africa 21
Other 6
Total 2,244
%
58
13
11
9
3
3
2
1
–
Mt
IRON ORE CONSUMPTION BY REGION
Source: Wood Mackenzie
69Anglo American plc Integrated Annual Report 2019

KUMBA IRON ORE
2019 RESULTS – KUMBA IRON ORE(1)
2019 2018
Production volume (Mt) 42.4 43.1
Sales volume (Mt) 42.0 43.3
Unit cost ($/t)(2) 33 32
Group revenue – $m 4,445 3,440
Underlying EBITDA – $m(3) 2,243 1,489
Mining EBITDA margin 50% 43%
Underlying EBIT – $m(3) 1,918 1,158
Capex – $m 389 309
Attributable ROCE 70% 42%
Fatalities 0 0
TRCFR 2.06 1.80
Energy consumption – million GJ 8.8 8.9
GHG emissions – Mt CO2 equivalent 1.00 0.96
Total water withdrawals – million m3 33.3 32.2
Employee numbers 6,000 6,000
(1) Sales volume, stock and realised price for 2019 differ to Kumba’s stand-alone reported results due to sales to other Group companies.
(2) Unit costs are on an FOB (dry) basis.(3) Kumba Iron Ore segment includes $66 million projects and corporate costs (2018: $55 million).
SafetyKumba has not had a loss of life incident since 2016. In 2019, the lost-time injury frequency rate decreased by 25% to 0.69 (2018: 0.92); however, the total recordable case frequency rate increased by 14% to 2.06 (2018: 1.80).
Kumba’s safety improvement plan is focused on the Group’s Elimination of Fatalities programme, with enhancements achieved in strengthening critical-control management, and in leveraging technology solutions to further improve safety performance. In addition, to address the cultural and behavioural aspects of safety, Kumba launched ‘I Care Buddy’, which empowers workers to take action and proactively stop unsafe activities.
Environmental performanceEnergy use decreased by 1% to 8.8 million GJ (2018: 8.9 million GJ) and GHG emissions increased by 4% to 1.00 Mt CO2e (2018: 0.96 Mt CO2e). Current energy efficiency and GHG emission reduction projects include the Kolomela Drill Performance Improvement project and the Sishen Primary Haul Road Improvement project.
Financial and operational reviewUnderlying EBITDA increased by 51% to $2,243 million (2018: $1,489 million), driven by a 35% increase in the average realised iron ore price to $97/tonne (2018: $72/tonne). FOB unit costs increased marginally to $33/tonne (2018: $32/tonne) primarily due to higher maintenance costs and mining in a more geologically challenging area of the mine. These factors were partly offset by the weaker South African rand, operational efficiency improvements and cost savings.
Total sales volumes decreased by 3% to 42.0 Mt (2018: 43.3 Mt) due to lower domestic sales of 2.2 Mt (2018: 3.3 Mt) following the winding down of the Saldanha Steel plant. Export sales of 39.8 Mt (2018: 40.0 Mt) were marginally lower due to the scheduled refurbishment of the second ship loader at Saldanha port. Consequently, total finished stock increased to 6.6 Mt(1) (2018: 5.3 Mt). Rail performance improved significantly in 2019, with port stock levels well set for the first quarter of 2020.
Markets
Kumba’s outperformance over the IODEX (Platts) 62% Fe CFR China index was primarily due to the higher iron content at 64.2% and the relatively high proportion (approximately 67%) of lump in its product portfolio.
Minas-Rio’s pellet feed product is also higher grade (higher iron content of 67% and lower gangue) than the reference product used for the IODEX 62% Fe CFR China index. The Metal Bulletin (MB) 66 index, therefore, is used when referring to Minas-Rio product.
2019 2018
Average market price (IODEX 62% Fe CFR China – $/tonne) 93 69
Average market price (MB 66% Fe Concentrate CFR – $/tonne) 104 95
Average realised price (Kumba export – $/tonne) (FOB Saldanha) 97 72
Average realised price (Minas-Rio – $/tonne) (FOB wet basis) 79 70
Operational performanceTotal production decreased by 2% to 42.4 Mt (2018: 43.1 Mt), driven by a 5% decrease at Kolomela to 13.2 Mt (2018: 13.9 Mt) as a result of the infrastructure upgrade of the DMS plant. Production volumes at Sishen were flat at 29.2 Mt, with improved plant performance in the second half of the year compensating for the operational challenges earlier in the year.
Sishen’s waste stripping decreased marginally to 181 Mt (2018: 182 Mt), while Kolomela’s waste stripping increased by 13% to 63 Mt (2018: 56 Mt). Progress continues to be made towards P101 benchmark efficiency, with Kumba’s operating efficiency increasing to 68% (2018: 65%). The efficiency improvement projects included improving truck efficiency and payloads, payload management and smart roads.
Operational outlookKumba’s production guidance for 2020 is 41.5-42.5 Mt.
70 Anglo American plc Integrated Annual Report 2019
STRATEGIC REPORT IRON ORE

MINAS-RIO
2019 RESULTS – MINAS-RIO2019 2018
Production volume (Mt)(1) 23.1 3.4
Sales volume (Mt) 22.9 3.2
Unit cost ($/t)(2) 21 –
Group revenue – $m 2,313 328
Underlying EBITDA – $m(3) 1,164 (312)
Mining EBITDA margin 50% –
Underlying EBIT – $m(3) 1,034 (411)
Capex – $m 205 106
Attributable ROCE 20% (9)%
Fatalities 0 0
TRCFR 1.48 2.14
Energy consumption – million GJ 5.1 1.8
GHG emissions – Mt CO2 equivalent 0.20 0.09
Total water withdrawals – million m3 28.8 28.3
Employee numbers 3,000 2,000
(1) Production is Mt (wet basis).(2) Unit costs are on an FOB (wet) basis and were not disclosed for 2018, due to the suspension of operations.(3) Iron Ore Brazil segment includes $55 million projects and corporate costs (2018: $40 million).
SafetyMinas-Rio has not had a fatal incident since 2015. In 2019, the lost-time injury frequency rate decreased by 10% to 0.85 (2018: 0.94) and the total recordable case frequency rate decreased by 31% to 1.48 (2018: 2.14).
Minas-Rio continued to implement its safety plan throughout the year, which is aligned to the Group’s Elimination of Fatalities programme. The actions implemented address behavioural change and include increasing leadership presence in the field and improving contractor management.
Environmental performanceMinas-Rio’s energy use and GHG emissions have increased year-on-year, owing to the restart of operations in December 2018.
Energy use increased by 183% to 5.1 million GJ (2018: 1.8 million GJ) and GHG emissions increased by 122% to 0.20 Mt CO2e (2018: 0.09 Mt CO2e).
Financial and operational reviewMinas-Rio recorded an underlying EBITDA of $1,164 million (2018: $312 million loss), reflecting the solid ramp-up following approval to restart the operation in December 2018, as well as cost efficiencies and strong price realisation. Unit costs of $21/tonne, lower than the original guidance of $28-$31/tonne, were driven by the higher production, P101 initiatives to improve productivity, and lower energy and consumables prices.
Operational performanceProduction of 23.1 Mt (2018: 3.4 Mt) was driven by strong operational performance, reflecting the optimisation work undertaken during 2018 while operations were suspended, the impact of P101 productivity initiatives and access to the Step 3 mining area higher grade ore. The construction of the scheduled tailings dam raise was completed in August 2019, and approval for the conversion of the installation licence to an operating licence was granted in December 2019.
Operational outlookProduction guidance for 2020 is 22-24 Mt, which allows for a one-month production stoppage in the second quarter to carry out routine internal scanning of the pipeline.
71Anglo American plc Integrated Annual Report 2019

COAL
Tyler MitchelsonCEO Metallurgical Coal
July NdlovuCEO Coal South Africa
Seamus FrenchCEO Bulk Commodities and Other Minerals
We are the world’s third largest exporter of metallurgical coal and our operations serve customers throughout Asia, Europe and South America. Our tier one assets include the Moranbah North (88% ownership) and Grosvenor (100% ownership) metallurgical coal mines, both located in Queensland, Australia. In 2019, Anglo American entered into a transaction, expected to complete in 2020, to provide for the equalisation of ownership across our integrated metallurgical coal operations at Moranbah North and Grosvenor through the sale of 12% in Grosvenor mine to the minority shareholders in Moranbah North.
We have reduced our South African thermal coal portfolio to concentrate on export markets, supplying around 19 Mt of thermal coal a year to our customers in Europe and Asia. Our South African export product is derived from three wholly owned and operated mines – Goedehoop, Greenside and Khwezela; Zibulo (73% owned); as well as from Mafube colliery, a 50:50 joint operation. These mines operate in the first quartile of the seaborne cost curve and produce high quality thermal coal. We also produce around 10 Mt a year of thermal coal for sale to the domestic market.
Our high quality assets provide a reliable supply of niche products our wide range of customers need, in both metallurgical coal (for steelmaking) and thermal coal (for electricity generation). Our coal portfolio is geographically diverse, with metallurgical coal assets in Australia, and thermal coal assets in South Africa and Colombia.
In Colombia, Anglo American, BHP and Glencore each have a one-third shareholding in Cerrejón, an independently managed associate and one of the country’s largest thermal coal exporters.
Uses of coalMetallurgical coal is an essential ingredient in blast-furnace steel production, being used for its mechanical, chemical and energy properties.
Around 70% of global steel output is produced using this method. Emerging markets, particularly in the Asia-Pacific region, continue to drive demand for metallurgical coal – helping to generate the steel needed for infrastructure, housing, transport and machinery.
Thermal coal is the heat source for around 40% of all electricity generated globally today. India and China’s reliance on thermal coal is expected to drive demand in absolute terms in the near term. However, fossil fuels are being increasingly contested by society and a responsible transition away from their use is necessary to achieve the Paris Agreement on Climate Change.
KEY Export market
Export market/Domestic market
Domestic market
Port
Goedehoop
Isibonelo
Greenside
Khwezela
Mafube
Zibulo
R ichards Bay Coal Terminal
Cerrejón (TC)
Moranbah North (MC)
Capcoal (MC/TC)(1)
Grosvenor (MC)
Dawson (MC/TC)
Grasstree (MC)(1)
Jellinbah (MC/TC)
SOUTH AFRICA AUSTRALIA
COLOMBIA
METALLURGICAL COAL THERMAL COAL
(1) Part of the Capcoal complex.
2019 SUMMARY – METALLURGICAL COAL
1Fatality
6.20TRCFR
$1,707mUnderlying EBITDA
45%Mining EBITDA Margin
22.9 MtProduction volume
2019 SUMMARY – THERMAL COAL SOUTH AFRICA
1Fatality
1.56TRCFR
$(5)mUnderlying EBITDA
(3)%Mining EBITDA Margin
17.8 MtExport production volume
72 Anglo American plc Integrated Annual Report 2019
STRATEGIC REPORT COAL

China 767
Other Asia 190
Europe (incl. CSI) 134
North America 24
South America 19
Africa 5
Other 7
Total 1,146
METALLURGICAL COAL CONSUMPTION BY REGION
%Mt
67
17
12
2
2
–
–
Source: CRU
China 697
Australia 188
Europe (incl. CIS) 104
North America 99
Other Asia 43
Other 9
Africa 8
Total 1,148
METALLURGICAL COAL PRODUCTION BY REGION
%Mt
61
16
9
9
3
1
1
Source: CRU
Metallurgical coal is used principally in blast-furnace steelmaking production; around 70% of global steel output is produced using this method and, currently, there are no viable commercial substitutes for metallurgical coal in the steelmaking process.
China 3,319
Other Asia 1,527
Europe (incl. CIS) 677
North America 583
Africa 195
Other 70
South America 42
Total 6,413
THERMAL COAL CONSUMPTION BY REGION
%Mt
52
24
11
9
3
1
–
Source: CRU
China 3,136
Other Asia 1,373
Europe (incl. CIS) 776
North America 605
Africa 276
Australia 271
Other 89
Total 6,526
%Mt
48
21
12
9
5
4
1
THERMAL COAL PRODUCTION BY REGION
Source: CRU
73Anglo American plc Integrated Annual Report 2019

METALLURGICAL COAL
2019 RESULTS – METALLURGICAL COAL2019 2018
Production volume (Mt)(1) 22.9 21.8
Sales volume (Mt)(2) 22.4 22.0
Price ($/t)(3) 165 190
Unit cost ($/t)(4) 63 64
Group revenue – $m 3,756 4,231
Underlying EBITDA – $m(5) 1,707 2,158
Mining EBITDA margin 45% 51%
Underlying EBIT – $m(5) 1,079 1,722
Capex – $m 670 574
Attributable ROCE 39% 80%
Fatalities 1 0
TRCFR 6.20 9.04
Energy consumption – million GJ 10.1 9.0
GHG emissions – Mt CO2 equivalent 8.17 6.85
Total water withdrawals – million m3 18.2 23.4
Employee numbers 2,000 2,000
(1) Production volumes are saleable tonnes and exclude thermal coal production of 1.4 Mt (2018: 1.4 Mt).(2) Sales volumes exclude thermal coal sales of 1.8 Mt (2018: 1.6 Mt).(3) Realised price is the weighted average hard coking coal and PCI sales price achieved.(4) FOB cost per saleable tonne, excluding royalties and study costs.(5) Metallurgical Coal segment includes $69 million projects and corporate costs (2018: $52 million).
Safety Metallurgical Coal suffered one loss of life during 2019, when Bradley Hardwick lost his life in a mobile equipment related incident at Moranbah North mine in Queensland. The lost-time injury frequency rate decreased by 41% to 4.32 (2018: 7.33), and the total recordable case frequency rate decreased by 31% to 6.20 (2018: 9.04).
The business safety improvement plan is focused on Elimination of Fatalities. Improvements have been made in operational risk management and critical control management, as well as operational planning and cultural and behavioural change.
Environmental performanceEnergy use and GHG emissions have increased year-on-year, primarily due to higher levels of methane gas in the coal seams. Energy use increased by 12% to 10.1 million GJ (2018: 9.0 million GJ) and GHG emissions by 19% to 8.17 Mt CO2e (2018: 6.85 Mt CO2e).
In 2019, over half of Metallurgical Coal’s total GHG emissions were offset by abatement projects, primarily through the sale of methane-rich gas for power generation. A significant technical challenge is to reduce emissions from low concentration methane in ventilation air within our underground operations. As there is currently no proven ventilated air methane mitigation technology in use in Australia, Anglo American is actively supporting research with the Australian Coal Industry’s Research Program and the Australian Coal Association Low Emissions Technology Limited research fund to trial safe mitigation technology.
Financial and operational reviewUnderlying EBITDA decreased by 21% to $1,707 million (2018: $2,158 million), with a 2% increase in sales volumes and a 2% decrease in US dollar unit costs to $63/tonne (2018: $64/tonne), being offset by a 13% reduction in the realised price for metallurgical coal.
Markets2019 2018
Average benchmark price hard coking coal ($/tonne)(1) 177 207Average benchmark price PCI ($/tonne)(1) 110 136Average realised price for premium low-volatile hard coking coal ($/tonne) 171 194Average realised price for PCI ($/tonne) 110 128
(1) Represents average spot prices.
Average realised prices differ from the average market price owing to differences in material grade and timing of contracts.
Market prices decreased in line with demand through the second half of the year. Demand was affected by increasingly stringent coal import policies at ports in China and a slowdown in the Indian economy, as well as lower production at east Asian steel mills in response to weaker steel margins.
Operational performanceProduction increased by 5% to 22.9 Mt (2018: 21.8 Mt), owing to a 1.0 Mt production increase at Grosvenor and operational improvements leading to a 10% increase in wash plant throughput, partially offset by the impact of an extended longwall move at Moranbah. In addition, there was a strong performance at Dawson where P101 productivity improvements drove an increase in shovel and dragline performance.
Operational outlookExport metallurgical coal production guidance for 2020 has been revised to 19-21 Mt (previously 21-23 Mt), with unit costs of around $70/tonne (previously around $65/tonne) following a roof collapse at Moranbah North on 30 January 2020. The sale of a 12% interest in the Grosvenor mine is expected to complete in 2020, equalising the ownership across Moranbah-Grosvenor, which is reflected in the guidance.
74 Anglo American plc Integrated Annual Report 2019
STRATEGIC REPORT COAL

Using a model of a continuous miner, Grasstree mine longwall maintenance supervisor Steven Henderson (right) points out to Group finance director Stephen Pearce some of the features of the mine’s dust-suppression system.
Breathing easier – solving the problem of respirable coal dustCoal workers’ pneumoconiosis is a potentially life-threatening disease caused by the fraction of total inhalable dust that is not deposited in the respiratory tract managing to penetrate the lungs.
Metallurgical Coal’s Grasstree Development and Engineering Team recognised that a new preventative approach was required to reduce respirable dust throughout the underground development process.
Focusing on the continuous miner, as this generates the most amount of coal dust in a development panel, the basic principle of Grasstree’s dust-suppression solution was to implement engineering controls that isolate workers from the source of dust; thereby forming a safe working area during the production sequence. This led to a dust-suppression system involving the revolutionary application of biodegradable foam to different points of the machine.
The initial design challenge was in fitting all components into the continuous miner’s limited space. This was resolved by refining the circuit and redesigning all valves into one manifold block and one mixing chamber.
Then, following further testing, the first component board design was refined to consist of a foam board unit and stand-alone tank. The operation also needed to reduce the time needed for maintenance downtime; by improving access to components and
eliminating pipework, downtime was reduced from an initial two to three hours a week to five minutes.
The continuous miner’s dust-suppression system incorporates an integrated curtain spray on the machine’s shovel and an enviro-mist high-pressure spray system that eliminates respirable dust between 2.5 and 20 microns. Foam is dispensed through the continuous miner and, as the machine moves forward, the dust particles are coated with foam. The particles are agglomerated before being transported along a conveyor system out of the mine, also reducing dust at belt-transfer points.
This system is substantially reducing the health risks associated with underground mining, with a 96% reduction in respirable-dust exposure to development coal mine workers, making it a safer and healthier working environment.
The team has now applied the biodegradable foam to other equipment and machinery at other phases of the mining process, such as the breaker feeder at all belt-transfer points. The system has been fitted to Grasstree’s entire continuous miner fleet and is being applied in the development phases at our Grosvenor mine and Aquila project. We are also looking to replicate this solution at our other underground coal mines.
The importance of this innovation has been recognised by the wider industry, with the team receiving the coveted Innovation award at the Queensland Mining Industry Health and Safety Conference in 2018.
75Anglo American plc Integrated Annual Report 2019

Safety – South AfricaThermal Coal – South Africa recorded one fatality when Januarie Mokoena lost his life in an underground fall of ground incident, at Zibulo colliery. The lost-time injury frequency rate decreased, however, by 12% to 0.80 (2018: 0.91) and the total recordable case frequency rate decreased by 17% to 1.56 (2018: 1.87).
Thermal Coal – South Africa is committed to the Elimination of Fatalities programme, based on three main pillars: getting the basics right; integrating safety into the planning and execution of work; and achieving cultural change. Critical controls are continually assessed for effectiveness and strengthened through the implementation of technology solutions. The analysis of leading indicators, coupled to effective work planning, drives continual improvement and is designed to prevent incidents.
Environmental performance – South AfricaThermal Coal – South Africa’s total energy use decreased by 15% to 3.5 million GJ (2018: 4.1 million GJ), and GHG emissions decreased by 10% to 0.90 Mt CO2e (2018: 1.00 Mt CO2e).
The ECO2MAN programme continues to evaluate projects for energy and GHG emissions savings, with opportunity assessment reports to improve diesel energy efficiencies expected in early 2020. Advanced Process Control has delivered a 3.5% energy efficiency benefit at Greenside and is expected to deliver more savings across the business in 2020 as roll-out progresses. Opportunities related to the passive treatment of mine-affected water, and related circular economy projects, continue to be reviewed.
Financial and operational review – South AfricaUnderlying EBITDA fell to a $5 million loss (2018: $650 million profit), driven by a 30% decrease in the realised export thermal coal price and marginally lower export sales volumes at 18.1 Mt (2018: 18.3 Mt). Unit costs were in line with the prior year at $45/tonne (2018: $44/tonne) as productivity improvements, cost savings and the favourable impact of the weaker South African rand offset the effects of inflation and lower production volumes.
Revenue for thermal coal includes amounts earned from the sale of volumes purchased from third parties (non-equity traded sales) that were not mined by the Group. Excluding these volumes, revenue from the mining of thermal coal (including thermal coal volumes
from South Africa, Colombia and the Metallurgical Coal business) is $1,783 million (or 6% of the Group’s revenue).
2019 RESULTS – THERMAL COAL SOUTH AFRICA2019 2018
Export production volume (Mt)(1) 17.8 18.4
Export sales volume (Mt)(2) 18.1 18.3
Unit cost ($/t)(3) 45 44
Group revenue – $m 1,887 2,719
Underlying EBITDA – $m(4) (5) 650
Mining EBITDA margin(5) (3)% 34%
Underlying EBIT – $m(4) (94) 521
Capex – $m 264 148
Attributable ROCE (19)% 68%
Fatalities 1 2
TRCFR 1.56 1.87
Energy consumption – million GJ 3.5 4.1
GHG emissions – Mt CO2 equivalent 0.90 1.00
Total water withdrawals – million m3 52.8 38.1
Employee numbers 5,000 5,000
(1) Production volumes are saleable tonnes. South African production volumes include export primary production, secondary production sold into export markets, production sold domestically at export parity pricing and pre-commercial production volumes from Navigation section of Khwezela and excludes other domestic production of 10.0 Mt (2018: 13.7 Mt). Included in other domestic production in 2018 is 2.8 Mt from the Eskom-tied operations, which were sold on 1 March 2018.
(2) South African sales volumes include export primary production, secondary production sold into export markets and production sold domestically at export parity pricing and pre-commercial production volumes from Navigation section of Khwezela and exclude domestic sales of 9.8 Mt (2018: 13.1 Mt) and non-equity traded sales of 10.9 Mt (2018: 9.5 Mt). Included in 2018 is domestic sales of 2.8 Mt from the Eskom-tied operations, which were sold on 1 March 2018.
(3) FOB cost per saleable tonne, excluding royalties, for the trade operations.(4) Thermal Coal – South Africa segment includes $59 million projects and corporate costs (2018: $45 million).(5) Excludes impact of third-party sales and, in 2018, Eskom-tied operations.
Markets2019 2018
Average market price ($/tonne, FOB South Africa) 72 98
Average market price ($/tonne, FOB Colombia) 54 85
Average realised price – Export South Africa ($/tonne, FOB) 61 87
Average realised price – Domestic South Africa ($/tonne) 14 19
Average realised price – Colombia ($/tonne, FOB) 56 83
The average realised price for export thermal coal differs from the average market price owing to timing differences and quality discounts relative to the industry benchmark.
Thermal coal prices fell sharply as lower gas and higher carbon prices encouraged a switch from coal to gas-generated power in Europe. Indian imports, however, remained strong, supported by local steelmaking demand. Delays to customs clearances at Chinese ports and various restrictions in Korea and Taiwan kept pressure on Pacific pricing towards the end of the year.
Operational performance – South AfricaExport production decreased by 3% to 17.8 Mt (2018: 18.4 Mt) mainly due to mine sections reaching their end of life at Khwezela and Goedehoop.
THERMAL COAL
76 Anglo American plc Integrated Annual Report 2019
STRATEGIC REPORT COAL

Financial and operational review – ColombiaUnderlying EBITDA decreased by 66% to $130 million (2018: $388 million), reflecting a 33% decrease in average realised price and a 13% reduction in sales volumes as a result of weaker market demand, as well as dust restrictions in the first half of the year. In response to the lower demand, Cerrejón reduced unit costs by 8% to $33/tonne through optimisation of the mine plan to exclude higher cost volumes that were not economic at current prices.
Operational performance – ColombiaAnglo American’s attributable production from its 33.3% ownership of Cerrejón decreased by 16% to 8.6 Mt (2018: 10.2 Mt) in response to dust restrictions in the first half and a reduction in market demand in the second half of 2019.
Operational outlook – export thermal coal Export thermal coal production guidance for 2020 is around 26 Mt.
2019 RESULTS – THERMAL COAL COLOMBIA(1) 2019 2018
Production volume (Mt)(2) 8.6 10.2
Sales volume (Mt) 8.8 10.1
Unit cost ($/t)(3) 33 36
Group revenue – $m 494 838
Underlying EBITDA – $m 130 388
Mining EBITDA margin 26% 46%
Underlying EBIT – $m 25 295
Attributable ROCE 4% 35%
(1) Represents the Group’s attributable share from its 33.3% interest in Cerrejón. (2) Production volumes are saleable tonnes.(3) FOB cost per saleable tonne, excluding royalties.
77Anglo American plc Integrated Annual Report 2019

Beyond the mine gates – boosting the community’s life-chances Our Thermal Coal business unit in South Africa is busy with several community outreach initiatives. They include:
• A groundbreaking community scholarship scheme, launched in 2014, that has enabled 105 talented students from disadvantaged backgrounds to graduate from university and pursue extraordinarily bright futures
• Mafube colliery’s action plan for young people, including many with learning disabilities, to put their practical skills to use in the hospitality industry
• Isibonelo colliery’s intervention in education to provide supplementary classes in critical subjects, which has led to a significant number of participants receiving bursaries from a range of corporate players.
At Greenside colliery, the first phase of an operator-training initiative, launched in November 2018, has already resulted in 60 job-seekers being trained in the operation of capital equipment, and 20 more youths undergoing instruction for their driver’s licences, while a further 120 job-seekers had benefited from being trained as machine operators by the end of 2019.
The first 60 candidates have the option to be trained on three of the five operating machines: excavators, articulated dump trucks, tracked dozers, graders, and front-end loaders. Instruction is delivered by the fully accredited Smart Institute of Mines and comprises two weeks of theoretical and practical training. For the next intake, we used a local supplier, Progressive Training, which
is also accredited and participates with the Mining Qualifications Authority.
Practical, industry-relevant skills such as operator training are much sought-after in the Mpumalanga coal-mining region and have been selected specifically to boost participants’ chances of securing meaningful employment. Greenside’s community development superintendent Linda Dludlu takes up the story: “The mine’s ongoing stakeholder engagement initiatives have clearly demonstrated that skills development is an over-riding priority if our local youths are to get decent jobs. They have continually asked for training in practical skills that will enable them to access local employment opportunities or provide them with the ability to set up their own sustainable businesses.”
Candidates are drawn from a pool of local community members who have applied, unsuccessfully, for jobs at Greenside. “Unfortunately, we have a limited number of positions available at Greenside, so it’s encouraging that over 20 trainees have already been employed by Greenside, its contractors and other mining houses around the area”, says Linda.
Greenside HR manager, Sihle Nkomo, observes, “This initiative is a catalyst in making a difference to people’s lives both in and around the mine. It is an essential element in helping to equip young people with a skillset required for the future. Furthermore, it is designed to give job-seekers more agility in seeking formal employment, becoming service providers, contractors, or joining the entrepreneurial stream. It’s exciting to be part of this initiative to re-imagine mining.”
Featured are some of the 60 people from the Greenside colliery local community who have been trained, and qualified, to operate various kinds of mining machinery.
THERMAL COAL CONTINUED
78 Anglo American plc Integrated Annual Report 2019
STRATEGIC REPORT COAL

NICKEL AND MANGANESE
Seamus FrenchCEO Bulk Commodities and Other Minerals
Our nickel assets are wholly owned, consisting of two ferronickel production sites: Barro Alto and Codemin. Our Nickel business produces around 45,000 tonnes per annum of ferronickel, whose primary end use is in the global stainless steel industry.
In Manganese, we have a 40% shareholding in Samancor joint venture (managed by South32, which holds 60%).
Uses of nickel and manganeseThe stainless steel industry uses two-thirds of the world’s nickel production and virtually all ferronickel produced each year. The balance is used mainly in the manufacture of alloy steel and other non-ferrous alloys.
Stainless steel is a key input in high-tech construction, and most stainless steels contain about 8%-10% nickel. As an alloying element, nickel enhances important properties of stainless steel such as formability, weldability and ductility, while increasing corrosion resistance in certain applications.
The Nickel and Manganese operations both provide ingredients for stainless and alloy steels. They are located in Brazil (Nickel), as well as South Africa and Australia (Manganese).
Nickel is also used to make other alloys with special properties. Corrosion-resistant alloys are used in chemical plants, while ‘super-alloys’ withstand extreme temperatures and are used in aviation. Nickel is also used in electronics and as a substrate for chromium plating.
The most significant of all the industrial uses of manganese is also steel production, which consumes more than 85% of all manganese mined. The ore is particularly useful in increasing steel’s resistance to oxidation; it can also improve the overall strength, durability and workability of the material.
Barro Alto Codemin
1
Samancor’s Tasmanian Electro Metallurgical Company (TEMCO)
Samancor’s Groote Eylandt Mining Company (GEMCO)
BRAZIL – NICKEL AUSTRALIA – MANGANESE
Samancor Manganese – Metalloys
Samancor Manganese – Hotazel
KEY Mining operations
Other
SOUTH AFRICA – MANGANESE
2019 SUMMARY – NICKEL
0Fatalities
2.75TRCFR
$191mUnderlying EBITDA
33%Mining EBITDA Margin
42.6 ktProduction volume
2019 SUMMARY – MANGANESE
$443mUnderlying EBITDA
48%Mining EBITDA Margin
3.7 MtProduction volume – ore and alloys
Wilfred BruijnCEO Anglo American, Brazil
79Anglo American plc Integrated Annual Report 2019
STRATEGIC REPORT NICKEL AND MANGANESE

Since the rebuilding of its two furnaces was completed in 2015, Barro Alto’s plant has operated well, maintaining nameplate capacity of 36,000 tonnes of nickel contained in ferronickel per year. Moreover, the fundamental outlook for nickel appears to be robust. Among the major mined commodities, the metal has a very attractive demand outlook, driven by a step-change in electric vehicle demand and resilient demand for later-cycle stainless and specialist steels.
Asia
Oceania
South America and Caribbean
North America
Russia
Africa
Europe
%
51
17
9
8
8
4
3
NICKEL SUPPLY BY REGION
Global total: 2.5 Mt
Source: Wood Mackenzie
Stainless steel
Non-ferrous alloys
EV batteries and energy storage
Plating
Alloy steel
Other
Foundry
%
68
9
6
6
4
4
3
GLOBAL PRIMARY NICKEL DEMAND BY SECTOR
Global total: 2.4 Mt
Source: Wood Mackenzie
NICKEL AND MANGANESE CONTINUED
80 Anglo American plc Integrated Annual Report 2019
STRATEGIC REPORT NICKEL AND MANGANESE

NICKEL
SafetyThe Nickel business has not had a fatal incident since 2012. In 2019, however, the lost-time injury frequency rate increased by 7% to 1.45 (2018: 1.35), though the total recordable case frequency rate decreased by 9% to 2.75 (2018: 3.03).
During 2019, Nickel undertook an overhaul of operational risk management, including a review of critical controls, with a focus on high risk activities, the prevention of repeat incidents, implementation of Technology for Safety solutions, and improving the business unit’s safety culture.
Environmental performanceEnergy use increased by 1% to 20.2 million GJ (2018: 20.0 million GJ) and GHG emissions increased by 2% to 1.23 Mt CO2e (2018: 1.21 Mt CO2e).
At Barro Alto, a more reactive coal was tested in the rotary kilns to enhance performance. As a result, the stability of the electric furnaces improved and energy use decreased by 3%, saving almost 36,000 tonnes of CO2e. An initiative to reduce oil consumption through improved stabilisation in the coal pulverisation plant saved almost 65,000 tonnes of CO2e over 2018 and 2019.
Financial and operational reviewUnderlying EBITDA increased by 6% to $191 million (2018: $181 million), benefiting from improved operational stability and a 6% higher realised price, partly offset by a 3% decrease in sales volumes and higher unit costs.
Unit costs increased by 5% to 380 c/lb (2018: 361 c/lb), driven mainly by a rise in the consumption of coal as a reductant due to higher iron content in ore, the impact of higher consumable prices, and new local legislation that increased freight costs.
2019 RESULTS – NICKEL2019 2018
Production volume (t) 42,600 42,300
Sales volume (t) 41,700 43,100
Unit cost (c/lb)(1) 380 361
Group revenue – $m 572 560
Underlying EBITDA – $m(2) 191 181
Mining EBITDA margin 33% 32%
Underlying EBIT – $m(2) 89 75
Capex – $m 42 38
Attributable ROCE 4% 4%
Fatalities 0 0
TRCFR 2.75 3.03
Energy consumption – million GJ 20.2 20.0
GHG emissions – Mt CO2 equivalent 1.23 1.21
Total water withdrawals – million m3 6.3 8.0
Employee numbers 1,000 1,000
(1) C1 unit cost.(2) Includes $12 million of projects and corporate costs (2018: $8 million).
Markets2019 2018
Average market price (c/lb) 632 595
Average realised price (c/lb) 624 588
Ferronickel is traded based on discounts or premiums to the LME nickel price, depending on market conditions, supplier products and consumer preferences. Differences between market prices and realised prices are largely due to variances between the LME and the ferronickel price.
The average nickel price increased by 6% to 632 c/Ib (2018: 595 c/lb), driven by strong growth in stainless steel production in China and solid battery demand growth (principally, zero emission vehicles and lithium-ion-based energy storage). Prices were also supported by Indonesia bringing forward its ban on nickel ore exports from January 2023 to January 2020, which is expected to markedly reduce nickel ore supply to Chinese nickel pig iron producers.
Operational performanceNickel output increased by 1% to 42,600 tonnes (2018: 42,300 tonnes), reflecting improved operational stability.
Operational outlookProduction guidance for 2020 is 42,000-44,000 tonnes.
81Anglo American plc Integrated Annual Report 2019

MANGANESE
2019 RESULTS – MANGANESE(1)
2019 2018
Production volume (Mt) 3.7 3.8
Sales volume (Mt) 3.7 3.7
Group revenue – $m 926 1,147
Underlying EBITDA – $m 443 663
Mining EBITDA margin 48% 58%
Underlying EBIT – $m 388 610
Attributable ROCE 109% 159%
(1) Production, sales and financials include ore and alloy.
Financial and operational reviewUnderlying EBITDA decreased by 33% to $443 million (2018: $663 million), mainly owing to the lower manganese ore price and, to a lesser extent, an 18% decrease in attributable manganese alloy sales, in line with reduced Australian and South African alloy production.
MarketsThe average benchmark price for manganese ore (Metal Bulletin 44% manganese ore CIF China) was $5.58/dmtu, a decrease of 23% (2018: $7.24/dmtu). The effect of strong steel output and stricter reinforcing steel standards in China was more than offset by an increase in manganese ore supply from South Africa.
Operational performanceAttributable manganese ore production decreased by 3% to 3.5 Mt (2018: 3.6 Mt). Output from the Australian operations decreased by 6% owing to the impact of a major cyclone in March which, combined with high clay content, adversely affected the quality of the feed to the processing plant. This was partly offset by a 3% increase in production from the South African operations as a result of improved mining productivity.
82 Anglo American plc Integrated Annual Report 2019
STRATEGIC REPORT NICKEL AND MANGANESE

CORPORATE AND OTHER
Financial reviewCorporate and other reported an underlying EBITDA loss of $43 million (2018: $219 million loss). Revenue increased to $121 million (2018: $3 million), predominantly due to ramp-up of third-party shipping activity.
ExplorationExploration’s underlying EBITDA loss increased to $126 million (2018: $113 million loss), reflecting increased exploration activities across most product groups, in particular, nickel, iron ore and metallurgical coal.
Corporate activities and unallocated costsUnderlying EBITDA amounted to an $83 million gain (2018: $106 million loss), driven primarily by a benefit to EBITDA from the adoption of IFRS 16 Leases as items previously recorded as operating costs are now included within depreciation.
2019 RESULTS Grouprevenue◊
$m
UnderlyingEBITDA◊
$m
Underlying EBIT◊
$mCapex◊
$m
Segment total 121 (43) (229) 56
Prior year 3 (219) (226) 27
Exploration – (126) (128) 1
Prior year – (113) (113) –
Corporate activities and unallocated costs 121 83 (101) 55
Prior year 3 (106) (113) 27
83Anglo American plc Integrated Annual Report 2019
STRATEGIC REPORT CORPORATE AND OTHER

GOVERNANCE
This section of the Integrated Annual Report provides an overview of the means by which the Company is directed and controlled. The Board is there to support and challenge management and to ensure that we operate in a manner that promotes the long term success of Anglo American. Over the next few pages we describe the ways in which we seek to achieve this.
Board compositionAs described in my statement on pages 4-5, we announced a number of changes to the Board in 2019. In carrying out such ongoing Board refreshment, which is beneficial in itself, we must maintain the right balance of experience, skills, continuity and diversity required to be successful.
At the start of the year, Byron Grote was appointed our senior independent director in addition to continuing as the chair of the Audit Committee – we continue to benefit from Byron’s more than 35 years of experience across the natural resources sector. In addition, Anne Stevens took over stewardship of the Remuneration Committee, bringing her extensive global executive and board experience to the role. On 30 April 2019, Jack Thompson retired from the Board after nine years of service, and Ian Ashby took over the role of chair of the Sustainability Committee, enhancing its deliberations with his extensive executive background in mining.
In late August, Nolitha Fakude, who had served as a non-executive director since 2017, stepped off the Board to take on a key strategic management role in the Group as chair of our management board in South Africa and a member of the Group Management Committee. I would like to thank
Nolitha for her dedication and professionalism as a director and look forward to her continued contribution to the Group in her new role.
I was pleased to welcome three new non-executive directors to the Board – Marcelo Bastos joined the Board on 1 April 2019, Hixonia Nyasulu joined the Board on 1 November 2019, and Nonkululeko Nyembezi was appointed with effect from 1 January 2020. Marcelo’s extensive operational and project experience gained over a more than 30 year career in mining across numerous commodities and geographies, particularly in South America, will ensure we continue to include the appropriate mix of skills and perspectives in our Board discussions. Hixonia has highly relevant global board experience drawn from the natural resources, financial services and consumer industries. Her entrepreneurial spirit and passion for education and economic development add richness to our Board discussions. Nonkululeko’s engineering background and extensive experience spanning mining, steel, financial services and technology in South African and global organisations will offer us great breadth of insight.
Strong corporate governance underpins our ability to fulfil our Purpose. The Anglo American Board is committed to ensuring that we continue to adhere to high standards of corporate governance.”
Stuart Chambers Chairman
84 Anglo American plc Integrated Annual Report 2019
GOVERNANCE CHAIRMAN’S INTRODUCTION

Stuart Chambers and Marcelo Bastos at the Group’s Metallurgical Coal operations in Australia in April 2019, viewing a shovel in action at the Capcoal open cut mine.
Global Workforce Advisory PanelAs mentioned in the 2018 Integrated Annual Report, the Board embraced the greater focus on board-workforce engagement contained in the UK Corporate Governance Code (the Code) published in July 2018. The Board and management spent a considerable amount of time exploring options for the most effective, practical and sustainable way to meaningfully achieve the level of engagement contemplated by the Code. We formed a Global Workforce Advisory Panel (the Panel) – comprising 12 employees drawn from across our business – and designated our senior independent director, Byron Grote, to chair and engage with the Panel, to enable the Board to better understand and take into account the views of its workforce. The Panel held its first meeting in October 2019 in South Africa. I was pleased with the quality and the richness of the feedback we received and look forward to its continuation.
For more information on the Panel and the ways in which we currently engage with our workforce: See page 98
Director and Board visits to operationsI believe that director and Board site visits are invaluable. They provide an opportunity for all directors to learn more about the operations and understand the opportunities and challenges faced by the businesses in their local environments. Site visits are a key mechanism for the Board to directly engage with the workforce from a range of backgrounds and seniority, and also present opportunities to meet with local stakeholders and understand their interests and concerns. The site visits are described on page 97.
Board effectivenessAt least every three years the Board and its committees are evaluated by an external third party who interviews the directors and senior management to form an objective opinion on the performance of the Board and its members. Every board and every individual can benefit and improve from the receipt of constructive feedback and this Board and its directors are no exception. In 2018, we conducted an external evaluation of the Board, its committees and each of the directors. An internal evaluation was carried out in 2019. The actions we took during 2019 to address the points raised in the 2018 external review, the processes used, and the results of the 2019 evaluation are described on page 100. I am pleased to report that the overall conclusion was that the Board and committees continue to function well. Of course, there is always room for improvement
and each committee and the Board itself are developing action plans to ensure that we address the points raised by the evaluations.
Committee governanceStarting on page 101, each of the Board committee chairs presents a report on the activities of their committee during 2019. The effective and efficient operation of the committees and their interaction with the Board are vital to ensure that all matters receive the necessary attention in a timely manner. I am grateful to the members and the chairs of those committees in particular for their commitment and the work that they do throughout the year in this regard.
Appointment of external auditorIn May 2019, the Board announced its intention to propose the appointment of PricewaterhouseCoopers as the external auditor of the Company for the 2020 financial year and beyond, subject to approval by shareholders at the Annual General Meeting (AGM) in 2020. A robust tender process was conducted by the Audit Committee, further details of which are described on pages 107-108. On behalf of the Board, I would like to thank Deloitte for their significant contribution to the Group over the years.
Compliance with the UK Corporate Governance Code The Board supports the principles and provisions of the UK Corporate Governance Code (the Code) issued by the Financial Reporting Council (FRC), which is available on the FRC’s website (www.frc.org.uk). The principles and provisions of the Code have applied throughout the financial year ended 31 December 2019. It is the Board’s view that the Company has complied throughout the year with the Code. The ways in which the Code has been applied can be found on the following pages:
Code section and where to find details.
Section 1: Board leadership and company purposeFurther detail on how the Board promotes the long term success of the Group is provided in the Strategic Report on pages 10-11. Relations with shareholders are described on pages 98-99. For the ways in which the Board engages with its key stakeholders, see our Section 172 Statement on page 10, and the Stakeholder Engagement section on pages 98-99 of this report. Our whistleblowing programme is described on page 109.
Section 2: Division of responsibilitiesPages 86-92 give details of the Board and executive management and the Board governance structure.
Section 3: Composition, succession and evaluationThe processes we followed to refresh the Board are set out on page 95 and the work of the Nomination Committee is described on page 102.
Section 4: Audit, risk and internal controlThe report of the Audit Committee is found on pages 103-109, with further detail on the Group’s principal risks to the business in the Strategic Report on pages 44-49.
Section 5: RemunerationThe Group’s remuneration policy and the report of the Remuneration Committee are found on pages 110-138.
I hope you find this report useful and informative. I look forward to seeing as many of you as possible at our AGM and would encourage you to vote your shares even if you cannot attend in person, so that we gain a better understanding of the views of our shareholders as a whole.
Stuart Chambers Chairman
85Anglo American plc Integrated Annual Report 2019

DIRECTORS
Stuart Chambers (63)Chairman
Qualifications: BSc
Appointed: 1 September 2017 and as Chairman on 1 November 2017
Mark Cutifani (61)Chief Executive
Qualifications: BE (Mining-Hons), FAusIMM, FREng, CEngFIMMM, DBA (Hon), DoL (Hon)
Appointed: 3 April 2013 as Chief Executive
Stephen Pearce (55)Finance Director
Qualifications: BBus (Acc), FCA, GIA, MAICD
Appointed: 24 April 2017 as Finance Director
N S S
Skills and experienceStuart contributes to Anglo American significant global executive and boardroom experience across the industrial, logistics and consumer sectors.
He previously served as chairman of ARM Holdings plc and Rexam plc until 2016; and as a non-executive director on the boards of Tesco PLC (2010-15), Manchester Airport Group plc (2010-13), Smiths Group plc (2006-2012) and Associated British Ports Holdings plc (2002-06). Stuart’s executive career included 13 years at Pilkington plc and its subsequent parent company Nippon Sheet Glass until 2010, in a number of executive roles and ultimately as chief executive of both companies. Prior to that, he gained 10 years of sales and marketing experience at Mars Corporation, following 10 years at Shell as a chemical engineer.
Current external appointmentsChairman of Travis Perkins plc, and a member of the UK Takeover Panel.
NationalityBritish
Skills and experienceMark contributes to Anglo American over 40 years’ experience of the mining industry across a wide range of geographies and commodities.
Mark is a member of the Group Management Committee (GMC), is a non-executive director of Anglo American Platinum, chairman of Anglo American South Africa and chairman of De Beers.
Mark was previously CEO of AngloGold Ashanti Limited, a position he held from 2007-2013. Before joining AngloGold Ashanti, Mark was COO at Vale Inco where he was responsible for Vale’s global nickel business. Prior to this he held senior executive positions with the Normandy Group, Sons of Gwalia, Western Mining Corporation, Kalgoorlie Consolidated Gold Mines and CRA (Rio Tinto).
Current external appointmentsIndependent director of Total S.A. and a member of the board of trustees of The Power of Nutrition, an independent charitable foundation.
NationalityAustralian
Skills and experienceStephen contributes to Anglo American almost 20 years of public company director experience and more than 30 years’ experience in the mining, oil and gas, and utilities industries.
Stephen became a member of the GMC in January 2017 and joined the Board in April 2017. He is also a non-executive director of Anglo American Platinum and De Beers. Before joining Anglo American, Stephen served as CFO and an executive director of Fortescue Metals Group from 2010 to 2016. Prior to that, he held the positions of managing director and CEO of Southern Cross Electrical Engineering Ltd and was CFO of Alinta Ltd. Stephen previously served as a non-executive director of Cedar Woods Properties Ltd.
Current external appointmentsNon-executive director of BAE Systems plc.
NationalityAustralian
86 Anglo American plc Integrated Annual Report 2019
GOVERNANCE DIRECTORS

Committee member key
Audit Committee Nomination Committee Remuneration Committee
Sustainability Committee Chair of Committee Member of Committee
Tony O’Neill (62)Technical Director
Qualifications: MBA, BASc (Eng), FREng, FIMMM
Appointed: 22 July 2015 as Technical Director
Byron Grote (71)Senior Independent Director
Qualifications: PhD Quantitative Analysis
Appointed: 19 April 2013 and as Senior Independent Director on 1 January 2019
Ian Ashby (62)Independent Non-executive Director
Qualifications: B Eng (Mining)
Appointed: 25 July 2017
S A N R N R S
Skills and experienceTony contributes to Anglo American almost 40 years’ experience in the mining industry across numerous geographies, and commodities spanning iron ore, copper, nickel and gold.
Tony joined Anglo American in September 2013 and has responsibility for the Technical and Sustainability function. He is a member of the GMC and a non-executive director of Anglo American Platinum and De Beers.
Tony was previously Executive Vice President – Business and Technical Development at AngloGold Ashanti Limited from 2008, where he served as joint acting CEO during 2013.
His extensive career in the mining industry includes roles as Operations Executive at Newcrest Mining and Head of the Gold Business at Western Mining Corporation.
Current external appointmentsNone
NationalityAustralian
Skills and experienceByron has over 35 years of experience across the natural resources sector. He contributes to Anglo American broad business, financial and board experience in numerous geographies.
In 2019, Byron was designated by the Board to chair and engage with Anglo American’s newly created Global Workforce Advisory Panel.
He served on the BP plc board from 2000 until 2013 and was BP’s chief financial officer during much of that period. He was previously a non-executive director of Unilever NV and Unilever PLC.
Current external appointmentsVice chairman of the supervisory board of Akzo Nobel NV and a non-executive director of Standard Chartered PLC and Tesco PLC. A member of the European Audit Committee Leadership Network and an emeritus member of the Cornell University Johnson Advisory Council.
NationalityAmerican/British
Skills and experienceIan contributes to Anglo American substantial knowledge of the minerals industry across a wide range of commodities, combined with global operating, major projects and capital development experience.
Ian served as President of Iron Ore for BHP Billiton between 2006 and 2012, when he retired from the company. During his 25-year tenure with BHP Billiton, Ian held numerous roles in its iron ore, base metals and gold businesses in Australia, the USA, and Chile, as well as projects roles in the corporate office. He began his nearly 40 year mining career as an underground miner at the Mount Isa Mines base metals operations in Queensland, Australia.
Ian has previously served as chairman of Petropavlovsk plc, and a non-executive director of Alderon Iron Ore Corp, Nevsun Resources Ltd, New World Resources PLC and Genco Shipping & Trading, and in an advisory capacity with Apollo Global Management and Temasek.
Current external appointmentsNone
NationalityAustralian
87Anglo American plc Integrated Annual Report 2019

DIRECTORS CONTINUED
Marcelo Bastos (56)Independent Non-executive Director
Qualifications: MBA, BSc (Hons) Mech Eng
Appointed: 1 April 2019
S Hixonia Nyasulu (65)Independent Non-executive Director
Qualifications: BA Hons
Appointed: 1 November 2019
Dr Mphu Ramatlapeng (67)Independent Non-executive Director
Qualifications: MD, MHSc
Appointed: 8 July 2013
SN
Skills and experienceMarcelo contributes to Anglo American more than 30 years of operational and project experience in the mining industry across numerous commodities and geographies, particularly in South America.
Marcelo served as chief operating officer of MMG between 2011 and 2017, responsible for the group’s copper, zinc, silver, lead and gold operations, and sales and marketing. In this role, he also led the planning and development of the Las Bambas copper mine in Peru. Prior to MMG, Marcelo served as president of the BHP Mitsubishi Alliance joint venture (metallurgical coal), president of BHP’s Cerro Matoso nickel operation in Colombia, president of nickel Americas, and president of Nickel West in Australia. His early career until 2004 at Vale included serving as general manager of the Carajás operations in northern Brazil and he was ultimately director for the company’s base metals operations. Marcelo is a former non-executive director of Oz Minerals Ltd.
Current external appointmentsNon-executive director of Aurizon Holdings Ltd, Golder Associates, and Iluka Resources Ltd.
NationalityBrazilian/Australian
Skills and experienceHixonia contributes to Anglo American significant global board experience drawn from the natural resources, financial services and consumer industries.
Hixonia has previously served as a non-executive director on the boards of Sasol, including five years as chairman, Nedbank, Unilever NV and Unilever PLC. She has also served as a member of the South Africa advisory board of JPMorgan and on the board of the Development Bank of Southern Africa. In 2004, Hixonia founded Ayavuna Women’s Investments (Pty) Ltd, a female-controlled investment holding company. Prior to that, she ran T.H. Nyasulu & Associates, a strategy, marketing and research company, after starting her career at Unilever in South Africa. Hixonia was a founder member of the Advisory Group formed by the World Economic Forum to set up a community of global chairs.
Current external appointmentsSenior independent director of Vivo Energy plc. A member of the board of AGRA, and chairs the Africa Economic Challenge Fund, both not-for-profit organisations.
NationalitySouth African
Skills and experienceMphu is a highly experienced leader who contributes to Anglo American a broad range of global health expertise at board level across both the public and private sectors.
Mphu served as Minister of Health and Social Welfare of Lesotho between 2007 and 2012. In this role, she championed Lesotho’s significant achievements in reducing the transmission of HIV from mother to child. Across her career, she has been a leading advocate for women in business, including serving as founding board member of Women in Business in Lesotho. Mphu was formerly the vice chair of the Global Fund to Fight AIDS, TB and Malaria.
Current external appointmentsExecutive vice president of HIV/AIDS and Tuberculosis programmes for the Clinton Health Access Initiative, and a member of the board of directors of Living Goods, a not-for-profit organisation.
NationalityLesotho
88 Anglo American plc Integrated Annual Report 2019
GOVERNANCE DIRECTORS

Committee member key
Audit Committee Nomination Committee Remuneration Committee
Sustainability Committee Chair of Committee Member of Committee
Jim Rutherford (60) A R S Independent Non-executive Director
Qualifications: BSc (Econ), MA (Econ)
Appointed: 4 November 2013
Anne Stevens (71)Independent Non-executive Director
Qualifications: BSc, PhD
Appointed: 15 May 2012
Nonkululeko Nyembezi (59)Independent Non-executive Director
Qualifications: MSc, BSc, MBA
Appointed: 1 January 2020
A N R A
Skills and experienceJim has over 25 years’ experience in investment management and investment banking. He has extensive international experience and contributes to Anglo American considerable financial insight from the perspective of the capital markets and a deep understanding of the mining industry.
Jim was formerly chairman of Dalradian Resources Inc. Between 1997 and 2013, he was a senior vice president of Capital International Investors, a division of Capital Group, and had responsibility for investments in the mining and metals industry. Prior to joining Capital Group, Jim was an investment analyst covering the South American mining and metals industry for HSBC James Capel in New York.
Current external appointmentsDeputy chairman of Centamin plc, senior independent director of Anglo Pacific Group, and a non-executive director of GT Gold Corp.
NationalityBritish
Skills and experienceAnne contributes to Anglo American a wealth of experience and wide-ranging commercial acumen from a number of global industries in North, Central and South America.
Anne was chief executive of GKN plc from November 2017 to April 2018. She was formerly chairman and CEO of SA IT Services from 2011 until her retirement in December 2014. From 2006 to 2009, Anne was chairman and CEO of Carpenter Technology Corporation. Prior to this, she was COO for the Americas at Ford Motor Company until 2006, the culmination of her 16 year career with the company. Her early career was spent at Exxon Corporation, where she held roles in engineering, product development, and sales and marketing. Anne is a former non-executive director of Lockheed Martin Corporation, GKN plc and XL Catlin.
Current external appointmentsNone
NationalityAmerican
Skills and experienceNonkululeko contributes to Anglo American great breadth of technical and strategic insights with a background in engineering and extensive experience spanning mining, steel, financial services and technology in South African and global organisations.
Until December 2019, Nonkululeko was chairman of Alexander Forbes Group and has previously served as a non-executive director on the boards of Old Mutual plc, Exxaro Resources, Universal Coal plc and Denel, and as CEO of ArcelorMittal South Africa. In her earlier career, Nonkululeko was chief officer of M&A for the Vodacom group and chief executive officer of Alliance Capital, the then local subsidiary of a New York-based global investment management company.
Current external appointmentsChief executive officer of Ichor Coal N.V., chairman of JSE Limited and Macsteel Service Centres SA, and a non-executive director of Standard Bank of South Africa Limited.
NationalitySouth African
In addition, the following directors served during the year:
Nolitha Fakude stepped down from the Board as a non-executive director on 31 August 2019 following her appointment as Group Director – South Africa and Chairman of Anglo American’s management board in South Africa, from 1 September 2019. See page 90 for biographical details.
Jack Thompson stepped down from the Board as a non-executive director on 30 April 2019.
89Anglo American plc Integrated Annual Report 2019

Group Management Committee members
EXECUTIVE MANAGEMENT
Mark CutifaniChief Executive
See page 86 for
biographical details
Member since April 2013
Stephen PearceFinance Director
See page 86 for
biographical details
Member since January 2017
Tony O’NeillTechnical Director
See page 87 for
biographical details
Member since September 2013
Nolitha Fakude (55)
Group Director – South Africa
Ruben Fernandes (54)
CEO of Base Metals
Bruce Cleaver (54)
CEO of De Beers Group
Didier Charreton (56)
Group Director – People and Organisation
Seamus French (57)
CEO of Bulk Commodities and Other Minerals
Qualifications: BA (Hons)
Member since: September 2019
Skills and experienceNolitha was appointed Group Director – South Africa on 1 September 2019. From April 2017 to August 2019, she served as a non-executive director on the Board of Anglo American plc.
Until 2016, Nolitha served as an executive director at Sasol Limited and Executive Vice President of Strategy and Sustainability. Prior to that she held senior management positions in corporate affairs, strategy and operations in the retail and financial sectors.
Nolitha is a non-executive director of JSE Limited, and a Patron of Guild Cottage home for girls. In her non-executive career, she has previously served as deputy chair and lead independent director of Datacentrix Holdings Limited, and as a non-executive director of Harmony Gold and Woolworths Holdings.
Qualifications: BSc, LLB, LLM
Member since: January 2016
Skills and experienceBruce has served as CEO of De Beers Group since July 2016. He has previously served as Group Director, Strategy and Business Development at Anglo American, as well as Executive Head of Strategy and Corporate Affairs for De Beers, having joined the Group in 2005. Before joining De Beers, he was a partner at Webber Wentzel, Africa’s largest law firm, specialising in commercial matters.
Qualifications: MSc
Member since: December 2015
Skills and experienceDidier joined Anglo American in December 2015. He has held a number of senior HR roles across his 30 year career. From 2007 until 2014, Didier was chief human resources officer for Baker Hughes, the US-based oilfield services company. Prior to 2007, he was HR director at Coats plc in the UK, and before that held a number of HR roles at Schlumberger, based in the US, Argentina, Venezuela and France.
Qualifications: MBA, MsC (Metallurgical Engineering)
Member since: March 2019
Skills and experienceRuben was appointed CEO of Base Metals on 1 March 2019. He previously served as CEO of Anglo American Brazil. Prior to joining the Group in 2012, Ruben was head of mining at Votorantim Metals in Brazil, responsible for projects and exploration activities around the world, as well as operations in Peru and Colombia. Between 2009 and 2011, he was COO at Vale Fertilizers, responsible for the fertiliser operations, sales and marketing. Ruben was also CEO of Kaolin Companies – Pará Pigments and Cadam – two subsidiaries of Vale, between 2007 and 2009, and held various analysis, marketing and project roles in Vale’s Base Metals business which he joined in 1999. Between 1988 and 1998, he held several leadership roles in the special alloys industry.
Qualifications: B Eng (Chemical)
Member since: October 2009
Skills and experienceSeamus has responsibility for the Group’s Coal, Iron Ore and Nickel businesses. He is a non-executive director of Kumba Iron Ore. Seamus joined the Group in 2007 and was CEO of Metallurgical Coal between 2009 and 2013, and CEO of Coal until 2015. Prior to his career at Anglo American, Seamus joined WMC Resources in Australia in 1994 in a strategic planning and business development role, and progressed to various operational management roles, gaining extensive experience in the Gold and Nickel businesses before being appointed executive general manager of the Copper-Uranium division. Seamus joined BHP Billiton as Global Vice President, Business Excellence, following its takeover of WMC in 2005.
90 Anglo American plc Integrated Annual Report 2019
GOVERNANCE EXECUTIVE MANAGEMENT

Richard Price (56)
Group General Counsel and Company Secretary
Chris Griffith (55)
CEO of Anglo American Platinum
Duncan Wanblad (53)
Group Director – Strategy and Business Development
Anik Michaud (52)
Group Director – Corporate Relations
Peter Whitcutt (54)
CEO of Marketing
Themba Mkhwanazi (50)
CEO of Kumba Iron Ore
Qualifications: LL.B, BA (Hons)
Member since: May 2017
Skills and experienceRichard joined Anglo American as Group General Counsel in May 2017 and was appointed as Company Secretary in March 2018. Prior to joining Anglo American, he was a partner at Shearman & Sterling, the international law firm working across EMEA, Asia and North America. In private practice, Richard acted for clients across the metals, mining, energy and financial services sectors, among others, assisting them with complex financing, corporate and compliance matters.
Qualifications: B Eng (Mining) Hons, Pr Eng
Member since: October 2009
Skills and experienceChris has served as CEO of Anglo American Platinum since September 2012. He was previously CEO of Kumba Iron Ore between 2008 and 2012 and prior to this, served as Anglo American Platinum’s head of joint operations. Chris has been with the Group for 30 years.
As announced on 17 February 2020, Chris will step down as CEO of Anglo American Platinum on 16 April 2020.
Qualifications: LL.L (Law)
Member since: March 2015
Skills and experienceAnik has served as Group Director – Corporate Relations since June 2015. Her remit includes corporate communication, international and government relations, social performance and engagement, the implementation of the Group’s Sustainable Mining Plan under the FutureSmart Mining™ programme, and the office of the Chief Executive. Anik joined Anglo American in 2008 as Group head of corporate communication. Prior to that, she was director of public affairs for Rio Tinto Alcan, following 10 years with the Alcan group. Anik began her career as the political attaché to the Minister of Finance for Quebec.
Qualifications: BSc (Eng) Mech, GDE (Eng Management)
Member since: October 2009
Skills and experienceDuncan led our Base Metals business as CEO from 2013 to 2019, and took on the Strategy and Business Development portfolio as Group Director in 2016. He is a non-executive director of De Beers and Kumba Iron Ore.
Between 2009 and 2013, Duncan held the position of Group Director – Other Mining and Industrial. He was appointed joint interim CEO of Anglo American Platinum in 2007 (having served on the board since 2004), before taking over as CEO of Anglo American’s Copper operations in 2008. Duncan began his career at Johannesburg Consolidated Investment Company Limited in 1990.
Qualifications: Bcom (Hons), CA (SA), MBA
Member since: October 2009
Skills and experiencePeter has served as CEO of Marketing since January 2016. He is a non-executive director of De Beers.
Peter joined the Group in 1990 within the Corporate Finance division. He worked on the merger of Minorco with Anglo American Corporation of South Africa, the listing of Anglo American plc in 1999 and the subsequent unwinding of the cross-holding with De Beers. Peter was appointed Group Head of Finance in 2003, CFO of Base Metals in August 2008 and from 2013 to 2015, he served as Group Director – Strategy, Business Development and Marketing.
Qualifications: B Eng (Chemical) Hons
Member since: August 2019
Skills and experienceThemba has served as CEO of Kumba Iron Ore since September 2016. Prior to that, he was CEO for Anglo American’s Thermal Coal business in South Africa, having joined the Group in 2014. He has extensive experience in the resources industry, including 18 years in his native South Africa, as well as in the USA and Australia.
Before joining Kumba, Themba was managing director for Huntsman Tioxide in South Africa until 2007, when he was appointed COO of Richards Bay Minerals, a joint venture between Rio Tinto and BHP Billiton. In 2011, he was seconded to Rio Tinto’s Australian coal business, before taking up the role of regional general manager for the Americas in 2012.
Norman Mbazima served as a member of the GMC during the year, before stepping down on 30 June 2019.
91Anglo American plc Integrated Annual Report 2019

THE BOARD IN 2019
The role of the BoardThe Board provides leadership to the Group and is collectively responsible for promoting and safeguarding the long term success of the business. The Board is supported by a number of committees, to which it has delegated certain powers. The role of these committees is summarised below, and their membership, responsibilities and activities during the year are detailed on pages 101-138.
Some decisions are sufficiently material that they can only be made by the Board as a whole. The schedule of ‘Matters Reserved for the Anglo American plc Board’, and the committees’ terms of reference, explain which matters are delegated and which are retained for Board approval, and these documents can be found on the Group’s website.
Executive structureThe Board delegates executive responsibilities to the chief executive, who is advised and supported by the Group Management Committee (GMC). The GMC comprises the chief executive, business unit CEOs, Group directors of corporate functions and the Group general counsel and company secretary. The names of the GMC members, their roles and biographical details appear on pages 90-91.
Audit CommitteeOversight of financial reporting, audit, internal control and risk management.
For more details: See page 103
Nomination CommitteeResponsible for Board composition, appointment of directors and senior management and succession planning.
For more details: See page 102
Remuneration CommitteeDetermines the remuneration
of executive directors, the chairman and senior management and oversees remuneration policy for all employees.
For more details: See page 110
Sustainability CommitteeOversees management of sustainability issues, including
safety, health, environment, and social performance. For more details:
See page 101
THE BOARD
CHIEF EXECUTIVECorporate Committee
Reviews corporate and ethical policies and processes, and financial performance and
budgets at business unit level.
Group Management Committee (GMC)
Principal executive committee. Responsible for formulating strategy, setting targets/
budgets and managing the Group’s portfolio.
Operational CommitteeResponsible for driving operational best
practices across the Group and the setting of technical standards.
Investment CommitteeResponsible for making recommendations
on capital investment proposals.
Marketing Risk CommitteeResponsible for evaluating, monitoring, directing
and controlling the management of risk associated with the sales and marketing activities of the Group.
Innovation CommitteeResponsible for the governance of
technology innovation projects.
Senior Independent Director (SID)
Byron Grote has served as SID since 1 January 2019. He acts as a sounding board for the chairman and as an intermediary between the other directors.
The SID leads the annual performance of the chairman and is available to shareholders on matters
where the usual channels of communication are deemed inappropriate.
Independent Non-Executive Directors (NEDs)
The role of the NEDs is to constructively challenge and provide advice to executive management; effectively contribute to the development of the Group’s strategy; scrutinise the performance of
management in meeting agreed goals and monitor the delivery of the Group’s strategy.
Chief Executive
Mark Cutifani manages the Group. His main responsibilities include: executive leadership; formulation and implementation of the Group’s strategy as agreed by the Board; approval and monitoring of business plans; organisational structure and senior appointments; business development; and stakeholder relations.
Finance Director
Stephen Pearce leads the finance function and supports the chief executive in formulating and implementing strategy in relation to the financial and
operational performance of the Group.
Technical Director
Tony O’Neill leads the Technical and Sustainability function and supports the chief executive in developing and implementing strategy in relation
to mining and technology, business performance, safety, health and environment.
Chairman
Stuart Chambers leads the Board, ensuring it works constructively as a team. His main responsibilities include: chairing the Board and the Nomination Committee and setting their agendas; Board composition and
succession planning; providing support and counsel to the chief executive and his team; promoting the highest standards of integrity and governance; facilitating effective communication between directors; effective dialogue with shareholders and other stakeholders; and acting as ambassador for the Group.
92 Anglo American plc Integrated Annual Report 2019
GOVERNANCE THE BOARD IN 2019

Board compositionThe Board currently comprises the chairman, chief executive, two further executive directors (our finance director and technical director) and eight independent non-executive directors. The roles of our directors are summarised on the opposite page.
The broad range of skills and experience our Board members contribute to the long term sustainable success of Anglo American are set out on pages 86-89 and illustrated in the charts below. The Board is supported by the Group general counsel and company secretary.
There is a clear separation of responsibilities at the head of the Company between the leadership of the Board (the responsibility of the chairman) and the executive responsibility for leadership of the Company’s business (the responsibility of the chief executive).
Independence of the non-executive directorsAt the date of this report, two-thirds of the Board are independent non-executive directors. The Board determines all of the non-executive directors (other than the chairman) to be independent of management and free from any business or other relationship which could materially interfere with their ability to exercise independent judgement. The UK Corporate Governance Code (the Code) does not consider a chairman to be independent due to the unique position the role holds in corporate governance. Notwithstanding this, Stuart Chambers met the independence criteria contained in the Code when he was appointed as the Group’s chairman in 2017.
The chairman and the non-executive directors regularly meet without the executive directors present. At least once a year, led by the senior independent director, the non-executive directors meet without the chairman present, to appraise his performance.
Board experience and diversityThe broad range of skills and experience and the diversity of our Board members holding office as at the date of this report are illustrated below.
BOARD NATIONALITIES
Australian
British
South African
American
Lesotho
American/British
Brazilian/Australian
33%
67%
2
4
1
1
1
1
2
Male
Female
GENDER DIVERSITY
BOARD NATIONALITIES
Australian
British
South African
American
Lesotho
American/British
Brazilian/Australian
33%
67%
2
4
1
1
1
1
2
Male
Female
GENDER DIVERSITY
Mining
Engineering
Large project management
Construction in extractive industries
Finance
Marketing (downstream) or commodity trading
Safety, health, environment
Digital technology
External quoted boardroom experience
Previous chief executive
Experience as an investor
%
58
58
83
50
67
67
83
25
83
58
8
PROFESSIONAL EXPERIENCEPercentage of Board members
North America
South America
China
Southern Africa
Australia
India
%
83
58
50
50
42
17
REGIONAL EXPERIENCE(1)
Percentage of Board members
(1) In the regions in which the Group operates or has major markets in.
Time commitment and external appointments The Board, through the Nomination Committee, considers annually the time commitment expected from each of the non-executive directors to meet the expectations of their role.
The Board accepts and acknowledges that non-executive directors have business interests other than those of the Company and the Group. Prior to their appointment to the Board, non-executive directors are required to declare any directorships, appointments and other business interests to the Company in writing. Non-executive directors are required to seek the agreement of the chairman, chief executive and Group general counsel and company secretary, on behalf of the Board, before accepting additional significant commitments that might affect the time they are able to devote to their role. New appointments are then reported to the full Board.
Executive directors are required to seek approval from the Board (via the chairman) before accepting an external directorship. The Board would not approve executive directors holding more than one non-executive directorship in a FTSE 100 company (or other equivalent publicly quoted company), nor the chairmanship of any such company. In 2019, the Board and Nomination Committee considered and approved Stephen Pearce accepting the role as non-executive director and chair of the audit committee at BAE Systems plc. The Board agreed that the broad experience to be gained by Stephen taking on a non-executive role with a global FTSE 100 company would build on his existing skills as a public company director and enhance his contribution to Board discussions.
93Anglo American plc Integrated Annual Report 2019

Board information and supportAll directors have full and timely access to the information required to discharge their responsibilities fully and effectively. They have access to the advice and services of the Group general counsel and company secretary, other members of the Group’s management and employees, and external advisers. Directors may take independent professional advice in the furtherance of their duties, at the Company’s expense.
Where a director is unable to attend a Board or committee meeting, he or she is provided with all relevant papers and information relating to that meeting and encouraged to discuss issues arising with the respective chairs and other Board and committee members.
All non-executive directors are provided with access to papers for each of the Board’s committees.
Board induction and developmentFollowing appointment and as required, directors receive training appropriate to their level of experience and knowledge. This includes the provision of a comprehensive, tailored induction programme and individual briefings with GMC members and their teams to provide newly appointed directors with information about the Group’s businesses and other relevant information to assist them in effectively performing their duties. In addition to scheduled Board operational site visits, non-executive directors are expected to spend time at the Group’s operations to meet management and members of the workforce.
Highlights • Following his appointment as a non-executive director in April 2019, Marcelo Bastos undertook an extensive onboarding programme, described in more detail in the case study below.
THE BOARD IN 2019 CONTINUED
• In August 2019, non-executive members of the Sustainability Committee visited De Beers’ Venetia mine and spent three days with management visiting the Group’s Thermal Coal operations in South Africa.
• During their annual overseas Board visit to South Africa in October 2019, Board members visited De Beers Marine in Cape Town and Kumba Iron Ore’s Sishen mine in the Northern Cape.
• In December 2019, the Board and GMC attended a networking event with all 38 of the Group’s operational General Managers, as part of the Operational Leadership Excellence development programme.
Further information about the Board’s visits to operations in 2019 can be found on page 97.
Marcelo Bastos – non-executive director onboarding programmeImmediately following his appointment to the Board as an independent non-executive director on 1 April 2019, Marcelo spent a considerable amount of time throughout the year getting to know the business, management and the Group’s operations. Key highlights of his programme are set out below:
• In early April, Marcelo accompanied the chairman on his visit to the Group’s Metallurgical Coal operations in Queensland, Australia
• Also in April, Marcelo joined fellow non-executive director Ian Ashby and members of the GMC on a visit to the Quellaveco copper project in southern Peru
• In July, he visited the Group’s Minas-Rio (iron ore) mine in Brazil
• In August, Marcelo joined the Sustainability Committee visit to De Beers’ Venetia mine and the Group’s Thermal Coal operations in South Africa
• In October, he visited De Beers Marine operations and mining vessel in Cape Town, Kumba Iron Ore’s Sishen mine, and the Group’s Centre for Experiential Learning and Technical Solutions facility during the Board’s visit to South Africa
• Received briefings from members of the GMC and their teams on key business and strategic issues
• Attended internal orientation sessions on the Anglo American Operating Model, the Sustainable Mining Plan, our Elimination of Fatalities programme, tailings and water storage stewardship
• Marcelo received a briefing on the obligations and responsibilities of directors of UK-listed companies, to complement his considerable knowledge and experience of serving on the boards of Australian and Canadian companies.
Marcelo’s ongoing development programme will continue into 2020 with further operational visits and meetings with senior leaders.
My induction programme has been thoroughly prepared and executed. It has facilitated my familiarisation with the Group’s key business issues and has enhanced my contribution to the Board in the short time since my appointment.”
Marcelo Bastos at a presentation from management during a visit to the Group’s Metallurgical Coal operations in Queensland, Australia in April 2019.
94 Anglo American plc Integrated Annual Report 2019
GOVERNANCE THE BOARD IN 2019

BOARD AND COMMITTEE MEETINGS 2019 – FREQUENCY AND ATTENDANCE OF MEMBERS
The table below shows the attendance of directors at meetings of the Board and committees during the year. Attendance is expressed as the number of meetings attended out of the number eligible to attend.
Independent Board Board Strategy Sustainability Nomination Audit(6) Remuneration
Stuart Chambers n/a 6/6 1/1 4/4 7/7 – –
Mark Cutifani No 6/6 1/1 4/4 – – –
Stephen Pearce No 6/6 1/1 – – – –
Tony O’Neill No 6/6 1/1 4/4 – – –
Ian Ashby Yes 6/6 1/1 4/4 – – –
Marcelo Bastos(1) Yes 5/5 1/1 3/3 – – –
Nolitha Fakude(2) Yes(2) 3/3 – 3/3 6/6 4/4 –
Byron Grote Yes 6/6 1/1 – 7/7 5/5 6/6
Hixonia Nyasulu(3) Yes 1/1 – – – – –
Mphu Ramatlapeng(4) Yes 5/6 1/1 3/4 – – –
Jim Rutherford Yes 6/6 1/1 4/4 – 5/5 6/6
Anne Stevens Yes 6/6 1/1 – 7/7 5/5 6/6
Jack Thompson(5) Yes 1/1 – 1/1 2/3 – 2/2
(1) Appointed 1 April 2019.(2) Stepped down from the Board as a non-executive director on 31 August 2019 following her appointment to the GMC on 1 September 2019.(3) Appointed 1 November 2019. As part of her onboarding process, Hixonia attended the Board Strategy meeting prior to her formal appointment date. Attendance is not reflected
in the table above.(4) Mphu was unable to attend the October 2019 Board and Sustainability Committee meetings due to a medical emergency. (5) Stepped down from the Board on 30 April 2019. Jack was unable to attend a short notice Nomination Committee meeting in January 2019 due to conflicting time zones.(6) The number of Audit Committee meetings included four scheduled meetings, and one special purpose meeting to consider audit tender proposals.
Process used in relation to board appointmentsThe Board is committed to ensuring that it has the right balance of skills, experience and diversity, taking into account the targets of the Hampton-Alexander and Parker Reports. At the date of this report, the Board comprises 12 directors, of whom 33% are female and three of whom are people of colour. In terms of nationality, 10 members of the Board have a nationality other than British, with one of them originating from South America and three from southern Africa.
As part of the Board’s ongoing refreshment programme, during 2019, the Nomination Committee led search processes to recruit three new non-executive directors, to ensure that the skills and experience lost as a result of resignations and retirements during the year were replaced, and to ensure continued gender and ethnic diversity on the Board.
As described in the 2018 Integrated Annual Report, in early 2019, the committee led the search for a non-executive director with substantial mining experience and experience in South America. In April 2019, the committee commenced a search for female candidates
from South Africa as a result of Nolitha Fakude’s appointment into an executive role with the Group.
Spencer Stuart was retained by the committee to assist with the search process in each case. Spencer Stuart has previously worked for the Group in recruiting for non-executive and senior appointments and accordingly has a good understanding of the Board’s requirements, given the markets in which the most suitable candidate were likely to be found. They are also accredited under the UK Government’s Enhanced Code of Conduct for Executive Search Firms.
Prior to each search commencing, the Nomination Committee agreed the skills and experience they considered necessary for the role and provided this to Spencer Stuart. Lists of potential candidates were then identified by Spencer Stuart and discussed with the committee members to agree shortlists to be interviewed. In each case, the initial list of potential prospects included ethnically and gender-diverse candidates. Shortlisted candidates were interviewed by members of the committee and, where practical, other directors.
Board activityThe Board is responsible for the overall conduct of the Group’s business. The rolling agenda of matters discussed by the Board is described and explained on the following page. The Board is scheduled to meet at least six times a year but meets more often when circumstances warrant this. In addition, the Board dedicates a full meeting to the discussion of the Group’s strategy, addressing short, medium and long term issues. Annually, each of the Group’s business unit heads presents to the Board in some depth on key aspects of their business.
The agenda of matters discussed by the Board in 2019 is described and explained on the next page.
95Anglo American plc Integrated Annual Report 2019

THE BOARD IN 2019 CONTINUED
Topic and link to pillars of value Areas covered Comments
Safety and health Fatal incidents, Total Recordable Case Frequency Rate, health and medical incidents
Safety is the most critical area of focus for the Board. The causes of fatal incidents and those causing injury were examined in detail by the Sustainability Committee and the findings discussed by the Board. Management performance in reducing such incidents, through the Group’s Elimination of Fatalities programme, was monitored. The Board discussed the risk mitigation measures in respect of tailings dams in the Group’s operations, as well as potential reputational and other risks associated with dams at disposed operations. The Board also continued to monitor the operational and technical innovation initiatives that have the potential to positively impact the Group’s safety performance.
Environment Environmental incidents, energy and climate change, water availability and rehabilitation
The Board reviewed material environmental incidents and steps taken by management to reduce energy and natural resource consumption. The Board also reviewed the development and use of new technologies that aim to reduce the impact of the Group’s operations on the environment. Climate change, and the Group’s resilience to its impacts, was considered during the year by the Board and the Sustainability Committee.
Socio-political
Social incidents and performance, government, media, investor and stakeholder relations
The Board is committed to ensuring collaboration and partnering with a broad range of stakeholders. It reviewed local community dialogue regarding environmental matters, and any health and safety issues. Investor and media relations updates were received. In 2019, an external investor study was undertaken, and the findings discussed by the Board. Feedback from external stakeholders such as customers, suppliers, global influencers and governments on their expectations of the Group were presented and discussed.
People Inclusion and diversity, talent and performance management, employee engagement
People are a pillar of the Group’s strategy and the Board is focused on creating an inclusive and diverse culture. The talent and succession among senior management was reviewed, with plans and targets produced that seek to address gender diversity while delivering sustainable talent pipelines that ensure the right talent is in the right place at the right time. The Board approved changes to the performance management and incentives of its employees, which are designed to further facilitate the delivery of the Group’s strategic objectives. The Board also established a Global Workforce Advisory Panel aligned to the workforce engagement recommendations set out in the UK Corporate Governance Code. The Board considered progress of work to align the Group’s culture and Values with its Purpose.
Operations
Operational performance by each business unit and progress of key projects
The Board received detailed updates on each business unit’s performance, operations, strategy, safety and sustainability performance, technological innovation and key risks.
Financial
Key financial measures, liquidity and balance sheet strength, cost improvements, dividend
The Board monitored and discussed progress against the annual budget and three-year plan. Liquidity, balance sheet strength and debt were reviewed. The Board considered the Group’s dividend policy and approved the final and interim dividend. The Board approved a share buyback programme of up to $1 billion and the appointment of PwC as the auditor of the Company for the 2020 financial year and beyond.
Economic outlook and commodity prices
Macro-economic environment and commodity price outlook
The Board received briefings from internal teams and external advisers on trends in relevant areas and likely scenarios for global economic growth. Commodity prices, and the effect of these on the Group, are noted and taken into account for strategic and planning purposes.
Strategy
Portfolio outlook, progress on critical tasks and long term strategic pathways
The Board discussed progress towards the ongoing transformation strategy, focusing on key objectives in relation to Portfolio, Innovation and People within the context of long term strategic levers including: key competitive trends and disruptions; technology capability; and climate change perspectives. The Board considered strategic issues at each meeting, and held a two day dedicated strategy session in 2019.
Board governance
Reports from committees, legislative and regulatory compliance, succession planning
Each of the committee chairs reported on their respective meetings and on any developments which required the attention of the Board. Reports were received on the Group’s compliance with relevant legislation and regulation and any actions needed to respond to recent developments. The Board received updates on material litigation across the Group. An internal evaluation of the performance of the Board and its committees was undertaken to ensure their effective functioning. The Board’s ongoing review of its composition, diversity and succession plans culminated in the appointment of three new non-executive directors during the year.
96 Anglo American plc Integrated Annual Report 2019
GOVERNANCE THE BOARD IN 2019

Board visits to Group operationsUndertaking regular site visits allows the directors to gain a better understanding of the Group’s operations and affords Board members the opportunity to meet and engage with a diverse cross-section of employees. During 2019, the Board met outside the UK on one occasion in South Africa. Non-executive directors visited a number of the Group’s operations during 2019, as described below.
Board visit to South AfricaIn October 2019, the Anglo American plc Board and Sustainability Committee met in South Africa. Over the course of the visit, Board members had the opportunity to participate in the following:
• A site visit to De Beers Marine operations and mining vessel in Cape Town port
• Engagement with South African government stakeholders
• An operational site visit to Kumba Iron Ore’s Sishen mine in the Northern Cape, where they received detailed presentations from Kumba Iron Ore leaders on their strategy, operations and sustainability performance, Sishen’s implementation of the Anglo American Operating Model, and viewed mine pit and drilling technology
• An informative tour of the Group’s Centre for Experiential Learning and Technical Solutions facility in Johannesburg.
Non-executive directors Marcelo Bastos (left) and Ian Ashby (third from right), with chief executive Mark Cutifani (middle) at our Quellaveco project in Peru in 2019. They are viewing a model of the mine and processing facilities, used as part of our ‘dialogue table’ with representatives from the local Moquegua community.
Members of the Anglo American Board with leaders and employees during the Board’s visit to Kumba Iron Ore’s Sishen mine in South Africa in October 2019.
Chairman and non-executive directors’ visits in 2019In April, the chairman and newly-appointed non-executive director Marcelo Bastos spent time with leaders and employees at the Group’s Metallurgical Coal operations in Queensland, Australia. They visited Moranbah North and Grosvenor underground mines, Capcoal operations and the Aquila project.
Also in April, non-executive directors Ian Ashby and Marcelo Bastos visited the Quellaveco copper project in southern Peru, accompanied by the chief executive and CEO Base Metals, Ruben Fernandes.
In July, Marcelo Bastos visited the Group’s Minas-Rio iron ore mine in Brazil, accompanied by Wilfred Bruijn, CEO Anglo American Brazil.
In August 2019, the chairman of the Sustainability Committee and non-executive members of the committee visited De Beers’ Venetia mine and spent time at the Group’s Thermal Coal operations in South Africa – Greenside, Goedehoop and Khwezela – hosted by July Ndlovu, CEO Coal South Africa and members of the Coal South Africa leadership team. During the visit the non-executive directors had the opportunity to learn more about safety improvement initiatives, local community engagement, and sustainable development projects.
Visiting operations is invaluable to a non-executive director and, in turn, helps to develop a greater understanding by our business leaders and employees about the work of the Board. Site visits enable me, as a non-executive director and chairman of the Sustainability Committee, to improve my understanding of the issues affecting the business, and enhance boardroom discussions.”
Ian Ashby Chairman of the Sustainability Committee
97Anglo American plc Integrated Annual Report 2019

STAKEHOLDER ENGAGEMENT
Investor engagementThe Company has an active engagement programme with its key financial audiences, including institutional shareholders and sell-side analysts, as well as potential shareholders.
The Group’s investor relations department manages the interactions with these audiences through roadshow meetings, presentations including at the time of the interim and final results, as well as regular attendance at industry conferences organised mainly by investment banks for their institutional investor base. Any significant concerns raised by a shareholder in relation to the Company and its affairs are communicated to the Board.
The Board receives a briefing at each meeting from the investor relations department and analysts’ reports are circulated to the directors when available. Feedback from meetings held between executive management, or the investor relations department, and institutional shareholders, is also communicated to the Board. In 2019, the Board commissioned an external investor study, carried out by a third party consultancy, to obtain the views on Anglo American from global institutional investors. The findings of the study were presented to the Board.
Private shareholders are encouraged to attend the Company’s general meetings or to submit questions to the Company via the Group’s website. The website also provides the latest news and historical financial information, details about forthcoming events for shareholders and analysts, and other information regarding Anglo American.
Stakeholder considerations form part of discussions at Board meetings and the decisions we make take into account potential impacts on our stakeholders.
Global Workforce Advisory PanelThe Board embraces the greater focus on board-workforce engagement contained in the UK Corporate Governance Code (the Code). In 2019, the Board and the Group Management Committee (GMC) explored and debated various options for the most effective, practical and sustainable way to meaningfully achieve the level of engagement contemplated by the Code. We established a Global Workforce Advisory Panel (the Panel), made up of 12 employee representatives from each country where the Group has a significant presence, and designated our senior independent director, Byron Grote, to chair and engage with the Panel.
Panel members were nominated using agreed criteria set out in its terms of reference and selected to ensure representatives, throughout the organisation, are appropriately balanced across the areas of gender, ethnicity, age and seniority. Panel members undertook a training and development programme to ensure a clear understanding of their role and to support them in being effective employee representatives.
The Panel held its first meeting in South Africa in October 2019. Topics for discussion at the inaugural Panel meeting included the Group’s Global Safety Day campaign, our Elimination of Fatalities Taskforce, our Codes of Conduct and understanding of Anglo American’s strategy. The outcomes of its discussions were shared with the Board at its meeting in December 2019.
Panel meetings in 2020 will be held in Johannesburg and London, and the key themes from those discussions will be shared with the Board.
It is anticipated that in future the Panel will meet at least twice a year and, along with the other established channels of communication we have with our employees, such as our employee engagement survey, director interactions with employees during site visits to operations and ‘town halls’, this forum should be of considerable benefit in helping the Board better understand and take into account the views of its workforce when making strategic decisions.
Employee Q&A event with Board membersIn September 2019, we held a roundtable discussion at the Group’s London headquarters with the chairman, our senior independent director Byron Grote and independent non-executive directors Anne Stevens and Marcelo Bastos. They were all available to answer employee questions on any topic and talk about their careers.
Global employee engagement surveyIn October 2019, we completed our latest global employee engagement survey, ‘Have Your Say’, giving Anglo American employees the opportunity to share their experience of working for the Group. Roughly 60,000 direct employees were asked to complete the survey and responses were received from 39,000 employees, representing 66% of our permanent workforce. Anglo American previously conducted a global employee engagement survey in 2017.
The questions covered topics spanning safety, the Group’s strategic direction, leadership, our culture, Values and Purpose. The survey was managed by an independent research agency, to ensure confidentiality of responses.
Key insights from the survey were shared with the Board and GMC in December 2019. The results indicated that engagement is strong, with our employees feeling proud to work for Anglo American and connected to our Purpose. Areas for the Group to strengthen employee engagement include building on our culture of care and respect and improving practices of recognition.
The GMC will agree and monitor a Group-wide action plan in early 2020, which will be shared with the Board.
Members of our Global Workforce Advisory Panel with senior independent director Byron Grote (second from left), who chairs the Panel, at the inaugural meeting in October 2019.
98 Anglo American plc Integrated Annual Report 2019
GOVERNANCE THE BOARD IN 2019

UK
South Africa
North America
Europe (excluding UK)
Rest of World
%
33
24
20
11
11
INSTITUTIONAL SHAREHOLDERSBY GEOGRAPHY
This analysis excludes the 112,300,129 shares held by Epoch Investment Holdings (RF) Proprietary Limited, Epoch Two Investment Holdings (RF) Proprietary Limited and Tarl Investment Holdings (RF) Proprietary Limited. See note 24 to the Consolidated financial statements for further details.
Bulks investor site visitIn November 2019, we hosted an investor and sell-side analysts’ visit to Queensland, Australia to provide a detailed update on Anglo American’s Bulks businesses. The seminar day covered Kumba Iron Ore, Minas-Rio and the Metallurgical Coal operations in Australia, as well as our Nickel and export Thermal Coal operations. Over the subsequent two days, we toured our Moranbah-Grosvenor and Capcoal operations.
This trip provided an opportunity for 22 investors and analysts to engage with management directly and take questions, while also experiencing first hand the operational excellence demonstrated at our Metallurgical Coal sites where the Anglo American Operating Model is firmly embedded and where we are now delivering step-change performance as a result of our P101 programme.
JanuaryClosed period
Q4 2018 Production Report
MarchInvestor roadshows: London and
South Africa
Conferences: Citi Global Natural Resources (London) and Exane Basic
Materials (London)
MayInvestor roadshows: London
and Edinburgh
Conferences: BAML Metals and Mining (Barcelona)
Mining and Tailings Safety Investor Roundtable
FutureSmart Mining™ analyst and investor roundtable
JulyClosed period
Q2 2019 Production Report
2019 Interim results
Investor roadshows: London
OctoberInvestor roadshows: London, Frankfurt
and Munich
Q3 2019 Production Report
December2019 Investor update
February2018 Preliminary results
Conferences: BMO Global Metals & Mining (Florida)
Investor roadshows: London and North America
April2018 Sustainable Development Performance
Climate Action 100+ investor meeting
Q1 2019 Production Report
AGM
JuneInvestor roadshows: Dublin and Paris
Conferences: Macquarie Global Metals, Mining and Materials (New York), RBC Global Mining and Materials (New York), JP Morgan European Materials (London) and BAML SmartMine (London)
Mining and Tailings Safety Investor Roundtable
SeptemberInvestor roadshows: London, North America
Conferences: PRI in Person (Paris), Bernstein Strategic Decisions (London) and Jefferies Copper and Base Metals Summit (New York)
NovemberInvestor and sell-side analysts’ visit to our Metallurgical Coal operations in Australia, including Bulks seminar day
Investor roadshows: London
Conferences: Goldman Sachs Global Metals and Mining (New York)
INVESTOR ENGAGEMENT IN 2019
Voting levels at the 2019 AGM were in excess of 73%, with less than 1% being votes withheld. All resolutions submitted to the meeting in 2019 were passed with at least 90% of votes in favour apart from the re-appointment of the auditors (80.08%), the authority to disapply pre-emption rights (77.75%) and the election of Marcelo Bastos as a non-executive director (73.80%). The votes cast against the resolution to disapply pre-emption rights were overwhelmingly received from our South African investors. As a result, the Company has proactively engaged with these shareholders to better understand their position. The engagement has been positive and, having listened to the views of our concerned shareholders, the Company will be seeking an authority at the 2020 AGM to disapply pre-emption rights up to 2.5% of the issued share capital, rather than 5% as it has done previously.
In respect of the appointment of Marcelo Bastos, the Board seeks to appoint non-executive directors of the highest calibre that have the relevant skills and experience to ensure the full breadth of capabilities required by the Board as a whole. The Board takes a proactive approach through its refreshment programme (further details of which can be found on page 95) and is of the belief that shareholders will be more strongly in support of Mr Bastos’ re-election in 2020.
.
99Anglo American plc Integrated Annual Report 2019

BOARD EVALUATION
Board, committee and individual director effectiveness in 2019Each year, the Board undertakes a rigorous evaluation of its own effectiveness and performance and that of its committees and individual directors. At least every three years, the evaluation is externally facilitated. In 2018, an external evaluation was undertaken, the results of which were reported in the 2018 Integrated Annual Report. Action plans were developed based on the results and progress against these measured throughout the year. The Board identified four effectiveness priority areas for 2019 and an action plan to address these areas as illustrated in the table opposite.
The Board succeeded in implementing the action plan in full in 2019, with the exception that, due to scheduling constraints, the Nomination Committee was unable to review senior management (below GMC) succession by the end of the year and will do so in 2020.
In 2019, the directors completed online, questionnaire-based internal evaluations. To allow the Board and its committees to judge progress over the two years, the evaluation explored similar areas to the 2018 external evaluation. The 2019 evaluation confirmed that the Board believes that it continues to be effective and well-functioning. Importantly, the evaluation found that the Board was clearer and more aligned on strategy at the end of 2019 than at the beginning of the year, and that the strategy discussions were highly valuable and effective.
The review of the chairman’s performance was led by the senior independent director. The chairman was not present during the discussion by the non-executive directors as it related to him. All directors commended the chairman on his effective leadership of the Board, noting that he continues to foster a supportive culture that facilitates the contribution of each director. In addition, the chairman received a report evaluating the individual directors’ performance. The chairman held one-to-one meetings with each of the directors following the evaluation.
Committee effectivenessThe committee evaluations looked at ways in which they could improve their overall effectiveness, their performance and areas they needed to address in 2020. All committees were believed to be performing well and were appropriately constituted.
Following the 2018 evaluation, the Board identified the effectiveness priority areas below for 2019:
Topic Areas identified for action Planned actions in 2019
Strategy More time to be dedicated to strategy discussions throughout the year
Continue to build on the successful format of the 2018 Board strategy meeting.
The Board’s forward-looking agenda is being revised to allow more time for strategic discussions leading up to the 2019 Board strategy meeting and a dedicated strategy input session has been scheduled ahead of the Board’s strategy meeting.
People Improve Board level visibility and focus on safety, talent and diversity
Board visibility on safety, diversity and talent will be enhanced by allocating greater Board time to these topics and improving committee reporting to the Board in these areas. The Board will continue to monitor progress of the Elimination of Fatalities Taskforce.
The Nomination Committee will provide greater oversight of talent and diversity.
Succession planning
More frequent Board discussion of succession planning and review the geographic spread of the Board
The Board will continue to review succession plans for the GMC annually, and the Nomination Committee will review senior management succession annually.
The Board’s skills and capabilities matrix has been updated to better align with the Group’s longer-term strategy.
Director development
Enhance the director induction and ongoing development programmes
The chairman and Group general counsel and company secretary will work together to prioritise and strengthen the director onboarding and development programme, to better align with the Group’s strategic objectives.
Building on the priority areas identified and the actions taken during 2019, and taking account of the results of the 2019 evaluation, the Board has identified the following effectiveness priorities for 2020:
Topic Areas identified for action
Strategy Continue to devote even more of the Board’s time to focus on strategic issues throughout the year. Fewer routine matters for discussion at Board meetings.
Long term trends and disruptions Greater focus on climate change issues, our carbon footprint, and the circular economy.
Technology and innovation More time should be dedicated to the Group’s approach to technology and innovation.
People More frequent discussion on senior management succession, and increase visibility and oversight of the management and development of talent in the organisation. Increase the Board’s exposure to future leaders in the Group’s talent pipeline.
Board deliberations Continue to reduce the length of Board papers and allow more time for discussion rather than presentation.
An action plan is being developed to address these areas in 2020 and will be reported on in the 2020 Integrated Annual Report.
100 Anglo American plc Integrated Annual Report 2019
GOVERNANCE THE BOARD IN 2019

SUSTAINABILITY COMMITTEE
In October 2019, the Committee held one of its four meetings in South Africa. In August 2019, non-executive members of the Committee visited De Beers’ Venetia mine and a number of the Group’s Thermal Coal operations in South Africa (Greenside, Goedehoop and Khwezela). The Committee chairman and individual members have spent time at Group operations throughout the year. More information on non-executive directors’ visits to Group operations can be found on page 97.
Role and responsibilitiesThe Committee oversees, on behalf of the Board, material management policies, processes, and strategies designed to manage safety, health, environment and socio-political risks, to achieve compliance with sustainable development responsibilities and commitments and strive to be a global leader in sustainable mining.
The Committee is responsible for reviewing the causes of any fatal or significant sustainability incidents and ensuring learnings are shared across the Group.
The Committee’s terms of reference are available to view online.
For more information, visit: www.angloamerican.com/about-us/governance
Committee discussions in 2019The Committee met four times in 2019. At each meeting, the Committee reviews detailed reports covering the Group’s performance across a range of sustainability areas, including: safety; health and wellness; socio-political trends; human rights; climate change; and environmental and social performance.
Significant social, safety, health and environmental incidents are reviewed at each meeting, as are the results from operational risk reviews.
The Committee seeks to address the fundamental root causes of all fatal incidents occuring across Anglo American.
In 2019, four members of the workforce lost their lives at the Group’s managed operations. Preliminary observations from each of these fatal incidents were reported to the next Committee meeting following their occurrence, noting the factors surrounding the incidents, mitigation steps being taken and the process for formal investigation. Following completion of independent investigations, findings are presented to the Committee.
In addition to the Committee’s standing agenda items, the following matters were discussed during 2019:
• Progress of the Group’s Elimination of Fatalities Taskforce, designed to achieve a zero fatality business
• Sustainable Mining Plan implementation
• Business unit reports on safety and sustainability performance: Coal South Africa, Base Metals, Kumba Iron Ore, and De Beers
• Implementation of the Elimination of Fatalities Fire Risk Management Programme
• Progress on the geotechnical risk management for the Group’s underground and open pit operations
• Water risks at Group operations
• Progress of dam wall raising activity at Minas-Rio
• Climate change scenario analysis and Scope 3 greenhouse gas emissions
• Reviews of the Group’s Safety Organisation and post-incident medical care
• Results of external stakeholder research: corporate purpose, brand and reputation
• Development of a Group wellbeing framework to support employee wellness across the Group
• 2018 Social Way assessment results – improvements in performance on managing the social impacts of mining
• Development of The Social Way 3.0 – an update to our management system that is designed to meet stakeholder expectations
• Sustainability benchmarking – comparing performance and global trends across the industry
• Key legislative and regulatory developments in the sustainability area
• Review and amendments to the Committee’s terms of reference.
An internal evaluation of the Committee was undertaken in 2019.
Ian AshbyChairman, Sustainability Committee
Committee members Ian Ashby – Chairman (with effect from 30 April 2019)
Jack Thompson (resigned 30 April 2019)
Marcelo Bastos (appointed 1 April 2019)
Stuart Chambers
Mark Cutifani
Nolitha Fakude (resigned 31 August 2019)
Tony O’Neill
Mphu Ramatlapeng
Jim Rutherford
For more on biographies and Board experience details: See pages 86-89
Business unit heads, Group directors of people and organisation, and corporate relations, the Group general counsel and company secretary and the Group head of safety and sustainable development also participate in meetings of the committee.
Sustainability is at the heart of Anglo American. The Committee is instrumental in overseeing how the Group manages its most material sustainability issues.”
101Anglo American plc Integrated Annual Report 2019
GOVERNANCE SUSTAINABILITY COMMITTEE

NOMINATION COMMITTEE
Role and responsibilities • Agreeing a skills, diversity and experience matrix for all directors (with the approval of the Board) to identify and address any skills gaps when recruiting new directors.
• Making recommendations as to the composition of the Board and its committees and the balance between the executive directors and non-executive directors in order to maintain a diverse Board with the appropriate mix of skills, experience, independence and knowledge.
• With the assistance of external search consultants, identifying and reviewing, in detail, potential candidates available in the market and agreeing a ‘longlist’ of candidates for each directorship. Following further discussion and research, deciding upon a shortlist of candidates for interview. Committee members interview the shortlisted candidates and make a recommendation to the Board.
• Ensuring that the human resources function of the Group regularly reviews and updates the succession plans for the directors and senior managers. These are presented to the Board by the chief executive (in the absence of other executive directors) and discussed.
The Committee’s terms of reference are available to view online.
For more information, visit: www.angloamerican.com/about-us/governance
Committee discussions and focus areas in 2019The Committee met seven times during 2019. Discussions at the meetings covered the responsibilities outlined above, with a particular focus on non-executive appointments and succession planning.
The following matters were considered during 2019:
• The composition, structure and size of the Board and its committees, and the leadership needs of the organisation
• Approving the appointment of Spencer Stuart as external search consultant to facilitate non-executive appointments
• Formalising the search processes and making recommendations to the Board on the appointments of Marcelo Bastos, Hixonia Nyasulu and Nonkululeko Nyembezi as non-executive directors
• Recommending that the Board support the election or re-election of each of the directors standing at the AGM in 2019. The length of tenure of non-executive directors was taken into account when considering supporting their re-election, to ensure they remain independent and recognising the need to progressively refresh the Board
• The time commitment expected from each of the non-executive directors to meet the expectations of their role
• Succession planning for the Group chief executive
• Succession planning for the chairs of the Audit and Remuneration committees
• Committee membership changes for recommending to the Board in light of the new non-executive appointments
• Consideration of Stephen Pearce’s appointment as a non-executive director of BAE Systems plc and making recommendations to the Board
• Reviewing and agreeing amendments to the Committee’s terms of reference.
Stuart ChambersChairman, Nomination Committee
Committee members Stuart Chambers – Chairman
Ian Ashby (appointed 1 January 2019)
Nolitha Fakude (resigned 31 August 2019)
Byron Grote
Hixonia Nyasulu (appointed 1 November 2019)
Anne Stevens
Jack Thompson (resigned 30 April 2019)
For more on biographies and Board experience details: See pages 86-89
The chief executive and the Group head of people and organisation also attend meetings of the committee.
The Committee plays a vital role in ensuring we have an appropriate mix of skills, experience and diversity around the Boardroom table.”
The process used for Board recruitment is described on page 95 of this Report.
The results of the internally conducted Board and committee evaluation in 2019 are on page 100.
Information on the Group’s policy on diversity and inclusion, and details of the gender balance of Anglo American’s executive management, can be found in the People section on pages 36-41.
102 Anglo American plc Integrated Annual Report 2019
GOVERNANCE NOMINATION COMMITTEE

AUDIT COMMITTEE REPORT
Role and responsibilities • Monitoring the integrity of the annual and interim financial statements.
• Making recommendations to the Board concerning the adoption of the annual and interim financial statements.
• Overseeing the Group’s relations with the external auditor, which in 2019 included conducting the tender process for the external audit services and making recommendations to the Board about the appointment, remuneration and terms of engagement of the external auditor.
• Reviewing the independence, effectiveness and objectivity of the external auditors.
• Reviewing and monitoring the effectiveness of the Group’s risk management and internal control mechanisms.
• Approving the terms of reference of the internal audit function and assessing its effectiveness.
• Approving the internal audit plan and reviewing regular reports from the Group head of risk management and business assurance on effectiveness of the internal control system.
• Receiving reports from management on the principal risks of the Group. Details of the principal risks are contained on pages 45-49. Overseeing completion of the Viability Statement.
• Reviewing the effectiveness of the Group’s Code of Conduct and the arrangements to counter the risk of bribery and corruption.
The Committee’s terms of reference are available to view online.
For more information, visit: www.angloamerican.com/about-us/governance
Fair, balanced and understandableA key requirement of our financial statements is for the report to be fair, balanced, understandable and provide the information necessary for shareholders to assess the Group’s position, performance, business model and strategy. The Audit Committee and the Board are satisfied that the 2019 Integrated Annual Report meets this requirement, as appropriate weight has been given to both positive and negative developments in the year.
In justifying this statement, the Audit Committee has considered the robust process which operates in creating the 2019 Integrated Annual Report, including:
• Review and approval of management’s assessment of the risk of misstatement in financial reporting
• Clear guidance and instruction provided to all contributors
• Revisions to regulatory reporting requirements are provided to contributors and monitored on an ongoing basis
• Early-warning meetings focused on accounting matters are conducted between business unit management, Group Functions, the Group Finance team and the external auditors in advance of the year end reporting process
• A thorough process of review, evaluation and verification of the inputs from business units is undertaken to ensure the accuracy and consistency of information presented in the 2019 Integrated Annual Report
• External advisers provide advice to management and the Audit Committee on best practice with regards to the creation of the 2019 Integrated Annual Report
• A meeting of the Audit Committee was held in February 2020 to review and approve the draft 2019 Integrated Annual Report, in advance of the final sign-off by the Board. This review included the significant accounting matters explained in the notes to the consolidated financial statements
• The Audit Committee considered the conclusions of the external auditor over the key audit matters that contributed to their audit opinion, specifically impairments, taxation and environmental restoration and decommissioning obligations.
Committee discussions in 2019Throughout the course of 2019, and consistent with prior years, the Audit Committee paid particular attention to material accounting issues, tax matters and the Group’s liquidity position. In addition, there were in-depth discussions on ad hoc topics as requested by the Audit Committee; for example, covering the marketing business, Quellaveco, and cyber security. The Committee monitored the ongoing work to embed the Code of Conduct and reviewed the system of internal control and risk management.
An internal evaluation of the Committee was undertaken.
The Audit Committee held five meetings in 2019, covering the key topics set out on the following pages.
Byron GroteChairman, Audit Committee
Committee members Byron Grote* – Chairman
Nolitha Fakude (resigned 31 August 2019)
Jim Rutherford
Anne Stevens
Nonkululeko Nyembezi (appointed 1 January 2020)
* Deemed to have recent and relevant financial experience in accordance with the UK Corporate Governance Code.
For more on biographies and Board experience details See pages 86-89
The chairman, the chief executive, the finance director, the Group financial controller, the head of financial reporting, the Group head of risk management and business assurance and the Group general counsel and company secretary also participate in meetings of the committee.
The Committee is focused on ensuring the integrity of the Company’s financial statements and the robustness of the Group’s systems of internal control and financial and regulatory risk management systems.”
103Anglo American plc Integrated Annual Report 2019
GOVERNANCE AUDIT COMMITTEE REPORT

Significant accounting issues considered by the Audit Committee in relation to the Group’s financial statements Response of the Audit Committee
Impairment and impairment reversals of assets
The value of mining operations is sensitive to a range of characteristics unique to each asset. Management is required to apply judgement in the estimation of Ore Reserves, and price and production forecasts which drive cash flow projections.
The Committee exercises oversight over the impairment review process, including the identification of impairment and impairment reversal indicators, the review of changes in the valuation of cash-generating units and associated sensitivity analysis, and the appropriateness of disclosures made within the 2019 Integrated Annual Report on key sources of estimation uncertainty. During 2019, the most significant assets considered were the following:
Minas-Rio Minas-Rio was last impaired in 2015 by $2.5 billion as a result of a deterioration in the long term outlook for iron ore prices. Prior to that date, impairment charges of $5.0 billion and $3.8 billion were recorded in 2012 and 2014. During 2019, operations at Minas-Rio achieved a successful ramp-up and the operating licence for the first tailings dam extension was awarded in December 2019. The Committee considered the long term outlook for iron ore, near term market forecasts and valuation scenarios presented by management. It was concluded that an impairment reversal of $1.0 billion should be recognised at the December 2019 year end.
Thermal Coal Certain assets within the South Africa Thermal Coal cash-generating unit (CGU) were cash flow negative at year end following lower forecast short and medium term thermal coal prices during 2019. After considering the sensitivity analysis presented by management, the Committee concluded that an impairment charge of $585 million be recognised. The Isibonelo CGU was previously impaired in 2013 by $143 million due to revised expectations of the operation’s future profitability. The Committee concluded that an impairment reversal of $46 million be recorded, reflecting management’s revised expectations of the operation’s future profitability. The Committee also concluded that an impairment of $334 million be recorded for the Group’s investment in Cerrejón, primarily due to lower forecast coal prices.
De Beers The annual impairment assessment for goodwill relating to De Beers showed that the valuation headroom had reduced from $1.9 billion to $1.0 billion. At this stage, sufficient headroom still remains and, while the valuation is sensitive to changes in consumer demand impacting prices, the Committee concluded that no impairment at 31 December 2019 should be recorded. The Committee carefully considered the proposed disclosures to ensure it fully addressed the key judgements and, after management incorporated the recommendations of the Committee, approved the disclosure.
Other In addition to the assets noted above, the Committee was updated on the valuation drivers of assets that had previously been impaired and therefore are considered to have an inherent risk of either further impairment or impairment reversal. After careful consideration of the valuation drivers of Barro Alto, Dawson, El Soldado, and Samancor, no impairments or impairment reversals were recorded for those assets.
Provision for restoration, rehabilitation and environmental costs
The estimation of environmental restoration and decommissioning liabilities is inherently uncertain, given the long time periods over which these expenditures will be incurred, and the potential for changes in regulatory frameworks and industry practices over time.
The Committee reviewed the update provided by management on estimates of environmental and decommissioning liabilities, which are based on the work of external consultants and internal experts. The Committee considered the changes in assumptions and other drivers of movements in the amounts provided on the balance sheet and concluded that the provisions recorded as at 31 December 2019 appropriately reflected these updates.
Inventory
Inventory valuation is an area of focus for the Group due to the level of judgement and complexity involved in assessing the carrying value of inventory held on the balance sheet. Areas of judgement include valuation of ore stockpiles and diamond stones.
The Committee reviewed the key areas of judgement in light of the year end inventory balances, and considered the associated key controls in place.
Taxation
The Group’s tax affairs are governed by complex domestic tax legislations, international tax treaties between countries and the interpretation of both by tax authorities and courts. Given the many uncertainties that could arise from these factors, judgement is often required in determining the tax that is due.
The Group head of tax provided the Committee with updates throughout the year on various tax matters, including the status of tax audits, tax reporting, the current global tax environment and the status of uncertain tax provisions. In addition, the Committee discussed the recoverability of the Group’s deferred tax assets, including its assets in Brazil, the value of which may be impacted by proposed tax reform. While all these matters are inherently judgemental, no significant issues arose during 2019.
AUDIT COMMITTEE REPORT CONTINUED
104 Anglo American plc Integrated Annual Report 2019
GOVERNANCE AUDIT COMMITTEE REPORT

Legal matters
A provision is recognised where, based on the Group’s legal views and, in some cases, independent advice, it is considered probable that an outflow of resources will be required to settle a present obligation that can be measured reliably. This requires the exercise of judgement.
The Committee was updated by the Group’s general counsel and company secretary on the status of legal matters over the course of the year.
In July 2019, the South African Court approved a settlement agreement in relation to the consolidated class action filed in South Africa on behalf of former mineworkers (and dependants of deceased mineworkers) who allegedly contracted silicosis or tuberculosis as a result of working for various gold mining companies, including some in which Anglo American South Africa (AASA) was a shareholder and to which AASA provided services. The Committee was informed that the amounts currently provided sufficiently covered the settlement and the Committee concluded it was appropriate to maintain this provision. Payments to claimants from the independent Trust established to give effect to the terms of the settlement are projected to commence in 2020.
Various other legal matters were reviewed and the Committee considered management’s assessment that there were no other material provisions required with respect to ongoing legal matters and that there were no individually material contingent liabilities that required disclosure. The Committee endorsed management’s proposal.
Retirement benefits
The estimation of retirement benefits requires judgement over the estimation of scheme assets and liabilities. Areas of judgement include assumptions for discount and inflation rates, returns on assets and life expectancy. Changes in the assumptions used would affect the amounts recognised in the financial statements.
The Committee reviewed the assumptions behind the calculations of the asset and liability positions of the Group’s pension and medical plans and concluded that the amounts recorded as at 31 December 2019 appropriately reflected these updates.
In addition, the Committee reviewed the adequacy of the level of funding provided to the plans and the overall expense recognised for the year. The Committee assessed the appropriateness of the Group’s overall risk management approach to retirement benefits.
New accounting standards
The impact of new accounting standards, and any elections made in their application, involves judgement to ensure their adoption is managed appropriately.
IFRS 16 Leases was adopted by the Group on 1 January 2019. The Committee considered the disclosures in the notes to the financial statements prepared by management to explain the transition impact and concluded that these were appropriate.
The Committee reviewed management’s impact assessment of other new standards and amendments which came into effect on 1 January 2019, but were not considered to have a material impact on the Group.
Special items and remeasurements
The Group’s criteria for recognising a special item or remeasurement involves the application of judgement in determining whether an item, owing to its size or nature, should be separately disclosed in the income statement.
The Committee reviewed each of the items classified as special items or remeasurements in the financial statements, and the related disclosures, to ensure that the separate disclosure of these items was appropriate.
Going concern basis of accounting in preparing the financial statements
The ability of the Group to continue as a going concern depends upon continued access to sufficient financing facilities. Judgement is required in the estimation of future cash flows and compliance with debt covenants in future years.
The Committee assessed the forecast levels of net debt, headroom on existing borrowing facilities and compliance with debt covenants. This analysis covered the period to 31 March 2021 and considered a range of downside sensitivities, including the impact of lower commodity prices and higher costs. The Committee concluded it was appropriate to adopt the going concern basis.
Liquidity management Response of the Audit Committee
Liquidity and debt
Reviewing the application of the debt strategy, funding and capital structure and the Group’s forecast cash position. Judgement is required in the estimation of future cash flows and their impact on financing plans and contingencies.
During 2019, the Committee reviewed the profile of the Group’s debt maturities and liquidity headroom in the context of capital expenditure requirements, free cash flow generation and dividend payments.
The Committee endorsed management’s debt capital markets and banking plans for 2020, in the context of strategy-defined targets, to ensure the continued sufficiency of financing facilities.
Payment of the dividend
Reviewing management’s recommendation to the Board regarding the level of dividend to be paid for 2019, based on the payout-ratio-driven dividend policy.
During 2019, the Committee reviewed the proposals for payments of dividends, in accordance with the payout-ratio-driven dividend policy based on 40% of underlying earnings. The Committee endorsed the proposal by management, and recommended to the Board for approval, the payments of the 2018 final dividend and the 2019 interim dividend.
The Committee also recommended for approval by the Board a share buyback programme of up to $1 billion.
105Anglo American plc Integrated Annual Report 2019

Liquidity management (continued) Response of the Audit Committee
Viability Statement
The Viability Statement, and the underlying process to analyse various scenarios that support the development of the Viability Statement, are found on pages 44-45.
The Committee reviewed the time period over which the assessment is made, along with the scenarios that are analysed, the potential financial consequences and assumptions made in the preparation of the statement.
The Committee concluded that the scenarios analysed were sufficiently severe but plausible and the time period of the Viability Statement was appropriate, given the alignment with the budgeting and strategy process.
Risk assurance Response of the Audit Committee
Risk management
The Group’s risk profile and the process by which risks are identified and assessed.
The committee assessed the Group’s risk profile, in particular the principal risks (see pages 46-49). The Committee discussed the key risks, the mitigation plans in place and the appropriate executive management responsibilities. The Committee also considered the process by which the risk profile is generated, the changes in risk definitions and how the risks aligned with the Group’s risk appetite. Following discussion and challenge, the risk profile was approved.
Various risk matters
The Committee oversees the implementation of work to mitigate a variety of key risks.
During the course of 2019, the Committee reviewed work to mitigate cyber risk, data-protection risk, risks associated with the Quellaveco project, marketing and trading risks and the transition of audit work from Deloitte to PwC. The Committee evaluated the work being performed, progress made and provided challenge to satisfy itself that these risks were being adequately managed.
Code of Conduct
The implementation of the Code of Conduct and specific actions to mitigate risk of bribery and corruption.
The Committee reviewed the ongoing work to embed the Group’s Code of Conduct. The Committee received updates on governance of the Code, ethical risk assessments performed and training provided.
The Committee also assessed the work undertaken to mitigate the risk of bribery and corruption. Specifically, the Committee reviewed work to assess risk from use of intermediaries and interaction with public officials. The Committee reviewed the status of actions taken to implement the recommendations set out in the report from an external law firm which had reviewed the Group’s policy and programme to manage bribery risk. All recommendations arising from the report were actioned by the end of 2019.
Mineral Resources and Ore Reserves statements
The year-on-year changes to Mineral Resources and Ore Reserves for operations and projects across the Group.
The Committee reviewed the significant year-on-year changes, satisfying itself that appropriate explanations existed. The Committee also reviewed the ongoing improvements in the process to estimate and report Mineral Resources and Ore Reserves.
Internal audit work
Reviewing the results of internal audit work and the 2019 plan.
The Committee received reports on the results of internal audit work, satisfying itself that the 2019 plan was on track, and discussed areas where control improvement opportunities were identified. The Committee reviewed the progress in completion of agreed management actions.
The Committee reviewed the proposed 2020 internal audit plan, assessing whether the plan addressed the key areas of risk for the business units and Group. The Committee approved the plan, having discussed the scope of work and its relationship to the Group’s risks.
External audit
Reviewing the results of extended audit work, evaluating the quality of the external audit and consideration of management letter recommendations.
The Committee reviewed the preliminary planning report from Deloitte in July 2019 and the final audit plan and fee were approved at the December meeting, having given due consideration to the audit approach, materiality level and audit risks. The Committee received updates during the year on the audit process, including how the auditor had challenged the Group’s assumptions on the issues noted in this report. In February 2020, the Committee reviewed the output of the external audit work that contributed to the auditor’s opinion.
The effectiveness, performance and integrity of the external audit process was evaluated through separate surveys for Committee members and management impacted by the audit, including business unit chief financial officers and heads of functions. The evaluation of the external audit concluded that the external auditor was independent, objective and effective in the delivery of the audit. Service levels had remained largely constant in key areas compared with the previous year. Results of the annual assessment were discussed with the external auditor who considered the themes for the 2019 audit approach, in particular with respect to greater focus on working with management through the audit planning and execution process and in providing insights to further strengthen the Group’s internal control environment.
AUDIT COMMITTEE REPORT CONTINUED
106 Anglo American plc Integrated Annual Report 2019
GOVERNANCE AUDIT COMMITTEE REPORT

Other safeguards • The external auditor is required to adhere to a rotation policy based on best practice and professional standards in the UK. The standard period for rotation of the audit engagement partner is five years and, for any key audit partner, seven years. Subject to the approval of shareholders at the 2020 AGM, the current audit partner, Kari Hale, will step down following the appointment of the new external auditor (see ‘Audit tender and appointment of external auditor’ below).
• Any Deloitte partner designated as a key audit partner of Anglo American shall not be employed by Anglo American in a key management position unless a period of at least two years has elapsed since the conclusion of the last relevant audit.
• The external auditor is required to assess periodically whether, in their professional judgement, they are independent of the Group.
• The Audit Committee ensures that the scope of the auditor’s work is sufficient and that the auditor is fairly remunerated.
• The Audit Committee has primary responsibility for making recommendations to the Board on the appointment, re-appointment and removal of the external auditor.
• The Audit Committee has the authority to engage independent counsel and other advisers as they determine necessary to resolve issues on the auditor’s independence.
• An annual assessment is undertaken of the auditor’s effectiveness through a structured questionnaire and input from all business units and Group functions covering all aspects of the audit process. The Audit Committee members also participate in this assessment, which evaluates audit planning, execution, communications and reporting. The assessment identifies strengths and areas for improvement, which are discussed with the auditor and action plans agreed. The assessment conducted in 2019 for the 2018 audit showed that the audit continued to be assessed as effective.
Ensuring independence of the external auditorAnglo American’s policy on auditors’ independence is consistent with the ethical standards published by the Audit Practices Board.
A key factor that may impair an auditor’s independence is a lack of control over non-audit services provided by the external auditor. The external auditor’s independence is deemed to be impaired if the auditor provides a service that:
• Results in the auditor acting as a manager or employee of the Group
• Puts the auditor in the role of advocate for the Group
• Creates a mutuality of interest between the auditor and the Group.
Anglo American addresses this issue through three primary measures, namely:
• The prohibition of selected services – this includes the undertaking of internal audit services
• Prior approval by the Audit Committee chairman of non-audit services where the cost of the proposed service is likely to exceed $100,000. All other non-audit services are approved by the finance director
• Disclosure of the extent and nature of non-audit services
Anglo American’s policy on the provision of non-audit services is regularly reviewed.
The definition of prohibited non-audit services corresponds with the European Commission’s recommendations on the auditor’s independence and with the Ethical Standards issued by the Audit Practices Board in the UK.
Non-audit work is only undertaken where there is commercial sense in using the auditor without jeopardising auditor independence; for example, where the service is related to the assurance provided by the auditor or benefits from the knowledge the auditor has of the business.
Non-audit fees represented 27% of the 2019 audit fee of $9.9 million. A more detailed analysis is provided on page 205.
Conclusions of the Audit Committee for 2019 The Audit Committee has satisfied itself that the external auditor’s independence was not impaired.
The Audit Committee held meetings with the external auditor, without the presence of management, on two occasions, and the chairman of the Audit Committee held regular meetings with the lead audit engagement partner during the year.
Audit tender and appointment of external auditorAs advised in the 2018 Integrated Annual Report, Anglo American commenced a formal tender process for the appointment of a new external auditor for the 2020 financial year onwards. The tender process was carried out as directed by the Audit Committee and comprised the following steps:
• Inviting a number of audit firms to submit pre-qualification questionnaires to confirm their willingness to participate in the audit tender, their global capabilities and their assessment of independence
• Agreeing detailed selection criteria for the evaluation of the audit firms and a tender timetable to enable a smooth transition from the current auditor
• Interviewing and selecting potential lead audit partners
• Approving the Request for Proposal (RFP) that was issued in December 2018 to a shortlist of audit firms that met the pre-qualification criteria.
• Conducting a number of assessment workshops with the proposed audit teams, covering audit quality, inclusion and diversity, technical accounting and use of technology
• Receiving and reviewing tender proposals
• Oral presentations by the proposed audit firms to the Audit Committee
• Special meeting of the Audit Committee to discuss the merits of each firm and their respective teams. The Committee considered the views of the management team, the likely level of disruption as a result of any change, audit quality and capacity, and the cost proposals presented by each firm.
• Outcomes of the Audit Committee deliberations were presented to the Board.
107Anglo American plc Integrated Annual Report 2019

The tender process was completed in May and on 2 May 2019, the proposed change in statutory auditor was announced by the Board. From the 2020 financial year, if agreed by shareholders, PricewaterhouseCoopers LLP (PwC) will be the Company’s statutory auditor. Resolutions to authorise the Board to appoint and determine the remuneration of PwC will be proposed at the AGM on 5 May 2020.
The Committee would like to thank each firm that participated in the tender and specifically thank Deloitte for their significant contribution to the Group over the years.
Risk managementRisk management is the responsibility of the Board and is integral to the achievement of our objectives. The Board establishes the system of risk management, setting risk appetite and maintaining the system of internal control to manage risk within the Group. The Group’s system of risk management and internal control is monitored by the Audit Committee under delegation from the Board.
The system of risk management is designed to ensure awareness of risks that threaten the achievement of objectives. The controls that mitigate those risks are identified so that assurance can be provided on the effectiveness of those controls and a determination can be made as to whether the risk is operating within the Group’s risk appetite. We seek to embed a culture of risk awareness into the development of our strategic and operational objectives.
The process for identification and assessment of the principal risks combines a top-down and bottom-up approach. At the operations level, a process to identify all risks that prevent the achievement of objectives is undertaken. Detailed analysis of the material risks at each location is performed to ensure management understanding of the risk and controls that reduce likelihood of occurrence and impact should the risk materialise. These operational-risk profiles contribute to the assessment of risks at the business unit level. Executive management at each business unit assesses risks that threaten achievement of the business unit objectives and the status of controls, or actions, that mitigate those risks. At the Group level, risks are identified through assessment of global factors affecting the industry and the Group specifically, as well as the risks arising from the business unit assessments. Materiality of risk is determined through assessment of the various impacts that may arise and likelihood of occurrence. An exception relates to those risks deemed catastrophic in nature, where the focus of assessment is on impact and status of internal
controls, given the very low likelihood of occurrence. When considering the impact of any risk, we assess safety, environmental, financial, legal or regulatory, social and reputational consequences.
The robust process of identifying and evaluating the principal risks was in place during 2019 and is ongoing. Regular reports on the status of risks and controls are presented to executive management teams throughout the year. The Audit Committee reviews reports on the overall Anglo American risk profile on two occasions during the year and conducts in-depth reviews of specific risks during its meetings over the course of the year. Each principal risk is assigned to either the Board or the relevant Board committees to oversee executive management actions in response to that risk. The Audit Committee reviews that oversight process on an annual basis.
Details of the principal risks are provided on pages 46-49.
Risk appetiteWe define risk appetite as ‘the nature and extent of risk that Anglo American is willing to accept in relation to the pursuit of its objectives’. Each principal risk is assessed as to whether it is operating within the limit of appetite for the Group, based on review of the external factors influencing that risk, the status of management actions to mitigate or control the risk and the potential impact should the risk materialise. For risks operating beyond the limit of appetite, a change in strategy may be required. For risks operating within, but approaching the limit of, appetite, specific management actions may be required to ensure the risk remains within the limit of appetite.
Risk management and the system of internal controlControls either reduce the likelihood or impact of any risk once it has occurred, while the identification of material controls – i.e. those controls that have the most influence in mitigating a risk – is an important input for audit planning.
The system of internal control operates on a traditional ‘three lines of defence’ approach, with operating management implementing and monitoring controls on a day-to-day basis, and business unit or functional management providing a second line of defence through regular and frequent oversight of operating management’s implementation of controls. A centrally managed internal audit department provides the third line of defence by reviewing
the design and operating effectiveness of the internal control environment, which includes the work performed by the first and second lines of defence management teams. Internal audit operated in all of the Group’s managed businesses in 2019, reporting its work to executive management and the Audit Committee on a regular basis. The internal audit department’s mandate and annual audit coverage plans were approved by the Audit Committee.
The scope of internal audit work covers the broad spectrum of risk to which the Group is exposed. The audit of controls associated with major operating/technical risks is undertaken in conjunction with relevant experts from the Technical and Sustainability function, the results of which were shared with the Sustainability Committee and Audit Committee.
In determining its opinion that the internal financial controls and internal control and risk management environment was effective during 2019, the Audit Committee considered the following factors:
• The results of internal audit work, including the response of management to completion of actions arising from audit work
• The key risk areas of judgement and estimation uncertainty within financial reporting and mitigating actions taken by management
• The output of risk management work
• The output of external audit work and other assurance providers
• Issues identified by management or reported through whistleblowing arrangements, and the results of investigations into allegations of breaches of our values and business principles.
Reviewing the effectiveness of the system of risk management and internal control The Board, through the Audit Committee, fulfils its responsibility in reviewing the effectiveness of the system of risk management and internal control through review of reports submitted over the course of the year covering the risk management process, adequacy of the internal control environment, consideration of risk appetite, in-depth reviews of specific risks and the results of external audit work. The Sustainability Committee also reviews technical and safety risks in detail and reports its findings to the Board.
AUDIT COMMITTEE REPORT CONTINUED
108 Anglo American plc Integrated Annual Report 2019
GOVERNANCE AUDIT COMMITTEE REPORT

The steep rise in reports is attributed to the successful relaunch communication campaign, creating greater awareness and fostering a culture of trust among our employees and other stakeholders to raise their concerns with confidence. The promotion of this channel through other relevant Group-wide initiatives, policies, and programmes, also encouraged a healthier ‘speak up’ culture.
The increase in reporting numbers also facilitates the opportunity to take early remedial actions and enables management to address any systemic issues identified.
The Group reviews, assesses, and where necessary, investigates every report received through this programme.
The Audit Committee is charged with the responsibility of monitoring and advancing the programme on a continuous basis.
Reviewing the effectiveness of internal auditThe Committee assesses the work of internal audit on a regular basis through the receipt of reports on the progress of the internal audit plan and issues arising and through its annual committee evaluation. The Committee met with the head of internal audit, in the absence of management on two occasions during 2019. Furthermore, the chair of the Committee held regular one-to-one meetings with the head of internal audit. This enables further evaluation of the work performed.
Whistleblowing programmeThe Group operates a multilingual whistleblowing facility which uses a reporting platform provided by a third party service provider. In 2019, the Group enhanced the programme. This included appointing a new whistleblowing platform service provider and rebranding the reporting channel from Speak Up to YourVoice. The programme continues to facilitate confidential and anonymous reporting of a wide range of concerns including:
• People
• Safety
• Legal and regulatory (including bribery and corruption)
• Fraud
• Information management
• Social and environment.
YourVoice channel is available to our employees in our managed operations as well as to all external stakeholders, such as suppliers, community members, and members of the public affected by our operation.
During 2019, we received 505 reports through the YourVoice channel, a 55% increase from 2018. We received a further 248 reports about procurement fraud committed by an external criminal syndicate in South Africa, and we continue to work closely with law enforcement authority on this. Of the 505 reports received, 63% were closed out in 2019, with a 24% substantiation rate. Corrective actions were taken against substantiated allegations in accordance with Group policies.
109Anglo American plc Integrated Annual Report 2019

DIRECTORS’ REMUNERATION REPORT
Role and responsibilities • Establishing and developing the Group’s general policy on executive and senior management remuneration.
• Determining specific remuneration packages for the chairman, executive directors, members of the Group Management Committee (GMC) and other senior management for review and approval by the Board.
• Input and oversight on the reward policy for the broader workforce.
• Consultation with the wider workforce, shareholders and other stakeholders regarding executive remuneration.
The Committee’s terms of reference are available to view online.
For more information, visit www.angloamerican.com/about-us/governance
Focus in 2019 • Development of the new directors’ remuneration policy: aligning executive remuneration with our business strategy; incorporating best practice changes and recent changes to corporate governance; and further aligning our executives with shareholders.
• Confirmation of incentive results for the 2018 annual bonus, the 100% vesting of the 2016 LTIP and consequently the application of the vesting cap.
• Setting of incentive targets for 2019, including the 2019 annual bonus and 2019 LTIP.
Looking ahead to 2020 • Implementation of the newly developed remuneration policy.
• Review of corporate governance and remuneration trends and any implications for the Group.
• Selection and appointment of an adviser to the committee as a result of audit rotation.
Anne StevensChair Remuneration Committee
Committee members Anne Stevens – Chair (with effect from 1 January 2019)
Ian Ashby (appointed 1 January 2019)
Byron Grote
Jim Rutherford
Jack Thompson (resigned 30 April 2019)
For more on biographies and Board experience details: See pages 86-89
The chairman, chief executive, Group director of people and organisation and the Group head of reward also attend meetings of the Committee.
•
Our new directors’ remuneration policy incentivises and supports the step change in operational and financial performance delivered as we unlock the potential of our business.”
An internal evaluation of the Committee was undertaken in 2019.
In 2019, the Committee developed a new directors’ remuneration policy, the details of which can be found on pages 116-123. We consulted with shareholders regarding the changes, and the Committee is regularly updated on the corporate governance environment affecting executive and wider employee pay.
For details of the CEO pay ratio; and Gender Pay Gap in respect of Anglo American Services (UK) Limited: See pages 137 and 139
110 Anglo American plc Integrated Annual Report 2019
GOVERNANCE DIRECTORS’ REMUNERATION REPORT

Business and strategic context With a clear focus on technology, digitalisation and sustainability, Anglo American has established the building blocks to achieve a step change in operational and financial performance in the next 3-5 years. The Group is adopting an innovative approach to sustainable mining by utilising new and existing technologies to improve safety, reduce its environmental impact, improve production, support thriving host communities and respond to stakeholder demands such as building trust in the provenance of products. The FutureSmart Mining™ programme provides the framework for this innovative approach and the Sustainable Mining Plan commits the Company to a series of ambitious goals to reduce the environmental impact, particularly in relation to climate change, greenhouse gas (GHG) emissions, and water usage.
New policyAs a Remuneration Committee, we have looked to ensure that these ambitious strategic goals are reflected and reinforced through the directors’ remuneration policy and pay arrangements. In this way, we ensure that management is sufficiently incentivised; that outcomes reflect performance achieved and are proportionate to the remuneration of the wider workforce; and that returns to executives are aligned to the shareholder returns delivered.
Over the past 12 months, the Committee has invested time in reviewing the executive directors’ remuneration policy to ensure the new policy reinforces Anglo American’s strategy of unlocking the very significant additional potential seen in the business. The new policy, which will be brought to a shareholder vote at the AGM in May 2020, further aligns executive and shareholder returns and appropriately reflects developments in remuneration governance and investor expectations.
Shareholder support for Anglo American’s current remuneration arrangements has been strong historically, and we believe these arrangements continue to be effective and serve our stakeholders well. We are therefore not proposing any changes to the overall structure of pay or to the quantum of incentive opportunity. We feel, however, there are some revisions required to further align with our strategic priorities over the next 3-5 years and to bring the policy in line with corporate governance changes and evolving investor expectations.
Shareholder consultationDuring the last quarter of 2019, the Committee engaged extensively with shareholders and proxy advisors. The Committee found early engagement helpful in understanding shareholder views and in finalising the new policy. In the final round of engagement, with shareholders covering c. 60% of issued shares, the proposed policy and revisions received overwhelming support. I would like to thank all those who took part in the consultation for their constructive engagement and comments.
Summary of proposed changes to policyThe main changes to the executive directors’ remuneration policy for 2020 are set out below, with a rationale for why we believe the changes are appropriate.
1. Mitigating the impact of share price volatility on LTIP award valuesFor LTIP awards made in 2020 onwards, the existing cap on vesting value (Cap) will be replaced with a reduction to the size of award at grant if the Anglo American share price declines by 25% or more between consecutive award dates. The vesting Cap approach was introduced retrospectively in 2017, after the grant of an LTIP award following a steep decline in the share price and in response to investor feedback. In 2018, the Cap achieved its goal of constraining windfall gains resulting from share price volatility. We feel however, that the operation of the Cap creates potential misalignment with shareholders as it penalises (and disincentivises) strong performance post grant rather than addressing the original share price decline. The new mechanism is more appropriate going forward as it brings Anglo American in line with market practice and removes the risk of misalignment. This new approach better limits the dilutive impact of a share price fall, is more motivational and more closely aligns the interests of executives and shareholders.
2. Rebalancing the performance measures for LTIP awards The policy wording on LTIP performance measures has been revised to provide some flexibility around measure selection for future award cycles. This change is intended to ensure that the LTIP awards made during the life of the policy can be structured to remain closely aligned with the Anglo American strategic priorities for the relevant three-year performance period.
The proposed measures for the 2020 awards are: relative Total Shareholder Return (TSR), comprising 50% of the award (down from 70% in 2019); ROCE and cumulative attributable free cash flow prior to capex, weighted 15% each and an upweighting to 20% for environment, social and governance (ESG) measures. For 2020, the ESG portion of the award will consist of three measures linked to tailings facilities, energy efficiency and GHG emissions. This provides a clear link with our Sustainable Mining Plan which commits us to ambitious goals relating to a healthy environment, particularly in relation to climate change and GHG emissions.
For specific details of the performance measures and targets for the 2020 LTIP: See page 135
3. Rebalancing the performance measures in the annual bonus The Committee is also proposing to rebalance metrics within the annual bonus to better reflect our strategic focus and the key concerns of our stakeholders. Going forward, a minimum of 50% of the bonus opportunity will be linked to financial performance (the previous policy specifies that this be linked to EPS); a minimum weighting of 15% will be linked to safety, health and environment (SHE); and individual objectives will be weighted no higher than 20% (previously 40%). The balance of the bonus opportunity will be linked to measures based on the Group’s strategic priorities. The Committee will retain discretion to select the most appropriate measures and weightings each year, subject to the parameters above, to ensure continued alignment with strategic priorities and business needs as these evolve over the life of the policy.
For the 2020 annual bonus, we are proposing to retain EPS as the single financial measure, comprising 50% of the bonus weighting. SHE measures focused on injuries, the environment and our zero harm commitment will be upweighted to 20% of the bonus. Specific strategic objectives aligning bonus outcomes to delivery of the P101 and FutureSmart Mining™ programmes, will comprise 20% of the bonus, and individual objectives will be weighted at 10% (reduced from 40%).
The Committee will continue to apply a discretionary safety deductor to the total bonus outcomes to reflect any fatalities during the year.
For specific details of the performance measures for the 2020 annual bonus and their weightings: See page 135
INTRODUCTORY LETTER
111Anglo American plc Integrated Annual Report 2019

We have also made other minor updates to the policy. The 5% limit on annual NED fee increases has been removed to reflect that we do not adjust NED fees on an annual basis. The details on malus and clawback are now specifically detailed in the policy. The wording relating to good leavers on a change in control has been clarified to state that awards are pro-rated for time and performance is taken into account.
For more on changes comparing the 2017 and the 2020 policies: See page 114
New share plan rules The share scheme rules which govern our annual bonus and long term incentive plan awards have been reviewed and updated to reflect changes to the executive directors’ remuneration policy. The plans are intended to operate on materially the same basis as the Company’s current share schemes but include changes to align with developments and best practice in corporate governance and investor guidance, including revisions to the Code. These will be voted on at the AGM in May 2020.
Corporate governance changesWe have also taken a number of actions in response to the changes to corporate governance in the UK, and in formulating the new policy have had close regard to the principles in the Code of clarity, transparency, risk management, proportionality and alignment to culture and strategy.
Expanded remitThe revised Code expands the Committee’s responsibility to take into account wider employee pay when determining remuneration policy and setting remuneration for executive directors and senior management. To reflect this expanded remit we updated our Terms of Reference in July 2019, and the Committee has discussed the changes that have been made to performance management and to remuneration structures. This included the introduction of incentives to various below-GMC level employees, intended to achieve the alignment of employee incentives to the Group’s strategic targets.
Understanding the workforce voiceTo facilitate the process of workforce engagement, the Board established a Global Workforce Advisory Panel, chaired by our senior independent director Byron Grote. The extra responsibilities for taking on this role are currently not being compensated by additional NED fees. Executive pay is one of the topics for discussion at the Panel.
The Board has considered the interests of a wider group of stakeholders than only shareholders. The Company conducted an in-depth global survey of our roughly 60,000 direct employees and will consider the responses in the performance of their duties.
CEO pay ratioThe updated Directors’ Remuneration Reporting Regulations mandate that for financial periods starting on or after 1 January 2019, the ratio of the CEO’s remuneration to the pay for an employee at the median, lower quartile and upper quartile of the UK employee population, must be disclosed. In our report last year, we voluntarily disclosed the CEO pay ratio at the median, which was 191:1 due to the unusually high LTIP vest value as a result of share price growth over the LTIP period. This year we can confirm that our pay ratio at the median is 139:1. While lower than last year, this ratio remains elevated owing to the LTIP vesting value being driven by the large increase in the share price since March 2017 and a high proportion of CEO pay being in the form of a share-based LTIP.
For more on CEO pay ratio: See page 137
Decision-makingIn making decisions on remuneration outcomes and policy for the executive directors, the Committee has taken into consideration: Company performance which includes financial performance; progress in safety; personal achievements within the context of our strategic ambitions around innovation; and transforming our portfolio. We also consider shareholder opinion and shareholder experience, pay for the wider workforce, and the wider societal context. To avoid conflicts of interest, no executive director is present when their pay is discussed. We are aware that executive pay is contentious and aim to ensure our decisions strike a balance between incentivising the management team, paying for good performance and being equitable in the broader context.
INTRODUCTORY LETTER CONTINUED
4. Promoting long term executive share ownershipThe Committee supports the principle of long term share ownership that is promoted by the UK Corporate Governance Code (the Code) and believes that ensuring executives maintain a strong holding in the Company provides the best alignment with shareholders. The new policy focuses on strengthening the level of shareholding rather than how that holding is achieved. The share ownership requirement for executive directors is increased, from 300% to 400% of salary for the chief executive and from 200% to 300% of salary for other executive directors. A post-employment share ownership requirement is also introduced, where departing executive directors are required to hold the lower of their shareholding on exit and 100% of their required in-post share ownership for a period of two years post-termination. The level of bonus deferral will be reduced from 60% to 50% of bonus (deferred 17% for two years and 33% for three years), to align more closely with sector practice.
5. Bringing executive pensions into line with the wider workforceThe Committee supports the principle of harmonising pension contributions between executive directors and the wider workforce. Current pension arrangements within the UK workforce range from 8% to 15%, with an average contribution rate of 11%. The Company has conducted a review of pension provisions and concluded that a single pension contribution rate, expected to be set at 15%, should be applied. The Company plans to achieve this by phased increases over a three year period from 2020 for those members of the workforce currently below this level.
Going forward, new executive directors will be appointed on the same company contribution rate as the wider workforce. Furthermore, all three incumbent executive directors have agreed to a reduction to their pension contributions from 30% to 25% of salary from 1 January 2020, with further reductions of 3.33% each year until parity is achieved by the end of this policy.
112 Anglo American plc Integrated Annual Report 2019
GOVERNANCE DIRECTORS’ REMUNERATION REPORT

2019 outcomes
SafetyThe continued focus on achieving zero harm has resulted in best ever safety performance including a new record low injury rate in 2019, which improved by 17% compared with 2018. Tragically, we lost four colleagues in work related incidents at our managed operations. Whilst this represents the lowest level of fatalities in our business, any loss of life is unacceptable and this will be reflected in pay outcomes, with the Committee exercising its discretion to apply an 8% reduction to overall annual bonus outcomes. As mentioned before, our focus on safety will be reflected in the upweighting of the SHE measures to 20% in the annual bonus for 2020, and the continued application of a safety deductor.
Financial performanceThe company continues to improve operating results, with further improvements in productivity and costs delivering a 9% increase in underlying EBITDA and a TSR of 31% for the year. Anglo American’s profit attributable to equity shareholders was $3.5 billion, in line with the prior year and underlying earnings were $3.5 billion (2018: $3.2 billion), enabling a $0.8 billion share buyback in the year, and support of increased investment in growth projects across the business. Production is up 1% on a copper equivalent basis.
For full details of our annual financial results: See page 1
Bonus outcomes Underlying EPS increased 8% year on year, supported by cost and volume improvement but impacted by a number of external factors including drought conditions in Chile, power interruption (load shedding) in South Africa and weaknesses in diamonds and coal. EPS performance measured using fixed prices and foreign exchange (FX) rates was $1.82 per share and resulted in a 33% vesting of the 25% of the annual bonus. The 25% of the annual bonus based on actual prices and FX rates resulted in a 47% vesting. The Committee only adjusts targets or outcomes in exceptional circumstances. On this occasion, the Committee has adjusted the target for EPS at fixed prices to reflect decisions made during the year in the best interests of shareholders and to avoid misalignment between the shareholders and management.
The Group delivered a best-ever safety performance and made further progress towards our environmental and health goals, resulting in a 90% payment against SHE targets.
Bonus outcomes after the safety deductor were between 58% and 59% of maximum, between 7% and 8% lower than the bonuses paid in respect of 2018, even though the Company’s financial performance was strong over this period.
For more on bonus outcomes: See page 127
2017-2019 LTIP outcomesThe shareholder experience over the three-year performance period of the LTIP was a positive one, with a TSR of 103%, which is significantly higher than that of the FTSE 100 index TSR of 20% and the Euromoney Global Mining Index TSR of 33%, resulting in full vesting of the TSR component.
The return on capital employed (ROCE) element vested at 94%, based on attributable ROCE of 19% for the year. Growth in operational cash flow was offset by increased capital expenditure of $3.8 billion on growth projects. This results in attributable free cash flow of $3.2 billion over the three years (2018: $3.2 billion), leading to a 31% vest of this measure in the LTIP.
For the first time, ESG measures were introduced for the LTIP award granted in 2017. The ESG measures relating to CO2 emissions and inhalable hazards vested at 100%.
The LTIP awards will therefore vest at 92.5% of maximum.
The vesting Cap that was introduced in 2017, which limits the value that can vest, will not come into force for the 2019 vesting based on current share prices.
SalariesThe Committee approved a 2% increase to executive directors’ salaries in 2020, in line with the 2% increase awarded to the Group’s UK based employees. The Committee took account of appropriate market benchmarks as well as pay in the wider workforce. Taking into account the reduction in pension contribution, equal to 5% of salary, overall levels of fixed pay in 2020 will be lower than those in 2019.
The Committee considered the operation of the policy in respect of 2019 and the pay outcomes for the year to be appropriate and reflective of performance.
Conclusion FutureSmart Mining™ is at the heart of repositioning our business as we re-imagine mining to improve people’s lives. Our new remuneration policy ensures that executive pay is aligned to and incentivises the delivery of that purpose.
Anne Stevens Chair, Remuneration Committee
113Anglo American plc Integrated Annual Report 2019

SUMMARY OF REMUNERATION POLICY CHANGES FOR 2020
Element 2017 policy 2020 policy
PENSION
Maximum opportunity
• 30% of salary • Newly appointed directors: the same company contribution as the wider workforce
• Incumbent directors: 25% of salary; this level will be reduced by 3.33% each year until parity is achieved
ANNUAL BONUS
Form and timing of payment
• 40% cash award at end of year
• 40% deferred into shares for three years
• 20% deferred into shares for five years
• 50% cash award at end of year
• 17% deferred into shares for two years
• 33% deferred into shares for three years
Performance measures
• At least 50% based on EPS
• Up to 50% based on a scorecard of measures covering individual objectives, strategic priorities and safety targets
• Depending on safety performance, overall outcomes may be reduced
• At least 50% based on financial performance
• At least 15% based on SHE measures
• No more than 20% based on individual performance
• Remainder based on strategic priorities
• Depending on safety performance, overall outcomes may be reduced
LTIP
Operation • Value of award at vesting is limited to twice the face value of the award on grant (for 2017, 2018 and 2019 grants). Any gains above this level will be forfeited before the start of the two-year holding period
• Grant-date award opportunities will be reduced if the Group’s share price declines by more than 25% between consecutive award dates; the reduction will typically be no less than 50% of the degree of share price decline
Performance measures
• 70% based on relative TSR
• 30% based on a balanced scorecard linked to the Company’s KPIs
• Linked to the Group’s strategic priorities and may include, but are not limited to, relative TSR, ROCE, free cash flow (FCF), and strategic objectives
SHAREHOLDING GUIDELINES
In-post • CEO: 300% of salary
• Other executive directors: 200% of salary
• CEO: 400% of salary
• Other executive directors: 300% of salary
Post-employment
• None • Lower of the in-post requirement at the time of cessation and the actual shareholding at cessation
• To be held for two years post-employment
NED FEES
Fee increases • Fee increases limited to an annual increase of 5% • Limit on fee increases removed, a limit on total board fees of £1.25m remains in place
MALUS AND CLAWBACK
Trigger events • Applies in the event of a material misstatement in results, misconduct and a material failing in risk management
• Malus and clawback provisions have been strengthened and the time period over which they apply has been clarified
POLICY ON TERMINATION AND CHANGE IN CONTROL
Performance and time
• For good leavers, a time-pro-rated bonus award may be made with the Committee’s approval, and will be paid wholly in cash
• Number of shares vesting under the LTIP will be calculated by reference to the extent to which the performance conditions have been met
• Clarified and strengthened policy on termination and change in control; in particular, clarified that performance to date will be taken into account in the adjudication of incentive outcomes, and that time pro-rating will be applied, unless the Committee determines otherwise
DISCRETION
Formulaic outcomes
• Not specifically detailed • Discretion to adjust the formulaic outcome of the annual bonus and LTIP positively and negatively, based on the Group’s underlying performance and any additional factors
INTRODUCTORY LETTER CONTINUED
114 Anglo American plc Integrated Annual Report 2019
GOVERNANCE DIRECTORS’ REMUNERATION REPORT

2026
2025
2024
2023
2022
2021
ONE YEAR
PERFOR
MAN
CE
THR
EE YEAR PER
FORM
ANCE
TWO YEAR
HOLD
ING
FIXED PAY
SHAREHOLDING GUIDELINES
ANNUAL BONUS
LTIP
• Reviewed annually by Remuneration Committee
• Increases based on Group performance, individual performance, levels of increase for the broader UK population and inflation
• Maximum bonus award of 210% of salary
• Outcome based on financial, safety, strategic and individual objectives subject to a safety deductor
• 50% of bonus is paid in cash
• CEO: 400% of salary
• Other executive directors: 300% of salary
• Lower of the in-post requirement at the time of cessation and the actual shareholding at cessation
• To be held for two years post-employment
• Shares granted with a face value of 300% of salary
• Shares vest after a three-year performance period and released after a further two-year holding period
• Vesting based on measures linked to strategic priorities and subject to malus and clawback
• 50% of bonus is deferred into shares (Bonus Shares)
• One-third of Bonus Shares will vest after two years, with the remaining Bonus Shares vesting after a further one year
• Unvested Bonus Shares are subject to malus and clawback
• Include car-related benefits, medical insurance, personal-taxation and financial advice, among others
• Capped at 10% of salary
• Newly appointed directors: same company contribution as the wider workforce
• Incumbent directors: 25% of salary (reduced from 30%) from 1 January 2020. This level will be reduced further by 3.33% each year until parity is achieved
SalaryRecruitment and retention of high-calibre executives
CashRewards delivery of strategic priorities and financial success
In-postTo align with long term shareholder interests
Encourages long term shareholder return and accomplishment of longer term strategic objectives
Deferred sharesEncourages sustained performance in line with shareholder interests
Post-employmentTo align with long term shareholder interests
Benefits
PensionAlignment with the wider workforce
Key featuresLink to strategy
SUMMARY OF 2020-2023 REMUNERATION POLICY COMPONENTS
TWO YEAR
VESTING
THREE YEAR
115Anglo American plc Integrated Annual Report 2019

FIGURE 1: KEY ASPECTS OF THE REMUNERATION POLICY FOR EXECUTIVE DIRECTORS
BASIC SALARY
To recruit and retain high-calibre executives
People
Operation Opportunity Performance measures
Basic salary levels are reviewed annually by the Committee, taking account of factors including Company performance, individual performance, levels of increase for the wider workforce and inflation.
Reference may also be made to median levels within relevant FTSE and natural resources companies. Alternative peer groups may be considered as appropriate.
The Committee also considers the impact of any basic salary increase on the total remuneration package.
Any increases awarded will be set out in the applicable statement of implementation of policy.
Maximum increase of 5% of salary per annum, in normal circumstances.
There may be occasions when the Committee needs to recognise, for example, development in role, change in responsibility and/or specific retention issues. External factors such as sustained high inflation may also be a consideration. In these circumstances, the Committee may award a higher annual increase, the rationale for which will be explained to shareholders in the applicable statement of implementation of policy.
Individual performance is considered for context when awarding any salary increases.
ANNUAL BONUS
To encourage and reward delivery of the Group’s strategic priorities for the relevant year.
To ensure, through the deferral of a portion into shares, that longer-term focus is encouraged and in line with shareholder interests.
Safety and health
Environment
Socio-political
People
Financial
Cost
The annual bonus is awarded based on a combination of measures, determined by the Committee each year to ensure continued alignment with the Group’s financial goals, strategic priorities and business needs.
50% of the annual bonus earned will be deferred into shares under the Bonus Share Plan (BSP), vesting 17% after two years and 33% after three years.
Dividends are paid on Bonus Shares.
Malus and clawback provisions apply as described below.
The maximum annual bonus opportunity is 210% of salary.
The bonus earned at threshold performance is up to 25% of the maximum. Performance below threshold results in zero bonus.
At least 50% of the annual bonus is linked to financial performance, and at least 15% is linked to safety, health and environment (SHE) measures. Individual performance will be weighted no more than 20%, with the balance linked to a scorecard of measures reflecting the Group’s strategic priorities for that year.
In addition, depending on safety performance during the year, the overall outcomes may be reduced.
Executive director remuneration policy tableThe Company’s remuneration policy, as set out in the 2016 Annual Report and Accounts, received approval from shareholders at the AGM held on 24 April 2017. It was intended that this policy should apply until the Company’s 2020 AGM.
As required, the Company will put the new remuneration policy, as set out on the following pages, to shareholders for a binding vote at the AGM on 5 May 2020. The intention is that the revised policy, if approved, will apply until the Company’s 2023 AGM.
The table below sets out the key elements of executive directors’ pay packages, including
how each element operates, as well as the maximum opportunity and our policy in relation to the performance linkage of each element.
DIRECTORS’ REMUNERATION POLICY
116 Anglo American plc Integrated Annual Report 2019
GOVERNANCE DIRECTORS’ REMUNERATION POLICY

FIGURE 1: KEY ASPECTS OF THE REMUNERATION POLICY FOR EXECUTIVE DIRECTORS
LONG TERM INCENTIVE PLAN (LTIP)
To encourage and reward the achievement of long term sustainable shareholder returns and the delivery of financial/strategic priorities.
To align executive director interests to shareholder interests.
Safety and health
Financial
Environment
Socio-political
Operation Opportunity Performance measures
Conditional awards of shares or nil-cost options are granted annually, with a performance period and vesting period of at least three years.
Any awards that vest are subject to a holding period so that the overall LTIP time horizon is at least five years. Vested awards may not generally be sold during the holding period, other than to cover tax liabilities arising on vesting.
Dividend equivalents accrue over the vesting period and are payable in respect of awards that vest.
Malus and clawback provisions apply as described below.
The maximum annual LTIP opportunity is 300% of salary.
The Committee reviews the executive directors’ LTIP award sizes annually, prior to grant, to ensure they are appropriate. The Committee intends to apply a reduction to award opportunities if the Group’s share price declines by more than 25% between consecutive award dates; the reduction will typically be no less than 50% of the degree of share price decline.
For each performance element, threshold performance warrants 25% vesting of the element, rising on a straight-line basis to 100% for achieving stretch targets.
Performance below threshold results in zero vesting.
Vesting is based on performance measures linked to the Group’s strategic priorities and may include, but are not limited to, relative TSR, ROCE, FCF, and strategic objectives.
ALL-EMPLOYEE SHARE PLANS
To encourage eligible employees to build up a shareholding in the Company.
People
Executive directors are eligible to participate in applicable all-employee share plans on the same basis as other eligible employees. In the UK these currently comprise the Company’s Save As You Earn (SAYE) scheme and Share Incentive Plan (SIP) on identical terms to other UK employees.
In line with the award limits applicable to the share plan, on the same basis that apply to other eligible employees.
All-employee share plans would normally operate without performance conditions.
PENSION
To provide a market-competitive level of pension provision, taking account of the provisions for the wider workforce, to attract and retain high-performing executive directors.
People
Executive directors participate in defined contribution pension arrangements.
Executive directors have the option for contributions which may not be paid to a UK-registered pension scheme as a result of applicable limits (either annual allowance or lifetime allowance) to be treated as if paid to an unregistered unfunded retirement benefit scheme (a UURBS).
Executive directors may request a pension allowance to be paid in place of defined contribution arrangements.
Newly appointed directors
New executive director appointments will receive the same company contribution as the wider workforce.
Incumbent directors (i.e. Mark Cutifani, Stephen Pearce, and Tony O’Neill)
Incumbent executive directors will receive a rate of company contributions of 25% (reduced from 30%) of salary from 1 January 2020. This contribution level will be reduced further by 3.33% each year until parity with the wider workforce is achieved.
None.
117Anglo American plc Integrated Annual Report 2019

DIRECTORS’ REMUNERATION POLICY CONTINUED
FIGURE 1: KEY ASPECTS OF THE REMUNERATION POLICY FOR EXECUTIVE DIRECTORS
OTHER BENEFITS
To provide market- competitive benefits.
People
Operation Opportunity Performance measures
The Company currently provides the following ongoing benefits:
• 28 days’ leave, with encashment of any accumulated leave in excess of 20 days
• car-related benefits
• medical insurance (family)
• death and disability insurance
• directors’ liability insurance
• limited personal taxation and financial advice
• club membership
• other ancillary benefits, including attendance at relevant public events.
The Company pays additional benefits when specific business circumstances require it, including costs and allowances related to relocation and international assignments.
The Company reimburses all necessary and reasonable business expenses.
Capped at 10% of salary.
The Committee reserves the discretion to exceed the ongoing maximum level for certain situation-specific benefits, such as relocation. Full details of the exercise of any such discretion will be set out in the applicable statement of implementation of policy.
None.
Notes to the policy tableThe Committee reserves the right to make non-significant amendments to the Policy without obtaining shareholder approval for that amendment.
Malus and clawbackAwards under the annual bonus (including both upfront cash payment and deferred bonus awards under the BSP) and LTIP are subject to malus provisions and clawback provisions which may be applied during the period of two years after the date of vesting. Clawback refers to the recovery of paid or vested amounts, and may be applied in the following certain circumstances:
• material misstatement in results;
• misconduct;
• material failing in risk management;
• error in calculation.
Malus refers to the reduction, including to nil, of unvested or unpaid awards. The Committee is able to apply malus to awards in the circumstances set out above, as well as other exceptional circumstances at the Committee’s discretion.
Payments from previously agreed remuneration arrangementsThe Committee reserves the right to make any remuneration payments and payments for loss of office, notwithstanding that they are not in line with the policy set out above, where the terms of the payment were agreed (i) under a previous policy, in which case the provisions of that policy shall continue to apply until such payments have been made; (ii) before the policy or the relevant legislation came into effect; or (iii) at a time when the relevant individual was not a director of the Company and, in the opinion of the Committee, the payment was not in consideration for the individual becoming a director of the Company. For these purposes, ‘payments’ includes the satisfaction of awards of variable remuneration and, in relation to awards of shares, the terms of the payment which are agreed at the time the award is granted. Details of any such payments will be set out in the relevant year’s Annual Report on Remuneration.
DiscretionIn addition to the specific discretions set out in the policy table above and in the notes below, there are a number of other areas in which the Committee may exercise discretion, including:
• In respect of the annual bonus and the LTIP, the Committee has discretion to adjust the formulaic outcome positively and negatively based on a holistic assessment of the Group’s underlying performance, and taking into account any additional factors it deems significant.
• The Committee also has the discretion to adjust the performance conditions and targets if an event occurs which makes such a variation necessary or desirable to ensure the conditions continue to be appropriate and capable of being measured on a fair and consistent basis in line with the Committee’s intention in setting the original conditions.
• Under the BSP and the LTIP rules, the Company has the standard discretions relating to the operation of share plans, including discretion to take appropriate action in the event of unforeseen events which affect the awards (for example, on a variation in share capital) and to settle awards in cash, in exceptional circumstances.
The exercise of any discretion will be fully disclosed in the applicable statement of implementation of policy.
118
GOVERNANCE DIRECTORS’ REMUNERATION POLICY
Anglo American plc Integrated Annual Report 2019

Shareholding guidelinesWithin five years of appointment, executive directors are expected to hold shares in the Company with a value of four times basic salary in respect of the CEO and three times basic salary in respect of other executive directors. The Committee takes into consideration achievement against these in-post guidelines when making grants under the Company’s various incentive plans.
In order to provide further long term alignment with shareholders, and in line with the UK Corporate Governance Code, executive directors will normally be expected to maintain a holding of Company shares for a period after their employment. Executive directors will normally be required to continue to hold the lower of the in-post requirement at the time of cessation and the actual shareholding at cessation. The requirement applies for a two-year period post-termination, and applies to all share awards granted under the BSP or LTIP from 2020 onwards.
Target settingThe Committee has a rigorous approach to determining performance measures, their weighting and target-setting. Targets are set taking into account a number of factors including internal and external forecasts, market practice, and past performance. The Committee reviews carefully targets prior to each award to ensure that they remain appropriately stretching.
Remuneration arrangements elsewhere in the GroupThe remuneration arrangements for the executive directors outlined in the policy are broadly aligned with those for other executives serving on the GMC, although opportunity levels vary.
In determining remuneration policy and structures for executive directors, the Committee takes account of and ensures appropriate alignment with pay and related policy and outcomes for the wider employee workforce. The Committee maintains broad oversight of policies relating to pay and how these are implemented for the wider workforce and, through Board engagement, ensures that it has a good understanding of the views of employees and other stakeholders with regards to executive pay.
Approach to recruitment and promotionThe remuneration arrangements for a newly recruited or promoted executive director will reflect the remuneration policy in place for executive directors at the time of the appointment. The arrangements will therefore comprise basic salary, annual bonus, LTIP awards, benefits, pension and all-employee share plan participation on the bases set out above. As described above, any new executive director appointments will receive a maximum company pension contribution on the same company contribution rate as the wider workforce.
The initial basic salary level for a newly recruited or promoted executive director will be set to reflect the individual’s experience, salary levels within the Company and market levels. Where basic salary is set below the level that might be expected, given the executive’s relative inexperience, and the executive then develops successfully into the role, the Committee has the discretion to give a salary increase in the year(s) after appointment above the standard maximum level of 5% per annum, to gradually bring the individual to the appropriate salary level over two to three years.
For external appointments, the Committee may determine that it is appropriate to offer additional cash and/or share-based elements (i.e. buy-out awards) to replace any remuneration opportunity forfeited at a previous employer, when it considers this to be in the best interests of the Company and its shareholders. The terms of any buy-out awards will reflect the nature, time horizons, performance requirements of remuneration forfeited, and the likelihood of such requirements being met. The expected value of any such buy-out awards will be no higher than the expected value of remuneration or opportunity forfeited. Any such buy-out awards will typically be made under the existing annual bonus and LTIP schemes, although in exceptional circumstances, the Committee may exercise the discretion available under the relevant Listing Rule 9.4.2 R to make awards using a different structure. Shareholders will be notified of any buy-out awards at the time of appointment.
For internal appointments, any commitments made before appointment and not relating to appointment will be honoured according to their terms.
For external and internal appointments, the Committee may agree that the Company will meet certain relocation expenses as appropriate.
119Anglo American plc Integrated Annual Report 2019

LTIP
2020 basic salary, benefits and pensionAnnual bonus (cash and Bonus Shares)
Chief Executive
Minimum Maximum Maximum+50%
On-target Minimum Maximum Maximum+50%
On-target Minimum Maximum Maximum+50%
On-target
Performance level
1.8
2.6
5.3
6.5
1.1
2.6
5.5
6.8
1.1
4.2
8.7
10.8
0
12.0
10.0
8.0
6.0
4.0
2.0
Indi
cativ
e to
tal p
ay (£
m)
Performance levelFinance Director
Performance levelTechnical Director
100%100% 42% 20% 16%
42% 20% 16% 42% 20% 16%
34%33% 27%
24%
47%
57%
24%
47%
57%
24%
47%
57%
34%33% 27%
34%
33% 27%
100%
Indicative executive director total remuneration at different levels of performanceThe charts below illustrate how the total pay opportunities for the executive directors vary under four different performance scenarios: minimum, on-target (i.e. in line with the Company’s expectations), maximum, and maximum plus 50% share price appreciation.
DIRECTORS’ REMUNERATION POLICY CONTINUED
Key assumptions:Pay element Minimum On-target Maximum Maximum +50%
Fixed 2020 basic salary, benefits and pension
2020 basic salary, benefits and pension
2020 basic salary, benefits and pension
2020 basic salary, benefits and pension
Annual bonus None 50% of maximum bonus opportunity
100% of maximum bonus opportunity
100% of maximum bonus opportunity
LTIP None 25% of maximum LTIP opportunity
100% of maximum LTIP opportunity
100% of maximum LTIP opportunity, plus 50% share price appreciation
• Potential incentive opportunities are based on the maxima set out in the policy table (being 210% of salary in annual bonus, and 300% of salary in LTIP), applied to basic salaries effective 1 January 2020, of £1,371,333 for the chief executive, £826,468 for the finance director, and £857,084 for the technical director.
• The 2019 figures have been used for ongoing non-pension benefits. • Dividend accrual has been excluded in all four scenarios; share price movement has been excluded from the ‘minimum’, ‘on-target’ and ‘maximum’ scenarios. • Participation in the SAYE and SIP has been excluded, given the relative size of the opportunity levels.
FIGURE 2: INDICATIVE EXECUTIVE DIRECTOR TOTAL REMUNERATION AT DIFFERENT LEVELS OF PERFORMANCE
120
GOVERNANCE DIRECTORS’ REMUNERATION POLICY
Anglo American plc Integrated Annual Report 2019

Non-executive directorsDetails of the policy on fees paid to non-executive directors (NEDs) are set out in the table below.
For more on current NED fees: See page 132
FIGURE 3: FEES PAID TO NON-EXECUTIVE DIRECTORS
Element Purpose and link to strategy Operation Opportunity
Company Chair fees
To attract and retain a high-calibre Company Chair by offering a market-competitive fee level.
The Company Chair is paid a single fee for all of their responsibilities. The level of this fee is reviewed periodically by the Committee and chief executive, with reference to appropriate market benchmarks, and a recommendation is then made to the Board (in the absence of the Chair).
Fees are paid in cash, with the flexibility to forgo all or part of the net fees to acquire shares in the Company.
The current maximum annual aggregate basic fee for all NEDs, excluding the Company Chair, is £1,250,000.
Any proposed revision to this limit would be subject to shareholder approval, as required under the Company’s Articles of Association.
Chair benefits
To provide market competitive benefits.
The Company Chair is entitled to the reasonable use of a car and driver.
Reasonable and necessary expenses are reimbursed.
Non-executive director fees
To attract and retain high-calibre NEDs by offering market- competitive fees.
The NEDs are paid a basic fee. Additional fees are paid for chairing or being a member of one of the main Board committees, or acting as the senior independent director, to reflect their extra responsibilities. These fee levels are reviewed periodically by the Company Chair and executive directors, with reference to appropriate market benchmarks, and a recommendation is then made to the Board.
Fees are paid in cash, with the flexibility to forgo all or part of the net fees to acquire shares in the Company.
Reasonable and necessary expenses are reimbursed.
Other fees/payments
To have the flexibility to provide additional fees/benefits if required.
The Company has the discretion to pay an additional fee, up to the equivalent of the Committee Chair fee, to a NED should the Company require significant additional time commitment in exceptional or unforeseen circumstances. Any such fees will be time-limited in nature.
Policy on termination and change in control
Service contracts
Executive directorsThe terms of employment are set out in the executive directors’ service agreements which are rolling contracts with no fixed term.
Notice periods do not exceed 12 months.
Key terms of the policy on termination and change in control follow. The Company’s policy on termination is consistent with provisions relating to termination of employment in the executive directors’ service agreements and with provisions in the incentive plan rules. Also set out are the key terms relating to change in control, where there is no termination. There are no provisions for enhanced payments in the event of a change in control of the Company.
Non-executive directorsAll NEDs have letters of appointment with the Company for an initial period of three years, subject to annual re-appointment at the AGM. The Company Chair’s appointment may be terminated by the Company with six months’ notice. All other NEDs have a notice period of one month. The appointment letters for the Chair and NEDs provide that no compensation is payable on termination, other than any accrued fees and expenses.
121Anglo American plc Integrated Annual Report 2019

DIRECTORS’ REMUNERATION POLICY CONTINUED
FIGURE 4: PRINCIPLES OF DETERMINING PAYMENTS FOR LOSS OF OFFICE
‘Good leaver’ Voluntary resignation ‘Bad leaver’
Salary and benefits for notice period
Salary and benefits continue to be paid to the date of termination of employment, including any notice period and/or gardening leave period.
The Company may terminate employment with immediate effect and, in lieu of the unexpired portion of any notice period, make a series of monthly payments based on salary and benefits (or make a lump sum payment based on salary only). Any monthly payments will be reduced to take account of any salary received from alternative employment.
Immediate termination with no notice period.
Bonus accrued prior to termination
A time-pro-rated bonus award may be made by the Company, with the Committee’s approval and taking into account performance, and will be paid wholly in cash.
No accrued bonus is payable. No accrued bonus is payable.
Unvested Bonus Shares
Normal circumstancesBonus Shares vest in full on the normal vesting date (i.e. awards will not vest early).
Exceptional circumstances (e.g. death or other compassionate grounds).
Bonus Shares vest in full, and are eligible for immediate vesting.
Awards forfeited. Awards forfeited.
Unvested LTIP awards
Normal circumstancesLTIP awards will typically vest on the normal vesting date, subject to the achievement of relevant performance conditions at the end of the normal performance period and, if applicable, released at the end of the holding period.
Exceptional circumstances (e.g. death or other compassionate grounds.)
LTIP awards may vest and be released on departure, subject to an assessment of the achievement of relevant performance conditions at that time.
In all circumstances, awards are pro-rated for time to reflect the proportion of the performance period elapsed at the time of cessation.
Awards forfeited. Awards forfeited.
Vested LTIP awards subject to holding period
Normal circumstancesVested LTIP awards that are subject only to a holding period will normally be released in full at the end of the holding period.
Exceptional circumstances (e.g. death or other compassionate grounds.)
Vested LTIP awards subject to a holding period may be released on departure.
If an employee resigns to join a competitor (as defined by the Committee), then even those vested LTIP awards that remain subject only to the holding period will be forfeited.
Outside of these circumstances, such awards are released to the employee at the end of the holding period.
Awards forfeited.
SAYE and SIP Outstanding shares and/or options under the Company’s SAYE and SIP are treated in accordance with the relevant HMRC rules.
Other Limited disbursements (for example, legal costs, relocation costs, untaken holiday).
Limited disbursements may be paid at the discretion of the Committee.
None.
Malus and clawback Malus and clawback provisions in the relevant incentive plan rules apply.
Policy on payments to executive directors leaving the GroupIn the table below, a ‘good leaver’ is defined as an individual who leaves the business for reasons including retirement, redundancy, death, ill health, injury, disability, or any other reason as defined by the Committee. Where departure is on mutually agreed terms, the
Committee may treat the departing individual as a good leaver in terms of one or more elements of remuneration. The Committee uses this discretion judiciously and shareholders will be notified of any exercise of this discretion as soon as reasonable. A ‘bad leaver’ is typically an individual who has been terminated for cause.
122
GOVERNANCE DIRECTORS’ REMUNERATION POLICY
Anglo American plc Integrated Annual Report 2019

Policy on change in control (without termination)In respect of the annual bonus, the Committee will determine the most appropriate treatment for the outstanding bonus period according to the circumstances.
Any unvested Bonus Shares will vest in full at the time of the change in control.
Any unvested LTIP awards will vest at the time of the change in control, with vesting determined based on the Committee’s assessment of the performance conditions and, unless the Committee determines otherwise, be subject to a time-based reduction.
Any vested LTIP awards subject to a post-vesting holding period will be released in full at the time of the change in control.
Consideration of the views of the wider workforce and shareholdersIn reviewing and developing the remuneration policy, the Committee has taken into account:
• the internal context for remuneration policy design at Anglo American, including the remuneration arrangements that apply for other employee groups
• recent developments in the governance landscape for executive remuneration in UK-listed companies
• the views of our shareholders.
During 2019, the Committee Chair consulted with major shareholders and proxy advisors on the proposed revisions to the policy (and its implementation in 2020), incorporating feedback as appropriate. The Committee also listens to, and takes into consideration, investor views and comments throughout the year, and has incorporated all feedback received in drafting the policy presented in this report.
As a standing item in the annual agenda, the Committee reviews in detail how the remuneration arrangements for the executive directors compare to those for other members of the GMC and other executive levels, to ensure an appropriate balance between internal alignment and line of sight to an executive’s own areas of responsibility. The Committee welcomes employee feedback on the remuneration policy and facilitates this through the wider engagement of employees on corporate matters as described elsewhere in this Annual Report. In addition, many of the Company’s UK-based employees are shareholders, through the SAYE and SIP schemes, and they, like other shareholders, are able to express their views on directors’ remuneration at each general meeting.
123Anglo American plc Integrated Annual Report 2019

Remuneration for 2019 was based on the remuneration policy approved by shareholders at the 2017 AGM as set out below. Each component of remuneration is designed to reward the accomplishment of aspects of the Group’s strategy.
KEY PERFORMANCE METRICS FROM 2020
Metrics Pillars of value Rationale
Safety and zero harm Safety and health • Employee safety is the Group’s first and most important value
Underlying EPS◊ Financial • EPS links reward to delivery of in-year underlying equity returns to shareholders
TSR Financial • Creates a direct link between executive pay and shareholder value
• Measure is split between comparison against sector index (Euromoney Global Mining Index) and comparison against local peers (constituents of FTSE 100 index)
Group attributable ROCE◊ Financial • ROCE promotes disciplined capital allocation by linking reward to investment return
Attributable free cash fow◊
prior to growth capex Financial • Attributable free cash flow prior to growth capex incentivises cash generation for use either
as incremental capital investment, for capital returns to shareholders, or debt reduction
Energy efficiency Environment • Improvement in energy efficiency by the end of 2022
Greenhouse Gas intensity Environment • Improvement in GHG intensity by the end of 2022
Tailings facilities Environment • Implementation of Tailings Standard across the Group's tailings facilities
2025
2024
2023
2022
2021
2020
ONE YEAR
PERFOR
MAN
CE
THR
EE YEAR PER
FORM
ANCE
TWO YEAR
HOLD
ING
FIVE YEAR VESTIN
G
THR
EE YEAR VESTIN
G
FIXED PAY
SHAREHOLDING GUIDELINES
ANNUAL BONUS
LTIP
• Reviewed annually by Remuneration Committee
• Increases based on Group performance, individual performance, levels of increase for the broader UK population and inflation
• Maximum bonus award of 210% of salary
• Outcome based on underlying EPS and individual/strategic/safety objectives subject to a safety deductor
• 40% of bonus is paid in cash
• CEO: 300% of salary
• Other Executive Directors: 200% of salary
• Shares granted with a face value of 300% of salary
• Shares vest after a three-year performance period and released after a further two-year holding period
• Vesting based on TSR performance and achievement against a balanced scorecard of financial and strategic measures and subject to malus and clawback
• 60% of bonus is deferred into shares (Bonus Shares)
• Two-thirds will vest after three years and one-third after a further two years
• Unvested Bonus Shares are subject to malus and clawback
• Include car-related benefits, medical insurance, personal-taxation and financial advice, among others
• Capped at 10% of salary
• 30% of salary
SalaryRecruitment and retention of high-calibre executives
CashRewards delivery of strategic priorities and financial success
In-post, to align with shareholder interests
Encourages long-term shareholder return and accomplishment of longer-term strategic objectives
Deferred sharesEncourages sustained performance in line with shareholder interests
Benefits
PensionAlignment with workforce
Key featuresLink to strategy
ANNUAL REPORT ON DIRECTORS’ REMUNERATION
For more on the Purpose to Reward journey See pages 10-11
For more on the pillars of value: See page 15
124 Anglo American plc Integrated Annual Report 2019
GOVERNANCE ANNUAL REPORT ON DIRECTORS’ REMUNERATION

2019 PAY OUTCOMES £’000
Mark Cutifani
LTIP paid Fixed Bonus paid
• Fixed pay comprises salary, benefits and pension• Bonus figures include deferred shares• LTIP paid includes dividend equivalent amounts
2019
2018
£1,786 £1,636 £7,558
Stephen Pearce
2019
2018
£1,093 £1,002 £4,555
Tony O’Neill
2019
2018
£1,126 £1,039 £4,723
£1,749 £1,754 £11,859
£1,072 £1,088 £5,540
£1,102 £1,112 £6,358
Executive directors are expected to build up and hold a percentage of their salary in shares (300% for the chief executive, 200% for other executive directors).
For more information see Annual Report on Remuneration See page 134
2019 ANNUAL BONUS OUTCOME
Opportunity Opportunity OutcomeOutcome
100%
58% – 59%
SHE 10% of overall opportunity
ESG 10% of overall opportunity
SHE 9% of overall opportunity
EPS50% of overall opportunityMaximum vestingactual price: $3.41fixed price: $2.13
Safety deductor 8% of overall outcome
Individual objectives40% of overall opportunity Individual objectives
Mark Cutifani: 34%Stephen Pearce: 35%Tony O’Neill: 35%of overall opportunity
EPS20% of overall opportunityactual price: $2.75fixed price: $1.82
2017 LTIP VESTING
TSR70% of overall opportunityEuromoney Global Mining TSR: index + 6% p.a.FTSE 100 TSR: upper quintile
ROCE10% of overall opportunityMaximum vesting ROCE: 20%
AFCF10% of overall opportunityMaximum vestingAFCF: $3.7 billion
100%
93%
ESG 10% of overall opportunity
ROCE9% of overall opportunityGroup ROCE: 19%
TSR70% of overall opportunityGroup TSR: 103%
AFCF3% of overall opportunityAFCF: $3.2 billion
125Anglo American plc Integrated Annual Report 2019
THREE-YEAR SHAREHOLDER RETURN
103%UNDERLYING EPS◊
$2.75/share$2.75/share2019
GROUP ATTRIBUTABLE ROCE◊
19%2019 19%2018 19%$2.55/share2018 2018 285%
2019 103%

FIGURE 7: BENEFITS IN KIND FOR 2019
Car-related benefits £
Mark Cutifani 31,375
Stephen Pearce 30,006
Tony O’Neill 30,257
Total basic salary£’000
Benefits in kind£’000
Annual bonus – cash and
Bonus Shares £’000
LTIP(1)
award vesting£’000
Pension£’000
Other(2)
£’000
Total2019
£’000
Total2018
£’000
Executive directors
Mark Cutifani 1,344 39 1,636 7,558 403 275 11,255
Mark Cutifani (2018) 1,318 36 1,754 11,859 395 274 15,636
Stephen Pearce 810 39 1,002 4,555 244 72 6,722
Stephen Pearce (2018)(3) 794 40 1,088 5,540 238 37 7,737
Tony O’Neill 840 34 1,039 4,723 252 177 7,066
Tony O’Neill (2018) 824 33 1,112 6,358 245 173 8,745
(1) The LTIP vesting level was confirmed by the Remuneration Committee at its meeting on 17 February 2020. As the awards are due to vest after publication of this report, an average share price between 1 October 2019 and 31 December 2019, of £20.2548, was used to calculate the value and will be trued up in the 2020 report. The LTIP values shown include dividend equivalent amounts of £691,112 for Mark Cutifani, £416,516 for Stephen Pearce and £431,946 for Tony O’Neill. 48% of the value is attributable to a 92% growth in share price since grant. The values of LTIP awards that vested in 2019 have been restated using the share price at vesting of £20.09773, see page 131 for more details.
(2) Other comprises the value of free and matching shares awarded under the SIP and dividend payments from unvested shares.(3) For Stephen Pearce, two buy-out awards vested, the second of which has been ‘trued-up’ using the share price at vest of £20.09773. See page 131 for more details.
The information set out in this section (which constitutes the Implementation Report) has been subject to external audit.
Executive director remuneration in 2019Figure 5 sets out the remuneration paid to the executive directors for 2019.
Basic salaries for 2019Figure 6 sets out the basic salaries for 2019.
Benefits in kind for 2019Benefits for executive directors with a value over £5,000 are set out in Figure 7. The executive directors also receive tax advice, club membership, death and disability insurance, directors’ liability insurance, medical insurance and other ancillary benefits.
FIGURE 6: BASIC SALARIES FOR 2019
MARK CUTIFANI(2018: £1,318)
£1,344STEPHEN PEARCE (2018: £794)
£810TONY O’NEILL (2018: £824)
£840(all amounts in ’000)
FIGURE 5: SINGLE TOTAL FIGURE OF REMUNERATION FOR EXECUTIVE DIRECTORS
ANNUAL REPORT ON DIRECTORS’ REMUNERATION CONTINUED
Annual bonus outcomes for 2019Figure 8 shows the annual bonus outcomes for 2019.
The financial element of the bonus is measured against underlying EPS targets. In line with the prior period, 50% of the earnings element of the annual bonus was evaluated against fixed prices and FX rates, with the remaining portion evaluated at actual prices and FX rates. The fixed price and FX rate EPS portion is designed to monitor Group operational performance, excluding the impact of the variations in price and currency fluctuations. Both target ranges are illustrated in the table on the right, with 25% vesting for performance at threshold.
Underlying EPS increased by 8% in 2019, supported by continued cost and volume improvements, including a strong recovery at Minas-Rio but impacted by external factors including drought conditions in Chile, power disruption (load shedding) in South Africa and weaknesses in diamonds and coal.
EPS assessed at actual prices and FX rates for the year was 275 cps (2018: 255 cps) corresponding to a 47% (2018: 87%) vesting performance. EPS benefited from a 1% increase in the average market price of the Group’s basket of products.
126 Anglo American plc Integrated Annual Report 2019
GOVERNANCE ANNUAL REPORT ON DIRECTORS’ REMUNERATION

EPS assessed at fixed prices and FX rates was 182 cps (2018: 152 cps) corresponding to a 33% (2018: 29%) vesting performance. Vesting of the combined EPS element was 40% (2018: 58%). The EPS element corresponds to 50% of the annual bonus award, with the 40% outcome equivalent to 20% (2018: 29%) of overall opportunity.
DiscretionIncentives are designed to ensure they drive appropriate short- and long-term behaviours and it is the Committee’s general preference to avoid making any adjustments. However, the Committee reviews all incentive outcomes to ensure they align with the experience of shareholders. On this occasion, the Committee approved an adjustment to the annual bonus fixed price and FX rates EPS targets set at the start of the year to avoid penalising participants for making the most appropriate commercial decisions during the year to address material changes in market dynamics, and which were taken in shareholders’ best interests. This adjustment had a positive 8% impact on the bonus relative to the previously-set targets. The Committee was satisfied that this adjustment was warranted given the overall strong financial performance during 2019 and felt that it avoided a potentially perverse incentive. The committee will take this adjustment into account when determining outcomes for 2020. The adjustment applied by the Committee was not in response to share price movement.
The executives’ individual objectives reflect the Group’s strategic priorities for the year, incorporating a combination of quantitative and qualitative metrics. Following the end of the year, the Committee made a detailed assessment of performance, leading to the evaluations shown in Figure 11. These results reflect a strong performance that saw revenue increase by 8% to $30 billion, underlying EBITDA grew by 9% to $10 billion and a TSR of 31% for the year against a FTSE 100 TSR of 17% and a Euromoney Global Mining Index TSR of 23%. The portfolio was further strengthened, with Minas-Rio recovery ahead of plan, Quellaveco progressing on track to deliver first production in 2022, together with progress on a number of growth options within copper, PGMs, diamonds and metallurgical coal. Our P101 programme was delivered to target and significant progress was made on our FutureSmart Mining™ programme, with testing of bulk ore sorting at El Soldado, Barro Alto and at Mogalakwena and a coarse particle recovery pilot at El Soldado.
In 2019, our record on systemic safety, which is recognised in the SHE targets, was positive. The Group recorded an all-time low injury
frequency rate, with our total recordable case frequency rate (TRCFR) decreasing more than 20% over the three-year average. There were zero Level 4 and 5 environmental incidents and, in South Africa, 94% of the at risk employee population know their HIV status, and 92% of those identified as HIV-positive are having anti-retroviral treatment.
Tragically we lost four colleagues in work related incidents at the Group’s managed operations. Whilst this represents an improvement on past results, any loss of life is unacceptable and will be reflected in an 8% reduction to overall bonus results for the executive directors and other leaders across the group. These fatal incidents highlight how important it is for us to continue to improve the safety of everyone associated with Anglo American, including beyond the mine gate.
MARK CUTIFANI(2018: £1,754)
£1,636STEPHEN PEARCE (2018: £1,088)
£1,002TONY O’NEILL (2018: £1,112)
£1,039(all amounts in ’000)
FIGURE 8: ANNUAL BONUS OUTCOMES FOR 2019 (CASH AND BONUS SHARES)
Weighting 2019 outcome
Total recordable case frequency rate (TRCFR) The Group achieved a 20% reduction, against a target of achieving a ≥15% improvement against the prior three year average.
2.0% 2.0%
Level 4/5 environmental incidentsNo level 4/5 environmental incidents occurred during 2019.
2.0% 2.0%
HIV managementThe Group achieved the target for both 90% of employees knowing their status and 90% of employees who are HIV+ receiving treatment.
2.0% 2.0%
Fatal Risk Management (FRM)The Group has critical controls in place for common fatal risks.
4.0% 3.0%
Overall 9.0%
FIGURE 9: SHE PERFORMANCE
8% Safety deductor
FIGURE 10: SAFETY DEDUCTOR
A reduction on overall bonus values, reflecting the impact of fatalities on executive pay .
Threshold Maximum Outcome Vesting
Actual prices and FX rates $2.46/share $3.41/share $2.75/share 47%
Fixed prices and FX rates(1) $1.78/share $2.13/share $1.82/share 33%
(1) Targets adjusted to reflect market conditions combined with company response.
127Anglo American plc Integrated Annual Report 2019

FIGURE 11: ANNUAL BONUS PERFORMANCE ASSESSMENT FOR 2019
50% of each executive director’s bonus outcome was assessed against an EPS target, with a 40% result. 40% of the bonus outcomes related to a set of individual objectives for the year. The achievement against these objectives are set out for each executive director below. 10% of the bonus outcomes are dependent on SHE targets with a 90% result. In addition, bonuses are subject to a safety deductor, which for executive directors resulted in an 8% deduction on overall values.
Mark Cutifani
Percentage weighting 2019 outcome
Financial 50% 20%
SHE targets 10% 9%
Personal objectives 40% 34%
Total 100% 63%
Safety deductor A percentage deduction from overall bonus outcomes (8)%
Overall result – 58%
Details of personal objectives Achievement Outcome
Portfolio (15%) • Deliver targeted progress on major projects
• Deliver business streamlining projects
• Identify endowment and Mineral Resource opportunities to cover Ore Reserve depletion in 2019
• Quellaveco on-track to deliver first production in 2022. Minas-Rio ramp-up exceeded plan, producing 23 Mt in 2019 compared with a sub-20 Mt initial outlook. Building of AMV3, the new De Beers vessel, remains on-track.
• Andina pillar agreement signed with Codelco; Mototolo acquisition completed; Bokoni/Atlatsa transaction completed; Moranbah/Grosvenor equalisation transaction announced in November 2019. Share buyback programme announced.
• Offer to acquire the entire issued and to be issued share capital of Sirius Minerals Plc has been announced, subject to regulatory and Sirius shareholder approval. Focused exploration programmes underway in several countries, deployment of portfolio-wide approach to near-asset drilling.
13%
Innovation (15%) • Deliver further uplift in asset performance, including EBITDA improvements through cost and volume gains
• Execute pathways to support production growth of 20% by 2023
• Develop innovative technology and digital opportunities to further enhance the Group’s value proposition
• Deploy the Group’s novel sustainability strategy
• Generated $10 billion of EBITDA at a mining margin of 42%. Year-on-year CuEq production increased by 1%, CuEq unit costs flat (FX neutral).
• Delivered $0.4 billion of cost and volume improvements, offset by $0.3 billion of headwinds including water constraints at Los Bronces, Eskom load shedding, lost sales due to rail and port constraints.
• Implementation of plans on track to achieve 20-25% uplift in CuEq growth, including Quellaveco, Metallurgical Coal volumes, De Beers’ new marine vessel.
• Further advances in FutureSmart Mining™, including testing of bulk sorting technologies at El Soldado, Barro Alto, and Mogalakwena, and installation of a Coarse Particle Recovery pilot plant at El Soldado. De Beers advanced its presence in the laboratory grown diamond market via Lightbox, and its blockchain applications continue to mature.
• Development of five-year sustainability plans per key site remain on-track, and scheduled for completion by end-2020. Compliance with sustainability roadmaps achieved in respect of communities, environment, and advocacy.
13%
People (10%) • Continue to strengthen the GMC and functional leadership
• Embed a culture of safety, high performance and innovation
• Deployment of the Operating Model (OM)
• Deployment of the Group’s Inclusion and Diversity strategy
• Successful execution of critical succession plan for Group Director – South Africa.
• Refresh of executive succession plan informed by systematic capability assessment of 25+ senior executives.
• Re-launch of the Group’s values and associated leadership behaviours with broad employee engagement as measured by global employee engagement survey conducted in Q4.
• OM implementation across the Group continuing at accelerated pace and supported by a standard organisation design to be implemented in all managed operations.
• Women representation in senior management globally increased to 24% (from 21% at year-end 2018).
8%
Overall individual performance 34%
ANNUAL REPORT ON DIRECTORS’ REMUNERATION CONTINUED
128 Anglo American plc Integrated Annual Report 2019
GOVERNANCE ANNUAL REPORT ON DIRECTORS’ REMUNERATION

FIGURE 11: ANNUAL BONUS PERFORMANCE ASSESSMENT FOR 2019
Stephen Pearce
Percentage weighting 2019 outcome
Financial 50% 20%
SHE targets 10% 9%
Personal objectives 40% 35%
Total 100% 64%
Safety deductor A percentage deduction from overall bonus outcomes (8)%
Overall result – 59%
Details of personal objectives Achievement Outcome
Portfolio (10%) • Continue portfolio upgrading, complete announced acquisitions and disposals
• With the technical director, deploy five-year capital plan and improve approvals process incorporating innovation and technology capital
• Bokoni/Atlatsa transaction completed; Moranbah/Grosvenor transaction announced in November 2019; Andina wall agreement concluded. Offer to acquire the entire issued and to be issued share capital of Sirius Minerals Plc has been announced, subject to regulatory and Sirius shareholder approval.
• An improved integrated planning process incorporates optimised life of mine plans, advanced asset option evaluations, and improved project governance.
8%
Innovation (15%) • Achieve EBITDA improvement in 2019 and continue to execute plans to deliver $3-4 billion improvement by 2022
• Achieve approvals for share buyback programme
• Engage with credit agencies to maintain/improve the Group’s rating
• Improve debt repayment profile
• Generated $10 billion of EBITDA at a mining margin of 42%. Year-on-year CuEq production increased by 1%, CuEq unit costs flat (FX neutral).
• Delivered $0.4 billion of cost and volume improvements, offset by $0.3 billion of headwinds including water constraints at Los Bronces, Eskom power outages, lost sales due to rail and port constraints. $3-4 billion improvement target by 2022 remains in place.
• $1 billion share buyback programme approved by SA regulatory authorities and implemented.
• Credit ratings maintained. Successful execution of debt strategy and capital market issues of $2 billion.
• Capital efficiencies for debt equity structures across the Group improved. In Peru, achieved a tax stability agreement and accelerated VAT recovery.
13%
People (10%) • Build finance team to support Group strategic objectives
• Promote Inclusion and increase Diversity in the Finance function
• Successful execution of succession plans for several key Finance roles (Controller, Treasury, Tax, Business Assurance).
• Women representation in Finance increased to 39%, ahead of target.
9%
Investor relations (5%) • Active and ongoing engagement with shareholders, setting out the progress in achieving strategic objectives, as well as operating/financial performance.
• Detailed planning and execution to manage the impact of activist shareholders exiting the share register.
5%
Overall individual performance 35%
129Anglo American plc Integrated Annual Report 2019

FIGURE 11: ANNUAL BONUS PERFORMANCE ASSESSMENT FOR 2019
Tony O’Neill
Percentage weighting 2019 outcome
Financial 50% 20%
SHE targets 10% 9%
Personal objectives 40% 35%
Total 100% 64%
Safety deductor A percentage deduction from overall bonus outcomes (8)%
Overall result – 59%
Details of personal objectives Achievement Outcome
Portfolio (15%) • Execute Quellaveco per plan
• Optimise the configuration of key assets and ensure the delivery of key projects
• Identify endowment and Mineral Resource opportunities to cover Ore Reserve depletion in 2019
• Quellaveco on track to deliver first production in 2022.
• Minas-Rio ramp-up exceeded plan, producing 23 Mt in 2019 compared with a sub-20 Mt initial outlook.
• Work progressing to develop Mogalakwena expansion options.
• Greenfield exploration programmes are underway in several countries. Airborne geophysics at Tapajos/Alta Florista was completed in 2019, and ground follow-up will continue in 2020. A portfolio-wide approach to near-asset drilling has been deployed.
13%
Innovation (15%) • Deployment of Group-wide safety intervention strategy
• Deliver operating improvements from implementation of OM and P101 initiatives
• Develop and implement a suite of FutureSmart Mining™ technologies
• Commence implementation of a digital strategy
• Execute strategy to ensure critical assets have integrity and maintenance strategies to support the longer-term production plan
• Recorded a further 20% year-on-year improvement in total recordable fatal incidents. Regrettably, four work related fatalities were recorded, representing the Group’s lowest fatal injury count on record. Platinum recorded zero fatalities from managed operations in 2019, the first time ever.
• Safety site reviews 100% complete. Verification audits of management actions allocated to each site are underway.
• OM and P101 initiatives delivered in-line with targets, including a 15% year-on-year improvement in shovel performance. Longwall automation delivered record production. Record processing throughputs achieved at several sites. The 2019 underlying EBITDA impact of P101 initiatives was 33%, ahead of target.
• Digital project milestones are on-track, including a Group-wide data lake supporting the P101 programme. Also, longwall cavity prediction tools, reserve reporting tools, assisted core logging, and other digital initiatives are gaining traction.
• Optimised asset tactics deployed at 43 sites during 2019, and all identified P101 equipment work has commenced.
13%
People (10%) • Execute development plan for technical talent with an emphasis on capability and diversity
• Deployment of the OM
• Talent reviews conducted on all technical disciplines lead to an increase in cross-BU appointments.
• All General Managers (GM) went through a thorough capability assessment and are equipped with a robust individual development plan to ensure consistency of leadership capabilities across the Group.
• Regular face-to-face engagement with GMs to ensure collective ownership and effective execution of the group-wide performance improvement initiatives.
• OM implementations across the Group continuing at accelerated pace and supported by a standard organisation design to be implemented in all managed operations. Operational risk management integrated into work management. Ongoing coaching of operational leaders on the use of OM tools to identify, prioritise and execute P101 initiatives.
9%
Overall individual performance 35%
130 Anglo American plc Integrated Annual Report 2019
ANNUAL REPORT ON DIRECTORS’ REMUNERATION CONTINUED
GOVERNANCE ANNUAL REPORT ON DIRECTORS’ REMUNERATION

In accordance with the rules of the Cap, the number of shares to be forfeited is determined using the average share price over the three months to vest, which was £18.26013. This resulted in the forfeit of a higher number of shares by each executive than was shown in last year’s report.
The key individual performance measures are assessed against the overall operational and financial performance of the business. In 2019, the benefits were felt from product and market diversification with strong PGMs and iron ore prices offsetting weaknesses in diamonds and coal, and the effects of reductions in copper production through lack of water in Chile and power outages in South Africa.
The personal performance outcomes set out in the previous pages, combined with the 40% EPS achievement and an overall safety performance of 90%, have generated overall bonus outcomes of 63%, 64% and 64%. When applied to the maximum bonus of 210% of salary, these performance outcomes translate into bonuses of £1,778,699, £1,088,993, and £1,129,334 for Mark Cutifani, Stephen Pearce and Tony O’Neill respectively.
Once the safety deductor of 8% for 2019 is applied to this outcome, the resultant bonus values are £1,636,403, £1,001,873, and £1,038,987.
40% of the total bonus is payable in cash, with 60% deferred into Bonus Shares. Two-thirds of the Bonus Shares will vest after three years, subject to continued employment; the remaining third will vest after five years.
LTIP award vestingIn 2017, Mark Cutifani, Stephen Pearce and Tony O’Neill received LTIP grants of 366,606, 220,944 and 229,129 conditional shares respectively, with vesting subject to:
(a) the Group’s TSR performance relative to:(i) the Euromoney Global Mining Index; and (ii) FTSE 100 constituents over the
three-year period to 31 December 2019;
(b) Group attributable ROCE in year to 31 December 2019;
(c) three year Group attributable FCF to 31 December 2019;
(d) CO2 emissions; and
(e) inhalable hazards.
Performance over the three year period was strong, with shareholders seeing a TSR of 103.4%, well above the FTSE 100 index TSR of 20% and the Euromoney Global Mining Index TSR of 33.5%. Return on capital and operational cash flow were adversely impacted by increased capital expenditure on growth projects.
As outlined in Figures 12 and 13, the 2017 LTIP performance assessment resulted in an overall achievement of 92.5%. At a 92.5% vest and based on current share price, the Cap on vesting value does not come into effect.
DiscretionThe Committee approved no adjustments to the LTIP targets or outcome.
Restatement of 2016-2019 LTIP vestingThe LTIP amounts shown in last year’s report in respect of the LTIP’s granted in 2016 were calculated on an ‘expected’ basis using an assumed share price of £16.716. The value of these shares at vesting is detailed in Figure 14.
FIGURE 13: TOTAL OUTCOME INCLUDING IMPACT OF THE CAP (2017 LTIP)
92.5%(1)Capped
value(2)
Dividend equivalents on
vested value(3)
Mark Cutifani (maximum opportunity 300% of salary)
£6,866,390 £7,715,590 £691,112
Stephen Pearce (maximum opportunity 300% of salary)
£4,138,197 £4,649,987 £416,516
Tony O’Neill (maximum opportunity 300% of salary)
£4,291,499 £4,822,249 £431,946
(1) This does not include dividend equivalents.(2) 2017 LTIP vesting does not exceed the Cap. Values based on a share price of £20.2548. See note (1) to Figure 5 for
further information.(3) Based on shares received on the vested amount, using the average share price for 1 October to 31 December 2019
of £20.2548.
FIGURE 12: PERFORMANCE ASSESSMENT FOR 2017 LTIP AWARDS
Measure
Threshold performance (25% vesting)
Stretch performance
(100% vesting)Actual
performanceVesting
outcome
Euromoney Global Mining Index TSR (47% of total award)
33.5% (index TSR)
56.6%(index TSR + 6% p.a.)
103.4%(index TSR + 16.6% p.a.)
100%
FTSE 100 constituents TSR (23% of total award)
14.5% (median TSR)
54.4%(upper
quintile TSR)
103.4% 100%
Group attributable ROCE (10% of total award)
10% 20% 19.16% 94%
Accumulative free cash flow(1) (10% of total award)
$3.2 billion $3.7 billion $3.2 billion 31%
CO2 emissions (5% of total award)
20% reduction by end of 2019
22% reduction by end of 2019
24% 100%
Inhalable hazards (5% of total award)
6% reduction by end of 2019
10% reduction by end of 2019
14% 100%
(1) Throughout the Remuneration Report, this cashflow target is measured as 2017-2019 cumulative attributable free cash flow (AFCF) at fixed price and FX rates.
FIGURE 14: TOTAL OUTCOME INCLUDING IMPACT OF THE CAP (2016 LTIP) – RESTATEMENT
Number of shares vesting(1)
Actual number of
shares vesting(2)
Actual value of award at
vesting(3)
Dividend equivalents
value
Mark Cutifani 610,139 558,544 £11,225,465 £633,908
Stephen Pearce(4) – 301,462 £5,428,738 £110,962
Tony O’Neill 327,083 299,424 £6,017,738 £339,825
(1) Number of shares vesting under the Cap determined by share price of £16.716 as stated in the 2018 Annual Report. (2) Number of shares vesting under the Cap is determined by average share price for three months prior to vesting of £18.26013.(3) The share price on vesting was £20.09773.(4) For Stephen Pearce two awards vested, both granted as buy-outs on joining. 203,692 shares vested in July 2018. 97,770
shares vested in March 2019 and are restated using the share price at vesting of £20.09773.
131Anglo American plc Integrated Annual Report 2019

PensionThe pension contribution amounts in Figure 15 should be read in conjunction with the following information:
• the total amount of pension contributions treated as having been paid into the UURBS for Mark Cutifani, Stephen Pearce and Tony O’Neill is £393,336, £60,768 and £242,088 respectively
• contributions treated as being paid into the UURBS earn a return equivalent to the Group’s pre-tax sterling nominal cost of debt, capped at a rate determined by the Committee. The total return earned in 2019 was £38,335 for Mark Cutifani, £4,608 for Stephen Pearce, and for Tony O’Neill £21,297
• as at 31 December 2019, the total balance due to executive directors in relation to the UURBS was £1,682,861. Retirement benefits can only be drawn from the UURBS if a member has attained age 55 and has left Group service.
External directorshipsExecutive directors are not permitted to hold external directorships or offices without the prior approval of the Board. If approved, they may each retain the fees payable from only one such appointment.
In the year, Mark Cutifani retained fees for one external directorship, at Total SA, amounting to €96,356 for 2019. Stephen Pearce retained fees for one external directorship, at BAE Systems plc, amounting to £51,167 for 2019.
Other director remuneration in 2019
Non-executive director remunerationFigure 16 sets out the remuneration paid to the Company’s NEDs in 2019. Fees shown include any additional fees paid in respect of chairing or being a member of one of the Board’s committees or acting as the senior independent director.
The current annual fees for non-executive directors are set out below:
• Chairman – £700,000(1)
• Non-executive director base fee – £90,000
• Chair of the Audit, Remuneration or Sustainability Committee – £30,000
• Senior independent director – £30,000
• Committee membership – £15,000 for serving on each of the Audit, Remuneration or Sustainability Committees; £10,000 for the Nomination Committee
(1) Includes service on any Board committee.
Payments for past directorsIn addition to retirement benefits, the Company continues to provide seven former executive directors with private medical insurance arrangements. The annual cost to the Company is minimal. The Committee continues to meet these longstanding commitments, but no new commitments have been made recently or will be made in future.
As announced previously, the former Finance Director, René Médori, was entitled to receive a pro-rata vesting of his 2016 LTIP, which as set out in last year’s report, vested at 100%. René Médori received in total 261,341 shares, valued at £5,252,361 using a vesting share price of £20.09773.
FIGURE 16: SINGLE TOTAL FIGURE OF REMUNERATION FOR NON-EXECUTIVE DIRECTORS
Total fees 2019
£’000
Benefits in kind 2019
£’000(5)
Total2019
£’000
Total fees 2018
£’000
Benefits in kind 2018
£’000(5)
Total2018
£’000
Non-executive directors
Stuart Chambers 700 5 705 700 7 707
Ian Ashby 132 132 91 91
Marcelo Bastos(1) 77 77
Nolitha Fakude(2) 78 78 101 101
Byron Grote 169 169 126 126
Sir Philip Hampton(3) 156 156
Hixonia Nyasulu(1) 15 15
Mphu Ramatlapeng 101 101 91 91
Jim Rutherford 126 126 111 111
Anne Stevens 139 139 106 106
Jack Thompson(4) 44 44 126 126(1) Marcelo Bastos and Hixonia Nyasulu were appointed during 2019; which therefore includes part-year figures.(2) Nolitha Fakude resigned as a NED on 31 August 2019 following her appointment to the GMC in September 2019. The figure
above relates only to her NED fees during the year.(3) Sir Philip Hampton resigned from the Board with effect from 31 December 2018.(4) Jack Thompson resigned from the Board during 2019; which therefore includes part-year figures.(5) Relates to travel expenses during the year.
FIGURE 15: PENSION FOR 2019
DC contribution (£’000)
Cash allowance (£’000)
UURBS contribution
(£’000)
NIC paid by Company
(£’000)Total
(£’000)
Mark Cutifani £10 £393 £403
Stephen Pearce £161 £61 £22 £244
Tony O’Neill £10 £242 £252
132 Anglo American plc Integrated Annual Report 2019
ANNUAL REPORT ON DIRECTORS’ REMUNERATION CONTINUED
GOVERNANCE ANNUAL REPORT ON DIRECTORS’ REMUNERATION

Scheme interests granted during 2019The information in this section has been subject to external audit.
Figure 17 summarises the deferred bonus awards and longer-term, conditional share awards granted to executive directors during 2019. Receipt of these long-term awards is dependent on the Group’s performance over 2019-2021, and to the maximum vesting value imposed by the Committee, as detailed below.
The value of Bonus Shares awarded to directors in respect of 2019 is included in the annual performance bonus figures, set out in Figure 8. They are also included in Figures 17 and 18.
FIGURE 17: SUMMARY OF CONDITIONAL SHARE AWARDS AND OPTIONS GRANTED IN 2019
Type of awardPerformance measure Vesting schedule
Performanceperiod end Director Basis of award
Number of shares awarded
Face value at grant(1)
Bonus Share Plan
– – – Mark Cutifani 60% of bonus 51,971 £1,052,309
Stephen Pearce 60% of bonus 32,236 £652,715
Tony O’Neill 60% of bonus 32,956 £667,293
LTIP share awards
TSR vs. Euromoney Global Mining Index (47%)
25% for TSRequal to the Index;100% for the Index+6% pa or above
31/12/2021 Mark Cutifani 300% of salary 199,196 £4,033,321
Stephen Pearce 300% of salary 120,050 £2,430,772
Tony O’Neill 300% of salary 124,497 £2,520,815
TSR vs. FTSE 100 constituents (23%)
25% for TSR equal to median; 100% for 80th percentile or above
Balanced Scorecard 30%
ROCE (10%)(2)
25% for 12%;100% for 20%
Cumulative attributable free cash fow (10%)
Water Management Standard (7%)
Employee wellbeing (3%)(1) The face value of each award has been calculated using the share price at time of grant, £20.248, for the BSP and LTIP awards. As receipt of the LTIP awards is conditional on performance,
the actual value of these awards may be nil. In addition, the maximum value that may be received from the LTIP in the year of vesting is limited for each executive director to 200% of the face value at grant. Any value over this level will be forfeited. Vesting outcomes will be disclosed in the Remuneration Report for 2021.
(2) ROCE target reduced in 2019 compared to 2018, to reflect investments including P101, Quellaveco, and other transformation activities.
133Anglo American plc Integrated Annual Report 2019

FIGURE 18: SHARES IN ANGLO AMERICAN PLC AT 31 DECEMBER 2019
Conditional (no performance conditions)
Conditional (with performance conditions) Total
Directors BeneficialWithin a
holding periodBSP
Bonus Shares SAYE/SIP LTIP Other
Mark Cutifani 274,126 392,030 298,300 8,695 788,065 – 1,761,216
Stephen Pearce 159,582 – 73,682 3,841 474,946 – 712,051
Tony O’Neill 120,354 210,369 190,147 3,394 492,540 – 1,016,804
Stuart Chambers 9,558 – – – – – 9,558
Ian Ashby – – – – – – –
Marcelo Bastos 940 – – – – – 940
Byron Grote(1) 39,396 – – – – – 39,396
Hixonia Nyasulu – – – – – – –
Mphu Ramatlapeng 7,094 – – – – – 7,094
Jim Rutherford 34,261 – – – – – 34,261
Anne Stevens 2,122 – – – – – 2,122
Former directors
Nolitha Fakude(2) 2,035 – – – – – 2,035
Jack Thompson(1) (3) 14,950 – – – – – 14,950
(1) Included in the beneficial interests of Byron Grote and Jack Thompson are shares held via unsponsored ADRs. (2) Nolitha Fakude resigned as a NED with effect from 31 August 2019, her interests are shown at her resignation date.(3) Jack Thompson resigned with effect from 30 April 2019, his interests are shown at his resignation date.
Total interests in sharesFigure 18 summarises the total interests of the directors in shares of Anglo American plc as at 31 December 2019. These include beneficial and conditional interests.
As already disclosed, Mark Cutifani is expected to hold interests in shares to a value of three times basic salary (built up over five years), and for Stephen Pearce and
Tony O’Neill to a value of two times salary. At the date of preparation of this report, Mark Cutifani has net shareholdings (including Bonus Shares) equal to 1425% of basic salary, 572% for Stephen Pearce and 1231% for Tony O’Neill, calculated using the average share price between 1 October and 31 December 2019 of £20.2548.
Statement of implementation of policy in 2020The Group’s proposed policy on executive director remuneration is shown in the policy statements in Figure 1. Figure 19 summarises how that policy will be implemented in 2020.
The annual bonus measures in 2020 are considered by the Board to be commercially sensitive, although they will be disclosed in the 2020 remuneration report. Specific details of the individual and strategic performance
targets for 2020 will also be included in the 2020 Annual Report on Remuneration.
In line with the proposed policy, the weighting of the TSR element of the 2020 LTIP has been lowered to 50% (from 70%). Financial measures based on ROCE and AFCF prior to growth capex will account for 15% each (previously 10%). ROCE ensures executive remuneration outcomes are linked to the strategic goal of disciplined capital allocation. AFCF ensures executives are rewarded for
Differences from 31 December 2019 to 19 February 2020Mark Cutifani’s, Stephen Pearce’s and Tony O’Neill’s interests increased by 28, 26 and 28 shares respectively during the period between 31 December 2019 to 19 February 2020, as a result of the acquisition of shares under the SIP. Their total holdings therefore increased to 1,761,244; 712,077; and 1,016,832 respectively. There have been no other changes in the interests of the directors in shares between 31 December 2019 and 19 February 2020.
134 Anglo American plc Integrated Annual Report 2019
ANNUAL REPORT ON DIRECTORS’ REMUNERATION CONTINUED
GOVERNANCE ANNUAL REPORT ON DIRECTORS’ REMUNERATION

success in the Group’s goal of reducing net debt through cash generation.
AFCF prior to growth capex has been selected in response to planned expenditure in support of growth.
Climate change continues to be one of the defining challenges of our time. Considerations regarding climate change and the broader environmental impact of our business are an important focus of our strategic planning and business decision making. We have identified three key priorities within our environmental strategy, with measurable targets and goals to ensure a linkage between executive pay and attainment of our environmental targets.
The broader goals within the Sustainable Mining Plan are a 30% net reduction in GHG emissions and a 30% improvement in energy
FIGURE 19: SUMMARY OF KEY REMUNERATION ASPECTS IN 2020
Element
Financial measure, weighting and component detail
Strategic measure, weighting and component detail
SHE/ESG measure, weighting and component detail
Personal measure, weighting and component detail Director Level
Basic salary
– – – – Mark Cutifani £1,371,333 (2% increase)
Stephen Pearce £826,468 (2% increase)
Tony O’Neill £857,084 (2% increase)
Annual bonus
EPS (50%)Half on performance at outturn prices and FX and half on performance at fixed prices and FX
Strategic (20%)Strategic objectives supporting the Group’s delivery on portfolio, innovation and people
SHE (20%)Safety objectives focussing on elimination of fatalities, environment, and injuries
Personal (10%)
Mark Cutifani 210% of salary
Stephen Pearce 210% of salary
Tony O’Neill 210% of salary
Safety deductor At the discretion of the Remuneration Committee, based on fatalities during the year.
Long Term Incentive Plan (LTIP)
TSR (50%)TSR vs. Euromoney Global Mining Index (33%)25% for TSR equal to Index 100% for Index +6% pa or above
TSR vs. FTSE 100 (17%)25% for TSR equal to median 100% for 80th percentile or above
ROCE (15%)25% for 12% 100% for 20%
Attributable free cash fow prior to growth capex (15%)
– Energy efficiency (6%)25% for 4% improvement in energy efficiency100% for 10% improvement
GHG intensity (6%)25% for 5% improvement in GHG intensity100% for 15% improvement
Tailings facilities (8%)100% for 100% implementation of the Anglo American Standard on tailings, across all Group tailings facilities
– Mark Cutifani 300% of salary
Stephen Pearce 300% of salary
Tony O’Neill 300% of salary
efficiency by 2030 against a 2016 baseline. In 2019, the GHG emission target for 2020 was met a year ahead of schedule, but the Group is currently finding challenges around meeting the energy efficiency target.
For the three year performance period of the LTIP we have rebased to achievement at the end of 2019, and set stretching targets relating to increasing our energy efficiency and reducing GHG intensity (6% weighting each).
We also have a 8% weighting on the implementation of the Anglo American Standard on tailings (which exceeds industry standards) – a key deliverable for the global industry.
The three-year cumulative AFCF prior to growth capex target within the LTIP is considered by the Board to be commercially
sensitive; disclosing it will enable competitors to derive information as to our detailed business plan. The actual targets, along with the outcomes, will be disclosed in the 2022 remuneration report. The definition of AFCF prior to growth capex can be found on page 229.
Outstanding LTIP awardsAs explained in the 2016 Annual Report on Remuneration, the value that can be received from awards granted from 2017 to 2019 is limited to twice the face value at grant.
135Anglo American plc Integrated Annual Report 2019

Remuneration disclosures
Ten-year remuneration and returnsFigure 20 shows the Group’s TSR performance against the performance of the FTSE 100 index from 1 January 2010 to 31 December 2019. The FTSE 100 index was chosen as this is a widely recognised broad index. The TSR performance since 2013, when the current chief executive took office, versus the FTSE 100 index is positive.
TSR is calculated in US dollars, and assumes all dividends are reinvested. The TSR level shown as at 31 December each year is the average of the closing daily TSR levels for the five-day period up to and including that date.
Figure 21 shows the total remuneration earned by the incumbent chief executive over the same ten-year period, along with the proportion of maximum opportunity earned in relation to each type of incentive. The total amounts are based on the same methodology as for Figure 5.
FIGURE 21: CHIEF EXECUTIVE’S REMUNERATION
Financial year ending31 December
201031 December
201131 December
201231 December
201331 December
201431 December
201531 December
201631 December
201731 December
201831 December
2019
Cynthia Carroll
Total remuneration (single figure, £’000) 4,235 8,113 3,203 1,462 – – – – – –
Annual bonus (% of maximum) 88% 94% 35% 67% – – – – – –
LTIP (% of maximum) 50% 96% 50% 28% – – – – – –
BSP Enhancement Shares (% of maximum) 0% 100% 0% 0% – – – – – –
Mark Cutifani
Total remuneration (single figure, £’000) – – – 5,305 3,725 3,462 3,996 6,693 15,636 11,255
Annual bonus (% of maximum) – – – 65% 60% 36.5% 87.5% 76.9% 63.4% 58%
LTIP (% of maximum) – – – – – 50% 0% 50% 100% 92.5%
FIGURE 22: CHANGE IN CHIEF EXECUTIVE’S REMUNERATION COMPARED TO UK EMPLOYEES
Salary Benefits(1) Bonus
Chief executive £’000 1,344 39 1,636
% change 2.0 7.3 (6.7)
London employees(2) Average % change 6.5 7.9 13
(1) Benefits for London employees comprise pension and car allowances (where applicable), these being the most material.(2) Annual salary increase was 2% for London employees, the 6.5% and 7.9% include pay increases resulting from promotions, and the resultant increase in bonus and benefit levels.
FIGURE 20: TEN-YEAR TSR PERFORMANCE
136 Anglo American plc Integrated Annual Report 2019
Source: Datastream
100
50
0
150
200
2009 2010 2011 2012 2013 2014 2018 2019201720162015
Val
ue o
f a h
ypot
hetic
al $
100
inve
stm
ent
GOVERNANCE ANNUAL REPORT ON DIRECTORS’ REMUNERATION
ANNUAL REPORT ON DIRECTORS’ REMUNERATION CONTINUED

Change in the chief executive’s remuneration in 2019 relative to UK employees Figure 22 sets out the chief executive’s basic salary, benefits and annual bonus amounts for 2019 and the year-on-year change. We show the average change in each element for London employees below GMC level, which is considered to be the most relevant employee comparator group given the Group-wide nature of roles performed at the corporate head office.
The table opposite shows the required chief executive pay ratio for 2019, and the methodology used to calculate the ratio. At 139:1 the chief executive’s pay ratio at the median is lower than the median ratio of 191:1 that we voluntarily disclosed for 2018. The ratio of 139:1 reflects the high value of the LTIP vesting in 2019, resulting from the significant increase in the share price over the three year life of the award. The structure of executive pay is heavily weighted to share-based long-term incentives, and as such share price appreciation has a greater impact on the chief executive’s pay level than that of the wider workforce.
Financial year ending Method
used25th
percentileMedian
percentile75th
percentile
2019 Option A 215:1 139:1 63:1
CEO pay ratio Salary Total remuneration
25th percentile employee £41,706 £52,301
Median percentile employee £54,810 £80,811
75th percentile employee £108,200 £178,410
Notes on methodology Option A has been used to calculate the ratio as this uses the full-time equivalent pay and benefits for all UK employees during the year, and is therefore a better representation of employee pay. The employees at the 25th, 50th and 75th percentiles have been determined on the snapshot date of 31 December 2019, the last day of the financial year. Each employee was a full-time employee during the year.The salary, benefits and share plan data has been taken on a full-time equivalent basis, however the annual bonus amounts have been taken on an estimated basis. All other elements were calculated in line with the methodology used for the chief executive.The employee at the 50th percentile does not participate in a long-term incentive plan and does not receive all benefits applicable to the chief executive. Therefore the ratio is not a direct comparison to the total remuneration of the chief executive.
FIGURE 23: DISTRIBUTION STATEMENT FOR 2019
Distribution statement 2019 2018
Underlying earnings(1) $m 3,468 3,237
% change 7 (1)
Dividends payable for year to Company shareholders
$m 1,422 1,291
% change 10 109
Dividends payable for year to non-controlling interests
$m 759 873
% change (13) 30
Payroll costs for all employees $m 3,467 3,490
% change (1) 4
Employee numbers ’000 63 64
% change (2) (7)
(1) Please see page 153 for details on how underlying earnings are calculated.
FIGURE 24: 2019 AGM SHAREHOLDER VOTING
Number of votes
Vote For Against Abstain
2018 Implementation report 961,964,923(92.07%)
82,858,529(7.93%)
5,284,796
2017 Remuneration Policy 875,719,701(92.91%)
66,854,666(7.09%)
3,153,118
Distribution statement for 2019Figure 23 sets out the total expenditure on employee reward over 2019, compared to profit generated by the Company and the dividends received by investors. Underlying earnings are shown, as this is one of the Group’s key measures of performance, while employee numbers help put the payroll costs of employees into context.
137Anglo American plc Integrated Annual Report 2019

138 Anglo American plc Integrated Annual Report 2019
GOVERNANCE ANNUAL REPORT ON DIRECTORS’ REMUNERATION
ANNUAL REPORT ON DIRECTORS’ REMUNERATION CONTINUED
FIGURE 25: EXTERNAL ADVISERS AND FEES
AdvisersOther services provided to the Company
Fees for committee assistance
Pricewaterhouse Coopers LLP (PwC) Appointed by the Company, with the agreement of the Committee, to support and advise on the Group's incentive arrangements, in addition to the provision of specialist valuation services and market remuneration data. Provided services to May 2019, after which PwC were appointed as the Group’s external auditor.
Investment advice, actuarial and audit work for various pension schemes; advice on internal audit projects; taxation, payroll and executive compensation advice.
£21,577
Mercer Kepler Appointed as advisers to the Committee on the development of the Policy, and as interim advisers from June 2019 as a result of audit rotation. Also provide specialist valuation services and market remuneration data.
£138,634
Deloitte LLP (Deloitte) In its capacity as Group external auditor, Deloitte undertakes an audit of the relevant sections of the report annually. However, it provides no advice to the Committee.
n/a
Remuneration Committee in 2019
MembershipThe Committee comprised the non-executive directors listed on page 110 on 31 December 2019.
External advisers to the CommitteeFigure 25 details the external advisers to the Committee and the fees paid for services provided during 2019. The fees are charged in accordance with the terms and conditions set out in each relevant engagement letter. PwC and Mercer Kepler are both signatories, and adhere to, the Code of Conduct for Remuneration Consultants (which can be found at www.remunerationconsultantsgroup.com). In addition, the Committee Chair has regular direct dialogue with advisers. For these reasons, the Committee considers that the advice it receives is independent.
ApprovalThis Directors’ Remuneration Report has been approved by the Board of directors of Anglo American plc.
Signed on behalf of the Board of directors.
Anne Stevens Chair, Remuneration Committee
19 February 2020

139Anglo American plc Integrated Annual Report 2019
Gender pay
SummaryThe UK Gender Pay Gap reporting requirement is a regulation under The Equality Act 2010 (Gender Pay Gap Information) Regulations 2017 that is designed to provide public transparency in relation to the difference between men’s and women’s earnings, on average, within a company.
This regulation came into effect on 6 April 2017 and all UK registered companies that employ, in the UK, 250 or more people are required to disclose the specifically defined information by 4 April 2020. The source data for the required information must be at the ‘snapshot date’ of 5 April 2019.
Anglo American is confident that it complies with the UK’s Equal Pay legislation, which governs the right to equal pay between men and women for equal work.
Hourly pay gapThe key measure that is required to be reported is the mean UK hourly pay gap. Anglo American Services (UK) Limited’s mean hourly pay gap is 50%, which is primarily a function of the representation of men in the most senior management roles in our UK head office.
Anglo American is a global mining business, headquartered in the UK, and the majority of the senior leadership team is UK-based. The gaps shown below are largely attributable to the fact that more men than women are working in more highly paid, senior roles.
At the snapshot date of 5 April 2019, Anglo American Services (UK) Limited had a UK workforce of 249 employees, of which:
• 47% were men and 53% were women;
• the senior management population was made up of a significantly higher proportion of men (75%) than women (25%);
• leading to a 50% mean and 38% median UK hourly pay gap.
On a global basis, our gender pay gap(1) of approximately 17% reflects the far greater gender balance across the full breadth of our business activities.(1) Weighted average gender pay gap of the guaranteed
pay of those employees in Australia, Brazil, Chile, Singapore, South Africa and the UK who are subject to the Anglo American Group-wide reward structures.
Continued progressWe have been working to address the challenges of longstanding gender imbalance within our industry, most evident at senior levels. While we are demonstrating our commitment through the actions we have taken and the improvements made at all levels of the business, both globally and within the UK, we recognise we still have much more to do and we know it will take time.
Across our global business, we are aligned with the Hampton-Alexander recommendations to achieve at least a 33% female representation across our Executive Committee (GMC) and those that report to it, improving to 24% by the end of 2019, from 21% in 2018.
We strive to create a more inclusive workplace to enable all our colleagues to achieve their full potential. We are adopting new approaches to recruitment, talent development, mentoring, and flexible working; while also focusing on both the psychological, as well as physical, safety of every one of our colleagues – aligned to our Values and guided by our Purpose.
2019 HOURLY PAY QUARTILES
Hourly pay quartiles
Percentage males in Quartile
Percentage females in
Quartile
Lower 19 81
Lower Middle 43 57
Upper Middle 60 40
Upper 66 34
Remuneration Committee’s commitmentWe recognise reducing the gender imbalance, and therefore the gender pay gap, will take time, however, we are pleased to see a large improvement year-on-year in the upper quartile of the hourly pay gap, reflecting the higher proportion of females in senior roles compared with previous years.
The Remuneration Committee continues to critically review our pay structures to make sure that they are inclusive for our whole employee population and we take this responsibility very seriously.
For more information on the UK gender pay gap, visit www.angloamerican.com/gender-pay-gap-report-uk

140 Anglo American plc Integrated Annual Report 2019
GOVERNANCE STATEMENT OF DIRECTORS’ RESPONSIBILITIES
We confirm that to the best of our knowledge:
(a) The financial statements, prepared in accordance with the applicable set of accounting standards, give a true and fair view of the assets, liabilities, financial position and profit of Anglo American plc and the undertakings included in the consolidation taken as a whole
(b) The strategic report includes a fair review of the development and performance of the business and the position of Anglo American plc and the undertakings included in the consolidation taken as a whole, together with a description of the principal risks and uncertainties that they face
(c) The Annual Report and financial statements, taken as a whole, are fair, balanced and understandable and provide the information necessary for shareholders to assess the Group’s performance, business model and strategy.
By order of the Board
Mark Cutifani Stephen PearceChief Executive Finance Director
19 February 2020
The directors are responsible for preparing the Annual Report and the financial statements in accordance with applicable law and regulations.
Company law requires the directors to prepare financial statements for each financial year. The directors are required to prepare the Group financial statements in accordance with International Financial Reporting Standards (IFRS), as adopted by the European Union and Article 4 of the IAS regulation, and have elected to prepare the parent Company financial statements in accordance with Financial Reporting Standard 101 Reduced Disclosure Framework. The directors must not approve the accounts unless they are satisfied that they give a true and fair view of the state of affairs of the Company and of the profit or loss of the Company for that period.
In preparing the parent Company financial statements, the directors are required to:
• Select suitable accounting policies and then apply them consistently
• Make judgements and accounting estimates that are reasonable and prudent
• State whether Financial Reporting Standard 101 Reduced Disclosure Framework has been followed, subject to any material departures disclosed and explained in the financial statements
• Prepare the financial statements on the going concern basis unless it is inappropriate to presume that the Company will continue in business.
In preparing the Group financial statements, IAS 1 requires that directors:
• Properly select and apply accounting policies
• Present information, including accounting policies, in a manner that provides relevant, reliable, comparable and understandable information
• Provide additional disclosures when compliance with the specific requirements in IFRS is insufficient to enable users to understand the impact of particular transactions, other events and conditions on the entity’s financial position and financial performance
• Make an assessment of the Group’s ability to continue as a going concern.
The directors are responsible for keeping adequate accounting records that are sufficient to show and explain the Group’s transactions, disclose with reasonable accuracy at any time the financial position of the Company and enable them to ensure that the financial statements comply with the Companies Act 2006. They are also responsible for safeguarding the assets of the Company and hence for taking reasonable steps for the prevention and detection of fraud and other irregularities. The directors are responsible for the maintenance and integrity of the corporate and financial information included on the Group’s website. Legislation in the UK governing the preparation and dissemination of financial statements may differ from legislation in other jurisdictions.
STATEMENT OF DIRECTORS’ RESPONSIBILITIES
RESPONSIBILITY STATEMENTfor the year ended 31 December 2019

FINANCIAL STATEMENTS AND OTHER FINANCIAL INFORMATION
Independent auditor’s report to the members of Anglo American plc 142
Primary statementsConsolidated income statement 148Consolidated statement of comprehensive income 148Consolidated balance sheet 149Consolidated cash flow statement 150Consolidated statement of changes in equity 151
Notes to the financial statementsFinancial performance1. Operating profit from subsidiaries and joint operations 1522. Financial performance by segment 1533. Earnings per share 1554. Net finance costs 1565. Income tax expense 1566. Dividends 158
Significant items7. Significant accounting matters 1598. Special items and remeasurements 161
Capital base9. Capital by segment 16310. Intangible assets 16411. Property, plant and equipment 16512. Capital expenditure 16613. Investments in associates and joint ventures 16714. Financial asset investments 16915. Provisions for liabilities and charges 16916. Deferred tax 170
Working capital17. Inventories 17218. Trade and other receivables 17319. Trade and other payables 173
Net debt and financial risk management20. Net debt 17421. Borrowings 17622. Financial instruments and derivatives 17723. Financial risk management 180
Equity24. Called-up share capital and consolidated equity analysis 18325. Non-controlling interests 184
Employees26. Employee numbers and costs 18627. Retirement benefits 18728. Share-based payments 191
Unrecognised items and uncertain events29. Events occurring after end of year 19230. Commitments 19231. Contingent liabilities 192
Group structure32. Assets and liabilities held for sale 19333. Acquisitions and disposals 19334. Basis of consolidation 19435. Related undertakings of the Group 196
Other items36. Related party transactions 20537. Auditor’s remuneration 20538. Accounting policies 206
Financial statements of the Parent Company 214
Summary by operation 217
Key financial data 219
Exchange rates and commodity prices 220
141Anglo American plc Integrated Annual Report 2019

REPORT ON THE AUDIT OF THE FINANCIAL STATEMENTS
1. OpinionIn our opinion:
• the financial statements of Anglo American plc (the ‘Parent Company’) and itssubsidiaries (the ‘Group’) give a true and fair view of the state of the Group’sand of the Parent Company’s affairs as at 31 December 2019 and of theGroup’s profit for the year then ended;
• the Group financial statements have been properly prepared in accordancewith International Financial Reporting Standards (IFRSs) as adopted by theEuropean Union;
• the Parent Company financial statements have been properly prepared inaccordance with United Kingdom Generally Accepted Accounting Practice,including Financial Reporting Standard 101 “Reduced Disclosure Framework”;and
• the financial statements have been prepared in accordance with therequirements of the Companies Act 2006 and, as regards the Group financialstatements, Article 4 of the IAS Regulation.
We have audited the financial statements which comprise:
• the Consolidated income statement;
• the Consolidated statement of comprehensive income;
• the Consolidated balance sheet;
• the Consolidated cash flow statement;
• the Consolidated statement of changes in equity;
• the accounting policies;
• the related notes 1 to 38; and
• the Balance sheet of the Parent Company and related information.
The financial reporting framework that has been applied in the preparation ofthe Group financial statements is applicable law and IFRSs as adopted by theEuropean Union. The financial reporting framework that has been applied inthe preparation of the Parent Company financial statements is applicablelaw and United Kingdom Accounting Standards, including FRS 101“Reduced Disclosure Framework” (United Kingdom Generally AcceptedAccounting Practice).
2. Basis for opinionWe conducted our audit in accordance with International Standards on Auditing(UK) (ISAs (UK)) and applicable law. Our responsibilities under those standardsare further described in the auditor’s responsibilities for the audit of the financialstatements section of our report.
We are independent of the Group and the Parent Company in accordance withthe ethical requirements that are relevant to our audit of the financial statementsin the UK, including the Financial Reporting Council’s (the ‘FRC’s’) EthicalStandard as applied to listed public interest entities, and we have fulfilled ourother ethical responsibilities in accordance with these requirements. The non-audit services provided to the Group and Parent Company for the year aredisclosed in note 37 to the financial statements. We confirm that the non-auditservices prohibited by the FRC’s Ethical Standard were not provided to theGroup or the Parent Company.
We believe that the audit evidence we have obtained is sufficient andappropriate to provide a basis for our opinion.
3. Summary of our audit approachKey audit mattersThe key audit matters that we identified in the current year were:
• Impairment/impairment reversals of operating assets;
• Taxation; and
• Environmental restoration and decommissioning obligations.
MaterialityGroupThe materiality that we used for the Group financial statements was $200 millionwhich was determined with consideration to both asset and profit bases.$200 million equates to 0.6% of net assets and 3.5% of normalized three-yearpre-tax profit before special items and remeasurements.
Parent CompanyThe materiality that we used for the Parent Company financial statements was$76 million which represents below 1% of shareholders’ equity.
ScopingAll business units were subject to a full scope audit with the exception ofManganese and Nickel where specific procedures were performed, whichis consistent with our 2018 audit approach. Our approach continues to focuson the key audit matters identified within that business unit and to performappropriate procedures on the rest of the business unit’s financial informationconsidering its financial significance in the context of the Group as a whole.
Significant changes in our approachRestoration and decommissioning provisions were elevated to a key auditmatter for the 2019 audit, taking into account the materiality of the provisionsrecognised and the increased level of stakeholder focus on areas ofenvironmental concern.
The accounting for and presentation of special items and corporate assettransactions was identified as a key audit matter in 2018 but was considered tobe less relevant for the 2019 audit as there were no significant corporate assettransactions undertaken.
Further details have been included within Section 5 below.
4. Conclusions relating to going concern, principal risks andviability statement4.1 Going concernWe have reviewed the directors’ statement in note 38 to the financial statementsabout whether they considered it appropriate to adopt the going concernbasis of accounting in preparing them and their identification of any materialuncertainties to the Group’s and Company’s ability to continue to do so overa period of at least twelve months from the date of approval of thefinancial statements.
We considered as part of our risk assessment the nature of the Group, itsbusiness model and related risks including where relevant the impact of Brexit,the requirements of the applicable financial reporting framework and the systemof internal control. We evaluated the directors’ assessment of the Group’s abilityto continue as a going concern, including challenging the underlying data andkey assumptions used to make the assessment, and evaluated the directors’plans for future actions in relation to their going concern assessment.
We are required to state whether we have anything material to add or drawattention to in relation to that statement required by Listing Rule 9.8.6R(3) andreport if the statement is materially inconsistent with our knowledge obtained inthe audit.
Going concern is the basis of preparation of the financial statementsthat assumes an entity will remain in operation for a period of at least12 months from the date of approval of the financial statements.
We confirm that we have nothing material to report, add or draw attentionto in respect of these matters.
FINANCIAL STATEMENTS AND OTHER FINANCIAL INFORMATION
INDEPENDENT AUDITOR’S REPORT TO THE MEMBERS OF ANGLO AMERICAN PLC
142 Anglo American plc Integrated Annual Report 2019

4.2 Principal risks and viability statementBased solely on reading the directors’ statements and considering whether theywere consistent with the knowledge we obtained in the course of the audit,including the knowledge obtained in the evaluation of the directors’ assessmentof the Group’s and the Company’s ability to continue as a going concern, weare required to state whether we have anything material to add or draw attentionto in relation to:
• the disclosures on pages 45-49 that describe the principal risks, proceduresto identify emerging risks, and an explanation of how these are beingmanaged or mitigated;
• the directors’ confirmation on page 45 that they have carried out a robustassessment of the principal and emerging risks facing the Group, includingthose that would threaten its business model, future performance, solvencyor liquidity; or
• the directors’ explanation on pages 44-45 as to how they have assessed theprospects of the Group, over what period they have done so and why theyconsider that period to be appropriate, and the statement as to whetherthey have a reasonable expectation that the Group will be able to continuein operation and meet its liabilities as they fall due over the period of theirassessment, including any related disclosures drawing attention to anynecessary qualifications or assumptions.
We are also required to report whether the directors’ statement relating to theprospects of the Group required by Listing Rule 9.8.6R(3) is materiallyinconsistent with our knowledge obtained in the audit.
Viability means the ability of the Group to continue over the time horizonconsidered appropriate by the directors.
We confirm that we have nothing material to report, add or draw attentionto in respect of these matters.
5. Key audit mattersKey audit matters are those matters that, in our professional judgement, wereof most significance in our audit of the financial statements of the current periodand include the most significant assessed risks of material misstatement(whether or not due to fraud) that we identified. These matters included thosewhich had the greatest effect on: the overall audit strategy, the allocation ofresources in the audit; and directing the efforts of the engagement team.
These matters were addressed in the context of our audit of the financialstatements as a whole, and in forming our opinion thereon, and we do notprovide a separate opinion on these matters.
5.1 Impairment/impairment reversals of operating assets Refer to the Audit Committee report on pages 103-109 and the disclosures in note 7 on pages 159-160.
Key audit matterdescription
As a consequence of continued volatility in long-term forecast commodity prices, particularly for thermal coal, as well as licencingand operational developments during the year, the assessment of the recoverable amount of operating assets remains a keyjudgement and a source of estimation uncertainty. This risk is also identified as a fraud risk area due to the potential for managementbias as discussed further on page 147.
Management assessed whether indicators of impairment or impairment reversal exist for assets in accordance with IAS 36Impairment of Assets. Where such indicators were identified management has prepared valuation models to determine the value inuse or fair value less costs of disposal of the relevant asset.
During the year, indicators of impairment reversal were identified at Minas-Rio and an impairment reversal of $1.0 billion has beenrecorded primarily due to the stabilisation of operations during the year and the receipt of a key permit in December 2019.
Indicators of impairment were identified at the Cerrejón associate and South African thermal coal CGU consequent to a fall inforecast prices for thermal coal. As a result impairments have been recognised of $334 million and $585 million respectively.
The Group additionally holds goodwill of $1.6 billion and indefinite useful life assets of $0.5 billion allocated to the De Beers naturaldiamonds CGU which is required to be tested for impairment annually. At 31 December 2019 the amount by which the De Beersnatural diamonds CGU recoverable amount exceeded the carrying value was $1.0 billion. This headroom has reduced since the prioryear and management identified that a reasonable possible change in the forecast diamond price could result in an impairment ofthese assets. Additional disclosure as required by IAS 36 and IAS 1 has been provided on pages 159-160.
How the scope of ouraudit responded to thekey audit matter
We obtained an understanding of relevant controls over the impairment process, including management review controls.
We challenged management’s assessment as to whether indicators of impairment or impairment reversal exist. Where relevantwe have obtained copies of the valuation models prepared by management.
We challenged the assumptions made by management, including utilising Deloitte valuation and tax specialists where relevant,in relation to these models relating to discount rates used, risk adjustments to the cash flows, forecast tax cash flows and foreignexchange rates used.
We challenged the assumptions relating to commodity prices, including the impact of climate change-related risks on thermal coalpricing, capital expenditure and operating cost forecasts and the expected production profiles, by comparison to recent analysisforecast commodity price data, third-party documentation where available, consultation with operational management andconsideration of sensitivity analyses.
We worked with Deloitte valuation specialists to challenge the structural integrity of the models prepared.
We reviewed whether the life of mine plans in the impairment assessment are based on the most up-to-date Ore Reserve andMineral Resource reports prepared by management’s experts. We evaluated the consistency of the key assumptions used in thepreparation of those reports with the assumptions used in the valuation models and assessed the competence, experience andobjectivity of management’s experts.
We assessed whether the assumptions had been determined and applied on a consistent basis, where relevant, across the Group.
We also challenged management to ensure that disclosures meet the requirements of IAS 36 and specifically IAS 1 in terms ofdisclosing areas of estimation uncertainty.
Key observations We found that the assumptions used were reasonable and had been determined and applied on a consistent basis, where relevant,across the Group. No additional impairments or impairment reversals were identified from the work performed.
We found that the impairment reversal recorded at the Minas-Rio mine in Brazil and impairments recorded on the investment inCerrejón and South African thermal coal were appropriate and that no impairment to the De Beers natural diamonds CGU goodwillwas required.
We found management’s interpretation of the IAS 1 and IAS 36 disclosure requirements pertaining to the impairment assumptions tobe supportable, and concluded that the related disclosures were compliant with the relevant standards.
Anglo American plc Integrated Annual Report 2019 143

5.2 TaxationRefer to the Audit Committee report on pages 103-109 and the disclosures in notes 5 and 16 on pages 156-157 and 170-171 respectively.
Key audit matterdescription
The recognition and measurement of certain of the Group’s deferred tax assets and liabilities requires management judgement and isa key area of audit effort due to the complexity of tax regulations across the jurisdictions where the Group operates and the inherentuncertainty in future forecasts for deferred tax asset recognition.
At 31 December 2019, the deferred tax assets recognised by the Group totalled $1.1 billion (2018: $0.9 billion) with the mostsignificant asset related to Minas-Rio. Management has performed an assessment of the forecast taxable profits against which theGroup’s tax losses and other tax attributes can be offset in future periods.
The deferred tax liabilities recognised across the Group at 31 December 2019 were $3.9 billion (2018: $3.7 billion).
How the scope of ouraudit responded to thekey audit matter
We obtained an understanding of relevant controls, including management review controls over tax risk matters.
Through the close involvement of our tax specialist teams at both a Group and business unit level we assessed the appropriatenessand measurement of the deferred tax assets and liabilities recognised by the Group through discussions with the Group’s taxationdepartment and review of supporting documentation and calculations.
In relation to assessing the recoverability of deferred tax assets, we reviewed and challenged the basis and underlying assumptionsin the supporting taxable profit forecasts in order to assess the appropriateness of the assets recognised. In particular, we challengedmanagement’s assessment that, in measuring the Minas-Rio deferred tax asset, taxable profit forecasts considered probable shouldbe risk weighted by reference to the criteria set out in IAS 12.
In relation to deferred tax liabilities recognised across the Group, we reviewed the relevant deferred tax calculations and challengedmanagement’s underlying assumptions.
Key observations We are satisfied that deferred tax assets and liabilities are properly recognised and measured in accordance with IAS 12.
5.3 Environmental restoration and decommissioning obligations Refer to the Audit Committee report on pages 103-109 and the disclosures in note 15 on pages 169 to 170.
Key audit matterdescription
The Group has an obligation to undertake environmental restoration and decommissioning activity as a result of the development orongoing production of mining properties. The methodologies used to set or revise these provisions involve management judgementto estimate the cost required to complete the restoration and rehabilitation activity, the application of the relevant regulatoryframework and timing of expenditure.
At 31 December 2019, the environmental restoration and decommissioning provisions recognised by the Group totalled $2.3 billion(2018: $1.9 billion). Management reviews the restoration and decommissioning obligations on an annual basis, using internal experts,with external consultants' reviews every three years, to assist in evaluating key assumptions and judgements, including changes inregulations and complexities associated with the geographical conditions and mine structure unique to each mining operation.
How the scope of ouraudit responded to thekey audit matter
We obtained an understanding of relevant controls over the environmental restoration and decommissioning provisioning process,including management review controls.
We assessed management’s process for the review of closure provisions, and understood and challenged the key changes to theenvironmental restoration and decommissioning provisions across all business units, specifically focused on those locations witha heightened level of judgement.
Where management has obtained an updated expert report during the year we have reviewed the expert’s report and consideredthe competence and objectivity of the expert.
We have assessed the key cost assumptions, the completeness of such assessments and assessed the discount rates applied bymanagement to calculate the net present value. We also considered the accounting implications of any changes in legislation andregulatory requirements in each jurisdiction.
We checked the mathematical accuracy of management’s calculation and investigated any differences in management’s calculationsfrom estimates provided by third parties and challenged management on the appropriateness of the adjustments, includingconsideration of management bias.
Key observations We are satisfied the level of environmental restoration and decommissioning provisioning is appropriate.
FINANCIAL STATEMENTS AND OTHER FINANCIAL INFORMATIONINDEPENDENT AUDITOR’S REPORT TO THE MEMBERS OF ANGLO AMERICAN PLC
144 Anglo American plc Integrated Annual Report 2019

6. Our application of materiality6.1 MaterialityWe define materiality as the magnitude of misstatement in the financial statements that makes it probable that the economic decisions of a reasonablyknowledgeable person would be changed or influenced. We use materiality both in planning the scope of our audit work and in evaluating the results of our work.
Based on our professional judgement, we determined materiality for the financial statements as a whole as follows:
Materiality Group$200 million (2018: $200 million)
Parent Company$76 million (2018: $76 million)
Basis for determiningmateriality
GroupWe have considered both asset and profit bases in the determination of materiality. $200 million equates to 0.6% (2018: 0.7%) of netassets and 3.5% (2018: 4.2%) of normalised three-year pre-tax profit before special items and remeasurements.
The use of a combination of bases is consistent with our approach in 2018.
Parent CompanyThe Parent Company materiality represents below 1% (2018: below 1%) of shareholders’ equity. When determining this materiality,we also considered the appropriateness of this materiality for the consolidation of this set of financial statements to theGroup’s results.
Rationale for thebenchmark applied
GroupGiven the continued volatility in commodity prices and the cyclical nature of the mining industry we believe that incorporatingbalance sheet metrics in our assessment in addition to pre-tax profit before special items and remeasurements is a more appropriateapproach as it reflects the capital invested, the changes in production, the volume of commodities sold and the scale of theGroup’s operations.
Parent CompanyDue to the Parent Company’s primary role as a holding company, owning investments in other Group entities, shareholders’ equity isthe key metric driving shareholder value. As such, we considered shareholders’ equity the most appropriate benchmark to determinethe Parent Company materiality.
6.2 Performance materialityWe set performance materiality at a level lower than materiality to reduce theprobability that, in aggregate, uncorrected and undetected misstatementsexceed the materiality for the financial statements as a whole. Groupperformance materiality was set at 70% of Group materiality for the 2019audit (2018: 70%). In determining performance materiality, we consideredthe following factors:
a. Our risk assessment, including our assessment of the Group’s overallcontrol environment;
b. The consistent organisational structure of the Group relative to the prior yearaudit; and
c. Our past experience as auditors which has indicated a low number ofmisstatements identified in prior periods.
6.3 Error reporting thresholdWe agreed with the Audit Committee that we would report to the Committeeall audit differences in excess of $10 million (2018: $10 million), as well asdifferences below that threshold that, in our view, warranted reporting onqualitative grounds. We also report to the Audit Committee on disclosurematters that we identified when assessing the overall presentation of thefinancial statements.
7. An overview of the scope of our audit7.1 Identification and scoping of componentsOur audit was scoped by obtaining an understanding of the Group, the ParentCompany and their environment, including internal control, and assessing therisks of material misstatement.
All business units were subject to a full scope audit with the exception ofManganese and Nickel where specific procedures were performed, which isconsistent with our 2018 audit approach. Our approach continues to focuson the key audit matters identified within those business units and to performappropriate procedures on the rest of those business units’ financialinformation, noting their financial significance in the context of the Group asa whole.
The work performed by the component audit teams at each business unitis guided by the Group audit team and is executed at levels of materialityapplicable to each individual entity which were lower than Group materialityand ranged from $80 million to $140 million (2018: $80 million to $110 million).
7.2 Working with other auditorsFor all in-scope components, the Group audit team was involved in the auditwork performed by component auditors through a combination of globalplanning issues meetings, the provision of referral instructions, review andchallenge of related component inter-office reporting and of findings from theirwork (which included the audit procedures performed to respond to risks ofmaterial misstatement), attendance at component audit closing conferencecalls and regular interaction on any related audit and accounting matterswhich arose.
Specific procedures were performed at Manganese and Nickel business unitsand subject to oversight by the Group audit team. In addition, analytical reviewprocedures are performed by the Group audit team to identify any additionalrisks of material misstatement.
The Senior Statutory Auditor and/or a senior member of the Group audit teamvisits the principal location of each significant business unit at least once everyyear and key operational assets on a rotating basis.
The Parent Company is located in the United Kingdom and audited directly bythe Group audit team.
GROUP REVENUE
%
Full audit scope 95
Specified audit procedures 5
UNDERLYING EBIT
%
Full audit scope 93
Specified audit procedures 7
NET ASSETS
%
Full audit scope 96
Specified audit procedures 4
Anglo American plc Integrated Annual Report 2019 145

8. Other informationThe directors are responsible for the other information. The other informationcomprises the information included in the annual report, other than the financialstatements and our auditor’s report thereon.
Our opinion on the financial statements does not cover the other informationand, except to the extent otherwise explicitly stated in our report, we do notexpress any form of assurance conclusion thereon.
In connection with our audit of the financial statements, our responsibilityis to read the other information and, in doing so, consider whether theother information is materially inconsistent with the financial statementsor our knowledge obtained in the audit or otherwise appears to bematerially misstated.
If we identify such material inconsistencies or apparent material misstatements,we are required to determine whether there is a material misstatement in thefinancial statements or a material misstatement of the other information. If,based on the work we have performed, we conclude that there is a materialmisstatement of this other information, we are required to report that fact.
In this context, matters that we are specifically required to report to you asuncorrected material misstatements of the other information include wherewe conclude that:
• Fair, balanced and understandable – the statement given by the directorsthat they consider the annual report and financial statements taken as a wholeis fair, balanced and understandable and provides the information necessaryfor shareholders to assess the Group’s position and performance, businessmodel and strategy, is materially inconsistent with our knowledge obtained inthe audit; or
• Audit Committee reporting – the section describing the work of the AuditCommittee does not appropriately address matters communicated by us tothe Audit Committee; or
• Directors’ statement of compliance with the UK Corporate GovernanceCode – the parts of the directors’ statement required under the Listing Rulesrelating to the Company’s compliance with the UK Corporate GovernanceCode containing provisions specified for review by the auditor in accordancewith Listing Rule 9.8.10R(2) do not properly disclose a departure from arelevant provision of the UK Corporate Governance Code.
We have nothing to report in respect of these matters.
9. Responsibilities of directorsAs explained more fully in the directors’ responsibilities statement, the directorsare responsible for the preparation of the financial statements and for beingsatisfied that they give a true and fair view, and for such internal control as thedirectors determine is necessary to enable the preparation of financialstatements that are free from material misstatement, whether due to fraudor error.
In preparing the financial statements, the directors are responsible for assessingthe Group’s and the Parent Company’s ability to continue as a going concern,disclosing as applicable, matters related to going concern and using the goingconcern basis of accounting unless the directors either intend to liquidate theGroup or the Parent Company or to cease operations, or have no realisticalternative but to do so.
10. Auditor’s responsibilities for the audit of the financialstatementsOur objectives are to obtain reasonable assurance about whether the financialstatements as a whole are free from material misstatement, whether due tofraud or error, and to issue an auditor’s report that includes our opinion.Reasonable assurance is a high level of assurance, but is not a guarantee thatan audit conducted in accordance with ISAs (UK) will always detect a materialmisstatement when it exists. Misstatements can arise from fraud or error andare considered material if, individually or in the aggregate, they could reasonablybe expected to influence the economic decisions of users taken on the basis ofthese financial statements.
Details of the extent to which the audit was considered capable of detectingirregularities, including fraud and non-compliance with laws and regulations areset out below.
A further description of our responsibilities for the audit of the financialstatements is located on the FRC’s website at: www.frc.org.uk/auditorsresponsibilities. This description forms part of our auditor’s report.
11. Extent to which the audit was considered capable ofdetecting irregularities, including fraudWe identify and assess the risks of material misstatement of the financialstatements, whether due to fraud or error, and then design and perform auditprocedures responsive to those risks, including obtaining audit evidence thatis sufficient and appropriate to provide a basis for our opinion.
11.1 Identifying and assessing potential risks related to irregularitiesIn identifying and assessing risks of material misstatement in respect ofirregularities, including fraud and non-compliance with laws and regulations,we considered the following:
• the nature of the industry and sector, control environment and businessperformance including the design of the Group’s remuneration policies, keydrivers for directors’ remuneration, bonus levels and performance targets;
• the Group’s own assessment of the risks that irregularities may occur eitheras a result of fraud or error;
• results of our enquiries of management, internal audit, legal counsel, technicalspecialists and the Audit Committee about their own identification andassessment of the risks of irregularities;
• any matters we identified having obtained and reviewed the Group’sdocumentation of their policies and procedures relating to:
• identifying, evaluating and complying with laws and regulations andwhether they were aware of any instances of non-compliance;
• detecting and responding to the risks of fraud and whether they haveknowledge of any actual, suspected or alleged fraud;
• the internal controls established to mitigate risks of fraud or non-compliance with laws and regulations;
• the matters discussed among the audit engagement team including significantcomponent audit teams and involving relevant internal specialists, includingtax, valuations, pensions, and IT specialists regarding how and where fraudmight occur in the financial statements and any potential indicators of fraud.
As a result of these procedures, we considered the opportunities and incentivesthat may exist within the organisation for fraud and identified the greatestpotential for fraud in assessing the carrying value of operating assets. Incommon with all audits under ISAs (UK), we are also required to performspecific procedures to respond to the risk of management override.
We also obtained an understanding of the legal and regulatory frameworks thatthe Group operates in, focusing on provisions of those laws and regulations thathad a direct effect on the determination of material amounts and disclosures inthe financial statements. The key laws and regulations we considered in thiscontext included the UK Companies Act, Listing Rules, pension legislation andtax legislation.
In addition, we considered provisions of other laws and regulations that do nothave a direct effect on the financial statements but compliance with which maybe fundamental to the Group’s ability to operate or to avoid a material penalty,including the Group’s operating licences and environmental regulations.
FINANCIAL STATEMENTS AND OTHER FINANCIAL INFORMATIONINDEPENDENT AUDITOR’S REPORT TO THE MEMBERS OF ANGLO AMERICAN PLC
146 Anglo American plc Integrated Annual Report 2019

11.2 Audit response to risks identifiedAs a result of performing the above, we identified the assessment of thecarrying value of operating assets as the key audit matter related to the potentialrisk of fraud. The key audit matters section of our report explains the matter inmore detail and also describes the specific procedures we performed inresponse to this key audit matter.
In addition to the above, our procedures to respond to risks identified includedthe following:
• reviewing the financial statement disclosures and testing to supportingdocumentation to assess compliance with provisions of relevant laws andregulations described as having a direct effect on the financial statements;
• enquiring of management, the audit committee and in-house legal counselconcerning actual and potential litigation and claims;
• performing analytical procedures to identify any unusual or unexpectedrelationships that may indicate risks of material misstatement due to fraud;
• reading minutes of meetings of those charged with governance, reviewinginternal audit reports and reviewing correspondence with relevant regulatoryauthorities; and
• in addressing the risk of fraud through management override of controls,testing the appropriateness of journal entries and other adjustments;assessing whether the judgements made in making accounting estimatesare indicative of a potential bias; and evaluating the business rationale ofany significant transactions that are unusual or outside the normal courseof business.
We also communicated relevant identified laws and regulations and potentialfraud risks to all engagement team members including internal specialists andsignificant component audit teams, and remained alert to any indications offraud or non-compliance with laws and regulations throughout the audit.
REPORT ON OTHER LEGAL AND REGULATORY REQUIREMENTS
12. Opinions on other matters prescribed by theCompanies Act 2006In our opinion the part of the directors’ remuneration report to be audited hasbeen properly prepared in accordance with the Companies Act 2006.
In our opinion, based on the work undertaken in the course of the audit:
• the information given in the strategic report and the directors’ report for thefinancial year for which the financial statements are prepared is consistent withthe financial statements; and
• the strategic report and the directors’ report have been prepared inaccordance with applicable legal requirements.
In the light of the knowledge and understanding of the Group and the ParentCompany and their environment obtained in the course of the audit, we havenot identified any material misstatements in the strategic report or thedirectors’ report.
13. Matters on which we are required to report by exception13.1 Adequacy of explanations received and accounting recordsUnder the Companies Act 2006 we are required to report to you if, in ouropinion:
• we have not received all the information and explanations we require for ouraudit; or
• adequate accounting records have not been kept by the Parent Company,or returns adequate for our audit have not been received from branches notvisited by us; or
• the parent company financial statements are not in agreement with theaccounting records and returns.
We have nothing to report in respect of these matters.
13.2 Directors’ remunerationUnder the Companies Act 2006 we are also required to report if in our opinioncertain disclosures of directors’ remuneration have not been made or the partof the directors’ remuneration report to be audited is not in agreement with theaccounting records and returns.
We have nothing to report in respect of these matters.
14. Other matters14.1 Auditor tenureFollowing the recommendation of the Audit Committee, we were appointed bythe shareholders on 24 May 1999 to audit the financial statements for the yearended 31 December 1999 and subsequent financial periods. The period of totaluninterrupted engagement including previous renewals and reappointments ofthe firm is 21 years, covering the years ending 1999 to 2019. The year ended31 December 2019 will be the final year under audit by Deloitte.
14.2 Consistency of the audit report with the additional report to theAudit CommitteeOur audit opinion is consistent with the additional report to the Audit Committeewe are required to provide in accordance with ISAs (UK).
15. Use of our reportThis report is made solely to the Company’s members, as a body, inaccordance with Chapter 3 of Part 16 of the Companies Act 2006. Ouraudit work has been undertaken so that we might state to the Company’smembers those matters we are required to state to them in an auditor’sreport and for no other purpose. To the fullest extent permitted by law, wedo not accept or assume responsibility to anyone other than the Companyand the Company’s members as a body, for our audit work, for this report,or for the opinions we have formed.
Kari Hale, ACA (Senior statutory auditor)For and on behalf of Deloitte LLPStatutory AuditorLondon, UK19 February 2020
Anglo American plc Integrated Annual Report 2019 147

FINANCIAL STATEMENTS AND OTHER FINANCIAL INFORMATION PRIMARY STATEMENTS
148 Anglo American plc Integrated Annual Report 2019
CONSOLIDATED INCOME STATEMENTfor the year ended 31 December 2019
2019 2018
US$ million Note
Before specialitems and
remeasurements
Special items andremeasurements
(note 8) Total
Before specialitems and
remeasurements
Special items andremeasurements
(note 8) Total
Revenue 2 29,870 — 29,870 27,610 — 27,610Operating costs (23,543) (151) (23,694) (22,379) 838 (21,541)Operating profit 1, 2 6,327 (151) 6,176 5,231 838 6,069Non-operating special items 8 — 7 7 — (94) (94)Net income from associates and joint ventures 13 389 — 389 739 (11) 728Profit before net finance costs and tax 6,716 (144) 6,572 5,970 733 6,703
Investment income 268 — 268 261 — 261Interest expense (666) (3) (669) (655) (102) (757)Other net financing (losses)/gains (22) (3) (25) 14 (32) (18)
Net finance costs 4 (420) (6) (426) (380) (134) (514)Profit before tax 6,296 (150) 6,146 5,590 599 6,189Income tax expense 5 (1,760) 196 (1,564) (1,490) (326) (1,816)Profit for the financial year 4,536 46 4,582 4,100 273 4,373Attributable to:
Non-controlling interests 25 1,068 (33) 1,035 863 (39) 824Equity shareholders of the Company 3,468 79 3,547 3,237 312 3,549
Earnings per share (US$)
Basic 3 2.75 0.06 2.81 2.55 0.25 2.80Diluted 3 2.70 0.06 2.76 2.50 0.24 2.74
CONSOLIDATED STATEMENT OF COMPREHENSIVE INCOMEfor the year ended 31 December 2019
US$ million 2019 2018
Profit for the financial year 4,582 4,373Items that will not be reclassified to the income statement (net of tax)(1)
Remeasurement of net retirement benefit obligation (128) 105Net revaluation gain/(loss) on equity investments 18 (42)Share of associates’ and joint ventures’ other comprehensive income 55 —Items that have been or may subsequently be reclassified to the income statement (net of tax)(1)
Net exchange differences:Net gain/(loss) (including associates and joint ventures) 192 (2,211)Cumulative (gain)/loss transferred to the income statement on disposal of foreign operations (7) 35
Other comprehensive income/(loss) for the financial year (net of tax) 130 (2,113)Total comprehensive income for the financial year (net of tax) 4,712 2,260Attributable to:
Non-controlling interests 1,122 422Equity shareholders of the Company 3,590 1,838
(1) Tax amounts are shown in note 5C.

CONSOLIDATED BALANCE SHEETas at 31 December 2019
US$ million Note 2019 2018
ASSETS
Non-current assets
Intangible assets 10 3,086 3,087Property, plant and equipment 11 34,201 30,898Environmental rehabilitation trusts 15 301 303Investments in associates and joint ventures 13 1,333 1,715Financial asset investments 14 434 396Trade and other receivables 18 676 708Deferred tax assets 16 1,057 910Derivative financial assets 22 347 209Other non-current assets 642 658Total non-current assets 42,077 38,884Current assets
Inventories 17 4,962 4,466Trade and other receivables 18 2,386 2,026Current tax assets 130 121Derivative financial assets 22 86 132Cash and cash equivalents 20 6,345 6,567Total current assets 13,909 13,312Assets classified as held for sale 32 166 —Total assets 56,152 52,196
LIABILITIES
Current liabilities
Trade and other payables 19 (5,373) (4,734)Short term borrowings 20, 21 (990) (600)Provisions for liabilities and charges 15 (516) (581)Current tax liabilities (194) (818)Derivative financial liabilities 22 (155) (103)Total current liabilities (7,228) (6,836)Non-current liabilities
Trade and other payables 19 (126) (145)Medium and long term borrowings 20, 21 (9,744) (8,371)Retirement benefit obligations 27 (651) (609)Deferred tax liabilities 16 (3,922) (3,676)Derivative financial liabilities 22 (522) (613)Provisions for liabilities and charges 15 (2,557) (2,114)Total non-current liabilities (17,522) (15,528)Liabilities directly associated with assets classified as held for sale 32 (17) —Total liabilities (24,767) (22,364)
Net assets 31,385 29,832
EQUITY
Called-up share capital 24 753 772Share premium account 4,358 4,358Own shares 24 (6,195) (6,315)Other reserves (10,395) (10,519)Retained earnings 36,274 35,302Equity attributable to equity shareholders of the Company 24,795 23,598Non-controlling interests 25 6,590 6,234Total equity 31,385 29,832
The financial statements of Anglo American plc, registered number 03564138, were approved by the Board of directors on 19 February 2020 and signed on itsbehalf by:
Mark Cutifani Stephen PearceChief Executive Finance Director
FINANCIAL STATEMENTS AND OTHER FINANCIAL INFORMATION PRIMARY STATEMENTS
Anglo American plc Integrated Annual Report 2019 149

CONSOLIDATED CASH FLOW STATEMENTfor the year ended 31 December 2019
US$ million Note 2019 2018
Cash flows from operating activities
Profit before tax 6,146 6,189Net finance costs including financing special items and remeasurements 426 514Net income from associates and joint ventures (389) (728)Non-operating special items 8 (7) 94Operating profit 1 6,176 6,069Operating special items and remeasurements 8 151 (838)Cash element of special items (109) (3)Depreciation and amortisation 1 2,812 2,596Share-based payment charges 163 183Increase in provisions and net retirement benefit obligations 22 58Increase in inventories (434) (526)Increase in operating receivables (170) (74)Increase in operating payables 554 570Other adjustments 95 (253)Cash flows from operations 9,260 7,782Dividends from associates and joint ventures 13 520 737Dividends from financial asset investments — 1Income tax paid (2,116) (1,393)Net cash inflows from operating activities 7,664 7,127
Cash flows from investing activities
Expenditure on property, plant and equipment 12 (4,744) (3,400)Cash flows (used in)/from derivatives related to capital expenditure 12 (9) 15Proceeds from disposal of property, plant and equipment 12 8 162Investments in associates and joint ventures 13 (36) (99)Purchase of financial asset investments (4) (3)Net issuance of financial asset loans and receivables 14 (50) (22)Interest received and other investment income 205 204Net cash outflow on acquisitions 33 (13) (90)Net cash inflow on disposals 33 24 193Other investing activities (97) (58)Net cash used in investing activities (4,716) (3,098)
Cash flows from financing activities
Interest paid (415) (478)Cash flows used in derivatives related to financing activities 20 (152) (250)Dividends paid to Company shareholders 6 (1,422) (1,291)Dividends paid to non-controlling interests 25 (894) (837)Proceeds from issuance of bonds 958 647Proceeds from other borrowings 708 117Capital repayment of lease obligations (272) —Repayments of bonds and borrowings (581) (3,507)Net proceeds from issue of shares to non-controlling interests — 875Purchase of shares by Group companies (1,043) (293)Other financing activities (3) 40Net cash used in financing activities (3,116) (4,977)
Net decrease in cash and cash equivalents (168) (948)
Cash and cash equivalents at start of year 20 6,548 7,792Cash movements in the year (168) (948)Effects of changes in foreign exchange rates (45) (296)Cash and cash equivalents at end of year 20 6,335 6,548
FINANCIAL STATEMENTS AND OTHER FINANCIAL INFORMATION PRIMARY STATEMENTS
150 Anglo American plc Integrated Annual Report 2019

CONSOLIDATED STATEMENT OF CHANGES IN EQUITYfor the year ended 31 December 2019
US$ millionTotal share
capital(1)Own
shares(2)Retained earnings
Cumulativetranslation
adjustmentreserve
Otherreserves (note 24)
Total equityattributable
to equityshareholders
of theCompany
Non-controlling
interests Total equity
At 1 January 2018 5,130 (6,191) 32,735 (9,274) 572 22,972 5,910 28,882Total comprehensive income/(loss) — — 3,657 (1,782) (37) 1,838 422 2,260Dividends — — (1,291) — — (1,291) (873) (2,164)Issue of shares to non-controlling interests — — — — — — 38 38Equity settled share-based payment schemes — (124) 43 — (9) (90) (6) (96)Change in ownership interest in subsidiaries — — 163 — — 163 674 837Other — — (5) — 11 6 69 75At 31 December 2018 5,130 (6,315) 35,302 (11,056) 537 23,598 6,234 29,832
Impact of adoption of new accounting standards — — (80) — — (80) (12) (92)
At 1 January 2019 5,130 (6,315) 35,222 (11,056) 537 23,518 6,222 29,740Total comprehensive income — — 3,431 91 68 3,590 1,122 4,712Dividends — — (1,422) — — (1,422) (759) (2,181)Equity settled share-based payment schemes — 120 (237) — (2) (119) 3 (116)Shares cancelled during the year (19) — — — 19 — — —Share buyback — — (777) — — (777) — (777)Other — — 57 — (52) 5 2 7At 31 December 2019 5,111 (6,195) 36,274 (10,965) 570 24,795 6,590 31,385
(1) Includes share capital and share premium.(2) Own shares comprise shares of Anglo American plc held by the Company (treasury shares), its subsidiaries and employee benefit trusts.
FINANCIAL STATEMENTS AND OTHER FINANCIAL INFORMATION PRIMARY STATEMENTS
Anglo American plc Integrated Annual Report 2019 151

FINANCIAL STATEMENTS AND OTHER FINANCIAL INFORMATION NOTES TO THE FINANCIAL STATEMENTS
NOTES TO THE FINANCIAL STATEMENTS
152 Anglo American plc Integrated Annual Report 2019
FINANCIAL PERFORMANCE
Profit attributable to equity shareholders remainedconsistent at $3,547 million and underlyingearnings increased 7% to $3,468 million.
The following disclosures provide further information about the driversof the Group’s financial performance in the year. This includes analysisof the respective contribution of the Group’s reportable segmentsalong with information about its operating cost base, net finance costsand tax. In addition, disclosure on earnings per share and the dividendis provided.
PROFIT ATTRIBUTABLETO EQUITY SHAREHOLDERS
$3.5 bn
(2018: $3.5 bn)
1. OPERATING PROFIT FROM SUBSIDIARIES AND JOINT OPERATIONS
Overview
US$ million Note 2019 2018
Revenue 29,870 27,610Operating costs:
Employee costs 26 (3,359) (3,407)Depreciation of property, plant and equipment (2,765) (2,545)Amortisation of intangible assets (47) (51)Third party commodity purchases (7,463) (7,242)Consumables, maintenance and production input costs (5,335) (5,408)Logistics, marketing and selling costs (2,589) (2,159)Royalties (780) (609)Exploration and evaluation (246) (228)Net foreign exchange losses (8) —Other net operating expenses (951) (730)
Operating profit before special items and remeasurements 6,327 5,231Operating special items and remeasurements 8 (151) 838Operating profit 6,176 6,069
Royalties exclude items which meet the definition of income tax on profit and accordingly have been accounted for as taxes. Exploration and evaluation excludesassociated employee costs. The full exploration and evaluation expenditure is presented below.
Operating profit before special items and remeasurements is stated after charging:
US$ million 2019 2018
Exploration expenditure (126) (113)Evaluation expenditure (173) (172)Research and development expenditure (107) (90)Provisional pricing adjustment (200) (239)
Further informationIncluded in revenue is a total (realised and unrealised) loss on provisionally priced sales of $29 million (2018: loss of $184 million). This comprises realised losses of$11 million (2018: gains of $51 million) relating to sales that were provisionally priced as at 31 December 2018 with the final price settled in the current year, realisedlosses of $102 million (2018: losses of $151 million) relating to sales fully priced during the year, and unrealised gains of $84 million (2018: losses of $84 million)relating to sales that were provisionally priced as at 31 December 2019. In addition, operating costs include losses on provisionally priced purchase contracts of$171 million (2018: losses of $55 million).
Following the adoption of IFRS 16 Leases, only short-term leases less than 12 months, variable leasing costs, leases of low value and, for the majority of leases,the cost of non-lease components continue to be charged to Operating costs before special items and remeasurements. These totalled $36 million during the yearended 31 December 2019. For the year ended 31 December 2018, all leasing costs for operating leases were recognised as rentals under operating leases withinOperating costs before special items and remeasurements of $150 million.
Accounting policySee note 38C for the Group’s accounting policy on revenue. See note 38A for the Group’s accounting policy on change in accounting policies and disclosures,IFRS 16 Leases.

2. FINANCIAL PERFORMANCE BY SEGMENT
OverviewThe Group’s operating segments are aligned to those business units that are evaluated regularly by the chief operating decision maker in deciding how to allocateresources and in assessing performance. Operating segments with similar economic characteristics are aggregated into reportable segments. Shipping revenuerelated to shipments of the Group’s products is shown within the relevant operating segment. Revenue from other shipping arrangements is presented within the‘Corporate and other’ segment, which also includes unallocated corporate costs and exploration costs.
The disclosures in this note include certain Alternative Performance Measures (APMs). For more information on the APMs used by the Group, including definitions,please refer to page 228.
Segment results
2019
US$ millionGroup
revenueUnderlying
EBITDA
Depreciationand
amortisationUnderlying
EBIT
Net financecosts and
income taxexpense
Non-controlling
interestsUnderlying
earnings
De Beers 4,605 558 (390) 168 (119) (4) 45Copper 5,840 1,618 (658) 960 (334) (117) 509Platinum Group Metals 6,866 2,000 (328) 1,672 (541) (259) 872Iron Ore 6,758 3,407 (455) 2,952 (622) (695) 1,635Coal 6,137 1,832 (822) 1,010 (347) (1) 662Nickel and Manganese 1,498 634 (157) 477 (171) (5) 301Corporate and other 121 (43) (186) (229) (335) 8 (556)
31,825 10,006 (2,996) 7,010 (2,469) (1) (1,073) 3,468Less: associates and joint ventures (1,955) (867) 184 (683) 289 5 (389)Subsidiaries and joint operations 29,870 9,139 (2,812) 6,327 (2,180) (1,068) 3,079Reconciliation:
Net income from associates and joint ventures 389 389Special items and remeasurements (144) 79Profit before net finance costs and tax 6,572Profit attributable to equity shareholders of the Company 3,547
2018
US$ millionGroup
revenueUnderlying
EBITDA
Depreciationand
amortisationUnderlying
EBIT
Net financecosts and
income taxexpense
Non-controlling
interestsUnderlying
earnings
De Beers 6,082 1,245 (551) 694 (288) (57) 349Copper 5,168 1,856 (622) 1,234 (125) (192) 917Platinum Group Metals 5,680 1,062 (357) 705 (153) (134) 418Iron Ore 3,768 1,177 (430) 747 (424) (440) (117)Coal 7,788 3,196 (658) 2,538 (736) (47) 1,755Nickel and Manganese 1,707 844 (159) 685 (147) (12) 526Corporate and other 3 (219) (7) (226) (392) 7 (611)
30,196 9,161 (2,784) 6,377 (2,265) (1) (875) 3,237Less: associates and joint ventures (2,586) (1,334) 188 (1,146) 395 12 (739)Subsidiaries and joint operations 27,610 7,827 (2,596) 5,231 (1,870) (863) 2,498Reconciliation:
Net income from associates and joint ventures 728 728Special items and remeasurements 744 323Profit before net finance costs and tax 6,703Profit attributable to equity shareholders of the Company 3,549
(1) Comprises net finance costs of $451 million (2018: $395 million) and income tax expense of $2,018 million (2018: $1,870 million).
The segment results are stated after elimination of inter-segment interest and dividends and include an allocation of corporate costs.
FINANCIAL STATEMENTS AND OTHER FINANCIAL INFORMATION NOTES TO THE FINANCIAL STATEMENTS
FINANCIAL PERFORMANCE
Anglo American plc Integrated Annual Report 2019 153

Further informationSegments predominantly derive revenue as follows – De Beers: rough and polished diamonds; Copper: copper; Platinum Group Metals: platinum group metalsand nickel; Iron Ore: iron ore; Coal: metallurgical coal and thermal coal; Nickel and Manganese: nickel, manganese ore and alloys. See note 38C for the Group’saccounting policy on revenue recognition. The revenue analysis below includes the Group’s share of revenue in equity accounted associates and joint ventures.See note 13. Other revenue includes shipping revenue which predominantly relates to the Iron Ore, Platinum Group Metals and Copper segments.
Group revenue by product
2019 2018
US$ million
Revenue fromcontracts with
customersRevenue fromother sources
GroupRevenue
Revenue fromcontracts with
customersRevenue fromother sources
Group Revenue
Diamonds 4,597 8 4,605 6,076 6 6,082Copper 5,558 11 5,569 5,141 (213) 4,928Platinum 1,944 — 1,944 2,194 41 2,235Palladium 2,707 — 2,707 1,690 19 1,709Rhodium 1,215 — 1,215 698 9 707Iron ore 5,646 263 5,909 3,355 (19) 3,336Metallurgical coal 3,202 423 3,625 3,459 472 3,931Thermal coal 2,033 470 2,503 2,971 882 3,853Nickel 921 6 927 877 5 882Manganese ore and alloys — 926 926 — 1,147 1,147Other 1,812 83 1,895 1,353 33 1,386
29,635 2,190 31,825 27,814 2,382 30,196
Revenue from other sources includes net gains of $235 million on derivative financial instruments for sales and purchase contracts, provisionally priced receivablesand economic hedges of commodity sales which are reported within total revenue from subsidiaries and joint operations (2018: net losses of $204 million) and$1,955 million of revenue from associates and joint ventures (2018: $2,586 million).
Group revenue by destinationThe Group’s geographical analysis of segment revenue is allocated based on the customer’s port of destination. Where the port of destination is not known,revenue is allocated based on the customer’s country of domicile.
US$ million 2019 2018
China 9,470 6,933India 2,898 3,796Japan 3,114 2,840Other Asia 6,055 5,813South Africa 807 1,466Other Africa 1,220 1,816Brazil 437 383Chile 574 540Other South America 71 35North America 786 714Australia 229 47United Kingdom (Anglo American plc’s country of domicile) 2,379 1,889Other Europe 3,785 3,924
31,825 30,196
FINANCIAL STATEMENTS AND OTHER FINANCIAL INFORMATION NOTES TO THE FINANCIAL STATEMENTS
FINANCIAL PERFORMANCE
2. FINANCIAL PERFORMANCE BY SEGMENT continued
154 Anglo American plc Integrated Annual Report 2019

3. EARNINGS PER SHARE
OverviewThe disclosures in this note include certain Alternative Performance Measures (APMs). For more information on the APMs used by the Group, including definitions,please refer to page 228.
US$ 2019 2018
Earnings per share
Basic 2.81 2.80Diluted 2.76 2.74Underlying earnings per share
Basic 2.75 2.55Diluted 2.70 2.50Headline earnings per share
Basic 2.74 2.04Diluted 2.69 2.00
Further informationThe calculation of basic and diluted earnings per share is based on the following data:
Profit attributable to equityshareholders of the Company Underlying earnings Headline earnings
2019 2018 2019 2018 2019 2018
Earnings (US$ million)
Basic and diluted earnings 3,547 3,549 3,468 3,237 3,459 2,590
Weighted average number of shares (million)
Basic number of ordinary shares outstanding 1,263 1,269 1,263 1,269 1,263 1,269Effect of dilutive potential ordinary shares 21 27 21 27 21 27Diluted number of ordinary shares outstanding 1,284 1,296 1,284 1,296 1,284 1,296
The weighted average number of ordinary shares in issue excludes shares held by employee benefit trusts and Anglo American plc shares held by Groupcompanies. The diluted number of ordinary shares outstanding, including share options and awards, is calculated on the assumption of conversion of all potentiallydilutive ordinary shares. In the year ended 31 December 2019 there were 57,399 (2018: nil) share options that were potentially dilutive but not included in thecalculation of diluted earnings because they were anti-dilutive.
Headline earnings, a Johannesburg Stock Exchange defined performance measure, is reconciled from underlying earnings as follows:
US$ million 2019 2018
Underlying earnings for the financial year 3,468 3,237Other operating special items (63) (58)Operating remeasurements (100) (113)Non-operating special items – charges relating to BEE transactions (11) (31)Financing special items and remeasurements (9) (132)Tax special items and remeasurements 109 (137)Associates’ and joint ventures’ special items and remeasurements — (11)Other reconciling items 65 (165)Headline earnings for the financial year 3,459 2,590
The reconciling items above are shown net of tax and non-controlling interests.
Other reconciling items principally relate to adjustments to former operations and disposals of property, plant and equipment and investments (2018: include theimpact of business combinations and disposals of property, plant and equipment and investments).
FINANCIAL STATEMENTS AND OTHER FINANCIAL INFORMATION NOTES TO THE FINANCIAL STATEMENTS
FINANCIAL PERFORMANCE
Anglo American plc Integrated Annual Report 2019 155

4. NET FINANCE COSTS
Overview
US$ million 2019 2018
Investment income
Interest income from cash and cash equivalents 188 188Interest income from associates and joint ventures 21 22Other interest income 35 27Net interest income on defined benefit arrangements 26 23Dividend income from financial asset investments — 1
270 261Less: Interest income capitalised (2) —Investment income 268 261
Interest expense
Interest and other finance expense (603) (561)Net interest cost on defined benefit arrangements (45) (45)Unwinding of discount relating to provisions and other liabilities (92) (90)
(740) (696)Less: Interest expense capitalised 74 41Interest expense before special items and remeasurements (666) (655)Financing special items (3) (102)Interest expense (669) (757)
Other net financing (losses)/gains
Net foreign exchange gains 30 14Other net fair value losses (52) —Other net financing (losses)/gains before special items and remeasurements (22) 14Financing remeasurements (3) (32)Other net financing losses (25) (18)
Net finance costs (426) (514)
Further informationFollowing the adoption of IFRS 16 Leases from 1 January 2019, the interest expense of $32 million incurred on lease liabilities is recognised within Interestand other finance expense for the year ended 31 December 2019. For the year ended 31 December 2018, all operating lease expenses were recognisedwithin operating costs.
Interest income recognised at amortised cost is $106 million (2018: $129 million) and interest expense recognised at amortised cost is $452 million (2018: $491 million).
Accounting policySee note 38A for the Group’s accounting policy on IFRS 16 Leases and 38C on borrowing costs.
FINANCIAL STATEMENTS AND OTHER FINANCIAL INFORMATION NOTES TO THE FINANCIAL STATEMENTS
FINANCIAL PERFORMANCE
156 Anglo American plc Integrated Annual Report 2019
5. INCOME TAX EXPENSE
OverviewThe effective tax rate for the year of 25.4% (2018: 29.3%) is higher (2018: higher) than the applicable statutory rate of corporation tax in the United Kingdom of19.0% (2018: 19.0%).
2019
Profitbefore tax
US$ millionTax chargeUS$ million
Effective tax rate
Calculation of effective tax rate (statutory basis) 6,146 (1,564) 25.4%Adjusted for:
Special items and remeasurements 150 (196)Associates’ and joint ventures’ tax and non-controlling interests 263 (258)
Calculation of underlying effective tax rate 6,559 (2,018) 30.8%
The underlying effective tax rate was 30.8% for the year ended 31 December 2019. This is lower than the equivalent underlying effective tax rate of 31.3% for theyear ended 31 December 2018. The effective tax rate in 2019 benefited from the impact of the relative levels of profits arising in the Group’s operating jurisdictions.In future periods, it is expected that the underlying effective tax rate will remain above the United Kingdom statutory tax rate.
The disclosures in this note include certain Alternative Performance Measures (APMs). For more information on the APMs used by the Group, including definitions,please refer to page 228.

A. Analysis of charge for the year
US$ million 2019 2018
United Kingdom corporation tax 67 26South Africa tax 879 673Other overseas tax 712 1,030Prior year adjustments (90) (56)Current tax 1,568 1,673Deferred tax 192 (183)Income tax expense before special items and remeasurements 1,760 1,490Special items and remeasurements tax (note 8) (196) 326Income tax expense 1,564 1,816
Current tax includes royalties which meet the definition of income tax and are in addition to royalties recorded in operating costs.
B. Factors affecting tax charge for the yearThe reconciling items between the statutory corporation tax rate and the income tax expense are:
US$ million 2019 2018
Profit before tax 6,146 6,189Less: Net income from associates and joint ventures (389) (728)Profit before tax (excluding associates and joint ventures) 5,757 5,461Tax calculated at United Kingdom corporation tax rate of 19.0% (2018: 19.0%) 1,094 1,038
Tax effects of:
Items non-deductible/taxable for tax purposes 218 55
Temporary difference adjustments
Current year losses not recognised 86 172Recognition of losses and temporary differences not previously recognised (15) (161)Utilisation of losses and temporary differences not previously recognised (290) (32)Write-off of losses and temporary differences previously recognised — 144Adjustment in deferred tax due to change in tax rate 4 —Other temporary differences 46 47
Special items and remeasurements (167) 212
Other adjustments
Dividend withholding taxes 142 (195)Effect of differences between local and United Kingdom tax rates 533 556Prior year adjustments to current tax (90) (56)Other adjustments 3 36Income tax expense 1,564 1,816
The special items and remeasurements reconciling credit of $167 million (2018: charge of $212 million) relates to the net tax impact of total special items andremeasurements before tax calculated at the United Kingdom corporation tax rate less the associated tax recorded against these items and tax special itemsand remeasurements.
Included within dividend withholding taxes for the year ended 31 December 2019 is a credit of $14 million (2018: credit of $285 million) due to a reassessmentof future dividend distributions.
Associates’ and joint ventures’ tax included within Net income from associates and joint ventures for the year ended 31 December 2019 is a charge of $258 million(2018: charge of $391 million). Excluding special items and remeasurements, this becomes a charge of $258 million (2018: charge of $380 million).
C. Tax amounts included in other comprehensive incomeThe Consolidated statement of comprehensive income includes a tax charge on the remeasurement of net retirement benefit obligations recognised directly inequity that will not be reclassified to the income statement of nil (2018: charge of $30 million). In addition, there is a tax charge on the net revaluation loss on equityinvestments recognised directly in equity that will not subsequently be reclassified to the income statement of $3 million (2018: tax credit of $2 million). Furthermore,there is a tax charge of $6 million (2018: nil) on the share of associates’ and joint ventures’ other comprehensive income that will not be reclassified to the incomestatement.
D. Tax amounts recognised directly in equityIn 2019, deferred tax of $4 million (2018: $12 million credit) was charged to equity in relation to share-based payments.
Accounting judgementThe Group’s tax affairs are governed by complex domestic tax legislations, international tax treaties between countries and the interpretation of these by taxauthorities and courts. Given the many uncertainties that could arise from these factors, judgement is often required in determining the tax that is due. Wheremanagement is aware of potential uncertainties that are judged more likely than not to result in a liability for additional tax, a provision is made for management’sbest estimate of the liability, determined with reference to similar transactions and, in some cases, reports from independent experts.
Accounting policySee note 38G for the Group’s accounting policy on tax.
FINANCIAL STATEMENTS AND OTHER FINANCIAL INFORMATION NOTES TO THE FINANCIAL STATEMENTS
FINANCIAL PERFORMANCE
5. INCOME TAX EXPENSE continued
Anglo American plc Integrated Annual Report 2019 157

6. DIVIDENDS
2019 2018
Proposed final ordinary dividend per share (US cents) 47 51Proposed final ordinary dividend (US$ million) 588 660
These financial statements do not reflect the proposed final ordinary dividend as it is still subject to shareholder approval.
Dividends paid during the year are as follows:
US$ million 2019 2018
Final ordinary dividend for 2018 – 51 US cents per ordinary share (2017: 54 US cents per ordinary share) 657 681Interim ordinary dividend for 2019 – 62 US cents per ordinary share (2018: 49 US cents per ordinary share) 765 610
1,422 1,291
FINANCIAL STATEMENTS AND OTHER FINANCIAL INFORMATION NOTES TO THE FINANCIAL STATEMENTS
FINANCIAL PERFORMANCE
158 Anglo American plc Integrated Annual Report 2019

SIGNIFICANT ITEMS
Special items and remeasurements are a net gainof $0.1 billion and include an impairment reversalat Minas-Rio of $1.0 billion, partially offset by theimpairments of South African thermal coal andCerrejón of $0.9 billion.
SPECIAL ITEMS AND REMEASUREMENTS
$0.1 bn
(2018: $0.3 bn)
During 2019, the significant accounting matters addressed by management included:
● the assessment of impairment and impairment reversal indicators
● the estimation of cash flow projections for impairment testing.
FINANCIAL STATEMENTS AND OTHER FINANCIAL INFORMATION NOTES TO THE FINANCIAL STATEMENTS
Anglo American plc Integrated Annual Report 2019 159
7. SIGNIFICANT ACCOUNTING MATTERS
In the course of preparing financial statements, management necessarilymakes judgements and estimates that can have a significant impact on thefinancial statements. The critical judgements and sources of estimationuncertainty that affect the results for the year ended 31 December 2019 areset out below. In addition to these items, further detail on other significantjudgements and estimates determined by management is provided, whereapplicable, in the relevant note to the financial statements.
Impairment and impairment reversals of assetsi) Critical accounting judgementsThe Group assesses at each reporting date whether there are any indicatorsthat its assets and cash generating units (CGUs) may be impaired. Operatingand economic assumptions which could affect the valuation of assets usingdiscounted cash flows, including those that could be impacted by the Group’sprincipal risks, are updated regularly as part of the Group’s planning andforecasting processes. Judgement is therefore required to determine whetherthe updates represent significant changes in the service potential of an asset orCGU, and are therefore indicators of impairment or impairment reversal. Thejudgement also takes into account the Group’s long-term economic forecasts,market consensus and sensitivity analysis of the discounted cash flow modelsused to value the Group’s assets.
Assets (other than goodwill) that have been previously impaired must beassessed for indicators of both impairment and impairment reversal. Suchassets are, by definition, carried on the balance sheet at a value close to theirrecoverable amount at the last assessment. Therefore in principle any change tooperational plans or assumptions, economic parameters, or the passage oftime, could result in further impairment or impairment reversal if an indicator isidentified. Significant operating assets that the Group has previously impairedinclude Minas-Rio (Iron Ore); Dawson and Isibonelo (Coal); Barro Alto andSamancor (Nickel and Manganese) and El Soldado (Copper). These assets havea combined carrying value of $7.1 billion within property, plant and equipmentas at 31 December 2019.
ii) Cash flow projections for impairment testing Expected future cash flows used in discounted cash flow models are inherentlyuncertain and could materially change over time. They are significantly affectedby a number of factors including Ore Reserves and Mineral Resources, togetherwith economic factors such as commodity prices, exchange rates, discountrates and estimates of production costs and future capital expenditure. Wherediscounted cash flow models based on management’s assumptions are used,the resulting fair value measurements are considered to be at level 3 in the fairvalue hierarchy, as defined in IFRS 13 Fair Value Measurement, as they dependto a significant extent on unobservable valuation inputs.
Cash flow projections are based on financial budgets and Life of Mine Plans or,for non-mine assets, an equivalent appropriate long-term forecast, incorporatingkey assumptions as detailed below:
• Ore Reserves and Mineral Resources Ore Reserves and, where considered appropriate, Mineral Resources areincorporated in projected cash flows, based on Ore Reserves and MineralResources statements and exploration and evaluation work undertaken by
appropriately qualified persons. Mineral Resources are included wheremanagement has a high degree of confidence in their economic extraction,despite additional evaluation still being required prior to meeting the requiredconfidence to convert to Ore Reserves.
• Commodity and product prices Commodity and product prices are based on latest internal forecasts,benchmarked with external sources of information, to ensure they are withinthe range of available analyst forecasts. In estimating the forecast cash flows,management also takes into account the expected realised price from existingcontractual arrangements.
• Foreign exchange rates Foreign exchange rates are based on latest internal forecasts, benchmarkedwith external sources of information for relevant countries of operation. Long-term foreign exchange rates are kept constant on a real basis.
• Discount rates Cash flow projections used in fair value less costs of disposal impairmentmodels are discounted based on a real post-tax discount rate, assessedannually, of 7.0% (2018: 7.0%). Adjustments to the rate are made for any risksthat are not reflected in the underlying cash flows, including the risk profile ofthe individual asset and country risk.
• Operating costs, capital expenditure and other operating factors Operating costs and capital expenditure are based on financial budgetscovering a five-year period. Cash flow projections beyond five years are basedon Life of Mine Plans or non-mine production plans, as applicable, andinternal management forecasts. Cost assumptions incorporate managementexperience and expectations, as well as the nature and location of theoperation and the risks associated therewith (for example, the grade of OreReserves varying significantly over time and unforeseen operational issues).Underlying input cost assumptions are consistent with related output priceassumptions. Other operating factors, such as the timelines of grantinglicences and permits are based on management’s best estimate of theoutcome of uncertain future events at the balance sheet date. For furtherinformation refer to the unaudited Ore Reserves and Mineral ResourcesReport 2019.
Where an asset has potential for future development through capitalinvestment, to which a market participant would attribute value, and the costsand economic benefits can be estimated reliably, this development is includedin the cash flows (with appropriate risk adjustments).
iii) Key sources of estimation uncertainty For assets where indicators of impairment or impairment reversal are identified,the Group performs impairment reviews to assess the recoverable amount of itsoperating assets principally with reference to fair value less costs of disposal,assessed using discounted cash flow models. Mining operations are large,complex assets requiring significant technical and financial resources to operate.Their value may be sensitive to a range of characteristics unique to each asset.Management applies judgement in determining the assumptions that areconsidered to be reasonable and consistent with those that would be appliedby market participants as outlined in note 38D. All assumptions are made fromthe perspective of a hypothetical informed market participant (as required by

IFRS 13 Fair Value Measurement). As a result, these assumptions may differfrom the Group’s own internal forecasts.
Minas-RioMinas-Rio was last impaired in 2015 by $2.5 billion based on a recoverableamount of $3.6 billion, as a result of a deterioration in the long-term outlook foriron ore prices. Prior to that date, impairment charges of $5.0 billion and$3.8 billion were recorded in 2012 and 2014.
Following pipeline leaks and the suspension of operations in March 2018,operations at Minas-Rio resumed in December 2018. The ramp-up hasprogressed well during 2019, facilitated by access to higher grade ore in theStep 3 licence area, and a key tailings dam extension permit was received inDecember 2019. Additionally, while the long-term outlook for iron ore hasremained broadly unchanged since 2015, the outlook for market conditionsin the nearer term has improved. Consequently, the valuation of Minas-Riohas been assessed and the previous impairment has been partially reversedto a recoverable amount of $5.3 billion, resulting in a gain of $1.0 billion($1.0 billion after tax). Of the impairment reversal, $1,023 million has beenallocated against property, plant and equipment and $10 million against landand buildings.
The recoverable amount is based on a discounted cash flow model. Thevaluation is inherently sensitive to changes in economic and operationalassumptions which could materially increase or reduce the valuation. Keyassumptions include the long-term realised iron ore price, and the timing ofreceipt of required permits and licences. The forecast realised price is calculatedusing the Platts 62% CFR price as a reference, with adjustments to reflect theanticipated grade and form of the Minas-Rio product, as well as an adjustmentfor future freight costs. In addition to the base case valuation, alternativescenarios have been considered to assess the impact of changes in keyassumptions. The most significant input to the valuation is the long-term pricefor iron ore used to calculate the forecast long-term realised price. The modeluses a long-term iron ore price that falls within the top quartile of the analystrange of $66/tonne to $76/tonne (Platts 62% CFR reference basis, 2020 realterms). If the model assumption were changed by $5/tonne with all othervaluation assumptions remaining the same, this would change the valuation by$0.6 billion.
South African thermal coalThe South African thermal coal CGU includes all of the Group’s South Africanthermal coal operations with the exception of the Isibonelo coal mine. Followinglower forecast short and medium-term thermal coal prices during 2019 andresultant negative cash flows of operations included within the South Africanthermal coal CGU, an impairment charge of $585 million has been recognised($585 million after tax and non-controlling interests). This has brought thecarrying amount into line with the recoverable amount of $0.6 billion.
The valuation, based on discounted cash flows, is sensitive to changes in inputassumptions, particularly in relation to future thermal coal prices and SouthAfrican rand foreign exchange rates over the period 2020 to 2028. The forecastrealised price is calculated using API4 FOB Richards Bay as a reference, withadjustments to reflect the quality and location of the product. In addition to thebase case valuation, alternative scenarios have been considered to assess theimpact of changes in key assumptions. The most significant input to thevaluation is the short to medium-term price for thermal coal used to calculatethe forecast realised prices. The model uses an average thermal coal price thatfalls within an analyst range throughout the Life of Mine Plan. However, thethermal coal price in the model falls within the top quartile of the analyst rangefrom 2025 onwards, of $79/tonne to $92/tonne API4 FOB Richards Bayreference basis, 2020 real terms. If the model assumptions were changed by$5/tonne throughout the Life of Mine Plan with all other valuation assumptionsremaining the same, this would change the valuation by $0.4 billion. The modeluses a forecast for the average South African rand to US dollar real exchangerate which falls within the analyst range of 12.2 ZAR/$ to 16.7 ZAR/$. A 10%appreciation of the South African rand compared to the valuation assumptionsacross the forecasted period would decrease the valuation by $0.5 billion. Thevaluation is not sensitive to long-term assumptions due to the remaining assetlives.
CerrejónThe Group has a 33% interest in Cerrejón, an exporter of Colombian thermalcoal, which is accounted for as an investment in an associate. Following lowerforecast thermal coal prices for Cerrejón’s principal markets during 2019 and arevision to the Life of Mine Plan, an impairment charge of $334 million has beenrecognised ($334 million after tax). This has brought the carrying amount intoline with the recoverable amount of $0.5 billion.
The valuation, based on discounted cash flows, is sensitive to changes in inputassumptions, particularly in relation to future Colombian thermal coal prices. Theforecast realised price is calculated using API4 FOB Richards Bay as reference,with adjustments to reflect the quality and location of the product. In addition tothe base case valuation, alternative scenarios have been considered to assessthe impact of changes in key assumptions. The most significant input to thevaluation is the short to medium-term price for thermal coal used to calculatethe forecast realised price. The model uses prices linked to thermal coal pricesthat fall within the analyst range noted above for South African thermal coal. Ifthe model assumptions were changed by $5/tonne in each year with all othervaluation assumptions remaining the same, this would change the valuation by$0.2 billion.
De Beers natural diamonds goodwillThe valuation of the De Beers natural diamonds CGU has been assessed as at31 December 2019 and the recoverable amount was considered to exceed thecarrying value by $1.0 billion. The valuation, based on discounted cash flows, issensitive to input assumptions particularly in relation to the future price growthfor diamonds. The two primary factors impacting price growth are expectedconsumer demand growth and changes in global supply.
Expected consumer demand growth (in USD terms) is driven predominantly by:local currency GDP growth expectations in the primary markets in whichdiamonds are sold; foreign exchange movements against the US dollar and thedesirability of diamonds. Desirability includes all aspects of buying behavioursuch as competition for share of wallet from other luxury products includingexperiential holidays, hardline and softline goods, new technology and otherproducts such as labgrown diamonds.
The valuation remains sensitive to consumer demand growth that provide bothupside and downside risk. For example a reduction in the weighted GDP growthrates, a strengthening of the US dollar or an increase in substitution by labgrowngems would suppress consumer demand growth. These factors have a rangeof possible impacts that may not occur independently of each other.
The medium-term real GDP growth assumption in US dollar terms inherent inthe consumer demand forecast is 2.7% which is sourced from an externalprovider and is weighted based on the key markets in which we operateincluding the US, China, India, Japan, Gulf Region and Eurozone.
The foreign exchange assumption inherent in the consumer demand forecast isbased on an external forecast, and in the medium-term incorporates annual USdollar depreciation of 0.5% against the Chinese renminbi and 0.8% against theJapanese yen and 0.5% annual appreciation against the Indian rupee.
The consumer demand forecast has assumed a growth in the short-termmarket penetration of labgrown diamonds which is then forecast to revert backto a stable share of the market by 2024 as the product becomes distinguishedas a separate category.
A range of alternative scenarios have been considered in determining whetherthere is a reasonably possible change in consumer demand growth, whichwould result in the recoverable amount equating to the carrying amount.These scenarios are consistent with external forecasts that incorporate realyear-on-year demand growth of 0-1% in the conservative estimate or 2-3%in more optimistic estimates.
A 0.6 percentage point underperformance in our consumer demand growthexpectation, either through a 10% appreciation in the US dollar or a reductionin real GDP growth assumptions by 0.6 percentage points, with other valuationassumptions remaining the same, would result in the recoverable amountequating to the carrying amount.
Changes in total global supply is driven primarily by the output anticipated fromnew projects. Our assessment is that no reasonably possible change in globalsupply with other assumptions remaining the same, would result in therecoverable amount equating to the carrying amount.
Recognition of deferred tax assetsIn accordance with the requirements of IAS 12 Income Taxes, the Groupreassesses the recognition and recoverability of deferred tax assets at the endof each reporting period. This assessment is performed for each jurisdictionbased upon the application of tax law, the likelihood of taxable profits arising infuture periods and the likelihood that tax assets will be utilised. In determiningthe likelihood of future taxable profits the Group considers the financial forecastsand the associated risks from operational and financial uncertainties.
FINANCIAL STATEMENTS AND OTHER FINANCIAL INFORMATION NOTES TO THE FINANCIAL STATEMENTS
SIGNIFICANT ITEMS
7. SIGNIFICANT ACCOUNTING MATTERS continued
160 Anglo American plc Integrated Annual Report 2019

8. SPECIAL ITEMS AND REMEASUREMENTS
Overview
2019 2018
US$ million Before tax Tax
Non-controlling
interests Net Net
Impairments and impairment reversals 131 — — 131 851Other operating special items (180) 55 62 (63) (58)Operating remeasurements (102) 8 (6) (100) (113)Operating special items and remeasurements (151) 63 56 (32) 680Disposals of businesses and investments (51) 24 — (27) (25)Adjustments relating to business combinations 23 — — 23 7Adjustments relating to former operations 48 (11) (11) 26 (39)Charges relating to BEE transactions (13) — 2 (11) (31)Non-operating special items 7 13 (9) 11 (88)Financing special items and remeasurements (6) (1) (2) (9) (132)Tax special items and remeasurements — 121 (12) 109 (137)Total (150) 196 33 79 323Associates’ and joint ventures’ special items and remeasurements — (11)Total special items and remeasurements 79 312
Special itemsSpecial items are those items of financial performance that, due to their size andnature, the Group believes should be separately disclosed on the face of theincome statement. These items, along with related tax and non-controllinginterests, are excluded from underlying earnings, which is an AlternativePerformance Measure (APM). For more information on the APMs used by theGroup, including definitions, please refer to page 228.
• Operating special items are those that relate to the operating performance ofthe Group and principally include impairment charges and reversals andrestructuring costs.
• Non-operating special items are those that relate to changes in the Group’sasset portfolio. This category principally includes profits and losses ondisposals of businesses and investments or closure of operations,adjustments relating to business combinations, and adjustments relating toformer operations of the Group, such as changes in the measurement ofdeferred consideration receivable or provisions recognised on disposal orclosure of operations in prior periods. This category also includes chargesrelating to Black Economic Empowerment (BEE) transactions.
• Financing special items are those that relate to financing activities and includerealised gains and losses on early repayment of borrowings, and theunwinding of the discount on material provisions previously recognised asspecial items.
• Tax special items are those that relate to tax charges or credits where theassociated cash outflow or inflow is anticipated to be significant due to its sizeand nature, principally including resolution of tax enquiries.
RemeasurementsRemeasurements are items that are excluded from underlying earnings in orderto reverse timing differences in the recognition of gains and losses in the incomestatement in relation to transactions that, while economically linked, are subjectto different accounting measurement or recognition criteria. Remeasurementsinclude mark-to-market movements on derivatives that are economic hedges oftransactions not yet recorded in the financial statements, in order to ensure thatthe overall economic impact of such transactions is reflected within the Group’sunderlying earnings in the period in which they occur. When the underlyingtransaction is recorded in the income statement, the realised gains or losses arereversed from remeasurements and are recorded in underlying earnings withineither revenue, operating costs or net finance costs as appropriate. If theunderlying transaction is recorded in the balance sheet, for example capitalexpenditure, the realised amount remains in remeasurements on settlement ofthe derivative.
• Operating remeasurements include unrealised gains and losses on derivativesrelating to revenue, operating costs or capital expenditure transactions. Theyalso include the reversal through depreciation and amortisation of a fair valuegain or loss, arising on revaluation of a previously held equity interest in abusiness combination.
• Financing remeasurements include unrealised gains and losses on financialassets and liabilities that represent economic hedges, including accountinghedges, related to financing arrangements.
• Tax remeasurements include foreign exchange impacts arising in US dollarfunctional currency entities where tax calculations are generated basedon local currency financial information and hence tax is susceptible tocurrency fluctuations.
Operating special itemsImpairments and impairment reversalsNet impairments and impairment reversals of $131 million ($131 million after taxand non-controlling interests) for the year ended 31 December 2019 principallycomprise the impairment reversals of Minas-Rio (Iron Ore) of $1,033 million($1,033 million after tax) and the impairment charges of South African thermalcoal (Coal) of $585 million ($585 million after tax and non-controlling interests),Cerrejón (Coal) of $334 million ($334 million after tax), and Corporate assets(Corporate and other) of $30 million ($30 million after tax).
Further information on significant accounting matters relating to impairmentsand impairment reversals is provided in note 7.
2018Net impairments and impairment reversals of $851 million after tax and non-controlling interests for the year ended 31 December 2018 principally consistedof impairment reversals of $652 million for Moranbah-Grosvenor (Coal) and$259 million for Capcoal (Coal) partially offset by $60 million relating to the write-off of assets in De Beers’ South African operations.
Other operating special itemsThe loss of $180 million ($63 million after tax and non-controlling interests)principally relates to the cost to the Group of terminating a long-term powersupply contract in Copper.
2018The loss of $58 million after tax related to the cost to the Group of the transferof liabilities of a South African pension scheme.
FINANCIAL STATEMENTS AND OTHER FINANCIAL INFORMATION NOTES TO THE FINANCIAL STATEMENTS
SIGNIFICANT ITEMS
Anglo American plc Integrated Annual Report 2019 161

Operating remeasurementsOperating remeasurements reflect a net loss of $102 million ($100 million aftertax and non-controlling interests) which principally relates to a $103 milliondepreciation and amortisation charge arising due to the fair value uplift on theGroup’s pre-existing 45% shareholding in De Beers, which was required onacquisition of a controlling stake.
2018Operating remeasurements reflected a net loss of $113 million after tax andnon-controlling interests for the year ended 31 December 2018.
Non-operating special itemsDisposals of businesses and investmentsOn 27 November 2019, the Group announced the equalisation of ownershipacross its integrated metallurgical coal operations at Moranbah North andGrosvenor in Australia (Coal). On entering into an agreement for the sale of a12% interest in the Grosvenor mine to the same consortium partners for cashproceeds of $141 million, an impairment charge of $59 million ($41 million aftertax) was recorded to bring the carrying amount of the related net assets intoline with its fair value less costs to sell based on the fair value of the salesconsideration.
2018The net loss of $25 million after tax and non-controlling interests related to thedisposals of the Group’s interests in the Bafokeng Rasimone Platinum Mine, theUnion platinum mine and Masa Chrome Company Proprietary Limited (PlatinumGroup Metals), the Eskom-tied domestic coal operations in South Africa and theDrayton mine (Coal).
Adjustments relating to business combinationsThe $23 million gain during the year ended 31 December 2019 relates toadjustments in respect of business combinations in prior periods.
2018The $7 million gain related to adjustments in respect of business combinationsin prior periods, including a gain on settlement of a related commercial dispute.
Adjustments relating to former operationsThe gain of $48 million ($26 million after tax and non-controlling interests) relatesto adjustments in respect of disposals completed in prior periods.
2018The net loss of $39 million after tax and non-controlling interests relates toadjustments in respect of disposals completed in prior periods.
Charges relating to BEE transactionsIn 2019 the net loss of $11 million after tax and non-controlling interests relatedto a modification charge under IFRS 2 Share-based Payments following therefinancing of Ponahalo Investments (Pty) Ltd.
2018In 2018 the net loss of $31 million after tax and non-controlling interests relatedto a modification charge under IFRS 2 Share-based Payments following therefinancing of Ponahalo Investments (Pty) Ltd.
Financing special items and remeasurementsFinancing special items and remeasurements principally comprise a net fairvalue loss of $6 million in respect of derivatives hedging net debt (2018: lossof $98 million arising on bond buybacks completed in the period and a net fairvalue loss of $33 million on derivatives hedging net debt).
Tax associated with special items and remeasurementsThis includes a tax remeasurement charge of $406 million and tax on specialscredit of $602 million principally arising on Brazilian deferred tax assets (2018:tax remeasurements charge of $110 million principally arising on Braziliandeferred tax assets).
Of the total tax credit of $196 million (2018: charge of $326 million), there isa net current tax credit of $56 million (2018: charge of $16 million) and a netdeferred tax credit of $140 million (2018: charge of $310 million).
Associates’ and joint ventures’ special items andremeasurementsThere were no associates’ and joint ventures’ special items andremeasurements recorded in the year ended 31 December 2019.
2018Associates’ and joint ventures’ special items and remeasurements relates to theCoal segment.
FINANCIAL STATEMENTS AND OTHER FINANCIAL INFORMATION NOTES TO THE FINANCIAL STATEMENTS
SIGNIFICANT ITEMS
8. SPECIAL ITEMS AND REMEASUREMENTS continued
162 Anglo American plc Integrated Annual Report 2019

CAPITAL BASE
We have a value-focused approach to capitalallocation with clear prioritisation: maintain assetintegrity; pay dividends to our shareholderswhile ensuring a strong balance sheet.Discretionary capital is then allocated basedon a balanced approach.
Value-disciplined capital allocation throughout the cycle is critical toprotecting and enhancing our shareholders’ capital, given the long-term and capital intensive nature of our business.
The Group uses attributable return on capital employed (ROCE) tomonitor how efficiently assets are generating profit on invested capitalfor the equity shareholders of the Company. Attributable ROCE is anAlternative Performance Measure (APM). For more information onthe APMs used by the Group, including definitions, please refer topage 228.
Attributable ROCE %
2019 2018
De Beers 2 8Copper 16 22Platinum Group Metals 38 15Iron Ore 31 3Coal 26 67Nickel and Manganese 20 28Corporate and other n/a n/a
19 19
Attributable ROCE remained consistent at 19% in the year ended31 December 2019 (2018: 19%). Average attributable capitalemployed has increased to $28.4 billion (2018: $27.4 billion) primarilydue to the increase of current year capital expenditure and changes inaccounting treatment arising from IFRS 16 Leases.
FINANCIAL STATEMENTS AND OTHER FINANCIAL INFORMATION NOTES TO THE FINANCIAL STATEMENTS
Anglo American plc Integrated Annual Report 2019 163
9. CAPITAL BY SEGMENT
The disclosures in this note include certain Alternative Performance Measures (APMs). For more information on the APMs used by the Group, includingdefinitions, please refer to page 228.
Capital employed by segmentCapital employed is the principal measure of segment assets and liabilities reported to the Group Management Committee. Capital employed is defined as netassets excluding net debt and financial asset investments.
Capital employed
US$ million 2019 2018
De Beers 8,800 8,349Copper 8,238 6,463Platinum Group Metals 4,045 4,058Iron Ore 8,363 6,929Coal 3,787 4,131Nickel and Manganese 2,305 2,390Corporate and other 38 (51)Capital employed 35,576 32,269Reconciliation to Consolidated balance sheet:
Net debt (4,626) (2,848)Debit valuation adjustment attributable to derivatives hedging net debt 1 15Financial asset investments 434 396Net assets 31,385 29,832

Non-current assets by location
Intangible assets andProperty, plant and equipment Total non-current assets
US$ million 2019 2018 2019 2018
South Africa 10,265 9,687 10,756 10,181Botswana 3,996 4,071 3,996 4,071Other Africa 1,075 1,033 1,096 1,039Brazil 6,699 5,643 6,948 5,891Chile 6,323 6,210 6,333 6,240Peru 3,428 1,958 3,687 2,181Other South America 1 2 447 838North America 634 644 634 644Australia and Asia 3,364 3,374 3,783 3,848United Kingdom (Anglo American plc’s country of domicile) 1,424 1,279 1,560 1,383Other Europe 78 84 79 84Non-current assets by location 37,287 33,985 39,319 36,400Unallocated assets 2,758 2,484Total non-current assets 42,077 38,884
Total non-current assets by location primarily comprise Intangible assets, Property, plant and equipment, Environmental rehabilitation trusts and Investments inassociates and joint ventures.
FINANCIAL STATEMENTS AND OTHER FINANCIAL INFORMATION NOTES TO THE FINANCIAL STATEMENTS
CAPITAL BASE
9. CAPITAL BY SEGMENT continued
164 Anglo American plc Integrated Annual Report 2019
10. INTANGIBLE ASSETS
OverviewIntangible assets comprise goodwill acquired through business combinations, brands, contracts and other non-mining assets.
2019 2018
US$ million
Brands,contracts and other
intangibles Goodwill Total
Brands,contracts and other
intangibles Goodwill Total
Net book value
At 1 January 1,111 1,976 3,087 1,201 2,122 3,323Additions 48 51 99 17 — 17Amortisation charge for the year (63) — (63) (68) — (68)Impairments — (68) (68) — — —Disposals — — — — (17) (17)Currency movements 9 22 31 (39) (129) (168)At 31 December 1,105 1,981 3,086 1,111 1,976 3,087
Cost 1,574 2,049 3,623 1,518 1,976 3,494Accumulated amortisation and impairment (469) (68) (537) (407) — (407)
Brands, contracts and other intangibles includes $1,026 million (2018: $1,082 million) relating to De Beers, principally comprising assets that were recognised at fairvalue on acquisition of a controlling interest in De Beers in August 2012. Of these, $517 million (2018: $517 million) have indefinite useful lives.
Further informationGoodwill relates to the following cash generating units (CGUs) or groups of CGUs:
US$ million 2019 2018
De Beers 1,636 1,592Copper Chile 124 124Platinum Group Metals 209 181Coal South Africa 2 71Other 10 8
1,981 1,976
Accounting judgementGoodwill is tested at least annually for impairment by assessing the recoverable amount of the related CGU or group of CGUs. The recoverable amounts have beendetermined based on fair value less costs of disposal using discounted cash flow projections. Other than in relation to De Beers as set out in note 7, managementbelieves that any reasonably possible change in a key assumption on which the recoverable amounts are based would not cause them to exceed their recoverableamounts. The key assumptions used in determining the recoverable amounts are set out in note 7.
Accounting policySee note 38D for the Group’s accounting policies on intangible assets.

11. PROPERTY, PLANT AND EQUIPMENT
OverviewProperty, plant and equipment comprises the physical assets that make up the Group’s operations. These include acquired mineral rights, capitalised wastestripping and mine development costs, processing plant and infrastructure, vehicles and other equipment.
2019
Owned and leased assets
US$ million
Miningpropertiesand leases
– Owned
Land andbuildings – Owned
Land andbuildings
– Right-of-use assets
Plant andequipment
– Owned
Plant andequipment– Right-of-use assets
Capitalworks inprogress – Owned Total
Net book value
At 31 December 10,616 1,786 — 13,652 — 4,844 30,898Impact of adoption of IFRS 16 (note 38) — — 176 (63) 266 — 379At 1 January 10,616 1,786 176 13,589 266 4,844 31,277Additions 531 8 30 133 252 4,389 5,343Depreciation charge for the year (1,042) (92) (37) (1,501) (218) — (2,890)Impairments (16) (61) (8) (249) (11) (243) (588)Impairments reversed 12 12 — 1,047 — 8 1,079Disposals (96) (15) (3) (154) (3) (31) (302)Reclassifications 919 191 — 1,318 1 (2,429) —Currency movements 154 16 1 54 2 55 282At 31 December 11,078 1,845 159 14,237 289 6,593 34,201
Cost 25,649 2,827 205 31,977 531 6,915 68,104Accumulated depreciation and impairment (14,571) (982) (46) (17,740) (242) (322) (33,903)
2018
Owned and leased assets
US$ million
Miningproperties
and leases – Owned
Land andbuildings – Owned
Land andbuildings
– Right-of-use assets
Plant andequipment
– Owned
Plant andequipment – Right-of-use assets
Capitalworks inprogress – Owned Total
Net book value
At 1 January 11,536 2,669 — 12,848 — 3,590 30,643Additions 438 87 — 199 — 3,308 4,032Depreciation charge for the year (1,080) (84) — (1,495) — — (2,659)Impairments (99) (58) — (1) — — (158)Impairments reversed 344 37 — 711 — 50 1,142Disposals (18) (23) — (58) — (7) (106)Reclassifications 573 (683) — 1,940 — (1,830) —Currency movements (1,078) (159) — (492) — (267) (1,996)At 31 December 10,616 1,786 — 13,652 — 4,844 30,898
Cost 24,227 2,853 — 31,202 — 4,997 63,279Accumulated depreciation and impairment (13,611) (1,067) — (17,550) — (153) (32,381)
On adoption of IFRS 16 Leases, right-of-use assets for items formerly recognised as leased under operating leases were recognised within property, plant andequipment. Assets previously recognised as leased under finance leases were reclassified within property, plant and equipment to right-of-use assets. Leasedassets principally relate to corporate offices, diamond jewellery retail outlets and shipping vessels.
Additions include $72 million (2018: $41 million) of net interest expense incurred on borrowings funding the construction of qualifying assets which has beencapitalised during the year.
Depreciation includes $2,765 million (2018: $2,545 million) of depreciation within operating profit, $86 million (2018: $97 million) of depreciation arising due tothe fair value uplift on the pre-existing 45% shareholding in De Beers which has been included within operating remeasurements (see note 8), and $39 million(2018: $17 million) of pre-commercial production depreciation and assets used in capital projects which has been capitalised.
Disposals includes disposals of assets, businesses, and transfers to Assets classified as held for sale.
FINANCIAL STATEMENTS AND OTHER FINANCIAL INFORMATION NOTES TO THE FINANCIAL STATEMENTS
CAPITAL BASE
Anglo American plc Integrated Annual Report 2019 165

Accounting judgementsImpairment testingFor the purposes of impairment testing, the recoverable amount of each of the cash generating units (CGUs) or group of CGUs has been determined based on a fairvalue less costs of disposal basis. The key assumptions used in determining fair value less costs of disposal are set out in note 7.
Deferred strippingIn certain mining operations, rock or soil overlying a mineral deposit, known as overburden, and other waste materials must be removed to access the orebody.The process of removing overburden and other mine waste materials is referred to as stripping.
The Group defers stripping costs onto the balance sheet where they are considered to improve access to ore in future periods. Where the amount to be capitalisedcannot be specifically identified it is determined based on the volume of waste extracted compared with expected volume for the identified component of theorebody. This determination is dependent on an individual mine’s design and Life of Mine Plan and therefore changes to the design or Life of Mine Plan will resultin changes to these estimates. Identification of the components of a mine’s orebody is made by reference to the Life of Mine Plan. The assessment depends ona range of factors including each mine’s specific operational features and materiality.
Accounting policySee note 38D for the Group’s accounting policies on property, plant and equipment.
FINANCIAL STATEMENTS AND OTHER FINANCIAL INFORMATION NOTES TO THE FINANCIAL STATEMENTS
CAPITAL BASE
11. PROPERTY, PLANT AND EQUIPMENT continued
166 Anglo American plc Integrated Annual Report 2019
12. CAPITAL EXPENDITURE
The disclosures in this note include certain Alternative Performance Measures (APMs). For more information on the APMs used by the Group, including definitions,please refer to page 228.
Capital expenditure by segment
US$ million 2019 2018
De Beers 567 417Copper 1,078 703Platinum Group Metals 569 496Iron Ore 594 415Coal 934 722Nickel and Manganese 42 38Corporate and other 56 27Capital expenditure 3,840 2,818Reconciliation to Consolidated cash flow statement:
Cash flows from derivatives related to capital expenditure (9) 15Proceeds from disposal of property, plant and equipment 8 162Direct funding for capital expenditure received from non-controlling interests 844 374Reimbursement of capital expenditure 61 31Expenditure on property, plant and equipment 4,744 3,400
Direct funding for capital expenditure received from non-controlling interests represents capital expenditure relating to the Quellaveco project funded by Mitsubishi.Capital expenditure on the Quellaveco project in the year ended 31 December 2019 was partly funded using remaining cash subscriptions received from Mitsubishiin 2018 as part of the Quellaveco syndication transaction. At 31 December 2019, subscription amounts have been fully utilised. Mitsubishi has continued to providedirect funding for its 40% share of capital expenditure via draw-downs against a committed shareholder facility which are recorded as borrowings on the Group’sConsolidated balance sheet.
Reimbursement of capital expenditure relates to funding provided for the development of the Charterhouse Street office.
Capitalised operating cash flowsCapital expenditure includes net capitalised operating cash outflows of $11 million (2018: net inflows of $18 million) in relation to operating costs incurred byoperations prior to reaching commercial production for accounting purposes.
Capital expenditure by category
US$ million 2019 2018
Expansionary 1,216 567Stay-in-business 1,656 1,617Stripping and development 976 796Proceeds from disposal of property, plant and equipment (8) (162)
3,840 2,818
Expansionary capital expenditure includes the cash flows from derivatives related to capital expenditure and is net of direct funding for capital expenditure receivedfrom non-controlling interests. Stay-in-business capital expenditure is net of reimbursement of capital expenditure.

13. INVESTMENTS IN ASSOCIATES AND JOINT VENTURES
OverviewInvestments in associates and joint ventures represent businesses the Group does not control, but instead exercises significant influence or joint control. Theseinclude (within the respective business units) the associates Cerrejón and Jellinbah (Coal) and the joint ventures Ferroport (Iron Ore) and Samancor (Nickel andManganese). The Group’s other investments in associates and joint ventures arise primarily in the Platinum Group Metals segment.
The disclosures in this note include certain Alternative Performance Measures (APMs). For more information on the APMs used by the Group, including definitions,please refer to page 228.
2019 2018
US$ million AssociatesJoint
ventures Total AssociatesJoint
ventures Total
At 1 January 1,136 579 1,715 1,350 606 1,956Net income from associates and joint ventures 145 244 389 347 381 728Other comprehensive income from associates and joint ventures — 53 53 — — —Dividends received (210) (310) (520) (332) (405) (737)Investments in equity and capitalised loans 32 4 36 72 27 99Impairments (334) — (334) (85) — (85)Disposals — — — (160) — (160)Other movements — — — — (15) (15)Currency movements (3) (3) (6) (56) (15) (71)At 31 December 766 567 1,333 1,136 579 1,715
Further informationThe Group’s total investments in associates and joint ventures include long-term loans of $212 million (2018: $181 million), which in substance form part of theGroup’s net investment. These loans are not repayable in the foreseeable future. Other comprehensive income from associates and joint ventures relates principallyto fair value movements on investments held at fair value through other comprehensive income.
The Group’s share of the results of the associates and joint ventures is as follows:
Income statement
US$ million 2019 2018
Revenue 1,955 2,586Operating costs (before special items and remeasurements) (1,272) (1,440)Associates’ and joint ventures’ underlying EBIT 683 1,146Net finance costs (31) (15)Income tax expense (258) (380)Non-controlling interests (5) (12)Net income from associates and joint ventures (before special items and remeasurements) 389 739Special items and remeasurements tax — (11)Net income from associates and joint ventures 389 728
Balance sheet
US$ million AssociatesJoint
ventures Total
Non-current assets 847 993 1,840Current assets 497 410 907Current liabilities (146) (208) (354)Non-current liabilities (432) (628) (1,060)Net assets as at 31 December 2019 766 567 1,333Net assets as at 31 December 2018 1,136 579 1,715
FINANCIAL STATEMENTS AND OTHER FINANCIAL INFORMATION NOTES TO THE FINANCIAL STATEMENTS
CAPITAL BASE
Anglo American plc Integrated Annual Report 2019 167

Further information
2019
US$ million RevenueUnderlying
EBITDAUnderlying
EBITShare of net
incomeDividends
received
Samancor (Nickel and Manganese) 926 443 388 200 300Cerrejón (Coal) 494 130 25 9 66Jellinbah (Coal) 438 206 193 135 139Ferroport (Iron Ore) 90 73 66 34 —Other 7 15 11 11 15
1,955 867 683 389 520
2018
US$ million RevenueUnderlying
EBITDAUnderlying
EBITShare of net
incomeDividends
received
Samancor (Nickel and Manganese) 1,147 663 610 380 405Cerrejón (Coal) 838 388 295 184 194Jellinbah (Coal) 482 241 228 160 138Ferroport (Iron Ore) 29 14 7 (2) —Other 90 28 6 6 —
2,586 1,334 1,146 728 737
Aggregate investment
US$ million 2019 2018
Samancor (Nickel and Manganese) 357 404Cerrejón (Coal) 487 837Jellinbah (Coal) 240 246Ferroport (Iron Ore) 152 123Other 97 105
1,333 1,715
Accounting judgementsImpairment testingThe Group has previously impaired its investment in Samancor (Nickel and Manganese). In 2019 the Group has impaired its investment in Cerrejón (Coal). For thepurposes of impairment testing, the recoverable amount has been determined based on a fair value less costs of disposal basis. The key assumptions used indetermining fair value less costs of disposal are set out in note 7.
Accounting policySee note 38I for the Group’s accounting policy on associates and joint arrangements, which includes joint ventures.
FINANCIAL STATEMENTS AND OTHER FINANCIAL INFORMATION NOTES TO THE FINANCIAL STATEMENTS
CAPITAL BASE
13. INVESTMENTS IN ASSOCIATES AND JOINT VENTURES continued
168 Anglo American plc Integrated Annual Report 2019

14. FINANCIAL ASSET INVESTMENTS
OverviewFinancial asset investments include three categories. Financial assets at amortised cost principally comprise loans to and deposits with third parties including theGroup’s associates and joint ventures. Assets classified at fair value through other comprehensive income principally comprise investments in equities of othercompanies. Financial assets held at fair value through profit and loss comprise financial assets that do not meet the criteria to be classified under either of the othertwo categories.
2019 2018
US$ million
Financialassets at
amortised cost
At fair valuethrough
profit andloss
At fair valuethrough other
comprehensiveincome Total
Financialassets at
amortised cost
At fair valuethrough
profit and loss
At fair valuethrough other
comprehensiveincome Total
At 1 January 358 — 38 396 446 — 115 561Additions — — 4 4 — — 25 25Interest receivable 19 — — 19 19 — — 19Net loans advanced 33 17 — 50 18 — 4 22Disposals — — — — (21) — (63) (84)Impairments (5) — — (5) (31) — — (31)Fair value and other movements — (14) 21 7 — — (44) (44)Currency movements (32) — (5) (37) (73) — 1 (72)At 31 December 373 3 58 434 358 — 38 396
During 2018, Anglo American Platinum disposed of certain investments made under the PGM Investment programme to a venture capital fund managed by APVentures LLP, over which the Group has joint control as an equity accounted joint venture.
Accounting policySee note 38D for the Group’s accounting policies on financial asset investments.
FINANCIAL STATEMENTS AND OTHER FINANCIAL INFORMATION NOTES TO THE FINANCIAL STATEMENTS
CAPITAL BASE
Anglo American plc Integrated Annual Report 2019 169
15. PROVISIONS FOR LIABILITIES AND CHARGES
Overview
US$ millionEnvironmental
restoration DecommissioningEmployee
benefitsOnerous
contracts Other Total
At 31 December 2018 (1,258) (607) (133) (65) (632) (2,695)Impact of adoption of IFRS 16 (note 38) — — — 15 — 15At 1 January 2019 (1,258) (607) (133) (50) (632) (2,680)Charged to the income statement (237) 1 (46) (1) (152) (435)Capitalised (60) (89) — — (77) (226)Unwinding of discount (59) (32) (1) (3) — (95)Amounts applied 41 26 37 5 141 250Unused amounts reversed 14 13 5 9 80 121Other movements — — 1 — — 1Currency movements (35) 28 (1) — (1) (9)At 31 December 2019 (1,594) (660) (138) (40) (641) (3,073)
Current (80) (34) (121) (14) (267) (516)Non-current (1,514) (626) (17) (26) (374) (2,557)
Further informationEnvironmental restorationThe Group has an obligation to undertake restoration, rehabilitation and environmental work when environmental disturbance is caused by the development orongoing production of a mining property. A provision is recognised for the present value of such costs, based on management’s best estimate of the legal andconstructive obligations incurred. Changes in legislation could result in changes in provisions recognised. It is anticipated that the majority of these costs will beincurred over a period in excess of 10 years.
DecommissioningProvision is made for the present value of costs relating to the decommissioning of plant or other site restoration work. It is anticipated that the majority of thesecosts will be incurred over a period in excess of 20 years.
The pre-tax, real discount rates that have been used in calculating the environmental restoration and decommissioning liabilities as at 31 December 2019, in theprincipal currencies in which these liabilities are denominated are as follows: US dollar: 1.5% (2018: 2.1%); South African rand: 4.0% (2018: 4.0%); Australian dollar:2.0% (2018: 2.0%); Chilean peso: 2.5% (2018: 2.5%); and Brazilian real: 6.0% (2018: 6.0%).
Employee benefitsProvision is made for statutory or contractual employee entitlements where there is significant uncertainty over the timing or amount of settlement. It is anticipatedthat these costs will be incurred when employees choose to take their benefits.
Onerous contractsProvision is made for the present value of certain long-term contracts where the unavoidable cost of meeting the Group’s obligations is expected to exceed thebenefits to be received. It is anticipated that the majority of these costs will be incurred over a period of up to six years. Following the adoption of IFRS 16 Leases,onerous lease provisions at 31 December 2018 have been reversed and equivalent impairments recorded against the carrying values of the corresponding right-of-use assets (note 11).

OtherOther provisions charged to the income statement primarily relate to restructuring costs, indemnities, legal and other claims and liabilities. Capitalised otherprovisions primarily relate to social commitments in Quellaveco.
Environmental rehabilitation trustsThe Group makes contributions to controlled funds that were established to meet the cost of some of its restoration and environmental rehabilitation liabilities inSouth Africa. The funds comprise the following investments:
US$ million 2019 2018
Equity 97 104Bonds 147 146Cash 57 53
301 303
These assets are primarily denominated in South African rand. Cash is held in short-term fixed deposits or earns interest at floating inter-bank rates. Bonds earninterest at a weighted average fixed rate of 8.0% (2018: 8.0%) for an average period of six years (2018: five years). Equity investments are recorded at fair valuethrough profit and loss and bonds are recorded at amortised cost.
These funds are not available for the general purposes of the Group. All income from these assets is reinvested to meet specific environmental obligations. Theseobligations are included in provisions stated above.
Accounting policySee note 38D for the Group’s accounting policy on environmental restoration and decommissioning obligations.
FINANCIAL STATEMENTS AND OTHER FINANCIAL INFORMATION NOTES TO THE FINANCIAL STATEMENTS
CAPITAL BASE
15. PROVISIONS FOR LIABILITIES AND CHARGES continued
170 Anglo American plc Integrated Annual Report 2019
16. DEFERRED TAX
OverviewThe movement in net deferred tax liabilities during the year is as follows:
US$ million 2019 2018
At 1 January (2,766) (2,997)Charged to the income statement (52) (127)Charged to the statement of comprehensive income — (28)(Charged)/credited directly to equity (7) 12Disposal of business — 47Currency movements (40) 327At 31 December (2,865) (2,766)Comprising:
Deferred tax assets 1,057 910Deferred tax liabilities (3,922) (3,676)
Further informationThe amount of deferred tax recognised in the Consolidated balance sheet is as follows:
US$ million 2019 2018
Deferred tax assets
Tax losses 357 221Post employment benefits 23 23Share-based payments 6 23Enhanced tax depreciation 261 228Depreciation in excess of capital allowances 791 264Other temporary differences (381) 151
1,057 910Deferred tax liabilities
Capital allowances in excess of depreciation (3,461) (3,072)Fair value adjustments (694) (691)Tax losses 134 95Provisions 464 413Withholding tax (99) (126)Other temporary differences (266) (295)
(3,922) (3,676)
The deferred tax liability on other temporary differences arises primarily in relation to deferred stripping costs, and functional currency differences, partially offset byan amount related to post employment benefits.

The amount of deferred tax charged to the Consolidated income statement is as follows:
US$ million 2019 2018
Capital allowances in excess of depreciation (505) (456)Fair value adjustments 70 35Tax losses 694 173Provisions 171 14Withholding tax 7 273Other temporary differences (489) (166)
(52) (127)
Deferred tax charged to the income statement includes a credit of $406 million (2018: charge of $110 million) relating to deferred tax remeasurements and a chargeof $546 million (2018: charge of $200 million) relating to deferred tax on special items.
A net deferred tax asset of $808 million (2018: $705 million) is recognised in Brazil in relation to the Minas-Rio and Barro Alto mines. This relates primarily to taxlosses, deductible goodwill and fixed asset temporary differences, and is partially offset by functional currency taxable temporary differences. Deferred tax assetsare recognised to the extent that the business has forecast taxable profits against which the assets can be recovered.
The Group has the following temporary differences for which no deferred tax assets have been recognised:
2019 2018
US$ millionTax losses– revenue
Tax losses– capital
Othertemporary
differences TotalTax losses – revenue
Tax losses – capital
Othertemporary
differences Total
Expiry date
Less than five years 21 — — 21 17 — — 17Greater than five years 17 — 1,680 1,697 26 — 2,102 2,128No expiry date 5,486 2,157 1,390 9,033 3,750 1,266 6,583 11,599
5,524 2,157 3,070 10,751 3,793 1,266 8,685 13,744
No deferred tax has been recognised in respect of temporary differences associated with investments in subsidiaries, branches, associates and interests in jointarrangements where the Group is in a position to control the timing of the reversal of the temporary differences and it is probable that such differences will notreverse in the foreseeable future. The aggregate amount of temporary differences associated with such investments in subsidiaries, branches, associates andinterests in joint arrangements is represented by the contribution of those investments to the Group’s retained earnings and amounted to $23,348 million(2018: $23,760 million).
Accounting judgementsRecognition of deferred tax assetIn accordance with the requirements of IAS 12 Income Taxes, the Group reassesses the recognition and recoverability of deferred tax assets at the end of eachreporting period. See note 7.
Accounting policySee note 38G for the Group’s accounting policy on tax.
FINANCIAL STATEMENTS AND OTHER FINANCIAL INFORMATION NOTES TO THE FINANCIAL STATEMENTS
CAPITAL BASE
16. DEFERRED TAX continued
Anglo American plc Integrated Annual Report 2019 171

WORKING CAPITAL
This section includes analysis of inventories, receivables and payables. These balances principallyrelate to current assets and liabilities held to support operating activities.
US$ million 2019 2018
Inventories 4,962 4,466Trade and other receivables 3,062 2,734Trade and other payables (5,499) (4,879)
2,525 2,321
Working capital was broadly flat in 2019. The net increase in the totalworking capital balance is attributable to increased stock volumes andoperating receivables offset by increased operating payables.
FINANCIAL STATEMENTS AND OTHER FINANCIAL INFORMATION NOTES TO THE FINANCIAL STATEMENTS
172 Anglo American plc Integrated Annual Report 2019
17. INVENTORIES
OverviewInventories represent goods held for sale in the ordinary course of business (finished products), ore being processed into a saleable condition (work in progress) andspares, raw materials and consumables to be used in the production process (raw materials and consumables).
US$ million 2019 2018
Raw materials and consumables 787 771Work in progress 2,103 1,911Finished products 2,072 1,784
4,962 4,466
Further informationThe cost of inventories recognised as an expense and included in cost of sales amounted to $16,089 million (2018: $17,170 million). The write-down of inventoriesto net realisable value (net of revaluation of provisionally priced purchases) amounted to $140 million (2018: $59 million).
Work in progress includes $544 million (2018: $332 million) of ore stockpiles that are not expected to be processed within the next 12 months. These stockpiles areclassified as current as they are expected to be consumed within the normal business cycle and there is the ability to process and market the ore.
Accounting judgementsAccounting for inventory involves the use of judgements and estimates, particularly related to the measurement and valuation of work in progress inventory withinthe production process. Certain estimates, including expected metal recoveries and work in progress volumes, are calculated by engineers using available industry,engineering and scientific data. Estimates used are periodically reassessed by the Group taking into account technical analysis and historical performance.
Accounting policySee note 38E for the Group’s accounting policy on inventories.
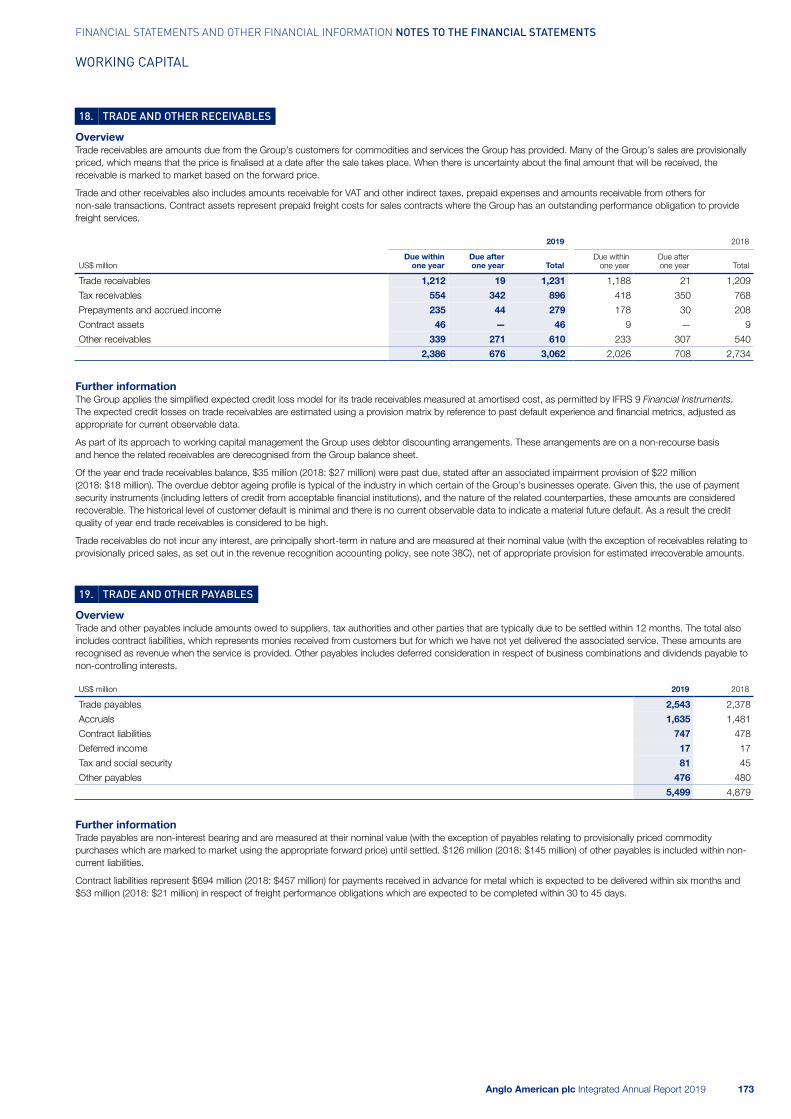
18. TRADE AND OTHER RECEIVABLES
OverviewTrade receivables are amounts due from the Group’s customers for commodities and services the Group has provided. Many of the Group’s sales are provisionallypriced, which means that the price is finalised at a date after the sale takes place. When there is uncertainty about the final amount that will be received, thereceivable is marked to market based on the forward price.
Trade and other receivables also includes amounts receivable for VAT and other indirect taxes, prepaid expenses and amounts receivable from others for non-sale transactions. Contract assets represent prepaid freight costs for sales contracts where the Group has an outstanding performance obligation to providefreight services.
2019 2018
US$ millionDue within
one yearDue afterone year Total
Due withinone year
Due afterone year Total
Trade receivables 1,212 19 1,231 1,188 21 1,209Tax receivables 554 342 896 418 350 768Prepayments and accrued income 235 44 279 178 30 208Contract assets 46 — 46 9 — 9Other receivables 339 271 610 233 307 540
2,386 676 3,062 2,026 708 2,734
Further informationThe Group applies the simplified expected credit loss model for its trade receivables measured at amortised cost, as permitted by IFRS 9 Financial Instruments.The expected credit losses on trade receivables are estimated using a provision matrix by reference to past default experience and financial metrics, adjusted asappropriate for current observable data.
As part of its approach to working capital management the Group uses debtor discounting arrangements. These arrangements are on a non-recourse basisand hence the related receivables are derecognised from the Group balance sheet.
Of the year end trade receivables balance, $35 million (2018: $27 million) were past due, stated after an associated impairment provision of $22 million (2018: $18 million). The overdue debtor ageing profile is typical of the industry in which certain of the Group’s businesses operate. Given this, the use of paymentsecurity instruments (including letters of credit from acceptable financial institutions), and the nature of the related counterparties, these amounts are consideredrecoverable. The historical level of customer default is minimal and there is no current observable data to indicate a material future default. As a result the creditquality of year end trade receivables is considered to be high.
Trade receivables do not incur any interest, are principally short-term in nature and are measured at their nominal value (with the exception of receivables relating toprovisionally priced sales, as set out in the revenue recognition accounting policy, see note 38C), net of appropriate provision for estimated irrecoverable amounts.
FINANCIAL STATEMENTS AND OTHER FINANCIAL INFORMATION NOTES TO THE FINANCIAL STATEMENTS
WORKING CAPITAL
Anglo American plc Integrated Annual Report 2019 173
19. TRADE AND OTHER PAYABLES
OverviewTrade and other payables include amounts owed to suppliers, tax authorities and other parties that are typically due to be settled within 12 months. The total alsoincludes contract liabilities, which represents monies received from customers but for which we have not yet delivered the associated service. These amounts arerecognised as revenue when the service is provided. Other payables includes deferred consideration in respect of business combinations and dividends payable tonon-controlling interests.
US$ million 2019 2018
Trade payables 2,543 2,378Accruals 1,635 1,481Contract liabilities 747 478Deferred income 17 17Tax and social security 81 45Other payables 476 480
5,499 4,879
Further informationTrade payables are non-interest bearing and are measured at their nominal value (with the exception of payables relating to provisionally priced commoditypurchases which are marked to market using the appropriate forward price) until settled. $126 million (2018: $145 million) of other payables is included within non-current liabilities.
Contract liabilities represent $694 million (2018: $457 million) for payments received in advance for metal which is expected to be delivered within six months and$53 million (2018: $21 million) in respect of freight performance obligations which are expected to be completed within 30 to 45 days.

NET DEBT AND FINANCIAL RISK MANAGEMENT
Net debt increased from $2.8 billion to $4.6 billion during the year, driven by the adoptionof IFRS 16 Leases and the share buy-back programme. Gearing has increased from 9% at31 December 2018 to 13% at 31 December 2019.
US$ million 2019 2018
Net assets 31,385 29,832Net debt including related derivatives (note 20) 4,626 2,848Total capital 36,011 32,680Gearing 13% 9%
Net debt is calculated as total borrowings less cash and cashequivalents (including derivatives that provide an economic hedge ofnet debt and excluding the impact of the debit valuation adjustment).Total capital is calculated as ‘Net assets’ (as shown in theConsolidated balance sheet) excluding net debt.
FINANCIAL STATEMENTS AND OTHER FINANCIAL INFORMATION NOTES TO THE FINANCIAL STATEMENTS
174 Anglo American plc Integrated Annual Report 2019
20. NET DEBT
OverviewThe disclosures in this note include certain Alternative Performance Measures (APMs). For more information on the APMs used by the Group, including definitions,please refer to page 228.
Movement in net debt
US$ million
Cashand cash
equivalentsShort termborrowings
Medium andlong term
borrowings
Net debtexcluding
derivatives
Derivativeshedgingnet debt
Net debtincluding
derivatives
At 1 January 2018 7,792 (1,324) (10,620) (4,152) (349) (4,501)Cash flow (948) 1,077 1,666 1,795 250 2,045Reclassifications — (434) 434 — — —Movement in fair value — 8 116 124 (345) (221)Other non-cash movements — 34 (137) (103) — (103)Currency movements (296) 58 170 (68) — (68)At 31 December 2018 6,548 (581) (8,371) (2,404) (444) (2,848)Impact of adoption of IFRS 16 (note 38) — (148) (321) (469) — (469)At 1 January 2019 6,548 (729) (8,692) (2,873) (444) (3,317)Cash flow (168) 583 (1,396) (981) 152 (829)Reclassifications — (593) 593 — — —Movement in fair value — (3) (231) (234) 53 (181)Other non-cash movements — (231) (91) (322) — (322)Currency movements (45) (5) 73 23 — 23At 31 December 2019 6,335 (978) (9,744) (4,387) (239) (4,626)
Following the adoption of IFRS 16 Leases, lease liabilities of $469 million were recognised within external borrowings included within net debt at the date oftransition at 1 January 2019. Corresponding right-of-use assets were recognised within Property, plant and equipment. Refer to note 11.
Other non-cash movements include $306 million relating to leases entered into in the year ended 31 December 2019.

Further informationReconciliation to the Consolidated balance sheet
Cash and cash equivalents Short term borrowingsMedium and
long term borrowings
US$ million 2019 2018 2019 2018 2019 2018
Balance sheet 6,345 6,567 (990) (600) (9,744) (8,371)Balance sheet – disposal groups 2 — — — — —Bank overdrafts (12) (19) 12 19 — —Net cash/(debt) classifications 6,335 6,548 (978) (581) (9,744) (8,371)
South Africa net cashThe Group operates in South Africa where the existence of exchange controls may restrict the use of certain cash balances. The Group therefore monitors thecash and debt associated with these operations separately. These restrictions are not expected to have a material effect on the Group’s ability to meet itsongoing obligations. On an owned basis cash and cash equivalents in South Africa is $5,001 million (2018: $5,316 million) and net cash is $4,282 million(2018: $4,603 million).
As part of the Group cash pooling arrangement, cash that is legally owned by South African companies is managed outside of South Africa. Below is a breakdownof net (debt)/cash managed in South Africa:
US$ million 2019 2018
Cash and cash equivalents 389 1,382Short term borrowings (42) (113)Medium and long term borrowings (678) (601)Net (debt)/cash excluding derivatives (331) 668Derivatives hedging net debt 1 1Net (debt)/cash including derivatives (330) 669
On the adoption of IFRS 16 Leases at 1 January 2019, lease liabilities of $94 million for assets leased in South Africa were recognised within borrowings includedwithin South Africa net cash.
Debit valuation adjustmentThe debit valuation adjustments reduce the valuation of derivative liabilities hedging net debt reflecting the impact of the Group’s own credit risk. These adjustmentsare excluded from the Group’s definition of net debt (as detailed on page 228). The movement in the debit valuation adjustments are as follows:
US$ million 2019 2018
At 1 January 15 9Movement in fair value (14) 6At 31 December 1 15
Accounting policySee note 38F for the Group’s accounting policy on cash and debt.
FINANCIAL STATEMENTS AND OTHER FINANCIAL INFORMATION NOTES TO THE FINANCIAL STATEMENTS
NET DEBT AND FINANCIAL RISK MANAGEMENT
20. NET DEBT continued
Anglo American plc Integrated Annual Report 2019 175

21. BORROWINGS
OverviewThe Group accesses borrowings mostly in capital markets through bonds issued under the Euro Medium Term Note (EMTN) programme, the South AfricanDomestic Medium Term Note (DMTN) programme and through accessing the US bond markets. The Group uses interest rate and cross currency swaps to ensurethat the majority of the Group’s borrowings are floating rate US dollar denominated.
In March 2019, the Group issued bonds with a US dollar equivalent value of $1.0 billion. The issuance consisted of €500 million 1.625% Guaranteed Notes due2026 and £300 million 3.375% Guaranteed Notes due 2029, both under the Euro Medium Term Note Programme.
Further information
2019 2018
US$ millionShort term
borrowings
Medium andlong term
borrowingsTotal
borrowings
Contractualrepayment at
hedge ratesShort termborrowings
Medium andlong term
borrowingsTotal
borrowings
Contractualrepayment at
hedge rates
Secured
Bank loans and overdrafts 26 15 41 41 25 31 56 56Leases (2018: finance leases) 209 345 554 554 12 58 70 70Other loans 12 108 120 120 — 57 57 57
247 468 715 715 37 146 183 183Unsecured
Bank loans and overdrafts 131 93 224 224 13 129 142 142Bonds issued under EMTN programme
2.75% €279m bond due June 2019 — — — — 323 — 323 3511.5% €139m bond due April 2020 155 — 155 152 — 169 169 1522.875% €281m bond due November 2020 320 — 320 377 — 322 322 3772.5% €378m bond due April 2021 — 432 432 492 — 445 445 4923.5% €750m bond due March 2022 — 890 890 992 — 924 924 9923.25% €750m bond due April 2023 — 889 889 1,033 — 910 910 1,0331.625% €600m bond due September 2025 — 695 695 714 — 689 689 7141.625% €500m bond due March 2026 — 569 569 566 — — — —3.375% £300 million bond due March 2029 — 400 400 395 — — — —
US bonds4.125% $500m bond due April 2021 — 502 502 500 — 494 494 5003.75% $300m bond due April 2022 — 301 301 300 — 292 292 3004.125% $600m bond due September 2022 — 599 599 600 — 579 579 6003.625% $650m bond due September 2024 — 654 654 650 — 624 624 6504.875% $650m bond due May 2025 — 661 661 650 — 628 628 6504.75% $700m bond due April 2027 — 723 723 700 — 678 678 7004% $650m bond due September 2027 — 661 661 650 — 616 616 6504.5% $650m bond due March 2028 — 696 696 650 — 651 651 650
Bonds issued under DMTN programme9.27% R1,400m bond due March 2019 — — — — 97 — 97 979.49% R650m bond due April 2021 — 47 47 46 — 46 46 45JIBAR+1.47% R400m bond due April 2021 — 29 29 29 — 28 28 28
Interest payable and other loans 137 435 572 572 130 1 131 131743 9,276 10,019 10,292 563 8,225 8,788 9,254
Total borrowings 990 9,744 10,734 11,007 600 8,371 8,971 9,437
Accounting policySee note 38F for the Group’s accounting policies on bank borrowings and lease liabilities.
FINANCIAL STATEMENTS AND OTHER FINANCIAL INFORMATION NOTES TO THE FINANCIAL STATEMENTS
NET DEBT AND FINANCIAL RISK MANAGEMENT
176 Anglo American plc Integrated Annual Report 2019

22. FINANCIAL INSTRUMENTS AND DERIVATIVES
Financial instruments overviewFor financial assets and liabilities which are traded on an active market, such as listed investments or listed debt instruments, fair value is determined by referenceto market value. For non-traded financial assets and liabilities, fair value is calculated using discounted cash flows, considered to be reasonable and consistent withthose that would be used by a market participant, and based on observable market data where available (for example forward exchange rate, interest rate orcommodity price curve), unless carrying value is considered to approximate fair value.
Where discounted cash flow models based on management’s assumptions are used, the resulting fair value measurements are considered to be at level 3 in the fairvalue hierarchy, as defined in IFRS 13 Fair Value Measurement, as they depend to a significant extent on unobservable valuation inputs.
All derivatives that have been designated into hedge relationships have been separately disclosed.
2019
US$ million
At fair valuethrough profit
and loss
Financialassets at
amortised cost
At fair valuethrough other
comprehensiveincome
Designatedinto hedges
Financialliabilities at
amortised cost Total
Financial assets
Trade and other receivables 1,166 766 — — — 1,932Derivative financial assets 79 — — 354 — 433Cash and cash equivalents 4,282 2,063 — — — 6,345Financial asset investments 3 373 58 — — 434
5,530 3,202 58 354 — 9,144Financial liabilities
Trade and other payables (944) — — — (3,710) (4,654)Derivative financial liabilities (677) — — — — (677)Borrowings — — — (9,320) (1,414) (10,734)
(1,621) — — (9,320) (5,124) (16,065)Net financial assets/(liabilities) 3,909 3,202 58 (8,966) (5,124) (6,921)
2018
US$ million
At fair valuethrough profit
and loss
Financial assets at
amortised cost
At fair valuethrough other
comprehensiveincome
Designatedinto hedges
Financialliabilities at
amortised cost Total
Financial assets
Trade and other receivables 996 810 — — — 1,806Derivative financial assets 129 — — 212 — 341Cash and cash equivalents 4,407 2,160 — — — 6,567Financial asset investments — 358 38 — — 396
5,532 3,328 38 212 — 9,110Financial liabilities
Trade and other payables (909) — — — (3,430) (4,339)Derivative financial liabilities (607) — — (109) — (716)Borrowings — — — (8,599) (372) (8,971)
(1,516) — — (8,708) (3,802) (14,026)Net financial assets/(liabilities) 4,016 3,328 38 (8,496) (3,802) (4,916)
Trade and other receivables exclude prepayments and tax receivables. Trade and other payables exclude tax, social security, contract liabilities anddeferred income.
The Group’s cash and cash equivalents at 31 December 2019 include $4,282 million (2018: $4,407 million) held in high grade money market funds. These fundsare selected to ensure compliance with the minimum credit rating requirements and counterparty exposure limits set out in the Group’s Treasury policy.
FINANCIAL STATEMENTS AND OTHER FINANCIAL INFORMATION NOTES TO THE FINANCIAL STATEMENTS
NET DEBT AND FINANCIAL RISK MANAGEMENT
Anglo American plc Integrated Annual Report 2019 177

Fair value hierarchyAn analysis of financial assets and liabilities carried at fair value is set out below:
2019 2018
US$ million Level 1 Level 2 Level 3 Total Level 1 Level 2 Level 3 Total
Financial assets
At fair value through profit and lossProvisionally priced trade receivables — 847 — 847 — 726 — 726
Other receivables — — 319 319 — — 270 270
Derivatives hedging net debt — 8 — 8 — 7 — 7Other derivatives — 71 — 71 9 113 — 122Cash and cash equivalents 4,280 2 — 4,282 4,407 — — 4,407Financial asset investments — — 3 3 — — — —
Designated into hedgesDerivatives hedging net debt — 354 — 354 — 212 — 212
At fair value through other comprehensive incomeFinancial asset investments 11 — 47 58 10 — 28 38
4,291 1,282 369 5,942 4,426 1,058 298 5,782Financial liabilities
At fair value through profit and lossProvisionally priced trade payables — (766) — (766) — (751) — (751)Other payables — — (178) (178) — — (158) (158)Derivatives hedging net debt — (601) — (601) — (554) — (554)Other derivatives (2) (75) — (77) (8) (60) — (68)
Debit valuation adjustment to derivative liabilities — 1 — 1 — 15 — 15Designated into hedges
Derivatives hedging net debt — — — — — (109) — (109)
(2) (1,441) (178) (1,621) (8) (1,459) (158) (1,625)Net assets/(liabilities) carried at fair value 4,289 (159) 191 4,321 4,418 (401) 140 4,157
Fair value hierarchy Valuation technique
Level 1 Valued using unadjusted quoted prices in active markets for identical financial instruments. This category includes cash and cashequivalents held in money market funds, listed equity shares and quoted futures.
Level 2 Instruments in this category are valued using valuation techniques where all of the inputs that have a significant effect on the valuation aredirectly or indirectly based on observable market data. This category includes provisionally priced trade receivables and payables andover-the-counter derivatives.
Level 3 Instruments in this category have been valued using a valuation technique where at least one input (which could have a significant effecton the instrument’s valuation) is not based on observable market data. Where inputs can be observed from market data without unduecost and effort, the observed input is used. Otherwise, management determines a reasonable estimate for the input. This categoryincludes contingent consideration, receivables relating to disposals and unlisted equity investments.
The movements in the fair value of the level 3 financial assets and liabilities are shown as follows:
Assets Liabilities
US$ million 2019 2018 2019 2018
At 1 January 298 284 (158) (112)Net profit/(loss) recorded in the income statement 53 (38) (30) 11Net profit/(loss) recorded in the statement of comprehensive income 22 (32) — —Additions 17 155 — (70)Settlements and disposals (28) (37) 13 4Currency movements 7 (34) (3) 9At 31 December 369 298 (178) (158)
For the level 3 financial assets and liabilities, changing certain estimated inputs to reasonably possible alternative assumptions does not changethe fair value significantly.
FINANCIAL STATEMENTS AND OTHER FINANCIAL INFORMATION NOTES TO THE FINANCIAL STATEMENTS
NET DEBT AND FINANCIAL RISK MANAGEMENT
22. FINANCIAL INSTRUMENTS AND DERIVATIVES continued
178 Anglo American plc Integrated Annual Report 2019

Further information on financial instrumentsBorrowings designated in fair value hedges represent listed debt which is held at amortised cost, adjusted for the fair value of the hedged interest rate risk. Thefair value of these borrowings is $9,598 million (2018: $8,519 million), which is measured using quoted indicative broker prices and consequently categorised aslevel 2 in the fair value hierarchy. The carrying value of the remaining borrowings at amortised cost of $1,414 million (2018: $372 million), principally comprisingbank borrowings and lease liabilities, is considered to approximate the fair value.
Offsetting of financial assets and liabilitiesThe Group offsets financial assets and liabilities and presents them on a net basis in the Consolidated balance sheet only where there is a legally enforceableright to offset the recognised amounts, and the Group intends to either settle the recognised amounts on a net basis or to realise the asset and settlethe liability simultaneously.
At 31 December 2019, certain over-the-counter derivatives entered into by the Group and recognised at fair value through profit and loss are both subject toenforceable ISDA master netting arrangements and intended to be settled on a net basis. In accordance with the requirements of IAS 32 Financial Instruments:Presentation, the positions of these derivatives have been offset; those in a liability position totalling $28 million (2018: $57 million liability position) were offsetagainst those in an asset position totalling $62 million (2018: $122 million asset position). The net asset position of $34 million (2018: $65 million net assetposition) is presented within derivative assets (2018: within derivative assets) in the Consolidated balance sheet. The amounts presented only relate to therelevant operations that have derivative assets offset against derivative liabilities at 31 December 2019.
Derivatives overviewThe Group utilises derivative instruments to manage certain market risk exposures, however it may choose not to designate certain derivatives as hedges foraccounting purposes. Such derivatives are classified as ‘Held for trading’ and fair value movements are recorded in the Consolidated income statement.
The use of derivative instruments is subject to limits and the positions are regularly monitored and reported to senior management.
Fair value hedgesThe majority of interest rate swaps (taken out to swap the Group’s fixed rate borrowings to floating rate, in accordance with the Group’s policy) have beendesignated as fair value hedges. The carrying value of the hedged debt is adjusted at each balance sheet date to reflect the impact on its fair value of changes inmarket interest rates. At 31 December 2019, this adjustment was to increase the carrying value of borrowings by $264 million (2018: $30 million increase). Changesin the fair value of the hedged debt are offset against fair value changes in the interest rate swap and recognised in the Consolidated income statement as financingremeasurements. Recognised in the Consolidated income statement is a loss on fair value hedged items of $234 million (2018: $124 million gain), offset by a gainon fair value hedging instruments of $236 million (2018: $118 million loss).
Held for tradingThe Group may choose not to designate certain derivatives as hedges. This may occur where the Group is economically hedged but IFRS 9 hedge accountingcannot be achieved or where gains and losses on both the derivative and hedged item naturally offset in the Consolidated income statement, as is the case forcertain cross currency swaps of non-US dollar debt. Fair value changes on these derivatives are recognised in the Consolidated income statement asremeasurements or within underlying earnings in accordance with the policy set out in note 8.
Further information on derivativesFair value of derivative positionsThe fair value of the Group’s open derivative positions at 31 December (excluding normal purchase and sale contracts held off balance sheet), recorded within‘Derivative financial assets’ and ‘Derivative financial liabilities’, is as follows:
Current Non-current
2019 2018 2019 2018
US$ million Asset Liability Asset Liability Asset Liability Asset Liability
Derivatives hedging net debt
Fair value hedgeInterest rate swaps 7 — 7 — 347 — 205 (109)
Held for tradingForward foreign currency contracts 8 (16) 3 (7) — — — —Cross currency swaps — (66) — (33) — (519) 4 (514)Debit valuation adjustment to derivative liabilities — — — — — 1 — 15
15 (82) 10 (40) 347 (518) 209 (608)Other derivatives 71 (73) 122 (63) — (4) — (5)Total derivatives 86 (155) 132 (103) 347 (522) 209 (613)
Other derivatives primarily relate to forward foreign currency contracts hedging capital expenditure, forward commodity contracts and other commodity contractsthat are accounted for as ‘Held for trading’. These marked to market valuations are not predictive of the future value of the hedged position, nor of the future impacton the profit of the Group. The valuations represent the cost of closing all hedge contracts at 31 December, at market prices and rates available at the time.
Accounting judgementFair value of financial instrumentsCertain of the Group’s financial instruments, principally derivatives, are required to be measured on the balance sheet at fair value. Where a quoted market price foran identical instrument is not available, a valuation model is used to estimate the fair value based on the net present value of the expected cash flows under thecontract. Valuation assumptions are usually based on observable market data (for example forward foreign exchange rate, interest rate or commodity price curves)where available.
Accounting policiesSee notes 38D and 38F for the Group’s accounting policies on financial asset investments, impairment of financial assets, derivative financial instruments andhedge accounting.
FINANCIAL STATEMENTS AND OTHER FINANCIAL INFORMATION NOTES TO THE FINANCIAL STATEMENTS
NET DEBT AND FINANCIAL RISK MANAGEMENT
22. FINANCIAL INSTRUMENTS AND DERIVATIVES continued
Anglo American plc Integrated Annual Report 2019 179

23. FINANCIAL RISK MANAGEMENT
OverviewThe Board approves and monitors the risk management processes, including documented treasury policies, counterparty limits and controlling and reportingstructures. The risk management processes of the Group’s independently listed subsidiaries are in line with the Group’s own policy.
The types of risk exposure, the way in which such exposure is managed and quantification of the level of exposure in the Consolidated balance sheet at31 December is as follows:
• liquidity risk
• credit risk
• commodity price risk
• foreign exchange risk
• interest rate risk.
A. Liquidity riskThe Group ensures that there are sufficient committed loan facilities (including refinancing, where necessary) in order to meet short-term business requirements,after taking into account cash flows from operations and its holding of cash and cash equivalents, as well as any Group distribution restrictions that exist. Inaddition, certain projects may be financed by means of limited recourse project finance, if appropriate.
Certain borrowing facilities within the Group are the subject of financial covenants that vary from facility to facility, but which would be considered normal forsuch facilities, such as the ratio of net debt to tangible net worth. The respective borrowers remain in compliance with these facilities at 31 December 2019.
The expected undiscounted cash flows of the Group’s net debt related and other financial liabilities, by remaining contractual maturity, based on conditions existingat the balance sheet date, are as follows:
2019
Net debt financial liabilities
US$ million Borrowings
Expectedfuture interest
payments
Derivativeshedgingnet debt
Otherfinancialliabilities Total
Amount due for repayment within one year (764) (345) (128) (4,602) (5,839)Greater than one year, less than two years (1,097) (316) (112) (12) (1,537)Greater than two years, less than three years (1,807) (281) (161) (20) (2,269)Greater than three years, less than four years (883) (218) (206) (18) (1,325)Greater than four years, less than five years (765) (189) (15) (18) (987)Greater than five years (4,898) (492) (26) (211) (5,627)Total due for repayment after more than one year (9,450) (1,496) (520) (279) (11,745)Total (10,214) (1,841) (648) (4,881) (17,584)
2018
Net debt financial liabilities
US$ million Borrowings
Expectedfuture interest
payments
Derivativeshedgingnet debt
Other financial liabilities Total
Amount due for repayment within one year (462) (337) (134) (4,262) (5,195)Greater than one year, less than two years (530) (313) (152) (20) (1,015)Greater than two years, less than three years (1,044) (286) (140) (17) (1,487)Greater than three years, less than four years (1,787) (254) (169) (19) (2,229)Greater than four years, less than five years (880) (193) (207) (18) (1,298)Greater than five years (4,133) (478) (77) (333) (5,021)Total due for repayment after more than one year (8,374) (1,524) (745) (407) (11,050)Total (8,836) (1,861) (879) (4,669) (16,245)
The Group had the following undrawn committed borrowing facilities at 31 December:
US$ million 2019 2018
Expiry date
Within one year 228 223Greater than one year, less than two years 394 1,182Greater than two years, less than three years 1,121 1,035Greater than three years, less than four years 1,538 —Greater than four years, less than five years 5,385 4,874
8,666 7,314
On 8 February 2019, the Group extended the maturity of $4.3 billion of its revolving credit facility by one year from March 2023 to March 2024. Subsequent to thisthe Group exercised its second extension option on 10 February 2020 extending the maturity of $4.3 billion of the facility by a further year and $0.2 billion by twoyears to March 2025.
Undrawn committed borrowing facilities expiring within one year include undrawn South African rand facilities equivalent to $0.2 billion (2018: $0.2 billion) inrespect of facilities with a 364 day maturity which roll automatically on a daily basis, unless notice is served.
FINANCIAL STATEMENTS AND OTHER FINANCIAL INFORMATION NOTES TO THE FINANCIAL STATEMENTS
NET DEBT AND FINANCIAL RISK MANAGEMENT
180 Anglo American plc Integrated Annual Report 2019

B. Credit riskCredit risk is the risk that a counterparty to a financial instrument will cause a loss to the Group by failing to pay its obligation.
The Group’s principal financial assets are cash, trade and other receivables, investments and derivative financial instruments. The Group’s maximum exposure tocredit risk primarily arises from these financial assets and is as follows:
US$ million 2019 2018
Cash and cash equivalents 6,345 6,567Trade and other receivables 1,932 1,806Financial asset investments 373 358Derivative financial assets 433 341
9,083 9,072
The Group limits credit risk on liquid funds and derivative financial instruments through diversification of exposures with a range of financial institutions approvedby the Board. Counterparty limits are set for each financial institution with reference to credit ratings assigned by Standard & Poor’s, Moody’s and FitchRatings, shareholder equity (in case of relationship banks) and fund size (in case of asset managers).
Given the diverse nature of the Group’s operations (both in relation to commodity markets and geographically), and the use of payment security instruments(including letters of credit from financial institutions), it does not have significant concentration of credit risk in respect of trade receivables, with exposure spreadover a large number of customers.
The classification of trade and other receivables excludes prepayments and tax receivables and the classification of financial asset investments excludes equityinvestments held at fair value through other comprehensive income.
C. Commodity price riskThe Group’s earnings are exposed to movements in the prices of the commodities it produces.
The Group’s policy is to sell its products at prevailing market prices and is generally not to hedge commodity price risk, although some hedging may beundertaken for strategic reasons. In such cases, the Group generally uses forward contracts and other derivative instruments to hedge the price risk.
Certain of the Group’s sales and purchases are provisionally priced, meaning that the selling price is determined normally 30 to 180 days after delivery to thecustomer, based on quoted market prices stipulated in the contract, and as a result are susceptible to future price movements. The exposure of the Group’sfinancial assets and liabilities to commodity price risk is as follows:
2019 2018
Commodity price linked Commodity price linked
US$ million
Subject toprice
movements Fixed price
Not linked tocommodity
price Total
Subject toprice
movements Fixed price
Not linked tocommodity
price Total
Total net financial instruments(excluding derivatives) 16 290 (6,983) (6,677) (286) 456 (4,711) (4,541)
Derivatives (4) — (240) (244) 67 — (442) (375)12 290 (7,223) (6,921) (219) 456 (5,153) (4,916)
Commodity price linked financial instruments subject to price movements include provisionally priced trade receivables and trade payables.
Commodity price linked financial instruments at fixed price include receivables and payables for commodity sales and purchases not subject to priceadjustment at the balance sheet date.
D. Foreign exchange riskAs a global business, the Group is exposed to many currencies principally as a result of non-US dollar operating costs and, to a lesser extent, from non-USdollar revenue.
The South African rand, Brazilian real and Australian dollar are the most significant non-US dollar currencies influencing costs. A strengthening of the US dollaragainst the currencies to which the Group is exposed has a positive effect on the Group’s earnings. The Group’s policy is generally not to hedge suchexposures given the correlation, over the longer term, with commodity prices and the diversified nature of the Group, although exceptions can be approved bythe Group Management Committee.
In addition, currency exposures exist in respect of non-US dollar capital expenditure projects and non-US dollar borrowings in US dollar functional currencyentities. The Group’s policy is to evaluate whether or not to hedge its non-US dollar capital expenditure on a case-by-case basis, taking into account theestimated foreign exchange exposure, liquidity of foreign exchange markets and the cost of executing a hedging strategy.
Net other financial liabilities (excluding net debt related balances and cash in disposal groups, but including the debit valuation adjustment attributable to derivativeshedging net debt) are $2,295 million. This includes net assets of $58 million denominated in Brazilian real, and net liabilities of $121 million denominated inUS dollars, $360 million denominated in Australian dollars, $436 million denominated in Chilean pesos and $1,036 million denominated in South African rand.
FINANCIAL STATEMENTS AND OTHER FINANCIAL INFORMATION NOTES TO THE FINANCIAL STATEMENTS
NET DEBT AND FINANCIAL RISK MANAGEMENT
23. FINANCIAL RISK MANAGEMENT continued
Anglo American plc Integrated Annual Report 2019 181

E. Interest rate riskInterest rate risk arises due to fluctuations in interest rates which impact the value of short-term investments and financing activities. The Group is principallyexposed to US and South African interest rates.
Various inter-bank offer rates (IBOR) are expected to be replaced by alternative risk-free rates by the end of 2021 as part of the IBOR reform. The Group is currentlyassessing the impact of these changes on its hedging arrangements and any future transactions in the financial market.
The Group’s policy is to borrow funds at floating rates of interest. The Group uses interest rate swap contracts to manage its exposure to interest rate movementson its debt.
In respect of financial assets, the Group’s policy is to invest cash at floating rates of interest and to maintain cash reserves in short-term investments (less than oneyear) in order to maintain liquidity.
Analysis of interest rate risk associated with net debt balances and the impact of derivatives to hedge against this risk is included within the table below. Net otherfinancial liabilities (excluding net debt related balances and cash in disposal groups, but including the debit valuation adjustment attributable to derivatives hedgingnet debt) of $2,295 million (2018: $2,068 million) are primarily non-interest bearing.
The table below reflects the exposure of the Group’s net debt to currency and interest rate risk.
2019
US$ million
Cashand cash
equivalentsFloating rate
borrowingsFixed rate
borrowings
Derivativeshedgingnet debt
Impact ofcurrency
derivatives Total
US dollar 5,443 (543) (5,232) (242) (4,424) (4,998)Euro 18 — (4,016) — 4,013 15South African rand 288 (54) (149) 2 — 87Brazilian real 181 — (20) — — 161Australian dollar 187 — (47) — — 140Sterling 22 (7) (594) 1 411 (167)Other 196 — (60) — — 136Impact of interest derivatives — (9,317) 9,317 — — —Total 6,335 (9,921) (801) (239) — (4,626)
2018
US$ million
Cashand cash
equivalentsFloating rateborrowings
Fixed rateborrowings
Derivativeshedgingnet debt
Impact ofcurrency
derivatives Total
US dollar 4,807 (134) (4,660) (445) (3,844) (4,276)Euro 20 — (3,844) — 3,844 20South African rand 1,250 (76) (154) 1 — 1,021Brazilian real 99 — — — — 99Australian dollar 165 — — — — 165Sterling 25 (7) (57) — — (39)Other 182 (3) (17) — — 162Impact of interest derivatives — (8,599) 8,599 — — —Total 6,548 (8,819) (133) (444) — (2,848)
Based on the net foreign currency and interest rate risk exposures detailed above, and taking into account the effects of the hedging arrangements in place,management considers that earnings and equity are not materially sensitive to reasonable foreign exchange or interest rate movements in respect of the financialinstruments held as at 31 December 2019 or 2018.
FINANCIAL STATEMENTS AND OTHER FINANCIAL INFORMATION NOTES TO THE FINANCIAL STATEMENTS
NET DEBT AND FINANCIAL RISK MANAGEMENT
23. FINANCIAL RISK MANAGEMENT continued
182 Anglo American plc Integrated Annual Report 2019

EQUITY
Equity represents the capital of the Groupattributable to Company shareholders and non-controlling interests, and includes share capital,share premium and reserves.
Total equity has increased from $29.8 billion to $31.4 billion in theyear, principally reflecting the profit for the year, partially offset byequity settled share-based payments, cancellation of treasury sharesand dividends to Company shareholders and non-controlling interestsof $2.2 billion.
TOTAL EQUITY
$31.4 bn (2018: $29.8 bn)
FINANCIAL STATEMENTS AND OTHER FINANCIAL INFORMATION NOTES TO THE FINANCIAL STATEMENTS
Anglo American plc Integrated Annual Report 2019 183
24. CALLED-UP SHARE CAPITAL AND CONSOLIDATED EQUITY ANALYSIS
Called-up share capital
2019 2018
Number of shares US$ million Number of shares US$ million
Called-up, allotted and fully paid:5% cumulative preference shares of £1 each — — 50,000 —
Ordinary shares of 5486/91 US cents each:At 1 January and 31 December 1,371,602,399 753 1,405,465,332 772
Excluding shares held in treasury (but including the shares held by the Group in other structures, as outlined below) the number and carrying value of called-up,allotted and fully paid ordinary shares as at 31 December 2019 was 1,371,259,349 and $753 million (2018: 1,404,916,230 and $772 million).
At general meetings, every member who is present in person has one vote on a show of hands and, on a poll, every member who is present in person or byproxy has one vote for every ordinary share held.
Own shares
2019 2018
Number of shares US$ million Number of shares US$ million
Own shares
Treasury shares 343,050 12 549,102 42Own shares held by subsidiaries and employee benefit trusts 128,991,088 6,183 138,173,090 6,273Total 129,334,138 6,195 138,722,192 6,315
The movement in treasury shares during the year is as follows:
2019 2018
Number of shares US$ million Number of shares US$ million
Treasury shares
At 1 January 549,102 42 851,900 53Transferred to employees in settlement of share awards (206,052) (30) (302,798) (11)At 31 December 343,050 12 549,102 42
Included in Own shares are 112,300,129 (2018: 112,300,129) Anglo American plc shares held by Epoch Investment Holdings (RF) Proprietary Limited, EpochTwo Investment Holdings (RF) Proprietary Limited and Tarl Investment Holdings (RF) Proprietary Limited, which are consolidated by the Group by virtue of theircontractual arrangements with Tenon Investment Holdings Proprietary Limited, a wholly owned subsidiary of Anglo American South Africa Proprietary Limited.Further details of these arrangements are provided in note 38B.
Included in the calculation of the dividend payable are 9,356,783 ($267 million) shares held in treasury and in the Employee Benefit Trust in respect of forfeitableshare awards granted to certain employees. Under the terms of these awards, the shares are beneficially owned by the respective employees, who are entitled toreceive dividends in respect of the shares. The shares are released to the employees on vesting of the awards, and any shares that do not vest are returned to theCompany or the Employee Benefit Trust. These shares are recognised on the Consolidated balance sheet within Own shares and are excluded from the calculationof basic earnings per share. They are included in the calculation of diluted earnings per share to the extent that the related share awards are dilutive (see note 3).

Consolidated equity analysis
Fair value and other reserves comprise:
US$ million
Share-basedpayment
reserve
Financial asset
revaluationreserve
Other reserves
Totalfair value
and otherreserves
At 1 January 2018 442 11 119 572Total comprehensive expense — (37) — (37)Equity settled share-based payment schemes (9) — — (9)Other — 10 1 11At 31 December 2018 433 (16) 120 537Total comprehensive income — 68 — 68Equity settled share-based payment schemes (2) — — (2)Cancellation of treasury shares — — 19 19Other — (55) 3 (52)At 31 December 2019 431 (3) 142 570
Other reserves comprise a capital redemption reserve of $134 million (2018: $115 million), a legal reserve of $3 million (2018: $5 million) and other reserves of$5 million (2018: nil).
FINANCIAL STATEMENTS AND OTHER FINANCIAL INFORMATION NOTES TO THE FINANCIAL STATEMENTS
EQUITY
24. CALLED-UP SHARE CAPITAL AND CONSOLIDATED EQUITY ANALYSIS continued
184 Anglo American plc Integrated Annual Report 2019
25. NON-CONTROLLING INTERESTS
OverviewNon-controlling interests that are material to the Group relate to the following subsidiaries:
• De Beers Plc (De Beers), is a company incorporated in Jersey. It is one of the world’s leading diamond companies with operations across all key parts of thediamond value chain. Non-controlling interests hold a 15% (2018: 15%) interest in De Beers, which represents the whole of the Diamonds reportable segment.
• Anglo American Sur S.A. (Anglo American Sur), is a company incorporated in Chile. Its principal operations are the Los Bronces and El Soldado copper minesand the Chagres smelter, which are located in Chile. Non-controlling interests hold a 49.9% (2018: 49.9%) interest in Anglo American Sur.
• Anglo American Platinum Limited (Anglo American Platinum), is a company incorporated in South Africa and listed on the JSE. Its principal mining operationsare the Mogalakwena and Amandelbult platinum group metals mines which are located in South Africa. Non-controlling interests hold an effective 20.6%(2018: 20.6%) interest in the operations of Anglo American Platinum, which represents the whole of the Platinum Group Metals reportable segment.
• Kumba Iron Ore Limited (Kumba Iron Ore), is a company incorporated in South Africa and listed on the JSE. Its principal mining operations are the Sishen andKolomela iron ore mines which are located in South Africa. Non-controlling interests hold an effective 46.6% (2018: 46.4%) interest in the operations of KumbaIron Ore, comprising the 29.7% (2018: 29.7%) interest held by other shareholders in Kumba Iron Ore and the 23.7% (2018: 23.7%) of Kumba Iron Ore’s principaloperating subsidiary, Sishen Iron Ore Company Proprietary Limited, that is held by shareholders outside the Group.
2019 2018
De Beers
AngloAmerican
Sur
AngloAmericanPlatinum
KumbaIron Ore Other Total De Beers
AngloAmerican
Sur
AngloAmericanPlatinum
KumbaIron Ore Other Total
Underlying earnings attributable tonon-controlling interests — 118 259 686 5 1,068 53 191 133 434 52 863
Profit attributable to non-controlling interests 1 56 269 691 18 1,035 34 191 117 432 50 824
Dividends paid to non-controllinginterests (9) (143) (79) (638) (25) (894) (10) (310) (47) (460) (10) (837)
Balance sheet information:
Equity attributable to non-controlling interests 1,406 1,619 906 1,555 1,104 6,590 1,409 1,573 691 1,474 1,087 6,234
Other non-controlling interests consist of individually immaterial non-controlling interests.

Further informationSummarised financial information on a 100% basis and before inter-company eliminations for De Beers, Anglo American Platinum, Kumba Iron Ore andAnglo American Sur is as follows:
2019 2018
US$ million De Beers
AngloAmericanPlatinum
KumbaIron Ore
AngloAmerican
Sur De Beers
AngloAmericanPlatinum
KumbaIron Ore
AngloAmerican
Sur
Non-current assets 9,006 5,424 2,971 4,084 8,621 5,047 2,782 4,104Current assets 3,835 3,342 1,893 1,100 3,713 2,489 1,701 1,165Current liabilities (694) (2,115) (499) (531) (639) (1,761) (405) (891)Non-current liabilities (2,155) (1,342) (911) (1,405) (1,747) (1,507) (796) (1,227)Net assets 9,992 5,309 3,454 3,248 9,948 4,268 3,282 3,151
Revenue 4,599 6,866 4,445 2,287 6,076 5,596 3,440 2,544Profit/(loss) for the financial year(1) (21) 1,247 1,466 113 203 481 922 385Total comprehensive income/(expense) 69 1,421 1,589 96 (428) (178) 450 381Net cash inflow from operating activities 361 1,985 1,860 437 1,041 1,124 1,008 947
(1) Stated after special items and remeasurements.
Change in ownership interests in subsidiariesIn 2019, there have been no material changes in ownership interests in subsidiaries.
In 2018, the Board approved the development of the Quellaveco copper project in Peru and Mitsubishi increased its interest in Anglo American Quellaveco S.A.(AAQSA) from 18.1% to 40% via the issuance of new shares. Mitsubishi subscribed $500 million in upfront consideration and an additional $351 million to fund itsinitial share of capex, resulting in a total cash subscription of $851 million. An amount of $674 million was transferred to non-controlling interests within equity, whichreflected the increase in Mitsubishi’s proportionate share of the net assets of AAQSA. The difference of $163 million between the increase in the non-controllinginterests and the net consideration received was credited to retained earnings.
FINANCIAL STATEMENTS AND OTHER FINANCIAL INFORMATION NOTES TO THE FINANCIAL STATEMENTS
EQUITY
25. NON-CONTROLLING INTERESTS continued
Anglo American plc Integrated Annual Report 2019 185

EMPLOYEES
This section contains information about theGroup’s current and former employees as wellas the associated cost of employment and postemployment benefits incurred by the Group.
The Group had on average 63,000 employees during 2019, down1,000 since the prior year.
EMPLOYEES
63,000(2018: 64,000)
FINANCIAL STATEMENTS AND OTHER FINANCIAL INFORMATION NOTES TO THE FINANCIAL STATEMENTS
186 Anglo American plc Integrated Annual Report 2019
26. EMPLOYEE NUMBERS AND COSTS
Employee numbersThe average number of employees, excluding contractors and associates’ and joint ventures’ employees and including a proportionate share of employeeswithin joint operations, by segment was:
Thousand 2019 2018
De Beers 9 10Copper 4 4Platinum Group Metals 31 33Iron Ore 9 8Coal 7 7Nickel and Manganese 1 1Corporate and other 2 1
63 64
The average number of employees, excluding contractors and associates’ and joint ventures’ employees and including a proportionate share of employees withinjoint operations, by principal location of employment was:
Thousand 2019 2018
South Africa 45 47Other Africa 4 4South America 8 8North America 1 1Australia and Asia 3 2Europe 2 2
63 64
Employee costsPayroll costs in respect of the employees included in the tables above were:
US$ million 2019 2018
Wages and salaries 2,877 2,871Social security costs 182 163Post employment benefits 245 271Share-based payments 163 185Total payroll costs 3,467 3,490Reconciliation:
Less: Employee costs capitalised (108) (83)Employee costs included in operating costs 3,359 3,407
Post employment benefits include contributions to defined contribution pension and medical plans, current and past service costs related to defined benefit pensionand medical plans and other benefits provided to certain employees during retirement.

Key managementKey management personnel are those persons having authority and responsibility for planning, directing and controlling the activities of the Group,directly or indirectly, including any director (executive and non-executive) of the Group. Key management comprises members of the Board and theGroup Management Committee.
Compensation for key management was as follows:
US$ million 2019 2018
Salaries and short-term employee benefits 24 21Social security costs 13 5Post employment benefits 3 3Share-based payments 23 24
63 53
Disclosure of directors’ emoluments, pension entitlements, share options and long-term incentive plan awards required by the Companies Act 2006 and thosespecified for audit by Part 3 and Schedule 8 of the Large and Medium-Sized Companies and Groups (Accounts and Reports) (Amendment) Regulations 2013are included in the Remuneration report.
FINANCIAL STATEMENTS AND OTHER FINANCIAL INFORMATION NOTES TO THE FINANCIAL STATEMENTS
EMPLOYEES
26. EMPLOYEE NUMBERS AND COSTS continued
Anglo American plc Integrated Annual Report 2019 187
27. RETIREMENT BENEFITS
OverviewThe Group operates a number of defined contribution and defined benefit pension plans with the most significant plans being in South Africa and the UnitedKingdom. It also operates post employment medical plans, the majority of which are unfunded, principally in South Africa. The post employment medicalplans provide health benefits to retired employees and certain dependants.
Defined contribution plansThe charge for the year for defined contribution pension plans (net of amounts capitalised and special items) was $136 million (2018: $148 million) and fordefined contribution medical plans (net of amounts capitalised) was $69 million (2018: $71 million).
Defined benefit pension plans and post employment medical plansCharacteristics of plansThe majority of the defined benefit pension plans are funded. The assets of these plans are held separately from those of the Group, in independentlyadministered funds, in accordance with statutory requirements or local practice in the relevant jurisdiction. The responsibility for the governance of thefunded retirement benefit plans, including investment and funding decisions, lies with the Trustees of each scheme. The unfunded liabilities are principally inrelation to termination indemnity plans in Chile.
South AfricaThe pension plans in South Africa are in surplus. All pension plans in South Africa are closed to new members and the majority of plans are closed to futurebenefit accrual. As the plans are in surplus no employer contributions are currently being made. The Group’s provision of anti-retroviral therapy to HIVpositive staff does not significantly impact the post employment medical plan liability.
United KingdomThe Group operates funded pension plans in the United Kingdom. These plans are closed to new members and to the future accrual of benefits. The Groupis committed to make payments to certain United Kingdom pension plans under deficit funding plans agreed with the respective Trustees.
OtherOther pension and post employment medical plans primarily comprise obligations in Chile where legislation requires employers to provide for a terminationindemnity, entitling employees to a cash payment made on the termination of an employment contract.
ContributionsEmployer contributions are made in accordance with the terms of each plan and may vary from year to year. Employer contributions made to fundedpension plans in the year ended 31 December 2019 were $41 million (2018: $191 million). In addition, $21 million (2018: $12 million) of benefits were paid tounfunded pension plans and $25 million (2018: $25 million) of benefits were paid in relation to post employment medical plans. The Group expects tocontribute $56 million to its pension plans and $28 million to its post employment medical plans in 2020.
Income statementThe amounts recognised in the Consolidated income statement are as follows:
2019 2018
US$ millionPension
plans
Postemployment
medicalplans Total
Pensionplans
Postemployment
medical plans Total
Charged to operating costs 12 3 15 30 3 33Net (credit)/charge to net finance costs (16) 35 19 (14) 36 22
Total net (credit)/charge to the income statement before special items (4) 38 34 16 39 55
Special items (note 8) — — — 80 — 80Total net (credit)/charge to the income statement (4) 38 34 96 39 135
Net (credit)/charge to net finance costs includes interest expense on surplus restriction of $11 million (2018: $17 million).

Comprehensive incomeThe pre-tax amounts recognised in the Consolidated statement of comprehensive income are as follows:
2019 2018
US$ millionPension
plans
Postemployment
medicalplans Total
Pensionplans
Postemployment
medical plans Total
Return on plan assets, excluding interest income 334 — 334 (177) — (177)Actuarial (losses)/gains on plan liabilities (488) 14 (474) 240 5 245Movement in surplus restriction 12 — 12 67 — 67Remeasurement of net defined benefit obligation (142) 14 (128) 130 5 135
Actuarial losses on plan liabilities comprise net losses from changes in financial and demographic assumptions as well as experience on plan liabilities. The taxamounts arising on remeasurement of the net defined benefit obligations are disclosed in note 5.
Balance sheetA summary of the movements in the net pension plan assets and retirement benefit obligations on the Consolidated balance sheet is as follows:
US$ million 2019 2018
Net asset/(liability) recognised at 1 January 39 (227)Net income statement charge before special items (34) (55)Remeasurement of net defined benefit obligation (128) 135Employer contributions to funded pension plans 41 191Benefits paid to unfunded plans 46 37Effects of Curtailments/Settlements (note 8) — (80)Other 1 10Currency movements 15 28Net (liability)/asset recognised at 31 December (20) 39Amounts recognised as:
Defined benefit pension plans in surplus 631 648Retirement benefit obligation – pension plans (264) (232)Retirement benefit obligation – medical plans (387) (377)
(20) 39
Defined benefit pension plans in surplus are included in Other non-current assets on the Consolidated balance sheet.
Further informationMovement analysisThe changes in the fair value of plan assets are as follows:
2019 2018
US$ millionPension
plans
Postemployment
medicalplans Total
Pension plans
Postemployment
medical plans Total
At 1 January 4,791 12 4,803 5,731 14 5,745Interest income 188 1 189 212 1 213Return on plan assets, excluding interest income 334 — 334 (177) — (177)Contributions paid by employer to funded pension plans 41 — 41 191 — 191Benefits paid (236) (1) (237) (309) (1) (310)Effects of Curtailments/Settlements (2) — (2) (479) — (479)Other 17 — 17 2 — 2Currency movements 125 — 125 (380) (2) (382)As at 31 December 5,258 12 5,270 4,791 12 4,803
The changes in the present value of defined benefit obligations are as follows:
2019 2018
US$ millionPension
plans
Postemployment
medicalplans Total
Pension plans
Postemployment
medical plans Total
At 1 January (4,259) (389) (4,648) (5,331) (454) (5,785)Current service costs (12) (3) (15) (30) (3) (33)Interest costs (161) (36) (197) (181) (37) (218)Actuarial (losses)/gains (488) 14 (474) 240 5 245Benefits paid 257 26 283 321 26 347Effects of Curtailments/Settlements 2 — 2 399 — 399Other (16) — (16) (5) 13 8Currency movements (96) (11) (107) 328 61 389As at 31 December (4,773) (399) (5,172) (4,259) (389) (4,648)
The most significant actuarial loss arose from changing financial assumptions on pension plans totalling $527 million (2018: gain arose from changing financialassumptions on pension plans totalling $255 million).
FINANCIAL STATEMENTS AND OTHER FINANCIAL INFORMATION NOTES TO THE FINANCIAL STATEMENTS
EMPLOYEES
27. RETIREMENT BENEFITS continued
188 Anglo American plc Integrated Annual Report 2019

Pension plan assets and liabilities by geographyThe split of the present value of funded and unfunded obligations in defined benefit pension plans and the fair value of pension assets at 31 December is as follows:
2019 2018
US$ millionSouth Africa
UnitedKingdom Other Total
South Africa
UnitedKingdom Other Total
Corporate bonds 137 2,467 3 2,607 274 2,128 5 2,407Government bonds 359 1,818 86 2,263 224 1,579 70 1,873Equity 90 32 6 128 95 57 5 157Cash 152 29 — 181 135 41 2 178Other 2 77 — 79 — 176 — 176Fair value of pension plan assets 740 4,423 95 5,258 728 3,981 82 4,791Active members (4) — (18) (22) (5) — (8) (13)Deferred members (2) (1,484) (7) (1,493) (2) (1,262) (3) (1,267)Pensioners (476) (2,500) (83) (3,059) (471) (2,242) (76) (2,789)Present value of funded obligations (482) (3,984) (108) (4,574) (478) (3,504) (87) (4,069)Present value of unfunded obligations — — (199) (199) — — (190) (190)Net surplus/(deficit) in pension plans 258 439 (212) 485 250 477 (195) 532Surplus restriction (118) — — (118) (116) — — (116)Recognised retirement benefit assets/(liabilities) 140 439 (212) 367 134 477 (195) 416
Other non-current assets – pension plans 140 491 — 631 134 513 1 648Retirement benefit obligation – pension plans — (52) (212) (264) — (36) (196) (232)
The fair value of assets is used to determine the funding level of the plans. The fair value of the assets of the funded plans was sufficient to cover 115%(2018: 118%) of the benefits that had accrued to members after allowing for expected increases in future earnings and pensions. The present value of unfundedobligations includes $191 million (2018: $181 million) relating to active members. All material investments are quoted.
In South Africa the asset recognised is restricted to the amount in the Employer Surplus Account. The Employer Surplus Account is the amount that the Group isentitled to by way of a refund, taking into consideration any contingency reserves as recommended by the funds’ actuaries.
Actuarial assumptionsThe principal assumptions used to determine the actuarial present value of benefit obligations and pension charges and credits are detailed below (shown asweighted averages):
2019 2018
South Africa
UnitedKingdom Other
South Africa
UnitedKingdom Other
Defined benefit pension plans
Average discount rate for plan liabilities 9.9% 2.0% 3.9% 9.8% 2.9% 5.3%Average rate of inflation 5.6% 2.9% 3.1% 6.3% 3.2% 3.0%Average rate of increase of pensions in payment 5.6% 3.2% 2.8% 6.3% 3.4% 2.8%Post employment medical plans
Average discount rate for plan liabilities 9.9% n/a 7.6% 9.8% n/a 7.7%Average rate of inflation 5.6% n/a 5.0% 6.3% n/a 5.3%Expected average increase in healthcare costs 8.0% n/a 7.6% 8.4% n/a 7.8%
The weighted average duration of the South African plans is nine years (2018: 11 years), United Kingdom plans is 18 years (2018: 18 years) and plans in otherregions is 14 years (2018: 13 years). This represents the average period over which future benefit payments are expected to be made.
Mortality assumptions are determined based on standard mortality tables with adjustments, as appropriate, to reflect experience of conditions locally. In SouthAfrica the PA90 tables are used. The main plans in the United Kingdom use CMI tables or Club Vita models with plan specific adjustments based on mortalityinvestigations. The mortality tables used imply that a male or female aged 60 at the balance sheet date has the following future life expectancy (shown asweighted averages):
Male Female
Years 2019 2018 2019 2018
South Africa 18.7 18.8 23.4 23.4United Kingdom 27.7 27.7 29.2 29.2Other 24.3 24.2 28.5 28.4
The table below summarises the expected life expectancy from the age of 60 for a male or female aged 45 at the balance sheet date. When viewed together withthe respective life expectancy at age 60 in the table above this indicates the anticipated improvement in life expectancy (shown as weighted averages):
Male Female
Years 2019 2018 2019 2018
South Africa 18.8 18.8 23.4 23.4United Kingdom 28.7 28.8 30.7 30.7Other 25.4 25.2 29.5 29.3
FINANCIAL STATEMENTS AND OTHER FINANCIAL INFORMATION NOTES TO THE FINANCIAL STATEMENTS
EMPLOYEES
27. RETIREMENT BENEFITS continued
Anglo American plc Integrated Annual Report 2019 189

Risk of plansThe Group has identified the main risk to its defined benefit pension schemes as being interest rate risk due to the impact on the UK discount rate assumption:
Risk Description Mitigation
Interest rate risk A fall in longer-term real and nominalinterest rates expectations causes giltyields and corporate bond yields todecrease, which results in a lowerdiscount rate being applied to the UKpension liabilities and so, with all elsebeing held equal, the value of thepension scheme liabilities increases.
If the pension scheme assets do notincrease by the same amount as theincrease in the pension schemeliabilities (caused by the fall in interestrates) then, all else being equal, this willresult in a worsening of the pensionscheme funding position.
The Trustees’ investment strategies vary by plan for the UK and include investing, with theintention of counter-balancing the movements in the liabilities, in fully owned (fully funded) physicalcredit and gilts, and by gaining unfunded exposure to gilts (via gilt repurchase agreements) andother fixed income based derivatives to match the real and nominal interest rate sensitivity of thepension scheme liabilities.
Approximately 75-100% (depending on the scheme) of the pension scheme liabilities are currentlyhedged against movements in real and nominal interest rates.
The Trustees’ hedging strategies are typically designed to protect the respective schemes’ fundingplans against volatility in market yields. The discount rate used to calculate any fundingrequirement for the schemes is linked to gilt yields rather than to corporate bond yields as requiredunder IAS 19. Consequently the valuation of the net retirement benefit obligation for accountingpurposes remains susceptible to movements in value due to the difference between corporatebond and gilt yields. In addition, since corporate bond yields are typically higher than gilt yields,this can result in the recognition of accounting surpluses in respect of schemes where cashcontributions continue to be made to meet funding shortfalls.
Sensitivity analysisSignificant actuarial assumptions for the determination of pension and medical plan liabilities are the discount rate, inflation rate and mortality. The sensitivity analysisbelow has been provided by local actuaries on an approximate basis based on changes in the assumptions occurring at the end of the year, assuming that all otherassumptions are held constant and the effect of interrelationships is excluded. The effect on plan liabilities is as follows:
2019
US$ millionSouth Africa
UnitedKingdom Other Total
Discount rate – 0.5% decrease (37) (377) (17) (431)Inflation rate – pension plans – 0.5% increase (19) (137) (13) (169)Inflation rate – medical plans – 0.5% increase (16) — (3) (19)Life expectancy – increase by 1 year (28) (193) (4) (225)
Independent qualified actuaries carry out full valuations at least every three years using the projected unit credit method. The actuaries have updated the valuationsto 31 December 2019. Assumptions are set after consultation with the qualified actuaries. While management believes the assumptions used are appropriate, achange in the assumptions used would impact the Group’s other comprehensive income.
Accounting policySee note 38H for the Group’s accounting policy on retirement benefits.
FINANCIAL STATEMENTS AND OTHER FINANCIAL INFORMATION NOTES TO THE FINANCIAL STATEMENTS
EMPLOYEES
27. RETIREMENT BENEFITS continued
190 Anglo American plc Integrated Annual Report 2019

28. SHARE-BASED PAYMENTS
OverviewDuring the year ended 31 December 2019 the Group had share-based payment arrangements with employees relating to shares of the Company. All of theseCompany schemes, as well as any non-cyclical awards, are equity settled either by award of ordinary shares (BSP, LTIP, SIP and Non-cyclical) or award ofoptions to acquire ordinary shares (SAYE). The awards are conditional on employment. LTIP awards granted prior to 2017 vest in accordance with theachievement of performance conditions based on a Group ROCE target and relative TSR targets. LTIPs granted since 2017 vest in accordance with theachievement of relative TSR targets and a balanced scorecard of measures including a Group ROCE target, an attributable free cash flow target andenvironmental, social and governance targets.
The total share-based payment charge relating to Anglo American plc shares for the year is split as follows:
US$ million 2019 2018
BSP 80 88LTIP 58 63Other schemes 3 13Share-based payment charge relating to Anglo American plc shares 141 164
In addition there are equity settled share-based payment charges of $6 million (2018: $5 million) relating to Kumba Iron Ore Limited shares and $10 million(2018: $13 million) relating to Anglo American Platinum Limited shares. Certain business units also operate cash settled employee share-based payment schemes.These schemes had a charge of $6 million (2018: $3 million).
Further informationThe movements in the number of shares for the more significant share-based payment arrangements are as follows:
Bonus Share PlanOrdinary shares of 5486/91 US cents may be awarded under the terms of this scheme for no consideration.
Number of awards 2019 2018
Outstanding at 1 January 17,051,229 18,051,949Conditionally awarded in year 3,543,428 3,996,543Vested in year (8,469,401) (4,467,219)Forfeited or expired in year (300,450) (530,044)Outstanding at 31 December 11,824,806 17,051,229
Further information in respect of the BSP, including performance conditions, is shown in the Remuneration report.
Long-Term Incentive PlanOrdinary shares of 5486/91 US cents may be awarded under the terms of this scheme for no consideration.
Number of awards 2019 2018
Outstanding at 1 January 17,414,233 18,446,709Conditionally awarded in year 4,591,308 3,168,211Vested in year (8,094,236) (2,934,058)Forfeited or expired in year (1,901,064) (1,266,629)Outstanding at 31 December 12,010,241 17,414,233
The early vesting of share awards is permitted at the discretion of the Company upon, inter alia, termination of employment, ill health or death. The LTIP awards arecontingent on pre-established performance criteria being met. Further information in respect of this scheme is shown in the Remuneration report.
Accounting policySee note 38H for the Group’s accounting policy on share-based payments.
FINANCIAL STATEMENTS AND OTHER FINANCIAL INFORMATION NOTES TO THE FINANCIAL STATEMENTS
EMPLOYEES
Anglo American plc Integrated Annual Report 2019 191

UNRECOGNISED ITEMS AND UNCERTAIN EVENTS
This section includes disclosure of items and transactions that are not reflected in the Group’s resultsbecause they are uncertain or have been incurred after the end of the year. These disclosures areconsidered relevant to an understanding of the Group’s financial position and the effect of expectedor possible future events.
FINANCIAL STATEMENTS AND OTHER FINANCIAL INFORMATION NOTES TO THE FINANCIAL STATEMENTS
192 Anglo American plc Integrated Annual Report 2019
29. EVENTS OCCURRING AFTER END OF YEAR
On 20 January 2020, Anglo American announced that an agreement has been reached with the board of Sirius Minerals Plc (Sirius) on the terms of a recommendedcash acquisition for the entire issued and to be issued share capital of Sirius for cash consideration of approximately £405 million (approximately $526 million). Theproposed transaction is subject to regulatory and Sirius’ shareholder approval.
With the exception of the proposed final dividend for 2019, there have been no other reportable events since 31 December 2019.
30. COMMITMENTS
OverviewA commitment is a contractual obligation to make a payment in the future which is not provided for in the balance sheet. The Group also has purchase obligationsrelating to take or pay agreements which are legally binding and enforceable.
Capital commitments for subsidiaries and joint operations relating to the acquisition of property, plant and equipment are $3,552 million (2018: $2,997 million),of which 52% (2018: 49%) relate to expenditure to be incurred within the next year.
The Group’s outstanding commitments relating to take or pay agreements are $13,246 million (2018: $14,217 million), of which 11% (2018: 12%) relate toexpenditure to be incurred within the next year.
At 31 December 2019 the Group’s total undiscounted future minimum lease payments under non-cancellable leases, for which liabilities are recognised on theConsolidated balance sheet (2018: in respect of non-cancellable operating leases not recognised on the Consolidated balance sheet) are as follows:
US$ million 2019 2018
Within one year 245 164Greater than one year, less than two years 113 97Greater than two years, less than five years 144 136Greater than five years 203 156
705 553
Leases relate principally to corporate offices, diamond jewellery retail outlets and shipping vessels. The Group leases land and buildings for its office space, foremployee accommodation and retail stores for De Beers Jewellers. The leases for office space typically run for 10 to 25 years, employee accommodation up to25 years and leases of retail stores 5 to 25 years. Some longer leases incorporate fixed increases in rentals or provide for annual uplifts based upon an index,typically a measure of inflation.
Accounting policySee notes 38C and 38D for the Group’s accounting policy on leases.
31. CONTINGENT LIABILITIES
OverviewThe Group is subject to various claims which arise in the ordinary course of business. Additionally, the Group has provided indemnities against certain liabilities aspart of agreements for the sale or other disposal of business operations. Having taken appropriate legal advice, the Group believes that a material liability arisingfrom the indemnities provided is remote.
The Group is required to provide guarantees in several jurisdictions in respect of environmental restoration and decommissioning obligations. The Group hasprovided for the estimated cost of these activities.
Accounting judgementA provision is recognised where, based on the Group’s legal views and, in some cases, independent advice, it is considered probable that an outflow ofresources will be required to settle a present obligation that can be measured reliably.

GROUP STRUCTURE
This section includes details about the composition of the Group and how this is reflected in theConsolidated financial statements. It also includes disclosures of significant corporate transactionssuch as acquisitions and disposals.
FINANCIAL STATEMENTS AND OTHER FINANCIAL INFORMATION NOTES TO THE FINANCIAL STATEMENTS
Anglo American plc Integrated Annual Report 2019 193
32. ASSETS AND LIABILITIES HELD FOR SALE
On 27 November 2019, the Group announced the equalisation of ownership across its integrated Australian metallurgical coal operations at Moranbah North andGrosvenor (Coal) via the disposal of 12% of its interest in the Grosvenor mine to a consortium that owns 12% of Moranbah North. The transaction is subject tovarious regulatory approvals but completion is considered highly probable to occur during 2020. At 31 December 2019, assets of $166 million and associatedliabilities of $17 million were classified as held for sale and a loss of $59 million recognised within non-operating special items to bring the carrying amount into linewith the fair value less cost to sell (see note 8).
2018There were no assets classified as held for sale as at 31 December 2018.
33. ACQUISITIONS AND DISPOSALS
AcquisitionsDuring the year, the Group made a cash payment of $13 million in relation to the acquisition of control of Mototolo Platinum Mine (Platinum Group Metals).The deferred consideration in respect of Mototolo was $53 million as at 31 December 2019.
2018Acquisitions in 2018 mainly related to the acquisition of control of Mototolo Platinum Mine (Platinum Group Metals).
DisposalsDuring the year, the Group received net cash of $24 million on disposals which principally relate to Platinum Group Metals. Additionally, on 30 January 2020, afurther $125 million was received as settlement of the deferred consideration relating to the sale of the 33% interest in Bafokeng Rasimone Platinum Mine (PlatinumGroup Metals) which completed on 10 December 2018.
2018Disposals in 2018 principally related to the sale of the Eskom-tied domestic coal operations in South Africa (Coal) and the sales of the Group’s interests in the Unionmine and Masa Chrome Company Proprietary Limited (Platinum Group Metals).

34. BASIS OF CONSOLIDATION
OverviewThe principal subsidiaries, joint operations, joint ventures and associates of the Group and the Group percentage of equity capital are set out below. All theseinterests are held indirectly by the Parent Company and are consolidated within these financial statements.
A complete list of the Group’s related undertakings can be found in note 35.
Percentage of equity owned
Segment and asset Location Accounting treatment 2019 2018
De Beers(1) 85% 85%Debswana(2), comprising: Botswana Joint operation 19.2% 19.2%
JwanengOrapaDamtshaaLetlhakane
Namdeb Holdings(3), comprising: Namibia Joint operation 50% 50%Namdeb Diamond CorporationDebmarine Namibia
De Beers Consolidated Mines(4), comprising: South Africa Full consolidation 100% 100%VenetiaVoorspoed
De Beers Canada, comprising:Snap Lake Canada Full consolidation 100% 100%Victor Canada Full consolidation 100% 100%Gahcho Kué Canada Joint operation 51% 51%
Sales, comprising:De Beers Global Sightholder Sales Botswana Full consolidation 100% 100%De Beers Sightholder Sales South Africa South Africa Full consolidation 100% 100%Auction Sales Singapore Full consolidation 100% 100%DTC Botswana Botswana Joint operation 50% 50%Namibia DTC Namibia Joint operation 50% 50%
Element Six, comprising:Element Six Technologies Global Full consolidation 100% 100%Element Six Abrasives Global Full consolidation 60% 60%
Brands, comprising:Forevermark Global Full consolidation 100% 100%De Beers Jewellers Global Full consolidation 100% 100%
Copper
Copper ChileLos Bronces Chile Full consolidation 50.1% 50.1%El Soldado Chile Full consolidation 50.1% 50.1%Chagres Chile Full consolidation 50.1% 50.1%Collahuasi Chile Joint operation 44% 44%
Copper PeruQuellaveco Peru Full consolidation 60% 60%
Platinum Group Metals(5) 78% 78%Mogalakwena Mine South Africa Full consolidation 100% 100%Amandelbult complex(6) South Africa Full consolidation 100% 100%Twickenham Mine South Africa Full consolidation 100% 100%Unki Mine Zimbabwe Full consolidation 100% 100%Platinum Refining South Africa Full consolidation 100% 100%Modikwa Platinum Joint Operation South Africa Joint operation 50% 50%Mototolo South Africa Full consolidation 100% 100%Kroondal Pooling and Sharing Agreement South Africa Joint operation 50% 50%Bokoni South Africa Equity accounted associate 49% 49%
See page 195 for footnotes.
FINANCIAL STATEMENTS AND OTHER FINANCIAL INFORMATION NOTES TO THE FINANCIAL STATEMENTS
GROUP STRUCTURE
194 Anglo American plc Integrated Annual Report 2019

Percentage of equity owned
Segment and asset Location Accounting treatment 2019 2018
Iron Ore
Kumba Iron Ore South Africa Full consolidation 69.7% 69.7%Sishen(7) South Africa Full consolidation 76.3% 76.3%Kolomela(7) South Africa Full consolidation 76.3% 76.3%
Minas-Rio Brazil Full consolidation 100% 100%Ferroport(8) Brazil Equity accounted joint venture 50% 50%
Coal
Coal Australia and Canada, comprising:Moranbah North(9) Australia Joint operation 88% 88%Grosvenor Australia Full consolidation 100% 100%Capcoal(9) Australia Joint operation 70% 70%Dawson(9) Australia Joint operation 51% 51%Jellinbah(10)(11) Australia Equity accounted associate 33.3% 33.3%Dalrymple Bay Coal Terminal Pty Ltd Australia Equity accounted associate 25.3% 25.3%Peace River Coal Canada Full consolidation 100% 100%
Coal South Africa, comprising:Goedehoop South Africa Full consolidation 100% 100%Greenside South Africa Full consolidation 100% 100%Khwezela South Africa Full consolidation 100% 100%Mafube South Africa Joint operation 50% 50%Zibulo(12) South Africa Full consolidation 73% 73%Isibonelo South Africa Full consolidation 100% 100%Richards Bay Coal Terminal South Africa Equity accounted associate 23.2% 23.2%
Carbones del Cerrejón Colombia Equity accounted associate 33.3% 33.3%
Nickel and Manganese
Barro Alto Brazil Full consolidation 100% 100%Samancor(10)(13) South Africa and Australia Equity accounted joint venture 40% 40%
(1) 85% should be applied to all holdings within De Beers to determine the Group’s attributable share of the asset.(2) De Beers owns 50% of equity in Debswana, but consolidates 19.2% of Debswana on a proportionate basis, reflecting the economic interest. The Group’s effective interest in Debswana is 16.3%
(taking into account the Group’s 85% interest in De Beers Group).(3) The 50% interest in Namdeb Holdings is held indirectly through De Beers. The Group’s effective interest in Namdeb Holdings is 42.5%.(4) De Beers’ legal ownership of De Beers Consolidated Mines (DBCM) and its subsidiaries is 74%. For accounting purposes De Beers consolidates 100% of DBCM as it is deemed to control the
BEE entity, Ponahalo, which holds the remaining 26%. The Group’s effective interest in DBCM is 85%.(5) The Group’s effective interest in Anglo American Platinum is 79.4%, which includes shares issued as part of a community empowerment deal.(6) Amandelbult comprises Tumela mine and Dishaba mine.(7) Sishen and Kolomela are fully owned by the Sishen Iron Ore Company (Pty) Ltd (SIOC). Kumba Iron Ore Limited has a 76.3% interest in SIOC (2018: 76.3%). Including shares held by Kumba Iron
Ore in relation to its own employee share schemes, the Group’s effective interest in Kumba Iron Ore is 70.02%. Consequently, the Group’s effective interest in SIOC is 53.4% (2018: 53.6%).(8) Ferroport owns and operates the iron ore handling and shipping facilities at the port of Açu.(9) The wholly owned subsidiary Anglo American Metallurgical Coal Holdings Limited holds the proportionately consolidated joint operations. These operations are unincorporated
and jointly controlled.(10) These entities have a 30 June year end.(11) The Group’s effective interest in the Jellinbah operation is 23.3%.(12) Zibulo forms, and prior to its disposal Kriel formed part of the Anglo American Inyosi Coal BEE company of which the Group owns 73%.(13) Samancor Holdings Proprietary Limited is the parent company of Hotazel Manganese Mines (HMM) and the Metalloys Smelter. BEE shareholders hold a 26% interest in HMM and therefore the
Group’s effective ownership interest in HMM is 29.6%.
Accounting judgementsJoint arrangementsJoint arrangements are classified as joint operations or joint ventures according to the rights and obligations of the parties, as described in note 38I. Judgement isrequired in determining this classification through an evaluation of the facts and circumstances arising from each individual arrangement. When a joint arrangementhas been structured through a separate vehicle, consideration has been given to the legal form of the separate vehicle, the terms of the contractual arrangementand, when relevant, other facts and circumstances. When the activities of an arrangement are primarily designed for the provision of output to the parties and, theparties are substantially the only source of cash flows contributing to the continuity of the operations of the arrangement, this indicates that the parties to thearrangement have rights to the assets and obligations for the liabilities. Certain joint arrangements that are structured through separate vehicles including Collahuasi,Debswana and Namdeb Holdings are accounted for as joint operations. These arrangements are primarily designed for the provision of output to the parties sharingjoint control, indicating that the parties have rights to substantially all the economic benefits of the assets. The liabilities of the arrangements are in substancesatisfied by cash flows received from the parties; this dependence indicates that the parties effectively have obligations for the liabilities. It is primarily these facts andcircumstances that give rise to the classification as joint operations.
FINANCIAL STATEMENTS AND OTHER FINANCIAL INFORMATION NOTES TO THE FINANCIAL STATEMENTS
GROUP STRUCTURE
34. BASIS OF CONSOLIDATION continued
Anglo American plc Integrated Annual Report 2019 195

35. RELATED UNDERTAKINGS OF THE GROUP
The Group consists of the Parent Company, Anglo American plc, incorporated in the United Kingdom and its subsidiaries, joint operations, joint ventures andassociates. In accordance with Section 409 of the Companies Act 2006 a full list of related undertakings, the country of incorporation and the effectivepercentage of equity owned as at 31 December 2019 is disclosed below. Unless otherwise disclosed all entities with an indirect equity holding of greater than51% are considered subsidiary undertakings. See note 34 for the Group’s principal subsidiaries, joint operations, joint ventures and associates.
As disclosed in the Group’s published tax strategy, the Group does not use tax haven jurisdictions to manage taxes. There remain a small number of undertakingsin the Group which are registered in tax haven jurisdictions. These are the result of legacy undertakings and are overridden by the Group’s policy of having them beeither resident in the UK for tax purposes or subject to the UK Controlled Foreign Company Rules. The Group is well advanced in our strategy to remove theselegacy undertakings from tax haven jurisdictions. Where the tax residency of a related undertaking is different from its country of incorporation, this is referenced inthe notes to the list below.
Country ofincorporation(1)(2) Name of undertaking
Percentageof equityowned(3) Registered address
See page 204 for footnotes.
Angola De Beers Angola Holdings SARL 85% Rua Rainha Ginga 87 9º andar Luanda, República de Angola, CaixaPostal 4031
Anguilla Carbones del Cerrejon Limited(4) 33% Babrow’s Commercial Complex,1341, The ValleyArgentina Minera Anglo American Argentina S.A. 100% Olegario V. Andrade 236 Mendoza 5500Australia Anglo American Australia Finance Limited 100% Level 11, 201 Charlotte Street, Brisbane QLD 4000Australia Anglo American Australia Holdings Pty Limited 100% Level 11, 201 Charlotte Street, Brisbane QLD 4000Australia Anglo American Australia Limited 100% Level 11, 201 Charlotte Street, Brisbane QLD 4000Australia Anglo American Exploration (Australia) Pty Limited 100% Level 11, 201 Charlotte Street, Brisbane QLD 4000Australia Anglo American Metallurgical Coal Assets Eastern Australia
Limited100% Level 11, 201 Charlotte Street, Brisbane QLD 4000
Australia Anglo American Metallurgical Coal Assets Pty Ltd 100% Level 11, 201 Charlotte Street, Brisbane QLD 4000Australia Anglo American Metallurgical Coal Finance Limited 100% Level 11, 201 Charlotte Street, Brisbane QLD 4000Australia Anglo American Metallurgical Coal Holdings Limited 100% Level 11, 201 Charlotte Street, Brisbane QLD 4000Australia Anglo American Metallurgical Coal Pty Ltd 100% Level 11, 201 Charlotte Street, Brisbane QLD 4000Australia Anglo American Thermal Coal (Australia) Pty. Ltd. 100% Level 11, 201 Charlotte Street, Brisbane QLD 4000Australia Anglo Coal (Archveyor Management) Pty Ltd 100% Level 11, 201 Charlotte Street, Brisbane QLD 4000Australia Anglo Coal (Capcoal Management) Pty Limited 100% Level 11, 201 Charlotte Street, Brisbane QLD 4000Australia Anglo Coal (Dawson Management) Pty Ltd 100% Level 11, 201 Charlotte Street, Brisbane QLD 4000Australia Anglo Coal (Dawson Services) Pty Ltd 100% Level 11, 201 Charlotte Street, Brisbane QLD 4000Australia Anglo Coal (Dawson South Management) Pty Ltd 100% Level 11, 201 Charlotte Street, Brisbane QLD 4000Australia Anglo Coal (Dawson South) Pty Ltd 100% Level 11, 201 Charlotte Street, Brisbane QLD 4000Australia Anglo Coal (Dawson) Holdings Pty Ltd 100% Level 11, 201 Charlotte Street, Brisbane QLD 4000Australia Anglo Coal (Dawson) Limited 100% Level 11, 201 Charlotte Street, Brisbane QLD 4000Australia Anglo Coal (German Creek) Pty Ltd 100% Level 11, 201 Charlotte Street, Brisbane QLD 4000Australia Anglo Coal (Grasstree Management) Pty Limited 100% Level 11, 201 Charlotte Street, Brisbane QLD 4000Australia Anglo Coal (Grosvenor Management) Pty Ltd 100% Level 11, 201 Charlotte Street, Brisbane QLD 4000Australia Anglo Coal (Grosvenor) Pty Ltd 100% Level 11, 201 Charlotte Street, Brisbane QLD 4000Australia Anglo Coal (Jellinbah) Holdings Pty Ltd 100% Level 11, 201 Charlotte Street, Brisbane QLD 4000Australia Anglo Coal (Moranbah North Management) Pty Limited 100% Level 11, 201 Charlotte Street, Brisbane QLD 4000Australia Anglo Coal (Roper Creek) Pty Ltd 100% Level 11, 201 Charlotte Street, Brisbane QLD 4000Australia Anglo Coal (Theodore South) Pty Ltd 100% Level 11, 201 Charlotte Street, Brisbane QLD 4000Australia Anglo Operations (Australia) Pty Ltd 100% Level 11, 201 Charlotte Street, Brisbane QLD 4000Australia Bowen Basin Coal Pty. Ltd. 23% Level 7, 12 Creek Street, Brisbane QLD 4000Australia Dalrymple Bay Coal Terminal Pty. Ltd. 25% Martin Armstrong Drive, Hay Point QLD 4740Australia Dawson Coal Processing Pty Ltd 100% Level 11, 201 Charlotte Street, Brisbane QLD 4000Australia Dawson Highwall Mining Pty Ltd 100% Level 11, 201 Charlotte Street, Brisbane QLD 4000Australia Dawson Sales Pty Ltd 51% Level 11, 201 Charlotte Street, Brisbane QLD 4000Australia Dawson South Sales Pty Ltd 51% Level 11, 201 Charlotte Street, Brisbane QLD 4000Australia De Beers Australia Exploration Limited 85% 23 North Street, Mount Lawley, WA 6050Australia German Creek Coal Pty. Limited 70% Level 11, 201 Charlotte Street, Brisbane QLD 4000Australia Groote Eylandt Mining Company Proprietary Limited 40% Level 35, 108 St Georges Terrace, Perth WA 6000Australia Jellinbah Group Pty Ltd 33% Level 7, 12 Creek Street, Brisbane QLD 4000Australia Jellinbah Mining Pty Ltd 33% Level 7, 12 Creek Street, Brisbane QLD 4000Australia Jellinbah Resources Pty Ltd 33% Level 7, 12 Creek Street, Brisbane QLD 4000Australia Jena Pty. Limited 100% Level 11, 201 Charlotte Street, Brisbane QLD 4000Australia Jena Unit Trust 100% Level 11, 201 Charlotte Street, Brisbane QLD 4000Australia JG Land Company Pty Ltd 23% Level 7, 12 Creek Street, Brisbane QLD 4000Australia Lake Vermont Marketing Pty Ltd 33% Level 7, 12 Creek Street, Brisbane QLD 4000Australia Lake Vermont Resources Pty Ltd 33% Level 7, 12 Creek Street, Brisbane QLD 4000Australia Monash Energy Coal Limited 100% Level 11, 201 Charlotte Street, Brisbane QLD 4000Australia Moranbah North Coal (No2) Pty Ltd 100% Level 11, 201 Charlotte Street, Brisbane QLD 4000Australia Moranbah North Coal (Sales) Pty Ltd 88% Level 11, 201 Charlotte Street, Brisbane QLD 4000
FINANCIAL STATEMENTS AND OTHER FINANCIAL INFORMATION NOTES TO THE FINANCIAL STATEMENTS
GROUP STRUCTURE
196 Anglo American plc Integrated Annual Report 2019

Country ofincorporation(1)(2) Name of undertaking
Percentageof equityowned(3) Registered address
See page 204 for footnotes.
Australia Moranbah North Coal Pty Ltd 100% Level 11, 201 Charlotte Street, Brisbane QLD 4000Australia QCMM (Lake Vermont Holdings) Pty Ltd 33% Level 7, 12 Creek Street, Brisbane QLD 4000Australia QCMM Finance Pty Ltd 33% Level 7, 12 Creek Street, Brisbane QLD 4000Australia Tasmanian Electro Metallurgical Company Proprietary Limited 40% Level 35, 108 St Georges Terrace, Perth WA 6000Australia Tremell Pty. Ltd. 33% Level 7, 12 Creek Street, Brisbane QLD 4000Belgium De Beers Auction Sales Belgium NV 85% 21 Schupstraat, 2018 AntwerpBelgium International Institute of Diamond Grading and Research
(Belgium) NV85% 21 Schupstraat, 2018 Antwerp
Bermuda Coromin Insurance Limited 100% Clarendon House, 2 Church Street, HamiltonBermuda Holdac Insurance Limited 100% Clarendon House, 2 Church Street, HamiltonBotswana Ambase Prospecting (Botswana) (Pty) Ltd 100% Unit G3, Victoria House, Plot 132 Independence Avenue, GaboroneBotswana Anglo American Corporation Botswana (Services) Limited 100% Plot 67977, Fairground Office Park, GaboroneBotswana Anglo Coal Botswana (Pty) Ltd 100% c/o KPMG, Chartered Accountants, Plot 67977, Off Tlokweng
Road, Fairground, P O Box 1519, GaboroneBotswana Broadhurst Primary School (Pty) Ltd 76% First Floor Debswana Corporate Centre, Plot 64288 Airport Road,
Block 8, GaboroneBotswana De Beers Global Sightholder Sales (Pty) Ltd 85% 3rd Floor, DTCB Building, Plot 63016, Block 8, Airport Road,
GaboroneBotswana De Beers Holdings Botswana (Pty) Ltd 85% 5th Floor, Debswana House, Main Mall, GaboroneBotswana Debswana Diamond Company (Pty) Ltd(5) 43% First Floor, Debswana Corporate Centre, Plot 64288 Airport Road,
Block 8, GaboroneBotswana Debswana Wellness Fund 43% First Floor, Debswana Corporate Centre, Plot 64288 Airport Road,
Block 8, GaboroneBotswana Diamond Trading Company Botswana (Pty) Ltd 43% Plot 63016, Airport Road, Block 8, GaboroneBotswana Sesiro Insurance Company (Pty) Ltd 43% First Floor Debswana Corporate Centre, Plot 64288 Airport Road,
Block 8, GaboroneBotswana The Diamond Trust 21% Debswana House, The Mall, GaboroneBotswana Tokafala (Proprietary) Limited 57% Floor, DTCB Building, Plot 63016, Block 8, Airport Road, GaboroneBrazil Anglo American Investimentos - Minério de Ferro Ltda. 100% Rua Maria Luiza Santiago, nº 200, 16º andar, sala 1603, bairro
Santa Lúcia, CEP 30360-740, Belo Horizonte, Minas GeraisBrazil Anglo American Minério de Ferro Brasil S.A 100% Rua Maria Luiza Santiago, nº 200, 16º andar, sala 1601, bairro
Santa Lucia, CEP 30360-740, Belo Horizonte, Minas GeraisBrazil Anglo American Niquel Brasil Ltda. 100% Rua Maria Luiza Santiago, nº. 200, 8º andar (parte), Santa Lúcia,
CEP 30360-740, Belo Horizonte, Minas GeraisBrazil Anglo American Participações - Minério de Ferro Ltda. 100% Rua Maria Luiza Santiago, nº 200, 16º andar, sala 1602, Bairro
Santa Lúcia, CEP 30.360-740, Belo Horizonte, Minas GeraisBrazil Anglo Ferrous Brazil Participações S.A. 100% Rua Maria Luiza Santiago, nº 200, 16º andar (parte), bairro Santa
Lúcia, CEP 30360-740, Belo Horizonte, Minas GeraisBrazil Câmara de Comércio Brasil República Sul Africana 100% Av. Paulista, nº. 2.300, 10º andar, Cerqueira César, São Paulo/SPBrazil Element Six Ltda. 51% Rua da Consolação, 368, 15º andar Consolação, São PauloBrazil Ferroport Logística Comercial Exportadora S.A. 50% Rua da Passagem, nº 123, 11º andar, sala 1101, Botafogo, CEP
22290-030, Rio de Janeiro/RJBrazil GD Empreendimentos Imobiliários S.A. 33% Rua Visconde de Ouro Preto, nº 5, 11º andar (parte), Botafogo, Rio
de Janeiro/RJBrazil Guaporé Mineração Ltda. 49% Avenida Paulista, nº. 2.300, 10º andar (parte), CEP 01.310-300,
São Paulo/SPBrazil Instituto Anglo American Brasil 100% Avenida Paulista, nº. 2.300, 10º andar (parte), CEP 01.310-300,
São Paulo/SPBrazil Mineração Tanagra Ltda. 49% Rua Maria Luiza Santiago, nº. 200, 20º andar (parte), bairro Santa
Lúcia, CEP 30.360-740, Belo Horizonte, Minas GeraisBrazil Mineração Tariana Ltda. 100% Rua Maria Luiza Santiago, nº 200, 16º andar (parte), bairro Santa
Lúcia, CEP 30360-740, Belo Horizonte, Minas GeraisBritish Virgin
IslandsDe Beers Angola Investments Limited 85% Craigmuir Chambers, Road Town, Tortola, VG1110
British VirginIslands
De Beers Angola Prospecting Pty Ltd 85% Craigmuir Chambers, Road Town, Tortola, VG1110
British VirginIslands
De Beers Centenary Angola Properties Ltd 85% Craigmuir Chambers, Road Town, Tortola, VG1110
British VirginIslands
Delibes Holdings Limited(6) 85% Craigmuir Chambers, Road Town, Tortola, VG1110
British VirginIslands
Loma de Niquel Holdings Limited(6) 94% Craigmuir Chambers, Road Town, Tortola, VG1110
British VirginIslands
Scallion Limited(6) 85% Craigmuir Chambers, Road Town, Tortola, VG1110
Canada 0912055 B.C. Ltd. 100% c/- McCarthy Tetrault, Suite 2400, 745 Thurlow Street, VancouverBC V6E 0C5
Canada Anglo American Exploration (Canada) Ltd. 100% c/o Anglo American Exploration (Canada) Ltd., Suite 800, 700 WestPender Street, British Columbia, V6C 1G8
FINANCIAL STATEMENTS AND OTHER FINANCIAL INFORMATION NOTES TO THE FINANCIAL STATEMENTS
GROUP STRUCTURE
35. RELATED UNDERTAKINGS OF THE GROUP continued
Anglo American plc Integrated Annual Report 2019 197

Country ofincorporation(1)(2) Name of undertaking
Percentageof equityowned(3) Registered address
See page 204 for footnotes.
Canada Central Ecuador Holdings Ltd. 70% c/o Borden Ladner Gervais, 1200 Waterfront Centre, 200 BurrardStreet, Vancouver, British Columbia, V6C 3L6
Canada De Beers Canada Holdings Inc. 85% 2400-333 Bay St, Toronto ON, M5H2T6Canada De Beers Canada Inc. 85% 2400-333 Bay St, Toronto ON, M5H2T6Canada Lion Battery Technologies Inc. 33% Suite 2600, Three Bentall Centre, 595 Burrard Street, P.O. BOX
49314, Vancouver, BC V7X 1L3Canada Peace River Coal Inc. 100% c/- McCarthy Tetrault, Suite 2400, 745 Thurlow Street, Vancouver
BC V6E 0C5Canada Peregrine Diamonds Ltd 85% 2400-333 Bay St, Toronto ON, M5H2T6Canada Peregrine Exploration Ltd 85% 2400-333 Bay St, Toronto ON, M5H2T6Chile Anglo American Chile Inversiones S.A. 100% Isidora Goyenechea 2800, piso 46, Las Condes, SantiagoChile Anglo American Chile Ltda 100% Isidora Goyenechea 2800, piso 46, Las Condes, SantiagoChile Anglo American Copper Finance SpA 100% Isidora Goyenechea 2800, piso 46, Las Condes, SantiagoChile Anglo American Marketing Chile SpA 100% Isidora Goyenechea 2800, piso 46, Las Condes, SantiagoChile Anglo American Sur S.A. 50% Isidora Goyenechea 2800, piso 46, Las Condes, SantiagoChile Compañía Minera Dona Ines De Collahuasi SCM 44% Avda Andres Bello 2687, P 11 Edif. el Pacifico, Las Condes,
Santiago, Región Metropolitana.Chile Compañía Minera Westwall S.C.M 50% Isidora Goyenechea 2800, piso 46, Las Condes, SantiagoChile Inversiones Anglo American Norte SpA 100% Isidora Goyenechea 2800, piso 46, Las Condes, SantiagoChile Inversiones Anglo American Sur SpA 100% Isidora Goyenechea 2800, piso 46, Las Condes, SantiagoChile Inversiones Minorco Chile SpA 100% Isidora Goyenechea 2800, piso 46, Las Condes, SantiagoChina Anglo American Resources Trading (China) Co. Ltd. 100% Units 01, 02A, 07, 08, Floor 32, No. 1198 Century Avenue, Pudong
New Area, ShanghaiChina De Beers Jewellers Commercial (Shanghai) Co., Ltd 85% Suite 3703, The Park Place, No.1601 Nan Jing West Road,
ShanghaiChina Element Six Hard Materials (Wuxi) Co., Ltd 51% No. 578 Xitai Road, Wuxi New District, Wuxi, JiangsuChina Element Six Trading (Shanghai) Co., Ltd 51% 2802A, Chong Hing Finance Centre, No. 288 Nan Jing Road West,
Huang Pu District, Shanghai, 200003China Forevermark Marketing (Shanghai) Company Limited 85% Suite 4601, 4602 and 4608, The Park Place, No.1601 Nan Jing
West Road, ShanghaiChina Platinum Guild International (Shanghai) Co., Limited 78% Room 601, L’avenue, 99 XianXia Road, Shanghai 200051Colombia Anglo American Colombia Exploration S.A. 100% Avenida Carrera 9a # 115 – 06/30 Oficina 1702, BogotáColombia Cerrejon Zona Norte S.A. 33% Calle 100 No. 19-54, Piso 12, BogotáCyprus Anglo American Amcoll (UK) Ltd(6) 100% 1, Lampousas Street, Nicosia, 1095Cyprus Anglo American Chile Investments (UK) Ltd(6) 100% 1, Lampousas Street, Nicosia, 1095Cyprus Anglo American Clarent (UK) Ltd(6) 100% 1, Lampousas Street, Nicosia, 1095Democratic
Republic ofCongo
Ambase Exploration Africa (DRC) SPRL 100% No. 510 LP, Avenue Sumahili, Quartier Golf, Commune DeLubumbashi, Lubumbashi
Ecuador Anglo American Ecuador S.A. 100% Av. Patria E4-69 y Av. Amazonas, Cofiec,16th FloorEcuador Central Ecuador EC-CT S.A. 70% Av. Patria E4-69 y Av. Amazonas, Edif.Cofiec, piso 17, QuitoFinland AA Sakatti Mining Oy 100% AA Sakatti Mining Oy, Tuohiaavantie 2, 99600, SodankyläGabon Samancor Gabon SA 40% Immeuble 2 AG, Libreville, 4660Germany Element Six GmbH 51% Staedeweg 18, 36151, BurghaunHong Kong De Beers Auction Sales Holdings Limited 85% Unit 1001,10/F Unicorn Trade Centre, 127-131 Des Voeux Road
CentralHong Kong De Beers Jewellers (Hong Kong) Limited 85% RM 02B&03-06 26/F, Kinwick Centre, 32 Holly Wood Road CentralHong Kong Forevermark Limited 85% RM 02B&03-06 26/F, Kinwick Centre, 32 Holly Wood Road CentralHong Kong Platinum Guild International (Hong Kong) Limited 78% Suites 2901-2, Global Trade Square, No.21 Wong Chuk Hang RoadIndia Anglo American Services (India) Private Limited 100% A-1/292, Janakpuri, New Delhi - 110058India De Beers India Private Ltd 85% 601, 6th floor, TCG Financial Centre, C -53, G Block, Bandra Kurla
Complex, Bandrar (East), Mumbai - 400 058India Forevermark Diamonds Private Limited 85% 601, 6th floor, TCG Financial Centre, C -53, G Block, Bandra Kurla
Complex, Bandrar (East), Mumbai - 400 058India Hindustan Diamond Company Private Limited 43% Office No. 12, 14th Floor, Navjivan Society Building, No.3,
Lamington Road, Mumbai - 400 008India International Institute of Diamond Grading & Research India
Private Limited85% 601, 6th floor, TCG Financial Centre, C -53, G Block, Bandra Kurla
Complex, Bandrar (East), Mumbai - 400 058India Platinum Guild India Private Limited 78% Notan Classic, 3rd Floor, 114 Turner Road, Bandra West, Mumbai
400 050Indonesia PT Anglo American Indonesia 100% Pondok Indah Office Tower 3, 17th Floor, Jl. Sultan Iskandar Muda,
Pondok Indah, Jakarta 12310Indonesia PT Minorco Services Indonesia 100% Belagri Hotel, Jl. Raja Ampat, No 1 Kampung Baru, Sorong, Papua
BaratIreland CMC-Coal Marketing Designated Activity Company 33% Fumbally Square, New Street, Dublin 8, D08 XYA5Ireland Coromin Insurance (Ireland) DAC 100% Fourth Floor, 25/28 Adelaide Road, Dublin
FINANCIAL STATEMENTS AND OTHER FINANCIAL INFORMATION NOTES TO THE FINANCIAL STATEMENTS
GROUP STRUCTURE
35. RELATED UNDERTAKINGS OF THE GROUP continued
198 Anglo American plc Integrated Annual Report 2019

Country ofincorporation(1)(2) Name of undertaking
Percentageof equityowned(3) Registered address
See page 204 for footnotes.
Ireland Element Six (Holdings) Limited 51% Shannon Airport, Shannon, Co.ClareIreland Element Six (Trade Marks) Limited 51% Shannon Airport, Shannon, Co.ClareIreland Element Six Abrasives Treasury Limited 51% Shannon Airport, Shannon, Co.ClareIreland Element Six Limited 51% Shannon Airport, Shannon, Co.ClareIreland Element Six Treasury Limited 85% Shannon Airport, Shannon, Co.ClareIsle of Man Element Six (Isle of Man) Corporate Trustee Limited 85% 1st Floor, 18-20 North Quay, Douglas, IM1 4LEIsle of Man Element Six (Legacy Pensions) Limited 85% 1st Floor, 18-20 North Quay, Douglas, IM1 4LEIsrael De Beers Auction Sales Israel Ltd 85% 11th Floor, Yahalom (Diamond) Building, 21 Tuval Street Ramat Gan
5252236Italy Forevermark Italy S.R.L. 85% Via Burlamacchi Francesco 14, 20135, MilanJapan De Beers Jewellers Japan K.K. 85% New Otani Garden Court 7th Floor, 4-1 Kioi-cho, Chiyoda-ku, TokyoJapan Element Six Limited 51% 9F PMO Hatchobori, 3-22-13 Hatchobori, Chuo-ku, Tokyo, 104Japan Forevermark KK 85% New Otani Garden Court, 7th Floor, 4-1 Kioi-cho, Chiyoda-ku,
TokyoJapan PGI KK 78% Imperial Hotel Tower 17F, 1-1-1 Uchisaiwai-cho, Chiyoda-ku, Tokyo,
100-8575Jersey A.R.H. Investments Limited(6) 100% 3rd Floor, 44 Esplanade, St Helier, JE4 9WGJersey A.R.H. Limited(6) 100% 3rd Floor, 44 Esplanade, St Helier, JE4 9WGJersey Ambras Holdings Limited(6)(7) 100% 3rd Floor, 44 Esplanade, St Helier, JE4 9WGJersey Ammin Coal Holdings Limited(6) 100% 3rd Floor, 44 Esplanade, St Helier, JE4 9WGJersey Anglo African Exploration Holdings Limited(6) 100% 3rd Floor, 44 Esplanade, St Helier, JE4 9WGJersey Anglo American Buttercup Company Limited(6) 100% 3rd Floor, 44 Esplanade, St Helier, JE4 9WGJersey Anglo American Capital Overseas Limited(6) 100% 3rd Floor, 44 Esplanade, St Helier, JE4 9WGJersey Anglo American Corporation de Chile Holdings Limited(6) 100% 3rd Floor, 44 Esplanade, St Helier, JE4 9WGJersey Anglo American Exploration Colombia Limited(6) 100% 3rd Floor, 44 Esplanade, St Helier, JE4 9WGJersey Anglo American Exploration Overseas Holdings Limited(6) 100% 3rd Floor, 44 Esplanade, St Helier, JE4 9WGJersey Anglo American Finland Holdings 1 Limited(6) 100% 3rd Floor, 44 Esplanade, St Helier, JE4 9WGJersey Anglo American Finland Holdings 2 Limited(6) 100% 3rd Floor, 44 Esplanade, St Helier, JE4 9WGJersey Anglo American Hermitage Limited(6) 100% 3rd Floor, 44 Esplanade, St Helier, JE4 9WGJersey Anglo American Liberia Holdings Limited(6) 100% 3rd Floor, 44 Esplanade, St Helier, JE4 9WGJersey Anglo American Midway Investment Limited(6) 100% 3rd Floor, 44 Esplanade, St Helier, JE4 9WGJersey Anglo American Overseas Limited(6)(8) 100% 3rd Floor, 44 Esplanade, St Helier, JE4 9WGJersey Anglo Australia Investments Limited(6) 100% 3rd Floor, 44 Esplanade, St Helier, JE4 9WGJersey Anglo Diamond Investments Limited(6) 100% 3rd Floor, 44 Esplanade, St Helier, JE4 9WGJersey Anglo Iron Ore Investments Limited(6) 100% 3rd Floor, 44 Esplanade, St Helier, JE4 9WGJersey Anglo Loma Investments Limited(6) 100% 3rd Floor, 44 Esplanade, St Helier, JE4 9WGJersey Anglo Operations (International) Limited(6) 100% 3rd Floor, 44 Esplanade, St Helier, JE4 9WGJersey Anglo Peru Investments Limited(6) 100% 3rd Floor, 44 Esplanade, St Helier, JE4 9WGJersey Anglo Quellaveco Limited(6) 100% 3rd Floor, 44 Esplanade, St Helier, JE4 9WGJersey Anglo South American Investments Limited(6) 100% 3rd Floor, 44 Esplanade, St Helier, JE4 9WGJersey Anglo Venezuela Investments Limited(6) 100% 3rd Floor, 44 Esplanade, St Helier, JE4 9WGJersey Aval Holdings Limited(6) 100% 3rd Floor, 44 Esplanade, St Helier, JE4 9WGJersey Cheviot Holdings Limited(6) 85% 3rd Floor, 44 Esplanade, St Helier, JE4 9WGJersey De Beers Centenary Limited(6) 85% 3rd Floor, 44 Esplanade, St Helier, JE4 9WGJersey De Beers Exploration Holdings Limited(6) 85% 3rd Floor, 44 Esplanade, St Helier, JE4 9WGJersey De Beers Holdings Investments Limited(6) 85% 3rd Floor, 44 Esplanade, St Helier, JE4 9WGJersey De Beers Investments plc(6) 85% 3rd Floor, 44 Esplanade, St Helier, JE4 9WGJersey De Beers plc(6) 85% 3rd Floor, 44 Esplanade, St Helier, JE4 9WGJersey Highbirch Limited(6) 100% 3rd Floor, 44 Esplanade, St Helier, JE4 9WGJersey Inglewood Holdings Limited(6) 100% 3rd Floor, 44 Esplanade, St Helier, JE4 9WGJersey Kumba International Trading Limited(6) 53% 3rd Floor, 44 Esplanade, St Helier, JE4 9WGJersey Minorco Overseas Holdings Limited(6) 100% 3rd Floor, 44 Esplanade, St Helier, JE4 9WGJersey Minorco Peru Holdings Limited(6) 100% 3rd Floor, 44 Esplanade, St Helier, JE4 9WGJersey Minpress Investments Limited(6) 100% 3rd Floor, 44 Esplanade, St Helier, JE4 9WGLuxembourg Kumba Iron Ore Holdings Sarl 53% 58 rue Charles Martel, L-2134Macau De Beers Jewellers (Macau) Company Limited 85% Avenida da Praia Grande No. 409, China Law Building 16/F – B79Madagascar Societe Civille De Prospection De Nickel A Madagascar 32% 44 Main Street, Johannesburg, 2001Mauritius Anglo American International Limited(6) 100% c/o AXIS Fiduciary Ltd, 2nd Floor, The AXIS, 26 Bank Street,
Cybercity Ebene, 72201Mexico Anglo American Mexico S.A. de C.V. 100% c/o Sanchez Mejorada, Velasco y Ribe, S.C. Paseo de la Reforma
No. 450, Col. Lomas de Chapultepec, 11000Mexico Servicios Anglo American Mexico S.A. de C.V. 100% c/o Sanchez Mejorada, Velasco y Ribe, S.C. Paseo de la Reforma
No. 450, Col. Lomas de Chapultepec, 11000
FINANCIAL STATEMENTS AND OTHER FINANCIAL INFORMATION NOTES TO THE FINANCIAL STATEMENTS
GROUP STRUCTURE
35. RELATED UNDERTAKINGS OF THE GROUP continued
Anglo American plc Integrated Annual Report 2019 199

Country ofincorporation(1)(2) Name of undertaking
Percentageof equityowned(3) Registered address
See page 204 for footnotes.
Mozambique Anglo American Corporation Mocambique Servicos Limitada 100% PricewaterhouseCoopers, Ltda. Avenida Vladimir Lenine, No 174,4o andar, Edifício Millennium Park Maputo
Namibia Ambase Prospecting (Namibia) (Pty) Ltd 100% 24 Orban Street, Klein Windhoek, Windhoek, P O Box 30 WindhoekNamibia De Beers Marine Namibia (Pty) Ltd 43% 4th Floor, Namdeb Centre, 10 Dr Frans, Indongo Street, WindhoekNamibia De Beers Namibia Holdings (Pty) Ltd 85% 6th floor, Namdeb Centre, 10 Dr Frans, Indongo Street, WindhoekNamibia Debmarine Namdeb Foundation 43% 10th Floor, Namdeb Centre, 10 Dr Frans Indongo Street, WindhoekNamibia DTC Valuations Namibia (Pty) Ltd 85% 4th Floor, Namdeb Centre, 10 Dr Frans, Indongo Street, WindhoekNamibia Exclusive Properties (Pty) Ltd 43% 10th Floor, Namdeb Centre, 10 Dr Frans Indongo Street, WindhoekNamibia Longboat Trading (Pty) Ltd 100% 24 Orban Street, Klein Windhoek, WindhoekNamibia Mamora Mines & Estates Limited 28% 10th Floor, Namdeb Centre, 10 Dr Frans Indongo Street, WindhoekNamibia Namdeb Diamond Corporation (Pty) Ltd 43% 10th Floor, Namdeb Centre, 10 Dr Frans Indongo Street, WindhoekNamibia Namdeb Holdings (Pty) Ltd 43% 10th Floor, Namdeb Centre, 10 Dr Frans Indongo Street, WindhoekNamibia Namdeb Properties (Pty) Ltd 43% 10th Floor, Namdeb Centre, 10 Dr Frans Indongo Street, WindhoekNamibia Namibia Diamond Trading Company (Pty) Ltd 43% 9th Floor, Namdeb Centre, 10 Dr Frans Indongo Street, WindhoekNamibia Oranjemund Private Hospital (Proprietary) Limited 43% 10th Floor, Namdeb Centre, 10 Dr Frans Indongo Street, WindhoekNamibia Oranjemund Town Management Company (Pty) Ltd 43% 10th Floor, Namdeb Centre, 10 Dr Frans Indongo Street, WindhoekNamibia Namdeb Hospital Pharmacy (Pty) Ltd 43% 10th Floor, Namdeb Centre, 10 Dr Frans Indongo Street, WindhoekNetherlands Anglo American (TIH) B.V.(6) 100% 20 Carlton House Terrace, London, SW1Y 5ANNetherlands Anglo American Exploration B.V.(6) 100% 20 Carlton House Terrace, London, SW1Y 5ANNetherlands Anglo American Exploration (Philippines) B.V.(6) 100% 20 Carlton House Terrace, London, SW1Y 5ANNetherlands Anglo American International B.V.(6) 100% 20 Carlton House Terrace, London, SW1Y 5ANNetherlands Anglo American Netherlands B.V.(6) 100% 20 Carlton House Terrace, London, SW1Y 5ANNetherlands Anglo Operations (Netherlands) B.V.(6) 100% 20 Carlton House Terrace, London, SW1Y 5ANNetherlands Element Six N.V. 85% De Nieuwe Erven 2, 5431 NT, CuijkNetherlands Erabas B.V(6) 78% 20 Carlton House Terrace, London, SW1Y 5ANNetherlands Loma de Niquel Holdings B.V.(6) 100% 20 Carlton House Terrace, London, SW1Y 5ANNetherlands Minorco Exploration (Indonesia) B.V.(6) 100% 20 Carlton House Terrace, London, SW1Y 5ANPapua New
GuineaAnglo American (Star Mountain) Limited 100% c/- Allens, Level 6, Mogoru Moto Building, Champion Parade, PORT
MORESBY, National Capital DistrictPapua New
GuineaAnglo American Exploration (PNG) Limited 100% c/- PricewaterhouseCoopers PNG, Pwc Haus, Level 6, Harbour
City, Konedobu, PORT Moresby, National Capital District 121Peru Anglo American Peru S.A. 100% Calle Esquilache 371, Piso 10, San Isidro, Lima 27Peru Anglo American Quellaveco S.A. 60% Calle Esquilache 371, Piso 10, San Isidro, Lima 27Peru Anglo American Servicios Perú S.A. 100% Calle Esquilache 371, Piso 10 San Isidro, Lima 27Peru Asociación Michiquillay 100% Calle Esquilache 371, Piso 10 San Isidro, Lima 27Peru Asociación Quellaveco 100% Calle Esquilache 371, Piso 10 San Isidro, Lima 27Peru Cobre del Norte S.A. 100% Calle Esquilache 371, Piso 10, San Isidro, Lima 27Philippines Anglo American Exploration (Philippines) Inc. 100% 27th Floor, Tower 2, The Enterprise Centre, 6766 Ayala Avenue
Corner, Paseo de Roxas, Makati CityRepublic of
NorthMacedonia
Anglo American Exploration West Tetyan Skopje 100% Orce Nikolov St., No. 98, Skopje-Center
Sierra Leone Gemfair (SL) Limited 85% 31 Lightfoot Boston Street, FreetownSingapore Anglo American Exploration (Singapore) Pte. Ltd 100% 10 Collyer Quey, #38-00 Ocean Financial Centre, 049315Singapore Anglo American Shipping Pte. Limited 100% 10 Collyer Quay, Level 38 Ocean Financial Centre, 049315Singapore De Beers Auction Sales Singapore Pte. Ltd. 85% 10 Collyer Quey, #03-04 Ocean Financial Centre, 049315Singapore Kumba Singapore Pte. Ltd. 53% 10 Collyer Quey, #38-00 Ocean Financial Centre, 049315Singapore MR Iron Ore Marketing Services Pte. Ltd. 50% 10 Collyer Quey, #38-00 Ocean Financial Centre, 049315Singapore Samancor Marketing Pte. Ltd. 40% 138 Market Street, #26-01, Capitagreen, 048946South Africa AEF Mining Services (Pty) Ltd 25% Zommerlust Building, Rietbok Road, Kathu, Northern Cape, 8446South Africa African Pipe Industries North (Pty) Ltd 39% 55 Marshall Street, Johannesburg, 2001South Africa Almenta 127 (Pty) Ltd 100% 44 Main Street, Johannesburg, 2001South Africa Amaprop Townships Ltd 100% 61 Katherine Street, Sandton, 2196South Africa Ambase Investment Africa (Botswana) (Pty) Ltd 100% 44 Main Street, Johannesburg, 2001South Africa Ambase Investment Africa (DRC) (Pty) Ltd 100% 44 Main Street, Johannesburg, 2001South Africa Ambase Investment Africa (Namibia) (Pty) Ltd 100% 44 Main Street, Johannesburg, 2001South Africa Ambase Investment Africa (Tanzania) (Pty) Ltd 100% 44 Main Street, Johannesburg, 2001South Africa Ambase Investment Africa (Zambia) (Pty) Ltd 100% 44 Main Street, Johannesburg, 2001South Africa Anglo American Corporation of South Africa (Pty) Ltd 100% 44 Main Street, Johannesburg, 2001South Africa Anglo American EMEA Shared Services (Pty) Ltd 100% 44 Main Street, Johannesburg, 2001South Africa Anglo American Farms (Pty) Ltd 100% Vergelegen Wine Farm, Lourensford Road, Somerset West, 7130South Africa Anglo American Farms Investment Holdings (Pty) Ltd 100% Vergelegen Wine Farm, Lourensford Road, Somerset West, 7130South Africa Anglo American Group Employee Shareholder Nominees
(Pty) Ltd100% 44 Main Street, Johannesburg, 2001
FINANCIAL STATEMENTS AND OTHER FINANCIAL INFORMATION NOTES TO THE FINANCIAL STATEMENTS
GROUP STRUCTURE
35. RELATED UNDERTAKINGS OF THE GROUP continued
200 Anglo American plc Integrated Annual Report 2019
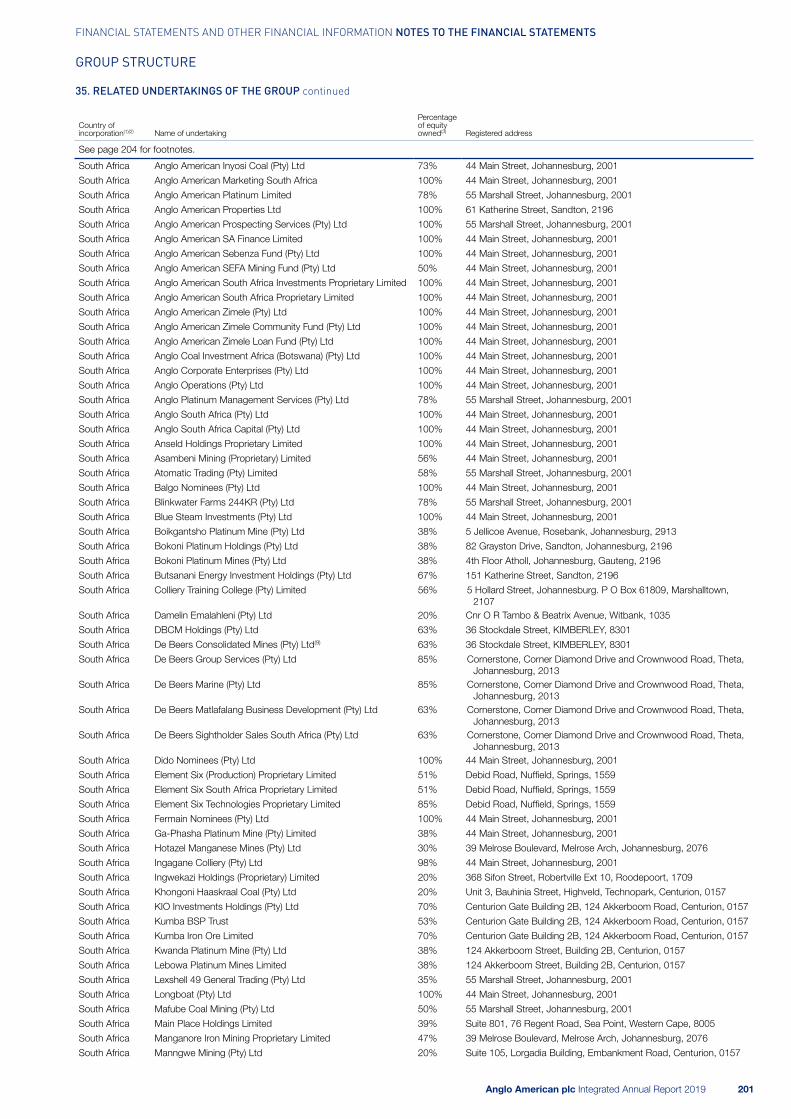
Country ofincorporation(1)(2) Name of undertaking
Percentageof equityowned(3) Registered address
See page 204 for footnotes.
South Africa Anglo American Inyosi Coal (Pty) Ltd 73% 44 Main Street, Johannesburg, 2001South Africa Anglo American Marketing South Africa 100% 44 Main Street, Johannesburg, 2001South Africa Anglo American Platinum Limited 78% 55 Marshall Street, Johannesburg, 2001South Africa Anglo American Properties Ltd 100% 61 Katherine Street, Sandton, 2196South Africa Anglo American Prospecting Services (Pty) Ltd 100% 55 Marshall Street, Johannesburg, 2001South Africa Anglo American SA Finance Limited 100% 44 Main Street, Johannesburg, 2001South Africa Anglo American Sebenza Fund (Pty) Ltd 100% 44 Main Street, Johannesburg, 2001South Africa Anglo American SEFA Mining Fund (Pty) Ltd 50% 44 Main Street, Johannesburg, 2001South Africa Anglo American South Africa Investments Proprietary Limited 100% 44 Main Street, Johannesburg, 2001South Africa Anglo American South Africa Proprietary Limited 100% 44 Main Street, Johannesburg, 2001South Africa Anglo American Zimele (Pty) Ltd 100% 44 Main Street, Johannesburg, 2001South Africa Anglo American Zimele Community Fund (Pty) Ltd 100% 44 Main Street, Johannesburg, 2001South Africa Anglo American Zimele Loan Fund (Pty) Ltd 100% 44 Main Street, Johannesburg, 2001South Africa Anglo Coal Investment Africa (Botswana) (Pty) Ltd 100% 44 Main Street, Johannesburg, 2001South Africa Anglo Corporate Enterprises (Pty) Ltd 100% 44 Main Street, Johannesburg, 2001South Africa Anglo Operations (Pty) Ltd 100% 44 Main Street, Johannesburg, 2001South Africa Anglo Platinum Management Services (Pty) Ltd 78% 55 Marshall Street, Johannesburg, 2001South Africa Anglo South Africa (Pty) Ltd 100% 44 Main Street, Johannesburg, 2001South Africa Anglo South Africa Capital (Pty) Ltd 100% 44 Main Street, Johannesburg, 2001South Africa Anseld Holdings Proprietary Limited 100% 44 Main Street, Johannesburg, 2001South Africa Asambeni Mining (Proprietary) Limited 56% 44 Main Street, Johannesburg, 2001South Africa Atomatic Trading (Pty) Limited 58% 55 Marshall Street, Johannesburg, 2001South Africa Balgo Nominees (Pty) Ltd 100% 44 Main Street, Johannesburg, 2001South Africa Blinkwater Farms 244KR (Pty) Ltd 78% 55 Marshall Street, Johannesburg, 2001South Africa Blue Steam Investments (Pty) Ltd 100% 44 Main Street, Johannesburg, 2001South Africa Boikgantsho Platinum Mine (Pty) Ltd 38% 5 Jellicoe Avenue, Rosebank, Johannesburg, 2913South Africa Bokoni Platinum Holdings (Pty) Ltd 38% 82 Grayston Drive, Sandton, Johannesburg, 2196South Africa Bokoni Platinum Mines (Pty) Ltd 38% 4th Floor Atholl, Johannesburg, Gauteng, 2196South Africa Butsanani Energy Investment Holdings (Pty) Ltd 67% 151 Katherine Street, Sandton, 2196South Africa Colliery Training College (Pty) Limited 56% 5 Hollard Street, Johannesburg. P O Box 61809, Marshalltown,
2107South Africa Damelin Emalahleni (Pty) Ltd 20% Cnr O R Tambo & Beatrix Avenue, Witbank, 1035South Africa DBCM Holdings (Pty) Ltd 63% 36 Stockdale Street, KIMBERLEY, 8301South Africa De Beers Consolidated Mines (Pty) Ltd(9) 63% 36 Stockdale Street, KIMBERLEY, 8301South Africa De Beers Group Services (Pty) Ltd 85% Cornerstone, Corner Diamond Drive and Crownwood Road, Theta,
Johannesburg, 2013South Africa De Beers Marine (Pty) Ltd 85% Cornerstone, Corner Diamond Drive and Crownwood Road, Theta,
Johannesburg, 2013South Africa De Beers Matlafalang Business Development (Pty) Ltd 63% Cornerstone, Corner Diamond Drive and Crownwood Road, Theta,
Johannesburg, 2013South Africa De Beers Sightholder Sales South Africa (Pty) Ltd 63% Cornerstone, Corner Diamond Drive and Crownwood Road, Theta,
Johannesburg, 2013South Africa Dido Nominees (Pty) Ltd 100% 44 Main Street, Johannesburg, 2001South Africa Element Six (Production) Proprietary Limited 51% Debid Road, Nuffield, Springs, 1559South Africa Element Six South Africa Proprietary Limited 51% Debid Road, Nuffield, Springs, 1559South Africa Element Six Technologies Proprietary Limited 85% Debid Road, Nuffield, Springs, 1559South Africa Fermain Nominees (Pty) Ltd 100% 44 Main Street, Johannesburg, 2001South Africa Ga-Phasha Platinum Mine (Pty) Limited 38% 44 Main Street, Johannesburg, 2001South Africa Hotazel Manganese Mines (Pty) Ltd 30% 39 Melrose Boulevard, Melrose Arch, Johannesburg, 2076South Africa Ingagane Colliery (Pty) Ltd 98% 44 Main Street, Johannesburg, 2001South Africa Ingwekazi Holdings (Proprietary) Limited 20% 368 Sifon Street, Robertville Ext 10, Roodepoort, 1709South Africa Khongoni Haaskraal Coal (Pty) Ltd 20% Unit 3, Bauhinia Street, Highveld, Technopark, Centurion, 0157South Africa KIO Investments Holdings (Pty) Ltd 70% Centurion Gate Building 2B, 124 Akkerboom Road, Centurion, 0157South Africa Kumba BSP Trust 53% Centurion Gate Building 2B, 124 Akkerboom Road, Centurion, 0157South Africa Kumba Iron Ore Limited 70% Centurion Gate Building 2B, 124 Akkerboom Road, Centurion, 0157South Africa Kwanda Platinum Mine (Pty) Ltd 38% 124 Akkerboom Street, Building 2B, Centurion, 0157South Africa Lebowa Platinum Mines Limited 38% 124 Akkerboom Street, Building 2B, Centurion, 0157South Africa Lexshell 49 General Trading (Pty) Ltd 35% 55 Marshall Street, Johannesburg, 2001South Africa Longboat (Pty) Ltd 100% 44 Main Street, Johannesburg, 2001South Africa Mafube Coal Mining (Pty) Ltd 50% 55 Marshall Street, Johannesburg, 2001South Africa Main Place Holdings Limited 39% Suite 801, 76 Regent Road, Sea Point, Western Cape, 8005South Africa Manganore Iron Mining Proprietary Limited 47% 39 Melrose Boulevard, Melrose Arch, Johannesburg, 2076South Africa Manngwe Mining (Pty) Ltd 20% Suite 105, Lorgadia Building, Embankment Road, Centurion, 0157
FINANCIAL STATEMENTS AND OTHER FINANCIAL INFORMATION NOTES TO THE FINANCIAL STATEMENTS
GROUP STRUCTURE
35. RELATED UNDERTAKINGS OF THE GROUP continued
Anglo American plc Integrated Annual Report 2019 201

Country ofincorporation(1)(2) Name of undertaking
Percentageof equityowned(3) Registered address
See page 204 for footnotes.
South Africa Marikana Ferrochrome Limited 100% 55 Marshall Street, Johannesburg, 2001South Africa Marikana Minerals (Pty) Ltd 100% 55 Marshall Street, Johannesburg, 2001South Africa Matthey Rustenburg Refiners (Pty) Ltd 78% 55 Marshall Street, Johannesburg, 2001South Africa Meruka Mining (Pty) Ltd 30% 16 North Road, Dunkeld Court, Dunkeld West, 2196South Africa Metalloys Manganese Smelter (Pty) Ltd 40% 39 Melrose Boulevard, Melrose Arch, Johannesburg, 2076South Africa Micawber 146 (Pty) Ltd 78% 55 Marshall Street, Johannesburg, 2001South Africa Middelplaats Manganese (Pty) Ltd 30% 39 Melrose Boulevard, Melrose Arch, Johannesburg, 2076South Africa Modikwa Mining Personnel Services (Pty) Ltd 39% 55 Marshall Street, Johannesburg, 2001South Africa Modikwa Platinum Mine (Pty) Ltd 39% 16 North Road, Dunkeld Court, Dunkeld West, 2196South Africa Mogalakwena Platinum Mines 78% 55 Marshall Street, Johannesburg, 2001South Africa Newshelf 1316 (Pty) Ltd 100% 44 Main Street, Johannesburg, 2001South Africa Newshelf 480 (Pty) Ltd 55% 44 Main Street, Johannesburg, 2001South Africa Norsand Holdings (Pty) Ltd 78% 55 Marshall Street, Johannesburg, 2001South Africa Peruke (Pty) Ltd 51% 44 Main Street, Johannesburg, 2001South Africa Phola Coal Processing Plant (Pty) Ltd 37% 44 Main Street, Johannesburg, 2001South Africa Platmed (Pty) Ltd 78% 55 Marshall Street, Johannesburg, 2001South Africa Platmed Properties (Pty) Ltd 78% 55 Marshall Street, Johannesburg, 2001South Africa Polokwane Iron Ore Company (Pty) Ltd 27% Centurion Gate Building 2B, 124 Akkerboom Road, Centurion, 0157South Africa Ponahalo Investments (RF) (Pty) Ltd(10) —% De Beers Consolidated Mines Corner, Corner Diamond and
Crownwood Road, Theta – Booysens Reserve, Johannesburg,2000
South Africa Precious Metals Refiners Proprietary Limited 78% 55 Marshall Street, Johannesburg, 2001South Africa Pro Enviro (Pty) Ltd 20% Greenside Colliery, PTN 0ff 331, Blackhills, 1032South Africa R A Gilbert (Pty) Ltd 78% 55 Marshall Street, Johannesburg, 2001South Africa Resident Nominees (Pty) Ltd 100% 44 Main Street, Johannesburg, 2001South Africa Richards Bay Coal Terminal (Pty) Ltd 23% South Dunes, Richards Bay Harbour, Richards Bay, 3900, KwaZulu
NatalSouth Africa Rietvlei Mining Company (Pty) Ltd 34% 151 Katherine Street, Sandton, 2196. P O Box 652419, Benmore,
2010South Africa Rustenburg Base Metals Refiners Proprietary Limited 78% 55 Marshall Street, Johannesburg, 2001South Africa Rustenburg Platinum Mines Limited 78% 55 Marshall Street, Johannesburg, 2001South Africa Samancor Holdings (Pty) Ltd 40% 39 Melrose Boulevard, Melrose Arch, Johannesburg, 2076South Africa Samancor Manganese (Pty) Ltd 40% 39 Melrose Boulevard, Melrose Arch, Johannesburg, 2076South Africa Sheba’s Ridge Platinum (Pty) Ltd 27% 55 Marshall Street, Johannesburg, 2001South Africa Sibelo Resource Development (Pty) Ltd 53% Centurion Gate Building 2B, 124 Akkerboom Road, Centurion, 0157South Africa Silver Lake Trading 619 (Pty) Ltd 100% 44 Main Street, Johannesburg, 2001South Africa Sishen Iron Ore Company (Pty) Ltd 53% Centurion Gate Building 2B, 124 Akkerboom Road, Centurion, 0157South Africa South Africa Coal Operations Proprietary Limited 100% 44 Main Street, Johannesburg, 2001South Africa Spectrem Air Pty Ltd 75% 44 Main Street, Johannesburg, 2001South Africa Springfield Collieries Limited 100% 44 Main Street, Johannesburg, 2001South Africa Tenon Investment Holdings (Pty) Ltd 100% 44 Main Street, Johannesburg, 2001South Africa Terra Nominees (Pty) Ltd 40% 39 Melrose Boulevard, Melrose Arch, Johannesburg, 2076South Africa The Village of Cullinan (Pty) Ltd 63% 36 Stockdale Street, KIMBERLEY, 8301South Africa Vergelegen Wine Estate (Pty) Ltd 100% Vergelegen Wine Farm, Lourensford Road, Somerset West, 7130South Africa Vergelegen Wines (Pty) Ltd 100% Vergelegen Wine Farm, Lourensford Road, Somerset West, 7130South Africa Whiskey Creek Management Services (Pty) Ltd 78% 55 Marshall Street, Johannesburg, 2001South Africa WPIC Holdings Pty Ltd 33% 5 Hollard Street, Johannesburg, 1627South Africa Anglo Inyosi Coal Security Company Limited 100% 44 Main Street, Johannesburg, 2001South Africa Invincible Trading 14 (Pty) Ltd 20% 16 Euclid Road, Industria East Ext 13, Germiston, 1400South Africa Main Street 1252 (Pty) Ltd (RF) 63% Cornerstone, Corner of Daimond Drive and Crownwood Road,
Theta, Johannesburg, 2013South Africa Roodepoortjie Resources (Pty) Ltd 49% 16 North Road, Dunkeld Court, Dunkeld West, 2196Sweden Element Six AB 51% c/o Advokatbyrån Kaiding, Box 385, 931 24 Skellefteå, SwedenSwitzerland De Beers Centenary AG(6) 85% c/o Telemarketing, Plus AG, Sonnenplatz 6, 6020, EmmenbrückeSwitzerland Element Six SA 51% rue du Tir-au-Canon 2r, Carouge, GenevaSwitzerland PGI SA 78% Avenue Mon- Repos 24, Case postale 656, CH- 1001 LausanneSwitzerland Synova S.A. 28% 13 Route de Genolier, 1266 DuillierTanzania Ambase Prospecting (Tanzania) (Pty) Ltd 100% Pemba House, 369 Toure Drive Oyster Bay, Dar Es SalaamUnited Arab
EmiratesDe Beers DMCC 85% Office 4D, Almas Tower, Jumeirah Lakes Towers, Dubai
United Kingdom Anglo American (London) 100% 1 More London Place, London, SE1 2AFUnited Kingdom Anglo American (London) 2 100% 20 Carlton House Terrace, London, SW1Y 5ANUnited Kingdom Anglo American (TIIL) Investments Limited 100% 1 More London Place, London, SE1 2AF
FINANCIAL STATEMENTS AND OTHER FINANCIAL INFORMATION NOTES TO THE FINANCIAL STATEMENTS
GROUP STRUCTURE
35. RELATED UNDERTAKINGS OF THE GROUP continued
202 Anglo American plc Integrated Annual Report 2019
Country ofincorporation(1)(2) Name of undertaking
Percentageof equityowned(3) Registered address
See page 204 for footnotes.
United Kingdom Anglo American 2005 Limited(11) 100% 20 Carlton House Terrace, London, SW1Y 5ANUnited Kingdom Anglo American Australia Investments Limited(12) 100% 20 Carlton House Terrace, London, SW1Y 5ANUnited Kingdom Anglo American Capital Australia Limited 100% 20 Carlton House Terrace, London, SW1Y 5ANUnited Kingdom Anglo American Capital plc(12) 100% 20 Carlton House Terrace, London, SW1Y 5ANUnited Kingdom Anglo American CMC Holdings Limited 100% 20 Carlton House Terrace, London, SW1Y 5ANUnited Kingdom Anglo American Corporate Secretary Limited 100% 20 Carlton House Terrace, London, SW1Y 5ANUnited Kingdom Anglo American Diamond Holdings Limited 100% 20 Carlton House Terrace, London, SW1Y 5ANUnited Kingdom Anglo American Farms (UK) Limited 100% 20 Carlton House Terrace, London, SW1Y 5ANUnited Kingdom Anglo American Ferrous Investments Limited 100% 20 Carlton House Terrace, London, SW1Y 5ANUnited Kingdom Anglo American Finance (UK) Limited 100% 20 Carlton House Terrace, London, SW1Y 5ANUnited Kingdom Anglo American Foundation 100% 20 Carlton House Terrace, London, SW1Y 5ANUnited Kingdom Anglo American Global Finance Limited 100% 20 Carlton House Terrace, London, SW1Y 5ANUnited Kingdom Anglo American Holdings Limited 100% 20 Carlton House Terrace, London, SW1Y 5ANUnited Kingdom Anglo American International Holdings Limited 100% 20 Carlton House Terrace, London, SW1Y 5ANUnited Kingdom Anglo American Investments (UK) Limited 100% 20 Carlton House Terrace, London, SW1Y 5ANUnited Kingdom Anglo American Marketing Limited 100% 20 Carlton House Terrace, London, SW1Y 5ANUnited Kingdom Anglo American Medical Plan Limited 100% 20 Carlton House Terrace, London, SW1Y 5ANUnited Kingdom Anglo American PNG Holdings Limited 100% 20 Carlton House Terrace, London, SW1Y 5ANUnited Kingdom Anglo American Prefco Limited(12) 100% 20 Carlton House Terrace, London, SW1Y 5ANUnited Kingdom Anglo American REACH Limited 100% 20 Carlton House Terrace, London, SW1Y 5ANUnited Kingdom Anglo American Services (UK) Ltd.(12) 100% 20 Carlton House Terrace, London, SW1Y 5ANUnited Kingdom Anglo American Services Overseas Limited 100% 1 More London Place, London, SE1 2AFUnited Kingdom Anglo American Technical & Sustainability Limited 100% 20 Carlton House Terrace, London, SW1Y 5ANUnited Kingdom Anglo American Technical & Sustainability Services Ltd 100% 20 Carlton House Terrace, London, SW1Y 5ANUnited Kingdom Anglo American Technical Limited(12) 100% 20 Carlton House Terrace, London, SW1Y 5ANUnited Kingdom Anglo Base Metals Marketing Limited 100% 20 Carlton House Terrace, London, SW1Y 5ANUnited Kingdom Anglo Coal Holdings Limited(12) 100% 20 Carlton House Terrace, London, SW1Y 5ANUnited Kingdom Anglo Coal Overseas Services Limited 100% 20 Carlton House Terrace, London, SW1Y 5ANUnited Kingdom Anglo Platinum Marketing Limited 78% 20 Carlton House Terrace, London, SW1Y 5ANUnited Kingdom Anglo UK Pension Trustee Limited 100% 20 Carlton House Terrace, London, SW1Y 5ANUnited Kingdom Anmercosa Finance Limited 100% 20 Carlton House Terrace, London, SW1Y 5ANUnited Kingdom Anmercosa Pension Trustees Limited 100% 20 Carlton House Terrace, London, SW1Y 5ANUnited Kingdom Anmercosa Sales Limited 100% 20 Carlton House Terrace, London, SW1Y 5ANUnited Kingdom AP Ventures Fund I LP 38% 45 Old Bond Street, London, W1S 4QTUnited Kingdom AP Ventures Fund II LP 27% 45 Old Bond Street, London, W1S 4QTUnited Kingdom Birchall Gardens LLP 50% Bardon Hall, Copt Oak Road, Markfield, LE67 9PJUnited Kingdom Charterhouse CAP Limited 85% 20 Carlton House Terrace, London, SW1Y 5ANUnited Kingdom Curtis Fitch Limited 21% Formal House, 60 St George’s Place, Cheltenham, Gloucestershire,
GL50 3PNUnited Kingdom De Beers Intangibles Limited 85% 20 Carlton House Terrace, London, SW1Y 5ANUnited Kingdom De Beers Jewellers Limited 85% 45 Old Bond Street, London, W1S 4QTUnited Kingdom De Beers Jewellers Trade Mark Limited 85% 45 Old Bond Street, London, W1S 4QTUnited Kingdom De Beers Jewellers UK Limited 85% 45 Old Bond Street, London, W1S 4QTUnited Kingdom De Beers Trademarks Limited 85% 1 More London Place, London, SE1 2AFUnited Kingdom De Beers UK Limited 85% 20 Carlton House Terrace, London, SW1Y 5ANUnited Kingdom Ebbsfleet Property Limited 50% Bardon Hall, Copt Oak Road, Markfield, LE67 9PJUnited Kingdom Element Six (Production) Limited 51% Global Innovation Centre, Fermi Avenue, Harwell, Oxford, Didcot,
Oxfordshire, OX11 0QRUnited Kingdom Element Six (UK) Limited 51% Global Innovation Centre, Fermi Avenue, Harwell, Oxford, Didcot,
Oxfordshire, OX11 0QRUnited Kingdom Element Six Abrasives Holdings Limited 51% 20 Carlton House Terrace, London, SW1Y 5ANUnited Kingdom Element Six Holdings Limited 85% 20 Carlton House Terrace, London, SW1Y 5ANUnited Kingdom Element Six Limited 85% Global Innovation Centre, Fermi Avenue, Harwell, Oxford, Didcot,
Oxfordshire, OX11 0QRUnited Kingdom Element Six Technologies Limited 85% Global Innovation Centre, Fermi Avenue, Harwell, Oxford, Didcot,
Oxfordshire, OX11 0QRUnited Kingdom Ferro Nickel Marketing Limited 100% 20 Carlton House Terrace, London, SW1Y 5ANUnited Kingdom Firecrest Investments Limited 100% 20 Carlton House Terrace, London, SW1Y 5ANUnited Kingdom Forevermark Limited 85% 20 Carlton House Terrace, London, SW1Y 5ANUnited Kingdom Gemfair Limited 85% 20 Carlton House Terrace, London, SW1Y 5ANUnited Kingdom IIDGR (UK) Limited 85% 20 Carlton House Terrace, London, SW1Y 5ANUnited Kingdom Lightbox Jewelry Ltd. 85% 20 Carlton House Terrace, London, SW1Y 5ANUnited Kingdom Mallord Properties Limited 100% 20 Carlton House Terrace, London, SW1Y 5AN
FINANCIAL STATEMENTS AND OTHER FINANCIAL INFORMATION NOTES TO THE FINANCIAL STATEMENTS
GROUP STRUCTURE
35. RELATED UNDERTAKINGS OF THE GROUP continued
Anglo American plc Integrated Annual Report 2019 203

(1) All the companies with an incorporation in the United Kingdom are registered in England and Wales. (2) The country of tax residence is disclosed where different from the country of incorporation. (3) All percentages have been rounded. (4) Tax resident in Colombia. (5) The interest in Debswana Diamond Company (Pty) Ltd is held indirectly through De Beers and is consolidated on a 19.2% proportionate basis, reflecting economic interest. The Group’s
effective interests in Debswana Diamond Company (Pty) Ltd is 16.3%. (6) Tax resident in the United Kingdom.
(7) 2% direct holding by Anglo American plc. (8) 0.03% direct holding by Anglo American plc. (9) A 74% interest in De Beers Consolidated Mines (Pty) Ltd (DBCM) and its subsidiaries is held indirectly through De Beers. The 74% interest represents De Beers’ legal ownership share in DBCM.
For accounting purposes De Beers consolidates 100% of DBCM as it is deemed to control the BEE entity, Ponahalo, which holds the remaining 26%. The Group’s effective interest inDBCM is 85%.
(10) Ponahalo Investments (RF) (Pty) Ltd is deemed to be controlled due to the financing structure in place and is consolidated as a majority owned subsidiary. (11) 4% direct holding by Anglo American plc.
(12) 100% direct holding by Anglo American plc.
Country ofincorporation(1)(2) Name of undertaking
Percentageof equityowned(3) Registered address
See page 204 for footnotes.
United Kingdom Neville Street Limited 100% 20 Carlton House Terrace, London, SW1Y 5ANUnited Kingdom Northfleet Property LLP 50% Bardon Hall, Copt Oak Road, Markfield, LE67 9PJUnited Kingdom Reunion Group Limited 100% 1 More London Place, London, SE1 2AFUnited Kingdom Reunion Mining Limited 100% 1 More London Place, London, SE1 2AFUnited Kingdom Rhoanglo Trustees Limited 100% 20 Carlton House Terrace, London, SW1Y 5ANUnited Kingdom Riverbank Investments Limited 85% 20 Carlton House Terrace, London, SW1Y 5ANUnited Kingdom Security Nominees Limited 100% 20 Carlton House Terrace, London, SW1Y 5ANUnited Kingdom Swanscombe Development LLP 50% Bardon Hall, Copt Oak Road, Markfield, LE67 9PJUnited Kingdom The Diamond Trading Company Limited 85% 20 Carlton House Terrace, London, SW1Y 5ANUnited States
of AmericaAnglo American Exploration (USA), Inc. 100% c/o Corporation Service Company, 251 Little Falls Drive, Wilmington
Delaware, 19808United States
of AmericaAnglo American US Holdings Inc. 100% c/o Corporation Service Company, 251 Little Falls Drive, Wilmington
Delaware, 19808United States
of AmericaDe Beers Jewellers US, Inc. 85% 300 First Stamford Place, Stamford, CT 06902
United Statesof America
Element Six Technologies (OR) Corp. 85% 3500 South Dupont Highway, Dover, County of Kent DE 19901
United Statesof America
Element Six Technologies (Oregon) Corp. 85% 3500 South Dupont Highway, Dover, County of Kent DE 19901
United Statesof America
Element Six Technologies U.S. Corporation 85% Incorporating Services Limited, 3500 South Dupont Highway,Dover, County of Kent DE 19901
United Statesof America
Element Six US Corporation 51% 24900 Pitkin Road, Suite 250, Spring TX 77386
United Statesof America
Forevermark US Inc. 85% 300 First Stamford Place, Stamford, CT, 06902
United Statesof America
Platinum Guild International (U.S.A.) Jewelry Inc. 78% 125 Park Avenue, 25th Floor, New York, New York 10017
Venezuela Minera Loma de Niquel C.A. 94% Torre Humboldt, Floor 9, office 09-07, Rio Caura Street, Prados delEste. Caracas 1080
Zambia Anglo Exploration (Zambia) (Pty) Ltd 100% 11 Katemo Road, Rhodes Park, LusakaZimbabwe Amzim Holdings Limited 78% 28 Broadlands Road, Emerald Hill, HarareZimbabwe Anglo American Corporation Zimbabwe Limited 78% 28 Broadlands Road, Emerald Hill, HarareZimbabwe Broadlands Park Limited 78% 28 Broadlands Road, Emerald Hill, HarareZimbabwe Southridge Limited 78% 28 Broadlands Road, Emerald Hill, Harare
Zimbabwe Unki Mines (Private) Limited 78% 28 Broadlands Road, Emerald Hill, Harare
FINANCIAL STATEMENTS AND OTHER FINANCIAL INFORMATION NOTES TO THE FINANCIAL STATEMENTS
GROUP STRUCTURE
35. RELATED UNDERTAKINGS OF THE GROUP continued
204 Anglo American plc Integrated Annual Report 2019

OTHER ITEMS
This section includes disclosures about related party transactions, auditor’s remuneration andaccounting policies.
FINANCIAL STATEMENTS AND OTHER FINANCIAL INFORMATION NOTES TO THE FINANCIAL STATEMENTS
Anglo American plc Integrated Annual Report 2019 205
36. RELATED PARTY TRANSACTIONS
The Group has related party relationships with its subsidiaries, joint operations, associates and joint ventures (see notes 34 and 35). Members of the Boardand the Group Management Committee are considered to be related parties.
The Company and its subsidiaries, in the ordinary course of business, enter into various sale, purchase and service transactions with joint operations, associates,joint ventures and others in which the Group has a material interest. These transactions are under terms that are no more or less favourable to the Group than thosearranged with third parties.
Associates Joint Ventures Joint Operations
US$ million 2019 2018 2019 2018 2019 2018
Transactions with related parties
Sale of goods and services — 1 — — 163 184Purchase of goods and services (20) (382) (170) (50) (2,893) (3,266)
Balances with related parties
Trade and other receivables from related parties 3 2 — 5 17 16Trade and other payables to related parties (5) (44) (31) (7) (128) (97)Loans receivable from related parties — — 230 211 — —
Balances and transactions with joint operations or joint operation partners represent the portion that the Group does not have the right to offset against thecorresponding amount recorded by the respective joint operations. These amounts primarily relate to purchases by De Beers and Platinum Group Metals from theirjoint operations in excess of the Group’s attributable share of their production.
Loans receivable from related parties are included in Financial asset investments on the Consolidated balance sheet.
Remuneration and benefits received by directors are disclosed in the Remuneration report. Remuneration and benefits of key management personnel, includingdirectors, are disclosed in note 26. Information relating to pension fund arrangements is disclosed in note 27.
37. AUDITOR'S REMUNERATON
2019 2018
Paid/payable to Deloitte
Paid/payableto auditor (ifnot Deloitte) Paid/payable to Deloitte
Paid/payableto auditor (ifnot Deloitte)
US$ millionUnited
Kingdom Overseas Total OverseasUnited
Kingdom Overseas Total Overseas
Paid to the Company’s auditor for auditof the Anglo American plc Annual Report 1.4 3.4 4.8 — 1.3 3.2 4.5 —
Paid to the Company’s auditor for otherservices to the GroupAudit of the Company’s subsidiaries 0.4 4.7 5.1 0.3 0.4 4.4 4.8 0.4Total audit fees 1.8 8.1 9.9 0.3 1.7 7.6 9.3 0.4Audit related assurance services 0.5 0.9 1.4 — 0.5 0.8 1.3 —Taxation advisory services — — — — 0.1 — 0.1 —Other assurance services 0.3 0.3 0.6 — — 0.5 0.5 —Other non-audit services 0.3 0.4 0.7 — 0.4 0.2 0.6 —Total non-audit fees 1.1 1.6 2.7 — 1.0 1.5 2.5 —
Audit related assurance services include $1.4 million (2018: $1.3 million) for the interim review.

38. ACCOUNTING POLICIES
A. BASIS OF PREPARATION
Basis of preparationThe financial statements have been prepared in accordance with InternationalFinancial Reporting Standards (IFRS) and IFRS Interpretations Committee(IFRIC) interpretations as adopted for use by the European Union, with thoseparts of the Companies Act 2006 applicable to companies reporting under IFRSand with the requirements of the Disclosure and Transparency rules of theFinancial Conduct Authority in the United Kingdom as applicable to periodicfinancial reporting. The financial statements have been prepared under thehistorical cost convention as modified by the revaluation of pension assets andliabilities and certain financial instruments. A summary of the principal Groupaccounting policies is set out below.
The preparation of financial statements in conformity with generally acceptedaccounting principles requires the use of estimates and assumptions that affectthe reported amounts of assets and liabilities at the date of the financialstatements and the reported amounts of revenues and expenses during thereporting period. Although these estimates are based on management’s bestknowledge of the amount, event or actions, actual results ultimately may differfrom those estimates.
As permitted by UK company law, the Group’s results are presented in USdollars, the currency in which its business is primarily conducted.
Changes in accounting policies and disclosuresThe accounting policies applied are consistent with those adopted anddisclosed in the Group financial statements for the year ended 31 December2018, except for changes arising from the adoption of the following newaccounting pronouncements which became effective in the currentreporting period:
• IFRS 16 Leases
• Amendments to IFRS 7 Financial Instruments Disclosures
• IFRIC 23 Uncertainty over Income Tax Treatments
• Amendments to IAS 28 Investments in Associates and Joint Ventures
• Amendments to IFRS 9 Financial instruments
• Amendments to IAS 19 Employee Benefits
• Annual Improvements to IFRSs: 2015-17 Cycle: IFRS 3, IFRS 11, IAS 12 andIAS 23.
IFRS 16 LeasesIFRS 16 Leases became effective for the Group from 1 January 2019, replacingIAS 17 Leases. The principal impact of IFRS 16 is to change the accountingtreatment by lessees of leases previously classified as operating leases. Leaseagreements give rise to the recognition of a right-of-use asset and a relatedliability for future lease payments.
The Group elected to apply the modified retrospective approach on transition.The cumulative effect of transition to IFRS 16 is recognised in retained earningsat 1 January 2019. The comparative period has not been restated.
On transition, lease liabilities were recognised as the present value of leasepayments still to be made, discounted at the appropriate incremental borrowingrate applicable at 1 January 2019 or where available, at the rate of interestimplicit in the lease. For the majority of leased assets, the corresponding right-of-use asset was recognised equal to the value of the lease liability at 1 January2019, adjusted for any accrued or prepaid lease payments.
Following adoption of IFRS 16, the costs of leases other than short-term leasesless than 12 months, variable leasing costs and leases of low value assets areallocated between the depreciation of right-of-use assets and a finance chargerepresenting the unwind of the discount on lease liabilities; previously leasingcosts for operating leases were recognised within operating costs. For the yearended 31 December 2018, operating lease costs of $150 million were chargedagainst Operating costs within underlying EBITDA. On adoption of IFRS 16, forthe year ended 31 December 2019 the depreciation of right-of-use assets($255 million charged against Operating costs) are excluded from underlyingEBITDA and finance costs incurred on lease liabilities ($32 million chargedagainst Net finance costs) are excluded from underlying EBIT and underlyingEBITDA. Short-term and low value leases, variable leasing costs and the costsof non-lease components continue to be charged against Operating costswithin underlying EBITDA.
The present value of the 2018 operating lease commitments, disclosedin note 30, discounted at the rates used to calculate lease liabilities at1 January 2019, is reconciled to the lease liabilities recognised in thetable below:
US$ million 2019
IAS 17 Operating lease commitments at 31 December 2018 553Impact of discounting operating lease commitments topresent value (93)
Other adjustments 9Former operating leases recognised on balance sheetat 1 January 2019 469
Finance leases recognised separately at 31 December 2018 70IFRS 16 Lease liabilities at 1 January 2019 539Current 160Non-current 379
On adoption of IFRS 16 on 1 January 2019, additional lease liabilities of$469 million previously classified as operating leases were included in net debt.Corresponding right-of-use assets of $379 million were recognised withinCapital employed, less than the carrying value of lease liabilities due to theimpairment of certain leased assets and the offsetting of onerous leaseprovisions against the carrying values of certain right-of-use assets on adoptionof IFRS 16.
In the Consolidated cash flow statement for the year ended 31 December 2019,the total amount of cash paid in respect of leases recognised on theConsolidated balance sheet are split between repayments of principal of$272 million and repayments of interest of $30 million, both presented withincash flows from financing activities. The repayment of both principal and interestforms part of the Attributable free cash flow Alternative Performance Measure.In 2018 repayments of operating leases were recognised within cash flows fromoperating activities.
The weighted average incremental borrowing rate used to measure leaseliabilities on transition to IFRS 16 at 1 January 2019 was 5.4%.
The Group adopted the following practical expedients on transition to IFRS 16:
• The Group applied a single discount rate to portfolios of leases with similarcharacteristics, such as those of the same length and in the same country.
• Lease liabilities and corresponding right-of-use assets where the lease termwill end during 2019 were excluded from leases brought on to the balancesheet unless the leases were significant.
• The Group considered known events after 1 January 2019 when determiningthe lease term, including using hindsight to assess whether options to extendor terminate the lease would be exercised.
• An impairment review was conducted for right-of-use assets on adoption ofthe standard. Any onerous lease provisions at 31 December 2018 have beenreversed and equivalent impairments recorded against the carrying values ofthe corresponding right-of-use assets on adoption of IFRS 16.
• The Group separated non-lease components from lease components forcertain leases for the first time as part of the transition adjustment.
At the date of inception of a new contract or significant modification of anexisting contract, the Group assesses whether the contract is, or contains,a lease. A contract is, or contains a lease if the contract conveys the right tocontrol the asset for a period of time in exchange for consideration. To identifylease arrangements, the Group assesses whether:
• The contract specifies the use of an identified asset or collection of assets.
• The Group has the right to obtain substantially all of the economic benefitsfrom the use of the identified asset(s).
• The Group has the right to direct the use of the asset.
The Group has paid particular attention to the judgement over whether thelessor has a substantive right to substitute the specified assets for alternatives.
• Many assets used by the Group are highly specialised in nature and arepurpose built or modified to meet the Group’s specification. Judgement isrequired to assess whether the assets can be substituted and used for otherpurposes without significant additional modification.
• The remote location of some of the Group’s operations presents practicaldifficulties to the substitution of assets. Judgement is required to determinewhether assets in remote locations can be relocated to other locations withina reasonable timeframe and cost.
FINANCIAL STATEMENTS AND OTHER FINANCIAL INFORMATION NOTES TO THE FINANCIAL STATEMENTS
OTHER ITEMS
206 Anglo American plc Integrated Annual Report 2019

• At some locations, high levels of security restrict the movement of assetsto alternative locations, limiting the ability to substitute assets.
• The Group’s health and safety standards exceed statutory requirements insome jurisdictions. This places limitations on the ability to substitute certainassets, such as vehicles. Judgement is required to assess whether equivalentassets meeting the Group’s requirements can be sourced within requiredoperational timeframes.
The Group recognises a lease liability and a corresponding right-of-use assetat the commencement date of the lease. Accounting policies applied to leaseliabilities and corresponding right-of-use assets are set out respectively innotes 38F and 38D.
Further disclosures required by IFRS 16 Leases are presented innotes 1, 4, 11 and 30.
Interest Rate Benchmark Reform: Amendments to IFRS 9 FinancialInstruments and IFRS 7 Financial Instruments Disclosures. The Group uses interest rate derivatives to swap all its Euro, Sterling and USdollar bonds from fixed interest rates to EURIBOR, GBP LIBOR and USD LIBORrespectively. Any non-USD interest rate derivatives are then swapped to USDLIBOR. The interest rate derivatives are designated into fair value hedges.
LIBOR is expected to be replaced by alternative risk-free rates by the end of2021 as part of inter-bank offer rate (IBOR) reform. The Group is currentlyassessing the impact of these changes on its hedging arrangements and anyfuture transactions in the financial market. Amendments to IFRS 7 and IFRS 9have been issued which modify specific hedge accounting requirements andallow it to be assumed that the interest rate benchmark is not altered as a resultof the uncertainties of IBOR reform when performing hedge effectivenesstesting. These amendments are effective from 1 January 2020 with earlyadoption allowed. The Group has elected to early adopt for the year ending31 December 2019. There is no impact on the Group’s fair value hedgeaccounting as a result of adopting the amendments.
The Group will continue to apply the amendments to IFRS 9 until the uncertaintyarising from the interest rate benchmark reforms with respect to the timing andthe amount of the underlying cash flows that the Group is exposed to ends. TheGroup is currently assessing alternative interest rate derivative contracts and thereliance upon replacement rates where relevant.
See note 21 for a list of the Group’s Euro, Sterling and US dollar bonds which inturn reflects the nominal amount of the hedging instruments.
Going concernThe directors have, at the time of approving the financial statements, areasonable expectation that the Company and the Group have adequateresources to continue in operational existence for the foreseeable future. Thusthe going concern basis of accounting in preparing the financial statementscontinues to be adopted. Further details are contained in the Directors’ reporton page 239.
New IFRS accounting standards, amendments andinterpretations not yet adoptedOther than in relation to IFRS 9 and IFRS 7 mentioned above, the Group hasnot early adopted any other amendment, standard or interpretation that hasbeen issued but is not yet effective. It is expected that where applicable, thesestandards and amendments will be adopted on each respective effective date.
The following new or amended IFRS accounting standards, amendments andinterpretations not yet adopted are not expected to have a significant impact onthe Group:
• Amendments to IAS 1 Presentation of Financial Statements and IAS 8Accounting Policies, Changes in Accounting Estimates and Errors: Definitionof Material
• Amendments to IAS 1 Presentation of Financial Statements: Classification
• Amendments to IFRS 3 Business Combinations: Definition of a Business
• Amendments to references to the Conceptual Framework in IFRS Standards.
B. BASIS OF CONSOLIDATION
Basis of consolidationThe financial statements incorporate a consolidation of the financial statementsof the Company and entities controlled by the Company (its subsidiaries).Control is achieved where the Company is exposed, or has rights, to variablereturns from its involvement with the investee and has the ability to affect thosereturns through its power over the investee.
The results of subsidiaries acquired or disposed of during the year are includedin the income statement from the effective date of acquisition or up to theeffective date of disposal, as appropriate.
Where necessary, adjustments are made to the results of subsidiaries, jointarrangements and associates to bring their accounting policies into line withthose used by the Group. Intra-group transactions, balances, income andexpenses are eliminated on consolidation, where appropriate.
For non-wholly owned subsidiaries, non-controlling interests are presented inequity separately from the equity attributable to shareholders of the Company.Profit or loss and other comprehensive income are attributed to theshareholders of the Company and to non-controlling interests even if this resultsin the non-controlling interests having a deficit balance.
Changes in ownership interest in subsidiaries that do not result in a change incontrol are accounted for in equity. The carrying amounts of the controlling andnon-controlling interests are adjusted to reflect the changes in their relativeinterests in the subsidiary. Any difference between the amount by which thenon-controlling interest is adjusted and the fair value of the consideration paidor received is recorded directly in equity and attributed to the shareholders ofthe Company.
Foreign currency transactions and translationForeign currency transactions by Group companies are recognised in thefunctional currencies of the companies at the exchange rate ruling on the dateof the transaction. At each reporting date, monetary assets and liabilities thatare denominated in foreign currencies are retranslated at the rates prevailing onthe reporting date. Gains and losses arising on retranslation are included in theincome statement for the period and are classified in the income statementaccording to the nature of the monetary item giving rise to them.
Non-monetary assets and liabilities that are measured in terms of historicalcost in a foreign currency are translated using the exchange rate at the dateof the transaction.
On consolidation, the assets and liabilities of the Group’s foreign operations aretranslated into the presentation currency of the Group at exchange ratesprevailing on the reporting date. Income and expense items are translated at theaverage exchange rates for the period where these approximate the rates at thedates of the transactions. Any exchange differences arising are classified withinthe statement of comprehensive income and transferred to the Group’scumulative translation adjustment reserve. Exchange differences on foreigncurrency balances with foreign operations for which settlement is neitherplanned nor likely to occur in the foreseeable future, and therefore form partof the Group’s net investment in these foreign operations, are offset in thecumulative translation adjustment reserve.
Cumulative translation differences are recycled from equity and recognised asincome or expense on disposal of the operation to which they relate.
Goodwill and fair value adjustments arising on the acquisition of foreign entitiesare treated as assets of the foreign entity and translated at the closing rate.
TenonTenon Investment Holdings Proprietary Limited (Tenon), a wholly ownedsubsidiary of Anglo American South Africa Proprietary Limited (AASA), hasentered into agreements with Epoch Investment Holdings (RF) ProprietaryLimited (Epoch), Epoch Two Investment Holdings (RF) Proprietary Limited(Epoch Two) and Tarl Investment Holdings (RF) Proprietary Limited (Tarl)(collectively the Investment Companies), each owned by independent charitabletrusts whose trustees are independent of the Group. Under the terms of theseagreements, the Investment Companies have purchased Anglo American plcshares on the market and have granted to Tenon the right to nominate a thirdparty (which may include Anglo American plc but not any of its subsidiaries) totake transfer of the Anglo American plc shares each has purchased on themarket. Tenon paid the Investment Companies 80% of the cost of theAnglo American plc shares including associated costs for this right to nominate,which together with subscriptions by Tenon for non-voting participatingredeemable preference shares in the Investment Companies, provided allthe funding required to acquire the Anglo American plc shares through themarket. These payments by Tenon were sourced from the cash resourcesof AASA. Tenon is able to exercise its right of nomination at any time up to31 December 2025 against payment of an average amount of $3.87 per shareto Epoch, $6.02 per share to Epoch Two and $4.99 per share to Tarl which willbe equal to 20% of the total costs respectively incurred by Epoch, Epoch Twoand Tarl in purchasing shares nominated for transfer to the third party. Thesefunds will then become available for redemption of the preference shares issuedby the Investment Companies. The amount payable by the third party on receiptof the Anglo American plc shares will accrue to Tenon and, as these are own
FINANCIAL STATEMENTS AND OTHER FINANCIAL INFORMATION NOTES TO THE FINANCIAL STATEMENTS
OTHER ITEMS
38. ACCOUNTING POLICIES continued
Anglo American plc Integrated Annual Report 2019 207

shares of the Company, any resulting gain or loss recorded by Tenon will not berecognised in the Consolidated income statement of Anglo American plc.
Under the agreements, the Investment Companies will receive dividends on theshares they hold and have agreed to waive the right to vote on those shares.The preference shares issued to the charitable trusts are entitled to aparticipating right of up to 10% of the profit after tax of Epoch and 5% of theprofit after tax of Epoch Two and Tarl. The preference shares issued to Tenonwill carry a fixed coupon of 3% plus a participating right of up to 80% of theprofit after tax of Epoch and 85% of the profit after tax of Epoch Two and Tarl.Any remaining distributable earnings in the Investment Companies, after theabove dividends, are then available for distribution as ordinary dividends to thecharitable trusts.
The structure effectively provides Tenon with a beneficial interest in the price riskon these shares together with participation in future dividend receipts. TheInvestment Companies will retain legal title to the shares until Tenon exercises itsright to nominate a transferee.
At 31 December 2019 the Investment Companies together held 112,300,129(2018: 112,300,129) Anglo American plc shares, which represented 8.2%(2018: 8.0%) of the ordinary shares in issue (excluding treasury shares) with amarket value of $3,207 million (2018: $2,509 million). The InvestmentCompanies are not permitted to hold more than an aggregate of 10% of theissued share capital of Anglo American plc at any one time.
The Investment Companies are considered to be structured entities. Althoughthe Group has no voting rights in the Investment Companies and cannotappoint or remove trustees of the charitable trusts, the Group considers that theagreement outlined above, including Tenon’s right to nominate the transferee ofthe Anglo American plc shares held by the Investment Companies, results in theGroup having control over the Investment Companies as defined under IFRS 10Consolidated Financial Statements. Accordingly, the Investment Companies arerequired to be consolidated by the Group.
C. FINANCIAL PERFORMANCE
Revenue recognitionRevenue is recognised in a manner that depicts the pattern of the transfer ofgoods and services to customers. The amount recognised reflects the amountto which the Group expects to be entitled in exchange for those goods andservices. Sales contracts are evaluated to determine the performanceobligations, the transaction price and the point at which there is transfer ofcontrol. The transactional price is the amount of consideration due in exchangefor transferring the promised goods or services to the customer, and is allocatedagainst the performance obligations and recognised in accordance withwhether control is recognised over a defined period or at a specific pointin time.
Revenue is derived principally from commodity sales, and is measured at thefair value of consideration received or receivable, after deducting discounts,volume rebates, value added tax and other sales taxes. A sale is recognisedwhen control has been transferred. This is usually when title and insurance riskhave passed to the customer and the goods have been delivered to acontractually agreed location.
Sales of metal concentrate are stated at their invoiced amount which is net oftreatment and refining charges. Sales of certain commodities are provisionallypriced such that the price is not settled until a predetermined future date andis based on the market price at that time. These sales are marked to marketat each reporting date using the forward price for the period equivalent to thatoutlined in the contract. Revenue on provisionally priced sales is recognised atthe forward market price when control passes to the customer and is classifiedas revenue from contracts with customers. Subsequent mark-to-marketadjustments are recognised in revenue from other sources.
Revenues from the sale of material by-products are recognised within revenueat the point control passes. Where a by-product is not regarded as significant,revenue may be credited against the cost of sales.
Revenue from services is recognised over time in line with the policy above.For contracts which contain separate performance obligations for the sale ofcommodities and the provision of freight services, the portion of the revenuerepresenting the obligation to perform the freight service is deferred andrecognised over time as the obligation is fulfilled, along with the associatedcosts. In situations where the Group is acting as an agent, amounts billed tocustomers are offset against the relevant costs.
Interest income is accrued on a time basis, by reference to the principaloutstanding and at the effective interest rate applicable.
Dividend income from investments is recognised when the shareholders’ rightsto receive payment have been established.
Exploration and evaluation expenditureExploration and evaluation expenditure is expensed in the year in which itis incurred.
Exploration expenditure is the cost of exploring for Mineral Resources otherthan that occurring at existing operations and projects and comprisesgeological and geophysical studies, exploratory drilling and sampling andMineral Resource development.
Evaluation expenditure includes the cost of conceptual and pre-feasibilitystudies and evaluation of Mineral Resources at existing operations.
When a decision is taken that a mining project is technically feasible andcommercially viable, usually after a pre-feasibility study has been completed,subsequent directly attributable expenditure, including feasibility study costs,are considered development expenditure and are capitalised within property,plant and equipment.
Exploration properties acquired are recognised on the balance sheet whenmanagement considers that their value is recoverable. These properties aremeasured at cost less any accumulated impairment losses.
Short-term and low value leasesFollowing the adoption of IFRS 16 from 1 January 2019, leases with a termof less than 12 months, or committed payments of less than $5,000, are notrecognised in the Consolidated balance sheet. The Group continues torecognise payments for these leases as an expense on a straight-line basisover the lease term within operating expenses.
Prior to the adoption of IFRS 16, rental costs under operating leases wererecognised in the income statement in equal annual amounts over thelease term.
Borrowing costsInterest on borrowings directly relating to the financing of qualifying assets in thecourse of construction is added to the capitalised cost of those projects under‘Capital works in progress’, until such time as the assets are substantially readyfor their intended use or sale.
Where funds have been borrowed specifically to finance a project, the amountcapitalised represents the actual borrowing costs incurred. Where the fundsused to finance a project form part of general borrowings, the amountcapitalised is calculated using a weighted average of rates applicable to relevantgeneral borrowings of the Group during the period. All other borrowing costsare recognised in the income statement in the period in which they are incurred.
D. CAPITAL BASE
Business combinations and goodwill arising thereonThe identifiable assets, liabilities and contingent liabilities of a subsidiary, a jointarrangement or an associate, which can be measured reliably, are recorded attheir provisional fair values at the date of acquisition. The estimation of the fairvalue of identifiable assets and liabilities is subjective and the use of differentvaluation assumptions could have a significant impact on financial results.Goodwill is the fair value of the consideration transferred (including contingentconsideration and previously held non-controlling interests) less the fair value ofthe Group’s share of identifiable net assets on acquisition.
Where a business combination is achieved in stages, the Group’s previouslyheld interests in the acquiree are remeasured to fair value at the acquisition dateand the resulting gain or loss is recognised in the income statement.
Amounts arising from interests in the acquiree prior to the acquisition date thathave previously been recognised in other comprehensive income arereclassified to the income statement, where such treatment would beappropriate if that interest were disposed of.
Transaction costs incurred in connection with the business combination areexpensed. Provisional fair values are finalised within 12 months of theacquisition date.
Goodwill in respect of subsidiaries and joint operations is included withinintangible assets. Goodwill relating to associates and joint ventures is includedwithin the carrying value of the investment.
Where the fair value of the identifiable net assets acquired exceeds the cost ofthe acquisition, the surplus, which represents the discount on the acquisition,is recognised directly in the income statement in the period of acquisition.
For non-wholly owned subsidiaries, non-controlling interests are initiallyrecorded at the non-controlling interests’ proportion of the fair values of netassets recognised at acquisition.
FINANCIAL STATEMENTS AND OTHER FINANCIAL INFORMATION NOTES TO THE FINANCIAL STATEMENTS
OTHER ITEMS
38. ACCOUNTING POLICIES continued
208 Anglo American plc Integrated Annual Report 2019

Impairment of goodwill, intangible assets and property, plantand equipmentGoodwill arising on business combinations is allocated to the group of cashgenerating units (CGUs) that is expected to benefit from synergies of thecombination, and represents the lowest level at which goodwill is monitoredby the Group’s Board of directors for internal management purposes. Therecoverable amount of the CGU, or group of CGUs, to which goodwill has beenallocated is tested for impairment annually, or when events or changes incircumstances indicate that it may be impaired.
Any impairment loss is recognised immediately in the income statement.Impairment of goodwill is not subsequently reversed.
At each reporting date, the Group reviews the carrying amounts of its property,plant and equipment and intangible assets to determine whether there is anyindication that those assets are impaired. If such an indication exists, therecoverable amount of the asset is estimated in order to determine the extentof any impairment. Where the asset does not generate cash flows that areindependent from other assets, the Group estimates the recoverable amountof the CGU to which the asset belongs. An intangible asset with an indefiniteuseful life is tested for impairment annually and whenever there is an indicationthat the asset may be impaired.
Recoverable amount is the higher of fair value less costs of disposal and valuein use (VIU) assessed using discounted cash flow models, as explained in note7. In assessing VIU, the estimated future cash flows are discounted to theirpresent value using a pre-tax discount rate that reflects current marketassessments of the time value of money and the risks specific to the asset forwhich estimates of future cash flows have not been adjusted.
If the recoverable amount of an asset or CGU is estimated to be less than itscarrying amount, the carrying amount of the asset or CGU is reduced to itsrecoverable amount. An impairment loss is recognised in the income statement.
Where an impairment loss subsequently reverses, the carrying amount of theasset or CGU is increased to the revised estimate of its recoverable amount, tothe extent that the increased carrying amount does not exceed the carryingamount that would have been determined had no impairment been recognisedfor the asset or CGU. A reversal of an impairment loss is recognised in theincome statement.
In addition, in making assessments for impairment, management necessarilyapplies its judgement in allocating assets, including goodwill, that do notgenerate independent cash inflows to appropriate CGUs.
Subsequent changes to the CGU allocation, to the timing of cash flows or to theassumptions used to determine the cash flows could impact the carrying valueof the respective assets.
Non-mining licences and other intangible assetsNon-mining licences and other intangible assets are measured at cost lessaccumulated amortisation and accumulated impairment losses. Intangibleassets acquired as part of an acquisition of a business are capitalised separatelyfrom goodwill if the asset is separable or arises from contractual or legal rightsand the fair value can be measured reliably on initial recognition. Intangibleassets are amortised over their estimated useful lives, usually between 3 and 20years, except goodwill and those intangible assets that are considered to haveindefinite lives. For intangible assets with a finite life, the amortisation period isdetermined as the period over which the Group expects to obtain benefits fromthe asset, taking account of all relevant facts and circumstances includingcontractual lives and expectations about the renewal of contractualarrangements without significant incremental costs. An intangible asset isdeemed to have an indefinite life when, based on an analysis of all of therelevant factors, there is no foreseeable limit to the period over which the assetis expected to generate cash flows for the Group. Amortisation methods,residual values and estimated useful lives are reviewed at least annually.
Deferred strippingThe removal of rock or soil overlying a mineral deposit, overburden, and otherwaste materials is often necessary during the initial development of an open pitmine site, in order to access the orebody. The process of removing overburdenand other mine waste materials is referred to as stripping. The directlyattributable cost of this activity is capitalised in full within ‘Mining properties andleases’, until the point at which the mine is considered to be capable ofoperating in the manner intended by management. This is classified asexpansionary capital expenditure, within investing cash flows.
The removal of waste material after the point at which depreciation commencesis referred to as production stripping. When the waste removal activity improvesaccess to ore extracted in the current period, the costs of production strippingare charged to the income statement as operating costs in accordance with theprinciples of IAS 2 Inventories.
Where production stripping activity both produces inventory and improvesaccess to ore in future periods the associated costs of waste removal areallocated between the two elements. The portion that benefits future oreextraction is capitalised within ‘Mining properties and leases’. This is classifiedas stripping and development capital expenditure, within investing cash flows.If the amount to be capitalised cannot be specifically identified it is determinedbased on the volume of waste extracted compared with expected volume forthe identified component of the orebody. This determination is dependent onan individual mine’s design and Life of Mine Plan and therefore changes tothe design or Life of Mine Plan will result in changes to these estimates.Identification of the components of a mine’s orebody is made by reference tothe Life of Mine Plan. The assessment depends on a range of factors includingeach mine’s specific operational features and materiality.
In certain instances significant levels of waste removal may occur during theproduction phase with little or no associated production. This may occur at bothopen pit and underground mines, for example longwall development.
The cost of this waste removal is capitalised in full to ‘Mining propertiesand leases’.
All amounts capitalised in respect of waste removal are depreciated using theunit of production method for the component of the orebody to which theyrelate, consistent with depreciation of property, plant and equipment.
The effects of changes to the Life of Mine Plan on the expected cost of wasteremoval or remaining Ore Reserves for a component are accounted forprospectively as a change in estimate.
Property, plant and equipmentProperty, plant and equipment is stated at cost, less accumulated depreciationand accumulated impairment losses. Cost is the fair value of considerationrequired to acquire and develop the asset and includes the purchase price,acquisition of mineral rights, costs directly attributable to bringing the asset tothe location and condition necessary for it to be capable of operating in themanner intended by management, the initial estimate of any decommissioningobligation and, for assets that take a substantial period of time to get ready fortheir intended use, borrowing costs.
Gains or losses on disposal of property, plant and equipment are determined bycomparing the proceeds from disposal with the carrying amount. The gain orloss is recognised in the income statement.
Depreciation of property, plant and equipmentMining properties are depreciated to their residual values using the unit ofproduction method based on Proved and Probable Ore Reserves and, in certainlimited circumstances, other Mineral Resources included in the Life of MinePlan. These other Mineral Resources are included in depreciation calculationswhere, taking into account historical rates of conversion to Ore Reserves, thereis a high degree of confidence that they will be extracted in an economicmanner. This is the case principally for diamond operations, where depreciationcalculations are based on Diamond Reserves and Diamond Resources includedin the Life of Mine Plan. This reflects the unique nature of diamond depositswhere, due to the difficulty in estimating grade, Life of Mine Plans frequentlyinclude significant amounts of Indicated or Inferred Resources.
Buildings and items of plant and equipment for which the consumption ofeconomic benefit is linked primarily to utilisation or to throughput rather thanproduction, are depreciated to their residual values at varying rates on astraight-line basis over their estimated useful lives, or the Reserve Life,whichever is shorter. Estimated useful lives normally vary from up to 20 yearsfor items of plant and equipment to a maximum of 50 years for buildings. Underlimited circumstances, items of plant and equipment may be depreciated overa period that exceeds the Reserve Life by taking into account additional MineralResources other than Proved and Probable Reserves included in the Life ofMine Plan, after making allowance for expected production losses based onhistorical rates of Mineral Resource to Ore Reserve conversion.
FINANCIAL STATEMENTS AND OTHER FINANCIAL INFORMATION NOTES TO THE FINANCIAL STATEMENTS
OTHER ITEMS
38. ACCOUNTING POLICIES continued
Anglo American plc Integrated Annual Report 2019 209

‘Capital works in progress’ are measured at cost less any recognisedimpairment. Depreciation commences when the assets are capable of operatingin the manner intended by management, at which point they are transferred tothe appropriate asset class.
Land is not depreciated.
When parts of an item of property, plant and equipment have different usefullives, they are accounted for as separate items (major components).
Depreciation methods, residual values and estimated useful lives are reviewedat least annually.
Leased right-of-use assetsFollowing the adoption of IFRS 16 from 1 January 2019, leased right-of-useassets are included within property, plant and equipment, and on inception ofthe lease are recognised at the amount of the corresponding lease liability,adjusted for any lease payments made at or before the lease commencementdate, plus any direct costs incurred and an estimate of costs for dismantling,removing, or restoring the underlying asset and less any leaseincentives received.
The right-of-use asset is depreciated on a straight-line basis over the term of thelease, or, if shorter, the useful life of the asset. The useful lives of right-of-useassets are estimated on the same basis as those of owned property, plantand equipment.
Prior to the adoption of IFRS 16 on 1 January 2019, assets held under financeleases were depreciated over the shorter of the lease term and the estimateduseful lives of the assets.
Financial assetsInvestments, other than investments in subsidiaries, joint arrangements andassociates, are financial asset investments and are initially recognised at fairvalue. The Group’s financial assets are classified into the following measurementcategories: debt instruments at amortised cost, equity instruments and debtinstruments designated at fair value through other comprehensive income (OCI),and debt instruments, derivatives and equity instruments at fair value throughprofit and loss. Financial assets are classified as at amortised cost only if theasset is held within a business model whose objective is to collect thecontractual cash flows and the contractual terms of the asset give rise to cashflows that are solely payments of principal and interest.
At subsequent reporting dates, financial assets at amortised cost are measuredat amortised cost less any impairment losses. Other investments are classifiedas either at fair value through profit or loss (which includes investments held fortrading) or at fair value through OCI. Both categories are subsequentlymeasured at fair value. Where investments are held for trading purposes,unrealised gains and losses for the period are included in the income statementwithin other gains and losses.
The Group has elected to measure equity instruments, which are neither heldfor trading nor are contingent consideration in a business combination, at fairvalue through OCI as this better reflects the strategic nature of the Group’sequity investments. For equity instruments at fair value through OCI, changes infair value, including those related to foreign exchange, are recognised in othercomprehensive income and there is no subsequent reclassification of fair valuegains and losses to profit or loss.
Impairment of financial assetsA financial asset not measured at fair value through profit or loss is assessed ateach reporting date to determine whether there is any objective evidence that itis impaired. The Group assesses on a forward looking basis the expected creditlosses, defined as the difference between the contractual cash flows and thecash flows that are expected to be received, associated with its assets carriedat amortised cost and fair value through OCI. The impairment methodologyapplied depends on whether there has been a significant increase in credit risk.For trade receivables only, the simplified approach permitted by IFRS 9 isapplied, which requires expected lifetime losses to be recognised from initialrecognition of the receivables.
Losses are recognised in the income statement. When a subsequent eventcauses the amount of impairment loss to decrease, the decrease in impairmentloss is reversed through the income statement.
Impairment losses relating to equity instruments at fair value through othercomprehensive income are not reported separately from other changes infair value.
Derecognition of financial assets and financial liabilitiesFinancial assets are derecognised when the right to receive cash flows fromthe asset has expired, the right to receive cash flows has been retained but anobligation to on-pay them in full without material delay has been assumed orthe right to receive cash flows has been transferred together with substantiallyall the risks and rewards of ownership.
Financial liabilities are derecognised when the associated obligation has beendischarged, cancelled or has expired.
Environmental restoration and decommissioning obligationsAn obligation to incur environmental restoration, rehabilitation anddecommissioning costs arises when disturbance is caused by the developmentor ongoing production of a mining asset. Costs for restoration of site damage,rehabilitation and environmental costs are estimated using either the work ofexternal consultants or internal experts. Such costs arising from thedecommissioning of plant and other site preparation work, discounted to theirnet present value, are provided for and capitalised at the start of each project,as soon as the obligation to incur such costs arises.
These costs are recognised in the income statement over the life of theoperation, through the depreciation of the asset and the unwinding of thediscount on the provision. Costs for restoration of subsequent site damagewhich is created on an ongoing basis during production are provided for attheir net present values and recognised in the income statement asextraction progresses.
The amount recognised as a provision represents management’s best estimateof the consideration required to complete the restoration and rehabilitationactivity, the application of the relevant regulatory framework and timing ofexpenditure. These estimates are inherently uncertain and could materiallychange over time. Changes in the measurement of a liability relating to thedecommissioning of plant or other site preparation work (that result fromchanges in the estimated timing or amount of the cash flow or a change in thediscount rate), are added to or deducted from the cost of the related asset inthe current period. If a decrease in the liability exceeds the carrying amount ofthe asset, the excess is recognised immediately in the income statement. If theasset value is increased and there is an indication that the revised carrying valueis not recoverable, an impairment test is performed in accordance with theaccounting policy set out above.
For some South African operations annual contributions are made to dedicatedenvironmental rehabilitation trusts to fund the estimated cost of rehabilitationduring and at the end of the life of the relevant mine. The Group exercises fullcontrol of these trusts and therefore the trusts are consolidated. The trusts’assets are disclosed separately on the balance sheet as non-current assets.
The trusts’ assets are measured based on the nature of the underlying assetsin accordance with accounting policies for similar assets.
E. WORKING CAPITAL
InventoriesInventory and work in progress are measured at the lower of cost and netrealisable value, except for inventory held by commodity broker-traders whichis measured at fair value less costs to sell. The production cost of inventoryincludes an appropriate proportion of depreciation and production overheads.Cost is determined on the following basis:
• Raw materials and consumables are measured at cost on a first in, first out(FIFO) basis or a weighted average cost basis.
• Work in progress and finished products are measured at raw material cost,labour cost and a proportion of production overhead expenses.
• Metal and coal stocks are included within finished products and are measuredat average cost.
At precious metals operations that produce ‘joint products’, cost is allocatedamong products according to the ratio of contribution of these metals to grosssales revenues.
Inventory is generally recognised as a current asset as it is consumed within thenormal business cycle. Stockpiles are classified as non-current where there isno ability to process the ore or there is no market to sell the product in itscurrent state.
FINANCIAL STATEMENTS AND OTHER FINANCIAL INFORMATION NOTES TO THE FINANCIAL STATEMENTS
OTHER ITEMS
38. ACCOUNTING POLICIES continued
210 Anglo American plc Integrated Annual Report 2019

F. NET DEBT AND FINANCIAL RISK MANAGEMENT
Cash and debtCash and cash equivalentsCash and cash equivalents comprise cash in hand and on demand deposits,together with short-term, highly liquid investments that are readily convertible toa known amount of cash and that are subject to an insignificant risk of changesin value. Bank overdrafts are shown within short term borrowings in currentliabilities on the balance sheet. Cash and cash equivalents in the cash flowstatement are shown net of overdrafts. Cash and cash equivalents aremeasured at amortised cost except for money market fund investments whichare held at fair value as they are redeemed through the sale of units in the fundsand not solely through the recovery of principal and interest.
Financial liabilities and equity instrumentsFinancial liabilities and equity instruments are classified and accounted for asdebt or equity according to the substance of the contractual arrangementsentered into.
BorrowingsInterest bearing borrowings and overdrafts are initially recognised at fair value,net of directly attributable transaction costs. Finance charges, includingpremiums payable on settlement or redemption and direct issue costs, arerecognised in the income statement using the effective interest method. Theyare added to the carrying amount of the instrument to the extent that they arenot settled in the period in which they arise.
Lease liabilitiesFollowing adoption of IFRS 16, lease liabilities recognised on balance sheet arerecognised within borrowings as part of net debt. On inception, the lease liabilityis recognised as the present value of the expected future lease payments,calculated using the Group’s incremental borrowing rate, adjusted to reflect thelength of the lease and country of location. For a minority of leases where it ispossible to determine the interest rate implicit in the lease, it is used in place ofthe Group’s incremental borrowing rate.
Lease payments included in the lease liability consist of each of the following:
• Fixed payments, including in-substance fixed payments.
• Payments whose variability is dependent only upon an index or a rate,measured initially using the index or rate at the lease commencement date.The lease liability is revalued when there is a change in future lease paymentsarising from a change in an index or rate.
• Any amounts expected to be payable under a guarantee of residual value.
• The exercise price of a purchase option that the Group is reasonably certainto exercise, the lease payments after the date of a renewal option if the Groupis reasonably certain to exercise its option to renew the lease, and penaltiesfor exiting a lease agreement unless the Group is reasonably certain not to exitthe lease early.
The lease liability is measured at amortised cost using the effective interestmethod. It is remeasured when there is a change to the forecast leasepayments. When the lease liability is remeasured, an adjustment is made to thecorresponding right-of-use asset.
Derivative financial instruments and hedge accountingIn order to hedge its exposure to foreign exchange, interest rate and commodityprice risk, the Group enters into forward, option and swap contracts.Commodity based (own use) contracts that meet the scope exemption in IFRS9 are recognised in earnings when they are settled by physical delivery.
All derivatives are held at fair value in the balance sheet within ‘Derivativefinancial assets’ or ‘Derivative financial liabilities’ except if they are linked tosettlement and delivery of an unquoted equity instrument and the fair valuecannot be measured reliably, in which case they are carried at cost. Derivativesare classified as current or non-current depending on the contractual maturityof the derivative. A derivative cannot be measured reliably where the range ofreasonable fair value estimates is significant and the probabilities of variousestimates cannot be reasonably assessed.
Changes in the fair value of derivative financial instruments that are designatedand effective as hedges of future cash flows (cash flow hedges) are recogniseddirectly in equity. The gain or loss relating to the ineffective portion is recognisedimmediately in the income statement. If the cash flow hedge of a firmcommitment or forecast transaction results in the recognition of a non-financialasset or liability, then, at the time the asset or liability is recognised, theassociated gains or losses on the derivative that had previously beenrecognised in equity are included in the initial measurement of the asset orliability. For hedges that do not result in the recognition of a non-financial asset
or liability, amounts deferred in equity are recognised in the income statementin the same period in which the hedged item affects profit or loss.
For an effective hedge of an exposure to changes in fair value, the hedged itemis adjusted for changes in fair value attributable to the risk being hedged. Thecorresponding entry and gains or losses arising from remeasuring theassociated derivative are recognised in the income statement.
Hedge effectiveness is determined at the inception of the hedge relationship,and through periodic prospective effectiveness assessments to ensure that aneconomic relationship exists between the hedged item and hedging instrument.The Group’s material hedging instruments are interest rate swaps that havesimilar critical terms to the related debt instruments, such as payment dates,maturities and notional amount. As all critical terms matched during the year,there was no material hedge ineffectiveness. The Group also uses crosscurrency swaps to manage foreign exchange risk associated with borrowingsdenominated in foreign currencies. These are not designated in an accountinghedge as there is a natural offset against foreign exchange movements onassociated borrowings.
Hedge accounting is discontinued when the hedging instrument expires oris sold, terminated, exercised, revoked, or no longer qualifies for hedgeaccounting. At that time, any cumulative gain or loss on the hedging instrumentrecognised in equity is retained until the forecast transaction occurs. If a hedgetransaction is no longer expected to occur, the net cumulative gain or losspreviously recognised in equity is recycled to the income statement forthe period.
Changes in the fair value of any derivative instruments that are not designatedin a hedge relationship are recognised immediately in the income statement.
Derivatives embedded in other financial instruments or non-financial hostcontracts (other than financial assets in the scope of IFRS 9) are treated asseparate derivatives when their risks and characteristics are not closely relatedto those of their host contracts and the host contracts themselves are notcarried at fair value with unrealised gains or losses reported in theincome statement.
Derivatives embedded in contracts which are financial assets in the scope ofIFRS 9 are not separated and the whole contract is accounted for at eitheramortised cost or fair value.
G. TAXATION
TaxThe tax expense includes the current tax and deferred tax charge recognisedin the income statement.
Current tax payable is based on taxable profit for the year. Taxable profit differsfrom net profit as reported in the income statement because it excludes itemsof income or expense that are taxable or deductible in other years and it furtherexcludes items that are not taxable or deductible. The Group’s liability forcurrent tax is calculated using tax rates that have been enacted or substantivelyenacted by the reporting date.
Deferred tax is recognised in respect of temporary differences between thecarrying amounts of assets and liabilities for financial reporting purposes andthe amounts used for taxation purposes. Deferred tax liabilities are generallyrecognised for all taxable temporary differences and deferred tax assets arerecognised to the extent that it is probable that taxable profits will be availableagainst which deductible temporary differences can be utilised. Probabletaxable profits are based on evidence of historical profitability and taxable profitforecasts limited by reference to the criteria set out in IAS 12 Income Taxes.Such assets and liabilities are not recognised if the temporary differences arisefrom the initial recognition of goodwill or of an asset or liability in a transaction(other than in a business combination) that affects neither taxable profit noraccounting profit.
Deferred tax liabilities are recognised for taxable temporary differences arisingon investments in subsidiaries, joint arrangements and associates except wherethe Group is able to control the reversal of the temporary difference and it isprobable that the temporary difference will not reverse in the foreseeable future.
The carrying amount of deferred tax assets is reviewed at each reporting dateand is adjusted to the extent that it is no longer probable that sufficient taxableprofit will be available to allow all or part of the asset to be recovered.
FINANCIAL STATEMENTS AND OTHER FINANCIAL INFORMATION NOTES TO THE FINANCIAL STATEMENTS
OTHER ITEMS
38. ACCOUNTING POLICIES continued
Anglo American plc Integrated Annual Report 2019 211

Deferred tax is calculated at the tax rates that are expected to apply in theperiod when the liability is settled or the asset is realised, based on the laws thathave been enacted or substantively enacted by the reporting date. Deferred taxis charged or credited to the income statement, except when it relates to itemscharged or credited directly to equity, in which case the deferred tax is alsotaken directly to equity.
Deferred tax assets and liabilities are offset when they relate to income taxeslevied by the same taxation authority and the Group intends to settle its currenttax assets and liabilities on a net basis with that taxation authority.
H. EMPLOYEES
Retirement benefitsThe Group’s accounting policy involves the use of ‘best estimate’ assumptionsin calculating the schemes’ valuations in accordance with the accountingstandard. This valuation methodology differs from that applied in calculating thefunding valuations, which require the use of ‘prudent’ assumptions, such aslower discount rates, higher assumed rates of future inflation expectations andgreater improvements in life expectancy, leading to a higher value placed on theliabilities. The funding valuations are carried out every three years, using theprojected unit credit method, by independent qualified actuaries and are used todetermine the money that must be put into the funded schemes. The Groupoperates both defined benefit and defined contribution pension plans for itsemployees as well as post employment medical plans. For defined contributionplans the amount recognised in the income statement is the contributions paidor payable during the year.
For defined benefit pension and post employment medical plans, full actuarialvaluations are carried out at least every three years using the projected unitcredit method and updates are performed for each financial year end. Theaverage discount rate for the plans’ liabilities is based on AA rated corporatebonds of a suitable duration and currency or, where there is no deep market forsuch bonds, is based on government bonds. Pension plan assets are measuredusing year end market values.
Remeasurements comprising actuarial gains and losses, movements in assetsurplus restrictions and the return on scheme assets (excluding interest income)are recognised immediately in the statement of comprehensive income and arenot recycled to the income statement. Any increase in the present value of planliabilities expected to arise from employee service during the year is charged tooperating profit. The net interest income or cost on the net defined benefit assetor liability is included in investment income or interest expense respectively.
Past service cost is recognised immediately to the extent that the benefits arealready vested and otherwise amortised on a straight line basis over the averageperiod until the benefits vest.
The retirement benefit obligation recognised on the balance sheet representsthe present value of the deficit or surplus of the defined benefit plans. Anyrecognised surplus is limited to the present value of available refunds orreductions in future contributions to the plan.
Share-based paymentsThe Group makes equity settled share-based payments to certain employees,which are measured at fair value at the date of grant and expensed on a straightline basis over the vesting period, based on the Group’s estimate of shares thatwill eventually vest. For those share schemes with market related vestingconditions, the fair value is determined using the Monte Carlo model at the grantdate. The fair value of share options issued with non-market vesting conditionshas been calculated using the Black Scholes model.
For all other share awards, the fair value is determined by reference to themarket value of the shares at the grant date. For all share schemes with non-market vesting conditions, the likelihood of vesting has been taken into accountwhen determining the relevant charge. Vesting assumptions are reviewed duringeach reporting period to ensure they reflect current expectations.
I. GROUP STRUCTURE
Associates and joint arrangementsAssociates are investments over which the Group has significant influence,which is the power to participate in the financial and operating policy decisionsof the investee, but without the ability to exercise control or joint control.Typically the Group owns between 20% and 50% of the voting equity ofits associates.
Joint arrangements are arrangements in which the Group shares joint controlwith one or more parties. Joint control is the contractually agreed sharing ofcontrol of an arrangement, and exists only when decisions about the activitiesthat significantly affect the arrangement’s returns require the unanimous consentof the parties sharing control.
Judgement is required in determining this classification through an evaluation ofthe facts and circumstances arising from each individual arrangement. Jointarrangements are classified as either joint operations or joint ventures based onthe rights and obligations of the parties to the arrangement. In joint operations,the parties have rights to the assets and obligations for the liabilities relating tothe arrangement, whereas in joint ventures, the parties have rights to the netassets of the arrangement.
Joint arrangements that are not structured through a separate vehicle arealways joint operations. Joint arrangements that are structured through aseparate vehicle may be either joint operations or joint ventures depending onthe substance of the arrangement. In these cases, consideration is given to thelegal form of the separate vehicle, the terms of the contractual arrangementand, when relevant, other facts and circumstances. When the activities of anarrangement are primarily designed for the provision of output to the parties,and the parties are substantially the only source of cash flows contributingto the continuity of the operations of the arrangement, this indicates that theparties to the arrangements have rights to the assets and obligations forthe liabilities.
Certain joint arrangements that are structured through separate vehiclesincluding Collahuasi, Debswana and Namdeb are accounted for as jointoperations. These arrangements are primarily designed for the provision ofoutput to the parties sharing joint control, indicating that the parties have rightsto substantially all the economic benefits of the assets. The liabilities of thearrangements are in substance satisfied by cash flows received from the parties;this dependence indicates that the parties effectively have obligations for theliabilities. It is primarily these facts and circumstances that give rise to theclassification as joint operations.
The Group accounts for joint operations by recognising the assets, liabilities,revenue and expenses for which it has rights or obligations, including its shareof such items held or incurred jointly.
Investments in associates and joint ventures are accounted for using the equitymethod of accounting except when classified as held for sale. The Group’sshare of associates’ and joint ventures’ net income is based on their mostrecent audited financial statements or unaudited interim statements drawn upto the Group’s balance sheet date.
The total carrying values of investments in associates and joint venturesrepresent the cost of each investment including the carrying value of goodwill,the share of post-acquisition retained earnings, any other movements inreserves and any long-term debt interests which in substance form part of theGroup’s net investment. The carrying values of associates and joint ventures arereviewed on a regular basis and if there is objective evidence that an impairmentin value has occurred as a result of one or more events during the period, theinvestment is impaired.
The Group’s share of an associate’s or joint venture’s losses in excess of itsinterest in that associate or joint venture is not recognised unless the Group hasan obligation to fund such losses. Unrealised gains arising from transactionswith associates and joint ventures are eliminated against the investment to theextent of the Group’s interest in the investee. Unrealised losses are eliminated inthe same way, but only to the extent that there is no evidence of impairment.
FINANCIAL STATEMENTS AND OTHER FINANCIAL INFORMATION NOTES TO THE FINANCIAL STATEMENTS
OTHER ITEMS
38. ACCOUNTING POLICIES continued
212 Anglo American plc Integrated Annual Report 2019

Non-current assets and disposal groups held for saleNon-current assets and disposal groups are classified as held for sale if theircarrying amount will be recovered through a sale transaction rather than throughcontinuing use. This condition is met only when a sale is highly probablewithin one year from the date of classification, management is committed tothe sale and the asset or disposal group is available for immediate sale in itspresent condition.
Non-current assets and disposal groups are classified as held for sale fromthe date these conditions are met and are measured at the lower of carryingamount and fair value less costs to sell. Any resulting impairment loss isrecognised in the income statement.
On classification as held for sale the assets are no longer depreciated.Comparative amounts are not adjusted.
Black Economic Empowerment (BEE) transactionsWhere the Group disposes of a portion of a South African based subsidiaryor operation to a BEE company at a discount to fair value, the transaction isconsidered to be a share-based payment (in line with the principle containedin South Africa interpretation AC 503 Accounting for Black EconomicEmpowerment (BEE) Transactions).
The discount provided or value given is calculated in accordance with IFRS 2Share-based Payments and the cost, representing the fair value of the BEEcredentials obtained by the subsidiary, is recorded in the income statement.
FINANCIAL STATEMENTS AND OTHER FINANCIAL INFORMATION NOTES TO THE FINANCIAL STATEMENTS
OTHER ITEMS
38. ACCOUNTING POLICIES continued
Anglo American plc Integrated Annual Report 2019 213

Balance sheet of the Company, Anglo American plc, as at 31 December 2019
US$ million Note 2019 2018
Fixed assets
Investment in subsidiaries 1 30,876 30,775Current assets
Amounts due from Group undertakings 1,296 164Cash at bank and in hand 81 1
1,377 165Creditors due within one year
Amounts owed to Group undertakings (190) (482)Accruals (3) —
(193) (482)Net current assets/(liabilities) 1,184 (317)Total assets less current liabilities 32,060 30,458Net assets 32,060 30,458
Capital and reserves
Called-up share capital 2 753 772Share premium account 2 4,358 4,358Capital redemption reserve 2 134 115Other reserves 2 1,955 1,955Retained earnings 2 24,860 23,258Total shareholders’ funds 32,060 30,458
The profit after tax for the year of the Company amounted to $3,422 million (2018: $1,057 million).
The financial statements of Anglo American plc, registered number 03564138, were approved by the Board of directors on 19 February 2020 and signed on itsbehalf by:
Mark Cutifani Stephen PearceChief Executive Finance Director
FINANCIAL STATEMENTS AND OTHER FINANCIAL INFORMATION FINANCIAL STATEMENTS OF THE PARENT COMPANY
FINANCIAL STATEMENTS OF THE PARENT COMPANY
214 Anglo American plc Integrated Annual Report 2019

1. INVESTMENT IN SUBSIDIARIES
US$ million 2019 2018
Cost
At 1 January 30,792 29,933Capital contributions(1) 103 147(Disposals)/additions (2) 712At 31 December 30,893 30,792Provisions for impairment
At 1 January (17) (17)Charge for the year (2) —Impairment on disposals 2 —At 31 December (17) (17)Net book value 30,876 30,775
(1) This amount is net of $37 million (2018: $17 million) of intra-group recharges.
Further information about subsidiaries is provided in note 35 to the Consolidated financial statements.
2. RECONCILIATION OF MOVEMENTS IN EQUITY SHAREHOLDERS' FUNDS
US$ millionCalled-up
share capital
Sharepremiumaccount
Capitalredemption
reserveOther
reserves(1)Retained earnings(2) Total
At 1 January 2018 772 4,358 115 1,955 23,169 30,369Profit for the financial year — — — — 1,057 1,057Dividends(3) — — — — (900) (900)Net purchase of treasury shares under employee share schemes — — — — (232) (232)Capital contribution to Group undertakings — — — — 164 164At 31 December 2018 772 4,358 115 1,955 23,258 30,458Profit for the financial year — — — — 3,422 3,422Dividends(3) — — — — (980) (980)Share buyback — — — — (777) (777)Net purchase of treasury shares under employee share schemes — — — — (192) (192)Shares cancelled during the year (19) — 19 — — —Capital contribution to Group undertakings — — — — 140 140Other — — — — (11) (11)At 31 December 2019 753 4,358 134 1,955 24,860 32,060
(1) At 31 December 2019 other reserves of $1,955 million (2018: $1,955 million) were not distributable under the Companies Act 2006.(2) At 31 December 2019 $2,685 million (2018: $2,685 million) of the Company's retained earnings of $24,860 million (2018: $23,258 million) was not distributable under the Companies Act 2006.(3) Dividends relate only to shareholders on the United Kingdom principal register excluding dividends waived by Wealth Nominees Limited as nominees for Estera Trust (Jersey) Limited, the trustee
for the Anglo American employee share scheme. Dividends paid to shareholders on the Johannesburg branch register are distributed by a South African subsidiary in accordance with the termsof the Dividend Access Share Provisions of Anglo American plc’s Articles of Association. The directors are proposing a final dividend in respect of the year ended 31 December 2019 of47 US cents per share (see note 6 of the Consolidated financial statements).
The audit fee in respect of the Company was $7,660 (2018: $7,052). Fees payable to Deloitte for non-audit services to the Company are not required to bedisclosed because they are included within the consolidated disclosure in note 37 to the Consolidated financial statements.
FINANCIAL STATEMENTS AND OTHER FINANCIAL INFORMATION FINANCIAL STATEMENTS OF THE PARENT COMPANY
Anglo American plc Integrated Annual Report 2019 215

3. ACCOUNTING POLICIES: ANGLO AMERICAN PLC (THE COMPANY)The Company balance sheet and related notes have been prepared under the historical cost convention and in accordance with Financial Reporting Standard 100Application of Financial Reporting Requirements (FRS 100) and Financial Reporting Standard 101 Reduced Disclosure Framework (FRS 101).
A summary of the principal accounting policies is set out below.
The preparation of financial statements in compliance with FRS 101 requires the use of certain critical accounting estimates. It also requires managementto exercise judgement in applying the Company’s accounting policies.
As permitted by section 408 of the Companies Act 2006, the statement of comprehensive income of the Company is not presented as part of thesefinancial statements.
Significant accounting policiesInvestmentsInvestments represent equity holdings in subsidiaries and are measured at cost less accumulated impairment.
Financial instrumentsThe Company recognises financial instruments when it becomes a party to the contractual arrangements of the instrument. Financial instruments are derecognisedwhen they are discharged or when the contractual terms expire.
DividendsInterim equity dividends are recognised when declared. Final equity dividends are recognised when approved by the shareholders at an annual general meeting.
Share-based paymentsThe Company has applied the requirements of IFRS 2 Share-based Payments.
The Company makes equity settled share-based payments to the directors, which are measured at fair value at the date of grant and expensed on a straight linebasis over the vesting period, based on the Company’s estimate of shares that will eventually vest. For those share schemes with market related vesting conditions,the fair value is determined using the Monte Carlo model at the grant date. The fair value of share options issued with non-market vesting conditions has beencalculated using the Black Scholes model. For all other share awards, the fair value is determined by reference to the market value of the shares at the grant date.For all share schemes with non-market vesting conditions, the likelihood of vesting has been taken into account when determining the relevant charge. Vestingassumptions are reviewed during each reporting period to ensure they reflect current expectations.
The Company also makes equity settled share-based payments to certain employees of certain subsidiary undertakings. Equity settled share-based payments thatare made to employees of the Company’s subsidiaries are treated as increases in equity over the vesting period of the award, with a corresponding increase in theCompany’s investments in subsidiaries, based on an estimate of the number of shares that will eventually vest.
Any payments received from subsidiaries are applied to reduce the related increases in Investments in subsidiaries.
FINANCIAL STATEMENTS AND OTHER FINANCIAL INFORMATION FINANCIAL STATEMENTS OF THE PARENT COMPANY
216 Anglo American plc Integrated Annual Report 2019

This section includes certain Alternative Performance Measures (APMs). For more information on the APMs used by the Group, including definitions, please refer topage 228.
Marketing activities are allocated to the underlying operation to which they relate.
See page 218 for footnotes.
2019
US$ million (unless otherwise stated)Sales
volumeRealised
price Unit costGroup
revenue(1)Underlying
EBITDAUnderlying
EBITUnderlying
earningsCapital
expenditure
’000 cts $/ct $/ct
De Beers 29,186 (2) 137 (3) 63 (4) 4,605 (5) 558 168 45 567Mining
Botswana n/a 139 (3) 29 (4) n/a 385 325 n/a 88Namibia n/a 534 (3) 303 (4) n/a 121 86 n/a 55South Africa n/a 108 (3) 73 (4) n/a 57 28 n/a 275Canada n/a 119 (3) 44 (4) n/a 138 66 n/a 31
Trading n/a n/a n/a n/a 133 126 n/a 4Other(6) n/a n/a n/a n/a (276) (463) n/a 114
kt c/lb c/lb
Copper 644 (7) 273 (8) 126 (9) 5,840 1,618 960 509 1,078Los Bronces(10) 336 n/a 135 (9) 1,872 745 378 n/a 239Collahuasi(11) 254 n/a 100 (9) 1,414 916 691 486 275Quellaveco(12) n/a n/a n/a n/a n/a n/a n/a 494Other(13) 54 n/a n/a 2,554 (43) (109) n/a 70
koz $/Pt oz $/Pt oz
Platinum Group Metals 2,215 (14) 2,819 (15) 1,543 (16) 6,866 2,000 1,672 872 569Mogalakwena 519 (14) 3,433 (15) 1,329 (16) 1,789 995 863 n/a 264Amandelbult 458 (14) 2,624 (15) 1,725 (16) 1,206 355 298 n/a 84Processing and trading(17) 813 (14) n/a n/a 2,669 321 295 n/a —Other(18) 425 2,879 1,621 1,202 329 216 n/a 221
Mt $/t $/t
Iron Ore n/a n/a n/a 6,758 3,407 2,952 1,635 594Kumba Iron Ore(19) 42.0 97 (20) 33 (21) 4,445 2,243 (22) 1,918 (22) 663 (22) 389Iron Ore Brazil (Minas-Rio) 22.9 79 (20) 21 (21) 2,313 1,164 (22) 1,034 (22) 972 (22) 205
Mt $/t $/t
Coal n/a n/a n/a 6,137 1,832 1,010 662 934Metallurgical Coal 22.4 (23) 165 (24) 63 (25) 3,756 1,707 (26) 1,079 (26) 734 (26) 670Thermal Coal – South Africa 18.1 (23) 61 (24) 45 (25) 1,887 (5) (26) (94) (26) (81) (26) 264Thermal Coal – Colombia(27) 8.8 56 33 494 130 25 9 —
Nickel and Manganese n/a n/a n/a 1,498 634 477 301 42Nickel 41,700 t 624 c/lb 380 c/lb (28) 572 191 (29) 89 (29) 99 (29) 42Manganese (Samancor)(30) 3.7 Mt n/a n/a 926 443 388 202 —
Corporate and other n/a n/a n/a 121 (43) (229) (556) 56Exploration n/a n/a n/a n/a (126) (128) (115) 1Corporate activities and
unallocated costs n/a n/a n/a 121 83 (101) (441) 55
n/a n/a n/a 31,825 10,006 7,010 3,468 3,840
FINANCIAL STATEMENTS AND OTHER FINANCIAL INFORMATION
SUMMARY BY OPERATION
Anglo American plc Integrated Annual Report 2019 217

2018
US$ million (unless otherwise stated)Sales
volumeRealised
price Unit costGroup
revenue(1)Underlying
EBITDAUnderlying
EBITUnderlying
earningsCapital
expenditure
’000 cts $/ct $/ct
De Beers 31,656 (2) 171 (3) 60 (4) 6,082 (5) 1,245 694 349 417 (31)
MiningBotswana n/a 155 (3) 28 (4) n/a 495 441 n/a 97Namibia n/a 550 (3) 274 (4) n/a 176 140 n/a 38South Africa n/a 109 (3) 54 (4) n/a 163 58 n/a 177Canada n/a 144 (3) 52 (4) n/a 231 78 n/a 127
Trading n/a n/a n/a n/a 413 407 n/a 2Other(6) n/a n/a n/a n/a (233) (430) n/a (24)
kt c/lb c/lb
Copper 672 (7) 283 (8) 134 (9) 5,168 1,856 1,234 917 703Los Bronces(10) 376 n/a 145 (9) 2,175 969 625 n/a 217Collahuasi(11) 243 n/a 105 (9) 1,460 960 736 642 295Quellaveco(12) n/a n/a n/a n/a n/a n/a n/a 131Other(13) 53 n/a n/a 1,533 (73) (127) n/a 60
koz $/Pt oz $/Pt oz
Platinum Group Metals 2,424 (14) 2,219 (15) 1,561 (16) 5,680 1,062 705 418 496Mogalakwena 492 (14) 2,759 (15) 1,398 (16) 1,367 623 478 n/a 210Amandelbult 445 (14) 2,222 (15) 1,717 (16) 996 153 96 n/a 74Processing and trading(17) 1,120 (14) n/a n/a 2,428 218 187 n/a —Other(18) 367 2,272 1,600 889 68 (56) n/a 212
Mt $/t $/t
Iron Ore n/a n/a n/a 3,768 1,177 747 (117) 415Kumba Iron Ore 43.3 72 (20) 32 (21) 3,440 1,489 (22) 1,158 (22) 415 (22) 309Iron Ore Brazil (Minas-Rio) 3.2 70 (20) n/a (21) 328 (312) (22) (411) (22) (532) (22) 106
Mt $/t $/t
Coal n/a n/a n/a 7,788 3,196 2,538 1,755 722Metallurgical Coal 22.0 (23) 190 (24) 64 (25) 4,231 2,158 (26) 1,722 (26) 1,228 (26) 574Thermal Coal – South Africa 18.3 (23) 87 (24) 44 (25) 2,719 650 (26) 521 (26) 334 (26) 148Thermal Coal – Colombia(27) 10.1 83 36 838 388 295 193 —
Nickel and Manganese n/a n/a n/a 1,707 844 685 526 38Nickel 43,100 t 588 c/lb 361 c/lb (28) 560 181 (29) 75 (29) 171 (29) 38Manganese (Samancor)(30) 3.7 Mt n/a n/a 1,147 663 610 355 —
Corporate and other n/a n/a n/a 3 (219) (226) (611) 27Exploration n/a n/a n/a — (113) (113) (105) —Corporate activities and
unallocated costs n/a n/a n/a 3 (106) (113) (506) 27
n/a n/a n/a 30,196 9,161 6,377 3,237 2,818
(1) Group revenue is shown after deduction of treatment and refining charges (TC/RCs).(2) Total sales volumes on a 100% basis were 30.9 million carats (2018: 33.7 million carats).
Total sales volumes (100%) include De Beers Group’s joint arrangement partners’ 50%proportionate share of sales to entities outside De Beers Group from Diamond TradingCompany Botswana and Namibia Diamond Trading Company.
(3) Pricing for the mining business units is based on 100% selling value post-aggregation ofgoods. The De Beers realised price includes the price impact of the sale of non-equityproduct and, as a result, is not directly comparable to De Beers unit costs, which relate toequity production only.
(4) Unit cost is based on consolidated production and operating costs, excluding depreciationand operating special items, divided by carats recovered.
(5) Includes rough diamond sales of $4.0 billion (2018: $5.4 billion). (6) Other includes Element Six, downstream, acquisition accounting adjustments and corporate. (7) Excludes 349 kt third-party sales (2018: 178 kt). (8) Realised price, excludes impact of third-party sales.(9) C1 unit cost includes by-product credits. (10) Figures on a 100% basis (Group’s share: 50.1%).(11) 44% share of Collahuasi production, sales and financials. (12) Figures on a 100% basis (Group’s share: 60%), except capex which represents the Group’s
share after deducting direct funding from non-controlling interests. 2019 capex on a 100%basis was $1,338 million, of which $515 million was funded by cash from the Mitsubishisyndication transaction in 2018. Of the remaining $823 million, the Group and Mitsubishifunded their respective 60% and 40% shares via shareholder loans.
(13) Other operations includes El Soldado and Chagres (figures on a 100% basis, Group’s share:50.1%), third-party sales and purchases.
(14) Sales volumes exclude the sale of refined metal purchased from third parties and toll material.Comparatives include purchase of concentrate volumes now transitioned to tolling.
(15) Average US$ realised basket price. Excludes the impact of the sale of refined metalpurchased from third parties.
(16) Total cash operating costs – includes on-mine, smelting and refining costs only. (17) Purchase of concentrate from joint operations, associates and third parties for processing
into refined metals, tolling and trading activities.
(18) Includes Unki, Union (prior to disposal), Mototolo (post-acquisition on 1 November 2018),PGMs’ share of joint operations.
(19) Sales volumes, stock and realised price for 2019 differ to Kumba’s stand-alone reportedresults due to sales to other Group companies.
(20) Prices for Kumba Iron Ore are the average realised export basket price (FOB Saldanha).Prices for Minas-Rio are the average realised export basket price (FOB Açu) (wet basis).
(21) Unit costs for Kumba Iron Ore are on an FOB (dry) basis. Unit costs for Minas-Rio are onan FOB (wet) basis and were not disclosed for 2018, due to the suspension of operations.
(22) Kumba Iron Ore segment includes $66 million projects and corporate costs (2018:$55 million). Iron Ore Brazil segment includes $55 million projects and corporate costs(2018: $40 million).
(23) South African sales volumes include export primary production, secondary production soldinto export markets and production sold domestically at export parity pricing and pre-commercial production volumes from Navigation section of Khwezela and exclude domesticsales of 9.8 Mt (2018: 13.1 Mt) and non-equity traded sales of 10.9 Mt (2018: 9.5 Mt).Included in 2018 is domestic sales of 2.8 Mt from the Eskom-tied operations, which weresold on 1 March 2018. Metallurgical Coal sales volumes exclude thermal coal sales of 1.8 Mt(2018: 1.6 Mt).
(24) Metallurgical Coal realised price is the weighted average hard coking coal and PCI sales priceachieved. Thermal Coal – South Africa realised price is the weighted average export thermalcoal price achieved. Excludes third-party sales.
(25) FOB cost per saleable tonne, excluding royalties. Metallurgical Coal excludes study costs.Thermal Coal – South Africa unit cost is for the trade operations.
(26) Metallurgical Coal segment includes $69 million projects and corporate costs (2018:$52 million). Thermal Coal – South Africa segment includes $59 million projects andcorporate costs (2018: $45 million).
(27) Represents the Group’s attributable share from its 33.3% interest in Cerrejón. (28) C1 unit cost. (29) Nickel segment includes $12 million projects and corporate costs (2018: $8 million). (30) Sales and financials include ore and alloy. (31) In 2018, includes the acquisition of Peregrine Diamonds Limited for a consideration of
$87 million.
FINANCIAL STATEMENTS AND OTHER FINANCIAL INFORMATION SUMMARY BY OPERATION
218 Anglo American plc Integrated Annual Report 2019

This section includes certain Alternative Performance Measures (APMs). For more information on the APMs used by the Group, including definitions, please refer topage 228.
US$ million (unless otherwise stated) 2019 2018 2017 2016 2015 2014 20132012
restated(1) 2011 2010
Income statement measures
Group revenue 31,825 30,196 28,650 23,142 23,003 30,988 33,063 32,785 36,548 32,929Underlying EBIT 7,010 6,377 6,247 3,766 2,223 4,933 6,620 6,253 11,095 9,763Underlying EBITDA 10,006 9,161 8,823 6,075 4,854 7,832 9,520 8,860 13,348 11,983Revenue 29,870 27,610 26,243 21,378 20,455 27,073 29,342 28,680 30,580 27,960Net finance costs (before special items and
remeasurements) (420) (380) (473) (209) (458) (256) (276) (299) (20) (244)
Profit/(loss) before tax 6,146 6,189 5,505 2,624 (5,454) (259) 1,700 (171) 10,782 10,928Profit/(loss) for the financial year 4,582 4,373 4,059 1,926 (5,842) (1,524) 426 (564) 7,922 8,119Non-controlling interests (1,035) (824) (893) (332) 218 (989) (1,387) (906) (1,753) (1,575)Profit/(loss) attributable to equity shareholders
of the Company 3,547 3,549 3,166 1,594 (5,624) (2,513) (961) (1,470) 6,169 6,544
Underlying earnings 3,468 3,237 3,272 2,210 827 2,217 2,673 2,860 6,120 4,976Balance sheet measures
Capital employed 35,576 32,269 32,813 31,904 32,842 43,782 46,551 49,757 41,667 42,135Net assets 31,385 29,832 28,882 24,325 21,342 32,177 37,364 43,738 43,189 37,971Non-controlling interests (6,590) (6,234) (5,910) (5,309) (4,773) (5,760) (5,693) (6,127) (4,097) (3,732)Equity attributable to equity shareholders
of the Company 24,795 23,598 22,972 19,016 16,569 26,417 31,671 37,611 39,092 34,239
Cash flow measures
Cash flows from operations 9,260 7,782 8,375 5,838 4,240 6,949 7,729 7,370 11,498 9,924Capital expenditure (3,840) (2,818) (2,150) (2,387) (4,177) (6,018) (6,075) (5,947) (5,672) (4,902)Net debt (4,626) (2,848) (4,501) (8,487) (12,901) (12,871) (10,652) (8,510) (1,374) (7,384)Metrics and ratios
Underlying earnings per share (US$) 2.75 2.55 2.57 1.72 0.64 1.73 2.09 2.28 5.06 4.13Earnings per share (US$) 2.81 2.80 2.48 1.24 (4.36) (1.96) (0.75) (1.17) 5.10 5.43Ordinary dividend per share (US cents) 109 100 102 — 32 85 85 85 74 65Ordinary dividend cover (based on underlying
earnings per share) 2.5 2.6 2.5 — 2.0 2.0 2.5 2.7 6.8 6.4
Underlying EBIT margin 22.0% 21.1% 21.8% 16.3% 9.7% 15.9% 20.0% 19.1% 30.4% 29.6%Underlying EBIT interest cover(2) 18.0 19.9 16.5 16.7 10.1 30.1 35.8 36.8 n/a 34.2Underlying effective tax rate 30.8% 31.3% 29.7% 24.6% 31.0% 29.8% 32.0% 29.0% 28.3% 31.9%Gearing (net debt to total capital)(3) 13% 9% 13% 26% 38% 29% 22% 16% 3% 16%
(1) Certain balances relating to 2012 were restated to reflect the adoption of new accounting pronouncements. See note 2 of the 2013 Consolidated financial statements for details.(2) Underlying EBIT interest cover is underlying EBIT divided by net finance costs, excluding net foreign exchange gains and losses, unwinding of discount relating to provisions and other liabilities,
financing special items and remeasurements, and including the Group’s attributable share of associates’ and joint ventures’ net finance costs, which in 2011 resulted in a net finance income andtherefore the ratio is not applicable.
(3) Net debt to total capital is calculated as net debt divided by total capital (being ‘Net assets’ as shown in the Consolidated balance sheet excluding net debt).
FINANCIAL STATEMENTS AND OTHER FINANCIAL INFORMATION
KEY FINANCIAL DATA
Anglo American plc Integrated Annual Report 2019 219

US$ exchange rates 2019 2018
Year end spot rates
South African rand 14.03 14.38Brazilian real 4.02 3.88Sterling 0.76 0.78Australian dollar 1.43 1.42Euro 0.89 0.87Chilean peso 752 694Botswana pula 10.60 10.71Peruvian sol 3.32 3.37
Average rates for the year
South African rand 14.45 13.25Brazilian real 3.95 3.65Sterling 0.78 0.75Australian dollar 1.44 1.34Euro 0.89 0.85Chilean peso 703 642Botswana pula 10.77 10.18Peruvian sol 3.34 3.29
Commodity prices 2019 2018
Year end spot prices
Copper(1) US cents/lb 279 270Platinum(2) US$/oz 971 794Palladium(2) US$/oz 1,920 1,263Rhodium(3) US$/oz 6,050 2,445Iron ore (62% Fe CFR)(4) US$/tonne 92 73Iron ore (66% Fe Concentrate CFR)(5) US$/tonne 106 91Hard coking coal (FOB Australia)(4) US$/tonne 140 220PCI (FOB Australia)(4) US$/tonne 87 122Thermal coal (FOB South Africa)(6) US$/tonne 87 97Thermal coal (FOB Australia)(7) US$/tonne 66 103Thermal coal (FOB Colombia)(6) US$/tonne 47 79Nickel(1) US cents/lb 635 481Manganese ore (44% CIF China)(5) US$/dmtu 4.20 6.85
Average market prices for the year
Copper(1) US cents/lb 272 296Platinum(2) US$/oz 864 880Palladium(2) US$/oz 1,539 1,029Rhodium(3) US$/oz 3,914 2,214Iron ore (62% Fe CFR)(4) US$/tonne 93 69Iron ore (66% Fe Concentrate CFR)(5) US$/tonne 104 95Hard coking coal (FOB Australia)(4) US$/tonne 177 207PCI (FOB Australia)(4) US$/tonne 110 136Thermal coal (FOB South Africa)(6) US$/tonne 72 98Thermal coal (FOB Australia)(7) US$/tonne 78 107Thermal coal (FOB Colombia)(6) US$/tonne 54 85Nickel(1) US cents/lb 632 595Manganese ore (44% CIF China)(5) US$/dmtu 5.58 7.24
(1) Source: London Metal Exchange (LME).(2) Source: London Platinum and Palladium Market (LPPM).(3) Source: Johnson Matthey/Comdaq.(4) Source: Platts.(5) Source: Metal Bulletin.(6) Source: Argus/McCloskey.(7) Source: globalCOAL.
FINANCIAL STATEMENTS AND OTHER FINANCIAL INFORMATION
EXCHANGE RATES AND COMMODITY PRICES
220 Anglo American plc Integrated Annual Report 2019

ORE RESERVES AND MINERAL RESOURCESas at 31 December 2019
The Ore Reserve and Mineral Resource estimates presented in thisreport were prepared in accordance with the Anglo American plc GroupOre Reserves and Mineral Resources Reporting Policy. This policyrequires that the Australasian Code for Reporting of ExplorationResults, Mineral Resources and Ore Reserves 2012 edition (the JORCCode) be used as a minimum standard. Some Anglo American plcsubsidiaries have a primary listing in South Africa where publicreporting is carried out in accordance with the South African Code forReporting of Exploration Results, Mineral Resources and MineralReserves (the SAMREC Code). The SAMREC Code is similar to theJORC Code and the Ore Reserve and Mineral Resource terminologyappearing in this section follows the definitions in both the JORC (2012)and SAMREC (2016) Codes. Ore Reserves in the context of this reporthave the same meaning as ‘Mineral Reserves’ as defined by theSAMREC Code and the CIM (Canadian Institute of Mining andMetallurgy) Definition Standards on Mineral Resources andMineral Reserves.
The information on Ore Reserves and Mineral Resources was prepared by orunder the supervision of Competent Persons as defined in the JORC orSAMREC Codes. All Competent Persons have sufficient experience relevant tothe style of mineralisation and type of deposit under consideration and to theactivity which they are undertaking. All the Competent Persons consent to theinclusion in this report of the information in the form and context in which itappears. The names of the Competent Persons (CPs) along with theirRecognised Professional Organisation (RPO) affiliation and years of relevantexperience are listed in the Ore Reserves and Mineral Resources Report 2019.
Anglo American Group companies are subject to a comprehensiveprogramme of reviews aimed at providing assurance in respect of OreReserve and Mineral Resource estimates. The reviews are conducted bysuitably qualified Competent Persons from within the Anglo American Groupor by independent consultants. The frequency and depth of the reviews isa function of the perceived risks and/or uncertainties associated with aparticular Ore Reserve and Mineral Resource. The overall value of the entityand time that has elapsed since an independent third-party review are alsoconsidered. Those operations/projects that were subjected to independentthird-party reviews during the year are indicated in footnotes to the tables.
Both the JORC and SAMREC Codes require due consideration of reasonableprospects for eventual economic extraction for Mineral Resource definition.These include long-range commodity price forecasts which are prepared by in-house specialists largely using estimates of future supply and demand and long-term economic outlooks. The calculation of Mineral Resource and Ore Reserveestimates are based on long-term prices determined at the beginning of thesecond quarter of each year. Ore Reserves are dynamic and more likely to beaffected by fluctuations in the prices of commodities, uncertainties in productioncosts, processing costs and other mining, infrastructure, legal, environmental,social and governmental factors which may impact the financial condition andprospects of the Group. Mineral Resource estimates also change and tend tobe most influenced by new information pertaining to the understanding of thedeposit and secondly by the conversion to Ore Reserves. Unless otherwisestated, Mineral Resources are additional to (exclusive of) those resourcesconverted to Ore Reserves and are reported on a dry tonnes basis.
Mineral Resource classification defines the confidence associated with differentparts of the Mineral Resource. The confidence that is assigned refers collectivelyto the reliability of the Grade and Tonnage estimates. This reliability includesconsideration for the fidelity of the base data, the geological continuitypredicated by the level of understanding of the geology, the likely precision ofthe estimated grades and understanding of grade variability, as well as variousother factors (in particular density) that may influence the confidence that canbe placed on the Mineral Resource. Most business units have developedcommodity-specific scorecard-based approaches to the classification of theirMineral Resources.
The appropriate Mineral Resource classification is determined by the appointedCompetent (or Qualified) Persons. The choice of category of Mineral Resourcedepends upon the quantity, distribution and quality of geoscientific informationavailable and the level of confidence in these data.
The estimates of Ore Reserves and Mineral Resources are stated as at31 December 2019. The figures in the tables have been rounded, and ifused to derive totals and averages, minor differences may result.
The Ore Reserves and Mineral Resources Report 2019 should be consideredthe only valid source of Ore Reserve and Mineral Resource information for theAnglo American Group exclusive of Kumba Iron Ore and Anglo AmericanPlatinum Limited which publish their own independent annual reports.
It is accepted that mine design and planning may include some Inferred MineralResources. Inferred Mineral Resources in the Life of Mine Plan (LOM Plan) aredescribed as ‘Inferred (in LOM Plan)’ separately from the remaining InferredMineral Resources described as ‘Inferred (ex. LOM Plan)’, as required. Theseresources are declared without application of any Modifying Factors. ReserveLife reflects the scheduled extraction period in years for the total Ore Reservesin the approved Life of Mine Plan.
The Ownership (Attributable) Percentage that Anglo American holds in eachoperation and project is presented beside the name of each entity and is theGroup’s effective ownership interest. Operations and projects which fall belowthe internal threshold for reporting (25% attributable interest) are not reported.Operations or projects which were disposed of during 2019 and hence notreported are: Bafokeng Rasimone Platinum Mine (Platinum) and Serro Project(Iron Ore Brazil).
In South Africa, the Minerals and Petroleum Resources Development Act,Number 28 of 2002 (MPRDA) was implemented on 1 May 2004 (subsequentlyamended by the Minerals and Petroleum Resources Development AmendmentAct 49 of 2008) effectively transferred custodianship of the previously privatelyheld mineral rights to the State.
A Prospecting Right is a right issued in terms of the MPRDA that is validfor up to five years, with the possibility of a further extension of three years.
A Mining Right is a right issued in terms of the MPRDA and is valid for up to30 years, with the possibility of a further extension of 30 years. The Ministerof Mineral Resources will grant a renewal of the Mining Right if the terms andconditions of the Mining Right have been complied with and the applicant isnot in contravention of any relevant provisions of the MPRDA.
In preparing the Ore Reserve and Mineral Resource statement for South Africanassets, Anglo American plc has adopted the following reporting principles inrespect of Prospecting Rights and Mining Rights:
• Where applications for Mining Rights and Prospecting Rights have beensubmitted and these are still being processed by the relevant regulatoryauthorities, the relevant Ore Reserves and Mineral Resources have beenincluded in the statement.
• Where applications for Mining Rights and Prospecting Rights have beeninitially refused by the regulatory authorities, but are the subject of ongoinglegal process and discussions with the relevant authorities and whereAnglo American plc has reasonable expectations that the Prospecting Rightswill be granted in due course, the relevant Mineral Resources have beenincluded in the statement (any associated comments appear in the footnotes).
The detailed Ore Reserve and Mineral Resource estimates, Reserve and ResourceReconciliation Overview, Definitions and Glossary are contained in the separateOre Reserves and Mineral Resources Report 2019 which is available in the AnnualReporting Centre on the Anglo American website.
ORE RESERVES AND MINERAL RESOURCES
Anglo American plc Integrated Annual Report 2019 221

ESTIMATED ORE RESERVES(1)
as at 31 December 2019Detailed Proved and Probable estimates appear on the referenced pages in the Ore Reserves and Mineral Resources Report 2019.
Total Proved & Probable
DIAMOND(3) OPERATIONS – DBCi(See page 10 in R&R Report for details)
Ownership%
MiningMethod
LOM(2)
(years)Saleable Carats
(Mct)Treated Tonnes
(Mt)Recovered Grade
(cpht)
Gahcho Kué Kimberlite 43.4 OP 11 52.1 32.6 160.2
DIAMOND(3) OPERATIONS – DBCM(See page 11 in R&R Report for details)
Ownership%
MiningMethod
LOM(2)
(years)Saleable Carats
(Mct)Treated Tonnes
(Mt)Recovered Grade
(cpht)
Venetia (OP) Kimberlite 62.9 OP 27 11.3 9.9 114.3Venetia (UG) Kimberlite UG 78.5 98.6 79.7
DIAMOND(3) OPERATIONS – Debswana(See pages 12 & 13 in R&R Report for details)
Ownership%
MiningMethod
LOM(2)
(years)Saleable Carats
(Mct)Treated Tonnes
(Mt)Recovered Grade
(cpht)
Damtshaa Kimberlite 42.5 OP 16 4.2 23.2 18.0Jwaneng Kimberlite 42.5 OP 16 152.4 120.9 126.1Letlhakane TMR 42.5 n/a 22 6.6 29.2 22.5Orapa Kimberlite 42.5 OP 12 136.8 121.9 112.2
DIAMOND(3) OPERATIONS – Namdeb(See page 14 in R&R Report for details)
Ownership%
MiningMethod
LOM(2)
(years)Saleable Carats
(kct)Treated Tonnes
(kt)Recovered Grade
(cpht)
Mining Area 1 Beaches 42.5 OC 3 44 818 5.38Orange River Fluvial Placers 42.5 OC 3 86 7,180 1.20
Saleable Carats(kct)
Areak (m2)
Recovered Grade(cpm2)
Atlantic 1 Marine Placers 42.5 MM 31 6,209 107,792 0.06
COPPER OPERATIONS(See page 16 in R&R Report for details)
Ownership%
MiningMethod
Reserve Life(2)
(years)Contained Copper
(kt)ROM Tonnes
(Mt)Grade
(%TCu)
Collahuasi Sulphide (direct feed) 44.0 OP 51 25,708 2,634.5 0.98Low Grade Sulphide (incl. stockpile) 2,384 420.6 0.57
El Soldado Sulphide 50.1 OP 8 462 59.2 0.78Los Bronces Sulphide – Flotation 50.1 OP 35 7,624 1,365.3 0.56
Sulphide – Dump Leach 1,742 630.9 0.28
PLATINUM(4) OPERATIONS(See pages 19 & 20 in R&R Report for details)
Ownership%
MiningMethod
Reserve Life(2)
(years)Contained Metal
(4E Moz)ROM Tonnes
(Mt)Grade
(4E g/t)
Amandelbult Complex MR & UG2 Reefs 78.0 UG >21 15.5 109.1 4.41Mogalakwena Platreef (incl. stockpiles) 78.0 OP >21 118.8 1,256.2 2.94Mototolo UG2 Reef 78.0 UG 16 3.0 27.8 3.34Unki Main Sulphide Zone 78.0 UG 22 5.6 53.3 3.27Non-Managed MR & UG2 Reefs 45.3 UG n/a 8.6 75.2 3.58
KUMBA IRON ORE OPERATIONS(See page 24 in R&R Report for details)
Ownership%
MiningMethod
Reserve Life(2)
(years)Saleable product
(Mt)Grade(%Fe)
Kolomela Hematite (incl. ROM stockpile) 53.2 OP 12 163 64.3Sishen Hematite (incl. ROM stockpile) 53.2 OP 13 388 63.9
IRON ORE BRAZIL OPERATIONS(See page 26 in R&R Report for details)
Ownership%
MiningMethod
Reserve Life(2)
(years)Saleable product(5)
(Mt)Grade(5)
(%Fe)
Serra do Sapo Friable Itabirite and Hematite 100 OP 52 637 67.5Itabirite 764 67.5
Operations = Mines in steady-state or projects in ramp-up phase. TMR = Tailings Mineral Resource. Mining method: OP = Open Pit, UG = Underground, OC = Open Cast/Cut, MM = Marine Mining.Mct = Million carats. Mt = Million tonnes. kct = thousand carats. kt = thousand tonnes. k (m²) = thousand square metres.Diamond Recovered Grade is quoted as carats per hundred metric tonnes (cpht) or as carats per square metre (cpm²).Values reported as 0.0 represent estimates less than 0.05.TCu = Total Copper. 4E is the sum of Platinum, Palladium, Rhodium and Gold.Moz = Million troy ounces. g/t = grams per tonne.ROM = Run of Mine.MR = Merensky Reef.Non-Managed = Kroondal, Modikwa mines and Siphumelele 3 shaft.
ORE RESERVES AND MINERAL RESOURCES
222 Anglo American plc Integrated Annual Report 2019

Estimated Ore Reserves continued Total Proved & Probable
COAL OPERATIONS – Australia(See page 27 in R&R Report for details)
Ownership%
MiningMethod
Reserve Life(2)
(years)Saleable Tonnes(6)
(Mt) Saleable Quality
Capcoal (OC)* Metallurgical – Coking 78.2 OC 19 32.1 5.5 CSNMetallurgical – Other 49.7 6,850 kcal/kgThermal – Export 9.6 5,980 kcal/kg
Capcoal (UG)* Metallurgical – Coking 70.0 UG 2 10.1 8.5 CSNDawson Metallurgical – Coking 51.0 OC 18 78.9 7.0 CSN
Thermal – Export 66.2 6,690 kcal/kgGrosvenor Metallurgical – Coking 100 UG 18 80.0 8.5 CSNMoranbah North Metallurgical – Coking 88.0 UG 20 145.6 7.5 CSN
COAL OPERATIONS – Colombia(See page 27 in R&R Report for details)
Ownership%
MiningMethod
Reserve Life(2)
(years)Saleable Tonnes(6)
(Mt) Saleable Quality
Cerrejón Thermal – Export 33.3 OC 14 327.8 6,040 kcal/kg
COAL OPERATIONS – South Africa(See pages 28 & 31 in R&R Report for details)
Ownership%
MiningMethod
Reserve Life(2)
(years)Saleable Tonnes(6)
(Mt) Saleable Quality
Goedehoop Thermal – Export 100 UG 5 13.1 5,970 kcal/kgGoedehoop – MRD Thermal – Export n/a 2 4.5 2,840 kcal/kgGreenside Thermal – Export 100 UG 7 25.2 5,930 kcal/kgGreenside – MRD Thermal – Export n/a 3 2.9 5,120 kcal/kgIsibonelo Synfuel 100 OC 7 34.9 4,630 kcal/kgKleinkopje+ Thermal – Export 100 OC 8 17.4 6,250 kcal/kgKleinkopje – MRD+ Thermal – Domestic n/a 3 7.2 4,560 kcal/kgLandau+ Thermal – Export 100 OC 7 21.0 5,650 kcal/kg
Thermal – Domestic 0.8 4,160 kcal/kgMafube Thermal – Export 50.0 OC 11 36.9 5,690 kcal/kgRietvlei Thermal – Domestic 34.0 OC 5 12.7 4,880 kcal/kgZibulo Thermal – Export 73.0 UG&OC 9 33.0 6,230 kcal/kg
Thermal – Domestic 20.0 4,960 kcal/kg
NICKEL OPERATIONS(See page 34 in R&R Report for details)
Ownership%
MiningMethod
Reserve Life(2)
(years)Contained Nickel
(kt)ROM tonnes
(Mt)Grade(%Ni)
Barro Alto Saprolite 100 OP 19 731 56.6 1.29Niquelândia Saprolite 100 OP 13 104 8.3 1.25
SAMANCOR MANGANESE OPERATIONS(See page 36 in R&R Report for details)
Ownership%
MiningMethod
Reserve Life(2)
(years)ROM tonnes
(Mt)Grade(%Mn)
GEMCO(7) ROM 40.0 OP 6 53 43.3Sands 6.8 40.0
Mamatwan 29.6 OP 16 51 36.6Wessels 29.6 UG 57 78 42.4
Operations = Mines in steady-state or projects in ramp-up phase. MRD = Mineral Residue Deposit. Mining method: OP = Open Pit, UG = Underground, OC = Open Cast/Cut.* Capcoal comprises opencast operations at Lake Lindsay and Oak Park, with an underground longwall operation at Grasstree.+ Kleinkopje and Landau operate under an integrated management structure, forming Khwezela Colliery.
(1) Estimated Ore Reserves are the sum of Proved and Probable Ore Reserves (on an exclusive basis, i.e. Mineral Resources are reported as additional to Ore Reserves unless otherwise stated).Please refer to the detailed Ore Reserve estimates tables in the Anglo American plc Ore Reserves and Mineral Resources Report for the individual Proved and Probable Reserve estimates. TheOre Reserve estimates are reported in accordance with the Australasian Code for Reporting of Exploration Results, Mineral Resources and Ore Reserves (The JORC Code, 2012) as a minimumstandard. Ore Reserve estimates for operations in South Africa are reported in accordance with The South African Code for the Reporting of Exploration Results, Mineral Resources and MineralReserves (The SAMREC Code, 2016). The figures reported represent 100% of the Ore Reserves. Anglo American plc ownership is stated separately. Rounding of figures may causecomputational discrepancies.
(2) Reserve Life = The scheduled extraction period in years for the total Ore Reserves in the approved Life of Mine Plan. LOM = Life of Mine (years) is based on scheduled Probable Reservesincluding some Inferred Resources considered for Life of Mine planning.
(3) DBCi = De Beers Canada, DBCM = De Beers Consolidated Mines, Debswana = Debswana Diamond Company, Namdeb = Namdeb Holdings. Reported Diamond Reserves are based on aBottom Cut-Off (BCO) which refers to the bottom screen size aperture and varies between 1.00mm and 3.00mm (nominal square mesh). Specific BCO’s applied to derive estimates are includedin the detailed Diamond Reserve tables in the Anglo American plc Ore Reserves and Mineral Resources Report.
(4) Details of the individual Anglo American Platinum Limited Managed and Non-Managed operations appear in the Anglo American plc Ore Reserves and Mineral Resources Report. Ownershippercentage for Non-Managed is weighted by Contained Metal (4E Moz) contributions from each operation.
(5) Iron Ore Brazil Saleable Product tonnes are reported on a wet basis (average moisture content is 9.2 wt% of the wet mass) with grade stated on a dry basis.(6) Total Saleable Tonnes represents the product tonnes quoted as metric tonnes on a product moisture basis. The coal quality for Coal Reserves is quoted as either kilocalories per kilogram (kcal/kg)
or Crucible Swell Number (CSN). Kilocalories per kilogram represent Calorific Value (CV) on a Gross As Received (GAR) basis. CV is rounded to the nearest 10 kcal/kg and CSN to the nearest 0.5index. Metallurgical – Coking: High-, medium- or low-volatile semi-soft, soft or hard coking coal primarily for blending and use in the steel industry. Metallurgical – Other: Semi-soft, soft, hard,semi-hard or anthracite coal, other than Coking Coal, such as pulverised coal injection (PCI) or other general metallurgical coal for the export or domestic market with a wider range of propertiesthan Coking Coal. Thermal – Export: Low- to high-volatile thermal coal primarily for export in the use of power generation; quality measured by calorific value (CV). Thermal – Domestic: Low- tohigh-volatile thermal coal primarily for domestic consumption in power generation. Synfuel: Coal specifically for the domestic production of synthetic fuel and chemicals.
(7) GEMCO Ore Reserve Manganese grades are reported as expected product and should be read together with their respective mass yields, ROM: 61%, Sands: 22%.
ORE RESERVES AND MINERAL RESOURCES
Anglo American plc Integrated Annual Report 2019 223

ESTIMATED MINERAL RESOURCES(1)
as at 31 December 2019Detailed Measured, Indicated and Inferred estimates appear on the referenced pages in the Ore Reserves and Mineral Resources Report 2019.
Total Measured & Indicated Total Inferred(2)
DIAMOND(3) OPERATIONS – DBCi(See page 10 in R&R Report for details)
Ownership%
MiningMethod
Carats(Mct)
Tonnes(Mt)
Grade(cpht)
Carats(Mct)
Tonnes(Mt)
Grade (cpht)
Gahcho Kué Kimberlite 43.4 OP 2.8 2.2 125.9 19.4 13.6 142.6
DIAMOND(3) OPERATIONS – DBCM(See page 11 in R&R Report for details)
Ownership%
MiningMethod
Carats(Mct)
Tonnes(Mt)
Grade(cpht)
Carats(Mct)
Tonnes(Mt)
Grade (cpht)
Venetia (OP) Kimberlite 62.9 OP — — — 1.3 5.6 24.0Venetia (UG) Kimberlite UG — — — 59.6 69.9 85.3Voorspoed Kimberlite 62.9 OP 0.5 1.9 26.9 3.5 18.5 19.0
DIAMOND(3) OPERATIONS – Debswana(See pages 12 & 13 in R&R Report for details)
Ownership%
MiningMethod
Carats(Mct)
Tonnes(Mt)
Grade(cpht)
Carats(Mct)
Tonnes(Mt)
Grade (cpht)
Damtshaa Kimberlite 42.5 OP 0.8 3.7 22.7 5.3 22.0 24.2Jwaneng Kimberlite 42.5 OP 57.8 70.4 82.1 63.1 74.2 85.0
TMR & ORT n/a — — — 22.5 29.7 76.0Letlhakane TMR & ORT 42.5 n/a 1.0 0.0 5,442.1 14.9 56.0 26.6Orapa Kimberlite 42.5 OP 286.7 285.9 100.3 66.2 77.7 85.2
DIAMOND(3) OPERATIONS – Namdeb(See page 14 in R&R Report for details)
Ownership%
MiningMethod
Carats(kct)
Tonnes(kt)
Grade(cpht)
Carats(kct)
Tonnes (kt)
Grade(cpht)
Douglas Bay Aeolian and Deflation 42.5 OC 160 2,269 7.05 1 127 0.79Elizabeth Bay Aeolian, Marine and Deflation 42.5 OC 148 2,165 6.84 2,151 28,469 7.56Mining Area 1 Beaches 42.5 OC 287 38,196 0.75 3,082 194,824 1.58Orange River Fluvial Placers 42.5 OC 117 27,898 0.42 227 65,619 0.35
Carats(kct)
Area k (m2)
Grade(cpm2)
Carats(kct)
Area k (m2)
Grade(cpm2)
Atlantic 1 Marine Placers 42.5 MM 11,127 133,579 0.08 69,630 994,996 0.07Midwater Marine 42.5 MM 1,192 7,396 0.16 1,031 11,334 0.09
COPPER OPERATIONS(See page 17 in R&R Report for details)
Ownership%
MiningMethod
Contained Copper(kt)
Tonnes(Mt)
Grade(%TCu)
Contained Copper(kt)
Tonnes (Mt)
Grade(%TCu)
Collahuasi Oxide and Mixed 44.0 OP 489 70.0 0.70 289 50.6 0.57Sulphide (direct feed) 9,193 957.6 0.96 26,801 3,024.7 0.89Low Grade Sulphide (in situ & stockpile) 5,917 1,308.7 0.45 8,040 1,729.9 0.46
El Soldado Sulphide 50.1 OP 758 136.4 0.56 27 7.0 0.39Los Bronces Sulphide – Flotation 50.1 OP 10,238 2,318.1 0.44 5,484 1,232.6 0.44
Sulphide – Dump Leach — — — 17 6.8 0.25
PLATINUM(4) OPERATIONS(See pages 21 & 23 in R&R Report for details)
Ownership%
MiningMethod
Contained Metal(4E Moz)
Tonnes(Mt)
Grade(4E g/t)
Contained Metal(4E Moz)
Tonnes (Mt)
Grade(4E g/t)
Amandelbult Complex MR & UG2 Reefs & Tailings 78.0 UG 55.9 354.2 4.91 23.3 115.9 6.25Mogalakwena Platreef 78.0 OP 117.7 1,596.8 2.29 33.8 596.0 1.76Mototolo UG2 Reef 78.0 UG 1.8 14.0 4.03 — — —Twickenham MR & UG2 Reefs 78.0 UG 60.7 335.7 5.62 56.0 313.9 5.55Unki Main Sulphide Zone 78.0 UG 16.5 120.2 4.28 6.5 47.8 4.22Non-Managed MR & UG2 Reefs 38.5 UG 120.6 688.0 5.45 99.6 602.1 5.14
KUMBA IRON ORE OPERATIONS(See page 24 in R&R Report for details)
Ownership%
MiningMethod
Tonnes(Mt)
Grade(%Fe)
Tonnes(Mt)
Grade(%Fe)
Kolomela Hematite (in situ & stockpile) 53.2 OP 116.2 62.4 33.7 63.2Sishen Hematite (in situ & stockpile) 53.2 OP 395.8 54.6 24.5 52.2
IRON ORE BRAZILOPERATIONS(See page 26 in R&R Report for details)
Ownership%
MiningMethod
Tonnes(5)
(Mt)Grade(5)
(%Fe)Tonnes(5)
(Mt)Grade(5)
(%Fe)
Serra do Sapo Friable Itabirite and Hematite 100 OP 282.2 32.0 85.4 36.4Itabirite 1,255.5 30.8 544.6 31.1
Operations = Mines in steady-state or projects in ramp-up phase. TMR = Tailings Mineral Resource. ORT = Old Recovery Tailings.Mining method: OP = Open Pit, UG = Underground, OC = Open Cast/Cut, MM = Marine Mining.Mct = Million carats. Mt = Million tonnes. kct = thousand carats. kt = thousand tonnes. k (m²) = thousand square metres.Diamond Grade is quoted as carats per hundred metric tonnes (cpht) or as carats per square metre (cpm²).Values reported as 0.0 represent estimates less than 0.05.TCu = Total Copper. 4E is the sum of Platinum, Palladium, Rhodium and Gold.Moz = Million troy ounces. g/t = grams per tonne.MR = Merensky Reef.Non-Managed = Bokoni, Kroondal, Marikana, Modikwa mines and Siphumelele 3 shaft.
ORE RESERVES AND MINERAL RESOURCES
224 Anglo American plc Integrated Annual Report 2019

Estimated Mineral Resources continued Total Measured & Indicated Total Inferred(2)
COAL OPERATIONS – Australia(See page 29 in R&R Report for details)
Ownership%
MiningMethod
MTIS(6)
(Mt)Coal Quality
(kcal/kg)MTIS(6)
(Mt)Coal Quality
(kcal/kg)
Capcoal (OC)* 78.2 OC 144.8 6,940 175.7 6,810Capcoal (UG)* 70.0 UG 81.1 6,810 5.6 6,550Dawson 51.0 OC 757.1 6,710 455.8 6,760Grosvenor 100 UG 248.4 6,470 68.1 6,320Moranbah North 88.0 UG 138.5 6,680 60.2 6,530
COAL OPERATIONS – Colombia(See page 29 in R&R Report for details)
Ownership%
MiningMethod
MTIS(6)
(Mt)Coal Quality
(kcal/kg)MTIS(6)
(Mt)Coal Quality
(kcal/kg)
Cerrejón 33.3 OC 4,156.3 6,560 633.7 6,360
COAL OPERATIONS – South Africa(See pages 30 & 31 in R&R Report for details)
Ownership%
MiningMethod
MTIS(6)
(Mt)Coal Quality
(kcal/kg)MTIS(6)
(Mt)Coal Quality
(kcal/kg)
Goedehoop 100 UG 227.5 5,330 6.0 4,710Greenside 100 UG 10.3 5,610 0.2 5,590Greenside – MRD n/a 2.9 3,860 — —Isibonelo 100 UG 23.6 5,250 — —Kleinkopje+ 100 OC 2.1 6,250 3.1 5,740Kleinkopje – MRD+ n/a 2.4 2,700 — —Landau+ 100 OC 50.9 5,020 5.9 6,320Landau – MRD+ n/a 22.4 2,580 — —Mafube 50.0 OC 70.7 5,080 — —Rietvlei 34.0 OC 21.2 5,020 — —Zibulo 73.0 UG&OC 423.5 4,900 163.1 4,730
NICKEL OPERATIONS(See page 34 in R&R Report for details)
Ownership%
MiningMethod
Contained Nickel(kt)
Tonnes(Mt)
Grade (%Ni)
Contained Nickel(kt)
Tonnes(Mt)
Grade (%Ni)
Barro Alto Saprolite 100 OP 76 6.3 1.21 206 16.3 1.27Ferruginous Laterite 49 4.1 1.21 56 4.7 1.20
Niquelândia Saprolite 100 OP 30 2.3 1.29 — — —
SAMANCOR MANGANESE OPERATIONS(See page 36 in R&R Report for details)
Ownership%
MiningMethod
Tonnes(Mt))
Grade (%Mn)
Tonnes(Mt)
Grade (%Mn)
GEMCO(7)(8) ROM 40.0 OP 124 44.1 22 39.9Sands 8.1 20.8 2.3 20.0
Mamatwan(7) 29.6 OP 84 34.8 0.5 37.4Wessels(7) 29.6 UG 136 42.5 7.7 44.1
Operations = Mines in steady-state or projects in ramp-up phase. MRD = Mineral Residue Deposit. Mining method: OP = Open Pit, UG = Underground, OC = Open Cast/Cut.* Capcoal comprises opencast operations at Lake Lindsay and Oak Park, with an underground longwall operation at Grasstree.+ Kleinkopje and Landau operate under an integrated management structure, forming Khwezela Colliery.
(1) Estimated Mineral Resources are presented on an exclusive basis, i.e. Mineral Resources are reported as additional to Ore Reserves unless otherwise stated. Please refer to the detailedMineral Resource estimates tables in the Anglo American plc Ore Reserves and Mineral Resources Report for the detailed Measured, Indicated and Inferred Resource estimates. The MineralResource estimates are reported in accordance with the Australasian Code for Reporting of Exploration Results, Mineral Resources and Ore Reserves (The JORC Code, 2012) as a minimumstandard. The Mineral Resource estimates for operations in South Africa are reported in accordance with The South African Code for the Reporting of Exploration Results, Mineral Resourcesand Mineral Reserves (The SAMREC Code, 2016). The figures reported represent 100% of the Mineral Resources. Anglo American plc ownership is stated separately. Rounding of figuresmay cause computational discrepancies.
(2) Total Inferred is the sum of ‘Inferred (in LOM Plan)’, the Inferred Resources within the scheduled Life of Mine Plan (LOM Plan) and ‘Inferred (ex. LOM Plan)’, the portion of Inferred Resourceswith reasonable prospects for eventual economic extraction not considered in the Life of Mine Plan (LOM Plan) as relevant. Due to the uncertainty attached to Inferred Resources, it cannotbe assumed that all or part of an Inferred Resource will necessarily be upgraded to an Indicated or Measured Mineral Resource after continued exploration.
(3) DBCi = De Beers Canada, DBCM = De Beers Consolidated Mines, Debswana = Debswana Diamond Company, Namdeb = Namdeb Holdings. Estimated Diamond Resources are presentedon an exclusive basis, i.e. Diamond Resources are quoted as additional to Diamond Reserves. Reported Diamond Resources are based on a Bottom Cut-Off (BCO) which refers to the bottomscreen size aperture and varies between 1.00mm and 3.00mm (nominal square mesh). Specific BCO’s applied to derive estimates are included in the detailed Diamond Resource tables in theAnglo American plc Ore Reserves and Mineral Resources Report.
(4) Details of the individual Anglo American Platinum Limited Managed and Non-Managed operations appear in the Anglo American plc Ore Reserves and Mineral Resources Report. Ownershippercentage for Non-Managed is weighted by Contained Metal (4E Moz) contributions from each operation. Merensky Reef, UG2 Reef and Main Sulphide Zone Mineral Resources are estimatedover a ‘Resource Cut’ which takes cognisance of the mining method, potential economic viability and geotechnical aspects in the hangingwall or footwall of the reef.
(5) Iron Ore Brazil Mineral Resource tonnes and grade are reported on a dry basis.(6) Coal Resources are quoted on a Mineable Tonnes In Situ (MTIS) basis in million tonnes, which are in addition to those Coal Resources that have been modified to produce the reported Coal
Reserves. Coal Resources are reported on an in situ moisture basis. The coal quality for Coal Resources is quoted on an in situ heat content as kilocalories per kilogram (kcal/kg), representingCalorific Value (CV) on a Gross As Received (GAR) basis. CV is rounded to the nearest 10 kcal/kg.
(7) Manganese Mineral Resources are quoted on an inclusive basis and must not be added to the Ore Reserves.(8) GEMCO ROM Mineral Resource tonnes are stated as in situ, manganese grades are given as per washed ore samples and should be read together with their respective mass yields, ROM: 49%.
GEMCO Sands Mineral Resource tonnes and manganese grades are as in situ.
ORE RESERVES AND MINERAL RESOURCES
Anglo American plc Integrated Annual Report 2019 225

Ore ReservesAn ‘Ore Reserve’ is the economically mineable part of a Measured and/orIndicated Mineral Resource. It includes diluting materials and allowances forlosses, which may occur when the material is mined or extracted and is definedby studies at Pre-Feasibility or Feasibility level as appropriate that includeapplication of Modifying Factors. Such studies demonstrate that, at the timeof reporting, extraction could reasonably be justified. ‘Modifying Factors’ are(realistically assumed) considerations used to convert Mineral Resources toOre Reserves. These include, but are not restricted to, mining, processing,metallurgical, infrastructure, economic, marketing, legal, environmental, socialand governmental factors. Ore Reserves are sub-divided in order of increasingconfidence into Probable Ore Reserves and Proved Ore Reserves.
A ‘Proved Ore Reserve’ is the economically mineable part of a MeasuredMineral Resource. A Proved Ore Reserve implies a high degree of confidencein the Modifying Factors.
A ‘Probable Ore Reserve’ is the economically mineable part of an Indicated,and in some circumstances, a Measured Mineral Resource. The confidence inthe Modifying Factors applying to a Probable Ore Reserve is lower than thatapplying to a Proved Ore Reserve. A Probable Ore Reserve has a lower level ofconfidence than a Proved Ore Reserve but is of sufficient quality to serve as thebasis for a decision on the development of the deposit.
Mineral ResourcesA ‘Mineral Resource’ is a concentration or occurrence of solid material ofeconomic interest in or on the Earth’s crust in such form, grade (or quality), andquantity that there are reasonable prospects for eventual economic extraction.The location, quantity, grade (or quality), continuity and other geologicalcharacteristics of a Mineral Resource are known, estimated or interpreted fromspecific geological evidence and knowledge, including sampling. MineralResources are sub-divided, in order of increasing geological confidence, intoInferred, Indicated and Measured categories.
A ‘Measured Mineral Resource’ is that part of a Mineral Resource for whichquantity, grade (or quality), densities, shape, and physical characteristics areestimated with confidence sufficient to allow the application of ModifyingFactors to support detailed mine planning and final evaluation of the economicviability of the deposit. Geological evidence is derived from detailed and reliableexploration, sampling and testing gathered through appropriate techniques fromlocations such as outcrops, trenches, pits, workings and drill holes, and issufficient to confirm geological and grade (or quality) continuity between pointsof observation where data and samples are gathered.
A Measured Mineral Resource has a higher level of confidence than thatapplying to either an Indicated Mineral Resource or an Inferred MineralResource. It may be converted to a Proved Ore Reserve or under certaincircumstances to a Probable Ore Reserve.
An ‘Indicated Mineral Resource’ is that part of a Mineral Resource for whichquantity, grade (or quality), densities, shape and physical characteristics areestimated with sufficient confidence to allow the application of ModifyingFactors in sufficient detail to support mine planning and evaluation of theeconomic viability of the deposit. Geological evidence is derived fromadequately detailed and reliable exploration, sampling and testing gatheredthrough appropriate techniques from locations such as outcrops, trenches,pits, workings and drill holes, and is sufficient to assume geological and grade(or quality) continuity between points of observation where data and samplesare gathered.
An Indicated Mineral Resource has a lower level of confidence than thatapplying to a Measured Mineral Resource and may only be converted toa Probable Ore Reserve.
An ‘Inferred Mineral Resource’ is that part of a Mineral Resource for whichquantity and grade (or quality) are estimated on the basis of limited geologicalevidence and sampling. Geological evidence is sufficient to imply but not verifygeological and grade (or quality) continuity. It is based on exploration, samplingand testing information gathered through appropriate techniques from locationssuch as outcrops, trenches, pits, workings and drill holes.
An Inferred Mineral Resource has a lower level of confidence than that applyingto an Indicated Mineral Resource and must not be converted to an Ore Reserve.It is reasonably expected that the majority of Inferred Mineral Resources couldbe upgraded to Indicated Mineral Resources with continued exploration.
Life of Mine Plan (LOM Plan)A design and costing study of an existing operation in which appropriateassessments have been made of realistically assumed geological, mining,processing, metallurgical, infrastructure, economic, marketing, legal,environmental, social, governmental, engineering, operational and all otherModifying Factors, which are considered in sufficient detail to demonstrateat the time of reporting that extraction is reasonably justified.
Reserve LifeThe scheduled extraction period in years for the total Ore Reserves in theapproved LOM Plan.
Inferred (in LOM Plan)Inferred Resources within the scheduled LOM Plan.
Inferred (ex. LOM Plan)The portion of Inferred Resources with reasonable prospects for eventualeconomic extraction not considered in the LOM Plan.
Fatal-injury frequency rate (FIFR)(1)
FIFR is the number of employee or contractor fatal injuries due to all causes per1,000,000 hours worked.
Lost time injury frequency rate (LTIFR)(1)
LTIFR is the number of lost time injuries (LTIs) for both employees andcontractors per 1,000,000 hours worked. An LTI is a work related injury resultingin the person being unable to attend work or perform the routine functions ofhis/her job, on the next calendar day after the day of the injury, whether ascheduled workday or not. Restricted work cases are therefore counted as LTIs.
Total recordable case frequency rate (TRCFR)(1)
TRCFR is the number of fatal injuries, lost time injuries and medical treatmentcases for both employees and contractors per 1,000,000 hours worked.
New cases of occupational disease (NCOD)(1)
NCOD is the sum of occupational diseases due to asbestosis, noise-inducedhearing loss, silicosis, coal-workers’ pneumoconiosis, chronic obstructive airways disease, occupational tuberculosis, occupational asthma, hand/armvibration syndrome, musculoskeletal disorders, occupational dermatitis,occupational cancers, sensitisation to platinum or rhodium salts, malaria,venus thromboembolism, work-related mental disorders and otheroccupational diseases.
Total energy consumed(1)
Total amount of energy consumed is the sum of total energy from electricitypurchased, total energy from fossil fuels and total energy from renewable fuelsand is measured in million gigajoules (GJ).
Total water withdrawals(1)
Total water withdrawals by source, reported in line with International Council onMetals and Mining (ICMM) guidance, includes: surface water; groundwater;seawater; third-party potable water; and third-party non-potable water, and ismeasured in million m3.
OTHER INFORMATION
GLOSSARY OF TERMS
226 Anglo American plc Integrated Annual Report 2019

Greenhouse gases (GHGs)(1)
The Intergovernmental Panel on Climate Change 2006 report (as updated in2011) factors are applied as defaults for all carbon dioxide-equivalent (CO2e)and energy calculations. Where emission factors are available for specificcountries or sub-regions from government and regulatory authorities, theseare applied. Australian operations apply conversion factors required by thegovernment for regulatory reporting and operations in Brazil apply local factorsfor biomass and biofuel. Factors for CO2e from electricity are based on localgrid factors.
Based on a self-assessment, Anglo American believes it reports in accordancewith the WRI/WBCSD GHG Protocol, as issued prior to the 2015 revision onScope 2 emissions reporting. In line with the GHG Protocol’s ‘managementcontrol’ boundary, 100% of the direct and indirect emissions for managedoperations are accounted for while zero emissions for joint ventures and otherinvestments are included in the reporting scope.
Level 3, 4 and 5 environmental incidents(1)
Environmental incidents are unplanned or unwanted events resulting fromour operations that adversely impact the environment or contravene localregulations/permit conditions. They are classified from minor (Level 1) tosignificant (Level 5) depending on the duration and extent of impact, as well asthe sensitivity and/or biodiversity value of the receiving environment. Level 3-5incidents are those which we consider to have prolonged impacts on the localenvironments, lasting in excess of one month and affecting areas greater thanseveral hundred metres on site, or extending beyond the boundaries of ourimmediate operations.
Total amount spent on corporate social investment (CSI)Categories for corporate social investment expenditure include charitabledonations, community investment and commercial initiatives. CSI is reportedin US dollars and converted from the currency of the operations at theaverage foreign exchange rate applied by Anglo American for financialreporting purposes.
Charitable donations include cash donations, contributions in kind, employees’working hours spent on charity projects during work hours, and the cost ofinitiatives designed to inform communities about community-benefit initiatives(e.g. the production of reports that are issued to communities for the purposeof reporting progress). Not included is expenditure that is necessary for thedevelopment of an operation (e.g. resettlement of families) or receiving a licence.Training expenditure for individuals who will be employed by the Companyfollowing completion of training is not included.
Community investment includes the funding of community partnerships whichaddress social issues, the costs of providing public facilities to communitymembers who are not employees or dependants, the marginal value of landor other assets transferred to community ownership, and income creationschemes or mentoring/volunteering initiatives that do not have a principallycommercial justification.
Commercial initiatives include enterprise development and other communityinitiatives/partnerships that also directly support the success of the Company(such as supplier development). There must, however be a clear and primaryelement of public benefit.
We prohibit the making of donations for political purposes to any politician,political party or related organisation, an official of a political party or candidatefor political office in any circumstances either directly or through third parties.
Jobs created/sustained through enterprise developmentinitiatives in ChileIn Chile, Anglo American supports jobs through training and mentoringprogrammes. On an annual basis, we report the number of entrepreneurswho have been provided support through our local partner, TechnoServe.The associated programmes are engaged in ongoing monitoring and datais reported at the end of the reporting period.
Businesses supported through enterprise developmentinitiatives in South AfricaAnglo American supports a range of entrepreneurs and small and mediumenterprises in South Africa through the issuance of micro-finance loans.Businesses supported are enterprises for which funding has been approvedand made available by the Zimele investment committee in the reporting year.
Local procurement measurementLaunched in 2010, our Local Procurement Policy provides a framework forsupporting development outcomes through targeted procurement initiatives.This policy is further strengthened by region specific policies. Local procurementstrategies articulate the value to Anglo American and local communities.
The measurement of local procurement varies between operations, and isinformed by a combination of development outcomes and legal requirements.Local procurement occurs on multiple levels, and often as a combination offactors, including procurement from host, indigenous and previouslydisadvantaged communities.
• Host communities: includes suppliers who have their main place of businessin the direct vicinity of the operation, as defined per region.
• Indigenous communities: includes First Nation-owned companies (De BeersCanada), Aboriginal owned supplier businesses (Australia).
• Previously disadvantaged and marginalised groups: includes targetedpreferential procurement expenditure from identified beneficiary groupse.g. Black owned businesses (South Africa).
In most instances, our local procurement initiatives also take into accountcommunities that may be affected by our operations – specifically referred toas Host Community Procurement, and aimed at ensuring maximum impact onhost communities in the direct vicinity of our operations. To improve accuracyand provide a clear and focused approach to our reporting, and to ensuremaximum positive impact on our host community and local suppliers, westarted to redefine how we measure our support for local and host communitysuppliers during 2019. In 2019, this new definition was rolled out in South Africaand will be rolled out in the rest of the world in 2020. This process means thatour 2019 reporting numbers are not comparable to 2018. We expect toharmonise the data in 2020.
(1) Data relates to subsidiaries and joint operations over which Anglo American has managementcontrol. In 2018 and 2019, data excludes results from De Beers’ joint operations in Namibiaand Botswana. Prior years’ data includes results from De Beers’ joint operations in Namibiaand Botswana. See Anglo American plc Sustainability Report 2019 for the full list of entitieswithin the reporting scope.
OTHER INFORMATION GLOSSARY OF TERMS
Anglo American plc Integrated Annual Report 2019 227

IntroductionWhen assessing and discussing the Group’s reported financial performance,financial position and cash flows, management makes reference to AlternativePerformance Measures (APMs) of historical or future financial performance,financial position or cash flows that are not defined or specified underInternational Financial Reporting Standards (IFRS).
The APMs used by the Group fall into two categories:
• Financial APMs: These financial measures are usually derived from thefinancial statements, prepared in accordance with IFRS. Certain financialmeasures cannot be directly derived from the financial statements as theycontain additional information, such as financial information from earlierperiods or profit estimates or projections. The accounting policies appliedwhen calculating APMs are, where relevant and unless otherwise stated,substantially the same as those disclosed in the Group’s Consolidatedfinancial statements for the year ended 31 December 2018 with the exceptionof the new accounting pronouncements disclosed in note 38.
• Non-financial APMs: These measures incorporate certain non-financialinformation that management believes is useful when assessing theperformance of the Group.
APMs are not uniformly defined by all companies, including those in the Group’sindustry. Accordingly, the APMs used by the Group may not be comparablewith similarly titled measures and disclosures made by other companies.
APMs should be considered in addition to, and not as a substitute for or assuperior to, measures of financial performance, financial position or cash flowsreported in accordance with IFRS.
PurposeThe Group uses APMs to improve the comparability of information betweenreporting periods and business units, either by adjusting for uncontrollablefactors or special items which impact upon IFRS measures or, by aggregatingmeasures, to aid the user of the Annual Report in understanding the activitytaking place across the Group’s portfolio.
Their use is driven by characteristics particularly visible in the mining sector:
1. Earnings volatility: The Group mines and markets commodities and preciousmetals and minerals. The sector is characterised by significant volatility inearnings driven by movements in macroeconomic factors, primarily price andforeign exchange. This volatility is outside the control of management andcan mask underlying changes in performance. As such, when comparingyear-on-year performance, management excludes certain items (such asthose classed as ‘special items’) to aid comparability and then quantifies andisolates uncontrollable factors in order to improve understanding of thecontrollable portion of variances.
2. Nature of investment: Investments in the sector typically occur over severalyears and are large, requiring significant funding before generating cash.These investments are often made with partners and the nature of theGroup’s ownership interest affects how the financial results of theseoperations are reflected in the Group’s results e.g. whether full consolidation(subsidiaries), consolidation of the Group’s attributable assets and liabilities(joint operations) or equity accounted (associates and joint ventures).Attributable metrics are therefore presented to help demonstrate the financialperformance and returns available to the Group, for investment and financingactivities, excluding the effect of different accounting treatments for differentownership interests.
3. Portfolio complexity: The Group operates in a number of different, butcomplementary commodities, precious metals and minerals. The cost, valueof and return from each saleable unit (e.g. tonne, pound, carat, ounce) candiffer materially between each business. This makes understanding both theoverall portfolio performance, and the relative performance of its constituentparts on a like-for-like basis, more challenging. The Group therefore usescomposite APMs to provide a consistent metric to assess performance at theportfolio level.
Consequently, APMs are used by the Board and management for planning andreporting. A subset is also used by management in setting director andmanagement remuneration, such as attributable free cashflow prior to growthcapital expenditure. The measures are also used in discussions with theinvestment analyst community and credit rating agencies.
Financial APMs
Group APMClosest equivalent IFRS measure Adjustments to reconcile to primary statements Rationale for adjustments
Income statement
Group revenue Revenue • Revenue from associates and joint ventures • Exclude the effect of different basis ofconsolidation to aid comparability
UnderlyingEBIT
Profit/(loss) before netfinance income/(costs) and tax
• Operating and non-operating special items andremeasurements
• Underlying EBIT from associates and joint ventures
• Exclude the impact of certain items due to theirsize and nature to aid comparability
• Exclude the effect of different basis ofconsolidation to aid comparability
UnderlyingEBITDA
Profit/(loss) before netfinance income/(costs) and tax
• Operating and non-operating special items andremeasurements
• Depreciation and amortisation• Underlying EBITDA from associates and joint ventures
• Exclude the impact of certain items due to theirsize and nature to aid comparability
• Exclude the effect of different basis ofconsolidation to aid comparability
Underlyingearnings
Profit/(loss) for thefinancial yearattributable to equityshareholders of theCompany
• Special items and remeasurements • Exclude the impact of certain items due to theirsize and nature to aid comparability
Underlyingeffective tax rate
Income tax expense • Tax related to special items and remeasurements • The Group’s share of associates’ and joint ventures’ profit
before tax, before special items and remeasurements, and taxexpense, before special items and remeasurements
• Exclude the impact of certain items due to theirsize and nature to aid comparability
• Exclude the effect of different basis ofconsolidation to aid comparability
Underlyingearnings per share
Earnings per share • Special items and remeasurements • Exclude the impact of certain items due to theirsize and nature to aid comparability
Mining EBITDAmargin
Operating profitmargin
• Revenue from associates and joint ventures• Operating and non-operating special items and
remeasurements• Underlying EBIT from associates and joint ventures• Adjustment to Debswana to reflect as a 50/50 joint operation• Exclusion of third-party sales, purchases and trading activity
• Exclude non-mining revenue and EBITDA toshow a margin for mining operations only whichprovides a relevant comparison to peers
OTHER INFORMATION
ALTERNATIVE PERFORMANCE MEASURES
228 Anglo American plc Integrated Annual Report 2019

Group revenueGroup revenue includes the Group’s attributable share of associates’ and jointventures’ revenue. A reconciliation to ‘Revenue’, the closest equivalent IFRSmeasure to Group revenue, is provided within note 2 to the Consolidatedfinancial statements.
Underlying EBITUnderlying EBIT is ‘Operating profit/(loss)’ presented before special items andremeasurements(1) and includes the Group’s attributable share of associates’and joint ventures’ underlying EBIT. Underlying EBIT of associates and jointventures is the Group’s attributable share of associates’ and joint ventures’revenue less operating costs before special items and remeasurements(1) ofassociates and joint ventures.
A reconciliation to ‘Profit/(loss) before net finance income/(costs) and tax’, theclosest equivalent IFRS measure to underlying EBIT, is provided within note 2 tothe Consolidated financial statements.
Underlying EBITDAUnderlying EBITDA is underlying EBIT before depreciation and amortisation andincludes the Group’s attributable share of associates’ and joint ventures’underlying EBIT before depreciation and amortisation.
A reconciliation to ‘Profit/(loss) before net finance income/(costs) and tax’, theclosest equivalent IFRS measure to underlying EBITDA, is provided within note 2to the Consolidated financial statements.
Underlying earningsUnderlying earnings is ‘Profit/(loss) for the financial year attributable to equityshareholders of the Company’ before special items and remeasurements(1) andis therefore presented after net finance costs, income tax expense and non-controlling interests.
A reconciliation to ‘Profit/(loss) for the financial year attributable to equityshareholders of the Company’, the closest equivalent IFRS measure tounderlying earnings, is provided within note 2 to the Consolidatedfinancial statements.
Underlying effective tax rateThe underlying effective tax rate equates to the income tax expense, beforespecial items and remeasurements(1) and including the Group’s share ofassociates’ and joint ventures’ tax before special items and remeasurements(1),divided by profit before tax before special items and remeasurements(1) andincluding the Group’s share of associates’ and joint ventures’ profit before taxbefore special items and remeasurements(1).
A reconciliation to ‘Income tax expense’, the closest equivalent IFRS measure tounderlying effective tax rate, is provided within note 5 to the Consolidatedfinancial statements.
(1) Special items and remeasurements are defined in note 8 to the Consolidatedfinancial statements.
Underlying earnings per shareBasic and diluted underlying earnings per share are calculated as underlyingearnings divided by the basic or diluted shares in issue. The calculation ofunderlying earnings per share is disclosed within note 3 to the Consolidatedfinancial statements.
Mining EBITDA marginThe Mining EBITDA margin is derived from the Group’s underlying EBITDA asa percentage of Group Revenue, adjusted to exclude certain items to betterreflect the performance of the Group’s mining business. The Mining EBITDAmargin reflects Debswana accounting treatment as a 50/50 joint operation,excludes third-party sales, purchases and trading and excludes Platinum GroupMetals’ purchase of concentrate.
US$ million (unless otherwise stated) 2019 2018
Underlying EBITDA 10,006 9,161Group Revenue 31,825 30,196Margin 31% 30%
Adjustments for:Debswana adjustment to reflect as a 50/50 joint
operation 2% 5%
Exclude third-party purchases, trading activityand processing(1) 9% 6%
Mining EBITDA margin(2) 42% 42%
(1) Third-party purchases, trading activity and processing consists of Platinum Group Metals’purchase of concentrate, third-party sales and purchases and the impact of third-partytrading activity.
(2) Percentages are presented to the nearest whole number.
Net debtNet debt is calculated as total borrowings less cash and cash equivalents(including derivatives which provide an economic hedge of net debt, seenote 22, before taking into account the effect of debit valuation adjustmentsexplained in note 20). A reconciliation to the Consolidated balance sheet isprovided within note 20 to the Consolidated financial statements.
Capital expenditure (capex)Capital expenditure is defined as cash expenditure on property, plant andequipment, including related derivatives, and is presented net of proceeds fromdisposal of property, plant and equipment and includes direct funding for capitalexpenditure from non-controlling interests and reimbursement of capitalexpenditure in order to match more closely the way in which it is managed.A reconciliation to ‘Expenditure on property, plant and equipment’, the closestequivalent IFRS measure to capital expenditure, is provided within note 12 tothe Consolidated financial statements.
Operating cash flows generated by operations that have not yet reachedcommercial production are also included in capital expenditure. However,capital expenditure is also periodically shown on an underlying basis i.e. beforeinclusion of capitalised operating cash flows. Where this occurs, the measure isfootnoted as such.
Group APMClosest equivalent IFRS measure Adjustments to reconcile to primary statements Rationale for adjustments
Balance sheet
Net debt Borrowings less cashand related hedges
• Debit valuation adjustment • Exclude the impact of accounting adjustmentsfrom the net debt obligation of the Group
AttributableROCE
No direct equivalent • Non-controlling interests’ share of capital employed andunderlying EBIT
• Average of opening and closing attributable capital employed
• Exclude the effect of different basis ofconsolidation to aid comparability
Cash flow
Capitalexpenditure(capex)
Expenditure onproperty, plant andequipment
• Cash flows from derivatives related to capital expenditure• Proceeds from disposal of property, plant and equipment• Direct funding for capital expenditure from non-controlling
interests• Reimbursement of capital expenditure
• To reflect the net attributable cost of capitalexpenditure taking into account economichedges
Attributable freecash flow
Cash flows fromoperations
• Capital expenditure• Cash tax paid• Dividends from associates, joint ventures and financial
asset investments• Net interest paid• Dividends to non-controlling interests• Capital repayment of lease obligations
• To measure the amount of cash available tofinance returns to shareholders or growth afterservicing debt, providing a return to minorityshareholders and meeting existingcapex commitments
OTHER INFORMATION ALTERNATIVE PERFORMANCE MEASURES
Anglo American plc Integrated Annual Report 2019 229

Sustaining capitalSustaining capital is calculated as capital expenditure excluding capitalisedoperating cash flows and growth projects. Expenditure on growth projects in2019 principally related to Quellaveco and construction of a greenfield syntheticdiamond plant in Oregon (De Beers) (2018: Quellaveco and the acquisition ofPeregrine Diamonds). The Group uses sustaining capital as a measure toprovide additional information to understand the capital needed to sustain thecurrent production base of existing assets.
Attributable return on capital employed (ROCE)ROCE is a ratio that measures the efficiency and profitability of a company’scapital investments. Attributable ROCE displays how effectively assets aregenerating profit on invested capital for the equity shareholders of the Company.It is calculated as attributable underlying EBIT divided by average attributablecapital employed.
Attributable underlying EBIT excludes the underlying EBIT of non-controlling interests.
Capital employed is defined as net assets excluding net debt and financial assetinvestments. Attributable capital employed excludes capital employed of non-controlling interests. Average attributable capital employed is calculated byadding the opening and closing attributable capital employed for the relevantperiod and dividing by two.
Attributable ROCE is also used as an incentive measure in executives’remuneration and is predicated upon the achievement of ROCE targets in thefinal year of a three year performance period. It is one of the performancemeasures used in LTIP 17 and LTIP 18 and is proposed to be used in LTIP 19.
A reconciliation to ‘Profit/(loss) before net finance income/(costs) and tax’, theclosest equivalent IFRS measure to underlying EBIT, is provided within note 2 tothe Consolidated financial statements. A reconciliation to ‘Net assets’, theclosest equivalent IFRS measure to capital employed, is provided within note 9to the Consolidated financial statements. The table below reconciles underlyingEBIT and capital employed to attributable underlying EBIT and averageattributable capital employed by segment.
Attributable ROCE %
2019 2018
De Beers 2 8Copper 16 22Platinum Group Metals 38 15Iron Ore 31 3Coal 26 67Nickel and Manganese 20 28Corporate and other n/a n/a
19 19
2019
US$ millionUnderlying
EBIT
Less: Non-
controllinginterests’share of
underlyingEBIT
Attributableunderlying
EBIT
Openingattributable
capitalemployed
Closingcapital
employed
Less: Non-
controllinginterests’share ofclosingcapital
employed
Closingattributable
capitalemployed
Averageattributable
capitalemployed
De Beers 168 (26) 142 7,164 8,800 (1,234) 7,566 7,365Copper 960 (203) 757 4,334 8,238 (2,838) 5,400 4,867Platinum Group Metals 1,672 (371) 1,301 3,416 4,045 (640) 3,405 3,411Iron Ore 2,952 (933) 2,019 5,799 8,363 (1,202) 7,161 6,480Coal 1,010 (2) 1,008 4,066 3,787 (66) 3,721 3,894Nickel and Manganese 477 (6) 471 2,390 2,305 — 2,305 2,348Corporate and other (229) 10 (219) (51) 38 — 38 (8)
7,010 (1,531) 5,479 27,118 35,576 (5,980) 29,596 28,357
2018
US$ millionUnderlying
EBIT
Less: Non-
controllinginterests’share of
underlyingEBIT
Attributableunderlying
EBIT
Openingattributable
capitalemployed
Closing capitalemployed
Less: Non-
controllinginterests’share of
closing capitalemployed
Closingattributable
capitalemployed
Averageattributable
capitalemployed
De Beers 694 (104) 590 7,970 8,349 (1,185) 7,164 7,567Copper 1,234 (303) 931 4,159 6,463 (2,129) 4,334 4,247Platinum Group Metals 705 (176) 529 3,841 4,058 (642) 3,416 3,628Iron Ore 747 (568) 179 6,345 6,929 (1,130) 5,799 6,072Coal 2,538 (60) 2,478 3,287 4,131 (65) 4,066 3,677Nickel and Manganese 685 (11) 674 2,364 2,390 — 2,390 2,377Corporate and other (226) — (226) (241) (51) — (51) (146)
6,377 (1,222) 5,155 27,725 32,269 (5,151) 27,118 27,422
Attributable free cash flowAttributable free cash flow is calculated as ‘Cash flows from operations’ plusdividends received from associates, joint ventures and financial assetinvestments, less capital expenditure, less tax cash payments excluding taxpayments relating to disposals, less net interest paid including interest onderivatives hedging net debt, less dividends paid to non-controlling interests.
A reconciliation of ‘Cash flows from operations’, the closest equivalent IFRSmeasure, is provided on page 54 of the Group Financial Review.
OTHER INFORMATION ALTERNATIVE PERFORMANCE MEASURES
230 Anglo American plc Integrated Annual Report 2019

Non-financial APMsSome of our measures are not reconciled to IFRS either because they include non-financial information, because there is no meaningful IFRS comparison or thepurpose of the measure is not typically covered by IFRS.
Group APM Category Purpose
Copper equivalent production Portfolio complexity Communicate production/revenue generation movements in a single comparable measureremoving the impact of price
Unit cost Earnings volatility Express cost of producing one unit of saleable product
Copper equivalent unit cost Portfolio complexity Communicate the cost of production per unit in a single comparable measure for the portfolio
Productivity Portfolio complexity Highlight efficiency in generating revenue per employee
Volume and cash cost improvements Earnings volatility Quantify year-on-year underlying EBITDA improvement removing the impact of majoruncontrollable factors
Copper equivalent productionCopper equivalent production, expressed as copper equivalent tonnes, showschanges in underlying production volume. It is calculated by expressing eachcommodity’s volume as revenue, subsequently converting the revenue intocopper equivalent units by dividing by the copper price (per tonne). Long-termforecast prices (and foreign exchange rates where appropriate) are used, inorder that period-on-period comparisons exclude any impact for movementsin price.
When calculating copper equivalent production, all volumes relating to domesticsales are excluded, as are sales from non-mining activities. Volume fromprojects in pre-commercial production are included.
Unit costUnit cost is the direct cash cost including direct cash support costs incurred inproducing one unit of saleable production.
For bulk products (coal, iron ore), unit costs shown are FOB i.e. cost on boardat port. For base metals (copper, nickel), they are shown at C1 i.e. afterinclusion of by-product credits and logistics costs. For platinum and diamonds,unit costs include all direct expensed cash costs incurred i.e. excluding, amongother things, market development activity, corporate overhead etc. PlatinumGroup Metals unit costs exclude by-product credits. Royalties are excludedfrom all unit cost calculations.
Copper equivalent unit costCopper equivalent unit cost is the cost incurred to produce one tonne of copperequivalent. Only the cost incurred in mined output from subsidiaries and jointoperations is included, representing direct costs in the Consolidated incomestatement controllable by the Group. Costs and volumes from associates andjoint ventures are excluded, as are those from operations that are not yet incommercial production, that deliver domestic production, and those associatedwith third party volume purchases of diamonds and platinum concentrate.
When calculating copper equivalent unit cost, unit costs for each commodityare multiplied by relevant production, combined and then divided by the totalcopper equivalent production, to get a copper equivalent unit cost i.e. the costof mining one tonne of copper equivalent. The metric is in US dollars and, whereappropriate, long-term foreign exchange rates are used to convert from localcurrency to US dollars.
ProductivityThe Group’s productivity measure calculates the copper equivalent productiongenerated per employee. It is a measure that represents how well headcount isdriving revenue. It is calculated by dividing copper equivalent production by theaverage direct headcount from consolidated mining operations in a given year.
Volume and cash cost improvementsThe Group uses an underlying EBITDA waterfall to understand its year-on-yearunderlying EBITDA performance. The waterfall isolates the impact ofuncontrollable factors in order that the real year-on-year improvement inperformance can be seen by the user.
Three variables are normalised, in the results of subsidiaries and jointoperations, for:
• Price: The movement in price between comparative periods is removed bymultiplying current year sales volume by the movement in realised price foreach product group.
• Foreign exchange: The year-on-year movement in exchange is removed fromthe current year non-US dollar cost base i.e. costs are restated at prior yearforeign exchange rates. The non-US dollar cash cost base excludes costswhich are price linked (e.g. purchase of concentrate from third party platinumproviders, third party diamond purchases).
• Inflation: CPI is removed from cash costs, restating these costs at the pricinglevel of the base year.
The remaining variances in the underlying EBITDA waterfall are in real US dollarterms for the base year i.e. for a waterfall comparing 2019 with 2018, the salesvolume and cash cost variances exclude the impact of price, foreign exchangeand CPI and are hence in real 2018 terms. This allows the user of the waterfallto understand the underlying real movement in sales volumes and cash costson a consistent basis.
OTHER INFORMATION ALTERNATIVE PERFORMANCE MEASURES
Anglo American plc Integrated Annual Report 2019 231

The figures below include the entire output of consolidated entities and the Group’s attributable share of joint operations, associates and joint ventures whereapplicable, except for De Beers’ joint operations which are quoted on a 100% basis.(1)
2019 2018
De BeersCarats recovered (’000 carats) 100% basis (unless otherwise stated)Jwaneng 12,462 11,896Orapa(2) 10,792 12,236Botswana 23,254 24,132Debmarine Namibia 1,292 1,436Namdeb (land operations) 408 572Namibia 1,700 2,008Venetia 1,922 4,249Voorspoed — 433South Africa 1,922 4,682Gahcho Kué (51% basis) 3,479 3,539Victor 421 936Canada 3,900 4,475Total carats recovered 30,776 35,297Sales volumes
Total sales volume (100%) (Mct)(3) 30.9 33.7Consolidated sales volume (Mct)(3) 29.2 31.7Number of Sights (sales cycles) 10 10
Copper (tonnes) on a contained metal basis unless stated otherwise(4)
Collahuasi 100% basis (Anglo American share 44%)Ore mined 87,253,200 51,886,400Ore processed – Sulphide 54,133,100 49,470,500Ore grade processed – Sulphide (% TCu)(5) 1.19 1.29Production – Copper in concentrate 565,400 559,100Total copper production for Collahuasi 565,400 559,100Anglo American’s share of copper production for Collahuasi(6) 248,800 246,000Anglo American Sur(7) 389,200 422,200Los Bronces mine(7) 335,000 369,500Ore mined 65,915,300 59,207,400Ore processed – Sulphide 42,008,400 50,583,000Ore grade processed – Sulphide (% TCu)(5) 0.83 0.76Production – Copper cathode 39,000 39,000Production – Copper in concentrate 296,000 330,500El Soldado mine(7) 54,200 52,700Ore mined 12,128,100 11,613,200Ore processed – Sulphide 7,438,500 7,598,200Ore grade processed – Sulphide (% TCu)(5) 0.93 0.85Production – Copper in concentrate 54,200 52,700Chagres Smelter(7)
Ore smelted 122,000 142,600Production 118,600 139,200Total copper production(8) 638,000 668,300Total payable copper production 614,300 644,500Total sales volumes 643,900 671,600Total payable sales volumes 619,500 647,700Third party sales(9) 349,000 178,400
See page 234 for footnotes.
OTHER INFORMATION
PRODUCTION STATISTICS
232 Anglo American plc Integrated Annual Report 2019

2019 2018
PlatinumProduced platinum (’000 troy oz) 2,050.6 2,020.5Own-mined 1,378.2 1,323.6Mogalakwena 517.5 495.1Amandelbult 453.6 442.7Unki 89.4 85.9Mototolo(10) 112.0 17.5Joint operations(10) 205.7 270.8Union and other — 11.6Purchase of concentrate 672.4 696.9Joint operations(10) 205.7 270.8Associates(11) — 220.2Third party purchase of concentrate 466.7 205.9Purchase of concentrate now under tolling arrangements — 464.2PalladiumProduced palladium (’000 troy oz) 1,385.9 1,379.0Own-mined 1,049.2 1,013.5Mogalakwena 557.9 540.9Amandelbult 208.9 205.1Unki 79.2 75.5Mototolo(10) 68.7 10.9Joint operations(10) 134.5 176.0Union and other — 5.2Purchase of concentrate 336.7 365.5Joint operations(10) 134.5 175.9Associates(11) — 90.2Third party purchase of concentrate 202.2 99.4Purchase of concentrate now under tolling arrangements — 231.8Refined productionPlatinum (’000 troy oz) 2,210.9 2,402.4Palladium (’000 troy oz) 1,480.5 1,501.8Rhodium (’000 troy oz) 293.4 292.8Gold (’000 troy oz) 105.6 105.5Nickel (tonnes) 23,000 23,100Copper (tonnes) 14,200 14,3004E Head grade (g/tonne milled)(12) 3.61 3.48Platinum sales volumes – own-mined and purchase of concentrate(13) 2,215.1 2,424.2Palladium sales volumes – own-mined and purchase of concentrate(13) 1,520.7 1,513.1
Iron Ore production by product (tonnes)Kumba Iron Ore 42,387,700 43,105,700Lump 28,510,100 29,171,500Fines 13,877,600 13,934,200
Iron Ore production by mine (tonnes)Sishen 29,174,400 29,246,000Kolomela 13,213,300 13,859,700Kumba sales volumesExport iron ore(14) 39,793,500 39,965,700Domestic iron ore 2,180,200 3,291,100Minas-Rio productionPellet feed (wet basis) 23,114,900 3,382,000Minas-Rio sales volumesExport – pellet feed (wet basis) 22,927,000 3,216,800
Coal production by product (tonnes)Metallurgical Coal(15) 24,262,900 23,211,700Metallurgical – Export Coking 18,957,100 18,798,400Metallurgical – Export PCI 3,895,100 3,032,000Thermal – Export 1,410,700 1,381,300South Africa 27,841,500 32,050,900Thermal – Export(16) 17,795,600 18,358,600Thermal – Domestic (Other)(17) 6,044,200 6,268,900Thermal – Domestic (Eskom)(18) — 2,825,600Thermal – Domestic (Isibonelo) 4,001,700 4,597,800CerrejónThermal – Export 8,586,100 10,219,900Total coal production 60,690,500 65,482,500
See page 234 for footnotes.
OTHER INFORMATION PRODUCTION STATISTICS
Anglo American plc Integrated Annual Report 2019 233

2019 2018
Coal production by mine (tonnes)Metallurgical Coal(15) 24,262,900 23,211,700Capcoal (incl. Grasstree) 6,264,200 5,926,800Dawson 3,907,500 3,379,500Grosvenor 4,721,900 3,763,500Jellinbah 3,220,900 3,379,900Moranbah North 6,148,400 6,762,000South Africa 27,841,500 32,050,900Goedehoop 6,066,300 5,441,600Greenside 4,845,900 4,451,700Zibulo 5,359,300 6,376,800Khwezela(19) 5,760,800 5,532,100Mafube 1,807,500 1,144,600Other(17) — 1,680,700Eskom tied operations(18) — 2,825,600Isibonelo 4,001,700 4,597,800Cerrejón 8,586,100 10,219,900Carbones del Cerrejón 8,586,100 10,219,900Total coal production 60,690,500 65,482,500
Coal sales volumes (tonnes)Metallurgical CoalMetallurgical – Export(20) 22,380,600 21,982,800Thermal – Export 1,807,600 1,565,300South AfricaThermal – Export(16) 18,148,400 18,306,600Thermal – Domestic (Other)(17) 5,279,000 5,698,600Thermal – Domestic (Eskom)(18) — 2,825,600Thermal – Domestic (Isibonelo) 4,488,500 4,586,600Third party sales 10,920,200 9,503,500CerrejónThermal – Export 8,773,800 10,129,400
Nickel and Manganese (tonnes) unless stated otherwise(21)
Barro AltoOre mined 4,075,600 4,667,200Ore processed 2,265,700 2,264,200Ore grade processed – %Ni 1.69 1.71Production 33,900 33,500CodeminOre mined 40,300 8,400Ore processed 570,500 581,400Ore grade processed – %Ni 1.65 1.66Production 8,700 8,800Total Nickel segment nickel production 42,600 42,300Sales volumes 41,700 43,100SamancorManganese ore(22) 3,513,400 3,606,500Manganese alloys(22)(23) 137,200 156,800Samancor sales volumesManganese ore 3,610,600 3,534,500Manganese alloys 132,500 161,100Total Manganese production(24) 3,650,600 3,763,300Sales volumes(24) 3,743,100 3,695,600
(1) De Beers Group production is on a 100% basis, except for the Gahcho Kué joint operationwhich is on an attributable 51% basis.
(2) Orapa constitutes the Orapa Regime which includes Orapa, Letlhakane and Damtshaa.(3) Consolidated sales volumes exclude De Beers Group’s joint arrangement partners’ 50%
proportionate share of sales to entities outside De Beers Group from Diamond TradingCompany Botswana and the Namibia Diamond Trading Company, which are included in totalsales volume (100% basis).
(4) Excludes copper production from the Platinum Group Metals business unit. (5) TCu = total copper.(6) Anglo American’s share of Collahuasi production is 44%.(7) Anglo American ownership interest of Anglo American Sur is 50.1%. Production is stated at
100% as Anglo American consolidates Anglo American Sur.(8) Total copper production includes Anglo American’s 44% interest in Collahuasi.(9) Relates to sales of copper not produced by Anglo American operations.(10) The joint operations are Modikwa and Kroondal. Platinum owns 50% of these operations,
which is presented under ‘Own-mined’ production, and purchases the remaining 50% ofproduction, which is presented under ‘Purchase of concentrate’. Mototolo is 100% ownedfrom 1 November 2018.
(11) Associates are PGM’s 33% interest in BRPM until its sale effective 11 December 2018.(12) 4E: the grade measured as the combined content of: platinum, palladium, rhodium and gold,
excludes tolled material.
(13) Sales from own mined and purchased concentrate, excludes refined metal purchased fromthird parties.
(14) Sales volumes differ to Kumba’s standalone Q4 results due to sales to other Groupcompanies.
(15) Includes Thermal – Export production from Australia.(16) Thermal export – Includes export primary production, secondary production sold into export
markets, production sold domestically at export parity pricing and pre-commercial productionvolumes from Navigation section of Khwezela.
(17) Thermal domestic – Other is product sold domestically excluding Eskom-tied and Isiboneloproduction.
(18) The sale of the Eskom-tied operations was completed on 1 March 2018.(19) Includes pre-commercial production volumes from Navigation section.(20) Includes both hard coking coal and PCI sales volumes.(21) Excludes nickel production from the Platinum Group Metals business unit.(22) Saleable production.(23) Production includes medium carbon ferro-manganese.(24) Production and sales includes ore and alloy.
OTHER INFORMATION PRODUCTION STATISTICS
234 Anglo American plc Integrated Annual Report 2019

Quarter ended % Change (Quarter ended)
31 December 2019
30 September2019
30 June 2019
31 March2019
31 December 2018
31 December 2019 v30 September 2019
31 December 2019 v30 December 2018
De Beers
Carats recovered (’000 carats)
100% basis(1)
Diamonds 7,787 7,439 7,699 7,852 9,128 5% (15)%
Copper (tonnes)(2)(3) 158,800 158,900 159,100 161,100 183,500 0% (13)%
Produced ounces platinum (’000 troy oz)(4) 531.7 526.8 520.3 471.9 485.4 1% 10%Produced ounces palladium (’000 troy oz)(4) 360.4 351.8 347.2 326.6 328.5 2% 10%Platinum refined production(4)
Platinum (’000 troy oz) 629.7 578.6 590.9 411.7 770.9 9% (18)%Palladium (’000 troy oz) 396.6 362.1 428.2 293.6 493.8 10% (20)%Rhodium (’000 troy oz) 90.8 66.5 84.1 52.0 91.3 37% (1)%Gold (’000 troy oz) 32.4 27.9 21.3 24.0 27.9 16% 16%Nickel refined (tonnes) 6,400 6,800 5,600 4,200 6,700 (6)% (4)%Copper refined (tonnes) 4,100 3,400 3,500 3,200 4,200 21% (2)%
Iron Ore (tonnes)
Iron ore – Kumba 11,806,100 10,521,300 10,544,000 9,516,300 10,170,200 12% 16%Iron ore – Minas-Rio 6,163,600 6,126,100 5,915,500 4,909,700 226,700 1% n/a
Coal (tonnes)
Australia
Metallurgical – Export 6,283,600 6,568,900 5,843,500 4,156,200 5,647,100 (4)% 11%Thermal – Export 389,200 437,900 245,200 338,500 427,600 (11)% (9)%South Africa
Thermal export(5) 4,515,100 4,288,400 4,575,000 4,417,000 4,537,100 5% —Thermal domestic – Other(6) 1,764,900 1,568,000 1,592,000 1,119,200 1,923,600 13% (8)%Thermal domestic – Isibonelo 745,900 1,053,300 1,031,600 1,171,000 1,368,900 (29)% (46)%Cerrejón
Thermal – Export 2,314,900 2,055,100 2,016,900 2,199,300 2,356,500 13% (2)%
Nickel and Manganese (tonnes)
Nickel(7) 11,700 11,300 9,800 9,800 11,400 4% 3%Manganese ore(8) 902,900 910,400 826,100 874,000 971,900 (1)% (7)%Manganese alloys(8)(9) 31,600 29,200 41,200 35,200 38,000 8% (17)%
(1) De Beers Group production is on a 100% basis, except for the Gahcho Kué joint operation which is on an attributable 51% basis.(2) Excludes copper production from the Platinum Group Metals business unit.(3) Copper segment attributable production.(4) Production excluding volumes previously purchased as concentrate which have transitioned to a tolling arrangement.(5) Thermal export – Includes export primary production, secondary production sold into export markets and production sold domestically at export parity pricing.(6) Thermal domestic – Other is product sold domestically excluding Isibonelo production. The sale of the Eskom-tied operations was completed on 1 March 2018.(7) Excludes nickel production from the Platinum Group Metals business unit.(8) Saleable production.(9) Production includes medium carbon ferro-manganese.
OTHER INFORMATION PRODUCTION STATISTICS
QUARTERLY PRODUCTION STATISTICS
Anglo American plc Integrated Annual Report 2019 235

2019 2018 2017 2016 2015
Anglo American plc dataSafety(1)
Work-related fatalities 4 5 9 11 6Fatal-injury frequency rate (FIFR)(2) 0.017 0.024 0.035 0.038 0.018Total recordable case frequency rate (TRCFR)(2) 2.21 2.66 3.17 3.55 4.66Lost-time injury frequency rate (LTIFR)(2) 1.36 1.63 1.68 1.87 2.35Occupational health(1)
New cases of occupational disease (NCOD)(2) 39 101 96 111 159Environment(1)
Total greenhouse gas (GHG) emissions (Mt CO2e) 17.7 16.2 18.0 17.9 18.3Total energy consumed (million GJ)(2) 87 84 97 106 106Total water withdrawals (million m3)(2) 209 227 306 296 339People(3)
Number of employees (’000)(4) 63 64 69 80 91Women in senior management (%)(5) 24 21 18 15 n/aHistorically Disadvantaged South Africans in management (%)(6) 65 65 66 62 60Resignations (%)(7) 2.3 2.4 2.3 2.2 1.9Redundancies (%)(8) 1.2 0.7 0.7 7.1 3.5Dismissals (%)(9) 1.2 1.2 1.4 1.8 1.4Other reasons for leaving (%)(10) 5.1 5.8 4.0 3.5 4.2Social
CSI spend (total in US$ million)(11) 114 82 88 84 124CSI spend (% of underlying EBIT)(11) 2 2 2 3 6Businesses supported through enterprise development initiatives(12) 65,548 64,830 64,291 62,447 62,394Jobs created/maintained through enterprise development programmes(12) 132,082 125,095 120,812 116,298 110,780
Select Business Unit dataSafety(1)
Work-related fatalities – De Beers — 1 — 2 —Work-related fatalities – Copper Chile 1 — — — —Work-related fatalities – Copper Peru(13) 1 n/a n/a n/a n/aWork-related fatalities – PGMs — 2 6 7 2Work-related fatalities – Iron Ore – Kumba — — — 2 —Work-related fatalities – Iron Ore – IOB — — — — 1Work-related fatalities – Coal – Metallurgical Coal 1 — — — 1Work-related fatalities – Coal – Thermal Coal South Africa 1 2 3 — 1Work-related fatalities – Nickel — — — — —Work-related fatalities – Corporate and Other — — — — —TRCFR – De Beers 3.07 2.48 1.90 2.05 2.63TRCFR – Copper Chile 1.15 1.03 1.22 3.27 2.57TRCFR – Copper Peru(13) 0.91 n/a n/a n/a n/aTRCFR – PGMs 2.50 3.00 4.52 5.28 7.59TRCFR – Iron Ore – Kumba 2.06 1.80 3.23 3.90 4.50TRCFR – Iron Ore – IOB 1.48 2.14 1.30 1.57 2.07TRCFR – Coal – Metallurgical Coal 6.20 9.04 12.19 5.59 5.79TRCFR – Coal – Thermal Coal South Africa 1.56 1.87 1.77 1.45 2.34TRCFR – Nickel 2.75 3.03 1.67 2.43 3.52TRCFR – Corporate and Other 0.17 1.85 2.53 1.81 1.95
OTHER INFORMATION
NON-FINANCIAL DATA
236 Anglo American plc Integrated Annual Report 2019

(1) Data relates to subsidiaries and joint operations over which Anglo American has management control. In 2018 and 2019, data excludes De Beers’ joint operations in Namibia and Botswana.Prior years’ data includes De Beers’ joint operations in Namibia and Botswana. See page 88 of the Anglo American plc Sustainability Report 2019 for the full list of entities within the reportingscope. Divested businesses are included up until the point of divestment.
(2) See pages 226-227 for definitions and change in basis of calculation.
(3) Excludes Other Mining and Industrial. (4) Average number of employees, excluding contractors and associates' and joint ventures' employees, and including a share of employees within joint operations. (5) Female representation within the Group Management Committee and those reporting to the committee. (6) Historically Disadvantaged South African employees within bands seven and above divided by the total number of South African employees in bands seven and above. (7) The number of people who resigned as a percentage of the total work force excluding contractors. (8) The number of people who have been retrenched as a percentage of total work force excluding contractors. (9) The number of people who have been dismissed or have resigned to avoid dismissal, as a percentage of total work force excluding contractors. (10) The number of people who left for reasons other than those shown above, for example retirement, ill health and death, as a percentage of total work force excluding contractors. (11) CSI spend is the sum of donations for charitable purposes and community investment (which includes cash and in-kind donations and staff time) as well as investments in commercial initiatives
with public benefit (such as enterprise development). Included within the CSI expenditure figure for 2019 is expenditure relating to Zimele of $4.2 million (2018: $2.3 million). (12) Figures are presented on a cumulative basis since 2008. (13) Comparative data for Quellaveco is not presented as the project only reached a full year of development in 2019.
2019 2018 2017 2016 2015
Environment(1)
GHG emissions – Mt CO2e – De Beers 0.48 0.56 1.85 1.85 2.02GHG emissions – Mt CO2e – Copper Chile 1.17 1.32 1.23 1.10 1.43GHG emissions – Mt CO2e – Copper Peru(13) 0.15 n/a n/a n/a n/aGHG emissions – Mt CO2e – PGMs 4.44 4.12 4.61 5.58 5.88GHG emissions – Mt CO2e – Iron Ore – Kumba 1.00 0.96 1.00 0.95 1.20GHG emissions – Mt CO2e – Iron Ore – IOB 0.20 0.09 0.19 0.17 0.17GHG emissions – Mt CO2e – Coal – Metallurgical Coal 8.17 6.85 6.37 5.47 5.30GHG emissions – Mt CO2e – Coal – Thermal Coal South Africa 0.90 1.00 1.45 1.43 1.49GHG emissions – Mt CO2e – Nickel 1.23 1.21 1.22 1.19 0.65GHG emissions – Mt CO2e – Corporate and Other 0.01 0.01 0.04 0.03 0.06Energy consumption – million GJ – De Beers 4.5 5.8 15.7 16.4 17.2Energy consumption – million GJ – Copper Chile 12.3 13.4 13.1 12.8 15.5Energy consumption – million GJ – Copper Peru(13) 2.0 n/a n/a n/a n/aEnergy consumption – million GJ – PGMs 20.1 20.0 21.5 24.6 25.2Energy consumption – million GJ – Iron Ore – Kumba 8.8 8.9 8.9 8.5 11.1Energy consumption – million GJ – Iron Ore – IOB 5.1 1.8 4.5 4.2 3.5Energy consumption – million GJ – Coal – Metallurgical Coal 10.1 9.0 7.6 10.1 12.3Energy consumption – million GJ – Coal – Thermal Coal South Africa 3.5 4.1 6.0 5.8 5.4Energy consumption – million GJ – Nickel 20.2 20.0 19.8 20.3 12.5Energy consumption – million GJ – Corporate and Other 0.1 0.9 0.4 0.4 0.5Total water withdrawals – million m3 – De Beers 21.9 42.6 105.6 104.0 123.8Total water withdrawals – million m3 – Copper Chile 21.7 29.5 35.0 40.1 39.2Total water withdrawals – million m3 – Copper Peru(13) 0.6 n/a n/a n/a n/aTotal water withdrawals – million m3 – PGMs 25.1 24.4 26.5 36.4 42.0Total water withdrawals – million m3 – Iron Ore – Kumba 33.3 32.2 35.9 34.0 39.6Total water withdrawals – million m3 – Iron Ore – IOB 28.8 28.3 28.7 17.4 20.6Total water withdrawals – million m3 – Coal – Metallurgical Coal 18.2 23.4 16.9 23.2 26.2Total water withdrawals – million m3 – Coal – Thermal Coal South Africa 52.8 38.1 49.5 28.6 29.4Total water withdrawals – million m3 – Nickel 6.3 8.0 7.5 5.2 4.6Total water withdrawals – million m3 – Corporate and Other 0.4 0.9 0.1 0.2 0.2People(3)
Number of employees – De Beers 9,000 10,000 10,000 9,000 11,000Number of employees – Copper Chile 4,000 4,000 4,000 4,000 5,000Number of employees – Copper Peru(13) 300 n/a n/a n/a n/aNumber of employees – PGMs 31,000 33,000 36,000 45,000 48,000Number of employees – Iron Ore – Kumba 6,000 6,000 6,000 5,000 8,000Number of employees – Iron Ore – IOB 3,000 2,000 2,000 2,000 2,000Number of employees – Coal – Metallurgical Coal 2,000 2,000 1,000 2,000 3,000Number of employees – Coal – Thermal Coal South Africa 5,000 5,000 8,000 8,000 8,000Number of employees – Nickel 1,000 1,000 1,000 2,000 2,000Number of employees – Corporate and Other 2,000 1,000 1,000 3,000 4,000
OTHER INFORMATION NON-FINANCIAL DATA
Anglo American plc Integrated Annual Report 2019 237

Anglo American’s response to the risks posed by climate change is multi-disciplinary and is covered throughout our reporting suite – from the Integrated AnnualReport to climate change: our plans, policies and progress, published in 2017 and revised in 2019.
The table below offers guidance on where to find information relating to each of the TCFD’s recommendations.
GovernanceDisclose the organisation’s governance around climate-related risks and opportunities.
Recommended disclosures References
a) Describe the Board’s oversight of climate-related risks and opportunities. Climate change: Our plans, policies and progress (2017), pages 6-7. Climate change, Integrated Annual Report 2019, pages 96 and 101.
b) Describe management’s role in assessing and managing climate-related risksand opportunities.
Climate change: Our plans, policies and progress (2017), page 7. Our Material Matters, Integrated Annual Report 2019, page 13.
StrategyDisclose the actual and potential impacts of climate-related risks and opportunities on the organisation’s businesses, strategy, and financial planning, where suchinformation is material.
Recommended disclosures References
a) Describe the climate-related risks and opportunities the organisation hasidentified over the short, medium, and long term.
CDP Climate Response 2019, question CC2 Risks and opportunities.
b) Describe the impact of climate-related risks and opportunities on theorganisation’s businesses, strategy, and financial planning.
Climate change: Our plans, policies and progress (2019), page 20CDP Climate Response 2019, question CC2 Risks and opportunities.Sustainability Report 2019, page 48.
c) Describe the resilience of the organisation’s strategy, taking intoconsideration different climate-related scenarios, including a 2°C or lowerscenario.
We have conducted a qualitative scenario analysis included in: Climate change:Our plans, policies and progress (2017), pages 12-15. We have undertaken a quantitative scenario analysis. Included in Climatechange: Our plans, policies and progress (2019), pages 10-20.
Risk managementDisclose how the organisation identifies, assesses, and manages climate-related risks.
Recommended disclosures References
a) Describe the organisation’s processes for identifying and assessing climate-related risks.
Climate change: Our plans, policies and progress (2017), pages 4 and 7.CDP Climate Response 2019, question CC2.2b, processes for identifying andassessing climate-related risks.
b) Describe the organisation’s processes for managing climate-related risks. CDP Climate Response 2019, questions CC2.1, CC2.2, CC2.5 and CC2.6.
c) Describe how processes for identifying, assessing, and managing climate-related risks are integrated into the organisation’s overall risk management.
Climate change: Our plans, policies and progress (2017), page 7.CDP Climate Response 2019, questions CC2.1, CC2.2, CC2.5 and CC2.6.
Metrics and targetsDisclose the metrics and targets used to assess and manage relevant climate-related risks and opportunities where such information is material.
Recommended disclosures References
a) Disclose the metrics used by the organisation to assess climate-related risksand opportunities in line with its strategy and risk management process.
CDP Climate Response 2019, questions CC2.2b, CC2.3a and CC11.3a.
b) Disclose Scope 1, Scope 2, and, if appropriate, Scope 3, greenhouse gas(GHG) emissions, and the related risks.
Sustainability Report 2019, page 50 and data table page 89. Integrated Annual Report 2019, pages 34, 44-45 and 237.
c) Describe the targets used by the organisation to manage climate-relatedrisks and opportunities and performance against targets.
Integrated Annual Report 2019, page 32.
OTHER INFORMATION
DISCLOSURES RELATED TO THERECOMMENDATIONS OF THE TCFD
238 Anglo American plc Integrated Annual Report 2019

This section includes certain disclosures which are required by law to beincluded in the Directors’ Report.
In accordance with the Companies Act 2006 (Companies Act), the followingitems have been reported in other sections of the Integrated Annual Report andare included in this Directors’ Report by reference:
• Details of the directors of the Company can be found on pages 86-89
• Directors’ interests in shares at 31 December 2019 and any changesthereafter, can be found on page 134 of the Directors’ Remuneration Report
• Events occurring after the end of the year are set out in note 29 to the financialstatements on page 192
• The Strategic Report on pages 2-83 gives a fair review of the business and anindication of likely future developments and fulfils the requirements set out insection 414C of the Companies Act
• Details of the Group’s governance arrangements and its compliance withthe UK Corporate Governance Code (the Code) can be found onpages 84-138
• Comprehensive details of the Group’s approach to financial risk managementare given in note 23 to the financial statements on pages 180-182
• The Group’s disclosure of its greenhouse gas emissions can be found onpage 34
• Details of employee engagement can be found on pages 36-41 and 98.
Going concernThe financial position of the Group, its cash flows, liquidity position andborrowing facilities are set out in the Group financial review on pages 52-55.Further details of our policy on financial risk management are set out in note 23to the financial statements on pages 180-182. The Group’s net debt at31 December 2019 was $4.6 billion (2018: $2.8 billion), representing a gearinglevel of 13% (2018: 9.0%). Details of borrowings and facilities are set out innote 21 on page 176 and net debt is set out in note 20 on pages 174-175.The directors have considered the Group’s cash flow forecasts for the periodto the end of March 2021. The Board is satisfied that the Group’s forecastsand projections, taking account of reasonably possible changes in tradingperformance, show that the Group will be able to operate within the level ofits current facilities for the period assessed. For this reason the Group continuesto adopt the going concern basis in preparing its financial statements.
DividendsAn interim dividend of 62 US cents per ordinary share was paid on20 September 2019. The directors are recommending that a final dividendof 47 US cents per ordinary share be paid on 7 May 2020 to ordinaryshareholders on the register at the close of business on 13 March 2020, subjectto shareholder approval at the AGM to be held on 5 May 2020. This would bringthe total dividend in respect of 2019 to $1.09 per ordinary share. In accordancewith the International Financial Reporting Standards (IFRS), the final dividend willbe accounted for in the financial statements for the year ended31 December 2020.
The Anglo American Employee Benefit Trust (EBT) holds shares to facilitate theoperation of certain of the Group’s share option and share incentive schemes(share plans). The EBT has waived the right to receive dividends on shares heldon behalf of share plans participants employed by the Group in countries otherthan the UK and South Africa.
Share capitalThe Company’s issued share capital as at 31 December 2019, together withdetails of share allotments and issue of treasury shares during the year, is setout in note 24 on page 183.
Significant shareholdingsThe Company has been notified of the following significant shareholdings:
CompanyNumber of
sharesPercentage of
voting rights
Public Investment Corporation 154,386,011 10.99BlackRock Inc 84,968,927 6.05Silchester International Investors LLP 70,110,363 4.99Genesis Asset Managers LLP 55,426,734 3.95Tarl Investment Holdings (RF) ProprietaryLimited(1) 47,275,613 3.37
Epoch Two Investment Holdings (RF)Proprietary Limited(1) 42,166,686 3.01
(1) Epoch Two Investment Holdings (RF) Proprietary Limited (Epoch 2) and Tarl InvestmentHoldings (RF) Proprietary Limited (Tarl) are two of the independent companies thathave purchased shares as part of Anglo American’s 2006 share buyback programme.Epoch 2 and Tarl have waived their right to vote all the shares they hold, or will hold, inAnglo American plc.
Disclosure table pursuant to Listing Rule 9.8.4C
Listing Rule Information to be included Disclosure
9.8.4(1) Interest capitalised by theGroup
See note 4, page 156
9.8.4(2) Unaudited financial information(LR 9.2.18)
None
9.8.4(4) Long-term incentive schemeonly involving a director(LR 9.4.3)
None
9.8.4(5) Directors’ waivers ofemoluments
None
9.8.4(6) Directors’ waivers of futureemoluments
None
9.8.4(7) Non pro rata allotments forcash (issuer)
Treasury shares have been issuedpursuant to the exercise ofoptions awarded undershareholder approved schemes
9.8.4(8) Non pro rata allotments forcash (major subsidiaries)
None
9.8.4(9) Listed company is a subsidiaryof another company
Not applicable
9.8.4(10) Contracts of significanceinvolving a director
None
9.8.4(11) Contracts of significanceinvolving a controllingshareholder
Not applicable
9.8.4(12) Waivers of dividends See ‘Dividends’ paragraph on thispage
9.8.4(13) Waivers of future dividends See ‘Dividends’ paragraph on thispage
9.8.4(14) Agreement with a controllingshareholding LR 9.2.2AR(2)(a)
Not applicable
Sustainable developmentThe Sustainability Report 2019 is published on the Group’s website on9 March 2020.
This report focuses on the safety, health, sustainable development andenvironmental performance of the Group’s managed operations, itsperformance with regard to the Company’s Code of Conduct, and theoperational dimensions of its social programmes.
Audit informationThe directors confirm that, so far as they are aware, there is no relevant auditinformation of which the auditor is unaware, that all directors have taken allreasonable steps to make themselves aware of any relevant audit informationand to establish that the auditor is aware of that information.
OTHER INFORMATION
DIRECTORS’ REPORT
Anglo American plc Integrated Annual Report 2019 239

Employment and other policiesThe Group’s key operating businesses are empowered to manage within thecontext of the different legislative and social demands of the diverse countriesin which those businesses operate, subject to the standards embodied inAnglo American’s Code of Conduct. Within all the Group’s businesses, thesafe and effective performance of employees and the maintenance of positiveemployee relations are of fundamental importance. Managers are charged withensuring that the following key principles are upheld:
• Adherence to national legal standards on employment and workplace rights atall times
• Adherence to the International Labour Organization’s core labour rights,including: prohibition of child labour; prohibition of inhumane treatment ofemployees and any form of forced labour, physical punishment or otherabuse; recognition of the right of our employees to freedom of association andthe promotion of workplace equality; and the elimination of all forms of unfairdiscrimination
• Continual promotion of safe and healthy working practices
• Provision of opportunities for employees to enhance their work related skillsand capabilities
• Adoption of fair and appropriate procedures for determining terms andconditions of employment.
It is the Group’s policy that people with disabilities should have full and fairconsideration for all vacancies. Employment of disabled people is considered onmerit and with regard only to the ability of any applicant to carry out the role. Weendeavour to retain the employment of, and arrange suitable retraining, for anyemployees in the workforce who become disabled during their employment.Where possible we will adjust a person’s working environment to enable themto stay in our employment.
The Group promotes an inclusive and diverse environment where everycolleague is valued and respected for who they are, and has theopportunity to fulfil their potential. The Group is focused on providing aworkplace where everyone can thrive and has introduced a number ofGroup-wide policies to encourage this. The Group’s inclusion and diversitypolicy reflects its commitment as a signatory to the United Nations GlobalCompact and is aligned both to the labour rights principles set out in theInternational Labour Organization core conventions and with the UnitedNations Sustainable Development Goals. The Group has also introduceda bullying, harassment and victimisation policy which clearly states its zerotolerance to such behaviours along with the agreement for a Group-wideflexible working policy.
Further, the Group is committed to treating employees at all levels withrespect and consideration, to investing in their development and to ensuringthat their careers are not constrained by discrimination or arbitrary barriers.
The Anglo American Code of Conduct is supported by an underlyingframework of policies and procedures which provide specific guidance toemployees on the behaviour required to reinforce the Group’s values anduphold the Group’s specific commitments to prioritise safety, health and theenvironment; treat people with care and respect, conduct business withintegrity and protect its physical assets and information. The Code ofConduct and accompanying policies can be accessed via the Group’swebsite.
In addition to meeting legal requirements, all Anglo American suppliers mustadhere to the Responsible Sourcing Standard for Suppliers, which is availableon the Group’s website and referenced in contracts.
The Business Integrity Policy and associated 11 Prevention of CorruptionProcedures set out the Group’s anti-bribery and corruption commitment byclearly stating that the Group will neither give nor accept bribes, nor permitothers to do so in its name. The policy sets out the standards of conductrequired at every level within Anglo American, including subsidiaries, jointventures and associates, on the part of those with which the Group doesbusiness and those who work on the Group’s behalf, in combating corruptbehaviour of all types.
The policy and procedures have been translated into the main languages thatare used across the Group’s operations. A dedicated team, operating withina broader Risk Management and Business Assurance team oversees theimplementation of the Code of Conduct and Business Integrity Policy. Theywork with senior managers in the business units and corporate functions; andassist with the implementation and monitoring of said procedures, managingand identifying bribery and corruption risks and provide online and face-to-facetraining for relevant employees, including those in high-risk roles. The internalaudit team regularly provide assurance on the effectiveness of the anti-briberyand corruption controls that support adherence to the policy and associatedprocedures.
The Group’s whistleblowing facility, operated by an external service providerwas refreshed and rebranded from Speak-Up to YourVoice in 2019. This facilityis available to our employees and external stakeholders to confidentially reportconcerns including business integrity, ethical, legal, supplier relationship, safetyand health, and human resources issues.
The Group has a social intranet called Eureka! which helps employees toconnect, communicate and collaborate more effectively.
Political donationsNo political donations were made during 2019. Anglo American has anestablished policy of not making donations to, or incurring expenses for thebenefit of any political party in any part of the world, including any politicalparty or political organisation as defined in the Political Parties, Elections andReferendums Act 2000.
Additional information for shareholdersSet out below is a summary of certain provisions of the Company’s currentArticles and applicable English law concerning companies (the Companies Act)required as a result of the implementation of the Takeover Directive in Englishlaw. This is a summary only and the relevant provisions of the Articles or theCompanies Act should be consulted if further information is required.
Dividends and distributionsSubject to the provisions of the Companies Act, the Company may, by ordinaryresolution, from time to time declare final dividends not exceeding the amountrecommended by the Board. The Board may pay interim dividends wheneverthe financial position of the Company, in the opinion of the Board, justifiessuch payment.
The Board may withhold payment of all, or any part of any dividends or othermonies payable in respect of the Company’s shares, from a person with a0.25% interest or more (as defined in the Articles) if such a person has beenserved with a notice after failing to provide the Company with informationconcerning interests in those shares required to be provided under theCompanies Act.
Rights and obligations attaching to sharesThe rights and obligations attaching to the shares are set out in the Articles.
The Articles may only be changed by a special resolution passed by theshareholders.
VotingSubject to the Articles generally and to any special rights or restrictions as tovoting attached by or in accordance with the Articles to any class of shares, ona show of hands every member who is present in person at a general meetingshall have one vote and, on a poll, every member who is present in person or byproxy shall have one vote for every share of which he/she is the holder. It is, andhas been for some years, the Company’s practice to hold a poll on everyresolution at shareholder meetings.
Where shares are held by trustees/nominees in respect of the Group’semployee share plans and the voting rights attached to such shares are notdirectly exercisable by the employees, it is the Company’s practice that suchrights are not exercised by the relevant trustee/nominee.
Under the Companies Act, members are entitled to appoint a proxy, who neednot be a member of the Company, to exercise all or any of their rights to attendand to speak and vote on their behalf at a general meeting or class meeting.
A member may appoint more than one proxy in relation to a general meeting orclass meeting provided that each proxy is appointed to exercise the rightsattached to a different share or shares held by that member. A member that is acorporation may appoint one or more individuals to act on its behalf at a generalmeeting or class meeting as a corporate representative. Where a shareholderappoints more than one corporate representative in respect of its shareholding,but in respect of different shares, those corporate representatives can actindependently of each other, and validly vote in different ways.
OTHER INFORMATION DIRECTORS' REPORT
240 Anglo American plc Integrated Annual Report 2019

Restrictions on votingNo member shall, unless the directors otherwise determine, be entitled inrespect of any share held by him/her to vote either personally or by proxy at ashareholders’ meeting, or to exercise any other right conferred by membershipin relation to shareholders’ meetings, if any call or other sum presently payableby him/her to the Company in respect of that share remains unpaid. In addition,no member shall be entitled to vote if he/she has been served with a notice afterfailing to provide the Company with information concerning interests in thoseshares required to be provided under the Companies Act.
Issue of sharesSubject to the provisions of the Companies Act relating to authority and pre-emption rights and of any resolution of the Company in a UK general meeting,all unissued shares of the Company shall be at the disposal of the directors andthey may allot, grant options over, or otherwise dispose of them to suchpersons at such times, and on such terms, as they think proper.
Shares in uncertificated formAny share or class of shares of the Company may be issued or held (includingany shares or class of shares held on the South African Branch Register or anyother overseas branch register of the members of the Company) on such terms,or in such a way, that: title to it or them is not, or must not be, evidenced by acertificate; or it or they may or must be transferred wholly or partly without acertificate. The directors have power to take such steps as they think fit inrelation to: the evidencing of and transfer of title to uncertificated shares(including in connection with the issue of such shares); any records relating tothe holding of uncertificated shares; the conversion of certificated shares intouncertificated shares; or the conversion of uncertificated shares into certificatedshares. The Company may by notice to the holder of a share require that share:if it is uncertificated, to be converted into certificated form; and if it iscertificated, to be converted into uncertificated form, to enable it to be dealt within accordance with the Articles.
If: the Articles give the directors power to take action, or require other personsto take action, in order to sell, transfer or otherwise dispose of shares; anduncertificated shares are subject to that power, but the power is expressed interms which assume the use of a certificate or other written instrument, thedirectors may take such action as is necessary or expedient to achieve thesame results when exercising that power in relation to uncertificated shares.The directors may take such action as they consider appropriate to achievethe sale, transfer, disposal, forfeiture, re-allotment or surrender of anuncertificated share or otherwise to enforce a lien in respect of it. This mayinclude converting such share to certificated form. Unless the directors resolveotherwise, shares which a member holds in uncertificated form must betreated as separate holdings from any shares which that member holds incertificated form. A class of shares must not be treated as two classes simplybecause some shares of that class are held in certificated form and others areheld in uncertificated form.
Deadlines for exercising voting rightsVotes are exercisable at a general meeting of the Company in respect ofwhich the business being voted upon is being heard. Votes may be exercisedin person, by proxy, or in relation to corporate members, by corporaterepresentative. The Articles provide a deadline for submission of proxy forms ofnot less than 48 hours before the time appointed for the holding of the meetingor adjourned meeting.
Variation of rightsSubject to statute, the Articles specify that rights attached to any class ofshares may be varied with the written consent of the holders of not less thanthree-quarters in nominal value of the issued shares of that class, or with thesanction of an extraordinary resolution passed at a separate general meetingof the holders of those shares. At every such separate general meeting thequorum shall be two persons holding, or representing by proxy, at least one-third in nominal value of the issued shares of the class (calculated excluding anyshares held as treasury shares). The rights conferred upon the holders of anyshares shall not, unless otherwise expressly provided in the rights attaching tothose shares, be deemed to be varied by the creation or issue of further sharesranking pari passu with them.
Transfer of sharesAll transfers of shares that are in certificated form may be effected by transferin writing in any usual or common form or in any other form acceptable to thedirectors and may be under hand only. The instrument of transfer shall besigned by, or on behalf of, the transferor and (except in the case of fully paidshares) by or on behalf of the transferee. The transferor shall remain the holderof the shares concerned until the name of the transferee is entered in theregister of shareholders. All transfers of shares registered on the main registerof members that are in uncertificated form may be effected by means of theCREST system. All transfers of uncertified shares registered on the branchregister of members in South Africa may be effected via the Transfer Secretary.
The directors may decline to recognise any instrument of transfer relating toshares in certificated form unless it:
(a) is in respect of only one class of share
(b) is lodged at the transfer office (duly stamped if required) accompanied bythe relevant share certificate(s) and such other evidence as the directorsmay reasonably require to show the right of the transferor to make thetransfer (and, if the instrument of transfer is executed by some other personon his/her behalf, the authority of that person so to do).
The directors may decline to register any transfer of shares in certificated formunless: the instrument of transfer is in respect of only one class of share; theinstrument of transfer is lodged (duly stamped if required) at the Transfer Officeaccompanied by the relevant share certificate(s) or such other evidence as thedirectors may reasonably require to show the right of the transferor to makethe transfer or, if the instrument of transfer is executed by some other personon the transferor’s behalf, the authority of that person to do so; and it is fullypaid. The directors may also refuse to register an allotment or transfer of shares(whether fully paid or not) in favour of more than four persons jointly.
If the directors refuse to register an allotment or transfer, they shall send therefusal to the allottee or the transferee within two months after the date onwhich the letter of allotment or transfer was lodged with the Company.
A shareholder does not need to obtain the approval of the Company, or of othershareholders of shares in the Company, for a transfer of shares to take place.
DirectorsDirectors shall not be fewer than 5 nor more than 18 in number. A director isnot required to hold any shares of the Company by way of qualification. TheCompany may by ordinary resolution increase or reduce the maximum orminimum number of directors.
Powers of directorsSubject to the Articles, the Companies Act and any directions given by specialresolution, the business of the Company will be managed by the Board whomay exercise all the powers of the Company.
The Board may exercise all the powers of the Company to borrow money andto mortgage or charge any of its undertaking, property and uncalled capitaland to issue debentures and other securities, whether outright or as collateralsecurity, for any debt, liability or obligation of the Company or of any third party.
The Company may by ordinary resolution declare dividends, but no dividendshall be payable in excess of the amount recommended by the directors.
Subject to the provisions of the Articles and to the rights attaching to anyshares, any dividends or other monies payable on or in respect of a share maybe paid in such currency as the directors may determine. The directors maydeduct from any dividend payable to any member all sums of money (if any)presently payable by him/her to the Company on account of calls or otherwisein relation to shares of the Company. The directors may retain any dividendspayable on shares on which the Company has a lien, and may apply the samein or towards satisfaction of the debts, liabilities or engagements in respect ofwhich the lien exists.
Appointment and replacement of directorsThe directors may from time to time appoint one or more directors. The Boardmay appoint any person to be a director (so long as the total number ofdirectors does not exceed the limit prescribed in the Articles). Any such directorshall hold office only until the next AGM and shall then be eligible for election.
The Articles provide that at each AGM all those directors who have been inoffice for three years or more since their election, or last re-election, shall retirefrom office. In addition, a director may at any AGM retire from office and standfor re-election. However, in accordance with the UK Corporate GovernanceCode, all directors will be subject to annual re-election.
OTHER INFORMATION DIRECTORS' REPORT
Anglo American plc Integrated Annual Report 2019 241

Stock Exchange ListingsThe Company’s ordinary shares are listed on the London Stock Exchange (theprimary listing), the JSE Limited, the SIX Swiss Exchange, the Botswana StockExchange and the Namibian Stock Exchange.
Significant agreements: change of controlAt 31 December 2019, Anglo American had committed bilateral and syndicatedborrowing facilities totalling $9.1 billion with a number of relationship bankswhich contain change of control clauses. $6.4 billion of the Group’s bond issuesalso contain change of control provisions. In aggregate, this financing isconsidered significant to the Group and in the event of a takeover (change ofcontrol) of the Company, these contracts may be cancelled, becomeimmediately payable or be subject to acceleration.
In the ordinary course of its business the Group’s subsidiaries enter intoa number of other commercial agreements, some of which would alter orterminate upon a change of control of the Company. None of these areconsidered by the Group to be significant to the Group as a whole.
Purchases of own sharesAt the AGM held on 30 April 2019, authority was given for the Company topurchase, in the market, up to 210.6 million ordinary shares of 5486/91 US centseach. This authority will expire at the 2020 AGM and, in accordance with usualpractice, a resolution to renew it for another year will be proposed.
On 25 July 2019, the Company announced its intention to return up to $1 billionto shareholders through an on-market irrevocable and non-discretionaryshare buyback programme (the “Programme”). The Programme started inJuly 2019 and is expected to end no later than 31 March 2020. This additionalreturn recognises the resilience of the Company’s balance sheet, and theBoard’s confidence in funding the Company’s portfolio of highly attractivenear and medium-term growth opportunities. The programme had returned$0.8 billion to shareholders by 31 December 2019.
Details of the shares repurchased and subsequently cancelled under theProgramme during the financial period are set out below. Further details can befound on the Group’s website at: www.angloamerican.com/investors/shareholder-information/share-purchase-transactions
Number of ordinaryshares of 5486/91
US centsrepurchased
Aggregateconsideration paid
Average price paidper share inclusive oftransaction costs
% of share capital therepurchased sharesrepresented at31 December 2019
33,862,933 $779,814,384 $23.03 2.47%
IndemnitiesTo the extent permitted by law and the Articles, the Company has madequalifying third-party indemnity provisions for the benefit of its directors duringthe year, which remain in force at the date of this report. Copies of theseindemnities are open for inspection at the Company’s registered office.
By order of the Board
Richard PriceGroup General Counsel and Company Secretary19 February 2020
OTHER INFORMATION DIRECTORS' REPORT
242 Anglo American plc Integrated Annual Report 2019

Annual General MeetingThis will be held at 14:30 on Tuesday, 5 May 2020, at The Queen Elizabeth IIConference Centre, Broad Sanctuary, Westminster, London SW1P 3EE.
Shareholding enquiriesEnquiries relating to shareholdings should be made to the Company’s UKRegistrars, Equiniti, or the South African Transfer Secretaries, ComputershareInvestor Services (Pty) Limited, at the relevant address below:
UK RegistrarsEquinitiAspect HouseSpencer RoadLancingWest Sussex BN99 6DAEngland
Telephone:In the UK: 0371 384 2026From overseas: +44 (0) 121 415 7558
Transfer Secretaries in South Africa Computershare Investor Services (Pty) LimitedRosebank Towers, 15 Biermann Avenue Rosebank, Johannesburg, 2196, South AfricaPrivate Bag X9000, Saxonwold, 2132, South Africa
Telephone: +27 (0) 11 370 5000Fax: +27 (0) 11 688 5238
Enquiries on other matters should be addressed to the Company Secretaryat the following address:
Registered and Head OfficeAnglo American plc20 Carlton House TerraceLondon SW1Y 5AN England
Telephone: +44 (0) 20 7968 8888Fax: +44 (0) 20 7968 8500Registered number: 03564138
On the Investors section of the Group website a whole range of usefulinformation for shareholders can be found, including:
– investor calendar– share price and tools– dividend information– AGM information– FAQs.
Electronic communicationShareholders may elect to receive, electronically, notification of the availabilityon the Company’s website of future shareholder correspondence, e.g. AnnualReports and Notices of AGMs.
By registering for this service, UK shareholders can also vote online inrespect of future AGMs and access information on their shareholdingincluding, for example, dividend payment history, sales and purchases andindicative share prices. In order to register for these services, UKshareholders should contact the UK Registrars or log on towww.shareview.co.uk and follow the on-screen instructions. It will benecessary to have a shareholder reference number when registering, whichis shown on share certificates, dividend tax vouchers and proxy cards.
DividendsDividends are declared and paid in US dollars to shareholders with registeredaddresses in all countries except the UK, eurozone countries and SouthAfrica where they are paid in sterling, euros and South African randrespectively. Shareholders outside South Africa may elect to receive theirdividends in US dollars.
Shareholders with bank accounts in the UK or South Africa can have their cashdividends credited directly to their own accounts. Shareholders should contactthe relevant Registrar or Transfer Secretary to make use of this facility. SouthAfrican branch register shareholders would need South African exchangecontrol approval to mandate their dividends to an account outside South Africa.
The Company operates a dividend reinvestment plan (DRIP), whichenables shareholders to reinvest their cash dividends into purchasingAnglo American shares. Details of the DRIP and how to join are availablefrom Anglo American’s UK Registrars and South African TransferSecretaries and on the Group’s website.
ShareGiftThe Company supports ShareGift, the charity share donation schemeadministered by The Orr Mackintosh Foundation (registered charity number1052686). Through ShareGift, shareholders with very small numbers of shareswhich might be considered uneconomic to sell are able to donate them tocharity. Donated shares are aggregated and sold by ShareGift, the proceedsbeing passed on to a wide range of charities. For those shareholders who wishto use ShareGift, transfer forms are available from the Registrars and furtherdetails of the scheme can be found on the website www.sharegift.org.
Share dealing serviceTelephone, internet and postal share dealing services have been arrangedthrough Equiniti, providing a simple way for European residents to buy orsell Anglo American shares. For telephone transactions call 0345 603 7037during normal office hours and for internet dealing log on to www.shareview.co.uk/dealing. You will need your shareholder reference number, found onshare certificates, dividend tax vouchers and proxy cards. For further detailson the postal dealing service call 0371 384 2026 (or +44 (0) 121 415 7558from overseas).
Unsolicited mailUnder the Companies Act, the Company is obliged to make the share registeravailable upon request on payment of the appropriate fee. Because of this,some shareholders may receive unsolicited mail. If you wish to limit thereceipt of addressed marketing mail you can register with the MailingPreference Service (MPS). The quickest way to register with the MPS isvia the website: www.mpsonline.org.uk. Alternatively you can registerby telephone on: 020 7291 3310, or by email to: [email protected], or bywriting to MPS Freepost LON20771, London W1E 0ZT.
OTHER INFORMATION
SHAREHOLDER INFORMATION
Anglo American plc Integrated Annual Report 2019 243

244 Anglo American plc Integrated Annual Report 2019
• Sustainability Report • Ore Reserves and Mineral Resources Report • Tax and Economic Contribution Report • Transformation Report • Our Code of Conduct • The Safety, Health and Environment (SHE) Way • The Social Way • The Socio-Economic Assessment Toolbox (SEAT) • Notice of 2020 AGM • www.facebook.com/angloamerican • www.twitter.com/angloamerican • www.linkedin.com/company/anglo-american • www.youtube.com/angloamerican • www.flickr.com/angloamerican • www.slideshare.com/angloamerican
Financial and other reports may be found at: www.angloamerican.com/reporting
A printed copy of the Anglo American Integrated Annual Report can be ordered online at: www.angloamerican.com/site-services/contact-us
©Anglo American plc 2020. All rights reserved.
Strategic partnersAnglo American works in partnership with a wide range of organisations; these important relationships form part of the Group’s commitments to a wide range of key sustainability and other societal objectives. A selection of the organisations we work with can be found on our website: www.angloamerican.com/approach-and-policies.
Group terminologyIn this document, references to “Anglo American”, the “Anglo American Group”, the “Group”, “we”, “us”, and “our” are to refer to either Anglo American plc and its subsidiaries and/or those who work for them generally, or where it is not necessary to refer to a particular entity, entities or persons. The use of those generic terms herein is for convenience only, and is in no way indicative of how the Anglo American Group or any entity within it is structured, managed or controlled. Anglo American subsidiaries, and their management, are responsible for their own day-to-day operations, including but not limited to securing and maintaining all relevant licences and permits, operational adaptation and implementation of Group policies, management, training and any applicable local grievance mechanisms. Anglo American produces group-wide policies and procedures to ensure best uniform practices and standardisation across the Anglo American Group but is not responsible for the day to day implementation of such policies. Such policies and procedures constitute prescribed minimum standards only. Group operating subsidiaries are responsible for adapting those policies and procedures to reflect local conditions where appropriate, and for implementation, oversight and monitoring within their specific businesses.
Forward-looking statements and third-party informationThis document includes forward-looking statements. All statements other than statements of historical facts included in this document, including, without limitation, those regarding Anglo American’s financial position, business, acquisition and divestment strategy, dividend policy, plans and objectives of management for future operations (including development plans and objectives relating to Anglo American’s products, production forecasts and Ore Reserve and Mineral Resource estimates), are forward-looking statements. By their nature, such forward-looking statements involve known and unknown risks, uncertainties and other factors which may cause the actual results, performance or achievements of Anglo American, or industry results, to be materially different from any future results, performance or achievements expressed or implied by such forward-looking statements. Such forward-looking statements are based on numerous assumptions regarding Anglo American’s present and future business strategies and the environment in which Anglo American will operate in the future. Important factors that could cause Anglo American’s actual results, performance or achievements to differ materially from those in the forward-looking statements include, among others, levels of actual production during any period, levels of global demand and commodity market prices, mineral resource exploration and development capabilities, recovery rates and other operational capabilities, the availability of mining and processing equipment, the ability to produce and transport products profitably, the availability of transportation infrastructure, the impact of foreign currency exchange rates on market prices and operating costs, the availability of sufficient credit, the effects of inflation, political uncertainty and economic conditions in relevant areas of the world, the actions of competitors, activities by governmental authorities such as permitting and changes in taxation or safety, health, environmental or other types of regulation in the countries where Anglo American operates, conflicts over land and resource ownership rights and such other risk factors identified in the section of this document titled ‘Managing Risk Effectively’. Forward-looking statements should, therefore, be construed in light of such risk factors and undue reliance should not be placed on forward-looking statements. These forward-looking statements speak only as of the date of this document. Anglo American expressly disclaims any obligation or undertaking (except as required by applicable law, the City Code on Takeovers and Mergers (the “Takeover Code”), the UK Listing Rules, the Disclosure and Transparency Rules of the Financial Conduct Authority, the Listings Requirements of the securities exchange of the JSE Limited in South Africa, the SIX Swiss Exchange, the Botswana Stock Exchange and the Namibian Stock Exchange and any other applicable regulations) to release publicly any updates or revisions to any forward-looking statement contained herein to reflect any change in Anglo American’s expectations with regard thereto or any change in events, conditions or circumstances on which any such statement is based. Nothing in this document should be interpreted to mean that future earnings per share of Anglo American will necessarily match or exceed its historical published earnings per share. Certain statistical and other information about Anglo American included in this document is sourced from publicly available third-party sources. As such, it has not been independently verified and presents the views of those third parties, though these may not necessarily correspond to the views held by Anglo American and Anglo American expressly disclaims any responsibility for, or liability in respect of, such third- party information.
OTHER INFORMATION
OTHER ANGLO AMERICAN PUBLICATIONS

Designed and produced by SALTERBAXTER MSL
This document is printed on Vision Superior which has been independently certified according to the rules of the Forest Stewardship Council® (FSC).
Printed in the UK by Pureprint using its alcofree® and pureprint® environmental printing technology, and vegetable inks were used throughout. Pureprint is a CarbonNeutral® company.
Both manufacturing paper mill and the printer are registered to the Environmental Management System ISO 14001 and are Forest Stewardship Council® (FSC) chain-of-custody certified.

Anglo American plc 20 Carlton House Terrace London SW1Y 5AN England
Tel +44 (0)20 7968 8888 Fax +44 (0)20 7968 8500Registered number 03564138
www.angloamerican.com
Find us on Facebook Follow us on Twitter