RD/RA ADDITIONAL STUDIES REPORT - LEMBERGER LDFL
171
fill-. I ADDITIONAL STUDIES REPORT Lemberger Landfill RD/RA Operable Unit 1 Prepared for. Lemberger Site Remediation Group Submitted By: MALGOUVt PIRNIE Environmental Engineers, Scientists & Planners 5500 Wayzata Boulevard Minneapolis, Minnesota 55416-1262 November 24, 1993 2049-001-290 RECYCLED PAPER
-
Upload
khangminh22 -
Category
Documents
-
view
0 -
download
0
Transcript of RD/RA ADDITIONAL STUDIES REPORT - LEMBERGER LDFL

f i l l - . I
ADDITIONALSTUDIESREPORT
Lemberger LandfillRD/RAOperable Unit 1
Prepared for.
Lemberger Site RemediationGroup
Submitted By:
MALGOUVtPIRNIE
Environmental Engineers, Scientists & Planners5500 Wayzata BoulevardMinneapolis, Minnesota 55416-1262
November 24, 19932049-001-290
RECYCLED PAPER


vsr

United StatesEnvironmental ProtectionAgency
Office of Public AffairsRegion 577 West Jackson Blvd.Chicago, IL 60604
Illinois IndianaMichigan MinnesotaOhio Wisconsin
PUBLIC COMMENT PERIODU.S. EPA will accept written comments on theProposed Plan and Feasibility Study during apublic comment period:
Date: July 21 to August 20, 1993
PUBLIC MEETINGU.S. EPA will hold a public meeting to explainthe Proposed Plan and all of the alternativespresented in the Feasibility Study. Oral andwritten comments will also be accepted at themeeting.
Date: August 10, 1993
Time: 7 p.m.
Place: Stronach Township Hall2471 Main StreetStronach, Michigan
LakeMichigan
PROPOSED PLANPACKAGING CORPORATION OF
AMERICA SUPERFUND SITEFiler City, Michigan
July 1993
INTRODUCTIONThis Proposed Plan identifies the United States Envi-ronmental Protection Agency's (U.S. EPA's) recom-mendation for no action with monitoring to address theground-water contamination at the Packaging Corpora-tion of America (PCA) Superfund site in Filer City,Michigan (Figure I).1 The Remedial Investigation (RI)and Feasibility Study (FS) Reports as well as any otherpertinent documents in the Administrative Record and In-formation Repositories, should be consulted for in-depth
details on the development and evalua-tion of the alternatives considered.
MANISTEETOWNSHIP
LittleManistee
River
NORTHSTRONACHTOWNSHIP
FIGURE 1
The objectives of the RI and FS areto determine the extent of contamina-tion at the site, and to evaluate alter-natives to address threats or potentialthreats posed by the site.
Public input on the alternatives andthe information that supports thesealternatives is an important contribu-tion to the cleanup remedy selectionprocess. Based on new informationor public comment, U.S. EPA maymodify the recommended alternativeor select another alternative pre-sented in this plan and/or the FS Re-port. The public is encouraged to re-view and comment on all technolo-gies and alternatives considered forthe PCA site.
1. Section 117(a) of the Comprehensive Environmental Response, Compensation, and Liability Act (CERCLA) requires publication of a noticeand Proposed Plan for site remediation. The Proposed Plan must also be made available to the public for comment. This Proposed Plan is asummary of information contained in the Feasibility Study for the Packaging Corporation of America Site. Please consult the Feasibility Studyfor more detailed information.

BACKGROUND
PCA operates a semichemical pulp and paper mill inFiler City, Michigan. The plant, which has had severalprevious owners, produces a pulp used to make the in-ternal walls of cardboard boxes.
In the 1940s, the spent pulping liquor from the manu-facturing process was released into Manistee Lake. In1950 or 1951, after a fish kill in the lake, the MichiganWater Resources Commission encouraged the plant op-erator to dispose of the liquid process waste in seepagelagoons rather than in the lake. In 1951, based on tox-icity information, economic considerations and avail-able treatment technologies, theCommission issued a permit to thecompany allowing the disposal ofpulping liquor in lagoons locatednortheast of the lake.
In 1974, the plant stopped using thelagoons. With a Michigan Depart-ment of Natural Resources(MDNR) permit, the company be-gan disposing of its non-hazardous,solid waste in a landfill made fromone of the lagoons. The companyhas since stopped this disposalpractice. PCA is currently imple-menting an MDNR-approved clo-sure plan for the landfill.
• 1983 - The lagoon area at PCAwas added to the National PrioritiesList(NPL). This is a list of sitesthroughout the country that are eli-gible for study and cleanup, if nec-essary, under the Superfund pro-gram.
• 1985 - U.S. EPA identified PCAas being potentially responsible forthe contamination at the site. Thatsame year, U.S. EPA and PCAsigned an agreement calling forPCA to conduct a long-term investi-gation. The agreement also requiredPCA to do the investigation accord-ing to U.S. EPA guidelines.
• 1985 to 1992 - The investigationwas done. It showed that contami-nants in the ground water may posea health threat to people exposed tothem over a lifetime. To U.S.EPA's knowledge, no one is in con-2]
tact with these contaminants nor is the contaminatedground water affecting private wells in the area (SeeFigure 2 for area of contamination).
• 1988 - Aquatic plants and animals typically found inlakes were used in a laboratory study to determinewhat impact, if any, the contaminated ground waterreaching the lake may be having on aquatic life. Thestudy found that the ground water was not having anyharmful effects on aquatic life.
• 1992 to 1993 - MDNR conducted an additionalstudy to determine the effects of the contaminatedground water on Manistee Lake. U.S. EPA believesthat the results of this study are inconclusive.
ATM ofground water
impact
Not to Scale
FIGURE 2

SUMMARY OF SITE RISKS
During the RI/FS, analysis indicated that the con-tamination found in the PCA ground water exceedsthe cleanup levels set by U.S. EPA under the author-ity of the Federal Safe Drinking Water Act. Thesecleanup levels are called Maximum ContaminantLevels (MCLs). Because of the presence of thiscontamination, an analysis was conducted to estimatethe health or environmental problems that wouldresult if the ground-water contamination was notaddressed. This analysis is commonly referred to asthe baseline risk assessment.
In conducting this assessment, the focus was onusing a conservative, yet reasonable, scenario topredict the health effects that could result fromdrinking the water, touching the water, or usingnearby Manistee Lake. Because of the strong odorand dark color of the contaminated ground water,U.S. EPA believes an appropriate scenario is basedon a one-day drinking water exposure. The riskcalculated based on this exposure scenario is withinsafe limits according to U.S. EPA guidelines.
For further details on risks to human health from thePCA ground water, the baseline risk assessmentshould be consulted.
SUMMARY OF ALTERNATIVES
The FS identified and evaluated alternatives thatcould be used to address threats and/or potentialthreats posed by the site. The alternatives evaluatedfor addressing the ground-water contaminationproblem are:
ALTERNATIVE 1 - No Action
• Estimated Cost: $0
• Estimated Timeframe: 60 years
This alternative involves no deed restrictions orcleanup action for the contaminated area. Thisalternative would not effectively reduce the threats tohuman health and the environment at the site. Theinclusion of the no-action alternative is required bylaw to give U.S. EPA a basis for comparison.
ALTERNATIVE 2 - No Action with Access Restric-tions and Site Monitoring (Recommended Alterna-tive)2
• Estimated Cost: $1 million
• Estimated Timeframe: 60 years
This alternative allows the existing natural attenua-tion to reduce the contaminant concentrations in theground water to the established cleanup levels.Under this alternative, deed restrictions and publichealth moratoriums would prohibit the use of anyexisting wells for human drinking water as well asprohibit the drilling of any future wells into thecontaminated ground water. A monitoring programwould indicate if the contaminated ground waterchanges flow direction or characteristics.
ALTERNATIVE 3 - Ground-water Extraction, NewTreatment Plant, and Surface-Water Discharge
DowngradientExtraction
Estimated Cost:$77 million
Estimated Timeframe:43 years
AcceleratedExtraction
$113 million
18 years
This alternative consists of two different extractionscenarios with treatment at a new facility on the PCAproperty. The downgradient extraction scenarioincludes five extraction wells, while the acceleratedextraction scenario includes seven extraction wells.This alternative would also include the access restric-tions described in Alternative 2.
2. Compliance with Superfund Law: Alternative 2, the recommended alternative, is believed to provide the best protection from the threatsassociated with contaminated ground water. Based on the information available at this time, U.S. EPA believes the recommended alternativewould protect human health, would comply with State and Federal laws, would be cost effective, would utilize permanent solutions, and wouldprovide the best balance among all of the nine evaluation criteria.
(3)

ALTERNATIVE 4 - Ground-water Extraction, Ex-panded PCA Treatment Plant, and Lake MichiganDischarge
DowngradientExtraction
Estimated Cost:$71 million
AcceleratedExtraction
$102 million• Estimated Timeframe:
43 years 18 yearsThis alternative consists of the same two extractionscenarios described in Alternative 3 with treatment inthe current PCA wastewater treatment facility. ThePCA treatment facility would be expanded to treat thecontaminated ground water. Alternative 4 also includesthe access restrictions described in Alternative 2.
ALTERNATIVE 5 - Ground-water Extraction andDeep-Well Injection into the Detroit River Group (anunderground rock formation)
Downgradient AcceleratedExtraction Extraction
Estimated Cost:$22 million
Estimated Timeframe:43 years
$37 million
18 yearsThis alternative also consists of the same two extractionscenarios described in Alternative 3, with deep-well in-jection of the contaminated ground water into the De-troit River Group formation. Alternative 5 also in-cludes the access restrictions described in Alternative 2.
ALTERNATIVE 6 - Ground-water Extraction andDeep-Well Injection into Mt. Simon Sandstone (anunderground rock formation)
DowngradientExtraction
Estimated Cost:$55 million
AcceleratedExtraction
$97 million• Estimated Timeframe:
43 years 18 years
This alternative consists of the same two extractionscenarios described in Alternative 3, with deep-wellinjection of the contaminated ground water into theMt. Simon sandstone. Alternative 6 also includes theaccess restrictions described in Alternative 2.
EVALUATING THE ALTERNATIVES
U.S. EPA used the nine criteria described below toevaluate each of the alternatives. An Evaluation Tablecomparing each alternative against these criteria is pro-vided on page 5. The evaluation criteria consisted of:
1. Overall protection of human health and the envi-ronment determines whether an alternative eliminates,reduces, or controls threats to public health and the en-vironment through institutional controls, engineeringcontrols, or treatment.
2. Compliance with Applicable or Relevant and Ap-propriate Requirements f ARARs) evaluates whetherthe alternative meets Federal and State environmentalstatutes, regulations, and other requirements that pertainto the site or whether a waiver is justified.
3. Long-term effectiveness and permanence consid-ers the ability of an alternative to maintain protectionof human health and the environment over time, andthe reliability of such protection.
4. Reduction of contaminant toiicity. mobility, orvolume through treatment evaluates an alternative'suse of treatment to reduce the harmful effects of principlecontaminants, their ability to move in the environment,and the amount of contamination present.
5. Short-term effectiveness considers the length oftime needed to implement an alternative and the risksthe alternative poses to workers, residents, and the en-vironment during implementation.
6. Implementability considers the technical and ad-ministrative feasibility of implementing the alternative,such as relative availability of goods and services.
7. Cost includes estimated capital and operation andmaintenance costs, as well as present worth costs.Present worth cost is the total cost of an alternativeover time in terms of today's dollars.
8. State acceptance considers whether the Stateagrees with U.S. EPA's analyses and recommendationsof the RI/FS and the Proposed Plan.
9. Community acceptance will be addressed in theRecord of Decision (ROD). The ROD will include aresponsiveness summary that presents public com-ments and U.S. EPA responses to those comments.Acceptance of the recommended alternative will beevaluated after the public comment period.

USE THIS SPACE TO WRITE YOUR COMMENTS
Your input on the recommended plan for the Packaging Corporation of America site is important to U.S. EPA.Comments provided by the public are valuable in helping U.S. EPA select a final remedy for the site.
You may use the space below to write your comments, then fold and mail. Comments must be postmarked byAugust 20, 1993. If you have questions about the comment period, please contact Susan Pastor at (312) 353-1325 or through U.S. EPA's toll-free number at: 1-800-621-8431.
I
5
Is
I
I
8?
I
Name_______________
Address_____________
City________________
State_____________ Zip_

PACKAGING CORPORATION OF AMERICA SITEPUBLIC COMMENT SHEET
Name_____________________ PlaceAddress____________________ StampCity_________________ HereState___________Zip________
Susan PastorCommunity Relations CoordinatorOffice of Public Affairs (P-19J)U.S. EPA Region 577 West Jackson BoulevardChicago, IL 60604

THE NEXT STEP EVALUATION TABLE
U.S. EPA will consider public comments receivedduring the public comment period before choosing afinal action for the site. The final action will bedescribed in the ROD.
After a final action is chosen, U.S. EPA will meetwith the parties believed to be responsible for the sitecontamination and request that they conduct sitecleanup activities. Following negotiations, the finalaction will be designed and implemented. If theseparties are unable to negotiate an agreement withU.S. EPA, or unwilling to conduct the cleanupactivities, Superfund monies may be used to pay forthe final action. U.S. EPA may try to recover thosecosts from the responsible parties in federal court.
The Evaluation Table below shows that the recom-mended alternative would be Alternative 2. It wouldprovide the best balance of tradeoffs with respect tothe nine criteria.
Based on available information, this site poses nocurrent or potential threat to human health or theenvironment. Therefore, Alternative 2, no actionwith monitoring and deed restrictions, is the recom-mended alternative. No action combined with moni-toring and deed restrictions will continue to ensurethat exposures to potential hazards posed by thecontaminated ground water at this site will not occurin the future.
TABLE 1
Evaluation Criteria
1 . Overall Protection ofHealth & Environment
2. Compliance with ARARs
3. Long-term Effectivenessand Permanence
4. Reduction of Toxicity, Mobility,or Volume through Treatment
5. Short-term Effectiveness
6. Implementability
7. Cost
8. Support Agency Acceptance
9. Community Acceptance
Alternative1
No Action
•
NA
•
nNA
NA
$0
Alternative2
No Actionwith
Monitoring
•
NA
•
n••$1
million
Alternative3
•
*
••
**
$77-113million
Alternative4
•
*
•
•
*
*$71-102million
Alternative5
•
*
•
D
*
*$22-37million
Alternative6
•
*
•a**
$55-97million
State Acceptance of the recommended alternative will be evaluated afterthe public comment period.
Community Acceptance of the recommended alternative will be evaluatedafter the public comment period.
- Fully meets criteria - Partially meets criteria - Does not meet criteria NA - Not Applicable
®

ADDITIONAL INFORMATION
Anyone interested in learning more about the investigation, the Proposed Plan for controlling contamination atthe PCA site, or the Superfund process, is encouraged to review the Information Repositories maintained forthe PCA site. They contain copies of the RI Work Plan, the RI Report, the FS, the Risk Assessment, theCommunity Relations Plan, the Proposed Plan, and other materials related to the site. The Information Re-positories are located at:
Manistee County Library Stronach Township Hall95 Maple Street 2471 Main StreetManistee, MI Stronach, MI
An Administrative Record file, which contains the information upon which the selection of the cleanup rem-edy will be based, has also been established at the public library and the U.S. EPA Region 5 office in Chicago.
For further information on the PCA site, please contact:
Julie Zakutansky Susan Pastor Mitch AdelmanRemedial Project Manager Community Relations Coordinator Project ManagerOffice of Superfund (HSRW-6J) Office of Public Affairs (P-19 J) Environmental Response DivisionU.S. EPA Region 5 U.S. EPA Region 5 Michigan Department of Natural Resources77 West Jackson Boulevard 77 West Jackson Boulevard Knapps Office CenterChicago, IL 60604 Chicago, IL 60604 P.O. Box 30028(312)353-9660 (312)353-1325 Lansing, MI 48909
Toll Free: 1-800-621-8431 (517)373-8436
&EPA U.S. Environmental Protection AgencyOffice of Public Affairs (P-19J)Region 577 West Jackson BoulevardChicago, IL 60604
Reproduced on Recycled Paper

TABLE OF CONTENTS
Page
1.0 I N T R O D U C T I O N . . . . . . . . . . . . . . . . . . . . . . . . . . . . . . . . . . . . . . . . . . . . . 1-11.1 Background . . . . . . . . . . . . . . . . . . . . . . . . . . . . . . . . . . . . . . . . . . . . 1-11.2 Final Work P lan . . . . . . . . . . . . . . . . . . . . . . . . . . . . . . . . . . . . . . . . . 1-2
2.0 LANDFILL WASTE VOLUME STUDY . . . . . . . . . . . . . . . . . . . . . . . . . . . 2-12.1 Introduction . . . . . . . . . . . . . . . . . . . . . . . . . . . . . . . . . . . . . . . . . . . . 2-12.2 Sources of Data Used and Outputs Generated . . . . . . . . . . . . . . . . . . 2-123 Surfer Calculations . . . . . . . . . . . . . . . . . . . . . . . . . . . . . . . . . . . . . . . 2-22.4 Volume of Waste Only . . . . . . . . . . . . . . . . . . . . . . . . . . . . . . . . . . . . 2-225 Volume of Waste Plus Six Inches of Intermediate Cover . . . . . . . . . . 2-22.6 Volume of Waste Plus Intermediate Cover Plus all Final
Cover Mate r ia l . . . . . . . . . . . . . . . . . . . . . . . . . . . . . . . . . . . . . . . . . . 2-32.7. Conclusion . . . . . . . . . . . . . . . . . . . . . . . . . . . . . . . . . . . . . . . . . . . . . 2-3
3.0 PREDESIGN GROUND WATERING MONITORING PROGRAM ... . . 3-13.1 Introduction . . . . . . . . . . . . . . . . . . . . . . . . . . . . . . . . . . . . . . . . . . . . 3-13.2 Installation of Monitoring Wells . . . . . . . . . . . . . . . . . . . . . . . . . . . . . 3-13.3 Groundwater Sampling . . . . . . . . . . . . . . . . . . . . . . . . . . . . . . . . . . . . 3-23.4 Groundwater Analytical Results . . . . . . . . . . . . . . . . . . . . . . . . . . . . . 3-3
3.4.1 Groundwater Monitoring Wells . . . . . . . . . . . . . . . . . . . . . . . 3-33.4.2 Residential Wells . . . . . . . . . . . . . . . . . . . . . . . . . . . . . . . . . . 3-43.4.3 Residential Wells to be Resampled . . . . . . . . . . . . . . . . . . . . . 3-4
3.5 Groundwater Plume Analysis . . . . . . . . . . . . . . . . . . . . . . . . . . . . . . . 3-5
4.0 PUMPING TEST PROGRAM . . . . . . . . . . . . . . . . . . . . . . . . . . . . . . . . . . . 4-1
5.0 MODELLING REPORT . . . . . . . . . . . . . . . . . . . . . . . . . . . . . . . . . . . . . . . . 5-15.1 Introduction . . . . . . . . . . . . . . . . . . . . . . . . . . . . . . . . . . . . . . . . . . . . 5-15.2 Study Area Hydrogeology. . . . . . . . . . . . . . . . . . . . . . . . . . . . . . . . . . 5-1
5.2.1 Geologic Units . . . . . . . . . . . . . . . . . . . . . . . . . . . . . . . . . . . . 5-15.2.2 Groundwater Flow . . . . . . . . . . . . . . . . . . . . . . . . . . . . . . . . . 5-25.23 Contaminant Migration . . . . . . . . . . . . . . . . . . . . . . . . . . . . . 5-4
5.3 Modelling . . . . . . . . . . . . . . . . . . . . . . . . . . . . . . . . . . . . . . . . . . . . . . 5-55.3.1 Objectives . . . . . . . . . . . . . . . . . . . . . . . . . . . . . . . . . . . . . . . . 5-653.2 Regional Aquifer Model . . . . . . . . . . . . . . . . . . . . . . . . . . . . . 5-6
53.2.1 Parameter Selection . . . . . . . . . . . . . . . . . . . . . . . . . . 5-653.2.2 Calibration . . . . . . . . . . . . . . . . . . . . . . . . . . . . . . . . . . 5-853.2.3 Sensitivity Analysis . . . . . . . . . . . . . . . . . . . . . . . . . . . . 5-953.2.4 Extraction Well Scenario . . . . . . . . . . . . . . . . . . . . . . . 5-1053.2.5 Infiltration Gallery Scenario . . . . . . . . . . . . . . . . . . . . . 5-12
533 Perched Aquifer Model . . . . . . . . . . . . . . . . . . . . . . . . . . . . . . . 5-13533.1 Parameter Selection . . . . . . . . . . . . . . . . . . . . . . . . . . . 5-135.33.2 Calibration . . . . . . . . . . . . . . . . . . . . . . . . . . . . . . . . . . 5-14533.3 Sensitivity Analysis . . . . . . . . . . . . . . . . . . . . . . . . . . . . 5-15533.4 Remedial Action Scenarios . . . . . . . . . . . . . . . . . . . . . 5-15
53.3.4.1 Slurry Wall and Cap Scenario . . . . . . . . . . . . 5-16
2049-001-290 i

TABLE OF CONTENTS (continued)
533.4.2 One Extraction Well Near RM-7 Scenario5-16533.43 Extraction Well Network Scenario ........ 5-17533.4.4 French Drain at LTR Scenario . . . . . . . . . . . 5-17533.4.5 French Drain Near MW-10 Scenario ...... 5-17533.4.6 Extraction Well Near MW-10 Scenario ..... 5-18533.4.7 Extraction Well Near RM-5S . . . . . . . . . . . . 5-18533.4.8 French Drain North of LL . . . . . . . . . . . . . . 5-18
533.5 Recommended Remedial Action Scenario . . . . . . . . . . 5-185.4 Conclusions and Recommendations . . . . . . . . . . . . . . . . . . . . . . . . . . 5-19
6.0 TREATABHJTY STUDY . . . . . . . . . . . . . . . . . . . . . . . . . . . . . . . . . . . . . . . 6-16.1 Introduction . . . . . . . . . . . . . . . . . . . . . . . . . . . . . . . . . . . . . . . . . . . . 6-16.2 Influent Sample Collection . . . . . . . . . . . . . . . . . . . . . . . . . . . . . . . . . 6-163 Liquid-Phase Carbon Adsorption . . . . . . . . . . . . . . . . . . . . . . . . . . . . 6-26.4 Chemical Precipitation Test . . . . . . . . . . . . . . . . . . . . . . . . . . . . . . . . 6-46.5 Electrochemical Precipitation Test . . . . . . . . . . . . . . . . . . . . . . . . . . . 6-56.6 Air Stripper Economic Analysis . . . . . . . . . . . . . . . . . . . . . . . . . . . . . 6-76.7 Bench Scale Test Summary and Conclusions . . . . . . . . . . . . . . . . . . . 6-8
7.0 AQUATIC TOXK3TY TESTING FOR TREATABHJTY STUDY .. . . . . . 7-17.1 Introduction . . . . . . . . . . . . . . . . . . . . . . . . . . . . . . . . . . . . . . . . . . . . 7-17.2 Acute Toxicity Tests . . . . . . . . . . . . . . . . . . . . . . . . . . . . . . . . . . . . . . 7-173 Chronic Toxicity Testing . . . . . . . . . . . . . . . . . . . . . . . . . . . . . . . . . . 7-2
73.1 General . . . . . . . . . . . . . . . . . . . . . . . . . . . . . . . . . . . . . . . . . 7-273.2 Ceriodaphma dupia . . . . . . . . . . . . . . . . . . . . . . . . . . . . . . . . . 7-2733 Pimephales promelas . . . . . . . . . . . . . . . . . . . . . . . . . . . . . . . . 7-3
7.4 Reference Toxicant and Water Quality . . . . . . . . . . . . . . . . . . . . . . . 7-475 Summary . . . . . . . . . . . . . . . . . . . . . . . . . . . . . . . . . . . . . . . . . . . . . . 7-4
8.0 WETLANDS ASSESSMENT . . . . . . . . . . . . . . . . . . . . . . . . . . . . . . . . . . . . 8-18.1 Introduction . . . . . . . . . . . . . . . . . . . . . . . . . . . . . . . . . . . . . . . . . . . . 8-18.2 Wetlands Delineation . . . . . . . . . . . . . . . . . . . . . . . . . . . . . . . . . . . . . 8-183 Wetland Evaluation Technique (WET) Results . . . . . . . . . . . . . . . . . 8-18.4 Practicable Alternatives Analysis . . . . . . . . . . . . . . . . . . . . . . . . . . . . 8-3
8.4.1 General . . . . . . . . . . . . . . . . . . . . . . . . . . . . . . . . . . . . . . . . . 8-38.4.2 WET Evaluation of Alternatives . . . . . . . . . . . . . . . . . . . . . . . 8-3
8.4.2.1 Alternative 1-Installation of French DrainNear MW-10. . . . . . . . . . . . . . . . . . . . . . . . . . . . . . . . . . . . . . 8-48.4.2.2 Alternative 2-Extraction Well Near MW-10 . . . . . . . . . 8-4
8.43 Impacts to Wetlands Water Quality Standards . . . . . . . . . . . . 8-58.4.4 Impacts to Wetlands in Areas of Special NaturalResource Interest . . . . . . . . . . . . . . . . . . . . . . . . . . . . . . . . . . . . . . . . 8-5
9.0 BRANCH RTVER WATER QUALITY SAMPLING . . . . . . . . . . . . . . . . . . 9-19.1 Introduction . . . . . . . . . . . . . . . . . . . . . . . . . . . . . . . . . . . . . . . . . . . . 9-192 July 1993 Sampling Round . . . . . . . . . . . . . . . . . . . . . . . . . . . . . . . . . 9-393 October 1993 Sampling Round . . . . . . . . . . . . . . . . . . . . . . . . . . . . . . 9-4
2049401-290

TABLE OF CONTENTS (continued)
10.0 BRANCH RIVER SEDIMENT SAMPLING . . . . . . . . . . . . . . . . . . . . . . . . 10-110.1 Introduction . . . . . . . . . . . . . . . . . . . . . . . . . . . . . . . . . . . . . . . . . . 10-110.2 July 1993 Sampling Round . . . . . . . . . . . . . . . . . . . . . . . . . . . . . . . . . 10-2
11.0 BRANCH RIVER BENTfflC INVERTEBRATE SURVEY . . . . . . . . . . . . 11-111.1 Introduction . . . . . . . . . . . . . . . . . . . . . . . . . . . . . . . . . . . . . . . . . . . . 11-111.2 Sample Collection . . . . . . . . . . . . . . . . . . . . . . . . . . . . . . . . . . . . . . . 11-111.3 Benthic Identification . . . . . . . . . . . . . . . . . . . . . . . . . . . . . . . . . . . . . 11-2
12.0 FISHERIES AND THREATENED/ENDANGERED SPECIES SURVEY . 12-112.1 Introduction . . . . . . . . . . . . . . . . . . . . . . . . . . . . . . . . . . . . . . . . . . . . 12-112.2 Branch River Fish Community and Habitat Survey . . . . . . . . . . . . . . 12-112.3 Branch River Mussel Survey . . . . . . . . . . . . . . . . . . . . . . . . . . . . . . . 12-3
13.0 SUBSURFACE SOIL INVESTIGATION . . . . . . . . . . . . . . . . . . . . . . . . . . . 13-113.1 Introduction . . . . . . . . . . . . . . . . . . . . . . . . . . . . . . . . . . . . . . . . . . . . 13-113.2 Slurry Wall . . . . . . . . . . . . . . . . . . . . . . . . . . . . . . . . . . . . . . . . . . . . . 13-113.3 Pipeline Route . . . . . . . . . . . . . . . . . . . . . . . . . . . . . . . . . . . . . . . . . . 13-2
14.0 INFILTRATION GALLERY ALTERNATIVE ANALYSIS . . . . . . . . . . . . . 14-114.1 Introduction . . . . . . . . . . . . . . . . . . . . . . . . . . . . . . . . . . . . . . . . . . . . 14-114.2 Data Collection . . . . . . . . . . . . . . . . . . . . . . . . . . . . . . . . . . . . . . . . . 14-1143 Data Reduction . . . . . . . . . . . . . . . . . . . . . . . . . . . . . . . . . . . . . . . . . 14-214.4 Modelling . . . . . . . . . . . . . . . . . . . . . . . . . . . . . . . . . . . . . . . . . . . . . . 14-314.5 Conclusion and Recommendations . . . . . . . . . . . . . . . . . . . . . . . . . . . 14-3
15.0 LANDFILL GAS PERIMETER MONITORING . . . . . . . . . . . . . . . . . . . . . 15-1
LIST OF TABLES
Table FollowingNo. Description Page
3-1 Predesign Monitoring Wells . . . . . . . . . . . . . . . . . . . . . . . . . . . . . . . . . . . . . . 3-5
3-2 Predesign Monitoring Well Monitoring network . . . . . . . . . . . . . . . . . . . . . . 3-5
3-3 Predesign Residential Well Monitoring Network . . . . . . . . . . . . . . . . . . . . . . 3-5
3-4 Drilling Water Analytical Results . . . . . . . . . . . . . . . . . . . . . . . . . . . . . . . . . . 3-5
3-5 Well Construction Table . . . . . . . . . . . . . . . . . . . . . . . . . . . . . . . . . . . . . . . . 3-5
3-6 Groundwater Monitoring Wells, Laboratory Analytical Data . . . . . . . . . . . . . 3-5
3-7 Residential Groundwater Wells, Laboratory Analytical Data . . . . . . . . . . . . . 3-5
2049401-290 iii

LIST OF TABLES (continued)
5-1 Contaminant List . . . . . . . . . . . . . . . . . . . . . . . . . . . . . . . . . . . . . . . . . . . . . . 5-21
5-2 Calibration, Regional Groundwater Model . . . . . . . . . . . . . . . . . . . . . . . . . . 5-21
5-3 Sensitivity Analysis, Regional Groundwater Model . . . . . . . . . . . . . . . . . . . . 5-21
5-4 Calibration, Perched Groundwater Model . . . . . . . . . . . . . . . . . . . . . . . . . 5-21
5-5 Sensitivity Analysis, Perched Groundwater Model . . . . . . . . . . . . . . . . . . . . . 5-21
6-1 Well Samples Used to Make Treatability Composite Sample . . . . . . . . . . . . . 6-9
6-2 Groundwater Composite Analytical Results . . . . . . . . . . . . . . . . . . . . . . . . . . 6-9
6-3 Carbon Column Effluent Results . . . . . . . . . . . . . . . . . . . . . . . . . . . . . . . . . . 6-9
6-4 Sediment Sample From Carbon Column Test . . . . . . . . . . . . . . . . . . . . . . . . 6-9
6-5 Potassium Permanganate Oxidation Test Results . . . . . . . . . . . . . . . . . . . . . . 6-9
6-6 Electrochemical Precipitation Effluent Analytical Results . . . . . . . . . . . . . . . 6-9
6-7 Precipitate Sample From Electrochemical Precipitation Test . . . . . . . . . . . . . 6-9
7-1 Acute Toxicity Test Results . . . . . . . . . . . . . . . . . . . . . . . . . . . . . . . . . . . . . . 7-4
7-2 Ceriodaphnia dubia, Short-Term Chronic Toxicity Test Results . . . . . . . . . . . 7-4
7-3 Pimephales promelas, Short-Term Chronic Toxicity Test Results . . . . . . . . . . 7-4
7-4 Results of Short-Term Chronic Reference Toxicant Testswith Sodium Chloride (NaCl) . . . . . . . . . . . . . . . . . . . . . . . . . . . . . . . . . . . . 7-4
7-5 Results of Acute Reference Toxicant Tests with Sodium Chloride(NaO) ... 7-4
7-6 Summary of Water Quality Measurements for Receiving Water andUndiluted Well Water Samples at Test Initiation . . . . . . . . . . . . . . . . . . . . . . 7-4
8-1 Summary of Wet Evaluation Results . . . . . . . . . . . . . . . . . . . . . . . . . . . . . . . 8-4
8-2 Summary of Wet Effectiveness Results for Alternatives . . . . . . . . . . . . . . . . . 8-4
13-1 Slurry Wall Borings Soil Sample Record . . . . . . . . . . . . . . . . . . . . . . . . . . . . 13-2
13-2 Pipeline Route Borings Soil Sample Record . . . . . . . . . . . . . . . . . . . . . . . . . 13-2
14-1 Infiltration Gallery Test Results . . . . . . . . . . . . . . . . . . . . . . . . . . . . . . . . . . . 14-3
15-1 Landfill Gas Perimeter Monitoring . . . . . . . . . . . . . . . . . . . . . . . . . . . . . . . . 15-2
20(94)01.290 Kr

LIST OF FIGURES
Figure FollowingNo. Description Page
2-1 Landfill Boring and Trenching Locations . . . . . . . . . . . . . . . . . . . . . . . . . . . . 2-3
3-1 Predesign Monitoring Well Locations . . . . . . . . . . . . . . . . . . . . . . . . . . . . . . 3-4
5-1 Study Area Limits . . . . . . . . . . . . . . . . . . . . . . . . . . . . . . . . . . . . . . . . . . . . . 5-21
5-2 Geologic Column . . . . . . . . . . . . . . . . . . . . . . . . . . . . . . . . . . . . . . . . . . . . . . 5-21
5-3 Landforms . . . . . . . . . . . . . . . . . . . . . . . . . . . . . . . . . . . . . . . . . . . . . . . . . . . 5-21
5-4 Extent of the Perched Aquifer . . . . . . . . . . . . . . . . . . . . . . . . . . . . . . . . . . . . 5-21
5-5 Bedrock Groundwater Elevations . . . . . . . . . . . . . . . . . . . . . . . . . . . . . . . . . 5-21
5-6 Bedrock Topography . . . . . . . . . . . . . . . . . . . . . . . . . . . . . . . . . . . . . . . . . . . 5-21
5-7 Saturated and Confined Conditions . . . . . . . . . . . . . . . . . . . . . . . . . . . . . . . . 5-21
5-8 GW Flow in the Perched Aquifer . . . . . . . . . . . . . . . . . . . . . . . . . . . . . . . . . 5-21
5-9 Regional Aquifer Plume . . . . . . . . . . . . . . . . . . . . . . . . . . . . . . . . . . . . . . . . 5-21
5-10 Perched Aquifer Plume . . . . . . . . . . . . . . . . . . . . . . . . . . . . . . . . . . . . . . . . . 5-21
5-11 Regional Model Water Levels . . . . . . . . . . . . . . . . . . . . . . . . . . . . . . . . . . . . 5-21
5-12 Regional Extraction Wells . . . . . . . . . . . . . . . . . . . . . . . . . . . . . . . . . . . . . . . 5-21
5-13 Extraction Water Levels-Bedrock . . . . . . . . . . . . . . . . . . . . . . . . . . . . . . . . . . 5-21
5-14 Extraction Water Levels-LGU . . . . . . . . . . . . . . . . . . . . . . . . . . . . . . . . . . . . 5-21
5-15 Infiltration Gallery Location . . . . . . . . . . . . . . . . . . . . . . . . . . . . . . . . . . . . . 5-21
5-16 Infiltration Gallery WL-Rock . . . . . . . . . . . . . . . . . . . . . . . . . . . . . . . . . . . . . 5-21
5-17 Infiltration Gallery WL-LGU . . . . . . . . . . . . . . . . . . . . . . . . . . . . . . . . . . . . . 5-21
5-18 Perched Model Water Levels . . . . . . . . . . . . . . . . . . . . . . . . . . . . . . . . . . . . . 5-21
5-19 Slurry Wall Scenario Water Levels . . . . . . . . . . . . . . . . . . . . . . . . . . . . . . . . 5-21
5-20 Extraction Well Near RM-7 Water Levels . . . . . . . . . . . . . . . . . . . . . . . . . . . 5-21
2049401-290 v

LIST OF FIGURES (continued)
5-21 Extraction Well Network . . . . . . . . . . . . . . . . . . . . . . . . . . . . . . . . . . . . . . . . 5-21
5-22 Extraction Well Network Water Levels . . . . . . . . . . . . . . . . . . . . . . . . . . . . . 5-21
5-23 LTR Drain Location . . . . . . . . . . . . . . . . . . . . . . . . . . . . . . . . . . . . . . . . . . . 5-21
5-24 LTR Drain Water Levels . . . . . . . . . . . . . . . . . . . . . . . . . . . . . . . . . . . . . . . . 5-21
5-25 Drain Near MW-10 Water Levels . . . . . . . . . . . . . . . . . . . . . . . . . . . . . . . . . 5-21
5-26 Extraction Well Near MW-10 Water Leveb . . . . . . . . . . . . . . . . . . . . . . . . . . 5-21
5-27 Extraction Well Near RM-5 Water Levels . . . . . . . . . . . . . . . . . . . . . . . . . . . 5-21
5-28 Drain North of LL Location . . . . . . . . . . . . . . . . . . . . . . . . . . . . . . . . . . . . . 5-21
5-29 Drain North of LL Water Levels . . . . . . . . . . . . . . . . . . . . . . . . . . . . . . . . . . 5-21
5-30 Recommended Remedial Action .................................. 5-21
5-31 Recommended Remedial Action Water Levels ....................... 5-21
9-1 July 1993 Surface Water Sampling Locations . . . . . . . . . . . . . . . . . . . . . . . . . 9-5
9-2 October 1993 Surface Water Sampling Locations . . . . . . . . . . . . . . . . . . . . . . 9-5
10-1 July 1993 Sediment Sampling Locations . . . . . . . . . . . . . . . . . . . . . . . . . . . . . 10-3
11-1 April 1993 Benthic Survey Sampling Locations . . . . . . . . . . . . . . . . . . . . . . . 11-3
13-1 Slurry Wall Boring Locations . . . . . . . . . . . . . . . . . . . . . . . . . . (See Map Pocket)
13-2 Pipeline Route Boring Locations . . . . . . . . . . . . . . . . . . . . . . . (See Map Pocket)
15-1 Gas Well Locations . . . . . . . . . . . . . . . . . . . . . . . . . . . . . . . . . . . . . . . . . . . . 15-2
LIST OF PLATES
Plate No. Description___________________________________
5-1 Geologic Cross Sections . . . . . . . . . . . . . . . . . . . . . . . . . . . . . . (See Map Pocket)
20494)01-290

VOLUME I
LIST OF APPENDICES
Appendix Description
A-l October 29, 1993 Memorandum From WDNR on Landfill Design CapacityCalculation
A-2 Lemberger Landfill Data Points for Volume Calculations
A-3 Lemberger Landfill Volume CalculationsA. Top of Waste to Bottom Waste OnlyB. Bottom of Waste to Top of Waste Plus Six Inches of Daily CoverC. Bottom of Waste to Landfill Surface
A-4 Topographic Map of Waste Thickness
A-5 Waste Cross-Sections
A-6 Waste Surface Maps - 3D Views
A-7 Landfill Surface MapsA. Ground Surface ElevationsB. Waste Upper Surface ElevationsC. Waste Lower Surface ElevationsD. Waste Upper and Lower Surface Elevations
A-8 Landfill Solid Waste Boring Logs
A-9 f-andfiU Perimeter Trenching Logs
B-l Soil Boring and Monitoring Well Forms
B-2 COD/TSS and Grain Size Analysis
B-3 Report of Groundwater Monitoring
B-4 Laboratory Analytical Data for Groundwater Monitoring and ResidentialWells
C-l Lemberger Landfill RD/RA Pumping Test Program
D-l Raw Model Output for Calibration Run
D-2 Raw Model Output for Extraction Well Scenario
2049401-290 vii

LIST OF APPENDICES (continued)
D-3 Raw Model Output for Infiltration Gallery Scenario
D-4 Raw Model Output for Perched Model Calibration Run
D-5 Raw Model Output for Perched ModelSlurry Wall Scenario
D-6 Raw Model Output for Perched ModelExtraction Well Near RM-7 Scenario
D-7 Raw Model Output for Perched ModelExtraction Well Network Scenario
D-8 Raw Model Output for Perched ModelLTR Drain Scenario
D-9 Raw Model Output for Perched ModelDrain Near MW-10 Scenario
D-10 Raw Model Output for Perched ModelExtraction Well Near MW-10 Scenario
D-ll Raw Model Output for Perched ModelExtraction Well Near RM-5 Scenario
D-12 Raw Model Output for Perched ModelDrain North of LL Scenario
D-13 Raw Model Output for Perched ModelRecommended Remedial Action Scenario
VOLUME II
E-l Sampling Logs for Treatability Study
E-2 Liquid Phase Carbon Adsorption Treatability Study
E-3 Chemical Precipitation Treatability Study
2049401-290 viii

LIST OF APPENDICES (continued)
E-4 Electrochemical Precipitation Treatability Study
F-l Laboratory Data Sheets for Aquatic Toxicity Test
G-l Wetlands Delineation Report
G-2 Wetlands Evaluation Technique Forms
H-l Water Quality and Sediment Field Sampling Data
H-2 Branch River Surface Water Analytical Data
1-1 Branch River Sediment Analytical Data
J-l Rapid Bioassessment Report on the Branch River
J-2 Macroinvertebrate Field Sampling Data
K-l Branch River Fish Community and Habitat Survey
K-2 Branch River Mussel Survey
L-l Subsurface Soil Investigation Boring Logs
M-l Infiltration Gallery Investigation Boring Logs
M-2 Infiltration Gallery Investigation Test Results and Calculations
N-l Gas Well Boring Logs
2049401-290

1.0 INTRODUCTION
1.1 BACKGROUND
The Lemberger Landfill (LL) and Lemberger Transport & Recycling (LTR) Siteslocated in Manitowoc County Wisconsin are both Superfund Sites on the National PrioritiesList. The U.S. Environmental Protection Agency (USEPA) has divided remedial actionactivities into two operable units. Operable Unit 1 (herein referred to as the "LembergerLandfill RD/RA") indudes treatment of contaminated groundwater associated with both theLL Site and the LTR Site, and source control at the LL Site. Operable Unit 2 addressessource control at the LTR Site.
The Lemberger Site Remediation Group (LSRG) has signed a Consent Decree withthe USEPA to conduct certain Operable Unit 1 remediation activities. The requiredremediation activities under the Consent Decree indude several "Additional Studies" whichmay impact the remedial design. The LSRG also added several alternative studies with thepotential for reducing the cost of remedial design, construction and operation while attainingthe environmental goals of the project. The "Additional Studies" indude the following:
• Landfill Waste Volume Study• Predesign Groundwater Monitoring Program• Groundwater Pumping Test• Groundwater Flow Modeling• Treatability Study• Aquatic Toxicity Tests• Wetlands Assessment• Branch River Water Quality Sampling• Branch River Sediment Sampling• Branch River Benthic Invertebrate Survey• Fisheries and Threatened and Endangered Species Survey• Subsurface Soils Investigation• Infiltration Gallery Alternative Investigation• Landfill Gas Perimeter MonitoringThe results of these Additional Studies are presented in this report.
2049-001-290 1-1

As of the date of this report several studies are still underway. Malcolm Pirnie stillplans to conduct: two quarterly rounds of Branch River water quality sampling (one inJanuary 1994 and one in April 1994); an additional sampling round for residential wellsshowing concentrations greater than the clean-up goals for the site, and one more roundof landfill gas perimeter monitoring. The results of these remaining activities will beprovided to the USEPA and WDNR under separate cover when they are available.
The USEPA has recently requested that an additional Branch River sedimentsampling round be conducted as part of the Additional Studies. However, the scope of thisactivity is still being clarified by the WDNR and USEPA. The results of additional sedimentsampling activities will be provided to the USEPA and WDNR under separate cover whenthey are available.
12 FINAL WORK PLAN
The scope and technical approach of the Additional Studies are defined in the FinalWork Plan dated March 23,1993, as conditionally approved by the USEPA on May 4,1993,and subsequent revisions issued by Malcolm Pirnie in response to these conditions.Revisions to the March 23, 1993 Final Work Plan which impact the technical approach ofthe Additional Studies were provided to the USEPA in correspondence from MalcolmPirnie. The date of each revision letter and the subject are listed below:
• May 18, 1993 letter regarding the clay borrow source investigation and clayspecifications;
• May 18, 1993 letter regarding revisions to the predesign groundwatermonitoring program, additional drilling requirements and Branch River waterquality sampling requirements;
• June 2,1993 letter regarding the submittal of a separate work plan for a partialactive gas system and a revised project schedule;
• July 12,1993 letter regarding revisions to the clay borrow source specifications,Branch River sediment sampling, and landfill gas monitoring program;
• July 26, 1993 letter regarding the Branch River sampling locations;
• October 5, 1993 letter regarding the clay borrow source conditions; and
• October 27,1993 letter regarding the Branch River sediment and water qualitysampling and analysis.
2049-001-290 1-2

Copies of these Final Work Plan revision letters may be obtained from the USEPA,WDNR or Malcolm Pirnie.
2049-001-290 1-3

2.0 LANDFILL WASTE VOLUME STUDY
2.1 INTRODUCTION
Covered waste material disposed of at the Lemberger Landfill could potentiallygenerate methane gas through decomposition. An evaluation of the design capacity volumeof waste in place will determine whether an active or passive landfill gas collection systemis required at the facility under NR 506.08 (6) Wis. Adm. Code. The Landfill WasteVolume Study was conducted to determine the total volume design capacity of solid wastein place at the Lemberger Landfill
As part of the study, available data on the thickness of waste at the LembergerLandfill were collected and compiled. New data was obtained through field investigations.All this data were tabulated and then used to calculate the approximate total volume ofwaste in place. Several different volume calculations were conducted using varyingassumptions on how much of the cover material to include in the volume calculations.Volume calculations were performed according to the instructions provided in the October29, 1993 memorandum from Mr. Gary Edelstein, Wisconsin Department of NaturalResources (WDNR) to the U.S. Environmental Protection Agency (EPA) and MalcolmPirnie, Inc. (See Appendix A-l).
22 SOURCES OF DATA USED AND OUTPUTS GENERATED
The available data include twenty-seven borings into the landfill, fifteen trenchesaround the landfill perimeter to define maximum extent of waste placement and the logs ofseven monitoring wells within and around the landfill. These data are summarized in atabular form in Appendix A-2. Appendix A-2, lists the x and y coordinates of the datapoints, the landfill surface elevation, the top of the waste elevation at that point, the baseof waste elevation, the depth to water table, the elevation of the deepest extent of theboring, well or trench, the point identification number, and the thickness of waste measuredat that point.
Copies of landfill design capacity calculations, SURFER output maps and cross-sections are included in Appendices A-3, A-4, A-5, A-6 and A-7. Boring logs from the wastedrilling program are provided in Appendix A-8. Trench logs are provided in Appendix A-9.
2049401-290 2-1

The base map in Figure 2-1 shows the outline of the landfill, as well as, the approximatelocations of the wells, borings and perimeter trenches used to delineate the maximum extentof waste placement.
23 SURFER CALCULATIONS
Fifty-one data points were entered into the SURFER computer program. The wastevolume was calculated by the SURFER volume utility. SURFER output maps and cross-sections are found in Appendices A4 through A7. Three narrative and calculation sheetsdescribing the SURFER volume calculations are provided in Appendix A-3.
2.4 VOLUME OF WASTE ONLY
Appendix A-3a describes the calculation of the total design capacity volume of wasteonly. This calculation does not include any of the cover material at the landfill The volumewas determined by subtracting the elevation of the base of the waste from the elevation ofthe top of the waste and integrating the surfaces across the fifty-one points of data.
According to the SURFER program, the waste volume was 313,490.76 cubic yardsas calculated by the trapezoidal rule. The volume was 313397.03 cubic yards as calculatedby Simpson's rule. The volume was 313,493.33 cubic yards as figured out by the applicationof Simpson's three eighths Rule. The average of these three readings is 313,46037 cubicyards. This average design capacity volume is 62.69% of the 500,000 cubic yard designcapacity limit set by the Wisconsin Department of Natural Resources to require an activelandfill gas collection system.
2.5 VOLUME OF WASTE PLUS SIX INCHES OF INTERMEDIATE COVER
Volume calculations in Appendix A-3b include the addition of six inches of interme-diate cover on top of the waste. According to WDNR's memorandum dated October 29,1993 (Appendix A-l) the WDNR definition of design capacity includes waste volume plusall intermediate or daily cover, but NOT final cover in the required volume calculation.This iteration is seen as the best determinant of whether the Lemberger Landfill wouldrequire an active or passive gas collection system. According to the SURFER program, the
2049401-290 2-2

waste volume was 341,975.55 cubic yards as calculated by the trapezoidal rule. The volumewas 341,881.85 cubic yards as calculated by Simpson's rule. The volume was 341,978.14cubic yards as calculated by the application of Simpson's three eighths Rule. Average ofthese three readings is 341,945.16 cubic yards. This average volume is 6839% of the 500,000cubic yard limit set by the WDNR to require an active landfill gas collection system. Basedon this calculation the Lemberger Landfill also would not require an active gas collectionsystem.
2.6 VOLUME OF WASTE PLUS INTERMEDIATE COVER PLUS ALL FINALCOVER MATERIAL
Appendix A-3c includes a calculation for the total volume of all waste, intermediatecover and existing final cover material at the Lemberger Landfill. This calculation isincluded primarily for informational purposes. The SURFER program indicates that thetotal waste and existing cover volume was 468,051.62 cubic yards as calculated by thetrapezoidal rule. The volume was 468,051.85 cubic yards as calculated by Simpson's rule.The volume was 468,144.44 cubic yards as figured out by the application of Simpson's threeeighths rule. The average of these three readings is 468,108.63 cubic yards.
2.7 CONCLUSION
Based on analysis of all available information, the total average design capacityvolume of the Lemberger Landfill is approximately 342,000 cubic yards. This volume is lessthan the 500,000 cubic yard criteria set by WDNR to require an active gas collection system.As a result, an active gas collection system would not be required for closure of theLemberger Landfill
2049401-290 2-3

•« carat EC a
B.7BBN
1ZS30 N
izsaan
I2JB0N
I22BB N
12JB0 N
12iKB N
U.9BB N
1LB00N
U.7BB N
IL6BE N
1LSK N
a«B N
UTC N
UZBBS
Trenching/Test PitsNew Landfill Borings
-N-
Note: SM Flgui* 13-1 for skiny wal bortig locations
LANDFILL BORING & TRENCHING LOCATIONSLEMBERGER LANDFILL RD/RA ACTIVITIES
Figure 2-1

3.0 PREDESIGN GROUNDWATER MONITORING PROGRAM
3.1 INTRODUCTION
Malcolm Pirnie developed and implemented a predesign groundwater monitoringprogram as part of the Lemberger Landfill RD/RA. The objective of the predesignmonitoring program is to update data collected during the Remedial Investigations forremedial design. The predesign monitoring program includes: installation of six newmonitoring wells; groundwater sampling of the six new wells (Table 3-1); 16 existingmonitoring wells (Table 3-2) and 18 residential wells (Table 3-3); and groundwater sampleanalysis for the Target Compound List/Target Analyte List (TCL/TAL) compounds. Welllocations are shown in Figure 3-1. Well installations, sampling procedures and analyticalmethods/results are discussed in the following subsections. Predesign monitoring programactivities were conducted in accordance with the Final Work Plan.
3.2 INSTALLATION OF MONITORING WELLS
As part of the predesign groundwater monitoring program, six monitoring wells wereinstalled in accordance with NR 141 and NR 508, Wis. Adm. Code. Drilling and welldevelopment activities were conducted from July 28,1993 to September 8, 1993. Final welllocations were approved in the field by a WDNR representative and are shown in Figure3-1. Three wells were completed in bedrock, two wells were completed in the lower granularunit (LGU) and one well was completed in the upper granular unit (UGU) as shown inTable 3-1.
Three drilling methods were used to complete the well borings. Shallow unconsoli-dated material was drilled by hollow stem augers (HSA). Intermediate and deepunconsolidated material was drilled using the rotary wash method. Diamond boring was themethod used for drilling bedrock. The source of water used during drilling activities wasa water hydrant in the town of Whitelaw. A water sample was collected and analyzed forTCL/TAL compounds. Results of the analysis are presented in Table 3-4.
Monitoring well borings were logged to provide data on the geology encountered andcontinuous inspection of drilling and well installation activities. One complete boring logsample was collected at each well nest location. Continuous split-spoon (ASTM D 1586)
2049-001-290 3-1

samples were collected for unconsolidated material and continuous core samples werecollected for bedrock. Detailed WDNR monitoring well boring logs (Form 4400-122) arepresented in Appendix B-l.
Monitoring wells were constructed of 2-inch diameter stainless steel pipe and screen.Well construction data is summarized in Table 3-5. Monitoring well installation,construction and development are detailed in WDNR monitoring well construction forms(Form 4400-113A) and are included in Appendix B-3. Well development water and cuttingswere contained in 55-gallon drums and were stored in the secure area at the LembergerLandfill. Well development water samples were collected for chemical oxygen demand(COD) and total suspended solids (TSS) analyses. Results of the analyses are included inAppendix B-l. A grain size hydrometer analysis was conducted on split-spoon samples atsand and gravel screened intervals for wells RM-101I and RM-103S. Results from thehydrometer analyses are in Appendix B-l.
33 GROUNDWATER SAMPLING
Groundwater sampling was conducted from September 28,1993 to October 4,1993.Groundwater samples were collected from 5 new wells, IS existing wells and 18 residentialwells. Well locations are shown in Figure 3-1. Groundwater samples were collected inaccordance with Section 3, Sampling and Analysis Plan, of the Final Work Plan.
Three initially planned groundwater sampling locations were not sampled during thesampling event. After thorough research in the vicinity of wells MW-12 and GR-61, asmapped in the Remedial Investigation Report (RI), the sampling team was unable to locateeither well. It was assumed that both wells were destroyed by vegetation clearing activitieswest of the landfill (MW-12) and at the former location of a trailer home (GR-61). Thethird location which was not sampled was RM-103I (new well). RM-103I was screened inthe LGU near the top of bedrock, and appeared to be located within a saturated zone ofthe LGU during the drilling and well-installation activities. Upon completion of the wellsfor this well nest and after wells had stabilized, groundwater level measurements showed theactual water level was within the bedrock and below the LGU.
Groundwater samples were analyzed for Target Compound List/Target Anatyte List(TCL/TAL) compounds using methods which are consistent with the USEPA's ContractLab Program, and for general chemistry parameters. The general chemistry parameters
2049401-290 3-2

included alkalinity, hardness, chloride, sulfate and COD (high level). The water level ineach monitoring well was measured to the nearest 0.01 feet prior to purging and sampling.Groundwater temperature, conductivity and pH was measured in the field. Samplescollected for dissolved metals analysis were field filtered and preserved as soon as possible.Samples collected for total metals analysis and for cyanide analysis were preserved, but werenot field filtered. Color, odor and turbidity were noted. Samples from residential wellswere analyzed using methods which are consistent with the USEPA's CLP Special AnalyticalServices (SAS) protocol for residential well samples. Groundwater analytical results arepresented in Section 3.4.
Detail groundwater sampling procedures and data are presented in Appendix B-3.Sampling was performed by Precision Environmental and Malcolm Pirnie. A report onsampling all but three of the residential wells was prepared by Precision Environmental andis included in Appendix B-3. Sampling data for the three other residential wells, sampledby Malcolm Pirnie on October 4, 1993, are also included in Appendix B-3.
3.4 GROUNDWATER ANALYTICAL RESULTS
3.4.1 Groundwater Monitoring WellsAnalytical results for groundwater samples collected from the groundwater
monitoring wells (verses the residential wells sampled) are provided in Table 3-6 andAppendix B-4. Table 3-6 presents analytical data for compounds/elements which werereported by the laboratory at concentrations in excess of instrument detection limits.Appendix B-4 contains all analytical data generated from ground water samples collectedfrom the monitoring wells. Generally, the Record of Decision (ROD) defined contaminantsof concern (COC), reported to be present in the wells contaminated by the LembergerSuperfund Sites, are limited to the di- and tri- chloroethanes and -ethenes along with bis(2-ethylhexyl)phthalate. Inorganic constituents of concern, reported to be present, are arsenic,barium, chromium, manganese, and selenium. Selenium was reported above the detectionlimit in only one location (RM-2D) at a concentration of 22 /ig/1, but was also detected inthe associated analytical method blank; therefore, the presence of selenium in the samplefrom this well is not confirmed.
Monitoring well MW-10 screened in the UGU is reported to contain the greatestnumber of COC at concentrations greater than the groundwater cleanup standards defined
2049401-290 3-3

in the ROD. In addition to the compounds listed above, the data indicate that the waterfrom MW-10 contains methylene chloride, acetone, 2-butanone, 4-methyl-2-pentanone,toluene, and xylene at concentrations in excess of ROD standards. Wells RM-7D and RM-8D are reported to contain the next highest concentrations of ROD defined COG
3.42 Residential WellsAnalytical results for samples collected from the residential wells in the area of the
Lemberger Superfund Sites are presented in Table 3-7 and Appendix B-4. Table 3-7contains analytical results for only those compounds which were reported to be present inthe samples at concentrations greater than analytical instrument detection limits. AppendixB-4 contains all analytical data generated from samples collected from the residential wells.
Target compound list (TCL) and target anatyte list (TAL) compounds were reportedto be present in five (5) of the residential wells at concentrations in excess of the NationalPrimary Drinking Water Standards maximum contaminant levels (MCL). GR-8, GR-13, andGR-31 are reported to contain antimony (MCL=6 /tg/1) at 26 /tg/1, 35 jig/l, and 23 /tg/1,respectively. GR-16 is reported to contain lead (MCL=50 /tg/1) at 79 /tg/1. GR-60 isreported to contain trichloroethene (MCL=6 /tg/1) at 6 /tg/L
Contaminants of concern are reported to be present in several of the residentialwells, at concentrations in excess of the ROD defined ground water cleanup standards.Manganese was detected above the cleanup standard (25 /tg/1) in residential wells GR-8,GR-9, GR-11, GR-12, GR-12-2 (dup), GR-13, GR-15, GR-26, GR-27, GR-30, and GR-60.A reanatysis from GR-12 reported manganese below the instrument detection limit. Leadwas reported at concentrations in excess of the cleanup standard (5 /tg/1) in wells GR-8,GR-11, GR-16, and GR-31. Selenium was detected in GR-10 at 2.3 /tg/L However,selenium was also detected in the associated analytical method blank; therefore, thepresence of selenium in water from this well is not confirmed. Trichloroethene wasreported in excess of the cleanup standard (0.18 /tg/1) m GR-13 and GR-60. The followinganah/tes were also reported to be present, at concentrations in excess of the cleanupstandards, in well GR-60:1,1-Dichloroethene, 1,1,1-trichloroethane, arsenic, beryllium, andcadmium.
2049-001-290 3-4

3.43 Residential Wells To Be ResampledThe Final Work Plan, as approved by the USEPA, requires residential wells which
exceeded the cleanup goals for the site be resampled. Analytical results from the predesignmonitoring program indicate that the following wells exceeded the cleanup goal for at leastone COC: GR-8, GR-9, GR-10, GR-11, GR-12, GR-13, GR-15, GR-16, GR-26, GR-27, GR-30, GR-31, GR-43, and GR-60.
For the following residential wells, only inorganic groundwater cleanup standardshave been exceeded: GR-8, GR-9, GR-10, GR-11, GR-12, GR-15, GR-16, GR-26, GR-27,GR-30, GR-31 and GR-43. Reanalysis of water from these wells will be limited to inorganicparameters. The frequency and concentrations of inorganic anatytes in the residential wellsand the inconsistency between analytical results for duplicate samples (GR-12-1 and GR-12-2) suggests that the inorganic contaminants of concern present in these samples may be inthe form of suspended solids.
Samples GR-13 and GR-60 were reported to contain volatile organic COC as wellas manganese at concentrations in excess of the groundwater cleanup standards. Reanalysisof these wells will be limited to TCL volatiles and TAL inorganics.
Included in the residential well resampling program will be two sets of samples forTAL inorganics analysis; one set will be filtered to remove suspended solids, the other setwill not be filtered. These analyses will aide in determining the extent to which the nativegeologic formation is contributing to inorganic contaminants of concern above thegroundwater cleanup goals. These analyses will also provide data for use in design andspecification of water filtering systems for these residences, should they be necessary.
35 GROUNDWATER PLUME ANALYSIS
Since analytical data from the predesign groundwater monitoring program has justrecently become available, Malcolm Pirnie has not yet evaluated any impacts on theestimated extent of the contaminated groundwater plume due to the Lemberger SuperfundSites. Malcolm Pirnie will analyze the new analytical data from the predesign groundwatermonitoring program and discuss any impacts to the estimated extent of the plume in a letterreport to the USEPA and WDNR. This report will be provided within one month.
2049401-290 3-5

TABLE 3-1PREDESIGN MONITORING WELLS
WELL
RM-101IRM-101DRM-102DRM-103SRM-103I*RM-103D
SCREENED UNIT
LGUBedrockBedrock
UGULGU
Bedrock
'Sample not collected during Predesign Groundwater Monitoring Program. Well was dry.
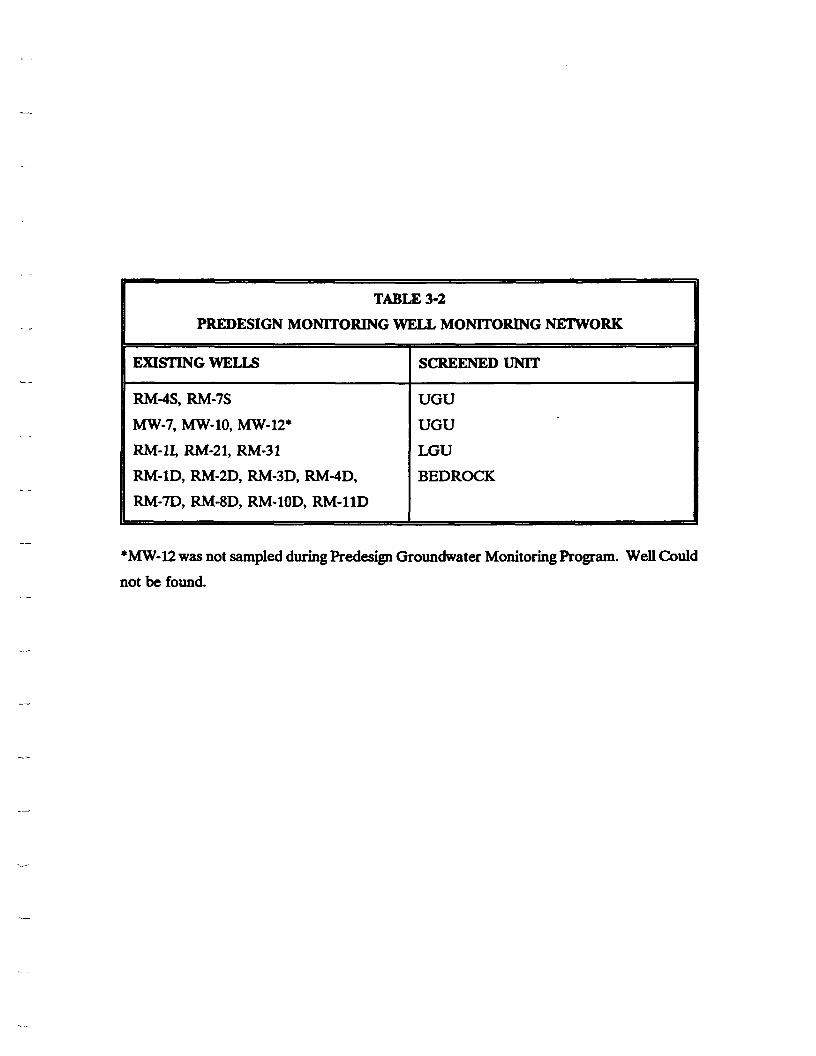
TABLE 3-2PREDESIGN MONITORING WELL MONITORING NETWORK
EXISTING WELLS SCREENED UNIT
RM-4S, RM-7SMW-7, MW-10, MW-12*RM-1I, RM-21, RM-31RM-1D, RM-2D, RM-3D, RM-4D,RM-7D, RM-8D, RM-10D, RM-11D
UGUUGULGUBEDROCK
* MW-12 was not sampled during Predesign Groundwater Monitoring Program. Well Couldnot be found.

TABLE 3-3PREDESIGN RESmENTIAL WELL
MONITORING NETWORK
WELL OWNER SCREENED UNIT
GR-6GR-8GR-9GR-10GR-11GR-12GR-17GR-30GR-13GR-14
GR-15GR-16GR-26GR-27GR-31GR-41GR-60GR-43*
James Hof&nanThomas Hanley**Edwin Sauer**Formerly Robert Wellner**Jae Kalies**John Dugan**Wayne Menza**Alice Lemberger**Stanley KubichkaDonald Schnieder, Sr.UnknownMargaret BackerKen LembergerLeonard LedvinaErvin PolifkaTom EbertLeo Denor Stock WellStaudinger
NABedrock**Bedrock**Bedrock**Bedrock**Bedrock**Bedrock**Bedrock**NA (Possibly 50 ft. deep)LGUNALGABedrockNA (Possibly 78 ft deep)BedrockUnknownNA (Possibly 35 ft deep)NA
* Added to Predesign Groundwater Monitoring Program as a result of landowner accessagreement for installation of two new monitoring wells (RM-101I and RM-101D).
**Indicates replacement water supply well
NA: Information on screened unit not available.

TABLES-4LEUBERGER LANDFILLANALYTICAL RESULTS
DRILLING WATER
TCL VOLATILESUnto
ChloromalhanaBromomathana
Mathytona CNoridaAcatona
1 .1 -Dichloroalhana1.2-Dlchlofoathana (toU9M-mm2-Butanona1.1.1 -Trichtoroathana
BtomoOchlo.o-.th.K.1.2-Dichtoropropanaoi»-1 ,3-DichloroDropana
I n^iiic^^mtiiiMiiiM^^m1,1.2-Trichloro«thafwBanzana
4-Mathyl-2-Pantanona2-Haxanona
TokianaCMorobanzana
StirMiiij;;;Xvtena (total)
no/11010
1010
1010
1010
1010
1010
101010
1010
10
a
uu
u
m
Maldolm Pi Sampte ID
DatoofCotoctionSampte Matrix
a-ow-103084220108/18/93
Watar
TCL SEJHVOLATILE3Unto
Prwnol
•g~Ctiii>fOpn0noi:
,4-Diehlorob*nz«i«1 2-Dichlorob«nz*n*
4-kMhvlorwnolN-NBioao-DI-n-PropvUmlna
aophorona2-Nirophanol
2.4-Dichtofophanol
ffipiriir ll MS^s^gM*- CIO6>batafaaS;g:gg:;j;g*s;:j;::a:;;::;;gsH«xachlorobubicR«n«4-Chkx<)-3-l*»thvtph«>nol
2.4. e-Trichtorophanol
DimathvlPhlhalat*Acanaohthytana
AewwphtrMM2.4-DMtrophmol
2.4-DMtrotokMM
4-NRroanHn*4,6-DWtro-2-Mrthvlh»nol
Haxadilarobanzan*'antachtorofihaool
Jarbaaoto3i-n-ButylpMhalai«
JuMbwzvtohthaJat.
bi«(2-EthyttwxyOPMhalat*
nan1010
1010
1010
isiJixSixig
1010
1010
1010
10
1010wmmmty
isaaE1025
M101010
2525
10
10
1010
mmmffi10
Hi
tt
«:§
•Us
TCL PESnCIDES/PCBaUnto
atoha-BHCb*ta-BHCmmmcmmmH«pt»chlorAJdrin
OMdrin4.4'-DDE
4.4'-DDD
M-aftbin lifcr:Endrin IwtonaEndrin aldahyd*
ToxaphanaArockH-1018
Arodor-1242Arodor-1248
0.060.08
0.060.06
0.10.1
m0.10.1wmt
Sx««i»:
0.10.1
;;;;;;;j;a|j;: Its
AL INORGANICS
AluminumJJQto.
Antimon
wmmmmmmm
MMrmhim
PotaadumSatenium
fhaliumVanadium
Jjjfl_30
22.1
21.4
99X00184
804
mtm
2049003/PDOWFULL 1of1 10-NOV-03

TABLE 3-5WELL CONSTRUCTION TABLE
COMMONNAME
RM-101I
RM-101D
RM-102D
RM-103S
RM-103I
RM-103D
WIS.UNIQUEWELL NO.
EW042
EW043
EW041
EW044
EW045
EW046
WELLTYPE
LGU
Bedrock
Bedrock
UGU
LGU
Bedrock
GRIDLOCATION
129.096.11N,
129.093.26N,
2#3,130.50E
127.419.44N,2 65303.17E
132.40133N,
2,565,967.18E
132,405.79N,
132.413J23N,2^65,954.95E
ELEVA-TIONS(TOQlt
MSL
818.74
818J9
874.48
855.99
856.11
856.14
WELLDEPTH(ftbgl)
40.0
603
50.0
243
42.7
70.0
SCREENEDINTERVAL
(ftbCl)
29A-W.O
50.0-603
39.7-50.0
9.0-243
37 .7
59.7-70.

GROUNDVLABOR;LEMBEF
Compounds with concent
Malcldm Rmie Sample IDLaboratory Sample IDDate of CollectionSample MatrixUnits
VOLATILESChloroethaneMethytene Chloride^(iiiiiiisif^mmmmmmmmm1^1*DJcWb>6iBthen« x1 .1 -Dichloroethane1 ,2-Dichbroethene (total)%&&UiliSfa^mmmmmmmlil^xJ^^TrfcWoirbiihariessSTrichteroirtheniisxx^xxxxxxx;:Benzene4 - Methyl -2- Pentanone
Sttt^t/it^isiMmmmmmmXvlene (total)
SEMIVOLATILESPhenol2-Methytphenol4;~Me^ytohenOlx:xx::xx::x: :;::;:;;Utethytehthalaleixxxxxxsxx::::Di-n-Butytphthalatebis(2-EthylnexyOPhthalateDf-ii^Cx^tvl PhfHatate
INORGANICSAluminumAntimonyffiiii^mmmmmmmfm.3iiikmmmmmmmmmmmCalciumChromiumOblBe^SgiS; BjpsBJs ;g mmG&ttmmm mmmm BBBtonj»adMa^hesfurn mmmm mmMafKianese mmmm BBBMickel^otassium^SiitiaS^mfmiMm:M&&ittiiiitmmmmmmmm mix
ThalliumVanadiumZti&mmmm^mmmmmmmGfti&ilfcmmmmmmmmmAlkalinityCODjf&iMimmmmmmm'mmliffiiii&mwmmiimmmm
SuKate
9310RM1D9310082-10
10/01/93Wateri/Q/|
mmmmmmmmmmmmmm
;:::::v:::::::::;::::::::x;::::x:::x:::x:
mmmmmmmmmmmmmm
mmmmmmmmmmmmmm:
mmmmmmmmmmmmmm
32
mmmmmmm
53.321.8
iiiiJB'jlSBBSiiiiSBS59.700
4.2
mmmmilM6.7
mmmmm::;:;::: :-::::':':::::>'::::::"::::-:::::::::;
1,640mmmmmmm.mmmyJJM)i&&:
>;/:i;;:::ixi:i:;:i:i:|:;:|x|:i:i:iXv:io
280.000
;:gx*:I:;Jx(B|SfOOjxiBBS'ibsobo;20.000
Q
x;B3x;3Bi;B
B'B'XX:::-::::x::::
:;B:BB
:v:v:;:::::
:BixB
BBBx:x:::::::>::
JJ
:B:iSB
111;
BSBB
««
J
•:-:'J|F:':-
iBiSSx:>x::'-x
;i;»tix:
;?B;;;;;;
oBBx'BBSS
9310RM1I9310082-09
10/01/93WaterPfl/l
;;:;l;Bji;J?;;;:l;;;:;3BKi;fg:JM®^B^^
;i K ;gS|Ji;«i;;;;;SP;;;B;3;;;;immmmmmm
mmmmmmm
mmmmmmmmmmmmmm
mmmmmsm
48.128.7
mmmmmm44.200
l;;;S;;;;BfBl:;SB?Bl;::S36.6
mmmxsiso^mmmmmt-if:1.800
glBtiSxBSxSxBSSmmmi^tiiUk
mmmmmmmmmmmmm
260.000
;;;;;Bj;;;;g;;:; F!iMjg;tti2iMKOO$
15.000
Q
;;B;;:;;:;::SB'BB
SBBB;mm-:-:::::::::::;
BiSB:
mm
mmmm
mm
mm|x|xB:-:
BSBB;:BB;BJ
ssp;i?«is;
mmmm
mmmm
mmmm
TABLE 3-6MTER MONITORING WELLSTORY ANALYTICAL DATA)GER SUPERFUND SITES
rations greater than instrument detection limits
9310RM2D9310082-13
10/01/93Waterusfl
mmmmmmmmmmmmms65
;BB;;:;B|;;;gBBB;ij;ijt;
mmmmmmmmmmmmmM
mmmmmmm.mmmmmmm
4mmmZmmif:
mmmmmmmmmmmm
65,000
mmmmmmMmmmmmmm6.3
mSmSjff^iiSiifmmmmmm
11.31,890
mmmmM&mmm^tiiSiH^
mmmmmmmmmmmmm
300.000
ISB*81;l|jj2dffiillSiOiflOQi;
25.000
Q
>;BBB::BB;BJJ
•BBS;mmmm
mmmm;
mmmmj
sm
SBBi
mmmmj
mm;BiJ;B
BBBiB;JJS
illBBBB
BB3B
9310RM2I-19310082-11
10/01/93Waterjia/l
4
mmmmmmmrnmmmmjt2122
•iSlSiiBliSB-BK;::BBBBsJig; BH3H5:ssiBBssBB ;;;g;BB;;s
mmmmmmmmmmmmmm
mmmmmmm.mmmmmmm
2mmmmmmm
51.3
mmmmfmmmmmmmm
64.300
14.5
mmmmmmmmmz?iK&:
1.180itiiiSslii?;
mmmmmmmmmmmmmm
310.000iBggBjB^WOsxH:Bsa50iOOO:
26.000
Q
J
BB'BB;B5^S
mmmmmm
mmmm
mmmm
JS:BBB;
Himm
mmm%&j
mfiW*
mmBS;;B;:
SiBBmm
mmmm.
9310RM2I-29310082-12
10/01/93Waterpg/l
4
Spig^BgggiiBiB
2121
mmmmmmmt
B:::::B::BXx::;:::X::xX:X:::X
mmmmmmmmmmmmmmf-
2K'B;;;;:B™;s;SB;;B-2:;
36.8
lllls5S;il;lmmmmmfg!:62.800
4.1l;:;B;;iB;|s|sj3j|*i;s
14.2
mmmmmmmmmmfsiK
1.490
;BBBB;;B:;5i|J(JR||;
mmmmmmm300.000
ii;;xB';B:;B^CJjajpt:;BxSS86Oy5bff:
24.000
Q
J
BSBB;Bi3;;s
SBBB;BBSS:•;;
BiiBSsBwB
HBBS;BB'BB
Jm*
mmmm
JB'lf*SBSB';J
mmmm
mm-:-:•:-:•:•:•:•
B'S*BBBS
B;BBS!BB;B;
9309RM3D9310037-02
09/30/93WaterJJO/1
22
::;:o:::::::::;:::::::::::::::::::::;:::;::::::::
I;:lsi*«it«120110
«;i;;;Bl;BiB.BBmmmmts/sQi:mmmmmms
mmmmmmmmmmmmmm
2
mmmmmmmmmmmmmm2
mmmmmmm
47.2
mmmmm86.300
IJPI^^I^;:;?;i;B';:B?::;:;BB3:;;;:;SB
:s5is:;s;H43t400:;
;i;B.;;:;B.;:B;;;B:B.;;BBB.;
1.510liSSSSipBjgSS:
mmm^KlOffOi:
mrnmmmj^mmmmmmm
330.000
B'BSBiB |j)pO;:B';;;BB^VIfOiObO::
34.000
Q
MX;™m&
§;B.B;B'BBSiBBB:
SB'SB;:iBBi*
J
SBB:;mmj
SBBB;
ill;«;;
mmmm
wmi'::i;:£:|:j:
SiBSxB;BB;;
;;?3s::vSB
B;;BBSB®;
NA-Not Analyzed J- Estimated value
2049003/PDMWDV_S 1of4 19-Nov-93

TABLE 3-6, ContinuedGROUNDWATER MONITORING WELLS
LABORATORY ANALYTICAL DATALEMBERGER SUPERFUND SITES
Compounds with concentrations greater than instrument detection limits
Maldolm Pimie Sample IDLaboratory Sample IDDate of CollectionSample MatrixUnits
VOLATILESChloroethaneMethylene Chloride
i:ii:-DicWbrbethen»;::*:;;:;1.1-Dichloroethane1 ,2-Dichloroethene (total)2*BOtifiicwmmm:mmim^it^STricHbrrietharie: ;Tricftlc^detheTOSisssSKSSS?Benzene4-Methyl-2-Pentanonefttitiiiii^mmmsmmmmm)&tiiKiiiiiJiiii^mmmmmmXvlene ftotaTJ
SEMIVOLATILESPhenol2-Methylphend4TMeQiTlph«fKif : :OletnVfpfTthalateDi-n-Butylphthalatebis(2-EthylhexvnPhthalateDi^rt-OctvJ Phfliatete
INORGANICSAluminumAntimony
CalciumChromium
COftQftf:; .:•;. :-.••:•:•:•:-:•:-:•:•:.;.::-:.:-:. :-:-:•:-:-:•:-: vx-:-x-
IronLeadltt*jii*9^ftmm:mm^mliiiftOBtii&mmmmtmmmNickelPotassiumSMtiS/uri^mmmmmmmm&£dfKiiifcmmmmmmmm.miThalliumVanadiumWiefmmmmmmmmmmfm'G^Miimmmmmmmmm:AlkalinityCOOVSK^tdSi^^mWMm^m^tfiffliiifMmmimmmmmmSutfate
9309RM3I9310037-01
09/30/93Water
Ugfl
WxiXxXXWivXHjvX::
4
3mmmmmmm
:|:i:v':i:v':i:i:.j:|:v:j:;:i:|:::;:::;::x|::
i:i:i:j:i:i:i:;: : :;: :;:i:i:;: ::::::::!
•:•:-:•:•:•: •:•••:•:•:•:-:• :•:-:•:•:•:•?-:-:•:-:•:•
5
41.9
ilxiiitixlxli
59.8005.6
:Bj:::EBx;;B::EBB.:;!B;BE
mmmmmmm3.2
iiiSSealQ**;sSBEfiiBEESKiS?
1,800mmmmmmmmm}mJt&iS&
WmmmWKfcmmmmmmm
300,000
mmmXiBOQi:; :41 0,OOO
20.000
Q
JJ
ammm
•mm.
J
;Xx>Xx
BESB
SxBB'
J
lili?;SJI;E
mmmm
.B' 3EElls
9309RM4D9310013-05
09/28/93WaterWJ/I
jSfeiilll
:-:-:-:-:-:-:-x :•:-:•:•:•: :-:-:-:-:-x.:-x-::X::x:::::xXy--:-X::-:vXvX;x;
:x:r:::X:::xEB:BE:S:Ex3SsBBBBSffiBBBBiSB:
iSHxSExEixExExEBx;;;;||;;|:;;;;:BBS;E;BEE;;
B;:B:x:::x:;:ExBSxBS:B
20-:•:-:•:•:•:•:•:•:•:•: •:•:•:•:- :•:-: •:•:•:•: j: •
39.3
vXvXv:.x.x.x.:»«.l*57.900
:::¥::x'::::::::::-::v>-::::::'-'-:::::::::T:
•:•:•:•:•:•:-:•:•: v:vx::v:-:-:-:-x-:-x-
6.31.1mmmimoi
SBBBBxEEBBjIfjT;
1.120mm^mmmmzSBBsJEEatiJiabi;
mmmmmmS:mmmmmmm
29.000
BBSsBiiBJasjJBSB:::E:S::«40O.ObO;
26.000
Q
mm
mm::;::::;E:E
BBSS
mmmm
:::>x::|::>:
—
BSxB:mm
JMt:BS|:E
3BBEBSBB;
;s;J[:EBE«B
SxBiB
9309RM4S9310013-04
09/28/93WaterVfl/I
||:;|||||ii-
mmmmmmmmmm^mtm:::E:E:B:X:x;x:xExExxE'
EHEiBBBBxExixsES;mmmmimim
igxjBExSSSxEasB:
4
44.223
81.7004.7
mmmmmtfm14
i!i«i!BslOKpiiEEiBBJESBgiiBi;
2.920mmmmmmmmZm35ffi!(i&
mmmmmmifmmmmmm.
650.000
sBBEailliaxitt;:1i200iOOO
43.000
Q
mJBBB.:;;B;BX;;:::::E;x:
SSBB;tmS
m;m
J
iliiBS
mmmmJ
;Wi;;;S;BB,
!•18*;
SSilBEx_:|:;E;:
IsxEiBIBBSB
9309RM7D9310028-13
09/29/93Waterjug/I
69
ii;iii;:BJs;ii;510440
mm'mmmmmmMm-tifiiOG:mmmmm3ii£
mmmmmmmpppiilslpxis;
1
^S%::::::::-::::::::::::^::::vX:::x:
:::::::'::;:'::::::::::x:>::::::::':::::::::::::
4
28.4
99.600
;B:|:|: SE|S:::Ex::xXBE:i:::
isi;x8x*/aSiKSSiiEiBBSBiSCSJ
2.390;8;S;8;;;;;;B:;j;EssS;:B
mmmXQHSXiQk
mmmmmmm
450.000
mmwtiS&QK530 00
18.000
Q
J
:XxXxX
sip;
BEBB:SEBS;;iiiS?;
:EB:BE
BSixE;
JBiSB:
J
BEES;
BiBEfBE*B';
m*ssl;;;
mmSBES;
ESESEBJBB:
mm
9309RM7S9310036-20
09/30/93Waterfg/l
xEiBSBESSBEEx;:;:;:;:;:;7
Bi&iBfBfBliBS'lS^EBS^SISBWB;;;;;S§S5;B.Bj?B.:;:B.B.:ii; ;i:
xiBiBEESEfaxBEi-SB';mmMmmmm
BE;;BESBSEBB:f;E>;;;;;xE:ExE::::E:E-:>:;xEx:-X::
3
37.7
mmmmmmmmmmm72.500
SSBEBjEBEEExBBBiB^^SiWisiSs™
9.8
:-: :x-::: : ::::: •••iflfl? ''9OQ''
: W x •: :::: |: ¥ :':':::::::; ::Hi D27'
662mmmmmmmmmmmfa&Qi
mMmimtfliijt f
360.000
mmtmtfiO&fmmmHcm
14.000
Q
:•¥:¥:::¥
J
BBSSSSiBBx;:|X;X|:
;EEE;:EBESE
mm:
J
mm—mmmmJ
siis-SilS
mm;.;.;.;.:. ;.v
•i:i J"::::
iBBSE
;;BB;BxEBiB
9309RM8D9310028-17
09/29/93Water
/Ufl/l
48
iiiiiiiii220220
:;§;;;;;$;;;i;5:;;;BiiiSiljgllgsiiBHJiO;
:;;x:;:;;;j;;;;:;:;;:EgEBE;;B.BiSBBBSSSBxiSKSB
;:;:i;;;iS;:g;;;;;;;;;;;;;::BB;;:;E;
4
73.7
98.1004.7
i-SBjlSxBBSExSBBSi;
•xox-x-XvX-x- :•:•:•:? JQ;-
24.41.6
iillijWEawii;s;Ei«x8;;;*5;Sj
2r420;El:8;;x;;8;;;;;;BHSB;BEEsESliaillOOi!
3.3
mmmmmmm350.000
mmfj&bjOO(t:
mm:Si<}j)QQ:
26.000
Q
::ij|:!:
x¥xo
vX-Xv
EEiBPEE'EE
mm
J;SB'xB
11;SB™;;
mm.sli;
J
;s;:3;;;;WK
<<mmm
Wij;|:|:>¥:¥
NA-Not Analyzed J - Estimated value
2049003/PDMWDV S 2of4 19-NOV-93

TABLE 3-6, ContinuedGROUNOWATER MONITORING WELLS
LABORATORY ANALYTICAL DATALEMBERGER SUPERFUND SITES
Compounds with concentrations greater than instrument detection limits
Malctolm Pimie Sample 10Laboratory Sample 10Date of Collect onSample MatrixUnits
VOLATILESChloroethaneMethytene Chloride^t^iiiticii^mmmmmmmml^lsWchlOroethene1.1-Dichbroethane1,2-DicNoroethene ftotaO2#B*Meanommmmmm:mt^iiMlribhloroelhan*Tflcifiiloro«tr*ne::fB-:H;:::-xH;S;:Benzene4 - Methyl - 2- Pentanone'feMiiijti^mmmmmmimsttt^iifiisft^mmmmmXvleneftotan
SEMIVOLATILESPhenol2-Methylphenol
Di-n-Butylpnthalatebis(2-EthylhexyOPhthalateDiSn^OcW Pt^aJate
INORGANICSAluminumAntimonyjajiiis&mmMmmmmmmftiiib^mmmmmmmmCateiumChromiumc&iiiiwmmmimmmm*'G&tiiiffimmmmmmmmmIronLead*tet**iim^mmmmnifiiiiiiiiti&i&immmmmmNickelPotassiumsiK^iimmm^mmmmms&jiiiwmmmmmmmmThalliumVanadiumzSj&mmmmmmmmmmc&i^mmmmmmmmAlkalinityCOOciiiiiiiidpmmmmmmmsi]R&r<iu&&mmmmmmm:iSuKate
9309RM1009310036-18
09/30/93Water
UQfl
:p;xX::;;;Bg:;:B;xB:::x
^BBxxBBxxBBBxx:
mmmmmm ;mmtmmm •-mmmmmm \
BBBBBBBBBBBS \mmmmmm :.
x.:.XWxx.x.:.xXx.xxxx
3mmmmmZm
39.8
mmmmmmmmmm&g&63.500
mmmmmmmB;;:;:;X;-X:::X;;:;BX;X;:BX;;;
4.62.3mm^atsQQ-
2.600K;?Px?;?;?3l;?!?l;
mmmmmxmmmmmmm
280,000
mm^s^x/iokmm$i&iQ6&29.000
Q
;;x3;B.:;fXXXft
m%;;3sli;mm
ms;5BB;::
^?'•yfvXf:
JBxS;B
mm:;::Xx:B
mm;;S;BB:J
idi
isimm
;Bi|Bmm
mzmz
9310RM11D9310082-15
10/01/93Waterma/1
;;;;X:;;;:;:;S;H;;BB;SB;:X
mmmmmm;:Bg;;;§3;;;;;;;::;;i;;;:B;: !;x;;;;;::;:;;;;;s:;::x:x;;:;xS!:; ;
;:::;;;:;S:x:B;xfB;:::;;::;jB: j
mmmmm: ;
-XvX-X;:-:-XvX-:::-X-::x-x-x:
:;:::::;;;::B:x:x;:::;:;;BB:xB;:
1;:;v;;;;;:;:;i;;;;:;;;;;v;;;;:;;:;:;:B3;
mmmmm82.700
:$:-j::::i>:;:::i:;>::::ii;:i:;>:i:v;:x:|:
mmmmm6.61.6iiHiJSiam;
20.44.780
;g;g:g;;;;;;;*BgB.:;;:;;B;mmvSft&Offi
mmmmsmmmmmmm360.00049,000
m^flSQjOQXt:S:ss;:<440iOOO:
14.000
Q
;;33s:gB:B
BJBB;;BBS;;;;
mmmm
::::::X;::;-:
JJBBB;
?;?;?;?BBS*;
WMBB;B;;J
;BB;;S:
mmBlJIs;
m$'::BBx:
slimn
9310RM101D9310082-16
10/01/93Water09/1
S;:;:;:;:;;;;::B:;;;:;i;:;;:;;;::ix;;;;Ki;::;:;:;!g;;;::;;::;s;!;:;;B;3:*;;:;:i|;
4316
•^^^mmmAmmmmmmmmmmmm
mmmmmmmmmmmmm
BXxXSiBiftXxixSiSSxX:;
mmmmmm1mmmmtmm.
mmmmmm.mmmmWl^K
75.500
mmmfmmmmmmmmm44.83.3
mmW&$itii&;x;;;;x:;;;;;;;;;;;SB.:;BSi(j:;55;
7,320mmmmmmi;?B;5;;BB8;?3Ri84tf:
mmmmmm330.000
ffi;s;g;8;5l;i|5g;M|j|:mm-si>QQ£o&
25.000
Q
ISSSB.BijJ:?!
SsssSB!Siiiil;?
SB'SX?i*i
xBvJx
JB'BSS
BB;:B;sBx';s;
x::x::::X;:X:x:;x;
wmm
mmwm
;B?vB;S55|
Sillmi
9310RM101I9310082-17
10/01/93Waterjug/l
;x8;;;;:;;BxH;Bj;;s:BB;immmmmm
mmmmmsmmmmmm!;3lgxSg;;;;;;j;B;l3
mmmmmmmmmmmm
1.xx^ ——— mmmmmm
;:p;:::;::BB;;;:;x::B;:;;;:g
217
mmmtfssgjii:10.100
WmmfMSmMmmmmmm2361.2mmmxmmmimwm
37.100B?B?;:B?;S£i;JB;Blxmmmnm
mmmmsmmmmmmm
210.00033,000
iixiisiidaOJitt;¥*s;:s250iOOO;
26.000
Q
Si-iw:
Xviviv:
mmSBBB.:;x;:;:;:B
JBSffiSwBS
J
mm'BBB:;
mm
mMwm
SsiBBB?
BB;:X:;::;?!?B;
;?!?;?!;Bi3(?:
:;i;i?i;mM
?;;?i;SB;*;?
9309RM102D9310036-19
09/30/93Waterpg/l
;:;:;?;S;:;:;;;;;;;;;;;:;:;x;3BB3;;3mmmmmm
mmmmmm?;:;?4?*Si*?S?*?:;;?:;:*:?
:?g?;S;?B?;?Px?;??S§
.:;:g:;:;;.:::;:i::;;:;:;:;:;:xj:;x:;:;:;ftx
;;??:?:;i?:;:;:;:?:?:3?;;:?:;B:
JSJSJSSSSJJSHS-SSSS
mmmmmmm12mmmmmmm
65
:sS:;;i;¥;;;SKBx:;?ixS???B'iiil;?;;ll?1li
64.900
mmrniimmmmmmmmmMt
8.5
?;?;?;?x?;?;>S2laiflOi;?x?x?;?;SB'x?S?;?B'::;2s
2,150mmmmmm
K^BBBBixSiisSBBB230.000
Bl???;i;?;?;ij|:iB|fldJp:mmmmm
10.000
Q
:::':::*B;:
mmmm:::::B:::*:
:B::;:::B:
SSSS:
vBBB:
BB;:;*;
*3BB
*B?B;
?:?;s*;:SB.?:?!j
gas;BiilB
?;?;?;?3?;?;?
*?J?!l;?i
B;i?i;5BS??*
9309RM10309310013-06
09/28/93WaterWfl/1
B::B::B;:;x::: B:X*:*BB'
;?::K;;;;:;;;S;;;;B;:;BB;;B:;54
;;SBxB.3;;B;*s:x*fii;
mmmmmmmmmmmm
mmmmmm
9?S;P;;l:?v*B'B.;:;j|i
37.819.8
s?x:xSB?l;?B's?ismmmm&m
78.3004.9
i^mmmmm;;3.;;?;?:;g;;3;s;;BB*xx;
7.4
mm'KSAJBQ&f;:Sx?B?;Bx:3';??iSi3f;:
1^00
mmmmsmmmmmmm
420.00042,000
SB'pBStifiiijMiJp::mmiimm21.000
Q
xBx'S:*x;B;*:
JJ
BBB*BBSSm*
mm;?BBS
•:•:•:•:•:•:•:•
mj
;B.fJ;*
mm:B-:::>;:;
*3?B::B:*x:;:
J
?M:;*Si;;:
:«?
?i?:?
?s»i?S-Sw:?
mm;?*??;
NA-Not Analyzed J - Estimated value
2049003/PDMWDV S 3of4 19-NOV-93

TABLE 3-6, ContinuedGROUNDWATER MONITORING WELLS
LABORATORY ANALYTICAL DATALEMBERGER SUPERFUNO SITES
Compounds with concentrations greater than instrument detection limitB
MaJclolm Pimie Sample 10Laboratory Sample IDDate of CollectionSample MatrixUnits
VOLATILESChloroethaneMethylene Chloride
1il DJcW6ir<>etliMH»e::s:-":::i1.1-Dichloroethane1 ,2-Dichloroethene (total)mmmimmmmmmmmmmtstmmmimmTrfch16i6«tt>en*S's:s::B::::::;-aHBenzene4 - Methyl -2-Pentanonew&MmmmmmmZimfiliato«(WBii*;iMMS:g»XvteneftotaD
SEMIVOLATILESPhenol2-Methylphenclmmitt&wuiimmmmhtrMli'i'ii «i 'M'i.''.LitMifiiiiL:':':':':':':'-':':':':':':':':':':'\J&UlVlln»B»9tfHm\'-:\'<s:-±'-^ I-:*:-;.; -:-••:
D!-n-Butylphthalatebis(2-EthvthexvllPtTthaJate
INORGANICSAluminumAntimonytffii&mmmmmmmmQii^^mmmmmmmmmCalciumChromium&ji^mmmmmmmm&8iii^VmimWmmmmmronLeadwi&iiitimm®mm%®mmii^iitmmmmmmmmNickelPotassiumii/ttaiiSiiifmmimmmmgm^tf^mmm-^mmmmThalliumVanadium
efti^mmmmmmmmAlkalinityCODrM£ | '_' J j i::jf -"-•-•-• •:-:-;•:•:-:-:•:•:-.-:•:•;•:-:•:-:•:•:•:-:•:-:-:-:-:•:-:-:-:-:-
VMCinflV::::::::: -::::S:-: :-::: ::x?:::>:>::::::>-¥::
^ii^^i^ltf^j^^^^.^^^^^^^y^^:SuMate
9310RM103S9310082-14
10/02/93Watervofl
immmfmmmxfmmmmfmmm
9
mmrnmmm2
'• :- : •: ::;:>: '•:•:•: ':; :;: •: : :; : r: •:•: • : ::: ': : ::'-:' : ;: :::::
mitimm-imm-fm^WfXmmK
mmmmmmmmmmmm
104.000
;Si§;Si;:iS 8;S;8*immmmmmi
7260
mmsmsmm1.150
: vx-xl:- :•.•:::::•.;:>::•:;:•: v':;X;X:::::T
ips S::;5*itti30«:;
iSs: iSWWS^imzmmZmm
530.000
mmmspmmmtvjmim
24.000
Q
:;:;:;:;>:;x
£;s?sJ
siSiJS
mmj
:::•¥::•?::
•:-:•:•:-:•:•:•
i x" :
*''* ::::;:
:j;:; ;g
•:•'•:• '.'•'.-''•
:-:•>:•:•:•:•:
:::::v:;:;:::
BSSS
s-ils
mixmtt
«:SS
?*p
9309MW7-19310028-15
09/29/93Waterfg/l
;;:;f;sg;;;;;|;:;;;;;;;8|;;s;:g:::f;;i::g;;;:g;;;:g;;;;¥
> 1 v I; X ;: •'.• '. •'.- '.-. •'.- / X; X v '.• ox'.;X
2
:o:;x;:;.;:;xi:;;;:::;::::::::::;:;:;:;:;x
; X;! ;Xv 1; X % • X v -; - X X \ ;X vX v
4
2
:;i:;:;8:4;5;:;Ss;:;s;£:SJ:
36.4
wzimmm58,800
::::x;x:£::::::::x_:::::::::::::x::::::::
:« :« (ii:5840
s iaaM««»
2.000;g:;:;:!::;:j;:;:;;;:;:;;i:;;:;:;:;:¥;¥:;:
«iPiKiii ;
i;S;:;*;«;;;i;B::5*a:i;
400.000
i;«?«ROfltt:;ii:ii«£diw;
720.000
Q
::¥;::::-
r-ttvjv:
::;:::::¥¥:
iS™K
J
ssssJ
J*«;;*;S*I*:
WrfiW;::;;:::::::;:
m*?m
J
il;<m
SsSs
illsisg
SH*•:'x-Xv:
9309MW7-29310028-16
09/29/93Waterpg/l
':|:j:':-:::::-:;:':':::- :':;:•:•:• x::¥:::;:;::x-:-
3f?$$S83%X8<88%
:;:;:o:::;:::j:;:¥:: :;:::;:;:::;:;:;:;i:-;:::;:;:;:
:SS;S;?;S:K SSSvSisssJSSSjSiS SSsiJSiSS
2
3
3
siSwSS^SisS&Si
2
104
iiiiiisaiiiii;«!8:i:;il:ft3r;
84.000
igi»»$«ai!:;;;;;p:i;¥:;;;p:;;;;i;gs;g;i
294001.7
ll«ss;s«SiliOPl
11.000:•: -:: x -x :::x •:• x ::: :|: |x |:-x J •:•:-:::;:-:•:
:i;;:i;il;?lia»i6.5
illllgliSl :
:?t*;;:iivi:;:iil|410.000
?«;«isaj«fi5iii:lfii4ffi«»J
16.000
Q
;ss;;S;SiSS*
:H;s;s;8sMmm
J
:*ias;J
Jmmm$
J
SiviW:
;wi:S:
S&Sxi?Sx^:
J
iiaiia»
SfiSS
WSiS:
*;iif:5Mi
ffiSSiW$&
9309MW109310028-14
09/29/93Waterca/l
440;:p lii3WI;?g;MSS¥;5iWS?S>
330630
i;i;il;isl:l&30O!;;!sKs:si;*ss;:;seWI;:::-::-;:::X::::::::::::;:::::::::;v::::>::;:::::::
960
|x •:; x|: 5; ; : ;: ;:| : |: •:• : •> x > ;X vX;X|S; >
250
180ill;«:*tiOOlttiilliiilliiiiSSS;
65.232.7
llililiSai;epsiPsaii*
575.00012
• i -xSx^ fciift:
97500
lillzMOMI
30.5154.000
S&SSsSWSsiisiiiaiiiiol;
10.6
|:m? S^W.S 33.700.0006.200,000
mmsaoptffi2.800.000
Q
J$m::x:::x:::;
J
SSiS;5;§;si:B5S:
si*'*:•:•:•:•:-:•:•:::i-:::-x'x
J
Jmm™iis
si'lsx-X' :•>:•:
mmWm
J
M?»
SfflSSi*Ss
tas?«!«?
PS:PS
9309MW10OL9310028-14
09/29/93Waterus/I
l«x:S«isSs;sss«sgi::Mg* ;?
:X::::X:::::::::L::::::¥::::::::::::::::::::::::
::g:;::g::;:;:g;::g:j:;:j:SSS:S
PlSsSPSiSPP
S:::: ::SS'::|:S$S::x':i:::::::::Xv:
;iilll;;tl!00i»;
ssSSS?sa*si5^;^
::¥:¥:;:¥:::::::::::':¥:>¥:o:>::::::>:::::
:;i:8:i:;l;;:i;;;;;!;:;:gs;is
:!5;:S;:S} SSffiSgjSsSW
;;;s:;5;:;gs:;;;::B;;;;i;s;;iS;;;3gJ;xS*Sggg;gg;gS
S:?S::::S-:fK?:j:?:S5S'S:SS5
iigpiijjS fg;;;;;;;;;;:;:;
MJWPsSPPssssssmasiSKiss:;;::!
msmmvmmm:;gg;g::;gg::;ggg;:Kg;;:
0
MANANANANANAMAHANANANAmNANA
8s»sSSwS
NANAMANANANANANANANANANANANAmNANANANANANANANANANA
NA - Not Analyzed J - Estimated value
2049003/PDMWDV_S 4 of 4 19-NOV-93

Compi
Maldolm Plrnle Sample IDLaboratory Sample IDDate of CollectionSample MafrbcUnits
9309GR69310013-02
09/28/93Waterva/l
Q 9309GR89310013-03
09/28/93Waterffl/l
Q
TABLE 3RESIDENTIAL GROUNC
LABORATORY ANALLEMBERGER SUPER
ounds with concentrations greater
9309QR99310028-08
09/29/93Watervafl
Q 9309GR9RE9310028-08
09/29/93Watertig/I
-7(WATER WELLSrTICAL DATAIFUND SITES
tncui Instrument detection limn
Q 9309GR109310037-03
09/30/93WaterWO/I
Q 9309GR10RE9310037-03
09/30/93WaterWO/1
Q 9310GR119310104-02
10/04/93WaterWO/I
Q 9310GR11RE19310104-02
10/04/93Wateruafl
Q
VOLATILE8unlccoethcineMetnylene Chloride^^^M^oi^itif^mmmmmmmm:'irt^Dtdnfa&faiit&mmmmmm-mcto-1 ,2-Dtehtoroethene1.1,1 -Trlchloroethane^"ft^^i^liiifiti^mmmmgmmmmm^^oiiiiit^i^mmmmmmmmmmmmAiKs1 .4-D!chlorobenzene
xliiiSxiiiiiSlii;S»s 8i8888?ia:
0.2:::S::::;:;::yx¥Si3¥x¥¥333
a8s4*i S83S8a8S.
:555555:-
5555555!
J:¥xX:¥
55Sx55:
mmm mmmmmmifmmmm
x':¥:¥:¥:x' ix'ix'S&x'ix'x':
1
x:::x;;::::
«ix^S-
S$SS':-i:!:i::::::::
J
0.4mmmmmmmmmmmmmjm
VnWi§mmmmmmm
J4555555.v.v.;.v,;.;.>X-X'
5555:34::333455:
JiJxsSBx'xiiSxSiSS^581888: 38883:
ISiltillPiSssss¥jgisgssssi
NANANANANANA
f \t\
AA
NA
::K:::S::S::::K:x':::x:::x:::::¥::::x'x :-:-::::x:::x-:::¥:::;
mmmsmmmiggSSSSJKxSHxx'X:
?;™ s
•ss; s:¥x;: :::
Jx^x^xlxXffixl;^
35^S^3^3'3 i85S::;
S4S* :S™*:S;:533;8SJSSS^xSx^x'SxiSifflx:; i
NANANANANANA4A
i!4A'NA
• :|x v : • : v : v : j : • :•:•: jx •; v fx •;•: j: • i
:;:;:g;:;:;:;:::g;::S::;:B5;x:x
:;:;:;:;:;:;:x:::;:::;XxBx;X¥:B;
SSiSS8¥S¥::S8:i¥:¥:8
x'4'4.45
ssss
wmmmmi*y*fi884133*555:334:45555:845:
x¥55:':' :•:•:': v:v:'::::5:XxX5x::X
SS5::SSiSl:i:SS::™-:¥5:
NANANANANANA^A
:!4ANA
INORGANICSALUMINUMANTIMONY
BARIUjRSxlss;:;:;?:;;;:;:;;: ^55,33:5.;;;:;;;5;;3:;;;:;3;;;:;;3g:;35i ^ ^
BERYLLIUMCADMIUMISi^JiSi^iimmmmmmmmmmmmmmx^fifiQM^St^mmmfmmsmxmmimmCOBALTCOPPERJRU«=A
S ^^P^S^^J^S^^SISS :
3fS:SS455S45S55;555555H4S;45S55;4555555:4:45;45555x:5555;
MAGNESIUMMANGANESE^Cftif^S&KUimmmmmmmmmmmm
SODIUMVANADIUM
i<SMiMl8ft ^ ' ^ v;:S?SSSSSSSS;g|i4g
COOChloridel iSiiiiii
47.7
f:;ll45:li;4l;470iil
lljIxiiMJsliOO:345;:;4;:;;:4f;;:4s;;;¥x¥4.¥
11.7xtssiiiijiijjjjSi345S34SX555S345555555
35.4007.7
3lx:4;'x:3lxl: ifiO
7.250
li ixWxZW«<»>
2.200
xXx:::xX:Xx«i::MilUi
55S45K
4-lii
Sfix'ii38383
¥x$3'5555555
JJ
:•:•:•:•:•:•:•
S:ox:i:|
555S34
45.626
sssssjsssisiSjsil:?Sx:¥li;Sx:fl3^
SiSssiKfi4i500:
mwSllfllf K 'i;::¥:::¥::S¥:¥::¥.S;::| |:
28.80098.4
ISiiiiiiliiSZ KMSi SliS
4.400
jP^fpfPSsSsSiSJMJiOOO:
3.600IxlSSifeiSdiii:
xWxX;
5S8S
S3S3SS334S34
5|f!f?:¥:x:¥::
J
J¥.:3;33::
S4x¥¥
^4
::555555:
555:4:4
45.7
455;4555555555S333333333mmmmsitiiik
ss:SSH:sS2^8OQ:S-j-x^-Si xlSx?
9.4im fflMfiiiiiiliii
27.20040.2
mmmi&tiift:mmmmgmm
3.800
if iliiTfivf* fi::xxiiij|60.00| fc
1,600
itfw345555:
4555¥.S
5x4'4;5
iil*5S35335
JJ
mtm4:55555:
S&:«;¥:¥;;
•XvX-X-XvX-XvXvXvX-x
^m^siimmmi5JS3s555iS^H5s5S553SSS
isiaigiigsivxIiiS;8333Sx3:gxS:i33«;83:
5S:g;5S3¥M;;sss;4jS^3S^8383533?S55Sc8
mmmmmm®SSSSSSSSSSiSSiSSiSiSS;
IWSix- S
NANAf<ANANANANANANANA: \
\
A:A
NANANANANANAmNANANANA
50.9
::x:S;x:::x:::::::::: i : ::xo:o
mmmiispoKmi^mmmiiii^
illfS^WWlffi¥:¥:x¥;S:;:;:;:S;:;:SS:¥:
36.10020.2
mrnmiessoo:mmmmmi.
12.500
260.00 >
16.000iiisiio;,Mil
SSiit
mm
ixss:
H:¥;:::;:|x
J
J
SSSSS:
mm
tMmm
i:x:x:x:
Sw5!55JiS33gi'8;8¥'5iS: •SJ ifi sSx^ !
: ivX v>i;:;::X v:w:v: w x •'.• '.•:• :•X'X'X^-X'X-T-X-X'X'X'XvX' :
*^^sSj553i5555JsJS3; :
llllliilwnl- i3 Sa'8'8 4>5':5'::S5l:S
if alvss'*';*'
:3::::3::::::::::¥:::x:::¥:>x¥4:::::X::
mmsmff&mmiz
NANAmNANANANANANANA4A*ANANANANANANANANANANANA
37.3
S5SSSS 8:5x884538
ixiii isiiii
llWiiilJO^OO;;¥;;:;s;;j;x s:;:;;;:;:;:;:;:S:H
4.4f ilflf l$j$|K f=Si xxISx ix'fliS li
30.50083.4
wmmmimWMM^iSM
4.760
|5|;::5:S;i;:xi: i.i:::SX::i:260.00 >
27.000S5siC6li:i
m
55544S;x4433:
mmmm.
W*455555:
JJ
Wfix;
SSSSS
HifS¥:xx:x
mm
38834>3Jx8;f5j;45';:¥;8|¥.|:3333x:333x:x;3:¥:::X:X::x¥:X:
8iiS4li;i;Ki:4i:3x5:X:X:X:XxX:X;X;X:X::xX:X:
5Ss4;383:;4.55;33:5S::::55.;a:5j55.:4::p::4;::4:3:;:;4J4;:;4x4
wmmmm mm|::55:4:::::4::::43:i34:5 ::::44v4
3333:xxxx¥x;x;>x; 4x4x'4;:::::::™44::x«4:x::xxx:xx:x
4M::3:;:;3:;53:;53:4:;:4i33455
NANANANANANANANANANA*W
•AIA
NANANANANANA>»
AA
NANANA
NA-Not Analyzed J - Estimated value
2049003/PDRWDV.S 1of5 19-Nov-93

Compounds «
Maldolm Pirnle Sample IDLaboratory Sample IDDate of CollectionSample MafrixUnits
9310GR11RE29310104-02
10/04/93WaterA/a/I
Q 9309GR12-19310028-10
09/29/93Wateruafl
Q
TABLE 3-7, ContinRESIDENTIAL QROUNDWATEI
LABORATORY ANALYTICALLEMBERGER 8UPERFUND
vhh concentrations greater than Ira
9309GR12-1RE9310028-10
09/29/93Waterfg/l
Q
uedDWELLSDATASITES
rtrument detection limits
9309GR12-29310028-11
09/29/93Waterua/l
Q 9309GR12-2RE9310028-11
09/29/93Waterwo/1
Q 9310GR139310082-18
10/01/93WaterItgfl
Q 9310GR13RE9310082-18
10/01/93WaterKfl/l
Q
VOLATILESChloroethaneMethvlene Chloride
fliiftSSDtfeKtb^
cls-1 .2-Dtehkxoethene1,1,1-Trtehteroethane
1 .4-Dtehlorobenzene
SiiW*wS^SSS:H&^Si x^^SSSSS
¥:¥:¥x¥x¥x¥x¥:::¥:¥x¥x¥x¥
NANANANANANANA
NA
:::x:x;x:x::-:::-::>:;:-x;x:x:x:>x;:|::x:::::::x:::::::::::::::::x>:::::::x|xjx
: 'x'-:-: :-:-:-:-:vS:'X-: : x'-:-:-:-:-
mf!ff!^^f^^i
oxox:;
Bx'ix'x^ ^SSSjHSSSiJ i?m®3$$mmmj3jgmi;
mmmmmmm
NANANANANANANA;ft ['*'•
NA
:|:j:;:;!;:;!::|:;:|:;:|:|:;:|:|:¥:¥¥¥:X:x
liiiiiiiiiii::;;:::;:;;
Iliiillwiii———— Jjr
;;:¥:¥¥;
l-S'xf!
I'Xvi'X
:X::::¥;i:i:;:;:;:¥;;:;x;:;:|:;:;:¥;;:x':y.:x:::x:x
^m^mMi^i^im
MMiffllPiPpW
NANANANANANANA
NA
:;:::::;::::¥:B::::::B:¥;::':'¥;X:X
jjmmmmsmm0.7
'&X&!
J
IP
?;S; ;::s;:;S;S:;ass:;ii Hi lxPs;;
l x'S SiSiiS:::;;:;:*:;
NANANANANANA
NANA
INORGANICSALUMINUMANTIMONYARfBARI
ftf1
Pi^ ^ » «; M »
BERYLLIUMCADMIUM
'CfmoiiVKii^immm^^^^mCOBALTCOPPER^^
fflsA
•:•:•:•
:;i^ ^ x *. i - ^Si ^ xHi x ^S^KS
MAGNESIUMMANGANESEIxfffiSS:«Mg|xmj:
! ilBli» ;; M>M Sg
SODIUMVANADIUMjZlip M^K^ il*:s?MSi M^M^:«iiiiiite l. j;ffi> M^ tCODChloride
i
x ig^xiiixxS^^SS®^^^?^
i M^xtSMxiS
SSMigxWx&xS&x*
wwwmmmm
mSM8Mm8s®®iMsMSSwS*!
NANA\Ki ANANAM:
NANANA*^ANANANA
1 JJaV
NANA:l A'4ANANA
61.2
liiSi K|'¥.;;:;:¥.:;:¥.|¥.;¥.:;:;:x:;:3 ||;;
j SgSJ'lteTMiJ:;;;;;:S::;;;:::;:;S:B;:;:;:::B;:;¥,™
29.00030.5
5.720
iS is'isigijj l iiislZTOiOOCI
25.0003.300
Six';::;*:mm
SBBS
IP
J
J
«
i|jp
spif
^M^ ^ sailSl iii iSS^ ^
mmmmmmmmimymMmmmmsm
. . . . . . . . . . . . . . . . . . . . . . . . . . . . . . . . . .
twwmmmmmm?*®mf®mmmsmmf
•XvX-Xvx.xv:-:v:-x-x-:-x-:-:-:':-:.:-x-x•x-x-:.x-x.x¥x:x¥x¥:¥:¥x¥:¥:¥x-:•XvX'X'X'.-x-x:x.x.x.x.x.x.x.x...x.:
x.x.x.x.X':.:-Xv:-x-:.x.x-x-x-:-:-x-Xv:¥:¥:¥:X:¥i?:¥:¥x¥:¥:¥x¥:¥x¥:¥
%m$mMmMm**K>
NANANA"A
NANAKf£™*NANANAs A
;K A :
NANA
•fckbaV:PIM
NANA.'tA,:NANANANANA
65.2
¥x'¥:x¥:¥x¥x;:¥: mmiiiSwiSWlliliife
is x iji:;10.2
l;:;iiffi;IS9jOi|ilK;¥M;S;iis>?;S!ift
45.100305
12.8007.3
iii;|i:I|ps¥ ;1 iliislKSIiHlSOOl 1
3.500mmmt* f K
wm¥.:¥:¥:¥
:¥:::¥:¥:
sasss;;?;
JJ
jgSSg
—
**jf*B'ssg;
:;i;i§
iiii;iS;Si:;S;S;SSSs:K^ i.:S^ is¥Sm8™:«
>:¥:¥;¥:¥:¥ :¥:¥:¥:¥:¥:¥ :¥:¥:¥x:x¥.
:S. S»;:x "S?x SSK>':S
^JJSafflSB^SxSiSi/wS™
|:;::¥.::|;::|i|::::;::j:::::|:|:;:|:::::::::|::::: ^
ipi M j MSsiK iiSfiiK fflSass
NANA|<JA:
HANANAJJ4::
NANANAi;»
AA
NANANAUA
NANAf ANANANANANA
64.734.9
mttMmmimmmmm&tite
mmmmixm
9.4SsSlSixfiflltt:
Wf$$Z&%$&32.200
134mmm^sm
4.490
•; ;*i¥'s!j(|ffi:lifiiJiTOdDM 0
4,4008OCMI66
¥:S¥:i«¥:
BSSS
ipSSxS:
J
J
mm
SpSSSJS
::¥:¥x:i
:x^¥^S;:?K:¥;MSiig ;sp:v:¥si.W^
-i::'i'i':::-l'':i:i' :ivivi'i'iv:-i'::i'i'i'i:i
x-:-:'X:x';:x:x:x'x:x;x'x;x-x:::
mmmmmmm
x-:-x-x-:- :•: -x-x-x-x-; -xv :•:• :•:•:•:•
•:•:•:•:•:•:•:•: -XvX1: •: •:-:•:•:•:•:•:• :•:•:•:•::
>:• : ':• :•:•:•:•; ' i;x •;•:• x-x-x-x-: •;•;•;• : :
mmMlmMmm
mmmmmmm• '.•'.•'.•: •: vx-x-M •:•:•:•:-:•:• x-x •:•:• x •:•:
NANANANANANAUA
NANANAi \•::(
A:
ANANANAklANANANA:NANANANANA
NA- Not Analyzed J - Estimated value
2049003/PDRWOV 3 2 of 5 19-Nov-93

TABLE 3-7, ContinuedRESIDENTIAL GROUND WATER WELLS
LABORATORY ANALYTICAL DATALEMBERGER 8UPERFUND SITES
Compounds wtth concentrations greater than Instrument detection limits
Malclolm Pirnle Sample IDLaboratory Sample IDDate of CollectionSample MatrixUnits
9309GR149310028-07
09/29/93Waterwo/I
Q 9309GR14RE9310028-07
09/29/93Waterwfl/l
Q 9309GR159310037-06
09/30/93WaterAig/l
Q 9309GR15RE9310037-06
09/30/93Waterua/l
Q 9309GR169310013-01
09/28/93Wateruafl
Q 9310GR179310104-03
10/04/93WateruaA
Q 9310GR17RE19310104-03
10/04/93Wateruafl
Q 9310GR17RE29310104-03
10/04/93Wateruafl
Q
VOLATILESChloroetnaneMethvtene Chloride^MMt^o^tliiiimmmmmmim.cta-1 ,2-Dtehloroethene1.1.1-TrtehloroethaneTrtel QeimBJi'ieXr.M.sx.M.v.r.x.M. ••: . • .:.:.:.:.:.:.:.:.:.;.v.: . :.y.v. v.
fyjjlitiitfi^£&$M^^f®M8!!^%&®M1 ,4-Dlchlorobenzene
illlllixti
BB.i;BB';:x:BBx:BBB.B:
TOIlifBi^g
lil
xBBBiB.;;BB:
llfxillilil. . . . . . . . . . . . . . . . . . . . . . . . . . . .
:::::::;:;:;:;:;:;:B';:B:S:::::B.B.B:X
mg^mmmX
NANANAWrlNANA
* A* ANA
••-------»
:B.:i:i:::;:::::::::Bx'-x' -:x:Bx;
SS;:;:::;;;:;;;;;;B.;;;;BB;B|B
m*
BB>B
X • XvX- X-X -X-X-X-X OX-Xv X->
:M::mMiilstSsziS^BSgSB'SSSSB'Bs:
NANANA
NANANANANA
mmmmmt
x-Xy X;: ;iy :•:%•:;:•:•:•:•:• :•: •:-:•:•;•
':K'::::;;::x::v:':;:\:::: ::v:v:''''
BBjB:
BBS::BBB:
mmKmmmmm
BBx-B::x:;:Bx:x:;:BBx.:B:mfxfxmxzm
mmmmmmm
:vXvX-x- xvX-x- x-x • : -x-; -x-x-
•x-x-XvXwX •:-:-:-:•:•:•:•:-:-:-:•:•:•:•:
NANANANANANANANANA
:;Bj;:;:;:::;:;:::S;:;:;:SSS;:;B:;:;:;x;B:::S:;:;B:5S:;:;S:;:;:;:;:;:;B;BB;3
NANAmn 'NANAJANANA
INORGANICSALUMINUMANTIMONYAlfi*m1 1BERYLLIUMCADMIUM
mmmmmmwimmmmmmmCOBALTCOPPERRO
:ii£Ali m1 :|:|:|
m™mmmmmmm mMmmsmx:x-; ;X;X:X:X:::X:-:::;:;:::;x:X;x|:|x;X :':X:X:X:x|-:X:-:X::-x:x-:'
MAGNESIUMMANGANESE:^Of^i6&tOii^mmimmKmmmmmiij^WW^mmymwwmmmmmm*SODIUMVANADIUMfflftGmmwmmmMmmmmmmmmmi:ymiiailmammmmmmmmmmmmCODChloride
54.6
:
BlsBBSZiiSOttmmmmmmt
4.9BBBBBBxIiJjMI |:;BfBlB3B'B'B'SJ£i;
31.90020.9
mmmmmas.mmmmmm5,450
mmmwtwwmmtmi
3,800280.OOO
W&
BBBx
x-Jx
BBSS
JJ
BBBxSBBB
BtfBmm
Sim
liilllil
£&gB$|:g;B$8SB.$3mmmmmmm
mmmmmmm^ •? S1 ^
mmmmmmmmmmmmmm
mmmmmmim•BB::BBBB::B::BB:v::B:::
B:::x:x::;x:x:::x;x:x:x:::x:x:x
NANAMANANANANAMANANANA*fiNANANANANANA
:1MHANANANAHA
45.3
:•:•;•:•;•:•:•;•:-:-: •:-:•:•:•:•;•;•:•:•:•:•:-:•;•;
;HSS::::S::54i400::B;::gxB:g;:;::::;SB:;Bx;:
9.1i Wrfmmii smttm
31.60041.2
mmm sisso::SBB-|B x^Sox^Bx^
4.600
mmiimm-i^B8$70$Q0:
4.300
x-x-x-:
BlissBBS;
;sJ|BBBi:
JJ
Wx£x
mn,
iSSB
glSBBBBBi^SBSJJ
B::::x:X::;:::::;:::X:X:X:X.xBB::
mmmwmwMim
SBBBBBBSSBBSSBB;BBx'BxxxS-Bx-BxS'BB
fBBBBBBBBSBBSSBS•X-XV/X-'-X./X-T.//:^."."^^-"
<:;B.:;:;g;5;:;:;S:;:K:;:;:: x'BS.B.:i:S';;:MS:i»:S'5:WB?
ix^iSxBxiSixixgB
NAND«
AJ^
ANANANANANANA
a ANANANANANANA
:NANANANANA
48.1
m&mmmxH;mjmmxm»m
17.2B;B';BXBBBB; ||I?:mmmmrmi.
32.90023.3
mmmwmmmmmmmm4.180
K«::5B';:5:?>BB':lldlmmzsojQQQ
3.500:;!:lB:»tOi«IO!
hiif
5sJBisiiJ
JJ
Ss?SS
x:;J:J;SBBB
iBBix
11 Illelit i
4BSB BiiKeSii^iOiiiJ;;X ;X ;X ; X ; I; .;X ; : ;X ;X; X ;X;1;X;X
BBS: :x*B*SEiOi|JO;
33.30024
•••x-x-x-x- x • x- x' :-§ 'ii3SO ':
:•:•:• :' :::; : :X:: : : : ;'•:'•: '• :'• : : :•>: :X: :: :;: ox' :-
4.830
xSv>SJS00.QOO
4,200ixiiaioiooo
isBiBmm
m
Wfimm
:::>xx>>
mmmmmKmmmmmmtmmm
3BBBBBBBBS:BBBBmmWffffmmSm
x:x:BxBBx::o::::::::::::i:;:i:;:xSSBifflBBBJBBBBBB
;B;;:;:;:S;:g;:::;:;:;:};B:x:;x:;:;xWmmrnm-iim
mmmmmmm
NAK A
*f"%
NANANANANANAm,NANANANANANANANANA,NANANA
:;:;:;:;i;:|:;:::::;:;:;:;:::y:x;:v' ;;S::i;:;;
•x-x • :-x; :': • :• : •:• : • : • :• : -x : x:x:x:t:x •:•
X^MXlmmfff;
BBBSasSSSSSBBsxB;BBBBBBBBBBBBBB:
:BB'xB'iB.B.:B'Bv.:;JBjfB'3x
•iffiSB'B'iBisiwSSS
iBi-BBBivl-BiSBBBSBB::::::xS::::::::::::::::::;:'::::::::::::::x::::
:;li;il:!;;;::;;;;:;;;;:;;;;;:;;l;:;;:;:x;;
NANAS!Ai miMANANANANANANA:|i(AsANANANANANANANANANANANANr\
NA-Not Analyzed J - Estimated vsJue
2049003/PDRWDV_8 3of5 19-NOV-93

TABLE 3-7, ContinuedRESIDENTIAL GROUNDWATER WELLS
LABORATORY ANALYTICAL DATALEMBERGER 8UPERFUND SITES
Compounds with concentrations greater than Instrument detection Nmlts
Malctolm Pfrnte Sample IDLaboratory Sample IDDate of CollectionSample MatrixUnite
9309GR269310028-12
09/29/93Waterjug/I
Q 9309GR26RE9310028-12
09/29/93Waterjug/I
Q 9309GR279310037-07
09/30/93Wateruaft
Q 9309GR27RE9310037-07
09/30/93Waterffl/l
Q 9309GR309310037-08
09/30/93Waterjug/I
Q 9309GR30RE9310037-08
09/30/93Waterfg/l
Q 9309GR319310037-04
09/30/93Waterjug/I
Q 9309GR31RE9310037-04
09/30/93Waterjjg/l
Q
VOLATILE8ChloroethaneMethvlene ChloridejfcilssDldrilibwiirtlSH^j|' •.• j|. ••;- j-[*^ t£ krtlyu 'ftm if fiw ri • •£•'•'•••••••'••-'••-•• •••-••••••••••••••••••••••••••••••••••
>il :!hl- :T?!U Iwl HU1.WU KUW!-:-:-:-:-:-:-x-:->: •:•:•:•:•:•:•: •:•:•:•:•:•: >:•:•:•:•:•:
cls-1 ,2-Dlchloroethene1.1.1 -Trlchloroethane
J5a ^ ^S^ I ilis' iliSix'i1 .4-Dichlorobenzene
gSBjggiSBSSBBBBB:|x'x¥x:x:x::¥:¥i::X:::::X
iiiiilliii'
xffiBi
iBiSS
SS3: ^x' SlSffi:&Ji£B:¥:X:Sx¥:¥:S::x¥x¥x¥S
NANANANANAhf
»
Af*A
NA
B^SSB'xB iSBBx'B.:
ggggggSxSSfliS;
:i:;:;;;;H;;;;:;;:;:;S;:;:;:;;;:;:S:SS
x'Bx¥:
i??S|x?
:":'§':
¥:-BB;:BBBBx¥:¥BB:
SSSSfflBSBBBBBS?:
NANANANANANA
MANA
:BBBBB;BB¥ffi¥:BB:X:|:¥x::X::.:;:::::::;:::;¥:¥x:x:;
•XvX-rvvX'X'Xv^'X'X'Xv:-:'
BBSSBBSx
Ix'SS^xwSSixSSiJx|:X:::X::::::::::;X;:LX::::;:::;:::x:::;:::.::
WiSwS^^wJxSSkx'i:
NANANANANANA
IwlNA
gxx^JSx^x'SVSHSS;
Sx'ffiSB-SSS-SJSSSS
1
B'x'ss>;¥:¥:¥:
:¥:¥:¥x
J
::::::::;:::::"::i::::::::::::::>::::::-::::: :::>::::o::x::::::::>-x-:::>o: '-:-:^:::::-:-:-:
giPiiiii
NANANANANANA
•! *lrt
NA
INORGANICSALUMINUMANTIMONYARSEf'BARIU
S^ 1!^ S^S1::xxBBBBBB::::B::BBB:;BBB¥¥|:BB::Bx¥BB::B
BERYLLIUMCADMIUM
wmmmmmmmimmmmmCOBALTCOPPER1
••$O!?A
is;i ^ ffigK i x^x?^M^>;s?i;i;SsS:
MAGNESIUMMANGANESE
^tfj^Hffi}^v;i^t-[iff;ff;ii^iii^f^ff-:^^ff:fff'>ffff-SODIUMVANADIUM
'WKliHiriMS®*®*™ BBxXx¥Bx¥x¥B:¥x¥SB33BBB
COOChloride;< diiiiiii;«;Bi:
utt :Bxx';i;;;:;;;B¥BSi *w^m!^Mim:&
39.1
Bx¥Bx:B:¥BBBBBBmfi®m3)&2(i
;B33SB'67!200:gx^BSSffiSxiSBBxiS
47.1:;::;;;;:;:;:;:;:;:;:;:;:;!8>I6B( iSSSjRi( i
31.60067.8
ixB';:ss;3B;liOBlO:B;;:;:;B;;xj;:g;:i;B;x;¥x
3.430
iiiligisgijijB:¥B:x£gQvQ( ^ i
isi;:;:B;B.SBxi
2,900,<XD
:i-x-xB
BSSB
:¥x¥;¥:
:i:Bx$:
B;ip:;:SBBB
JJ
BSSBSB;?;
:¥i*f:B¥:>;:|:S:
SBBxBSSB
^msmmx^msimxX;:;X;X:XxXxXxX:XxX;X;X
.;.;.v.:.x-X-X-X-X'XvX'X'X'X-X
;SSM;:;:;;;::S.;::S;s;;;s;:;:B:s;
SgS^iMttZ&ttm:
KSSSS^SxSgSSBx
ttmXiwMimiWttSXSSVZisyxfi
WM^mmmm
NANANANANANANANANANAM4ANANANANANANANA
62.531.4
-:v:v:::v:::vx:::::::xv:>::::::::::
mmmmm
68iBOOZ&^mMSSm
9.4fe^?mS«.?^S8jP
BBBSSBBISBiiHSB32.800
57.7s';5:BB.isB.;;J;il;;fiiBi::x;S:;:;S::::;5S:;:gx':iB.SB
4.420
;gB.:;;;:!:;B.;;|;;:;g;i|3S
:SS'¥:S:
BBx'B
iSBBSSBBx
B;i3iSS3BSJJ
3B5BBB¥x
;?SI;¥:x¥:¥BBBBBBB:-BS¥B:j:ijl|A|BBBH2^ j()(j'J¥¥:;¥¥
:SS:;B.3:;B:;:::;:g;¥;:;B;::;sB
NANANAlift
3.700mma®*ix'SSSxSS'ilBi tot
:BBB!wBBf
:5iS:5SBj;:;:;:;:;:;:;:;:;:;B.BB;:::;x;:i:::|¥:::Bx;:;:::;:;:;:;x;B:
:5x^S ::5s^x^xS:¥:v:;:v:v:v:::¥:¥:¥:x:¥:x:x;:
^•ssmimiyiSxiSs:xBBBB:¥:SBBBB:¥;::
BB:::¥BBB:¥B::::B>B::
::X:X;¥:::x:x;::¥:¥K¥:¥i:¥:
S¥;SB:;:;:;B:;:;B3:;¥;:;B;;;B;;3;;x;g;¥BiBBB¥iBB.:
SSHSJBSiSBJx'SiB
NANANANANANANANANANA!(\
i \AA
NANANANANANA
:N,A•MJt
NANANAm
60.2
SiJggJBsSBSSx'SBxi;I;;|:¥::Six!90 ;
x¥'lixB:74ii800:BBB^Bx'BxoxoBBB
14.3¥x':;B.BB:;Bi|:| plj i;
ISglBBSBSSjJJijll;34.800
65.5sSsiisBsBliBSO:•BBBBJSSxffixBB:
3.490
v:vXvXx.>xX'-x;
mmimi>:<iH
J i« i
5.400¥B:;B:;3CO )00mm&Biiiais/tt
BBB:;
Pill
ftBBB:BBB:
x'SilB.
BBSS:
J
J
iSBSB
Sit?B?>BS
;;x¥x;.B:;:3B
^M^K?mmiiimiiiililSxl:
«<^s;;wi5s?¥S?x^gSSxBBxSBBKSSBBx
BBB:¥x'¥B:¥x¥x:BB|:B::
mvZMtiMtMZ
BBBB¥:¥:¥:¥:¥x;:¥:¥:¥:;:;:
BBBBBBB¥:BBBBBB^KSiiHjSjfflBHixj
:;:;:;:;:;:::X:::X:;:::::;::::::::::::;::::::::::::::¥:¥:¥:¥:•: ¥x¥x¥: ¥:¥:¥:¥:•:¥
NANANANANANANANANANA
•:,\S >
AA
NANANANANANA,:|i
*•AA
NANANAm
64.522.5
xXSBBBSSBBBSSSSB!
MmMOBWOOfSSSSSSSSBBBBBBBB
35.4B^BB^BB^BjSSii f
:;50.500
ixBsilisSSiltiJixBSBSSxBBBBBSffiB
36.200
&nM$M$$i$i-:B;:;:?H:S: 380,000
86,000gggsssOOOiOOOSiilffisSJGOltt
iv'i'v'x'x
'M&
::::-::::::x:
:•:•:-:•:•:£:
S:;iil;:-i;:::;::::::::-:
JBBBH
tflfif
'BB;BB¥B¥
:i§i:i:;:i:i:i :i: :::::S :iSx::!S:i::o: :::Xo: :So:S : : :SS
::: : ::: :: : : : ::x:::: : :: :: ::::: v ::::: v :::::: : -::::;:
x' X^^Si x'Si x'S
:BBBBBBBB¥:BB:¥B¥::;:::;:::;:::::;:¥:|:;:|:::|:::X:¥:BB;:¥:
;§;;::;;:S::S:5¥S¥;;3BB:;;;:;;;:;:;:::;:¥;;:::;:::::;:;;:¥¥;x;:¥:¥:;
x'Bi'Siixx'xx'-SiJISxgxS
i; :S: ¥vBBBBiBB:-B:-
rnmmmfmm
NANANANANANANANANANANANANANANANANANA
:j|i
NIANANANANA
NA-Not Analyzed J - Estimated value
2049003/PORWDV_8 4of5 19-Nov-93

TABLE 3-7, ContinuedRESIDENTIAL QROUNDWATER WELLS
LABORATORY ANALYTICAL DATALEMBERGER 8UPERFUNO SITES
Compounds with concentrations greater than Instrument detection limits
Malclolm Pknle Sample IDlaboratory Sample IDDate of CollectionSample MatrixUnits
9309GR419310037-05
09/30/93WaterWP/I
Q 9309GR41RE9310037-05
09/30/93Waterjua/l
Q 9309GR439310028-09
09/29/93Water//g/l
Q 9309GR43RE9310028-09
09/29/93Wateruafl
Q 9310GR609310104-01
10/04/93Waterwa/l
Q 9310GR60RE19310104-01
10/04/93Waterjjg/l
Q 9310GR60RE29310104-01
10/04/93Water0Q/I
Q
VOLATILE8ChloroetnaneMethvtene Chloridet DteiHli88iitl8>lti ^ i ^
:1i - 0|C k*O*ilSWrW:::::::5:S:::S:::S:S::H:S::i:i:iiv::;-x
cls-1,2-Dlchloroethene1,1,1-Trtehlccoethane
|| j|j|jjj|jjj j;j: j:j; j:|:j; j: j:|:|:j:j; :•:•; S i-ft'-: ;::>:;S>
1 .4-Dlchlorobenzene
SSBBBBBBBBBBBx:::::::::::::::::::::::;:.:;.:.:.:::xX:X
0.6
:x,x:xxx;:x:x:::::x>x>^
:Xffi>x
J
x>::¥:x
SBJBBBxSBBBiBBBSSSSB^SS^SSBB;:;
Ji- ximiBBB
« —— 'i***™
NANANANftNAK
•;\
>
IS
INORGANICSALUMINUMANTIMONYAWBAF
E>HI!
ljjj| ¥:::':':':::::::::::':;:;:|:::-:;:;:::
BERYLLIUMCADMIUM
id^01il8lill ^:^ ^ ^ ^ ^ KlCOBALTCOPPER
; 3M
01
fftAG
SB
NE8IUMMANGANESE
mmxwmmwmmwmmmmSODIUMVANADIUMiJtlfifB^^^^^^SSfeKf'SSSfiSSS-SSHSSSSS^f^^j^mimmmmimmmmmmsm!CODChloride
53.3
;?l:l:::?:::?::::::xB.:;:x:B
;S;|:B;iBS*!30
;BsB;B'BTBi90l)i
37.9004.3
:B'lliB*S80:wmmmmm
5.680
S^BBBfBjfBBfj ,BiSBiJJJlOlJjjQI i
13.000BBS?; £962 WQ
BBBx
SBBB
jixB'Bj;B'B':S:
x-x-x-:-
J
J
B'iix-x-x-:-
JsiSixBSS
mm
B i;::::::xBB.B;?;i;B;;B.:;:;:x:
WM»S@%X%
mmmmmmm;B:!:xi:;SS:|;|;;:;:;B;;:;:;:;:;B.:;:
::::::x-x-:-x-X'X.:.x:XvX.X;X;X;
mmmmm mi
S;:B.SBBBBBBBSS" BBi
ftWx'X'i'X'X- :;>X:K:>X: •:•:•:•>
x-:o#x*:::-x:::::::xv::x-x-x-x-
AftftA.
0.4^ ei;Bl«SSSSx'S&Sfei'SiJS:?
;:B;:BBBB::;:;BBBB5:
JWxXS:BBB:
:>™sx
mmmmmmm*'i':ffi™:>?:¥x?ft?SSw
SSiSSiiSSSHSiiSSS?
ffi s™™:™:
NANANANANANA
NA
23
;;:;;:;;;;i;;::;:S::;:;:;;j;;;;B;5:::;:B.:;;:SBB;B;:i;i:;ii|ft;
26100
SBBBBSSBSSBBB
NANAmNANANANANANANA
ith
A:Ml
ANANANANANA
it)ill ANANA
58
;Sjx':;:S:::;:x':x:x':;?::;BH;K
i;§is;i;;g*ISj!<i
xBiSxB'xlJSsiioKiWx'x-r-x-x-x-X'i'X-x-:*:*;-:*
15.3|&;a»»
38.500
•xliilib$85M^M3^
4.880
B'xBB.B.B;:i:B.:iji jp™s:iS;;340i«>
13.000mid®® M
IffM'fWP™"*'*'*.
:BBB:
Siiixl
?BBSBBSB
: i«J
SSS:?mm
iiffi:Si?
•am
& *S:8KWS888>^ ^ ^ 5
SaaSB5!BSSSSSSS^ss^ rsis-:*s«>?^
Siei MSSSSK• • " " " • • • • • " • " • • " • " • • l
mmmwmwmm
mmwmmvmi
NANAt f\MANANANAMANANA;!&NANAhANANANANA
5SS3K::x;x:::::
SB;:;;:;
xxxxx
SSBBBBBBBBJBBSSg:;;::::;:::;:::;:;;:;:;;:;:;;:;;:;;;;;;;;;;:;;;
::.XvX::;:;:;:.:;:;:;:;:;:;:;:;:X:::-:x:::x:
js. :gsj;sgs:gg^^
NANANANANAr<':\
N
22.4
BlI?;x;i?iWf3E;
1.13
B%B'83ii4dG::$::::x:::::::::::::;::;::::::>:::$:;:;x:
16.2
mmmmm42.301
ft:F0
61mmmmmmmxmmim
5.1706.1
!BjB.:gS;;:B;::J|0j:
^ ^ ^ ^SKLI K- iX'l1'
mmmmmmm
™;BBSiBB:
::*««B;:BB;
S:Mtt
JJ
ffiSBB
v.;.;.;.;.;-
m*!BBBB
NAlNAI 12.000i: <A| sadiodo: iJAjssil iOOft.
wx'$?
S^B.S^^3j;5x?¥^Sg:;;;B.B.;;;;;;:;;;j:;:;:;:;;::;g;B.;;:;;
ISiiBMi ffixBBB^^ffi&S^xwi
11111111———— ... ——
B;:;:;:;:::;:BB;::::;i;:;::;::;:;:;:;:;:;:;;:;
^ i ssiisiBMS
^SsSwB'K«i?x?«K?^sssKSBSSBsaas:
BB;:BB;:BB;:x:B;:::B::BB
Aftft
A
SSBBBBBBBBiBBBizmmmmmsm-
mmmmlmmmmimmmtm
NANANANANANAMAMANA
NANANANANANANANANANAH\\
h
Ajt:
TTA
NANANANANA:|i
fIANANANA
BB::::;:;:B;:x:BB::B:B.i;:BB;:;:;;:::B;:SB.;;;;;;;;:g;;;BBBiH
SBjv':;:;:;:;:;:;:;:;:;:;:;:;:;:;:;:;:;:;:;:;:;:BBBBJBBBBBBBBB;
Pllllll•'•'•VIVIVIYIVII'IVMVIVIVIIIVI
i3^BWjxgxi;B.SB;::::x:x:x.x:x:x:x:x:::::x:::x':X::
••Sfffif!-!-!Xtiff!-ffX!*!-f!a
BBBBBBBBBBBB;™
NANANANANANANANANANA:f^i
NANANANANANA;|^ftNANANA:Mt
NA-Not Analyzed J - Estimated value
2049003/PDRWDV 8 SofS 19-NOV-93

*ptf<*''."'J\ Wr lJjitfSiS'liiJ-;.?^
fo?mi*?e%M£&
(fr tf&^&*^*8m* v\ \M$.
1^7 x-s/Ji RM^oJ^-^v vsar -K'/liA W- -,h V??^u/..^ iMw-iTl : .•;i.V^°ltefe,
PREDESIGN MONITORING WELL LOCATIONSLEMBERGER LANDFILL RO\RA ACTIVITIES
FIGURE 3-1

4.0 PUMPING TEST PROGRAM
As part of the Lemberger Landfill RD/RA, Malcolm Pirnie developed andimplemented a Pumping Test Program. The goal of the Pumping Test Program was toprovide field data concerning the performance of a remedial extraction well and to providedata for the construction and calibration of the groundwater computer model.
The Pumping Test Program includes the installation of a pumping test well and fourobservation wells, a 24-hour pumping test, and data reduction. The pumping test well andobservation wells were installed near the Lemberger Landfill Site on April 12-24,1993. Thepumping test was conducted on May 4-6, 1993.
The Pumping Test Program is discussed in its entirety in Appendix C-l. Resultsfrom the data reduction are summarized and presented in Table 2 of the InterofficeCorrespondence (Appendix C-l). Data generated during the Pumping Test Program hasbeen incorporated into the groundwater flow modeling. The Groundwater Flow ModelingProgram is presented in the following section.
2049-001-290 4-1

5.0 MODELING REPORT
5.1 INTRODUCTION
The Feasibility Study for the Lemberger Sites recommended pump and treat as theremedial action for contaminated groundwater. To accomplish the goals of the remediation,groundwater extraction wells will have to be located and operated in such a way as tocapture all of the contaminated groundwater. The efficiency of the cleanup will dependupon the locations and operating parameters selected for the wells. To aid in the selectionof these design criteria, a three dimensional mathematical groundwater flow model of thestudy area was constructed. The model was used to evaluate potential locations andpumping rates to establish efficient capture zones, and to evaluate the effects of thisremedial action upon ground and surface water.
52 STUDY AREA HYDROGEOLOGY
The limits of the study area were defined primarily by the occurrence of naturalgroundwater boundaries. These are the Branch River in the northwest, where groundwaterdischarges to surface water, and the groundwater divide along the ridgeline in the east andsouth, which is an important area for recharge to the bedrock. The study area limits areshown on Figure 5-1. The area wholly contains the landfill sites and the contaminantplumes.
52.1 Geologic UnitsThe lowermost unit of interest to this study is the uppermost 30 to 80 feet of the
Niagara Limestone. This is the deepest unit exhibiting contaminants in the groundwater.Overlying the limestone are an outwash sand and gravel unit (the LGU), a clay till unit (theCU), and locally a unit of combined glacio-lacustrine and glacio-fluvial deposits (the UGU).A generalized geologic column for the study area is shown if Figure 5-2. The units aredescribed in detail in the RI Report.
The study area is underlain by a buried glacial bedrock valley whose southeasternvalley wall rises to form the bedrock ridge at the east and south edges of the area (Figure5-3). The valley has been filled with glacial deposits as shown in Figure 5-2. The actual
2049-001-290 5-1

relationships of the units at specific locations are shown in cross-sections A-A' through D-D'(Plate 5-1). Most of the glacial sediments fill the broad, flat bedrock valley, and are moreor less flat hying. Along the valley wall, however, where the bedrock forms the topographicridgeline, the sediments follow the slope of the wall and in some cases pinch out at thehigher elevations. This is particularly evident at the south end of cross-section A-A', nearthe LTR site.
5.2.2 Groundwater FlowTwo aquifers are found in the study area. The regional aquifer, known locally as the
Lower Groundwater System (LGS) consists of the bedrock and the overlying sand andgravel unit (the LGU, or Lower Granular Unit). A perched aquifer locally occurs in theUGU (Upper Granular Unit). The approximate extent of the perched aquifer is shown inFigure 5-4. The regional aquifer occurs beneath the entire study area.
Groundwater elevation contours for data from 1990 in the regional aquifer areshown in Figure 5-5. Groundwater flow is from the divide along the ridgeline in the eastand south toward the Branch River in the northwest. Because of the L-shaped configurationof the ridge and its orientation with respect to the river, the direction of groundwater flowvaries locally depending upon the location within the study area. Generally, flow directionlies between westward and northward, but a small reentrant valley in the side of the bedrockridge beneath the Ridgeview Landfill (Figure 5-6) results in a local flow direction to thesouthwest. This can be seen in the map of water level elevations (Figure 5-5).
The water table in the regional aquifer is found in the bedrock beneath theridgelines in the east and south. As the wall of the bedrock valley slopes downward awayfrom the ridge, the glacial sediments occur at lower and lower elevations until the watertable is found within the LGU. Still further from the ridge, the top of the LGU slopesfurther downward, with the result that the water table is found in the overlying clay till (theCohesive Unit, or CU). This results in a transition from unconfined to confined conditionsas one moves across the site from the southeast to northwest. This can be seen most clearlyon cross section A-A' on Plate 5-1, as well as in several other cross sections. Figure 5-7shows the approximate locations where the water table is found in the bedrock and in theglacial sediments, and where conditions transition from unconfined to confined.
Because of these widely varying conditions, the pattern of groundwater flow iscomplex. Most of the recharge occurs along the ridgeline, where the layer of relatively
2049-001-290 5-2
impermeable day till is thinnest, or even absent. This mounds the water table beneath theridge, forming the groundwater divide. Lateral flow is then towards the river, as shown inFigure 5-5. However, in the vicinity of the valley wall, groundwater flows laterally from thebedrock into the LGU. Even though vertical gradients are generally downward in the LGUand bedrock, the unusual geometry of the LGU along the face of the bedrock valley wall(cross section A-A') results in recharge to the LGU from the bedrock along the edge of theridgeline (the "Water Table in LGU" line in Figure 5-7).
The vertical gradient between the bedrock and the LGU is upward in the vicinity ofwell RM-5D. This is the result of the highly permeable sediments filling the reentrant valleyat this location (Figure 5-6). Because the sand and gravel is incised into the rock at thislocation, it performs similarly to a french drain. Their relatively high permeability reducesthe head in the sediments, inducing a flow from the higher heads in .the surrounding rock.There is also an upward gradient in the vicinity of well RM-2D. This appears to be relatedto ihe occurrence of a 6-foot layer of sandy clay between the LGU and the bedrock, whichlocally restricts communication between the two units. As a result, the heads reflectconditions in each unit independently, rather than the combined effects of interactionsbetween them.
The perched aquifer occurs in the UGU. The approximate extent of the aquifer isshown in Figure 5-4. The aquifer is drained by two wetlands along its western margin.Therefore flow is from the northern, eastern, and southern portions of the aquifer towardsthe western margin. The general flow pattern is shown in Figure 5-8.
While investigations during the RI describe the UGU as a single unit with severallithologies (silt to silty sand to sand and gravel), adjacent investigations conducted by theRidgeview Landfill describe two separate units along the flank of the ridge. The lower unitis the UGU as described in the RI, which is primarily a glacial lake deposit. The upper unitis a sand of outwash and possibly colluvial origin, separated from the lower unit by a layerof clay. Groundwater occurs in both units, but the details of the relationships between thetwo units at the base of the ridge, where they appear to combine, have not been determined.Ridgeview has determined that their operations have affected the groundwater quality inthe upper unit, and has installed a groundwater collection trench in that unit at the base ofthe ridge. The trench does not extend into the lower unit, which is the primary unit overthe extent of the aquifer.
204*401-290 5-3

Recharge to the perched aquifer is primarily from direct infiltration. Groundwa-ter flow is complicated by the presence of the Lemberger Landfill, which was excavatedbeneath the water table in some locations. The landfill also abuts the larger wetland thatdrains the aquifer. The waste within the landfill is now part of the aquifer, and groundwaterflows through the waste to the discharge area in the wetlands.
There appears to be little, if any, vertical communication with the regional aquifer.Water levels in the two aquifers differ by 30 to 40 feet. There is an unsaturated zone of asmuch as 7 feet of sand and gravel at the top of the LGU. At well RM-5S, laboratorypermeability analyses of clay till samples reported a hydraulic conductivity of 7.7 x 10* cm/s.There is the potential for some movement along fractures in the till, but fractures identifiedin boring samples were limited to the upper portion of the till, and did not penetrate thefull thickness of the unit. In any event, there is insufficient groundwater flux through thetill to saturate the upper portion of the LGU. There is no evidence of a mounding effectthat would be indicative of recharge from the UGU to the LGU. Consequently, verticalflow between the aquifers appears negligible.
523 Contaminant MigrationGroundwater contaminants include a list of 30 organic and inorganic compounds and
metals. A list of the contaminants of concern is included in Table 5-1. At LTR, liquids andsludges were discharged into trenches excavated to, or close to, the bedrock. Other trenchesreceived drummed wastes. Contaminants migrated vertically through the unsaturated partof the bedrock and reached the water table. At the water table contaminants began tomigrate laterally as well as vertically with the groundwater flow. Following the groundwaterflow paths, some contaminants migrated deeper into the bedrock and developed acontaminant plume in the rock beneath the buried valley. Closer to the valley wall, somecontaminants followed groundwater flow through the face of the valley wall and into thesands and gravels of the LGU. This resulted in a plume in the LGU similar to, but separatefrom, the plume in the bedrock. However, since vertical communication between the LGUand bedrock is generally unimpeded, the two plumes appear to have intermingled and havethe same general distribution. The extent of the combined plume in the regional aquifer,as reported in the FS, is shown in Figure 5-9.
The perched aquifer discharges to the wetlands, so migration is from the outerportions of the aquifer toward the wetlands. Since the Lemberger Landfill is adjacent to
20494)01-290 5-4

the larger wetlands, migration is generally from the Landfill to the wetlands with h'ttlelikelihood of up-gradient migration. Migration in the perched aquifer from the LTR siteis directed toward the smaller wetlands near the LTR site. The FS took a conservativeapproach to the plume extent, including almost all of the aquifer. The extent of the plumein the perched aquifer, as presented in the FS, is shown in Figure 5-10.
As discussed in Section 5.2.2, there appears to be little or no flow between theperched and regional aquifers. Consequently, there is little or no migration between thetwo.
53 MODELING
The U.S.G.S. Modular Three-Dimensional Finite-Difference Groundwater FlowModel (MODFLOW) was used to simulate groundwater flow in the study area.MODFLOW simulates flow in three dimensions and accounts for unsteady-state, non-homogeneous, and anisotropic flow conditions. The program consists of a Main Programand a series of independent subroutines called "modules," that are grouped into packageswhich represent specific hydrologic features to be simulated (such as rivers, drains, wells,area! recharge, evapotranspiration) and specific solution techniques for solving linearequations which describe the flow system (such as the strongly implicit procedure or slice-successive overrelaxation).
The modular nature of the program allows the user to study specific hydrologicfeatures of the model independently and is designed to permit flexibility in the input of dataand output of results. Groundwater flow within the aquifer is simulated by using a block-centered finite-difference approach. Layers can be simulated as confined, unconfined, ora combination of both. The physical aquifer system is divided into a three-dimension gridcomposed of rows, columns, and vertical layers. Rows and columns have length and widthdimensions, as well as a thickness in the vertical dimension. At the intersection of anycolumn and row is a grid cell which is supplied with an initial condition or boundarycondition and other parametric data. After the simulation the values of the heads 17 eachof these cells are given as output. The implementation of the model is explained in detailin Chapter Al, Book 6 of the Techniques of Water-Resources Investigations of the UnitedStates Geological Survey (McDonald and Harbaugh, 1988).
2049-001-290 5-5

Because the perched aquifer and regional aquifer have little or no interaction, theyhave been modeled separately. The separation of the aquifers was justified based on theconceptual model of the hydrogeology described in Section 5.2.
53.1 ObjectivesThe model of the regional aquifer had two objectives: the development of design
criteria for the groundwater extraction system, and the evaluation of the infiltration galleryscenario for the discharge of treated water. The design criteria included the number ofextraction wells, the location of the wells, and the pumping rates at which each well wouldbe operated. To evaluate the success of the extraction well scenarios in achieving their goal,the primary criterion was the capture, within the zones of influence of the well network, ofthe regional aquifer contaminant plume as depicted in Figure 5-9. Secondary criteria werethe minimization of the discharge rates required at each well, and the selection of locationsthat would minimize cultural disruptions during construction and operation.
The infiltration gallery scenario required the regional aquifer to accept 3.6 mgd oftreated water within the limits of the infiltration structure. The model was used to predictthe heads in the aquifer that would result from this facility. The criteria for a successfulscenario were to keep the heads beneath the top of the aquifer, and to minimizeinterference with the successful performance of the extraction system.
The objectives of the separate model of the perched aquifer were to evaluate theeffects of the slurry wall upon the water levels in the wetlands, and to evaluate the effectsof groundwater extraction from the perched aquifer upon the wetlands. The primarycriterion for the evaluation was the predicted water levels in the wetlands and in theunderlying aquifer sediments.
53.2 Regional Aquifer Model532.1 Parameter SelectionThe model encompassed the study area shown in Figure 5-1. Boundary conditions
were the Branch River in the northwest and the groundwater divide in the east and south.The study area was extended sufficiently in the southwest and northeast that the use ofdefault no-flow boundaries at the model edges would not have an effect on the area ofinterest near the center of the model
2049-001-290 5-6

The Branch River was modeled using constant head boundary conditions along theriver valley. The head in each river cell was estimated using the river elevations shown onthe 1978 edition of the Whitelaw 7.5-minute topographic quadrangle. The trace of thegroundwater divide was based on interpretive contours of the 1990 water level data in thebedrock, as presented in the RI. Cells outside of the study area boundaries were definedas no-flow cells. Layer 1, representing the LGU, pinched out on the flanks of the bedrockridgeline. No-flow cells were used to exclude layer 1 cells that did not contain the LGU.These relationships resulted in layer 1 having a smaller area! extent than layer 2.
The regional aquifer was modeled as two layers, representing the bedrock unit andthe sand and gravel unit. Both layers transition from confined to unconfined conditions inthe study area, so the top and bottom elevations of the layers were used as input to themodel The tops of both units were contoured based on boring and well log data containedin the RI Report, and the results were translated into elevation data for the model. The topof the bedrock unit was used to define the bottom of the sand and gravel unit. The bottomof the bedrock unit was arbitrarily defined at elevation 655. In order to accommodate therapid rate of elevation change in some areas, a cell dimension of 100 ft by 100 ft wasselected. This resulted in an overall grid of 80 columns by 130 rows with uniform spacing.
Hydraulic conductivities for both layers were initially based on the field testingresults reported in the RI. Because of the inaccuracy inherent in slug and packer tests, aswell as the fact that these data are point measurements while the model simulates bulkconditions over the entire cell volume, these data were assumed to be approximate andhydraulic conductivity was manipulated during the calibration of the model.
Recharge in the Wisconsin portion of the Lake Michigan Basin is reported by theU.S.G.S. to be approximately 1 inch per year. This value was used as the overall "baseline"recharge to the study area. The bedrock ridge to the east and south of the study area wasassumed to be an area of greater local recharge due to the thinner layer of day till over thebedrock, the proximity of the bedrock to the surface, and the assumption of a greater degreeof weathering in the bedrock along this feature. Recharge was manipulated along the ridgesto help reproduce the configuration of the water table during calibration.
Leakance was calculated by the model using an input value for vertical hydraulicconductivity. The value was selected in the range of 10 to 20 percent of the horizontalhydraulic conductivity, which is typical for sediments of glacial origin. In the vicinity of wellnest RM-2, the boring log indicates a day layer between the sand and gravel layer and the
2049-001-290 5-7

bedrock layer. This clay layer was simulated by locally reducing the leakance by threeorders of magnitude.
The evapotranspiration module was not used. Since all model runs would be steadystate, the storage module was not used. The preconditioned conjugate gradient matrixalgebra solver (PCG) was selected, since this method is best suited for models with complexgeometry (Kuiper, 1987). The convergence criterion was set at 0.0001 ft of head variance.
5322 CalibrationThe regional aquifer model was calibrated to the 1990 water level data reported in
the RI. These were static water levels under non-pumping conditions. The RM-series wellswere selected as calibration targets. Since water levels varied by 70 ft across the model, andsince the wells were point head data and the model calculated average heads over a cellvolume, a target variance of +/- 2.0 feet was selected as the calibration criterion.
Table 5-2 shows the calibration targets, the predicted water levels, and the variances.Except for the well nest at RM-1, all wells are within the calibration criterion. Repeatedtrials with varying local conditions in the vicinity of RM-1 had no effect upon the modelwater levels at this location. Only during the sensitivity analysis, when parameter and headchanges were model-wide, did any effects appear, and these were small compared to theeffects over the rest of the model. Consequently, the model was accepted with these twopoints approximately 10 percent over the calibration criterion.
A contour map of the predicted water levels is shown in Figure 5-11. It compareswell with the map of actual conditions in Figure 5-5, showing the same general configurationand flow patterns, and many of the same details including the effects of the reentrant valleyin the side of the bedrock ridge. The raw model output is included in Appendix D-l.
The model was also calibrated to a pumping test conducted in May of 1993. Thedetails of the test are presented in Section 4.0. The pumping test was limited to a maximumdischarge of 25 gpm by the constraints of the available treatment system for the discharge.The pumping test generated 2 feet of drawdown in the pumping well, and 0.2 feet ofdrawdown in an observation well 50 feet away. Simulation of the pumping test predicteda drawdown of 2.6 feet in the cell containing the pumping well. Based on this result, noadditional adjustment was made to the model
2049401-290 5-8

53.2.3 Sensitivity AnalysisThree parameters were varied, one at a time, for the sensitivity analysis recharge:
hydraulic conductivity and leakance. The results are presented in Table 5-3. Increasingrecharge by a factor of 10 produced the greatest effects upon the model, with head changein some cells in excess of 200 feet. The greatest changes were in the extreme southeasterncorner, at well RM-11D. In the central area of the model, the changes were moremoderate, on the order of 20 feet. At the northern end of the model, at well nest RM-1,the change in head from the calibration scenario was less than 2 feet.
Decreasing recharge by a factor of 10 produced effects of much lesser magnitude,with a maximum change of about 37 feet at well RM-1 ID. In the central portion of themodel, changes were on the order of several feet. At well nest RM-1, predicted water levelschanged 0.1 feet from the calibration scenario.
Reducing hydraulic conductivity by a factor of 10 had effects similar to increasingrecharge, with head changes in excess of 200 feet at RM-1 ID. The magnitude of thechanges declines northward, being on the order of 20 feet in the central portion and about1 to 2 feet in the north.
Increasing hydraulic conductivity had effects similar to reducing recharge, with amaximum head change of about 37 feet at well RM11-D. The magnitude of head changesdropped off to the north, on the order of several feet in the central portion and 0.2 feet atwell nest RM-1 in the north.
Changes in leakance had little effect upon the model Whether leakance wasincreased or decreased by a factor of 10, changes were so small that the model stayed withinthe acceptable variance for the calibration targets at almost all wells. For leakance reducedby a factor of 10, well RM-2I developed a variance of 2.11 feet (compared to 1.91 duringcalibration). Wells RM-1I and RM-1D were unchanged from the variances they developedduring the calibration scenario.
The sensitivity of the model in the southeastern area is due to the simulation of arecharge zone along the groundwater divide. With heads at the discharge area of the modelfixed by the constant head boundary simulating the river, small parameter changes in therecharge area generate large effects. These effects lessen with distance from the rechargearea. Also, the recharge area is adjacent to no flow boundary cells. Head changes in therecharge zone are magnified by the image well effects of the boundary.
2049401-290 5-9

The lesser sensitivity of the model in the northwestern area is due to the stabilizingeffects of the constant heads at the river. This can be seen in the responses of wells RM-1Iand RM-1D to the sensitivity analysis. The wells in the central portion of the model showincreasing sensitivity with distance from the river, and proximity to the recharge zone.
Overall confidence in the model is high. Many runs were made with simplifyingassumptions about the distribution of hydraulic conductivities, but only when theconductivity pattern was detailed enough to approximate the data from the slug tests, packertests and pumping test did the model produce a pattern of head distribution thatapproximated the historic head data. Most of the model uses a recharge value thatapproximates the recharge reported in the hydrologic atlas for the regional watershed (1inch per year). In the recharge area along the eastern boundary of the model (in layer 2)the recharge and hydraulic conductivity values were manipulated to produce the historicwater levels. While this was justified by assuming increased mechanical weathering andbetter hydraulic connection with the surface in this area, this is supported only by qualitativedata such as the observation of rock weathering at road cuts and the generally thinner coverof unconsolidated sediments. No quantitative data (except at well RM-11D) were availableto establish values in these areas. Consequently, while hydraulic conductivity and rechargewere manipulated to produce historic water levels in this area, there is less confidence herethan in the majority of the model that the combinations of values are representative of fieldconditions. However, this zone of reduced confidence is limited to a narrow band along theeastern edge of the model Virtually all of the remedial activities simulated by use of themodel are located in the central portion of the model, where the confidence is the highest.
532.4 Extraction Well ScenarioThe extraction well scenario consists of three pumping well locations: the pumping
test site, near the wye junction of Reifs Mills Road, and near well RM-10D. The locationsare shown in Figure 5-12. The predicted effects of the pumping wells on the bedrock areshown in Figure 5-13, and on the LGU in Figure 5-14. Well EW-1 represents the pumpingtest well, screened in the bedrock, and pumped at 100 gpm. Its capture zone in the bedrockis predicted to include the LTR site, where the highest contaminant concentrations arefound (Figure 5-13). This would serve to contain the contaminant "hot spots" in a limitedarea, both protecting the down-gradient aquifer and reducing the time required to removethe contaminants as compared to a well located further away. Because of the high degree
20494)01-290 5-10

of connection between the bedrock and the LGU at this location, well EW-1 is predicted togenerate a capture zone in LGU (Figure 5-14). The effects are predicted to be sufficientto contain the area where contaminants from LTR in the bedrock move through fracturesin the face of the bedrock valley wall and into the LGU. As a result, this well is predictedto contain and cleanup the major source of contaminants to the regional aquifer. It is alsoa cost-effective and efficient installation, since it uses an existing well located at the site ofthe treatment facility.
Well location EW-2 is at the wye junction of Reifs Mills Road, about 1500 feet eastof well nest RM-2 (Figure 5-12). Location EW-2 was modeled as two separate wells, onescreened in the bedrock and one screened in the LGU. Each well had a simulated pumpingrate of 50 gpm, for a combined discharge of 100 gpm from this location. This well nest ispredicted to capture the central part of the plume in both aquifers, leaving only thenorthernmost tip of the plume unremediated. The plume in the northernmost area is basedon data in the RI from well RM-10D, and onty occurs in the bedrock. Well EW-3 wassimulated adjacent to RM-10D to capture this northernmost part of the plume. It wasscreened in the bedrock, and pumped at a simulated 25 gpm. The model predicts that thiswill extend the capture zone of the well network to include RM-10D and all but the verynorthernmost edge of the plume depiction, which is actually an indistinct boundary (Figure5-13). The raw model output is included in Appendix D-2. The simulation of wells at thesethree locations, at these simulated pumping rates, are predicted to create a capture zonethat encompasses virtually all of the contaminant plume. These locations can also beefficiently served by collection pipelines following road rights-of-way and property lines.This minimizes the disruption of agricultural activities during construction, as well aspotential long-term damage to agricultural fields.
The confidence level for this simulation is high. The remedial activities simulatedat locations EW-1 and EW-2 lie within the central portion of the model, where boundaryeffects are minimal and confidence in the model parameters is high. Location EW-3 liesnear a no flow boundary. The drawdown simulated at EW-3 is probably affected by theimage well properties of the boundary, resulting in a greater predicted drawdown than maybe achieved in the field. Since the no flow boundary in the model represents a groundwaterdivide, the field effects of a well pumping at location EW-3 may be to cause the divide tomove further east in response to the pumping. The model does not simulate this. Theresult would likely be a smaller drawdown, and a reduction in the size of the capture zone.
2049401-290 5-11

However, even a reduced capture zone would still include the contaminants at well RM-10D,which is the primary goal of location EW-3.
Infiltration Gallery ScenarioThe infiltration gallery scenario is based on the use of engineered infiltration
structures installed in an unsaturated portion of the LGU to accept the discharge from thetreatment facility. The facility concept uses the fact that the LGU is in hydraulic connectionwith the bedrock to provide for vertical flow of the water from the infiltration structuresthrough the LGU and bedrock to the water table located in the bedrock. It requires thatthe facility be located in the portion of the LGU that is above the water table. This occurswhere the LGU is found on the slope of the bedrock valley wall, but also means that theLGU is in the process of pinching out as it occurs further up the slope. This limits the setof conditions acceptable for facility operation. The only suitable location for this facility,where the LGU is both unsaturated and relatively shallow, is the area adjacent and to thesouth of the Lemberger Landfill (Figure 5-15). Investigations during 1993 verified theoccurrence of unsaturated conditions and provided hydraulic conductivity data for the inputto the model (Section 14.0). The results of the extraction scenario simulations resulted ina target discharge of 250 gpm (0.36 mgd). Assuming a conservative discharge rate for thestructures of 1 gpd/ft2, each 100 ft by 100 ft cell would receive 10,000 gpd. This required36 cells, or a little over 8 acres, to accommodate the discharge.
The gallery was simulated by an array of wells located just south of the LembergerLandfill A well was placed in the LGU in each of the 36 cells and each well discharged10,000 gpd into the sand and gravel layer. The model simulated the flow from the galleryto the bedrock, and predicted the size and shape of the mound that would result. This isshown in each aquifer in Figures 5-16 and 5-17. Raw model output is included in AppendixD-3.
The model predicted heads in the bedrock in the range of 816 to 825 ft, which wouldkeep the head near or below the top of the bedrock. The model predicted heads in therange of 817 to 835 in the LGU, with the highest heads at the eastern end of the facility.While the lower predicted heads remain below the top of the LGU, the predicted heads atthe extreme eastern end appear to be about at the top. This is an artifact of locating theeastern end of the facility against the no-flow boundary of Layer 1, which causes an increasein head as if there were an image well across the boundary. Since the actual location of this
2049-001-290 5-12

boundary is approximate, the heads in the facility cells should be lower and this scenariorepresents the smallest area that should be considered for the facility.
In layer 2, the bedrock, the gallery is located about 2000 feet from the nearestboundary, and the water levels show little or no boundary effects. The infiltration galleryis predicted to have positive effects on the capture zones of the extraction well scenario.The creation of a groundwater mound at this location would establish a barrier to migration,and redirect groundwater flow from the contaminated area near LTR more directly towardthe extraction well at EW-1 (Figure 5-16 and 5-17). The mound is also predicted to increasethe gradient between the mound and the extraction well, which would accelerate the rateof migration of contaminants from the area of the mound to the extraction well This wouldcontribute to a more rapid cleanup of the area affected by the mound.
533 Perched Aquifer Model533.1 Parameter SelectionThe model encompassed the area shown in Figure 5-4 as the extent of the perched
aquifer. The model used a uniform cell dimension of 100 ft by 100 ft, resulting in a grid of50 cells by 70 cells. No flow boundaries were used to outline the aquifer and exclude cellsthat were outside of the area shown in Figure 5-4. One layer was used.
Groundwater flow in the perched aquifer discharges to two wetlands along thewestern margin of the aquifer. The extents of these wetlands were mapped during 1993, anddetails are provided in Section 8.0. The outlines of the wetlands as mapped are shown inFigure 5-4. These outlines were used to define the wetlands in the model Wetlands weresimulated using the drain module of MODFLOW. Drain elevations were set at 830.0 ft,which represents the approximate lowest elevation of the wetlands as mapped during theactivities discussed in Section 8.0. This also kept the drain elevation 5 feet above thebottom of the aquifer, which would allow the drains to potentially go dry during simulations.The drain conductance was set at 1000 ft2/d. This was estimated by assuming a hydraulicconductivity for the wetland sediments of 1 ft/d and a thickness of wetland deposits of 10feet, within a cell dimension of 100 ft by 100 ft.
The bottom elevations of the aquifer were based on data from boring logs in the RIReport, boring and test pit logs in other Lemberger Site reports, boring logs in reports forthe Ridgeview Landfill, boring logs from investigations carried out as part of the Additional
2049-001-290 5-13

Studies activities (Sections 2.0, 13.0, and 14.0) and the general topography of the area.Since unconfined conditions were simulated, aquifer top elevations were not required.
Hydraulic conductivity was estimated based on several slug tests conducted duringthe RI. Recharge was initially estimated at the regional watershed average of 0.0002 ft/d.Both parameters were manipulated during calibration to reproduce observed aquifer heads.In the area of the Lemberger Landfill, the waste was considered to be part of the aquifer.No field data were available for hydraulic conductivity of waste and recharge through thelandfill cover, so these parameters were manipulated until the pattern of the water levelsin the waste approximated the pattern observed during investigations in 1993 (Sections 2.0and 3.0).
The evapotranspiration module was not used. With only one layer, the leakancemodule was not used. Since all model runs would be steady state, the storage module wasnot used. The strongly implicit procedure (SIP) module was used for the matrix algebrasolver. The convergence criterion was set at 0.0001 ft of head variance.
5.33.2 CalibrationThe perched aquifer model was calibrated to the 1990 water level data reported in
the RI. The RM-Series wells were selected as calibration targets. Since the wells werepoint head data and the model calculated average heads over a cell volume, a targetvariance of +/• 2.0 feet was selected as the calibration criterion. Additionally, qualitativecriteria were selected, including the reproduction of the pattern of water levels found in thewaste during the 1993 investigations, the development of a saturated zone throughout theaquifer (except at elevation extremes), establishment of the water table at a lower elevationthan the ground surface, and the development of a dry zone near well RM-8D. The criteriawere met. Table 5-4 shows the head variance for the calibration run. All are within + /-2.0 feet of the targets. The target for the cell at well RM-8D was taken as the elevation ofthe bottom of the aquifer (837.48 ft). Well RM-8D is located at the western edge of thecell, and the cell immediately adjacent to the west was dry in the calibration run. Althoughthe average head over the cell containing well RM-8D was 838.7 ft, at the well location theaquifer could be dry. A contour map of the data (Figure 5-18) using MODGRID andSURFER shows well RM-8D to be on the edge of a dry area. Of numerous trials, this runbest satisfied the calibration criteria.
2049401-290 5-14

Figure 5-18 shows a contour map of the water levels predicted by the calibration run.This shows many of the qualitative criteria, including water levels in the Lemberger Landfillthat approximate those found in 1993 (Sections 2.0 and 13.0), and the dry area near WellRM-8D. 1993 data were not used as quantitative targets because of the long time spanbetween these and the 1990 data. The model predicted overall flow patterns consistent withthe conceptual model shown in Figure 5-8.
The model predicted the flow in each cell of the drains used to simulate thewetlands. The sum of the flows predicted in the 82 individual drains making up thenorthern wetlands (adjacent to Lemberger Landfill) is approximately 29,916 cu ft/d. Thesum of the flows predicted in the 39 individual drains simulating the southern wetlands(north of LTR) is approximately 18,217 cu ft/d. These flows will be used as a baseline forevaluating the hydraulic effects of remedial activities upon the wetlands. The raw modeloutput for the calibration run is included in Appendix EM.
5333 Sensitivity AnalysisThree parameters were varied, one at a time, for the sensitivity analysis: hydraulic
conductivity, recharge, and drain conductance. The results are presented in Table 5-5. Themodel would not run with hydraulic conductivities increased by a factor of 10. Thisgenerated an integer overflow/divide by zero error. When hydraulic conductivities weredecreased by a factor of 10, water levels rose between 10 and 40 feet. A similar changeresulted when recharge was increased by a factor of 10. Decreasing recharge by a factor of10 resulted in head changes from 0.2 to about 8 feet. Decreasing drain conductance resultedin changes between 1 and 5 feet. Increasing drain conductance resulted in changes of lessthan 1 foot, and kept the variances within the calibration criterion.
5.3.3.4 Remedial Action ScenariosThe remedial action will include several components, including the cap and slurry
wall, and groundwater extraction at several potential locations. The cap and slurry wall willbe evaluated first, and since it will be a component of the final action it will be used as thebaseline condition for evaluating potential extraction options. After evaluating individualextraction systems, several components will be selected to form a complete remedial actionscenario, and the combined effects of the complete remedial action will be evaluated(Section 533.5).
2049-001-290 5-15

53.3.4.1 Slurry Wall and Cap ScenarioThe slurry wall and cap scenario assumes that the engineered structures remove all
groundwater flow and recharge through the area surrounded by the slurry wall. This wassimulated by creating noflow boundaries in all cells within the area surrounded by the slurrywall. This area is shown in Figure 5-19. The model was run with no other changes fromthe calibration scenario. Figure 5-19 shows the heads predicted by the model. There is littlechange in the northern portion of the model, since most of the groundwater from this areaflows past the landfill to the north of the landfill limits, and discharges to the wetlandsnorthwest of the fill. There is also little effect upon the southernmost portion of the model,at LTR. In the central portion, a substantial part of the aquifer has been removed by theslurry wall and cap, removing a source of flow into the down-gradient portion of the model.South of the landfill, the dry area near well RM-8D has enlarged. .
The raw model output is included in Appendix D-5. The sums of the flows in theindividual drains show reductions of 15,838 cu ft/d in the flow through the northern wetland,and 6856 cu ft/d in the flow through the southern wetland.
In the northern wetland, the greatest drawdowns are predicted to be along thenorthern, eastern and southern edges, with a predicted maximum of about 2.2 feet in theeast central area adjacent to the Landfill. To the north and south, drawdowns along theedge are predicted in the range of 0.5 ft to 1.0 ft. The cells adjacent to the edge cells showpredicted drawdowns on the order of 0.1 to 0.2 feet, and the interior of the wetlands ispredicted to have 0.01 ft or less of drawdown.
In the southern wetland, the greatest drawdown is predicted at the northeast cornerof the main body of the wetland, reaching about 1 ft. This is predicted to decline southward,reaching about 0.03 ft at the southeast corner. The northern arm of the wetlands ispredicted to decline by 0.1 to 0.9 ft, with the greatest fall at the extreme northeast portion,closest to the slurry wall The central portion of the wetland is predicted to fall by 0.2 to0.1 feet, and the southwestern portion is predicted to be least affected with drawdowns ofless than 0.01 ft.
53.3.4.2 One Extraction Well Near RM-7 ScenarioOne extraction well located in the vicinity of well RM-7S was simulated. At a
pumping rate of 5 gpm, the water level predicted in the cell containing the well (834.8 ft)was within 3 feet of the bottom of the aquifer (832 ft) as indicated on the boring log. The
2049401-290 5-16

well created a small capture zone that was insufficient to intercept the entire LTR site. Thewater level contours are shown in Figure 5-20, and the raw model output is included inAppendix D-6.
53.3.4.3 Extraction Well Network ScenarioFour extraction wells located as shown in Figure 5-21 were simulated. Each well was
pumped at a simulated 5 gpm. Figure 5-22 shows the head distribution predicted by themodel in the immediate vicinity of the wells. The easternmost well has gone dry.Comparison of predicted drawdowns with the elevation of the base of the aquifer shown onthe boring log for RM-7XD indicates that the other wells will also have gone dry (bottomelevations in the model are not represented with that level of detail, and so the model doesnot show these wells as dry). There is some question as to whether this scenario wouldadequately intercept flows from LTR.
533.4.4 French Drain at LTR ScenarioA french drain at the northern edge of LTR from well RM-7 in the west to the
eastern boundary of LTR was simulated (Figure 5-23). The drain is predicted to interceptthe flow from LTR (Figure 5-24), and to discharge at about 24 gpm. The drain, combinedwith the slurry wall, is predicted to cause drawdowns in the southern wetland ranging fromabout 1.3 ft to less than 0.01 feet. The raw model output is included in Appendix D-8.Most of the drawdown in the wetland occurs around the edges of the feature, while in thecenter there is little change. The flow through the wetland is reduced by about 4620 cu ft/d.
53.3.4.5 French Drain Near MW-10 ScenarioA french drain in the vicinity of well MW-10 was simulated. The location is shown
is Figure 5-25. The drain is predicted to affect the water levels in the north wetland asshown by the contours in Figure 5-25, with predicted drawdowns of almost 2 feet at thesouthern portion of the wetland. The raw model output is included in Appendix D-9. Thesimulation predicts that the drain would collect all of the contaminated water in the vicinityof well MW-10.
2049-001-290 5-17

533.4.6 Extraction Well Near MW-10 ScenarioA well pumping at 3 gpm near MW-10 was simulated. The heads predicted by the
model (Figure 5-26) indicate that the contaminated groundwater in the vicinity of well MW-10 would be intercepted. The raw model output is included in Appendix D-10. The modelpredicts minor impacts to the wetlands, with a reduction in flow of 349 cu ft/d, andmaximum drawdowns of 0.2 to 0.3 feet at the southern edge of the wetland dropping off toless than 0.01 ft over most of the wetland.
533.4.7 Extraction Well Near RM-5SA well pumping at 25 gpm near well RM-5S was simulated. The heads predicted by
the model (Figure 5-27) indicate that this well would have a small capture zone, affectingonly the immediate vicinity. The model predicts that the water level would be drawn downto within 3.5 feet of the aquifer bottom, indicating that this is about the maximum pumpingrate that could be applied at this cell The raw model output is included in Appendix D-ll.
This scenario predicts a reduction in flow to the wetlands of about 4812 cu ft/d. Itgenerates a maximum predicted drawdown in the wetland of about 1.4 feet in thenortheastern portion, which drops off to 0.2 to 0.4 ft further into the wetland, falling below0.05 ft in the central and southern portions.
533.4.8 French Drain North of LLA french drain at the location shown in Figure 5-28 was simulated. The predicted
heads are shown in Figure 5-29. The raw model output is included in Appendix D-12. Thedrain is predicted to intercept much of the flow north of LL, discharging at 55 gpm. It ispredicted to reduce the flow through the wetlands by 10,633 cu ft/d. The drawdown beneaththe wetlands is predicted to be as much as 3.4 feet in the northern extremes, dropping offto the range of 0.5 to 1.0 feet in the northern hah7. Drawdowns of as much as 1.5 feet arepredicted to occur around the edges of the southern half of the wetland, with drawdownsof 0.1 to 0.3 feet over most of the remainder.
533.5 Recommended Remedial Action ScenarioThe recommended remedial action scenario for the perched aquifer is the isolation
of the source at LL by the installation of a slurry wall and cap; combined with theinstallation of an extraction well near MW-10, pumping at 3 gpm; combined with a french
2049401-290 5-18

drain along the northern edge of LTR. These features are shown in Figure 5-30. In viewof the magnitude of the predicted hydraulic impacts upon the wetland by extractionscenarios around well RM-SS, the isolation of the source of the contaminants at this locationappears to be the best approach to remediating contaminants in this area.
A model run simulated the effects of these combined features. The heads predictedby the model are shown in Figure 5-31. The raw model output is included in Appendix D-13. With the isolation of the source at LL, the extraction well near MW-10 is predicted tointercept the contaminated groundwater in the immediate vicinity. The french drain at LTRis predicted to intercept all of the groundwater discharging from LTR in the perchedaquifer.
Virtually all of the effects on the northern wetland are predicted to be due to theslurry wall and cap. Drawdown extremes beneath the wetland are predicted to range fromabout 0.5 to 1.0 ft along the north and south edges to about 2.2 feet along the east centraledge. Drawdowns are predicted to drop off toward the center of the wetland, falling below0.01 ft. The flow through the wetland is predicted to be reduced by about 16500 cu ft/dOf this, less than 350 cu ft/d is predicted to be attributable to the extraction well near MW-10.
The model predicted that the flow to the southern wetlands will be reduced by about11,650 cu ft/d. Of this, about 6850 cu ft/d is predicted to be attributable to the slurry walland cap, 4570 cu ft/d to the LTR drain, and 230 cu ft/d to the extraction well near MW-10.The heads at the northernmost portion of the wetland are predicted to decline by 0.4 to 1.1feet. Along the eastern edge of the main portion of the wetland, the maximum drawdownis predicted to be about 1.4 feet at the northeastern corner. Drawdowns are predicted todecline to the south and west, reaching 0.5 ft at the southeastern corner and 0.1 at thesouthwestern corner. Drawdowns also drop off toward the central and western portions ofthe wetlands, falling below 0.05 feet.
5.4 CONCLUSIONS AND RECOMMENDATIONS
The model indicates that three extraction well locations should be adequate toremediate the ground water plume in the regional aquifer, located as shown in Figure 5-12.Well Location EW-1 is at the existing pumping test well, screened in the bedrock. At asimulated pumping rate of 100 gpm the well is predicted to capture the plume originating
2049-001-290 5-19

at LTR in both the bedrock and the LGU. At location EW-2, two wells were simulated, onescreened in the bedrock and one screened in the LGU. Each well was pumped at asimulated 50 gpm, for a total discharge of 100 gpm at this location. These are predicted tocapture the central portion of the plume beyond the capture zone of well EW-1. WellLocation EW-3 simulates one well screened in the bedrock (the LGU is unsaturated at thatlocation). At a simulated 25 gpm, EW-3 is predicted to capture the northernmost portionof the plume.
The infiltration gallery is a technically feasible alternative for the discharge of treatedwater from the remediation treatment plant. The predicted size of the infiltration gallery(approx. 8 ac.) for currently anticipated conditions may make the gallery economicallyinfeasible.
The model of the perched aquifer predicted that the most .severe effects on thewetlands will result from the installation of a slurry wall and cap. The addition of a 3 gpmextraction well near well MW-10 was predicted to have minor effects. The model predictedthat a french drain will be necessary to completely capture the contaminated groundwaterfrom LTR. This is predicted to have some negative effects on the southern wetland, witha predicted magnitude between that of the slurry wall and that of the extraction well at MW-10.
The model indicates that the remedial design should proceed using the well locationsand pumping rates determined by the model. The need for Well EW-3 should be re-evaluated as additional monitoring data become available, to determine whether anypumping is actually required at that location to achieve the cleanup goals. The infiltration
gallery should be considered in the remedial design through the stage of an economicanalysis, and the feasibility of the alternative should be reevaluated based upon thatinformation.
The simulation of complex hydrologic systems and remedial actions has inherentlimitations. The accuracy and completeness of the data base for the independentparameters of the model can affect the accuracy of the model predictions. Simplificationsof field conditions to meet mathematical assumptions inherent in the model may introduceother inaccuracies. Consequently, the results from any model should be taken as anapproximation, and variances from the predicted results should be expected under actualfield conditions. With this in mind, it is highly recommended that as implementation of theremedial action proceeds, additional pilot testing and verification testing be conducted at
2049401-290 5-20

appropriate stages. Recommended stages include a high stress pumping test at the existingpumping test well after a treatment facility is available to handle the high flow rate; andpumping tests at each extraction well as each well is completed.
2049401-290 «1

TABLE 5-1CONTAMINANT UST
Methyfene Chloride
Acetone
U-Dichloroethene
U-DfcUoroethane
1,2-DicMoroethene
2-Butanooe
1,1,1-Trichloroe thane
Trichloroetbene (TCE)
4-MethyJ-2-PenUnooe
TetncUoroethene (PCE)
Toluene
Xytene
Bis (2-Ethyi Hexle) Phlhabte
Barium
Cadmium
Chromium
Lead
Zinc
Heptachtor
AMrin
Dieldrin
4,4-DDT
Arochkjr-1248
Anenic
Beryllium
Manganese
Mercuiy
Selenium
Silver

TABLES-2CALIBRATION
REGIONAL GROUNDWATER MODEL
WELL
RM-1
RM-2
RM-3
RM-4
RM-5
RM-7
RM-8
RM-10
RM-11
ROW
26
51
85
59
76
103
94
40
129
COL
31
28
33
54
48
41
48
57
55
I
1990 WL
793.02
795
800.1
799.7
MODEL
790.8
795
800.1
799.7
D
1990 WL
793.01
795.18
800.52
799.92
799.05
803.5
803.42
796.61
83932
MODEL
790.8
795
800.1
800.4
799.7
803
803.4
798.1
838.7
VARIANCE
I
•222
1.91
•031
0.75
D
•221
-0.18
-0.42
0.48
0.65
-03
-0.02
1.49
-0.82

TABLES-3
SENSITIVITY ANALYSISREGIONAL GROUND WATER MODEL
WELLRM-1RM-2RM-3RM-4RM-5RM-7RM-6RM-10RM-11
ROW»SI655978
1099440
120
COLSI»33544641485796
——— j ——————————1990 WL
7034279349B00j61
79845
Mooa700J79347954
798
01890 WL
793.01785.1830052799.92799 45toss
303.42796.6133952
MODEL790.67939798.8795.1798.1797.8797.4791.7301.7
VARMNCE1-2.32
041-4.01
-245
D-i41-126-3.72-4*2-245-54
-8X12-441
-37*2
WELLRM-1RM-2RM-3RM-4RM-5RM-7RM-8RM-10RM-11
ROW2651655978
1O39440
!______!»
COL312633544841485755
11990 WL
793.02793.09600.61
79845
MODEL702230328194
8248
D199OWL
79341795.16600*279942799,058035
603427964183952
MODEL792.260346194624482488385839.4814.41118
VARMNCEI-O42
19.19
25.65
o-041
8.121926244625.75
35354817.79
276.46
WELLRM— 1RM-2RM-3RM-4RM-5RM-7RM-8RM-10RM-11
HOW28*'655976
1039440
129
COL312633544641465755
11990 WL
793.O279SJ0980041
79645
MODEL792.460558294
682.1
D1990 WL
793.01795.1680042799.92799.058034
603.42798.6183952
MODEL792.4805.9
830629.7632.1
651651817
1126
VARIANCE1
— O4212.412929
33.15
D— O4110.72294829.7633.05475
47562049
266.46
WELLRM-1RM-2RM— 3RM-4RM-5RM-7RM-8RM-10RM-11
now2851855976
1039440
129
COL312633«4641465755
|1990 WL
793.027934060041
79645
MODEL790.7
794797
7964
D1990 WL
79341705.18600527994279945
603.427964183952
MODEL790.7
794797.1795.3796.379747974791.7
802
VARMNCE1-242041
-341
-245
D-241-1.18-3.42-442-2.75-5.8
-542-441
-3752
WELLRM— 1RM-2RM-3RM-4RM-5RM-7RM-8RM-10RM-11
ROW2651655976
1039440
129
COL312633544641465755
I1990 WL
703427034080041
79645
MODEL790470447904
799.1
01090 WL
79341795.166005279942799456035
603.427984183952
MODEL7904794479947994799.1
602602.479748374
VARMNCE1
TTI"-141
0.15
D-221-O48-122-O.02
045-15
-1421.19
-142
WELLRM-1RM-2RM-3RM-4RM-SRM-7RM-6RM-10RM-11
ROW2651655976
IDS9440
120
COL312633**4641465755
I1090 WL
793J027034060041
79645
MODEL79047954601.4
800.7
t>1990 WL
793.01795.188005279942799458034
803.4279641639.52
MODEL7904795.8
602801.6801.28057
79928404
VARIANCE1-222
2210.79
1.75
o-2.11
0.421.481482.1522
256259148

TABLE 5-4
CALIBRATIONPERCHED GROUNDWATER MODEL
WELL
RM-4S
RM-5S
[RM-8]
RM-7S
ROW
11
28
46
55
COL
24
18
18
11
1990 WL
846.02
837.03
DRY839.26
MODEL
847.7
837.2
838.7
839.4
VARIANCE
1.68
0.17
122
0.14

inductance ConductanceTimes 1/10 Times 10
ia
&
«t
1976
G9
eo
e
0
ft
I
'§»
i
£8
8
«
§8
I•»
n*
2ft
_*
*
IS
§
i
§
i
}
i
»i
•
JPi0
S
.4
§8
§»
0I
a
ft
«k«
i
8
«Ani>
31
s
8
•
3
£•4
iis
fk
y
is
Sk
i
^
3
?
1990 WL
I
I
i
RechargeTimes 1/10
iV
a
«A
§8
!
D
a
0
ft
o»
«
8di
•*s
31
ss
8
a>
38
B
aS
3
I
^.A
s
Is§in
xfe
§
D
1
,
;
V,
i'
R1
3
1%
0
8
§8
1»
8>
echarge Hydraulic Hydraulic"••n* 10 Conductivity Conductivity
Times 1/10 Times 105
0
ft
•*)»
«
E»
.A>
3
8
•
§8
g»
85
2
&
«l
K
is
§»
I
I3
ztf1990
WL
1ta
I
3
I•«0
%
§8
3
81
5i
ft
.j
1
»i
Hk
>
8
:
J
8
.*
8
3
Ji
3)a•
S
IS
^
I
s
iji
i
i!
$1
IW5S§ngi
TABLE 5-5
SENSITIV
ITY A
NA
LYSIS
PERCHED
GRO
UN
DW
ATER M
OD
EL

LTR
Study Area Limits
Lemberger Landffl
NI
MAbDOL STUDY AREA LIMITSLEMBERGER LANDRLL RDVRA ACTIVITIES
RGURE 5-1

UPPER GRANULAR UNIT(UGU)
CLAY(COHESIVE UNIT/CU)
LOWER GRANULAR UNIT(LGU)
NIAGARA LIMESTONE
ccUJ
O
5a.
55
MALCOLMPIRNIE GEOLOGIC COLUMN
LEMBERGER LANDFILL RDXRA ACTIVITIESFIGURE 5-2

4SEB FT.
Study Area Limits
Lemberger Landta
LTR
Nt\
LANDFORMSLEMBERGER LANDRLL RDVRA ACTIVITIES
RGURE 5-3

APPROXMATEEXTENT OFPERCHEDAQUFER
*
LEGENDEXBTNG1YELLLOCATIONS
EQUPOTENT1ALLf£
N
4000 FT.
PERCHED MODEL WATER LEVELSLEMBERGER LANDFILL RO\RA AClWmES
FIGURE 5-18

Study Area Unto
Lemberger LandtW
LEGEND* WELL LOCATIONS
ECUPOTENTIAL LINE
1990 DATAReference: Rl Report
MAUOOLMPIRNIE
BEDROCK GROUND WATER ELEVATIONSLEMBERGER LANDFILL RD\RA ACTIVITIES
RGURE 5-5

Study ATM Unite
L«mberger LandfW LTR
LEGEND• * WELL LOCATIONS
MAbooyviPIRNIE
BEDROCK TOPOGRAPHYLEMBERGER LANDRLL RDVRA ACTIVITIES
FIGURE 5-6

Study Area LJmte
Lemberger Landfil
LTR
0 1000 2000 4000 FT.
MAUOOUVtPIRNIE SATURATED and CONFINED CONDITIONS
LANDFILL RDVRA ACTIVITIESRGURE 5-7

Study Area Limits
Lemberger Landfill
LTR
LEGENDWELL UOCATONS
NA
0 1000 2000 4000 FT.
MAUOOLMPIRNIE GW FLOW in the PERCHED AQUIFERLEMBERGER LANDFILL RDVRA ACTlVmES
RGURE 5-8

Study Area Limits
Lemterger Landlil
LEGEND* WELL LOCATIONS
PLUME
LTR
Reference: FS Report
REGIONAL AQUIFER PLUMELEMBERGER LANDRLL RD\RA ACTIVITIES
RGURE 5-9

RIDGEV1EWLANDFILL
* ILEMBERGERLANDFILL
SUNNY SLOPE ROAD;
LEGENDWELL LOCATIONS
V
N/
0 1000 2000 4000 FT.
Reference: FS Report
PIRNIE PERCHED AQUIFER PLUMELEMBERGER LANDRLL RDXRA ACTIVITIES
FIGURE 5-10

Study Area Limit*
LEGEND* WELL LOCATIONS
EQUPOTENTIAL LINE
Lembeiger Landfll
LTR
MA1OXMPIRNIE REGIONAL MODEL WATER LEVELS
LEMBERGER LANDFILL RD\RA ACTIVITIESRGURE 5-11

•&>-J SI
Study Area Limits
LEGENDWELL LOCATIONS
Lemberger Landfill
LTR
REGIONAL EXTRACTION WELLSLEMBERGER LANDRLL RDNRA ACTIVITIES
FIGURE 5-12

Study Area Limit*
LEGENDWELL LOCATIONS
EQlflPOTENTIAL LINE
CAPTURE ZONES
PLUME
Lemberger Landfil
PIRNIE EXTRACTION WATER LEVELS-BEDROCKLEMBERGER LANDFILL RDXRA ACTIVITIES
FIGURE 5-13

Study Area Limits
LEGENDWELL LOCATIONS
EOLHPOTENTIAL LINE
m CAPTURE ZONES
PLUME
Lemberger LandM
MAlCOUVtPIRNIE EXTRACTION WATER LEVELS-LGULEMBERGER LANDFILL RD\RA ACTIVITIES
FIGURE 5-14

Study Area Limits
Lemberger Landfill
INFILTRATION GALLERY
LTR
MALCOLMPIRNIE INFILTRATION GALLERY LOCATION
LEMBERGER LANDFILL RD\RA ACTIVITIESFIGURE &-15

Study Area Limits
LEGENDWELL LOCATIONS
EQUPOTENmAL LINE
Lemberger LandfiO
LTR
MAliOOL INFILTRATION GALLERY WL-ROCKLEMBERGER LANDFILL RDVRA ACTIVITIES
RGURE 5-16

Study Area Limits
LEGENDWELL LOCATIONS
EQUIPOTENTIAL LINE
Lemberger LandfUl
LTR
MAllDOlMPIRNIE INFILTRATION GALLERY WL-LGULEMBERGER LANDFILL RDVRA ACTIVITIES
FIGURE 5-17

APPROXIMATEEXTENT OFPEROfi)AQUFER
*
LEGENDO * * EX6TNG
w WELL LOCATIONS
EOUPOTENT1AL
N
4000 FT.
MAUGOUViRRNIE SLURRY WALL SCENARIO WLLEMBERGER LANDRLL RD\RA ACTIVITIES
FIGURE 5-19

APPROXMATEEXTENT OFPEROEDAOUFER
LEGENDBOSTNGWELL LOCATIONS
EQUPOTENTIALLhE
N
4000 FT.
MA1OXMRRNIE EXTRACTION WELL NEAR RM-7 WLLEMBERGER LANDFILL RD\RA ACTIVITIES
FIGURE 5-20

APPROXMATEEXTENT OFPERO€DAOUFER
*
LEGENDEXBTNGWELL LOCATIONS
SMULATEDEXTRACTIONWELL
N/I
1000 2000 4000 FT.
EXTRACTION WELL NETWORKLEMBERGER LANDRLL RD\RA ACTIVITIES
RGURE 5-21

LEGEND
0 1000
EXJSTNGWELL LOCATIONS
EQUPOTENT1ALLfC
SMULATEDEXTRACTIONWEa
N
MAUOOUVtPIRNIE EXTRACTION WELL NETWORK WL
LEMBERGER LANDRLL RDXRA ACTIVITIESRGURE 5-22

APPROXMATEEXTENT OFPERCHEDAOUFER
*
2000
LEGENDEXBTNGWELL LOCATIONS
SMULATEDFRENCHDRAW
N
4000 FT.
MA1OXMPIRNIE LTR DRAIN LOCATIONLEMBERGER LANDFILL RD\RA ACTIVITIES
RGURE 5-23

0 1000
LEGENDEXBTNGWELL LOCATIONS
EOUPOTBfllAL
Ny
MAUGOUViPIRNIE LTR DRAIN WATER LEVELS
LEMBERGER LANORLL RD\RA ACTIVmESRGURE 5-24

APPROXMATEEXTENT OFPEROB)AQUFER
*
LEGEND
WELL LOCATIONS
EQUPOTENTIALLhE
N
2000 4000 FT.
MALCOLMP1RNIE DRAIN NEAR MW-10 WATER LEVELS
LEMBERGER LANDFILL RD\RA ACTIVITIESRGURE 5-25

APPROXMATEEXTENT OFPEROB)AOAJFER
*
LEGENDBCSTMGWELL LOCATIONS
EOUPOTEmiAL
N/\
1000 2000 4000 FT.
•war EXTRACTION WELL NEAR MW-10 WLLEMBERGER LANDFILL RD\RA ACTIVmES
RGURE 5-26

APPROXIMATEEXTENT OFPERCHEDAQUIFER
*LEGEND
O f t * EXJSTNGw WELL LOCATIONS
EOUPOTENT1ALLhE
N
0 1000
IRNI EXTRACTION WELL NEAR RM-5 WLLEMBERGER LANDFILL RDXRA ACTIVITIES
FIGURE 5-27

APPROXMATEEXTENT OFPERCHEDAQUFER
*
0t_________i
1000 2000 4000 FT.
LEGENDEXSTNGWELL LOCATIONS
SMULATEDFRENCHDRAN
N/I
IRNI DRAIN NORTH OF LL LOCATIONLEMBERGER LANDFILL RDVRA ACTIVITIES
FIGURE 5-28

APPROXIMATEEXTENT OFPERCHEDAQUIFER
*
0 1000
LEGENDEXJSTNGWELL LOCATIONS
EQUPOTENT1ALLJNE
N
MAUQOUV4PIRNIE DRAIN NORTH OF LL WATER LEVELS
LEMBERGER LANDFILL RDVRA ACTIVITIESFIGURE 5-29

APPROXMATEEXTENT OFPEROEDAQUFER
EXTRACTION WELL
*
LEGEND
WELL LOCATIONS
DRAM
SMULATEDEXTRACTIONWELL
APPROXMATEEXTENT OFSLURRY WALLAND CAP
N/I
1000 2000 4000 FT.
MAUOOIMPIRNIE RECOMMENDED REMEDIAL ACTION
LEMBERGER LANDFILL RDVRA ACTIVITIESFIGURE 5-30

APPROXMATEEXTENT OFPEROEDAQUFER
*
LEGENDEXBTNGWELL LOCATIONS
EOUP07ENT1AL
NA
2000 4000 FT.
PIRNIE RECOMMENDED REMEDIAL ACTION WLLEMBERGER LANDRLL RDVRA ACTIVITIES
FIGURE 5-31

6.0 TREATABILTIY STUDY
6.1 INTRODUCTION
This section summarizes the results of the groundwater treatability study describedin the Final Work Plan. Treatability tests performed included: carbon adsorption fortreatment of organics; and chemical precipitation with potassium permanganate andelectrochemical precipitation for treatment of metals. The chemical precipitation andelectrochemical precipitation treatability tests were performed on the effluent from thecarbon adsorption test The tests were performed to obtain design data for the full-scaletreatment system and to determine whether the discharge levels established by WisconsinDNR could be met. The treated groundwater from the full scale treatment system wouldbe discharged to the Branch River.
62 INFLUENT SAMPLE COLLECTION
The sample used in the treatability studies was a composite sample of groundwaterfrom six monitoring wells. The six wells were chosen for sampling based on proximity to thesuspected locations of proposed extraction wells. The exact locations of the extraction wellswill be based on groundwater flow modeling performed by Malcolm Pirnie. Copies of thewell sampling forms are included in Appendix E-l.
The samples from the six monitoring wells were shipped to the Malcolm Pirnielaboratory in three 55 gallon drums and two one-gallon and one two-and-a-half-gallon plasticcontainers. The composite sample was prepared in the laboratory according to the volumeslisted in Table 6-1. The relative volume of water from each of the six wells used for thecomposite sample was based on the estimated pumping rates from the Feasibility Study.Approximately 55-gallons of the composite sample were used as the untreated groundwatersample in the toxicity tests. The remaining volume was used in the treatability tests. Theanalytical results of the composite sample are listed in Table 6-2. These results agree withprevious analytical results of the monitoring wells.
2049401-290 6-1

63 LIQUID-PHASE CARBON ADSORPTION
The composite groundwater sample was pumped through activated carbon to removethe organic compounds. A Rapid Small-Scale Column Test (RSSCT) was performed todetermine carbon design criteria for a full scale carbon treatment system. The pumping ratewas approximately 16 millfliters per minute, and the carbon volume was 160 millfliters. Asingle carbon bed was used and the empty-bed residence time was 10 minutes. The carbonused was Filtersorb 400 by Calgon. A glass wool plug was inserted above the carbon to filtersediment out of the groundwater. Effluent samples were collected approximately every 12hours.
Based on the analytical results of the RI, volatile compounds make up the vastmajority of the organic load in the groundwater. Semi-volatile compounds were detectedat concentrations well below the preliminary Branch River discharge levels. Pesticides andPCBs were detected at low concentrations only in a few localized on-site monitoring wellsat the LTR site. Therefore, groundwater extraction from the proposed extraction wells (inexcess of 250 gpm) is expected to result in concentrations of pesticides, PCBs and semi-volatile compounds in the influent to the treatment system which are much less than themonitoring well concentrations. These influent concentrations are not expected to exceedthe preliminary Branch River discharge levels for these compounds. Additionally, volatileorganics have lower affinity for activated carbon than semi-volatile compounds, pesticidesor PCBs. This results in a faster breakthrough for volatile compounds than semi-volatiles,pesticides and PCBs. Therefore, design criteria for liquid phase carbon capacity foruntreated groundwater was determined solely from the volatile organic compoundconcentrations. Hence, only volatile organic compounds were analyzed during treatabflitytesting.
Copies of the laboratory procedure and detailed analytical results are included inAppendix E-2. The results are summarized below.
• Acetone and 2-butanone do not adsorb well onto carbon. These compounds "bleedthrough"-that is, some concentration will always pass through the carbon before thecarbon has broken through. After a period of time, these compounds also showedeffluent concentrations which exceeded the influent concentration. The effluentconcentration increases over time because other compounds which adsorb morestrongly to the carbon replace acetone and 2-butanone. The acetone and 2-butanone
2049-001-290 6-2

are forced back into the water-phase (desorption) and are discharged from thecolumn. It should also be noted that acetone is a typical laboratory contaminant andseveral blank samples had moderate concentrations of acetone contamination.
• The breakthrough for the organics (chloroethane and 1,1-dichloroethane) occurredafter approximately 52 gallons of groundwater were treated. Chloroethane had beendetected previously in several wells (including treatability test sample well RM-7D)but was not included as a Constituent of Concern in the Record of Decision. Thecalculated carbon capacity is approximately 2,600 gallons of groundwater per poundof carbon.
• The volatile organics concentrations were below the preliminary discharge levels forthe Branch River for the compounds listed in the memo dated March 13,1991 fromDuane Schuettpelz to Doug Rossberg based on preliminary water quality modellingcalculations. A copy of this memorandum is included in Appendix E-2. Several ofthe detected compounds did not have preliminary limits calculated. Thesecompounds include acetone, 2-butanone, chloroethane, and 1,1-dichloroethane. Thevolatile organic compounds results for the sample collected at breakthrough aresummarized in Table 6-3.
• Although glass wool was used to filter sediment from the groundwater before carbontreatment, fine solids passed through the glass wool and plugged the carbon. Thecarbon column was rinsed with de-ionized water several times (in simulatedbackwashes); the carbon, however, was eventually plugged to the point that waterwould no longer flow through the column. This occurred after treating approximate-ly 53 gallons through the column. It should be noted that a full-scale carbontreatment system would require pre-filtration or other solids removal methods aheadof the carbon column.
• The pH of the effluent from the carbon bed was 8.74.
• There was a concern that the sediment that collected on the filter could be a RCRA-characteristic hazardous waste if the metals concentrations in the sediment exceedthe TCLP limits after extraction. Sediment plugging the column was analyzed for
2049401-290 6-3

Target Analyte List total metals because there was not enough sediment sample toperform a TCLP analysis. The analytical results are listed in Table 6-4. Maximumpossible TCLP concentrations were then calculated from the total metals concentra-tions for the detected metals that have TCLP limits - barium and selenium. Sincethe weight of the extraction fluid used in the TCLP analysis is 20 times the weightof the sediment sample, the metal concentrations were divided by 20 to determinethe maximum possible TCLP sample concentration - assuming that all of the metalconcentration is leachable, which is rarely the case. The maximum barium andselenium concentrations were substantially below the TCLP limits (see Table 6-4)indicating that the sediment would not be a RCRA-characteristic hazardous waste.
• A copy of the analytical results for the raw groundwater and the spent carbon weresent to Calgon Carbon Corp. to determine whether the spent carbon could beregenerated. Calgon indicated that the spent carbon could most likely beregenerated. However, they stated that depending on the volume of carbon to beregenerated, it is possible that the zinc concentration of the spent carbon couldprohibit the carbon from being regenerated. The maximum zinc concentration thatCalgon will accept is on a "sliding-scale" and depends on the amount of carbonaccepted at any time. Calgon can blend the carbon so that, the lower the carbonvolume, the greater the zinc concentration which can be accepted for regeneration.
6.4 CHEMICAL PRECIPITATION TEST
Six liters of effluent from the liquid-phase carbon adsorption treatability study wasused as the sample for the chemical precipitation study. Potassium permanganate wasadded to oxidize and precipitate metals for removal from the groundwater. The sample wassplit into six one-liter samples. Potassium permanganate was added to five of the samplesin dosages of 1,5,10, 20, and 30 parts per million. The sixth sample was used as a controland potassium permanganate was not added to it. The samples were mixed rapidly for oneminute, mixed slowly for five minutes, and then allowed to settle. Samples of the waterwere filtered through a Whatman #40 filter paper and the filtrates were analyzed for TargetAnalyte List of metals. Copies of the laboratory procedure and detailed analytical resultsare included in Appendix E-3. The results are summarized below.
2049401-290

• Potassium permanganate reduced the manganese concentration of the liquid-phasecarbon adsorption test at the 1 ppm dosage. Higher potassium permanganatedosages increased the manganese concentrations. The results of the analyses arelisted in Table 6-5. The analytical results for metals are below the discharge levelsfor the Branch River for the compounds listed in the WDNR internal memorandumdated March 13, 1991 from Duane Schuettpelz to Doug Rossberg. Manganese didnot have preliminary limits calculated.
• There was essentially no change in the antimony concentration at any potassiumpermanganate dosage.
• All other Target Analyte List metals concentrations were below the respectiveanalytical detection limits at all dosages and in the control
• No visible precipitate formed in any of the samples, and therefore, no precipitatesample was collected from the liquid phase.
• The addition of potassium permanganate did not affect the pH.
6£ ELECTROCHEMICAL PRECIPITATION TEST
The electrochemical precipitation process used an iron electrode emersed in waterto remove heavy metals from the water. A current is passed through the electrode andcreates ferric ions. The iron and heavy metals coprecipitate as metal hydroxides and aresettled or filtered from the water.
Two-and-one-half gallons of effluent from the liquid-phase carbon adsorptiontreatability study were used as the sample for the electrochemical precipitation study. Thesample was sent to Andco Environmental Processes, Inc., the manufacturer of electrochemi-cal precipitation systems, for bench-top treatability studies. Andco added ferric ions atdosages of 25,50, and 100 milligrams per liter. Andco used two pH concentrations for the50 and 100 ppm dosages (approximately 8.0 and 9.0) and three pH concentrations for the25 ppm dosage (approximately 8.0, 9.0 and 10.0). Andco then collected a sludge samplegenerated from the treatability test performed with their recommended iron dosage and pH.A total metals analyses was performed on the sludge sample. Copies of the laboratory
2049401-290 6-5

procedure, laboratory report from Andco, and detailed analytical results are induded inAppendix E-4. The results are summarized below.
• The analytical results are summarized in Table 6-6. The detection limits for Andco'sLaboratory (Ecology & Environment, Inc) were less than Malcolm Pirnie'slaboratory. As a result, chromium and selenium were detected at low concentrationsin the influent to the electrochemical precipitation test (effluent from the carboncolumn) but not from the influent to the chemical precipitation test. The analyticalresults for metals are below the discharge levels for the Branch River for thecompounds listed in the memo dated March 13, 1991 from Duane Schuettpelz toDoug Rossberg. Barium and manganese did not have preliminary limits calculated.
• Several metals in the electrochemical sludge sample have RCRA TCLP limits. Thedetected metals with TCLP limits are arsenic, barium, cadmium, chromium, andselenium. There was a concern that the precipitate could be a RCRA-characteristichazardous waste if the metals concentrations exceed the TCLP limits afterextraction. The precipitate was analyzed for Target Analyte List total metalsbecause there was not enough sediment sample to perform a TCLP analysis. Theanalytical results are listed in Table 6-7. Maximum possible TCLP concentrationswere then calculated from the total metals concentrations for the detected metalsthat have TCLP limits. Since the weight of the extraction fluid used in the TCLPanalysis is 20 times the weight of the sediment sample, the total metal concentrationswere divided by 20 to determine the maximum possible TCLP sample concentration- assuming that all of the metal concentration is leachable, which is rarely the case.The maximum concentrations of cadmium and chromium were greater than theTCLP limits (see Table 6-7) indicating that the sediment could be a RCRA-characteristic hazardous waste if all of these metals are leachable. Andco has statedthat, based on past experience, this is not expected to be the case and that theprecipitates are typically not characteristic hazardous wastes.
2049-001-290 6-6

6.6 AIR STRIPPER ECONOMIC ANALYSIS
As discussed earlier, volatile organics and metals are the only constituents in thegroundwater which are expected to require treatment. Semi-volatile compounds, pesticidesand PCBs, although detected at low concentrations in a few localized monitoring wells, areexpected to be at insignificant concentrations in the influent to the treatment system. Thisis mainly due to the large volume of the extracted groundwater to be treated (in excess of250 gpm) and the large area of influence of the extraction wells in comparison with whatseem like small pockets of semi-volatile, pesticide and PCB containing groundwater.
Since, air stripping is another effective and proven technology to remove volatileorganic compounds from groundwater, an economic analysis was performed to determineif an air stripper would be more economical than liquid-phase carbon. In general, if thestripped volatile compounds can be discharged to the air, air stripping tends to be lessexpensive than liquid-phase carbon. If the stripped volatiles can not be discharged to theair, the air stripper must be followed by air-phase carbon. The USEPA and WDNR havenot yet made a determination whether air-phase carbon would be required.
Several factors influence the economics of air stripping. The Henry's Law constantof the volatile compounds determine whether the compound will be easy to remove fromthe water stream. The greater the Henry's Law Constant, the easier the compound is toremove from water. The three volatile compounds with the highest concentrations in thegroundwater (1,1-dichloroethane, 1,1,1-trichloroethane, and 1,2-dichloroethene) have highHenry's Law constants - approximately 5x10* atm mj/mol. For compounds with a Henry'sLaw constant of this magnitude, an air stripping system with a treatment flow between 0.1and 1.0 million gallons per day1 would cost approximately $0.15 per 1000 gallons and airstripping with air-phase carbon treatment system costs would be approximately $035 per1000 gallons. Liquid-phase carbon treatment for similarly sized systems would costapproximately $130 per 1000 gallons'. Therefore, economic factors favor the air stripping,even if air-phase carbon treatment is required.
Therefore it is recommended that air stripping followed by air phase carbon (ifrequired) be used to treat the volatile compounds in contaminated groundwater at theLemberger Superfund Sites and that liquid-phase carbon be available after the stripper totreat pesticides and PCBs.
20494)01-290 6-7

6.7 BENCH SCALE TEST SUMMARY AND CONCLUSIONS
A summary of the bench scale treatability study is provided below:
• The organic concentrations of the effluent from the liquid-phase carbon treatabflitytest were below the preliminary limits for discharge to the Branch River. Airstripping would also meet the preliminary discharge limits for the volatilecompounds. The preliminary limits were listed in the memo dated March 13,1991from Duane Schuettpelz to Doug Rossberg.
• Since semi-volatile compounds, pesticides and PCBs are expected to be atinsignificant concentrations in the influent to the treatment system, additionaltreatment for these compounds using liquid-phase carbon is unnecessary. Using onlyair stripping would result in adequate treatment of the groundwater for organics.
• To avoid plugging the carbon bed or fouling the air stripper in full scale operation,the sediment should be filtered.
• Chemical precipitation and electrochemical precipitation reduced metals concentra-tions. However, these two treatment processes were not needed to meet thepreliminary discharge limits for the Branch River. Incidental filtering of thegroundwater by the carbon reduced the metals concentration to below thepreliminary limits for discharge to the Branch River. In fact, the analytical resultson the carbon effluent samples were significantly below the listed preliminarydischarge limits.
• Air stripping the volatile organics with or without air-phase carbon treatment ofstripping air would be more economical than liquid-phase carbon treatment.
• Therefore, it is recommended that filtration and air stripping be the treatmenttechnologies selected to treat contaminated groundwater at the LembergerSuperfund Sites.
2049401-290

TABLE 6-1WELL SAMPLES USED TO MAKE TREATABILITY COMPOSITE SAMPLE
Monitoring Well
Volume inComposite Sample
per 55 gallons(gallons)
Percent ofComposite Sample
UPPER GROUNDWATER SYSTEM
RM-7S
MW-10
MW-7
0.26
0.26
0.77
0.47
0.47
1.40
LOWER GROUNDWATER SYSTEM
RM-4D
RM-10D
RM-7D
55-GALLON COMPOSITE
12.8
15.4
25.6
55.0
23.26
27.91
46.51
100.0

TABLE 6-2GROUNDWATER COMPOSITE ANALYTICAL RESULTS
Volatile Parameter
Bromomethane*
Chloroethane*
Methylene Chloride
Acetone
1, 1-Dichloroethene
1,1-Dichloroethane
c-l,2-Dichloroethene
1,2-Dichloroethane*
2-Butanone
1,1,1-Trichloroethane
Carbon Tetrachloride
Trichloroethene
Benzene*
4-Methyl-2-pentanone
Toluene
m,p-Xylene
Vinyl Acetate*
Drum 1Concentration
(Mg/1)
< 10
54
9
14
12
170
120
2
60
150
23
19
1
4
2
1
14
Inorganic Parameter
Barium
Iron
Manganese
Zinc
Drum 2Concentration
0*g/»6
30
6
58
8
116
78
SUIT
< 10
91
< 10
12
< 10
6
surr
< 10
12
AverageConcentration
0*g/D
< 10
42
7
36
10
143
99
2
< 35
120
< 16
16
< 10
5
2
< 10
13
Concentration 0*g/l)
50
38,700
244
34
* Not a Contaminant of Concern as defined in the ROD.surr.: Compound was used as a spike surrogate and could not be quantified.

TABLE 6-3CARBON COLUMN EFFLUENT RESULTS
Volatile Parameter
Chloroe thane*
Methyienc Chloride
Acetone
1,1-Dichloroethene
1,1-Dichloroe thane
ol,2-Dichloroethene
1,2-Dichloroethane*
2-Butanone
1,1,1-Trichloroethane
Carbon Tetrachloride
Trichloroethene
4-Methyi-2-pentanone
Toluene
Vinyl Acetate*
Pesticide/PCBParameter
none detected in effluent
Inorganic Parameter
Antimony*
Barium
Iron
Manganese
Zinc
InfluentConcen-tration0*8/1)
42
7
36
10
143
99
2
< 35
120
< 16
16
5
2
13
InfluentConcen-trationOig/l)
NA
InfluentConcen-tration0*8/1)
NA
50
37,700
244
34
EffluentConcen-tration0*8/0
25
4
45
6
84
53
< 10
10
64
< 10
9
< 10
< 10
< 10
EffluentConcen-tration0*8/1)
not detected
EffluentConcen-tration0*8/0
221
<50
137
126
< 20
RemovalEfficiency
(*)
40
43
-252
40
41
46
NC
< 71
47
> 38
44
NC
NC
> 23
RemovalEfficiency
(*)
NC
RemovalEfficiency
(*)
NC
> 1
99.6
48
>41
PreliminaryBranch River
DischargeLevels1
0*8/«
Not Determined
2,640
Not Determined
118
Not Determined
208
Not Determined
11,200
118
281
Not Determined
426,000
Not Determined
PreliminaryBranch River
Discharge Levels1
Otg/1)
PreliminaryBranch River
Discharge Levels1
0*g/I)
6,730
Not Determined
1,080
Not Determined
281,000
• Not a r««mmiii.nt of Concern as defined in the ROD.NA: Not Analyzed.NC: Not Calculated, either the influent or both influent and effluent were below detection Emit.
1 Bated on one-third assimilative capacity in receiving water (from memo dated March 13,1991 from Duane Schuettpdz to Douf Rocsberg).1 Acetone effluent concentrations mxtded influent coocentmions because other compounds were replacing acetone on the carbon and concentrating acetone in theeffluent (see text tot discussion).
Note: Effluent sample was collected at the brealMhrough point. Column plugged shortly after and no more samples were collected.

TABLE 6-4SEDIMENT SAMPLE FROM CARBON COLUMN TEST
DetectedParameter
Barium
Manganese
Selenium
Zinc
Total MetalsConcentration
(rag/kg)
39.9
131
23
423
Maximum PossibleTCLP Concentration
(mg/1)
2.0
NA
0.17
NA
TCLP Limits(mg/1)
100
NA
1.0
NA
* Not a Contaminant of Concern as defined in the ROD.
NA: Not Applicable, no TCLP limit for this metal.

TABLE 6-5POTASSIUM PERMANGANATE OXIDATION TEST RESULTS
ParameterPotassiumPermanganate Dose
Antimony*
Manganese
Treated Sample Concentration (|ig/l)
Control(0 ppm)
221
126
1 ppm229
52
5 ppm226
810
10 ppm221
2,880
20 ppm
216
5,250
30 ppm203
6,750
PreliminaryBranchRiver
DischargeLevels'ffig/n6,730
Not Determined
* Not a Contaminant of Concern as defined in the ROD.1 Based on one-third assimilative capacity in receiving water (from memo dated March 13,1991 from Duane Schuettpelz to Doug Rossberg).

TABLE 6-6ELECTROCHEMICAL PRECIPITATION EFFLUENT ANALYTICAL RESULTS
Parameter
Barium
Chromium, total
Manganese
Selenium
InfluentConcentration (/tg/1)
8
3.5
93
1.8
EffluentConcentration (/tg/1)
5
< 2
< 2
<(X5
PreliminaryBranch River
Discharge Levels1
(Mg/D
Not Determined
3,880*
Not Determined
561
1 Based on one-third assimilative capacity in receiving water (from memo dated March 13,1991 fromDuane Schuettpelz to Doug Rossberg).2 Limit is for hexavalent chromium.
NOTE: Zinc was not analyzed because the maximum detected concentration was less than the CleanupStandard in the ROD.

TABLE 6-7PRECIPITATE SAMPLE FROM ELECTROCHEMICAL PRECIPITATION TEST
DetectedParameter
Arsenic
Barium
Beryllium
Cadmium
Chromium
Lead
Manganese
Mercury
Selenium
Silver
Total MetalsConcentration
(mg/kg)
46
197
CC
97
140
CC
1,994
CC
51
CC
Maximum PossibleTCLP
Concentration(mg/D
2.3
9.9
NA
4.9
7.0
CC
NA
CC
1.3
CC
TCLP Limits(mg/D
5.0
100.0
NA
1.0
5.0
5.0
NA
0.2
1.0
5.0
NA: Not Applicable, no TCLP limit for this metal.
CC: Can not calculate (concentration was below detection limit, see Andco report).
NOTE: Zinc was not analyzed because the maximum detected concentration was less than the CleanupStandard in the ROD.

7.0 AQUATIC TOXICITY TESTING FOR TREATABILTTY STUDY
7.1 INTRODUCTION
As a part of the treatability study, aquatic toxicity testing was performed to assesstoxicity reduction by the treatment processes studied. Both acute and chronic (acute staticrenewal and short-term chronic) toxicity tests were conducted using treated and untreatedwater, defined as follows:
• Untreated - filtered ground water ("influent" to the treatment units)• Treated - chemical precipitation test effluent (included granular activated
carbon treatment)The Sampling and Analysis Plan for the aquatic toxicity testing is discussed in
Sections 4.3.4 and 4.3.5 of the Quality Assurance Project Plan in Appendix B of the FinalWork Plan.
Laboratory data sheets for both the acute and chronic toxicity tests are provided inAppendix F-l.
72 ACUTE TOXICITY TESTS
Acute toxicity testing with Ceriodaphnia dubia and Oncorhynchus my kiss, rainbowtrout, were begun on 16 and 17 August 1993; test solutions were renewed daily usingcomposite samples of treated water collected between 15 and 19 August 1993. Acutetoxicity tests with Daphnia magna were begun on 25 and 26 August 1993; test solutions wererenewed daily using composite samples of treated water collected from 24 to 27 August.Untreated well water was composited at the beginning of the study (15 August), and wasused for daily renewal for all untreated well water tests.
All acute toxicity tests were conducted according to methods presented in Methodsfor Measuring the Acute Toxicity of Effluents and Receiving Waters to Freshwater andMarine Organisms (Weber 1991; EPA/600/4-90/027).
No toxicity was observed in any of the acute toxicity tests with C. dubia, D. magnaand O. myfdss (Table 7-1). Survival was >90% in 100% sample in each test with these spe-cies; therefore, all LC50's are reported as > 100% sample. The acceptability of the BranchRiver receiving water for acute toxicity testing is indicated by high survival which was
2049-001-290 7-1

comparable to survival in the moderately hard reconstituted (MHR) water controls. Testacceptance criteria of >90% dilution water control survival were met in all acute tests.
73 CHRONIC TOXICITY TESTING
7.3.1 GeneralShort-term chronic toxicity tests with Ceriodaphnia dubia and Pimephales promelas
were initiated on 19 August 1993 and daily renewal of test solutions was performed withcomposite samples of treated water collected from 18 to 26 August 1993. Untreated wellwater was composited at the beginning of the study (15 August), and was used for dailyrenewal for all untreated ground water tests.Chronic toxicity testing was conducted in accordance with Short-Term Methods forEstimating the Chronic Toxicity of Effluents and Receiving Waters to Freshwater Organisms(Weber et al. 1989;EPA/600/4-89/001). Test procedures were modified as required by theWisconsin Department of Natural Resources' Guidance Manual for the Certification andRegistration of Laboratories Conducting Effluent Toxicity Tests (PUBL-TS-006 91).
132 Ceriodaphnia duptaThe results of the chronic toxicity tests with C. dubia indicate considerable toxicity
associated with the untreated well water, but only slight toxicity of the treated well water(Table 7-2). In the treated well water test, survival was 100% in the 100% sample treat-ment. Analysis of Varience (ANOVA) followed by Dunnett's Test indicates that offspringproduction was significantly reduced in 100% treated well water as compared to offspringproduction in the Branch River control treatment. This statistical analysis also indicates thatoffspring production in the 12.5% and 25% sample concentrations is significantly reducedas compared to the control, but that offspring production at 50% sample was not differentfrom that in the control Therefore, in the absence of a clear trend, of reduced offspringproduction at sample concentrations above 12.5%, the 50% sample is considered to be theNo Observed Effect Concentration (NOEC) and the 100% sample is the Lowest ObservedEffect Concentration (LOEC).
2049-001-290 7-2

In the C. dubia chronic test with the untreated well water, both survival andreproduction were decreased at some of the intermediate test concentrations as well as atthe 100% sample treatment (Table 7-2). Fisher's Exact test indicated that survival at 100%sample was significantly reduced as compared to survival in the Branch River water control.An LC50 of 70.7% sample was calculated (Spearman method). As recommended byEPA/600/4-89/001, the data from the 100% sample treatment was then removed fromfurther statistical analyses. ANOVA followed by Dunnett's test indicated that offspringproduction was significantly reduced as compared to the Branch River control at both the25% and 50% sample concentrations. The analysis also indicates that offspring productionwas significantly reduced at the 6.25% sample concentration, but the 12.5% sampleconcentration was not different from the Branch River water control. Following the samereasoning presented above for the treated sample results, the 12.5% sample is consideredto be the NOEC and the 25% sample is the LOEC.
The decreased offspring production at some intermediate concentrations in C. dubiachronic tests with both types of water may be related to factors other than sample toxicity,such as feeding or handling. The results of both chronic tests point to the acceptability ofthe Branch River receiving water for use as dilution water in chronic toxicity testing.Offspring production in Branch River water control was similar to production in the dilutemineral water (DMW) control in the treated well water test. However, in the untreated wellwater test, while production in the Branch River water control was acceptable, theproduction in the DMW control was reduced for some unknown reason. Dilution watercontrol acceptance criteria of >80% survival and ^15 young/live adult were met in bothchronic tests with C. dubia.
7.33 P. promelasThe results of the chronic toxicity tests with P. promelas indicate that there was no
toxicity associated with either the untreated or the treated well water (Table 7-3). In the100% treatments of both water types, survival was high (^80%) and was not significantlydifferent from the Branch River water control survival. The LC50's are reported as > 100%sample. Additionally, the growth of fish in the 100% treatments of tests with both watertypes was not reduced by comparison with the Branch River water control. The NOEC and
2049-001-290 7-3

LOEC were 100% sample and >100% sample, respectively, for both the treated anduntreated well waters. Dilution water control acceptance criteria of 80% survival and >0.25mg dry weight (measure of fish growth) were met in both tests.
7.4 REFERENCE TOXICANT AND WATER QUALITY
Chronic and acute reference toxicant test results are presented in Tables 7-4 and 7-5.These tests with Sodium Chloride (NaCl) were carried out under the same conditions as theacute and chronic tests discussed above. Control acceptance criteria were met in acute andchronic tests with each species.
Table 7-6 presents a summary of measured water quality characteristics of theBranch River receiving water and the treated and untreated well water. Measurements weretypically made at test initiation for the acute toxicity tests, and on each day of the chronictests.
7.5 SUMMARY
Overall, the results of these tests indicate that the toxicity of both the treated anduntreated well water was low. No acute toxicity was observed with any of the three speciesfor either water type. Only the C. dubia chronic tests produced measurable toxic results.Those results indicate only slight chronic toxicity associated with the well water treated withgranular activated carbon and chemical precipitation, and considerable chronic toxicityassociated with the untreated well water.
2049-001-290 7-4

Table 7-1.Lemberger Landfill Treatability Study
Acute Toxicity Test Results
Percent SurvivalSample Type/Sample Concentration
I. Treated Well Water
Branch River Control
MHR Control
625%
12.5%
25%
50%
100%
LC50 (percent sample)
n. Non-Treated Well Water
Branch River Control
MHR Control
6.25%
12.5%
25%
50%
100%
LC50 (percent sample)
Ceriodaphniadubia
(48 hours)
Daphniamagna
(48 hours)
Oncotttynchusmykiss
(96 hours)
100
100
100
95
90
100
100
>100%
100
100
100100
100
95
100
>100%
100
100
100
100
100
100
100
>100%
100
95
100
95
95
95
90
>100%
100
100
100
100
100
100
100
>100%
100
100
100
100
100
100
100
>100%

Table 7-2.Lemberger Landfill Treatability Study
August 19, 1993Ceriodaphnia dubia
Short-Tenn Chronic Toxicity Test Results
I. Treated Well Water (7 day test)
Sample Type/Sample Concentration
Branch River Control
BMW Control
625%
12.5%
25%
50%
100%
LC50 (percent sample)
LOEC / NOEC (percent sample)
PercentSurvival
100
100
100
100
90
90
100
>100%
Mean No.Offspring/Adult
17
16
13
10
7
12
5...
(offspring production)100% / 50%
II. Non-Treated Well Water (8 day test)
Branch River Control
BMW Control
625%
12.5%
25%
50%
100%
LC50 (percent sample)
LOEC / NOEC (percent sample)
90
90
100
90
90
80
20
70.7%
16
11
9
13
5
7
1—
(offspring production)25% / 12.5%

Table 7-3.Lemberger Landfill Treatability Study
August 19, 1993Pimephales promdas
Short-Term Chronic Toxicity Test Results
L Treated Well Water (7 day test)
Sample Type/Sample Concentration
Branch River ControlMHR Control
625%
12.5%
25%
50%
100%
LC50 (percent sample)
LOEC / NOEC (percent sample)
PercentSurvival
80
87
83
78
82
89
87
>100%
Mean DryWeight (mg)
0.55
0.51
0.54
0.55
0.54
0.62
0.55—
> 100% / 100%
II. Non-Treated Well Water (7 day test)Branch River Control
MHR Control
625%
12.5%
25%
50%
100%
LC50 (percent sample)
LOEC / NOEC (percent sample)
82
98
87
89
80
85
80
>100%
0.62
0.56
0.60
0.51
0.56
0.49
0.54—
>100%/ 100%

TABLE 7-4
RESULTS OF SHORT-TERM CHRONIC REFERENCE TOXICANT TESTSWITH SODIUM CHLORIDE (NaCl)
Species
Ceriodaphniadubia
Pimephalespromelas
TestDate/
Duration
8-11-937 day
7-30-937 day
ReferenceToxicant
2.5 g/L stockprep, daily
10.0 g/L stockprep, daily
Source
Chempure ACSLot # M272KL-
BZ
as above
BiologicalResponse
OffspringProduction
Survival
ChronicEndpoints (g/L)LOEC
1.25
10.0
NOEC
0.625
5.0

TABLE 7-5
RESULTS OF ACUTE REFERENCE TOXICANT TESTSWITH SODIUM CHLORIDE (NaCl)
Species
Daphniamagnet
Ceriodaphruadubia
Oncorhync-hus
mykiss
TestDate/
Duration
7-30-9348 hr.
8-11-9348 hr.8-5-9396 hr.
ReferenceToxicant
16g/Lstock
prep, daily
as above
20g/Lstock
prep, daily
Source
ChempureACSLot#
M272KLBZas above
as above
LC50(g/L)(Method)
5.1(Spearman)
2.2(Spearman)
6.3(MAA)
ConfidenceLimits (g/L)
Lower
4.6
1.8
4.8
Upper
5.7
2.7
8.9

TABLE 7-6
SUMMARY OF WATER QUALITY MEASUREMENTSFOR RECEIVING WATER AND UNDELUTED WELL WATER SAM-
PLES AT TEST INITIATION.
(Means values with range in parentheses).
Parameter
Hardness,mg/L as CaCOj
Alkalinity,mg/L as CaCO3
PH
Conductivity,uS/cm
Dissolvedoxygen, mg/L
Branch RiverWater
417(396 - 430)
340(325 - 345)
837(8.19 - 8.51)
774(759 - 789)
8.5(7.8 - 10.4)
Treated WellWater
336(312 - 360)
322(275 - 360)
8.43(8.15 - 8.91)
540(565 - 705)
8.7(8.0 -10.2)
Non-TreatedWell Water
363(300 - 404)
372(345 - 425)
8.09(7.67 - 8.27)
705(683 - 740)
8.3(7.7 - 8.7)

PEOPLE. PRIDE I. PROGRESS
Office of the Mayor
133 W. State St. 54451 -1797
„
MR PABLO VALENTINREMEDIAL PROJECT MANAGERUS ENVIRONMENTAL PROTECTION AGENCY77 WEST JACKSON BOULEVARDCHICAGO IL 60604-3590

\
I I

8.0 WETLANDS ASSESSMENT
8.1 INTRODUCTION
An assessment of wetlands on and off the Lemberger Landfill Site was conductedfor use during Remedial Design to avoid and/or minimize the impacts of Remedial Action.In general, this assessment included the following:
• Delineating wetlands;• Determining the quality of the wetlands functional values using the Wetlands
Evaluation Technique; and• Conducting a design alternatives analysis.
The results of these activities are discussed in the following subsections.
&2 WETLANDS DELINEATION
In September 1992 a delineation of wetlands on and extending off the LembergerLandfill Site was conducted by Malcolm Pirnie as indicated in the Final Work Plan. Theresults of the wetlands delineation are provided in the Wetlands Delineation Report inAppendix G-l.
83 WETLAND EVALUATION TECHNIQUE (WET) RESULTS
The Army Corps of Engineers Wetland Evaluation Technique, (WET) Version 2.0was applied to the wetlands system in the project area of the Lemberger Landfill. Thepurpose of the application was to identify the qualitative wetland functional values. WETidentifies fourteen wetland function values in terms of Social Significance, Effectiveness andOpportunity. WET uses a series of questions to assign a qualitative ratings of "High","Moderate" or "Low" to each of the values. Social significance assesses the value of awetland to society because of its special features or designations, (Le. historical, recreation-al), economic value, and location. Effectiveness assesses the capability of a wetland toperform functions as a result of its physical, chemical or biological features. Opportunity
2049401-290 8-1

assesses the opportunity of a wetland to perform a function. The wetland functionsevaluated by WET are summarized in Table 8-1. The data in this section reflects the WETresults for the existing wetlands conditions.
A wetland delineation conducted by Malcolm Pirnie biologists in September 1992,identified four palustrine forested wetlands with limited emergent areas in the project area.Because the wetland areas are similar in cover type, and ultimately drain to the BranchRiver, they were assessed by the WET as a single Assessment Area (AA). The Data Formsgenerated by WET represent application of Social Significance Levels 1 and 2, andEffectiveness and Opportunity Levels 1, 2, and 3. The Data Forms are provided inAppendix G-2. The following summary of the WET assessment presents the ratings forSocial Significance, Effectiveness and Opportunity.
• The probability rating for the Social Significance of the current system scores LOWfor all functions. The LOW ratings are a result of the wetlands inaccessibility forrecreational use, limited economic value, lack of official status, and location.
• The Effectiveness probability rating rates the wetlands HIGH for flood control andsediment stabilization and, as a result, also scores high for sediment/toxicantretention and nutrient removal Production export rates MODERATE because ofthe intermittent outlets that control the potential for exporting organic nutrients.The wetlands also rated a LOW probability score for wildlife utilization primarilybecause the area freezes for a period longer than one month, and also because ofprobable contaminant input from the landfill. Aquatic diversity rated LOW becausethe limited area of shallow open water in the wetlands has poor accessibility and isunlikely to provide appropriate fisheries habitat. In addition, the open water areasare subject to fluctuation as a result of precipitation and overland flow from thelandfill. Groundwater recharge and discharge rated LOW because of the claysubstrate underlying the wetlands area and the non-permanent flooded wetlandsconditions that occur.
• Opportunity for the sediment/toxicant retention and nutrient uptake rated HIGHbecause of the wetlands proximity to the landfill and their ability to trap sedimentsand recycle nutrients. The wetlands rated MODERATE for flood control because
2049401-290 8-2

of their opportunity to slow/intercept floodflows based on their location in the lowersection of the watershed.
In summary, the wetlands in the Lemberger Landfill project area, in terms ofeffectiveness provide limited functional value for wildlife diversity and utilization, however,the wetlands have a high probability rating for providing functions for groundwater recharge,floodwater control, and nutrient uptake. The probability ratings assigned by WET inconjunction with data collected during site reconnaissance confirm the probability ratings.
8.4 PRACTICABLE ALTERNATIVES ANALYSIS
8.4.1 GeneralThe No-Action alternative is not a consideration for this project, since the
Lemberger Site Remediation Group is under a Consent Decree with the EPA to cap theLemberger Landfill and remediate groundwater contamination.
In general, construction of the slurry wall at the limits of the landfill will causegroundwater in the upper groundwater unit (UGU), that typically flowed through thelandfill, to flow around the northwestern corner of the landfill This increases the volumeof groundwater flow in the wetlands immediately west of the landfill
Two perched aquifer groundwater pumping alternatives were considered in thisPracticable Alternatives Analysis: the use of a french drain just south of the northernwetland area near MW-10 (Alternative 1) and the use of an extraction well just south of thenorthern wetland area near MW-10 (Alternative 2). Alternative 2 is the recommendedremedial action pumping alternative.
8.42 WET Evaluation of AlternativesData generated by the MODFLOW model (see Section 5.0) was used to estimate
the change to the wetland functional values for each of the two alternatives considered. Acomparative assessment of the WET effectiveness ratings for the alternatives is presentedin Table 8-2.
2049401-290 8-3

8.4.2.1 Alternative Mnstallation of French Drain Near MW-10The WET probability ratings for Alternative 1 represent the projected/future
wetlands impacts that are likely to result from proposed groundwater remediation.Alternative 1 was the pumping scenario presented in the Preliminary Design Report. TheMODFLOW modelling data relative to Alternative 1 is discussed in Section 53.3.4.5 of thisreport Under this alternative, a french drain would be installed at the southern edge of thenorthern wetland area near well MW-10 (see Figure 5-25). Modelling data predicts thatinstallation of the drain in this area would cause a groundwater drawdown of almost 2 feetat the southern portion of the wetland. The WET model was applied to the wetlandsfunctional values to assess changes in the Effectiveness of the wetlands values as a result ofthe predicted drawdown. Because of construction of the slurry wall and landfill closure, theWET model anticipates increased sedimentation because of upgradient soils being disturbedand rates the wetlands probability for sediment retention and nutrient uptake as LOW.However, the rating for these functions is temporary, since revegetation of the landfill areawill increase the probability ratings of these wetlands functions. Results for SocialSignificance and Opportunity remain unchanged from the existing wetlands ratings.
8.4.2.2 Alternative 2-Extraction Well Near MW-10WET probability ratings for Alternative 2 (the recommended groundwater extraction
alternative in Section 5.0) represent the projected/future wetlands impacts likely to resultfrom the installation of an extraction well near monitoring well MW-10 (See Figure 5.26).Modelling of groundwater in the area of the extraction well and adjoining wetlands predictsthat there will be a reduction in groundwater flow and a drawdown of 0.2 to 0.3 feet on thesouthern end of the wetlands which would lessen with the distance from the well site to>0.01 feet over the remainder of the wetlands. A discussion of the Extraction Well ispresented in Section 5.3.3.4.6 of this report.
Application of the WET model to assess the changes to the wetlands functionalvalues as a result of the predicted changes in groundwater flow rates and drawdown indicatethat the Effectiveness ratings are similar to those for Alternative 1. As shown in Table 8-2,a comparative analysis of the Effectiveness ratings for the existing wetlands with thepredicted changes for Alternatives 1 and 2 predict little change in the wetlands functionalvalues. The decreased probability for the sediment retention and nutrient removal istemporary, since revegetation of the landfill and those areas disturbed during construction
2049401-290 8-4

of the slurry wall and closure will enhance the functions of retaining sediments and nutrientuptake.
8.4 J Impacts to Wetlands Water Quality StandardsImpacts to water quality are not anticipated under WDNR Wetlands Water Quality
Standards, NR 103.03 (l)(c) Wis. Adm. Code. The source of contaminants and nutrientsfrom the landfill would be contained by the slurry wall and landfill capping/closure, therebyeliminating these substances from wetlands environment. The effectiveness of the wetlandsin minimizing sedimentation may be temporarily affected during at least one growing seasonuntil vegetation can reestablish on the landfill after areas are disturbed during construction.
Habitat concerns for wildlife utilizing the site stated in NR 103.03 (l)(f) Wis. Adm.Code would be temporary. During the remedial activities phase, wildlife utilizing the sitemay be disturbed in the construction areas. Disturbance will be temporary and removal ofcontaminants from the affected environment would ultimately benefit wildlife.
8.4.4 Impacts to Wetlands in Areas of Special Natural Resource InterestThe wetlands on and extending off the Lemberger Landfill Site appear to discharge
to a tributary that discharges to the Branch River. The Branch River is reported to beannually stocked with trout. Cold water communities addressed in NR 103.04 (1) willbenefit from the remediation of the Lemberger Landfill. Contaminants carried by surfacerun-off would be reduced, and with the additional wetlands treatment (i.e., removal ofsediments, nutrients) on site runoff, surface water quality entering the tributary andultimately the Branch River would be expected to improve.
Concerns for threatened and endangered species expressed in NR 103.01 (6) do notapply to the Lemberger Landfill Site. Studies conducted on the Branch River, data receivedfrom the Wisconsin Natural Heritage Inventory Program and on-site observations indicatethat neither threatened or endangered species nor habitat for these species exist on theproject site or in the Branch River. Therefore, these impacts were not considered.
2049401-290 8-5

TABLE 8-1SUMMARY OF WET EVALUATION RESULTS
Functional Value
Groundwater Recharge
Groundwater Discharge
Floodflow Alteration
Sediment StabilizationSediment/Toxicant Retention
Nutrient Removal/Transformation
Production Export
Wildlife Diversity/Abundance
Wildlife D/A Breeding
Wildlife D/A Migration
Wildlife D/A Wintering
Aquatic Diversity/ Abundance
Uniqueness/Heritage
Recreation
SocialSignificance
L
L
L
L
L
L*
L*
*
*
L
L
L
Effec-tiveness
L
L
H
H
H
H
M*
L
L
L
L*
*
Oppor-tunity
*
*
M*
H
H**
«
«
»
*
*
*
Note: "H" = High, "M" = Moderate, "L" = Low, "U" - Uncertain, and "*"'s identifyconditions where functions and values are not evaluated.

TABLE 8-2SUMMARY OF WET EFFECTIVENESS RESULTS FOR ALTERNATIVES
Functional Value
Groundwater Recharge
Groundwater Discharge
Floodflow Alteration
Sediment Stabilization
Sediment/Toxicant Retention
Nutrient Removal/TransformationProduction ExportWildlife Diversity/ Abundance
Wildlife D/A Breeding
Wildlife D/A MigrationWildlife D/A Wintering
Aquatic Diversity/Abundance
Uniqueness/HeritageRecreation
EffectivenessExisting
L
L
H
H
H
H
M*
LL
LL*
*
Alt 1
L
L
H
H
L
L
M*
L
L
L
1«
*
Alt 2
L
L
H
H
L
L
M*
L
L
L
1*
*
Note: "H" = High, "M" - Moderate, "L" = Low, "U" = Uncertain, and "*"'s identifyconditions where functions and values are not evaluated.
(1): Criterion is eliminated by WET program if future condition is being assessed, modelassigns a LOW value since presence/absence of fish is not known.

9.0 BRANCH RTVER WATER QUALITY SAMPLING
9.1 INTRODUCTION
Based on the FS, full scale operation of the groundwater remediation treatmentfacility will discharge approximately 0.3 mgd of effluent into the river. A Branch Riversurface water quality program was designed to assess the potential impacts on the qualityof water in the Branch River and effects on the ecosystem. The goal of the water qualitysampling program is to identify the surface water quality prior to introduction of treatmentfacility effluent, in order to define baseline conditions for the Branch River.
Background surface water quality sampling was conducted in accordance with NR207.05 Wis. Adm. Code for the following twelve indicator parameters that have water qualitycriteria listed in tables 8 and 9 of NR 105 Wis. Adm. Code and are contaminants of concernfor the groundwater: cadmium, total chromium, copper, lead, selenium, silver, cyanide,methylene chloride, pentachlorophenol, gamma-BHC, arsenic and mercury.
Water quality samples were analyzed for the indicator parameters in accordance withthe Sampling and Analysis Plan and Quality Assurance Project Plan (QAPP) of the WorkPlan. While an attempt was made to achieve lower detection limits for cadmium, totalchromium, copper, lead, selenium, silver and mercury than are typical, the laboratoryfacilities required to implement the "clean methods" protocols are found only at researchlaboratories, such as the University of Wisconsin. Protocols that can be implemented in acommercial laboratory, such as evaporative concentration or analysis by florescence, aredeviations from protocol, or are experimental, and as such are unapproved by USEPA.Consequently, there is no guarantee that a commercial laboratory can achieve the detectionlimits of a research laboratory clean room. As a result, Interpoll Laboratories, Inc. wasdirected to achieve the USEPA method detection limits, or document the interferenceproblems that affect the detection limits. The laboratory was also directed to make an effortto reduce detection limits.
Three (3) sampling stations were identified by the WDNR in accordance with theBranch River Benthic Invertebrate Survey (Figure 9-1). One station was located upstreamof the discharge to collect background water quality data. The two other sampling stationswere located downstream of the point of discharge. The three sampling locations were
2049-001-290 9-1

included in the first (July, 1993) sampling round. The WDNR identified a fourth samplinglocation, downstream of the discharge point, which was included in the second (October,1993) sampling round (Figure 9-2). Water quality, sediment, and benthic sampling locationswere located in close proximity to each other to allow for correlation of data to assessphysical, chemical and biological conditions in the river. Permanent markers identifyingeach station were placed on the shoreline in line with sampling locations.
Each sampling station site was described relative to its physical characteristics. Thesite descriptions are presented in the following sections and include:
• bank characteristics;• percent vegetative cover;• substrate (e.g., rock, cobble, sand) composition, and depth of sediment;• depth of water and width of river;• flow velocity;• temperature, in degrees Centigrade;• dissolved oxygen and pH; and• location and size of scour areas.
The purpose of the first two sampling rounds was to determine whether indicatorparameters are present above state allowable limits. Background pH, dissolved oxygen, riverwater temperature, and hardness data were also collected along with the indicator sampling.A sample to determine total suspended solids was collected during the benthic surveysampling. Two subsequent sampling events will be conducted at three-month intervals.Additionally, if both round 1 or 2 samples indicate that certain indicator parameters areundetected, the additional sampling rounds will not include the undetected indicatorparameters as part of the analyses.
Branch River flow velocities were recorded for each smpling location during bothsampling rounds. Water depth was recorded at each station and was less than three feet atall stations for both sampling rounds. One sample was collected from just below the watersurface at each sample station. A duplicate quality control sample was collected at theupstream station for both sampling rounds.
Water samples were collected by holding the sampling bottle up-stream of thesampling point and opening the hand-held bottle under water. Teflon bottles were used for
2049-001-290 9-2

metals samples and were acid-rinsed and leached as part of the "clean methods" approach,with the intent of reducing extraneous sources of trace metals to the sample. Samples werepreserved and stored as required prior to shipment of Interpoll Laboratories, Inc. Fielddata was recorded in a field notebook including; sample identifications and descriptions, thedate, time and depth of sample collection, and weather conditions. A unique sampleidentification system was used to key each sample to the appropriate location, in accordance
with the QAPP. Results of Round 1 and Round 2 sampling events are presented in thefollowing sections.
92 JULY 1993 SAMPLING ROUND
Branch River surface water quality samples were collected during the week of July20, 1993. Sampling was conducted in accordance with the Work Plan, as discussed in theprevious section, and included three sampling stations (Figure 9-1). Water samples werecollected at all three stations for analysis of the twelve indicator parameters, with a duplicatesample collected from the upstream location.
Physical characteristics for each sampling location were collected in the fielding andare presented in the Water Quality and Sediment Field Sampling Data Forms (AppendixH-l). Analytical results are presented in Appendix H-2: Interpoll Laboratories ReportNumber 9572F. The unique sample numbers and corresponding sample locations are asfollows:
• 9307 WU101 Upstream Location-1• 9307 WU102 (Duplicate) Upstream Location-1• 9307 W201 Downstream Location-2• 9307 WD301 Downstream Location-3
A summary of the analytical results is presented in the following paragraphs.The inorganic analysis results are presented below. Three inorganics were detected
in all three samples and the duplicate sample in the following ranges:
• Arsenic 1.0 to 1.2 ug/L• Cadmium 0.2 to 0.3 ug/L
2049-001-290 9-3

• Lead 4 to 6.3 ug/LSilver was detected in the upstream sample at 1 ug/L, although it was not detected in theduplicate sample analyzed for this location. Copper was detected in all four samples (5 to9 ug/L), however it was detected in the equivalent method blank at 3 ug/L. The inorganicanalyses results for surface water were well below the Human Threshold Criteria (Table 8)or Human Cancer Criteria (Table 9) of NR 105.
Methylene chloride was detected in the upstream sample at a concentration of 3.5ug/L, although it was not confirmed in the duplicate sample. Additionally, results from thetrip blank analyses show methylene chloride was detected at 3.6 ug/L. Analysis resultsappear to be inconclusive since methylene chloride was not detected in the duplicate sampleand was detected in the trip blank. Methylene chloride was detected at a concentrationbelow the Human Cancer Criteria (47 ug/L).
Chloroform was detected in both downstream samples at a concentration of 0.33 and0.35 ug/L, however chloroform was detected in the equivalent method blank at 0.38 ug/Land in the trip blank at 0.44 ug/L. Analysis results appear to be inconclusive sincechloroform was detected in both the equivalent method blank and trip blank. Chloroformwas detected at a concentration below the Human Cancer Criteria (1.8 ug/L).
The only other compound detected during the July 1993 sampling round was 1,1-Dichlorethane. 1,1-Dichlorethane was detected at a concentration of 0.23 ug/L in a surfacewater sample from Downstream Location-2. There is no surface water criteria listed for 1,1-Dichlorethane in NR 105. 1,1-Dichlorethane is not included as one of the twelve indicatorparameters and there is no ambient water quality criteria for the compound. 1,1-Dichlorethane is referred to as a systemic toxicant rather than a carcinogen and is listed inthe USEPA Health Effects Assessment Summary Tables, 3rd quarter, 1990 as having asurface water criteria of 70 ug/L.
9 J OCTOBER 1993 SAMPLING ROUND
The second round of Branch River surface water quality samples was collectedduring the week of October 11, 1993. Samples were collected from the three stationsidentified for the Round 1 sampling event and an additional (4th) location identified by theWDNR (Figure 9.2). Sampling was conducted in accordance with the Work Plan and asdiscussed in section 9.0.
2049-001-290 94
The physical characteristics for each sampling location are presented in AppendixH-2 (Water Quality and Sediment Field Sampling Data Forms). The unique samplingnumbers and corresponding sampling locations are as follows:
• 9310 WU101 Upstream Location-1• 9310 WU102 (Duplicate) Upstream Location-1• 9310 W201 Downstream Location-2• 9310 WD301 Downstream Location-3• 9310 W401 (New location) Downstream Location-4
A Branch River flow rate was calculated from flow rate data collected during theOctober 1993 sampling event. Water depths and velocities were measured at two-footintervals along a river transect in the vicinity of Downstream Location-4 (9310 W401sampling location). Results from the flow rate calculations indicate that the total averageflow rate was approximately 1.56 cubic feet/second during the October sampling period.Results of the flow rate analysis are induded in Appendix H-2. Analytical results from theOctober 1993 sampling event are not available at this time. Results from the October 1993sampling will be summarized upon completion of the laboratory analyses.
2049401-290 9-5

LEGENDSAMPLING LOCATIONS
WETLANDS
SOURCE: BASE MAP FROM USOS WHTTQAW, Wl
JULY 1993 SURFACE WATER SAMPLING LOCATIONSLEMBERGER LANDFILL RDVRA ACTIVITIES FIGURE 9-1
July 1993

So
V
x
' )
v,, V
3>
/
\
l f ln
^

LEGENDSAMPUNG LOCATIONS
SURFACE WATEFSAMPLING STATIONS
PROPOSED DISCHARGE PIPELINE
SOURCE: BASE MAP FROM USGSWHTTELAW.WI
I STOCTOBER 1993 SURFACE WATER SAMPUNG LOCATIONS
LEMBERGER LANDFILL RDVRA ACTIVITIESFIGURE 9-2
October 1993

_ .1
' / -\TT~ "3
\\
rdo .

10.0 BRANCH RIVER SEDIMENT SAMPLING
10.1 INTRODUCTION
Baseline sediment data were collected to evaluate potential impacts to chemicallevels in the Branch River sediments prior to the introduction of treatment facility effluent.The purpose of the sediment sampling effort was to determine if the 12 indicatorparameters are present as well as the additional parameters required in the USEPA's WorkPlan Conditional Approval dated May 4, 1993, the levels of concentration, and to collectdata on particle size and total organic carbon (TOC). Surficial sediment samples wereconcurrently collected with water quality samples during the week of July 20,1993. Samplelocations are shown in Figure 10-1.
Since the Branch River was at a shallow low flow water stage when sedimentsampling was conducted, a large stainless steel scoop was used to collect representativesediment samples. As recommended by the WDNR, composite samples composed of threereplicates were randomly collected from the river's near-shore, mid-reach, and far-shorealong a transect bisecting the river. During sampling, field data were recorded in a fieldnotebook including sample identifications and descriptions, the date, time and depth ofsample collections, weather conditions, and physical characteristics. The field data arereported in Appendix H-l (Water Quality and Sediment Field Sampling Data Forms). Aunique sample identification system was used to key each sample to the appropriatelocation. The unique sampling numbers and corresponding sample locations are as follows:
• 9307SU101 Upstream Location-1• 9307S201 Downstream Location-2• 9307SD301 Downstream Location-3• 9307SD302 Downstream Location-3 (duplicate)
The farthest downstream sampling station and its duplicate were analyzed for thecontaminants of concern as defined in the Work Plan. Sediment analyses were conductedin accordance with SW846 for the following twelve indicator parameters: cadmium, totalchromium, copper, lead, selenium, silver, cyanide, methylene chloride, pentachlorophenol,gamma- BHC, arsenic and mercury. Additional parameters stated in the USEPA's WorkPlan Conditional Approval Letter dated May 4, 1993, include: aromatic volatile organics,
2049401-290 10-1

PAIVnitroaromatics, chlorinated hydrocarbons, PAIvPCB, ethers, antimony, beryllium, nickel,thallium, zinc, and total amenable cyanides.. Total organic carbon (TOC) and particle sizeanalyses were conducted for all three sampling station locations. Analytical results areincluded in Appendix 1-1. Results from the July 1993 Sediment Sampling Round arediscussed in the next section (Section 10.2). •.
10.2 JULY 1993 SAMPLING ROUND
The contaminant analysis results for the downstream location and duplicate sampleare summarized below. Seven inorganics were detected in the following ranges:
Beryllium 0.05 to 0.08 mg/kg• Cadmium 0.02 mg/kg• Chromium 2.0 to 2.8 mg/kg .
Copper 2.3 to 2.6 mg/kg -Nickel 1.3 to 1.5 mg/kgLead 1.3 to 1.6 mg/kg
• Zinc 4.5 to 6.6 mg/kgSilver was found in the sample at its' detection limit of 0.02 mg/kg, but was not detected inthe duplicate sample.
The following six PAH's were detected in the sample, but not in the duplicatesample:
• Pyrene 18 ug/kg• Chrysene 67 ug/kg• Benzo(a)anthracene 216 ug/kg• Benzo(b)fluoranthene 1 ug/kg• Benzo(k)fluoranthene 0.8 ug/kg• Benzo(a)pyrene 18 ug/kg
One pesticide (a-BHC) was detected in the sample at 1 ug/kg, but was not detected in theduplicate sample.
All three samples were analyzed for TOC and had results of 400 mg/kg in theupstream sample, 500 mg/kg in the downstream sample taken nearest the proposed pointof discharge (location 2) and 160 mg/kg in the farthest downstream sample and 140 mg/kgin the farthest downstream sample duplicate. The results for the grain size analysisclassified the farthest downstream location as sand with gravel, while the downstreamlocation nearest the proposed point of discharge and upstream location were" classified assand with silt and gravel.
2049-001-290 10-2

With the exception of beryllium for which results did not exist in the referencedocument, all the metals detected in sediment were all below the "no-effect" and "lowest-effect" levels negatively impacting aquatic species/and significantly lower than the Limit ofTolerance (NYSDEC, 1989). The Limit of Tolerance is defined as the concentration whichwould be detrimental to the majority of species, potentially eliminating most. Again withthe reference exclusion of beryllium, results for a study determining the previouslymentioned metals significant mortality to the prawn Mysidacea rosenbergii in SheboyganRiver sediment, were all significantly higher than the concentrations found in the BranchRiver sediment (NOAA 1991). Beryllium does not bioaccumulate significantly in aquaticorganisms and does not significantly biomagnify within food chains (ATSDR 1992).
The detection of the six PAH's at the furthest downstream sampling location maybe attributed to conditions specific to the sample area. The sample location is in the vicinityof a roadway overpass with open storm drains that discharge upstream of the samplinglocation to the river. These compounds are associated with roadway runoff and commonlyfound near areas of vehicular traffic. AU of the PAH's detected were well below the EPAinterim mean freshwater sediment quality criteria based upon the Sediment-WaterEquilibrium Partioning Approach at 1% TOC (NOAA 1991). In this approach, the criteriaare established for single chemicals at concentrations in sediment that ensure that theconcentrations in interstitial water do not exceed the applicable EPA water quality criteria.
The lone pesticide detected slightly above the detection limit lies within the River'sdrainage basin in an area with high agricultural usage in addition to large residential lawns.Since pesticide application is common on both types of land, it is difficult to determine theorigin of this compound given its trace amount in the sediment.
2049-001-290 10-3

LEGENDSAMPUNG LOCATIONS
_ J ,j .-t'/ V^PROPOSED DISCHARGE PIPEUNE
BASE MAP FROM USGS WHTTELAW
JULY 1993 SEDIMENT SAMPLING LOCATIONSLEMBERGER LANDFILL RDVRA ACTIVmES
July 1993

11.0 BRANCH RIVER BENTHIC INVERTEBRATE SURVEY
11.1 INTRODUCTION
The assessment of river conditions included the characterization of the substrate andvariations in the range of benthic habits. A benthic survey was conducted to inventorymacorinvertebrates and assess biological conditioning in the Branch River upstream anddownstream of the discharge point. Three sampling stations were located on the BranchRiver and sampled April 14 and 15,1993 to assist in characterizing water quality and benthicpopulations using benthic macroinvertebrate community metrics as part of the LembergerLandfill remediation project. The three sampling stations were field identified in the fieldby the WDNR and are shown in Figure 11-1. Benthic survey sampling procedures andresults are discussed in the following subsections. A Rapid Bioassessment Report on thebenthic samples collected in the Branch River was prepared by Dr. Stanley W. Szczytko ofthe University of Wisconsin-Stevens Point and is included as Appendix J-l.
112 SAMPLE COLLECTION
Three transects were established parallel to the shoreline (near-shore, mid- and far-shore) at each station for the purpose of. taking benthic macroinvertebrate rapidbioassessment samples. Three replicate samples were taken at each sampling station, (oneat each of the sampling transects) and two scrape samples were collected from support
structures at roadway overpasses at sampling stations 1 and 2. The methods described inAppendix J-l for biotic index sampling were used to take the samples. These methods havebeen used by the WDNR since 1979 to assess stream water quality. Benthic macroinvertebr-ate samples were collected with a D-frame kicknet by kicking and disturbing the substratein an area approximately 1 meter directly upstream. Data for each sample were recordedon a standard field form (WDNR Form 3200-81) which included relative substratecomposition, visual in-stream water quality indicators, water depth velocity, pH, conductivity,temperature and dissolved oxygen. A water sample was collected at each sampling stationfor total suspend solids (TSS) analysis. Field data forms and details on TSS laboratoryresults can be found in Appendix J-2.
2049-001-290 11-1

Sample station transect lengths were recorded at approximately 59.5 ft, 60 ft and 105ft for sampling stations 1, 2 and 3 respectively. The principal substrates along the transectswere composed of a mixture of rock rubble, gravel and boulders which are characteristic ofthe major substrates in that reach of the Branch River. Also present in varying smalleramounts were clays, sands, silts and organic debris. The Branch River current velocities andwater depth were measured at each sampling location and ranged from 1.0 to 1.1 ft/sec and2.0 to 3.0 feet respectively. Dissolved oxygen and temperature were recorded and rangedfrom 12.3 to 13.6 mg/1 and 5.3 to 6.2 * C, respectively.
113 BENTHIC IDENTIFICATION
The coefficient of variation (CV - standard deviation/mean), was used in this studyto estimate variability of the 9 benthic community measures among replicate samplesbecause it is unit independent and allows comparisons of the variability of values withdifferent measures. Variability associated with biotic measures used to assess water qualityis important because the measure must be able to detect change or impairment when it hasoccurred, and must not indicate change when it has not occurred. Biotic measures may notaccurately indicate that a change has or has not occurred if the variability of the measureis high. The biotic index (BI), family biotic index (FBI) and Margalef s diversity index hadthe lowest variability of all the measures used in this study, which is consistent with otherrecent studies. The percent variability for these measures was usually less than 10% withthe exception of Station 1 (BI -16.3%, FBI -11.4%). The variability of the other measuresvaried from 15 - 89% and the EPT (Ephemeroptera-Plecoptera-Trichoptera) measuresgenerally were above 35%. This indicates that the BI, FBI and Margalef s diversity indexhad the most reliability for the data in this study. For a breakdown of the individual resultsat each of the 9 transect stations and two substrate scrapes, see Appendix J-l.
It should be noted that at the time of sampling, water levels were high due to recentsnow melt and runoff which may have prevented obtaining representative benthic samples.Sampling under high flow conditions is not recommended due to unnatural benthicdistributions, problems with physically gaining access to sampling locations and escapementof organisms dislodged from the substrate. The recommended 100 arthropods necessary tocalculate the BI was attained in only 2 of the 9 benthic samples and 1 of the 2 scrapesamples. The mean total numbers was 54.7 for station 1, 81 for station 2 and 72.3 for
2049-001-290 11-2

station 3. The low total numbers may not be considered as characteristic of these sitesunder normal flow conditions.
2049-001-290 11-3

LEGENDSAMPLING LOCATIONS
WETLANDS
BENTHIC SURVEYSAMPLING STATIONS
PROPOSED DISCHARGE PIPEUNE
SOURCE: BASE MAP FROM USGSWHTTa^W.WI
FIGURE 11-1APRIL 1993 BENTHIC SURVEY SAMPLING LOCATIONSLEMBERGER LANDFILL RDVRA ACTIVmES

12.0 FISHERIES AND THREATENED/ENDANGERED SPECIESSURVEY
12.1 INTRODUCTION
A Fisheries and Threatened/Endangered Species Survey was conducted for theBranch River area during June, 1993. The survey included two studies conducted by theUniversity of Wisconsin. One study concentrated on the Branch River Fish Community andHabitat (Appendix K-l) and the other on the freshwater mollusks from the FamilyUnionidae (Branch River Mussel Survey-Appendix K-2). Principal investigators for the fishstudy were Dr. Frederick Copes and Stephen P. Czajkowski. Dr. Edward M. Sternconducted the mollusk study with collection assistance from Dr. Copes. The Survey Resultsare summarized in the following subsections.
12 2 BRANCH RIVER FISH COMMUNITY AND HABITAT SURVEY
The fish community and habitat survey area encompassed approximately 2 miles(channel length) of the Branch River in Sections 22 and 27 of Franklin Township,Manitowoc County, Wisconsin. The survey area was divided into five segments, with eachsegment approximately 900 feet in length. Fish were collected with a 220 volt D.C. streamshocker running at between 5 to 7 amperes. Sites were sampled from the downstream pointupstream so as to minimize disturbance of the substrate. All shocking was timed with astopwatch for Catch per Unit Effort (CPUE) analysis. After a site was sampled, fish wereidentified by species and counted. Samples were preserved in formalin and stored at theUniversity of Wisconsin Museum.
Habitat measurements were made at the same sites sampled for fish communitystructure. Since this area of the Branch River is characterized by primarily slow-movingstretches, both length and width of riffle and pool complexes were measured and recorded.Four to five transects were run for each site and all data was recorded on WDNR Forms3600-183 (Appendix K-l). Length, width, depths and bank height were recorded along withsubstrate by percent composition of bottom sediments (i.e. sand, silt, muck etc.). Theamount of erosion, instream cover percentage and type, and species of bank vegetation withpercentage of overhead cover were also recorded. Water quality characteristics weremeasured and included dissolved oxygen (DO), pH, total alkalinity, water level stage, water
2049-001-290 12-1

and air temperatures. The individual results of the habitat surveys for each of the five sitesare summarized in Appendix K-l.
The stretch of the Branch River that includes this study area is characterized by theWDNR as generally being low-gradient (approximately one foot per mile) and softbottomed. It is predominantly considered a coldwater stream although water temperatureregimes permit the presence of species typically found in cool to warm waters. River watercolor was tea-stained during the survey and turbidity was considered low. The paucity ofinstream structure resulted in concentrating high numbers and varieties offish in these areascompared to open channel sections. The canopy was mostly open throughout the studyarea. The primary landuse surrounding the study area is agricultural with the predominantgrass being reed canary. The riparian zone fluctuates from less than 20 to over 3000 feetdepending on the specific location along the river. Maples, elms, basswood and willows arescattered throughout the riparian zone where the zone has not undergone agriculturaldevelopment. Erosion impact was generally light overall except for a few upstream locationswhere erosion could be considered heavy.
Species richness and CPUE (used to classify a species as present, common orabundant) were determined for each individual site and for all five sites together. Presence,commonness and/or abundance could not be compared with previous studies because theWDNR did not report CPUE. A total of 26 species of fish representing six families werefound in the study area. Species richness was greatest at two of the five sites with 18 and19 species respectively. Species found exclusively at these two sites included thosepreferring well oxygenated cool water. Species richness was least at the site withwarmwater species dominating the catch. No species of special concern were found in anyof the five sites sampled. For a breakdown of the number and types of fish species caughtat each sampling location, see Appendix K-l.
Species composition and abundance of species varied between sites depending onthe types of habitat found in each site. The common shiner, bluntnose and fatheadminnows, and the white sucker were common to abundant at sites where slow-movingstretches characterized the channel. At sites where riffles and braided channel areas werepredominantly present, the largescale stoneroller, blacknose and longnose dace, and johnnyand blackside darters were found common to abundant. For all sites combined, the mostabundant species were the common shiner and the white sucker. The least abundant speciesfor all sites combined were the black bullhead and the black crappie. The rainbow trout was
2049-001-290 12-2

common at one of the five sites, but became merely present when all sites were groupedbecause it was not found at the other four sites.
123 BRANCH RIVER MUSSEL SURVEY
Freshwater mollusks were collected from the five fish and habitat survey locationsalong the Branch River, as discussed in the previous section. The ecological data for eachsite were collected by Dr. Fred Copes and are included in Appendix K-2. Members of theFamily Unionidae were identified to species for each locality. The results from the musselsurvey were tabulated for each site. Length and height measurements (in mm) wererecorded for each complete set of valves.
Only 3 live specimens were collected during the study, none of which representedgravid females. The designation "live" identifies those specimens that contained soft tissuewhile "freshly dead" refers to those specimens that contained no soft tissue where thenacreous lining of the shell still had some lustre. EUiptio dilatata was the most com-mon/abundant species found and represented 76% of the total number of unionidscollected. None of the unionid species collected represent an endangered or threatenedspecies at either the state or federal level. The unionid species are widespread and relativelycommon in the Branch River.
2049-001-290 12-3

13.0 SUBSURFACE SOIL INVESTIGATION
13.1 INTRODUCTION
The Subsurface Soil Investigation for the Lemberger Landfill site was designed toobtain information necessary for the construction of the slurry wall around the landfill itselfas well as for the proposed discharge pipeline for the treated groundwater. The field workfor both areas of interest began on October 19, 1993, and concluded on October 26, 1993.Malcolm Pirnie, Inc. subcontracted with Braun Intertec from Minneapolis, Minnesota, toperform the drilling. Braun Intertec supplied a track-mounted CME 55 Drill Rig and 3 V4"inside diameter hollow-stem augers to conduct the drilling.
132, SLURRY WALL
Twenty-one soil borings were drilled along the proposed slurry wall perimeter asshown in Figure 13-1. Except for SWB-14 and 15, each boring was continuously sampledaccording to standard penetration test methods (ASTM D1586). Using a 140-pound weight,dropped repeatedly from a 30" height, the drillers drove the two-inch diameter split-barrelsampler two feet beyond the augers to collect the soil samples. SWB-14 and 15, drilledthrough the existing landfill, were not sampled until the driller suspected that the augerswere below the landfill material and into native soils. Each boring was advanced until thehole extended approximately four to six feet into the clay till A Malcolm Pirniehydrogeologist screened the hole and cuttings with an HNu photoionization detector andMSA 261 combustible gas indicator and logged the soil samples. The boring logs appear inAppendix L-l. SWB-10 had to be moved because a large void and thick wood wereencountered in the original boring, effectively stopping auger advancement. The log for theoriginal boring is included as SWB-10A.
The borings were abandoned by pumping a bentonite slurry to a final depth ofapproximately two to three feet below grade and topping it off with a neat cement grout.Cuttings were shoveled into 55-gallon drums and stored in the staging area on site.
At least one sample of the upper granular unit was selected from each boring (exceptfor borings SWB-14 and 15, which were drilled through the landfill itself) and submitted toBraun Intertec's soils laboratory for particle size analysis. One split-barrel sample of theclay till was selected from each boring and submitted to the same laboratory for determina-
2049401-290 13-1

tion of Atterberg limits. Also, a total of six Shelby-tube samples were collected from theclay till and submitted for determination of Atterberg limits and dry density. Two of thesesamples (from SWB-1 and SWB-9) were also tested for permeability. The soil samples andthe depths from which they were collected are listed in Table 13-1. At this time, thelaboratory results are not complete. When available, the results will be provided to theUSEPA and WDNR.
These slurry wall borings indicate that the clay till underlies the entire landfill siteat depths ranging form approximately 14 feet in the southeastern corner to approximately32 feet in the northwestern corner. Close examination of the samples revealed only oneobservable vertical fracture, approximately one foot in length, in SWB-14. This fractureappeared at a depth of approximately sixteen to seventeen feet below grade.
133 PIPELINE ROUTE
Six soil borings were drilled along the proposed route of the discharge pipeline forthe treated groundwater as shown in Figure 13-2. Each boring was continuously sampledaccording to standard penetration test methods (ASTM D1586) to a total depth of ten feetbelow grade. Using a 140-pound weight, dropped repeatedly from a 30" height, the drillersdrove the two-inch diameter split-barrel sampler two feet beyond the augers to collect thesoil samples. A Malcolm Pimie hydrogeologist screened the hole and cuttings with an HNuphotoionization detector and logged the soil samples. The boring logs are included inAppendix L-l. Each hole was abandoned by pumping bentonite slurry to a final level of 2-3feet below grade and topping it off with the sillier, near-surface soils from the cuttings. Theremaining cuttings were shoveled into a 55-gallon drum and stored on site.
Two samples of silty sand found overlying the clay till in PLB-1 and PLB-2 weresubmitted to Braun Intertec's soils laboratory for particle size analysis. One sample of theclay till from each pipeline route boring was submitted to the laboratory for determinationof Atterberg limits. The samples and the depths from which they were collected are listedin Table 13-2. At this time, the laboratory results are not complete. When available, theresults will be provided to the USEPA and WDNR.
These borings indicate that the day till underlies the entire proposed pipeline routeat depths ranging from approximately five to eight feet below grade level At the easternend, silty sand overlies the clay till. This silty sand layer appears to grade into clayey siltand silty clay to the west.
2049401-290 13-2

TABLE 13-1
SLURRY WALL BORINGS SOIL SAMPLE RECORD[Sample No. (Sample depth from surface)]
Soil BoringLD. Number
SWB-1
SWB-1
SWB-2
SWB-3
SWB-3
SWB-4
SWB-5
SWB-5
SWB-6
SWB-6
SWB-7
SWB-8
SWB-9
SWB-9SWB-10
SWB-11
SWB-12
SWB-12
SWB-13
SWB-14
SWB-14
SWB-15
ParticleSize
181(7-7.5 ft)
182(85-9 ft)
162(7.5-8 ft)
150(7.5-8 ft)—
137(7 .5-8 ft)
107(10.5-11 ft)~.
92(10.5-11 ft)
95(19-19.5 ft)
77(9-9.5 ft)
59(13.5-14 ft)
125(13-14 ft)
127(17.5-18 ft)48(19.5-20 ft)
34(22.5-23 ft)
8(10-10.5 ft)—
19(11-11.5 ft)—
—
—
AtterbergLimits
193(27.5-28 ft)
TW-5(28-30 ft)175(29-29.5 ft)
159(23.5-24 ft)
TW-4(24-26 ft)
146(21.5-22 ft)
118(355-36 ft)
TW-2(32-33.5 ft)103(34.5-35 ft)
—
88(29 .5-30 ft)
70(335-34 ft)
133(29.5-30 ft)
TW-3(26-28 ft)52(263-27 ft)
41(35-35.5 ft)
12(14-145 ft)
TW-1(16-18 ft)
24(25-255 ft)
198(15.5-16 ft)
TW-6(18-195 ft)
194(195-20 ft)
DryDensity
TW-5 (28-30 ft)—
_
_
TW-4(24-26 ft)_
TW-2(32-33.5 ft)—_
—__
TW-3(26-28 ft).__
—
TW-1(16-18 ft)~
—
TW-6(18-19.5 ft)——
Permeability
TW-5(28-30 ft)_
—_
—
_
_
—
_
—
~.
_
TW-3(26-28 ft)_———
—————

TABLE 13-2
PIPELINE ROUTE BORINGS SOIL SAMPLE RECORD[Sample No. (Sample Depth from surface)]
Soil BoringLD. Number
PLB-1
PLB-2PLB-3PLB-4PLB-5PLB-6
Particle Size
202(2-2.5 ft)
209(4-4.5 ft)—
—
_
—
Atterberg Limits
207(8 .5-9.5 ft)
21 1(8.8 .5 ft)
216(9-9.5 ft)221(9-9.5 ft)224(7.7.5 ft)
230(7.7.5 ft)

14.0 INFILTRATION GALLERY ALTERNATIVE INVESTIGATION
14.1 INTRODUCTION
As an alternative to the discharge of treated water to the Branch River, the use ofan infiltration gallery was evaluated. An infiltration gallery consists of engineered seepagestructures installed in a permeable but unsaturated soil The soil accepts water from thegallery, which infiltrates to the local water table.
A review of data contained in the RI Report found an unsaturated portion of theLGU to be present relatively close to the surface in the area immediately south of theLemberger Landfill During August and September, 1993, two test borings were installedand the LGU was tested for hydraulic performance at this location. After testing, theborings were abandoned in accordance with NR 141, Wise. Adm. Code.
142 DATA COLLECTION
Two percolation test borings were drilled at the locations shown in Figure 14-1.Twelve-inch diameter casing was used to seal off the perched water table in the UGU, andthe borings were advanced through the casing using hollow stem augers. Borings wereterminated at the top of bedrock, and 4-inch diameter PVC pipe was used to keep theboring open. Ten feet of 50 slot PVC continuous slot screen was used at the bottom of thepipe string. No water was encountered in the LGU. Boring logs are included in AppendixM-l.
The test procedure consisted of filling the standpipe with water, and eithermaintaining the level in the pipe as a constant head type test or recording the rate of fallof the water level as a falling head type test. A water tank and centrifugal pump were usedto supply water. A globe valve in the discharge line regulated flow, and a spring and pistonflow meter was used. For low flows, the bucket and stopwatch method was used for greateraccuracy. The test water was potable municipal water from the City of Whitelaw.
20*9-001-290 14-1

143 DATA REDUCTION
The data from the falling head type tests were reduced using the Bouwer and Riceslug test method. In order to use this method, an assumption was made that the areaaround the screen had become sufficiently saturated during the previous test cycles (fallinghead and constant head) that the requirement for saturated conditions was essentially met.Since the effects of point injection tests are dissipated within about a foot of the boring,(Ziegler, 1976), this is a reasonable assumption. Errors due to this assumption will tend toresult in lower calculated hydraulic conductivities, which makes the results more conservativefor evaluating the gallery alternative. The results of the tests are shown in Table 14-1. Thetest data and calculations are included in Appendix M-2.
As a check on the results produced by the Bouwer and Rice method, the data fortest boring IW-1 was reduced by two other methods. The data from the constant head typetest was reduced as a borehole pump-in test (packer test) (Ziegler, 1976). The clay tillabove the LGU was assumed to be one packer, and the cap at the end of the screen wasassumed to be the other. The results are included in Table 14-1, and agree with the resultsof the Bouwer and Rice method. Calculations are included in Appendix M-2.
The data from a constant head cycle and the immediately following falling head cyclewere combined and treated as a "Falloff Test" (Earlougher, 1977). This uses a Horner plotof head and time data to determine the slope of a semilogarithmic line. The slope of theline is then used to calculate hydraulic conductivity. The results are included in Table 14-1,and agree with the results of the other two methods. Calculations are included in AppendixM-2.
The tests showed the LGU to have a hydraulic conductivity of about 10'5 cm/s. Thisis lower than reported in the RI Report for other tests in the LGU, but the very silty natureof the unit at this location indicates that a lower conductivity should be expected. Becausethis represents a conservative or "worst case" estimate of the conductivity, 10"5 cm/s wasused in constructing a model to evaluate the gallery alternative.
2049401-290 14-2

14.4 MODELING
A three-dimensional ground water flow model covering several square miles wasconcurrently under development for the purpose of evaluating remedial action details. Themodel was based on MODFLOW, and is described in detail in Section 5.0. The model wasused to predict the effects of constructing an infiltration gallery at this location, anddisposing of 360,000 gpd of treated water. The model predicted that heads in the bedrockwould stay below the top of rock, and heads in the LGU would stay below the top of theLGU except near the boundary conditions, at an infiltration rate of 1 gpd/ft2. This is areasonable infiltration rate for an engineered structure, and indicates that the concept istechnically feasible. However, the gallery requires approximately 8 acres of infiltration areato handle the expected discharge of the treatment plant. The construction costs of a facilitythis size may not be economically feasible. The economic analysis may be conducted duringthe remedial design, which is currently in progress.
14.5 CONCLUSION AND RECOMMENDATIONS
The infiltration gallery is a technically feasible alternative for the discharge of treatedwater from the remediation treatment plant. The predicted size of the infiltration gallery(approx. 8 ac.) for currently anticipated conditions may make the gallery economicallyinfeasible.
The infiltration gallery should be considered in the remedial design through the stageof an economic analysis, and the feasibility of the alternative should be reevaluated basedupon that information.
2049401-290 14-3

TABLE 14-1
INFILTRATION GALLERY TEST RESULTS
TESTBORING
IW-1
IW-2
HYDRAULIC CONDUCTIVITY (cm/s)
Bouwer & RiceMethod
4 x lO'5
4 x 10's
Pump-InMethod
7 x lO'5
NA
Falloff TestMethod
IxlO-5
NA
NA: Not Analyzed

15.0 LANDFILL GAS PERIMETER MONITORING
Six landfill gas perimeter monitoring wells were installed at the locations shown inFigure 15-1 between August 12 and 27,1993. The boring logs and well construction detailsare included in Appendix N-l. Each gas well was set at a depth just above the observedwater table on the date of installation. These completion depths range from approximately3.5 feet below grade level (GW-2 - northwest corner of landfill) to approximately 7.5 feetbelow grade level (GW-3 - northeast corner of landfill). In order to leave enough room fora bentonite seal above the perforated zone, GW-2, 4, 5 and 6 have only two feet ofperforated pipe at the bottom of the well Gas wells GW-1 and GW-3 have the specifiedthree feet of perforated pipe.
The first round of gas monitoring was conducted on September 11, 1993. Thismonitoring event followed the procedure described in the work plan. The results of thisevent are shown in Table 15-1.
The effects of the day's warming can be seen in the temperature data. The first welltemperature reading collected in the morning was 13.2° C (at GW-4), which is comparableto the ambient air temperature (15°C) at that time. At the second well monitored (GW-5),the recorded air temperature from the well was 25.2°C. The ambient temperature was notyet that warm, but direct sunlight on the metal couplings was probably increasing thetemperature of the air passing the temperature probe.
The warming temperature also probably affected the moisture inside the gas wellsand tubing. The last three wells monitored, GW-2, 3 and 6, produced HNu readings of 1.4ppm. Because the HNu reacted in precisely the same manner at each well, it is probablethat moisture from within the wells or tubing confounded the readings.
The data collected during the first round of gas monitoring suggests the following:
• Methane is likely present in the screened zones of GW-1 and GW-4.• Toxic gas (hydrogen sulfide) may be present at a low level in GW-1.• No volatile organic compounds were present at levels detectable by a 10.2eV
HNu photoionization detector (levels shown in Table 15-1 thought to be dueto moisture).
• No pressure gradient was detected in any of the wells.
204WJ01-290 15-1

SDMS US EPA REGION VFORMAT-ILLEGIBLE - 5
IMAGERY INSERT FORM
The item(s) listed below are not available in SDMS. In order to view originaldocument or document pages, contact the Superfund Records Center.
SITE NAME
DQCID#DESCRIPTION
OF1TEM(S)REASON WHY
UNSCANNABLE
DATE OF ITEM(S)
NO. OF ITEMS
PHASE
PRPi>W A CTTrxlAiSJli
(AR DOCUMENTS ONLY)
o.u.LOCATION
LEMBERGER LANDFILL INC
116512
MAPS
ILLEGIBLE OR X FORMAT(OVERSIZED)
NONE
3
REM
Remedial Removal Deletion Docket
Original Update # Volume of
Box# 4 Folder # 2 Subsection K10
COMMENTS

The second round of gas monitoring has not been scheduled at this time, but willoccur sometime after November 11, 1993.
2049-001-290 15-2

TABLE 15-1GAS WELL MONITORING RESULTS
Gas Well
GW-1
GW-2
GW-3
GW-4
GW-5
GW-6
Pressure Gradient
(PSD
0
0
0
0
0
0
Combustible
Gas
(%LEL)
100 +
1
1
100+
2
0
o*(%)19.0
20.5
20.6
13.8
20.7
20.4
HjS
(PPM)
1
0
0
0
0
0
HNn
Reading(PPM)
0
1.4
1.4
0
0.2
1.4
Temperature
(°C)
24.2
25.1
24.0
13.2
•252
22.6

US!" GAS WELL LOCATIONSLEMBERGER LANORLL RO\RA ACTIVITIES
RGURE 15-1