Rapid health transition in China 1990–2010: findings from the Global Burden of Disease Study 2010
29
Articles www.thelancet.com Vol 381 June 8, 2013 1987 Rapid health transition in China 1990–2010: findings from the Global Burden of Disease Study 2010 Gonghuan Yang*, Yu Wang*, Yixin Zeng, George F Gao, Xiaofeng Liang, Maigeng Zhou, Xia Wan, Shicheng Yu, Yuhong Jiang, Mohsen Naghavi, Theo Vos, Haidong Wang, Alan D Lopez, Christopher J L Murray Summary Background China has undergone rapid demographic and epidemiological changes in the past few decades, including striking declines in fertility and child mortality and increases in life expectancy at birth. Popular discontent with the health system has led to major reforms. To help inform these reforms, we did a comprehensive assessment of disease burden in China, how it changed between 1990 and 2010, and how China’s health burden compares with other nations. Methods We used results of the Global Burden of Diseases, Injuries, and Risk Factors Study 2010 (GBD 2010) for 1990 and 2010 for China and 18 other countries in the G20 to assess rates and trends in mortality, causes of death, years of life lost (YLLs), years lived with disability (YLDs), disability-adjusted life years (DALYs), and healthy life expectancy (HALE). We present results for 231 diseases and injuries and for 67 risk factors or clusters of risk factors relevant to China. We assessed relative performance of China against G20 countries (significantly better, worse, or indistinguishable from the G20 mean) with age-standardised rates and 95% uncertainty intervals. Findings The leading causes of death in China in 2010 were stroke (1·7 million deaths, 95% UI 1·5–1·8 million), ischaemic heart disease (948 700 deaths, 774 500–1 024 600), and chronic obstructive pulmonary disease (934 000 deaths, 846 600–1 032 300). Age-standardised YLLs in China were lower in 2010 than all emerging economies in the G20, and only slightly higher than noted in the USA. China had the lowest age-standardised YLD rate in the G20 in 2010. China also ranked tenth (95% UI eighth to tenth) for HALE and 12th (11th to 13th) for life expectancy. YLLs from neonatal causes, infectious diseases, and injuries in children declined substantially between 1990 and 2010. Mental and behavioural disorders, substance use disorders, and musculoskeletal disorders were responsible for almost half of all YLDs. The fraction of DALYs from YLDs rose from 28·1% (95% UI 24·2–32·5) in 1990 to 39·4% (34·9–43·8) in 2010. Leading causes of DALYs in 2010 were cardiovascular diseases (stroke and ischaemic heart disease), cancers (lung and liver cancer), low back pain, and depression. Dietary risk factors, high blood pressure, and tobacco exposure are the leading risk factors[A:for short life-expectancy? Or for all indicators of poor health?]. Ambient air pollution ranked fourth (third to fifth; the second highest in the G20) and household air pollution ranked fifth (fourth to sixth; the third highest in the G20) in terms of the age-standardised DALY rate in 2010. Interpretation The rapid rise of non-communicable diseases driven by urbanisation, rising incomes, and ageing poses major challenges for China’s health system, as does a shift to chronic disability. Reduction of population exposures from poor diet, high blood pressure, tobacco use, cholesterol, and fasting blood glucose are public policy priorities for China, as are the control of ambient and household air pollution. These changes will require an integrated government response to improve primary care and undertake required multisectoral action to tackle key risks. Analyses of disease burden provide a useful framework to guide policy responses to the changing disease spectrum in China. Funding Bill & Melinda Gates Foundation. Introduction China has made enormous strides in improving health in the past few decades. Between 1970 and 2010, male life expectancy increased from 60·4 years to 72·9 years and female life expectancy increased from 63·5 years to 79·0 years; 1 the under-5 mortality rate reduced from 100·6 per 1000 to 12·9 per 1000; 1 and the total fertility rate declined from 4·77 to 1·64 children per woman. 2 Rapidly increasing income per head, an ageing population, and longer life-spans have led to a rapid change in the health profile of the nation. Some counties within the country, however, remain relatively poor and continue to have a set of health challenges dominated by communicable, maternal, and neonatal causes. 3,4 China needs to under- stand and formulate a long-range strategy to tackle several challenges in public health and medical care at the same time. Before health-care reform was announced in 2009, 5 the Chinese Government was faced with widespread public discontent stemming from unaffordable access to health care and growing inequalities in access to health care and health status across regions and populations. 6–9 Health improvement fell short of what China’s rapid economic growth should have afforded. 10 Some previously eliminated Lancet 2013; 381: 1987–2015 *Joint first authors Institute for Health Metrics and Evaluation, University of Washington, Seattle, WA, USA (Prof C J L Murray MD, M Naghavi PhD, Prof T Vos PhD, H Wang PhD); Institute of Basic Medical Sciences, Chinese Academy of Medical Sciences & School of Basic Medicine, Peking Union Medical College, Beijing, China (X Wan PhD, Prof G Yang MD); Peking Union Medical College, Beijing, China (Y Jiang MBA); and Chinese Center for Disease Prevention and Control, Beijing, China (G F Gao PhD, X Liang PhD, Y Wang MD, S Yu PhD, Y Zeng MD, M Zhou PhD) Correspondence to: Prof Christopher J L Murray, Institute for Health Metrics and Evaluation, University of Washington, 2301 Fifth Avenue, Suite 600, Seattle, WA 98121, USA [email protected] TD 13tl2999 D-13-02999 S0140-6736(13)61097-1
Transcript of Rapid health transition in China 1990–2010: findings from the Global Burden of Disease Study 2010

Articles
www.thelancet.com Vol 381 June 8, 2013 1987
Rapid health transition in China 1990–2010: findings from the Global Burden of Disease Study 2010Gonghuan Yang*, Yu Wang*, Yixin Zeng, George F Gao, Xiaofeng Liang, Maigeng Zhou, Xia Wan, Shicheng Yu, Yuhong Jiang, Mohsen Naghavi, Theo Vos, Haidong Wang, Alan D Lopez, Christopher J L Murray
SummaryBackground China has undergone rapid demographic and epidemiological changes in the past few decades, including striking declines in fertility and child mortality and increases in life expectancy at birth. Popular discontent with the health system has led to major reforms. To help inform these reforms, we did a comprehensive assessment of disease burden in China, how it changed between 1990 and 2010, and how China’s health burden compares with other nations.
Methods We used results of the Global Burden of Diseases, Injuries, and Risk Factors Study 2010 (GBD 2010) for 1990 and 2010 for China and 18 other countries in the G20 to assess rates and trends in mortality, causes of death, years of life lost (YLLs), years lived with disability (YLDs), disability-adjusted life years (DALYs), and healthy life expectancy (HALE). We present results for 231 diseases and injuries and for 67 risk factors or clusters of risk factors relevant to China. We assessed relative performance of China against G20 countries (significantly better, worse, or indistinguishable from the G20 mean) with age-standardised rates and 95% uncertainty intervals.
Findings The leading causes of death in China in 2010 were stroke (1·7 million deaths, 95% UI 1·5–1·8 million), ischaemic heart disease (948 700 deaths, 774 500–1 024 600), and chronic obstructive pulmonary disease (934 000 deaths, 846 600–1 032 300). Age-standardised YLLs in China were lower in 2010 than all emerging economies in the G20, and only slightly higher than noted in the USA. China had the lowest age-standardised YLD rate in the G20 in 2010. China also ranked tenth (95% UI eighth to tenth) for HALE and 12th (11th to 13th) for life expectancy. YLLs from neonatal causes, infectious diseases, and injuries in children declined substantially between 1990 and 2010. Mental and behavioural disorders, substance use disorders, and musculoskeletal disorders were responsible for almost half of all YLDs. The fraction of DALYs from YLDs rose from 28·1% (95% UI 24·2–32·5) in 1990 to 39·4% (34·9–43·8) in 2010. Leading causes of DALYs in 2010 were cardiovascular diseases (stroke and ischaemic heart disease), cancers (lung and liver cancer), low back pain, and depression. Dietary risk factors, high blood pressure, and tobacco exposure are the leading risk factors[A:for short life-expectancy? Or for all indicators of poor health?]. Ambient air pollution ranked fourth (third to fifth; the second highest in the G20) and household air pollution ranked fifth (fourth to sixth; the third highest in the G20) in terms of the age-standardised DALY rate in 2010.
Interpretation The rapid rise of non-communicable diseases driven by urbanisation, rising incomes, and ageing poses major challenges for China’s health system, as does a shift to chronic disability. Reduction of population exposures from poor diet, high blood pressure, tobacco use, cholesterol, and fasting blood glucose are public policy priorities for China, as are the control of ambient and household air pollution. These changes will require an integrated government response to improve primary care and undertake required multisectoral action to tackle key risks. Analyses of disease burden provide a useful framework to guide policy responses to the changing disease spectrum in China.
Funding Bill & Melinda Gates Foundation.
IntroductionChina has made enormous strides in improving health in the past few decades. Between 1970 and 2010, male life expectancy increased from 60·4 years to 72·9 years and female life expectancy increased from 63·5 years to 79·0 years;1 the under-5 mortality rate reduced from 100·6 per 1000 to 12·9 per 1000;1 and the total fertility rate declined from 4·77 to 1·64 children per woman.2 Rapidly increasing income per head, an ageing population, and longer life-spans have led to a rapid change in the health profile of the nation. Some counties within the country, however, remain relatively poor and continue to have a
set of health challenges dominated by communicable, maternal, and neonatal causes.3,4 China needs to under-stand and formulate a long-range strategy to tackle several challenges in public health and medical care at the same time.
Before health-care reform was announced in 2009,5 the Chinese Government was faced with widespread public discontent stemming from unaffordable access to health care and growing inequalities in access to health care and health status across regions and populations.6–9 Health improvement fell short of what China’s rapid economic growth should have afforded.10 Some previously eliminated
Lancet 2013; 381: 1987–2015
*Joint first authors
Institute for Health Metrics and Evaluation, University of Washington, Seattle, WA, USA (Prof C J L Murray MD, M Naghavi PhD, Prof T Vos PhD, H Wang PhD); Institute of Basic Medical Sciences, Chinese Academy of Medical Sciences & School of Basic Medicine, Peking Union Medical College, Beijing, China (X Wan PhD, Prof G Yang MD); Peking Union Medical College, Beijing, China (Y Jiang MBA); and Chinese Center for Disease Prevention and Control, Beijing, China (G F Gao PhD, X Liang PhD, Y Wang MD, S Yu PhD, Y Zeng MD, M Zhou PhD)
Correspondence to: Prof Christopher J L Murray, Institute for Health Metrics and Evaluation, University of Washington, 2301 Fifth Avenue, Suite 600, Seattle, WA 98121, USA [email protected]
TD
13tl2999D-13-02999
S0140-6736(13)61097-1
Articles
1988 www.thelancet.com Vol 381 June 8, 2013
infectious diseases re-emerged11 and incidence of some non-communicable diseases increased.12,13 The 2002–03 severe acute respiratory syndrome (SARS) outbreak was a wake-up call exposing the inadequacies of the public health protection and surveillance system, and emphasis-ing the important role for government in guidance of the evolution of health in China. Health system reforms focused on delivering improved access to quality clinical care14 are now underway but can be better informed by a broad assessment of China’s progress in health.
Several data systems provide substantial detail about levels and trends in health in China, including various national surveys of health, civil registration, medical certification of causes of death in some cities and counties,15 the Disease Surveillance Points system,16 a sophisticated infectious disease surveillance network,17
population-based cancer registries,18 a maternal and child surveillance system,17 and demographic surveys19,20 and censuses.21,22 Despite these data systems, a comprehensive and comparable assessment of health challenges and how they change over time is not available. Opportunities to compare China’s health performance with other countries to learn where China has done well and where scope for improvement exists have thus been limited.
In this report, we use the results of the Global Burden of Diseases, Injuries, and Risk Factors Study 2010 (GBD 2010) to examine in detail the transformation of health in China from 1990 to 2010 and to benchmark health challenges in China to 18 major high-income and rapidly developing countries that are members of the G20.
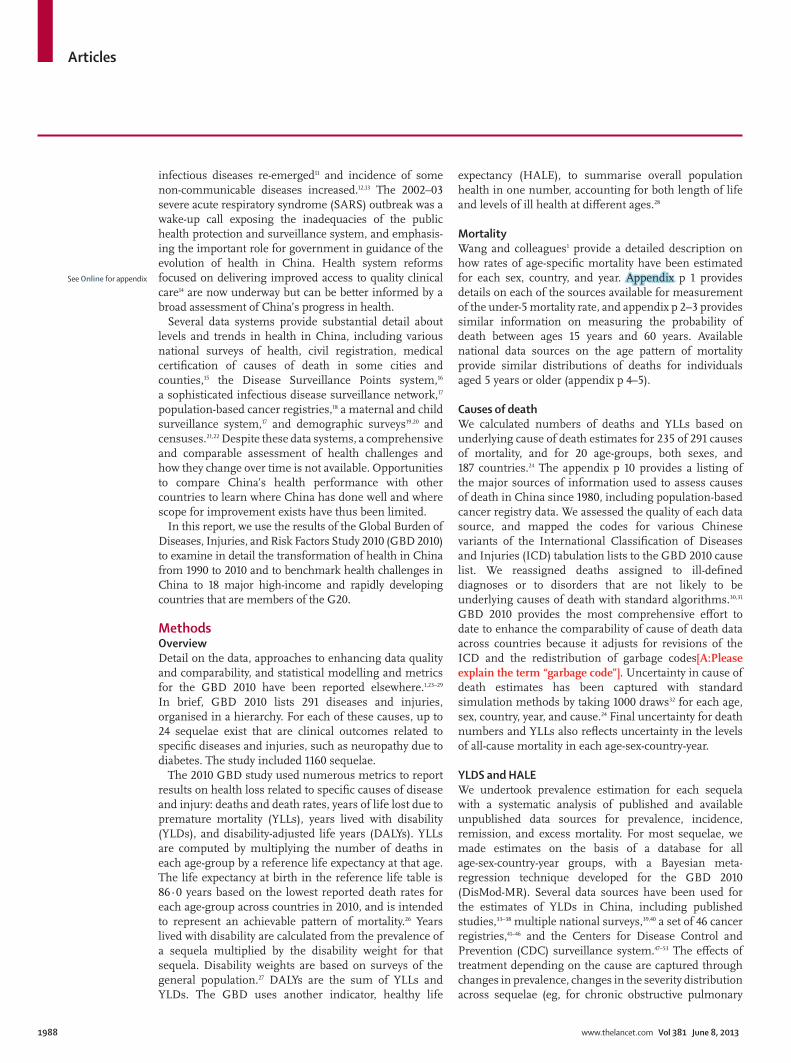
MethodsOverviewDetail on the data, approaches to enhancing data quality and comparability, and statistical modelling and metrics for the GBD 2010 have been reported elsewhere.1,23–29 In brief, GBD 2010 lists 291 diseases and injuries, organised in a hierarchy. For each of these causes, up to 24 sequelae exist that are clinical outcomes related to specific diseases and injuries, such as neuropathy due to diabetes. The study included 1160 sequelae.
The 2010 GBD study used numerous metrics to report results on health loss related to specific causes of disease and injury: deaths and death rates, years of life lost due to premature mortality (YLLs), years lived with disability (YLDs), and disability-adjusted life years (DALYs). YLLs are computed by multiplying the number of deaths in each age-group by a reference life expectancy at that age. The life expectancy at birth in the reference life table is 86·0 years based on the lowest reported death rates for each age-group across countries in 2010, and is intended to represent an achievable pattern of mortality.26 Years lived with disability are calculated from the prevalence of a sequela multiplied by the disability weight for that sequela. Disability weights are based on surveys of the general population.27 DALYs are the sum of YLLs and YLDs. The GBD uses another indicator, healthy life
expectancy (HALE), to summarise overall population health in one number, accounting for both length of life and levels of ill health at different ages.28
MortalityWang and colleagues1 provide a detailed description on how rates of age-specific mortality have been estimated for each sex, country, and year. Appendix p 1 provides details on each of the sources available for measurement of the under-5 mortality rate, and appendix p 2–3 provides similar information on measuring the probability of death between ages 15 years and 60 years. Available national data sources on the age pattern of mortality provide similar distributions of deaths for individuals aged 5 years or older (appendix p 4–5).
Causes of deathWe calculated numbers of deaths and YLLs based on underlying cause of death estimates for 235 of 291 causes of mortality, and for 20 age-groups, both sexes, and 187 countries.24 The appendix p 10 provides a listing of the major sources of information used to assess causes of death in China since 1980, including population-based cancer registry data. We assessed the quality of each data source, and mapped the codes for various Chinese variants of the International Classification of Diseases and Injuries (ICD) tabulation lists to the GBD 2010 cause list. We reassigned deaths assigned to ill-defined diagnoses or to disorders that are not likely to be underlying causes of death with standard algorithms.30,31 GBD 2010 provides the most comprehensive effort to date to enhance the comparability of cause of death data across countries because it adjusts for revisions of the ICD and the redistribution of garbage codes[A:Please explain the term “garbage code”]. Uncertainty in cause of death estimates has been captured with standard simulation methods by taking 1000 draws32 for each age, sex, country, year, and cause.24 Final uncertainty for death numbers and YLLs also reflects uncertainty in the levels of all-cause mortality in each age-sex-country-year.
YLDS and HALEWe undertook prevalence estimation for each sequela with a systematic analysis of published and available unpublished data sources for prevalence, incidence, remission, and excess mortality. For most sequelae, we made estimates on the basis of a database for all age-sex-country-year groups, with a Bayesian meta-regression technique developed for the GBD 2010 (DisMod-MR). Several data sources have been used for the estimates of YLDs in China, including published studies,33–38 multiple national surveys,39,40 a set of 46 cancer registries,41–46 and the Centers for Disease Control and Prevention (CDC) surveillance system.47–53 The effects of treatment depending on the cause are captured through changes in prevalence, changes in the severity distribution across sequelae (eg, for chronic obstructive pulmonary
See Online for appendix

Articles
www.thelancet.com Vol 381 June 8, 2013 1989
Ag
e-st
anda
rdiz
ed d
eath
rate
(p
er 1
00 0
00)
Age-
stan
dard
ized
YLL
s (pe
r 100
000
)Ag
e-st
anda
rdiz
ed Y
LDs (
per 1
00 0
00)
Life
exp
ecta
ncy
at b
irth
(yea
rs)
HAL
E at
birt
h (y
ears
)
19
9020
1019
9020
1019
9020
1019
9020
1019
9020
10
Rate
Rank
Rate
Rank
Rate
Rank
Rate
Rank
Rate
Rank
Rate
Rank
LERa
nkLE
Rank
HAL
ERa
nkH
ALE
Rank
Chin
a89
6 (8
59–
944)
14
(14–
15)
607
(581
–63
3)
13
(11–
14)
24 9
89
(23 7
92–
26 29
3)
13
(13–
14)
14 0
24
(13 4
16–
14 9
96)
11
(11–
12)
9639
(7
954–
11 70
0)
2 (1–4
)87
82
(729
1–10
497
)
1 (1–2
)69
·3 (6
8·3–
70·3
)13
(1
3–15
)75
·7
(74·
9–76
·5)
12
(11–
13)
61·7
(5
9·9–
63·3
)
13
(12–
13)
67·8
(6
6·1–
69·3
)
10
(8–1
0)
Arge
ntin
a73
1 (7
25–
736)
10
(10–
10)
597
(593
–60
2)
11
(11–
13)
19 4
00
(19
003–
19 76
7)
11
(10–
11)
14 3
43
(14
163–
14 57
4)
12
(11–
12)
11 15
4 (9
280–
13 51
7)
9 (5–1
5)10
843
(8
885–
13 18
3)
7
5–15
)72
·5 (7
2·5–
72·6
)10
(9
–11)
76·0
(7
5·9–
76·0
)
11
(11–
12)
63·1
(6
1·2–
64·7
)
10
(9–1
2)66
·1
(64·
0–67
·9)
12
(11–
13)
Aust
ralia
568
(564
–57
1)
5
(5–5
)38
9 (3
86–
393)
2 (2–3
)12
381
(12 2
13–
12 52
0)
4 (4–4
)77
22
(761
0–78
97)
3 (3–3
)11
153
(922
3–13
293)
8 (6–1
3)10
979
(9
088–
13 16
5)
9 (6–1
3)76
·9 (7
6·8–
76·9
)5 (4–5
)81
·5
(81·
4–81
·6)
2 (2–3
)66
·6
(64·
7–68
·4)
4 (2–5
)70
·4
(68·
2–72
·3)
2 (2–5
)
Braz
il85
4 (8
46–
863)
13
(13–
13)
670
(665
–67
4)
15
(15–
15)
26 37
0 (2
5 718
–27
152)
15
(14–
15)
17 58
0 (1
7 240
–17
932
)
15
(14–
15)
12 0
16
(991
4–14
293)
14
(12–
17)
11 6
37
(967
0–13
849
)
15
(11–
17)
69·1
(68·
9–69
·3)
14
(13–
14)
74·1
(7
3·9–
74·3
)
15
(14–
15)
59·6
(5
7·8–
61·3
)
15
(14–
15)
64·0
(6
2·0–
65·7
)
15
(14–
15)
Cana
da55
8 (5
54–
561)
3 (3–3
)42
2 (4
18–
427)
5 (5–5
)12
079
(1
1 923
–12
203)
2 (2–2
)85
46
(842
9–87
14)
5
(4–6
)10
806
(8
988–
12 8
78)
6 (4–1
0)10
845
(9
035–
12 8
54)
6 (5–1
3)77
·2 (7
7·1–
77·3
)2 (2–2
)80
·6
(80·
4–80
·8)
5 (5–5
)67
·1
(65·
2–68
·8)
2 (2–4
)69
·7
(67·
8–71
·6)
5 (4–7
)
Germ
any
644
(641
–64
6)
9 (8–9
)43
3 (4
29–
440)
6 (6–6
)14
032
(1
3 863
–14
171)
7 (7–7
)85
12
(838
3–87
39)
4 (4–5
)11
165
(927
1–13
253)
10
(6–1
3)11
015
(9
177–
13 0
70)
10
(6–1
3)75
·4 (7
5·3–
75·4
)7 (7–8
)80
·2
(80·
1–80
·4)
6 (6–6
)65
·4
(63·
5–67
·1)
8 (6–8
)69
·3
(67·
3–71
·1)
7 (6–8
)
Fran
ce54
9 (5
45–
553)
2 (2–2
)40
8 (4
03–
416)
4 (4–4
)12
717
(12 5
35–
12 8
58)
5 (5–5
)86
66
(851
6–89
12)
6 (5–6
)11
358
(941
8–13
475
)
11
(7–1
4)11
194
(927
9–13
307)
12
(6–1
5)77
·1 (7
7·0–
77·1
)3 (3–3
)80
·9
(80·
7–81
·1)
4 (4–4
)66
·6
(64·
6–68
·4)
5 (2–5
)69
·7
(67·
6–71
·6)
6 (4–7
)
UK63
8 (6
34–
642)
6 (6–8
)45
5 (4
52–
458)
8 (8–8
)13
452
(1
3 296
–13
581)
6 (6–6
)89
49
(887
1–90
52)
8 (7–8
)11
453
(9
466–
13 6
03)
12
(8–1
4)11
435
(9
482–
13 56
9)
14
(10–
16)
75·7
(75·
6–75
·7)
6 (6–7
)79
·9
(79·
9–80
·0)
7 (7–7
)65
·5
(63·
6–67
·3)
7 (6–8
)68
·8
(66·
7–70
·7)
8 (7–9
)
Indo
nesia
1033
(1
005–
1062
)
17
(17–
17)
867
(831
–90
3)
16
(16–
16)
34 58
4 (3
3 009
–36
082
)
18
(17–
18)
24 17
8 (2
3 026
–25
502)
16
(16–
17)
12 10
1 (9
909–
14 59
6)
15
(10–
18)
11 10
7 (9
122–
13 4
02)
11
(5–1
6)65
·0 (6
4·5–
65·5
)17
(1
7–18
)69
·7
(68·
5–70
·9)
16
(16–
17)
56·2
(5
4·4–
57·8
)
17
(17–
18)
60·9
(5
9·0–
62·7
)
16
(16–
17)
Indi
a14
47
(138
9–15
30)
19
(19–
19)
1097
(1
011–
1166
)
18
(18–
18)
50 0
84
(47 6
13–
53 4
09)
19
(19–
19)
33 36
6 (3
0 67
0–35
506)
18
(18–
18)
13 72
7 (1
1 265
–16
542)
19
(18–
19)
12 4
94
(10
287–
14 9
67)
18
(16–
18)
58·3
(56·
9–59
·7)
19
(19–
19)
65·2
(6
3·5–
66·9
)
18
(18–
18)
49·8
(4
7·8–
51·7
)
19
(19–
19)
56·2
(5
3·8–
58·3
)
18
(18–
18)
Italy
561
(558
–56
3)
4 (4–4
)38
9 (3
86–
396)
3 (2–3
)12
202
(12 0
53–
12 33
0)
3 (3–3
)74
85
(735
9–77
03)
2 (2–2
)11
038
(9
150–
13 17
4)
7 (5–1
2)10
907
(9
081–
12 8
95)
8 (5–1
2)77
·0 (7
6·9–
77·0
)4 (4–5
)81
·5
(81·
3–81
·6)
3 (2–3
)66
·8
(64·
8–68
·6)
3 (2–5
)70
·3
(68·
3–72
·2)
3 (2–5
)
Japa
n46
9 (4
66–
471)
1 (1–1
)35
2 (3
50–
356)
1 (1–1
)96
58
(955
2–97
50)
1 (1–1
)68
27
(676
1–69
39)
1 (1–1
)94
06
(779
4–11
361)
1 (1–3
)90
94
(746
5–10
904
)
2 (1–4
)79
·1 (7
9·1–
79·1
)1 (1–1
)82
·6
(82·
6–82
·7)
1 (1–1
)69
·9
(68·
0–71
·5)
1 (1–1
)73
·0
(71·
2–74
·7)
1 (1–1
)
Sout
h Ko
rea
813
(802
–82
2)
12
(12–
12)
447
(441
–45
2)
7 (7–7
)18
830
(1
8 15
8–19
318)
10
(9–1
0)89
41
(880
1–90
93)
7 (7–8
)10
074
(8
289–
12 0
73)
3 (2–7
)95
75
(788
8–11
559)
4 (2–5
)72
·1 (7
1·6–
72·6
)11
(1
0–11
)79
·7
(79·
6–79
·8)
8 (8–8
)63
·8
(62·
1–65
·4)
9 (9–1
1)70
·3
(68·
4–72
·0)
4 (2–6
)
Mex
ico74
0 (7
32–
749)
11
(11–
11)
604
(599
–60
9)
12
(12–
14)
22 77
5 (2
2 171
–23
502)
12
(12–
12)
15 6
58
(15 3
65–
15 9
76)
13
(13–
14)
10 0
92
(841
4–12
094
)
4 (2–6
)93
64
(776
2–11
245)
3 (2–4
)71
·5 (7
1·2–
71·9
)12
(1
1–12
)75
·5
(75·
2–75
·7)
13
(12–
14)
62·9
(6
1·1–
64·4
)
11
(10–
12)
66·9
(6
5·2–
68·4
)
11
(11–
12)
Russ
ia95
3 (9
47–
959)
16
(15–
16)
952
(947
–95
9)
17
(17–
17)
25 71
5 (2
5 268
–26
205)
14
(13–
14)
25 38
7 (2
5 067
–25
797)
17
(16–
17)
11 53
6 (9
582–
13 8
45)
13
(7–1
5)11
444
(9
494–
13 50
9)
13
(8–1
7)68
·7 (6
8·4–
69·0
)15
(1
4–15
)68
·9
(68·
6–69
·1)
17
(16–
17)
59·8
(5
8·1–
61·3
)
14
(14–
15)
60·0
(5
8·4–
61·6
)
17
(16–
17)
(Con
tinue
s on
next
pag
e)
Articles
1990 www.thelancet.com Vol 381 June 8, 2013
disease), and for some injuries different disability weights for treated and untreated outcomes. Access to treatment for injuries is estimated on the basis of an indicator of access to health systems.29
For GBD 2010, disability weights were measured for 220 unique health states that cover the 1160 disease and injury sequelae.27 Disability weights were generated from more than 30 000 respondents collected through population-based surveys in five countries—USA, Peru, Tanzania, Bangladesh, and Indonesia—and an open internet survey. 271 respondents of the internet survey were from China. Uncertainty in the disability weight for each sequela has been propagated into the estimates of YLDs for each disease and injury. We combined information about age-specific mortality rates, and about overall age-specific YLDs per person into the overall measure of health expectancy, HALE, using a standard approach to extending the life table to capture adjust-ments for non-fatal health outcomes.28
Risk factorsDeaths, YLLs, YLDs, and DALYs attributable to 67 risk factors or clusters of risk factors were assessed with three key inputs.23 First, for each risk–outcome pair, relative risks of mortality or morbidity, or both, were estimated on the basis of meta-analyses of the published literature. Second, each risk factor exposure distribution in each country, age, and sex group was estimated on the basis of published and unpublished data sources with mostly Bayesian estimation methods.23 For China, key sources included the 2002 China National Nutrition and Health Survey, the China Global Youth Tobacco Survey, the Second National Health Services Survey, the 1996 Global Youth Tobacco Survey, the 1996 National Prevalence Survey, the After-MONICA, the INTERSALT Beijing, the INTERMAP Beijing, and the 2000 and 2005 national censuses. Third, we estimated attributable deaths or DALYs by comparing the present distribution of exposure to a theoretical minimum risk counterfactual distribution of exposure selected for each risk factor. Each risk factor or cluster of risk factors was analysed separately and therefore the sum of attributable fractions for a disease or injury can be greater than 100%. Uncertainty in the relative risks, exposure estimates, and theoretical minimum risk distributions and uncertainty in the background outcome rates have been propagated into the final estimates.
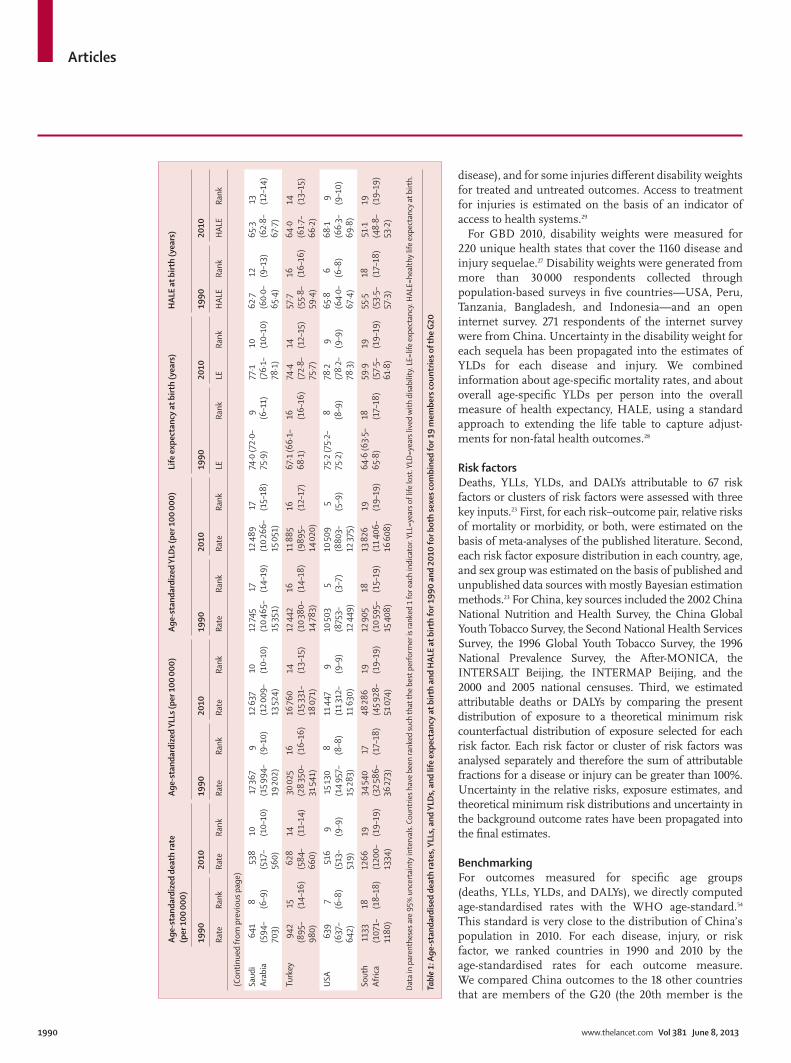
BenchmarkingFor outcomes measured for specific age groups (deaths, YLLs, YLDs, and DALYs), we directly computed age-standardised rates with the WHO age-standard.54 This standard is very close to the distribution of China’s population in 2010. For each disease, injury, or risk factor, we ranked countries in 1990 and 2010 by the age-standardised rates for each outcome measure. We compared China outcomes to the 18 other countries that are members of the G20 (the 20th member is the
Ag
e-st
anda
rdiz
ed d
eath
rate
(p
er 1
00 0
00)
Age-
stan
dard
ized
YLL
s (pe
r 100
000
)Ag
e-st
anda
rdiz
ed Y
LDs (
per 1
00 0
00)
Life
exp
ecta
ncy
at b
irth
(yea
rs)
HAL
E at
birt
h (y
ears
)
19
9020
1019
9020
1019
9020
1019
9020
1019
9020
10
Rate
Rank
Rate
Rank
Rate
Rank
Rate
Rank
Rate
Rank
Rate
Rank
LERa
nkLE
Rank
HAL
ERa
nkH
ALE
Rank
(Con
tinue
d fro
m p
revi
ous p
age)
Saud
i Ar
abia
641
(594
–70
3)
8
(6–9
)53
8 (5
17–
560)
10
(10–
10)
17 36
7 (1
5 994
–19
202)
9 (9–1
0)12
637
(1
2 009
–13
524)
10
(10–
10)
12 74
5 (1
0 46
5–15
351)
17
(14–
19)
12 4
89
(10
266–
15 0
51)
17
(15–
18)
74·0
(72·
0–75
·9)
9 (6–1
1)77
·1
(76·
1–78
·1)
10
(10–
10)
62·7
(6
0·0–
65·4
)
12
(9–1
3)65
·3
(62·
8–67
·7)
13
(12–
14)
Turk
ey94
2 (8
95–
980)
15
(14–
16)
628
(584
–66
0)
14
(11–
14)
30 0
25
(28
350–
31 54
1)
16
(16–
16)
16 76
0 (1
5 331
–18
071
)
14
(13–
15)
12 4
42
(10
380–
14 78
3)
16
(14–
18)
11 8
85
(989
5–14
020
)
16
(12–
17)
67·1
(66·
1–68
·1)
16
(16–
16)
74·4
(7
2·8–
75·7
)
14
(12–
15)
57·7
(5
5·8–
59·4
)
16
(16–
16)
64·0
(6
1·7–
66·2
)
14
(13–
15)
USA
639
(637
–64
2)
7 (6–8
)51
6 (5
13–
519)
9 (9–9
)15
130
(14
957–
15 28
3)
8 (8–8
)11
447
(1
1 312
–11
630
)
9 (9–9
)10
503
(875
3–12
449
)
5
(3–7
)10
509
(880
3–12
375)
5 (5–9
)75
·2 (7
5·2–
75·2
)8 (8–9
)78
·2
(78·
2–78
·3)
9 (9–9
)65
·8
(64·
0–67
·4)
6 (6–8
)68
·1
(66·
3–69
·8)
9 (9–1
0)
Sout
h Af
rica
1133
(1
071–
1180
)
18
(18–
18)
1266
(1
200–
1334
)
19
(19–
19)
34 54
0 (3
2 586
–36
273)
17
(17–
18)
48 28
6 (4
5 928
–51
074
)
19
(19–
19)
12 9
05
(10
595–
15 4
08)
18
(15–
19)
13 8
26
(11 4
06–
16 6
08)
19
(19–
19)
64·6
(63·
5–65
·8)
18
(17–
18)
59·9
(5
7·5–
61·8
)
19
(19–
19)
55·5
(5
3·5–
57·3
)
18
(17–
18)
51·1
(4
8·8–
53·2
)
19
(19–
19)
Data
in p
aren
thes
es a
re 9
5% u
ncer
tain
ty in
terv
als.
Coun
trie
s hav
e be
en ra
nked
such
that
the
best
per
form
er is
rank
ed 1
for e
ach
indi
cato
r. YLL
=yea
rs o
f life
lost
. YLD
=yea
rs li
ved
with
disa
bilit
y. LE
=life
exp
ecta
ncy.
HAL
E=he
alth
y lif
e ex
pect
ancy
at b
irth.
Tabl
e 1: A
ge-s
tand
ardi
sed
deat
h ra
tes,
YLL
s, a
nd Y
LDs,
and
life
exp
ecta
ncy
at b
irth
and
HAL
E at
birt
h fo
r 199
0 an
d 20
10 fo
r bot
h se
xes c
ombi
ned
for 1
9 m
embe
rs co
untr
ies o
f the
G20

Articles
www.thelancet.com Vol 381 June 8, 2013 1991
European Union). The G20 is the set of developed and developing countries identified as global agenda setters. Comparisons of China with this group provide insights into China’s standing relative to this set of developed or rapidly developing countries. For each quantity of interest in the GBD, 1000 draws were taken from the posterior distribution. We computed ranks across causes and percentage change from 1990 to 2010 at the draw level. We report 95% uncertainty intervals for ranks. For percentage change from 1990 to 2010 com puted at the level of each draw, we report the median percentage change, which is less sensitive to extreme values than the mean percentage change. For a specific country and cause, we tested whether a country was significantly greater than the G20 mean, in distin guish able from the mean, or below the mean.
Role of the funding sourceThe sponsor of the study had no role in study design, data collection, data analysis, data interpretation, or writing of the report. The corresponding author had full access to all the data in the study and had final respon sibility to submit for publication.
ResultsTable 1 provides an overall comparative view of health across the G20. Between 1990 and 2010, China had a 6·4 year improvement in life expectancy at birth for both sexes combined (from 69·3 years to 75·7 years), rising one rank past Mexico in a league table of G20 countries. In terms of the age-standardised death rate, China ranked 13th (95% uncertainty interval [UI] 11th to 14th) in 2010, ahead of Turkey, Brazil, Indonesia, Russia, India, and South Africa, but behind countries such as South Korea, USA, Saudi Arabia, Argentina, and Mexico. Across the G20, age-standardised YLL rate varied by more than sevenfold. China had the lowest levels of age-standardised YLDs in 2010 across the G20; although Japan, South Korea, and Mexico had rates that were statistically indistin-guishable from China. Across G20 countries the ratio of the highest to lowest age-standardised YLD rate was only 1·6. China ranks at 10th (8th to 10th) for HALE in 2010, only 0·4 years (95% UI –0·4 to 1·2) behind the USA. Japan had a healthy life expectancy in 2010 that was 5·2 years (4·3–6·2) longer than that reported for China.
Changes in age-specific mortality rates in China from 1990 to 2010 varied widely by age and sex (figure 1). Under-5 mortality rates declined by nearly 70%[A:please provide UI]. We noted declines in female adult mortality with declines in excess of 50% for age-groups 0 years to 30–34 years. Progress in reduction of male mortality was substantially worse than that noted for women. Figure 1 shows comparative progress in reduction of age-specific mortality with other G20 countries. For men, China’s relative rank in terms of age-specific mortality was lower than the G20 average at ages older than 50 years and relatively little changed between 1990 and 2010. For
Figure 1: Age-specific mortality in China, 1990–2010(A) Percentage change in age-specific mortality, by sex, in China between 1990 and 2010. (B) Rank of age-specific mortality for male individuals in China compared with 18 other members of the G20. (C) Rank of age-specific mortality in for female individuals in China compared with 18 other members of the G20. Shaded areas show 95% uncertainty intervals (UI). In some cases, the 95% UI has an upper and lower bound equal to the rank of the mean death rate. Countries have been ranked such that the best performer is ranked as one for each indicator.
13 131312 12
10 11 1110
12
14 14
10
16 16
10 10 10 10 10
12 12 1211
11 1112
13
14 14
<1
0
20
40
60
80A
Decli
ne in
mor
talit
y ra
te (%
)
0
5
10
15
20
5
10
15
20
B
Rank
in a
ge-s
pecifi
c mor
talit
y ra
te
0 1–4 5–910–14
15–1920–24
25–2930–34
35–3940–4
445–4
950–54
55–5960–6
465–6
970–74
75–79≥80
0
C
Rank
in a
ge-s
pecifi
c mor
talit
y ra
te
Age group (years)
Male mortality Female mortality
19902010
1314
1516 16 16 16 16 16 16 16 16 16 16 16 16
11
15
1211
10 10 10 10 10 10 1010
1211
11
12 12
1414

Articles
1992 www.thelancet.com Vol 381 June 8, 2013
All ages deaths (thousands) Age-standardised death rate (per 100 000)
1990 2010 Median %Δ 1990 2010 Median %Δ
All causes 7997·5 (7663·4–8426·7) 8303·7 (7939·6–8678·7) 4·0 895·9 (858·8–943·6) 606·8 (580·7–632·7) –32·1
Communicable, maternal, neonatal, and nutritional disorders
1207·8 (1105·1–1303·8) 490·4 (441·9–548·5) –59·5 108·5 (100·3–117·4) 40·7 (36·6–45·2) –62·5
HIV/AIDS and tuberculosis 169·2 (140·8–200·2) 80·9 (63·6–100·1) –52·2 18·6 (15·4–22·0) 5·5 (4·3–6·8) –70·2
Tuberculosis 169·0 (140·5–200·0) 44·7 (32·7–54·2) –73·0 18·5 (15·4–21·9) 3·1 (2·3–3·8) –82·8
HIV/AIDS 0·2 (0·0–0·6) 36·2 (25·1–49·2) 13 860·7 <0·05 (0·0–0·1) 2·4 (1·7–3·3) 9447·6
HIV disease resulting in mycobacterial infection <0·05 (0·0–0·1) 2·0 (1·4–2·7) 6050·5 <0·05 (0·0–0·05) 0·1 (0·1–0·2) 4159·1
HIV disease resulting in other specified or unspecified diseases
0·2 (0·0–0·5) 34·2 (23·9–46·7) 14 809·7 <0·05 (0·0–0·1) 2·3 (1·6–3·1) 10 224·8
Diarrhoea, lower respiratory infections, meningitis, and other common infectious diseases
558·4 (492·7–623·3) 223·2 (188·9–257·3) –59·9 50·6 (45·6–56·5) 18·2 (15·5–21·1) –63·9
Diarrhoeal diseases 71·3 (61·5–83·2) 4·4 (3·7–5·3) –93·9 6·4 (5·6–7·3) 0·4 (0·3–0·5) –94·0
Cholera 2·0 (1·2–3·5) 0·1 (0·1–0·2) –95·3 0·2 (0·1–0·3) <0·05 (0·0–0·05) –94·0
Other salmonella infections 5·6 (4·0–7·9) 0·4 (0·3–0·5) –93·6 0·5 (0·4–0·7) <0·05 (0·0–0·05) –93·8
Shigellosis 4·8 (3·6–6·5) 0·3 (0·3–0·5) –93·1 0·5 (0·4–0·6) <0·05 (0·0–0·05) –93·9
Enteropathogenic E coli infection 6·6 (4·0–10·2) 0·3 (0·2–0·5) –95·4 0·5 (0·3–0·8) <0·05 (0·0–0·1) –94·1
Enterotoxigenic E coli infection 6·4 (4·8–8·4) 0·5 (0·3–0·6) –92·9 0·6 (0·5–0·8) <0·05 (0·0–0·1) –93·9
Campylobacter enteritis 6·7 (4·3–9·8) 0·4 (0·3–0·6) –94·4 0·6 (0·4–0·8) <0·05 (0·0–0·1) –94·0
Amoebiasis 1·8 (1·3–2·5) 0·2 (0·1–0·2) –91·4 0·2 (0·1–0·3) <0·05 (0·0–0·05) –93·9
Cryptosporidiosis 5·5 (3·4–8·4) 0·3 (0·2–0·4) –95·4 0·4 (0·3–0·7) <0·05 (0·0–0·05) –94·0
Rotaviral enteritis 17·8 (13·1–23·6) 0·9 (0·6–1·2) –94·9 1·5 (1·1–1·9) 0·1 (0·1–0·1) –94·0
Other diarrhoeal diseases 14·1 (9·6–20·0) 1·1 (0·8–1·5) –92·2 1·4 (1·0–2·0) 0·1 (0·1–0·1) –93·9
Typhoid and paratyphoid fevers 12·0 (1·4–22·6) 11·9 (1·4–21·9) –1·0 1·0 (0·1–1·9) 0·9 (0·1–1·7) –6·5
Lower respiratory infections 392·4 (342·3–441·9) 195·2 (162·9–226·3) –50·1 36·4 (32·3–41·5) 15·9 (13·4–18·5) –56·2
Influenza 75·2 (61·9–91·1) 40·8 (33·4–47·9) –45·5 7·1 (6·0–8·6) 3·3 (2·7–3·9) –53·7
Pneumococcal pneumonia 89·7 (74·8–107·1) 60·5 (48·9–72·4) –32·3 9·0 (7·6–10·9) 4·8 (3·9–5·8) –46·3
H influenzae type B pneumonia 102·2 (79·6–126·8) 30·4 (25·5–35·8) –70·3 8·6 (6·8–10·5) 2·6 (2·2–3·1) –69·9
Respiratory syncytial virus pneumonia 56·1 (39·4–74·7) 7·3 (5·5–10·0) –87·2 4·3 (3·1–5·7) 0·8 (0·5–1·1) –83·0
Other lower respiratory infections 69·2 (53·4–93·3) 56·2 (43·0–70·0) –17·5 7·3 (5·7–9·6) 4·5 (3·4–5·6) –38·2
Upper respiratory infections 0·3 (0·3–0·4) <0·05 (0·0–0·1) –89·4 <0·05 (0·0–0·05) <0·05 (0·0–0·05) –84·9
Otitis media 1·0 (0·0–11·6) 0·3 (0·0–2·9) –74·6 0·1 (0·0–1·0) <0·05 (0·0–0·3) –74·1
Meningitis 30·6 (24·5–34·7) 7·7 (6·4–10·2) –76·0 2·7 (2·2–3·1) 0·6 (0·5–0·8) –78·3
Pneumococcal meningitis 5·8 (4·3–6·9) 1·4 (1·1–2·0) –77·0 0·5 (0·4–0·6) 0·1 (0·1–0·2) –79·5
H influenzae type B meningitis 4·8 (3·8–5·9) 0·9 (0·7–1·2) –81·1 0·4 (0·3–0·5) 0·1 (0·1–0·1) –78·5
Meningococcal infection 4·1 (3·0–4·9) 1·0 (0·8–1·3) –77·7 0·4 (0·3–0·4) 0·1 (0·1–0·1) –79·6
Other meningitis 15·9 (12·1–18·4) 4·4 (3·6–6·0) –74·1 1·5 (1·1–1·7) 0·3 (0·3–0·5) –78·1
Encephalitis 3·7 (3·0–4·4) 0·7 (0·5–0·8) –82·1 0·3 (0·2–0·3) 0·1 (0·1–0·1) –78·7
Diphtheria 0·2 (0·0–1·4) <0·05 (0·0–0·4) –73·4 <0·05 (0·0–0·1) <0·05 (0·0–0·05) –68·8
Whooping cough 3·3 (0·0–16·4) 0·5 (0·0–2·2) –86·0 0·3 (0·0–1·3) <0·05 (0·0–0·2) –80·6
Tetanus 19·0 (8·9–34·8) 1·7 (0·5–5·2) –91·9 1·6 (0·7–3·1) 0·1 (0·0–0·4) –91·3
Measles 23·7 (7·9–60·2) 0·4 (0·1–1·1) –98·3 1·8 (0·6–4·6) <0·05 (0·0–0·1) –97·7
Varicella 0·8 (0·0–5·5) 0·5 (0·0–3·7) –34·0 0·1 (0·0–0·5) <0·05 (0·0–0·3) –42·6
Neglected tropical diseases and malaria 24·0 (10·9–65·7) 14·9 (4·7–57·6) –45·7 2·4 (1·0–7·0) 1·1 (0·3–4·0) –58·5
Malaria 0·2 (0·1–0·3) 0·1 (0·0–0·1) –63·2 <0·05 (0·0–0·05) <0·05 (0·0–0·05) –72·1
Leishmaniasis 6·5 (2·8–14·7) 1·8 (0·8–3·6) –71·2 0·6 (0·2–1·2) 0·1 (0·1–0·3) –73·5
Schistosomiasis 8·5 (0·0–50·4) 8·5 (0·0–50·2) 0·2 0·9 (0·0–5·6) 0·6 (0·0–3·5) –37·9
Cysticercosis <0·05 (0·0–0·1) <0·05 (0·0–0·2) 54·0 <0·05 (0·0–0·05) <0·05 (0·0–0·05) 3·8
Echinococcosis 0·6 (0·0–2·3) 0·4 (0·0–1·6) –31·5 0·1 (0·0–0·2) <0·05 (0·0–0·1) –56·1
Dengue 1·0 (0·2–3·2) 1·0 (0·4–2·3) 11·6 0·1 (0·0–0·3) 0·1 (0·0–0·2) –5·6
Rabies 2·0 (1·2–3·2) 1·2 (0·4–2·2) –52·6 0·2 (0·1–0·3) 0·1 (0·0–0·2) –66·1
Intestinal nematode infections 1·4 (0·0–6·7) 0·3 (0·0–1·7) –75·3 0·1 (0·0–0·5) <0·05 (0·0–0·2) –69·9
Ascariasis 1·4 (0·0–6·7) 0·3 (0·0–1·7) –75·3 0·1 (0·0–0·5) <0·05 (0·0–0·2) –69·9
(Continues on next page)

Articles
www.thelancet.com Vol 381 June 8, 2013 1993
All ages deaths (thousands) Age-standardised death rate (per 100 000)
1990 2010 Median %Δ 1990 2010 Median %Δ
(Continued from previous page)
Other neglected tropical diseases 3·9 (1·8–5·3) 1·5 (0·6–4·1) –73·0 0·4 (0·2–0·5) 0·1 (0·0–0·3) –81·1
Maternal disorders 20·6 (15·9–28·5) 5·0 (3·6–6·3) –75·7 1·6 (1·3–2·2) 0·3 (0·2–0·4) –78·2
Maternal haemorrhage 5·6 (4·4–7·7) 1·6 (1·2–2·1) –70·5 0·4 (0·3–0·6) 0·1 (0·1–0·1) –74·4
Maternal sepsis 3·0 (2·3–4·1) 0·7 (0·5–0·9) –75·4 0·2 (0·2–0·3) 0·1 (0·0–0·1) –77·2
Hypertensive disorders of pregnancy 2·4 (1·9–3·3) 0·5 (0·4–0·6) –79·0 0·2 (0·1–0·3) <0·05 (0·0–0·05) –80·7
Obstructed labour 0·2 (0·2–0·3) <0·05 (0·0–0·1) –74·5 <0·05 (0·0–0·05) <0·05 (0·0–0·05) –77·5
Abortion 3·4 (2·6–4·7) 0·8 (0·6–1·1) –75·0 0·3 (0·2–0·4) 0·1 (0·0–0·1) –77·4
Other maternal disorders 6·0 (4·7–8·3) 1·2 (0·9–1·5) –79·6 0·5 (0·4–0·7) 0·1 (0·1–0·1) –81·8
Neonatal disorders 343·0 (291·9–394·9) 83·4 (61·2–102·7) –75·7 26·4 (22·5–30·4) 9·4 (6·9–11·6) –64·5
Preterm birth complications 97·4 (69·2–131·7) 27·6 (20·0–37·3) –71·6 7·5 (5·3–10·2) 3·1 (2·3–4·2) –58·4
Neonatal encephalopathy (birth asphyxia/birth trauma)
109·7 (75·2–150·6) 26·8 (16·4–39·8) –75·4 8·5 (5·8–11·6) 3·0 (1·9–4·5) –64·0
Sepsis and other infectious disorders of the newborn baby
5·1 (1·9–11·2) 1·6 (0·8–3·2) –65·9 0·4 (0·1–0·9) 0·2 (0·1–0·4) –50·0
Other neonatal disorders 130·9 (77·9–186·4) 27·4 (18·0–40·1) –79·2 10·1 (6·0–14·4) 3·1 (2·0–4·5) –69·6
Nutritional deficiencies 20·0 (16·8–31·9) 13·4 (6·8–17·4) –25·2 2·0 (1·7–3·1) 1·1 (0·5–1·4) –40·2
Protein-energy malnutrition 14·8 (12·2–20·4) 9·2 (5·2–12·0) –36·0 1·5 (1·2–2·0) 0·7 (0·4–1·0) –47·5
Iodine deficiency 0·2 (0·2–0·2) 0·2 (0·1–0·3) 36·2 <0·05 (0·0–0·05) <0·05 (0·0–0·05) 12·8
Iron-deficiency anaemia 3·9 (3·3–4·9) 2·8 (1·6–3·5) –28·0 0·4 (0·3–0·5) 0·2 (0·1–0·3) –44·9
Other nutritional deficiencies 1·1 (1·0–1·5) 1·2 (0·7–1·6) 9·5 0·1 (0·1–0·2) 0·1 (0·1–0·1) –20·6
Other communicable, maternal, neonatal, and nutritional disorders
72·6 (63·1–82·5) 69·7 (57·7–78·6) –4·0 7·0 (6·1–7·8) 5·1 (4·1–5·7) –27·6
Sexually transmitted diseases excluding HIV 19·2 (11·2–27·8) 2·7 (1·7–4·3) –86·8 1·7 (0·9–2·5) 0·3 (0·2–0·4) –85·0
Syphilis 17·0 (10·7–25·2) 2·2 (1·3–3·7) –87·2 1·4 (0·9–2·1) 0·2 (0·1–0·4) –84·7
Sexually transmitted chlamydial diseases 0·5 (0·2–0·9) 0·1 (0·1–0·2) –84·1 0·1 (0·0–0·1) <0·05 (0·0–0·05) –89·3
Gonococcal infection 0·4 (0·1–0·7) 0·1 (0·1–0·1) –84·0 <0·05 (0·0–0·1) <0·05 (0·0–0·05) –89·3
Other sexually transmitted diseases 1·3 (0·4–2·2) 0·3 (0·2–0·5) –84·0 0·1 (0·0–0·2) <0·05 (0·0–0·05) –89·3
Hepatitis 33·3 (30·1–36·7) 43·8 (37·7–50·7) 30·9 3·4 (3·1–3·8) 3·0 (2·5–3·4) –13·5
Acute hepatitis A 7·0 (3·1–16·9) 5·2 (1·8–17·7) –29·4 0·7 (0·3–1·7) 0·4 (0·1–1·2) –53·6
Acute hepatitis B 21·3 (16·6–27·9) 35·1 (23·5–44·1) 67·8 2·3 (1·8–3·0) 2·3 (1·6–3·0) 7·0
Acute hepatitis C 0·7 (0·4–1·1) 1·2 (0·8–1·6) 88·2 0·1 (0·0–0·1) 0·1 (0·1–0·1) 16·0
Acute hepatitis E 4·2 (2·3–7·1) 2·3 (1·1–4·1) –47·3 0·3 (0·2–0·6) 0·2 (0·1–0·3) –52·0
Other infectious diseases 20·1 (16·6–27·2) 23·2 (13·0–28·5) 22·9 1·9 (1·6–2·5) 1·8 (1·0–2·3) 2·5
Non-communicable diseases 5937·8 (5679·4–6331·6) 7017·1 (6663·3–7310·2) 18·7 708·5 (678·0–754·9) 509·4 (483·6–530·3) –27·8
Neoplasms 1503·6 (1362·6–1710·4) 2133·5 (1905·4–2314·6) 43·1 170·0 (154·5–193·7) 148·0 (131·9–160·4) –12·0
Oesophageal cancer 168·8 (138·0–225·8) 176·0 (117·9–224·7) 10·1 19·8 (16·1–26·3) 12·3 (8·2–15·8) –34·4
Stomach cancer 297·4 (228·5–403·4) 297·0 (209·5–385·3) 0·0 34·3 (26·3–46·6) 20·8 (14·7–27·0) –39·2
Liver cancer 238·6 (199·6–283·9) 369·7 (322·0–467·0) 54·0 26·5 (22·3–31·7) 25·0 (21·6–31·4) –6·4
Liver cancer secondary to hepatitis B 128·5 (107·6–153·3) 200·8 (170·0–253·6) 55·4 14·3 (12·0–17·0) 13·5 (11·4–16·9) –5·6
Liver cancer secondary to hepatitis C 42·5 (36·1–51·8) 71·8 (60·0–89·4) 69·8 4·9 (4·2–6·0) 4·9 (4·1–6·1) 1·5
Liver cancer secondary to alcohol use 44·4 (36·2–53·5) 67·5 (56·2–87·6) 51·4 4·9 (4·0–5·9) 4·5 (3·8–5·8) –8·2
Other liver cancer 23·3 (19·1–28·5) 29·5 (24·3–39·3) 25·1 2·4 (2·0–2·9) 1·9 (1·6–2·6) –21·2
Larynx cancer 9·8 (4·4–18·8) 13·5 (5·6–25·3) 34·8 1·1 (0·5–2·2) 0·9 (0·4–1·8) –19·3
Trachea, bronchus, and lung cancers 260·2 (216·2–372·9) 513·3 (353·4–598·5) 109·5 30·0 (25·0–43·2) 35·8 (24·5–41·8) 27·2
Breast cancer 29·2 (27·9–30·5) 52·5 (47·4–59·6) 78·4 3·3 (3·1–3·4) 3·5 (3·1–3·9) 5·0
Cervical cancer 20·7 (13·2–30·7) 25·4 (12·4–32·5) 31·3 2·4 (1·5–3·5) 1·7 (0·8–2·2) –24·5
Uterine cancer 5·4 (3·7–11·8) 10·5 (3·7–13·8) 139·3 0·6 (0·4–1·3) 0·7 (0·3–0·9) 42·8
Prostate cancer 3·9 (2·4–7·0) 11·3 (4·7–17·6) 138·2 0·5 (0·3–0·9) 0·9 (0·4–1·3) 43·7
Colon and rectum cancers 93·0 (76·9–105·2) 150·4 (130·5–186·1) 59·4 10·7 (8·9–12·1) 10·6 (9·1–13·0) –2·3
Mouth cancer 7·5 (6·2–8·5) 14·0 (10·3–18·4) 87·1 0·9 (0·7–1·0) 1·0 (0·7–1·3) 12·6
Nasopharynx cancer 22·1 (15·2–32·4) 34·4 (21·1–48·9) 49·5 2·4 (1·7–3·6) 2·3 (1·4–3·2) –9·1
(Continues on next page)
Articles
1994 www.thelancet.com Vol 381 June 8, 2013
All ages deaths (thousands) Age-standardised death rate (per 100 000)
1990 2010 Median %Δ 1990 2010 Median %Δ
(Continued from previous page)
Cancer of other part of pharynx and oropharynx 4·1 (2·5–5·5) 5·1 (3·6–8·3) 20·9 0·5 (0·3–0·6) 0·3 (0·2–0·6) –26·1
Gallbladder and biliary tract cancer 17·8 (12·7–27·3) 29·8 (19·5–40·5) 67·6 2·1 (1·5–3·2) 2·1 (1·4–2·9) 1·7
Pancreatic cancer 32·1 (24·9–43·1) 58·2 (43·2–74·8) 82·9 3·7 (2·9–5·0) 4·0 (3·0–5·2) 9·4
Malignant melanoma of skin 2·7 (1·4–3·4) 6·7 (4·5–11·4) 131·5 0·3 (0·2–0·4) 0·5 (0·3–0·8) 45·8
Non-melanoma skin cancer 3·2 (1·5–5·8) 4·5 (2·4–8·1) 41·1 0·4 (0·2–0·7) 0·3 (0·2–0·6) –15·7
Ovarian cancer 14·4 (9·8–18·4) 20·7 (13·6–29·1) 34·4 1·6 (1·1–2·0) 1·4 (0·9–1·9) –18·7
Testicular cancer 1·0 (0·5–1·4) 0·8 (0·4–1·5) –18·3 0·1 (0·0–0·1) 0·1 (0·0–0·1) –43·5
Kidney and other urinary organ cancers 13·7 (9·9–19·5) 32·0 (22·5–41·4) 134·9 1·5 (1·1–2·2) 2·2 (1·6–2·9) 47·2
Bladder cancer 14·5 (12·3–18·6) 22·9 (17·6–28·2) 59·2 1·8 (1·5–2·2) 1·7 (1·3–2·1) –4·2
Brain and nervous system cancers 35·5 (23·1–48·4) 48·9 (29·3–67·1) 38·0 3·8 (2·5–5·2) 3·3 (2·0–4·6) –11·5
Thyroid cancer 4·8 (3·7–6·5) 8·1 (5·7–10·6) 69·5 0·5 (0·4–0·7) 0·6 (0·4–0·7) 4·9
Hodgkin’s disease 1·5 (1·0–2·2) 1·2 (0·7–1·7) –20·2 0·1 (0·1–0·2) 0·1 (0·1–0·1) –43·0
Non-Hodgkin lymphoma 21·0 (17·8–24·3) 27·7 (22·6–33·7) 30·3 2·2 (1·9–2·6) 2·0 (1·6–2·4) –13·9
Multiple myeloma 5·1 (3·5–7·8) 9·4 (5·4–13·3) 90·2 0·5 (0·4–0·8) 0·7 (0·4–0·9) 21·4
Leukaemia 53·0 (42·3–67·5) 58·0 (44·2–69·2) 13·7 4·9 (3·9–6·2) 4·2 (3·2–5·0) –10·5
Other neoplasms 122·5 (84·9–149·0) 131·6 (95·7–171·3) 6·3 13·4 (9·3–16·4) 9·2 (6·7–11·9) –32·1
Cardiovascular and circulatory diseases 2167·5 (2054·9–2462·4) 3136·2 (2827·1–3274·6) 47·4 267·7 (253·5–304·4) 230·8 (207·4–241·1) –12·2
Rheumatic heart disease 131·4 (120·1–147·3) 57·1 (49·8–63·0) –56·4 14·9 (13·7–16·8) 4·0 (3·5–4·5) –72·7
Ischaemic heart disease 450·3 (409·2–594·5) 948·7 (774·5–1024·6) 120·3 55·7 (50·6–73·9) 70·1 (57·2–76·0) 31·6
Cerebrovascular disease 1340·6 (1237·6–1623·2) 1726·7 (1463·2–1848·6) 34·5 167·0 (154·5–201·6) 126·9 (107·9–135·8) –20·8
Ischaemic stroke 426·4 (304·4–639·7) 609·6 (478·3–808·4) 44·7 56·3 (40·8–83·3) 46·7 (36·7–61·6) –16·2
Haemorrhagic and other non-ischemic stroke 914·2 (657·9–1146·4) 1117·2 (887·1–1359·1) 22·1 110·7 (79·1–139·5) 80·2 (63·8–97·9) –27·7
Hypertensive heart disease 133·7 (106·7–174·0) 172·9 (136·4–210·6) 31·5 16·9 (13·4–21·8) 12·8 (10·1–15·7) –22·8
Cardiomyopathy and myocarditis 32·6 (20·4–48·1) 35·2 (24·5–49·5) 8·8 3·6 (2·3–5·1) 2·5 (1·8–3·6) –28·5
Atrial fibrillation and flutter 4·8 (1·9–10·3) 12·9 (5·6–26·6) 175·1 0·6 (0·2–1·5) 1·0 (0·4–2·1) 58·7
Aortic aneurysm 36·3 (12·9–62·6) 58·2 (30·7–90·3) 61·4 4·5 (1·6–7·8) 4·3 (2·2–6·6) –3·9
Peripheral vascular disease 3·3 (1·2–6·6) 9·1 (4·1–17·2) 180·4 0·4 (0·1–0·9) 0·7 (0·3–1·3) 63·7
Endocarditis 9·5 (6·8–12·8) 12·4 (9·8–15·8) 31·6 1·0 (0·7–1·3) 0·9 (0·7–1·1) –8·4
Other cardiovascular and circulatory diseases 25·0 (20·1–31·1) 103·0 (94·5–112·6) 318·5 3·1 (2·5–3·9) 7·5 (6·9–8·3) 148·6
Chronic respiratory diseases 1496·5 (1444·7–1550·5) 1022·9 (965·4–1089·3) –31·8 189·0 (182·1–196·2) 77·2 (72·8–82·3) –59·3
Chronic obstructive pulmonary disease 1426·9 (1340·1–1509·5) 934·4 (846·6–1032·3) –34·3 180·7 (169·9–190·9) 70·6 (64·0–78·1) –60·8
Pneumoconiosis 6·1 (3·6–10·6) 4·1 (1·9–7·2) –32·7 0·7 (0·4–1·3) 0·3 (0·1–0·5) –59·1
Asthma 25·2 (16·9–34·8) 19·9 (16·6–27·3) –22·2 3·1 (2·1–4·3) 1·5 (1·2–2·0) –52·7
Interstitial lung disease and pulmonary sarcoidosis 5·0 (2·8–8·0) 8·6 (4·8–12·9) 73·6 0·6 (0·3–0·9) 0·6 (0·3–0·9) 6·9
Other chronic respiratory diseases 33·4 (25·8–43·2) 55·9 (33·6–69·0) 72·4 4·0 (3·0–5·2) 4·2 (2·6–5·2) 9·2
Cirrhosis of the liver 174·9 (127·0–198·9) 114·4 (90·0–187·8) –45·7 19·6 (14·2–22·3) 7·7 (6·1–12·7) –67·3
Cirrhosis of the liver secondary to hepatitis B 78·7 (55·0–93·1) 52·3 (39·3–86·5) –44·1 9·0 (6·2–10·6) 3·5 (2·7–5·9) –66·7
Cirrhosis of the liver secondary to hepatitis C 37·9 (25·9–44·5) 24·5 (18·8–40·7) –45·2 4·4 (3·0–5·2) 1·7 (1·3–2·8) –67·5
Cirrhosis of the liver secondary to alcohol use 35·9 (24·2–43·7) 25·3 (18·8–42·9) –41·0 4·0 (2·7–4·9) 1·7 (1·3–2·9) –64·5
Other cirrhosis of the liver 22·4 (15·5–26·9) 12·3 (9·0–20·8) –54·2 2·3 (1·6–2·8) 0·8 (0·6–1·4) –70·5
Digestive diseases (except cirrhosis) 163·4 (142·8–181·2) 133·0 (116·8–153·1) –19·0 19·1 (16·7–21·2) 9·7 (8·5–11·2) –49·4
Peptic ulcer disease 54·9 (41·4–61·0) 19·3 (16·5–23·2) –65·4 6·5 (4·9–7·3) 1·4 (1·2–1·7) –78·9
Gastritis and duodenitis 2·5 (1·2–5·7) 1·3 (0·8–2·7) –43·8 0·3 (0·1–0·7) 0·1 (0·1–0·2) –64·1
Appendicitis 5·6 (3·3–7·7) 1·4 (0·9–2·5) –76·7 0·6 (0·4–0·8) 0·1 (0·1–0·2) –84·2
Paralytic ileus and intestinal obstruction without hernia
17·3 (9·7–21·7) 11·2 (7·8–18·9) –44·6 1·9 (1·1–2·3) 0·8 (0·6–1·4) –62·0
Inguinal or femoral hernia 2·0 (1·9–2·0) 1·1 (1·0–1·1) –43·4 0·2 (0·2–0·2) 0·1 (0·1–0·1) –65·9
Non-infective inflammatory bowel disease 2·8 (1·0–4·9) 2·4 (1·2–3·9) –10·0 0·3 (0·1–0·5) 0·2 (0·1–0·3) –38·9
Vascular disorders of intestine 6·0 (1·8–17·6) 10·3 (3·8–26·5) 86·0 0·7 (0·2–2·2) 0·8 (0·3–2·0) 11·6
Gall bladder and bile duct disease 15·5 (11·3–21·1) 18·2 (11·5–27·1) 16·5 1·8 (1·3–2·5) 1·3 (0·8–2·0) –26·4
(Continues on next page)

Articles
www.thelancet.com Vol 381 June 8, 2013 1995
All ages deaths (thousands) Age-standardised death rate (per 100 000)
1990 2010 Median %Δ 1990 2010 Median %Δ
(Continued from previous page)
Pancreatitis 6·2 (3·2–9·6) 8·3 (5·2–11·5) 34·7 0·7 (0·4–1·1) 0·6 (0·4–0·8) –18·0
Other digestive diseases 50·7 (33·2–63·2) 59·5 (45·7–91·5) 11·1 6·0 (3·9–7·5) 4·3 (3·3–6·6) –31·1
Neurological disorders 58·5 (46·1–74·8) 80·6 (65·1–112·4) 34·5 6·5 (5·1–8·3) 6·1 (4·9–8·5) –8·9
Alzheimer’s disease and other dementias 25·8 (17·0–35·8) 50·0 (36·8–77·6) 87·9 3·4 (2·2–4·8) 3·9 (2·8–6·1) 13·0
Parkinson’s disease 4·1 (2·4–5·9) 7·3 (4·7–11·3) 73·6 0·5 (0·3–0·7) 0·5 (0·3–0·8) 9·5
Epilepsy 18·7 (12·0–23·0) 12·2 (10·4–17·8) –37·3 1·7 (1·1–2·0) 0·9 (0·7–1·3) –50·1
Multiple sclerosis 3·2 (1·3–5·3) 1·6 (1·0–2·6) –54·2 0·3 (0·1–0·6) 0·1 (0·1–0·2) –71·8
Other neurological disorders 6·6 (3·6–17·1) 9·5 (5·3–18·8) 53·9 0·7 (0·4–1·6) 0·7 (0·4–1·4) 12·6
Mental and behavioural disorders 23·3 (15·0–30·0) 20·7 (16·7–29·8) –16·9 2·4 (1·6–3·1) 1·4 (1·1–2·1) –44·4
Schizophrenia 12·6 (8·3–16·0) 8·9 (7·1–14·1) –33·4 1·3 (0·9–1·7) 0·6 (0·5–1·0) –57·7
Alcohol use disorders 3·3 (1·7–7·1) 4·6 (2·3–8·2) 44·6 0·3 (0·2–0·7) 0·3 (0·2–0·5) –7·8
Drug use disorders 3·2 (0·5–6·6) 4·8 (3·2–10·5) 41·3 0·3 (0·1–0·6) 0·3 (0·2–0·8) 12·8
Opioid use disorders 1·0 (0·2–2·0) 1·5 (1·0–3·4) 45·1 0·1 (0·0–0·2) 0·1 (0·1–0·3) 15·6
Cocaine use disorders 0·1 (0·0–0·3) <0·05 (0·0–0·05) –96·7 <0·05 (0·0–0·05) <0·05 (0·0–0·05) –97·4
Amphetamine use disorders 0·1 (0·0–0·1) <0·05 (0·0–0·05) –93·4 <0·05 (0·0–0·05) <0·05 (0·0–0·05) –94·7
Other drug use disorders 2·0 (0·3–4·1) 3·2 (2·1–6·7) 53·5 0·2 (0·0–0·4) 0·2 (0·2–0·5) 22·3
Eating disorders 1·5 (0·4–2·6) 0·7 (0·5–1·4) –69·1 0·1 (0·0–0·3) 0·1 (0·0–0·1) –76·9
Other mental and behavioural disorders 2·7 (0·8–4·7) 1·6 (1·0–3·2) –63·4 0·3 (0·1–0·5) 0·1 (0·1–0·2) –74·8
Diabetes, urogenital, blood, and endocrine diseases 186·2 (158·2–245·1) 294·9 (252·1–323·1) 65·3 20·6 (17·6–27·3) 21·3 (18·2–23·3) 7·9
Diabetes mellitus 70·5 (64·2–102·4) 160·1 (123·7–176·2) 141·6 8·0 (7·3–11·8) 11·5 (8·8–12·7) 52·3
Acute glomerulonephritis 16·2 (1·7–61·4) 3·0 (1·1–6·4) –72·0 1·7 (0·2–6·5) 0·2 (0·1–0·5) –80·5
Chronic kidney diseases 53·9 (47·6–75·5) 82·0 (66·6–93·1) 62·0 6·0 (5·3–8·4) 5·8 (4·7–6·6) 2·5
Chronic kidney disease due to diabetes mellitus 8·8 (7·2–12·6) 14·5 (11·5–17·4) 75·9 1·0 (0·8–1·5) 1·0 (0·8–1·2) 5·7
Chronic kidney disease due to hypertension 10·5 (9·0–14·9) 16·6 (13·3–19·2) 66·8 1·2 (1·0–1·7) 1·2 (0·9–1·4) 3·4
Chronic kidney disease unspecified 34·6 (30·0–48·5) 51·0 (41·3–58·7) 57·1 3·8 (3·3–5·3) 3·6 (2·9–4·2) 1·5
Urinary diseases and male infertility 14·8 (7·9–20·1) 13·0 (9·8–20·1) –19·4 1·7 (0·9–2·3) 1·0 (0·7–1·5) –47·8
Tubulointerstitial nephritis, pyelonephritis, and urinary tract infections
7·8 (4·5–11·0) 8·5 (6·4–12·7) 7·7 0·9 (0·5–1·2) 0·6 (0·5–0·9) –27·7
Urolithiasis 5·6 (2·3–12·5) 3·0 (0·9–7·8) –46·9 0·7 (0·3–1·5) 0·2 (0·1–0·6) –67·3
Other urinary diseases 1·5 (0·8–2·0) 1·5 (1·1–2·5) –3·7 0·2 (0·1–0·2) 0·1 (0·1–0·2) –40·0
Gynaecological diseases 2·7 (2·0–3·7) 1·7 (1·3–2·2) –38·3 0·3 (0·2–0·4) 0·1 (0·1–0·2) –58·3
Uterine fibroids <0·05 (0·0–0·05) <0·05 (0·0–0·05) –76·8 <0·05 (0·0–0·05) <0·05 (0·0–0·05) –75·2
Endometriosis 0·0 (0·0–0·0) 0·0 (0·0–0·0) 0·0 0·0 (0·0–0·0) 0·0 (0·0–0·0) 0·0
Genital prolapse 0·1 (0·0–0·1) <0·05 (0·0–0·05) –36·1 <0·05 (0·0–0·05) <0·05 (0·0–0·05) –58·9
Other gynaecological diseases 2·6 (1·9–3·7) 1·6 (1·3–2·2) –38·2 0·3 (0·2–0·4) 0·1 (0·1–0·1) –58·1
Haemoglobinopathies and haemolytic anaemias 20·5 (8·1–39·0) 15·2 (8·5–24·5) –23·6 2·1 (0·8–4·0) 1·2 (0·6–1·8) –43·8
Thalassaemias 7·5 (4·3–13·5) 3·7 (2·7–4·8) –49·3 0·6 (0·4–1·1) 0·3 (0·2–0·4) –54·8
Sickle cell disorders 0·1 (0·0–0·1) <0·05 (0·0–0·05) –43·4 <0·05 (0·0–0·05) <0·05 (0·0–0·05) –53·2
G6PD deficiency 0·8 (0·5–1·5) 0·6 (0·5–0·8) –21·9 0·1 (0·1–0·1) <0·05 (0·0–0·1) –42·3
Other haemoglobinopathies and haemolytic anaemias
12·1 (4·3–25·2) 10·8 (4·5–20·1) –4·3 1·4 (0·5–2·9) 0·8 (0·3–1·6) –36·6
Other endocrine, nutritional, blood, and immune disorders
7·5 (4·7–13·3) 20·0 (10·7–30·7) 176·8 0·7 (0·5–1·4) 1·5 (0·8–2·3) 119·2
Musculoskeletal disorders 17·3 (9·7–22·4) 26·2 (19·3–40·7) 41·2 2·0 (1·1–2·5) 1·9 (1·4–2·9) –11·2
Rheumatoid arthritis 8·9 (5·2–11·8) 11·3 (7·9–16·6) 22·9 1·1 (0·6–1·4) 0·8 (0·6–1·2) –24·2
Other musculoskeletal disorders 8·3 (3·6–12·0) 14·9 (11·6–25·1) 55·3 0·9 (0·4–1·3) 1·1 (0·8–1·8) 2·5
Other non-communicable diseases 146·6 (122·3–195·6) 54·8 (42·8–73·6) –62·8 11·6 (9·7–15·4) 5·4 (4·1–7·4) –54·0
Congenital anomalies 130·1 (106·0–176·9) 45·7 (33·5–65·1) –65·0 10·0 (8·2–13·6) 4·6 (3·4–6·7) –53·9
Neural tube defects 25·0 (11·6–43·5) 3·2 (1·7–6·6) –87·5 1·9 (0·9–3·4) 0·3 (0·2–0·7) –82·7
Congenital heart anomalies 73·4 (63·2–86·0) 31·3 (24·6–40·4) –57·5 5·6 (4·9–6·6) 3·2 (2·5–4·1) –44·1
Cleft lip and cleft palate 4·3 (1·1–11·9) 0·7 (0·3–1·5) –81·1 0·3 (0·1–0·9) 0·1 (0·0–0·2) –72·4
(Continues on next page)

Articles
1996 www.thelancet.com Vol 381 June 8, 2013
women and girls, however, we noted a substantial relative improvement, with ranks improving from 16th to 10th in the age groups 15–19 years through to 50–54 years. Although we noted a relative improvement for women older than 60 years, the improvement was less pronounced.
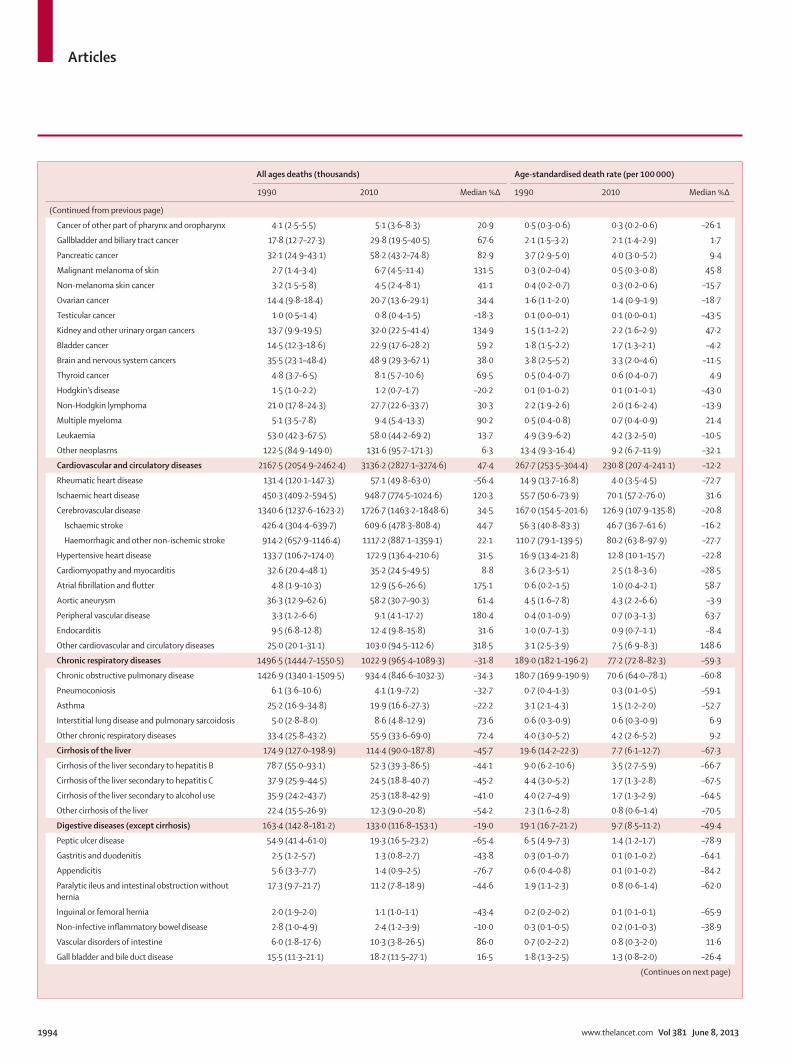
Table 2 shows the number of deaths and the age-standardised death rate for each cause in 1990 and 2010. Communicable, maternal, neonatal, and nut-
ritional disorders have declined by 59·5% (95% UI 54·4–63·8). Among these disorders, however, the large increase in HIV deaths is notable. The number of deaths from non-communicable disease rose from 5·9 million (5·7–6·3) to 7·0 million (6·7–7·3), but age-standardised death rates declined 27·8% (24·2–33·1); this difference was caused by population growth and ageing. Rising age-standardised rates have occurred for some causes such as lung cancer, ischaemic heart
All ages deaths (thousands) Age-standardised death rate (per 100 000)
1990 2010 Median %Δ 1990 2010 Median %Δ
(Continued from previous page)
Down’s syndrome 2·1 (0·9–4·3) 0·9 (0·6–1·3) –56·4 0·2 (0·1–0·3) 0·1 (0·1–0·1) –50·1
Other chromosomal abnormalities 11·4 (2·6–35·8) 2·9 (1·3–6·9) –69·5 0·9 (0·2–2·8) 0·3 (0·1–0·8) –58·6
Other congenital anomalies 14·0 (3·4–32·5) 6·8 (4·1–13·6) –43·5 1·1 (0·3–2·5) 0·7 (0·4–1·4) –28·4
Skin and subcutaneous diseases 12·7 (9·0–15·3) 7·4 (5·5–9·0) –41·7 1·3 (1·0–1·6) 0·6 (0·4–0·7) –57·0
Cellulitis 3·4 (2·4–4·2) 1·6 (1·3–1·9) –53·1 0·3 (0·2–0·4) 0·1 (0·1–0·1) –64·6
Abscess, impetigo, and other bacterial skin diseases 5·5 (3·6–6·9) 2·3 (1·8–2·7) –58·4 0·5 (0·4–0·6) 0·2 (0·1–0·2) –66·6
Decubitus ulcer 3·7 (2·9–4·7) 3·5 (2·4–4·5) –7·7 0·5 (0·4–0·6) 0·3 (0·2–0·4) –41·4
Other skin and subcutaneous diseases <0·05 (0·0–0·05) <0·05 (0·0–0·05) –64·6 <0·05 (0·0–0·05) <0·05 (0·0–0·05) –69·8
Sudden infant death syndrome 3·8 (0·8–15·1) 1·6 (0·5–4·3) –49·6 0·3 (0·1–1·1) 0·2 (0·1–0·5) –26·8
Injuries 851·9 (738·8–968·8) 796·2 (697·4–992·5) –9·9 78·9 (68·7–89·3) 56·7 (49·8–70·4) –30·5
Transport injuries 159·5 (108·6–245·1) 287·0 (204·7–415·0) 79·0 14·7 (9·8–22·3) 19·8 (14·2–28·6) 33·5
Road injury 155·5 (105·5–231·8) 282·6 (205·2–414·9) 90·3 14·3 (9·7–21·2) 19·5 (14·2–28·6) 42·4
Pedestrian injury by road vehicle 34·7 (16·1–57·7) 105·4 (75·3–142·1) 188·9 3·2 (1·5–5·3) 7·2 (5·2–9·6) 113·8
Pedal cycle vehicle 6·0 (3·3–9·9) 8·8 (4·8–13·0) 48·2 0·6 (0·3–0·9) 0·6 (0·3–0·9) 11·2
Motorised vehicle with two wheels 33·2 (18·5–51·8) 48·7 (37·5–62·1) 48·6 3·0 (1·7–4·7) 3·3 (2·6–4·2) 12·4
Motorised vehicle with three or more wheels 34·5 (21·0–48·7) 74·0 (55·2–92·9) 111·5 3·1 (1·9–4·5) 5·1 (3·8–6·4) 59·8
Road injury other 47·1 (9·8–114·0) 45·7 (10·1–122·0) –5·8 4·4 (0·9–10·6) 3·2 (0·7–8·6) –28·0
Other transport injury 4·0 (1·9–6·5) 4·4 (2·5–7·2) 7·3 0·4 (0·2–0·6) 0·3 (0·2–0·5) –18·3
Unintentional injuries other than transport injuries 458·6 (412·0–508·7) 316·4 (277·2–349·5) –30·7 41·9 (38·2–46·4) 23·6 (20·7–26·1) –43·6
Falls 88·1 (75·4–109·8) 115·3 (89·1–136·0) 32·9 9·7 (8·2–12·2) 8·5 (6·6–10·0) –11·7
Drowning 147·4 (107·8–175·8) 67·4 (56·7–93·2) –56·5 12·2 (9·1–14·4) 5·5 (4·5–7·7) –57·4
Fire, heat, and hot substances 15·8 (12·7–19·9) 10·7 (8·4–15·4) –33·7 1·6 (1·3–2·0) 0·8 (0·6–1·2) –51·5
Poisonings 52·7 (39·6–93·6) 37·0 (19·3–49·0) –14·5 4·9 (3·7–8·8) 2·6 (1·4–3·4) –37·1
Exposure to mechanical forces 30·8 (23·1–44·0) 21·0 (12·2–27·0) –28·0 2·8 (2·1–4·1) 1·4 (0·8–1·8) –45·2
Mechanical forces (firearm) 11·4 (4·8–19·6) 3·6 (1·5–6·8) –69·3 1·0 (0·4–1·8) 0·2 (0·1–0·5) –76·2
Mechanical forces (other) 19·4 (9·3–36·9) 17·4 (7·1–28·0) –5·8 1·8 (0·8–3·4) 1·2 (0·5–1·9) –28·8
Adverse effects of medical treatment 4·2 (1·9–7·0) 7·0 (4·3–10·2) 72·4 0·4 (0·2–0·6) 0·5 (0·3–0·8) 34·1
Animal contact 8·0 (3·4–14·5) 3·0 (1·3–5·3) –61·7 0·8 (0·3–1·4) 0·2 (0·1–0·4) –71·0
Animal contact (venomous) 3·5 (1·2–9·1) 1·2 (0·5–2·5) –60·8 0·3 (0·1–0·9) 0·1 (0·0–0·2) –71·2
Animal contact (non-venomous) 4·5 (1·5–9·6) 1·8 (0·8–3·4) –59·3 0·4 (0·1–0·9) 0·1 (0·1–0·3) –68·1
Unintentional injuries not classified elsewhere 111·6 (81·2–128·8) 55·0 (39·9–62·4) –50·8 9·5 (7·0–10·8) 4·1 (3·1–4·7) –56·9
Self-harm and interpersonal violence 233·7 (157·5–278·0) 192·9 (152·2–309·3) –29·4 22·3 (15·4–26·7) 13·4 (10·5–21·3) –48·5
Self-harm 206·1 (132·3–248·9) 173·0 (134·6–286·0) –28·5 20·0 (13·1–24·6) 12·0 (9·3–19·7) –48·6
Interpersonal violence 27·7 (18·5–35·4) 19·9 (15·3–33·3) –36·0 2·3 (1·6–3·0) 1·4 (1·1–2·3) –47·0
Assault by firearm 4·9 (2·0–10·3) 2·2 (1·2–3·9) –54·7 0·4 (0·2–0·9) 0·1 (0·1–0·3) –63·8
Assault by sharp object 7·3 (3·6–12·0) 6·1 (3·9–9·7) –13·2 0·6 (0·3–1·0) 0·4 (0·3–0·7) –27·7
Assault by other means 15·5 (10·1–21·5) 11·7 (7·5–17·4) –23·9 1·3 (0·9–1·8) 0·8 (0·5–1·2) –36·9
Data are deaths (95% UI) or % change. 95% UIs are shown in parentheses. Percentage change is computed for 1000 draws of each quantity in 1990 and 2010 and median percentage change is reported. UI=uncertainty interval. DALYs=disability-adjusted life years. %Δ=percentage change. E coli=Escherichia coli. H influenza=Haemophilus influenza.
Table 2: Deaths (in thousands) and age-standardised death rates per 100 000 for 231 causes in 1990 and 2010 for all ages, both sexes combined, and percentage change from 1990 to 2010 in China

Articles
www.thelancet.com Vol 381 June 8, 2013 1997
disease, atrial fibrillation, peripheral vascular disease, diabetes, and road injury.
China has made substantial progress in reduction of the number of child deaths from 1·0 million (95% UI 0·9–1·1 million) in 1990 to 213 0000 (189 300–245 100) in 2010 (table 3). During this period, the main causes of child mortality also changed. The top five specific causes, accounting for 59·6% (54·1–64·9) of child deaths in 2010 were (in order of frequency) congenital anomalies, preterm birth complications, lower respiratory infections, neonatal encephalopathy, and drowning. Diarrhoeal diseases were ranked sixth (95% UI fifth to seventh) in 1990 but accounted for 0·9% (95% UI 0·6–1·3) of child deaths in 2010, and measles were ranked seventh (sixth to 13th) in 1990 but accounted for 0·2% (95% UI <0·05–0·4) of child deaths in 2010.
Figure 2 shows the striking transition in YLLs that took place in China between 1990 and 2010. The number of YLLs attributable to neonatal causes, diarrhoea, pneu-monia, and other infectious causes and injuries in children declined profoundly in this period. At the same time, a shift occurred towards a large number of cardio-vascular and cancer YLLs at older ages with a notable
peak in cancer YLLs in the 55–59 year age group in 2010. The number, age pattern, and composition of injury YLLs also changed: we noted increases and shifts to older ages in transport injuries and large declines in intentional injuries.
Figure 3 shows the transition in leading causes of YLLs from 1990 to 2010. We noted striking declines in major communicable and neonatal causes of premature mortality: lower respiratory infections moved from first (95% UI first to third) to ninth (eighth to 11th); neonatal encephalopathy dropped 14 ranks (sixth to 20th); preterm birth complications dropped ten ranks (fourth to 17th); a 77% (95% UI 72–84) decline in YLLs from tuberculosis led it to drop from 15th (13th to 16th) to 29th (26th to 35th); and diarrhoea and meningitis also had substantial improvements. YLLs from stroke, ischaemic heart disease, road injury, lung cancer, liver cancer, colorectal cancer, and diabetes increased. Although population ageing was a key driver of these increases, age-standardised YLL rates (data not shown) for ischaemic heart disease, road injury, lung cancer, and diabetes also increased between 1990 and 2010. Several disorders that did not increase in incidence remained leading causes of YLLs in 2010: chronic
1990 2010 Median %Δ in deaths
Deaths (thousands) % of total Deaths (thousands) % of total
All causes 1038·9 (937·0 to 1142·3) ·· 213·0 (189·3 to 245·1) ·· –79·7 (–82·5 to –75·3)
Congenital anomalies 109·6 (84·3 to 155·6) 10·5 (8·4 to 14·0) 33·2 (24·6 to 44·8) 15·6 (11·4 to 20·9) –69·3 (–78·7 to –57·5)
Preterm birth complications 97·4 (69·2 to 131·7) 9·4 (6·6 to 12·8) 27·6 (20·0 to 37·3) 13·0 (9·5 to 16·7) –71·6 (–81·6 to –57·7)
Other neonatal disorders 130·9 (77·9 to 186·4) 12·6 (7·6 to 18·2) 27·4 (18·0 to 40·1) 12·8 (8·8 to 17·8) –79·2 (–87·7 to –61·3)
Lower respiratory infections 254·7 (199·3 to 298·6) 24·5 (20·4 to 28·1) 26·9 (20·6 to 37·4) 12·6 (9·8 to 16·4) –89·8 (–92·3 to –83·9)
Neonatal encephalopathy (birth asphyxia/birth trauma) 109·7 (75·2 to 150·6) 10·6 (7·4 to 14·5) 26·8 (16·4 to 39·8) 12·5 (8·3 to 17·5) –75·4 (–86·4 to –60·2)
Other non-communicable diseases 48·1 (37·0 to 64·5) 4·6 (3·7 to 6·2) 19·7 (16·1 to 24·2) 9·3 (7·4 to 11·6) –58·8 (–69·5 to –44·7)
Drowning 63·2 (36·3 to 87·6) 6·1 (3·7 to 8·2) 12·5 (7·6 to 25·2) 5·8 (3·7 to 10·5) –81·9 (–89·4 to –42·8)
Other injuries 64·5 (46·6 to 79·3) 6·2 (4·7 to 7·7) 11·2 (8·2 to 14·6) 5·3 (3·7 to 7·0) –82·7 (–87·4 to –74·5)
Other communicable, maternal, neonatal, and nutritional diseases
12·3 (7·4 to 21·8) 1·2 (0·7 to 2·1) 6·0 (3·3 to 8·4) 2·8 (1·5 to 4·1) –46·3 (–80·3 to –10·3)
Road injury 9·0 (5·5 to 14·9) 0·9 (0·5 to 1·4) 5·5 (3·5 to 9·0) 2·6 (1·7 to 4·1) –38·7 (–66·5 to 19·6)
Falls 7·1 (5·0 to 12·0) 0·7 (0·5 to 1·2) 2·7 (1·7 to 4·2) 1·3 (0·8 to 1·9) –59·4 (–82·3 to –28·8)
Meningitis and encephalitis 13·6 (11·1 to 17·5) 1·3 (1·1 to 1·7) 2·1 (1·5 to 2·7) 1·0 (0·7 to 1·3) –84·9 (–89·7 to –78·7)
Diarrhoeal diseases 47·4 (37·5 to 59·3) 4·6 (3·6 to 5·7) 1·9 (1·4 to 2·7) 0·9 (0·6 to 1·2) –95·9 (–97·1 to –94·0)
Syphilis 12·2 (6·8 to 19·9) 1·2 (0·6 to 1·9) 1·7 (0·8 to 3·1) 0·8 (0·4 to 1·4) –86·8 (–91·6 to –78·7)
Sepsis and other infectious disorders of the newborn baby 5·1 (1·9 to 11·2) 0·5 (0·2 to 1·0) 1·6 (0·8 to 3·2) 0·8 (0·4 to 1·5) –65·9 (–88·3 to –21·8)
Typhoid and paratyphoid fevers 2·4 (0·3 to 4·5) 0·2 (0·0 to 0·4) 1·6 (0·2 to 3·1) 0·7 (0·1 to 1·5) –33·6 (–54·1 to –1·2)
Nutritional deficiencies 6·1 (4·2 to 10·4) 0·6 (0·4 to 1·0) 1·4 (0·8 to 2·3) 0·7 (0·4 to 1·1) –76·5 (–88·4 to –59·0)
Tetanus 15·3 (7·4 to 27·1) 1·5 (0·7 to 2·6) 0·7 (0·3 to 1·7) 0·3 (0·1 to 0·8) –96·0 (–98·2 to –86·7)
Fire, heat, and hot substances 3·1 (2·0 to 4·6) 0·3 (0·2 to 0·4) 0·7 (0·4 to 1·3) 0·3 (0·2 to 0·6) –80·7 (–89·0 to –46·2)
Epilepsy 1·6 (0·8 to 3·0) 0·2 (0·1 to 0·3) 0·5 (0·3 to 0·9) 0·3 (0·2 to 0·4) –65·6 (–84·3 to –17·6)
Whooping cough 3·2 (0·0 to 15·8) 0·3 (0·0 to 1·5) 0·4 (0·0 to 2·0) 0·2 (0·0 to 1·0) –87·1 (–89·0 to –84·5)
HIV/AIDS <0·05 (0·0 to 0·05) <0·05 (0·0 to 0·05) 0·4 (0·2 to 0·6) 0·2 (0·1 to 0·3) 4212·4 (1450·5 to 48 219·0)
Measles 20·0 (6·6 to 50·9) 1·9 (0·6 to 4·8) 0·3 (0·1 to 0·9) 0·2 (0·0 to 0·4) –98·4 (–99·0 to –97·3)
Tuberculosis 2·5 (1·8 to 3·2) 0·2 (0·2 to 0·3) 0·2 (0·1 to 0·4) 0·1 (0·0 to 0·2) –91·3 (–96·1 to –84·1)
Data in parentheses are 95% uncertainty intervals. Cause groups are ordered by the number of deaths in 2010. %Δ=percentage change.
Table 3: Deaths (in thousands), percentage of all-cause mortality, and median percentage change by cause from 1990 to 2010 for children younger than 5 years (both sexes) in China

Articles
1998 www.thelancet.com Vol 381 June 8, 2013
Figure 2: Years of life lost in China for both sexes for 21 cause groups, by age(A) 1990. (B) 2010.
0
5
10
15
20
25
30
A
YLL
(mill
ions
)
0–6 days
7–27 days
28–364 days
1–4 years
5–9 years
10–14 years
15–19 years
20–24 years
25–29 years
30–34 years
35–39 years
40–44 years
45–49 years
50–54 years
55–59 years
60–64 years
65–69 years
70–74 years
75–79 years
≥80 years0
5
10
15
20
25
30
B
YLL
(mill
ions
)
Age group
War and disasterIntentional injuriesUnintentional injuriesTransport injuriesOther non-communicable diseasesMusculoskeletal disordersDiabetes, urogenital, blood, and endocrineMental and behaviouraldisordersNeurological disordersDigestive diseasesCirrhosisChronic respiratorydiseasesCardiovascular andcirculatory diseasesCancerOther communicablediseasesNutritional deficienciesNeonatal disordersMaternal disordersNeglected tropicaldiseases and malariaDiarrhoea, lowerrespiratory infections,and other commoninfectious diseasesHIV/AIDS and tuberculosis

Articles
www.thelancet.com Vol 381 June 8, 2013 1999
obstructive pulmonary disease, stomach cancer, self-harm, oesophageal cancer, drowning, falls, and congenital anoma lies. The substantial decrease we noted in pre-mature mortality from drowning deserves note. Incidence of HIV/AIDS increased strikingly in the 20-year period to become the 23rd biggest cause (20th to 29th) of YLLs.
Figure 4 shows the levels of premature mortality in China relative to other members of the G20 in 2010. For men in China in 2010, age-standardised rates of years of life lost due to ischaemic heart disease, lower respiratory infections, cirrhosis, diabetes, preterm birth compli-cations, chronic kidney diseases, HIV/AIDS, and tuber-culosis were significantly better than the G20 mean. China had significantly worse ranks than the mean for stroke, chronic obstructive pulmonary disease, liver cancer, stomach cancer, oesophageal cancer, leukaemia, drowning, and falls. The YLL rates of road injury and lung cancer for 2010 are indistinguishable from the mean but the absolute increase in YLLs from these causes is concerning. For women in China, we noted better than G20 average performance on ischaemic heart disease, lower respiratory infections, diabetes, breast cancer,
preterm birth complications, chronic kidney diseases, cervical cancer, cirrhosis, cardiovascular and circulatory diseases. We noted worse than G20 average outcomes for stroke, chronic obstructive pulmonary disease, road injury, self-harm, liver cancer, stomach cancer, oesoph-ageal cancer, falls, drowning, and rheumatic heart disease. Even for conditions such as ischaemic heart disease, lung cancer, and diabetes (for which China was better than average in the G20 in 2010), rising rates suggest that this status might change in the near future.
Appendix p 6 shows YLDs per head by age in China, by sex, in 1990 and 2010. Compared with substantial declines in mortality, we noted relatively little change in the age-specific YLDs per head. The percentage of DALYs attributable to YLDs increased from 28·1% (95% UI 24·2–32·5) to 39·4% (34·9–43·8) in 2010. Figure 5 shows the prominent role played by mental and behavioural disorders (23·6%, 18·9–28·6) and musculoskeletal disorders (25·8%, 21·7–29·9) as causes of YLDs in adults. At younger ages, however, nutritional deficiencies, and some neglected tropical diseases make an important contribution. Other
Figure 3: Ranks for the top 25 causes of years of life lost in China for both sexes and all ages combined with 95% UIs in 1990 and 2010 and median percentage change from 1990 to 2010UI=uncertainty interval. COPD=chronic obstructive pulmonary disease.
2·2 (1 to 3) 3 COPD
14·6 (13 to 18) 14 Cirrhosis
22·1 (21 to 26) 22 Colorectal cancer
5·2 (4 to 8) 4 Congenital anomalies
25·1 (22 to 28) 24 Diabetes
15·8 (14 to 18) 16 Diarrhoeal diseases
60 Diarrhoeal diseases
5·7 (4 to 10) 5 Drowning
17·7 (15 to 20) 18 Oesophageal cancer
19·3 (17 to 21) 19 Falls
22·8 (20 to 26) 23 Hypertensive heart disease
7·6 (4 to 10) 7 Ischaemic heart disease
20·7 (19 to 24) 20 Leukaemia
10·5 (8 to 13) 12 Liver cancer
1·6 (1 to 3) 1 Lower respiratory infections
12·5 (8 to 14) 13 Lung cancer
25·7 (23 to 30) 25 Meningitis
49 Meningitis
7·1 (4 to 12) 6 Neonatal encephalopathy
21·7 (16 to 25) 21 Poisonings
8·6 (4 to 13) 9 Preterm birth complications
17·5 (16 to 19) 17 Rheumatic heart disease
28 Rheumatic heart disease
9·9 (4 to 14) 10 Road injury
7·7 (4 to 14) 8 Self-harm
10·5 (6 to 13) 11 Stomach cancer
2·2 (1 to 3) 2 Stroke
14·7 (13 to 16) 15 Tuberculosis
29 Tuberculosis
24·7 (22 to 27)24 Breast cancer 70 (49 to 99)
37 Breast cancer
3·3 (3 to 5)3 COPD –45 (–51 to –40)
21·2 (19 to 24)22 Chronic kidney disease 27 (–15 to 51)
27 Chronic kidney disease
14·9 (9 to 19)16 Cirrhosis –38 (–57 to 17)
13·5 (10 to 16)13 Colorectal cancer 38 (20 to 98)
12·4 (9 to 18)12 Congenital anomalies –66 (–79 to –48)
14·1 (11 to 18)14 Diabetes 67 (10 to 91)
12·2 (9 to 16)11 Drowning –64 (–74 to –32)
11·5 (9 to 18)10 Oesophageal cancer 1 (–40 to 35)
14·1 (11 to 19)15 Falls 2 (–30 to 26)
24·3 (20 to 29)23 HIV/AIDS 982 454 (5588 to 435 363)
117 HIV/AIDS
16·8 (13 to 20)17 Hypertensive heart disease 21 (–8 to 42)
2·1 (2 to 3)2 Ischaemic heart disease 81 (23 to 103)
18·9 (16 to 23)18 Leukaemia –13 (–33 to 5)
5·7 (3 to 6)6 Liver cancer 37 (17 to 76)
9·0 (8 to 11)9 Lower respiratory infections –81 (–84 to –75)
4·9 (3 to 7)5 Lung cancer 81 (27 to 112)
19·7 (13 to 26)20 Neonatal encephalopathy –75 (–86 to –60)
20·5 (18 to 22)21 Other cardiovascular and circulatory 311 (213 to 433)
48 Other cardiovascular and circulatory
25·9 (22 to 37)25 Poisonings –37 (–75 to –3)
19·0 (14 to 23)19 Preterm birth complications –71 (–82 to –58)
4·1 (2 to 6)4 Road injury 64 (–9 to 188)
7·9 (6 to 9)8 Self-harm –30 (–55 to 37)
7·3 (7 to 9)7 Stomach cancer –11 (–24 to 5)
1·0 (1 to 1)1 Stroke 21 (–13 to 37)
Communicable, maternal, neonatal, and nutritional disorders Non-communicable diseases Injuries
Mean rank (95% UI)
Disorder Disorder Mean rank (95% UI)
% change (95% UI)
1990 2010
Ascending order in rankDescending order in rank

Articles
2000 www.thelancet.com Vol 381 June 8, 2013
important causes included diabetes, urogenital, blood, and endocrine causes; other non-communicable diseases, which includes vision loss, hearing loss, and skin diseases; and unintentional injuries, which includes falls. Although age-specific YLDs per head rise with age, the effect of population age-structure leads to 77·2% (76·5–78·0) of YLDs occurring before age 60 years in China.
Figure 6 compares the leading causes of YLDs in 1990 and 2010. The top 11 causes of YLDs all increased in terms of the absolute numbers of YLDs. Of the top ten causes of disability in 2010, four were musculoskeletal disorders (low back pain, neck pain, other musculoskeletal disorders, and osteoarthritis). Major depression was the second lead-ing cause of disability and alcohol use disorders was the ninth most common cause of YLDs. China ranked among
Figure 4: Age-standardised YLL rates in China in 2010 relative to 18 other members of G20, ranked by cause(A) Male individuals. (B) Female individuals. Numbers in cells show the ranks of each country for each cause, with 1 representing the best performing country. Countries have been sorted on the basis of age-standardised all-cause YLLs for that year. Causes are ordered by the 25 leading causes of YLLs in China. YLL=years of life lost. COPD=chronic obstructive pulmonary disease. [A: confidence reference okay?]
9 2 1 1 8 17 16 17 12 9 8 5 5 3 12 3 1 4 1 3 1 9 1 4 87 4 8 4 11 15 11 4 4 1 3 6 8 6 13 8 7 13 5 5 4 4 9 2 52 5 5 6 7 3 3 11 7 2 5 1 2 5 16 1 5 12 4 4 9 3 6 13 11 8 4 7 13 2 4 14 5 4 6 4 7 8 10 2 10 9 7 6 8 5 10 14 26 9 2 9 9 1 6 9 15 8 2 8 11 7 14 5 2 5 9 11 5 1 3 12 65 10 3 8 15 7 9 10 9 5 1 12 12 4 17 7 6 8 6 12 3 6 5 3 44 3 7 3 16 16 7 15 16 3 7 11 13 2 15 4 4 11 3 14 7 2 8 6 7
11 1 10 5 10 18 19 16 10 6 10 14 16 1 11 6 13 6 2 1 2 7 7 5 153 13 11 11 14 11 2 12 8 7 9 10 10 9 9 10 11 10 10 9 6 12 12 18 3
12 16 19 2 1 13 1 1 2 12 12 3 9 13 2 14 14 1 17 13 12 16 4 11 1417 6 13 18 17 19 18 8 19 10 17 7 17 12 7 12 8 18 8 10 13 10 11 16 1110 15 12 12 12 5 13 13 13 14 13 13 3 15 18 13 12 17 13 16 11 14 13 9 98 11 14 10 2 10 8 5 3 13 14 19 14 18 3 9 18 16 12 7 14 19 15 10 12
16 18 6 17 19 12 15 7 1 11 4 2 6 19 8 17 9 19 14 17 10 8 2 7 1014 14 17 14 4 9 14 6 14 15 16 15 15 14 6 16 15 7 16 15 16 15 16 1 1318 12 18 16 6 8 10 2 6 17 11 18 4 10 4 18 17 15 15 19 19 17 14 15 1913 17 16 19 3 4 12 18 17 19 18 17 19 16 1 15 16 3 19 8 18 13 17 17 1719 19 15 15 18 6 17 19 11 16 19 16 18 17 19 11 3 14 11 2 15 11 18 19 1615 7 9 13 5 14 5 3 18 18 15 9 1 11 5 19 19 2 18 18 17 18 19 8 18
7 1 1 6 1 17 15 16 8 1 4 3 10 5 1 10 1 3 5 5 3 3 6 4 36 4 4 9 6 4 10 12 1 7 15 6 15 10 4 2 6 13 1 3 8 5 3 8 71 2 2 11 5 14 8 5 3 3 17 2 12 4 6 6 2 12 8 1 15 10 9 10 103 5 8 14 8 9 1 3 2 5 11 5 18 2 8 8 4 10 11 4 5 4 4 5 1
11 3 3 10 9 18 17 19 6 11 1 1 8 6 2 7 3 7 2 9 14 2 12 1 84 8 7 15 3 10 4 9 4 4 14 4 14 7 3 4 5 6 6 6 12 12 10 9 142 7 10 18 10 13 2 4 5 8 13 8 13 1 9 5 7 8 7 8 6 8 5 3 68 6 14 17 2 6 3 6 9 2 19 7 16 3 5 1 9 5 16 2 13 11 8 7 135 14 17 19 14 12 6 2 7 12 12 9 11 9 7 9 11 11 9 12 10 13 7 2 15
14 16 5 1 18 1 12 1 13 14 2 13 1 14 12 14 17 1 12 16 9 15 2 6 516 10 18 16 15 15 19 17 10 9 3 12 7 11 15 18 8 18 18 11 17 7 11 15 410 12 9 8 11 11 11 10 15 13 18 17 17 13 11 11 13 15 14 13 2 16 16 16 119 13 13 2 12 3 16 14 14 17 6 18 3 12 13 13 12 17 3 19 7 9 17 11 18
12 15 15 7 13 5 13 13 16 16 8 15 9 17 16 15 16 9 13 14 11 14 15 12 1217 18 16 12 4 7 7 15 11 10 10 19 5 15 10 3 14 16 4 7 4 18 1 19 218 19 6 4 17 16 9 18 12 6 16 14 19 8 14 17 10 14 10 10 16 1 13 13 1919 11 12 13 19 8 18 8 17 18 9 10 6 18 19 12 15 19 15 18 18 19 18 17 1613 17 19 3 16 19 5 11 19 15 5 16 2 16 18 19 19 4 17 15 19 6 14 18 1715 9 11 5 7 2 14 7 18 19 7 11 4 19 17 16 18 2 19 17 1 17 19 14 9
Ischa
emic
hear
t dise
ase
Stro
ke
Lung
canc
er
Live
r can
cer
COPD
Low
er re
spira
tory
infe
ctio
ns
Drow
ning
Falls
Road
inju
ry
Colo
rect
al ca
ncer
Hyp
erte
nsiv
e he
art d
iseas
e
Self-
harm
Oes
opha
geal
canc
er
Diab
etes
Leuk
aem
ia
Cong
enita
l ano
mal
ies
Pret
erm
birt
h co
mpl
icatio
ns
Oth
er ca
rdio
vasc
ular
and
cir
cula
tory
dise
ases
Neo
nata
l enc
epha
lopa
thy
Stom
ach
canc
er
Cirrh
osis
Chro
nic k
idne
y dise
ase
HIV
/AID
S
Poiso
ning
s
Tube
rcul
osis
Ischa
emic
hear
t dise
ase
Stro
ke
Lung
canc
er
Live
r can
cer
COPD
Low
er re
spira
tory
infe
ctio
ns
Drow
ning
Falls
Brea
st ca
ncer
Road
inju
ry
Colo
rect
al ca
ncer
Hyp
erte
nsiv
e he
art d
iseas
e
Self-
harm
Oes
opha
geal
canc
er
Diab
etes
Leuk
aem
ia
Cong
enita
l ano
mal
ies
Pret
erm
birt
h co
mpl
icatio
ns
Oth
er ca
rdio
vasc
ular
and
cir
cula
tory
dise
ases
Neo
nata
l enc
epha
lopa
thy
Stom
ach
canc
er
Cirrh
osis
Rheu
mat
ic he
art d
iseas
e
Cerv
ical c
ance
r
Chro
nic k
idne
y dise
ase
Lower than mean Ranking legend (95% confidence) [A: OK?] Indistinguishable from mean Higher than mean
Japan Italy Australia Canada UKGermany France South Korea USA SaudiArabia China Argentina MexicoTurkey Brazil Indonesia India Russia South Africa
Japan Italy France Australia South Korea Germany Canada UK USASaudi Arabia China Argentina MexicoBrazil Turkey Russia Indonesia India South Africa
B
A
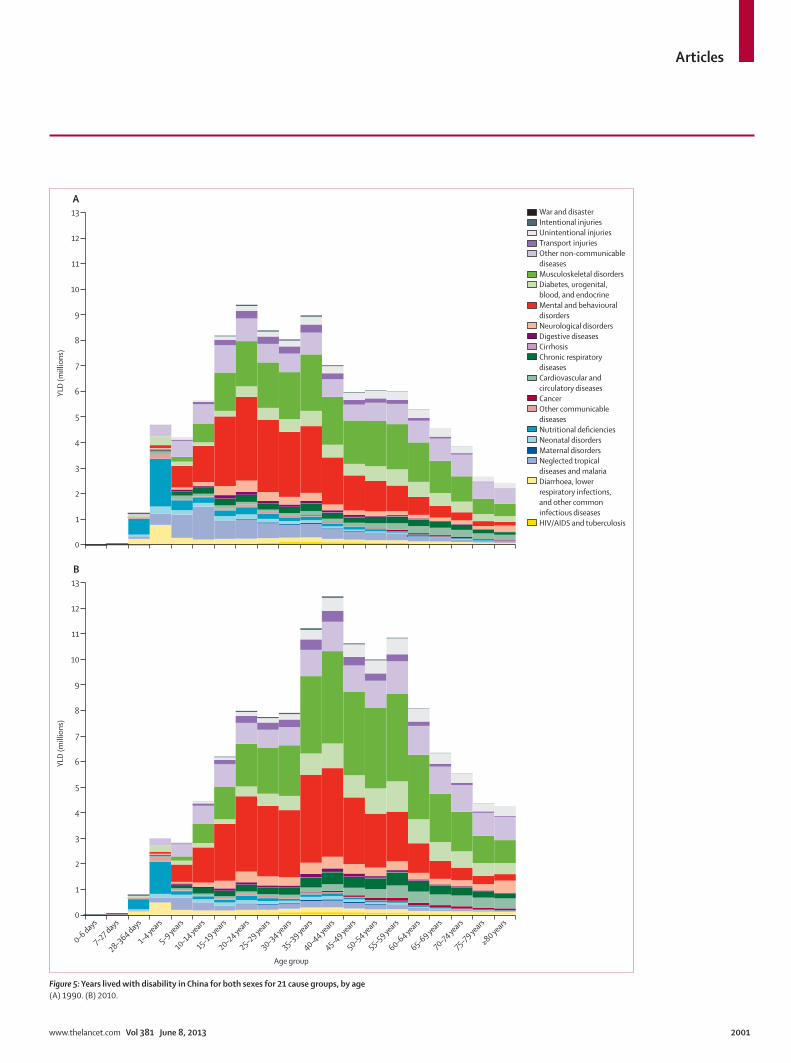
Articles
www.thelancet.com Vol 381 June 8, 2013 2001
Figure 5: Years lived with disability in China for both sexes for 21 cause groups, by age(A) 1990. (B) 2010.
0–6 days
7–27 days
28–364 days
1–4 years
5–9 years
10–14 years
15–19 years
20–24 years
25–29 years
30–34 years
35–39 years
40–44 years
45–49 years
50–54 years
55–59 years
60–64 years
65–69 years
70–74 years
75–79 years
≥80 years0
1
2
3
4
5
6
7
8
9
10
11
12
13B
YLD
(mill
ions
)
0
1
2
3
4
5
6
7
8
9
10
11
12
13A
YLD
(mill
ions
)
Age group
War and disasterIntentional injuriesUnintentional injuriesTransport injuriesOther non-communicable diseasesMusculoskeletal disordersDiabetes, urogenital, blood, and endocrineMental and behaviouraldisordersNeurological disordersDigestive diseasesCirrhosisChronic respiratorydiseasesCardiovascular andcirculatory diseasesCancerOther communicablediseasesNutritional deficienciesNeonatal disordersMaternal disordersNeglected tropicaldiseases and malariaDiarrhoea, lowerrespiratory infections,and other commoninfectious diseasesHIV/AIDS and tuberculosis

Articles
2002 www.thelancet.com Vol 381 June 8, 2013
the G20 as having the fifth lowest age-standardised rate of major de pression. Diabetes, falls, chronic obstruc tive pulmonary disease, and hearing loss constituted the other top ten causes of YLDs. Progress on tackling com muni-cable diseases was also evident in the analysis of YLDs. We noted substantial declines (>30·0%) for iron-deficiency anaemia, hook worm, tuberculosis, and ascariasis.
Putting premature mortality and disability together in terms of DALYs provides an overall picture of the leading health problems in China. Table 4 shows the number and rate of DALYs in 1990 and 2010 and the percentage change between 1990 and 2010. The top ten causes have prominent roles for cardiovascular disorders (stroke and ischaemic heart disease) and cancers (lung and liver). Two disorders that largely cause disability, low back pain and major depression, are also leading causes of DALYs. Four other disorders make up the top ten: chronic obstructive pulmonary disease, diabetes, road injuries, and falls, which all make up an important component of premature mortality and disability.
Appendix pp 7–8 ranks each country by the age-standardised DALY rate across the G20 for men and women in 2010. Men in China had higher than G20
average rates of disability-adjusted life years caused by stroke, chronic obstructive pulmonary disease, liver cancer, stomach cancer, oesophageal cancer, and drowning. Chinese women had increased rates of disability-adjusted life years caused by stroke, chronic obstructive pulmonary disease, road injury, self-harm, liver cancer, and stomach cancer. For some of the leading causes of disability, including low back pain and neck pain, China had rates that are indistinguishable from the G20 mean. Comparing 1990 (data not shown) with 2010, eight causes switched from significantly better than average to indistinguishable from average: falls, congenital anomalies, neonatal encephalopathy, poison ings, rheumatic heart disease, hookworm, ascariasis, and cysticercosis. For ischaemic heart disease, road injury and lung cancer (for which China was below the G20 average in 2010), rising rates mean that this situation might soon change.
Figure 7 shows the percentage of DALYs attributable to major risk groups in 2010. The leading risk factor in China was a composite of dietary risk factors, account-ing for 16·3% (14·5–18·0%) of DALYs and 30·6% (27·5–33·3%) of deaths. The composite diet risk factor
Figure 6: Top 25 ranks causes of YLDs for both sexes and all ages in China in 1990 and 2010, with median percentage change from 1990 to 2010UI=uncertainty level. COPD=chronic obstructive pulmonary disease. YLDs=years lived with disability.
Communicable, maternal, neonatal, and nutritional disorders Non-communicable diseases Injuries
Mean rank (95% UI)
Disorder Disorder Mean rank (95% UI)
% change (95% UI)
1990 2010
Ascending order in rankDescending order in rank
10·1 (4 to 18) 7 Alcohol use disorders
13·1 (7 to 19) 12 Anxiety disorders
16·0 (8 to 25) 16 Ascariasis
99 Ascariasis
13·9 (6 to 22) 13 Bipolar disorder
10·8 (4 to 20) 10 COPD
26·5 (19 to 38) 25 Conduct disorder
31 Conduct disorder
8·0 (5 to 13) 6 Diabetes
22·1 (17 to 27) 21 Diarrhoeal diseases
16·8 (9 to 24) 18 Drug use disorders
17·1 (9 to 25) 19 Dysthymia
10·1 (6 to 15) 8 Falls
22·8 (2 to 56) 22 Food-borne trematodiases
16·1 (6 to 26) 17 Hookworm
32 Hookworm
4·9 (3 to 8) 4 Iron-deficiency anemia
24·9 (19 to 34) 24 Ischaemic heart disease
1·1 (1 to 2) 1 Low back pain
2·0 (1 to 3) 2 Major depressive disorder
17·5 (9 to 23) 20 Migraine
3·4 (2 to 6) 3 Neck pain
24·6 (21 to 32) 23 Neonatal encephalopathy
27 Neonatal encephalopathy
12·3 (7 to 18) 11 Osteoarthritis
10·3 (4 to 20) 9 Other hearing loss
5·1 (4 to 9) 5 Other musculoskeletal disorders
14·0 (8 to 20) 14 Road injury
15·8 (7 to 23) 15 Schizophrenia
10·3 (5 to 16)9 Alcohol use disorders 25 (–15 to 80)
28·2 (21 to 38)25 Alzheimers disease 95 (81 to 112)
45 Alzheimer’s disease
12·6 (8 to 18)12 Anxiety disorders 25 (–0 to 60)
23·4 (19 to 33)20 Benign prostatic hyperplasia 78 (38 to 131)
33 Benign prostatic hyperplasia
13·2 (6 to 19)14 Bipolar disorder 26 (5 to 50)
9·1 (4 to 17)8 COPD 39 (–1 to 94)
5·5 (3 to 9)5 Diabetes 59 (34 to 88)
26·4 (21 to 35)23 Diarrhoeal diseases –19 (–30 to –7)
16·9 (10 to 22)18 Drug use disorders 13 (–29 to 84)
14·9 (8 to 20)15 Dysthymia 33 (23 to 46)
25·4 (19 to 40)21 Eczema 13 (–10 to 41)
26 Eczema
7·9 (5 to 12)7 Falls 49 (22 to 81)
26·0 (6 to 54)22 Food-borne trematodiases –8 (–88 to 447)
14·9 (9 to 20)16 Iron-deficiency anemia –34 (–40 to –30)
19·0 (13 to 24)19 Ischaemic heart disease 59 (44 to 74)
1·0 (1 to 1)1 Low back pain 44 (32 to 57)
2·1 (2 to 3)2 Major depressive disorder 22 (–8 to 60)
15·9 (10 to 21)17 Migraine 29 (13 to 45)
3·1 (2 to 6)3 Neck pain 39 (29 to 49)
7·1 (4 to 11)6 Osteoarthritis 73 (33 to 130)
11·4 (5 to 18)10 Other hearing loss 15 (0 to 36)
4·4 (3 to 7)4 Other musculoskeletal disorders 44 (33 to 56)
26·5 (13 to 48)24 Periodontal disease 65 (32 to 106)
36 Periodontal disease
13·0 (8 to 18)13 Road injury 26 (–4 to 64)
12·0 (5 to 18)11 Schizophrenia 52 (32 to 72)

Articles
www.thelancet.com Vol 381 June 8, 2013 2003
All ages DALYs (thousands) Age-standardised DALY rate (per 100 000)
1990 2010 Median %Δ
1990 2010 Median %Δ
All causes 365 390·8 (342 403·1–390 433·0)
316 616·1 (292 429·2–341 996·6)
–13·4 34 627·6 (32 546·7–36 963·9)
22 805·6 (21 125·1–24 630·4)
–34·2
Communicable, maternal, neonatal, and nutritional disorders
97 065·4 (87 592·0–108 572·4)
32 024·5 (28 260·9–36 819·7)
–67·0 7897·2 (7130·3–8857·0)
2843·8 (2489·4–3247·7)
–63·9
HIV/AIDS and tuberculosis 6163·8 (5178·9–7105·7) 3484·6 (2829·3–4197·3) –43·6 620·1 (518·8–715·0) 236·1 (191·8–284·2) –62·0
Tuberculosis 6150·8 (5170·7–7096·4) 1732·9 (1352·2–2098·1) –71·5 618·9 (517·9–714·7) 117·8 (91·7–142·5) –80·8
HIV/AIDS 13·0 (1·8–31·3) 1751·7 (1258·8–2330·9) 12 400·0 1·2 (0·2–2·9) 118·2 (84·8–157·5) 9009·4
HIV disease resulting in mycobacterial infection
1·3 (0·1–3·5) 113·8 (83·2–147·9) 7451·5 0·1 (0·0–0·3) 7·7 (5·6–10·0) 5439·7
HIV disease resulting in other specified or unspecified diseases
11·7 (1·8–27·7) 1637·9 (1173·2–2184·2) 12 995·8 1·1 (0·2–2·6) 110·6 (78·8–147·2) 9483·0
Diarrhoea, lower respiratory infections, meningitis, and other common infectious diseases
39 694·8 (33 504·7–44 936·4)
9202·9 (7907·1–10 842·0)
–77·0 3162·3 (2698·5–3559·1)
805·6 (691·9–947·5)
–74·7
Diarrhoeal diseases 6016·0 (5080·9–7135·2) 1297·4 (923·5–1752·6) –78·7 478·3 (405·4–564·6) 115·6 (83·0–155·3) –76·0
Cholera 178·2 (104·9–301·2) 15·4 (9·1–25·5) –91·5 13·6 (8·1–22·9) 1·5 (0·9–2·5) –89·1
Other salmonella infections 411·5 (281·4–593·8) 73·0 (46·4–107·2) –82·3 32·7 (22·7–46·4) 6·3 (4·0–9·4) –80·9
Shigellosis 402·8 (289·3–557·6) 109·8 (68·1–170·7) –72·8 32·9 (24·1–45·1) 9·2 (5·7–14·5) –72·3
Enteropathogenic E coli infection 680·0 (427·6–1019·6) 132·3 (70·6–232·2) –81·1 51·9 (32·8–77·6) 13·6 (7·1–24·3) –74·7
Enterotoxigenic E coli infection 534·9 (393·2–728·3) 189·4 (121·4–300·3) –64·8 44·1 (32·9–59·1) 15·5 (9·8–25·0) –65·5
Campylobacter enteritis 590·2 (384·8–882·4) 125·9 (72·7–204·4) –78·9 46·2 (30·5–68·5) 11·7 (6·5–19·6) –75·1
Amoebiasis 101·4 (72·2–140·4) 36·2 (21·2–56·5) –64·5 9·1 (6·6–12·2) 2·7 (1·6–4·1) –71·1
Cryptosporidiosis 554·2 (357·6–831·1) 88·3 (47·3–147·7) –84·4 42·3 (27·4–63·2) 8·9 (4·7–15·2) –79·5
Rotaviral enteritis 1567·4 (1150·5–2046·1) 230·2 (149·7–340·7) –85·4 120·9 (89·2–157·4) 22·6 (14·3–33·9) –81·5
Other diarrhoeal diseases 995·5 (671·2–1385·3) 296·9 (156·1–476·9) –70·6 84·6 (58·1–117·1) 23·6 (12·4–38·4) –72·6
Typhoid and paratyphoid fevers 772·9 (96·8–1455·1) 682·9 (89·7–1255·7) –11·6 62·0 (7·8–116·7) 57·2 (7·5–105·9) –7·8
Lower respiratory infections 25 300·9 (20 527·7–29 014·8)
5135·0 (4492·8–6092·5)
–80·1 2006·9 (1648·0–2285·2)
464·7 (401·2–565·5)
–77·4
Influenza 4671·2 (3519·9–5865·6) 1067·1 (909·2–1282·3) –77·3 374·6 (287·9–465·0) 93·7 (78·1–115·1) –75·2
Pneumococcal pneumonia 4839·2 (3770·6–6127·1) 1235·2 (1057·1–1457·0) –74·6 394·6 (314·7–492·9) 106·0 (89·1–127·0) –73·3
H influenzae type B pneumonia 7623·1 (5682·2–9727·9) 1192·7 (950·1–1534·7) –84·7 590·6 (443·6–748·8) 114·5 (88·6–151·5) –81·1
Respiratory syncytial virus pneumonia 4723·5 (3295·0–6322·1) 512·1 (348·0–745·3) –89·5 359·4 (250·9–480·7) 55·7 (37·5–81·6) –84·9
Other lower respiratory infections 3444·0 (2318·6–5218·0) 1127·8 (918·1–1404·1) –66·4 287·8 (201·3–425·4) 94·7 (75·6–120·4) –66·5
Upper respiratory infections 231·5 (127·1–387·5) 212·1 (105·4–371·5) –9·3 19·4 (10·6–32·6) 16·6 (8·2–28·9) –15·6
Otitis media 1012·8 (573·6–1805·1) 893·4 (533·8–1422·2) –8·3 90·2 (51·9–158·2) 69·0 (41·2–108·0) –21·4
Meningitis 2229·3 (1863·5–2559·9) 674·6 (534·6–890·1) –70·1 186·6 (155·8–214·1) 53·9 (43·3–69·2) –71·5
Pneumococcal meningitis 443·1 (348·3–526·5) 127·9 (97·5–166·5) –71·7 37·2 (29·5–44·2) 10·0 (7·7–12·8) –73·7
H influenzae type B meningitis 407·0 (328·9–502·0) 88·0 (68·1–110·4) –78·5 32·4 (26·3–39·5) 8·0 (6·2–10·1) –75·4
Meningococcal infection 303·9 (238·9–364·9) 84·4 (65·5–110·0) –72·7 25·2 (19·9–30·1) 6·7 (5·2–8·6) –73·8
Other meningitis 1072·1 (868·3–1259·7) 372·4 (286·5–504·6) –65·8 91·4 (73·9–108·1) 29·0 (22·6–38·1) –68·7
Encephalitis 312·5 (260·7–377·3) 67·7 (53·8–84·7) –78·4 24·7 (20·7–29·6) 6·1 (4·8–7·6) –75·5
Diphtheria 12·2 (0·0–107·6) 2·9 (0·0–24·8) –76·3 0·9 (0·0–8·3) 0·3 (0·0–2·4) –70·0
Whooping cough 290·1 (9·5–1396·2) 39·7 (1·8–182·8) –85·8 22·0 (0·7–106·0) 4·3 (0·2–19·7) –79·8
Tetanus 1457·4 (697·9–2530·1) 90·2 (34·2–227·9) –94·4 114·1 (54·9–197·3) 8·7 (3·6–21·2) –92·9
Measles 1975·7 (666·8–5000·0) 33·8 (9·3–93·2) –98·3 149·6 (50·5–378·7) 3·6 (1·0–9·9) –97·7
Varicella 83·5 (22·7–346·5) 73·2 (29·0–221·1) 6·2 7·4 (2·2–28·6) 5·7 (2·1–19·1) –16·8
Neglected tropical diseases and malaria 8656·2 (5002·0–16 670·9)
3697·5 (1947·9–7386·2)
–58·0 762·1 (441·2–1459·8)
287·4 (155·1–553·1)
–62·5
Malaria 15·2 (10·5–22·2) 11·7 (7·2–18·3) –22·8 1·3 (0·9–1·9) 1·0 (0·6–1·5) –25·0
Leishmaniasis 426·5 (187·3–970·8) 110·2 (52·8–212·1) –73·8 34·6 (15·4–77·6) 9·4 (4·3–18·7) –72·7
Schistosomiasis 273·4 (13·1–1548·5) 250·6 (20·8–1344·8) –0·7 27·8 (1·1–158·5) 17·5 (1·9–90·8) –26·8
Cysticercosis 104·8 (73·3–148·9) 67·5 (44·0–96·5) –35·6 9·3 (6·6–13·0) 4·7 (3·0–6·7) –49·9
(Continues on next page)

Articles
2004 www.thelancet.com Vol 381 June 8, 2013
All ages DALYs (thousands) Age-standardised DALY rate (per 100 000)
1990 2010 Median %Δ
1990 2010 Median %Δ
(Continued from previous page)
Echinococcosis 41·7 (7·9–121·2) 44·9 (9·0–144·0) –1·3 4·1 (0·8–11·9) 3·1 (0·6–9·8) –30·5
Lymphatic filariasis 123·5 (76·7–180·5) –100·0 11·6 (7·2–16·9) –100·0
Trachoma 25·9 (16·3–38·6) 39·9 (25·9–56·8) 55·2 2·8 (1·8–4·2) 2·7 (1·8–3·8) –4·7
Dengue 57·2 (12·5–196·5) 47·2 (18·9–112·2) –8·3 4·7 (1·0–16·0) 4·0 (1·5–9·5) –8·8
Rabies 94·3 (53·7–156·2) 45·1 (13·3–84·5) –60·1 8·4 (4·9–13·7) 3·4 (1·0–6·4) –66·5
Intestinal nematode infections 4431·0 (2391·4–7631·5) 1043·0 (459·1–1991·9) –76·6 389·3 (211·0–672·4) 92·0 (39·0–174·5) –76·3
Ascariasis 2152·3 (1169·7–3626·8) 90·8 (43·4–195·4) –96·1 190·1 (103·5–321·0) 7·5 (3·4–17·1) –96·5
Trichuriasis 237·8 (126·8–402·5) 14·1 (7·7–25·2) –94·1 21·1 (11·3–35·4) 1·1 (0·6–1·9) –95·0
Hookworm disease 2040·9 (960·6–3650·7) 938·1 (387·0–1831·4) –54·3 178·1 (85·0–319·1) 83·4 (32·9–162·9) –53·2
Food-borne trematodiases 2034·5 (349·5–8097·9) 1529·2 (406·1–4437·5) –7·9 180·0 (31·3–709·9) 108·5 (28·8–316·7) –27·2
Other neglected tropical diseases 1028·3 (556·3–2492·1) 508·1 (284·8–1046·0) –47·5 88·1 (47·5–214·3) 41·2 (24·4–76·9) –48·8
Maternal disorders 1401·2 (1061·6–2050·8) 545·9 (317·4–1266·9) –64·9 111·6 (83·0–169·6) 37·4 (22·3–83·2) –69·4
Maternal haemorrhage 319·3 (247·7–439·2) 95·2 (69·7–119·6) –69·9 25·2 (19·6–34·6) 6·8 (4·9–8·5) –72·9
Maternal sepsis 174·6 (133·9–241·6) 41·5 (30·5–54·2) –76·0 13·2 (10·2–18·4) 3·0 (2·2–3·9) –77·2
Hypertensive disorders of pregnancy 159·7 (124·9–215·5) 46·6 (34·1–64·3) –70·9 12·2 (9·6–16·4) 3·4 (2·5–4·7) –72·3
Obstructed labour 155·3 (28·2–568·3) 196·3 (23·1–790·5) 25·0 14·7 (2·5–54·3) 12·6 (1·6–50·8) –12·8
Abortion 204·3 (159·2–280·4) 55·3 (39·2–79·2) –73·0 15·7 (12·3–21·7) 3·9 (2·8–5·7) –75·0
Other maternal disorders 388·0 (296·4–539·3) 111·1 (69·9–225·9) –73·5 30·6 (23·4–43·5) 7·7 (4·9–15·0) –76·4
Neonatal disorders 31 212·8 (26 661·0–35 682·6)
8678·8 (6681·0–10 384·2)
–72·3 2418·1 (2066·0–2763·7)
926·8 (706·3–1117·6)
–61·9
Preterm birth complications 8804·0 (6344·9–11 790·5) 2858·1 (2187·8–3742·5) –67·3 683·1 (494·2–913·6) 304·6 (230·1–403·0) –55·1
Neonatal encephalopathy (birth asphyxia/birth trauma)
10 569·3 (7655·4–14 118·2) 3255·8 (2338·5–4438·7) –69·0 823·4 (598·2–1097·9) 333·6 (231·9–465·3) –59·2
Sepsis and other infectious disorders of the newborn baby
436·9 (165·5–962·7) 139·8 (69·7–271·6) –65·8 33·7 (12·8–74·3) 15·8 (7·9–30·7) –49·9
Other neonatal disorders 11 402·6 (6837·5–16 172·4) 2425·2 (1622·1–3505·8) –78·9 878·0 (525·7–1245·8) 272·8 (182·0–394·7) –69·1
Nutritional deficiencies 5513·7 (4040·5–7469·5) 3307·5 (2350·5–4613·3) –39·4 445·9 (328·2–600·8) 305·9 (216·7–428·4) –30·8
Protein-energy malnutrition 1013·8 (804·4–1385·8) 321·2 (231·1–406·1) –68·1 82·5 (66·7–112·0) 30·1 (21·3–39·2) –63·3
Iodine deficiency 322·7 (207·8–490·4) 300·9 (183·8–480·3) –7·2 27·9 (17·8–42·3) 21·3 (13·1–34·0) –23·8
Vitamin A deficiency 117·9 (86·6–154·0) 63·4 (44·3–86·8) –46·1 9·4 (6·9–12·3) 5·2 (3·7–7·1) –44·8
Iron-deficiency anemia 4000·3 (2679·3–5881·1) 2588·9 (1693·2–3834·7) –35·2 320·8 (215·5–472·1) 246·8 (162·5–363·5) –23·1
Other nutritional deficiencies 59·0 (49·5–76·6) 33·2 (22·0–40·0) –42·7 5·3 (4·5–6·7) 2·6 (1·7–3·1) –51·0
Other communicable, maternal, neonatal, and nutritional disorders
4422·9 (3724·9–5283·1) 3107·2 (2579·9–3591·2) –29·0 377·0 (322·5–444·2) 244·7 (197·3–285·9) –34·5
Sexually transmitted diseases excluding HIV 1631·0 (1059·3–2349·6) 510·6 (302·4–812·9) –69·2 130·3 (85·2–189·0) 42·3 (25·7–66·2) –68·0
Syphilis 1241·4 (766·4–1910·3) 183·6 (101·2–310·0) –85·3 98·8 (62·0–150·5) 18·8 (10·0–32·6) –81·3
Sexually transmitted chlamydial diseases 231·2 (97·1–427·4) 220·9 (81·4–438·9) –5·9 17·9 (7·7–32·8) 16·1 (5·9–31·9) –11·6
Gonococcal infection 50·3 (25·9–83·5) 43·9 (18·9–82·2) –14·1 4·2 (2·2–7·0) 3·1 (1·3–5·8) –28·3
Trichomoniasis 33·0 (0·2–99·6) 24·8 (0·1–77·4) –25·1 2·6 (0·0–7·6) 1·8 (0·0–5·6) –30·0
Other sexually transmitted diseases 75·1 (35·4–117·4) 37·4 (20·8–65·6) –51·8 6·7 (3·1–10·5) 2·5 (1·4–4·5) –63·5
Hepatitis 1480·7 (1323·3–1673·3) 1442·8 (1221·6–1714·3) –3·2 138·3 (124·0–155·5) 97·8 (82·9–116·1) –29·8
Acute hepatitis A 308·5 (147·7–703·3) 179·1 (76·0–539·5) –44·6 28·9 (13·7–66·3) 12·8 (5·7–37·5) –56·4
Acute hepatitis B 864·6 (636·5–1100·3) 1083·7 (739·2–1394·0) 25·8 84·8 (63·8–108·4) 71·7 (49·5–91·9) –14·8
Acute hepatitis C 25·9 (15·2–41·4) 41·8 (28·3–57·1) 66·0 2·6 (1·6–4·2) 2·8 (1·9–3·8) 8·1
Acute hepatitis E 281·7 (160·9–461·6) 138·2 (71·0–240·2) –51·6 21·9 (12·6–35·9) 10·5 (5·5–18·0) –53·0
Leprosy 0·3 (0·1–0·8) <0·05 (0·0–0·2) –85·1 <0·05 (0·0–0·1) <0·05 (0·0–0·05) –88·3
Other infectious diseases 1311·0 (1047·1–1870·7) 1153·8 (711·7–1417·5) –5·9 108·5 (88·2–151·5) 104·7 (64·0–130·1) 3·1
Non-communicable diseases 217 135·5 (202 900·7–234 686·3)
243 787·7 (224 298·4–264 558·7)
12·3 22 358·9 (20 943·7–24 144·9)
17 021·8 (15 673·6–18 458·5)
–23·8
Neoplasms 42 123·6 (38 081·6–47 195·5)
53 105·5 (48 351·7–58 136·7)
26·3 4471·5 (4041·5–5040·1)
3579·6 (3257·3–3908·9)
–19·8
(Continues on next page)

Articles
www.thelancet.com Vol 381 June 8, 2013 2005
All ages DALYs (thousands) Age-standardised DALY rate (per 100 000)
1990 2010 Median %Δ
1990 2010 Median %Δ
(Continued from previous page)
Oesophageal cancer 3868·4 (3168·4–5255·7) 3858·1 (2534·0–4960·1) 4·9 437·5 (357·9–593·1) 258·8 (170·7–334·5) –37·9
Stomach cancer 7440·6 (5626·0–10 084·2) 6615·6 (4806·1–8739·3) –11·1 819·7 (621·2–1109·4) 444·8 (323·8–584·2) –45·8
Liver cancer 7370·7 (6070·8–8874·6) 10 088·6 (8790·2–13 301·8) 35·0 784·3 (653·3–935·5) 659·7 (574·1–866·3) –16·9
Liver cancer secondary to hepatitis B 3944·8 (3240·8–4694·3) 5464·1 (4654·1–7228·2) 36·5 421·2 (344·7–500·7) 357·1 (304·1–467·1) –16·2
Liver cancer secondary to hepatitis C 1094·2 (907·5–1303·4) 1693·8 (1419·4–2194·8) 53·7 122·5 (101·4–146·1) 112·3 (94·3–144·0) –8·8
Liver cancer secondary to alcohol use 1404·6 (1128·7–1680·3) 1892·6 (1564·1–2514·5) 32·8 149·1 (120·0–177·2) 122·9 (101·5–162·6) –18·6
Other liver cancer 927·0 (755·7–1166·9) 1038·0 (836·5–1413·1) 9·8 91·5 (74·5–112·2) 67·5 (54·3–92·7) –27·9
Larynx cancer 236·8 (108·3–441·7) 311·2 (136·0–571·1) 30·1 26·8 (12·3–50·4) 20·8 (9·1–38·3) –23·2
Trachea, bronchus, and lung cancers 6305·9 (5233·5–8931·3) 11 318·4 (7921·4–13 281·6) 88·0 702·8 (582·5–996·2) 760·4 (529·6–890·0) 13·5
Breast cancer 954·6 (903·0–1001·7) 1670·7 (1499·1–1912·8) 73·7 101·9 (96·6–106·8) 107·0 (96·3–122·3) 4·1
Cervical cancer 557·4 (374·8–868·3) 742·0 (331·3–984·4) 51·4 60·6 (40·6–94·0) 48·0 (21·7–63·1) –10·8
Uterine cancer 154·1 (103·9–325·1) 287·0 (106·1–380·5) 127·0 16·5 (11·3–35·0) 18·8 (7·0–24·7) 38·7
Prostate cancer 69·7 (44·1–118·7) 178·4 (80·5–264·4) 115·9 8·0 (5·1–13·5) 12·9 (5·8–19·1) 37·0
Colon and rectum cancers 2447·4 (1966·7–2710·3) 3422·6 (3003·7–4487·9) 35·9 263·8 (213·7–292·0) 230·7 (203·2–300·8) –14·9
Mouth cancer 205·2 (169·5–234·5) 360·7 (262·5–469·6) 76·1 22·1 (18·3–25·2) 23·9 (17·5–31·0) 8·2
Nasopharynx cancer 739·8 (505·1–1063·6) 1059·7 (644·8–1540·3) 39·3 76·7 (53·1–111·7) 68·8 (42·5–98·2) –13·0
Cancer of other part of pharynx and oropharynx
120·6 (75·5–164·7) 144·2 (99·1–227·6) 18·3 12·7 (7·9–17·1) 9·6 (6·6–15·2) –25·0
Gallbladder and biliary tract cancer 415·6 (289·7–643·7) 644·2 (417·1–934·4) 56·2 45·3 (31·9–70·1) 43·9 (28·3–63·7) –2·7
Pancreatic cancer 767·0 (585·1–1016·7) 1321·8 (998·7–1698·2) 74·1 84·9 (65·1–112·4) 88·5 (66·7–113·2) 5·3
Malignant melanoma of skin 79·3 (41·7–97·2) 155·8 (109·5–278·8) 82·3 8·0 (4·3–9·9) 10·6 (7·4–18·9) 21·9
Non-melanoma skin cancer 76·1 (40·5–131·5) 96·1 (56·8–161·0) 24·8 8·4 (4·4–14·7) 6·6 (3·9–11·1) –22·1
Ovarian cancer 457·6 (312·0–591·8) 602·9 (399·9–850·1) 21·9 47·9 (32·6–61·6) 39·3 (26·2–55·4) –24·2
Testicular cancer 39·1 (19·9–55·7) 29·4 (15·7–53·5) –30·6 3·6 (1·8–5·1) 2·0 (1·1–3·7) –48·4
Kidney and other urinary organ cancers 425·6 (292·4–595·7) 836·6 (587·4–1096·6) 97·7 43·1 (30·2–59·9) 57·7 (40·4–75·9) 34·5
Bladder cancer 296·4 (242·4–368·9) 411·1 (320·1–510·0) 39·3 33·6 (27·6–42·1) 28·6 (22·3–35·4) –14·3
Brain and nervous system cancers 1256·5 (806·0–1674·0) 1496·5 (912·7–2075·0) 19·9 125·3 (81·2–169·0) 102·3 (61·7–142·7) –17·9
Thyroid cancer 136·9 (106·3–184·2) 212·6 (148·5–282·8) 56·7 14·3 (11·1–19·2) 14·3 (10·0–18·9) 0·7
Hodgkin’s disease 64·7 (42·7–98·6) 41·4 (25·9–61·9) –36·4 5·8 (3·9–8·9) 3·1 (1·9–4·8) –48·1
Non-Hodgkin lymphoma 738·5 (624·8–860·0) 812·2 (649·9–982·0) 8·9 70·6 (59·7–81·9) 57·6 (45·9–70·1) –19·0
Multiple myeloma 157·5 (104·8–235·0) 250·1 (146·6–363·8) 59·6 15·5 (10·4–23·1) 17·0 (10·0–24·8) 10·8
Leukaemia 2772·1 (2166·2–3533·1) 2418·1 (1856·4–2975·7) –9·5 235·0 (184·5–298·9) 184·2 (141·0–226·4) –18·7
Other neoplasms 3969·6 (2815·5–4898·8) 3719·4 (2707·8–4860·7) –7·7 396·8 (277·6–487·5) 259·7 (189·7–335·5) –35·5
Cardiovascular and circulatory diseases 45 267·9 (42 851·2–51 606·5)
58 205·5 (53 245·8–61 100·3)
30·6 5114·5 (4842·2–5826·4)
4065·1 (3707·6–4264·6)
–19·3
Rheumatic heart disease 4140·4 (3766·9–4548·5) 1486·6 (1306·6–1691·0) –64·1 420·7 (382·5–462·8) 101·6 (89·3–115·9) –75·8
Ischaemic heart disease 10 127·0 (9193·6–12 758·3)
17 885·8 (15 135·4–19 306·6)
83·0 1139·8 (1036·0–1434·6)
1242·5 (1053·5–1339·7)
13·1
Cerebrovascular disease 24 876·8 (22 724·2–30 679·9)
30 138·9 (25 523·4–32 406·0)
28·9 2894·6 (2651·5–3550·7)
2101·5 (1783·9–2257·2)
–23·0
Ischaemic stroke 6252·0 (4408·0–9652·9) 8383·8 (6523·0–11 529·4) 35·9 767·5 (547·0–1169·1) 612·4 (478·1–835·8) –19·1
Haemorrhagic and other non-ischemic stroke
18 624·7 (13 636·3–23 424·5)
21 755·1 (17 436·2–25 934·6)
16·8 2127·0 (1557·1–2669·7)
1489·1 (1192·7–1781·1)
–30·0
Hypertensive heart disease 2307·1 (1866·1–2994·8) 2767·4 (2169·8–3284·5) 22·8 271·2 (218·8–351·2) 194·7 (152·4–230·9) –26·6
Cardiomyopathy and myocarditis 1139·2 (619·8–1796·4) 1012·6 (683·4–1380·0) –8·5 107·8 (61·2–166·2) 74·5 (49·5–102·4) –29·1
Atrial fibrillation and flutter 337·3 (232·9–465·3) 596·2 (425·6–809·7) 76·9 39·9 (27·6–55·4) 42·6 (30·3–58·0) 6·7
Aortic aneurysm 692·1 (243·1–1208·2) 1010·1 (563·5–1569·9) 45·5 78·7 (27·8–136·2) 70·4 (39·1–109·7) –10·8
Peripheral vascular disease 81·7 (46·3–126·5) 181·5 (110·9–279·6) 120·9 10·0 (5·7–15·7) 13·0 (7·9–20·2) 29·2
Endocarditis 397·0 (268·7–545·9) 386·7 (275·0–507·2) –2·0 36·1 (25·2–48·8) 27·2 (19·7–35·5) –24·2
Other cardiovascular and circulatory diseases 1169·3 (813·0–1678·6) 2739·7 (2367·5–3187·2) 137·1 115·8 (83·3–162·2) 197·1 (169·4–230·3) 72·5
(Continues on next page)
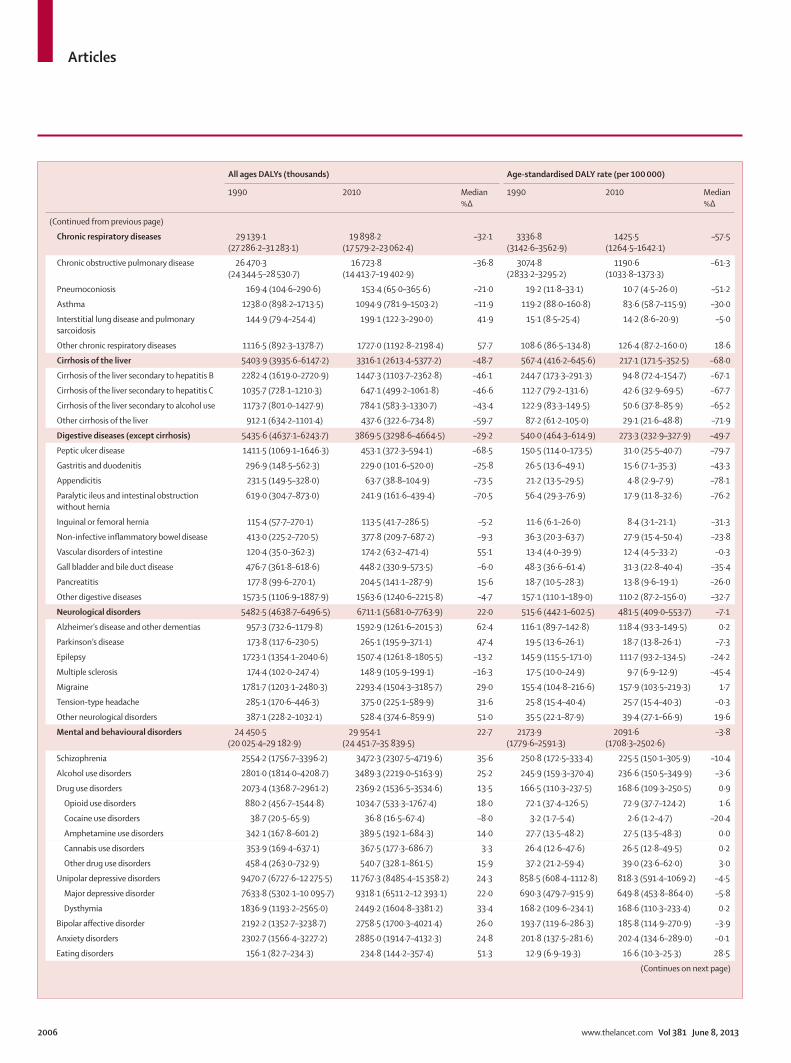
Articles
2006 www.thelancet.com Vol 381 June 8, 2013
All ages DALYs (thousands) Age-standardised DALY rate (per 100 000)
1990 2010 Median %Δ
1990 2010 Median %Δ
(Continued from previous page)
Chronic respiratory diseases 29 139·1 (27 286·2–31 283·1)
19 898·2 (17 579·2–23 062·4)
–32·1 3336·8 (3142·6–3562·9)
1425·5 (1264·5–1642·1)
–57·5
Chronic obstructive pulmonary disease 26 470·3 (24 344·5–28 530·7)
16 723·8 (14 413·7–19 402·9)
–36·8 3074·8 (2833·2–3295·2)
1190·6 (1033·8–1373·3)
–61·3
Pneumoconiosis 169·4 (104·6–290·6) 153·4 (65·0–365·6) –21·0 19·2 (11·8–33·1) 10·7 (4·5–26·0) –51·2
Asthma 1238·0 (898·2–1713·5) 1094·9 (781·9–1503·2) –11·9 119·2 (88·0–160·8) 83·6 (58·7–115·9) –30·0
Interstitial lung disease and pulmonary sarcoidosis
144·9 (79·4–254·4) 199·1 (122·3–290·0) 41·9 15·1 (8·5–25·4) 14·2 (8·6–20·9) –5·0
Other chronic respiratory diseases 1116·5 (892·3–1378·7) 1727·0 (1192·8–2198·4) 57·7 108·6 (86·5–134·8) 126·4 (87·2–160·0) 18·6
Cirrhosis of the liver 5403·9 (3935·6–6147·2) 3316·1 (2613·4–5377·2) –48·7 567·4 (416·2–645·6) 217·1 (171·5–352·5) –68·0
Cirrhosis of the liver secondary to hepatitis B 2282·4 (1619·0–2720·9) 1447·3 (1103·7–2362·8) –46·1 244·7 (173·3–291·3) 94·8 (72·4–154·7) –67·1
Cirrhosis of the liver secondary to hepatitis C 1035·7 (728·1–1210·3) 647·1 (499·2–1061·8) –46·6 112·7 (79·2–131·6) 42·6 (32·9–69·5) –67·7
Cirrhosis of the liver secondary to alcohol use 1173·7 (801·0–1427·9) 784·1 (583·3–1330·7) –43·4 122·9 (83·3–149·5) 50·6 (37·8–85·9) –65·2
Other cirrhosis of the liver 912·1 (634·2–1101·4) 437·6 (322·6–734·8) –59·7 87·2 (61·2–105·0) 29·1 (21·6–48·8) –71·9
Digestive diseases (except cirrhosis) 5435·6 (4637·1–6243·7) 3869·5 (3298·6–4664·5) –29·2 540·0 (464·3–614·9) 273·3 (232·9–327·9) –49·7
Peptic ulcer disease 1411·5 (1069·1–1646·3) 453·1 (372·3–594·1) –68·5 150·5 (114·0–173·5) 31·0 (25·5–40·7) –79·7
Gastritis and duodenitis 296·9 (148·5–562·3) 229·0 (101·6–520·0) –25·8 26·5 (13·6–49·1) 15·6 (7·1–35·3) –43·3
Appendicitis 231·5 (149·5–328·0) 63·7 (38·8–104·9) –73·5 21·2 (13·5–29·5) 4·8 (2·9–7·9) –78·1
Paralytic ileus and intestinal obstruction without hernia
619·0 (304·7–873·0) 241·9 (161·6–439·4) –70·5 56·4 (29·3–76·9) 17·9 (11·8–32·6) –76·2
Inguinal or femoral hernia 115·4 (57·7–270·1) 113·5 (41·7–286·5) –5·2 11·6 (6·1–26·0) 8·4 (3·1–21·1) –31·3
Non-infective inflammatory bowel disease 413·0 (225·2–720·5) 377·8 (209·7–687·2) –9·3 36·3 (20·3–63·7) 27·9 (15·4–50·4) –23·8
Vascular disorders of intestine 120·4 (35·0–362·3) 174·2 (63·2–471·4) 55·1 13·4 (4·0–39·9) 12·4 (4·5–33·2) –0·3
Gall bladder and bile duct disease 476·7 (361·8–618·6) 448·2 (330·9–573·5) –6·0 48·3 (36·6–61·4) 31·3 (22·8–40·4) –35·4
Pancreatitis 177·8 (99·6–270·1) 204·5 (141·1–287·9) 15·6 18·7 (10·5–28·3) 13·8 (9·6–19·1) –26·0
Other digestive diseases 1573·5 (1106·9–1887·9) 1563·6 (1240·6–2215·8) –4·7 157·1 (110·1–189·0) 110·2 (87·2–156·0) –32·7
Neurological disorders 5482·5 (4638·7–6496·5) 6711·1 (5681·0–7763·9) 22·0 515·6 (442·1–602·5) 481·5 (409·0–553·7) –7·1
Alzheimer’s disease and other dementias 957·3 (732·6–1179·8) 1592·9 (1261·6–2015·3) 62·4 116·1 (89·7–142·8) 118·4 (93·3–149·5) 0·2
Parkinson’s disease 173·8 (117·6–230·5) 265·1 (195·9–371·1) 47·4 19·5 (13·6–26·1) 18·7 (13·8–26·1) –7·3
Epilepsy 1723·1 (1354·1–2040·6) 1507·4 (1261·8–1805·5) –13·2 145·9 (115·5–171·0) 111·7 (93·2–134·5) –24·2
Multiple sclerosis 174·4 (102·0–247·4) 148·9 (105·9–199·1) –16·3 17·5 (10·0–24·9) 9·7 (6·9–12·9) –45·4
Migraine 1781·7 (1203·1–2480·3) 2293·4 (1504·3–3185·7) 29·0 155·4 (104·8–216·6) 157·9 (103·5–219·3) 1·7
Tension-type headache 285·1 (170·6–446·3) 375·0 (225·1–589·9) 31·6 25·8 (15·4–40·4) 25·7 (15·4–40·3) –0·3
Other neurological disorders 387·1 (228·2–1032·1) 528·4 (374·6–859·9) 51·0 35·5 (22·1–87·9) 39·4 (27·1–66·9) 19·6
Mental and behavioural disorders 24 450·5 (20 025·4–29 182·9)
29 954·1 (24 451·7–35 839·5)
22·7 2173·9 (1779·6–2591·3)
2091·6 (1708·3–2502·6)
–3·8
Schizophrenia 2554·2 (1756·7–3396·2) 3472·3 (2307·5–4719·6) 35·6 250·8 (172·5–333·4) 225·5 (150·1–305·9) –10·4
Alcohol use disorders 2801·0 (1814·0–4208·7) 3489·3 (2219·0–5163·9) 25·2 245·9 (159·3–370·4) 236·6 (150·5–349·9) –3·6
Drug use disorders 2073·4 (1368·7–2961·2) 2369·2 (1536·5–3534·6) 13·5 166·5 (110·3–237·5) 168·6 (109·3–250·5) 0·9
Opioid use disorders 880·2 (456·7–1544·8) 1034·7 (533·3–1767·4) 18·0 72·1 (37·4–126·5) 72·9 (37·7–124·2) 1·6
Cocaine use disorders 38·7 (20·5–65·9) 36·8 (16·5–67·4) –8·0 3·2 (1·7–5·4) 2·6 (1·2–4·7) –20·4
Amphetamine use disorders 342·1 (167·8–601·2) 389·5 (192·1–684·3) 14·0 27·7 (13·5–48·2) 27·5 (13·5–48·3) 0·0
Cannabis use disorders 353·9 (169·4–637·1) 367·5 (177·3–686·7) 3·3 26·4 (12·6–47·6) 26·5 (12·8–49·5) 0·2
Other drug use disorders 458·4 (263·0–732·9) 540·7 (328·1–861·5) 15·9 37·2 (21·2–59·4) 39·0 (23·6–62·0) 3·0
Unipolar depressive disorders 9470·7 (6727·6–12 275·5) 11 767·3 (8485·4–15 358·2) 24·3 858·5 (608·4–1112·8) 818·3 (591·4–1069·2) –4·5
Major depressive disorder 7633·8 (5302·1–10 095·7) 9318·1 (6511·2–12 393·1) 22·0 690·3 (479·7–915·9) 649·8 (453·8–864·0) –5·8
Dysthymia 1836·9 (1193·2–2565·0) 2449·2 (1604·8–3381·2) 33·4 168·2 (109·6–234·1) 168·6 (110·3–233·4) 0·2
Bipolar affective disorder 2192·2 (1352·7–3238·7) 2758·5 (1700·3–4021·4) 26·0 193·7 (119·6–286·3) 185·8 (114·9–270·9) –3·9
Anxiety disorders 2302·7 (1566·4–3227·2) 2885·0 (1914·7–4132·3) 24·8 201·8 (137·5–281·6) 202·4 (134·6–289·0) –0·1
Eating disorders 156·1 (82·7–234·3) 234·8 (144·2–357·4) 51·3 12·9 (6·9–19·3) 16·6 (10·3–25·3) 28·5
(Continues on next page)

Articles
www.thelancet.com Vol 381 June 8, 2013 2007
All ages DALYs (thousands) Age-standardised DALY rate (per 100 000)
1990 2010 Median %Δ
1990 2010 Median %Δ
(Continued from previous page)
Pervasive development disorders 1331·0 (898·0–1880·3) 1570·3 (1048·7–2258·6) 18·2 114·9 (77·5–162·2) 117·3 (77·9–168·8) 2·2
Autism 700·2 (455·4–1037·3) 831·9 (521·2–1212·7) 18·8 60·4 (39·3–89·0) 62·3 (39·1–90·7) 3·1
Asperger’s syndrome 630·8 (404·1–938·4) 738·4 (483·0–1095·2) 16·6 54·5 (35·0–80·7) 55·0 (35·9–81·5) 0·6
Childhood behavioural disorders 1146·9 (664·9–1833·9) 1054·6 (625·7–1617·9) –7·7 91·6 (52·8–146·6) 94·3 (56·0–144·7) 3·1
Attention-deficit hyperactivity disorder 105·5 (60·2–166·4) 99·5 (55·4–156·4) –5·9 8·3 (4·7–13·0) 8·3 (4·6–13·1) 0·2
Conduct disorder 1041·4 (580·3–1716·3) 955·2 (548·7–1503·9) –8·0 83·3 (46·3–137·5) 86·0 (49·4–136·1) 3·4
Idiopathic intellectual disability 181·7 (86·9–300·3) 126·4 (51·0–232·3) –30·1 14·8 (7·0–24·8) 9·6 (3·8–17·4) –35·3
Other mental and behavioural disorders 240·6 (132·5–350·9) 226·4 (146·9–341·3) –13·8 22·4 (12·4–32·7) 16·6 (10·9–25·0) –32·1
Diabetes, urogenital, blood, and endocrine diseases
13 110·6 (10 822·3–16 111·4)
16 976·7 (14 276·6–20 599·6)
30·7 1291·3 (1066·6–1582·5)
1186·5 (998·3–1439·8)
–7·3
Diabetes mellitus 4845·8 (3822·2–6253·6) 7834·7 (6342·2–9799·0) 63·4 512·6 (402·2–665·7) 531·8 (431·6–664·0) 5·1
Acute glomerulonephritis 636·5 (64·8–2360·9) 87·3 (32·8–198·1) –80·1 58·4 (5·9–219·4) 6·4 (2·4–14·3) –83·8
Chronic kidney diseases 2085·3 (1827·2–2789·1) 2781·6 (2381·3–3118·3) 39·7 210·9 (185·3–279·9) 191·0 (163·5–214·6) –5·1
Chronic kidney disease due to diabetes mellitus
304·2 (251·9–404·5) 471·7 (389·1–550·4) 60·9 33·4 (27·6–44·2) 31·5 (26·1–36·8) –2·0
Chronic kidney disease due to hypertension 383·0 (327·6–515·4) 530·8 (447·8–607·2) 44·4 39·7 (34·0–52·5) 36·2 (30·4–41·4) –5·2
Chronic kidney disease unspecified 1398·2 (1215·6–1894·5) 1779·1 (1521·4–2016·5) 33·5 137·8 (119·6–183·6) 123·2 (105·4–139·6) –6·2
Urinary diseases and male infertility 1292·4 (906·2–1774·1) 1767·2 (1191·9–2561·3) 35·4 139·0 (97·2–192·1) 120·7 (82·1–174·4) –14·0
Tubulointerstitial nephritis, pyelonephritis, and urinary tract infections
303·8 (177·9–469·5) 240·5 (183·9–335·3) –21·2 28·1 (16·7–41·7) 18·0 (13·8–24·9) –36·4
Urolithiasis 215·6 (124·0–392·7) 197·4 (122·5–313·8) –5·9 23·0 (13·1–41·9) 13·3 (8·3–21·1) –40·5
Benign prostatic hyperplasia 701·7 (438·0–1079·4) 1252·5 (772·5–1981·4) 78·4 80·9 (50·6–124·4) 84·3 (52·1–133·2) 4·2
Male infertility 28·1 (9·4–67·2) 37·2 (13·0–88·2) 32·1 2·5 (0·8–5·9) 2·4 (0·8–5·5) –4·5
Other urinary diseases 43·2 (27·1–56·3) 39·5 (29·6–57·4) –13·5 4·6 (2·8–5·9) 2·8 (2·1–4·0) –42·5
Gynaecological diseases 1575·7 (988·5–2500·9) 1844·2 (1109·5–3063·5) 16·2 138·4 (87·5–218·8) 124·4 (74·7–204·7) –10·8
Uterine fibroids 339·9 (208·3–544·5) 451·2 (240·2–791·3) 30·6 33·2 (19·6–54·1) 28·4 (15·2–49·5) –15·5
Polycystic ovarian syndrome 452·1 (214·5–861·1) 535·5 (252·3–1012·5) 18·3 37·3 (17·7–70·9) 36·7 (17·2–69·6) –1·7
Female infertility 20·0 (6·9–46·6) 27·5 (9·9–64·6) 37·0 1·8 (0·6–4·1) 1·7 (0·6–4·1) –1·1
Endometriosis 95·4 (33·6–181·6) 116·1 (40·1–235·4) 21·6 7·9 (2·8–15·0) 8·1 (2·8–16·4) 3·1
Genital prolapse 262·7 (103·7–583·9) 383·7 (145·4–822·0) 46·7 25·3 (10·1–55·5) 25·3 (9·6–54·3) 0·3
Premenstrual syndrome 255·8 (0·0–682·6) 250·3 (0·0–656·6) –2·7 19·7 (0·0–52·7) 18·7 (0·0–49·1) –5·2
Other gynaecological diseases 149·7 (108·4–204·4) 79·8 (58·0–111·7) –46·8 13·3 (9·8–18·3) 5·4 (3·9–7·4) –59·6
Haemoglobinopathies and haemolytic anaemias
1858·0 (1191·7–2755·5) 1512·5 (1106·9–2063·0) –17·1 159·0 (102·6–235·2) 122·3 (89·5–167·8) –21·7
Thalassaemias 1255·6 (910·9–1752·0) 1152·2 (824·3–1619·9) –7·3 105·2 (76·1–146·1) 91·6 (65·7–127·6) –11·9
Sickle cell disorders 28·0 (18·0–42·8) 37·4 (22·2–59·9) 33·3 2·4 (1·5–3·7) 3·3 (1·9–5·4) 37·5
G6PD deficiency 50·4 (30·7–91·8) 36·4 (27·2–48·4) –22·9 4·3 (2·7–7·7) 2·9 (2·2–4·0) –27·6
Other haemoglobinopathies and haemolytic anaemias
523·9 (239·4–1149·3) 286·6 (157·4–480·8) –38·5 47·0 (21·5–100·3) 24·5 (13·8–42·2) –42·0
Other endocrine, nutritional, blood, and immune disorders
816·9 (609·5–1093·4) 1149·3 (839·3–1606·3) 40·8 73·0 (55·3–99·1) 89·9 (64·1–126·7) 23·7
Musculoskeletal disorders 22 450·5 (17 056·0–28 497·3)
32 746·0 (25 008·9–40 768·0)
45·7 2205·4 (1690·1–2780·6)
2216·8 (1690·7–2758·4)
0·5
Rheumatoid arthritis 595·6 (440·8–756·9) 791·5 (601·7–1013·2) 31·4 61·3 (45·6–77·4) 53·8 (40·9–68·9) –13·0
Osteoarthritis 2393·7 (1556·3–3516·5) 4164·5 (2778·2–6066·1) 73·2 273·3 (177·7–401·9) 272·0 (181·6–395·7) –0·9
Low back and neck pain 15 419·9 (10 644·3–21 027·7)
21 939·0 (15 213·0–29 528·8)
42·4 1478·6 (1023·0–2010·8)
1494·1 (1036·4–2009·4)
1·1
Low back pain 10 523·5 (7159·4–14 513·5) 15 131·8 (10 278·6–20 522·3) 43·9 1019·5 (696·8–1403·7) 1028·5 (699·1–1396·1) 0·9
Neck pain 4896·4 (3404·7–6729·8) 6807·2 (4772·2–9378·6) 39·1 459·1 (318·8–630·2) 465·6 (326·9–641·1) 1·6
Gout 12·4 (7·6–18·2) 20·5 (12·6–30·4) 65·6 1·4 (0·8–2·0) 1·4 (0·8–2·0) –0·4
Other musculoskeletal disorders 4028·8 (3306·4–4604·7) 5830·4 (4828·6–6636·4) 44·6 390·9 (322·5–447·1) 395·6 (327·9–449·6) 1·1
(Continues on next page)

Articles
2008 www.thelancet.com Vol 381 June 8, 2013
All ages DALYs (thousands) Age-standardised DALY rate (per 100 000)
1990 2010 Median %Δ
1990 2010 Median %Δ
(Continued from previous page)
Other non-communicable diseases 24 271·1 (19 351·4–31 778·1)
19 005·1 (13 581·9–27 514·6)
–22·0 2142·4 (1684·7–2851·3)
1484·7 (1095·4–2093·1)
–30·9
Congenital anomalies 11 234·4 (9294·0–15 172·2) 4098·6 (3132·6–5655·8) –63·5 865·0 (716·6–1166·8) 414·1 (310·3–584·2) –52·1
Neural tube defects 2275·4 (1108·8–3887·1) 427·8 (271·1–710·4) –81·0 176·5 (86·3–300·6) 41·2 (24·9–73·6) –76·8
Congenital heart anomalies 6040·9 (5191·6–7098·7) 2508·9 (1975·0–3243·6) –58·4 462·8 (398·7–542·3) 258·9 (201·3–337·6) –44·0
Cleft lip and cleft palate 448·1 (177·9–1097·8) 113·1 (68·9–186·2) –71·8 34·3 (13·8–83·5) 10·9 (6·4–18·7) –64·8
Down’s syndrome 242·1 (129·4–421·5) 175·6 (123·8–245·8) –24·3 19·4 (10·6–33·2) 14·2 (10·0–19·6) –23·9
Other chromosomal abnormalities 1000·8 (254·9–3085·3) 296·0 (157·8–639·5) –63·6 77·3 (20·2–236·8) 29·8 (15·1–68·0) –53·1
Other congenital anomalies 1227·2 (333·2–2834·7) 577·1 (345·7–1160·4) –44·9 94·7 (26·5–216·8) 59·1 (33·7–123·6) –28·4
Skin and subcutaneous diseases 5604·0 (3661·2–8513·9) 5926·4 (3709·7–9185·6) 5·2 491·6 (321·5–745·8) 442·0 (275·6–684·5) –10·5
Eczema 1053·2 (532·6–1694·8) 1192·6 (592·9–1943·4) 13·3 91·1 (46·2–146·1) 91·3 (45·3–149·0) 0·5
Psoriasis 168·5 (79·3–285·0) 239·4 (110·6–407·4) 42·7 16·3 (7·7–27·6) 16·3 (7·6–27·6) 0·1
Cellulitis 220·7 (131·7–387·8) 106·6 (48·9–301·0) –59·1 19·4 (11·7–34·4) 8·0 (3·7–22·7) –65·1
Abscess, impetigo, and other bacterial skin diseases
478·5 (316·1–688·1) 259·8 (144·0–484·9) –47·1 40·3 (26·7–58·1) 21·0 (11·5–38·9) –49·3
Scabies 350·7 (158·3–700·7) 256·1 (116·2–497·8) –26·6 30·0 (13·6–60·1) 19·8 (9·0–38·4) –33·4
Fungal skin diseases 273·5 (85·1–635·9) 355·2 (113·4–837·3) 29·8 25·4 (7·9–59·2) 25·8 (8·2–60·5) 1·3
Viral skin diseases 498·3 (189·4–895·9) 509·2 (196·9–913·7) 3·1 41·9 (15·9–75·2) 41·0 (15·8–73·9) –1·6
Acne vulgaris 819·3 (372·3–1536·1) 794·7 (362·1–1527·6) –3·2 61·6 (28·0–115·3) 61·8 (28·1–119·0) 0·0
Alopecia areata 206·3 (60·2–419·8) 252·1 (70·3–538·2) 22·5 18·4 (5·4–37·3) 18·0 (5·0–38·4) –1·8
Pruritus 261·9 (114·1–491·9) 375·5 (171·0–751·3) 42·4 25·7 (11·2–47·9) 25·6 (11·7–51·2) –0·8
Urticaria 432·1 (177·6–756·1) 523·3 (209·4–932·8) 20·4 38·4 (15·7–66·7) 38·3 (15·3–68·1) –0·8
Decubitus ulcer 155·6 (103·8–248·1) 136·7 (75·0–256·4) –15·0 16·6 (10·9–27·0) 9·8 (5·4–18·2) –42·5
Other skin and subcutaneous diseases 685·4 (318·1–1295·3) 925·1 (438·7–1750·2) 35·1 66·6 (30·8–126·0) 65·2 (30·9–123·3) –2·0
Sense organ diseases 4802·5 (3355·8–6779·3) 5906·2 (4136·2–8413·2) 22·9 527·4 (369·2–736·6) 412·5 (289·3–586·9) –21·8
Glaucoma 101·0 (71·6–139·4) 157·7 (113·9–213·2) 57·0 11·7 (8·3–16·3) 11·0 (7·9–14·9) –6·2
Cataracts 646·2 (492·0–831·6) 504·8 (380·9–653·5) –21·9 74·5 (56·7–95·8) 35·1 (26·4–45·3) –53·0
Macular degeneration 205·9 (148·4–276·7) 431·3 (324·9–556·0) 109·9 25·6 (18·5–34·3) 31·5 (23·8–40·6) 23·6
Refraction and accommodation disorders 564·9 (425·6–743·0) 767·1 (571·1–1005·7) 35·8 63·3 (47·8–83·2) 54·3 (40·5–71·0) –14·3
Other hearing loss 2715·1 (1597·2–4262·8) 3151·4 (1849·7–5120·5) 15·5 292·6 (173·7–455·2) 219·6 (129·1–355·3) –25·1
Other vision loss 548·0 (252·0–1014·6) 866·7 (403·3–1642·5) 58·3 57·7 (26·5–106·9) 59·1 (27·5–112·0) 2·4
Other sense organ diseases 21·4 (7·3–50·2) 27·3 (9·3–61·0) 27·4 2·0 (0·7–4·7) 2·0 (0·7–4·5) 0·3
Oral disorders 2299·9 (1224·0–4066·9) 2934·1 (1468·5–5368·6) 26·5 233·2 (127·1–406·9) 200·5 (100·4–364·6) –14·8
Dental caries 886·6 (348·4–1759·8) 1056·9 (437·7–2040·2) 18·9 77·4 (30·6–152·6) 77·0 (31·8–149·2) –0·8
Periodontal disease 745·0 (285·5–1593·9) 1231·5 (460·3–2676·4) 65·2 78·9 (30·2–168·4) 79·5 (29·7–172·8) 0·7
Edentulism 668·3 (386·0–1048·1) 645·8 (376·2–1013·0) –3·3 76·9 (44·5–120·6) 44·0 (25·7–69·2) –42·7
Sudden infant death syndrome 330·3 (67·8–1297·6) 139·9 (47·0–370·1) –49·6 25·1 (5·2–98·7) 15·5 (5·2–41·0) –26·8
Injuries 51 189·9 (44 186·7–57 117·4)
40 804·0 (35 982·2–48 950·1)
–22·3 4371·5 (3798·2–4872·8)
2939·9 (2596·8–3515·1)
–34·3
Transport injuries 10 583·2 (7969·0–15 143·4) 15 726·6 (11 842·4–21 218·3) 50·3 921·4 (694·4–1306·4) 1103·2 (828·2–1494·9) 20·7
Road injury 10 017·3 (7555·8–13 977·9) 14 962·3 (11 418·0–19 995·4) 55·6 870·8 (654·8–1209·0) 1050·3 (800·7–1403·5) 25·2
Pedestrian injury by road vehicle 2257·3 (1318·3–3423·7) 5595·6 (4267·2–7256·6) 139·6 197·5 (116·2–299·5) 389·8 (296·4–502·3) 90·8
Pedal cycle vehicle 391·7 (242·1–614·6) 451·4 (283·6–615·0) 16·3 34·0 (21·5–51·9) 32·4 (20·4–43·8) –4·3
Motorised vehicle with two wheels 2182·7 (1381·6–3179·7) 2646·2 (2093·6–3353·9) 22·9 189·0 (122·1–272·4) 184·5 (146·5–233·5) –1·8
Motorised vehicle with three or more wheels
2264·6 (1542·0–3013·1) 4004·5 (3158·4–4940·2) 73·4 196·4 (135·0–260·7) 280·3 (220·3–348·0) 40·8
Road injury other 3088·8 (1196·6–6449·1) 2464·4 (924·6–5589·7) –22·3 269·6 (105·9–557·3) 177·0 (66·4–399·0) –36·4
Other transport injury 565·9 (406·7–770·7) 764·3 (542·4–1037·1) 34·7 50·6 (36·5–68·3) 52·9 (37·4–71·7) 4·1
Unintentional injuries other than transport injuries
29 833·2 (25 958·0–33 260·9)
17 783·1 (15 550·7–20 527·2)
–40·8 2516·9 (2214·1–2805·9)
1334·5 (1174·5–1541·1)
–47·4
(Continues on next page)

Articles
www.thelancet.com Vol 381 June 8, 2013 2009
is made up of 14 different components (appendix p 8). Analysed component by component, the most important factors in the dietary composite factor were diets that were low in fruits, high in sodium, or low in whole grains; all of which are problems with diet even in rural areas. The second leading risk factor was high blood pressure, which accounted for 12·0% (10·4–13·5) of DALYs and 24·6% (21·9–27·2) of deaths. The third major risk was tobacco, accounting for 9·5% (7·4–11·4)
of DALYs and 16·4% (12·8–19·9) of deaths. Two sources of particulate matter (PM) 2·5 exposure, ambient air pollution and household air pollution, were the fourth and fifth leading risks, respectively. Total PM2·5 burden in China–the combination of ambient air pollution, household air pollution, and second-hand tobacco smoke—is very large. Four more risks or clusters of risks accounted for between 4% and 5·5% of DALYs: high fasting plasma glucose, alcohol use, occupational
All ages DALYs (thousands) Age-standardised DALY rate (per 100 000)
1990 2010 Median %Δ
1990 2010 Median %Δ
(Continued from previous page)
Falls 5752·0 (4694·8–7259·2) 7058·3 (5624·8–8834·5) 24·3 567·7 (462·1–720·7) 494·4 (394·5–613·6) –11·9
Drowning 10 212·4 (7166·0–12 426·4) 3663·4 (3008·1–5370·1) –66·0 802·5 (572·7–967·1) 315·6 (254·2–484·9) –62·9
Fire, heat, and hot substances 892·0 (700·7–1132·8) 582·7 (442·2–826·8) –35·8 77·4 (61·3–98·1) 42·8 (32·5–61·9) –45·9
Poisonings 2686·9 (1996·5–4710·1) 1613·7 (885·2–2123·1) –27·3 230·5 (172·0–406·7) 114·1 (63·7–150·3) –40·0
Exposure to mechanical forces 1792·8 (1348·8–2453·6) 1130·0 (739·9–1436·6) –34·8 152·3 (116·6–209·4) 77·9 (51·4–99·1) –47·1
Mechanical forces (firearm) 677·4 (334·9–1134·0) 208·2 (113·8–355·7) –69·2 56·9 (28·7–92·7) 14·6 (8·0–24·9) –74·2
Mechanical forces (other) 1149·5 (607·8–2098·5) 975·6 (530·3–1450·2) –11·6 98·5 (52·5–181·4) 66·9 (37·0–99·0) –28·9
Adverse effects of medical treatment 287·9 (141·7–475·1) 370·0 (255·7–519·0) 32·2 25·6 (13·6–40·3) 27·6 (18·4–39·0) 10·3
Animal contact 474·6 (237·5–836·1) 156·0 (92·9–246·4) –66·2 41·5 (20·8–71·5) 11·7 (7·0–18·2) –71·1
Animal contact (venomous) 215·9 (99·1–495·7) 71·9 (40·2–123·5) –63·4 19·4 (9·2–43·5) 5·2 (2·9–9·1) –70·7
Animal contact (non-venomous) 258·7 (92·0–571·9) 84·1 (46·3–148·6) –64·1 22·1 (8·1–47·2) 6·4 (3·4–11·2) –68·4
Unintentional injuries not classified elsewhere 7734·6 (5740·5–9057·6) 3209·0 (2493·5–3694·6) –58·8 619·4 (464·8–720·1) 250·4 (197·3–293·3) –59·9
Self-harm and interpersonal violence 10 773·5 (7173·7–12 847·8) 7294·3 (5797·7–11 344·9) –42·3 933·1 (627·3–1102·1) 502·3 (401·7–780·4) –53·9
Self-harm 8959·3 (5433·1–10 915·0) 5969·9 (4645·7–9717·0) –44·3 785·0 (484·2–954·3) 408·3 (318·3–664·1) –56·2
Interpersonal violence 1814·2 (1322·0–2249·4) 1324·4 (1034·3–1987·4) –31·7 148·2 (108·8–184·4) 94·0 (73·3–141·2) –40·9
Assault by firearm 323·9 (165·9–625·7) 150·4 (99·0–239·7) –51·5 27·2 (14·2–51·3) 10·5 (6·9–16·9) –60·0
Assault by sharp object 484·5 (271·0–752·0) 423·7 (290·1–621·4) –8·6 39·0 (22·4–59·9) 29·5 (20·1–43·2) –21·5
Assault by other means 1030·9 (696·4–1403·7) 789·4 (561·5–1069·5) –23·2 84·3 (58·0–113·3) 56·6 (40·6–76·1) –32·6
Data are DALYs (95% UI) or % change. UI=uncertainty interval. DALYs=disability-adjusted life years. %Δ=percentage change. E coli=Escherichia coli. H influenza=Haemophilus influenza.
Table 4: DALYs (in thousands) for 285 causes in 1990 and 2010 for all ages, both sexes, and per 100 000 with 95% UI and percentage change, in China
Figure 7: Disability-adjusted life years for both sexes in China in 2010
Vitamin A deficiencyUnimproved water source
Zinc deficiencyUnimproved sanitationChildhood underweight
Ambient ozone pollutionResidential radon
Childhood sexual abuseLow bone mineral densitySuboptimal breastfeeding
Lead exposureIntimate partner violence
Iron deficiencyDrug use
High total cholesterolPhysical inactivity and low physical activity
High body-mass indexOccupational risks
Alcohol useHigh fasting plasma glucose
Household air pollution from solid fuelsAmbient particulate matter pollution
Tobacco smokingHigh blood pressure
Dietary risks
0 5 10Percentage of total China DALYs (%)
15 20
War and disasterIntentional injuriesUnintentional injuriesTransport injuries
Other non-communicable diseases
Musculoskeletal disorders
Diabetes, urogenital, blood, and endocrine
Mental and behaviouraldisorders
Neurological disordersDigestive diseasesCirrhosis
Chronic respiratorydiseases
Cardiovascular andcirculatory diseases
Cancer
Other communicablediseases
Nutritional deficienciesNeonatal disordersMaternal disorders
Neglected tropicaldiseases and malaria
Diarrhoea, lower respiratory infections, and other common infectious diseases
HIV/AIDS and tuberculosis

Articles
2010 www.thelancet.com Vol 381 June 8, 2013
DALYs (thousands) in male individuals DALYs (thousands) in female individuals DALYs (thousands) in both sexes
1990 2010 1990 2010 1990 2010
Unimproved water and sanitation
976 (35–1911) 139 (5–359) 886 (32–1686) 118 (4–303) 1861 (67–3486) 257 (9–663)
Unimproved water source 395 (15–957) 53 (2–171) 359 (14–864) 44 (1–147) 754 (29–1792) 97 (3–319)
Unimproved sanitation 671 (17–1358) 92 (2–263) 609 (17–1199) 78 (2–219) 1279 (34–2525) 170 (4–479)
Air pollution
Ambient particulate matter pollution
13 452 (11 054–15 846)
16 068 (13 612–18 419) 10 806 (8840–13 055) 9160 (7767–10 570) 24 258 (20 317–28 401) 25 227 (21 771–28 595)
Household air pollution from solid fuels
21 923 (16 783–26 583)
12 382 (8705–16 206) 20 844 (17 619–23 989)
8910 (6644–11 222) 42 767 (35 924–48 879) 21 292 (15 869–26 661)
Ambient ozone pollution 490 (150–920) 400 (135–737) 430 (134–802) 250 (81–444) 920 (284–1712) 651 (220–1175)
Other environmental risks 437 (271–667) 1930 (1131–3085) 456 (251–657) 1105 (679–1648) 893 (608–1216) 3035 (1943–4573)
Residential radon ·· 540 (52–1522) ·· 222 (22–650) ·· 762 (75–2092)
Lead exposure 437 (271–667) 1389 (811–2134) 456 (251–657) 883 (538–1292) 893 (608–1216) 2273 (1550–3154)
Child and maternal undernutrition
10 206 (6303–14 355) 1859 (1269–2612) 10 530 (7376–14 390) 2406 (1708–3297) 20 736 (13 935–27 847) 4264 (3066–5835)
Suboptimal breastfeeding 6067 (2456–9863) 731 (279–1301) 5045 (2064–8341) 521 (198–883) 11 113 (4498–17 488) 1252 (488–2052)
Non-exclusive breastfeeding 5656 (2098–9424) 641 (186–1197) 4661 (1785–7975) 443 (120–789) 10 317 (3924–16 607) 1085 (307–1881)
Discontinued breastfeeding 411 (43–934) 89 (9–198) 384 (36–857) 78 (8–166) 795 (82–1701) 167 (17–366)
Childhood underweight 3495 (2229–5095) 169 (106–243) 3005 (1967–4351) 126 (74–188) 6500 (4307–9377) 295 (194–426)
Iron deficiency 1254 (848–1817) 901 (603–1297) 2950 (2013–4287) 1709 (1084–2565) 4204 (2869–6062) 2609 (1712–3861)
Vitamin A deficiency 336 (113–769) 27 (12–47) 305 (102–642) 23 (10–41) 641 (255–1259) 49 (23–85)
Zinc deficiency 734 (120–1703) 93 (32–184) 668 (137–1442) 76 (30–140) 1402 (271–2935) 169 (64–322)
Tobacco smoking 17 871 (13 586–23 735)
22 710 (17 091–28 270) 10 451 (7269–15 690) 7295 (4467–9735) 28 322 (22 504–35 727) 30 005 (23 431–35 918)
Tobacco smoking, excluding second-hand smoke
13 956 (9733–19 432) 21 193 (15 459–26 815) 6228 (3208–11 636) 5061 (2197–7504) 20 184 (14 644–28 362) 26 254 (19 643–32 224)
Second-hand smoke 3916 (2649–5219) 1517 (1068–1967) 4222 (3122–5373) 2234 (1562–2979) 8138 (6067–10 360) 3751 (2665–4873)
Alcohol and drug use 11 659 (9477–14 051) 13 438 (10 801–16 389) 3681 (2558–4892) 3183 (2223–4358) 15 340 (12 458–18 572) 16 621 (13 436–20 283)
Alcohol use 10 232 (8216–12 384) 11 617 (9192–14 277) 2791 (1811–3917) 2163 (1247–3104) 13 023 (10 502–15 741) 13 780 (10 890–16 881)
Drug use 1459 (905–2141) 1841 (1198–2784) 902 (564–1338) 1024 (660–1573) 2360 (1615–3263) 2865 (1985–4021)
Physiological risks
High fasting plasma glucose 5143 (3695–6681) 9199 (6530–12 137) 4534 (3410–5837) 6903 (5247–8653) 9677 (7570–11 979) 16 103 (12 903–19 824)
High total cholesterol 1109 (576–1785) 3356 (1496–5266) 1128 (661–1718) 2555 (1256–3873) 2237 (1437–3265) 5912 (3603–8473)
High blood pressure 13 553 (11 374–16 218)
23 326 (19 489–27 142) 12 488 (10 500–15 025)
14 614 (12 167–16 954) 26 041 (22 752–30 040) 37 940 (33 309–42 707)
High body-mass index 2323 (1349–3368) 6852 (4719–9263) 2480 (1547–3527) 5404 (3570–7315) 4803 (2984–6833) 12 256 (8625–16 166)
Low bone mineral density 437 (338–567) 761 (553–957) 350 (268–446) 474 (363–611) 787 (642–965) 1234 (973–1523)
Dietary risks 21 170 (18 259–24 481)
32 913 (28 434–36 538) 16 113 (13 900–19 320)
18 787 (16 314–20 922) 37 283 (32 882–42 124) 51 700 (46 070–56 650)
Diet low in fruits 12 401 (9336–15 668) 19 203 (14 551–23 129) 9136 (6809–11 954) 10 275 (7812–12 510) 21 537 (16 764–26 123) 29 478 (23 464–34 689)
Diet low in vegetables 2709 (1274–4411) 3734 (1901–5848) 1692 (719–2947) 1529 (682–2550) 4401 (2115–6869) 5263 (2678–8079)
Diet low in whole grains 3951 (3070–4998) 6591 (5157–8019) 3216 (2490–4123) 3989 (3126–4851) 7167 (5633–8853) 10 580 (8394–12 742)
Diet low in nuts and seeds 2508 (1619–3540) 4907 (3093–6366) 1971 (1252–2911) 2745 (1704–3648) 4479 (2906–6150) 7652 (4971–9943)
Diet low in milk 241 (74–404) 350 (105–606) 192 (59–324) 263 (71–461) 433 (132–718) 613 (176–1055)
Diet high in red meat 150 (71–247) 297 (132–484) 118 (53–197) 225 (96–376) 268 (126–439) 522 (237–855)
Diet high in processed meat 289 (106–501) 517 (184–883) 264 (102–450) 386 (162–617) 553 (224–916) 903 (356–1444)
Diet high in sugar-sweetened beverages
605 (22–1487) 186 (24–1236) 376 (17–1258) 192 (20–1040) 981 (46–2549) 378 (47–1820)
Diet low in fibre 1472 (727–2256) 2762 (1307–4167) 1111 (535–1689) 1532 (732–2315) 2582 (1261–3910) 4294 (2036–6510)
Diet low in calcium 332 (244–413) 470 (347–675) 258 (173–335) 344 (242–482) 590 (438–732) 814 (603–1118)
Diet low in seafood omega-3 fatty acids
1222 (862–1759) 2456 (1692–3134) 941 (665–1436) 1288 (868–1679) 2163 (1522–3042) 3745 (2633–4789)
Diet low in polyunsaturated fatty acids
492 (232–778) 751 (331–1179) 368 (166–610) 398 (190–638) 860 (405–1332) 1150 (516–1806)
(Continues on next page)

Articles
www.thelancet.com Vol 381 June 8, 2013 2011
risks, high body-mass index, and physical inactivity. Table 5 provides estimates for 1990 and 2010 of the attributable DALYs for 67 risk factors or clusters of risk factors. Compared with the G20 mean attributable DALY rates, China had significantly higher rates for ambient and household air pollution and low bone mineral density in 1990 and 2010. Dietary risks and high blood pressure worsened compared with the G20 average between 1990 and 2010 whereas occupational risks in 2010 were no longer distinguishable from the G20
average, but in 1990 were worse than the G20 average (appendix p 9). DALYs attribu table to six risk factors increased in China from 1990 to 2010 by more than 40·0%: diet, high blood pressure, high fasting plasma glucose, high body-mass index, high cholesterol, and lead exposure. Four dietary factors each contributed more than 2·0% to total DALYs in 2010: low consumption of fruit, whole grain, and nuts and seeds and high intake of sodium. The burden of tobacco is also disaggregated into the burden from tobacco smoking (26·2 million
DALYs (thousands) in male individuals DALYs (thousands) in female individuals DALYs (thousands) in both sexes
1990 2010 1990 2010 1990 2010
(Continued from previous page)
Diet high in trans fatty acids 239 (159–342) 595 (378–814) 190 (124–284) 339 (221–465) 430 (301–594) 934 (632–1252)
Diet high in sodium 6978 (4571–9388) 10 897 (7367–14 469) 5142 (3311–7122) 5934 (3838–7956) 12 120 (7899–15 991) 16 831 (11 210–21 998)
Physical inactivity and low physical activity
·· 6341 (5091–7744) ·· 5098 (4212–6050) ·· 11 439 (9492–13 679)
Occupational risks 9750 (7143–12 888) 8775 (6511–11 597) 3732 (2599–5023) 3620 (2479–4987) 13 482 (10 005–17 268) 12 395 (9234–16 106)
Occupational carcinogens 396 (241–659) 803 (420–1220) 174 (102–300) 286 (152–450) 570 (354–907) 1089 (626–1627)
Occupational exposure to asbestos
1 (0–10) 1 (0–11) 10 (0–29) 6 (0–25) 11 (0–31) 7 (0–28)
Occupational exposure to arsenic
13 (5–26) 26 (9–48) 8 (3–17) 13 (5–24) 22 (8–42) 38 (15–70)
Occupational exposure to benzene
8 (3–15) 14 (6–25) 9 (3–18) 13 (4–26) 17 (7–31) 27 (11–50)
Occupational exposure to beryllium
1 (0–1) 2 (1–3) 0 (0–1) 1 (0–2) 1 (0–2) 2 (1–4)
Occupational exposure to cadmium
2 (1–4) 6 (2–9) 1 (1–2) 2 (1–4) 3 (2–6) 8 (4–13)
Occupational exposure to chromium
7 (4–12) 18 (9–27) 5 (3–9) 10 (5–15) 12 (7–19) 28 (17–41)
Occupational exposure to diesel engine exhaust
121 (69–206) 235 (115–362) 32 (18–58) 49 (24–77) 153 (89–248) 284 (150–428)
Occupational exposure to second-hand smoke
98 (68–157) 190 (108–259) 55 (37–95) 97 (51–138) 153 (110–227) 287 (191–382)
Occupational exposure to formaldehyde
5 (2–11) 9 (3–18) 4 (2–8) 5 (2–10) 10 (4–18) 14 (6–27)
Occupational exposure to nickel
38 (10–84) 88 (22–183) 25 (6–55) 48 (13–101) 63 (17–136) 136 (36–279)
Occupational exposure to polycyclic aromatic hydrocarbons
16 (8–30) 41 (18–67) 8 (4–15) 16 (7–28) 24 (11–42) 57 (27–94)
Occupational exposure to silica 92 (62–151) 196 (109–275) 21 (14–37) 34 (18–50) 113 (78–177) 231 (138–319)
Occupational exposure to sulphuric acid
8 (2–20) 12 (3–30) 1 (0–2) 1 (0–2) 8 (2–21) 13 (4–31)
Occupational asthmagens 111 (46–188) 82 (45–128) 70 (25–130) 54 (26–93) 181 (100–285) 137 (83–208)
Occupational particulate matter, gases, and fumes
2470 (1172–3735) 1578 (759–2405) 1041 (487–1640) 503 (227–848) 3511 (1679–5286) 2080 (966–3203)
Occupational noise 472 (263–767) 488 (280–804) 252 (138–421) 247 (141–415) 725 (410–1164) 735 (428–1216)
Occupational risk factors for injuries
3516 (1938–6185) 2538 (1435–4599) 253 (94–549) 145 (39–327) 3769 (2135–6505) 2682 (1562–4745)
Occupational low back pain 2786 (1707–4148) 3286 (2016–4876) 1941 (1115–3057) 2386 (1414–3643) 4727 (3007–6897) 5672 (3615–8227)
Sexual abuse and violence ·· 422 (285–610) ·· 2835 (1800–4146) ·· 3258 (2175–4620)
Childhood sexual abuse ·· 422 (285–610) ·· 463 (303–672) ·· 885 (617–1232)
Intimate partner violence ·· ·· ·· 2485 (1479–3768) ·· 2485 (1479–3768)
0 suggests no deaths or DALYs were attributable to risk factors or risk factor clusters. ··=attributable deaths or DALYs not quantified.
Table 5: Disability-adjusted life-years (in thousands) attributable to risk factors or risk factor clusters in China

Articles
2012 www.thelancet.com Vol 381 June 8, 2013
DALYs [95% UI 19·6–32·2]) and from second-hand smoke exposure (3·8 million DALYs [2·7–4·9]).
DiscussionBetween 1990 and 2010, the health profile of China changed rapidly. Premature mortality in children declined by almost 80%. The contribution of communicable, maternal, neonatal, and nutritional disorders to DALYs declined for all ages from nearly 27% in 1990 to about 10% in 2010. The burden of disease is now dominated by cardiovascular diseases, lung cancer, chronic obstructive pulmonary disease, road injuries, and key causes of chronic disabilities such as mental and musculoskeletal disorders. Although the burden of suicide, drowning, and many injuries declined, the burden of road injuries and falls is increasing. The rise of non-communicable diseases and chronic disability is fuelled by a shift away from risks for communicable diseases in children toward those for non-communicable diseases in adults. The one child policy in China implies the demographic shifts contrib-uting to this rapid transition in health problems will intensify in the coming decades.
China has had remarkable success in decreasing death rates and disability from communicable diseases. Deaths from diarrhoea and lower respiratory infections in children younger than 5 years declined by more than 90% in the two decades from 1990. DALYs caused by tuberculosis dropped by about 71%. We also noted large declines for incidence of infection with intestinal nematodes, meningitis, tetanus, measles, and diarrhoea. The speed of some of these declines provides a model for other developing countries. Communicable disease-control challenges, however, are not over. The burden of HIV increased between 1990 and 2010 (table 2). 213 000 (95% UI 179·6–260·7[A:this was 189·3–245·1 in table 3, which is correct?]) children younger than 5 years died in 2010, almost 60% of them from communicable, neonatal, and nutritional causes. Subnational assessments would probably reveal that the burden of communicable diseases is high in some poor provinces. China faces challenges dealing with the ongoing risk of pandemic influenza. The 2013 outbreak of H7N9 shows how the interaction between animal and human populations continues to lead to new epidemics. Through the internet-based surveillance system run by the Chinese CDC, early detection of the first human cases of H7N9 led to a coherent response. Despite progress, continued attention to the unfinished agenda for communicable disease control is required and ongoing epidemic surveillance and response is a necessity.
The burden of diseases attributable to individual behaviours and practices is steadily rising. The most important behaviours included diets low in fruit, high in sodium and low in whole grains, smoking, alcohol, and physical inactivity. Smoking prevalence in China for men is 52·9% (one of the highest rates in the world) and for women is 2·4% (one of the lowest),55 and second-hand
smoke exposure is as high as 72·4%.23,56 The fraction of deaths attributable to tobacco increased from 12·8% (9·9–16·9) in 1990 to 16·4% (12·8–19·9) in 2010[A:is this shown in any of the figures/tables?] and will increase because of the lag between consumption and death rates. The aggregation of 14 components of diet was the leading risk factor for DALYs in China, including the consumption of sodium and inadequate intake of fruit, whole grains, and nuts and seeds. Reliable data from the national nutrition surveys show that even rural Chinese diets dominated by rice are low in fruit, high in sodium, low in whole grains, and low in nuts and seeds. Rising incomes and a larger fraction of the population living to older ages mean that the burden attributable to these behaviours will increase. The extraordinary pace of urbanisation in China might exacerbate this trans-formation. The urban population in China has more than tripled in the past 30 years and the rate of urbanisation is accelerating.57,58 Although urban isation offers opportunities for improvements in popu lation health in China (such as access to improved health care and basic infrastructure), it also can lead to substantial health risks including ambient air pollution, occupational and traffic hazards, and poor diet and little physical activity. Associated social and economic chal lenges will accompany these shifts. For example, the ratio of the population older than 65 years to the working-aged population (aged 20–64 years) was 0·127 in 2010 and is expected to rise to 0·184 in 2020 and 0·26 in 2030.2
The physical environment is an important driver of health in China. High levels of PM2·5, particularly in eastern China, have made ambient air pollution the fourth leading risk factor for DALYs.59 Use of solid fuels—in particular coal in inadequately ventilated homes—also contributes to excess mortality.59 Policies to change the physical layout of the road system and vehicle safety equipment might need to be enacted to restrict the burden of road injuries.59 Physical activity might also be influenced by urban layout. Actions to address the physical environment, however, are far beyond the scope of the National Health and Family Planning Commission. Addressing these new and substantial risks to Chinese health will require multisectorial action at national, provincial, and local levels. Such action will need careful documentation of the health harms at a local level and the potential for affordable alternative policies to reduce these harms.
Rapid reductions in fertility and age-specific mortality rates have led to many more Chinese individuals living to an old age, when rates of chronic disability are high. Incidence of health loss and health-care costs from mental disorders, musculoskeletal disorders, neuro-logical disorders, and vision and hearing loss will steadily rise. China needs to plan for how the health system can prevent and manage these disorders cost-effectively. Along with Japan, South Korea, and Mexico, China seems to benefit from lower rates of major depression,
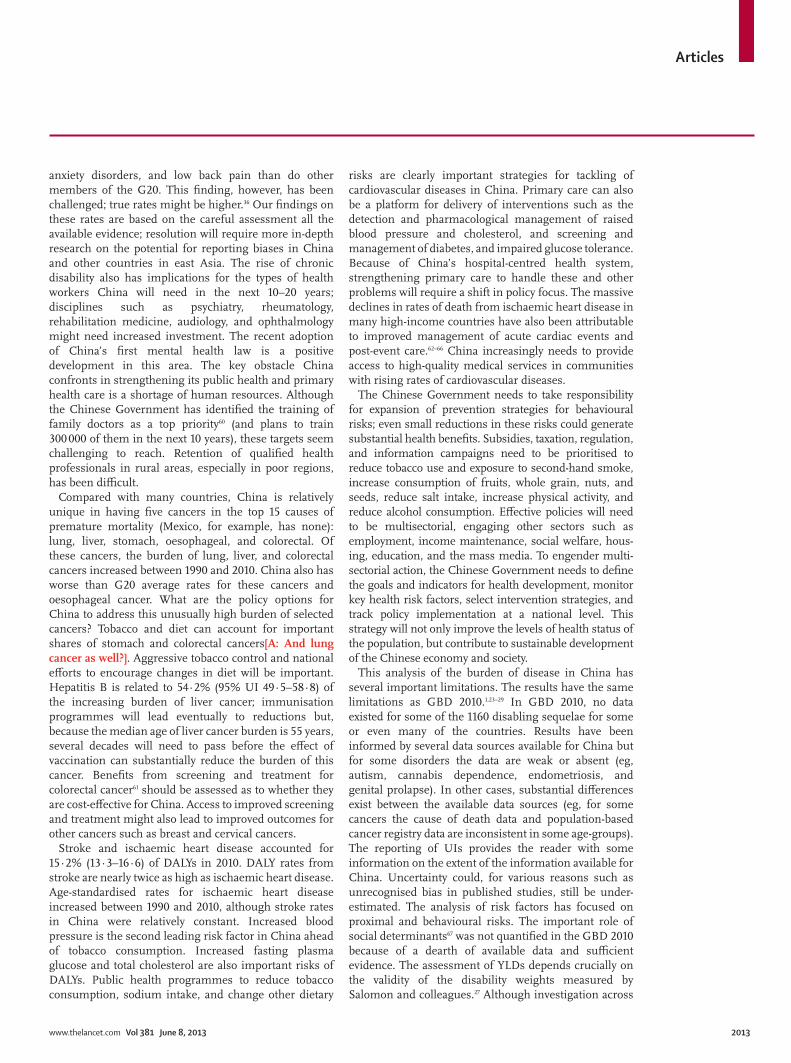
Articles
www.thelancet.com Vol 381 June 8, 2013 2013
anxiety disorders, and low back pain than do other members of the G20. This finding, however, has been challenged; true rates might be higher.36 Our findings on these rates are based on the careful assessment all the available evidence; resolution will require more in-depth research on the potential for reporting biases in China and other countries in east Asia. The rise of chronic disability also has implications for the types of health workers China will need in the next 10–20 years; disciplines such as psychiatry, rheuma tology, rehabilitation medicine, audiology, and ophthal mology might need increased investment. The recent adoption of China’s first mental health law is a positive development in this area. The key obstacle China confronts in strengthening its public health and primary health care is a shortage of human resources. Although the Chinese Government has identified the training of family doctors as a top priority60 (and plans to train 300 000 of them in the next 10 years), these targets seem challenging to reach. Retention of qualified health professionals in rural areas, especially in poor regions, has been difficult.
Compared with many countries, China is relatively unique in having five cancers in the top 15 causes of premature mortality (Mexico, for example, has none): lung, liver, stomach, oesophageal, and colorectal. Of these cancers, the burden of lung, liver, and colorectal cancers increased between 1990 and 2010. China also has worse than G20 average rates for these cancers and oesophageal cancer. What are the policy options for China to address this unusually high burden of selected cancers? Tobacco and diet can account for important shares of stomach and colorectal cancers[A: And lung cancer as well?]. Aggressive tobacco control and national efforts to encourage changes in diet will be important. Hepatitis B is related to 54·2% (95% UI 49·5–58·8) of the increasing burden of liver cancer; immunisation programmes will lead eventually to reductions but, because the median age of liver cancer burden is 55 years, several decades will need to pass before the effect of vaccination can substantially reduce the burden of this cancer. Benefits from screening and treatment for colorectal cancer61 should be assessed as to whether they are cost-effective for China. Access to improved screening and treatment might also lead to improved outcomes for other cancers such as breast and cervical cancers.
Stroke and ischaemic heart disease accounted for 15·2% (13·3–16·6) of DALYs in 2010. DALY rates from stroke are nearly twice as high as ischaemic heart disease. Age-standardised rates for ischaemic heart disease increased between 1990 and 2010, although stroke rates in China were relatively constant. Increased blood pressure is the second leading risk factor in China ahead of tobacco consumption. Increased fasting plasma glucose and total cholesterol are also important risks of DALYs. Public health programmes to reduce tobacco consumption, sodium intake, and change other dietary
risks are clearly important strategies for tackling of cardiovascular diseases in China. Primary care can also be a platform for delivery of interventions such as the detection and pharmacological management of raised blood pressure and cholesterol, and screening and management of diabetes, and impaired glucose tolerance. Because of China’s hospital-centred health system, strengthening primary care to handle these and other problems will require a shift in policy focus. The massive declines in rates of death from ischaemic heart disease in many high-income countries have also been attributable to improved management of acute cardiac events and post-event care.62–66 China increasingly needs to provide access to high-quality medical services in communities with rising rates of cardiovascular diseases.
The Chinese Government needs to take responsibility for expansion of prevention strategies for behavioural risks; even small reductions in these risks could generate substantial health benefits. Subsidies, taxation, regulation, and information campaigns need to be prioritised to reduce tobacco use and exposure to second-hand smoke, increase consumption of fruits, whole grain, nuts, and seeds, reduce salt intake, increase physical activity, and reduce alcohol consumption. Effective policies will need to be multisectorial, engaging other sectors such as employment, income maintenance, social welfare, hous-ing, education, and the mass media. To engender multi-sectorial action, the Chinese Government needs to define the goals and indicators for health development, monitor key health risk factors, select intervention strategies, and track policy implementation at a national level. This strategy will not only improve the levels of health status of the population, but contribute to sustainable development of the Chinese economy and society.
This analysis of the burden of disease in China has several important limitations. The results have the same limitations as GBD 2010.1,23–29 In GBD 2010, no data existed for some of the 1160 disabling sequelae for some or even many of the countries. Results have been informed by several data sources available for China but for some disorders the data are weak or absent (eg, autism, cannabis dependence, endometriosis, and genital prolapse). In other cases, substantial differences exist between the available data sources (eg, for some cancers the cause of death data and population-based cancer registry data are inconsistent in some age-groups). The reporting of UIs provides the reader with some information on the extent of the information available for China. Uncertainty could, for various reasons such as unrecognised bias in published studies, still be under-estimated. The analysis of risk factors has focused on proximal and behavioural risks. The important role of social determinants67 was not quantified in the GBD 2010 because of a dearth of available data and sufficient evidence. The assessment of YLDs depends crucially on the validity of the disability weights measured by Salomon and colleagues.27 Although investigation across

Articles
2014 www.thelancet.com Vol 381 June 8, 2013
several countries reported no evidence of systematic differences; disability weights obtained in a national survey in China could be different from other countries.68,69 Most importantly, a national analysis for a country as large and diverse as China could mask substantial variations in key outcomes. For example, the HIV epidemic is very concentrated in some provinces.70,71 The rapid transition towards non-communicable diseases and disability is probably more advanced in eastern provinces. In view of improvements in some data systems in the previous decade, the possibility of bias exists in the measurement of some diseases overtime. We believe that the substantial efforts to correct for these biases that are part of the GBD method minimises this possibility.
In view of the pace of health change in China, the burden of diseases, injuries, and risk factors should be monitored every year. Annual assessments along with subnational detail at the provincial level ought to be undertaken. Key developments in the health information system that are underway will facilitate such an analysis. Development of a complete national vital events regis-tration system with certification of cause of death would strikingly aid in this endeavour. In the previous 2 years alone, a rapid expansion has occurred in coverage of cause of death certification so that more than half of all deaths were captured in 2012. The national internet case reporting system can provide local level detail on 39 diseases since 2004. Several national surveys are underway or planned with large sample sizes. Ensuring that the various surveillance systems and topic-specific national surveys ultimately combine to provide a coherent picture of the prevalence of major diseases, injuries, and risk factors at the provincial level will also reduce the role of statistical estimation in generating burden of disease results. Robust annual assessments of the burden will provide China with a powerful method to benchmark progress against developed and other rapidly developing nations and assess where investments and policy action have been effective. Setting priorities for the health system, however, will also need information on the costs and consequences of different policy options, a better understanding of health inequalities and the capacity of the health system to implement change that is both efficient and fair.ContributorsGY wrote the first draft of the report. All authors had key roles in formulation of the analysis for China with Global Burden of Diseases, Injuries, and Risk Factors Study 2010 (GBD 2010) results, and also commented on and reviewed the report.
Conflicts of interestWe declare that we have no conflicts of interest.
AcknowledgmentsThis research was conducted as part of Global Burden of Diseases, Injuries, and Risk Factors Study 2010 (GBD 2010); we thank all individuals who have contributed to this study and Daniel Dicker and Anne Bulchis (Institute for Health Metrics and Evaluation, Seattle, WA, USA) for their important and much appreciated contribution to the
preparation of this report.
References1 Wang H, Dwyer-Lindgren L, Lofgren KT, et al. Age-specific and
sex-specific mortality in 187 countries, 1970–2010: a systematic analysis for the Global Burden of Disease Study 2010. Lancet 2012; 380: 2071–94.
2 UN, Department of Economic and Social Affairs, Population Division. World population prospects: the 2010 revision, vol. 1 & 2: comprehensive tables. New York: United Nations, 2011.
3 Feng XL, Guo S, Hipgrave D, et al. China’s facility-based birth strategy and neonatal mortality: a population-based epidemiological study. Lancet 2011; 378: 1493–500.
4 The Lancet. China’s challenges: health and wealth. Lancet 2006; 367: 623.
5 Yip W, Hsiao W. China’s health care reform: a tentative assessment. China Econ Rev 2009; 20: 613–19.
6 Hu S, Tang S, Liu Y, Zhao Y, Escobar M-L, de Ferranti D. Reform of how health care is paid for in China: challenges and opportunities. Lancet 2008; 372: 1846–53.
7 Yip WC-M, Hsiao W, Meng Q, Chen W, Sun X. Realignment of incentives for health-care providers in China. Lancet 2010; 375: 1120–30.
8 Blumenthal D, Hsiao W. Privatization and its discontents—the evolving Chinese health care system. N Engl J Med 2005; 353: 1165–70.
9 Liu Y, Rao K, Wu J, Gakidou E. China’s health system performance. Lancet 2008; 372: 1914–23.
10 Huang Y. The sick man of Asia: China’s health crisis. http://www.foreignaffairs.com/articles/136507/yanzhong-huang/the-sick-man-of-asia (accessed April 2, 2013).
11 Wang L, Wang Y, Jin S, et al. Emergence and control of infectious diseases in China. Lancet 2008; 372: 1598–605.
12 Yang G, Kong L, Zhao W, et al. Emergence of chronic non-communicable diseases in China. Lancet 2008; 372: 1697–705.
13 Wang L, Kong L, Wu F, Bai Y, Burton R. Preventing chronic diseases in China. Lancet 2005; 366: 1821–24.
14 Yip WC-M, Hsiao WC, Chen W, Hu S, Ma J, Maynard A. Early appraisal of China’s huge and complex health-care reforms. Lancet 2012; 379: 833–42.
15 WHO. WHO mortality database. http://www.who.int/healthinfo/morttables/en/ (accessed July 10, 2012).
16 Chinese Center for Disease Control and Prevention. National disease surveillance systems death surveillance data sets 2011. Beijing, China: People’s Medical Publishing House, 2012.
17 Ministry of Health. China health statistics yearbook 2012. Beijing, China: Peking Union Medical College Press, 2012.
18 National Office for Cancer Prevention and Control & National Central Cancer Registry. Annual report of cancer registration in China 2011. Beijing, China: Military Medical Sciences, 2012.
19 China China Third Retrospective Survey on mortality 2004–2005. Beijing, China: Peking Union Medical College, 2008.
20 National Bureau of Statistics of China. China Population and Employment Statistics Yearbook 2012. Beijing, China: China Statistics Press, 2013.
21 National office for Census and National Bureau of Statistics of China. Tabulation on the 2000 population census of The People’s Republic of China. Beijing, China: China Statistics Press, 2002.
22 National office for Census and National Bureau of Statistics of China. Tabulation on the 2010 population census of The People’s Republic of China. Beijing, China: China Statistics Press, 2012.
23 Lim SS, Vos T, Flaxman AD, et al. A comparative risk assessment of burden of disease and injury attributable to 67 risk factors and risk factor clusters in 21 regions, 1990–2010: a systematic analysis for the Global Burden of Disease Study 2010. Lancet 2012; 380: 2224–60.
24 Lozano R, Naghavi M, Foreman K, et al. Global and regional mortality from 235 causes of death for 20 age groups in 1990 and 2010: a systematic analysis for the Global Burden of Disease Study 2010. Lancet 2012; 380: 2095–128.
25 Murray CJL, Vos T, Lozano R, et al. Disability-adjusted life years (DALYs) for 291 diseases and injuries in 21 regions, 1990–2010: a systematic analysis for the Global Burden of Disease Study 2010. Lancet 2012; 380: 2197–223.
26 Murray CJ, Ezzati M, Flaxman AD, et al. GBD 2010: design, definitions, and metrics. Lancet 2012; 380: 2063–66.

Articles
www.thelancet.com Vol 381 June 8, 2013 2015
27 Salomon JA, Vos T, Hogan DR, et al. Common values in assessing health outcomes from disease and injury: disability weights measurement study for the Global Burden of Disease Study 2010. Lancet 2012; 380: 2129–43.
28 Salomon JA, Wang H, Freeman MK, et al. Healthy life expectancy for 187 countries, 1990–2010: a systematic analysis for the Global Burden Disease Study 2010. Lancet 2012; 380: 2144–62.
29 Vos T, Flaxman AD, Naghavi M, et al. Years lived with disability (YLDs) for 1160 sequelae of 289 diseases and injuries 1990–2010: a systematic analysis for the Global Burden of Disease Study 2010. Lancet 2012; 380: 2163–96.
30 Naghavi M, Makela S, Foreman K, O’Brien J, Pourmalek F, Lozano R. Algorithms for enhancing public health utility of national causes-of-death data. Popul Health Metr 2010; 8: 9.
31 Ahern RM, Lozano R, Naghavi M, Foreman K, Gakidou E, Murray CJ. Improving the public health utility of global cardiovascular mortality data: the rise of ischemic heart disease. Popul Health Metr 2011; 9: 8.
32 King G, Tomz M, Wittenberg J. Making the most of statistical analyses: improving interpretation and presentation. Am J Polit Sci 2000; 44: 341–55.
33 Jiang B, Wang W, Chen H, et al. Incidence and trends of stroke and its subtypes in China results from three large cities. Stroke 2006; 37: 63–65.
34 Zhu L, Qin M, Du L, Xie R, Wong T, Wen SW. Maternal and congenital syphilis in Shanghai, China, 2002 to 2006. Int J Infect Dis 2010; 14 (Suppl 3): e45–48.
35 Zhou L, Honma T, Kaku N. Comparison of incidence, mortality and treatment of acute myocardial infarction in hospitals in Japan and China. Kurume Med J 1992; 39: 279–84.
36 Shen Y-C, Zhang M-Y, Huang Y-Q, et al. Twelve-month prevalence, severity, and unmet need for treatment of mental disorders in metropolitan China. Psychol Med 2006; 36: 257–67.
37 Dai S-M, Han X-H, Zhao D-B, Shi Y-Q, Liu Y, Meng J-M. Prevalence of rheumatic symptoms, rheumatoid arthritis, ankylosing spondylitis, and gout in Shanghai, China: a COPCORD study. J Rheumatol 2003; 30: 2245–51.
38 Phillips MR, Zhang J, Shi Q, et al. Prevalence, treatment, and associated disability of mental disorders in four provinces in China during 2001-05: an epidemiological survey. Lancet 2009; 373: 2041–53.
39 WHO. The world health survey, 2011. http://surveydata.who.int/index.html (accessed Dec 21, 2011).
40 Wang H-Y, Petersen PE, Bian J-Y, Zhang B-X. The second national survey of oral health status of children and adults in China. Int Dent J 2002; 52: 283–90.
41 Parkin D, Whelan S, Ferlay, Storm H. Cancer incidence in five continents, vol I to VIII. Lyon: IARC CancerBase No 7, 2005.
42 Curado M, Edwards B, Shin H, et al. Cancer incidence in five continents, vol. IX. IARC Scientific Publications No. 160. Lyon: IARC, 2007.
43 Disease Prevention and Control Bureau, Ministry of Health. Cancer Incidence and Mortality in Chinese Cancer Registration Areas in 2004. Beijing, China: Peking Union Medical College Press, 2008.
44 Disease Prevention and Control Bureau, Ministry of Health. Cancer Incidence and Mortality in Chinese Cancer Registration Areas in 2005. Beijing, China: Disease Prevention and Control Bureau, Ministry of Health, 2009.
45 Disease Prevention and Control Bureau, Ministry of Health. Cancer Incidence and Mortality in Chinese Cancer Registration Areas in 2006. Beijing, China: Military Medical Sciences, 2010.
46 Disease Prevention and Control Bureau, Ministry of Health. Cancer Incidence and Mortality in Chinese Cancer Registration Areas in 2007. Beijing, China: Military Medical Sciences, 2011.
47 Chinese Center for Disease Control and Prevention. National disease surveillance systems death surveillance data sets 2004. Beijing, China: People’s Medical Publishing House, 2005.
48 Chinese Center for Disease Control and Prevention. National disease surveillance systems death surveillance data sets 2005. Beijing, China: People’s Medical Publishing House, 2006.
49 Chinese Center for Disease Control and Prevention. National disease surveillance systems death surveillance data sets 2006. Beijing, China: People’s Medical Publishing House, 2007.
50 Chinese Center for Disease Control and Prevention. National
disease surveillance systems death surveillance data sets 2007. Beijing, China: People’s Medical Publishing House, 2008.
51 Chinese Center for Disease Control and Prevention. National disease surveillance systems death surveillance data sets 2008. Beijing, China: People’s Medical Publishing House, 2009.
52 Chinese Center for Disease Control and Prevention. National disease surveillance systems death surveillance data sets 2009. Beijing, China: People’s Medical Publishing House, 2010.
53 Chinese Center for Disease Control and Prevention. National disease surveillance systems death surveillance data sets 2010. Beijing, China: People’s Medical Publishing House, 2011.
54 Ahmad OB, Global Programme on Evidence for Health Policy (World Health Organization). Age standardization of rates: a new WHO standard. Geneva: World Health Organization, 2001.
55 WHO. WHO Infobase. https://apps.who.int/infobase/ (accessed April 20, 2011).
56 Li Q, Hsia J, Yang G. Prevalence of smoking in China in 2010. N Engl J Med 2011; 364: 2469–70.
57 Yeh AGO, Xu J, Liu K. China’s post-reform urbanization: retrospect, policies and trends. New York: United Nations Population Fund (UNFPA) and International Institute for Environment and Development (IIED), 2011.
58 NBSC. National statistics yearbook. Beijing: National Bureau of Statistics of China, 2010.
59 Institute for Health Metrics and Evaluation. GBD compare. http://viz.healthmetricsandevaluation.org/gbd-compare/ (accessed April 1, 2013).
60 Liu Q, Wang B, Kong Y, Cheng KK. China’s primary health-care reform. Lancet 2011; 377: 2064–66.
61 Frazier AL, Colditz GA, Fuchs CS, Kuntz KM. Cost-effectiveness of screening for colorectal cancer in the general population. JAMA 2000; 284: 1954–61.
62 Capewell S, Morrison C, McMurray J. Contribution of modern cardiovascular treatment and risk factor changes to the decline in coronary heart disease mortality in Scotland between 1975 and 1994. Heart 1999; 81: 380–86.
63 Goldman L, Cook EF. The decline in ischemic heart disease mortality rates. An analysis of the comparative effects of medical interventions and changes in lifestyle. Ann Intern Med 1984; 101: 825–36.
64 Cutler DM, Meara E. The technology of birth: is it worth it? http://www.nber.org/papers/w7390 (accessed April 4, 2013).
65 Cutler DM, Rosen AB, Vijan S. The value of medical spending in the United States, 1960–2000. N Engl J Med 2006; 355: 920–27.
66 Hu FB, Stampfer MJ, Manson JE, et al. Trends in the incidence of coronary heart disease and changes in diet and lifestyle in women. N Engl J Med 2000; 343: 530–37.
67 Marmot MG, Wilkinson RG. Social determinants of health. Oxford: Oxford University Press, 2006.
68 Fang P, Dong S, Xiao J, Liu C, Feng X, Wang Y. Regional inequality in health and its determinants: evidence from China. Health Policy 2010; 94: 14–25.
69 Tang S, Meng Q, Chen L, Bekedam H, Evans T, Whitehead M. Tackling the challenges to health equity in China. Lancet 2008; 372: 1493–501.
70 Jia M, Luo H, Ma Y, et al. The HIV epidemic in Yunnan province, China, 1989-2007. J Acquir Immune Defic Syndr 2010; 53 (Suppl 1): S34–40.
71 Xiao Y, Kristensen S, Sun J, Lu L, Vermund SH. Expansion of HIV/AIDS in China: lessons from Yunnan province. Soc Sci Med 2007; 64: 665–75.