Agilent 1260 Infinity Diode Array and Multiple Wavelength ...
Upload
independentCategory
view
0download
0
Journal of Chromatography A, 1034 (2004) 139–148
Rapid analysis of nucleotide-activated sugars by high-performance liquidchromatography coupled with diode-array detection, electrospray
ionization mass spectrometry and nuclear magnetic resonance
Michael Ramma, Jean-Luc Wolfenderb, Emerson Ferreira Queirozb,Kurt Hostettmannb, Matthias Hamburgera,∗
a Institute of Pharmacy, Friedrich-Schiller-University Jena, Semmelweisstrasse 10, D-07743 Jena, Germanyb Institute of Pharmacognosy and Phytochemistry, University of Lausanne, BEP, CH-1015 Lausanne, Switzerland
Received 17 November 2003; received in revised form 4 February 2004; accepted 6 February 2004
Abstract
A generally applicable method for HPLC analysis of sugar nucleotides was established. Separation was achieved using ion-pair chro-matography on a reversed-phase column. Ion-pair reagents were selected and various parameters optimized with respect to separation of11 of the most important sugar nucleotides and compatibility with on-line detection by electrospray ionization MS and NMR. The methodwas applied to the on-line analysis of the GDP-d-mannose-4,6-dehydratase (Gmd) and GDP-4-keto-6-deoxy-d-mannose reductase (Rmd)catalyzed conversion of GDP-d-mannose to GDP-d-rhamnose. By LC–NMR, the intermediate product of the reaction was shown to be amixture of GDP-4-keto-6-deoxy-d-mannose and GDP-3-keto-6-deoxy-d-mannose. Nucleotide co-factors of enzymatic reactions such as ATPand NADH did not interfere with the analysis of nucleotide-activated sugars.© 2004 Elsevier B.V. All rights reserved.
Keywords:Nuclear magnetic resonance spectrometry; Nucleotide sugars; Carbohydrates; Guanosine diphosphate–mannose; Guanosinediphosphate–rhamnose
1. Introduction
Nucleotide-activated sugars are ubiquitous metabolites forthe biosynthesis of carbohydrate containing molecules. In-terconversions of monosaccharides occur in their activatedforms. Nucleotide sugars serve as building blocks for oligoand polysaccharides; they are involved in glycosidation ofproteins and lipids, and in phase 2 metabolization (conju-gation) of xenobiotics. Carbohydrates form highly complexstructures at the outer surface of microbial, plant, and ani-mal cells, where they serve for molecular recognition in fun-damental cellular processes including signal transduction,intercellular communication, protein targeting and recogni-tion of pathogens[1–3]. The bacterial cell wall is particu-larly rich in complex carbohydrates containing rare sugarswhich are not found in other organisms such as mammals.
∗ Corresponding author. Tel.:+49-3641-949841;fax: +49-3641-949842.
E-mail address:[email protected] (M. Hamburger).
Polysaccharides of the outer membrane, such as O-antigensin Gram-negative and S-layer in Gram-positive bacteria, areoften essential virulence factors of pathogens. Targetting thebiosynthesis of specific carbohydrates is, therefore, of con-siderable interest for the development of therapeutic agents[4–6].
Investigation of the metabolism of nucleotide-activatedsugars requires a generally applicable, rapid and robust ana-lytical assay which should enable the separation, unambigu-ous structural characterization and quantitation of substrates,intermediates and end products. From the late 1970s until to-day, several HPLC methods for analysis of nucleotides havebeen developed. Ion exchange chromatography enables pri-marily the separation of nucleotides that differ in their degreeof phosphorylation. Ion exchange chromatography is, there-fore, only of limited use for analysis of sugar nucleotides,and few applications have been reported[7–9]. Long sepa-ration times and poor long-term stability of columns are ma-jor drawbacks. Reversed-phase liquid chromatography withacetonitrile–phosphate buffer gradients leads to significantly
0021-9673/$ – see front matter © 2004 Elsevier B.V. All rights reserved.doi:10.1016/j.chroma.2004.02.023
140 M. Ramm et al. / J. Chromatogr. A 1034 (2004) 139–148
faster separations and enables the successful analysis of nu-merous nucleotide-containing molecules. However, separa-tion of nucleoside phosphates and nucleotide-activated sug-ars is not satisfactory[10–12]. Finally, ion-pair chromatog-raphy was established as an alternative. Addition of tertiaryor quaternary ammonium derivatives to the mobile phaseprovides satisfactory retention of the highly polar analyteson reversed-phase materials. Using acetonitritrile gradients,numerous nucleotide-containing compounds and sugar nu-cleotides can be separated[13,14]. Ion-pair chromatographyhas been successfully applied to the analysis of nucleotidesugars from genetically engineered yeast and bacteria[15].
The applications mentioned were carried out with UVdetection. All nucleotides exhibit an absorption maximumaround 260 nm and are, therefore, easily detected. How-ever, sugar nucleotides cannot be differentiated accordingto the nature of their nucleotide diphosphate moiety (ADP,CDP, GDP, dTDP, UDP) attached to C-1 of the sugarresidue. Thus, HPLC peak identity can only be establishedby co-chromatography with reference compounds, if avail-able, and no further structural information can be derived.Given the subtle structural conversions in monosaccha-ride biosynthesis, biochemical analyses of carbohydratemetabolism are severely hampered by the lack of structuralinformation.
In the context of our ongoing investigation of the biosyn-thesis of lipopolysaccharides (LPSs), rare bacterial sugarsand activated 6-deoxyhexoses[16–18], we needed an analyt-ical method providing on-line spectroscopic information forthe unambiguous identification of closely related nucleotidesugars, and for structure elucidation of potentially unknownintermediates. At the same time, we wanted to avoid te-dious sample preparation which possibly would result inloss of analytes and decomposition of labile compounds. Wehere describe HPLC conditions suitable for the separationof the most important activated sugars and compatible withon-line electrospray ionization (ESI) MS and NMR analysis.Biosynthesis of GDP-d-rhamnose is taken as an example todemonstrate the detection and structural characterization ofintermediate products obtained by enzymatic conversion ofGDP-d-mannose.
2. Experimental
2.1. Chemicals
Nucleotide sugars were purchased from various suppliers.ADP-d-glucose (1), CDP-d-glucose (2) and ADP-d-ribose(8) were from ICN Biomedicals (Eschwege, Germany),GDP-d-glucose (3), UDP-d-glucose (5), UDP-d-galactose(7), UDP-N-acetyl-d-glucosamine (10) and UDP-d-glucu-ronic acid (11) were from Roche (Basel, Switzerland),dTDP-d-glucose (4) was from Fluka (Buchs, Switzer-land), GDP-d-mannose (6) from Calbiochem (Bad So-
den, Germany), and GDP-l-fucose (9) was from Sigma(Deisenhofen, Germany). Stock solutions (10 mg ml−1)of each compound were prepared in HPLC-grade waterand were stored at−26◦C for not more than 1 month.Trietylamine (TEA), tripropylamine (TPA), tributylamine(TBA) and acetic acid were analytical grade (Fluka).HPLC-grade acetonitrile was from Merck (Darmstadt, Ger-many). HPLC-grade water was prepared with a Milli-RO3Plus system coupled to a Milli-Q RG module (Milli-pore, Bedford, MA, USA), followed by filtration througha 0.22�m cellulose acetate filter (Schleicher & Schuell,Dassel, Germany). Deuterated water (99%) for LC–NMRanalysis was purchased from Dr. Glaser (Basel, Switzer-land). LC–NMR-grade acetonitrile was from SDS (Peypin,France).
2.2. Instrumentation
HPLC separations were carried out with a HP series 1100system (Agilent, Waldbronn, Germany) driven by ChemSta-tion software. This system was composed of a solvent de-gasser module, a binary high pressure mixing pump, an au-tosampler, a column thermostat, and a diode-array detection(DAD) system. For LC–MS analysis, the HPLC system wasconnected to a PE Sciex API 165 quadrupole mass spec-trometer with a turbo ionspray interface (Applied Biosys-tems, Foster City, USA). PE Sciex Analyst 1.1. software wasused for processing of MS data.
LC–NMR analysis was performed on a Varian UnityInova 500 MHz spectrometer equipped with a LC–NMRflow-probe cell (60�l, 3 mm i.d.) (Varian, Palo Alto, CA,USA). The HPLC system consisted of a Varian 9012pump and a ProStar 320 Varian UV-Vis detector. A Valcostop-flow valve (Valco, Houston, TX, USA) was used forthe stop-flow experiments. This valve was controlled by theLC–NMR Varian software. It enables a precise parking ofthe LC peak of interest in the NMR flow-probe based ona calibrated delay time between UV and NMR detectors.In the stop-flow position, the valve releases into the wastethe flow caused by the slow pressure drop over the columnafter the LC-pump stop.
2.3. Chromatographic conditions
All separations were carried out on Hypersil ODSRP-18 columns (5�m, 250 mm× 4.6 mm i.d.) (Supelco,Taufkirchen, Germany). The column was thermostatted at22◦C, or at temperatures indicated in text and legends.Buffers were prepared by adding the desired volume ofTEA, TPA or TBA to 1 l of HPLC-grade water, followedby adjustment of pH to 6.0 with acetic acid. Due to volatil-ity of reagents, buffers were prepared immediately prior touse. For binary gradients with low acetonitrile proportions,buffer (mobile phase A) and a buffer–acetonitrile mixture(90:10 (v/v)) (mobile phase B) were used to generate the
M. Ramm et al. / J. Chromatogr. A 1034 (2004) 139–148 141
desired gradient profile. Eluents were prepared daily anddegassed prior to use. Flow rate was 1 ml min−1. The injec-tion volume was 10�l, and the wavelength of UV detectionwas 254 nm.
2.4. ESI-MS conditions
Operating conditions in the negative ion mode were as fol-lows: source temperature 350◦C, ion spray voltage –3.100 V,focusing potential−310 V, declustering potential−70 V, en-trance potential−6.5 V. The settings in positive ion modewere: source temperature 350◦C, ion spray voltage 3.100 V,focusing potential 200 V, declustering potential 20 V, en-trance potential 10 V. Mass spectra were recorded in them/zrange 150–800 (0.4 s per scan).
2.5. LC–NMR conditions
For LC–NMR analysis the amount injected on-columnwas increased for sensitivity reasons. The method was testedby injecting a mixture of GDP-mannose, GDP-fucose andGDP-glucose (200�g each). The HPLC conditions used forLC–NMR were similar to those described inSection 2.3using TEA as buffer except that H2O was replaced by2H2Oin the buffer solution and that the isocratic mode was chosen(buffer (mobile phase A)+ 0.5% MeCN).
2.5.1. Suppression of signals from ion-pair reagentMultiple solvent suppression was achieved by calculating
automatically a selective pulse which enabled the suppres-sion of all the signal from the solvent and buffer using theWET sequence[19] [MeCN (s,δ 2.0), HO2H (s, � 4.9), tri-ethylammonium acetate (TEA) (s,δ 1.8; t, δ 1.2; ddδ 3.15)](seeFig. 7).
2.5.2. Stop-flow LC–NMR two-dimensional correlationexperiments
Good quality spectra (NT= 128) were obtained inthe stop-flow mode for the standards of GDP-mannose,GDP-fructose and GDP-glucose andd-rhamnose (200�geach). One milligram of the enzymatic reaction mixturewas injected on-column. Time slice experiments were per-formed on the broad assymmetric LC peak correspondingto GDP-keto-deoxymannoses13a and 13b every 1 min. AWET gCOSY (NT 96×NI 512) was performed on the mix-ture of interconverting GDP-keto deoxymannoses13a and13b. A similar experiment on the standard GDP-mannoseandd-rhamnose for reasons of comparison was performed.Specific correlations were evidenced by one-dimensionaltotal correlation spectroscopy (1D-TOCSY) experiments.In this case, no solvent suppression was applied and thecrude mixture was directly injected in the flow probe in2H2O without separation. The specific signal irradiationswere performed based on the LC–NMR results obtainedpreviously.
2.6. Enzymatic reactions with GDP-d-mannose
GDP-d-mannose-4,6-dehydratase (Gmd, EC 4.2.1.47)and GDP-4-keto-6-deoxy-d-mannose-reductase (Rmd, EC1.1.1.187) fromPseudomonas aeruginosawere cloned,overexpressed inEscherichia coliand characterized as de-scribed elsewhere[18]. The standard reaction mixture forLC–MS experiments contained 4 mM GDP-d-mannose,20�g Gmd and, for synthesis of GDP-d-rhamnose, 1.5�gRmd in 80�l of a 25 mM bicine–ammonium hydroxidebuffer (pH 8.0). The reaction mixture was incubated at37◦C for 20 min. The reaction was stopped by heating for1 min in a boiling water bath. The denatured protein wasremoved by centrifugation, and the protein-free supernatantwas directly submitted to HPLC analysis.
For LC–NMR studies, the reaction mixture consistedof 15 mmol GDP-d-mannose, 1.5 mg Gmd in 1.5 ml of a10 mM potassium phosphate buffer (pH 8.5). The mix-ture was incubated at 37◦C for 4 h. After this time, thereaction was complete, as monitored by HPLC. The en-zyme was removed by ultrafiltration with a disposableMicrocon YM-10 centrifugal filter Unit (Millipore). Fortwo-dimensional NMR experiments, the solution was de-salted over a Sephadex G-10 column (200 cm× 1.6 cmi.d.) eluted with water at a flow rate of 1.1 ml min−1. Theeffluent was monitored at 254 nm, and fractions containingGDP-sugars were pooled, lyophilized. Samples were storedat −80◦C and redissolved in D2O immediately prior toLC–NMR analysis.
3. Results and discussion
Ion-pair chromatography is a well established method forthe HPLC analysis of highly polar nucleotides[14] and hasalso been successfully applied to the separation of the signif-icantly more polar sugar nucleotides[15,20,21]. The buffersystems and ion-pair reagents used, typically tetrabutylam-monium sulfate in phosphate buffers, are suitable for UVdetection but not for hyphenation with ESI-MS and NMR.Another drawback of these ion-pair systems is that free nu-cleotides and co-factors required for enzymatic reactions,such as NADH, ATP or FAD, show similar retention behav-ior than the sugar nucleotides and unnecessarily complicatethe chromatogram[14]. As a starting point for developmentof a suitable eluent, we chose the volatile triethylammoniumacetate buffer system described by Oba et al.[22].
Preliminary HPLC separations with 11 commerciallyavailable sugar nucleotides (seeSection 2andFig. 1) with40 mM triethylammonium acetate (TEA; pH 6) at 22◦C ledto a good separation of analytes. Retention times for com-pounds1, 4, 8 and9, however, were unacceptably long, asa full chromatographic run lasted 50 min (Fig. 1a). Further-more, the high buffer concentration led to weak ESI-MSsignals of analytes due to ion suppression (see below).Reduction of buffer concentration to 10 mM led to shorter
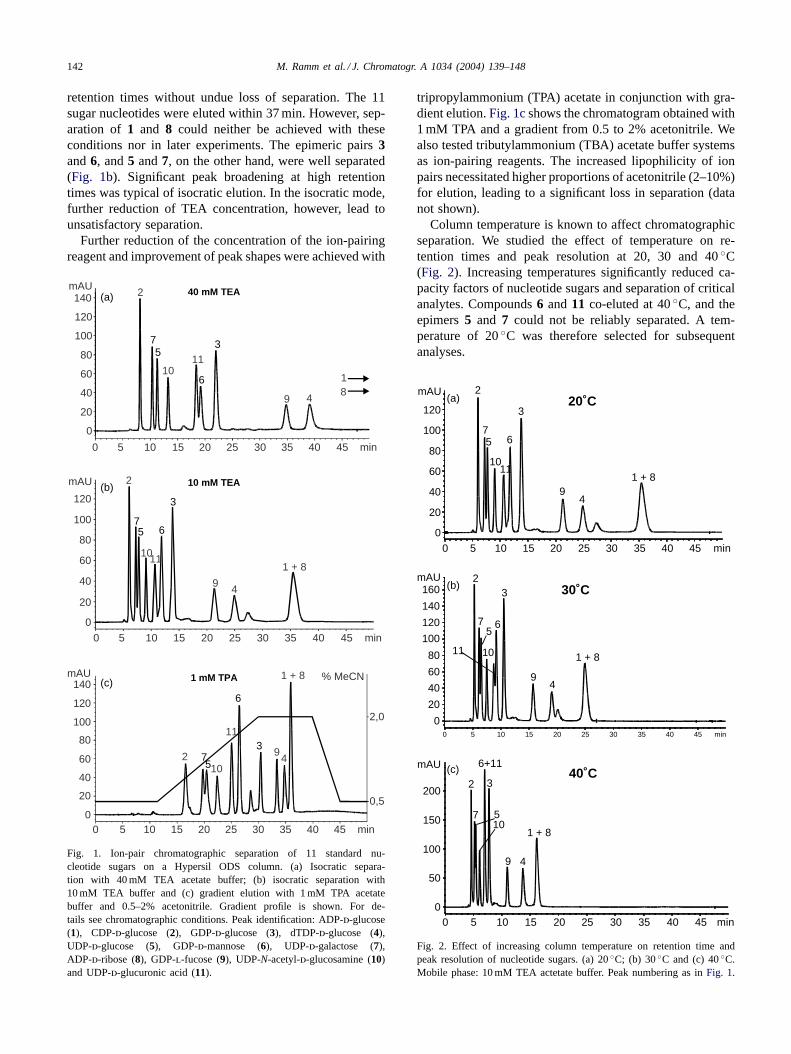
142 M. Ramm et al. / J. Chromatogr. A 1034 (2004) 139–148
retention times without undue loss of separation. The 11sugar nucleotides were eluted within 37 min. However, sep-aration of 1 and 8 could neither be achieved with theseconditions nor in later experiments. The epimeric pairs3and6, and5 and7, on the other hand, were well separated(Fig. 1b). Significant peak broadening at high retentiontimes was typical of isocratic elution. In the isocratic mode,further reduction of TEA concentration, however, lead tounsatisfactory separation.
Further reduction of the concentration of the ion-pairingreagent and improvement of peak shapes were achieved with
min0 5 10 15 20 25 30 35 40 45
mAU
0
20
40
60
80
100
120
2
75
1011
6
3
94
1 + 8
min0 5 10 15 20 25 30 35 40 45
mAU
0
20
40
60
80
100
120
140
0,5
2,0
% MeCN
2 7510
11
6
39
4
1 + 8
min0 5 10 15 20 25 30 35 40 45
mAU
0
20
40
60
80
100
120
140 2
3
4
5
6
7
9
11
81
10
40 mM TEA
10 mM TEA
1 mM TPA
(a)
(b)
(c)
Fig. 1. Ion-pair chromatographic separation of 11 standard nu-cleotide sugars on a Hypersil ODS column. (a) Isocratic separa-tion with 40 mM TEA acetate buffer; (b) isocratic separation with10 mM TEA buffer and (c) gradient elution with 1 mM TPA acetatebuffer and 0.5–2% acetonitrile. Gradient profile is shown. For de-tails see chromatographic conditions. Peak identification: ADP-d-glucose(1), CDP-d-glucose (2), GDP-d-glucose (3), dTDP-d-glucose (4),UDP-d-glucose (5), GDP-d-mannose (6), UDP-d-galactose (7),ADP-d-ribose (8), GDP-l-fucose (9), UDP-N-acetyl-d-glucosamine (10)and UDP-d-glucuronic acid (11).
tripropylammonium (TPA) acetate in conjunction with gra-dient elution.Fig. 1cshows the chromatogram obtained with1 mM TPA and a gradient from 0.5 to 2% acetonitrile. Wealso tested tributylammonium (TBA) acetate buffer systemsas ion-pairing reagents. The increased lipophilicity of ionpairs necessitated higher proportions of acetonitrile (2–10%)for elution, leading to a significant loss in separation (datanot shown).
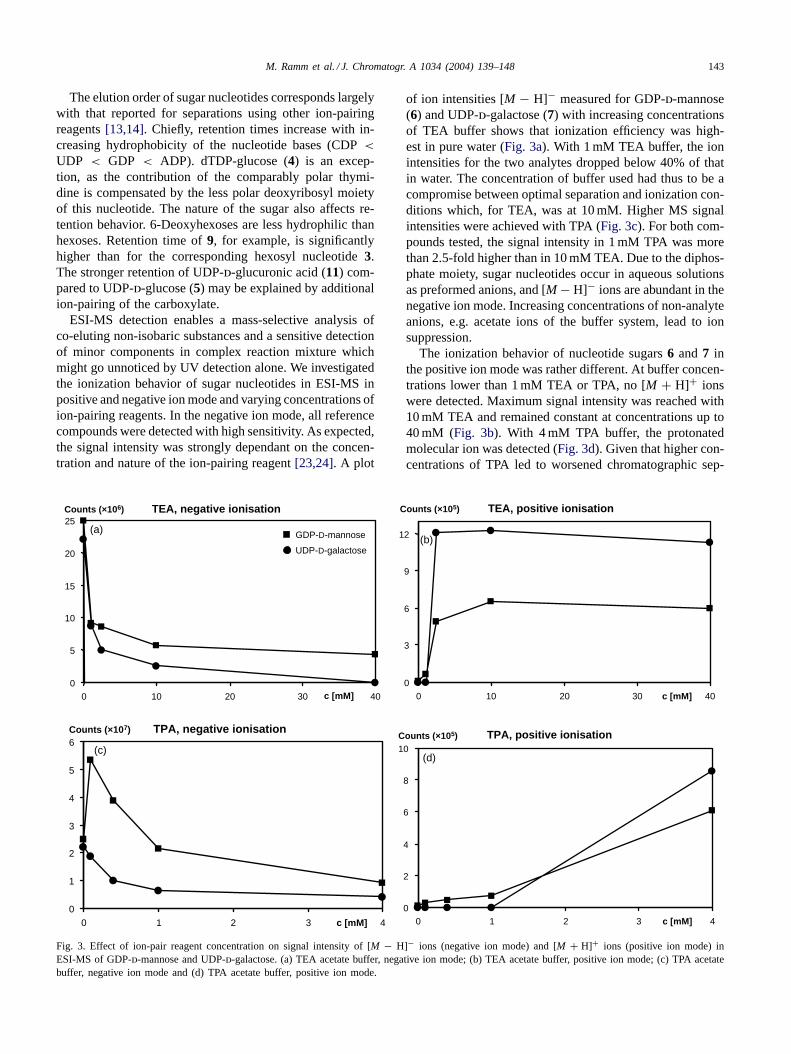
Column temperature is known to affect chromatographicseparation. We studied the effect of temperature on re-tention times and peak resolution at 20, 30 and 40◦C(Fig. 2). Increasing temperatures significantly reduced ca-pacity factors of nucleotide sugars and separation of criticalanalytes. Compounds6 and11 co-eluted at 40◦C, and theepimers5 and 7 could not be reliably separated. A tem-perature of 20◦C was therefore selected for subsequentanalyses.
min0 5 10 15 20 25 30 35 40 45
mAU
0
20
40
60
80
100
120
2
3
4
5 67
1 + 89
1011
20˚C
min0 5 10 15 20 25 30 35 40 45
mAU
0
20
40
60
80
100
120
140
1602
3
4
567
1 + 8
9
1011
30˚C
min0 5 10 15 20 25 30 35 40 45
mAU
0
50
100
150
2002 3
4
5
6+11
7
1 + 8
9
10
40˚C
(a)
(b)
(c)
Fig. 2. Effect of increasing column temperature on retention time andpeak resolution of nucleotide sugars. (a) 20◦C; (b) 30◦C and (c) 40◦C.Mobile phase: 10 mM TEA actetate buffer. Peak numbering as inFig. 1.
M. Ramm et al. / J. Chromatogr. A 1034 (2004) 139–148 143
The elution order of sugar nucleotides corresponds largelywith that reported for separations using other ion-pairingreagents[13,14]. Chiefly, retention times increase with in-creasing hydrophobicity of the nucleotide bases (CDP<
UDP < GDP < ADP). dTDP-glucose (4) is an excep-tion, as the contribution of the comparably polar thymi-dine is compensated by the less polar deoxyribosyl moietyof this nucleotide. The nature of the sugar also affects re-tention behavior. 6-Deoxyhexoses are less hydrophilic thanhexoses. Retention time of9, for example, is significantlyhigher than for the corresponding hexosyl nucleotide3.The stronger retention of UDP-d-glucuronic acid (11) com-pared to UDP-d-glucose (5) may be explained by additionalion-pairing of the carboxylate.
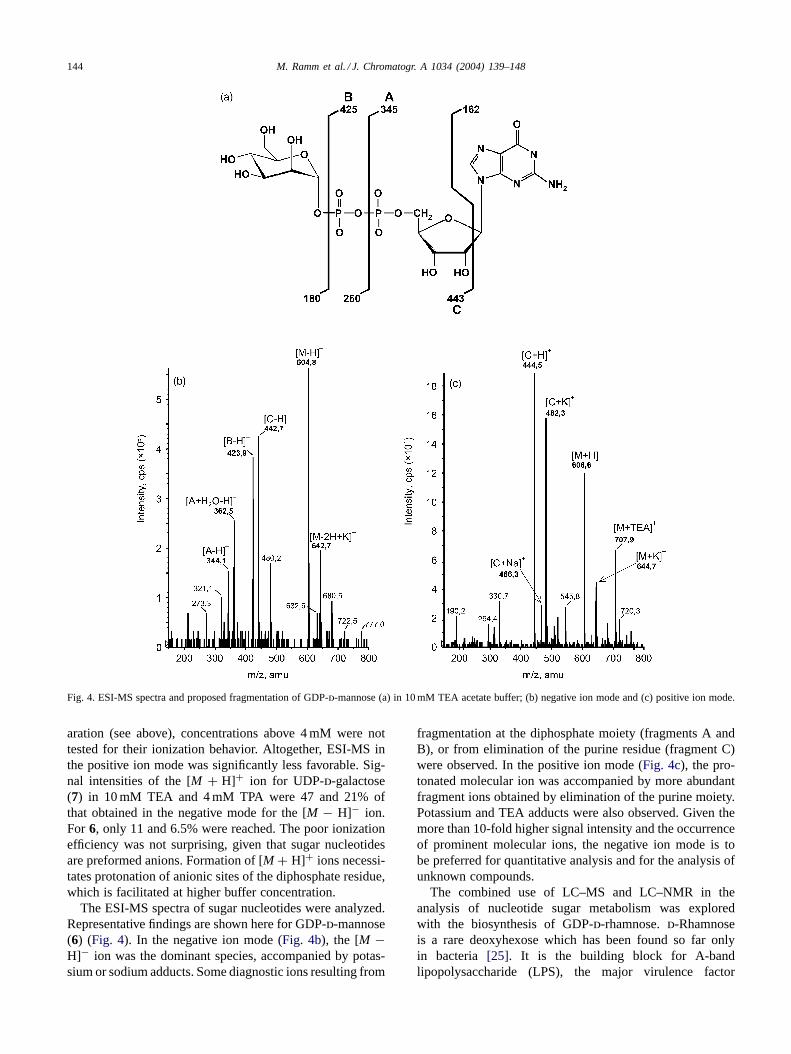
ESI-MS detection enables a mass-selective analysis ofco-eluting non-isobaric substances and a sensitive detectionof minor components in complex reaction mixture whichmight go unnoticed by UV detection alone. We investigatedthe ionization behavior of sugar nucleotides in ESI-MS inpositive and negative ion mode and varying concentrations ofion-pairing reagents. In the negative ion mode, all referencecompounds were detected with high sensitivity. As expected,the signal intensity was strongly dependant on the concen-tration and nature of the ion-pairing reagent[23,24]. A plot
0
5
10
15
20
25
0 10 20 30 40c [mM]
Counts (×106) TEA, negative ionisation
GDP-D-mannose
UDP-D-galactose
0
3
6
9
12
0 10 20 30 40c [mM]
Counts (×105) TEA, positive ionisation
0
1
2
3
4
5
6
0 1 2 3 4c [mM]
Counts (×107) TPA, negative ionisation
0
2
4
6
8
10
0 1 2 3 4c [mM]
Counts (×105) TPA, positive ionisation
(a)(b)
(c)(d)
Fig. 3. Effect of ion-pair reagent concentration on signal intensity of [M − H]− ions (negative ion mode) and [M + H]+ ions (positive ion mode) inESI-MS of GDP-d-mannose and UDP-d-galactose. (a) TEA acetate buffer, negative ion mode; (b) TEA acetate buffer, positive ion mode; (c) TPA acetatebuffer, negative ion mode and (d) TPA acetate buffer, positive ion mode.
of ion intensities [M − H]− measured for GDP-d-mannose(6) and UDP-d-galactose (7) with increasing concentrationsof TEA buffer shows that ionization efficiency was high-est in pure water (Fig. 3a). With 1 mM TEA buffer, the ionintensities for the two analytes dropped below 40% of thatin water. The concentration of buffer used had thus to be acompromise between optimal separation and ionization con-ditions which, for TEA, was at 10 mM. Higher MS signalintensities were achieved with TPA (Fig. 3c). For both com-pounds tested, the signal intensity in 1 mM TPA was morethan 2.5-fold higher than in 10 mM TEA. Due to the diphos-phate moiety, sugar nucleotides occur in aqueous solutionsas preformed anions, and [M − H]− ions are abundant in thenegative ion mode. Increasing concentrations of non-analyteanions, e.g. acetate ions of the buffer system, lead to ionsuppression.
The ionization behavior of nucleotide sugars6 and7 inthe positive ion mode was rather different. At buffer concen-trations lower than 1 mM TEA or TPA, no [M + H]+ ionswere detected. Maximum signal intensity was reached with10 mM TEA and remained constant at concentrations up to40 mM (Fig. 3b). With 4 mM TPA buffer, the protonatedmolecular ion was detected (Fig. 3d). Given that higher con-centrations of TPA led to worsened chromatographic sep-
144 M. Ramm et al. / J. Chromatogr. A 1034 (2004) 139–148
Fig. 4. ESI-MS spectra and proposed fragmentation of GDP-d-mannose (a) in 10 mM TEA acetate buffer; (b) negative ion mode and (c) positive ion mode.
aration (see above), concentrations above 4 mM were nottested for their ionization behavior. Altogether, ESI-MS inthe positive ion mode was significantly less favorable. Sig-nal intensities of the [M + H]+ ion for UDP-d-galactose(7) in 10 mM TEA and 4 mM TPA were 47 and 21% ofthat obtained in the negative mode for the [M − H]− ion.For 6, only 11 and 6.5% were reached. The poor ionizationefficiency was not surprising, given that sugar nucleotidesare preformed anions. Formation of [M + H]+ ions necessi-tates protonation of anionic sites of the diphosphate residue,which is facilitated at higher buffer concentration.
The ESI-MS spectra of sugar nucleotides were analyzed.Representative findings are shown here for GDP-d-mannose(6) (Fig. 4). In the negative ion mode (Fig. 4b), the [M −H]− ion was the dominant species, accompanied by potas-sium or sodium adducts. Some diagnostic ions resulting from
fragmentation at the diphosphate moiety (fragments A andB), or from elimination of the purine residue (fragment C)were observed. In the positive ion mode (Fig. 4c), the pro-tonated molecular ion was accompanied by more abundantfragment ions obtained by elimination of the purine moiety.Potassium and TEA adducts were also observed. Given themore than 10-fold higher signal intensity and the occurrenceof prominent molecular ions, the negative ion mode is tobe preferred for quantitative analysis and for the analysis ofunknown compounds.
The combined use of LC–MS and LC–NMR in theanalysis of nucleotide sugar metabolism was exploredwith the biosynthesis of GDP-d-rhamnose.d-Rhamnoseis a rare deoxyhexose which has been found so far onlyin bacteria [25]. It is the building block for A-bandlipopolysaccharide (LPS), the major virulence factor
M. Ramm et al. / J. Chromatogr. A 1034 (2004) 139–148 145
GMD
H2O NADPH NADP+
OHOHO
OHOH
OGDP
(6)O
O
HO
OH
OGDP
H3C(13a)
OHOHO
OHH3C
OGDP
(12)
OHO
OHH3C
OGDP
O
(13b)
RMD
Fig. 5. Proposed pathway for biosynthesis of GDP-d-rhamnose (12) from GDP-d-mannose (6), via GDP-4-keto-6-deoxy-d-mannose (13a) which is inequilibrium with GDP-3-keto-6-deoxy-d-mannose (13b).
of P. aeruginosa involved in chronic lung infectionsof cystic fibrosis patients[20,26,27]. Key enzymes ofd-rhamnose biosynthesis are promising targets for the de-velopment of novel anti-infective agents[28]. Biosynthesisof GDP-d-rhamnose starts from GDP-d-mannose whichis dehydrated by GDP-d-mannose dehydratase (Gmd)to GDP-4-keto-6-deoxy-d-mannose. This intermediate issubsequently reduced by GDP-4-keto-6-deoxy-d-mannose
Fig. 6. HPLC analysis of reaction catalyzed by Gmd and Rmd. (a) Chromatogram recorded at 254 nm (standard reaction conditions, eluent 10 mM TEAacetate buffer, 20◦C); (b) ESI-MS trace (negative ion mode) atm/z 604.5; (c) atm/z 586.5 and (d) atm/z 588.5.
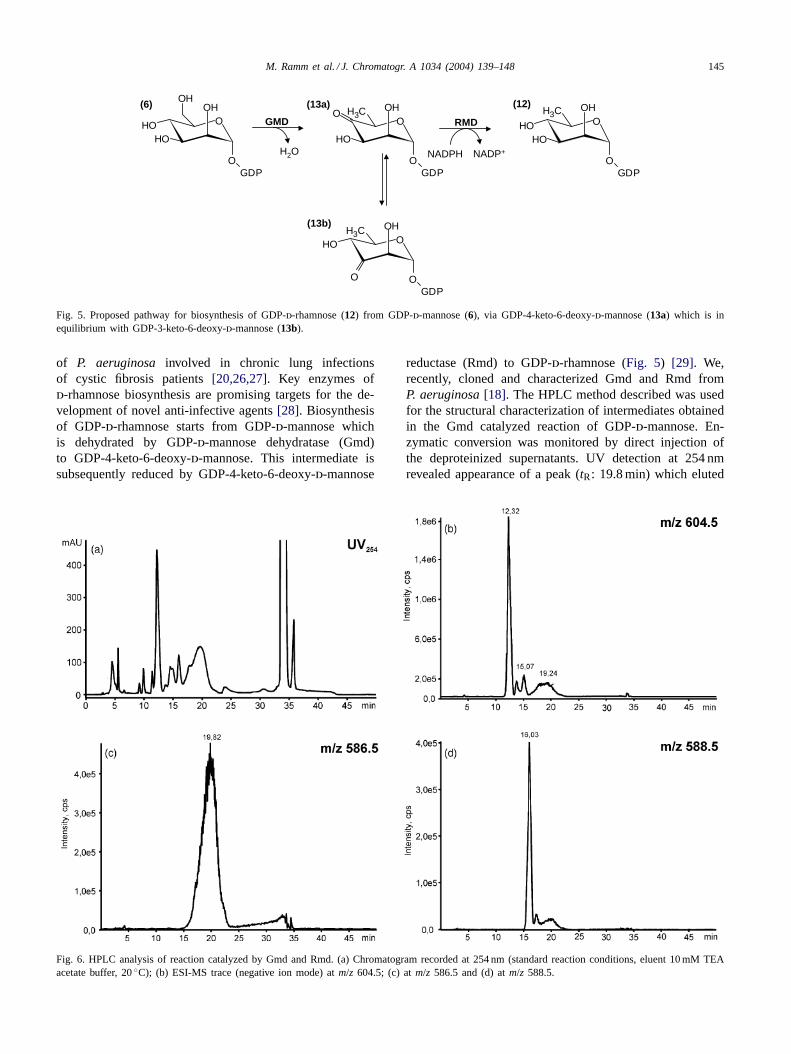
reductase (Rmd) to GDP-d-rhamnose (Fig. 5) [29]. We,recently, cloned and characterized Gmd and Rmd fromP. aeruginosa[18]. The HPLC method described was usedfor the structural characterization of intermediates obtainedin the Gmd catalyzed reaction of GDP-d-mannose. En-zymatic conversion was monitored by direct injection ofthe deproteinized supernatants. UV detection at 254 nmrevealed appearance of a peak (tR: 19.8 min) which eluted
146 M. Ramm et al. / J. Chromatogr. A 1034 (2004) 139–148
after GDP-d-mannose (tR: 12.3 min) (Fig. 6a and b). Thenegative ion ESI-MS of the peak showed a [M − H]−ion at m/z 586.5 (Fig. 6c), as compared tom/z 604.5 forGDP-d-mannose (Fig. 6b), and was thus in accord witha GDP-keto-deoxyhexose. Mass spectra recorded over theentire peak width suggested peak homogeneity despite itsunusually broad and asymmetric shape. This fact and ear-lier investigations on the biosynthesis of keto deoxysugars[30,31] suggested a possible co-occurrence of tautomers,which was clarified with the aid of LC–NMR experiments.
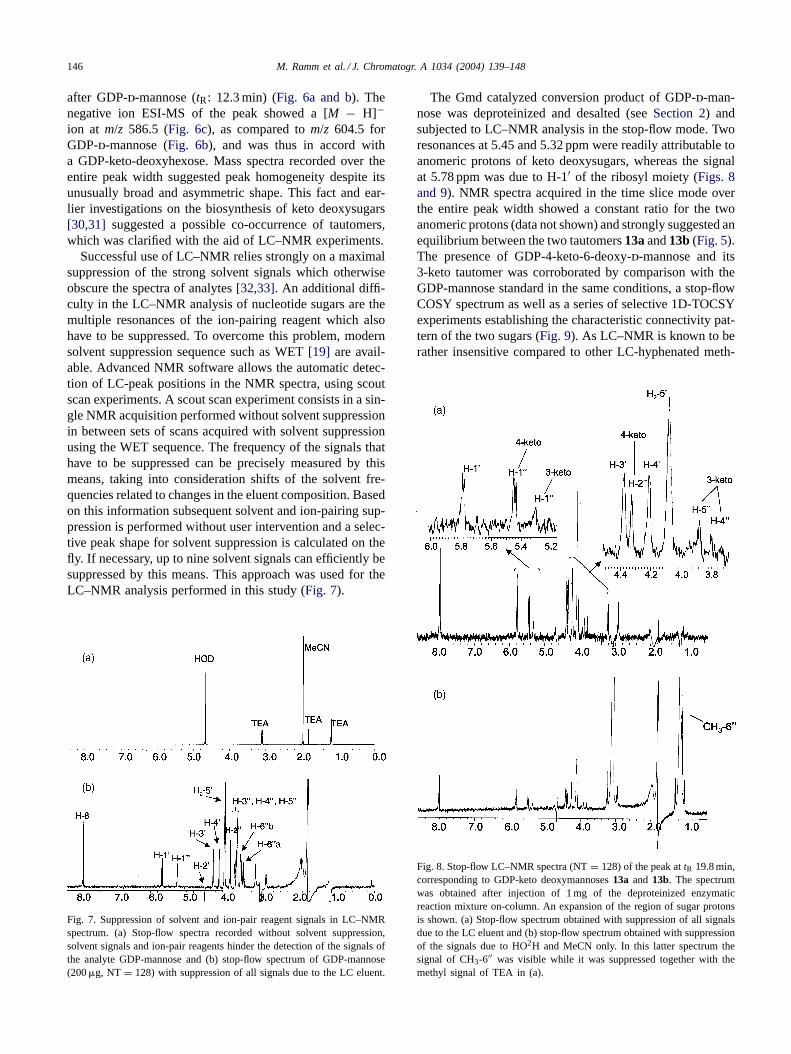
Successful use of LC–NMR relies strongly on a maximalsuppression of the strong solvent signals which otherwiseobscure the spectra of analytes[32,33]. An additional diffi-culty in the LC–NMR analysis of nucleotide sugars are themultiple resonances of the ion-pairing reagent which alsohave to be suppressed. To overcome this problem, modernsolvent suppression sequence such as WET[19] are avail-able. Advanced NMR software allows the automatic detec-tion of LC-peak positions in the NMR spectra, using scoutscan experiments. A scout scan experiment consists in a sin-gle NMR acquisition performed without solvent suppressionin between sets of scans acquired with solvent suppressionusing the WET sequence. The frequency of the signals thathave to be suppressed can be precisely measured by thismeans, taking into consideration shifts of the solvent fre-quencies related to changes in the eluent composition. Basedon this information subsequent solvent and ion-pairing sup-pression is performed without user intervention and a selec-tive peak shape for solvent suppression is calculated on thefly. If necessary, up to nine solvent signals can efficiently besuppressed by this means. This approach was used for theLC–NMR analysis performed in this study (Fig. 7).
Fig. 7. Suppression of solvent and ion-pair reagent signals in LC–NMRspectrum. (a) Stop-flow spectra recorded without solvent suppression,solvent signals and ion-pair reagents hinder the detection of the signals ofthe analyte GDP-mannose and (b) stop-flow spectrum of GDP-mannose(200�g, NT = 128) with suppression of all signals due to the LC eluent.
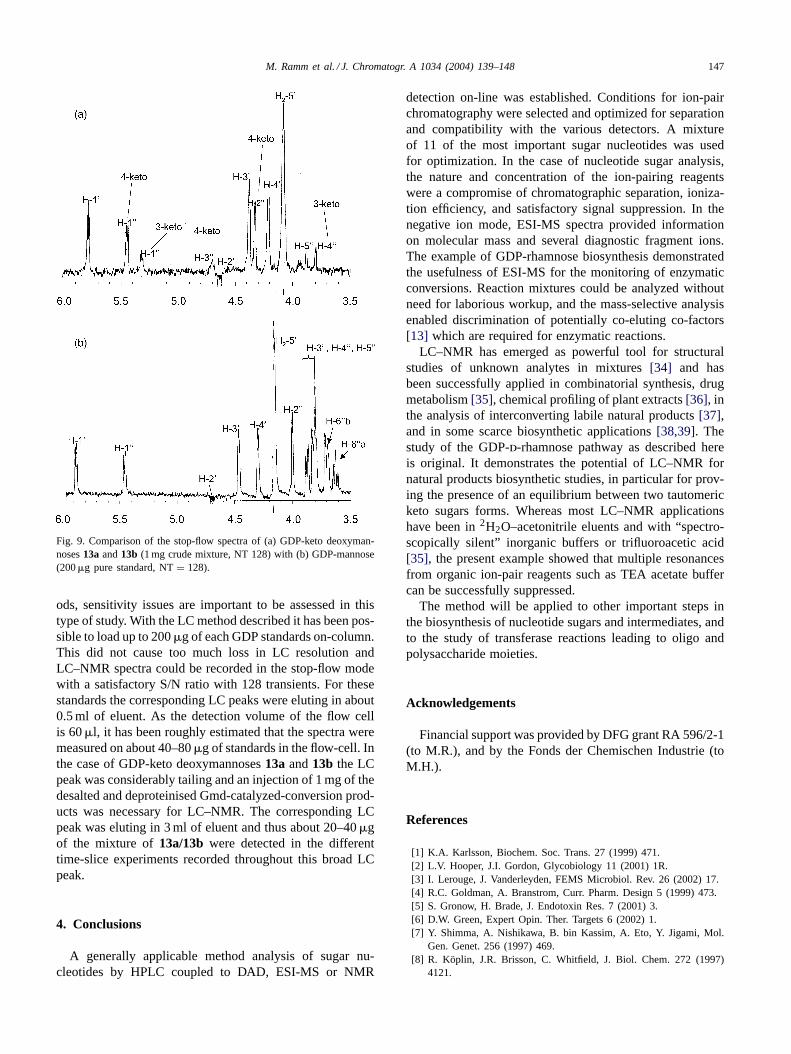
The Gmd catalyzed conversion product of GDP-d-man-nose was deproteinized and desalted (seeSection 2) andsubjected to LC–NMR analysis in the stop-flow mode. Tworesonances at 5.45 and 5.32 ppm were readily attributable toanomeric protons of keto deoxysugars, whereas the signalat 5.78 ppm was due to H-1′ of the ribosyl moiety (Figs. 8and 9). NMR spectra acquired in the time slice mode overthe entire peak width showed a constant ratio for the twoanomeric protons (data not shown) and strongly suggested anequilibrium between the two tautomers13a and13b (Fig. 5).The presence of GDP-4-keto-6-deoxy-d-mannose and its3-keto tautomer was corroborated by comparison with theGDP-mannose standard in the same conditions, a stop-flowCOSY spectrum as well as a series of selective 1D-TOCSYexperiments establishing the characteristic connectivity pat-tern of the two sugars (Fig. 9). As LC–NMR is known to berather insensitive compared to other LC-hyphenated meth-
Fig. 8. Stop-flow LC–NMR spectra (NT= 128) of the peak attR 19.8 min,corresponding to GDP-keto deoxymannoses13a and 13b. The spectrumwas obtained after injection of 1 mg of the deproteinized enzymaticreaction mixture on-column. An expansion of the region of sugar protonsis shown. (a) Stop-flow spectrum obtained with suppression of all signalsdue to the LC eluent and (b) stop-flow spectrum obtained with suppressionof the signals due to HO2H and MeCN only. In this latter spectrum thesignal of CH3-6′′ was visible while it was suppressed together with themethyl signal of TEA in (a).
M. Ramm et al. / J. Chromatogr. A 1034 (2004) 139–148 147
Fig. 9. Comparison of the stop-flow spectra of (a) GDP-keto deoxyman-noses13a and13b (1 mg crude mixture, NT 128) with (b) GDP-mannose(200�g pure standard, NT= 128).
ods, sensitivity issues are important to be assessed in thistype of study. With the LC method described it has been pos-sible to load up to 200�g of each GDP standards on-column.This did not cause too much loss in LC resolution andLC–NMR spectra could be recorded in the stop-flow modewith a satisfactory S/N ratio with 128 transients. For thesestandards the corresponding LC peaks were eluting in about0.5 ml of eluent. As the detection volume of the flow cellis 60�l, it has been roughly estimated that the spectra weremeasured on about 40–80�g of standards in the flow-cell. Inthe case of GDP-keto deoxymannoses13a and13b the LCpeak was considerably tailing and an injection of 1 mg of thedesalted and deproteinised Gmd-catalyzed-conversion prod-ucts was necessary for LC–NMR. The corresponding LCpeak was eluting in 3 ml of eluent and thus about 20–40�gof the mixture of13a/13b were detected in the differenttime-slice experiments recorded throughout this broad LCpeak.
4. Conclusions
A generally applicable method analysis of sugar nu-cleotides by HPLC coupled to DAD, ESI-MS or NMR
detection on-line was established. Conditions for ion-pairchromatography were selected and optimized for separationand compatibility with the various detectors. A mixtureof 11 of the most important sugar nucleotides was usedfor optimization. In the case of nucleotide sugar analysis,the nature and concentration of the ion-pairing reagentswere a compromise of chromatographic separation, ioniza-tion efficiency, and satisfactory signal suppression. In thenegative ion mode, ESI-MS spectra provided informationon molecular mass and several diagnostic fragment ions.The example of GDP-rhamnose biosynthesis demonstratedthe usefulness of ESI-MS for the monitoring of enzymaticconversions. Reaction mixtures could be analyzed withoutneed for laborious workup, and the mass-selective analysisenabled discrimination of potentially co-eluting co-factors[13] which are required for enzymatic reactions.
LC–NMR has emerged as powerful tool for structuralstudies of unknown analytes in mixtures[34] and hasbeen successfully applied in combinatorial synthesis, drugmetabolism[35], chemical profiling of plant extracts[36], inthe analysis of interconverting labile natural products[37],and in some scarce biosynthetic applications[38,39]. Thestudy of the GDP-d-rhamnose pathway as described hereis original. It demonstrates the potential of LC–NMR fornatural products biosynthetic studies, in particular for prov-ing the presence of an equilibrium between two tautomericketo sugars forms. Whereas most LC–NMR applicationshave been in2H2O–acetonitrile eluents and with “spectro-scopically silent” inorganic buffers or trifluoroacetic acid[35], the present example showed that multiple resonancesfrom organic ion-pair reagents such as TEA acetate buffercan be successfully suppressed.
The method will be applied to other important steps inthe biosynthesis of nucleotide sugars and intermediates, andto the study of transferase reactions leading to oligo andpolysaccharide moieties.
Acknowledgements
Financial support was provided by DFG grant RA 596/2-1(to M.R.), and by the Fonds der Chemischen Industrie (toM.H.).
References
[1] K.A. Karlsson, Biochem. Soc. Trans. 27 (1999) 471.[2] L.V. Hooper, J.I. Gordon, Glycobiology 11 (2001) 1R.[3] I. Lerouge, J. Vanderleyden, FEMS Microbiol. Rev. 26 (2002) 17.[4] R.C. Goldman, A. Branstrom, Curr. Pharm. Design 5 (1999) 473.[5] S. Gronow, H. Brade, J. Endotoxin Res. 7 (2001) 3.[6] D.W. Green, Expert Opin. Ther. Targets 6 (2002) 1.[7] Y. Shimma, A. Nishikawa, B. bin Kassim, A. Eto, Y. Jigami, Mol.
Gen. Genet. 256 (1997) 469.[8] R. Köplin, J.R. Brisson, C. Whitfield, J. Biol. Chem. 272 (1997)
4121.
148 M. Ramm et al. / J. Chromatogr. A 1034 (2004) 139–148
[9] R.J. Stern, T.-Y. Lee, W. Tan, M.S. Scherman, V.D. Vissa, S.-K.Kim, B.L. Wanner, M.R. McNeil, Microbiology 145 (1999) 663.
[10] A. Martin, D. Ruggiero-Lopez, P. Broquet, M. Richard, P. Louisot,J. Chromatogr. 497 (1989) 319.
[11] K. Andrianopoulos, L. Wang, P.R. Reeves, J. Bacteriol. 180 (1998)998.
[12] Y. Nakano, N. Suzuki, Y. Yoshida, T. Nezu, Y. Yamashita, T. Koga,J. Biol. Chem. 275 (2000) 6806.
[13] T. Ryll, R. Wagner, J. Chromatogr. 570 (1991) 77.[14] I. Maynial, V. Paquet, D. Combes, Anal. Chem. 67 (1995) 1627.[15] J. Rabina, M. Mäki, E.M. Savilahti, N. Jarvinen, L. Penttila, R.
Renkonen, Glycoconj. J. 18 (2001) 799.[16] A. Muck, M. Ramm, M. Hamburger, J. Chromatogr. B 732 (1999)
39.[17] M. Ramm, M. Lobe, M. Hamburger, Carbohydr. Res. 338 (2003)
109.[18] M. Ramm, T. Ellinger, M. Hamburger, Eur. J. Biochem., submitted.[19] S.H. Smallcombe, S.L. Patt, P.A. Keiffer, J. Magn. Reson. Ser. A
117 (1995) 295.[20] S.-I. Yokota, S. Kaya, Y. Araki, E. Ito, T. Kawamura, S. Sawada, J.
Bacteriol. 172 (1990) 6162.[21] C.R.H. Raetz, Annu. Rev. Biochem. 59 (1990) 129.[22] T. Oba, K.K. Doesburg, T. Iwasaki, J. Sikkema, Arch. Microbiol.
171 (1999) 343.[23] S. Zhou, M. Hamburger, Rapid Commun. Mass Spectrom. 9 (1995)
1516.
[24] S. Zhou, M. Hamburger, J. Chromatogr. A 755 (1996) 189.[25] M. Tonetti, L. Sturla, A. Bisso, D. Zanardi, U. Benatti, A. de Flora,
Biochimie 89 (1988) 923.[26] M.Y.C. Lam, E.J. McGroarty, A.M. Kropinski, L.A. MacDonald, S.S.
Pedersen, N. Hoiby, J.S. Lam, J. Clin. Microbiol. 27 (1989) 962.[27] T.L. Arsenault, D.W. Hughes, D.B. MacLean, W.A. Szarek, A.M.B.
Kropinski, J.S. Lam, Can. J. Chem. 69 (1990) 1273.[28] R. Chaby, Drug Discov. Today 4 (1999) 209.[29] M.F. Giraud, J.H. Naismith, Curr. Opin. Struct. Biol. 10 (2000) 687.[30] A. Naundorf, W. Klaffke, Carbohydr. Res. 285 (1996) 141.[31] F.X. Sullivan, R. Kumar, R. Kriz, M. Stahl, G.-Y. Xu, J. Rousse,
X.-J. Chang, A. Boodhoo, B. Potvin, D.A. Cumming, J. Biol. Chem.273 (1998) 8193.
[32] C. Dalvit, G. Shapiro, J.M. Bohlen, T. Parella, Magn. Reson. Chem.37 (1999) 7.
[33] K. Albert, in: K. Albert (Ed.), On-line LC–NMR and Related Tech-niques, Wiley, Chichester, 2002.
[34] K. Albert, J. Chromatogr. A 856 (1999) 199.[35] L.C. Lindon, J.K. Nicholson, I.D. Wilson, J. Chromatogr. B 748
(2000) 233.[36] J.J. Wolfender, K. Ndjoko, K. Hostettmann, J. Chromatogr. A 1000
(2003) 437.[37] F. Schaller, J.L. Wolfender, K. Hostettmann, S. Mavi, Helv. Chim.
Acta 84 (2001) 222.[38] B. Schmitt, B. Schneider, Phytochemistry 52 (1999) 45.[39] B. Schmitt, B. Schneider, Phytochem. Anal. 12 (2001) 43.
Copyright © 2022 FDOKUMEN