RANWAR: Rank-Based Weighted Association Rule Mining from Gene Expression and Methylation Data
8
1 RANWAR: Rank-Based Weighted Association Rule Mining from Gene Expression and Methylation Data Saurav Mallik * , Anirban Mukhopadhyay † , Senior Member, IEEE, and Ujjwal Maulik ‡ , Senior Member, IEEE Abstract—Ranking of association rules is currently an interesting topic in data mining and bioinformatics. The huge number of evolved rules of items (or, genes) by association rule mining (ARM) algorithms makes confusion to the decision maker. In this article, we propose a weighted rule-mining technique (say, RAN W AR or rank-based weighted association rule-mining) to rank the rules using two novel rule-interestingness measures, viz., rank-based weighted condensed support (wcs) and weighted condensed con- fidence (wcc) measures to bypass the problem. These measures are basically depended on the rank of items (genes). Using the rank, we assign weight to each item. RAN W AR generates much less number of frequent itemsets than the state-of-the-art association rule mining algorithms. Thus, it saves time of execution of the algorithm. We run RAN W AR on gene expression and methylation datasets. The genes of the top rules are biologically validated by Gene Ontologies (GOs) and KEGG pathway analyses. Many top ranked rules extracted from RAN W AR that hold poor ranks in traditional Apriori, are highly biologically significant to the related diseases. Finally, the top rules evolved from RAN W AR, that are not in Apriori, are reported. Keywords—Weighted association rule mining, wcs, wcc, Limma, gene-weight, gene-ranking, RAN W AR. I. I NTRODUCTION Knowledge Discovery and Data Mining (KDD) is an interdis- ciplinary domain that mainly focus as on the systematic ways of acquiring interesting rules and patterns from the data. The significant common patterns which are estimated by interesting- ness measures include association rules and classification rules. Association rule mining (ARM) [3], one of the most important data mining techniques is widely utilized for detecting interesting relationships between items. Huge number of rules always creates problem to select top among them. Therefore, the ranking of rules from the biological data is very important area for research. For this, different rule- interestingness measures (viz., support, confidence, lift, convic- tion etc.) were proposed. But, these still generate huge number of frequent itemsets, and thereby these generate huge number of association rules. Thus, lot of time is taken to run these algorithms. In this article, we propose a weighted rule-mining technique (viz., RAN W AR or Rank-based Weighted Associ- ation Rule-Mining) which has been developed using two novel measures rank-based weighted condensed support (say, wcs) and rank-based weighted condensed confidence (say, wcc) measures for extracting rules from the data. Sometime it happens that a lot of rules have same support and same confidence. At this moment, if we need some of them, it is difficult to differentiate among them. Therefore, if we apply the wcs and wcc, we can easily categorize them. The major benefit of RAN W AR is that * Machine Intelligence Unit, Indian Statistical Institute, Kolkata-700108, India. E-mail: chasaurav [email protected] *‡ Department of Computer Science and Engineering, Jadavpur University, Kolkata-700032, India. E-mail: [email protected], [email protected] † Department of Computer Science and Engineering, University of Kalyani, Kalyani, Nadia-741235, India. E-mail: [email protected] it generates much less number of itemsets than the the state- of-the-art association rule mining algorithms for same minimum support value. There is no such ARM method which generates lesser number of frequent itemsets than RAN W AR. Thereby, it takes much less time than the the other algorithms. Another benefit of RAN W AR is that some of the rules which hold very low rank in traditional rule mining algorithms, get good rank in RAN W AR due to the involvement of genes’ weights (w.r.t. their importance) in the proposed measures, and sufficient evidences of biological significance of the genes of the evolved rules. As we know that if the number of genes in data is large, the number of itemsets will be also large, thus, using Limma [2] statistical test, we have just taken into account the top differ- entially expressed (i.e., DE) or differentially methylated (i.e., DM ) genes. Limma is an useful statistical test which performs well for both normally and non-normally distributed data for all types of sample-size (i.e., small, medium, large). Our proposed measures are basically rank-based weighted measures. Therefore, ranking of genes has a significant role here. Limma test provides a rank-wise gene-list according to their p-values from best to worst cases. Thereafter, we assign weight to each item/gene w.r.t. their p-value ranking, and include these into the measures. Therefore, our measures give importance to each item (gene). Our proposed measures (viz., wcs and wcc) are condensed form of the traditional support and confidence measures. Furthermore, two gene expression datasets and two methylation datasets are used to test the performance of RAN W AR. We have made a comparative analysis of it with the traditional Apriori algorithm [1] and other state-of-the-art rule mining algorithms. For valida- tion of the rules, GO terms and KEGG pathways of the genes in the rules are identified. The genes of the evolved rules involving highest number of GOs/pathways are reported for biologically benevolent aspects. Finally, we report many top ranked rules produced by RAN W AR that hold poor ranks in traditional Apriori, but are highly biologically significant to related diseases. The rest of the article is organized as follows. Section II presents literature review. Section III and section IV elaborate the proposed measures, and the proposed ARM method, respectively. The source and description about the dataset are given in section V. Section VI presents the experimental results and discussion, where section VII shows utility of ARM in biology and our novel findings. Finally, Section VIII concludes the article. II. LITERATURE REVIEW ARM [1] is a popular technique to estimate interesting rela- tionships among different items (i.e., genes). Suppose, Itmset = {i 1 ,i 2 , ..., i n } be an itemset (i.e., set of genes) and S = {s 1 ,s 2 , ..., s m } be a set of transactions (samples). Thus, a rule might be described as A ⇒ C, where A, C ⊆ Itmset and A C = φ. Here, A is called as antecedent and C is called as consequent. In ARM, the word “transaction” is closely related to items (genes). For microarray data [3], [7], a transaction signifies a “sample”. In any transaction (sample), many genes may occur together. Some of them are up-regulated, and some are down- regulated and remaining are not differentially expressed (i.e., neither up-regulated nor down-regulated). In case of biological
Transcript of RANWAR: Rank-Based Weighted Association Rule Mining from Gene Expression and Methylation Data
1
RANWAR: Rank-Based Weighted Association RuleMining from Gene Expression and Methylation Data
Saurav Mallik∗, Anirban Mukhopadhyay†, Senior Member, IEEE, and Ujjwal Maulik‡, Senior Member, IEEE
Abstract—Ranking of association rules is currently an interestingtopic in data mining and bioinformatics. The huge number ofevolved rules of items (or, genes) by association rule mining (ARM)algorithms makes confusion to the decision maker. In this article,we propose a weighted rule-mining technique (say,RANWAR orrank-based weighted association rule-mining) to rank the rulesusing two novel rule-interestingness measures, viz., rank-basedweighted condensed support (wcs) and weighted condensed con-fidence (wcc) measures to bypass the problem. These measures arebasically depended on the rank of items (genes). Using the rank,we assign weight to each item.RANWAR generates much lessnumber of frequent itemsets than the state-of-the-art associationrule mining algorithms. Thus, it saves time of execution of thealgorithm. We run RANWAR on gene expression and methylationdatasets. The genes of the top rules are biologically validated byGene Ontologies (GOs) and KEGG pathway analyses. Many topranked rules extracted from RANWAR that hold poor ranks intraditional Apriori, are highly biologically significant t o the relateddiseases. Finally, the top rules evolved fromRANWAR, that arenot in Apriori, are reported.
Keywords—Weighted association rule mining, wcs, wcc, Limma,gene-weight, gene-ranking, RANWAR.
I. I NTRODUCTION
Knowledge Discovery and Data Mining (KDD) is an interdis-ciplinary domain that mainly focus as on the systematic waysof acquiring interesting rules and patterns from the data. Thesignificant common patterns which are estimated by interesting-ness measures include association rules and classificationrules.Association rule mining (ARM) [3], one of the most importantdata mining techniques is widely utilized for detecting interestingrelationships between items.
Huge number of rules always creates problem to select topamong them. Therefore, the ranking of rules from the biologicaldata is very important area for research. For this, different rule-interestingness measures (viz., support, confidence, lift, convic-tion etc.) were proposed. But, these still generate huge numberof frequent itemsets, and thereby these generate huge numberof association rules. Thus, lot of time is taken to run thesealgorithms. In this article, we propose a weighted rule-miningtechnique (viz.,RANWAR or Rank-based Weighted Associ-ation Rule-Mining) which has been developed using two novelmeasures rank-based weighted condensed support (say,wcs) andrank-based weighted condensed confidence (say,wcc) measuresfor extracting rules from the data. Sometime it happens thatalot of rules have same support and same confidence. At thismoment, if we need some of them, it is difficult to differentiateamong them. Therefore, if we apply thewcs andwcc, we caneasily categorize them. The major benefit ofRANWAR is that
∗Machine Intelligence Unit, Indian Statistical Institute,Kolkata-700108, India.E-mail: [email protected]∗‡Department of Computer Science and Engineering, Jadavpur
University, Kolkata-700032, India. E-mail: [email protected],[email protected]†Department of Computer Science and Engineering, University of Kalyani,
Kalyani, Nadia-741235, India. E-mail: [email protected]
it generates much less number of itemsets than the the state-of-the-art association rule mining algorithms for same minimumsupport value. There is no such ARM method which generateslesser number of frequent itemsets thanRANWAR. Thereby,it takes much less time than the the other algorithms. Anotherbenefit ofRANWAR is that some of the rules which hold verylow rank in traditional rule mining algorithms, get good rank inRANWAR due to the involvement of genes’ weights (w.r.t. theirimportance) in the proposed measures, and sufficient evidencesof biological significance of the genes of the evolved rules.
As we know that if the number of genes in data is large, thenumber of itemsets will be also large, thus, using Limma [2]statistical test, we have just taken into account the top differ-entially expressed (i.e.,DE) or differentially methylated (i.e.,DM ) genes. Limma is an useful statistical test which performswell for both normally and non-normally distributed data for alltypes of sample-size (i.e., small, medium, large). Our proposedmeasures are basically rank-based weighted measures. Therefore,ranking of genes has a significant role here. Limma test providesa rank-wise gene-list according to their p-values from besttoworst cases. Thereafter, we assign weight to each item/genew.r.t. their p-value ranking, and include these into the measures.Therefore, our measures give importance to each item (gene).Our proposed measures (viz.,wcs andwcc) are condensed formof the traditional support and confidence measures. Furthermore,two gene expression datasets and two methylation datasets areused to test the performance ofRANWAR. We have made acomparative analysis of it with the traditional Apriori algorithm[1] and other state-of-the-art rule mining algorithms. Forvalida-tion of the rules, GO terms and KEGG pathways of the genes inthe rules are identified. The genes of the evolved rules involvinghighest number of GOs/pathways are reported for biologicallybenevolent aspects. Finally, we report many top ranked rulesproduced byRANWAR that hold poor ranks in traditionalApriori, but are highly biologically significant to relateddiseases.
The rest of the article is organized as follows. Section IIpresents literature review. Section III and section IV elaborate theproposed measures, and the proposed ARM method, respectively.The source and description about the dataset are given in sectionV. Section VI presents the experimental results and discussion,where section VII shows utility of ARM in biology and our novelfindings. Finally, Section VIII concludes the article.
II. L ITERATURE REVIEW
ARM [1] is a popular technique to estimate interesting rela-tionships among different items (i.e., genes). Suppose,Itmset ={i1, i2, ..., in} be an itemset (i.e., set of genes) andS ={s1, s2, ..., sm} be a set of transactions (samples). Thus, a rulemight be described asA ⇒ C, whereA,C ⊆ Itmset andA⋂
C = φ. Here,A is called as antecedent andC is called asconsequent. In ARM, the word “transaction” is closely related toitems (genes). For microarray data [3], [7], a transaction signifiesa “sample”. In any transaction (sample), many genes may occurtogether. Some of them are up-regulated, and some are down-regulated and remaining are not differentially expressed (i.e.,neither up-regulated nor down-regulated). In case of biological
Anirban Mukhopadhyay
Text Box
Pre-publication copy
2
transaction, suppose,{gene1+, gene2−, gene3nde ⇒ gene4+}is an association rule which states that if gene1 is up-regulated(denoted by ‘+’), gene2 is down-regulated (denoted by ‘-’),andgene3nde is non-differentially expressed (depicted as ‘nde’)simultaneously, then gene4 will be up-regulated. Therefore, thosefour genes must occur in some of transactions simultaneously.For real life example of a transaction, someone went to multiplexand purchased a gold-chain, a bracelet and a diamond-ring ata time. The support of an itemset can be defined as the totalnumber of transactions in which all items of the itemset appearsimultaneously. The itemset is frequent when its support isgreater than any threshold value (i.e., minimum support). Theconfidence of the rule is defined as ratio of support of the itemsetto the support of antecedent.
Apriori [1] is a basic algorithm for learning association rulesto control on databases that have transactions. Apriori utilizesa “bottom-up” approach, where frequent subsets are extendedone item at a time to generate each candidate and groups of thecandidates are tested against the data. The algorithm terminatesif there is no further successful extensions to be identified. Theoutput of Apriori is actually the sets of rules that generatetheoccurrence of items in the dataset. Apriori follows breadth-first search to count the candidate itemsets. Apriori producescandidate itemsets of lengthk from itemsets of lengthk − 1.Thereafter, it eliminates the candidates having an infrequentsub-pattern. The candidate set contains all frequent-itemsets.It searches the transaction database to discover most frequentitemsets from the candidates.
By further investigations, different limitations have been foundin the traditional Apriori algorithm, like generation of hugenumber of frequent itemsets, high elapsed time, multiple-scanproblem, load-imbalance problem, importing same importanceto each item etc. For reducing those shortcomings, differentenhancements have been performed on the original Apriorialgorithm (viz., Orlando et al. in 2001 [14], Pavon et al. in 2006[11], Yu et al. in 2008 [16], Ogzu et al. in 2012 [13] etc.). Besidesthat, many other ARM methodologies have been proposed (e.g.,Tao et al. in 2003 [19]). Tao et al. used weighted ARM techniquein efficient way. But, very less improvement on reducing elapsedtime has been done through Tao et al. Therefore, further newmethodologies are proposed (Yun et al. in 2006 [15], Hong etal. in 2008, Sun et al. in 2008 [17], Ahmed et al. in 2008 [18]).But, it has been noticed that it is very difficult to reduce allsuchlimitations simultaneously. Therefore, we have mainly focusedhow to reduce elapsed time for rule mining in such way thatonly top ranked items and their related highly significant ruleswill present in result for large transaction database. In additionto that, we do not consider some of the transactions which areredundant for calculating our proposed weighted support. It isdescribed in next section.
III. PROPOSED MEASURES
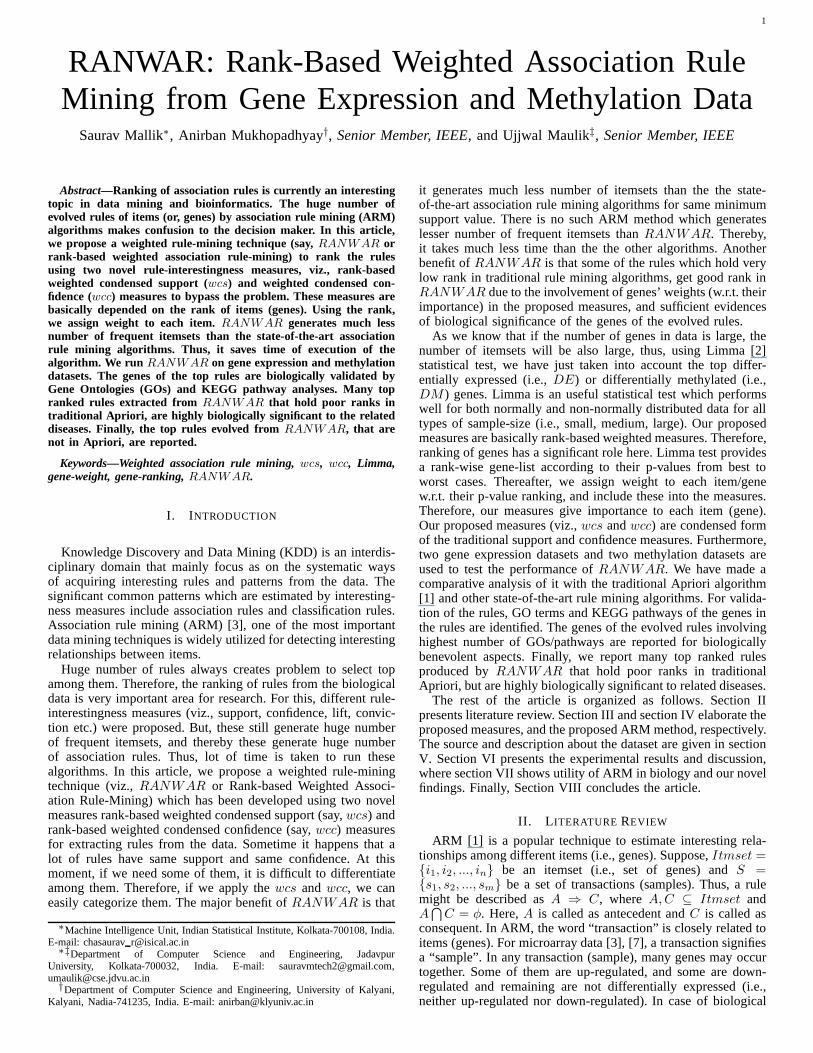
In this article, we propose two novel rule-interestingnessmeasures, viz., rank-basedweighted condensed support(wcs)and weighted condensed confidence(wcc) on basis of indepen-dency of the genes of a microarray dataset [3], [4] instatisticalscenario. Suppose, input boolean matrixBIT is of sizem× n,wherem denotes #sample andn denotes #gene. The assignedweights to genes are assumed to beW = {w1, w2, ..., wn}. Aweightwi is attached to each genegi (i.e., i = 1, 2, ..., n). Thisdenotes a pair of(gi, wi) which is stated as a weighted gene. Theweight of thegi gene in thek-th sample/transaction is denotedby wki, where1 ≤ k ≤ m. If the genegi presents in thek-thtransaction (sk), then value ofwki will be the weight of the gene
TABLE I: An example of calculating the proposedwcs andwcc.Genes (Items)−→
︷ ︸︸ ︷
g1 g2 g3 g4 g5Item weight 1.0 0.2 0.8 0.6 0.4
(wi)
Genes (Items)−→
Tran
sact
ions
→
︷ ︸︸ ︷
g1 g2 g3 g4 g5s1 1 1 0 1 1s2 0 0 1 1 0s3 0 1 1 1 1s4 1 1 0 0 1
Suppose,Z is whole itemset of a rule,{g1, g2 ⇒ g5}; Here, antecedent,A = {g1, g2};consequent,C = {g5}; andZ = A ∪ C = {g1, g2, g5}; andSo,W1(Z) = w11 ∗ w12 ∗ w15 = w1 ∗ w2 ∗ w5 = 1.00 ∗ 0.2 ∗ 0.4 = 0.08;W2(Z) = w21 ∗ w22 ∗ w25 = 0 ∗ 0 ∗ 0 = 0;W3(Z) = w31 ∗ w32 ∗ w35 = 0 ∗ w2 ∗ w5 = 0 ∗ 0.2 ∗ 0.4 = 0;W4(Z) = w41 ∗ w42 ∗ w45 = w1 ∗ w2 ∗ w5 = 1.00 ∗ 0.2 ∗ 0.4 = 0.08;
m′(Z) = max{4∑
k=1BITk1,
4∑
k=1BITk2,
4∑
k=1BITk5}
= max{(1 + 0 + 0 + 1), (1 + 0 + 1 + 1), (1 + 0 + 1 + 1)}= max{2, 3, 3} = 3
wcs(Z) =W1(Z)+W2(Z)+W3(Z)+W4(Z)
m′(Z)= 0.16
3= 0.053;
Similarly, W1(A) = w11 ∗ w12 = w1 ∗ w2 = 1.00 ∗ 0.2 = 0.2;W2(A) = w21 ∗ w22 = 0 ∗ 0 = 0; W3(A) = w31 ∗ w32 = 0 ∗ w2 = 0 ∗ 0.2 = 0;W4(A) = w41 ∗ w42 = w1 ∗ w2 = 1.00 ∗ 0.2 = 0.2;
m′(A) = max{4∑
k=1BITk1,
4∑
k=1BITk2}
= max{(1 + 0 + 0 + 1), (1 + 0 + 1 + 1)}= max{2, 3} = 3
wcs(A) =W1(A)+W2(A)+W3(A)+W4(A)
m′(A)= 0.4
3= 0.13;
Therefore,wcc(A ⇒ C) =wcs(Z)wcs(A)
= 0.0530.13
= 0.41;
gi, otherwise, value ofwki becomes zero. In other words,
wki =
{
wi, if gi ∈ sk.0, otherwise.
For microarray dataset, differential expression values (t-statisticalvalues, or corresponding p-value in any statistical test) of genesare calculated on the assumption of independency of genes [7].If all the genes are dependent, then p-values (specified probabili-ties) of the genes in the test will be invalid [7]. Therefore,on thebasis of the independency of the genes of a microarray dataset,we have determined itemset-transaction weight. The weightofa gene is calculated through p-value ranking of the gene. Thus,itemset-transaction weight can be defined as multiplication ofweights of all the genes (items) of the itemset in a transaction(sample) for a microarray dataset. It is estimated as:
Wk(Z) =
Q∏
(∀giǫZ,Q=|Z|)i=1
wki, (1)
whereWk(Z) denotes itemset-transaction weight of itemsetZfor k-th transaction,wki refers to the weight of genegi for k-thtransaction,
∏
denotes multiplicative operator,Q refers to thetotal number of genes in the itemsetZ.
The proposed support of the itemset (i.e.,wcs(Z)) is definedin two folds. If the size of itemset is one, then thewcs(Z) isthe ratio of summation of all the itemset-transaction weights ofthe itemset (summation of allWk(Z), ∀k) to the total numberof transactions/samples (m) in the database. But if the size ofitemset is greater than one, then thewcs(Z) is the ratio ofsummation of all the itemset-transaction weights of the itemset(summation of allWk(Z), ∀k) to the frequency of the highestfrequent gene/item of the itemset (m′(Z)) instead of consideringm. Thus,wcs is stated as thecondensed formof the traditionalsupport. The proposed support can be stated as:
wcs(Z) =
m∑
k=1
Wk(Z)
m′(Z) , if |Z| > 1
m∑
k=1
Wk(Z)
m, if |Z| = 1
(2)
3
wherem′(Z) is described as follows:
m′(Z) = max
(∀giǫZ,Q=|Z|)
{ m∑
k=1
BITk1,
m∑
k=1
BITk2, ...,
m∑
k=1
BITkQ
}
, (3)
whereQ denotes the total number of genes in the itemsetZ(|Z| > 1), andBITki denotes boolean value of the genegi fork-th sample/transaction (here,i = 1, 2, ..., Q). Here, the booleansub-matrix of the itemsetZ having size|m×Q| is considered.
The proposed confidence of a rule (viz.,wcc(A −→ C) isdefined as the ratio of the support of the itemset (wcs(Z), Z =A ∪ C) to the support of the antecedent (wcs(A)).
wcc(A −→ C) =wcs(A ∪ C)
wcs(A)=
wcs(Z)
wcs(A). (4)
It should be mentioned that for rule mining using thewcsandwcc measures, we have to set two thresholds, one forwcs,and otherwcc. It is well-known that support is the property of anitemset, and confidence is the property of a rule. Therefore,here,the above statement signifies that ifwcs of an itemset is greaterthan equal to a minimum support threshold (say,min wsupp),then the itemset is frequent. If the itemset is frequent, then wccvalues of rules made from the itemset need to validate. Ifwcc ofany rule is greater than equal to a minimum confidence threshold(say,min wconf ), then the rule can be selected.
IV. PROPOSEDRULE M INING APPROACH
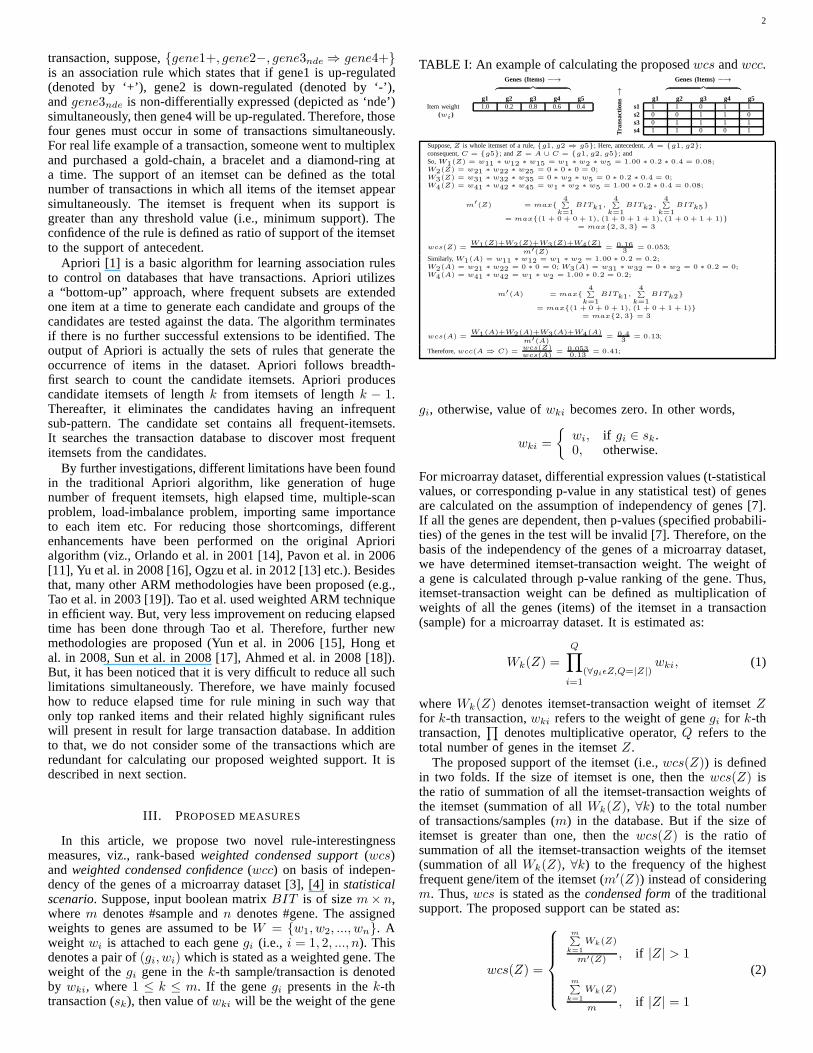
In this article, we have proposed a rank-based weightedassociation rule mining (RANWAR) using the two proposedrule-interestingness measures (wcs andwcc). The steps of themethodology how it can be applied on microarray/beadchip data[3], [7] to extract association rules, are described below:
A. Determination and ranking of differentiallyexpressed/methylated genes
Microarray technique [7] is a useful tool for measuring geneexpression data across different experimental and controlsam-ples. In microarray data, it is mandatory to use some pre-filteringprocess like removal of genes having low variance. In fact, due tothe low variance of the gene, sometime lower p-value is producedwhich seems to be significant, but actually it is insignificant.Therefore, it is needed to check the overall variance of the dataaccording for each gene and filter out the genes having very lowvariance. Here, we have used a matlab function “genevarfilter” bywhich some user-defined percentile (say, 5 or 10 or 20 percentile)of the genes having low variance can be eliminated from thegene list. The filtered data should be normalized gene-wiseas normalization converts the data from different scales into acommon scale. There are many normalization methods available.In our experiment, we have used zero-mean normalization [7]which converts the data into such a form where mean of eachgene becomes zero and standard deviation becomes one. Thezero-mean normalization can be formulated as:xnorm
ij =xij−µ
σ,
where µ and σ refer to mean and standard deviation of theexpression/methylation data of a genei before normalizationrespectively; andxij andxnorm
ij denote the value ofi-th gene atj-th sample before and after normalization, respectively.
For identification of DE/DM genes, a suitable non-parametrictest should be applied correctly. Here, we have chosen Limma[2] to do so as it is performed well for normal and non-normalboth distributions for all sizes of data (small, medium or big).The moderated t-statistic in Limma can be demonstrated as:
t̃g =1
√
1n1
+ 1n2
β̂g
s̃g, (5)
Microarray
Dataset
Pre-filtering genes
Normalization
Use Limma to
identify DE genes
Gene ranking w.r.t.
their p-values
Assigning weight to
each gene w.r.t. its
ranking
Data discretizationUse 'RANWAR'
algorithm to extract
rules
Comparative performance
between 'RANWAR' and
other existing algorithms
Evaluation of evolved rules:
GO, pathway analysis
Fig. 1: The proposed rule mining approach from biological data.
where samplesizen = n1 + n2, β̂g and s̃2g denote the contrastestimator and posterior sample variance for the geneg respec-tively. The statistic for calculating contrast estimator for genegis : β̂g|σ
2g ∼ N(βg, σ
2g) (here,N is normal distribution); and the
statistic for estimating posterior sample variance for thegeneg
is: s̃2g =d0s
20+dgs
2g
d0+dg(here,d0 (< ∞) and s20 refer to the prior
degrees of freedom and variance respectively, anddg (> 0) ands2g denote the experimental degrees of freedom and the samplevariance of a particular geneg, respectively).
However, from the resulting value of the t-statistic, corre-sponding p-value is calculated from t-table or cumulative distri-bution function (cdf) [7]. If p-value of a gene is less than 0.05,then the gene is calledDE/DM , otherwise not. Thereafter, theidentified genes are ranked w.r.t. their p-values.
B. Assigning weight to each gene
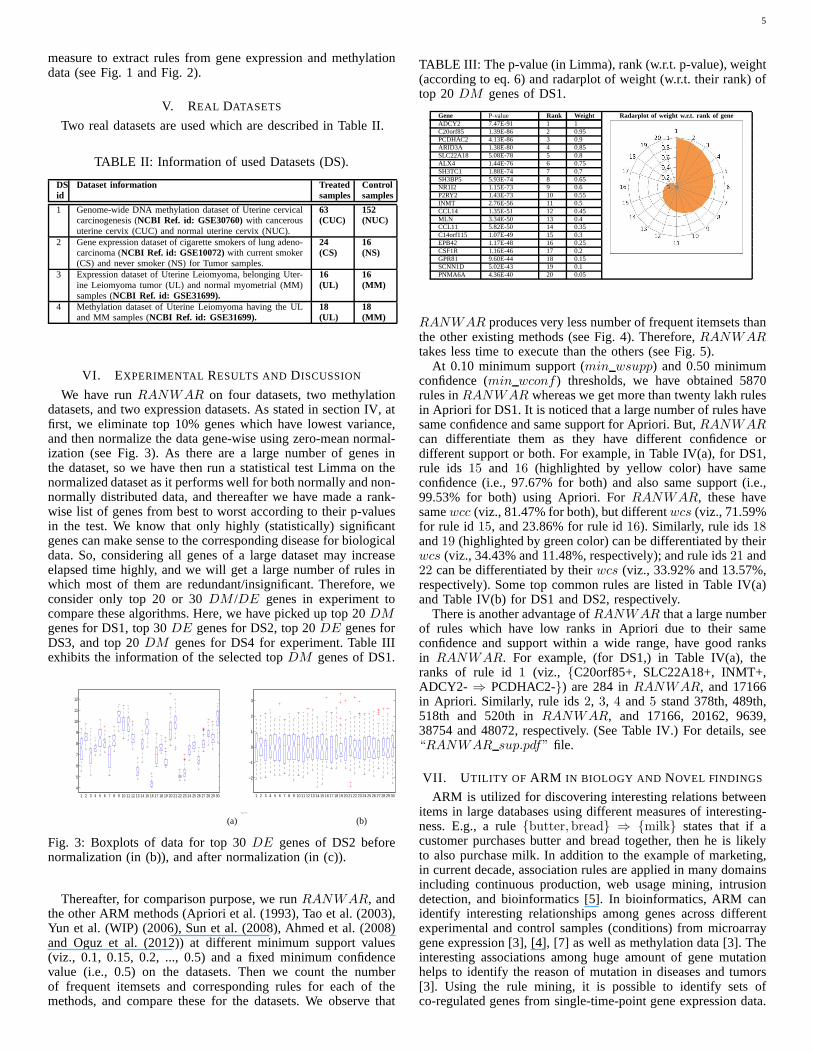
In our approach, all the genes have not same importance. Thatis why, some weight is assigned to each gene w.r.t. their p-valueranking mentioned earlier. Here, the weights of the genes arecalculated in such a way that difference between the weightsofany two consecutive ranked genes are same, and the weight ofthe first ranked gene is always 1 (see Table III for example). Theranges of weight lie in between 0 and 1. Suppose,n is number ofgenes. Thus, the weight of each gene (denoted bywi, 1 ≤ i ≤ n)is estimated from a function of the above rank (denoted byri,1 ≤ i ≤ n) and number of genes as described below:
wi =1
n∗ (n− (ri − 1)). (6)
C. Data Discretization
Suppose,I[r, c] is input data matrix. Here,r denotes genes,and c denotes samples. First of all, the matrixI is transposed.Suppose,IT be the resulting matrix. Now, discretization of theinput data matrix is mandatory for applying association rulemining. For discretization purpose, we have utilized standard k-means clustering algorithm. But, before using k-means, we havechosen initial seed values for k-means using [6]. For doing this,at first, we choose first cluster centercc1 uniformly at randomfrom all the data points (χ). Thereafter, for each data-pointy, wecalculate the distance (Dy) between the data-point and nearestcenter which is already chosen. After that, choose the next clusterccj by takingccj = y′ ∈ χ where the corresponding probabilityis D(y′)2
∑
y∈χ
D(y)2 . Repeat the last step until we selectk number of
cluster centers. In this way, the initial centers are chosenthatare used for the standard k-means clustering. Thereafter, wehave run k-means clustering algorithm sample-wise (i.e., row-wise) on each row ofIT where the number of clusters is 2
4
Sam
ples
−→
DE Genes−→
(Dis
cret
izat
ion)︷ ︸︸ ︷
g1 g2 g3 ...︷
︸︸
︷ str1 11.51 2.56 12.68 ...str2 2.53 11.68 10.68 ...str3 10.36 1.68 10.32 .... . . . ... =⇒snr1 10.52 11.89 3.56 ...snr2 3.67 10.42 12.34 ...snr3 12.67 11.45 3.32 .... . . . ...
(a)
DE Genesg1 g2 g3 ...
str1 1 0 1 ...str2 0 1 1 ...str3 1 0 1 .... . . . ...snr1 1 1 0 ...snr2 0 1 1 ...snr3 1 1 0 .... . . . ...
•‘1’(red color)≡ DEup•‘0’(green color)≡ DEdown
(b)
(Post-discretization)⇓
Domain of DEup Property Domain of DEdown Property︷ ︸︸ ︷ ︷ ︸︸ ︷
g1+ g2+ g3+ ... g1- g2- g3- ...
Dis
ease
d
︷︸︸
︷︷
︸︸
︷ str1 1 0 1 ... 0 1 0 ...str2 0 1 1 ... 1 0 0 ...str3 1 0 1 ... 0 1 0 ...
. . . . ... . . . ...
Nor
mal snr1 1 1 0 ... 0 0 1 ...
snr2 0 1 1 ... 1 0 0 ...snr3 1 1 0 ... 0 0 1 ...
. . . . ... . . . ...•‘1’(red color)≡ presence ofDEup •‘1’(green color)≡ presence ofDEdown
•‘0’(no color)≡ ((∼ DEup)|(∼ DEdown))
(c)
(Apply RANWAR) ⇐=
Frequent Itemsets: {g1+, g2-, g3+} {g1+, g5+, g6-} {g3+, g8-, g10+}
⇐=
⇐=
⇐=
Rules: {g1+, g2-⇒ g3+} {g1+, g5+⇒ g6-} {g3+, g8-⇒ g10+}{g1+ ⇒ g2-, g3+} {g1+ ⇒ g5+, g6-} {g3+ ⇒ g8-, g10+}
(Ranking of rules) ⇐=
Identification of top rules
(d)
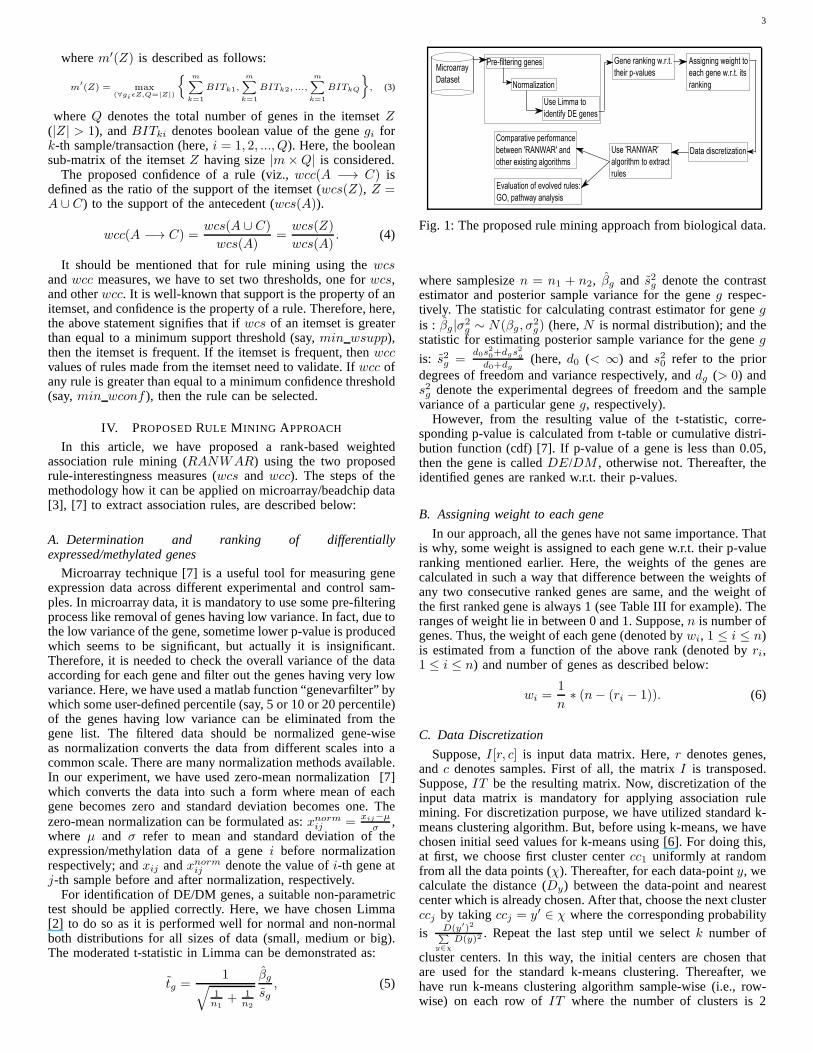
Fig. 2: An example of post-discretization usingRANWAR,where ‘+ and ‘- denote up-regulation and down-regulation aredenoted by ‘1’ and ‘0’, respectively. Here,str and snr denoteexperimental/diseased and normal samples, respectively.
and the distance metric is the Euclidean distance. The clusterhaving higher centroid value is the cluster of up-regulated/hyper-methylated genes and the other cluster is the cluster of down-regulated/hypo-methylated genes.
According toIT matrix, ‘1’(red color) denotes up-regulatedgene (DEup) and ‘0’(green color) denotes down-regulated gene(DEdown) (see Fig. 2(b)). As in ARM,‘1’ and ‘0’ signifypresence and absence of some item (gene) in some transaction(sample), respectively for binary data, so here we can show onlythe presence ofDEup by using ‘1’, and presence ofDEdown byusing ‘0’. But, we need to represent three categories of items,i.e., (i) DEup, (ii) DEdown and (iii) ∼ DEup| ∼ DEdown usingbinary digits (‘1’ and ‘0’). Therefore, the number of columns oftheIT is then set twice of the original (see Fig. 2(c)). Let,BITbe the resulting boolean matrix. In this case, for the first-half,‘1’(red color) denotes presence of up-regulated gene (DEup),and ‘0’(no color) represents absence of up-regulated gene (∼DEup). Similarly, for the second-half, ‘1’(green color) denotespresence of down-regulated gene (DEdown), and ‘0’(no color)represents absence of down-regulated gene (∼ DEdown). Ac-cording to Fig. 2(c),str andsnr denote experimental/treated andnormal/control samples respectively, where ‘+’ and ‘-’ denoteup-regulation and down-regulation, respectively. Here, for thestr1 sample, gene1g1 and gene3g3 are upregulated, and gene2g2) is downregulated. Therefore, the cellsBIT (str1, g1+)=1,BIT (str1, g3+)=1 and BIT (str1, g2−)=1. Thus, automati-cally, the cells BIT (str1, g1−)=0, BIT (str1, g3−)=0 andBIT (str1, g2+)=0. The similar approach is applicable for theother samples/rows of the matrixBIT . If the genes becomehyper-methylated (DMhyper) and hypo-methylated (DMhypo)instead of up-regulated (DEup) and down-regulated (DEdown),respectively, the sub-procedure for post-discretizationis samefor the methylation data. Fig. 2 shows an example of post-
discretization usingRANWAR.
Algorithm 1 RANWARInput: Data matrixD (rows=genes, columns=samples), original gene-listA1 according toD, rank-wise gene-listA2 (according to p-values of genes by Limma), flag of sortingthe evolved rulessortF lag (w.r.t. either wcs or wcc), minimum support thresholdmin wsupp, minimum confidence thresholdmin wconf .Output: Set of association rulesRules, Rule-supportRuleSupp, Rule-confidenceRuleConf .1: procedure RANWAR2: Normalize the data-matrixD using zero-mean normalization.3: Calculate rank of genes (i.e.,rankk(:)) according to original gene listA1.4: Assign weightswt(:) to all genes according to their ranksrankk(:).5: Transpose the normalized data-matrix.6: Choose initial seed values for using k-means clustering. Thereafter, discretize the
transposed data-matrix applying both standard k-means clustering sample-wise,where the number of clusters is taken as 2 and distance metricis the Euclidiandistance. The cluster having higher centroid value is the group of up-regulated genesand the other cluster is the group of down-regulated genes.
7: Apply post-discretization technique.8: Initialize k = 1.9: Find the frequent 1-itemsets.
Frequent itemset,FIk = {i|i ∈ A1 ∧ wcs(i) ≥ min wsupp}.10: repeat11: k=k+1.12: Generate candidate itemsets,CIk from FIk−1 itemsets.13: for each candidate itemset,c ∈ CIk do14: Calculatewcs(c) for each candidate itemset,c.15: if wcs(c) >= min wsupp then16: FIk ← [FIk; c].17: Generate rules,rule(:) from the frequent itemset,c.18: Determinewcc(:) for eachrule(:).19: for each evolved rule,r ∈ rule(:) do20: if wcc(r) >= min wconf then21: Store ther in the resulting rule-listRules with its wcs andwcc;
Rules← r, RuleSupp ← wcs(r) andRuleConf ← wcc(r).22: end if23: end for24: end if25: end for26: until (FIk = ∅)27: end procedure
D. Identification of frequent itemset and rule mining
After the post-discretization technique as stated in the lastsubsection, we need to identify frequent itemsets. For this, atfirst, we evaluatewcs of the 1-itemsets, and then identify thefrequent singleton itemsets (i.e.,wcs of them are greater thanequal tomin wsupp). Thereafter, similarly, we calculate theirsupersets 2-itemsets and then determine frequent 2-itemsets.After that, rules are extracted from the frequent 2-itemsets.Then, wcc of each rule is computed. The rules havingwccgreater thanmin wconf value, are selected for resulting listof rules. Then, we determine their supersets 3-itemsets andthendetermine frequent 3-itemsets, and then extract significant rulesfrom these, and so on. The algorithm terminates if there is nofurther successful extensions of frequent itemsets to be identified.Finally, the evolved rules are ranked w.r.t.wcs or wcc. Fordetails, see Algorithm 1. Hence, theRANWAR algorithm isbasically updated version of Apriori algorithm with the weightedmeasures (i.e.,wcs andwcc).
The performance ofRANWAR algorithm is compared withtraditional Apriori algorithm and other existing rule miningtechniques. The number of frequent itemsets are comparedbetweenRANWAR, and the other state-of-the-art rule miningalgorithms at different minimum support values. For validationof the rules, GO terms and KEGG pathways of the genes inthe rules are identified. The genes of the evolved rules involvinghighest number of GOs/pathways are reported for biologicallybenevolent aspects. Finally, we report many top ranked rulesproduced by RANWAR that hold poor ranks in traditionalApriori, but are highly biologically significant to relateddiseases.Finally, a flowchart is provided to describe how to apply the
5
measure to extract rules from gene expression and methylationdata (see Fig. 1 and Fig. 2).
V. REAL DATASETS
Two real datasets are used which are described in Table II.
TABLE II: Information of used Datasets (DS).
DS Dataset information Treated Controlid samples samples
1 Genome-wide DNA methylation dataset of Uterine cervicalcarcinogenesis (NCBI Ref. id: GSE30760)with cancerousuterine cervix (CUC) and normal uterine cervix (NUC).
63(CUC)
152(NUC)
2 Gene expression dataset of cigarette smokers of lung adeno-carcinoma (NCBI Ref. id: GSE10072)with current smoker(CS) and never smoker (NS) for Tumor samples.
24(CS)
16(NS)
3 Expression dataset of Uterine Leiomyoma, belonging Uter-ine Leiomyoma tumor (UL) and normal myometrial (MM)samples (NCBI Ref. id: GSE31699).
16(UL)
16(MM)
4 Methylation dataset of Uterine Leiomyoma having the ULand MM samples (NCBI Ref. id: GSE31699).
18(UL)
18(MM)
VI. EXPERIMENTAL RESULTS AND DISCUSSION
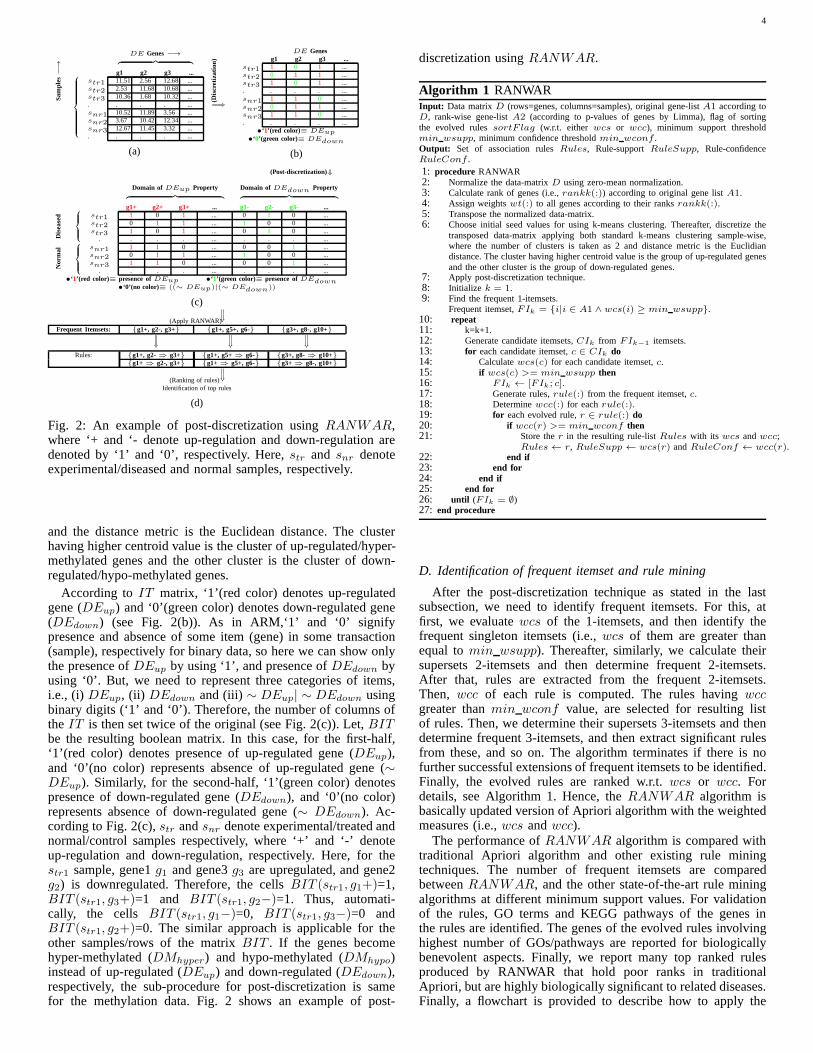
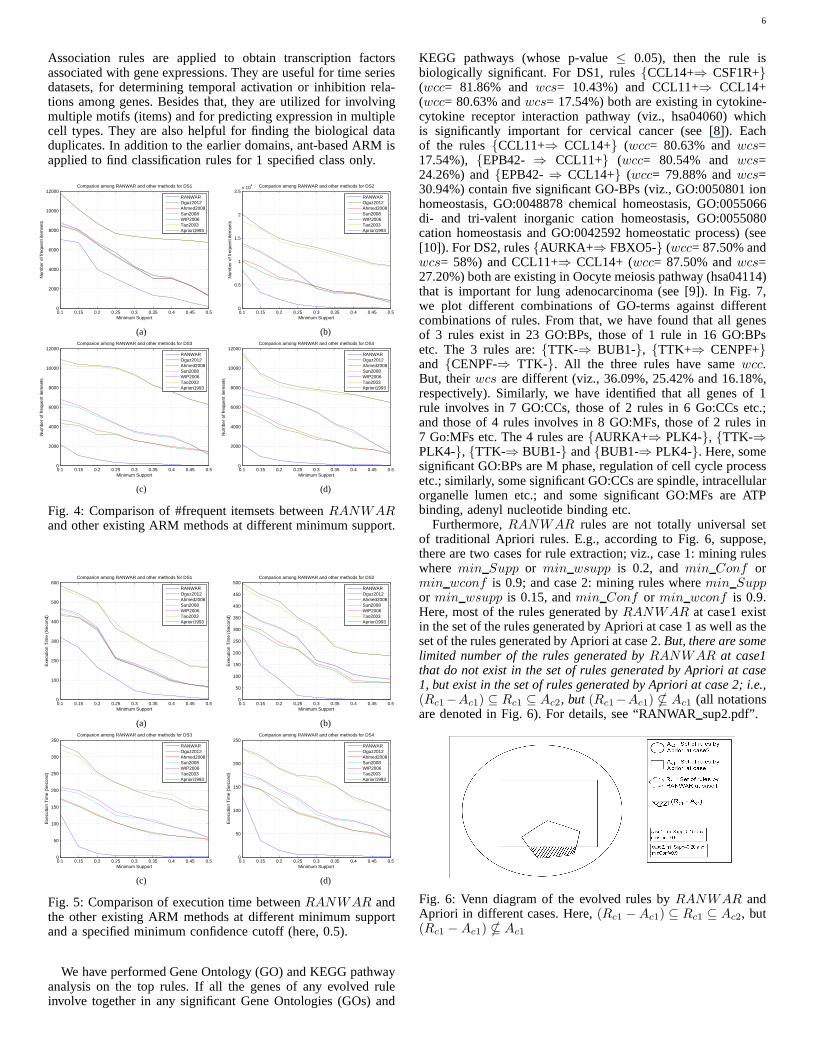
We have runRANWAR on four datasets, two methylationdatasets, and two expression datasets. As stated in sectionIV, atfirst, we eliminate top 10% genes which have lowest variance,and then normalize the data gene-wise using zero-mean normal-ization (see Fig. 3). As there are a large number of genes inthe dataset, so we have then run a statistical test Limma on thenormalized dataset as it performs well for both normally andnon-normally distributed data, and thereafter we have made a rank-wise list of genes from best to worst according to their p-valuesin the test. We know that only highly (statistically) significantgenes can make sense to the corresponding disease for biologicaldata. So, considering all genes of a large dataset may increaseelapsed time highly, and we will get a large number of rules inwhich most of them are redundant/insignificant. Therefore,weconsider only top 20 or 30DM /DE genes in experiment tocompare these algorithms. Here, we have picked up top 20DMgenes for DS1, top 30DE genes for DS2, top 20DE genes forDS3, and top 20DM genes for DS4 for experiment. Table IIIexhibits the information of the selected topDM genes of DS1.
4
5
6
7
8
9
10
11
12
1 2 3 4 5 6 7 8 9 10 11 12 13 14 15 16 17 18 19 20 21 22 23 24 25 26 27 28 29 30
&
−2
−1
0
1
2
3
1 2 3 4 5 6 7 8 9 10 11 12 13 14 15 16 17 18 19 20 21 22 23 24 25 26 27 28 29 30
(a) (b)
Fig. 3: Boxplots of data for top 30DE genes of DS2 beforenormalization (in (b)), and after normalization (in (c)).
Thereafter, for comparison purpose, we runRANWAR, andthe other ARM methods (Apriori et al. (1993), Tao et al. (2003),Yun et al. (WIP) (2006), Sun et al. (2008), Ahmed et al. (2008)and Oguz et al. (2012)) at different minimum support values(viz., 0.1, 0.15, 0.2, ..., 0.5) and a fixed minimum confidencevalue (i.e., 0.5) on the datasets. Then we count the numberof frequent itemsets and corresponding rules for each of themethods, and compare these for the datasets. We observe that
TABLE III: The p-value (in Limma), rank (w.r.t. p-value), weight(according to eq. 6) and radarplot of weight (w.r.t. their rank) oftop 20DM genes of DS1.
Gene P-value Rank Weight Radarplot of weight w.r.t. rank of geneADCY2 7.47E-91 1 1C20orf85 1.39E-86 2 0.95PCDHAC2 4.13E-86 3 0.9ARID3A 1.38E-80 4 0.85SLC22A18 5.08E-78 5 0.8ALX4 1.44E-76 6 0.75SH3TC1 1.88E-74 7 0.7SH3BP5 5.93E-74 8 0.65NR1I2 1.15E-73 9 0.6P2RY2 1.43E-73 10 0.55INMT 2.76E-56 11 0.5CCL14 1.35E-51 12 0.45MLN 3.34E-50 13 0.4CCL11 5.82E-50 14 0.35C14orf115 1.07E-49 15 0.3EPB42 1.17E-48 16 0.25CSF1R 1.16E-46 17 0.2GPR81 9.60E-44 18 0.15SCNN1D 5.02E-43 19 0.1PNMA6A 4.36E-40 20 0.05
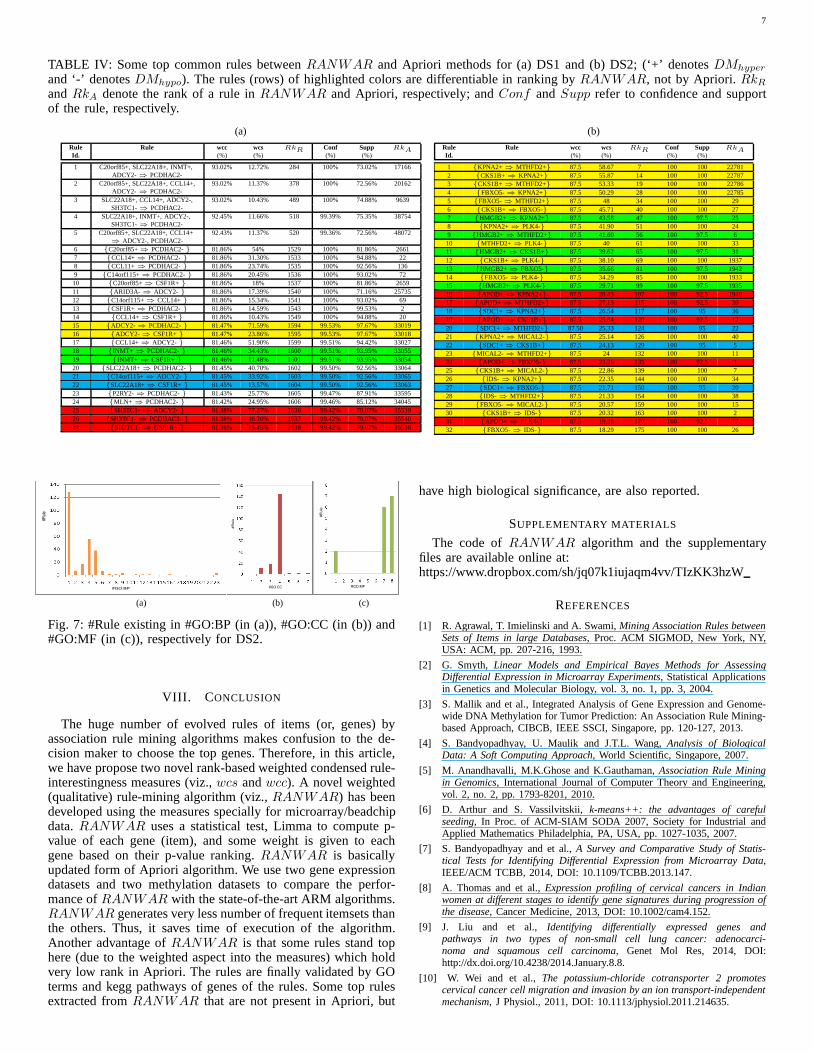
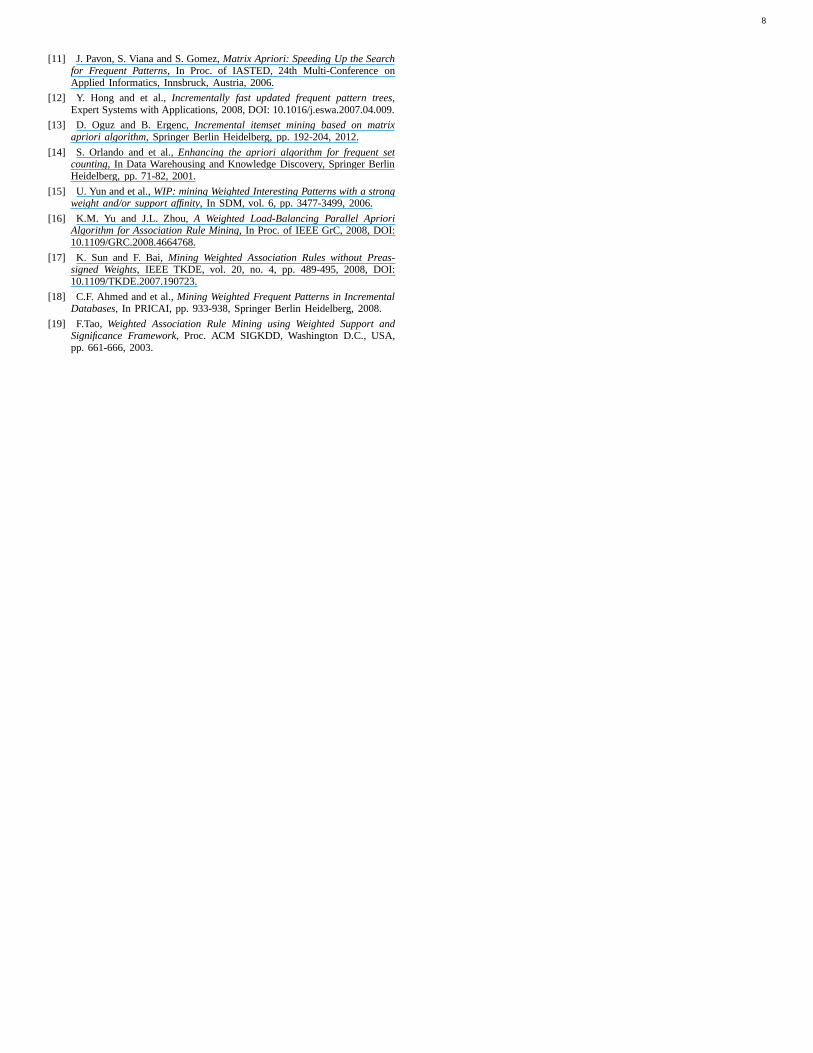
RANWAR produces very less number of frequent itemsets thanthe other existing methods (see Fig. 4). Therefore,RANWARtakes less time to execute than the others (see Fig. 5).
At 0.10 minimum support (min wsupp) and 0.50 minimumconfidence (min wconf ) thresholds, we have obtained 5870rules inRANWAR whereas we get more than twenty lakh rulesin Apriori for DS1. It is noticed that a large number of rules havesame confidence and same support for Apriori. But,RANWARcan differentiate them as they have different confidence ordifferent support or both. For example, in Table IV(a), for DS1,rule ids 15 and 16 (highlighted by yellow color) have sameconfidence (i.e., 97.67% for both) and also same support (i.e.,99.53% for both) using Apriori. ForRANWAR, these havesamewcc (viz., 81.47% for both), but differentwcs (viz., 71.59%for rule id 15, and 23.86% for rule id16). Similarly, rule ids18and19 (highlighted by green color) can be differentiated by theirwcs (viz., 34.43% and 11.48%, respectively); and rule ids21 and22 can be differentiated by theirwcs (viz., 33.92% and 13.57%,respectively). Some top common rules are listed in Table IV(a)and Table IV(b) for DS1 and DS2, respectively.
There is another advantage ofRANWAR that a large numberof rules which have low ranks in Apriori due to their sameconfidence and support within a wide range, have good ranksin RANWAR. For example, (for DS1,) in Table IV(a), theranks of rule id 1 (viz., {C20orf85+, SLC22A18+, INMT+,ADCY2- ⇒ PCDHAC2-}) are 284 inRANWAR, and 17166in Apriori. Similarly, rule ids2, 3, 4 and5 stand 378th, 489th,518th and 520th inRANWAR, and 17166, 20162, 9639,38754 and 48072, respectively. (See Table IV.) For details,see“RANWAR sup.pdf” file.
VII. U TILITY OF ARM IN BIOLOGY AND NOVEL FINDINGS
ARM is utilized for discovering interesting relations betweenitems in large databases using different measures of interesting-ness. E.g., a rule{butter, bread} ⇒ {milk} states that if acustomer purchases butter and bread together, then he is likelyto also purchase milk. In addition to the example of marketing,in current decade, association rules are applied in many domainsincluding continuous production, web usage mining, intrusiondetection, and bioinformatics [5]. In bioinformatics, ARMcanidentify interesting relationships among genes across differentexperimental and control samples (conditions) from microarraygene expression [3], [4], [7] as well as methylation data [3]. Theinteresting associations among huge amount of gene mutationhelps to identify the reason of mutation in diseases and tumors[3]. Using the rule mining, it is possible to identify sets ofco-regulated genes from single-time-point gene expression data.
6
Association rules are applied to obtain transcription factorsassociated with gene expressions. They are useful for time seriesdatasets, for determining temporal activation or inhibition rela-tions among genes. Besides that, they are utilized for involvingmultiple motifs (items) and for predicting expression in multiplecell types. They are also helpful for finding the biological dataduplicates. In addition to the earlier domains, ant-based ARM isapplied to find classification rules for 1 specified class only.
0.1 0.15 0.2 0.25 0.3 0.35 0.4 0.45 0.50
2000
4000
6000
8000
10000
12000Comparion among RANWAR and other methods for DS1
Minimum Support
Num
ber
of fr
eque
nt it
emse
ts
RANWAROguz2012Ahmed2008Sun2008WIP2006Tao2003Apriori1993
0.1 0.15 0.2 0.25 0.3 0.35 0.4 0.45 0.50
0.5
1
1.5
2
2.5x 10
4 Comparion among RANWAR and other methods for DS2
Minimum Support
Num
ber
of fr
eque
nt it
emse
ts
RANWAROguz2012Ahmed2008Sun2008WIP2006Tao2003Apriori1993
(a) (b)
0.1 0.15 0.2 0.25 0.3 0.35 0.4 0.45 0.50
2000
4000
6000
8000
10000
12000Comparion among RANWAR and other methods for DS3
Minimum Support
Num
ber
of fr
eque
nt it
emse
ts
RANWAROguz2012Ahmed2008Sun2008WIP2006Tao2003Apriori1993
0.1 0.15 0.2 0.25 0.3 0.35 0.4 0.45 0.50
2000
4000
6000
8000
10000
12000Comparion among RANWAR and other methods for DS4
Minimum Support
Num
ber
of fr
eque
nt it
emse
ts
RANWAROguz2012Ahmed2008Sun2008WIP2006Tao2003Apriori1993
(c) (d)
Fig. 4: Comparison of #frequent itemsets betweenRANWARand other existing ARM methods at different minimum support.
0.1 0.15 0.2 0.25 0.3 0.35 0.4 0.45 0.50
100
200
300
400
500
600Comparion among RANWAR and other methods for DS1
Minimum Support
Exe
cutio
n T
ime
(Sec
ond)
RANWAROguz2012Ahmed2008Sun2008WIP2006Tao2003Apriori1993
0.1 0.15 0.2 0.25 0.3 0.35 0.4 0.45 0.50
50
100
150
200
250
300
350
400
450
500Comparion among RANWAR and other methods for DS2
Minimum Support
Exe
cutio
n T
ime
(Sec
ond)
RANWAROguz2012Ahmed2008Sun2008WIP2006Tao2003Apriori1993
(a) (b)
0.1 0.15 0.2 0.25 0.3 0.35 0.4 0.45 0.50
50
100
150
200
250
300
350Comparion among RANWAR and other methods for DS3
Minimum Support
Exe
cutio
n T
ime
(Sec
ond)
RANWAROguz2012Ahmed2008Sun2008WIP2006Tao2003Apriori1993
0.1 0.15 0.2 0.25 0.3 0.35 0.4 0.45 0.50
50
100
150
200
250Comparion among RANWAR and other methods for DS4
Minimum Support
Exe
cutio
n T
ime
(Sec
ond)
RANWAROguz2012Ahmed2008Sun2008WIP2006Tao2003Apriori1993
(c) (d)
Fig. 5: Comparison of execution time betweenRANWAR andthe other existing ARM methods at different minimum supportand a specified minimum confidence cutoff (here, 0.5).
We have performed Gene Ontology (GO) and KEGG pathwayanalysis on the top rules. If all the genes of any evolved ruleinvolve together in any significant Gene Ontologies (GOs) and
KEGG pathways (whose p-value≤ 0.05), then the rule isbiologically significant. For DS1, rules{CCL14+⇒ CSF1R+}(wcc= 81.86% andwcs= 10.43%) and CCL11+⇒ CCL14+(wcc= 80.63% andwcs= 17.54%) both are existing in cytokine-cytokine receptor interaction pathway (viz., hsa04060) whichis significantly important for cervical cancer (see [8]). Eachof the rules{CCL11+⇒ CCL14+} (wcc= 80.63% andwcs=17.54%), {EPB42- ⇒ CCL11+} (wcc= 80.54% andwcs=24.26%) and{EPB42-⇒ CCL14+} (wcc= 79.88% andwcs=30.94%) contain five significant GO-BPs (viz., GO:0050801 ionhomeostasis, GO:0048878 chemical homeostasis, GO:0055066di- and tri-valent inorganic cation homeostasis, GO:0055080cation homeostasis and GO:0042592 homeostatic process) (see[10]). For DS2, rules{AURKA+⇒ FBXO5-} (wcc= 87.50% andwcs= 58%) and CCL11+⇒ CCL14+ (wcc= 87.50% andwcs=27.20%) both are existing in Oocyte meiosis pathway (hsa04114)that is important for lung adenocarcinoma (see [9]). In Fig.7,we plot different combinations of GO-terms against differentcombinations of rules. From that, we have found that all genesof 3 rules exist in 23 GO:BPs, those of 1 rule in 16 GO:BPsetc. The 3 rules are:{TTK-⇒ BUB1-}, {TTK+⇒ CENPF+}and {CENPF-⇒ TTK-}. All the three rules have samewcc.But, theirwcs are different (viz., 36.09%, 25.42% and 16.18%,respectively). Similarly, we have identified that all genesof 1rule involves in 7 GO:CCs, those of 2 rules in 6 Go:CCs etc.;and those of 4 rules involves in 8 GO:MFs, those of 2 rules in7 Go:MFs etc. The 4 rules are{AURKA+⇒ PLK4-}, {TTK-⇒PLK4-}, {TTK-⇒ BUB1-} and{BUB1-⇒ PLK4-}. Here, somesignificant GO:BPs are M phase, regulation of cell cycle processetc.; similarly, some significant GO:CCs are spindle, intracellularorganelle lumen etc.; and some significant GO:MFs are ATPbinding, adenyl nucleotide binding etc.
Furthermore,RANWAR rules are not totally universal setof traditional Apriori rules. E.g., according to Fig. 6, suppose,there are two cases for rule extraction; viz., case 1: miningruleswhere min Supp or min wsupp is 0.2, andmin Conf ormin wconf is 0.9; and case 2: mining rules wheremin Suppor min wsupp is 0.15, andmin Conf or min wconf is 0.9.Here, most of the rules generated byRANWAR at case1 existin the set of the rules generated by Apriori at case 1 as well astheset of the rules generated by Apriori at case 2.But, there are somelimited number of the rules generated byRANWAR at case1that do not exist in the set of rules generated by Apriori at case1, but exist in the set of rules generated by Apriori at case 2;i.e.,(Rc1−Ac1) ⊆ Rc1 ⊆ Ac2, but (Rc1−Ac1) * Ac1 (all notationsare denoted in Fig. 6). For details, see “RANWARsup2.pdf”.
case1: minSupp=0.15 and
minConf=0.9
case2: minSupp=0.20 and
minConf=0.9
Ac2 : Set of rules by
Apriori at case2
Ac1 : Set of rules by
Apriori at case1
Rc1 : Set of rules by
RANWAR at case1
(Rc1 - Ac1)
Fig. 6: Venn diagram of the evolved rules byRANWAR andApriori in different cases. Here,(Rc1 −Ac1) ⊆ Rc1 ⊆ Ac2, but(Rc1 −Ac1) * Ac1
7
TABLE IV: Some top common rules betweenRANWAR and Apriori methods for (a) DS1 and (b) DS2; (‘+’ denotesDMhyper
and ‘-’ denotesDMhypo). The rules (rows) of highlighted colors are differentiable in ranking byRANWAR, not by Apriori.RkRandRkA denote the rank of a rule inRANWAR and Apriori, respectively; andConf andSupp refer to confidence and supportof the rule, respectively.
(a)
Rule Rule wcc wcs RkR Conf Supp RkAId. (%) (%) (%) (%)
1 C20orf85+, SLC22A18+, INMT+, 93.02% 12.72% 284 100% 73.02% 17166ADCY2- ⇒ PCDHAC2-
2 C20orf85+, SLC22A18+, CCL14+, 93.02% 11.37% 378 100% 72.56% 20162ADCY2- ⇒ PCDHAC2-
3 SLC22A18+, CCL14+, ADCY2-, 93.02% 10.43% 489 100% 74.88% 9639SH3TC1-⇒ PCDHAC2-
4 SLC22A18+, INMT+, ADCY2-, 92.45% 11.66% 518 99.39% 75.35% 38754SH3TC1-⇒ PCDHAC2-
5 C20orf85+, SLC22A18+, CCL14+ 92.43% 11.37% 520 99.36% 72.56% 48072⇒ ADCY2-, PCDHAC2-
6 {C20orf85+⇒ PCDHAC2-} 81.86% 54% 1529 100% 81.86% 26617 {CCL14+⇒ PCDHAC2-} 81.86% 31.30% 1533 100% 94.88% 228 {CCL11+⇒ PCDHAC2-} 81.86% 23.74% 1535 100% 92.56% 1369 {C14orf115+⇒ PCDHAC2-} 81.86% 20.45% 1536 100% 93.02% 7210 {C20orf85+⇒ CSF1R+} 81.86% 18% 1537 100% 81.86% 265911 {ARID3A- ⇒ ADCY2- } 81.86% 17.39% 1540 100% 71.16% 2573512 {C14orf115+⇒ CCL14+} 81.86% 15.34% 1541 100% 93.02% 6913 {CSF1R+⇒ PCDHAC2-} 81.86% 14.59% 1543 100% 99.53% 214 {CCL14+⇒ CSF1R+} 81.86% 10.43% 1549 100% 94.88% 2015 {ADCY2- ⇒ PCDHAC2-} 81.47% 71.59% 1594 99.53% 97.67% 3301916 {ADCY2- ⇒ CSF1R+} 81.47% 23.86% 1595 99.53% 97.67% 3301817 {CCL14+⇒ ADCY2- } 81.46% 51.90% 1599 99.51% 94.42% 3302718 {INMT+ ⇒ PCDHAC2-} 81.46% 34.43% 1600 99.51% 93.95% 3305519 {INMT+ ⇒ CSF1R+} 81.46% 11.48% 1601 99.51% 93.95% 3305420 {SLC22A18+⇒ PCDHAC2-} 81.45% 40.70% 1602 99.50% 92.56% 3306421 {C14orf115+⇒ ADCY2- } 81.45% 33.92% 1603 99.50% 92.56% 3306522 {SLC22A18+⇒ CSF1R+} 81.45% 13.57% 1604 99.50% 92.56% 3306323 {P2RY2-⇒ PCDHAC2-} 81.43% 25.77% 1605 99.47% 87.91% 3359524 {MLN+ ⇒ PCDHAC2-} 81.42% 24.95% 1606 99.46% 85.12% 3404525 {SH3TC1-⇒ ADCY2- } 81.38% 77.27% 1636 99.42% 79.07% 3553926 {SH3TC1-⇒ PCDHAC2-} 81.38% 46.36% 1637 99.42% 79.07% 3554027 {SH3TC1-⇒ CSF1R+} 81.38% 15.45% 1638 99.42% 79.07% 35538
(b)
Rule Rule wcc wcs RkR Conf Supp RkAId. (%) (%) (%) (%)
1 {KPNA2+ ⇒ MTHFD2+} 87.5 58.67 7 100 100 227812 {CKS1B+⇒ KPNA2+} 87.5 55.87 14 100 100 227873 {CKS1B+⇒ MTHFD2+} 87.5 53.33 19 100 100 227864 {FBXO5- ⇒ KPNA2+} 87.5 50.29 28 100 100 227855 {FBXO5- ⇒ MTHFD2+} 87.5 48 34 100 100 296 {CKS1B+⇒ FBXO5-} 87.5 45.71 40 100 100 277 {HMGB2+ ⇒ KPNA2+} 87.5 43.58 47 100 97.5 258 {KPNA2+ ⇒ PLK4-} 87.5 41.90 51 100 100 249 {HMGB2+ ⇒ MTHFD2+} 87.5 41.60 56 100 97.5 610 {MTHFD2+ ⇒ PLK4-} 87.5 40 61 100 100 3311 {HMGB2+ ⇒ CKS1B+} 87.5 39.62 65 100 97.5 3112 {CKS1B+⇒ PLK4-} 87.5 38.10 69 100 100 193713 {HMGB2+ ⇒ FBXO5-} 87.5 35.66 81 100 97.5 194214 {FBXO5- ⇒ PLK4-} 87.5 34.29 85 100 100 193315 {HMGB2+ ⇒ PLK4-} 87.5 29.71 99 100 97.5 193516 {APOD+ ⇒ KPNA2+} 87.5 28.43 107 100 92.5 194017 {APOD+ ⇒ MTHFD2+} 87.5 27.13 115 100 92.5 3018 {SDC1+⇒ KPNA2+} 87.5 26.54 117 100 95 3619 {APOD+ ⇒ CKS1B+} 87.5 25.84 120 100 92.5 1220 {SDC1+⇒ MTHFD2+} 87.50 25.33 124 100 95 2221 {KPNA2+ ⇒ MICAL2-} 87.5 25.14 126 100 100 4022 {SDC1+⇒ CKS1B+} 87.5 24.13 129 100 95 523 {MICAL2- ⇒ MTHFD2+} 87.5 24 132 100 100 1124 {APOD+ ⇒ FBXO5-} 87.5 23.26 135 100 92.5 125 {CKS1B+⇒ MICAL2-} 87.5 22.86 139 100 100 726 {IDS- ⇒ KPNA2+} 87.5 22.35 144 100 100 3427 {SDC1+⇒ FBXO5-} 87.5 21.71 150 100 95 2028 {IDS- ⇒ MTHFD2+} 87.5 21.33 154 100 100 3829 {FBXO5- ⇒ MICAL2-} 87.5 20.57 159 100 100 1530 {CKS1B+⇒ IDS-} 87.5 20.32 163 100 100 231 {APOD+ ⇒ PLK4-} 87.5 19.38 170 100 92.5 1732 {FBXO5- ⇒ IDS-} 87.5 18.29 175 100 100 26
#GO:BP
#Rule
#GO:CC
#Rule
#GO:MF
#Rule
(a) (b) (c)
Fig. 7: #Rule existing in #GO:BP (in (a)), #GO:CC (in (b)) and#GO:MF (in (c)), respectively for DS2.
VIII. C ONCLUSION
The huge number of evolved rules of items (or, genes) byassociation rule mining algorithms makes confusion to the de-cision maker to choose the top genes. Therefore, in this article,we have propose two novel rank-based weighted condensed rule-interestingness measures (viz.,wcs andwcc). A novel weighted(qualitative) rule-mining algorithm (viz.,RANWAR) has beendeveloped using the measures specially for microarray/beadchipdata.RANWAR uses a statistical test, Limma to compute p-value of each gene (item), and some weight is given to eachgene based on their p-value ranking.RANWAR is basicallyupdated form of Apriori algorithm. We use two gene expressiondatasets and two methylation datasets to compare the perfor-mance ofRANWAR with the state-of-the-art ARM algorithms.RANWAR generates very less number of frequent itemsets thanthe others. Thus, it saves time of execution of the algorithm.Another advantage ofRANWAR is that some rules stand tophere (due to the weighted aspect into the measures) which holdvery low rank in Apriori. The rules are finally validated by GOterms and kegg pathways of genes of the rules. Some top rulesextracted fromRANWAR that are not present in Apriori, but
have high biological significance, are also reported.
SUPPLEMENTARY MATERIALS
The code ofRANWAR algorithm and the supplementaryfiles are available online at:https://www.dropbox.com/sh/jq07k1iujaqm4vv/TIzKK3hzW
REFERENCES
[1] R. Agrawal, T. Imielinski and A. Swami,Mining Association Rules betweenSets of Items in large Databases, Proc. ACM SIGMOD, New York, NY,USA: ACM, pp. 207-216, 1993.
[2] G. Smyth, Linear Models and Empirical Bayes Methods for AssessingDifferential Expression in Microarray Experiments, Statistical Applicationsin Genetics and Molecular Biology, vol. 3, no. 1, pp. 3, 2004.
[3] S. Mallik and et al., Integrated Analysis of Gene Expression and Genome-wide DNA Methylation for Tumor Prediction: An Association Rule Mining-based Approach, CIBCB, IEEE SSCI, Singapore, pp. 120-127, 2013.
[4] S. Bandyopadhyay, U. Maulik and J.T.L. Wang,Analysis of BiologicalData: A Soft Computing Approach, World Scientific, Singapore, 2007.
[5] M. Anandhavalli, M.K.Ghose and K.Gauthaman,Association Rule Miningin Genomics, International Journal of Computer Theory and Engineering,vol. 2, no. 2, pp. 1793-8201, 2010.
[6] D. Arthur and S. Vassilvitskii,k-means++: the advantages of carefulseeding, In Proc. of ACM-SIAM SODA 2007, Society for Industrial andApplied Mathematics Philadelphia, PA, USA, pp. 1027-1035,2007.
[7] S. Bandyopadhyay and et al.,A Survey and Comparative Study of Statis-tical Tests for Identifying Differential Expression from Microarray Data,IEEE/ACM TCBB, 2014, DOI: 10.1109/TCBB.2013.147.
[8] A. Thomas and et al.,Expression profiling of cervical cancers in Indianwomen at different stages to identify gene signatures during progression ofthe disease, Cancer Medicine, 2013, DOI: 10.1002/cam4.152.
[9] J. Liu and et al., Identifying differentially expressed genes andpathways in two types of non-small cell lung cancer: adenocarci-noma and squamous cell carcinoma, Genet Mol Res, 2014, DOI:http://dx.doi.org/10.4238/2014.January.8.8.
[10] W. Wei and et al.,The potassium-chloride cotransporter 2 promotescervical cancer cell migration and invasion by an ion transport-independentmechanism, J Physiol., 2011, DOI: 10.1113/jphysiol.2011.214635.
8
[11] J. Pavon, S. Viana and S. Gomez,Matrix Apriori: Speeding Up the Searchfor Frequent Patterns, In Proc. of IASTED, 24th Multi-Conference onApplied Informatics, Innsbruck, Austria, 2006.
[12] Y. Hong and et al.,Incrementally fast updated frequent pattern trees,Expert Systems with Applications, 2008, DOI: 10.1016/j.eswa.2007.04.009.
[13] D. Oguz and B. Ergenc,Incremental itemset mining based on matrixapriori algorithm, Springer Berlin Heidelberg, pp. 192-204, 2012.
[14] S. Orlando and et al.,Enhancing the apriori algorithm for frequent setcounting, In Data Warehousing and Knowledge Discovery, Springer BerlinHeidelberg, pp. 71-82, 2001.
[15] U. Yun and et al.,WIP: mining Weighted Interesting Patterns with a strongweight and/or support affinity, In SDM, vol. 6, pp. 3477-3499, 2006.
[16] K.M. Yu and J.L. Zhou,A Weighted Load-Balancing Parallel AprioriAlgorithm for Association Rule Mining, In Proc. of IEEE GrC, 2008, DOI:10.1109/GRC.2008.4664768.
[17] K. Sun and F. Bai,Mining Weighted Association Rules without Preas-signed Weights, IEEE TKDE, vol. 20, no. 4, pp. 489-495, 2008, DOI:10.1109/TKDE.2007.190723.
[18] C.F. Ahmed and et al.,Mining Weighted Frequent Patterns in IncrementalDatabases, In PRICAI, pp. 933-938, Springer Berlin Heidelberg, 2008.
[19] F.Tao, Weighted Association Rule Mining using Weighted Support andSignificance Framework, Proc. ACM SIGKDD, Washington D.C., USA,pp. 661-666, 2003.