Raman and infrared spectroscopic investigations on the crystal structure and phonon modes of LaYbO3...
21
J Solution Chem (2010) 39: 1039–1059 DOI 10.1007/s10953-010-9555-4 Raman and Infrared Spectroscopic Investigation of Speciation in BeSO 4 (aq) Wolfram W. Rudolph Received: 5 November 2009 / Accepted: 19 February 2010 / Published online: 1 July 2010 © Springer Science+Business Media, LLC 2010 Abstract Measurements have been made of the Raman spectra of aqueous solutions of Be(ClO 4 ) 2 , BeCl 2 , (NH 4 ) 2 SO 4 and BeSO 4 to 50 cm −1 . In some cases low concentrations (0.000770 mol·kg −1 ) have been used and two temperatures (23 and 40 °C) were studied. In BeSO 4 (aq), the ν 1 -SO 2− 4 mode at 980 cm −1 broadens with increasing concentration and shifts to higher wavenumbers. At the same time, a band at 1014 cm −1 is detectable with this mode being assigned to [BeOSO 3 ], an inner-sphere complex (ISC). Confirmation of this assignment is provided by the simultaneous appearance of stretching bands for the Be 2+ -OSO 2− 3 bond of the complex at 240 cm −1 and for the BeO 4 skeleton mode of the [(H 2 O) 3 BeOSO 3 ] unit at 498 cm −1 . The ISC concentration increases with higher temper- atures. The similarity of the ν 1 -SO 2− 4 Raman bands for BeSO 4 in H 2 O and D 2 O is fur- ther strong evidence for formation of an ISC. After subtraction of the ISC component at 1014 cm −1 , the ν 1 -SO 2− 4 band in BeSO 4 (aq) showed systematic differences from that in (NH 4 ) 2 SO 4 (aq). This is consistent with a ν 1 -SO 2− 4 mode at 982.7 cm −1 that can be assigned to the occurrence of an outer-sphere complex ion (OSCs). These observations are shown to be in agreement with results derived from previous relaxation measurements. Infrared spectroscopic data show features that are also consistent with a beryllium sulfato complex such as the appearance of a broad and weak ν 1 -SO 2− 4 mode at ∼1014 cm −1 , normally in- frared forbidden, and a broad and asymmetric ν 3 -SO 2− 4 band contour which could be fitted with four band components (including ν 3 -SO 2− 4 (aq)). The formation of ISCs in BeSO 4 (aq) is much more pronounced than in the similar MgSO 4 (aq) system studied recently. Keywords Raman spectra · Be(II) tetraaqua ion · Be(ClO 4 ) 2 , BeCl 2 , and BeSO 4 solutions · Inner-sphere complexes of beryllium(II) W.W. Rudolph ( ) Medizinische Fakultät, TU Dresden, Institut für Virologie im MTZ, Fiedlerstr. 42 01307 Dresden, Germany e-mail: [email protected]
Transcript of Raman and infrared spectroscopic investigations on the crystal structure and phonon modes of LaYbO3...

J Solution Chem (2010) 39: 1039–1059DOI 10.1007/s10953-010-9555-4
Raman and Infrared Spectroscopic Investigationof Speciation in BeSO4(aq)
Wolfram W. Rudolph
Received: 5 November 2009 / Accepted: 19 February 2010 / Published online: 1 July 2010© Springer Science+Business Media, LLC 2010
Abstract Measurements have been made of the Raman spectra of aqueous solutions ofBe(ClO4)2, BeCl2, (NH4)2SO4 and BeSO4 to 50 cm−1. In some cases low concentrations(0.000770 mol·kg−1) have been used and two temperatures (23 and 40 °C) were studied.In BeSO4(aq), the ν1-SO2−
4 mode at 980 cm−1 broadens with increasing concentration andshifts to higher wavenumbers. At the same time, a band at 1014 cm−1 is detectable withthis mode being assigned to [BeOSO3], an inner-sphere complex (ISC). Confirmation ofthis assignment is provided by the simultaneous appearance of stretching bands for theBe2+-OSO2−
3 bond of the complex at 240 cm−1 and for the BeO4 skeleton mode of the[(H2O)3BeOSO3] unit at 498 cm−1. The ISC concentration increases with higher temper-atures. The similarity of the ν1-SO2−
4 Raman bands for BeSO4 in H2O and D2O is fur-ther strong evidence for formation of an ISC. After subtraction of the ISC component at1014 cm−1, the ν1-SO2−
4 band in BeSO4(aq) showed systematic differences from that in(NH4)2SO4(aq). This is consistent with a ν1-SO2−
4 mode at 982.7 cm−1 that can be assignedto the occurrence of an outer-sphere complex ion (OSCs). These observations are shownto be in agreement with results derived from previous relaxation measurements. Infraredspectroscopic data show features that are also consistent with a beryllium sulfato complexsuch as the appearance of a broad and weak ν1-SO2−
4 mode at ∼1014 cm−1, normally in-frared forbidden, and a broad and asymmetric ν3-SO2−
4 band contour which could be fittedwith four band components (including ν3-SO2−
4 (aq)). The formation of ISCs in BeSO4(aq)is much more pronounced than in the similar MgSO4(aq) system studied recently.
Keywords Raman spectra · Be(II) tetraaqua ion · Be(ClO4)2, BeCl2, and BeSO4
solutions · Inner-sphere complexes of beryllium(II)
W.W. Rudolph (�)Medizinische Fakultät, TU Dresden, Institut für Virologie im MTZ, Fiedlerstr. 42 01307 Dresden,Germanye-mail: [email protected]

1040 J Solution Chem (2010) 39: 1039–1059
1 Introduction
The technical importance of beryllium and its compounds in reactor technology, aerospaceindustry and metallurgy has been well documented [1, 2]. Beryllium compounds have beenstudied quite extensively in the solid state, with BeSO4·4H2O(cr) [2–9] being, by far, the bestcharacterized solid. Solution chemistry [1], especially aqueous solutions, has been sparselystudied.
When dissolved in water, the Be2+ ion is strongly hydrated and because of its high chargeto ionic radius ratio the bonds between Be2+ and water are strong. An early study by Frickeand Schützdeller [9] concluded that the Be2+ ion is the most heavily hydrated of all di-valent cations. Later, the existence of the tetra-aquaberyllium(II) ions was experimentallyverified through NMR spectroscopy [10–12] and it was also determined that the aqua ion isthermodynamically stable and kinetically quite inert. More recently, a study on vibrationalspectra in aqueous solutions of common beryllium salts has established the existence of the[Be(OH2)4]2+ species in aqueous solutions of perchlorate, chloride, nitrate and sulfate [13].The [Be(OH2)4]2+ species also occurs in solid state compounds such as BeSO4·4H2O or inBeX2·4H2O with X = Cl−, Br−, NO−
3 , and H4IO−6 [2, 4–7].
However, BeSO4 solutions show striking features because, besides the well characterized[Be(OH2)4]2+ species, a beryllium sulfato complex was also verified recently [13]. There-fore, it seemed warranted to study Raman and infrared spectra of aqueous BeSO4 solutionsas a function of concentration and temperature in more detail. In order to properly interpretsuch spectra it is essential to first characterize the spectra of free (unassociated) Be2+(aq)and SO2−
4 (aq) ions.This paper presents a detailed analysis of the spectra of BeSO4(aq) over a wide con-
centration range and also of aqueous solutions of other relevant salts: Be(ClO4)2, BeCl2
and (NH4)2SO4. In addition, the relationship between the apparent association constant forBeSO4(aq) obtained by Raman spectroscopy and those measured by other techniques isdiscussed. A comparison of the qualitative and quantitative data on the sulfato complex for-mation in BeSO4 solutions with the results on MgSO4 solutions obtained by recent Ramanand DRS studies [14, 15] are included.
2 Experimental Details and Data Analysis
2.1 Preparation of Solutions
Be(ClO4)2 and BeCl2 solutions were prepared by dissolving BeO (Merck; Darmstadt, Ger-many, p.a. quality) with slightly more than the stoichiometric amount of the appropriateacids. Two Be(ClO4)2 solutions were prepared: Solution A was 3.150 mol·L−1 Be(ClO4)3
with a slight excess of perchloric acid (ca. 0.20 mol·L−1), Solution B was 1.246 mol·L−1
Be(ClO4)2 with 0.10 mol·L−1 HClO4 excess. Two BeCl2 solutions were prepared: Solu-tion A was 3.350 mol·L−1 BeCl2 with an excess of HCl (ca. 0.80 mol·L−1), Solution B was1.246 mol·L−1 BeCl2 with 0.5 mol·L−1 HCl excess. A 3.050 mol·L−1 BeCl2 stock solutionwas prepared in D2O with an excess of ∼ 0.65 mol·L−1 DCl.
Two BeSO4 stock solutions were prepared by weight from BeSO4·4H2O(cr) purchasedfrom Merck; Darmstadt, Germany (p.a. quality) and ultrapure water produced from Pure-Lab Plus, Ultra-pure Water Purification Systems: (A) a 3.052 mol·L−1 (3.260 mol·kg−1)solution and (B) a 1.835 mol·L−1 (1.910 mol·kg−1). The diluted BeSO4 solutions were pre-pared from stock Solution A and ultrapure water by weight. Five diluted solutions prepared

J Solution Chem (2010) 39: 1039–1059 1041
were: 0.098 mol·L−1 (0.101 mol·kg−1), 0.237 mol·L−1 (0.239 mol·kg−1), 0.460 mol·L−1
(0.465 mol·kg−1), 0.925 mol·L−1 (0.944 mol·kg−1), and 1.801 (1.874 mol·kg−1) mol·L−1.The BeSO4 solutions were quite acid and for the 1.835 mol·L−1 solution a pH value of 1.50was measured, for the 0.237 mol·L−1 a value of 2.40 and for the most dilute BeSO4 solutiona pH value of 2.85.
A 1.650 mol·L−1 BeSO4 stock solution in D2O was prepared by dissolving BeSO4·4H2Oin D2O and removing the water. The obtained salt was then re-dissolved in D2O. A deutera-tion degree ∼95% was reached. The beryllium content of the solutions was analyzed gravi-metrically as Be2P2O7 [16].
Ammonium sulfate solutions were prepared with (NH4)2SO4 (Merck; Darmstadt, Ger-many, p.a. quality) and ultrapure water by weight. A saturated stock solution 3.057 mol·L−1
(3.842 mol·kg−1) and 9 diluted solutions were prepared.Solution densities were determined with a pycnometer (5 mL) at 22 ◦C and with the
densities at hand the concentrations in the molality scale were calculated and from these thestoichiometric ratios water to salt.
2.2 Spectroscopic Measurements
Raman spectra were measured in the macro chamber of the T 64000 Raman spectrometerfrom Jobin Yvon in a 90◦ scattering geometry at 23 ◦C. These measurements have beendescribed in detail elsewhere [17, 18]. Briefly, the spectra were excited with the 514.5 nmline of an Ar+ laser at a power level of ∼1100 mW at the sample. After passing the spec-trometer in the subtractive mode, with gratings of 1800 grooves·mm−1, the scattered lightwas detected with a cooled CCD detector. IVV and IVH spectra were obtained with fixedpolarization of the laser beam by rotating the polarizator at 90◦ between the sample and theentrance slit to give the scattering geometries:
IVV = I (Y[ZZ]X) = 45α′2 + 4γ ′2 (1)
IVH = I (Y[ZY]X) = 3γ ′2 (2)
The isotropic spectrum, Iiso or Iα , is then constructed:
Iiso = IVV − 4/3 · IVH (3)
The depolarization ratio, ρ, of the modes has been determined according to Eq. 4:
ρ = IVH/IVV = 3γ ′2/(45α′2 + 4γ ′2) (4)
The polarization analyzer was calibrated with CCl4 before each measuring cycle and ad-justed if necessary. The depolarization ratio of the ν1 mode of CCl4 at 459 cm−1 was mea-sured 15 times and a depolarization ratio equal to 0.0036±0.0005 determined. The depolar-ization degree of the CCl4 modes at 217 cm−1 and 315 cm−1 (these modes are depolarizedaccording to theory) have been determined to be 0.75 ± 0.02.
In order to obtain spectra defined as R(v̄) which are independent of the excitationwavenumber v̄L, the measured Stokes intensity should be corrected for the scattering factor(νL − v̄)3 [17]. The spectra were further corrected for the Bose-Einstein temperature fac-tor, B = [1 − exp(−hv̄c/kT ] and the frequency factor, v̄, to give the so called reduced orR spectrum. For details and for justification of using the R-normalization procedure, see
1042 J Solution Chem (2010) 39: 1039–1059
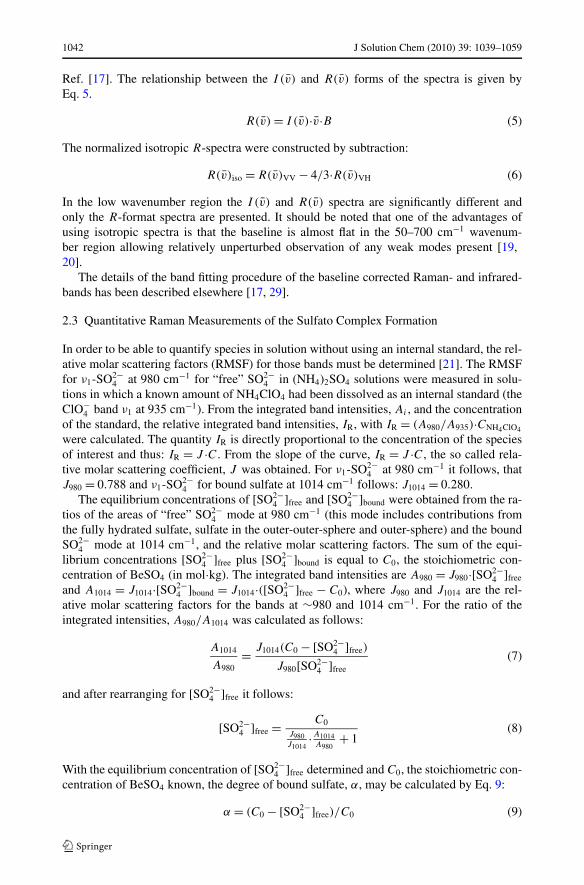
Ref. [17]. The relationship between the I (v̄) and R(v̄) forms of the spectra is given byEq. 5.
R(v̄) = I (v̄)·v̄·B (5)
The normalized isotropic R-spectra were constructed by subtraction:
R(v̄)iso = R(v̄)VV − 4/3·R(v̄)VH (6)
In the low wavenumber region the I (v̄) and R(v̄) spectra are significantly different andonly the R-format spectra are presented. It should be noted that one of the advantages ofusing isotropic spectra is that the baseline is almost flat in the 50–700 cm−1 wavenum-ber region allowing relatively unperturbed observation of any weak modes present [19,20].
The details of the band fitting procedure of the baseline corrected Raman- and infrared-bands has been described elsewhere [17, 29].
2.3 Quantitative Raman Measurements of the Sulfato Complex Formation
In order to be able to quantify species in solution without using an internal standard, the rel-ative molar scattering factors (RMSF) for those bands must be determined [21]. The RMSFfor ν1-SO2−
4 at 980 cm−1 for “free” SO2−4 in (NH4)2SO4 solutions were measured in solu-
tions in which a known amount of NH4ClO4 had been dissolved as an internal standard (theClO−
4 band ν1 at 935 cm−1). From the integrated band intensities, Ai , and the concentrationof the standard, the relative integrated band intensities, IR, with IR = (A980/A935)·CNH4ClO4
were calculated. The quantity IR is directly proportional to the concentration of the speciesof interest and thus: IR = J ·C. From the slope of the curve, IR = J ·C, the so called rela-tive molar scattering coefficient, J was obtained. For ν1-SO2−
4 at 980 cm−1 it follows, thatJ980 = 0.788 and ν1-SO2−
4 for bound sulfate at 1014 cm−1 follows: J1014 = 0.280.The equilibrium concentrations of [SO2−
4 ]free and [SO2−4 ]bound were obtained from the ra-
tios of the areas of “free” SO2−4 mode at 980 cm−1 (this mode includes contributions from
the fully hydrated sulfate, sulfate in the outer-outer-sphere and outer-sphere) and the boundSO2−
4 mode at 1014 cm−1, and the relative molar scattering factors. The sum of the equi-librium concentrations [SO2−
4 ]free plus [SO2−4 ]bound is equal to C0, the stoichiometric con-
centration of BeSO4 (in mol·kg). The integrated band intensities are A980 = J980·[SO2−4 ]free
and A1014 = J1014·[SO2−4 ]bound = J1014·([SO2−
4 ]free − C0), where J980 and J1014 are the rel-ative molar scattering factors for the bands at ∼980 and 1014 cm−1. For the ratio of theintegrated intensities, A980/A1014 was calculated as follows:
A1014
A980= J1014(C0 − [SO2−
4 ]free)
J980[SO2−4 ]free
(7)
and after rearranging for [SO2−4 ]free it follows:
[SO2−4 ]free = C0
J980J1014
·A1014A980
+ 1(8)
With the equilibrium concentration of [SO2−4 ]free determined and C0, the stoichiometric con-
centration of BeSO4 known, the degree of bound sulfate, α, may be calculated by Eq. 9:
α = (C0 − [SO2−4 ]free)/C0 (9)

J Solution Chem (2010) 39: 1039–1059 1043
The infrared solution spectra were measured with the FT-IR spectrometer IFS66v(BRUKER OPTICS, Germany) [18] in the wavelength range from 400 to 4000 cm−1 witha spectral resolution of 2 cm−1 in capillary thickness between AgCl disks. The spectra havebeen corrected by subtracting the spectra of the window (AgCl) material from the measuredsolution spectra.
3 Results and Discussion
3.1 Characterization of Unassociated Be(OH2)2+4 (aq)
There may be a slight level of association in aqueous Be(ClO4)2 and BeCl2 solutions,but in neither case does the anion penetrate into the first coordination sphere of the tetra-aquaberyllium(II) ion as has been recently shown [13]. If any association does occur in suchsolutions only outer sphere complexes are formed. Such solutions are therefore appropriatefor characterizing the spectral features of Be(OH2)2+
4 (aq). The isolated Be(OH2)2+4 species
possesses S4 symmetry and for the tetra-aquaberyllium(II) ion, [Be(OH2)2+4 ], with its 13
atoms, 33 normal modes (n.m.) are expected. The irreducible representation of the vibra-tional modes is as follows:
Γvib(S4) = 8a(Ra) + 9b(Ra, i.r.) + 8e(Ra, i.r.) (10)
All the modes with the character a, b, and e are Raman active, but only the b and e modesare infrared allowed. On the basis of this model the modes of the comparable [Li(OH2)+4 ]ion was calculated using ab initio molecular orbital theory [20, 22, 23]. According to thismodel 3 symmetrical and 3 anti-symmetrical OH stretching modes should be observed.However, the water molecules of the beryllium aqua complex couple only slightly and canbe viewed as point masses. This assumption is certainly sufficient in aqueous solutions ashas been shown previously [24–26]. Therefore, the modes of the water molecules may beconsidered separately from the ones of the aqua complex itself. The 33 n.m. may be dividedinto 12 internal and 12 external modes of the four coordinated water molecules and 9 n.m.of the BeO4 skeleton.
The BeO4 skeleton possesses Td symmetry and the normal modes of the BeO4 skele-ton span the representation Γvib(Td) = a1(Ra) + e(Ra) + 2f2(Ra, i.r.). The modes ν1(a1),ν2(e), ν3(f2) and ν4(f2) are Raman active and the modes ν3(f2) and ν4(f2) are i.r. allowed.The Raman active mode with the character a1 is polarized while the modes e and f2 aredepolarized.
The following assignments of the various modes of BeO4 are based on ab initio mole-cular orbital calculations for the BeO4 modes in the [Be(OH2)4(OH2)8]2+ cluster, de-noted as Be[4 + 8] (Fig. 1) which are summarized in Table 1 for convenience [13]. The[Be(OH2)4(OH2)8]2+ cluster model consist of four water molecules in the first shell andan explicit second water shell with 8 water molecules. Clusters without a second hydrationshell give an unrealistically high BeO4 mode (for further discussions cf. Ref. [13]). Theisotropic band at 531 cm−1 in the Raman spectrum (Fig. 2) of Be(OH2)2+
4 (aq) is assignedto the BeO4 symmetric stretching mode ν1(a1). The Raman active ν2(f2) mode is too weakto be observed in solution spectra or may be incidentally overlapped with the other defor-mation mode ν4(e) at 348 cm−1. A very weak mode at ∼760 cm−1 but strong in infraredabsorption is assigned to ν3(f2). In the IR spectrum, ν3(f2) has been observed at 760 cm−1
[13]. The peak positions and depolarization degrees of the modes of the Raman and IR bands

1044 J Solution Chem (2010) 39: 1039–1059
Fig. 1 Structure of the stabledodecaaqua cluster,[Be(OH2)4(OH2)2+
8 ] denotedBe[4 + 8]. Note the 4inner-sphere water molecules and8 waters constituting the secondhydration sphere [13]
Table 1 The BeO4 skeleton modes (BeO4 unit possesses Td symmetry), Raman- and IR-spectroscopic fre-quencies (cm−1) in aqueous, acidified Be(ClO4)3, and BeCl2 solutions at 23 ◦C. The Raman active modesof BeO4 in crystalline BeSO4·4H2O are given as well. The depolarization ratio is given in parentheses andthe full-width at half-height in the second line
Assignments and Exp. values Exp. values Experimental values Theoretical values
activities of BeO4 in H2O in D2O for crystalline for Be[4 + 8] [13]c
BeSO4·4H2O powder
ν1(a1) Ra 531 ± 1(0.01) 505 ± 1(0.01) 544 540
34 ± 2 28 ± 2
ν4(f2) Ra 348 ± 2(0.75) 312 ± 2(0.75) 327a, 340, 352a 310 ± 40
40 ± 2 38 ± 2
ν2(e) Ra, i.r. – – 256, 280, 293 250 ± 20
ν3(f2) Ra, i.r. 760 ± 10(0.75)b 622 ± 10(0.75)b 787, 830, 885 810 ± 40
∼ 55 ∼ 50
aThese modes are very weak and broad and appear only as shoulders
bThese modes are very weak in the Raman spectrum but strong in the infrared spectrumcTheoretical level MP2/6-31 + G*; the theoretical values for degenerate modes are weighted averages of upto four frequencies, with the range also given

J Solution Chem (2010) 39: 1039–1059 1045
Fig. 2 Raman spectrum (inR-format) in the polarized,depolarized and isotropicscattering geometry of a3.80 mol·kg−1 BeCl2 solutionwith an excess of HCl(0.80 mol·kg−1)
support the assignment of Td symmetry of the BeO4 skeleton. In BeCl2/D2O solutions,ν1-Be(OD2)2+
4 shifts to 505 cm−1, which is in reasonable agreement with the expected iso-
tope shift: ν1·√
mH2O
mD2O= 531·
√18.0220.03 = 503 cm−1.
In crystalline BeSO4·4H2O, ν1 is obtained at 544 cm−1 and for BeSO4·4D2O,ν ′
1 = 507 cm−1. Besides the isotropic mode, ν1 BeO4 at 531 cm−1 (full width at half-height(fwhh) = 34 ± 2 cm−1), a weak, very broad mode centered at 176 ± 10 cm−1 can be ob-served in aqueous BeCl2 solution (cf. Fig. 2). The mode at ∼180 cm−1 can also be observedin neat water as moderately intense but slightly polarized. This mode has been assignedto a restricted translational mode of the H-bonded water molecules. The mode is stronglyanion and concentration dependent [20]. It should be pointed out that in concentrated BeCl2
solutions other H-bonds are important, namely OH· · ·Cl− and the intensity of the band dueto OH· · ·Cl− is weak in the isotropic Raman spectrum. The strengths of the OH· · ·Cl− andO· · ·OH− hydrogen bonds are quite comparable, and therefore the frequency of this modeis shifted only slightly [20].
The Be2+ is a hard cation and this is reflected by its scattering intensity. The relative mo-lar scattering intensity, Sh of the symmetric stretching mode ν1 of MO4 (M = Be2+ and Li+)for Be2+ equals 0.0085, and for Li+ equals 0.0035 [20] (Li+(aq) also exist as a tetraaqua ionin aqueous solution.)
3.2 Characterization of Unassociated SO2−4 (aq)
The spectral characteristics of the unassociated SO2−4 (aq) ion can be established from mea-
surements of (NH4)2SO4 solutions, which are considered to be fully dissociated [27, 28].Such a study has been carried out recently [14, 29, 30] but only points relevant to theligated sulfate are presented here. An ab initio molecular orbital study including Ramanspectroscopic measurements of SO2−
4 hydration, has been recently published by Pye andRudolph [30]. The unassociated SO2−
4 (aq) ion possesses Td symmetry and thus nine modesof internal vibration, having the representation: Γvib(Td) = a1 +e+2f2. All vibration modesare Raman active but only the f2 modes are IR allowed.
The infrared spectrum of a 1.258 mol·kg−1 (NH4)2SO4 solution is presented in Fig. 3and the Raman spectrum of a 2.742 mol·kg−1 (NH4)2SO4 solution in Fig. 4. In the in-frared spectrum the IR-active modes ν4(f2) and ν3(f2) are located at 620 cm−1 and1104 cm−1 respectively (Fig. 3). The following features were observed in the Raman spec-trum (Fig. 4): The ν1(a1)-SO2−
4 mode centered on 979.5 cm−1 (fwhh = 6.95 ± 0.05 cm−1)

1046 J Solution Chem (2010) 39: 1039–1059
Fig. 3 Infrared spectrum of1.260 mol·kg−1 (NH4)2SO4(aq)at 23 ◦C. The two infrared activemodes of SO2−
4 : ν4(f2) = 620
and ν3(f2) = 1104 cm−1. Thevery weak contribution at979 cm−1 is due to ν1-SO2−
4 .
Note, the mode at 1475 cm−1 isdue to ν4(f2) NH+
4 and the band
at 1644 cm−1 to δH2O. Thebroad band at ∼680 cm−1 is dueto the libration (rocking mode) ofwater
Fig. 4 Raman spectrum (Rformat) of 2.724 mol·kg−1
(NH4)2SO4(aq) at 23 ◦C. Toppanel (A): (50 to 720 cm−1):ν2 and ν4 bending modes ofSO2−
4 at 451 cm−1 and
619 cm−1; H· · ·(OSO3)2−restricted translation mode at ca.190 cm−1. Bottom panel (B):(800 to 1300 cm−1): ν1-SO2−
4mode and the broad, weakν3-SO2−
4 mode at 1110 cm−1.
The ν1-SO2−4 mode is given in
the inset in the polarizedscattering geometry at full scale.The Raman active NH+
4 modes
ν2(e)-NH+4 at 1475 cm−1 and
ν4(f2) at 1692 cm−1, as well asδH2O at ∼1640 cm−1, areomitted for clarity
is almost totally polarized (ρ = 0.0035, Fig. 4B) whereas the ν3(f2)-SO2−4 band centred on
1107 cm−1 (fwhh(Rpol) = 78.0 cm−1) and the deformation modes ν4(f2)-SO2−4 at 620 cm−1
(fwhh(Rpol) = 42 cm−1) and ν2(e)-SO2−4 at 451 cm−1 (fwhh/Rpol = 35 cm−1) are depolar-
ized. At low frequencies, a broad and very weak mode at ∼190 cm−1 (fwhh = 170 cm−1)is observed in the isotropic spectrum (Fig. 4A). This mode is also observable in pure wa-ter at 180 cm−1 and has been attributed to OH· · ·O bonded water species [14, 29, 30]. In(NH4)2SO4(aq) it may be assigned to the restricted translational modes of both OH· · ·O andOH· · ·(OSO3)2− H-bonds. The corresponding bending mode of this unit is observable at∼ 60 cm−1 [31].

J Solution Chem (2010) 39: 1039–1059 1047
Fig. 5 Concentration effects at23 ◦C on the ν1-SO2−
4 mode at
ca. 980 cm−1 in (NH4)2SO4solutions (filled circles) and inBeSO4 solutions (aftersubtraction of the 1014 cm−1
component, open circles);(A) peak position (νmax/cm−1);(B) fwhh/cm−1
The ν1-SO2−4 band shape is symmetrical in both Raman polarization arrangements but
other band parameters vary slightly with concentration (cf. Fig. 5). For example, at 23 ◦Cfor a 3.841 mol·kg−1 (NH4)2SO4 solution, νmax shifted to slightly higher wavenumbers asthe concentration was decreased, reaching (980.4 ± 0.1) cm−1 at infinite dilution (Fig. 5A).Using a spectral slit width of 0.7 cm−1, the fwhh decreased from (7.10 ± 0.05) cm−1 to(5.40 ± 0.1) cm−1 at infinite dilution (Fig. 5B). For present purposes, it is important to statethat the symmetric profile of the ν1-SO2−
4 mode was independent of the salt concentrationover the entire range studied. The ν1-SO2−
4 band is the strongest band in the SO2−4 (aq) –
Raman spectrum and the intensity ratio of the ν1-SO2−4 band area to the ν3-SO2−
4 band areais 100:11.
With increasing temperature the symmetric S-O stretching, ν1-SO2−4 is shifted to lower
frequencies and broadened [29]. For example, in a 3.780 mol·kg−1 (NH4)2SO4 solutionνmax varied smoothly from (979.4 ± 0.1) cm−1 at 23 ◦C to (978.5 ± 0.1) cm−1 at 99 ◦Cand to (977.0 ± 0.1) cm−1 at 200 ◦C while the fwhh increased from (7.10 ± 0.05) cm−1 to(11.0 ± 0.1) cm−1 [14, 29]. Although the ν1-SO2−
4 band shape remained symmetrical up to200 ◦C it was not Lorentzian. Thus, at 23 ◦C the Gauss-Lorentz factor (RGL) was 0.75 (i.e.,there is a 25% Gaussian contribution to the peak shape) but it became more Lorentzian withincreasing temperature (RGL = 0.905 at 200 ◦C) [14, 29]. Detailed studies of the ν1-SO2−
4mode as a function of concentration and temperature may be found elsewhere [29, 30].
The band contour of the antisymmetric S-O stretching mode, ν3-SO2−4 , is also symmet-
rical in both polarization arrangements but band parameters vary slightly with concen-tration. For example, at 23 ◦C for a 3.841 mol·kg−1 (NH4)2SO4 solution, νmax is foundat (1110 ± 2) cm−1 and is shifted to slightly lower wavenumbers as the concentrationwas decreased, reaching (1106 ± 2) cm−1 at infinite dilution. The fwhh decreased from(81 ± 1) cm−1 for a 3.841 mol·kg−1 salt solution to (68.5 ± 1) cm−1 at infinite dilution. Itis of importance to state that the symmetric profile of the ν3-SO2−
4 mode was independentof the ammonium sulfate concentration over the entire range studied. The ν3-SO2−
4 band iscompletely depolarized.
3.3 The BeSO4(aq) Spectra
When a polyatomic anion such as sulfate replaces water in the first coordination sphereof the cation, marked changes occur in the spectrum of the ligated sulfate, so that it is

1048 J Solution Chem (2010) 39: 1039–1059
Fig. 6 Raman spectra(R-format) of (NH4)2SO4(aq)and BeSO4(aq) at 23 ◦C at lowwavenumbers, showing therestricted OH· · ·OSO2−
3translation mode at ca.190 cm−1, the very weak andbroad Be2+-OSO2−
3 mode at ca.
240 cm−1, the BeO4 stretchingmode at 348 cm−1, thesymmetric BeO4 stretchingmodes at ca. 498 and 531 cm−1,and the SO2−
4 deformationmodes, ν2 and ν4, at 451 and617 cm−1. Note that the SO2−
4deformation modes, ν2 and ν4,are slightly shifted to lowerwavenumber in BeSO4(aq) at ca.446 and 613 cm−1
possible to differentiate between the modes of the ligated and the unligated sulfate in the S-Ostretching region (800–1300 cm−1) and less characteristic in the S-O bending region (451and 620 cm−1). The spectroscopic characterization of unligated i.e. unassociated sulfate hasbeen described in Sect. 3.2. Additionally to the changes in the S-O stretching and bendingregion of the ligated sulfate, a shift or splitting of the metal aqua modes and the appearanceof a metal-ligand vibration at low frequencies (100–600 cm−1) should be detectable [14,32–35]. It is noteworthy that in crystalline BeSO4·4H2O and Be2+-perchlorate and -chloridesolutions Be2+ occurs in form of a tetraaqua cation, Be(OH2)2+
4 (cf. results in Sect. 3.1). Thespectroscopic features of the beryllium(II) aqua ion, the sulfate modes and the vibrations inthe low wavenumber region of BeSO4(aq) are discussed below.
3.3.1 Low Frequency Region (40–800 cm−1)
Significant differences exist between the Raman spectra of BeSO4(aq) and (NH4)2SO4(aq)in the low frequency region. However, as has been explained above (and discussed in detailpreviously [18, 20]), to make meaningful comparisons in this region it is essential to useR-normalized data, so as to obtain spectra free of the influence of the broad quasi-elasticRayleigh wing. Figure 6 compares the spectrum of a 3.260 mol·kg−1 BeSO4 solution (uppertrace, A) with that of a 2.742 mol·kg−1 (NH4)2SO4 solution (bottom trace, B) at 23 ◦C inthe low wavenumber region from 50–800 cm−1. Both spectra exhibit the restricted trans-lation mode of OH· · ·OSO2−
3 at ca. 190 cm−1 along with the SO2−4 deformation modes ν2
at 451 cm−1 and ν4 at 620 cm−1. However, the latter two bands in BeSO4(aq) are broad-ened and asymmetric relative to (NH4)2SO4(aq) due to very weak contributions at 432 cm−1
and 625 cm−1. Both deformation modes shift slightly to lower frequencies with increas-ing concentration of the salt. Furthermore, in BeSO4(aq) the ν1-BeO4 mode at 531 cm−1 isobserved as well as a separate one at 498 cm−1. Both modes are strongly polarized and anew weak and broad mode at ∼240 cm−1, also polarized, is apparent although the overlapwith the broad mode at 190 cm−1 is severe. All of these features become more pronouncedwith increasing temperature (Fig. 7, top trace). While Be(ClO4)2(aq) at 23 ◦C (Fig. 1 inRef. [13]) and BeCl2 (Fig. 2) show only one symmetric ν1-BeO4 mode at 531 cm−1, inBeSO4(aq) a separate mode at 498 cm−1 on the ν1-BeO4 mode is clearly distinguishable(Fig. 7, top and middle trace). The most compelling assignment of this component is that

J Solution Chem (2010) 39: 1039–1059 1049
Fig. 7 Polarized Raman spectraof BeSO4(aq), 3.26 mol·kg−1, at23 ◦C and 40 ◦C (medium traceand upper trace) in comparisonwith (NH4)2SO4(aq),2.742 mol·kg−1, at lowwavenumbers, showing theBe2+-OSO2−
3 mode at ca.
240 cm−1, the BeO4 stretchingmodes at ca. 498 and 531 cm−1,and the SO2−
4 deformationmodes, ν2 and ν4 at ca. 446 and612 cm−1
Fig. 8 Isotropic Raman spectraof BeSO4(aq) at 23 ◦C at lowwavenumbers, showing the BeO4and BeO*O3 stretching modes531 cm−1 and at 498 cm−1,respectively, and a weak isotropiccontribution of the SO2−
4deformation mode, ν2 at ca.430 cm−1
it is due to the Be-OH2 stretching mode of the sulfato complex [(H2O)3BeOSO3], hereafterabbreviated ν1-BeO3O*, for which further details are given below. The penetration of SO2−
4into the first coordination sphere of the Be2+ lowers the BeO4 symmetry, which leads to ashift of the Be-OH2 symmetric stretch to lower frequencies. The mode ν1 of BeO4 of theBe(OH2)2+
4 unit in the solid state is observed at 544 cm−1, slightly higher than in solutionstate (531 cm−1); cf. results in Ref. [13]. A concentration profile of selected isotropic Ra-man spectra of BeSO4 solutions at 23 ◦C, showing the ν1-BeO4 mode in a component at531 cm−1 due to Be(OH2)2+
4 and a mode at 498 cm−1 for the beryllium(II) sulfato complex,is presented in Fig. 8. At higher temperatures the sulfato complex formation increases andtherefore the mode at 498 cm−1 for the complex species, [(H2O)3BeOSO3] is even morestrikingly observable in the Raman spectrum (upper trace in Fig. 7). These observations areclear evidence that the sulfate has replaced water in the first coordination sphere of the Be2+ion. Only in Al2(SO4)3, Ga2(SO4)3 and In2(SO4)3 solutions [32–35] is such a clear splittingof the aqua modes into the fully hydrated species and the partially hydrated sulfato complexspecies observable.
The assignment of the isotropic mode in Fig. 7 (upper and middle trace) and Fig. 8 at498 cm−1 to [(H2O)3BeOSO3] is clear evidence for formation of a beryllium-inner-spherecomplex with SO2−
4 while the mode at 531 cm−1 is assigned to the fully hydrated speciesBe(OH2)2+
4 . In a deuterated BeSO4 solution a comparable picture is observable, namely theisotropic component of the sulfate bending mode of the ligated sulfate and the two isotropic

1050 J Solution Chem (2010) 39: 1039–1059
Fig. 9 Concentration(mol·kg−1) dependence of theRiso spectrum in the ν1-SO2−
4region for BeSO4(aq) at 23 ◦C.Note the arrow marks the modeat 1014 cm−1 assigned to ν1 ofthe bound sulfate
components of BeO4 at 507 cm−1 and 476 cm−1, respectively. This is clear proof that sul-fate penetrates the first hydration sphere of Be(OH2)2+
4 forming a stable [Be(OH2)3OSO3]complex. The tetrahedral coordination arrangement of Be2+ is unchanged.
The weak isotropic component at 432 cm−1 is obviously a component of the deformationmode of the ligated sulfate. Evidence for direct bonding between SO2−
4 and Be2+ stemsfrom observation of the Be2+-OSO2−
3 band at ∼240 cm−1 (Fig. 7 upper trace). Consistentwith increased formation of ISCs at higher temperature, the component analysis shows thatthe relative importance of both the 498 cm−1 and 240 cm−1 modes rises in intensity withincrease in temperature. The S-O stretching modes are now discussed below.
3.3.2 Sulfate Stretching Mode Region (800–1300 cm−1)
The spectroscopic characteristics of the strong ν1-SO2−4 profile in BeSO4(aq) differ con-
siderably from those observed for the free, i.e. non-associated, (NH4)2SO4(aq) solutions(Figs. 4 and 9). At ambient temperatures the ν1-SO2−
4 band at ∼980 cm−1 shifts to slightlyhigher wavenumbers and a separate band component at 1014 cm−1 increases in intensityas the BeSO4 concentration rises. A concentration profile of the ν1-SO2−
4 Raman bands ofaqueous BeSO4 solutions is depicted in Fig. 9. Smaller isotropic contributions were alsodetectable at 765 cm−1, 895 cm−1, 1054 cm−1, 1072 cm−1 and very weak contribution at1154 cm−1. The changes in νmax and the fwhh of ν1-SO2−
4 band without the 1014 cm−1 con-tribution in BeSO4(aq) are quantified and compared with those for (NH4)2SO4(aq) in Fig. 5.In a deuterated BeSO4 solution the band at 1014 cm−1 is clearly detectable as a separatecomponent from the sulfate mode at ∼ 982 cm−1 (Fig. 11). Table 2 shows Raman data of a3.260 mol·kg−1 aqueous BeSO4 solution and in addition to the modes of BeO4 the modesof the sulfate, free i.e. non-associated and ligated sulfate are tabulated. BeSO4 solutions arequite acid (pH ∼ 2 for a 1.835 mol·L−1) and therefore small quantities of HSO−
4 are formeddue to hydrolysis and these modes are also given in Table 2. The weak modes at 895 cm−1,and 1054 cm−1 stem clearly from HSO−
4 [29]. A detailed discussion of spectral features ofthe HSO−
4 ion is given below.The band at 1014 cm−1 arising from a sulfato complex of hydrated beryllium(II), has
never been described before except in a recent publication about common beryllium saltsin aqueous solutions [13]. Consistent with this assignment, the intensity of the 1014 cm−1
mode decreases with lower concentrations, but furthermore, a good correlation exists be-tween the band intensity of the 1014 cm−1 contribution with the one of the ν1-BeO3O*

J Solution Chem (2010) 39: 1039–1059 1051
Fig. 10 Polarized Ramanspectra of (NH4)2SO4(aq),2.720 mol·kg−1, at 23 ◦C (A)and BeSO4(aq) 3.260 mol·kg−1,at 23 ◦C (B) and 40 ◦C (C). Note,that the spectrum of2.720 mol·kg−1 (NH4)2SO4(aq)has been shifted by 4.0 cm−1 tohigher wavenumbers for clarity
Fig. 11 Raman spectrum (Ipol,Idepol and Iiso) of a BeSO4solution in D2O at 23 ◦C. Note,that the broad band at 1203 cm−1
stems from the deformation modeof D2O. The deuterated solutionwas acidified with a smallamount of D2SO4 and therefore afairly high portion of DSO−
4 (ca.
0.15 mol·L−1) is present (modesat 862 cm−1 and 1060 cm−1)
component at 498 cm−1. The relationship of the integrated intensity of the ν1-BeO3O* com-ponent at 498 cm−1 against that of the ν1-SO2−
4 component at 1014 cm−1 results in a goodcorrelation between their normalized intensities as required for the assignment of these twobands to the formation of ISC. The existence of ISCs rather than OSC as the last stage ofthe multistage association process between Be2+(aq) and SO2−
4 (aq) is confirmed by the in-crease in the 1014 cm−1 contribution with temperature. Thus the rather small contribution at1014 cm−1 becomes a prominent component at 40 ◦C (Fig. 10). The sulfato complex forma-tion is clearly an endothermic process (increase of aquaberyllium(II) sulfato complex withenhancing temperature (Fig. 10)). In a similar system, namely MgSO4(aq), aside from theν1-SO2−
4 mode of free sulfate at ∼980 cm−1, a band at 993 cm−1 has been recently assignedto an inner-sphere complex between Mg2+ and SO2−
4 [14].Such behavior would not be expected for an OSC but is consistent with the increase of
an ISC resulting from the weakening of the first hydration sphere with temperature increase.The hydrolysis of Be2+ is detectable even at 23 ◦C and with an increase in temperature the
hydrolysis is enhanced and therefore [HSO−4 ] rises as detectable by the mode at 1054 cm−1
(Fig. 10). As mentioned, both polarized modes at 895 cm−1 and 1054 cm−1 can be clearlyassigned as bands of the HSO−
4 ion [29]. As a result of the hydrolysis of [Be(OH2)2+4 ], small
amounts of hydrogen sulfate are formed in beryllium sulfate solutions:
[Be(OH2)4]2+ + H2O � [Be(OH2)3(OH)]+ + H3O+ (11)

1052 J Solution Chem (2010) 39: 1039–1059
Table 2 Polarized Raman data of a 3.260 mol/kg BeSO4 solutions in water at 23 ◦C
BeSO4(aq) Assignment
νmax/cm−1 I Γ1/2/cm−1 ρ
175 1 br p νT OH· · ·O240 0.5 br p Be-O-SO
348 0.02 br dp ν4 [Be(OH2)2+4 ]
429 0.05 24 p SO2−4 complex
448 5 34 dp ν2(e) SO2−4
498 1.3 38 p ν1 [Be(OH2)3OSO3]
531 1.2 34 0.008 ν1 [Be(OH2)2+4 ]
612 3.2 25 dp ν4-SO2−4 ; SO2−
4 complex
765 3.6 32 p ν3-SO2−4 complex and ν3-[Be(OH2)2+
4 ]
895 2.2 46 p HSO−4
983.5 100 12 0.004 ν1(a1) SO2−4
1014 22 38 0.01 SO2−4 complex
1054 1.2 19.5 p HSO−4
1074 9 48 0.02 SO2−4 complex
1108 1 36 dp ν3(f2) SO2−4
1150 2 44 p SO2−4 complex
br = broad; p = polarized; dp = depolarized
which is coupled with the sulfate ionization reaction according to Eq. 12:
H3O+ + SO2−4 � HSO−
4 + H2O (12)
The degree of hydrolysis may be determined by measuring the equilibrium concentrationsof HSO−
4 and “free” SO2−4 . Unfortunately, both HSO−
4 modes are of very low intensityand the mode at 1054 cm−1 is even severely overlapped. The concentration of HSO−
4formed is <1% at 23 ◦C and slightly bigger at 40 ◦C. It shall be noted that the hydroly-sis of [Be(OH2)4]2+(aq) has been extensively studied (cf. e.g. Ref. [36–39]) and the fol-lowing species (in addition to [Be(OH2)4]2+) seem to be established: Be2OH3+, Be(OH)2
and [Be3(OH)3]3+ and two higher oligomers [39]. From these studies it becomes clear thatthe mononuclear species Be(OH)+ is highly reactive and forms at higher concentrations(>0.001 mol·L−1), a dimer Be2OH3+, and Eq. 11 may only express the hydrolysis on a for-mal basis. On the other hand, the hydrolysis is small, even at 40 ◦C (∼0.6%) [40] and specieswith a higher OH−/Be(II) ratio or higher oligomers do not exist in these acidic solutions (thepH values of a few BeSO4 solutions are given in Sect. 2; see also Ref. [40]).
The infrared absorption spectroscopic data on the BeSO4(aq) solution series shows strongfeatures of sulfato complex formation of Be2+(aq) as well. To recall (see Sect. 3.2) the freeundissociated infrared spectrum of SO2−
4 (aq) shows only two modes which are infrared ac-tive, namely ν4(f2), a deformation mode at 620 cm−1, and ν3(f2), a antisymmetric stretchingmode at 1104 cm−1 (cf. Fig. 3). The weak deformation mode at 621 cm−1 (cf. Fig. 12) isoverlapped by a broad and strong librational mode of water centered at ∼680 cm−1 [41]and is therefore difficult to analyze. The concentration profiles of BeSO4(aq) presentedin Fig. 12 (wavenumber range from 400 to 2000 cm−1) show the deformation mode ν4-SO2−
4 at 620 cm−1 as a rather broad band, two very weak ν1-SO2−4 band components at

J Solution Chem (2010) 39: 1039–1059 1053
Fig. 12 Infrared absorptionspectra of four BeSO4 solutions;from top to bottom:(A) 3.26 mol·kg−1;(B) 1.91 mol·kg−1;(C) 0.944 mol·kg−1and (D)0.239 mol·kg−1 at 23 ◦C
Fig. 13 Infrared absorptionspectra of ν3-SO2−
4 band,showing the sum, componentband and residual curves at 23 ◦Cfor A: 3.260 mol·kg−1 BeSO4solution and B: 2.742 mol·kg−1
(NH4)2SO4 solution. Note, thatthe single band ν3-SO2−
4 of
SO2−4 (aq) (B) lies at 1106 cm−1
and the fwhh = 77 cm−1. Theν3-SO2−
4 band complex in theBeSO4 solution (A) is ∼1.7times broader than in the(NH4)2SO4 solution andcontains 4 component bandsincluding the component of theundisturbed SO2−
4 (aq) at
1114 cm−1
979 cm−1, a broad one at 1014 cm−1 and a broad very strong and asymmetrically structuredν3-SO2−
4 band at ∼1090 cm−1. In addition to these modes the deformation mode of water at1644 cm−1 can be observed. Figure 13 compares the infrared absorption spectra of ν3-SO2−
4band of a 3.260 mol·kg−1 BeSO4 solution and of a 2.742 mol·kg−1 infrared (NH4)2SO4
solution spectrum. It is obvious from Fig. 13 that the ν3-SO2−4 band splits in BeSO4(aq)
into four components with component bands at 1083, 1115, 1149 and 1188 cm−1 (Fig. 13)contrasting with the result for (NH4)2SO4(aq) which shows only a single broad band with afwhh equal to 75 cm−1. Furthermore, the ν1(a1)-SO2−
4 band shows the previously mentionedtwo very weak components, the first at ∼980 cm−1 and second a broad one at 1014 cm−1.The mode at ∼980 cm−1 is due to free undissociated SO2−
4 (aq) and its appearance is causedby the slight lifting of the Td symmetry by the inhomogeneous environment of the hydrationsphere. This phenomenon has already been observed and does not offer proof for inner-sphere complex formation. The broad mode at 1014 cm−1 is certainly due to the ν1 mode ofthe sulfato complex of Be2+. The occurrence of a very weak ν1-SO2−
4 mode in the infrared

1054 J Solution Chem (2010) 39: 1039–1059
spectra at ∼980 cm−1 in (NH4)2SO4(aq) has been reported recently [46, 47] and reflectsthe hydrated sulfate and the sulfate of the OOC and OSC while the mode at 1014 cm−1 iscertainly due to the ISC of Be2+.
In summary, the mode at 1014 cm−1, which does not occur in (NH4)2SO4 solutions (com-pare Figs. 13 and 3), represents the sulfato complex of Be2+. Furthermore, the componentbands of the ν3-SO2−
4 band complex are assigned to bound sulfate, Be2+-O-SO2−3 , due to
lifting of Td symmetry of the ligated sulfate.The sulfato complex formation can be written according to Eq. 13
[Be2+(H2O)4·SO2−4 ] � [Be2+(H2O)3OSO2−
3 ] + H2O (13)
and represents the last step of the multistep association formulated by Eigen [44, 45]. A sim-ilar association in MgSO4(aq) may be noted [14].
3.4 Quantitative Analysis of Contact Ion Pair Formation in BeSO4(aq)
Given, as shown above, that the 1014 cm−1 band of the ν1-SO2−4 mode can be assigned to a
sulfato complex, it is possible to use Raman spectroscopy to derive an association constantfor the sulfato complex formation. The association between Be2+(aq) and SO2−
4 (aq) ions isgenerally accepted to occur via a three step process, referred to as the Eigen mechanism [44,45], in which the strongly hydrated ions combine initially to form a OOC or, in the languageof inorganic chemistry, an outer–outer sphere complex. The two interceding water moleculesare then lost successively, forming OSCs (outer sphere complexes) and finally ISCs (innersphere complexes). This process is summarized in the following reaction scheme:
Be2+(aq) + SO2−4 (aq)
K1� Be2+(OH2)2SO2−4 (aq)
K2� Be2+(OH2)SO2−4 (aq)
free hydrated ions OOC OSC
K3� Be2+OSO2−3 (aq) (14)
ISC
where Ki (i = 1 to 3) are the ‘stepwise’ constants for the designated equilibria expressed forconvenience in terms of concentration: K1 = [OOC]/[Be2+][SO2−
4 ], K2 = [OSC]/[OOC],and K3 = [ISC]/[OSC].
The overall association constant, KA, as measured by traditional techniques such as po-tentiometry or conductivity, corresponds to the equilibrium:
Be2+(aq) + SO2−4 (aq) � BeSO0
4(aq) (15)
where BeSO04(aq) refers to all forms of associated {Be2+,SO2−
4 } species of 1:1 stoichiom-etry in aqueous solution (solution thermodynamics makes no distinction between dissolvedspecies of identical stoichiometry but differing levels of hydration). It has been shown thatthe association constant derived from Raman spectroscopy KR is much smaller than the as-sociation constants derived from traditional methods, such as potentiometry, conductivity,and other thermodynamic methods. The association constant KA is readily shown, ignoringactivity coefficient effects throughout, to be related to the Ki values via:
KA = K1(1 + K2 + K2K3) (16)
The Ki values, determined by repetitive relaxation techniques (T - and p-jump excitation)[42, 43] is at ∼0.7 much higher than the value for Ki = ∼0.1 measured for the MgSO4(aq)

J Solution Chem (2010) 39: 1039–1059 1055
Fig. 14 Fraction of berylliumsulfato-complex(inner-sphere-complex) as afunction of the total BeSO4concentration determined byRaman spectroscopy at 23 ◦C
system. The equilibrium constant for the association between Be2+(aq) and SO2−4 (aq) mea-
sured by Raman spectroscopy differs from both KA and Ki because Raman spectroscopydoes not easily allow for the determination of the equilibrium concentration of the outer-sphere complex, which is necessary to formulate Ki . Regardless of the relationship betweenKR, KA and Ki , as detailed in [14], it is noteworthy that both Raman spectroscopy and UAdetect inner-sphere complexes directly, so it is possible to make a quantitative comparisonbetween them in the form of a degree of association, α. Figure 14 shows the present Ra-man results (expressed as the fraction of SO2−
4 presented as ISCs: α = [ISC]/[SO2−4 ]T as a
function of [BeSO4]T (see Sect. 2).In order to quantify the degree of ISC-formation in Sect. 3.4 it was assumed that the ν1-
SO2−4 mode consisted of only two components: one at ∼980 cm−1 associated with ‘free’
SO2−4 and the other at ∼1014 cm−1 associated with ISCs. On this basis and consistent
with the generally accepted view that when using only ligand vibrations, OOCs and OSCsare indistinguishable from the unassociated ion [14]. It would be expected that subtractionof the ISC contribution from the ν1-SO2−
4 envelope would produce a mode with charac-teristics similar to those observed for ν1-SO2−
4 in solutions of an unassociated salt suchas (NH4)2SO4. However, when this decomposition is performed, the ‘free’ SO2−
4 modein BeSO4(aq) shows systematic differences from that observed for (NH4)2SO4(aq) whichis thought to be non-associated. In particular (Fig. 5), the ν1-SO2−
4 mode in BeSO4(aq)at ∼980 cm−1, after removal of the 1014 cm−1 band component, shows changes in posi-tion and fwhh with increasing concentration that are of much greater magnitude and, in thecase of νmax, in the opposite direction to those of ν1-SO2−
4 in (NH4)2SO4(aq). These effectsare small (�νmax ≤ 3 cm−1; �fwhh ≤ 4.0 cm−1) but they are reproducible. Importantly, invery dilute solutions the shape and peak location of the ν1-SO2−
4 mode in BeSO4(aq) and(NH4)2SO4(aq) become identical.
In aqueous solution, the sulfate modes are influenced by the environment (environmen-tal broadening). While there is probably a continuum of perturbing environments, it can beassumed that there are preferred energy minima within this continuum. These minima canbe interpreted as corresponding to ion pairs. Thus, the most straightforward explanation forthese effects is that the ‘free’ SO2−
4 mode at ∼980 cm−1 overlaps with another mode centeredat slightly higher wavenumbers. It seems both plausible and chemically reasonable to assignthis extra mode to the presence of OSCs. Although (and as discussed above) it is generallythought [14] that Raman spectra involving anion vibrations can distinguish only between‘free’ anions and those involved in direct bonding to the cations (ISCs), James and Frost

1056 J Solution Chem (2010) 39: 1039–1059
Table 3 Band fitting results for the ν1-SO2−4 band complex at ∼ 982 cm−1 and for the component bands
at 980.5 cm−1 (fully hydrated sulfate plus the contribution of the SO2−4 in the outer-outer-sphere complex),
the ν1-SO2−4 band component at 982.6 cm−1 (outer-sphere complex) and the ν1-SO2−
4 band component at
1014 cm−1 assigned for the inner-sphere-complex at 23 ◦C. K3 is the equilibrium constant for the inner-sphere complexformation
Conc. A980.5 A982.6 A1014 [SO2−4 ]980.5 [SO2−
4 ]OSC [SO2−4 ]1014 K3
(mol·kg−1)
0.101 36,867 26,153 6403.4 0.0459 0.0326 0.0225 0.69
0.239 87,366 60,712 17,016 0.1066 0.0740 0.0584 0.79
0.465 171,759 92,486 32,089 0.2253 0.1213 0.1184 0.98
0.944 384,648 172,813 73,438 0.4752 0.2135 0.2553 1.20
1.874 758,178 340,631 159,672 0.9177 0.4123 0.5439 1.32
1.910 786,031 321,055 160,987 0.9623 0.3930 0.5547 1.41
3.260 1,303,076 506,752 267,266 1.6581 0.6448 0.9571 1.48
[48, 49] have detected both ISCs and OSCs in their Raman studies of weak metal ion/nitratecomplexes in aqueous solutions. Their assignment was based on a Fourier transform proce-dure for signal narrowing and subsequent band fitting, and assumed that the peak positionsof the ‘free’ nitrate and the nitrate in the OSCs and ISCs were virtually independent of con-centration. The other sulfate modes also show effects consistent with the formation of OSCs.Thus, the restricted O–H· · ·OSO2−
3 stretching mode at ∼190 cm−1 in 2 mol·L−1 BeSO4(aq)is much broader (fwhh ≈ 200 cm−1) than in 2 mol·L−1 (NH4)2SO4(aq) (fwhh ≈ 175 cm−1)and ν2- and ν4-SO2−
4 in BeSO4(aq) are broadened compared with (NH4)2SO4(aq) (Fig. 5).Although the above assignment appears reasonable, an unambiguous decomposition of
the ‘free’ ν1-SO2−4 band is difficult because of the severe overlap of the components. The
fitting procedure employed was based on considerations similar to those used by Frost andJames [44, 45]. As the effects of OSC formation on ν1-SO2−
4 were very much less thanthose of ISC formation, it was assumed that OOC would not be Raman-distinguishablefrom SO2−
4 (aq). The total ν1-SO2−4 mode was then fitted with the minimum number of com-
ponents that produced concentration-independent band parameters, except for the intensity.The concentrations on ISCs, OSCs and {OOC + SO2−
4 (aq)} derived from the present de-composition of the ν1-SO2−
4 mode are presented in Table 3. It is noteworthy to state that thescattering coefficients Ji for “free” sulfate at 980.5 cm−1 and sulfate at 982.56 cm−1 boundas in OSCs are approximately the same, J980.5 = J982.6. The value of K3, the equilibriumconstant of the inner-sphere sulfato complex formation is 0.65 ± 0.1 for an infinitely diluteBeSO4 solution is in quite good agreement with an ultrafast kinetic study [42]. On the otherhand, the overall association constant, KA = 100 L·mol−1 at 25 ◦C [42] is much larger thanthe value determined by Raman spectroscopy because the KA value determined by conduc-tometric measurements records all 1:1 sulfato species formed, such as outer-outer-sphere,outer-sphere and inner-sphere complexes and must therefore be much larger than the Ramanvalue, K3 (or KR), which reflects only the last stage of the Eigen mechanism. Prerequisitefor a meaningful K3 value is the determination of the equilibrium concentration of the outer-sphere complex, [Be(OH2)SO2−
4 ].

J Solution Chem (2010) 39: 1039–1059 1057
4 Conclusions
Raman and infrared spectroscopic measurements have been carried out on aqueous BeSO4
solutions over a broad concentration range and at two different temperatures, 23 ◦C and40 ◦C. Be(ClO4)2, BeCl2 and (NH4)2SO4 solutions have been measured as well, and thespectra have been compared with those of the solutions of beryllium sulfate. The contri-bution at 1014 cm−1 to the sulfate mode ν1-SO2−
4 at 980 cm−1 has been assigned to thesulfate ligated to the Be2+(aq) cation. Other features characteristic for sulfato-complex for-mation have been given. The BeO*O3 mode is clearly separated from the BeO4 mode in-dicative for the hydrated Be2+ cation in aqueous beryllium perchlorate and chloride solu-tions. In the MgSO4–water system [14] ICSs are formed but the extent is smaller than inBeSO4(aq).
Acknowledgements The author thanks Dr. G. Irmer for the use of his Raman spectrometer and Dr. D. Fis-cher for the infrared spectra. Mrs. B. Ostermay is thanked for helping to measure the Raman spectra.
References
1. Wong, C.Y., Woollins, J.D.: Beryllium coordination chemistry. Coord. Chem. Rev. 130, 243–273 (1994)2. Bell, N.A.: Beryllium halides and pseudohalides. Adv. Inorg. Chem. Radiochem. 14, 255–332 (1972)3. Georgiev, M., Karadjova, V., Marinova, D., Stoilova, D.: Study on the hydrates of beryllium sulfate and
selenate: thermal analysis, X-ray diffraction and infrared spectroscopy. J. Univ. Chem. Technol. Metall.43, 139–148 (2008)
4. Dance, I.G., Freeman, H.C.: Refinement of the crystal structure of beryllium sulfate tetrahydrate. ActaCrystallogr. B25, 304–310 (1969)
5. Sikka, S.K., Chidambbaram, K.: A neutron diffraction determination of the structure of beryllium sulfatetetrahydrate, BeSO4·4H2O. Acta Crystallogr. B25, 310–315 (1969)
6. Kellersohn, T., Delaplane, R.G., Olovsson, I.: The synergetic effect in beryllium sulfate tetrahydrate- anexperimental electron-density study. Acta Crystallogr. B50, 316–326 (1994)
7. Zhang, Z., Lutz, H.D., Georgiev, M., Manev, M.: The first beryllium periodate: Be(H4IO6)2·4H2O. ActaCrystallogr. C52, 2660–2662 (1996)
8. Pigenet, C.: Activites Raman et Infrarouge des cristaux Piezo electriques BeSO4·4H2O et BeSO4·4D2O.J. Raman Spectrosc. 13, 66–77 (1982)
9. Fricke, R., Schützdeller, H.: Untersuchungen über Hydrate in wäßriger Lösung. I. Mitteilung: Das Beryl-liumion. Z. Anorg. Allg. Chem. 131, 130–139 (1923)
10. Alei, M., Jackson, J.A.: NMR determination of the hydration numbers of cations in aqueous perchloratesolutions. J. Chem. Phys. 41, 3402–3404 (1964)
11. Connick, R.E., Fiat, D.N.: Coordination numbers of beryllium and aluminium ions in aqueous solutions.J. Chem. Phys. 39, 1349–1351 (1963)
12. Pittet, P.A., Elbaze, G., Helm, L., Merbach, A.E.: Tetrasolventoberyllium(II): high-pressure evidence fora sterically controlled solvent-exchange-mechanism crossover. Inorg. Chem. 29, 1936– 1942 (1990)
13. Rudolph, W.W., Fischer, D., Irmer, G., Pye, C.C.: Hydration of beryllium(II) in aqueous solutions ofcommon inorganic salts. A combined vibrational spectroscopic and ab initio molecular orbital study.Dalton Trans. 7, 6513–6527 (2009)
14. Rudolph, W.W., Irmer, G., Hefter, G.T.: Raman spectroscopic investigation of speciation in MgSO4(aq).Phys. Chem. Chem. Phys. 5, 5253–5261 (2003)
15. Akilan, C., Rohman, N., Hefter, G., Buchner, R.: Temperature effects on ion association and hydrationin MgSO4 by dielectric spectroscopy. Chem. Phys. Chem. 7, 2319–2330 (2006)
16. Vogel, A.I.: A Text-Book of Quantitative Inorganic Analysis, 3rd edn. Longman, London (1961)17. Rudolph, W.W., Irmer, G.: Raman and infrared spectroscopic investigations on aqueous alkali metal
phosphate solutions and density functional theory calculations of phosphate–water clusters. Appl. Spec-trosc. 61, 1312–1327 (2007)
18. Rudolph, W.W., Fischer, D., Irmer, G.: Vibrational spectroscopy studies and density functional theorycalculations in the CO2-water system. Appl. Spectrosc. 60, 130–144 (2006)
19. Rudolph, W.W.: Hydration and water-ligand replacement in aqueous cadmium(II) sulfate solution: a Ra-man and infrared study. Faraday Trans. 92, 489–499 (1998)

1058 J Solution Chem (2010) 39: 1039–1059
20. Rudolph, W.W., Brooker, M.H., Pye, C.C.: Hydration of lithium ion in aqueous solution. J. Phys. Chem.99, 3793–3797 (1995)
21. Rudolph, W., Steger, E.: Dissoziation, Struktur und schneller Protonenaustausch der Phosphorsäure inverdünnter wäßriger Lösung. Z. Phys. Chem. 172, 49–59 (1995)
22. Pye, C.C., Rudolph, W.W., Poirier, R.A.: An ab initio investigation of lithium ion hydration. J. Phys.Chem. 100, 601–605 (1996)
23. Marcus, Y.: Effect of ions on the structure of water: structure making and breaking. Chem. Rev. 109,1346–1370 (2009); See especially Chap. 4.3.1
24. Rudolph, W., Schönherr, S.: I. Zur schwingungsspektroskopischen Charakterisierung des Hexaquo-aluminium(III)-Komplexions. Z. Phys. Chem. (Leipzig) 270, 1121–1134 (1989)
25. Rudolph, W., Schönherr, S.: II. Zur Sulfatokomplexbildung in Aluminiumsulfat – Lösungen und Hy-dratschmelzen. Z. Phys. Chem. 172, 31–48 (1991)
26. Rudolph, W., Schönherr, S.: III. Valenz- und Deformationsschwingungsbereich des Wassers desHexaquoaluminium(III)-Komplexions. Z. Phys. Chem. 173, 167–177 (1991)
27. Musinu, A., Paschina, G., Piccaluga, G.: On the structure of the NH+4 ion in aqueous solution. Chem.
Phys. Lett. 80, 163–167 (1981)28. Vollmar, P.M.: Ionic interactions in aqueous solution: a Raman spectral study. J. Chem. Phys. 39, 2236–
2248 (1963)29. Rudolph, W.: Structure and dissociation of hydrogen sulfate ion in aqueous solution over a broad tem-
perature range: a Raman study. Z. Phys. Chem. 194, 73–95 (1996)30. Pye, C.C., Rudolph, W.W.: An ab initio and Raman investigation of Mg(II) hydration. J. Phys. Chem. A
102, 9933–9943 (1998)31. Walrafen, G.E., Hokmabadi, M.S., Yang, W.-H., Chu, Y.C., Monosmith, B.: Collision-induced Raman,
scattering from water and aqueous solutions. J. Phys. Chem. 93, 2909–2917 (1989)32. Rudolph, W.W., Mason, R.: Studies of aqueous Al2(SO4)3 solutions under hydrothermal conditions:
sulfate ion pairing, hydrolysis and the formation of hydronium alunite. J. Solution Chem. 30, 527–548(2001)
33. Rudolph, W.W., Mason, R., Pye, C.C.: Aluminium(III) hydration in aqueous solution: a Raman spec-troscopic investigation and an ab initio molecular orbital study of aluminium(III) water clusters. Phys.Chem. Chem. Phys. 2, 5030–5040 (2000)
34. Rudolph, W.W., Pye, C.C.: Gallium(III) hydration in aqueous solution of perchlorate, nitrate and sulfate.Raman and 71-Ga NMR spectroscopic studies and ab-initio molecular orbital calculations of gallium(III)water clusters. Phys. Chem. Chem. Phys. 4, 4319–4327 (2002)
35. Rudolph, W.W., Fischer, D., Tomney, M.R., Pye, C.C.: Indium(III) hydration in aqueous solution ofperchlorate, nitrate and sulfate. Raman and infrared spectroscopic studies and ab-initio molecular orbitalcalculations of indium(III) water clusters. Phys. Chem. Chem. Phys. 6, 5145–5155 (2004)
36. Ohtaki, H.: Ionic equilibria in mixed solvents. I. Hydrolysis of beryllium ion in a 0.2 mole fractindioxane-water mixture containing 3 M LiClO4 as an ionic medium. Inorg. Chem. 6, 808–813 (1967)
37. Brown, P.L., Elis, J., Sylva, R.N.: The hydrolysis of metal ions. Part 7. Beryllium(II). J. Chem. Soc.Dalton Trans., 2001–2004 (1983)
38. Wood, S.A.: Theoretical prediction of speciation and solubility of beryllium in hydrothermal solutionto 300 °C at saturated vapour pressure: application to bertrandite/phenakite deposits. Ore Geol. Rev. 7,249–278 (1992)
39. Bruno, J.: Beryllium(II) hydrolysis in 3.0 mol dm−3 perchlorate. J. Chem. Soc. Dalton Trans., 2431–2437 (1987)
40. Prytz, M.: Hydrolysemessungen in Berylliumsalzlösungen. Z. anorg. Chem. 180, 355–369 (1929)41. Armishaw, R.F., James, D.W.: Structure of aqueous solutions relative intensity studies of the infrared
librational band in nitrate solutions. J. Phys. Chem. 80, 501–508 (1976)42. Brumm, P., Rüppel, H.: Kinetische Untersuchungen an Berylliumsulfat durch repetierende Temperatur-
sprunganregung. Ber. Bunsenges. Phys. Chem. 75, 102–106 (1971)43. Diebler, H., Eigen, M.: Das Relaxationszeitspektrum der chemischen Gleichgewichtseinstellung in
wäßrigen lösungen von Berylliumsulfat. Z. Phys. Chem. NF 20, 299–306 (1959)44. Eigen, M., Tamm, K.: Schallabsorption in Elektrolytlösungen als Folge chemischer relaxation. i. Relax-
ationstheorie der mehrstufigen Dissoziation. Z. Elektrochem. 66, 93–107 (1962)45. Eigen, M., Tamm, K.: Schallabsorption in Elektrolytlösungen als Folge chemischer Relaxation.
II. Meßergebnisse und Relaxationsmechanismen für 2-2–wertigen Elektrolyte. Z. Elektrochem. 66, 107–121 (1962)
46. Rudolph, W.W., Irmer, G.: Unpublished results, TU Dresden (2004)47. Wei, Z.-F., Zhang, Y.-H., Zhao, L.-J., Liu, J.-H., Li, X.-H.: Observation of the first hydration layer of
isolated cations and anions through the FTIR-ATR difference spectra. J. Phys. Chem. A 109, 1337–1342(2005)

J Solution Chem (2010) 39: 1039–1059 1059
48. James, D.W., Frost, R.L.: Ion-ion-solvent interactions in solution: aqueous solutions of nitrates of cationsfrom Groups 2A and 3A. Aust. J. Chem. 35, 1793–1806 (1982)
49. James, D.W., Carrick, M.T., Frost, R.L.: Structure of aqueous solutions: Fourier transformation and bandcomponent analysis in magnesium nitrate solutions. J. Raman Spectrosc. 13, 115–119 (1982)