RAIN RATE RETRIEVAL USING THE 183-WSL ALGORITHM
8
Rain rate retrieval using the 183-WSL algorithm S. Laviola, and V. Levizzani Institute of Atmospheric Sciences and Climate, National Research Council Bologna, Italy ([email protected]) ABSTRACT High spatial resolution AMSU-B opaque channels are used to retrieve rain rates and classify precipitation types. The retrieval scheme of the 183-WSL algorithm consists of two fast sections, one for land and the other for sea surface, that use the water strong absorption lines at 183.31 GHz to infer rain rate intensities based on a series of thresholds calculated to remove the condensed water vapor effect and discriminate between convective and stratiform pixels. The reported results show the sensitivity of the technique to detect deep convective clouds and to measure light-rain stratiform systems. This latter fact recommends application particularly over mid-latitude basins where persistent light rains cause intense run-off episodes. Other studies are planned to apply the method at high latitudes where the atmospheric humidity is mainly located within the surface layers and appropriate correction coefficients need to be found. 1. INTRODUCTION Over the past two decades satellite-based passive microwave (MW) sensors were increasingly exploited to retrieve atmospheric variables such as temperature and humidity profiles, and more complex cloud microphysics parameters such as cloud phase, liquid water and ice amounts, and hydrometeor sizes. The actual widespread use of MW frequencies is mainly justified by the substantially improved spatial resolution of the last generation sensors, which ranges between 5 and 16 km thus making it possible to estimate relevant hydrometeorological quantities at basin scale and to assimilate satellite-derived data into numerical weather prediction models thus improving both precipitation retrievals and weather forecasts. In this work we propose a new algorithm based on the 183.31 GHz water vapor absorption bands of the Advanced Microwave Sounding Unit-B (AMSU-B) on board the National Oceanic and Atmospheric Administration (NOAA) satellites, which is conceived to retrieve rain rates over land and sea. AMSU-B is the second module of the AMSU passive MW across-track scanner operating into the frequency range from 90 up to 190 GHz with a spatial resolution of 16 km at nadir view [1] [2]. An emission approach at 183.31 GHz is adopted to infer surface precipitation because one of our major targets is the estimation of warm rain typically associated to low and very low rain rates. The 183-WSL retrieval scheme, based on a suite of brightness temperature (BT) thresholds, distinguishes and classifies convective and stratiform precipitation while filtering out condensed
-
Upload
independent -
Category
Documents
-
view
1 -
download
0
Transcript of RAIN RATE RETRIEVAL USING THE 183-WSL ALGORITHM
Rain rate retrieval using the 183-WSL algorithm S. Laviola, and V. Levizzani
Institute of Atmospheric Sciences and Climate, National Research Council Bologna, Italy ([email protected])
ABSTRACT High spatial resolution AMSU-B opaque channels are used to retrieve rain rates and classify precipitation types. The retrieval scheme of the 183-WSL algorithm consists of two fast sections, one for land and the other for sea surface, that use the water strong absorption lines at 183.31 GHz to infer rain rate intensities based on a series of thresholds calculated to remove the condensed water vapor effect and discriminate between convective and stratiform pixels. The reported results show the sensitivity of the technique to detect deep convective clouds and to measure light-rain stratiform systems. This latter fact recommends application particularly over mid-latitude basins where persistent light rains cause intense run-off episodes. Other studies are planned to apply the method at high latitudes where the atmospheric humidity is mainly located within the surface layers and appropriate correction coefficients need to be found.
1. INTRODUCTION Over the past two decades satellite-based passive microwave (MW) sensors were increasingly exploited to retrieve atmospheric variables such as temperature and humidity profiles, and more complex cloud microphysics parameters such as cloud phase, liquid water and ice amounts, and hydrometeor sizes. The actual widespread use of MW frequencies is mainly justified by the substantially improved spatial resolution of the last generation sensors, which ranges between 5 and 16 km thus making it possible to estimate relevant hydrometeorological quantities at basin scale and to assimilate satellite-derived data into numerical weather prediction models thus improving both precipitation retrievals and weather forecasts. In this work we propose a new algorithm based on the 183.31 GHz water vapor absorption bands of the Advanced Microwave Sounding Unit-B (AMSU-B) on board the National Oceanic and Atmospheric Administration (NOAA) satellites, which is conceived to retrieve rain rates over land and sea. AMSU-B is the second module of the AMSU passive MW across-track scanner operating into the frequency range from 90 up to 190 GHz with a spatial resolution of 16 km at nadir view [1] [2]. An emission approach at 183.31 GHz is adopted to infer surface precipitation because one of our major targets is the estimation of warm rain typically associated to low and very low rain rates. The 183-WSL retrieval scheme, based on a suite of brightness temperature (BT) thresholds, distinguishes and classifies convective and stratiform precipitation while filtering out condensed
water vapor and snow cover on mountain top, which affects particularly more opaque superficial channels (i.e., 190 GHz).
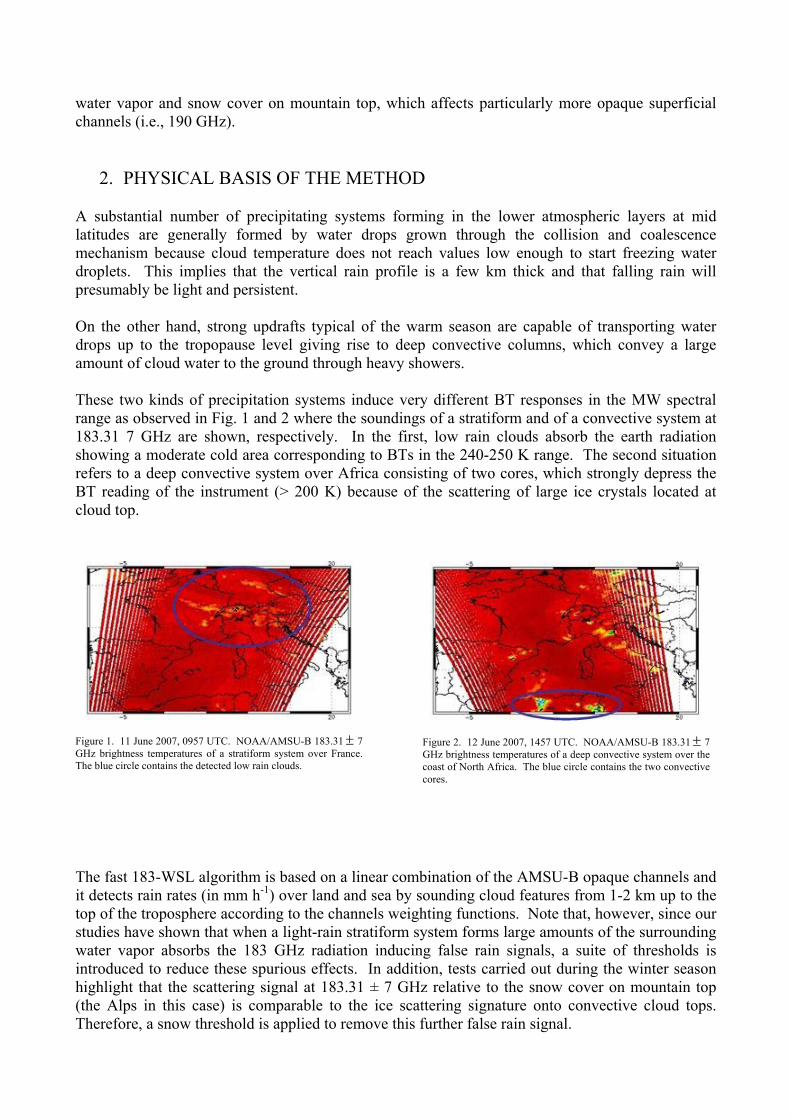
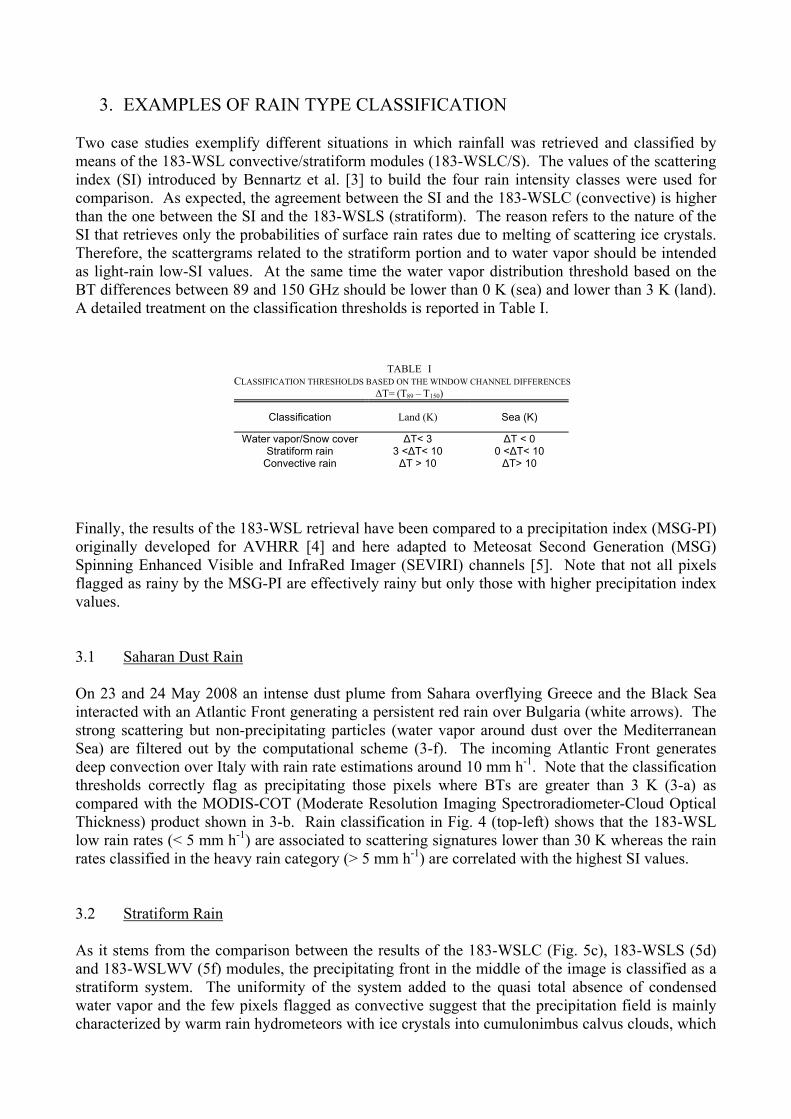
2. PHYSICAL BASIS OF THE METHOD A substantial number of precipitating systems forming in the lower atmospheric layers at mid latitudes are generally formed by water drops grown through the collision and coalescence mechanism because cloud temperature does not reach values low enough to start freezing water droplets. This implies that the vertical rain profile is a few km thick and that falling rain will presumably be light and persistent. On the other hand, strong updrafts typical of the warm season are capable of transporting water drops up to the tropopause level giving rise to deep convective columns, which convey a large amount of cloud water to the ground through heavy showers. These two kinds of precipitation systems induce very different BT responses in the MW spectral range as observed in Fig. 1 and 2 where the soundings of a stratiform and of a convective system at 183.31 7 GHz are shown, respectively. In the first, low rain clouds absorb the earth radiation showing a moderate cold area corresponding to BTs in the 240-250 K range. The second situation refers to a deep convective system over Africa consisting of two cores, which strongly depress the BT reading of the instrument (> 200 K) because of the scattering of large ice crystals located at cloud top.
The fast 183-WSL algorithm is based on a linear combination of the AMSU-B opaque channels and it detects rain rates (in mm h-1) over land and sea by sounding cloud features from 1-2 km up to the top of the troposphere according to the channels weighting functions. Note that, however, since our studies have shown that when a light-rain stratiform system forms large amounts of the surrounding water vapor absorbs the 183 GHz radiation inducing false rain signals, a suite of thresholds is introduced to reduce these spurious effects. In addition, tests carried out during the winter season highlight that the scattering signal at 183.31 ± 7 GHz relative to the snow cover on mountain top (the Alps in this case) is comparable to the ice scattering signature onto convective cloud tops. Therefore, a snow threshold is applied to remove this further false rain signal.
Figure 1. 11 June 2007, 0957 UTC. NOAA/AMSU-B 183.31± 7 GHz brightness temperatures of a stratiform system over France.The blue circle contains the detected low rain clouds.
Figure 2. 12 June 2007, 1457 UTC. NOAA/AMSU-B 183.31± 7 GHz brightness temperatures of a deep convective system over the coast of North Africa. The blue circle contains the two convective cores.
3. EXAMPLES OF RAIN TYPE CLASSIFICATION Two case studies exemplify different situations in which rainfall was retrieved and classified by means of the 183-WSL convective/stratiform modules (183-WSLC/S). The values of the scattering index (SI) introduced by Bennartz et al. [3] to build the four rain intensity classes were used for comparison. As expected, the agreement between the SI and the 183-WSLC (convective) is higher than the one between the SI and the 183-WSLS (stratiform). The reason refers to the nature of the SI that retrieves only the probabilities of surface rain rates due to melting of scattering ice crystals. Therefore, the scattergrams related to the stratiform portion and to water vapor should be intended as light-rain low-SI values. At the same time the water vapor distribution threshold based on the BT differences between 89 and 150 GHz should be lower than 0 K (sea) and lower than 3 K (land). A detailed treatment on the classification thresholds is reported in Table I. Finally, the results of the 183-WSL retrieval have been compared to a precipitation index (MSG-PI) originally developed for AVHRR [4] and here adapted to Meteosat Second Generation (MSG) Spinning Enhanced Visible and InfraRed Imager (SEVIRI) channels [5]. Note that not all pixels flagged as rainy by the MSG-PI are effectively rainy but only those with higher precipitation index values. 3.1 Saharan Dust Rain
On 23 and 24 May 2008 an intense dust plume from Sahara overflying Greece and the Black Sea interacted with an Atlantic Front generating a persistent red rain over Bulgaria (white arrows). The strong scattering but non-precipitating particles (water vapor around dust over the Mediterranean Sea) are filtered out by the computational scheme (3-f). The incoming Atlantic Front generates deep convection over Italy with rain rate estimations around 10 mm h-1. Note that the classification thresholds correctly flag as precipitating those pixels where BTs are greater than 3 K (3-a) as compared with the MODIS-COT (Moderate Resolution Imaging Spectroradiometer-Cloud Optical Thickness) product shown in 3-b. Rain classification in Fig. 4 (top-left) shows that the 183-WSL low rain rates (< 5 mm h-1) are associated to scattering signatures lower than 30 K whereas the rain rates classified in the heavy rain category (> 5 mm h-1) are correlated with the highest SI values. 3.2 Stratiform Rain As it stems from the comparison between the results of the 183-WSLC (Fig. 5c), 183-WSLS (5d) and 183-WSLWV (5f) modules, the precipitating front in the middle of the image is classified as a stratiform system. The uniformity of the system added to the quasi total absence of condensed water vapor and the few pixels flagged as convective suggest that the precipitation field is mainly characterized by warm rain hydrometeors with ice crystals into cumulonimbus calvus clouds, which
TABLE I CLASSIFICATION THRESHOLDS BASED ON THE WINDOW CHANNEL DIFFERENCES
ΔT= (T89 – T150)
Classification Land (K) Sea (K)
Water vapor/Snow cover ΔT< 3 ΔT < 0 Stratiform rain 3 <ΔT< 10 0 <ΔT< 10
Convective rain ΔT > 10 ΔT> 10
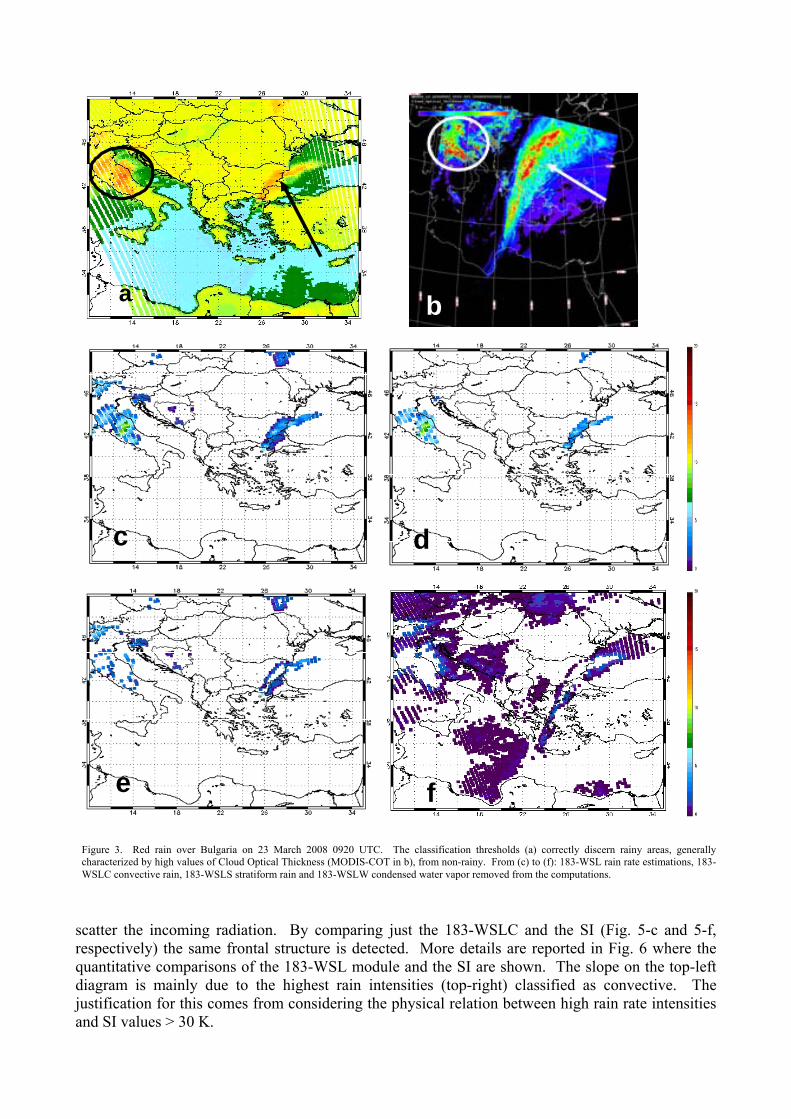
scatter the incoming radiation. By comparing just the 183-WSLC and the SI (Fig. 5-c and 5-f, respectively) the same frontal structure is detected. More details are reported in Fig. 6 where the quantitative comparisons of the 183-WSL module and the SI are shown. The slope on the top-left diagram is mainly due to the highest rain intensities (top-right) classified as convective. The justification for this comes from considering the physical relation between high rain rate intensities and SI values > 30 K.
aa
bb
cc
dd
ee
ff
Figure 3. Red rain over Bulgaria on 23 March 2008 0920 UTC. The classification thresholds (a) correctly discern rainy areas, generallycharacterized by high values of Cloud Optical Thickness (MODIS-COT in b), from non-rainy. From (c) to (f): 183-WSL rain rate estimations, 183-WSLC convective rain, 183-WSLS stratiform rain and 183-WSLW condensed water vapor removed from the computations.
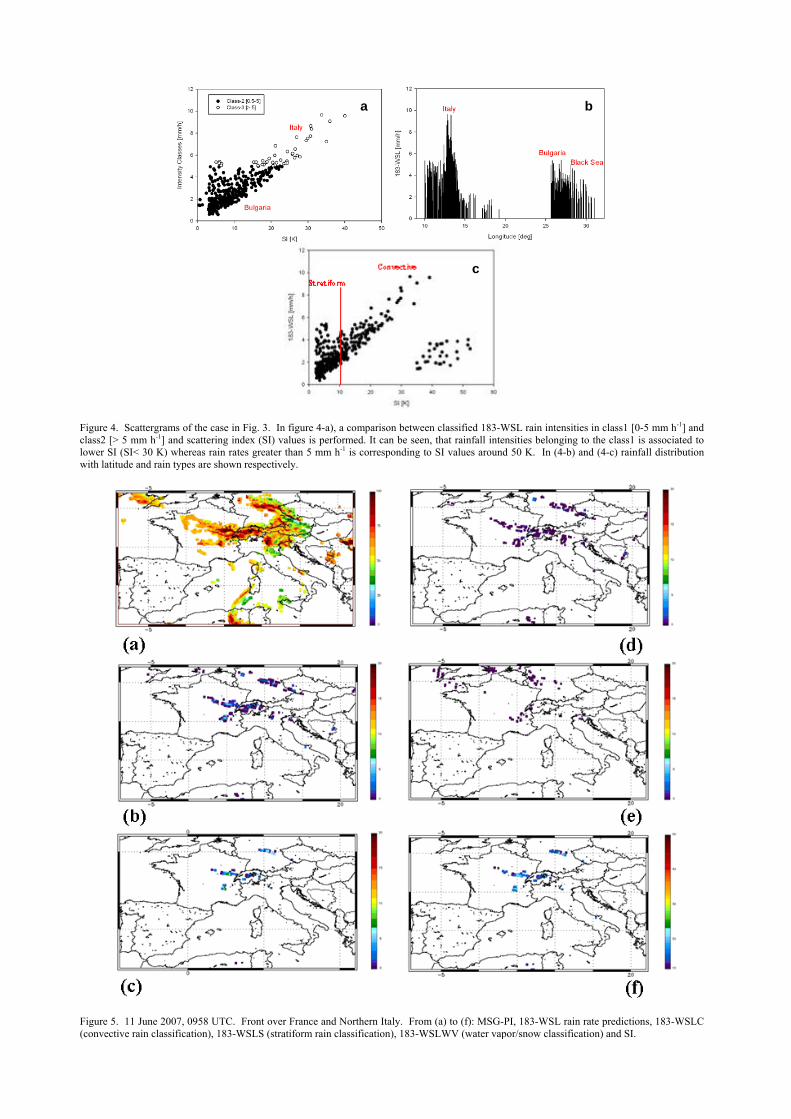
Figure 4. Scattergrams of the case in Fig. 3. In figure 4-a), a comparison between classified 183-WSL rain intensities in class1 [0-5 mm h-1] and class2 [> 5 mm h-1] and scattering index (SI) values is performed. It can be seen, that rainfall intensities belonging to the class1 is associated to lower SI (SI< 30 K) whereas rain rates greater than 5 mm h-1 is corresponding to SI values around 50 K. In (4-b) and (4-c) rainfall distribution with latitude and rain types are shown respectively.
Figure 5. 11 June 2007, 0958 UTC. Front over France and Northern Italy. From (a) to (f): MSG-PI, 183-WSL rain rate predictions, 183-WSLC (convective rain classification), 183-WSLS (stratiform rain classification), 183-WSLWV (water vapor/snow classification) and SI.
a b
c
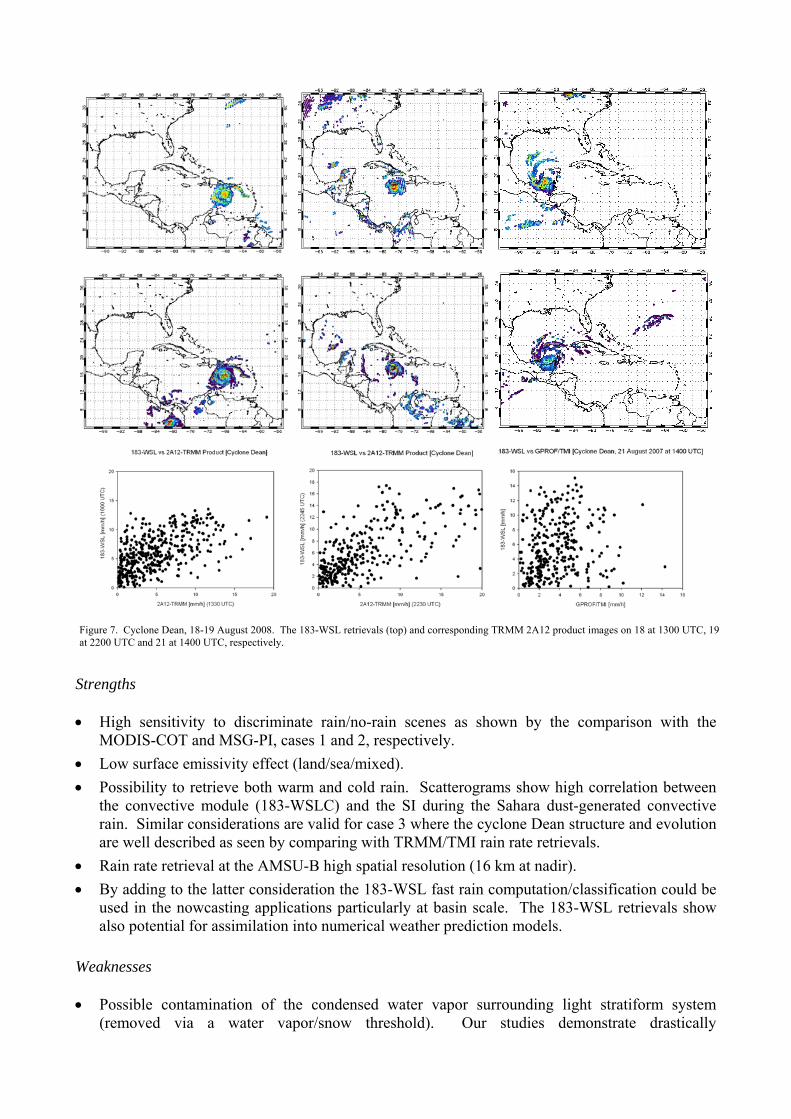
3.3 Hurricane Dean The cyclone Dean was a classic seasonal tropical system forming over the Cape Verde islands, passing close to Jamaica and pouring rain on the coast of the Yucatan as a category 5 hurricane. Figure 7 shows the cyclone development stages retrieved by the 183-WSL algorithm (top) and the 2A12 product from the best coincident overpasses of the Tropical Rainfall Measuring Mission (TRMM) Microwave Imager (TMI) (bottom). By comparing the TRMM/TMI and the 183-WSL results a reasonable agreement can be observed although a more comprehensive study needs to be carried out. The scattergrams at the bottom of Fig. 7 depict a generally good correlation between the two retrieval techniques. Nevertheless, some other studies of ours describe a slight overestimation of the 183-WSL but this is probably due to the large water vapor absorption characteristic of this kind of extreme event. 4 CONSIDERATIONS ON THE 183-WSL On the basis of the 183-WSL results the following preliminary considerations can be drawn on strengths and weaknesses of the method to date.
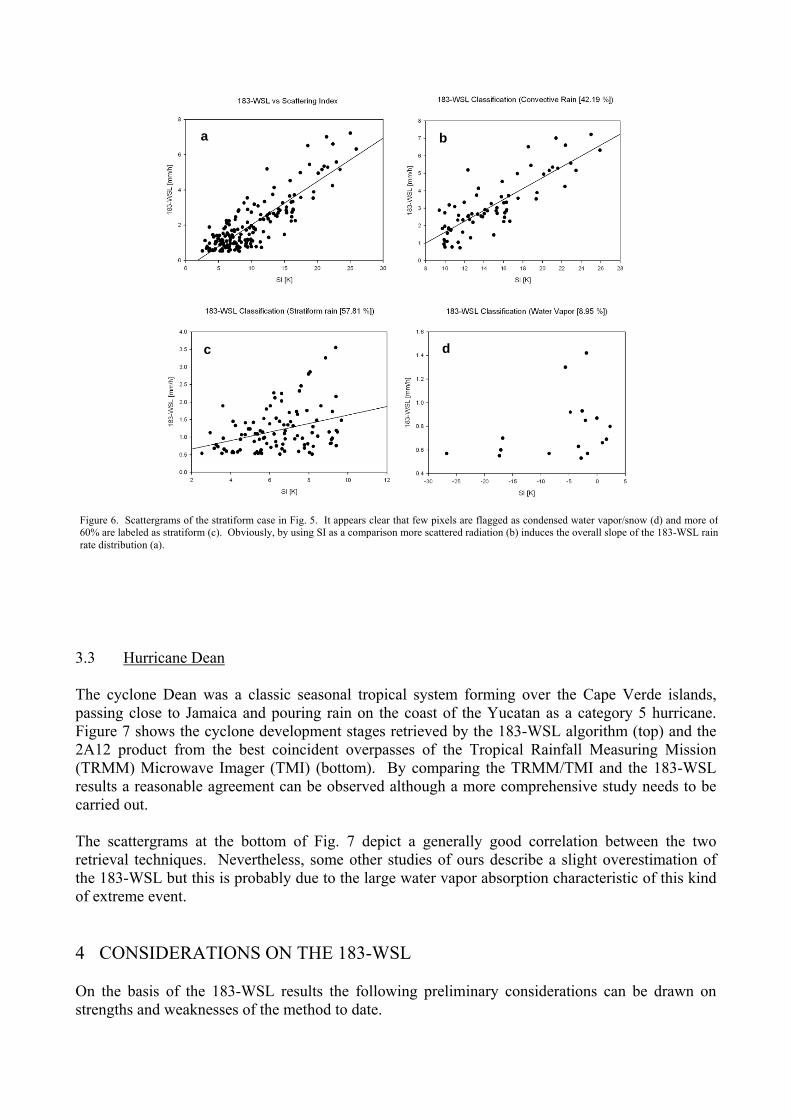
Figure 6. Scattergrams of the stratiform case in Fig. 5. It appears clear that few pixels are flagged as condensed water vapor/snow (d) and more of 60% are labeled as stratiform (c). Obviously, by using SI as a comparison more scattered radiation (b) induces the overall slope of the 183-WSL rain rate distribution (a).
a b
c d
Strengths • High sensitivity to discriminate rain/no-rain scenes as shown by the comparison with the
MODIS-COT and MSG-PI, cases 1 and 2, respectively. • Low surface emissivity effect (land/sea/mixed). • Possibility to retrieve both warm and cold rain. Scatterograms show high correlation between
the convective module (183-WSLC) and the SI during the Sahara dust-generated convective rain. Similar considerations are valid for case 3 where the cyclone Dean structure and evolution are well described as seen by comparing with TRMM/TMI rain rate retrievals.
• Rain rate retrieval at the AMSU-B high spatial resolution (16 km at nadir). • By adding to the latter consideration the 183-WSL fast rain computation/classification could be
used in the nowcasting applications particularly at basin scale. The 183-WSL retrievals show also potential for assimilation into numerical weather prediction models.
Weaknesses • Possible contamination of the condensed water vapor surrounding light stratiform system
(removed via a water vapor/snow threshold). Our studies demonstrate drastically
Figure 7. Cyclone Dean, 18-19 August 2008. The 183-WSL retrievals (top) and corresponding TRMM 2A12 product images on 18 at 1300 UTC, 19 at 2200 UTC and 21 at 1400 UTC, respectively.
underestimations of rain rate intensities when large water vapor amounts surround light-rain clouds classified as stratiform. Tests are under way on a new function which improves the 183-WSL performances.
• Stronger dependence on the seasonal conditions particularly over 60° latitude where surface effects can also affect the retrieval.
5 CONCLUSION AND FUTURE WORK The drawback of this kind of algorithms stems from what can be considered also its main strength, i.e. their direct link with the atmospheric water vapor amount. When condensation clusters are formed both in cloud free regions and in the surroundings of rain clouds while at the same time being not directly involved in the precipitation formation process a fake rain signal can result from the retrieval. Our studies have shown that absorption due to water vapor contaminates the algorithm retrievals by labeling as rainy those pixels for which only water vapor absorption was detected. In order to prevent such incorrect rain flags we calculate a series of thresholds to evaluate the water vapor only contribution, to classify rain types, and to estimate precipitation intensities for each class. The present results encourage us to apply the method to precipitating events characterized by different stratiform and convective components and by different amounts of water vapor for a better quantification of the algorithm performances. An improvement of rain delineation in the winter season and at latitudes higher than 60° is also needed. An improved version of the 183-WSL algorithm is under development for an improved delineation of the rainy areas. The basic concept is that more pixels with high values of condensed water vapor, particularly during light rain events, can be attributed to clouds in the growing stage depending on the water vapor amount. With progress of the accretion mechanism condensed water vapor particles can develop into light stratiform rain. A Probability Of Rain Development Function (PORDF) is being introduced to capture these light rain areas. REFERENCES [1] R. W. Saunders, T. J. Hewison, S. J. Stephen and N. C. Atkinson, “The radiometric characterization of AMSU-B,” IEEE Trans. Microwave Theory and Techniques, vol. 43, no. 4, pp 760-771, 1995.
[2] T. J. Hewison, and R. W. Saunders, “Measurements of the AMSU-B antenna pattern,” IEEE Trans. Geosci. Remote Sensing, vol. 34, no. 2, pp 405-412, 1996. [3] R. Bennartz, A. Thoss, A. Dybbroe and D. Michelson, “Precipitation analysis using the Advanced Microwave Sounding Unit in support of nowcasting applications,” Meteorol. Appl., vol. 9, pp 177-189, 2002. [4] A. Thoss, A. Dybbroe, and R. Bennartz, “The Nowcasting SAF precipitating clouds product,” Proc. 2001 EUMETSAT Satellite Data Users’ Conf., Antalya, 1-5 Oct., 399-406, 2001. [5] J. Schmetz, P. Pili, S. Tjemkes, D. Just, J. Kerkmann, S. Rota, and A. Ratier, “An introduction to Meteosat Second Generation (MSG),” Bull. Amer. Meteor. Soc., 83, 977-992, 2002.