Railway trip speeds and areal coverage. The emperor’s new clothes of effectivity?
10
Railway trip speeds and areal coverage. The emperor’s new clothes of effectivity? Tadej Brezina ⇑ , Hermann Knoflacher Vienna University of Technology, Institute of Transportation, Research Center of Transport Planning and Traffic Engineering, Gusshausstrasse 30/230-1, A-1040 Vienna, Austria article info Keywords: Railway Travel speed Access Egress Feeder lines abstract Europe’s railways have experienced a general decline in the second half of the 20th century and a renaissance since the 1980s. Total network length has decreased fundamentally while high-speed rail (HSR) line construction has soared since then. Accordingly HSR has stipulated a lot of research, but only recently HSR’s impacts on settlement structure and transport regimes have been studied in depth. We embrace a passenger’s point of view and utilize a generalized overview model for illustrating the trade-offs between trip speeds of complete trip chains, access/egress legs and mainline trip lengths. In order to estimate input parameters, an overview of railway network and settlement structure of Austria is empirically derived. In four scenarios, we vary these input parameters to study the impact of timetable integration, speed upgrades on mainlines and access/egress modes on trip speed in the Austrian case. Our results show that travel speed advantages of mainline speed increases are quickly countervailed by access/egress improvements or timetable integration improvements. We conclude that finding harmo- nized optimum speeds, introducing clock-face timetable design and improving access/egress modes are promising strategies in comparison to unscrutinized further maximization of mainline travel speed levels at the expense of feeder/distributor lines quality. Ó 2014 Elsevier Ltd. All rights reserved. 1. Introduction After a decline starting in the middle of the 20th century, a modest renaissance of railways is observable in Europe since the 1980s (Givoni, 2006). This renaissance has been running under the auspices that railways have a dedicated slot of service advantages in between the competing modes car and aeroplane, distinguished either by time-spans or distance-spans (de Urena Frances, 2012; Givoni and Banister, 2012; Vickerman, 2012). It has also seen the increasing implementation of high-speed rail (HSR) services and line construction in Europe and growing num- bers of passengers (Cascetta et al., 2013; Hall, 2009, p. 63). All over the world high expectations are projected on high-speed train (HST) services, even in nations whose national railway systems are heavily deteriorated or still in very early stages of development with very low service quality. Argentina serves as an example for the first case that has proposed a high-speed line (HSL) from Buenos Aires to Rosario (RGI, 2008). The latter could be, for exam- ple, characterized by Thailand that has recently been pursuing a national HSL network with a first link from Bangkok to Chiang Mai (SEPO, 2010a,b). In Europe, the historic HSR idea lead to the construction of HSL and the installation of corresponding passenger services since the 1970s (Haase, 1997; Müller, 1997). Since then, HSTs have been introduced in countries including France, Spain, Germany and Italy where the first batch of lines connected cities in optimal size and distance relation for a successful competition with air traffic (Lopez Pita and Robuste Anton, 2003; Nash, 2009; Roman et al., 2007; Sanchez Borras and Lopez Pita, 2010). But the HSR ventures also went along with the closure of many regional and local railway lines that worked as access/egress services to the national network resulting in a decrease of the regular network at a rate of 1 km HSL being gained and 5.2 km (France) to 6.75 km (EU27 average) of regular network being lost (Preston, 2009). Marti- Henneberg (2012) gives a detailed historical and geographical account of Europe’s initial rapid rise in total network length and the following diminishment which was slightly abated by HSL con- struction. In Austria during the second half of the 20th century especially the peripheral and remote mountainous areas experi- enced a demise in passenger service lines with mainly trunk lines remaining. Looking from an international perspective, different railway priority axes run on those trunk lines: priority axis nr. 17, the Danube corridor Paris – Stuttgart – Vienna – Bratislava/ http://dx.doi.org/10.1016/j.jtrangeo.2014.06.024 0966-6923/Ó 2014 Elsevier Ltd. All rights reserved. ⇑ Corresponding author. Tel.: +43 1 58801 23127; fax: +43 1 58801 23199. E-mail addresses: [email protected] (T. Brezina), hermann. knofl[email protected] (H. Knoflacher). Journal of Transport Geography 39 (2014) 121–130 Contents lists available at ScienceDirect Journal of Transport Geography journal homepage: www.elsevier.com/locate/jtrangeo
Transcript of Railway trip speeds and areal coverage. The emperor’s new clothes of effectivity?
Journal of Transport Geography 39 (2014) 121–130
Contents lists available at ScienceDirect
Journal of Transport Geography
journal homepage: www.elsevier .com/ locate / j t rangeo
Railway trip speeds and areal coverage. The emperor’s new clothesof effectivity?
http://dx.doi.org/10.1016/j.jtrangeo.2014.06.0240966-6923/� 2014 Elsevier Ltd. All rights reserved.
⇑ Corresponding author. Tel.: +43 1 58801 23127; fax: +43 1 58801 23199.E-mail addresses: [email protected] (T. Brezina), hermann.
[email protected] (H. Knoflacher).
Tadej Brezina ⇑, Hermann KnoflacherVienna University of Technology, Institute of Transportation, Research Center of Transport Planning and Traffic Engineering, Gusshausstrasse 30/230-1, A-1040 Vienna, Austria
a r t i c l e i n f o a b s t r a c t
Keywords:RailwayTravel speedAccessEgressFeeder lines
Europe’s railways have experienced a general decline in the second half of the 20th century and arenaissance since the 1980s. Total network length has decreased fundamentally while high-speed rail(HSR) line construction has soared since then. Accordingly HSR has stipulated a lot of research, but onlyrecently HSR’s impacts on settlement structure and transport regimes have been studied in depth. Weembrace a passenger’s point of view and utilize a generalized overview model for illustrating thetrade-offs between trip speeds of complete trip chains, access/egress legs and mainline trip lengths. Inorder to estimate input parameters, an overview of railway network and settlement structure of Austriais empirically derived. In four scenarios, we vary these input parameters to study the impact of timetableintegration, speed upgrades on mainlines and access/egress modes on trip speed in the Austrian case. Ourresults show that travel speed advantages of mainline speed increases are quickly countervailed byaccess/egress improvements or timetable integration improvements. We conclude that finding harmo-nized optimum speeds, introducing clock-face timetable design and improving access/egress modesare promising strategies in comparison to unscrutinized further maximization of mainline travel speedlevels at the expense of feeder/distributor lines quality.
� 2014 Elsevier Ltd. All rights reserved.
1. Introduction
After a decline starting in the middle of the 20th century, amodest renaissance of railways is observable in Europe since the1980s (Givoni, 2006). This renaissance has been running underthe auspices that railways have a dedicated slot of serviceadvantages in between the competing modes car and aeroplane,distinguished either by time-spans or distance-spans (de UrenaFrances, 2012; Givoni and Banister, 2012; Vickerman, 2012). Ithas also seen the increasing implementation of high-speed rail(HSR) services and line construction in Europe and growing num-bers of passengers (Cascetta et al., 2013; Hall, 2009, p. 63). All overthe world high expectations are projected on high-speed train(HST) services, even in nations whose national railway systemsare heavily deteriorated or still in very early stages of developmentwith very low service quality. Argentina serves as an example forthe first case that has proposed a high-speed line (HSL) fromBuenos Aires to Rosario (RGI, 2008). The latter could be, for exam-ple, characterized by Thailand that has recently been pursuing a
national HSL network with a first link from Bangkok to ChiangMai (SEPO, 2010a,b).
In Europe, the historic HSR idea lead to the construction of HSLand the installation of corresponding passenger services since the1970s (Haase, 1997; Müller, 1997). Since then, HSTs have beenintroduced in countries including France, Spain, Germany and Italywhere the first batch of lines connected cities in optimal size anddistance relation for a successful competition with air traffic(Lopez Pita and Robuste Anton, 2003; Nash, 2009; Roman et al.,2007; Sanchez Borras and Lopez Pita, 2010). But the HSR venturesalso went along with the closure of many regional and localrailway lines that worked as access/egress services to the nationalnetwork resulting in a decrease of the regular network at a rate of1 km HSL being gained and 5.2 km (France) to 6.75 km (EU27average) of regular network being lost (Preston, 2009). Marti-Henneberg (2012) gives a detailed historical and geographicalaccount of Europe’s initial rapid rise in total network length andthe following diminishment which was slightly abated by HSL con-struction. In Austria during the second half of the 20th centuryespecially the peripheral and remote mountainous areas experi-enced a demise in passenger service lines with mainly trunk linesremaining. Looking from an international perspective, differentrailway priority axes run on those trunk lines: priority axis nr.17, the Danube corridor Paris – Stuttgart – Vienna – Bratislava/
122 T. Brezina, H. Knoflacher / Journal of Transport Geography 39 (2014) 121–130
Budapest; nr. 1, Berlin – Palermo over the Brenner alpine crossingand nr. 23, Gdansk – Vienna. Additionally, the Pan-European corri-dors touch Austria: VII (Danube corridor) and X (from Salzburg andGraz south into Slovenia). The European Union (European Council,1995, Annex 1) defines HSR in three categories, with the denomi-nation we use for clarity in this paper put in brackets afterwards:
� lines built on purpose for speeds of 250 km/h and higher (HSR);� upgraded lines for speeds up to or around 200 km/h (moderate
HSR);� all other lines should be ‘‘equipped’’ for speeds as high as possi-
ble (improved regular railway).
In the Austrian case the alternative concept of high-capacitylines (HCL) was adopted. The initial HCL guidelines (ÖBB, 1992)allow for moderate HSR speeds of 200 km and less. In combinationwith studies of economic viability that suggested to limit the max-imum to 160 km/h (Veit, 1993, 2001), this lead to major invest-ments along the Danube corridor since then, eg. by doublingtracks from two to four and improving to moderate HSR standards.Only in late 2012 the newest HSR link that enables maximum oper-ational speeds of 230 km/h between Vienna and St. Pölten has beenopened. Altogether a fully mixed operational network model(Campos and de Rus, 2009) with HST and regular trains runningon both HSL and regular lines has been developed. Today, threemajor tunnel mega projects are pursued at different stages ofimplementation: the base tunnels below Brenner pass, Semmeringpass and Koralm mountain. The latter two are not part of any Euro-pean priority corridor. With the expansion of the European Unionand the TEN idea to Central and Eastern European countries, alsothe idea of HSL construction on priority axes has progressed tothese countries and flourished there (Ebeling and Kirsch, 2000;Ellwanger, 2001, European Commission, 2010; Hainitz, 1999;Schwarz, 2001). For example, Croatia studies HSR link alignmentsfrom Zagreb to the Adriatic Sea at Rijeka including an option to linkthe rail-wise cut-off half peninsula of Istra to the mainland (Kralj,2012). And in Slovenia ever since its independence an intricateHSL-project along Pan-European corridor V traversing the hillycountry has been proposed, but no steps of implementation what-soever have been made yet. In Central and Eastern Europe the pro-jects mostly aim at operational speed levels of moderate HSR.
A considerable amount of research has been conducted in termsof increased railway speeds and the construction of HSL. Givoni(2006) gives a general review on HST development, its basic fea-tures and impacts on transport regimes and on the environment,whereas Cascetta, Ben-Akiva and colleagues were studying themodelling of HST and its impact on mobility patterns (Ben-Akivaet al., 2010; Cascetta et al., 2011). Detailed discussions on HSRand its implications on territorial organization with a Spanish per-spective have been published recently (de Meer et al., 2012; deUrena Frances et al., 2012). Feliu (2012) and de Urena Frances(2009) study the HSR’s impact on urban development in Europeanmiddle sized cities. One observable effect of mainline speedincrease on settlement geography is, as Hall (2009, p. 65) puts it,an increased spatial imbalance, the peripherization of peripherywith accompanying concentration effects on mainlines and inmetropolises. Further critical aspects of HSR have been detectedby other authors too: regional concentration effects take place incombination with a deterioration of regular network links(Vickerman, 1997), increased mainline speed in combination withextended stop distances reduces regional accessibility (Tapiadoret al., 2009) and the Spanish HSL network shows bad operationalefficiency (Woker, 2013).
Although there has been previous work arguing for the utility ofpassenger travel time (Jain and Lyons, 2008; Lyons et al., 2007),passenger journey time is still recognized as the key measuring
metric of a public transport system’s level-of-service (Lyonset al., 2007). In their model of high-speed operations on a mixednetwork of existing and new lines, Wong et al. (2002) arguestrongly for utilizing passenger travel time savings for the apprai-sal of network and service solutions. In the appraisal of rail travel,the railway stations’ access is of special importance and asks forspecial attention being drawn to it (Brons et al., 2009; Brons andRietveld, 2009; Givoni and Rietveld, 2007). Givoni and Banister(2012) point out: ‘‘travel times that passengers experience are afactor of the average speed’’ and ‘‘door-to-door travel time is ofimportance’’. HSR time savings lead to shorter travel times onlyon a few selected corridors with an emphasis on dedicated rela-tions. In other relations the rail journey’s time savings may easilyforfeit due to added time necessary for access/egress trips to/fromHST stops (Givoni and Banister, 2012). The results from Brons andRietveld’s (2009) analysis of Dutch railway user surveys state thatpassengers pay especially attention to all door-to-door trip aspectsand not just the sole train trip. We utilize this notion by adding apassenger’s trip speed perspective to our model as well as accessmodes and interchange stations.
The effect of HSR on demand figures and modal shifts in point topoint services between conurbations has been documented before.Smith et al. (2004) for example narrowed this distance of viabilitybased on international case study data to a range between 275 and540 km. Cascetta et al. (2013) put this range into the perspective ofcloser situated Italian cities ranging from 87 to 250 km. The classicschool of thought in regard to rail service improvement is very lineoriented, as many recent rail successes took place in the linear con-nection of major conurbations. But many railway systems still havea strong areal component.
We balance the pure point to point, conurbation to conurbationperspective on trip speed with an area oriented approach wherethe railroad system’s (regular and HSL) areal effectiveness isemphasized. By areal effectiveness we mean the ability of therailway system to serve population apart of the big conurbationswith attractive services and trip speeds. Knoflacher (1989) madean estimate of the impact of railroad’s speed and of access/egresson passenger trip speed in an areal perspective. We improve andupdate this early estimate here. Utilizing a simple model, we illus-trate the trade-off between different mainline speeds and arealcoverage by means of passenger trip speed under inclusion ofaccess/egress trip legs. Using four scenarios we check the hypoth-esis that for Austrian boundary conditions an improvement ofaccess/egress lines and interchange times produces improvementsin trip speeds for passengers over further increase in mainlinespeeds.
In section two, we first set out the model framework of tripspeed including the journey’s access and egress legs. Furthermorein section three, we derive the empirical boundary conditions ofthe Austrian railway and settlement system for further enquiriesin four scenarios. These four scenarios are defined in section fourby expedient alteration of input parameters. Section five showsthe results of these scenarios in form of diagrams. Section six, dis-cusses the results and draws conclusions, planning and researchperspectives.
2. Trip speed model
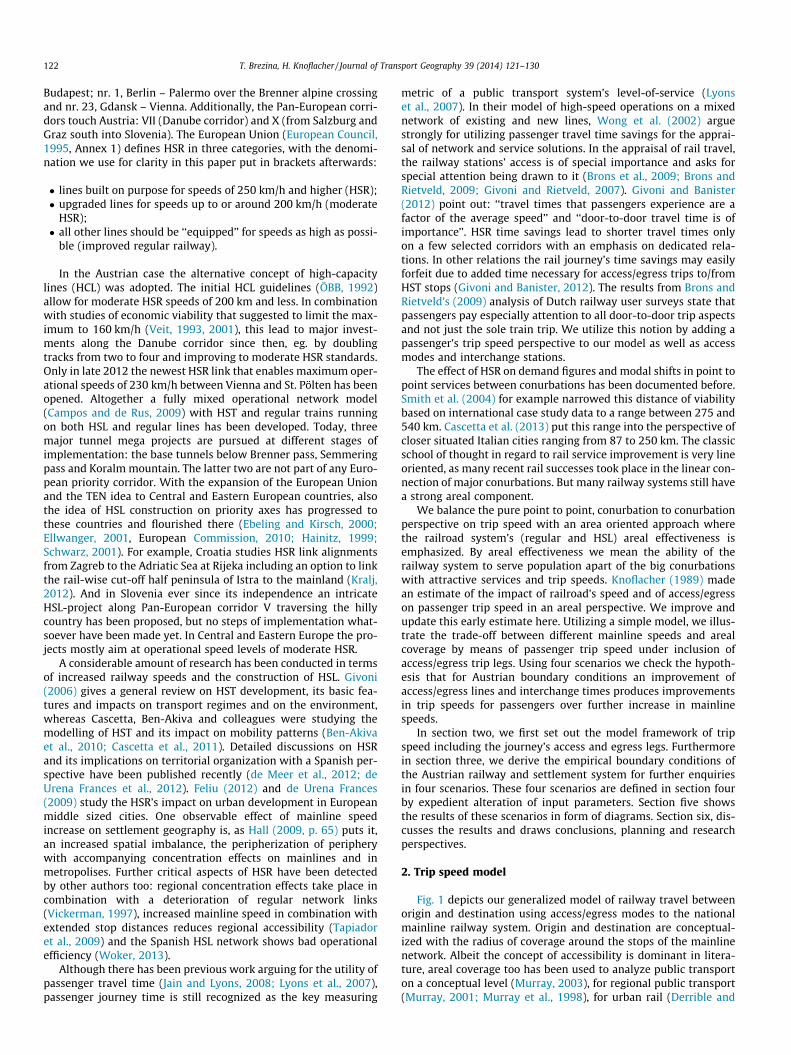
Fig. 1 depicts our generalized model of railway travel betweenorigin and destination using access/egress modes to the nationalmainline railway system. Origin and destination are conceptual-ized with the radius of coverage around the stops of the mainlinenetwork. Albeit the concept of accessibility is dominant in litera-ture, areal coverage too has been used to analyze public transporton a conceptual level (Murray, 2003), for regional public transport(Murray, 2001; Murray et al., 1998), for urban rail (Derrible and
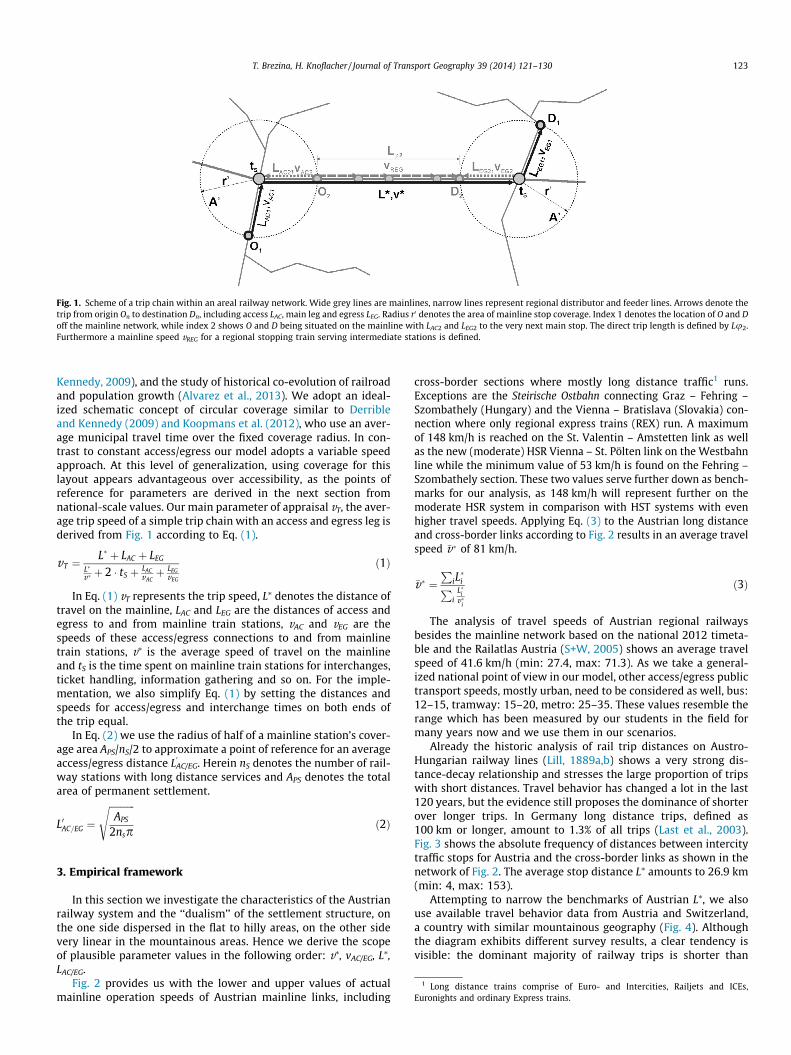
Fig. 1. Scheme of a trip chain within an areal railway network. Wide grey lines are mainlines, narrow lines represent regional distributor and feeder lines. Arrows denote thetrip from origin On to destination Dn, including access LAC, main leg and egress LEG. Radius r0 denotes the area of mainline stop coverage. Index 1 denotes the location of O and Doff the mainline network, while index 2 shows O and D being situated on the mainline with LAC2 and LEG2 to the very next main stop. The direct trip length is defined by Lu2.Furthermore a mainline speed vREG for a regional stopping train serving intermediate stations is defined.
T. Brezina, H. Knoflacher / Journal of Transport Geography 39 (2014) 121–130 123
Kennedy, 2009), and the study of historical co-evolution of railroadand population growth (Alvarez et al., 2013). We adopt an ideal-ized schematic concept of circular coverage similar to Derribleand Kennedy (2009) and Koopmans et al. (2012), who use an aver-age municipal travel time over the fixed coverage radius. In con-trast to constant access/egress our model adopts a variable speedapproach. At this level of generalization, using coverage for thislayout appears advantageous over accessibility, as the points ofreference for parameters are derived in the next section fromnational-scale values. Our main parameter of appraisal vT, the aver-age trip speed of a simple trip chain with an access and egress leg isderived from Fig. 1 according to Eq. (1).
vT ¼L� þ LAC þ LEG
L�
v� þ 2 � tS þ LACvACþ LEG
vEG
ð1Þ
In Eq. (1) vT represents the trip speed, L⁄ denotes the distance oftravel on the mainline, LAC and LEG are the distances of access andegress to and from mainline train stations, vAC and vEG are thespeeds of these access/egress connections to and from mainlinetrain stations, v⁄ is the average speed of travel on the mainlineand tS is the time spent on mainline train stations for interchanges,ticket handling, information gathering and so on. For the imple-mentation, we also simplify Eq. (1) by setting the distances andspeeds for access/egress and interchange times on both ends ofthe trip equal.
In Eq. (2) we use the radius of half of a mainline station’s cover-age area APS/nS/2 to approximate a point of reference for an averageaccess/egress distance L
0
AC/EG. Herein nS denotes the number of rail-way stations with long distance services and APS denotes the totalarea of permanent settlement.
L0AC=EG ¼
ffiffiffiffiffiffiffiffiffiffiffiAPS
2nsp
sð2Þ
1 Long distance trains comprise of Euro- and Intercities, Railjets and ICEs,Euronights and ordinary Express trains.
3. Empirical framework
In this section we investigate the characteristics of the Austrianrailway system and the ‘‘dualism’’ of the settlement structure, onthe one side dispersed in the flat to hilly areas, on the other sidevery linear in the mountainous areas. Hence we derive the scopeof plausible parameter values in the following order: v⁄, vAC/EG, L⁄,LAC/EG.
Fig. 2 provides us with the lower and upper values of actualmainline operation speeds of Austrian mainline links, including
cross-border sections where mostly long distance traffic1 runs.Exceptions are the Steirische Ostbahn connecting Graz – Fehring –Szombathely (Hungary) and the Vienna – Bratislava (Slovakia) con-nection where only regional express trains (REX) run. A maximumof 148 km/h is reached on the St. Valentin – Amstetten link as wellas the new (moderate) HSR Vienna – St. Pölten link on the Westbahnline while the minimum value of 53 km/h is found on the Fehring –Szombathely section. These two values serve further down as bench-marks for our analysis, as 148 km/h will represent further on themoderate HSR system in comparison with HST systems with evenhigher travel speeds. Applying Eq. (3) to the Austrian long distanceand cross-border links according to Fig. 2 results in an average travelspeed �v� of 81 km/h.
�v� ¼P
iL�iP
iL�iv�
i
ð3Þ
The analysis of travel speeds of Austrian regional railwaysbesides the mainline network based on the national 2012 timeta-ble and the Railatlas Austria (S+W, 2005) shows an average travelspeed of 41.6 km/h (min: 27.4, max: 71.3). As we take a general-ized national point of view in our model, other access/egress publictransport speeds, mostly urban, need to be considered as well, bus:12–15, tramway: 15–20, metro: 25–35. These values resemble therange which has been measured by our students in the field formany years now and we use them in our scenarios.
Already the historic analysis of rail trip distances on Austro-Hungarian railway lines (Lill, 1889a,b) shows a very strong dis-tance-decay relationship and stresses the large proportion of tripswith short distances. Travel behavior has changed a lot in the last120 years, but the evidence still proposes the dominance of shorterover longer trips. In Germany long distance trips, defined as100 km or longer, amount to 1.3% of all trips (Last et al., 2003).Fig. 3 shows the absolute frequency of distances between intercitytraffic stops for Austria and the cross-border links as shown in thenetwork of Fig. 2. The average stop distance L⁄ amounts to 26.9 km(min: 4, max: 153).
Attempting to narrow the benchmarks of Austrian L⁄, we alsouse available travel behavior data from Austria and Switzerland,a country with similar mountainous geography (Fig. 4). Althoughthe diagram exhibits different survey results, a clear tendency isvisible: the dominant majority of railway trips is shorter than
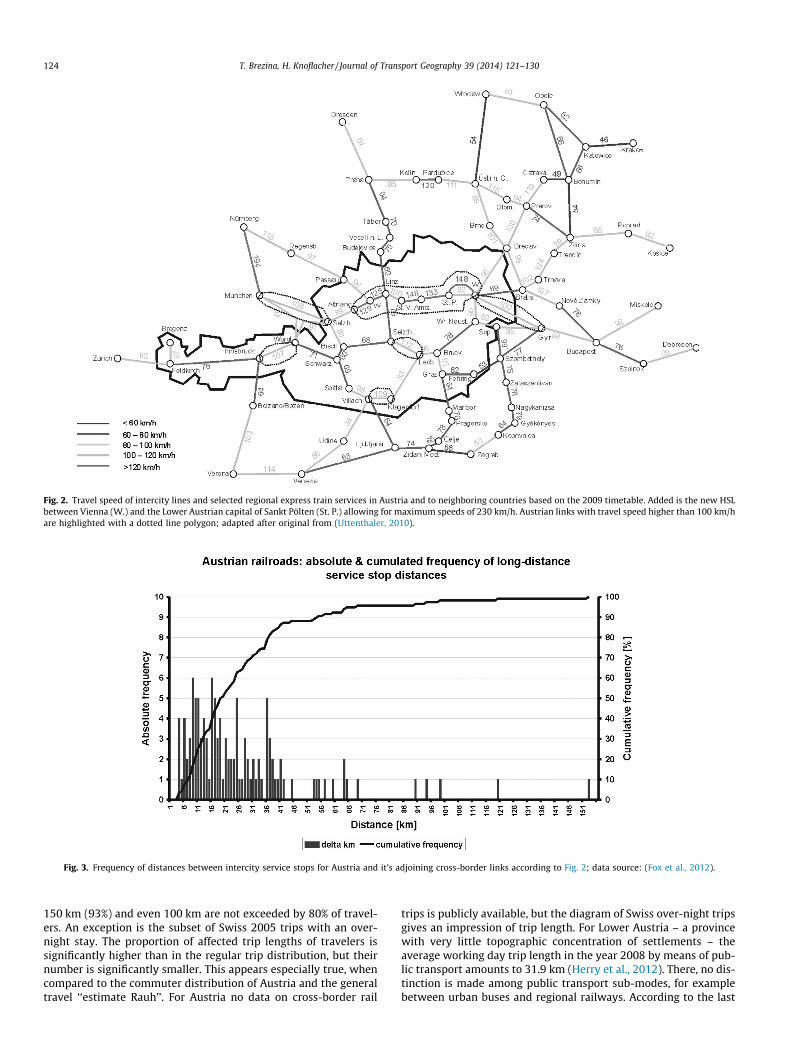
Fig. 2. Travel speed of intercity lines and selected regional express train services in Austria and to neighboring countries based on the 2009 timetable. Added is the new HSLbetween Vienna (W.) and the Lower Austrian capital of Sankt Pölten (St. P.) allowing for maximum speeds of 230 km/h. Austrian links with travel speed higher than 100 km/hare highlighted with a dotted line polygon; adapted after original from (Uttenthaler, 2010).
Fig. 3. Frequency of distances between intercity service stops for Austria and it’s adjoining cross-border links according to Fig. 2; data source: (Fox et al., 2012).
124 T. Brezina, H. Knoflacher / Journal of Transport Geography 39 (2014) 121–130
150 km (93%) and even 100 km are not exceeded by 80% of travel-ers. An exception is the subset of Swiss 2005 trips with an over-night stay. The proportion of affected trip lengths of travelers issignificantly higher than in the regular trip distribution, but theirnumber is significantly smaller. This appears especially true, whencompared to the commuter distribution of Austria and the generaltravel ‘‘estimate Rauh’’. For Austria no data on cross-border rail
trips is publicly available, but the diagram of Swiss over-night tripsgives an impression of trip length. For Lower Austria – a provincewith very little topographic concentration of settlements – theaverage working day trip length in the year 2008 by means of pub-lic transport amounts to 31.9 km (Herry et al., 2012). There, no dis-tinction is made among public transport sub-modes, for examplebetween urban buses and regional railways. According to the last
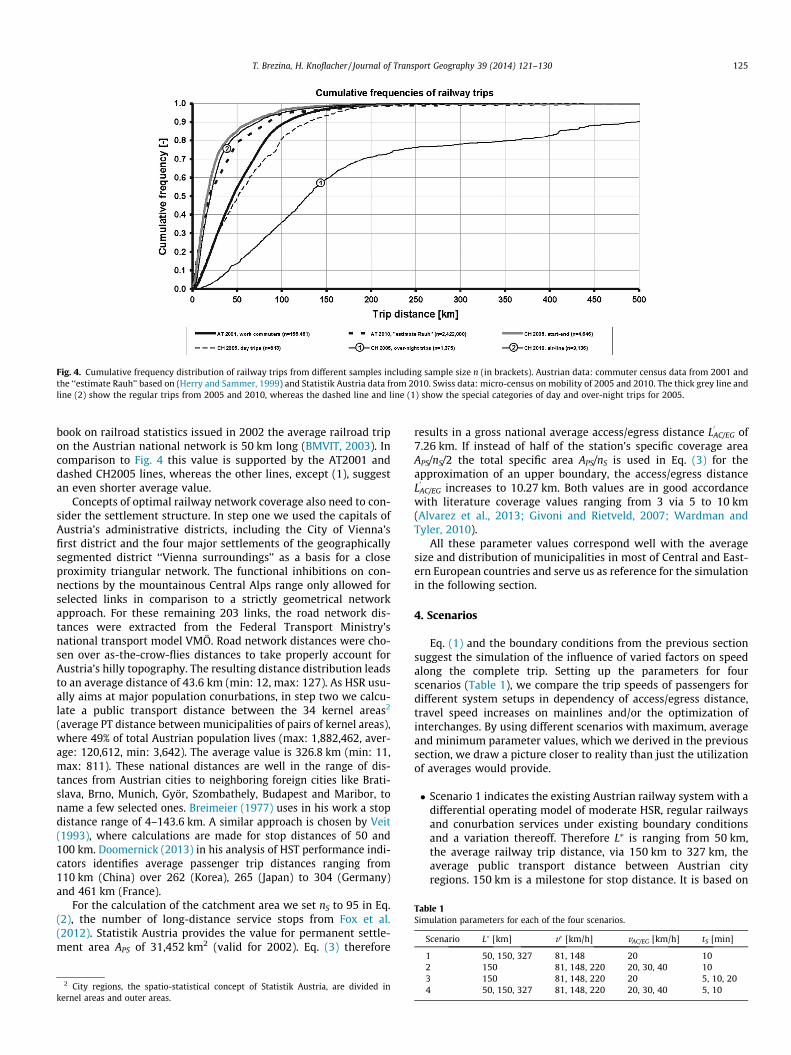
Table 1Simulation parameters for each of the four scenarios.
Scenario L� [km] v� [km/h] vAC/EG [km/h] tS [min]
Fig. 4. Cumulative frequency distribution of railway trips from different samples including sample size n (in brackets). Austrian data: commuter census data from 2001 andthe ‘‘estimate Rauh’’ based on (Herry and Sammer, 1999) and Statistik Austria data from 2010. Swiss data: micro-census on mobility of 2005 and 2010. The thick grey line andline (2) show the regular trips from 2005 and 2010, whereas the dashed line and line (1) show the special categories of day and over-night trips for 2005.
T. Brezina, H. Knoflacher / Journal of Transport Geography 39 (2014) 121–130 125
book on railroad statistics issued in 2002 the average railroad tripon the Austrian national network is 50 km long (BMVIT, 2003). Incomparison to Fig. 4 this value is supported by the AT2001 anddashed CH2005 lines, whereas the other lines, except (1), suggestan even shorter average value.
Concepts of optimal railway network coverage also need to con-sider the settlement structure. In step one we used the capitals ofAustria’s administrative districts, including the City of Vienna’sfirst district and the four major settlements of the geographicallysegmented district ‘‘Vienna surroundings’’ as a basis for a closeproximity triangular network. The functional inhibitions on con-nections by the mountainous Central Alps range only allowed forselected links in comparison to a strictly geometrical networkapproach. For these remaining 203 links, the road network dis-tances were extracted from the Federal Transport Ministry’snational transport model VMÖ. Road network distances were cho-sen over as-the-crow-flies distances to take properly account forAustria’s hilly topography. The resulting distance distribution leadsto an average distance of 43.6 km (min: 12, max: 127). As HSR usu-ally aims at major population conurbations, in step two we calcu-late a public transport distance between the 34 kernel areas2
(average PT distance between municipalities of pairs of kernel areas),where 49% of total Austrian population lives (max: 1,882,462, aver-age: 120,612, min: 3,642). The average value is 326.8 km (min: 11,max: 811). These national distances are well in the range of dis-tances from Austrian cities to neighboring foreign cities like Brati-slava, Brno, Munich, Györ, Szombathely, Budapest and Maribor, toname a few selected ones. Breimeier (1977) uses in his work a stopdistance range of 4–143.6 km. A similar approach is chosen by Veit(1993), where calculations are made for stop distances of 50 and100 km. Doomernick (2013) in his analysis of HST performance indi-cators identifies average passenger trip distances ranging from110 km (China) over 262 (Korea), 265 (Japan) to 304 (Germany)and 461 km (France).
For the calculation of the catchment area we set nS to 95 in Eq.(2), the number of long-distance service stops from Fox et al.(2012). Statistik Austria provides the value for permanent settle-ment area APS of 31,452 km2 (valid for 2002). Eq. (3) therefore
2 City regions, the spatio-statistical concept of Statistik Austria, are divided inkernel areas and outer areas.
results in a gross national average access/egress distance L0
AC/EG of7.26 km. If instead of half of the station’s specific coverage areaAPS/nS/2 the total specific area APS/nS is used in Eq. (3) for theapproximation of an upper boundary, the access/egress distanceL0
AC/EG increases to 10.27 km. Both values are in good accordancewith literature coverage values ranging from 3 via 5 to 10 km(Alvarez et al., 2013; Givoni and Rietveld, 2007; Wardman andTyler, 2010).
All these parameter values correspond well with the averagesize and distribution of municipalities in most of Central and East-ern European countries and serve us as reference for the simulationin the following section.
4. Scenarios
Eq. (1) and the boundary conditions from the previous sectionsuggest the simulation of the influence of varied factors on speedalong the complete trip. Setting up the parameters for fourscenarios (Table 1), we compare the trip speeds of passengers fordifferent system setups in dependency of access/egress distance,travel speed increases on mainlines and/or the optimization ofinterchanges. By using different scenarios with maximum, averageand minimum parameter values, which we derived in the previoussection, we draw a picture closer to reality than just the utilizationof averages would provide.
� Scenario 1 indicates the existing Austrian railway system with adifferential operating model of moderate HSR, regular railwaysand conurbation services under existing boundary conditionsand a variation thereoff. Therefore L⁄ is ranging from 50 km,the average railway trip distance, via 150 km to 327 km, theaverage public transport distance between Austrian cityregions. 150 km is a milestone for stop distance. It is based on
1 50, 150, 327 81, 148 20 102 150 81, 148, 220 20, 30, 40 103 150 81, 148, 220 20 5, 10, 204 50, 150, 327 81, 148, 220 20, 30, 40 5, 10
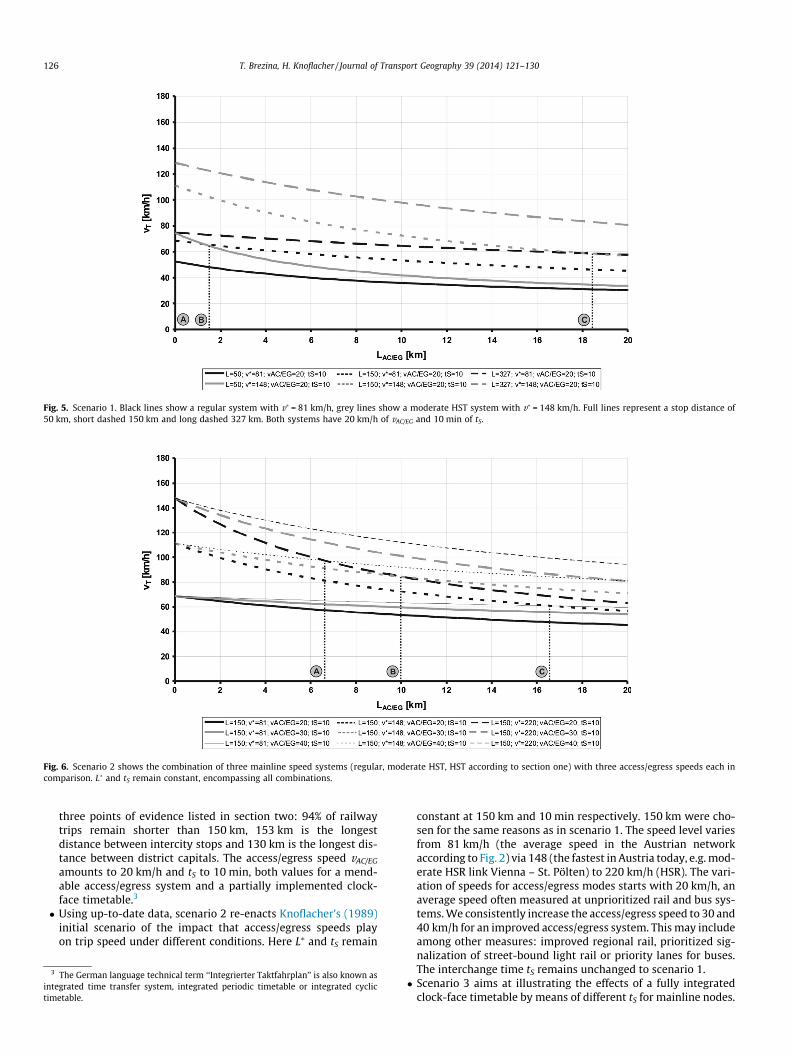
Fig. 5. Scenario 1. Black lines show a regular system with v� = 81 km/h, grey lines show a moderate HST system with v� = 148 km/h. Full lines represent a stop distance of50 km, short dashed 150 km and long dashed 327 km. Both systems have 20 km/h of vAC/EG and 10 min of tS.
Fig. 6. Scenario 2 shows the combination of three mainline speed systems (regular, moderate HST, HST according to section one) with three access/egress speeds each incomparison. L� and tS remain constant, encompassing all combinations.
126 T. Brezina, H. Knoflacher / Journal of Transport Geography 39 (2014) 121–130
three points of evidence listed in section two: 94% of railwaytrips remain shorter than 150 km, 153 km is the longestdistance between intercity stops and 130 km is the longest dis-tance between district capitals. The access/egress speed vAC/EG
amounts to 20 km/h and tS to 10 min, both values for a mend-able access/egress system and a partially implemented clock-face timetable.3
� Using up-to-date data, scenario 2 re-enacts Knoflacher’s (1989)initial scenario of the impact that access/egress speeds playon trip speed under different conditions. Here L⁄ and tS remain
3 The German language technical term ‘‘Integrierter Taktfahrplan’’ is also known asintegrated time transfer system, integrated periodic timetable or integrated cyclictimetable.
constant at 150 km and 10 min respectively. 150 km were cho-sen for the same reasons as in scenario 1. The speed level variesfrom 81 km/h (the average speed in the Austrian networkaccording to Fig. 2) via 148 (the fastest in Austria today, e.g. mod-erate HSR link Vienna – St. Pölten) to 220 km/h (HSR). The vari-ation of speeds for access/egress modes starts with 20 km/h, anaverage speed often measured at unprioritized rail and bus sys-tems. We consistently increase the access/egress speed to 30 and40 km/h for an improved access/egress system. This may includeamong other measures: improved regional rail, prioritized sig-nalization of street-bound light rail or priority lanes for buses.The interchange time tS remains unchanged to scenario 1.� Scenario 3 aims at illustrating the effects of a fully integrated
clock-face timetable by means of different tS for mainline nodes.
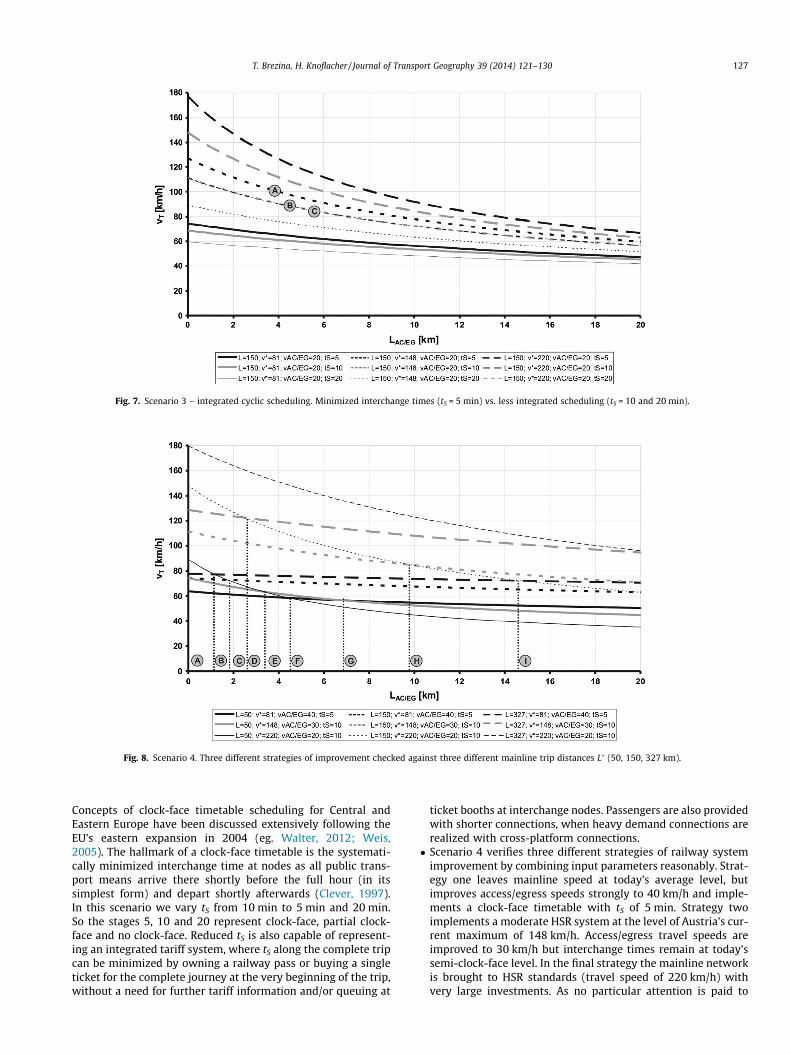
Fig. 7. Scenario 3 – integrated cyclic scheduling. Minimized interchange times (tS = 5 min) vs. less integrated scheduling (tS = 10 and 20 min).
Fig. 8. Scenario 4. Three different strategies of improvement checked against three different mainline trip distances L� (50, 150, 327 km).
T. Brezina, H. Knoflacher / Journal of Transport Geography 39 (2014) 121–130 127
Concepts of clock-face timetable scheduling for Central andEastern Europe have been discussed extensively following theEU’s eastern expansion in 2004 (eg. Walter, 2012; Weis,2005). The hallmark of a clock-face timetable is the systemati-cally minimized interchange time at nodes as all public trans-port means arrive there shortly before the full hour (in itssimplest form) and depart shortly afterwards (Clever, 1997).In this scenario we vary tS from 10 min to 5 min and 20 min.So the stages 5, 10 and 20 represent clock-face, partial clock-face and no clock-face. Reduced tS is also capable of represent-ing an integrated tariff system, where tS along the complete tripcan be minimized by owning a railway pass or buying a singleticket for the complete journey at the very beginning of the trip,without a need for further tariff information and/or queuing at
ticket booths at interchange nodes. Passengers are also providedwith shorter connections, when heavy demand connections arerealized with cross-platform connections.� Scenario 4 verifies three different strategies of railway system
improvement by combining input parameters reasonably. Strat-egy one leaves mainline speed at today’s average level, butimproves access/egress speeds strongly to 40 km/h and imple-ments a clock-face timetable with tS of 5 min. Strategy twoimplements a moderate HSR system at the level of Austria’s cur-rent maximum of 148 km/h. Access/egress travel speeds areimproved to 30 km/h but interchange times remain at today’ssemi-clock-face level. In the final strategy the mainline networkis brought to HSR standards (travel speed of 220 km/h) withvery large investments. As no particular attention is paid to
128 T. Brezina, H. Knoflacher / Journal of Transport Geography 39 (2014) 121–130
feeder/distributor modes, vAC/EG and tS remain at less favorablelevels. In this scenario the lowest value of L⁄ = 50 km matcheswell with the length of the most recently opened HSL linkVienna – St. Pölten at 60 km.
5. Results
In this section we present the travel speed results of the fourscenarios and discuss them in the last section. Subsequently forimproved readability curves are concisely identified by differingparameters in the order L⁄/v⁄/vAC/EG/tS.
Two different speeds v⁄ (81 and 148 km/h) and three differentmainline trip distances L⁄ (50, 150 and 327 km) denominate therange of parameters of Austria’s railway system of today in sce-nario 1 (Fig. 5). At LAC/EG = 0 km, point (A), both curves 50/148and 327/81 start to decline from 75 km/h downwards. The thickgrey line with shorter L⁄ has the bigger rate of decrease. At point(B) at 1.5 km the 150/81 curve surpasses the 50/148 curve. Bothdistances are well within the identified gross average access/egressdistance of 7.26 km. The outmost point (C) at 18.5 km lies well out-side of L
0
AC/EG, here the 327/81 curve crosses the 150/148 curve. Thelongest distance 327 km curve with travel speed 148 km/h remainsconstantly on top.
In Fig. 6, for constant L⁄ and tS at three points slower mainlinesystems surpass the ones with faster mainlines. At 6.5 km (A) the150/148/40 (moderate HSR) curve surpasses 150/220/20 (HSR),while a few kilometers out at 10 km (B) 150/148/30 surpasses150/220/20. Both values lie within or close to the estimated aver-age access/egress length. Outside of L
0
AC/EG at 16.5 km, the 150/148/20 curve is surpassed by 150/81/40 (regular rail) curve. The fasterthe mainline speed v⁄ is, the slighter is the decrease of travel speedalong the increasing access/egress distance. The faster vAC/EG
becomes, the faster decreases trip speed over growing access/egress distance.
Scenario 3 (Fig. 7) illustrates the impact of different stages oftimetable integration by means of interchange times tS and stres-ses the importance of an areal perspective. The fully integratedmoderate mainline HSR system (A, 150/148/20/5) lies above theHSR system (C, 150/220/20/20) with poor timetable integration(i.e. bigger tS) over total access/egress length. The moderate HSLwith imperfect timetable integration, curve (B) 150/148/20/10,superposes the non-integrated curve (C) 150/220/20/20 along thetotal extent of examined access/egress length. The theoreticalcombination 150/220/20/5 remains the fastest throughout thediagram.
The strategic improvement check in scenario 4 (Fig. 8) shows avariety of initially slower curves outdoing faster ones at differentaccess/egress distances. Whereas the regular speed mainline sys-tem with high access/egress speed and low interchange time hasa very low rate of speed decay, higher speed systems with lesstimetable integration decline faster. In point (A) the systems withhighest v⁄ per distance class start in the top most positions, butdecrease quickly to be surpassed by strategies that were slowerinitially. Only the curve with longest distance and highest travelspeed remains on top of all within the examined LAC/EG of 20 km.In situation (B) at 1 km the short L⁄ high speed curve 50/220/20/10 is surpassed by 327/81/40/5 and shortly after at (C) at 1.8 kmby 150/81/40/5. In point (D) at 2.5 km the 150 km curve of strategythree is surpassed by the long distance moderate HSR system withintermediate access/egress speed and tS = 10 min. Within the7.26 km distance, at 3.5 km (E), 4.5 km (F) and 7 km (G) theL� = 50 km curves surpass each other consecutively with strategyone remaining on top. At the outer zone of our estimated L
0
AC/EG
in point (H) at 9.7 km strategy two curve 150/148/30/10 surpassesstrategy three curve 150/220/20/10 which itself is shortly
afterwards at (I) 14.5 km surpassed by the regular railway long dis-tance curve 327/81/40/5.
6. Discussion and conclusions
The results section compared trip speeds as a function of access/egress distance to mainline services. In scenario 1 the curve setswith common distances span the actual Austrian boundary condi-tions. The result meets the expected outcome insofar, as withgrowing L� the curve sets converge stronger. In scenario 2 thespread between curve sets of the same distance increases, as therelative impact of vAC/EG increases along LAC/EG. With growing dis-tance LAC/EG from national network access points the curve setsoverlap each other increasingly. At points A and B the lowermost220 km/h curve, which includes the lowest vAC/EG, is surpassed bythe faster two 148 km/h lines. This takes place right within therange of LAC/EG. In our understanding these curve sets mark theupper end due to the chosen distance L� of 150 km, as they encom-pass the predominant proportion of rail travel taking place. It istherefrom to be expected that the majority of rail customers willmeet conditions close to points (A) and (B), thus being of greaterimportance for the population. Scenario 3 delimits the impact ofsystem integration by means of e.g. clock-face timetabling.Whereas the v� = 81 km/h curve set is markedly slower, the 148and 220 km/h curve sets overlap in part. It is the impact of areduced interchange time tS of the system with slower mainlinetravel speed but better system integration that lifts curves (A andB) at the level of curve (C), with (C) being the v� = 220 km/h curvewith the longest tS. The evaluation of three different railwayenhancement strategies in scenario 4 produces numerous situa-tions of curves surpassing each other. At L� = 50 km, which equalsthe length of average railway trips, the points of outdoing (E, F,G) are situated close to each other, all three within the L
0
AC/EG
distance. Point (H) lies within the upper boundary of L0
AC/EG of10.26 km. Here within the 150 km L� class, strategy three issurpassed by strategy two – the initially faster system becomesslower from this access/egress distance on. We have added thelong distance trips (L� = 327 km) to the set of parameters to acco-modate for potential trips between distant Austrian city regionsand for trips to conurbations in the neighboring countries. In sce-narios 1 and 4 the curves for L� = 327 km remain the fastest withv� = 220 km/h. Nevertheless, the results for these long distancesneed to be treated with caution. As shown by the trip distributionevidence in Fig. 4, the percentage of trips of such length is verysmall in comparison to the bulk of travel. When parameters areused that emphasize mid to longer journeys, the trip speed of allcurves decreases with increasing access/egress distance. If thelower ends of the varied distributions from section two are consid-ered for L�, an increasing relationship is plausible. Such shorter L�
would strengthen the network trait of a railway system. In sucha situation the clock-face timetable and homogenized speedswould gain increased importance over linear long distance trips.
Hence it is evident that at most highlighted points the fastermainline system’s advantage diminishes within or close to L
0
AC/EG,which we identified in section two to range between 7.26 and10.27 km, if the total specific stop area and population are to beconsidered. We also highlighted distinctive points outside of the7.26–10.27 km range as the real life settlement distribution isnot as uniform as insinuated in our generalizing national approxi-mation. This means that on average in most cases an increase ofmainline speeds is forfeited for half of the settlement area byreduced access/egress speeds, non-clock-face timetables or timespent at stations when changing means of transport.
Many HSL projects also lead to increased distances betweenstops, either due to geographically dislocated route alignments or
T. Brezina, H. Knoflacher / Journal of Transport Geography 39 (2014) 121–130 129
missed population thresholds for stops. An increased distance ofmainline stops – serving mainly large cities – often forces usersfrom middle sized cities and towns to access/egress these mainlinestops by traveling in the direction contrary to the desired line oftravel, either with regional rail services or private modes, or makethe total trip with slower regional services. This is indicated inFig. 1 by two different trips between origin O2 and destinationD2. In the most unfavorable case, when travelling from non-HSRstop to non-HSR stop, counter-direction travel may be necessaryat both ends of the trip, as depicted with LAC/EG2 and vAC/EG2 inFig. 1. For passengers such detours neither serve the purpose of tra-vel time reduction nor do they provide a financially attractivealternative when links need to be travelled twice.
As laid out in the introduction, Austria is included in the Euro-pean HSR network concepts. These concepts aim at a future devel-opment of passenger rail transport over longer distances with anintermingling of national and international services. Althoughadditional HSR products are conceptualized for a further developedEuropean-wide HSR network (eg. DB International, 2013) one hasto keep the proportion of long distance trips in mind. As cited inthe framework section for Europe’s biggest nation Germany, tripsover 100 km of length amount to 1.3% of all trips. In Central andEastern Europe conditions are less homogeneous, smaller countrieswith a diversity of language barriers are likely to decrease this por-tion even more. The argument to built rail lines to HSL standards asthey would as well prove useful for lower speed services omitsfinancial efficiency. As construction costs increase with designspeed, often supralinearly, this would make it a bad design. Highconstruction costs would provide higher infrastructure fees formoderately fast services in comparison to improved regular rail-ways or moderate HSR standards. In recent history a strong finan-cial focus has been set on the improvement of mainline servicespeeds either by refurbishment or by construction of new lines.But meanwhile funds are lacking for maintenance or enhancementof regional feeder lines – these are often being shut down instead.Due to financial constraints of public households, governmentshave to decide which infrastructural strategies have the expectedpositive or unwanted adverse effects. In general, costs to enhancetravel speed and improve service of access/egress lines are muchlower and much more efficient in relation to the benefits for thewhole railway system (Knoflacher, 1988).
As already shown by Lill (1889a,b), a trivial relation existsbetween the increased number of passengers between a fewselected cities and travel time reduction (time savings) by meansof increased speeds on mainlines. The reports on modal sharechanges in favor of HSR at the disadvantage of existing slower rail-way services make some authors treat HSR even as a stand-alonemode (Cascetta et al., 2013). But the railway market has a muchwider perspective to offer, if an areawide approach is used.
The implementation of an EU-wide HSR network has now beenon the transport agenda for two decades, derived from successfulcase studies of linked large cities. Although the vision of a HSR net-work covering the EU may be considered by many as an unavoid-able external force in shaping Middle European railway systems ofthe future, its effectiveness in terms of serving passenger needs, inallocating scarce funds and in contributing to a sustainable trans-port system needs to be re-assessed continuously. If the re-assess-ment suggests so, a subsequent adaption of this agenda needs to bemade to improve the system design, so that the most benefits canbe attained.
For example, the impressive financial success of the Swiss rail-way system is based on the integration of all lines in a network ofgood connectivity, punctuality and short interchange times every-where in the network, not only on moderate HSR mainlines. Thepromising market options for passenger railway transport aremedium and short distance trips. As it has been proven in
Switzerland, this is the market segment in which passenger trans-port has the chance of becoming the railway system’s ‘‘cash cow’’.To develop a competitive railway system, it is necessary to under-stand the effects of investments into different measures. Vrtic et al.(2013) have shown that in Switzerland a 60% demand increasecould be gained from reduced access times to rail nodes. Exempl-aric European cases of flexible Light Rail Transit on feeder lines –often called Tram-Train – have shown how to draw trips from roadto rail and also provide the input for long distance trips, in whichconvenience and punctuality are at least as important as traveltime. Due to the structural settlement patterns of Central Europe,a balanced speed regime of the railway network between mainand feeder lines can support and strengthen the benefits of theEuropean economic and social structures and enhance the shareof sustainable transport modes.
In this study we analyzed existing rail trip boundary conditionsin Austria and their variation as proxy for Central Europe. Distance,speed and travel time of mainlines and access/egress lines as wellas transfer times at interchange stations were taken into account.We have shown that the increase of travel speeds on railwaymainlines is often of limited use for passengers. It may even con-tradict passengers’ travel time benefits from the perspective ofareal coverage by railways. Such a strategy enhances the dispari-ties between the center and peripheral regions on the national aswell as on the European level. This paper has made a contributionto the debate by discussing two options:
� Investment into HSR mainlines with a limited number of inter-changes in major cities.� A railway network with harmonized speeds between mainlines
and access/egress lines and optimized interchanges, servingmid-sized cities and regional capitals as well.
We therefore take a stand for the second option.Our approach offers space for future refinements to improve
results. One step ahead would be to move the scheme’s generalizedrepresentation towards actual railway and population distributionpatterns and a differentiation in access/egress distances andspeeds. The relevant impacts of headway variation, number ofconnections and periodic timetables need to be extracted fromliterature (or surveyed independently) and incorporated into animproved model. Fig. 1 indicates the provision of differential ser-vices between non-HSR stops with at least two different optionsof travel. In a future refinement the modelling of detours (Lu2)and counter-direction travel (LAC/EG2, vAC/EG2) in comparison toregional rail services (vREG) shall be included.
Based on the discussion above, we find a parallel to HansChristian Andersen’s fairy tale ‘‘The Emperor’s New Clothes’’. Animbalanced increase in mainline travel speed together with theaccompanying diminishment of regional feeder lines brings aboutfiguratively ‘‘The Emperor’s new Clothes’’ of area-wide sustainablemobility options for customers.
Acknowledgements
The authors declare no conflict of interest. This research wasconducted and this paper was written by both authors under theirbase university wages.
We thank Ulrich Leth and Igor Ripka for providing us with thedata from the Austrian transport model VMÖ; Takeru Shibayamafor very valuable help with handling of large data amounts,discussions on content and language; Peraphan Jittrapirom for the lit-erature on Thailand’s rail projects; Wolfgang Rauh for the suggestionon the railway trip distribution estimation; and Edwina Tanios forproofreading. And finally we thank two anonymous reviewers fortheir valuable comments that helped to finalize the paper.
130 T. Brezina, H. Knoflacher / Journal of Transport Geography 39 (2014) 121–130
References
Alvarez, E., Franch, X., Marti-Henneberg, J., 2013. Evolution of territorial coverage ofthe railway network and its influence on population growth: the case ofEngland and Wales, 1871–1931. Hist. Meth. J. Quant. Interdiscipl. Hist. 46 (3),175–191.
Ben-Akiva, M., Cascetta, E., Coppola, P., Papola, A., Velardi, V., 2010. High speed raildemand forecasting: Italian case study. Paper Presented at the WorldConference on Transportation Research – WCTR (Ed.), Lisboa, Portugal: WCTR.
BMVIT. 2003. Eisenbahn- und Seilbahnstatistik der Republik Österreich für denBerichtszeitraum 2001/2002. Wien: Bundesministerium für Verkehr,Innovation und Technologie.
Breimeier, R., 1977. Die planmäßige Höchstgeschwindigkeit schneller Reisezüge alsFunktion des durchschnittlichen Haltestellenabstandes und der spezifischenAntriebsleistungen. Eisenbahntechnische Rundschau 26, 349.
Brons, M., Givoni, M., Rietveld, P., 2009. Access to railway stations and its potentialin increasing rail use. Transp. Res. Part A 43, 136–149.
Brons, M., Rietveld, P., 2009. Improving the quality of the door-to-door rail journey:a customer-oriented approach. Built Environ. 35 (1), 122–135.
Campos, J., de Rus, G., 2009. Some stylized facts about gigh-speed rail: a review ofHSR experiences around the world. Transp. Policy 16, 19–28.
Cascetta, E., Coppola, P., Velardi, V., 2013. High-speed rail demand: before-and-afterevidence from the Italian market. disP 49 (193), 51–59.
Cascetta, E., Papola, A., Pagliara, F., Marzano, V., 2011. Analysis of mobility impactsof the high speed Rome–Naples rail link using within day dynamic mode servicechoice models. J. Transp. Geogr. 19, 635–643.
Clever, R. 1997. Integrated Timed Transfer - A European Perspective. In:Transportation Research Record, vol. 1571, Washington, DC, pp. 109–115.
DB International. 2013. UIC-Study Night Trains 2.0 – New opportunities by HSR?UIC, Berlin, 207.
de Meer, A., Ribalaygua, C., Martin, E., 2012. High-Speed Rail and RegionalAccessibility. In: de Urena Frances, J.M. (Ed.), Territorial Implications of High-Speed Rail – A Spanish Perspective, Ashgate, Farnham, GB, pp. 197–217.
de Urena Frances, J.M., 2009. The high-speed rail challenge for big intermediatecities: a national, regional and local perspective. Cities 26, 266–279.
de Urena Frances, J.M. 2012. High-Speed Rail and its Evolution in Spain. In: de UrenaFrances, J.M. (Ed.), Territorial Implications of High-Speed Rail – A SpanishPerspective, Ashgate, Farnham, GB, pp. 1–16.
de Urena Frances, J.M., Coronado, J.M., Garmendia, M., Romero, V., 2012. TerritorialImplications at National and Regional Scales of High-Speed Rail. In: de UrenaFrances, J.M. (Ed.), Territorial Implications of High-Speed Rail – A SpanishPerspective, Ashgate, Farnham, GB, pp. 129–162.
Derrible, S., Kennedy, C., 2009. Network analysis of world subway systems usingupdated graph theory. Transp. Res. Rec. 2112, 17–25.
Doomernick, J., 2013. The performance and efficiency of high-speed rail systems inEurope and Asia. In: Rio de Janeiro (Ed.), Paper Presented at the WorldConference on Transportation Research – WCTR, Brazil: WCTR. 15–18.07.2013.
Ebeling, K., Kirsch, K.D., 2000. Konzept eines gesamteuropäischen Eisenbahnnetzes.Internationales Verkehrswesen 52 (7+8/2000), 304–307.
Ellwanger, G., 2001. Zukunft für den europäischen Hochgeschwindigkeitsverkehr.Internationales Verkehrswesen 53 (9/2001), 423–425.
European Commission 2010. High-Speed Europe - A sustainable link betweencitizens. Luxembourg: Publications Office of the European Union.
European Council. 1995. Directive 96/48/EC of 23 July 1996 on the Interoperabilityof the Trans-European High-speed Rail System. In: 95/48/EC.
Feliu, J., 2012. High-speed rail in European medium-sized cities: stakeholders andurban development. J. Urban Plan. Develop. 138 (4), 293–302.
Fox, B., Potter, J., Turner, R., Turpie, D., Woodcock, C., 2012. European Rail Timetable,Summer, 2012 ed. Thomas Cook Publishing, Peterborough, UK.
Givoni, M., 2006. Development and impact of modern high-speed train: a review.Transport Rev. 26 (5), 593–611.
Givoni, M., Banister, D., 2012. Speed: the less important element of the high-speedtrain. J. Transp. Geogr. 22, 306–307.
Givoni, M., Rietveld, P., 2007. The access journey to the railway station and its rolein passengers’ satisfaction with rail travel. Transp. Policy 14, 357–365.
Haase, R., 1997. Entwicklung des Hochgeschwindigkeitsverkehrs. EI –Eisenbahningenieur 48 (10), 17–21.
Hainitz, H., 1999. Stand und Perspektiven der österreichischenHochleistungsstrecken. ETR – Eisenbahntechnische Rundschau 48 (9/1999),566–570.
Hall, P., 2009. Magic carpets and seamless webs: opportunities and constraints forhigh-speed trains in Europe. Built Environ. 35 (1), 59–69.
Herry, M., Sammer, G., 1999. Mobilitätserhebung Österreichischer Haushalte.Bundesverkehrswegeplan, Arbeitspaket A3–H2. In: Forschungsarbeiten ausdem Verkehrswesen, Bundesministerium für Wissenschaft und Verkehr, Wien.
Herry, M., Sedlacek, N., Steinacher, I. 2012. Verkehr in Zahlen - Österreich – Ausgabe2011. Wien: Bundesministerium für Verkehr, Innovation und Technologie.
Jain, J., Lyons, G., 2008. The gift of travel time. Transport Geogr. 16, 81–89.Knoflacher, H., 1988. Die ‘‘Neue Bahn’’ – Laßt Zahlen sprechen. Verkehrspolitik
(1–2), 32–33.Knoflacher, H., 1989. Des Kaisers neue Kleider oder Hochgeschwindigkeitsstrecken
– was hat die Fläche davon? Verkehrspolitik 3 (4), 6–9.Koopmans, C., Rietveld, P., Huijg, A., 2012. An accessible approach to railways and
municipal population growth, 1840–1930. J. Transp. Geogr. 25, 98–104.
Kralj, S., 2012. Overview of the railway line Zagreb-Rijeka as part of the spatial-traffic study of the Primorje-Gorski Kotar county and the City of Rijeka. Paperpresented at the CETRA2102, Lakusic, S. (Ed.), Dubrovnik: Uni Zagreb, pp. 523–532.
Last, J., Manz, W., Zumkeller, D., 2003. Heterogenität im Fernverkehr: Wie wenigereisen wie viel? Internationales Verkehrswesen 55 (6), 267–273.
Lill, E., 1889a. Die Grundgesetze des Personenverkehrs. Zeitschrift für Eisenbahnenund Dampfschiffahrt der Österreichisch-Ungarischen Monarchie 2 (35), 697–706.
Lill, E., 1889b. Die Grundgesetze des Personenverkehrs – Schluss. Zeitschrift fürEisenbahnen und Dampfschiffahrt der Österreichisch-Ungarischen Monarchie 2(36), 713–725.
Lopez Pita, A., Robuste Anton, F., 2003. The effects of high-speed rail on thereduction of air traffic congestion. J. Public Transport. 6 (1), 37–52.
Lyons, G., Jain, J., Holley, D., 2007. The use of travel time by rail passengers in GreatBritain. Transport. Res. Part A Policy Pract. 41 (1), 107–120.
Marti-Henneberg, J., 2012. European integration and national models for railwaynetworks (1840–2010). J. Transp. Geogr. 26, 126–138.
Müller, C., 1997. Thalys: Die Verbindung Paris-Brüssel-Köln/Amsterdam. EI –Eisenbahningenieur 48 (10), 28–30.
Murray, A.T., 2001. Strategic analysis of public transport coverage. Socio-Econ. Plan.Sci. 35 (3), 175–188.
Murray, A.T., 2003. A coverage model for improving public transit systemaccessibility and expanding access. Ann. Oper. Res. 123, 143–156.
Murray, A.T., Davis, R., Stimson, R.J., Ferreira, L., 1998. Public transportation access.Transp. Res. Part D 3 (5), 319–328.
Nash, C. 2009. When to Invest in High-Speed Rail Links and Networks. OECD,International Transport Forum, Leeds, 24.
ÖBB. 1992. Richtlinien für das Entwerfen von Bahnanlagen –Hochleistungsstrecken. Wien: Österreichische BundesbahnenGeneraldirektion, vol. 8.
Preston, J., 2009. Trends in European railways over the last two decades. BuiltEnviron. 35 (1), 11–23.
RGI. 2008. Argentina confirms high speed consortium. In: Railway GazetteInternational, 06/2008, 01.06.2008.
Roman, C., Espino, R., Martin, J.C., 2007. Competition of high speed train with airtransport: the case of Madrid-Barcelona. J. Air Transp. Manage. 13, 277–284.
S+W. 2005. Eisenbahnatlas Österreich - Railatlas Austria. Köln: Verlag Schweers +Wall.
Sanchez Borras, M., Lopez Pita, A., 2010. Impact of rail infrastructure charges on thecompetiveness of high speed services. RTR – Rail Technol. Rev. (1), 6–10.
Schwarz, A., 2001. Bessere Schienenwege für Europa. InternationalesVerkehrswesen 53 (3), 104–106.
SEPO, 2010a. High Speed Rail for Thailand: Development Policies and EconomicAnalysis. State Enterprise Policy Office, Bangkok, 30.
SEPO, 2010b. High Speed Rail for Thailand: Framework for Private PublicParticipation. State Enterprise Policy Office, Bangkok, 30.
Smith, S., Stephens, J., Pratt, R., 2004. High Speed Rail: International Comparisons.Commission for Integrated Transport, London, 69.
Tapiador, F.J., Burckhart, K., Marti-Henneberg, J., 2009. Characterizing Europeanhigh speed train stations using intermodal time and entropy metrics. Transp.Res. Part A 43, 197–208.
Uttenthaler, H., 2010. Grundlagen eines auf einem integrierten Taktfahrplanbasierenden Eisenbahninfrastrukturausbaues am Beispiel Zentraleuropa.Fakultät für Bauingenieurwesen, Technische Universität Graz, Graz, 277.
Veit, P., 1993. Gibt es eine wirtschaftlich optimale Höchstgeschwindigkeit für dasEisenbahnwesen Österreichs? ÖZV – Österreichische Zeitschrift fürVerkehrswissenschaft 40 (1–2), 55–63.
Veit, P., 2001. Ein Weg zum Gesamtoptimum im System Eisenbahn – Überlegungenan Hand wirtschaftlicher Bewertungen von Betriebs- undInfrastrukturprojekten. Paper Presented at the Berufungsvorträge TU Wien,Institut für Eisenbahnwesen, TU Wien: 01.02.2001.
Vickerman, R., 1997. High-speed rail in Europe: experience and issues for futuredevelopment. Ann. Reg. Sci. 31, 21–38.
Vickerman, R., 2012. High-speed rail – the European experience. In: de UrenaFrances, J.M. (Ed.), Territorial Implications of High-Speed Rail – A SpanishPerspective, Ashgate, Farnham, GB, pp. 17–32.
Vrtic, M., Weis, C., Fröhlich, P., 2013. Einfluss der Siedlungsentwicklung und des ÖV-Verkehrsangebotes auf die Verkehrsentwicklung. Straßenverkehrstechnik 57(3), 129–135.
Walter, S., 2012. Integrated periodic timetable scheduling - towards an integratedtimetable across Central Europe. Lakusic, S. (Ed.), Paper Presented at theCETRA2102, Dubrovnik: Uni Zagreb, pp. 855–861.
Wardman, M., Tyler, J., 2010. Rail network accessibility and the demand forinterurban rail travel. Trans. Rev. 20 (1), 3–24.
Weis, P., 2005. Konstruktionsprinzip eines Taktfahrplans – Eine Strategie für denEisenbahnverkehr der Staaten Kroatien, Ungarn, Slowenien und Österreich. Inst.für Eisenbahnwesen und Verkehrswirtschaft, TU Graz, Graz, 126.
Woker, K.P. 2013. Schlecht ausgelastetes AVE-Netz in Spanien. In: Eisenbahn-Revue,12/2013.
Wong, W.G., Han, B.M., Ferreira, L., Zhu, X.N., 2002. High-speed rail operationswithin an existing network: an assessment model from China. Transport. Plann.Technol. 25, 239–254.