Railway Accident Investigation Report
81
i RA2017-8-II Railway Accident Investigation Report Train Derailment Accident between Kumamoto station and Kumamoto General Train Depot of the Kyushu Shinkansen of the Kyushu Railway Company November 30, 2017 Japan Transport Safety Board
-
Upload
khangminh22 -
Category
Documents
-
view
1 -
download
0
Transcript of Railway Accident Investigation Report
i
RA2017-8-II
Railway Accident Investigation Report
Train Derailment Accident
between Kumamoto station and Kumamoto General Train Depot
of the Kyushu Shinkansen of the Kyushu Railway Company
November 30, 2017
Japan Transport Safety Board

ii
The objective of the investigation conducted by the Japan Transport Safety Board in
accordance with the Act for Establishment of the Japan Transport Safety Board is to determine the
causes of an accident and damage incidental to such an accident, thereby preventing future
accidents and reducing damage. It is not the purpose of the investigation to apportion blame or
liability.
Kazuhiro Nakahashi
Chairman
Japan Transport Safety Board
Note:
This report is a translation of the Japanese original investigation report. The text in
Japanese shall prevail in the interpretation of the report.

iii
Railway accident investigation report
Railway operator : Kyushu Railway Company
Accident type : Train derailment
Date and time : About 21:26, April 14, 2016
Location : At around 99,160 m from the origin in Hakata station, between
Kumamoto station and Kumamoto General Train Depot, Kyushu
Shinkansen, Kumamoto City, Kumamoto Prefecture
November 6, 2017
Adopted by the Japan Transport Safety Board
Chairman Kazuhiro Nakahashi
Member, Chair Fuminao Okumura
Member Hiroaki Ishida
Member Toshiyuki Ishikawa
Member Miyoshi Okamura
Member Miwako Doi

iv
SYNOPSIS
SUMMARY
On April 14, 2016, the 5347A train, composed of 6 vehicles started from Hakata station bound
for Kumamoto station, Kyushu Shinkansen of Kyushu Railway Company, arrived at Kumamoto
station. After that, the train departed from Kumamoto station in the deadhead operation on
schedule at 21:25. While the train was running at the velocity of about 78 km/h, the train driver
felt vertical jolts as if the earth were heaving upward, then turned off the notch and applied the
emergency brake immediately. There was heavy rolling after vertical jolts. After the train stopped
at around 99,461 m from the origin in Hakata station, the train driver got off the train and checked
underfloor of the vehicles and found that all 6 vehicles were derailed.
Only the train driver was boarded on the train, i.e., a conductor was not boarded, between
Kumamoto station and Kumamoto General Train Depot, but no one was injured.
Here, the earthquake, one of the 2016 Kumamoto Earthquakes, occurred at about 21:26, April
14, 2016. The magnitude was 6.5, the hypocenter was in about 11 km deep of Kumamoto district,
Kumamoto Prefecture, and the maximum seismic intensity 7 was observed in Mashiki Town,
Kumamoto Prefecture.
PROBABLE CAUSES
It is probable that the accident occurred as the train derailed due to receiving the seismic
ground motion of the earthquake occurred at about 21:26, April 14, 2016, which was one of the
2016 Kumamoto Earthquakes.
As for the process to the derailment, it is probable that many axles derailed in almost the same
timing, after each vehicle in the train rolled significantly and wheel flanges of left or right wheels
climbed up the rail, because the rolling motion in the frequency range to promote rolling motion
of the vehicles easily were amplified in the structures, in addition to the violent shakes in the
direction orthogonal to the track was acted on just beneath the structures in around the accident
site due to the amplified vibration of the ground.

v
CONTENTS
1. PROCESS AND PROGRESS OF THE RAILWAY ACCIDENT INVESTIGATION.................. 1
1.1. Summary of the Railway Accident ........................................................................................ 1
1.2. Outline of Railway Accident Investigation ............................................................................ 1
1.2.1. Organization of the Investigation ................................................................................... 1
1.2.2. Implementation of the Investigation............................................................................... 2
1.2.3. Comments from Parties Relevant to the Cause .............................................................. 2
2. FACTUAL IFORMATION ............................................................................................................ 2
2.1. Progress of the Train Operation .............................................................................................. 2
2.1.1. Statements of the Train Crews, etc. ................................................................................. 2
2.1.2. Records of the Operating Status...................................................................................... 4
2.2. Injuries to Persons .................................................................................................................. 6
2.3. Information on the Accident Site ............................................................................................ 7
2.3.1. Status of the Accident Train after the Accident .............................................................. 7
2.3.2. Traces of the Derailment ................................................................................................. 8
2.4. Information on the railway facilities and the vehicles ........................................................... 9
2.4.1. Outline of the Railway Facilities .................................................................................... 9
2.4.2. Outline of the Vehicles .................................................................................................. 11
2.4.3. The Other Information on the Vehicles ........................................................................ 13
2.5. Information on the Damages of the Railway Facilities and the Vehicles, etc. ..................... 14
2.5.1. Status of Major Damages in the Railway Facilities in around the Accident Site ......... 14
2.5.2. Status of Major Damages and Traces in the Vehicles of the Accident Train ................ 15
2.6. Information on the Major Measures against Large Scale Earthquake in the Company ....... 17
2.6.1. Train Defense System for Earthquake .......................................................................... 17
2.6.2. Derailment and Deviation Preventing Devices ............................................................. 18
2.7. Information on the Train Crews, etc. .................................................................................... 19
2.8. Information on the Weather Conditions ................................................................................ 19
2.9. Information on the Earthquake ............................................................................................. 20
2.9.1. Outline of the Concerned Earthquake, etc. ................................................................... 20
2.9.2. Positional Relationship between the Accident Site and the Epicenter of the
Concerned Earthquake ................................................................................................. 20
2.9.3. Records of the Seismographs Located in the Earthquake Observing Points in
around the Accident Site ................................................................................................ 21
2.10. Information on the Simulation of the Derailment ............................................................... 22
2.10.1. Observation of the Concerned Earthquake, Main Shock and Aftershocks ................. 22
2.10.2. Simulation of the Derailment ...................................................................................... 23
2.11. Information on the Other Shinkansen Trains Running in around the Accident Site ........... 36
2.12 The Other Information ......................................................................................................... 36
2.12.1 Status of the Restoring Works after the Accident ........................................................ 36

vi
2.12.2 The Past Derailment Accidents of Shinkansen Train by Large Scale Earthquakes ..... 36
3. ANALYSIS ................................................................................................................................... 38
3.1. Analysis on Maintenance of the Tracks and the Vehicles before the Accident ..................... 38
3.1.1. Maintenance of the Tracks ............................................................................................ 38
3.1.2. Maintenance of the Vehicles ......................................................................................... 38
3.2. Analysis on the Derailment of the Accident Train ................................................................ 38
3.2.1. Status before and after the Occurrence of the Accident ................................................ 38
3.2.2. Relationship between the Occurrence of the Derailment and Status of the Vehicles,
the Tracks, etc. ........................................................................................................... 40
3.2.3. Relationship between the Occurrence of the Derailment and the Concerned
Earthquake ................................................................................................................... 40
3.2.4. Effects by the Ground Condition .................................................................................. 41
3.2.5 Effects by the Structures ................................................................................................ 42
3.2.6. Mechanism of the Derailment ....................................................................................... 42
3.3. Analysis on Estimation of Seismic Ground Motion of the Ground Surface in the
Accident Site ....................................................................................................................... 43
3.4. Analysis on Damages of the Tracks and the Vehicles ........................................................... 46
3.4.1. Damages of the Tracks .................................................................................................. 46
3.4.2. Damages of the Vehicles .............................................................................................. 46
3.5. Analysis on Prevention of Recurrence and Reduction of Damages ..................................... 47
3.5.1. Guard Angles ................................................................................................................ 47
3.5.2. Measures to Prevent Deviation ..................................................................................... 48
3.5.3. Train Defense System for Earthquake .......................................................................... 48
4. CONCLUSIONS ......................................................................................................................... 49
4.1. Findings ................................................................................................................................ 49
4.2. Probable Causes .................................................................................................................... 52
5. SAFETY ACTIONS ..................................................................................................................... 52
5.1. Measures Expected to be Implemented in the Future ........................................................... 52
5.2. Measures Implemented by the Company after the Accident ................................................ 53
5.3. Measures Implemented by the Ministry of Land, Infrastructure, Transport and Tourism
after the Accident ................................................................................................................ 53

vii
ATTACHED MATERIALS
Attached figure 1. Route map of Kyushu Shinkansen ................................................................... 54
Attached figure 2. Topographical map around the accident site .................................................... 54
Attached figure 3. Schematic diagram of the accident site ............................................................ 54
Attached figure 4. Structures in around the accident site ............................................................... 55
Attached figure 5. Status of derailment of the accident train ......................................................... 60
Attached figure 6. Schematic diagram of the train defense system for earthquake ........................ 63
Attached figure 7. Extracted records of the brake control device ................................................... 63
Attached figure 8. Extracted records of acceleration of lateral vibration of vehicle body .............. 64
Attached figure 9. Positions of the earthquake detecting points for the train defense system
for earthquake ...................................................................................................... 64
Attached figure 10. Observed records of the concerned earthquake in JMA Kumamoto
Nishi-Ku Kasuga ................................................................................................. 65
Attached figure 11. Observing points for the main shock and the aftershocks ............................... 66
Attached figure 12. Extracted ground model determined in the places of structures ...................... 66
Attached figure 13. Model of the structures group .......................................................................... 67
Attached figure 14. Modeling of supports and girders .................................................................... 67
Attached figure 15. Results of the behavior analysis for the 1st vehicle ......................................... 68
Attached figure 16. Results of the behavior analysis for the 3rd vehicle ........................................ 69
Attached figure 17. Transition of posture of the 1st vehicle just before the derailment ................. 70
Attached figure 18. Transition of posture of the 3rd vehicle just before the derailment ................. 71
Attached figure 19. Results of the behavior analysis for the 1st vehicle when guard angles
were equipped ................................................................................................. 72
Attached figure 20. Results of the behavior analysis for the 3rd vehicle when guard angles
were equipped ..................................................................................................73
Attached figure 21. Behavior of the vehicle when derailed to right ................................................ 74

1
1. PROCESS AND PROGRESS OF THE RAILWAY ACCIDENT INVESTIGATION
1.1. Summary of the Railway Accident
On Thursday, April 14, 2016, the 5347A train, composed of 6 vehicles started from Hakata
station bound for Kumamoto station, Kyushu Shinkansen of Kyushu Railway Company, arrived at
Kumamoto station. After that, the train departed from Kumamoto station in the deadhead
operation on schedule at 21:25. While the train was running at about 78 km/h, the train driver felt
vertical jolts as if the earth were heaving upward, then turned off the notch and applied the
emergency brake immediately. There was heavy rolling after vertical jolts. After the train stopped
at around 99,461 m from the origin in Hakata station, the train driver got off the train and checked
underfloor of the vehicles and found that all 6 vehicles were derailed.
Only the train driver was boarded on the train, i.e., a conductor was not boarded, between
Kumamoto station and Kumamoto General Train Depot, but no one was injured.
Here, the earthquake, one of the 2016 Kumamoto Earthquakes, occurred at about 21:26, April
14, 2016. The magnitude was 6.5, the hypocenter was in about 11 km deep of Kumamoto district,
Kumamoto Prefecture, and the maximum seismic intensity 7 was observed in Mashiki Town,
Kumamoto Prefecture.
1.2. Outline of Railway Accident Investigation
1.2.1. Organization of the Investigation
The Japan Transport Safety Board, JTSB, designated a chief investigator and two railway
accident investigators to investigate the accident, on April 14, 2016.
In addition, another two railway accident investigators were designated on April 22, 2016.
As it is considered the possibility that the seismic ground motion by the earthquake, which
occurred at about 21:26, April 14, 2016, one of the 2016 Kumamoto Earthquakes, was related
with the accident, the JTSB appointed three professional members, listed in Table 1, to engage in
the investigation of the accident, and designated technical fields to be investigated as
earthquakes, structures and vehicles, respectively.
Table 1. Professional members and their technical fields to be investigated
Organization Title Name Technical fields
Earthquake Research Institute, The University of Tokyo Professor T. Furumura Earthquakes
School of Regional Design, Utsunomiya University Professor A. Nakajima Structures
Institute of Industrial Science, The University of Tokyo Professor Y. Suda Vehicles
* Organizations and Titles are as of September 2016
Kyushu District Transport Bureau dispatched its staffs to support investigation of the
accident.
The JTSB entrusted the simulation analysis on the vehicle behaviors during earthquake to the
Railway Technology Research Institute, RTRI. In addition, analyses of the process to the

2
derailment were implemented with the cooperation of the RTRI.
1.2.2. Implementation of the Investigation
- April 15 and 16, 2016 Investigation of the accident site and interviews
- April 25 and 26, 2016 Investigation of the vehicles and the accident site
- September 2016 to March 2017 Simulation analysis on vehicle behaviors during
earthquake
1.2.3. Comments from Parties Relevant to the Cause
Comments from parties relevant to the cause were invited.
2. FACTUAL INFORMATION
2.1. Progress of the Train Operation
2.1.1. Statements of the Train Crews, etc. [Refer to Attached figures 1 to 5]
According to the statements of the driver, hereinafter referred to as "the Driver", of the 5347A
train, hereinafter referred to as "the accident train", composed of 6 vehicles started from Hakata
station bound for Kumamoto station, Kyushu Shinkansen of Kyushu Railway Company,
hereinafter referred to as "the Company", and scheduled to be the deadhead train bound for
Kumamoto General Train Depot after arrived at Kumamoto station, the process to the accident
was as follows.
On the accident day, the Driver took over operation of the accident train from the
preceding driver as there was no abnormal situation in the accident train at Hakata station.
The accident train departed from Hakata station on time at 20:17, and arrived at Kumamoto
station, located at 1,167,275 m from the origin in Tokyo station, i.e., at 98,180 m from the
origin in Hakata station, on schedule at 21:11. Hereinafter, kilometerages were expressed by
the distance from the origin in Hakata station, and the text "from the origin in Hakata
station" was omitted. Any abnormal situation was noticed during train operation.
The accident train departed from Kumamoto station on schedule at 21:25, as the
deadheading train in the section from Kumamoto station to Kumamoto General Train Depot.
The Driver operated the accident train in powering operation by notch 4, as the ATC signal
at that moment was "80" signal, which means the reference velocity was 80 km/h. After that,
the Driver set the powering notch 2, as the ATC signal changed. The velocity of the accident
train at that time was 80 km/h.
Just after the ATC signal changed to "85" signal, i.e., the reference velocity was 85 km/h,
there was the shock of vertical vibration as if the earth were heaving upward, then the Driver
set notch off and applied the emergency brake immediately. The Driver thought that he
operated the emergency brake earlier than the automatic operation of the onboard device, but
he also felt that the both operations were implemented almost the same time. There were the
violent lateral shakes at almost the same moment with the operation of the emergency brake.

3
Hereinafter, directions "left"/"right" and "front"/"rear" were defined based on the running
direction of the train. The Driver was seated in the driver's seat but he was hard to be seated
firmly as his body was shaking. The Driver intended to operate the EGS*1 but he could not
operate due to violent shakes, then he pushed the button after the accident train stopped.
The accident train stopped at 1,168.6 km, which was the kilometerage from the origin in
Tokyo statin indicated in the monitor device*2, and the stopped time was 21:27.
As for the shakes, the severe shocks occurred suddenly and continued a while as the
Driver thought when it would calm, but he felt that the shocks were weakened gradually and
calmed within one minute. While the accident train was running, there was dreadful sound
as "grrr", never heard before. It was low pitched scraping sound, not high tone sound.
The status of indicator lamps in the driver's desk were as follows, the ATC signal
indicated "X-indication", the indicator lamps for ATC brake, electric devices, VCB*3, bogies
and emergency brake were "lightened", and the buzzer was sounded. As it became utter dark
in the cabin, the Driver checked the trolley voltage in the voltmeter and found that it was 0 V.
But the DC power source was in active and the emergency lights were lighting.
The Driver checked backward of the train from the small window in the driver's cabin
and found the gaps between vehicles which could not be found in usual situation, then he
thought that it was serious situation. The jolts were so violent that the Driver was shook in
vertical and lateral direction after the accident train was stopped, then he communicated to
the Shinkansen train dispatcher of the Traffic Control Division, hereinafter referred to as
"the train dispatcher", after waited for a little. The train dispatcher instructed the Driver to
implement measures to prevent discharge of batteries, and to check underfloor of vehicles
after implement procedure to prevent wheel rolling, at 21:44. Then the Driver set the
reverser handle in off position while the emergency brake was acting and got off the
accident train. He walked on the track in left side of the accident train to the rearmost
vehicle checking the status of vehicles and found that all vehicles were derailed. Then, he
reported to the train dispatcher about the situation.
The Driver also checked the situation around the couplers between vehicles in addition to
the bogies. When the Driver checked inside cabins to the second vehicle, he felt dusty and
hazy but there was no abnormal smell. Here, the number of the vehicles in the accident train
was counted from the front.
As the train dispatcher instructed to lower pantographs at 22:42, the Driver operated the
required procedure obeying the instruction. After that, while the Driver was waiting in the
train, the Company staffs came to the driver's cab at about 00:00 in the next day, April 15.
As the severe aftershock occurred at that moment, they evacuated outside of the train,
because it was considered as dangerous to stay in the accident train.
*1 "EGS" is the abbreviation of "Emergency Ground Switch", which is equipped in AC electric
railcars, and used to stop power feeding to overhead contact lines urgently to secure safety, by
forming circuit to ground the pantograph voltage directly when it is operated.
*2 "Monitor device" is the device to monitor status of each onboard equipment and assist train crews
by simplifying indication of contents of malfunctions and operations for inspections and repairs,

4
when malfunctions happened.
*3 "VCB" is the abbreviation of "Vacuum Circuit Breaker", which is the circuit breaker to cut off
electric circuit in the high vacuum container in AC electric railcars and AC-DC dual system
electric railcars.
2.1.2. Records of the Operating Status
2.1.2.1. Records in the Accident Train
The device recording the operating status based on the event driven*4 rule, hereinafter
referred to as "the operating status recording device", was equipped in the accident train, and
the data about time, velocity, status of braking operation, etc. were recorded. According to these
recorded data, summaries of the operating status of the accident train before and after the
accident were shown in Table 2. Here, there was no data between 21:26:43 to 21:26:47 in the
operating status recording device.
Table 2. Extracted records of operating status of the accident train
Date & time* [yy.mm.dd_hh.mm.ss]
Velocity
[km/h]
Kilometerage
of front head
of the train
Contents
16.04.14_21.26.41 79.2 99,265 m Received trigger signal "02", i.e., stop due to lowered
trolley voltage.
16.04.14_21.26.42 79.7 99,286 m Received trigger signal "02E", i.e., emergency stop.
16.04.14_21.26.43 78.4 99,295 m Receiver device issued emergency brake command, after
confirmed receipt of signal "02E", i.e. emergency brake.
16.04.14_21.26.43 78.3 99,296 m Relay for emergency brake in the receiver device was
acted.
16.04.14_21.26.43 78.8 99,298 m Relay for emergency brake in the operation control
device was acted.
16.04.14_21.26.43 79.9 99,304 m
Confirmed receipt of stop signal "02" due to lowered
trolley voltage, but nothing changed as relay for
emergency brake in receiver device was already acted,
i.e., emergency was continued.
16.04.14_21.26.43 77.2 99,310 m Emergency brake is in operation.
16.04.14_21.26.47 0 0 m Under initialization due to restart after the momentary
power failure in the ATC device.
* Times in the table were the revised times.
The time data in the operating status recording device had a possibility to include some
errors because they were obtained from the time in the monitor device of the accident train, in
which sub-second data were omitted, and adjusted manually before the accident train started
from Hakata station by the Driver based on the railway watch, i.e., the business pocket watch,
carrying with himself. Therefore, the time data listed in the date & time column of Table 2 are
the revised data based on the time when the circuit breaker 13 for power feeding in
Shin-Gyokuto substation was acted, indicated in Table 3 in 2.1.2.2. In addition, the velocity
data also had a possibility to include some errors compared with the actual velocity due to spin,
slip, etc. of wheels.

5
The ATC emergency brake in the accident train did not act instantaneously in order to realize
the stable control even when the system received the emergency stop "02E" signal or the stop
signal "02" due to lowered trolley voltage, from the ground device. The onboard system
received the stop signal "02" due to lowered trolley voltage at first on 21:26:41, and confirmed
it about 2 seconds later, which was almost the same time when the receipt of the emergency
stop signal "02E" was confirmed, at 21:26:43. Here, the ATC emergency brake of the accident
train had operated by the emergency stop signal "02E".
The recorded data about velocity and position of the front head of the train at 21:26:47 were
0, and the position of the front head of the train just before recorded as 0, was around 99,310 m.
According to the Company, the operating status recording device starts recording a few seconds
after the time when the power switch was turned on.
Here, it is probable that the accident started from about 21:26:43 to 21:26:44, as described in
the following paragraph 3.2.1.2.
*4 "Event driven" was the procedure operated when some event, i.e., change of phenomena, was
happened, different from the procedure operated periodically.
2.1.2.2. Records of the Power System Control
The records of power system control were the time series data of changed status and
controlled status of the equipment to be monitored and the equipment to be controlled in the
substations*5, sectioning post*6, sub-sectioning post, hereinafter abbreviated as "SS", "SP",
"SSP", respectively, managed by the Shinkansen electric power dispatcher in the Traffic
Control Division. According to the Company, there were little errors in the time data used in the
records of power system control because they were adjusted periodically based on the radio
wave clock every day. Shin-Gyokuto SS was feeding electric power to the overhead contact
line in the section where the accident train was running when the earthquake, that occurred at
about 21:26, April 14, 2016, hereinafter referred to as "the concerned earthquake", one of the
2016 Kumamoto Earthquakes, occurred. Shin-Gyokuto SS received the interlinked breaking
signal transferred from the Kumamoto Train Depot SS, where detected the concerned
earthquake and transferred it to, in turns, Shin-Tomiai SSP, Shin-Kumamoto SSP and
Shin-Gyokuto SS, at 21:26:41, and turned off the circuit breaker 13 for power feeding
immediately, to break power feeding to the overhead contact lines, as shown in Table 3.
*5 "Substation" is the plant to supply or cut off electric power to the overhead contact line, composed of
power receiving facilities, main transformer facilities, power feeding facilities, etc.
*6 "Sectioning post" is the plant located at intermediate point between power stations to change areas
to feed electric power to overhead contact lines by the switch gears.

6
Table 3. Extracted records of the power system control
Time & Date Place Device name Status Remarks
21:26:41,
April 14
Kumamoto
Train Depot SS 22LI Received Electrical trackside seismograph was operated.
21:26:41,
April 14
Shin-Tomiai
SSP 85FREK2B Received
Interlinked breaking signal due to earthquake,
from Kumamoto General Train Depot SS.
21:26:41,
April 14
Shin-Kumamoto
SSP 85FREK2B Received
Interlinked breaking signal due to earthquake,
from Shin-Tomiai SSP.
21:26:41,
April 14
Shin-Gyokuto
SS 85FREK2B Received
Interlinked breaking signal due to earthquake,
from Shin-Kumamoto SSP.
21:26:41,
April 14
Shin-Gyokuto
SS 13 Opened Circuit breaker 13 for power feeding.
21:26:42,
April 14
Kumamoto
Train Depot SS 22LC Received
Mechanical trackside seismograph was
operated.
2.1.2.3. Operation Records of the Seismograph for the Train Defense System for Earthquake in
Kumamoto Train Depot SS [Refer to Attached figure 6]
The seismograph located in the track side earthquake detecting point in the premises of
Kumamoto Train Depot SS transmitted the signal to break electric power feeding to overhead
contact line, hereinafter referred to as " the trip feeding signal", when the concerned
earthquake occurred. The recorded data were shown in Table 4.
The following events were shown in Table 4. The exceeded standard value in the
seismograph for early detection was detected at 21:26:40.08, the exceeded standard value in the
seismic motion detector for control was detected at 21:26:41.31, the P-wave*7 estimated signal
in the seismograph for early detecting was detected at 21:26:42.70, and the earthquake early
warning information by the Japan Meteorological Agency, JMA was detected at 21:26:43.32,
and the trip feeding signals were transmitted to Kumamoto Train Depot SS, respectively.
*7 "P-wave" is the vertical wave, observed by seismograph at first.
Table 4. Records of the earthquake in the train defense system for earthquake located
in the premises of Kumamoto Train Depot SS
Transmitted
time
Trip feeding
signal
Time difference with
trigger of earthquake Situation
21:26:38.46 - - Trigger of earthquake
21:26:38.82 - 0.36 s P-wave was estimated, 1st announce.
21:26:39.82 - 1.36 s P-wave was estimated, 2nd announce.
21:26:40.08 Transmitted 1.62 s Exceeded standard value for display.
21:26:40.82 - 2.36 s P-wave was estimated, 3rd announce.
21:26:41.31 Transmitted 2.85 s Exceeded standard value for control.
21:26:42.70 Transmitted 4.24 s P-wave was estimated, 4th announce.
21:26:43.32 Transmitted 4.86 s Earthquake early warning information, JMA
2.2. Injuries to Persons
None

7
2.3. Information on the Accident Site
2.3.1. Status of the Accident Train after the Accident
The front head of the accident train was halted at around 99,461 m and all axles, except for
the 3rd axle in the 1st vehicle and the 3rd axle in the 2nd vehicle, had been derailed when the
investigation of the accident site was implemented. The 6 axles had been derailed to right and the
16 axles had been derailed to left of the track, and the most deviated axle was the 2nd axle in the
6th vehicle, in which the axle box suspension device was damaged, and its left wheel had been
derailed to inside gauge by 57 cm apart from left rail, as shown in Figure 1.
Figure 1. Status etc. of each axle after the occurrence of the accident
When the investigation of the accident site was implemented, vehicles were displaced with
each other in lateral direction, and the front head of the accident train deviated to left by about
half of the gauge and center of the front head deviated to just above the left rail, as shown in
Figure 2. The pantograph equipped on the 2nd vehicle had been in the lifted position, but its bow
had come off to above the overhead contact line. The right horn of the pantograph, considered as
to contact with hanger of the overhead contact line, was broken away, and the broken piece was
found in beneath the Rendaiji No.1 viaduct, hereinafter referred to as "No.1 Rendaiji BL",
around the border of Kagoshima main line and Kumamoto Vehicle Center, about 20 to 30 m
apart from Tsuboigawa Bridge, hereinafter referred to as "Tsuboigawa B", in the direction to
Kumamoto General Train Depot, according to the Company.
The 3rd axles in the 1st and 2nd vehicles had been stayed on rails, but there were fretting
traces considered as contacted with something in circumference of outside surfaces of the
wheels.
There was no trace considered as running on the slab track, in the tip of flanges of left and
right wheels of the 3rd axles in the 1st and 2nd vehicles.

8
Figure 2. Status of the accident train at the investigation of the accident site.
2.3.2. Traces of the Derailment
There was linear trace considered as caused by the wheel flanges running on the top surface
of left rail in around 99,157 m, hereinafter referred to as the "start point of the derailed trace",
and there were damages considered as caused by the wheels running on the rail fastening devices
and the bottom of rail in outside gauge of left rail in around 99,160 m, but there was no trace
considered as wheel flanges climbed up rails. In addition, there was no trace considered as to
relate with the derailment on the track in the direction to Kumamoto station from there. Traces of
the derailment were shown in Figure 3. There was the black adhesion considered as the gear oil
leaked from gear box of the driving device on the top surface of left rail in around 99,160 m.
There were black adhesions, as same as described in the above, discretely on the rail and the
frame shaped slab*8 from around 99,160 m in the direction to Kumamoto General Train Depot.
There were damages considered as being hit by the wheels or the underfloor equipment on the
front wall of inside frame of the frame shaped slab, hereinafter referred to as "the hollow in
frame shaped slab" refer to Figure 5, from around 99,200 m to the position where the accident
train had stopped. The damaged level became severer gradually according to the movement of
the train, but it became smaller gradually to the point where the accident train stopped. There
were many black adhesions described in above and the traces etc. being scraped by the
underfloor equipment and their cover plates, etc. of the vehicle on the top of rail, and many
traces etc. considered as caused by the wheels passing on and the underfloor equipment of
vehicles coming into contact with the rail fastening devices, bottom of rail and the frame shaped
slab in the same section.
Figure 3. Traces of the derailment, around 99,157 m in left, and around 99,160 m in right

9
*8 "Frame shaped slab" is one of the flat panel slab made of concrete having the frame type shape,
composed of longitudinal parts mainly suspending load weight and lateral parts suspending the gauge,
compared to commonly used "A type" slab.
2.4. Information on the Railway Facilities and the Vehicle
2.4.1. Outline of the Railway Facilities
2.4.1.1. Route
Kyushu Shinkansen, between Hakata station and Kagoshima-Chuo station, was 288.9 km in
railway business mile, double track, electrified by AC 25,000 V, and gauge is 1,435 mm. The
Japan Railway Construction Transport and Technology Agency, hereinafter referred to as "the
JRTT", had constructed the railway track and possess the railway facilities in the route, and
Kyushu Railway Company manages the train operation.
2.4.1.2. Information on the Vicinity of the Accident Site
[1] Track layout [Refer to Attached figure 3]
The accident occurred on Tasaki No.2 viaduct, hereinafter referred to as "No.2 Tasaki BL",
located from 98,930 m to 99,332 m and Tsuboigawa B located from 99,332 m to 99,427 m.
The accident site was in the section where viaducts and bridges were continuously laid out,
and direction of the track was almost in NNW to SSE.
The track layout was as follows, from 98,725 m to 99,082 m was the left curved section
with 402 m radius and 115 mm cant, from 99,132 m to 99,620 m was the right curved section
with 1,000 m radius and 105 mm cant, including the transition curve from 99,132 m to 99,217
m. Here, from 97,995 m to 100,651 m was the flat track section.
[2] Outline of the structures, i.e., viaducts and bridges [Refer to Attached figure 4]
The structure types of No.2 Tasaki BL in the accident site were composed of six Gerber
type rigid frame viaducts*9, i.e., four 5-span viaducts and two 6-span viaducts, and seven
T-shaped girders. The foundations were pile foundations consisted of the cast-in-place
concrete piles with underground beams. Hight of the upper surface of slab from the ground
surface was about 10 m.
The structure types of Tsuboigawa B were the box girders, the T-shaped girders and the
wall type piers, and foundations were the pile foundation consisted of the cast-in-place
concrete piles.
The structures in around the accident site was designed in 2003 FY, in accordance with the
technical standard on the seismic design at that time, i.e., "Design standards on railway
structures etc., seismic design, 1999".
*9 "Rigid frame viaduct" is the viaduct with the unified columns and girders.
[3] Outline of the ground
According to the vertical section chart of geology around Kumamoto station provided from
the JRTT, the stratum in around the accident site were, the alluvial clay soil layer and alluvial
sand soil layer, in two layers each, of the Holocene in the Quaternary period existed from
ground surface to about 30 m depth, the diluvial gravel with sand layer of the Pleistocene in
Quaternary period existed from about 30 m depth to 50 m depth, and the Aso No.4 Pyroclastic

10
flow sediments of the Pleistocene in Quaternary period existed below about 50 m depth.
According to the data, i.e., the columnar section, obtained from the soil analyses in around the
accident site, the soft silt layer*10 was existed from about 20 m to 25 m below the ground
surface.
*10 "Silt layer" is the low water permeability stratum composed of particles with diameters of smaller
than sands and larger than clay.
[4] Outline of the track
The track in around the accident site was the slab track section with the tie plate*11 type
frame shaped slabs for the steep curved track, which sized 4 m or 5 m long, 2.2 m wide and
0.19 m high, and the 60 kg rails were laid out.
The tie plate type direct fastening No.8 modified type or the direct fastening No.8 modified
lower type was used as the rail fastening devices, and the rail fastening devices were laid out
every 625 mm.
*11 "Tie plate" is the plate for fastening inserted between rail and suspension devices such as sleepers
or slab track.
2.4.1.3. Information on the Maintenance Management for the Railway Track Facilities
[1] Periodic inspections
The Company regulated the periodic inspections in "Implementing standards for
maintenance of the Shinkansen facilities", which was decided by the Company in accordance
with the "Ministerial Ordinance to Provide Technical Regulatory Standards on Railways" (No.
151 ordinance issued by the Ministry of Land, Infrastructure, Transport and Tourism, MLIT,
in 2001) and reported to the Minister of Land, Infrastructure, Transport and Tourism. The
latest periodic inspections for the railway track facilities, implemented based on the regulation
before the occurrence of the accident were shown in Table 5. There was no abnormal data and
no data exceeded the maintenance standard value in these periodic inspections.
Table 5. The latest periodic inspections for railway track facilities implemented before the accident
Category of
inspections
Inspecting
periods Implemented place
Implemented
date Contents Result of inspection
Tack irregularity
inspection 2 months
Engineering works Sec.,
Shinkansen Dept.
April 8,
2016
Track status
inspection
No data exceeded the
maintenance standard
Train swaying
inspection 1 year
Kumamoto Shinkansen
Engineering Works
April 6,
2016
Track status
inspection
No data exceeded the
maintenance standard
Long rail
inspection 1 year
Kumamoto Shinkansen
Engineering Works
Mar. 6,
2016
Track status
inspection No abnormal data
Rail etc. inspection 1 year Kumamoto Shinkansen
Engineering Works
Feb. 9,
2016
Track parts
inspection No abnormal data
Slab inspection 1 year Kumamoto Shinkansen
Engineering Works
July 14,
2015
Track parts
inspection No abnormal data
Other materials
inspection 1 year
Kumamoto Shinkansen
Engineering Works
Aug. 5,
2015
Track parts
inspection No abnormal data
Ballast & roadbed
inspection 1 year
Kumamoto Shinkansen
Engineering Works
July 14,
2015
Track parts
inspection No abnormal data

11
[2] Measurement of track irregularity using track inspection devices equipped on the
commercial vehicle.
The Company has been measuring track irregularity by the track inspection devices
equipped on the commercial vehicle, in addition to the periodic inspection. There was no
place where the track irregularities such as gauge, level, longitudinal level irregularity,
alignment and twist, exceeded the maintenance standard values in the measurement of the
track irregularities in the latest track irregularity inspection implemented before the accident.
[3] Track patrol
The track patrol was implemented as shown in Table 6, and there was no abnormal result
in the latest track patrol on foot and onboard track patrol, implemented before the accident.
Table 6. Status of the latest track patrol implemented before the accident.
Category of
inspection
Inspecting
period Implemented place
Implemented
date Contents
Result of
inspection
Track patrol on
foot 1 month
Kumamoto Shinkansen
Engineering Works
April 8,
2016 -
No abnormal
situation
Onboard track
patrol 2 weeks
Kumamoto Shinkansen
Engineering Works
April 2,
2016 -
No abnormal
situation
2.4.2. Outline of the Vehicles
2.4.2.1. Information on Vehicle Specification, History of Vehicles, etc.
Vehicle classification 800 Series AC electric railcar, 25,000 V, 60 Hz
No. of vehicles in the train set 6 vehicles
Major specification Listed in Table 7
Composition of the accident train and positions of the derailed axles were shown in Figure 4.
According to the Company, in case of the 800 series Shinkansen train running at 80 km/h,
the planned idle running time in the manual emergency brake operation was 1.5 s, the idle
running time in the ATC emergency brake operation was about 2.4 s, and the planned average
deceleration until to stop was about 3.6 km/h/s.
Table 7. Major specification of the accident train, i.e., U005 train set composed of the 800
Series Shinkansen electric railcar
Vehicle position in the train set 1st vehicle 2nd vehicle 3rd vehicle 4th vehicle 5th vehicle 6th vehicle
Type & number 821-5 826-5 827-5 827-105 826-105 822-105
Tare [t]*12 44.3 41.8 42.1 41.0 43.3 41.9
Seat capacity [Person] 46 80 72 72 58 56
Vehicle length [mm] 27,350 25,000 25,000 25,000 25,000 27,350
Vehicle height [mm] 3,994 4,500 4,137 4,137 4,500 3,994
Vehicle width [mm] 3,380
Distance between bogie centers [mm] 17,500
Wheel base [mm] 2,500
Wheel diameter [mm] 860
*12 "t" as the unit of weight means "ton weight", i.e. 1,000 [kgw], where 1 [kgw] is 9.8 [N].

12
Figure 4. Composition of the accident train
The history and remodeled records of the accident train were as follows.
Newly produced December 28, 2003 Hitachi Ltd.
Remodeled July, 2010 Works correspond to start whole route service
2.4.2.2. Information on Maintenance Management of Vehicles
[1] Periodic inspections
The Company regulated the periodic inspections in the "Implementing standards for
maintenance of the Shinkansen electric railcars", which was decided by the Company in
accordance with the "Ministerial Ordinance to Provide Technical Regulatory Standards on
Railways" and reported to the Minister of Land, Infrastructure, Transport and Tourism. The
latest periodic inspections implemented obeying the regulation before the accident were
shown in Table 8, and there was no abnormal data in these inspections.
Table 8. The latest periodic inspections of the accident train implemented before the accident
Category of
inspection Inspecting period* Implemented place Implemented date
Running distance
until the accident
General inspection 36 months or
1,200,000 km
Kumamoto General
Train Depot
February 10, 2015
Shop-out 454,943.2 km
Bogie inspection 18 months or
600,000 km
Kumamoto General
Train Depot
February 10, 2015
Shop-out 454,943.2 km
Regular inspection 30 days or
30,000 km
Kumamoto General
Train Depot March 18, 2016 26,441.0 km
Daily inspection 2 days Kumamoto General
Train Depot April 12, 2016 2,571.3 km
* Regulation of inspecting period for newly produced electric railcar were 48 months or 1,200,000 km
after started commercial operation for general inspection, and 30 months or 600,000 km for bogie
inspection.
[2] Ratio of wheel road unbalance
According to the measured results of the ratio of wheel road unbalance in the general
inspection implemented on February 2015, the ratio of wheel road unbalance*13 in all axles
were less than 15 %, which were less than the controlled value regulated in the Maintenance
Manual for 800 series Shinkansen electric railcars.
*13 "Ratio of wheel load unbalance" is the ratio of the static wheel load in each wheel and the average
value of the static wheel load in the axle.
826-5 827-5 827-105 826-105 821-5 822-105
Train direction
: Derailed axles Length of train : about 155 m

13
2.4.3. The Other Information on the Vehicles
2.4.3.1. Information on the Brake Control Device [Refer to Attached Figure 7]
Each vehicle in the accident train was equipped with the brake control device that could
record axle velocity of each wheelset, pressures of left and right air suspensions, "AS pressure",
in each bogie, pressure of brake cylinder, "BC pressure", status of instruction signals related
with braking operation, when the wheel slide or wheel lock was detected. The data in the brake
control devices equipped in the 1st and 6th vehicles, recorded after 21:26:40 were shown in
Attached Figure 7. The pressures of air suspensions 1 and 3 in right side of vehicle, and air
suspensions 2 and 4 in left side of vehicle, oscillated in the same phase, on the contrary,
pressures of air suspensions 1 and 2, and air suspensions 3 and 4 oscillated in inverse phase
with each other, as shown in Attached Figure 7. These situations were in the same trends in all
vehicles of the accident train, although it was not shown in Attached Figure 7. Here the time
data shown in Attached Figure 7 were the revised time from the recorded data because the
brake control device used the time data based on the monitor device.
According to the records in the brake control device, pressures of each air suspension started
to oscillate from about 21:26:42, the BC pressure increased before 21:26:44, and axle velocity
of each wheelset decreased rapidly at about 21:26:43 to 21:26:44. The axle velocities decreased
in almost the same time, for example, velocities of the 1st axle decelerated within about 1 to 2
seconds, the 2nd and 4th axles decelerated within about 4 to 5 seconds in the 1st vehicle, and
velocities of all axles in the 6th vehicle decreased within about 1 to 2 seconds.
The axle velocity of the 3rd axle of the 1st vehicle, which stayed on rails after the accident
train had stopped, decreased same as the calculated velocity*14 during about 5 to 12 seconds.
*14 "Calculated velocity" in this context is the faster one in the velocity obtained from sampling every
20 ms and the velocity sampled before one sampling time subtracted by time integration of the preset
deceleration.
2.4.3.2. Information on Acceleration of Lateral Vibration of the Vehicle Body
[Refer to Attached figure 8]
The status of acceleration of lateral vibration of vehicle body was monitored to equip
accelerometers in the bottom of vehicle bodies in around the front and the rear bogies, in each
vehicle in the accident train. The sample of the recorded acceleration of lateral vibration of
vehicle body was shown in Attached Figure 8. These data were recorded when the value of the
accelerometer exceeded the standard value. Here the time data indicated in Attached Figure 8
were the revised time from the recorded time because the recorded time used the time data in
the monitor device.
The acceleration of the vehicle body lateral vibration of about 10 m/s2, i.e., about 1 G, in
maximum, and oscillating about 5 cycles with about 1 second period, was recorded from about
21:26:42 to about 21:26:47. However, it is somewhat likely that the larger acceleration more
than 10 m/s2 was acted actually, because there was a possibility that the recorded data were
restrained by the upper limit restriction.

14
2.5. Information on the Damages of the Railway Facilities and the Vehicles, etc.
2.5.1. Status of Major Damages in the Railway Facilities in around the Accident Site
[1] Structures such as viaducts, bridges, etc.
There was no abnormal situation in the structures in around the accident site when checked
in the investigation of the accident site implemented on April 15, 2016. However, the damaged
status checked by the Company on April 20 and 24, 2016, were shown in Table 9. There was no
severe damage in the structures as shown in Table 9.
Table 9. Damaged status in viaducts, bridges, etc. in around the accident site
Name of structures Damaged portion Kilometerage Damaged status
No.2 Tasaki BL T5, direct to KGTD* 99,204 m Cracks etc. on columns and stoppers.
No.2 Tasaki BL T6, direct to KGTD 99,266 m Cracks on columns and stoppers
Soundproof walls Right wall 99,325 m 43 mm moved toward KGTD.
Soundproof walls Left wall 99,325 m 53 mm moved toward KGTD.
Soundproof walls Right wall 99,444 m 18 mm moved toward Kumamoto station.
Soundproof walls Left wall 99,444 m 38 mm moved toward Kumamoto station.
* KGTD : Kumamoto General Train Depot.
[2] Slab track
The split damage etc. were found in the front wall and left and right walls in the hollows and
side surfaces of the frame shaped slab in the inspection of the accident site. These damages
existed in around 99,200 m to around 99,450 m, but remarkable damages existed from around
99,200 m to around 99,407 m. The damaged status of the frame shaped slab were shown in
Figure 5.
Here, there were no angular rotation nor joint stagger on the track.
Figure 5. Damaged status of frame shaped slab.
[3] Rail fastening devices
According to the Company, damaged status of the parts related to the rail fastening devices
in the section from 99,154 m to 99,462 m in the down track were shown in Table 10.
15
Table 10. Damaged status of the parts related to rail fastening devices in around the accident site
Tie plate Insulation plate Hexagonal bolts Leaf spring
Left rail Outside gauge
273/ 497 169/ 497 543/ 994 363/ 497
Inside gauge 347/ 994 425/ 497
Right rail Outside gauge
268/ 497 95/ 497 321/ 994 343/ 497
Inside gauge 347/ 994 384/ 497
Total 541/ 994 264/ 994 1558/3976 1515/1988
* Numbers in the table indicate "number of damaged devices" / "number of installed devices"
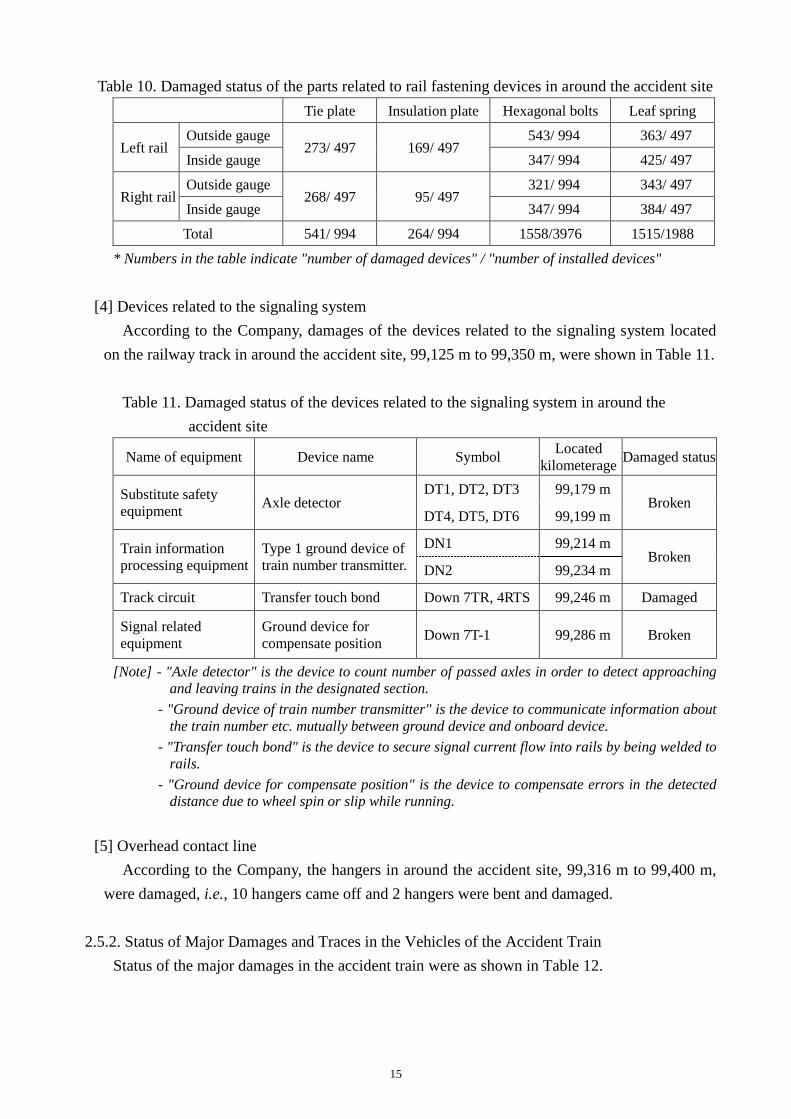
[4] Devices related to the signaling system
According to the Company, damages of the devices related to the signaling system located
on the railway track in around the accident site, 99,125 m to 99,350 m, were shown in Table 11.
Table 11. Damaged status of the devices related to the signaling system in around the
accident site
Name of equipment Device name Symbol Located
kilometerage Damaged status
Substitute safety
equipment Axle detector
DT1, DT2, DT3 99,179 m Broken
DT4, DT5, DT6 99,199 m
Train information
processing equipment
Type 1 ground device of
train number transmitter.
DN1 99,214 m Broken
DN2 99,234 m
Track circuit Transfer touch bond Down 7TR, 4RTS 99,246 m Damaged
Signal related
equipment
Ground device for
compensate position Down 7T-1 99,286 m Broken
[Note] - "Axle detector" is the device to count number of passed axles in order to detect approaching
and leaving trains in the designated section.
- "Ground device of train number transmitter" is the device to communicate information about
the train number etc. mutually between ground device and onboard device.
- "Transfer touch bond" is the device to secure signal current flow into rails by being welded to
rails.
- "Ground device for compensate position" is the device to compensate errors in the detected
distance due to wheel spin or slip while running.
[5] Overhead contact line
According to the Company, the hangers in around the accident site, 99,316 m to 99,400 m,
were damaged, i.e., 10 hangers came off and 2 hangers were bent and damaged.
2.5.2. Status of Major Damages and Traces in the Vehicles of the Accident Train
Status of the major damages in the accident train were as shown in Table 12.

16
Table 12. Status of damaged status of devices in each vehicle of the accident train
Vehicle Damaged devices Damaged status
1st
vehicle
Right cover plate of lower part of front head Fretting traces
Bodyshell in lower part of front head Broken
Guard iron Broken and dropped
Control rod of automatic leveling device #1 & #2 Snapped and broken
Gear device of 1st axle including oil level meter Broken and oil leakage
Lower part of traction motor #2 Fretting traces
Control valve lever of automatic leveling device #3 & #4 Wound and broken
2nd
vehicle
Anti-roll damper between vehicles Broken
Yaw damper between vehicles #3 Broken
Front cover plate for edge of vehicle body Wound and broken
Fitting metal for right cover plate Wound and broken
Right axle box of 1st axle Broken
Control rod of automatic leveling device #1 & #2 Snapped and broken
Lockout cock of control valve of automatic leveling device #2 Wound and broken
Gear device of 1st axle Broken
Lower part of traction motor #2 Fretting traces
Control valve lever of automatic leveling device #3 & #4 Wound and broken
Pantograph Deformed, right horn fallen away
3rd
vehicle
Front support metal for fitting bellows Wound and broken
Control valve lever of automatic leveling device #1 & #3 Wound and broken
Control rod of automatic leveling device #2 & #4 Snapped and broken
Gear device of 2nd axle Broken
Lower part of gear devices in 1st and 3rd axles Fretting trace
Lower part of traction motor #4 Fretting traces & cover fallen away
Yaw damper between vehicles #3 Broken
Water seal device Broken
Fitting metal of cover plate for sanitary tank Wound and broken
4th
vehicle
Cover plate for front edge of vehicle body Wound and broken
Control rod of automatic leveling device #1, #2 & #4 Snapped and broken
Lower part of gear device #1& #3 Fretting trace
Control valve lever of automatic leveling device #3 Wound and broken
Fitting bolts of cover plate for the edge of vehicle body Snapped and broken
Lower part of traction motor #4 Fretting traces
5th
vehicle
Yaw damper between vehicles #1, #3 & #4 Broken
Front support metal for fitting hollows Wound and broken
Fitting metal for side cover plate Wound and broken
Right axle box of 1st axle Broken
Control rod of automatic leveling device #1, #2, #3 & #4 Snapped and broken
Wiring cables for traction motor #1 Cables had broken
Gear device for 1st axle Broken
Left air suspension #2 Fallen away
Lower part of traction motor #2 Fretting traces
6th
vehicle
Front cover plate for edge of vehicle body Wound and broken
Slanted cover plate for front bogie Wound and broken
Left air suspension in front bogie Deformed
Control rod of automatic leveling device #2, #3 & #4 Snapped and broken
Left side cover plate Deformed
Gear device of 2nd axle Broken and oil leakage
Left axle spring of 2nd axle Fallen away
Left axle beam of 2nd axle Come off
Cover plate for edge of vehicle body Wound and broken
Cover plate for underfloor Broken
Cover plate for lower part of main convertor unit Broken
Bottom of receiving coil Deformed

17
Many damages were found in bogies, yaw damper between vehicles and underfloor
equipment such as automatic leveling device, lower part of gear box, lower part of traction motor,
cover plates, etc. Some air suspensions in the 5th and 6th vehicles were damaged. The fitting
bolts snapped and broken, axle beam came off and axle spring fell away, in left axle box
suspension device of the 2nd axle of the 6th vehicle. There was no beach mark etc. that is the
trace caused by metal fatigue, in the broken surface of the fitting bolts.
Figure 6. Damaged status of axle box suspension device, status at just after the accident
in left, holding metal and snapped and broken bolt in right
2.6. Information on the Major Measures against Large Scale Earthquake in the Company
2.6.1. Train Defense System for Earthquake [Refer to Attached figures 6 and 9]
The train defense system for earthquake was introduced to decrease velocity of running
Shinkansen train etc. earlier when large scale earthquake occurred. To achieve the purpose
described in the above, seismographs were located in 12 track side earthquake detecting points
along Kyushu Shinkansen Line and 6 seaside earthquake detecting points in seaside of Kyushu
area. The system has functions to operate emergency brake of the Shinkansen trains by breaking
electric power feeding to overhead contact lines when one of the earthquakes detecting points
estimated the arrival of large scale earthquake, based on the difference of arrival times between
P-wave and S-wave*15, that propagates in different velocities.
[1] Outline of operation of the system
Among the seismographs located in the trackside earthquake detecting points and the
seaside earthquake detecting points described in the above, the earthquake detecting point
where decided the traffic control due to estimate arrival of the large scale earthquake based on
detection of tremor of earthquake i.e., P-wave, transmit the trip power feeding signal to the
power conversion equipment in the facility.
The power conversion equipment, that received the above trip power feeding signal,
transmit the interlinked breaking signal to the substations feeding electric power in the feeding
area in charge in the vicinity of the above described earth detecting point, and the substations,
that received the interlinked breaking signal, operate the circuit breakers for power feeding to
stop power feeding to overhead contact lines. The ground side equipment, that detected power
failure of the overhead contact line, transmits the emergency stop signal "02E" to the track
circuit, i.e., the rail. Therefore, the trains existing in the track circuit, operate the emergency

18
brake by receiving the above signal "02E" or by detecting the stop signal "02" due to the
lowered trolley voltage in the onboard device.
[2] Operated status of the system
The seismograph located in the trackside earthquake detecting point in the premises of
Kumamoto Train Depot SS decided the traffic control against the concerned earthquake. When
the concerned earthquake occurred, Shin-Gyokuto SS was feeding electric power to the
overhead contact line where the accident train was running. Kumamoto Train Depot SS, as
received the trip power feeding signal, transmitted the interlinked breaking signal to
Shin-Gyokuto SS to turn off the circuit breaker 13 in Shin-Gyokuto SS finally, as shown in
Table 3 in 2.1.2.2. The emergency brake of the accident train was operated due to receive the
emergency stop signal "02E" in the receiver of the ATC device, as shown in Table 2 in 2.1.2.1.
*15 "S-wave" is the horizontal wave recorded in seismograph following P-wave.
2.6.2. Derailment and Deviation Preventing Devices
The Company has been promoted to equip guard angles on the track to prevent train
derailment accident caused by earthquakes, and to equip the deviation preventing stoppers to
vehicles to prevent running as being deviated widely from the track even if train was derailed,
from 2012. The guard angles prevent derailment by being in contact with back surface of wheels,
and the deviation preventing stopper prevent deviation by being in contact with the guard angle.
The attached status of the guard angles and the deviation preventing stopper and the status of
being in contact with each other are shown in Figure 7. Here, in Figure 7, the equipment
mounted on bogie frame and underfloor equipment of vehicle were omitted to simplify the
explanation.
The relation of positions of the deviation preventing stopper and the guard angles was as
follows. When the train derailed and displaced from rail in lateral direction to its maximum and
the deviation preventing stopper came into contact with guard angle, wheel set displaced in
lateral direction by 48 cm, as shown in Figure 7. However, wheel moved to the hollow of the
frame shaped slab when the wheel set displaced by about 42 cm.
The guard angles were not equipped in around the accident site when the accident occurred.
According to the Company, installation of the guard angles had been planed based on the
installation standard, i.e., the guard angles should be equipped in the viaducts and bridges in
around the active faults supposed as to shake severely when earthquake occurred, in the active
faults crossing with the Shinkansen track completely and listed in the literatures on the active
faults*16 as the certainty I*17. However, there was no plan to install the guard angles in around the
accident site because the accident site was not the place to fit the installation standard. Here, the
guard angles were installed in total 48 km track section when the accident occurred, within total
about 577.8 km between Hakata station and Kagoshima-Chuo station.
On the other hand, the deviation preventing stoppers were equipped in the 13 train sets in total
20 train sets of the Shinkansen trains of the Company when the accident occurred. But the
deviation preventing stoppers were not equipped to the accident train when the accident occurred,
even though there was a plan to equip them in July 2016.

19
Figure 7. Positional relationship in lateral direction of guard angle, deviation
preventing stopper and frame shaped slab
*16 "New edition, Active faults in Japan, distribution map and materials", edited by the study group on
active faults, The university of Tokyo Press., 1991, in Japanese.
*17 "Certainty I" in this text means that the fault is certainly the active fault.
2.7. Information on the Train Crews, etc.
The Driver was 30 years old male. He received the driver's license for Shinkansen electric
motor car issued on October 21, 2014, and the driver's license for class A electric motor car issued
on January 28, 2011. There was no problem in the health check and aptitude test for train
operation of the Driver.
2.8. Information on the Weather Conditions
According to the observed records in Kumamoto District Meteorological Observatory of JMA,
located in about 800 m NNE from the place where the accident train had been halted, it was

20
almost fine in around the accident site, between about 12 hours before the occurrence of the
accident to the time of the occurrence of the accident. The direction and speed of wind were 1.0
m/s NE, temperature was 18.7 ℃, humidity was 45 %, at 21:00, before the occurrence of the
accident.
2.9. Information on the Earthquake
2.9.1. Outline of the Concerned Earthquake, etc.
According to the materials published by the JMA, the concerned earthquake occurred at
21:26:34.4, April 14, 2016. The hypocenter was 32°44.5' N in latitude, 130°48.5' E in longitude,
11 km in depth, and magnitude was 6.5. The maximum seismic intensity 7 was observed in
Mashiki Town, Kumamoto district, Kumamoto Prefecture. The concerned earthquake occurred in
the crust, and the focal mechanism*18 was the strike-slip fault type earthquake having the tension
axis in NNW - SSE direction.
After that, the earthquakes as mighty as observed seismic intensity of above 6- occurred
intermittently. According to the material published by the JMA, the earthquake, hereinafter
referred to as "the main shock", occurred about 28 hours after the occurrence of the concerned
earthquake, at 01:25:05.4, April 16, 2016. Its hypocenter was 32°45.2' N in latitude, 130°45.7' E
in longitude, 12 km in depth, and the magnitude was 7.3. The maximum seismic intensity 7 was
observed in Mashiki Town and Nishihara Village in Kumamoto District, Kumamoto Prefecture.
The main shock also occurred in the crust, and the focal mechanism was the strike-slip fault type
earthquake having the tension axis in N-S direction. Another train derailment accident*19 had
occurred in Hohi Line of the Company by the main shock.
According to the database materials on the seismic intensity published by the JMA, among all
aftershocks of the 2016 Kumamoto Earthquakes, over 4,000 aftershocks whose hypocenters were
in Kumamoto district of Kumamoto Prefecture, occurred from the occurrence of the concerned
earthquake to the end of March 2017.
During one month before the occurrence of the concerned earthquake, earthquakes with
maximum seismic intensity of above 1 were observed five times, and that of above 2 was
observed only once, which was observed in Kumamoto district, Kumamoto Prefecture, at 14:22,
April 3, 2016.
*18 "Focal mechanism" is to describe the status of faults generating earthquake in the ground, and any
forces had acted to the faults.
*19 "Railway accident investigation report RA2016-8-III, Train derailment in Akamizu station, Hohi Line,
Kyushu Railway Company", published on November 24, 2016, Japan Transport Safety Board, in
Japanese.
2.9.2. Positional Relationship between the Accident Site and the Epicenter of the Concerned
Earthquake
Figure 8 showed the estimated seismic intensity distribution chart published by the JMA
added by the route of Kyushu Shinkansen. According to this figure, the area of the estimated
seismic intensity above 6+ was in the restricted areas, and the accident site was in around the

21
border between seismic intensities 6- and 6+. The accident site was in about 12 km distant in
WNW from the epicenter*20.
Here, the Hinagu fault belt was existed in around the hypocenter, and edge of the Futagawa to
Hinagu fault series faults, shown in the literature on active faults, was existed in about 10-odd
km from the accident site, although it was not reached to just beneath the viaduct of Kyushu
Shinkansen.
*20 "Epicenter" is the point on the ground surface just above the hypocenter of earthquake.
Estimated seismic intensity distribution chart
The seismic intensities observed at an
earthquake sometimes differs about one rank
due to the difference of the ground conditions
even when observed in very close places. In
addition, the estimated seismic intensity
sometimes differs from the actual seismic
intensity about one rank due to errors in the
estimating process.
Therefore, this chart should be used to focus
the characteristics of spreading in plane and
their shapes of large seismic intensity, but the
values of intensity or position of each mesh.
Japan Meteorological Agency
* Red line indicates the section where the
accident train was running.
* Cross mark "×" indicates the epicenter of the
concerned earthquake.
* This chart was made based on the estimated
seismic intensity distribution chart published
by JMA on April 14, 2016.
Figure 8. Estimated seismic intensity distribution chart for the concerned earthquake
and route map of Kyushu Shinkansen
2.9.3. Records of the Seismograph Located on the Earthquake Observing Point in around the
Accident Site [Refer to Attached figure 10]
The observed records in few earthquake observing points in around the accident site were
collected in the investigation of the accident. Among them, the earthquake observing point
nearest to the accident site was the JMA earthquake observing point in Kasuga, Nishi-Ku,
Kumamoto City, hereinafter referred to as the "JMA Kumamoto Nishi-Ku Kasuga", located in
about 12 km WNW from the epicenter, as shown in Figure 9. Here, the accident site was about
550 m in SSW from the JMA Kumamoto Nishi-ku Kasuga.
According to the observed records in the JMA Kumamoto Nishi-ku Kasuga published by the
JMA, the maximum accelerations of the concerned earthquake of about 659 Gal*21 in N-S
direction, about 433 Gal in E-W direction, about 262 Gal in vertical direction and 737 Gal as the
acceleration synthesized three components, were recorded at about 21:26:41, April 14, 2016.
*21 "Gal" is the unit of acceleration mainly used for earthquake. 1 Gal equals to 1 cm/s2.

22
Figure 9. Positions of the epicenter, the accident site and JMA Kumamoto Nishi-Ku Kasuga
2.10. Information on the Simulation of the Derailment
2.10.1. Observation of the Concerned Earthquake, Main Shock and Aftershocks
[Refer to Attached figure 11]
The Company implemented the microtremor*22 observations and earthquake observation
temporarily, hereinafter referred to as "the aftershocks observation", due to the necessity of
estimating seismic ground motion in around the accident site when the accident occurred, in the
implementation of the simulation of the derailment. The observations were implemented to
install the simple seismographs in around the accident site, i.e., R0G to R5G on the ground
surface, R1S, R4S, R6S on No.2 Tasaki BL, as shown in Attached Figure 11. The records of the
JMA Kumamoto Nishi-Ku Kasuga, close to the accident site, were used as the observed records
of the concerned earthquake. The records of earthquakes used in the selection of the method to
estimate the seismic ground motion on the ground surface in around the accident site, based on
the transfer function in relation to the seismic ground motion in JMA Kumamoto Nishi-Ku
Kasuga, as described in the following paragraph 3.3, were shown in Table 13.
Table 13. List of records of earthquakes used to select estimating method of transfer function
of the seismic ground motion
Date & time
of earthquakes North
latitude
East
longitude
Depth
[km]
Magnitude
[Mj]
Existence of records
Remarks
Date Time Derailed
point JMA#1
Kumamoto
station#2
April 14 21:26:34 32°44.5' 130°48.5' 11 6.5 - Y Y The concerned
earthquake
April 16
01:25:05 32°45.2' 130°45.7 12 7.3 Y Y Y Main shock
01:44:07 32°45.1' 130°45.6' 15 5.4 Y - Y Aftershock 1
01:45:55 32°51.7' 130°53.9' 11 5.9 Y Y Y Aftershock 2
09:48:33 32°50.8' 130°50.1' 16 5.4 Y Y - Aftershock 3

23
#1 JMA Kumamoto Nishi-Ku Kasuga
#2 Kumamoto station of the conventional line of the Company.
*22 "Microtremor" is the microscopic ground motion while earthquakes were not occurred. It is possible
to obtain information about the first order peak of the amplifying characteristics at the site by
observing the microtremor using high sensitive seismographs.
2.10.2. Simulation of the Derailment
Hereinafter the earthquake observing point used to estimate seismic ground motion was
referred to as "the reference point", and the accident site was referred to as "the estimating
point" in 2.10.2 and 3.3. In the simulation of the derailment, the seismic ground motion on
ground surface at the estimated point estimated by using the records of the aftershocks
observation and the data of the soil inspection at beneath the structures in the reference point and
the estimating point, were used as the input seismic ground motion to the structure model. In the
next step, the seismic motion in the track surface on the top surface of the structure was
estimated based on the dynamic nonlinear response analysis using three-dimensional frame
model of the structures. The dynamic behaviors of the vehicle running on the structures were
analyzed to input the estimated seismic ground motion to the track surface just beneath the
vehicle. The precise procedures were described in 2.10.2.1 to 2.10.2.3.
2.10.2.1. Estimation of the Seismic Ground Motion on Ground Surface in around the Accident Site
The JMA Kumamoto Nishi-Ku Kasuga and "the earthquake observing point of the Company
in Kumamoto station of conventional railway line", hereinafter referred to as "Kumamoto
station in conventional line of the Company", were studied as the possible reference points. The
reference point should satisfy some conditions such as, close to the estimating point, the data of
soil investigation were existed, observed data for the main shock and the aftershocks were
existed, no singular characteristic of seismic ground motion such as soil liquefaction etc. in the
observed data, etc. As for the concerned earthquake, JMA Kumamoto Nishi-Ku Kasuga was
located about 550 m distant from the estimating point, i.e. the closest point, and the data of soil
investigation in the neighborhood were existed, as described in 2.9.3.
On the other hand, the Kumamoto station in conventional line of the Company was located
about 700 m distant from the estimating point, farther than JMA Kumamoto Nishi-Ku Kssuga,
and the soil investigation data in the neighborhood was not exist. Therefore, JMA Kumamoto
Nishi-Ku Kasuga was selected as the reference point.
The components of seismic ground motion in N-S and E-W directions observed in the
reference point were coordinates transformed to the components in directions of the track and
the direction orthogonal to the track at the estimating point.
To estimate the seismic ground motion of ground surface just beneath the structure in the
estimating point from the seismic ground motion of ground surface in the reference point,
calculating method was selected from method A and B indicated in Table 14. As the results of
precise studies described in 3.3, the method A was selected, and the seismic ground motion of

24
the ground surface at around the accident site was estimated as shown in Figure 10. The
estimated seismic ground motion of the ground surface had the maximum acceleration of 398
Gal, and many oscillatory frequency components in around 0.8 Hz and around 1.3 Hz.
Here, the method B, that was the common method, was used to calculate transfer function of
the seismic ground motion in the investigations of the past two Shinkansen train derailment
accidents*23, *24 caused by large scale earthquakes, i.e., the Niigata Prefecture Chuetsu
earthquake and the Pacific Coast of Tohoku earthquake. In case of the concerned earthquake,
many observed data were obtained for the aftershocks etc. including as large as the seismic
intensity of above 5, which were the same level of the concerned earthquake as suitable for the
calculation of the transfer function of the ground surface, in the earthquake observing point in
around the accident site close to the hypocenter. Therefore, the method A, which was expected
to obtain the estimated results with smaller error compared to the method B, was selected to
calculate the transfer function of the seismic ground motion of the concerned earthquake, as
described in 3.3.
*23 "Railway accident investigation report RA2007-8-I, Train derailment between Urasa station and
Nagaoka station, Joetsu Shinkansen, East Japan Railway Company", published on October 26, 2007,
Aircraft and Railway Accident Investigation Commission, former Japan Transport Safety Board.
*24 "Railway accident investigation report RA2013-1-I, Train derailment in the premises of Sendai
station, Tohoku Shinkansen, East Japan Railway Company", published on February 22, 2013, Japan
Transport Safety Board.
Table 14. Studied methods to estimate transfer function of the seismic ground motion
Method Contents
A
The method to calculate waveform of the seismic ground motion at the analyzing point as
the reference waveform at the reference point multiplied by the calculated transfer function
between the reference point and the analyzing point.
B
The method to calculate waveform of the seismic ground motion at the analyzing point
based on the dynamic analysis using the ground model at the analyzing point, by input the
reference wave transformed to the bedrock multiplied by the transfer function between the
reference point and the analyzing point calculated from waveforms in the both points
transformed to the bedrock.
Figure 10. Estimated waveform of seismic ground motion of ground surface in
orthogonal direction to track at the estimating point

25
2.10.2.2. Dynamic Response Analysis of the Structures Group
The dynamic response analysis of the structures group in the estimating point was
implemented in the following procedures.
[1] Modeling of surface layer ground [Refer to Attached Figure 12]
As described in 2.10.1, the Company has been implemented the aftershocks observation in
around the start point of the derailed trace, then the ground condition at the start point of the
derailed trace was determined based on the following policies, using the observed records
provided from the Company. The determined results were shown in Attached Figure 12.
As for the ground condition at the start point of the derailed trace, the N-value*25 and the
soil category at the point where the boring investigation had been implemented, were
determined based on the results of a variety of ground investigations. The boundary of the
stratums between the points where the boring investigations were implemented was expressed
using linear interpolation. The spatial variations of the N-values were also determined by
linear interpolation between the data obtained by the boring investigations. The information
on the velocity of the shear elastic wave, the weight of the unit volume, etc. were determined
based on N-values according to the literature*26.
*25 "N-value" is the index to indicate relative value for rigidity, softness or firmness of soil. It is the
number of beating required to penetrate the sampler for the standard penetration test until the
prearranged value into the ground, by falling the predetermined weight hammer freely, in the
standard penetration test. In the seismic design of railway, it can be established as the ground
surface for seismic design when N-value is 50 or above for sand soil, or 30 or above for continuous
clay soil.
*26 RTRI, supervised by the Railway Rureau of the MLIT, "Design standards and comments of railway
structures etc., Seismic design", Maruzen, 2012, in Japanese.
[2] Modeling of structures group
The structures group model was built up by connecting individual models of structures for
the rigid frame viaducts, girders, supports, etc., existed in the area to be analyzed, referring
the design sheets, a variety of design standards and drawings provided from the Company and
the JRTT. The precise information was as follows.
[a] Structures to be analyzed [Refer to Attached figure 13]
The analyzed area was determined as the structures group including girders and supports
from P2 of the No.2 Tasaki over road bridge, hereinafter referred to as "No.2 Tasaki Bv", in
the direction of start point of the accident train, centered at the beginning edge of R4 of the
No.2 Tasaki BL where the derailed trace were started, to P2 of the Tsuboigawa B, in the
direction of destination of the accident train, and modeled by the three-dimensional frame
model.
[b] Model of the structures group [Refer to Attached figure 13]
Modeling of the structures group was implemented based on the followings.
a. Fundamental policy
Modeling should be implemented referring the design sheets of individual structures,
the "Design standards and comments of railway structures etc., Seismic design", "Design

26
standards and comments of railway structures etc., Concrete structures", "Design standards
and comments of railway structures etc., Foundation structures", drawings, etc. The
reinforced concrete material was treated as the M-φ model*27 and divided into elements, the
nonlinear characteristics was treated as the tri-linear type*28.
*27 "M-φ model" is the method to definite restoring force model of materials, expressed by the
relationship between the bending moment M and the curvature φ generated in the cross-section
of material.
*28 "Tri-linear type" is one of the models expressing framework of material, and express
non-linearity of material by three straight lines having two turning points of rigidity.
b. Modeling of columns and girders, i.e., rigid frame viaduct and wall type piers
The safety factor was set as 1.0 and the material correction factor was set as 1.2,
considered as the same level as the practical strength of iron reinforcing rods, for both the
rigid frame viaducts and the wall type piers, as the common items.
The rigidity of the columns in the rigid frame viaducts was set as the equivalent rigidity
corresponding with the yield point by assuming that there were some slight damages such
as cracks before occurrence of earthquake and modeled as the T-shaped cross section
composed of the slab and the upper layer beam.
The specifications of the pier P1 in Tsuboigawa B were applied to describe the
nonlinear characteristics of the structure of the pier P2 in Tsuboigawa B, which was the
wall type pier.
c. Modeling of basement and peripheral ground for rigid frame viaducts and wall type piers
The springs were set for the horizontal resistance, circumferential resistance and tip
resistance of piles, and effects of the characteristics value β of piles and variation of the
axial force of piles were considered commonly in modeling of the rigid frame viaducts and
the wall type piers. The upper limit value of the ground resistance αf was set as 2.0.
The rigidity of the springs for the front surface resistances of the footing*29 of the rigid
frame viaducts and the underground beams were set as multiplied by 0.5 considering the
effects by the front/rear and left/right surfaces. The compensating coefficients of the pile
group indicated in Table 15 were used for the initial rigidities of the front surface resistance
spring of the piles in the wall type piers.
*29 "Footing" is the plate type structure to receive columns, pedestals, walls, etc. of the structures,
and transmit load weight to the basement or the ground.
Table 15. Compensating coefficients for pile group in wall type girders
Orthogonal direction to track Direction to track
No.2 Tasaki Bv, Pier P2 0.49 0.56
Tsuboigawa B, Pier P1 0.41 0.41
Tsuboigawa B, Pier P2 0.41 0.41
[c] Modeling of supports and girders [Refer to Attached figure 14]
The nonlinear characteristics of the steel rod stopper were determined referring the
27
drawings and considered as the results in the literatures*30, *31 could be applied. The shear
rigidity of the rubber pad and the friction between rubber pad and concrete were considered
for the rubber supports. All girders were treated as the rigid beams.
*30 Harada et al., "Behavior analysis of structure group in earthquake considering effects by the
support structures", pp.201-204, 14th combined symposium on railway technologies, 2007, in
Japanese.
*31 Harada, et al., "Behaviors of continuous railway viaducts group in earthquake", pp.1-6, No.2,
Vol.31, Proceedings of the concrete engineering, 2009, in Japanese.
[d] Modeling of damping characteristics
The damping characteristics was determined based on the Rayleigh damping*32, as the
first order mode damping factor*33 in the orthogonal direction to the track became to the
same level as 2.2 %, to cause the variation due to vibrating frequency as small in the range
between about 1 Hz and 10 Hz.
*32 "Rayleigh damping" is the damping considered damping characteristics related with mass and
rigidity in the vibration analysis of structures, etc.
*33 "Damping factor" is an index expressed damping effect by consuming vibration energy as heat,
etc. in the inside of the structure or scattering vibration energy out of the structure system.
[3] Verification of validity of the model using records of the aftershocks observation
[a] Ground model
The validity of the property values of the ground and the ground model, determined in
2.10.2.2[1], was checked by the H/V spectrum ratio*34. As the result, validity of the
determined ground model was confirmed as the peak frequency of the H/V spectrum ratio
almost corresponded with the peak frequency of the theoretical transfer function, as shown
in Figure 22 in 3.2.4.
*34 "H/V spectrum ratio" is the ratio of Fourier spectrum of vibrations in horizontal and vertical
directions.
[b] Structure group model
The first mode and natural frequency of the vibration in the orthogonal direction to the
track of the structure group, were obtained by the natural frequency analysis. The estimated
natural frequency was 1.34 Hz.
The comparison of the spectrum ratio obtained from the frequency response analysis and
the spectrum ratio obtained from the records of the aftershocks observation, for the vibration
at top of the R4 viaduct of the No.2 Tasaki BL against the ground surface, were shown in
Figure 11.
As the result of comparison, validity of the supposed structures group model was
confirmed as the analyzed results and the observed results were almost agreed with each
other, for the peak values and the frequencies of the spectrum ratio corresponding the first
mode vibration in orthogonal direction to the track.

28
Figure 11. Comparison of records of the aftershock observation and
analyzed results of frequency response
[4] Response analysis of the structures group by nonlinear dynamic analysis
The nonlinear dynamic analysis was implemented to input the estimated waveform of the
seismic ground motion on the ground surface, shown in Figure 10 in 2.10.2.1, to the structures
group model in the direction orthogonal to the track.
The waveforms of the analyzed results were calculated for the seven calculating points
shown in Figure 12. A sample of the response waveform in each calculated point was shown
in Figure 13. The results of the response analysis, i.e., the maximum acceleration and the
maximum response velocity of the response, were listed in Table 16. The maximum
accelerations were above 1.8 times of the acceleration at the ground surface in all calculating
points except for the point Pt.2 in Table 16, i.e., edge of R2 in terminal direction of No.2
Tasaki BL and the maximum velocities were larger than 100 kine*35 in all calculating points
except for Pt.2 in No.2 Tasaki BL and Pt.7 in Tsuboigawa B, as shown in Table 16.
*35 "Kine" is the unit of velocity mainly used in the area of earthquake. 1 kine equals 1 cm/s.

29
Figure 12. Analyzed area and calculating points of seismic ground motion
Figure 13. Sample of response waveforms of the structures group, at end edge
direct to terminal in R4, in the direction orthogonal to track.
Table 16. Results of response analysis in the calculating points
Calculating point Maximum absolute
acceleration
Maximum absolute
velocity
Pt.1 No.2 Tasaki BL : R1, end edge direct to terminal 861 Gal 110 kine
Pt.2 No.2 Tasaki BL : R2, end edge direct to terminal 542 Gal 87 kine
Pt.3 No.2 Tasaki BL : R3, end edge direct to terminal 972 Gal 115 kine
Pt.4 No.2 Tasaki BL : R4, end edge direct to terminal 730 Gal 103 kine
Pt.5 No.2 Tasaki BL : R5, end edge direct to terminal 757 Gal 114 kine
Pt.6 No.2 Tasaki BL : R6, end edge direct to terminal 794 Gal 108 kine
Pt.7 Tsuboigawa B : P1, on the pier adjusting girder 940 Gal 83 kine

30
2.10.2.3. Behavior Analysis of the Vehicles
The behavior analysis of the vehicles in the 800 series Shinkansen electric railcar, composed
of six vehicles, against the response at the top surface of the structure in the concerned
earthquake described in 2.10.2.2[4], was implemented using the vehicle dynamics simulator,
VDS*36.
* 36 "VDS" is abbreviation of "Vehicle Dynamics Simulator", which was the simulator to recreate
vehicle running in the computer. It is used for the behavior analysis of vehicles on the track vibrating
significantly due to earthquake. Reference : "Report of the RTRI", Vol.28, No.12,2014, in Japanese.
[1] Vehicle model
Vehicle was modeled as shown in Figure 14. Summary of the model were as follows.
a. Single vehicle body, two bogie frames and four wheelsets were modeled as 6 degrees of
freedom, DOFs, each, rails under eight wheels were modeled as 2 DOFs each, then each
vehicle was simulated by the total 58 DOFs model.
b. Although the vehicles to be simulated were six 800 series Shinkansen electric railcars, each
vehicle was modeled as a single vehicle model, respectively, as the interaction between
vehicles was considered as negligible.
c. The secondary spring, axle spring, lateral displacement stopper, axle box vertical motion
stopper, height stopper of air spring, lateral damper and yaw damper were laid out as the
connecting elements, composed of spring and damper element, between vehicle body and
bogie frame, and between bogie frame and wheelsets, in a single vehicle model. The results
of the test to identify the characteristics of secondary spring, independently implemented by
the RTRI, were applied to the characteristics of the secondary spring in a single vehicle
model.
d. The deviation of the gravity center of the vehicle from the center of the vehicle body, was
considered.
e. The force acting between wheel and rail was modeled based on the Kalker theory*37. The
coordinate system was set as x-axis in the direction of train running, y-axis in lateral
direction, z-axis in vertical direction, and left and upward directions were set as positive.
Figure 14. Single vehicle model used in the simulation

31
* 37 "Kalker theory" is the theory to decide tangential force between rail and wheel in rolling contact
situation, and the calculating algorithms based on this theory was used in the vehicle dynamics
analysis.
[2] Track model and vibration input model
The track was modeled as that the rails just beneath the wheels were suspended elastically
in both lateral and vertical directions against the frame shaped slab. The seismic ground
motion was treated as displacement of the slab surface beneath the rails suspending wheels,
i.e., the two translational displacements in lateral and vertical directions and the rolling angle
variation, i.e., rolling angle variation around x-axis, caused by the rocking motion of the
structures, were input to rails. The rolling angle variations of the track surface were simulated
as to displace left and right rails vertically in inverse phase corresponding the rolling angle φ,
and to tilt each rail itself by rolling angle φ.
The coordinate system for the input seismic ground motion was set as that left and upward
directions were set as positive in lateral, vertical directions, respectively. The positive rolling
motion was defined when the left rail was raised up.
[3] Condition of vehicles
The conditions about vehicles were determined according to the specification, drawings
and the measured weight of the 800 series Shinkansen electric railcars provided from the
Company. The running velocity when derailed was determined as 78 km/h, referred to the
records in the operating status recording device.
[4] Track condition and running position of the vehicle
The track condition was determined based on the track layout in around the accident site.
As for the track condition, no track irregularity was considered in the simulation because the
track irregularities in around the accident site were small, as described in 2.4.1.3[2]. As for the
positions of running vehicles, the position of each vehicle was estimated based on the
supposition that the 1st axle of the 1st vehicle of the accident train had passed 99,089 m, at
21:26:34, April 14, 2016.
[5] Judgment for derailment
Figure 15. Track model and input
method of seismic ground
motion
Figure 16. Input method of rolling vibration of
the track surface
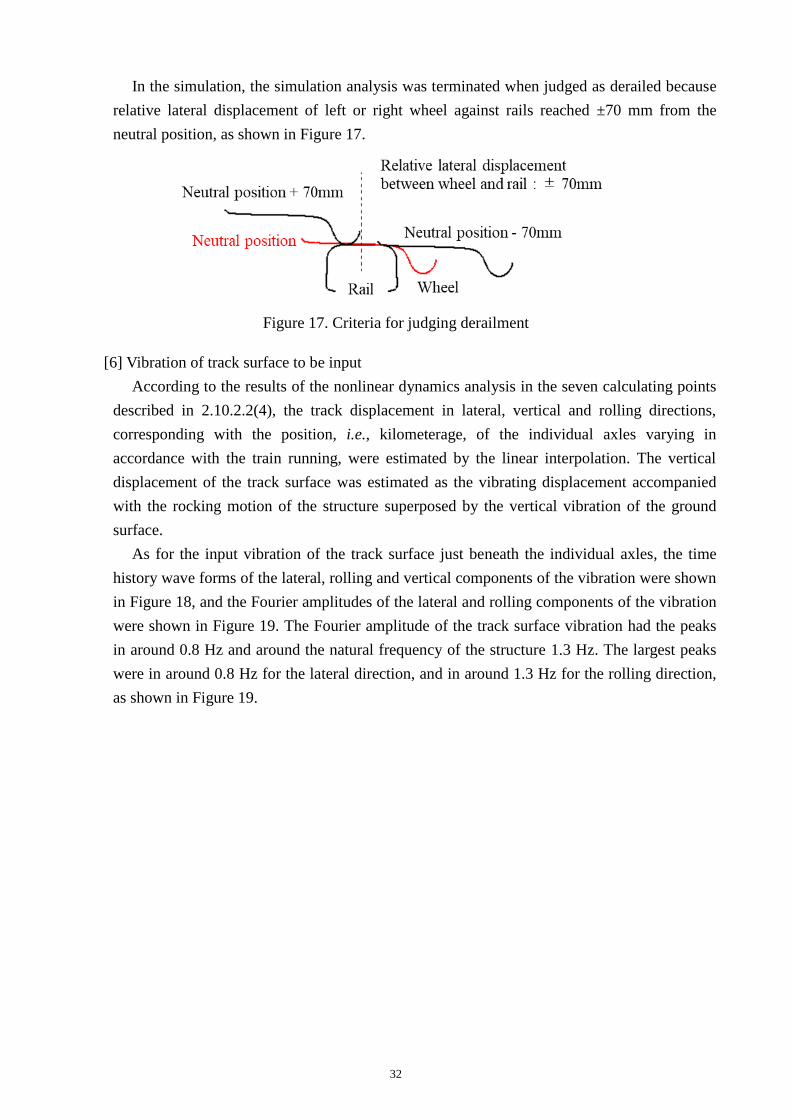
32
In the simulation, the simulation analysis was terminated when judged as derailed because
relative lateral displacement of left or right wheel against rails reached ±70 mm from the
neutral position, as shown in Figure 17.
Figure 17. Criteria for judging derailment
[6] Vibration of track surface to be input
According to the results of the nonlinear dynamics analysis in the seven calculating points
described in 2.10.2.2(4), the track displacement in lateral, vertical and rolling directions,
corresponding with the position, i.e., kilometerage, of the individual axles varying in
accordance with the train running, were estimated by the linear interpolation. The vertical
displacement of the track surface was estimated as the vibrating displacement accompanied
with the rocking motion of the structure superposed by the vertical vibration of the ground
surface.
As for the input vibration of the track surface just beneath the individual axles, the time
history wave forms of the lateral, rolling and vertical components of the vibration were shown
in Figure 18, and the Fourier amplitudes of the lateral and rolling components of the vibration
were shown in Figure 19. The Fourier amplitude of the track surface vibration had the peaks
in around 0.8 Hz and around the natural frequency of the structure 1.3 Hz. The largest peaks
were in around 0.8 Hz for the lateral direction, and in around 1.3 Hz for the rolling direction,
as shown in Figure 19.
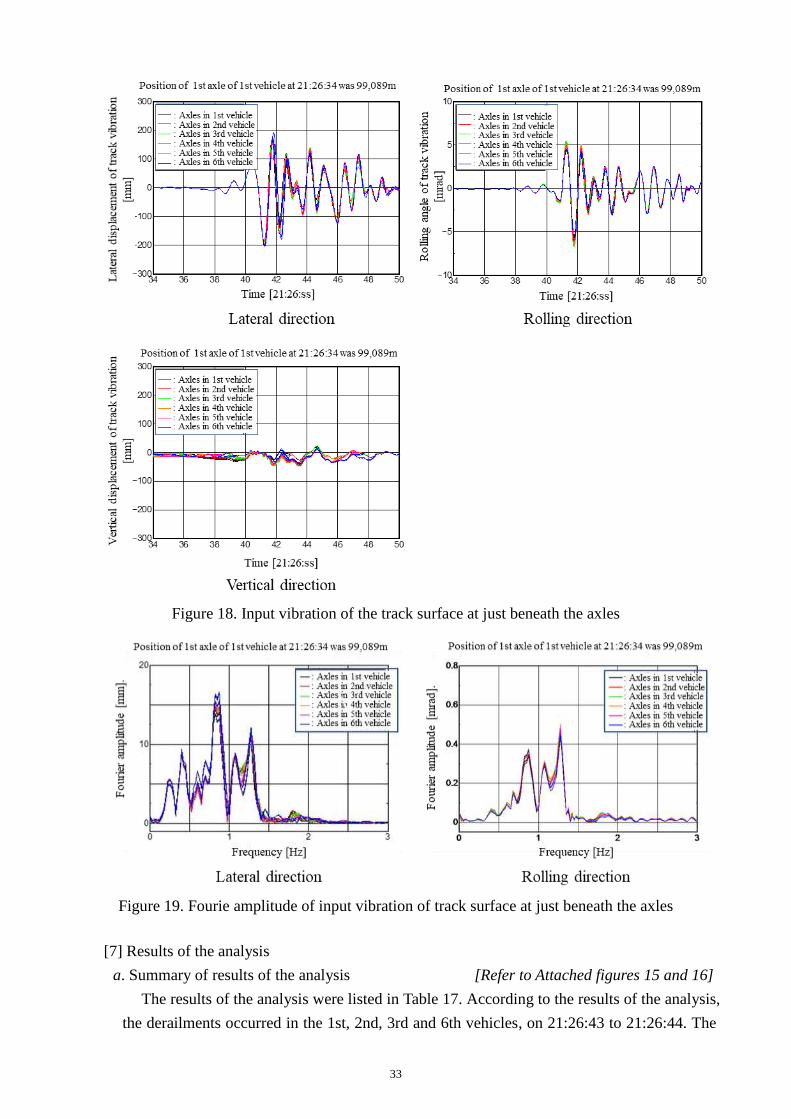
33
Figure 18. Input vibration of the track surface at just beneath the axles
Figure 19. Fourie amplitude of input vibration of track surface at just beneath the axles
[7] Results of the analysis
a. Summary of results of the analysis [Refer to Attached figures 15 and 16]
The results of the analysis were listed in Table 17. According to the results of the analysis,
the derailments occurred in the 1st, 2nd, 3rd and 6th vehicles, on 21:26:43 to 21:26:44. The

34
four axles derailed, but the wheels in another four axles raised up to top of rails. The
derailed directions of wheels dispersed in left and right, the vehicles in the mid part of the
train derailed to left, and the front and the rear vehicles derailed to right. The maximum
raised height of wheels in all vehicles exceeded the flange height 30 mm.
The results of the behavior analysis for the 1st and the 3rd vehicles were shown in
Attached Figures 15 and 16, respectively. According to these figures, the derailments
occurred within one to two vibration periods after the large lateral vibration arrived at the
accident site.
Table 17. Results of the behavior analysis of vehicles.
Vehicle Derailed or
not Derailed time Derailed axle#
Derailed
direction
Max. relative
displacement of
rail and wheel
Max. raised
up of wheel
Max. lateral
force
1st vehicle Derailed 21:26:43.29 4th axle
[2nd axle] Right -70 mm 38.4 mm 156 kN
2nd vehicle Derailed 21:26:43.76 1st axle
[2nd axle] Left 70 mm 47.1 mm 146 kN
3rd vehicle Derailed 21:26:43.79 1st axle
[2nd axle] Left 70 mm 54.8 mm 145 kN
4th vehicle Not derailed - - - 16.2 mm 41.2 mm 148 kN
5th vehicle Not derailed - - - -16.1 mm 33.2 mm 146 kN
6th vehicle Derailed 21:26:43.34 2nd axle
[1st axle] Right -70 mm 67.8 mm 169 kN
# Axles in brackets indicated the axles whose wheel flanges stayed on rail when derailed.
b. Transition of vehicle posture [Refer to Attached figures 17 and 18]
As a sample of the derailment to right side of the running direction of the train, the
posture of the 1st vehicle from about 0.5 second before the derailment to the occurrence of
the derailment was shown in Attached Figure 17. As a sample of the derailment to left side
of the running direction of the train, the posture of the 3rd vehicle from about 0.5 second
before the derailment to the occurrence of the derailment was shown in Attached Figure 18. ,
In these two figures, the transition of postures of vehicles were indicated, in turns, the fine
broken line, the fine solid line and the bold solid line, as the time passed.
c. Position of the accident train when derailed
The analyzed results on position of the accident train and the positions of vehicles and the
derailed axles when derailed were shown in Figure 20. The analyzed results showed that the
rear bogie of the 6th vehicle was running in around the start point of the derailed trace,
around 99,157 m, when the derailment to left occurred at 21:26:43.76 to 21:26:43.79.

35
Figure 20. Position of vehicles and derailed axles when derailed
2.10.2.4. Analysis of Vehicle Behavior if the Guard Angles were Equipped
[Refer to Attached figurer 19 and 20]
The vehicle behavior was analyzed for the case if the guard angles were equipped in around
the accident site, as shown in Figure 21. The analyzed results showed that the maximum values
of the relative lateral displacement between wheel and rail in the 1st, 2nd, 3rd and 6th vehicles,
which had derailed in the section where the guard angle were not equipped, exceeded 50 mm
and did not derail because the wheels came into contact with the guard angle, as shown in Table
18. The maximum values of the height of the raised wheels exceeded the flange height 30 mm
in all vehicles.
Figure 21. Guard angle model

36
Table 18. Results of vehicle behavior analysis when guard angles were installed
Vehicle Derailed
or not
Contact with guard
angle or not
Max. relative lateral displace-
ment between rail & wheel
Max. height of
raised wheel
Max. lateral
force
1st vehicle Not
derailed Contact -69.3 mm 58.2 mm 156 kN
2nd vehicle Not
derailed Contact 50.6 mm 47.1 mm 146 kN
3rd vehicle Not
derailed Contact 50.6 mm 54.8 mm 145 kN
4th vehicle Not
derailed Not contact 16.2 mm 41.2 mm 148 kN
5th vehicle Not
derailed Not contact -16,1 mm 33.2 mm 146 kN
6th vehicle Not
derailed Contact -50.2 mm 67.8 mm 179 kN
2.11. Information on the Other Shinkansen Trains Running in around the Accident Site
According to the Company, Shinkansen trains running in around the accident site at the
occurrence of the concerned earthquake, were listed in Table 19. All trains except for the accident
train stopped by the emergency brake triggered by the train defense device for earthquake and did
not derail. Here, the R1 and the U008 trainsets were running in the section where the guard angles
were equipped, but there was no trace on the guard rail caused by being in contact with wheels.
Table 19. Stopped position of Shinkansen trains running in around the accident site
Inbound or
outbound Train No. Train set*
Position of front
head of train
Initial velocity at
emergency brake Remarks
Inbound 5350A R1 76,751 m 117 km/h Foregoing train of the 5352A train.
Outbound 5349A U008 77,293 m 99 km/h Following train of the accident train.
Outbound 5347A U005 99.461 m 79 km/h The accident train.
Outbound 609A R3 196.100 m 203 km/h Foregoing train of the accident train.
Inbound 5352A R9 172,711 m 0 km/h Following train of the 5350A train.
* Train set U was composed of 6 vehicles, and train set R was composed of 8 vehicles.
2.12. The Other Information
2.12.1. Status of the Restoring Works after the Accident
The restoring works of the derailment started from April 18, 2016 and completed to restore
wheelsets on rails by April 23, 2016. After the concerned earthquake, Kyushu Shinkansen
restarted operation between Shin-Minamata station and Kagoshima-Chuo station on April 20,
between Hakata station and Kumamoto station on April 23, and between Kumamoto station and
Shin-Minamata station on April 27, as the operation control for slow speed was introduced.
2.12.2. The Past Derailment Accidents of Shinkansen Train by Large Scale Earthquakes
Comparative information on the past two large scale earthquakes, that caused derailment
accidents of Shinkansen train, and the concerned earthquake were shown in Table 20.
Comparative information on the Shinkansen train derailment accidents caused by the past two

37
large scale earthquakes and the concerned accident were shown in Table 21.
The concerned earthquake was considered as the inland type earthquake, same as the Niigata
Prefecture Chuetsu Earthquake, the depth of the hypocenter and distance from the epicenter of
about 10 km were also the same level. On the other hand, the Pacific Coast of Tohoku
Earthquake was the trench type earthquake, the depth of the hypocenter was 20-odd km, distance
from the eepicenter was about 170 km.
The velocities of trains when earthquakes occurred were about 70 to 80 km/h in the concerned
earthquake and the Pacific Coast of Tohoku Earthquake, and 204 km/h in the Niigata Prefecture
Chuetsu Earthquake. Numbers of the derailed axles were, 22 axles in total 24 axles in the
concerned earthquake, 2 axles in total 40 axles in the Pacific Coast of Tohoku Earthquake and 22
axles in total 40 axles in the Niigata Prefecture Chuetsu Earthquake.
Table 20. Comparative information on the past large scale earthquakes and the concerned earthquake
Niigata Prefecture Chuetsu Earthquake
Pacific Coast of
Tohoku Earthquake
2016
Kumamoto Earthquake
Date and time of
occurrence
About 17:56,
October 23, 2004
About 14:46,
March 11, 2011
About 21:26,
April 14, 2016
Depth of
hypocenter About 13 km About 24 km About 11 km
Magnitude of
earthquake M 6.8 Mw 9.0 M 6.5
Maximum
seismic intensity 7 7 7
Classification of
earthquake Inland type earthquake Trench type earthquake Inland type earthquake
Major damages
in train
- Train derailed between
Urasa station and
Nagaoka station of Joetsu
Shinkansen.
- Train derailed in the
premises of Sendai station
of Tohoku Shinkansen
- Freight trains derailed in
Joban Line & Tohoku Line.
- Train derailed between
Kumamoto station and
Kumamoto General
Train Depot, Kyushu
Shinkansen.
Table 21. Comparative information on the past Shinkansen train derailment accident and the
concerned accident
Niigata Prefecture
Chuetsu Earthquake
Pacific Coast of
Tohoku Earthquake
2016
Kumamoto Earthquake
Type of vehicle,
train set
200 Series,
10 vehicle train set
E2 Series,
10 vehicle train set
800 Series,
6 vehicle train set
Estimated velocity
at earthquake About 204 km/h About 72 km/h About 79 km/h
Estimated velocity
at derailment About 200 km/h About 14 km/h About 78 km/h
Distance from the
epicenter About 9.6 km About 172 km About 12 km
Type of structures Reinforced concrete, rigid frame
viaduct, etc.
Steel composite
simple girder viaduct.
Reinforced concrete,
rigid frame viaduct, etc.
Topography Region from mountain to alluvial
low land, via river terrace. Plain Plain
Geological features
of surface stratum
Terrace sediment in quaternary
period of Pleistocene
Terrace sediment
in quaternary period
of Pleistocene
Alluvial clay layer and
alluvial sand soil layer in
Quaternary period Holocene.
38
3. ANALYSIS
3.1. Analysis on Maintenance of the Tracks and the Vehicles before the Accident
3.1.1. Maintenance of the Tracks
It is probable that there was no problem in the track facilities in around the accident site
before the accident, because there was no abnormal situation in the latest periodic inspection for
the track facilities such as the structures and the track etc. in around the accident site, as
described in 2.4.1.3[1], and the track irregularities did not exceed the maintenance standard
values in the measurement by the track measurement device equipped on the commercial vehicle,
implemented just before the accident, as described in 2.4.1.3[2].
3.1.2. Maintenance of the Vehicles
It is probable that there was no problem in the status of the accident train because there was
no abnormal situation in the accident train in the latest periodic inspection, and the ratio of wheel
load unbalance did not exceed the maintenance standard value prescribed in the maintenance
manual for the 800 series Shinkansen electric railcar, as described in 2.4.2.2[1] and 2.4.2.2[2].
3.2. Analysis on the Derailment of the Accident Train
It is probable that the accident was caused by the severe vibration in the direction orthogonal to
the track due to the concerned earthquake acted on all wheels in the accident train running on the
viaduct, uniformly through the rails, and was not caused by any abnormal situation in the railway
facilities such as tracks and vehicles, based on the analyses described in 3.2.1 to 3.2.6. It is
probable that vehicle bodies in the accident train started significant vibration in lateral direction
and rolling motion from about 21:26:42, because wheels in each vehicle received lateral vibration,
and the left or right wheel flanges climbed onto rails within a few seconds after 21:26:43 to
21:26:44, then many wheelsets derailed in almost the same timing.
3.2.1. Status before and after the Occurrence of the Accident.
3.2.1.1. Status until the Occurrence of the Derailment
It is probable that there was no abnormal situation in the operation of the accident train
before the occurrence of the derailment, based on the statements of the Driver described in
2.1.1.
It is probable that the severe vibration due to the concerned earthquake occurred on the track
surface at 21:26:41 to 21:26:42, as described in Figure 18 in 2.10.2.3[6]. The Driver stated that
he applied the emergency brake immediately after he felt vibration by the concerned earthquake.
The ATC device received the emergency stop signal "02E" and operated the emergency brake at
about 21:26:43, as described in Table 2 in 2.1.2.1. Then, it is probable that the operations of the
emergency brake by the Driver and by the ATC device were implemented in almost the same
timing each other.

39
3.2.1.2. Analysis on the Time to Start Derailment, etc.
It is probable that each vehicle was derailed in about 21:26:43 to 21:26:44, when the sudden
decrease of the axle velocity was recorded in the brake control devices in each vehicle, as
described in 2.4.3.1.
The position of the rear end of the accident train at this time was in around 99,155 m as the
position of the front head of the train was in around 99,310 m at this time as described in
2.1.2.1. Then, it is probable that the trace remained on the rail top at the start point of the
derailed trace in around 99,157 m, was caused as the flanges of the left wheel in the rear bogie
of the 6th vehicle that climbed up the rail. It is probable that the derailment of the accident train
occurred from around 99,160 m because the damages considered as caused by passing wheels
were found on the rail fastening devices installed in the outside gauge of left rail in around
99,160 m, as described in 2.3.2.
The ATC device starts recording few seconds after the power supply has turned on as the
specification as described in 2.1.2.1. There was no record in the operating status recording
device between 21:26:43 to 21:26:47. The velocity and the position of the front head of the
train were recorded as zero. Then, it is probable that the power supply of the ATC device
recovered at about 21:26:44 when the wheelset of the front bogie in the 1st vehicle derailed
already, as shown in Table 2.
Here, it is probable that the power supply of the ATC device failed momentarily because the
power source circuit for the ATC device mounted near to the front bogie of the 1st vehicle
broke momentarily due to receive impacts and the system was initialized.
3.2.1.3. Analysis on Deceleration
The average deceleration from start of the operation of emergency brake until to stop was
about 5.1 km/h/s according to the calculation based on the velocity recorded in the operating
status recording device, shown in Table 2 in 2.1.2.1. The running distance of the train from
about 78 km/h until to stop was about 162 m based on the above calculated deceleration, then
the calculated stopped position of the train was at 99,458 m considering that the point to start
braking operation was 99,296 m. It is probable that the actual average deceleration of the
accident train was about 5.1 km/h/s, because the actual stopped position of the accident train
was 99,461 m, which was almost corresponded with the calculated stopped position.
Although the planned average deceleration for the accident train was about 3.6 km/h/s as
described in 2.4.2.1, it is probable that the deceleration of the accident train exceeded the
planned value as the running resistance increased because the plural wheels hit the front walls
of the hollow in the frame shaped slab, and a part of bogies and the underfloor equipment of
vehicles came to contact with rails etc., while wheels of the accident train ran on the frame
shaped slabs after derailed.
3.2.1.4. Analysis on Status of the Vehicles before and after the Accident
It is highly probable that the vehicles in the accident train was running as swaying vehicle

40
bodies in lateral direction and rolling before derailment, because the pressures of air
suspensions equipped to the bogies in each vehicle in the accident train were changed as
described in 2.4.3.1, i.e., the pressures of air suspensions in left and right side of vehicle bodies
oscillated in inverse phase with each other, at the occurrence of the concerned earthquake, and
there was no trace on top surface of rail considered as caused by the climbed up wheel flanges
of the accident train as described in 2.3.2.
It is somewhat likely that the lateral accelerations of about 10 m/s2, i.e., about 1 G, and
momentarily over 10 m/s2 in magnitude, of about 1 second period, were acted to the vehicle
bodies of the vehicle in the accident train continuously for about 4 to 5 seconds as described in
2.4.3.2. Also, it is somewhat likely that the large deceleration of over emergency brake acted by
the wheels hitting the front walls of the hollow in the frame shaped slabs. Then, it is somewhat
likely that if passengers were boarded on the accident train, passengers were shaken their
bodies violently in forward and backward, lateral and vertical directions.
3.2.1.5. Analysis on the Axles Stayed on Rails
The 3rd axles in the 1st and 2nd vehicles of the accident train were stayed on rails when the
investigation of the accident site was implemented as described in 2.3.1. It is highly probable
that these axles did not derail because the actual axle velocity of the 3rd axle in the 1st vehicle
was well corresponded with the calculated one as described in 2.4.3.1, and there was no trace
caused by running on slab track, in the tip of flanges of the 3rd axle in the 2nd vehicle, even
though there was no information about the axle velocity as in the 1st vehicle. Therefore, it is
somewhat likely that the fretting traces in outer surface of wheels described in 2.3.1, were
caused by being in contact with some parts composing bogies.
3.2.2. Relationship between the Occurrence of the Derailment and Status of the Vehicles, the
Tracks, etc.
It is probable that the possibility of relationship between status of the tracks etc. and the
derailment was low because there was no abnormal data and the track irregularities were all
within the maintenance standard values in the latest periodic inspections as described in 3.1.1,
and thewe was no abnormal situation in the tracks as to cause the derailment directly and there
was no significant damage in the structures as described in 2.5.1.
It is probable that the possibility of relationship between status of the vehicles and the
derailment was low, because there was no abnormal situation of the vehicles as caused
derailment directly as there was no abnormal situation in the accident train and no problem in the
ratio of wheel load unbalance etc. in the latest inspection for the accident train as described in
3.1.2, and the Driver stated that he operated the accident train from Hakata station to Kumamoto
station on the accident day without abnormal situation as described in 2.1.1.
3.2.3. Relationship between the Occurrence of the Derailment and the Concerned Earthquake
There was the Hinagu fault belt in around the hypocenter of the concerned earthquake and the

41
edge of the Futagawa to Hinagu fault series fault, that was the fault closest to the accident site,
depicted to the vicinity, as it was not reached, of just beneath the viaduct of Kyushu Shinkansen,
in the literature on active faults as described in 2.9.2.
The concerned earthquake occurred at 21:26:34.4, April 14, 2016. Its hypocenter was in
32°44.5' N in latitude, 130°48.5' E in longitude, 11 km in depth, and magnitude was 6.5. It is
somewhat likely that the concerned earthquake affected the occurrence of the derailment because
the accident site was located in about 12 km distant from the epicenter, and received violent
shakes of the seismic intensity 6- to 6+.
According to the records in the JMA Kumamoto Nishi-Ku Kasuga, located in about 550 m
NNE from the accident site and nearest to the accident site as indicated in Figure 9, the large
acceleration in N-S and E-W directions were recorded at 21:26:41, April 14, 2016 as described in
2.9.3.
As for the status of the vehicle, it is probable that the vehicle body started swaying in lateral
direction when the pressures of the air suspensions in each vehicle of the accident train started to
oscillate from about 21:26:42 as described in 2.4.3.1. In addition, it is probable that the
derailment started from about 21:26:43 to 21:26:44, and many wheelsets derailed in almost the
same timing, because the vibration started about 1 second after 21:26:41, when large acceleration
was recorded in JMA Kumamoto Nishi-Ku Kasuga, located in the nearest point to the accident
site and the description in 3.2.1.2.
It is probable that the position of the front head of the accident train when the derailment
started was considered as in around 99,310 m as described in 3.2.1. Then, the incredible situation
that would not be considered in usual train running as 22 axles in total 24 axles of the accident
train derailed during about 150 m train running to the stopped position at 99,461 m, occurred.
Therefore, it is probable that the concerned earthquake was related to the derailment of the
accident train.
3.2.4. Effects by the Ground Condition
[Ref. Attached figure 11]
The surface layer ground in around the accident site
was modeled as shown in Attached figure 12 as
described in 2.10.2.2[1]. The estimated results of the
transfer function from the Dg1 layer, i.e., the bedrock
of seismic design, in the ground around R4 viaduct of
the No.2 Tasaki BL, using the multiple reflection
theory*38, was shown as the blue line in Figure 22. Here,
it was assumed that the signal was input from
downward in vertical direction. The H/V spectrum
ratio obtained from observation of the microtremor
was shown by the orange line in Figure 22. It is
probable that the possibility of amplification of the
Fig 22. Comparison of theoretical
transfer function and H/V spectrum
ratio of the tremor, observed at R4G

42
vibration component of around 1 Hz in the ground surface in around the viaduct R4 of the No.2
Tasaki BL was high, because there were dominant peaks in around 1 Hz in both characteristics.
Therefore, it is somewhat likely that the large lateral vibration as shown in Figure 10 in 2.10.2.1,
were acted to just beneath the structures in around the accident site.
* 38 "Multiple reflection theory" is the theory on the ground vibration. Refer to K. Kanai, "Earthquake
Engineering", Kyoritsu Publishing Co. Ltd., 1969, in Japanese.
3.2.5. Effects by the Structures
The spectrum ratio on the No.2 Tasaki BL against the ground surface, obtained from the
records of the aftershocks observation, as indicated by orange line in Figure 11 in 2.10.2.2[3][b],
had a peak in around 1.3 Hz, and its value was almost corresponded with the results obtained
from the frequency response analysis indicated by blue line in the same figure. The response
waveforms in each calculating point on the structures obtained, when the seismic ground motion
in the ground surface, which had the maximum acceleration of 398 Gal and shown in Figure 10
in 2.10.2.1, were input to the structures model, had the maximum value of 730 Gal, and the
Fourier amplitude of 1,500 Gal*s at 1.3 Hz, as shown in Figure 13 in 2.10.2.2[4]. Therefore, it is
probable that the vibration was amplified in the structures. Here, it is probable that the Fourier
amplitude in around 1.3 Hz was large as being affected by the natural frequency of the structures.
3.2.6. Mechanism of the Derailment [Ref. Attached Figure 21]
According to the results of analysis described in 2.10.2.3[7], the mechanism of the derailment
was as follows. The wheelset was pushed in lateral direction by the lateral force received from
large lateral vibration of the track, and the wheels were raised up over the flange height 30 mm,
and then left or right wheel flanges climbed up to top of rail and resulted to derail.
It is probable that the vehicles derailed to left and right of the train direction because of the
difference in the vehicle behaviors in each vehicle due to some differences of vibration of the
track surface acted on each vehicle, as the positions of each vehicle running on the viaduct in a
certain moment were existed on the different structures, as shown in Figure 20. Here, there were
occasions having a possibility of derailment twice in the interval of about 0.5 second, i.e.,
vehicles derailed to right in the first occasion and vehicles derailed to left in the second occasion.
The lateral vibration of the track surface acted on the vehicles in the concerned earthquake
had the peaks in around 0.8 Hz and around 1.3 Hz which were in the frequency band to promote
rolling motion of the vehicles*39, as described in 2.10.2.3[6]. These frequencies were a little
larger than the frequency to promote the lower center rolling vibration, that occurred when the
rolling center of vehicle body was in lower part of vehicle and left and right wheels were raised
up high alternately according to rolling motion of the vehicle body, and a little smaller than the
frequency to promote the upper center rolling vibration, that occurred when the rolling center of
the vehicle body was in upper part of the vehicle and wheels moved in lateral direction according
to rolling motion of the vehicle body and the remarkable lateral force acted to wheels. Therefore,
it is probable that it was difficult to determine the vibration mode of the vehicle body.

43
According to the results of the analysis described in 2.10.2.3[7], the 1st, 2nd, 3rd and 6th
vehicles of the accident train derailed to left and right in about 21:26:43 to 21:26:44, April 14,
2016, within 1 to 2 periods after the large lateral vibration arrived at the track surface. As for the
process to the derailment, it is probable that the wheelsets were pushed in left and right by the
lateral forces received from large lateral vibration of the track, and in turns, the wheels were
raised up over flange height 30 mm, the flanges of left or right wheels climbed up to top of rails
and resulted to derail. These results of the analysis well corresponded with the results of analysis
on the traces etc. on rails and the time of the derailment described in 3.2.1 to 3.2.3, and the status
of the accident train after the accident described in 2.3.1.
Furthermore, it is somewhat likely that the risk to cause derailment could be lowered if the
guard angles were equipped in around the accident site, because the simulated results, listed in
Table 18 in 2.10.2.4, showed that the train did not derail if the guard angles were installed.
*39 Miyamoto, "Measures to prevent vehicle derailment in earthquake", RRR, Vol.69, No.3, p.15, RTRI,
2012, in Japanese.
3.3. Analysis on Estimation of Seismic Ground Motion of the Ground Surface in the Accident Site
The transfer function between the reference point and the estimating point was studied to
estimate the seismic ground motion on the ground surface in the accident site. Here, the method A
and B described in Table 14 in 2.10.2.1, were used and their results were compared and studied.
The transfer function was estimated by calculating the Fourier amplitude ratio, i.e., ratio of Fourier
amplitudes in the estimating point and the reference point, from the observed data of the main
shock and the aftershocks, to select the JMA Kumamoto Nishi-Ku Kasuga as the reference point,
and the accident site as the estimating point.
[1] Method A using transfer function on the ground surface
The transfer function between two points
estimated by calculating the Fourier amplitude
ratio based on the recorded data of the main shock
and the aftershocks using method A, was shown in
Figure 23. According to Figure 23, the Fourier
amplitude ratios of the main shock and two
aftershocks varied in around almost 1.0 and the
amplitude ratios for each earthquake showed the
similar trends, then it could conclude that the
transfer function could be obtained stably.
In addition, it is probable that the seismic ground
motion was amplified by the effects of the surface
ground at the estimating point, because the average
Fourier amplitude ratio in the period of 1.0 to 1.5 seconds, i.e., frequency was 0.8 Hz, exceeded
1.0 significantly.
It was highly probable that the estimated waveforms of seismic ground motion obtained
from the above discussions, contained a lots of frequency components in around 0.8 Hz and
Figure 23. Transfer function between
two points on the ground surface,
JMA Kumamoto Nishi-Ku Kasuga
was used as the reference point.

44
around 1.3 Hz, as shown in the upper figure of Fugure25.
[2] Method B using transfer function on the bedrock
The method B estimate the Fourier amplitude ratio same as in the method A, however,
different from the method A, the amplitude characteristics of the ground in around the
estimating point was revised by the calculated seismic ground motion on "the bedrock of the
seismic design", hereinafter "on the seismic design" was omitted, removing the effects by the
surface layer ground from the seismic ground motion in the reference point. The seismic
ground motion had a possibility to include the effects of the nonlinear responses of the surface
layer ground in the seismic ground motion, especially in case of the earthquake of the large
amplitude level, because characteristics of the seismic ground motion on the ground surface
differs significantly by the effects of the surface layer ground. Then, the seismic ground motion
on the bedrock was estimated by removing effects by the surface layer ground. Here, it is
desirable to select the engineering bedrock*40 having the elastic wave velocity Vs of about 700
m/s, as the bedrock, but in this case, the bedrock in this context was set as the soil of the
N-value 50, i.e., Vs is about 400 m/s, because the information on the ground condition to the
depth that satisfied this condition could not be obtained.
Next, the observed data for the main shock and the aftershocks in the reference position and
the estimating point, were restored to the position of the bedrock, using the ground conditions
estimated in the above discussions.
The average value of the Fourier amplitude ratio between the reference point and the
estimating point calculated for each earthquake about the estimated seismic ground motion on
the bedrock was determined as the transfer function between two points in the position of the
bedrock.
The transfer function on the bedrock between
the reference point and the estimated point was
shown in Figure 24. The transfer function on the
bedrock was expected as smaller than the transfer
function on the ground surface indicated in Figure
23, but it was larger in wide frequency band. It is
somewhat likely that the transfer function could not
be estimated stably because the Fourier amplitude
ratios of the main shock and two aftershocks varied
largely, and the amplitude ratios of each earthquake
differed significantly with each other.
Next the seismic ground motion on the ground surface at the reference point was estimated by
the response analysis of the ground using the obtained seismic ground motion at the bedrock and
the ground conditions at the estimating point. The physical properties of the ground and the
nonlinear characteristics were determined by the same conditions as in the calculation of restoring.
The estimated waveforms of the seismic ground motion obtained as the results of the calculation
Figure 24. Transfer function between
two points on the bedrock. JMA
Kumamoto Nishi-Ku Kasuga was
set as the reference point.
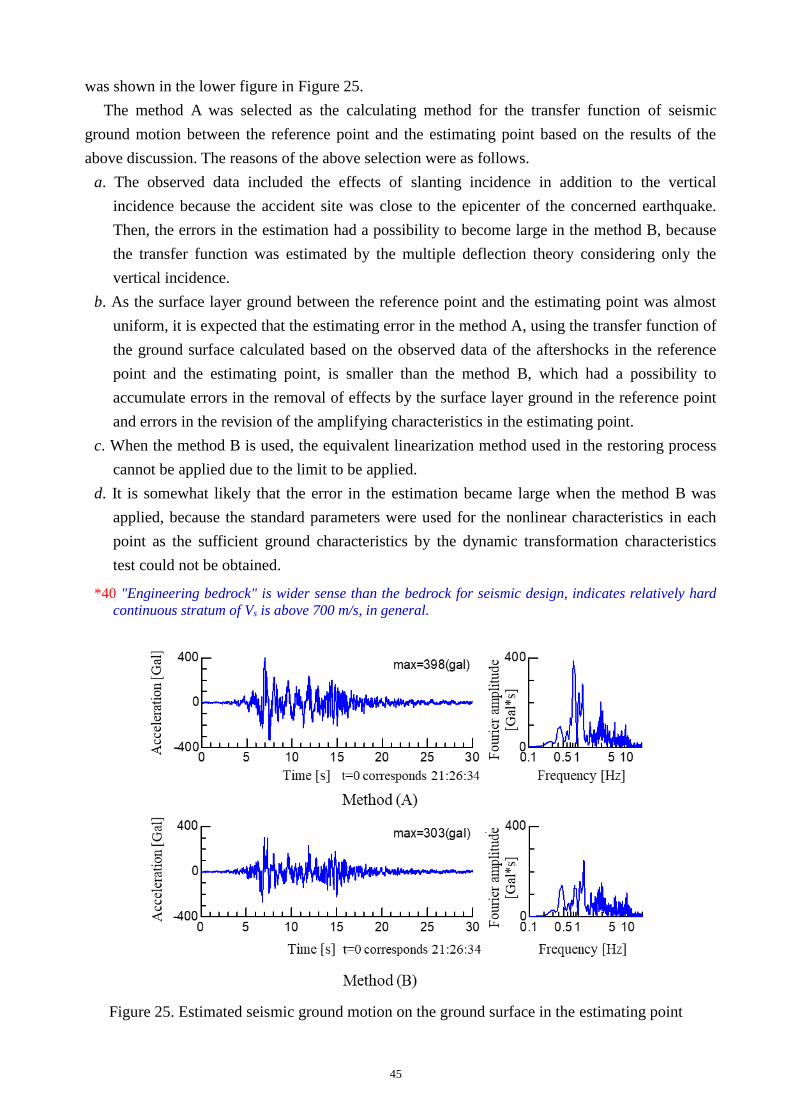
45
was shown in the lower figure in Figure 25.
The method A was selected as the calculating method for the transfer function of seismic
ground motion between the reference point and the estimating point based on the results of the
above discussion. The reasons of the above selection were as follows.
a. The observed data included the effects of slanting incidence in addition to the vertical
incidence because the accident site was close to the epicenter of the concerned earthquake.
Then, the errors in the estimation had a possibility to become large in the method B, because
the transfer function was estimated by the multiple deflection theory considering only the
vertical incidence.
b. As the surface layer ground between the reference point and the estimating point was almost
uniform, it is expected that the estimating error in the method A, using the transfer function of
the ground surface calculated based on the observed data of the aftershocks in the reference
point and the estimating point, is smaller than the method B, which had a possibility to
accumulate errors in the removal of effects by the surface layer ground in the reference point
and errors in the revision of the amplifying characteristics in the estimating point.
c. When the method B is used, the equivalent linearization method used in the restoring process
cannot be applied due to the limit to be applied.
d. It is somewhat likely that the error in the estimation became large when the method B was
applied, because the standard parameters were used for the nonlinear characteristics in each
point as the sufficient ground characteristics by the dynamic transformation characteristics
test could not be obtained.
*40 "Engineering bedrock" is wider sense than the bedrock for seismic design, indicates relatively hard
continuous stratum of Vs is above 700 m/s, in general.
Figure 25. Estimated seismic ground motion on the ground surface in the estimating point

46
3.4. Analysis on Damages of the Tracks and the Vehicles
3.4.1. Damages of the Tracks
The damages of the frame shaped slab were found from around 99,200 m to around 99,450 m
as described in 2.5.1[2], but it is probable that the damage in the front wall of the hollow in the
frame shaped slab were caused as being hit by the plural derailed wheels based on the position of
damages and the damaged level, as described in 3.2.1.3. It is probable that the large damages in
the hollows of the frame shaped slabs were remarkable in between beginning end and around
middle point of the above section, i.e., from around 99,200 m to around 99,407 m, by the effects
of large number of axles passed on the hollows of the frame shaped slab after derailed.
According to the measures to prevent deviations of the Company, the wheels run on the hollow
of the frame shaped slab when the wheelset deviated about 42 cm as described in 2.6.2, then it is
probable that wheels dropped into the hollows of the frame shaped slab and hit the front walls of
the hollows.
It is probable that the damages of the devices related to the rail fastening devices and the
devices related to signaling system existed between around the start point of the derailed trace in
the direction to Kumamoto station and the position where the train halted as described in 2.5.1[3]
and [4], were caused by the wheels of the derailed axles passing on them or the underfloor
equipment coming into contact with them.
3.4.2. Damages of the Vehicles
It is probable that the axle beams and the axle spring of the 2nd axle of the 6th vehicle came
off from the bogie because the bolts to attach the axle beams to the bogie frame using the holding
metal were broken as described in 2.5.2. It is probable that the bolt was damaged being acted by
the large impacts exceeding the designed strength when the wheels hit the front wall of the
hollow in the frame shaped slab, because no feature of the fatigue break was found in the broken
surface of the bolt. Then, it is expected that research and development will be implemented to
improve safety according to its necessity, by estimating the impacts generated when wheels hit
the front wall of the hollow in the frame shaped slab, to avoid missing functions of preventing
deviation by the deviation preventing stopper due to the damaged bogie after derailment
occurred.
It is somewhat likely that the damages of the air springs in the 5th and the 6th vehicles and the
damages of the automatic leveling devices in each vehicle were caused by the large displacement
of each device exceeded their movable area, due to the remarkable rolling motion of the vehicle
body caused by the lateral vibration from the tracks and the occurrence of the derailment as
described in 3.2.
Here, the horn of the pantograph in the 2nd vehicle was damaged due to being in contact with
some hangers in around the accident site, as the broken pieces were found on the ground in the
direction to Kumamoto Train Depot from Tsuboigawa B as described in 2.3.1, and the hangers in
around the accident site came off from the overhead contact line as described in 2.5.1. It is
probable that the horn of the pantograph came into contact with the hangers because the shoe of

47
the pantograph came off from the overhead contact line by the shakes due to the earthquake.
3.5. Analysis on Prevention of Recurrence and Reduction of Damages
The Company has been implemented large scale measures against earthquake such as to
reinforce strength of the structures and to equip the train defense system for earthquake, based on
the past large scale earthquakes. However, to improve safety still more based on the situation
occurred in the accident, the measures to prevent recurrence and to reduce damages were analyzed
as follows.
3.5.1. Guard Angles
The Company should promote continuously to install guard angles which has been
implemented from 2012, as the safety should be secured by the maximum efforts because
Shinkansen trains operated in high speed have the fear of severe damage once the derailment
accident happens.
The accident occurred in the place where the guard angles were not installed, and the reasons
why the guard angles were not installed there, were as described in 2.6.2. It is somewhat likely
that the seismic ground motion vibrating in about 1 Hz was amplified in the surface ground in
around the accident site by the effects of the surface layer ground as described in Figure 22 in
3.2.4. It is somewhat likely that the acceleration of the seismic ground motion at the top of the
structure, having the peak in around the natural frequency 1.3 Hz, might be amplified to over 1.8
times in maximum of the seismic ground motion at the ground surface, according to the results
of the simulation described in Figure 13 in 2.10.2.2[4].
Therefore, the Company should study about the installation plans of the guard angles because
there is the possibility that guard angles will not be installed in the places where the installation
standards are not fitted as same as in the accident site, obeying the conventional plan of the
Company.
It is important to study the installation plan of the guard angles considering the following
points.
[1] The risks of occurrence of earthquakes reviewed including active faults along the
Shinkansen Line, in addition to the conventional standard that the active faults, crossing
completely with the Shinkansen Line, listed as the certainty I in the reference on the active
faults and defined as dangerous in the long term estimation etc. by the headquarter of
promoting investigation and research and investigation of earthquake.
[2] The probability of occurrence of the severe vibration in the place along the Shinkansen
Lines based on the map of the predicted seismic ground motion in the whole country.
[3] The risks of occurrence of the derailment supposed by the screening studies considering
the amplifying characteristics of the surface layer ground just beneath the Shinkansen track
and the vibrating characteristics of the structures.
[4] The scale of the possible damages caused by the train running after derailed.
It is expected to install guard angles in order of priority of requirement in the places where

48
attention against earthquake should be paid, because it is probable that the Company could not
finish installation of guard angles easily in the whole track in a short term, and it could not be
identified when and where the large scale earthquake would occur.
3.5.2. Measures to Prevent Deviation
The accident train ran on the slab track after many wheelsets were derailed as described in
2.3.1. The deviation preventing stoppers were not equipped in the accident train when the
accident occurred, but, according to the Company, the deviation preventing stoppers were
equipped to all vehicles by the end of 2016 fiscal year. The deviation preventing stoppers of the
Company performed their function when united with the guard angles as described in 2.6.2. Then,
it is desirable that the guard angles will be installed in order of priority for installation described
in 3.5.1.
Here, it is somewhat likely that the positional relationship between the deviation preventing
stopper and the guard angle varies larger than as supposed when the wheels ran into the hollows
of the frame shaped slab, because it is probable that the wheels passed on the hollows of the
frame shaped slab in the accident as described in 3.4.1. Then, it is expected to confirm that the
positional relationship between the deviation preventing stopper and the guard angle and the
force acting to the guard angle, were within the designed range even when the wheels ran into
the hollow of the frame shaped slab.
3.5.3. Train Defense System for Earthquake
The seismograph in Kumamoto Train Depot SS issued four kinds of trip feeding signals when
the concerned earthquake occurred as shown in Table 4 in 2.1.2.3. The Kumamoto Train Depot
SS issued the interlinked breaking signal to the neighboring SSs and broke electric power
feeding to the overhead contact lines as shown in Table 3 in 2.1.2.2. The receiver of the ATC
device equipped in the accident train received the emergency stop signal "02E" from rail and the
stop signal "02" due to the decreased line voltage from the third windings of the main
transformer and operated the emergency brake, as described in Table 2 in 2.1.2.1. Then, it is
highly probable that the train defense system for earthquake functioned normally.
According to the materials published by the JMA described in 2.9.1, and the recorded data
indicated in Table 2 to Table 4, the process from the detection of the concerned earthquake to the
operation of the emergency brake in the accident train was as follows.
The concerned earthquake observed by the seismograph of the JMA at 21:26:34.4, was
detected by the seismograph located in the trackside earthquake detecting point in the premises
of Kumamoto Train Depot SS, about 12 km distant from the epicenter at 21:26:38.46, and the
seismograph issued the stop feeding signal to the Kumamoto Train Depot SS at 21:26:40.08. The
Kumamoto Train Depot SS, as received the stop feeding signal, issued the earthquake interlinked
breaking signal at 21:26:41. The Shin-Gyokuto SS, received the earthquake interlinked breaking
signal at 21:26:41, operated the circuit breaker 13 for power feeding to stop power feeding at
21:26:41. The accident train, received the emergency stop signal "02E" from the ground facility

49
detected power failure of the overhead contact line, operated the emergency brake at 21:26:43.
Therefore, the emergency brake of the accident train operated about 5 seconds after the first
detection of the concerned earthquake by the seismograph located in the trackside earthquake
detecting point in the premises of the Kumamoto Train Depot SS at 21:26:38.46.
The emergency brake of the accident train operated after confirmed the receipt of the
emergency stop signal "02E" at 21:26.43, as indicated in Table 2 in 2.1.2.1, but the accident train
received from the violent lateral vibration of the track surface considered as caused by the
S-wave of the concerned earthquake at about 21:26:41 to 21:26:42 as shown in Figure 18, before
the velocity was decreased.
The train defense system for earthquake of the Company functions using the difference of
arrival times of the P-wave and the S-wave, that propagate in the different speed as described in
2.6.1. Then it is probable that the system was effective for the train running in the section apart
from the epicenter, but not so effective for the train running in the vicinity of epicenter due to
small difference in the arrival times of both waves. Therefore, it is highly probable that the
accident train, running in the place close to the epicenter of the concerned earthquake, could not
be suppressed its velocity enough before arrival of the S-wave. From the above discussion, it is
expected to promote research and development continuously, to shorten the required time to
detect earthquake and to shorten the braking distance of a train after an earthquake was detected.
However, there is the limitation in the train defense system for earthquake against the inland type
earthquakes, then it is necessary to promote the measures by installation of the preventing
devices for derailment and deviation continuously and steady, at the same time.
4. CONCLUSIONS
4.1. Findings
[1] Analysis on the derailment of the accident train
[a] Transition of status before and after the derailment accident
It is probable that the derailment occurred in each vehicle from 21:26:43 to 21:26:44,
because the brake control devices in each vehicle recorded that the axle velocity in each vehicle
decreased rapidly in that time.
It is probable that the front head of the accident train was in around 99,310 m at that moment,
then the position of the rear end of the accident train was in around 99,155 m. Therefore, it is
probable that the derailed trace on the top of rail at the start point of the derailed trace in around
99,157 m, was caused by the derailed axle in the rear bogie of the 6th vehicle, at about from
21:26:43 to 21:26:44. In addition, it is probable that the power supply for the ATC device
recovered at about 21:26:44, so the axles in the front bogie of the 1st vehicle were derailed
before that moment.
It is highly probable that the accident train was running as the vehicle bodies were swaying
and rolling based on the records of the pressures of air springs. The laterally vibrating forces of
about 1 second period and acceleration of 10 m/s2 or above were acted on the vehicle bodies for

50
about 4 to 5 seconds based on the recorded data of acceleration of lateral vibration of the
vehicle body. It is somewhat likely that the average deceleration of about 5.1 km/h/s was acted
by the wheels hit the front wall of the hollows in the frame shaped slabs, etc. Then it is
somewhat likely that passengers received from lateral and vertical violent shakes if they were
boarded on the accident train. [Refer to 3.2.1]
[b] Relation between the occurrence of the derailment and status of the track and the vehicles
It is probable that the possibility of relationship between status of the tracks and the
derailment was small, because there was no abnormal status as to cause the derailment directly
in the records of the latest inspection for the tracks. Also, it is probable that the possibility of
relationship between status of the vehicles and the derailment was small, because there was no
abnormal status in the records of the latest inspection for the vehicles. [Refer to 3.2.2]
[c] Relation with the concerned earthquake
The large accelerations in N-S and E-W directions were recorded at about 21:26:41, April 14,
2016, in the observed records in the JMA Kumamoto Nishi-Ku Kasuga, the nearest observing
point to the accident site.
On the other hand, it is probable that vehicle bodies started violent lateral vibration at about
21:26:42, when the air springs of each vehicle in the accident train started oscillation and the
violent vibration of the vehicle bodies started from about 1 second after the large acceleration
were recorded in the above earthquake observing point. It is probable that the derailment
started before 21:26:44, because the power source for the ATC device failed momentarily and
the axle velocity recorded in the brake control device decreased rapidly. The situation, which
would not occur in the normal operation, that the 22 axles in total 24 axles of the accident train
derailed while the train ran about 150 m after derailed, had happened. Therefore, it is probable
that the concerned earthquake related to the derailment of the accident train. [Refer to 3.2.3]
[d] Effects by the ground
It is probable that vibration was amplified in the ground. It is somewhat likely that the
component of vibration in around 1 Hz was amplified, due to effects by the characteristics of
the surface layer ground. [Refer to 3.2.4]
[e]Effects by the structures
It is probable that vibration was amplified in the structures. It is probable that the Fourier
amplitude in around 1.3 Hz was large due to effects by the natural frequency of the structures.
[Refer to 3.2.5]
[f] Mechanism of the derailment
It is probable that wheels were raised higher than the flange height 30 mm, as being pushed
in left and right directions by the lateral forces due to large lateral vibration of the track, then
the flanges of left or right wheels climbed up to top surface of rails and resulted to derail.
It is probable that direction of the derailments differed in left and right because there were
differences between behaviors of each vehicle due to slight differences in vibration of the track
surface acted to each vehicle caused by the difference of viaducts where each vehicle was
running at a certain moment. [Refer to 3.2.6]

51
[2] Analysis on damages of the tracks and the vehicles
It is probable that the damages in the frame shaped slabs were caused by being hit by the
derailed plural wheels, based on the positions of the damages in the track and the portions and
the size of the damages in the hollows of the frame shaped slabs.
As for the damages in the vehicle, it is probable that the bolts to attach axle beam to the bogie
frame in the 2nd axle of the 6th vehicle were broken because the impact exceeding the designed
strength was acted. Therefore, it is expected to estimate the impacts when the wheels hit the front
wall of the hollows in the frame shaped slabs, and to implement research and development to
improve safety according to their necessities, as the deviation preventing stoppers do not lose
their function to prevent deviation by the damages of bogies even if the vehicle is derailed.
[Refer to 3.4]
[3] Analysis on prevention of recurrence and reduction of damages
[a] Guard angles
The Company should promote installation of the guard angles continuously because the
greatest possible efforts should be paid to secure safety due to the fear of severe damages, once
the Shinkansen train operated in high speed is derailed.
According to the Company, the guard angles were not equipped in around the accident site
when the accident occurred because the section in around the accident site was not fit the
installation standard of the guard angle, and there was no plan to equip the guard angles.
However, the derailment accident occurred actually, then the Company should study about the
installation plans of the guard angles because there are possibilities that the guard angles may
not be installed in the section where the installation standard are not fit as same as the accident
site, by the conventional installation plan decided as obeying the conventional installation
standard.
It is important to study sections where the guard angles should be installed, considering the
following viewpoints.
a. The risks of occurrence of earthquakes reviewed including active faults along the
Shinkansen Line, in addition to the conventional standard that the active faults, crossing
completely with the Shinkansen Line, listed as the certainty I in the reference on the
active faults and defined as dangerous in the long term estimation etc. by the headquarter
of promoting investigation and research and investigation of earthquake.
b. The probability of occurrence of the severe vibration in the place along the Shinkansen
Lines based on the map of the predicted seismic ground motion in the whole country.
c. The risks of occurrence of derailment supposed by the screening studies considering the
amplifying characteristics of the surface layer ground just beneath the Shinkansen track
and the vibration characteristics of the structures.
d. The scale of the possible damages caused by the train running after derailed.
Furthermore, it is desirable to study the priority order for installation of the guard angles.
[Refer to 3.5.1]
[b] Measures to prevent deviation
52
The Company completed to equip the deviation preventing stoppers for all Shinkansen
vehicles, but they will function as a unit with the guard angles installed in the track. Then, it is
expected that the guard angles should be installed in turns obeying the priority described in
4.1[3]a. [Refer to 3.5.2]
[c] Train defense system for earthquake
The train defense system functioned normally but it could not suppress velocity of the
accident train before the arrival of the S-wave because the concerned earthquake was the inland
type earthquake and the accident site was in a short distance from the hypocenter. It is desirable
that the Company promote research and development to shorten the time required to detect
earthquake and to shorten the braking distance of the train still more. At the same time, the
Company is required to promote measures to prevent derailment and deviation successively and
steadily, because the train defense system for earthquake has the limitation against the inland
type earthquake. [Refer to 3.5.3]
4.2. Probable Causes
It is probable that the accident occurred as the train derailed due to receiving the seismic
ground motion of the earthquake occurred at about 21:26, April 14, 2016, which was one of the
2016 Kumamoto Earthquakes.
As for the process to the derailment, it is probable that many axles derailed in almost the same
timing, after each vehicle in the train rolled significantly and wheel flanges of left or right wheels
climbed up the rail, because the rolling motion in the frequency range to promote rolling motion
of the vehicles easily, were amplified in the structures, in addition to the violent shakes in the
direction orthogonal to the track was acted on just beneath the structures in around the accident
site due to the amplified vibration of the ground.
5. SAFETY ACTIONS
5.1. Measures Expected to be Implemented in the Future
The greatest possible efforts should be paid to secure safety due to the fear of severe damages,
once the Shinkansen train operated in high speed is derailed. The railway operator who operate
Shinkansen have been promoting measures to improve running safety and to reduce damages
against earthquake, by the measures for earthquake such as reinforcement of structures against
earthquake and the installation of the train defense system for earthquake, and measures to prevent
derailment and deviation supposing the case that the above measures could not be prevented
derailment.
The Company should also promote the measures to prevent derailment and deviation, still
more.
It is important to study and implement installation plans for measures to prevent derailment and
deviation, considering risks of occurrence of earthquake, risks of occurrence of derailment
supposed from various conditions, and the scale of damages caused by the train running after
derailed, based on the situation occurred in the accident.
53
In addition, it is expected to estimate the impacts when the wheels hit the front wall of the
hollows in the frame shaped slabs, and to implement research and development to improve safety
according to their necessities, as the measures to prevent deviation do not lose their function after
the occurrence of derailment.
5.2. Measures Implemented by the Company after the Accident
The Company implemented the following measures from May 27, 2016, after the accident.
(1) The guard angles were installed in total 17 km, i.e., 14.5 km in around the derailed place of
the accident train by the concerned earthquake, total 2.5 km in the premises of Kumamoto
station and in the premises of Kumamoto Train Depot, by March 27, 2017.
(2) The deviation preventing stoppers were equipped to the six train-set, except for the accident
train, by March 29, 2017.
5.3. Measures Implemented by the Ministry of Land, Infrastructure, Transport and Tourism after the
accident
The Railway Bureau, MLIT, held the 13th meeting on measures for derailment of Shinkansen,
on May 27, 2016, according to the occurrence of the accident. In the meeting, the Company
reported about the damaged status in Kyushu Shinkansen. It was confirmed in the meeting to
implement verification of the effectiveness of the measures implemented by the railway operators
who operate Shinkansen and to implement studies to promote future measures as soon as possible.

54
Attached figure 1. Route map of Kyushu Shinkansen
Attached figure 2. Topographical map around the accident site
Attached figure 3. Schematic diagram of the accident site

55
Attached figure 4.1. Structures in around the accident site, No.2 Tasaki Bv

56
Attached figure 4.2. Structures in around the accident site, No.2 Tasaki BL-1

57
Attached figure 4.3. Structures in around the accident site, No.2 Tasaki BL-2

58
Attached figure 4.4. Structures in around the accident site, Tsuboigawa B

59
Attached figure 4.5. Structures in around the accident site, No.1 Rendaiji BL
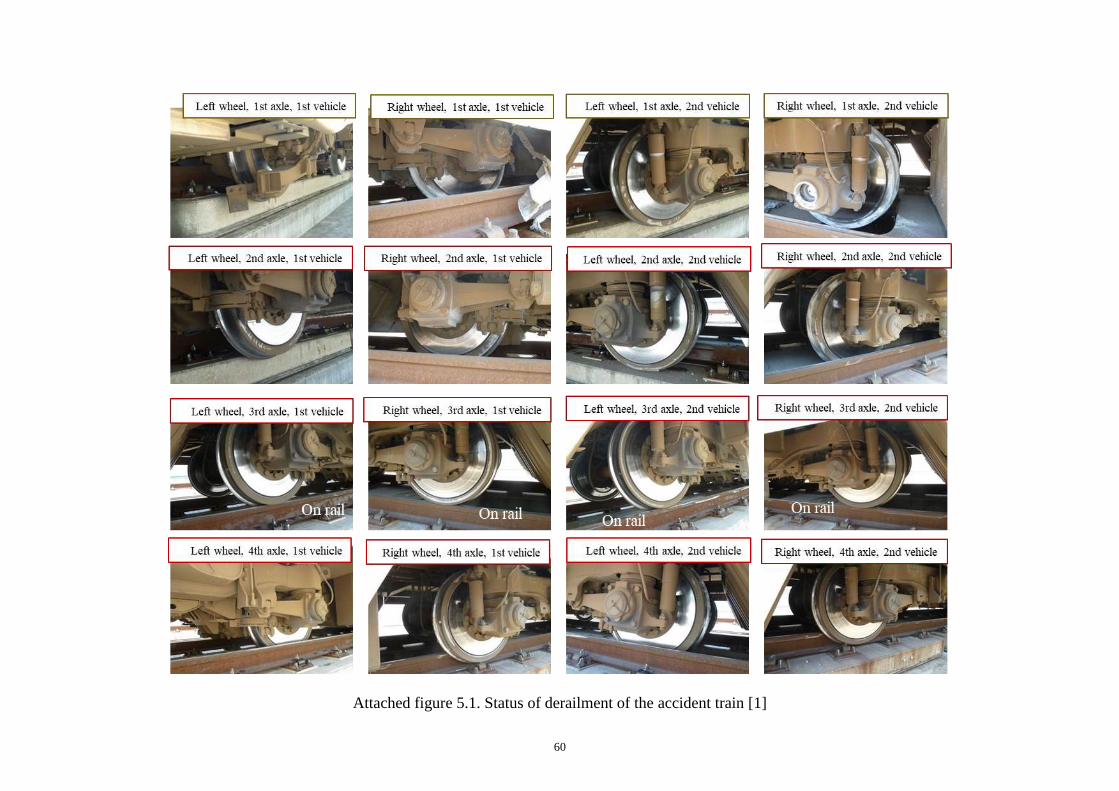
60
Attached figure 5.1. Status of derailment of the accident train [1]

61
Attached figure 5.2. Status of derailment of the accident train [2]

62
Attached figure 5.3. Status of derailment of the accident train [3]

63
Attached figure 6. Schematic diagram of the train defense system for earthquake
Attached figure 7. Extracted records of the brake control device

64
Attached figure 8. Extracted records of acceleration of lateral vibration of vehicle body
Attached figure 9. Positions of the earthquake detecting points for the train defense system
for earthquake

65
Attached figure 10. Observed records of the concerned earthquake in JMA Kumamoto
Nishi-Ku Kasuga

66
Attached figure 11. Observing points for the main shock and the aftershocks
Attached figure 12. Extracted ground model determined in the places of structures
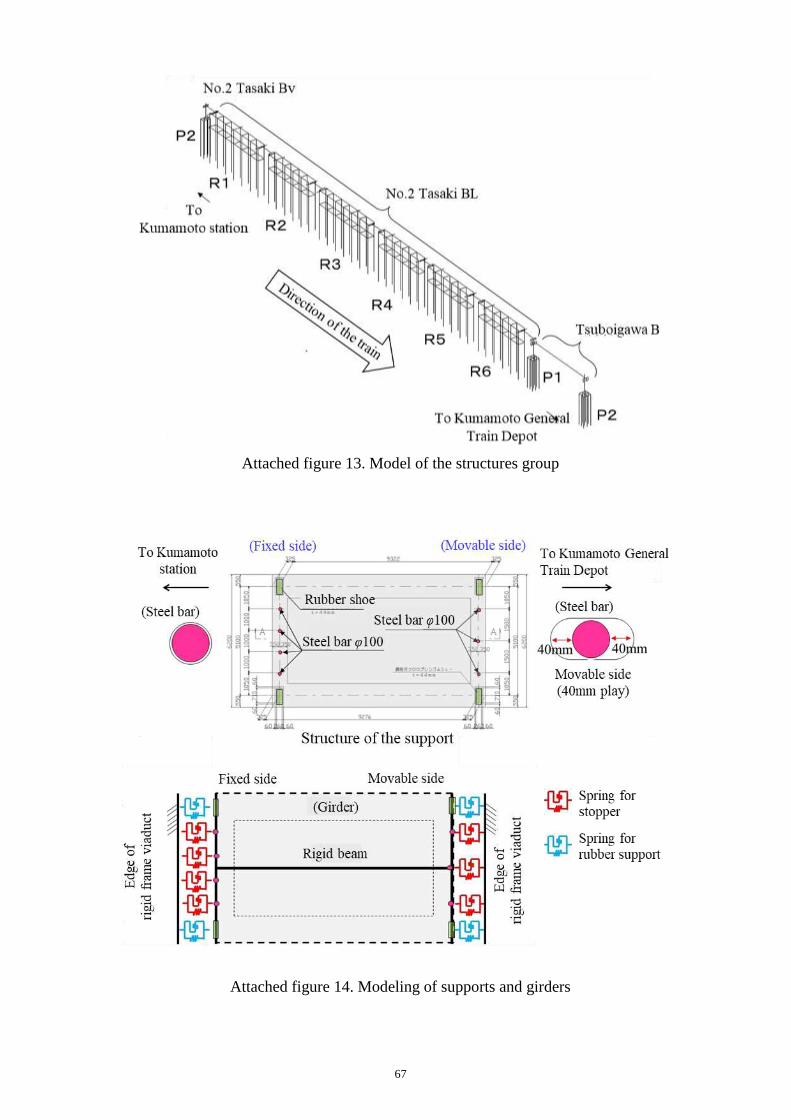
67
Attached figure 13. Model of the structures group
Attached figure 14. Modeling of supports and girders

68
Attached figure 15. Results of the behavior analysis for the 1st vehicle

69
Attached figure 16. Results of the behavior analysis for the 3rd vehicle

70
(a) From 21:26:42.76 to 21:26:43.06
(b) From 21:26:43.06 to the derailment
Attached figure 17. Transition of posture of the 1st vehicle just before the derailment

71
(a) From 21:26:43.26 to 21:26:43.56
(b) From 21:26:43.56 to the derailment
Attached figure 18. Transition of posture of the 3rd vehicle just before the derailment

72
Attached figure 19. Results of behavior analysis for the 1st vehicle when guard
angles were equipped
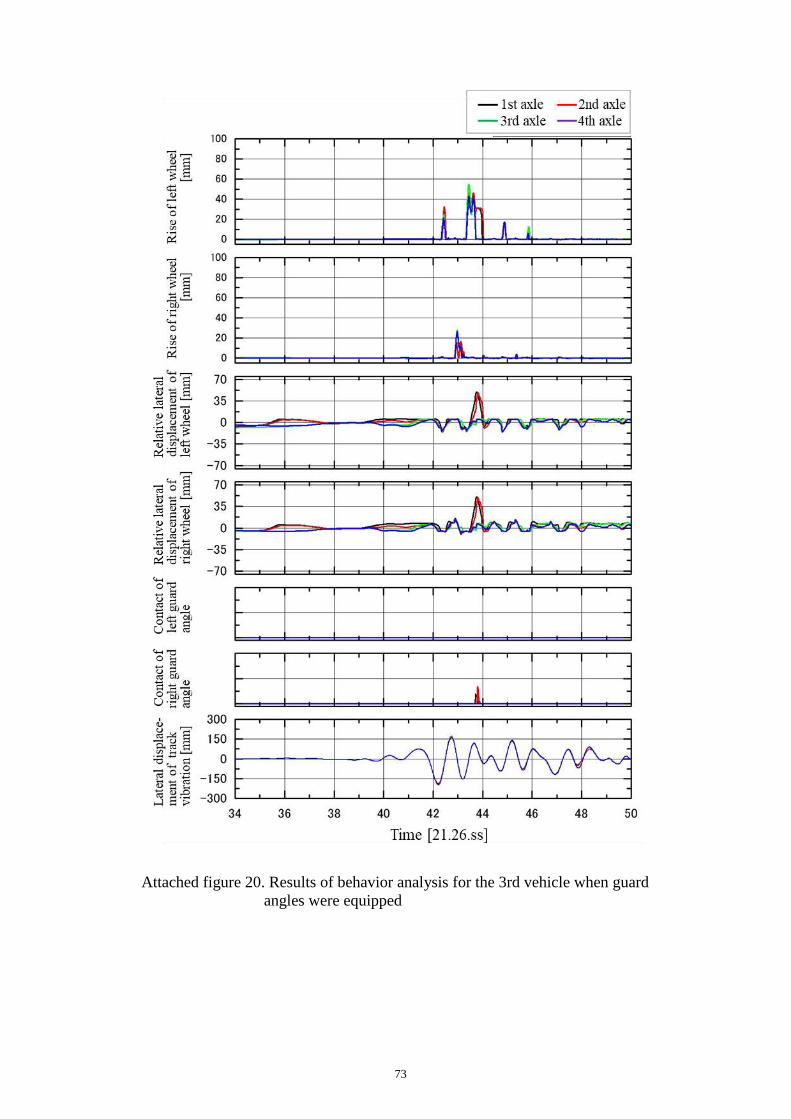
73
Attached figure 20. Results of behavior analysis for the 3rd vehicle when guard
angles were equipped

74
Attached figure 21. Behavior of the vehicle when derailed to right