Race, Ethnicity, Immigration, and Living Conditions in Costa ...
30
RACE, ETHNICITY, IMMIGRATION, AND LIVING CONDITIONS IN COSTA RICA by Carlos Gradi ´n* Universidade de Vigo and EQUALITAS Using information from the 2011 census, we analyze the differential in living standards by race, ethnicity, and country of birth in Costa Rica. We identify the main factors explaining such inequalities along the distribution of a composite index of wellbeing, with counterfactual analysis based on the Blinder–Oaxaca type of decomposition. Our results show that mulattoes, indigenous people, and immigrants from Nicaragua and Panama are generally worse off than the majority of the population, although the reasons differ. While lower education levels and lower paying occupations explain much of the differential in all cases, location is particularly important for indigenous people and immigrants from Panama who live in the least developed areas of the country. We also investigate the distributive pattern of these inequalities and the remarkably distinctive situation of Costa Rican blacks. JEL Codes: D63, I32, J15 Keywords: Costa Rica, decomposition, race/ethnicity, wellbeing 1. Introduction Costa Rica is a small, middle-income country, traditionally outstanding for having economic and political stability and social cohesion well above the usual levels in the Central American and Caribbean region (e.g., Medina and Galván, 2008; ECLAC, 2012; Gindling and Trejos, 2013). For example, Medina and Galván (2008) ranked Costa Rica as having the second-lowest Gini inequality among 17 Latin American and Caribbean countries circa 2005 (only above Uruguay), with three Central American and Caribbean countries at the top (Hon- duras, Nicaragua, and the Dominican Republic). Gindling and Trejos (2013), using various inequality indices, noted that around 1990, Costa Rica had inequal- ity well below that of Guatemala, Honduras, Nicaragua, and El Salvador. However, the opposite trends followed by these countries ever since, with inequal- ity increasing in Costa Rica and Honduras and decreasing in the other countries, but especially in El Salvador, have substantially reduced the gap, and around 2010 the latter was the country with the lowest inequality in this group (followed by Costa Rica). Long-term trends in poverty and inequality in Costa Rica are described by Trejos (2012). Note: This research was started while visiting the Instituto de Investigaciones en Ciencias Económicas at the Universidad de Costa Rica. I acknowledge financial support from the Spanish Ministerio de Economía y Competitividad (ECO2013-46516-C4-2-R) and Xunta de Galicia (CN2012/ 178). I am grateful to Juan D. Trejos for his help. *Correspondence to: Carlos Gradín, Facultade de CC. Económicas e Empresariais, Universidade de Vigo, Campus Lagoas-Marcosende, 36310 Vigo, Galicia, Spain ([email protected]). V C 2015 International Association for Research in Income and Wealth S90 Review of Income and Wealth Series 62, Supplement 1, August 2016 DOI: 10.1111/roiw.12176
-
Upload
khangminh22 -
Category
Documents
-
view
1 -
download
0
Transcript of Race, Ethnicity, Immigration, and Living Conditions in Costa ...

RACE, ETHNICITY, IMMIGRATION, AND LIVING CONDITIONS IN
COSTA RICA
by Carlos Gradin*
Universidade de Vigo and EQUALITAS
Using information from the 2011 census, we analyze the differential in living standards by race,ethnicity, and country of birth in Costa Rica. We identify the main factors explaining such inequalitiesalong the distribution of a composite index of wellbeing, with counterfactual analysis based on theBlinder–Oaxaca type of decomposition. Our results show that mulattoes, indigenous people, andimmigrants from Nicaragua and Panama are generally worse off than the majority of the population,although the reasons differ. While lower education levels and lower paying occupations explain muchof the differential in all cases, location is particularly important for indigenous people and immigrantsfrom Panama who live in the least developed areas of the country. We also investigate the distributivepattern of these inequalities and the remarkably distinctive situation of Costa Rican blacks.
JEL Codes: D63, I32, J15
Keywords: Costa Rica, decomposition, race/ethnicity, wellbeing
1. Introduction
Costa Rica is a small, middle-income country, traditionally outstanding forhaving economic and political stability and social cohesion well above the usuallevels in the Central American and Caribbean region (e.g., Medina and Galván,2008; ECLAC, 2012; Gindling and Trejos, 2013). For example, Medina andGalván (2008) ranked Costa Rica as having the second-lowest Gini inequalityamong 17 Latin American and Caribbean countries circa 2005 (only aboveUruguay), with three Central American and Caribbean countries at the top (Hon-duras, Nicaragua, and the Dominican Republic). Gindling and Trejos (2013),using various inequality indices, noted that around 1990, Costa Rica had inequal-ity well below that of Guatemala, Honduras, Nicaragua, and El Salvador.However, the opposite trends followed by these countries ever since, with inequal-ity increasing in Costa Rica and Honduras and decreasing in the other countries,but especially in El Salvador, have substantially reduced the gap, and around 2010the latter was the country with the lowest inequality in this group (followed byCosta Rica). Long-term trends in poverty and inequality in Costa Rica aredescribed by Trejos (2012).
Note: This research was started while visiting the Instituto de Investigaciones en CienciasEconómicas at the Universidad de Costa Rica. I acknowledge financial support from the SpanishMinisterio de Economía y Competitividad (ECO2013-46516-C4-2-R) and Xunta de Galicia (CN2012/178). I am grateful to Juan D. Trejos for his help.
*Correspondence to: Carlos Gradín, Facultade de CC. Económicas e Empresariais, Universidadede Vigo, Campus Lagoas-Marcosende, 36310 Vigo, Galicia, Spain ([email protected]).
Review of Income and Wealth 2015DOI: 10.1111/roiw.12176
© 2015 International Association for Research in Income and Wealth
1
VC 2015 International Association for Research in Income and Wealth
S90
Review of Income and WealthSeries 62, Supplement 1, August 2016DOI: 10.1111/roiw.12176
bs_bs_banner

Due to its particular history, the national identity of this country was con-structed based on the myth of an egalitarian, pacific, and white nation (e.g.,Putnam, 1999) in a predominantly non-white area dominated by high inequality,violence, and instability. The population in Costa Rica is, however, diverse as theresult of colonialism and the historical need for foreign workers, and presentsimportant inequalities along racial and ethnic lines. This was highlighted by therecent release of the 2011 Census, which gave greater visibility to ethnic/racialminorities in the country.
Complying with the requests from local ethnic organizations and followingmost recent international recommendations, the national statistical office hasincluded for the first time a question addressed to all Costa Ricans about theirethnic and racial self-identification. As a result, more than 11 percent of thepopulation of 4.3 million ascribed themselves to any of the racial/ethnic reportedminorities (mulattoes, blacks, and indigenous people). Another dimension of theethnic diversity is nationality, because there was a significant flow of immigrationinto the country by disadvantaged groups of people born in Nicaragua (6.7percent) and Panama (0.3 percent). This immigration flow involved people of anyrace or ethnicity but with significant numbers of mulattoes, blacks, and indigenouspeople.
The historical social disadvantages of indigenous and African descendantsacross Latin America and the Caribbean have been widely documented recentlyusing the limited statistical information available on ethnicity in the region (e.g.,Hall and Patrinos, 2006; Bello and Paixão, 2009; IACHR, 2011; Ñopo, 2012).These two groups are generally over-represented at low income and wellbeinglevels, and present poorer socioeconomic endowments (lower achieved education,higher unemployment, precarious low-paid jobs, and so on). Not surprisingly,both indigenous people and blacks are perceived amongst the most discriminatedpopulation groups in the region (Chong and Ñopo, 2007). Mulattoes and indig-enous people in Costa Rica have traits that do not differ much from the disad-vantages of these minorities in other Latin American and Caribbean countries, andthis disadvantage is shared by immigrants from Nicaragua and Panama. However,the black minority of Costa Rica is an outstanding case with some distinctivetraits. The particular history of West Indians (mostly Jamaicans) who settled onthe Caribbean coast of Costa Rica between the end of the nineteenth and thebeginning of the twentieth century makes them an interesting case for study. Theymade up a differentiated racial (black), ethnic (British Antillean) group that had tostruggle with serious discrimination in a predominantly Catholic, white/mestizo,and Hispanic country, and despite that, were able to achieve better education andmore qualified jobs than other population groups.
In the Latin American and Caribbean region, many studies have analyzed thenature of the ethnic and racial inequalities in labor market outcomes like earningsand the distribution of workers across occupations using Blinder–Oaxaca-typedecomposition techniques (see the revisions and comparative studies in Chong andÑopo, 2008; Atal et al., 2009; Gradín, 2012). These outcomes are associated to agreat extent with the poorer pre-market endowments of indigenous and blackworkers, especially education. The main case studied in Central America was thelower earnings of indigenous workers in Guatemala. The only studies of this type
Review of Income and Wealth 2015
© 2015 International Association for Research in Income and Wealth
2
Review of Income and Wealth, Series 62, Supplement 1, August 2016
VC 2015 International Association for Research in Income and Wealth
S91

in Costa Rica analyzed the earnings gap between Nicaraguan immigrant andnative workers (Gindling, 2009), and the occupational segregation of blacks(Gradín, 2012).
A smaller number of studies have focused on how racial and ethnic inequalityhas shaped the distribution of overall wellbeing among households (e.g., income,wealth, expenditure, living conditions). Examples of these are the studies of thehigher poverty of Afro-descendants in Brazil and indigenous people in Chile, andof the gap by skin color along the entire distribution of income in Brazil (Antónand Carrera, 2007; Gradín, 2009, 2014).
This paper contributes to filling this gap in the research on ethnicity and thedistribution of wellbeing in Costa Rica. Apart from the scarcity of these studies inCentral American countries, a number of reasons make Costa Rica a case thatdeserves special attention: its high diversity with the presence of indigenous people,African descendants, and immigrants from neighbor countries; the contrast of therelatively higher levels of equality and democracy, with the persistence of race andethnicity as a determinant of wellbeing; and the presence of a black populationwith relatively better than average socioeconomic background but in a discrimi-natory environment.
The aim of this paper is thus to investigate in detail the extent and the natureof inequalities in wellbeing (proxied here by a synthetic index of living conditions)across racial and ethnic lines in Costa Rica, using the 2011 Census, the databasewith the richest information for ethnicity. To identify the main factors explainingsuch racial and ethnic inequalities, we use regression-based counterfactual analy-sis. By comparing the actual difference with what remains when the minority isgiven the characteristics of the majority, we estimate the characteristics and coef-ficients effects of the gap in wellbeing between population groups. The character-istics effect provides an idea of how much of the differential in wellbeing isexplained by one group having better attributes (education, labor attachment,location, and so on) than the other. The coefficients effect quantifies the extent towhich these factors associate with a differential impact on wellbeing in each group(one group takes more advantage of or is less harmed by some attributes). Adetailed decomposition provides a quantification of the contribution of specificattributes to each of these effects. We undertake this analysis at the mean ofwellbeing (Blinder, 1973; Oaxaca, 1973) and then extend it to at different quantilesalong its distribution using a recent technique (Firpo et al., 2007, 2009).
The remainder of the paper is as follows. The next section provides a glimpseof the different population groups in Costa Rica. Section 3 briefly summarizes theliterature investigating the racial and ethnic gap of economic outcomes in LatinAmerica and the Caribbean. We present the methodology in Section 4, data andmain variables in Section 5, and discuss the empirical results in Section 6. The finalsection closes by summarizing the main conclusions.
2. Race and Ethnicity in Costa Rica
In this section, we describe the main Costa Rican racial/ethnic groups toclarify the context of the results presented below. The three main groups areEuropeans, Afro-descendants, and indigenous peoples, but as in the rest of Latin
Review of Income and Wealth 2015
© 2015 International Association for Research in Income and Wealth
3
Review of Income and Wealth, Series 62, Supplement 1, August 2016
VC 2015 International Association for Research in Income and Wealth
S92

America, miscegenation created a large population of mixed races, such as mesti-zos and mulattoes, of which the census only singles out the latter.
The oldest settlers in Costa Rica are eight indigenous populations (pueblos):Bribri, Brunca/Boruca, Cabécar, Chorotega, Huetar, Maleku/Guatuso, Ngöbe/Guaymí, and Teribe/Térraba. Their traditional territories or reservations are pro-tected under the 1977 Indigenous Act and are under the supervision of a publicorganization, the National Commission of Indian Affairs (Comisión Nacional deAsuntos Indígenas, CONAI). Costa Rica has also ratified the 1992 ILO Conven-tion No. 169 on indigenous rights, but still “continues to be one of the countrieswith the lowest level of constitutional recognition of indigenous rights in theregion” (IWGIA, 2011, p. 107). These legal instruments have not been effective inprotecting their cultural, political, and socioeconomic rights, and people of indig-enous ancestry are left behind all the other groups.
The largest concentration of indigenous people is found near the Panamanianborder, with the highest numbers in the cantons of Talamanca (14 percent) andBuenos Aires (13 percent). About one-third (34 percent) of the indigenous popu-lation lives across the 24 officially recognized indigenous territories, althoughanother significant group lives in nearby areas. For example, about 25 percent ofthem live in the same cantons but outside the reservations. Indigenous people in ornear reservations are more likely to preserve their native language and culturaltraits and live in harsher conditions. Not all indigenous people were born in CostaRica. One out of six indigenous people was born abroad, mainly in Nicaragua(especially Miskito, not identified as such in the Census) and Panama (mainly fromthe binational group of Ngöbe).1 There is also an increasing non-indigenouspopulation settling in traditional indigenous territories (26 percent of their popu-lation in 2011), a source of great conflict (e.g., IWGIA, 2013).
There is an increasing degree of alienation among the indigenous population.About one-quarter of the population claiming indigenous ethnicity does not iden-tify with any pueblo. This proportion is insignificant in the reservations; it is about18 percent in the areas near reservations, but rises to 50 percent in the rest of thecountry. It is possible that this growing alienation results in an underestimation ofthe actual indigenous population, if some people of this ancestry decline to claimthis ethnicity and are included as mestizos or even mulattoes, for example.
Costa Rica was a Spanish colony between the early 1500s until its indepen-dence in the early 1800s (as part of the Central American federation of nations).Therefore, the first European settlers were Spanish. However, it was a poor,peripheral colony and was scarcely populated by Europeans when the republic wasborn.
Later immigration of Europeans and mestizos from neighboring countrieshelped to make up the main ethnic group of the country. The country promotedEuropean immigration after independence in the context of whitening policies thatalso became popular in other countries in the region. At the same time, immigra-tion of Chinese and Africans, among other non-white groups, was banned in 1862.
1A detailed description of the socioeconomic characteristics of the indigenous population in CostaRica can be found in Solano (2004) and UNDP (2012), based on the 2000 Census; and Fuentes (2013),based on the 2011 Census.
Review of Income and Wealth 2015
© 2015 International Association for Research in Income and Wealth
4
Review of Income and Wealth, Series 62, Supplement 1, August 2016
VC 2015 International Association for Research in Income and Wealth
S93

In the context of the convulsive 1980s, immigrants and refugees from other CentralAmerican countries and Colombia started to arrive in the country, with Nicara-guans making up the largest group. The immigration flows and the characteristicsof Nicaraguans in Costa Rica have been described in Marquette (2006) based onthe 2000 Census; she highlighted their higher economic activity, and their segre-gation into low status, low paying occupations, and higher poverty levels, whilenegative perceptions about this community predominate in the public debate.Furthermore, Smith-Castro (2009) reported that Nicaraguan immigrants claimedto have experienced abuse and disdain because of their nationality. Gindling(2009) documented the large gap in earnings between Nicaraguan immigrants andthe native-born population.
Most Afro-Costa Ricans arrived in two different waves.2 A first group ofpeople of African descent came as slaves during the Spanish colony, settlingespecially in different plantations in Matina (Caribbean coast), Nicoya (Pacificcoast), as well as in the central valley villages (such as in Cartago). Due to the lackof large plantations, Costa Rica was never an outstanding slave economy likeCuba or Brazil, and the number of slaves was relatively small. Slavery was abol-ished in 1824. There was an intense miscegenation and this population was even-tually assimilated into the predominant culture (e.g., Murillo, 1999). As aconsequence, their descendants often do not accept their African ancestry, and itis reasonable to expect these people are mostly included as mulatto in the currentracial/ethnic classification. It is possible, however, that this category could havebeen interpreted by some people as darker skin color, rather than mixed white–black race.
A second wave of Afro-descendants came from the Caribbean region due toan exception to the bans imposed on non-white immigration. The most importantinflow started to arrive in Costa Rica in 1872 for the construction of the railwayconnecting San José, in the central valley, with Limón harbor on the Caribbeancoast, to open a new route for coffee exports. People came from several Caribbeancountries until the 1920s, especially from Jamaica, to work not only in the railwaycompany but also in the harbor and in banana and cocoa plantations. The wholeeconomic activity of the region was ruled by the U.S.-based United Fruit Corpo-ration (UFCO).
This immigration created a solid, distinct, Antillean ethnic group—Protestantand Anglophone in a predominantly Hispanic and Catholic country. They camewith higher literacy due to the fact that basic general education started earlier inthe British West Indies. For decades, they also benefited from a specific privateeducational system (English schools) supported by their fraternity associations,protestant church denominations, and UFCO. As a consequence, their educa-tional level was above that for most Costa Ricans at the time, they developed asense of education as a way out of poverty, and they filled better jobs thanHispanics in the area (around the activities of the English-speaking UFCO). At thetime, most Costa Ricans showed strong racial and xenophobic prejudices toward
2See Meléndez and Duncan (2012) for a detailed history of Afro-Costa Ricans. A description ofthis group based on 2000 and 2011 censuses can be found in Putnam (2004) and Campbell (2012),respectively.
Review of Income and Wealth 2015
© 2015 International Association for Research in Income and Wealth
5
Review of Income and Wealth, Series 62, Supplement 1, August 2016
VC 2015 International Association for Research in Income and Wealth
S94

Afro-Caribbeans, whom they saw as foreigners who often took the best jobs in thearea. As a consequence, blacks had limited geographical mobility (e.g., they couldnot leave Limón for long; they were banned in 1934 from working on the SouthPacific banana plantations when UFCO moved its activities there due to Panamadisease). Immigrants during the first decades did not make much effort to integratein the host society, expecting to return soon to their countries of origin. They didnot obtain Costa Rican citizenship until the 1950s, right after the short civil war.
The economy in Limón stagnated after the collapse of banana plantations onthe Caribbean coast, and once the limitations of mobility were removed, manyAfro-Caribbeans moved to the more prosperous central valley around San José,looking for better job opportunities. There was also an intense migration to theU.S. or other countries in the area that significantly decimated the population,while a growing Hispanic population settled in Limón and became the majority ofthe population there.
Despite the existence of anti-discriminatory legislation (e.g., Minott, 2005),this culturally differentiated Afro-Caribbean community lacks any official recog-nition from the state (e.g., Rangel, 2009). It also still faces negative prejudices froma significant part of the population. For example, 27 percent of interviewed CostaRicans agreed in a survey that Afro-descendants are more aggressive and danger-ous than the rest of the nation; 38 percent of these claimed this was determinedbiologically (Sandoval et al., 2010).
3. Previous Research on the Nature of Race and Ethnicity Inequality inCosta Rica and Latin America
The existence of large wage differentials by race and ethnicity has been welldocumented and investigated in several Latin American and Caribbean countries.Using the common Blinder–Oaxaca approach or its extensions, a number ofstudies have shown that a large part of these wage gaps was related to existingdifferentials in pre-market characteristics by group, especially in attained educa-tion (e.g., Chong and Ñopo, 2008; Atal et al., 2009). They also found evidence thata substantial part of the wage gaps remained unexplained after controlling forworkers’ characteristics due to either differences in the quality of relevant endow-ments, such as education, or prevailing discrimination in the labor market. InCentral America, the nature of ethnic wage differentials has been widely studiedonly for indigenous people in Guatemala (Patrinos, 2000; de Ferranti et al., 2004;Chong and Ñopo, 2008; Cunningham and Jacobsen, 2008; Atal et al., 2009;Vásquez, 2011; Ñopo, 2012).
Gindling (2009) also showed that Nicaraguans in Costa Rica have earningslower than those of native-born workers. In analyzing the causes, he concludedthat this could be the result of a large gap in attained education, as well as of thelarge differential in returns to years of schooling. The gap that could be explainedby education might be partially offset by the impact of the better unobservedcharacteristics of immigrants (captured by a large and negative intercept effect).Furthermore, a few studies have also documented occupational segregation ofAfro-descendants in Brazil (e.g., King, 2009; Salardi, 2014). Gradín (2012) com-pared the occupational segregation of blacks in Costa Rica and other various
Review of Income and Wealth 2015
© 2015 International Association for Research in Income and Wealth
6
Review of Income and Wealth, Series 62, Supplement 1, August 2016
VC 2015 International Association for Research in Income and Wealth
S95

countries (Brazil, Cuba, Ecuador, and Puerto Rico) using census data circa 2000,analyzing to what extent it was the result of differences in education and otherworkers characteristics, or of labor markets being more segregative. Blacks inCosta Rica showed relatively low levels of segregation across the major occupa-tional categories (1 digit) but significantly higher levels if a more detailed classifi-cation was used instead. Black Costa-Rican women tended to work in relativelymore-skilled occupations compared with the rest of the population. A particularresult for Costa Rica was that, unlike other countries, the interethnic difference inthe observed workers’ characteristics (i.e., education and province of residence)did not explain the levels of segregation. In fact, segregation was higher, notsmaller, after controlling for workers’ characteristics.
Regarding how racial and ethnic inequality affected the distribution of well-being among households, Gradín (2009) has shown that observed characteristicsaccounted for almost 88 percent of the higher poverty levels of Afro-descendantscompared with whites in Brazil, mostly driven by their lower years of schooling,but also by the larger number of dependants in their households, and by blacksbeing overrepresented in the poorest areas of the country. Gradín (2014) has alsoshown, in a comparative study with the U.S. and South Africa, that the white–black gap in Brazil was smaller for higher income quantiles, with an increasing roleof education and decreasing importance of location in driving those differentials.Along the same lines, the lower level of education attained by household heads andthe lower attachment of adults to the labor market explained more than a half ofthe higher poverty rates of the indigenous populations in Chile (Antón andCarrera, 2007). There is no evidence of this for Central American countries.
4. Methodology
4.1. Composite Index of Wellbeing
Let c1, . . . , cQ be a set of categorical variables describing the wellbeing of apopulation of size N, where cq is coded with consecutive integers 1, . . . , nq. Let Zq
be the N · nq binary indicator matrix associated with cq, with Zij
q = 1 if and only ifthe q-th categorical variable for the i-th individual ciq = j. Let Z = (Z1, . . . , ZQ) bethe N · J indicator matrix of the set of variables, where J = n1 + . . . + nQ is the totalnumber of categories.
For each variable cq we estimate coordinates s sq
n
q
q1 , ,… using the firstextracted dimension with Multiple Correspondence Analysis (MCA). Lets s s Q= 1, ,… and s s sQ= 1, ,… be, respectively, the vectors with the highest andlowest scores associated with the Q categorical variables. Given that higher scoresare associated here with lower wellbeing, s and s represent the worst and bestpossible profiles in terms of wellbeing.
We define yi to be a wellbeing composite index that summarizes the livingconditions or wealth profile for the i-th person as a weighted sum of the categoriesfor this individual, where the weights are based on coordinates and represent therelative marginal contribution to the individual wellbeing of being in each cat-egory, compared with being in the worst category, normalized by the maximumpossible contribution. Thus, this index is just a linear transformation of the
Review of Income and Wealth 2015
© 2015 International Association for Research in Income and Wealth
7
Review of Income and Wealth, Series 62, Supplement 1, August 2016
VC 2015 International Association for Research in Income and Wealth
S96

predicted value, and is normalized here to increase in wellbeing and to rangebetween 0, the value corresponding to the worst possible profile, and 1, that for thebest possible profile:
(1) y Z w i N ws s
s si ij
q
j
q
j
n
q
Q
j
q
q
j
q
q q
q
Q
q= = =−
−( )==
=
∑∑∑11
1
1, , . . , ; .with
4.2. Decomposing the Gap in Wellbeing: The Mean
To obtain a decomposition of the gap in wellbeing between whites/mestizosand racial/ethnic minorities in Costa Rica (and between native-born and immi-grants), we use the well-known regression-based Blinder (1973) and Oaxaca (1973)approach. The original approach was applied to decompose intergroup differencesin the average values of wages into the part that was explained by characteristicsand the part that remained unexplained. Later researchers extended the approachto deal with gaps at different quantiles of the distribution of the variable ofinterest. Among the various extensions, we here follow the one proposed by Firpoet al. (2007, 2009) based on unconditional quantile regressions.
We split the population into two groups. Let yg be the vector indicating thelevel of wellbeing index for members of group g, where g = 0 indicates the referencegroup (white/mestizo in the case of race/ethnicity; people born in Costa Rica in thecase of country of birth), and g = 1 the target group (minority). We first estimateseparately for each group the level of wellbeing as a function of a vectorX x xg g
K
g= ( )1 , ,… of a household’s characteristics that might affect wellbeing:ˆ ˆy Xg g g= β , where β g is the associated OLS vector of estimated coefficients.
Given that wellbeing is defined by the characteristics of the dwelling and allexplanatory variables are collected at the household level, we estimated robuststandard errors, taking into account any correlation between observations withinthe same sample cluster (here the dwelling), while assuming independence acrossclusters (see Cappellari and Jenkins, 2004). A well-known property of theunconditional mean is that it equals the expectation (over X) of the conditionalmean, which can be estimated by OLS. Thus, the average wellbeing in group g,y g, is equal to the average predicted wellbeing for this group (with popula-tion Ng):
(2) yN
y Xg
g i
g
i
N g gg
= ==∑1
1ˆ ˆ .β
As a result, it is easy to produce an aggregate and a detailed decomposition of theinter-ethnic gap in wellbeing. In the counterfactual average wellbeing distributionX 0 1β , we gave minorities the characteristics (on average) of the reference groupwhile keeping their own estimated coefficients (the impact of characteristics onwellbeing). By adding and subtracting the counterfactual and rearranging terms,we can rewrite the differential in average wellbeing between the majority and theminority as the sum of the aggregate characteristics effect (gap explained byshifting characteristics valued at the coefficients of the target group) and the
Review of Income and Wealth 2015
© 2015 International Association for Research in Income and Wealth
8
Review of Income and Wealth, Series 62, Supplement 1, August 2016
VC 2015 International Association for Research in Income and Wealth
S97

aggregate coefficients effect (unexplained gap due to characteristics having adifferent impact for each group):
(3) y y X X X X X0 1 0 0 1 1 0 1 1 0 0 1− = − = −( ) + −( )ˆ ˆ ˆ ˆ ˆ .β β β β β
Given the linearity of the regressions, we can estimate the detaileddecomposition (the evaluation of the individual contribution of each variable xk
(k = 1, . . . , K) to the characteristics and coefficients effects) respectively asW y y x xk
X
k k k
Δ 0 1 0 1 1− = −( )( ) β and W y y xk k k k
Δβ β β0 1 0 0 1− = −( )( ) ˆ ˆ . Thus, the individualeffects sum up the corresponding aggregate effects.
A well-known problem that needs to be addressed is that the detailed decom-position of the coefficients effect suffers from identification difficulties (Oaxacaand Ransom, 1999). This is because the contribution of a dummy variable to thiseffect will vary with the choice of the reference group, while the contribution ofcontinuous variables will vary with affine transformations that involve a locationparameter. As pointed out by Fortin et al. (2011), there is no general solution tothis problem and all solutions proposed in the literature are ad-hoc. We herefollow Yun (2005, 2008) and use normalized coefficients for categorical variables,such that the sum of the coefficients of each set of dummies is 1 (the only solutionfor continuous variables is to rely on specifications that are widely accepted in theliterature). However, for the above reasons, the estimates for the detailed decom-position of the coefficients effect should be taken with caution.
4.3. Decomposing the Gap in Wellbeing: Quantiles
The Blinder–Oaxaca approach implies the decomposition of the mean differ-ential. However, it is important to ask how much the pattern of differences inwellbeing between two given groups varies along its whole distribution. One wayto achieve that is to produce a similar decomposition at different quantiles of thewellbeing distribution. However, the decomposition of the gap in quantiles istechnically more complicated than the decomposition at the mean. The law ofiterated expectations that holds for the mean, does not generally hold for quantilesqτ. Then they cannot be estimated using quantile regressions (with parameters βτ):qτ(y) ≠ E(qτ(y|X)) = E(X)βτ (e.g., Fortin et al., 2011).
In order to evaluate the impact of changes in the distribution of householdattributes on different quantiles of the unconditional (marginal) distribution ofwellbeing, we used an extension of the Blinder–Oaxaca approach (Firpo et al.,2007, 2009). This method produces the decomposition for the gap between theunconditional τ-th quantiles of the reference and target groups, q qτ τ
0 1− , using alinear approximation for the non-linear quantile function based on the concept of“influence function” of a distributional statistic (the quantile in our case). Theinfluence function for the τ-th quantile of the wellbeing distribution y, IF(y; qτ), isa statistical tool used for robustness analysis, measuring the influence of eachindividual observation of y on the quantile function qτ:
(4) IF y q y q f q; ,τ τ ττ( ) = − ≤( )[ ] ( )1
Review of Income and Wealth 2015
© 2015 International Association for Research in Income and Wealth
9
Review of Income and Wealth, Series 62, Supplement 1, August 2016
VC 2015 International Association for Research in Income and Wealth
S98

where 1() is an indicator function that takes the value 1 if the specified conditionis satisfied and 0 otherwise. Its expectation is zero. The corresponding recenteredinfluence function, RIF(y; qτ), is just obtained by adding the quantile to IF(y; qτ),so that its expectation is qτ:
(5) RIF y q q IF y q; ; .τ τ τ( ) = + ( )
The simplest version of this approach assumes that the conditional expectation ofthe RIF(y; qτ) can be modeled as a linear function of the explanatory variables, X,such that its coefficients can be estimated by OLS (where γ indicates thecorresponding vector of coefficients):
(6) q E RIF y q X Xτ τ γ= ( )( ) =; .
Note that the RIF(y; qτ) is just a linear transformation of an indicator variable thattakes a value of 1 or 0 depending on whether the observation falls below or aboveqτ. The intuition of this approach is that we first estimate a model for theproportion of people below a given quantile of wellbeing using a linear probabilitymodel. Then, we estimate the counterfactual proportion in which we replace theobserved distribution by its counterfactual. Finally, we estimate the counterfactualquantile under the assumption that the relationship between counterfactualproportions and counterfactual quantiles is locally linear (which implies dividingby the corresponding probability density function). The implication of this is thatwe can obtain the decomposition for the gap in quantiles just using aBlinder–Oaxaca decomposition in which the dependent variable y is replaced byRIF(y; qτ) in the OLS regressions:
(7) RIF y q RIF y q X X X X X; ;τ τ τ τ τ τ τγ γ γ γ γ( ) − ( ) = − = −( ) + −0 1 0 0 1 1 0 1 1 0 0ˆ ˆ ˆ ˆ ˆ11( ).
Given that E RIF y q RIF y q q; ;τ τ τ( )[ ] = ( ) = , then we get:
(8) q q X X Xτ τ τ τ τγ γ γ0 1 0 1 1 0 0 1− = −( ) + −( )ˆ ˆ ˆ .
The corresponding aggregate explained and unexplained effects areW q q X XXΔ
τ τ τγ0 1 0 1 1− = −( )( ) ˆ and W q q XΔγτ τ τ τγ γ0 1 0 1 0− = −( )( ) ˆ ˆ .
Similarly to the previous case, we estimate the detailed effects using subsets ofcharacteristics and their corresponding coefficients:W q q x xk
X
k k k
Δτ τ τγ0 1 0 1 1− = −( )( ) ˆ
and W q q xk k k k
Δγτ τ τ τγ γ0 1 0 1 0− = −( )( ) ˆ ˆ .3 Repeating the procedure for different quantiles
(i.e., 10th, 25th, 50th, 75th, and 90th), we are able to explain the ethnic gap alongthe entire distribution of wellbeing.
3For the computations we used the RIFREG (Firpo et al., 2009) and the OAXACA (B. Jann) Statamodules.
Review of Income and Wealth 2015
© 2015 International Association for Research in Income and Wealth
10
Review of Income and Wealth, Series 62, Supplement 1, August 2016
VC 2015 International Association for Research in Income and Wealth
S99

4.4. Decomposing the Gap in Wellbeing: Interpretation
Most regression-based decomposition techniques have been initially formu-lated and widely used in the context of the analysis of wage differentials. In thisliterature, the explained effect is interpreted as a wage differential due to (pre-market) inter-ethnic differences in productivity, and thus it does not imply directwage discrimination. The center of the analysis is usually the unexplained part. Ifproductivity is properly measured it would reflect the neat effect (discrimination)of ethnicity on wages. Otherwise, it might also result from unobserved productiv-ity. It is important to note some differences when it comes to analyzing wellbeing.
In the context of wellbeing, we are not looking at the existence of a particularform of discrimination. We rather look at the overall social or economic disadvan-tage of one group with respect to another and try to identify its potential sources.On the one hand, this economic disadvantage can be the result of one group havingmore prevalence of those characteristics associated with lower wellbeing such asless education, living in inaccessible rural areas, or having more children. These“poorer” endowments are clearly identified by the explained effect which is themain effect of interest here, unlike the case of wage differentials. For this reason, inour case we give the ethnic minority the characteristics of the reference group,instead of its coefficients, which is the most common practice in the analysis of wagedifferentials. These characteristics we control for, should be all those associatedwith wellbeing, whether related with productivity or not. In fact, if the availableinformation were sufficiently rich, we would ideally explain the entire gap inwellbeing (with none or a minimum residual). On the other hand, the disadvantageof ethnic minorities could be the result of some attributes having different impli-cations in terms of wellbeing. This is captured by the coefficients or unexplainedeffect that can still be interpreted as the “treatment effect” of race/ethnicity onwellbeing, after having controlled for the difference in observable attributes.
Discrimination might be present in either effect. In the explained effect, it ispresent when the poorer characteristics of ethnic minorities are the result not ofthem sharing different cultural values, but of them receiving less attention in theprovision of public goods or social benefits by the government. The same appliesif they invest less in human capital after anticipating discrimination in the labormarket, or if the other groups reject to hire them, or segregate them into low-paidoccupations. Discrimination can also appear in the coefficients effect associatedwith the coefficients of education and labor market variables, if there is wagediscrimination, or systematic differences in the quality of attained education ofnative-born minorities. The approach used here, however, does not allow us toassess the ultimate reasons for these poorer endowments and differentials inreturns, for which one needs to rely on more specific studies (which are scarce forthe case of Costa Rica).
5. Data and Variables
5.1. Data, Wellbeing, and Race/Ethnicity
The database used in this study is a public-use sample extracted from the 2011decennial Census (X Censo Nacional de Población y Vivienda) undertaken by the
Review of Income and Wealth 2015
© 2015 International Association for Research in Income and Wealth
11
Review of Income and Wealth, Series 62, Supplement 1, August 2016
VC 2015 International Association for Research in Income and Wealth
S100

Instituto Nacional de Estadísticas y Censos (INEC), which accounts for about 10percent of Costa Rica’s population living in private households (427,972 observa-tions). The census does not provide any information about income or expenditure.For that reason, we computed a composite index of wealth for measuring wellbe-ing or economic status, as explained in Section 4.1. The variables we used forcomputing this index referred to the existence of healthcare insurance, availableutilities, and basic dwelling characteristics (type, ownership, predominant materi-als, conditions, and equipment). The variables used to construct the index and theestimated scores and weights for each category are reported in the online Appendix(Table A1). This first MCA dimension used to construct the index explains 61.5percent of the total variability (inertia). As expected, the wellbeing index waspositively and highly correlated with the log of per capita household net income:about 60 percent using the 2011 Household National Survey (Encuesta Nacional de
Hogares), with similar variables. Correlation with income is not higher becausethere are not many attributes that allow us to identify the distance between themost affluent individuals properly. The advantage of the 2011 Census with respectto previous data sources is that it provides the richest information on race andethnicity. It also provides the largest sample size, allowing a more detailed analysisof ethnic/racial groups.
The decision to include (and how) the racial/ethnic dimension in statistics isa controversial issue in most Latin American countries. Admitting a diversity ofethnicities and cultures still generates strong resistance in societies whosenational identities were typically constructed on the basis of being composed byhomogenous populations (mestizo in most cases; whites in the case of CostaRica, as in some South American countries). Even when some diversity isaccepted, the idea of racial democracy which denies the racial/ethnic dimensionof social inequalities is also quite common in the region, and Costa Rica is aprominent example due to its higher equality levels. This has generally lead tothe invisibility of ethnic minorities, mostly Afro-descendants and indigenouspeople, in modern statistics all over the region (with the outstanding exception ofBrazil), although the situation is changing rapidly due to increasing concernabout making minorities visible as a first step to recognize the diversity andovercome discrimination. Antón and Del Popolo (2009), Lennox and Minott(2011), or Cruces et al. (2012) provide a thorough discussion of the visibility ofAfro-descendants in Latin American statistics and the recent debate on theissue.
Along these lines, Costa Rican statistics did not recognize minorities untilvery recently. As in other countries, the earliest censuses (between 1864 and 1950)in Costa Rica classified the population on the basis of race. After omitting race/ethnicity in the 1963, 1973, and 1984 Censuses, the authorities first reintroduced itin the 2000 Census, which included a question about self-identification with ethnicminorities (culture): black/African descents; Chinese; indigenous people; none. Butthere was no explicit category either for whites or for people of mixed race (such asmestizos or mulattoes). Some specific questions addressed to indigenous peoplewere restricted to indigenous territories. The authorities’ interest was to identifyminorities rather than allowing any Costa Rican to self-identify and, as a result,the proportion of ethnic minorities (3.8 percent) was underestimated, compared to
Review of Income and Wealth 2015
© 2015 International Association for Research in Income and Wealth
12
Review of Income and Wealth, Series 62, Supplement 1, August 2016
VC 2015 International Association for Research in Income and Wealth
S101

the 2011 Census (11.2 percent) when the question was extended to embrace therace or ethnicity of all Costa Ricans. Additionally, the Household Survey ofMultiple Purposes (Encuesta de Hogares de Propósitos Múltiples) in 2002 includeda racial question asking whether any member of the household was indigenous,black, mulatto, Chinese, or other. About 1.3 percent was indigenous, 1.1 percentblack, 4.1 percent mulatto, and 0.2 percent Chinese (the remaining 93 percent wasincluded in the “other” category).
Several international organizations, particularly the Economic Commissionfor Latin America and the Caribbean (ECLAC), strongly recommended that allLatin American countries undertaking the 2010 round of national censuses shouldinclude self-identification of all the population according to their ethnicity, aconcept generally preferred over race (e.g., ECLAC, 2009). Costa Rica compliedwith these recommendations in the 2011 Census. National ethnic organizationshave long claimed for this, and INEC agreed with them on the main questions toinclude (e.g., López, 2013).
The Census first asked each individual about her indigenous condition, and ifthe answer was positive, about the specific people (pueblo) and whether or not therespondent spoke any indigenous language. For non-indigenous people, there wasa question about race/ethnicity asking whether the respondents considered them-selves in the following categories: (i) black or Afro-descendant, (ii) mulatto, (iii)Chinese, (iv) white or mestizo, (v) other, or (vi) none. This implied a debatabletreatment of mixed-race people: blacks and mulattoes are collected in separatecategories, while whites and mestizos are included in the same category. It alsoneglects the linguistic dimension in the case of Caribbean blacks—who mightspeak (Creole) English.
There were some criticisms from ethnic groups regarding the implementationof the census in the field, especially referring to the lack of sufficient training forinterviewers and advertisements to make citizens aware of the ethnic/racial self-identification (see, e.g., Campbell, 2012). There is, however, a great consensusamong analysts that this round implied a great improvement over the way theethnic/racial information was collected previously.
As a result, more than 11 percent of a population of 4.3 million ascribedthemselves to any of the racial/ethnic minorities of the country. The largest minor-ity, 334,437 (7.8 percent) Costa Ricans, is the population of (possible) Africanancestry, a result of colonization and immigration flows. More specifically, 45,228(1.1 percent) Costa Ricans considered themselves as blacks or of African descent,and 289,209 (6.7 percent) as mulattoes. The second-largest minority in the country(104,143; 2.4 percent) is made up of the different indigenous peoples that histori-cally inhabited the region (including neighboring countries) before the arrival ofEuropeans. There is also a small and affluent Chinese minority (9170; 0.2 percent),and 36,334 (0.8 percent) Costa Ricans included themselves in the “other race/ethnicity” category. The majority of the population (84 percent) ascribed them-selves to the mixed white/mestizo category, while the remaining 5 percent refusedto identify with any of these categories.
There is a common practice, especially in Brazil, of pooling blacks (preto) andpeople of mixed race with presumable African ancestry (pardo) in a wider categoryof Afro-descendants because the lines between both groups are unclear and the
Review of Income and Wealth 2015
© 2015 International Association for Research in Income and Wealth
13
Review of Income and Wealth, Series 62, Supplement 1, August 2016
VC 2015 International Association for Research in Income and Wealth
S102

choice might be influenced by the degree of ethnic self-esteem, the environment,and individual characteristics (e.g., Telles, 2002). This is consistent with the claimfor higher statistical visibility pursued by the emerging black movement in LatinAmerica. However, Costa Rica is a particular case because blacks and mulattoesstrongly differ in their characteristics, as we will discuss below, for reasons forwhich we will undertake a separate analysis of both groups in most of the empiricalanalysis. Similarly, it is reasonable to think that the choice between indigenous andwhite/mestizo might also depend on household characteristics and assimilation.However, in this case no pooling is possible because of the lack of a separatecategory for mestizo.
The census questionnaire also asked about the country of birth, whichallows us to identify first-generation immigrants from different countries, ofwhich we single out two disadvantaged groups of immigrants: people born inNicaragua (287,766; 6.7 percent) and Panama (11,250; 0.3 percent). This immi-gration flow involved people of any race or ethnicity but with significantnumbers of mulattoes, blacks, and indigenous people. Other, more affluentgroups come from the U.S. and Colombia (about 16,000 of each nationality),among other countries. In this aspect, Costa Rica contrasts with other countriesin the Central American region that stand out for sending migrants, mostly tothe U.S.
5.2. Explanatory Variables
The variables explaining the race/ethnicity gap should include all thosefactors that might affect wellbeing. This set of variables is necessarily richer thanthose usually considered in (Mincerian) earnings regressions because wellbeingdepends on all sources of permanent income and on needs, and is determined atthe household level. Thus, it must consider information on location, demo-graphic variables such as the size and composition of households, education, andlabor-related variables from all household members. Based on that, we includedseveral explanatory variables that might affect the wellbeing in a household,because they affect either household needs (e.g., the number and age of house-hold members) or the ability of its members to raise income from any source(e.g., human capital and labor related variables which are common in Mincerianearnings equations). Some variables, such as the presence of children or location,could affect both.
We measured location by a dummy variable indicating whether the area isurban or rural and by the region of residence (Great Metropolitan Area, Rest ofCentral Region, Chorotega, Pacific Central, Brunca, Atlantic Huetar, and North-ern Huetar). We also considered the number of children (0–15 years old) in thehousehold, and householder’s age (less than 35, 35–50, 51–64, 65 or more), sex,and immigration status. This includes information about householder birthplace(same canton, another canton, Nicaragua, Panama, rest of Central America, U.S.or Canada, another country), place of residence five years ago (same canton,another canton, another country), and whether the household is sendingremittances abroad. In addition, we included the achieved level of education of the
Review of Income and Wealth 2015
© 2015 International Association for Research in Income and Wealth
14
Review of Income and Wealth, Series 62, Supplement 1, August 2016
VC 2015 International Association for Research in Income and Wealth
S103

household head (none, primary, high school, and college) and the percentage of alladults in the household at each education level. As usual, there is no informationthat allows us to capture differences in the quality of education. Labor marketperformance includes the householder’s labor status (not in the labor force, unem-ployed, and occupation and industry at 1 digit disaggregation), the percentages ofadults employed and unemployed, and a dummy indicating whether the householdreceives or does not receive remittances from abroad. Unfortunately, there is noinformation on the intensity of labor market attachment such as the number ofhours or weeks worked. In the case of the analysis by country of birth, all variablesare the same, except that the head of the household’s immigration status isreplaced by individual race (black or mulatto, white or mestizo, indigenous, orother).
6. Results
6.1. Wellbeing, Race, and Ethnicity in Costa Rica
The values of the normalized wellbeing index estimated at different pointsof the distribution and for different partitions of the population are reported inthe Appendix. The average value of the index for the population is 0.75; that is,the average Costa Rican has a weighted wellbeing that is about three-quartersof the best possible profile, given the set of categorical variables we used todescribe basic living conditions in the country. The values have an importantvariability: for example, it is 0.60 and 0.89 for the 10th and 90th percentiles,respectively.
The distribution of the index by characteristics follows the pattern weexpected. Wellbeing is higher (at any quantile) in urban areas, in the centralprovinces (i.e., San José, Heredia, or Cartago), and for people at least 25 years oldwith a college degree or with a white-collar job. On the contrary, it is lower in ruralareas, in peripheral provinces (Limón, Puntarenas, and Guanacaste), for peoplewithout any formal education, and for those working in blue-collar and agrarianoccupations.
There is a significant gap regarding ethnicity and country of birth. Figures 1and 2 make this clear: they display the adaptive Gaussian kernel densities of thewellbeing index for different population groups in Costa Rica. Figure 1a demon-strates that indigenous people stand out as generally showing the lowest levels ofwellbeing (0.62 on average). It is important to note that we constructed thewellbeing index for the country as a whole and based on objective attributes. Thus,we associate living in traditional dwellings (constructed with natural materials,lack of domestic appliances, and so on) with severely poor living conditions. In thecase of indigenous populations, this might also reflect the preservation of theircultural values. Using a unique index to judge wellbeing in two population groupswith different cultures and social values is always problematic.
As Figure 1b highlights, there is also a large heterogeneity among indigenouspeople depending on whether they live on reservations (the lowest levels), in thenearby areas (outside the reservation but in cantons with a reservation), or inthe rest of the country (with the highest wellbeing). On the opposite end of the
Review of Income and Wealth 2015
© 2015 International Association for Research in Income and Wealth
15
Review of Income and Wealth, Series 62, Supplement 1, August 2016
VC 2015 International Association for Research in Income and Wealth
S104

spectrum, a small group of affluent Chinese concentrate at the highest levels ofwellbeing among all population groups, followed by whites/mestizos, and thenclosely by blacks/Africans. Mulattoes are somewhere in between both extremes.The wellbeing of Afro-descendants (black and mulatto) is determined by that ofthe largest group, mulattoes.
Given the particular history of blacks in Costa Rica discussed above, a moredetailed look at the distribution of wellbeing in the Limón province is of particularinterest. Figure 2a provides a summary of this information. Blacks in this generallypoor province stand out as sharing the highest wellbeing, while there is almost nodistinction in the distribution of mulattoes and whites/mestizos. Indigenouspeople, however, show no significant difference with their relative position for thewhole country, because this is one of the main indigenous areas.
Similarly, as shown in Figure 2b (and in the Appendix), there is a large gap inwellbeing between immigrants from Panama and Nicaragua compared with those
dens
ity
0 0.1 0.2 0.3 0.4 0.5wellbeing indicator
White/mestizoIndigenous
Black/AfricanOutside Nearby Inside
MulattoChinese
0.6 0.7 0.8 0.9 10
0.51
1.52
2.53
3.54
4.55
5.56
6.57
dens
ity
0 0.1 0.2 0.3 0.4 0.5wellbeing indicator
0.6 0.7 0.8 0.9 10
0.51
1.52
2.53
3.54
4.55
5.56
6.57
Figure 1. Wellbeing Distribution in Costa Rica
Note: Panel B: outside, inside or nearby (same canton) indigenous territories in Costa Rica.Source: Own construction based on 2011 Census.
White/mestizo Black/AfricanMulatto Indigenous Native Nicaragua Panama Other
dens
ity
0 0.1 0.2 0.3 0.4 0.5wellbeing indicator
0.6 0.7 0.8 0.9 1
00.5
11.5
22.5
33.5
44.5
55.5
66.5
7
dens
ity
0 0.1 0.2 0.3 0.4 0.5wellbeing indicator
0.6 0.7 0.8 0.9 1
00.5
11.5
22.5
33.5
44.5
55.5
66.5
7
Figure 2. Wellbeing Distribution in Costa Rica
Source: Own construction based on 2011 Census.
Review of Income and Wealth 2015
© 2015 International Association for Research in Income and Wealth
16
Review of Income and Wealth, Series 62, Supplement 1, August 2016
VC 2015 International Association for Research in Income and Wealth
S105

born in Costa Rica and immigrants from other countries. As mentioned previ-ously, there is a strong relationship between the gaps in Figures 1a and 2b, as manyNicaraguan and Panamanian immigrants are indigenous or Afro-descendants.More specifically, 44 percent of immigrants from Panama are indigenous (but only2 percent from Nicaragua), while 16 percent of immigrants from Nicaragua aremulatto, and nearly 2 percent are black. Similarly, 7 percent of immigrants fromPanama are mulatto and 5 are percent black. The other side of this picture is thatnearly 11 percent of blacks and 15 percent of mulattoes in Costa Rica are born inNicaragua, and 11 percent of indigenous people are either from this nationality orfrom Panama.
Understanding the nature of these differences based on race/ethnicity andcountry of birth is the aim of this section, for which we will use the decompositiontechniques described above. The main aim is to find the extent to which thesedifferences are explained by the different composition of ethnic groups’ character-istics such as education, location, performance in the labor market, and so on.Otherwise, it could be that a given characteristic has different implications acrossethnic groups in terms of attained wellbeing.
6.2. Explaining the Gap in Wellbeing of Mulattoes and Indigenous People
We display in Table 1 the results of the aggregate and detailed decompositionof the gap in wellbeing between whites/mestizos, and indigenous people and mulat-toes, for the mean and for different quantiles of the wellbeing distribution (10th,25th, 50th, 75th, and 90th).4 The observed gap with whites/mestizos is sharplydecreasing with the level of wellbeing in the case of the indigenous people, while itis stable up to the median and then decreasing in the case of mulattoes. In acomparative exercise for the black–white gap in income, Gradín (2014) showedthat Brazil, the U.S., and South Africa all presented increasing gaps in absoluteterms along the income distribution, but with different distributional patternswhen the gaps were expressed as proportions of whites’ income: decreasing, flat,and increasing, respectively. In the case of Costa Rica, the fact that the gaps arelarger at the bottom of the distribution might be associated with the index ofwellbeing being constructed using information about basic utilities and homeequipment, which is expected to compress the distribution (and ethnic differen-tials) at its top.
Generally speaking, a large proportion of the mean gap in wellbeing betweenwhites/mestizos and these two disadvantaged minorities can be explained by thelatter having poorer endowments: about 77 percent (indigenous) and 66 percent(mulattoes). However, a look at the distributive pattern shows that the proportionthus explained is relatively low at the bottom of the distribution (38 and 52 percentat the 10th quantile), and then sharply increases for higher quantiles (161 and 96
4The regressions used to obtain all the results are reported in the online Appendix (Tables A3 andA4), jointly with descriptive statistics of the explanatory variables, and a number of figures summariz-ing the decomposition results.
Review of Income and Wealth 2015
© 2015 International Association for Research in Income and Wealth
17
Review of Income and Wealth, Series 62, Supplement 1, August 2016
VC 2015 International Association for Research in Income and Wealth
S106

TA
BL
E1
Dec
om
po
sit
ion
of
th
eG
ap
inW
ell
bei
ng
(100
·ind
ex)
by
Ra
ce/
Et
hn
icit
y
Indi
geno
usP
eopl
eM
ulat
to
Mea
np1
0p2
5p5
0p7
5p9
0M
ean
p10
p25
p50
p75
p90
Whi
te/m
esti
zo75
.73
60.9
468
.66
77.1
384
.20
88.8
975
.73
60.9
468
.66
77.1
384
.20
88.8
9(0
.09)
(0.1
3)(0
.12)
(0.1
1)(0
.08)
(0.0
5)(0
.09)
(0.1
3)(0
.12)
(0.1
1)(0
.08)
(0.0
5)R
ace/
ethn
icm
inor
ity
61.7
337
.19
51.0
163
.87
75.5
583
.84
71.6
156
.66
64.3
572
.47
80.1
285
.92
(0.4
0)(0
.92)
(0.6
4)(0
.48)
(0.4
5)(0
.33)
(0.1
4)(0
.26)
(0.2
0)(0
.18)
(0.1
5)(0
.14)
Gap
14.0
023
.75
17.6
413
.26
8.65
5.06
4.12
4.28
4.30
4.66
4.08
2.98
(0.3
8)(0
.91)
(0.6
3)(0
.46)
(0.4
3)(0
.31)
(0.1
2)(0
.25)
(0.1
9)(0
.16)
(0.1
4)(0
.13)
Ex
pla
ined
10.8
18.
9911
.91
12.0
012
.89
8.16
2.73
2.23
2.41
3.10
3.05
2.85
(0.3
5)(0
.84)
(0.5
2)(0
.39)
(0.3
8)(0
.33)
(0.1
0)(0
.17)
(0.1
2)(0
.13)
(0.1
1)(0
.11)
Reg
ion
1.95
−0.2
80.
722.
514.
033.
010.
210.
330.
270.
240.
160.
11(0
.20)
(0.4
2)(0
.37)
(0.3
2)(0
.38)
(0.3
0)(0
.03)
(0.0
8)(0
.04)
(0.0
4)(0
.03)
(0.0
3)A
rea
2.73
2.42
3.76
3.29
3.06
0.86
−0.0
3−0
.06
−0.0
4−0
.04
−0.0
2−0
.01
(0.1
7)(0
.46)
(0.3
3)(0
.30)
(0.2
8)(0
.23)
(0.0
1)(0
.03)
(0.0
2)(0
.02)
(0.0
1)(0
.00)
Chi
ldre
n0.
982.
351.
130.
910.
250.
080.
330.
540.
410.
330.
200.
10(0
.22)
(0.6
0)(0
.48)
(0.2
0)(0
.12)
(0.0
7)(0
.03)
(0.0
7)(0
.05)
(0.0
4)(0
.02)
(0.0
2)Se
x0.
010.
040.
040.
02−0
.04
−0.0
50.
030.
010.
010.
040.
040.
04(0
.01)
(0.0
4)(0
.03)
(0.0
2)(0
.02)
(0.0
3)(0
.01)
(0.0
2)(0
.01)
(0.0
1)(0
.01)
(0.0
1)A
ge0.
00−0
.11
−0.0
20.
020.
040.
090.
110.
030.
120.
170.
130.
08(0
.05)
(0.1
2)(0
.08)
(0.0
5)(0
.04)
(0.0
3)(0
.02)
(0.0
5)(0
.04)
(0.0
3)(0
.03)
(0.0
2)E
duca
tion
3.32
4.10
4.09
2.78
3.45
2.97
1.05
0.44
0.65
1.18
1.50
1.56
(0.2
6)(0
.66)
(0.4
8)(0
.25)
(0.2
3)(0
.22)
(0.0
5)(0
.07)
(0.0
6)(0
.06)
(0.0
8)(0
.09)
Imm
igra
tion
0.05
−0.8
00.
360.
300.
12−0
.01
0.64
0.79
0.75
0.78
0.49
0.31
(0.1
2)(0
.45)
(0.2
5)(0
.14)
(0.1
2)(0
.09)
(0.0
4)(0
.09)
(0.0
6)(0
.06)
(0.0
4)(0
.04)
Lab
or1.
771.
271.
842.
181.
981.
190.
400.
140.
230.
400.
550.
65(0
.20)
(0.5
5)(0
.40)
(0.1
9)(0
.26)
(0.2
2)(0
.04)
(0.0
7)(0
.05)
(0.0
5)(0
.05)
(0.0
6)
Un
exp
lain
ed3.
1914
.76
5.73
1.26
−4.2
4−3
.11
1.39
2.05
1.89
1.57
1.02
0.12
(0.1
9)(0
.45)
(0.3
1)(0
.31)
(0.3
9)(0
.46)
(0.0
9)(0
.20)
(0.1
5)(0
.12)
(0.1
3)(0
.16)
Reg
ion
0.58
2.91
3.17
0.91
−2.4
0−2
.72
0.09
0.31
0.64
0.33
−0.2
0−0
.43
(0.1
7)(0
.36)
(0.3
6)(0
.25)
(0.3
9)(0
.37)
(0.0
8)(0
.18)
(0.1
7)(0
.14)
(0.1
0)(0
.10)
Are
a−1
.24
−0.3
7−1
.62
−1.6
1−1
.87
−0.5
50.
040.
100.
12−0
.07
−0.0
7−0
.06
(0.1
2)(0
.33)
(0.2
4)(0
.21)
(0.2
0)(0
.17)
(0.0
6)(0
.16)
(0.1
2)(0
.09)
(0.0
6)(0
.05)
Chi
ldre
n0.
522.
150.
120.
43−0
.10
−0.0
30.
380.
550.
120.
420.
460.
33(0
.35)
(1.0
2)(0
.86)
(0.3
3)(0
.21)
(0.1
3)(0
.09)
(0.2
5)(0
.18)
(0.1
3)(0
.11)
(0.0
9)Se
x0.
360.
550.
720.
67−0
.11
−0.4
2−0
.01
−0.1
30.
080.
05−0
.01
−0.1
6(0
.12)
(0.4
2)(0
.30)
(0.1
5)(0
.15)
(0.1
4)(0
.05)
(0.1
5)(0
.08)
(0.0
8)(0
.06)
(0.0
7)A
ge0.
400.
400.
710.
340.
310.
000.
01−0
.19
0.03
0.09
0.05
−0.0
3(0
.15)
(0.5
3)(0
.27)
(0.1
3)(0
.13)
(0.1
0)(0
.05)
(0.1
2)(0
.09)
(0.0
7)(0
.06)
(0.0
6)E
duca
tion
−3.6
1−2
.49
−10.
05−3
.05
−5.4
8−3
.29
−0.9
01.
371.
20−1
.67
−3.3
3−2
.72
(1.5
6)(6
.34)
(3.0
8)(1
.61)
(1.2
1)(0
.89)
(1.0
6)(3
.83)
(1.7
4)(1
.06)
(0.6
9)(0
.48)
Imm
igra
tion
0.77
3.34
3.65
0.07
−0.8
90.
540.
091.
051.
27−0
.02
−0.9
2−0
.49
(1.2
1)(3
.61)
(1.7
4)(1
.26)
(1.3
7)(1
.62)
(0.3
4)(0
.91)
(0.6
0)(0
.51)
(0.6
0)(0
.70)
Lab
or1.
864.
861.
32−0
.22
1.61
−0.1
80.
33−0
.83
−1.0
61.
031.
561.
02(0
.79)
(2.4
2)(1
.51)
(1.0
7)(1
.18)
(1.3
0)(0
.33)
(0.7
0)(0
.53)
(0.5
3)(0
.55)
(0.5
8)In
terc
ept
3.54
3.42
7.70
3.72
4.68
3.54
1.35
−0.1
9−0
.51
1.40
3.50
2.66
(2.3
0)(7
.50)
(3.7
5)(2
.35)
(2.1
2)(2
.04)
(1.1
6)(3
.97)
(2.0
1)(1
.28)
(0.9
5)(1
.04)
No
te:
Rob
ust
stan
dard
erro
rsin
pare
nthe
ses.
So
urc
e:O
wn
cons
truc
tion
base
don
2011
Cen
sus.
Review of Income and Wealth 2015
© 2015 International Association for Research in Income and Wealth
18
Review of Income and Wealth, Series 62, Supplement 1, August 2016
VC 2015 International Association for Research in Income and Wealth
S107

percent at the 90th). This is the result of the gaps explained by characteristics thatare increasing (except at the top) in both cases. That is, the gap by race/ethnicity isnot only larger among the poor, but a larger proportion of it remains even whenpeople are compared with similar characteristics. On the contrary, the whole gapamong the most affluent people is explained by minorities having a higher preva-lence of characteristics associated with lower wellbeing.
Looking at the factors that explain the gap in wellbeing at the mean, bothgroups share some similarities. The lower education in their households turns outto be the most important single factor, associated with about one-quarter of themean gap. This does not come as a surprise, as education has already beenidentified in other Latin American countries as the main factor explaining theethnic gap in wages (e.g., Chong and Ñopo, 2008; Atal et al., 2009), in povertylevels (Antón and Carrera, 2007; Gradín, 2009), or in income (Gradín, 2014). Thehigher number of children (7–8 percent of the gap) and the worst performance ofthese groups in the labor market (10–13 percent) also play a significant role.However, these groups also differ in the relevance of other factors. The largerproportion of immigrants plays a substantial role only in the case of mulattoes (16percent), given the larger share of people of this group born abroad (i.e., Nicara-gua). Additionally, other demographic factors (head of household’s age or sex)matter only for mulattoes, although this is only marginal (3 percent). For indig-enous people, location matters most, explaining about one-third of the gap alto-gether, due to their overrepresentation in rural areas (20 percent of the gap) and inthe poorest regions of the country (14 percent). This is the reason why the pro-portion of the gap explained for this group is larger than in the case of mulattoes,who have a geographical distribution similar to that of whites/mestizos. Theover-representation in the poorest areas has also been previously identified as arelevant factor for the lower income and higher poverty of Afro-descendants inBrazil (Gradín, 2009, 2014).
The magnitude of the characteristics effect is not the only thing that variesacross the distribution of wellbeing. The relevant factors also change substantially,with both groups showing different distributive patterns. In the case of mulattoes,the gap explained by education and labor variables increases for higher quantiles,at the same time that location and some demographic factors, such as the numberof children and immigration, become less important. Gradín (2014) has previouslyfound an increasing importance of education for explaining the income black–white gap in two other middle income countries (Brazil and South Africa) using adifferent regression-based procedure (re-weighting). In the case of Brazil there wasa decreasing contribution of demographic and geographical factors along theincome distribution, while the contribution of these factors was more stable inthe case of South Africa.
In the case of indigenous people in Costa Rica, education tends to explain thelargest gap in the bottom of the distribution and labor variables in the middle. Thismight reflect an insertion pattern of this group in the local labor market differentfrom that of mulattoes. The region of residence is more important for explainingthe differential in higher quantiles in this group, while the type of area of residence(rural or urban) and the number of children, among other factors, are less impor-tant. Thus, in the case of mulattoes, the largest contributions to explain the
Review of Income and Wealth 2015
© 2015 International Association for Research in Income and Wealth
19
Review of Income and Wealth, Series 62, Supplement 1, August 2016
VC 2015 International Association for Research in Income and Wealth
S108

wellbeing differential at the bottom of the distribution come from the accumula-tion of a larger share of immigrants, their larger number of children, their lowerachieved education, and their overrepresentation in the poorest regions. In the caseof indigenous people, the largest contributions come from their lower level ofeducation, their overrepresentation in rural areas, and their large number ofchildren.
For both minorities, had they shared the same characteristics as the referencegroup, there would remain an unexplained gap that is higher at the bottom of thedistribution of wellbeing. As mentioned above, this might be the result of unob-served differentials by group in relevant attributes or in its quality, or the result ofsegregation into low-paid occupation or earnings discrimination. The unexplainedgap at the top becomes nearly zero for mulattoes and negative for indigenouspeople, meaning that the observed gap for the latter group should be even largerthan it is. Therefore, it is interesting to ask whether we can identify which char-acteristics have a different effect on wellbeing by population group and thatexplain higher poverty levels among ethnic minorities.
In the case of mulattoes, the coefficients effects at the mean tend to be smalland not significant, consistent with similar evidence about the ethnic wage gappreviously found for other countries in Latin America. However, a clear distri-butional pattern appears again. At the bottom of the distribution, where theunexplained gap is largest, we find positive and significant effects of the numberof children (10th quantile) and region (25th), meaning that living in the poorestregions and having children tends to lower the wellbeing of mulattoes more thanfor whites/mestizos. This might be the result of the large penalty on educationfaced by Nicaraguan immigrants that we analyze in the next subsection. In thecase of indigenous people, the region of residence and the number of childrenhave similar effects for mulattoes, but performance in the labor market andimmigration status also tend to have a substantial and significant differentialeffect on this group at the bottom of the distribution, leading to a larger unex-plained gap. On the opposite side, it is worth noting that their wellbeing is gen-erally less affected by education and living in rural areas (coefficient effects arenegative and significant). There are also large effects of education and immigra-tion status (10th and 25th quantiles), but these have high standard errors andthus are not significant.
6.3. Explaining the Gap in Wellbeing of Nicaraguan and Panamanian Immigrants
We show the results of the decomposition of the gap in wellbeing by countryof birth (immigrants from Panama and Nicaragua, compared with native-bornpeople) in Table 2. The proportion of the immigrant average gap explained bytheir poorer endowments is large for the people from Panama (79 percent), butrelatively small for those born in Nicaragua (only 45 percent). This contrasts withGindling’s (2009) result; the entire gap between the log earnings of native-born andNicaraguan workers in 2004 could be explained by the lower endowments (edu-cation) of the latter (no overall unexplained effect). There might be several reasonsfor the discrepancy in the results for earnings and wellbeing in the case of immi-grants. For example, the short time residing in the country or the remittances that
Review of Income and Wealth 2015
© 2015 International Association for Research in Income and Wealth
20
Review of Income and Wealth, Series 62, Supplement 1, August 2016
VC 2015 International Association for Research in Income and Wealth
S109

TA
BL
E2
Dec
om
po
sit
ion
of
th
eG
ap
inW
ell
bei
ng
(100
·ind
ex)
by
Co
un
tr
yo
fB
irt
h
Nic
arag
uaP
anam
a
Mea
np1
0p2
5p5
0p7
5p9
0M
ean
p10
p25
p50
p75
p90
Bor
nin
Cos
taR
ica
75.3
760
.64
68.4
276
.88
83.8
788
.61
75.3
760
.64
68.4
276
.88
83.8
788
.61
(0.1
1)(0
.15)
(0.1
3)(0
.12)
(0.0
9)(0
.06)
(0.1
1)(0
.15)
(0.1
3)(0
.12)
(0.0
9)(0
.06)
For
eign
min
orit
y66
.61
51.1
659
.04
66.8
074
.86
81.7
164
.76
44.0
151
.79
63.8
279
.10
87.3
0(0
.16)
(0.3
1)(0
.23)
(0.1
9)(0
.18)
(0.1
9)(0
.80)
(1.2
1)(1
.09)
(1.3
5)(1
.13)
(0.6
1)G
ap8.
769.
479.
3810
.08
9.01
6.90
10.6
216
.63
16.6
313
.06
4.77
1.31
(0.1
2)(0
.28)
(0.1
9)(0
.15)
(0.1
5)(0
.17)
(0.7
8)(1
.21)
(1.0
7)(1
.33)
(1.1
1)(0
.60)
Ex
pla
ined
3.94
1.98
2.47
3.42
5.22
7.47
8.33
6.07
7.66
11.9
18.
653.
42(0
.15)
(0.3
6)(0
.21)
(0.1
5)(0
.15)
(0.2
1)(0
.88)
(1.5
0)(1
.33)
(1.4
8)(1
.34)
(0.8
4)R
egio
n0.
160.
210.
140.
120.
130.
081.
100.
24−1
.16
0.01
3.82
2.55
(0.0
8)(0
.24)
(0.1
3)(0
.07)
(0.0
6)(0
.09)
(0.3
8)(0
.57)
(0.6
4)(0
.78)
(0.9
5)(0
.68)
Are
a0.
080.
110.
110.
090.
070.
041.
402.
112.
731.
890.
540.
20(0
.02)
(0.0
3)(0
.03)
(0.0
3)(0
.02)
(0.0
1)(0
.26)
(0.5
8)(0
.51)
(0.5
9)(0
.36)
(0.2
0)C
hild
ren
0.38
0.56
0.47
0.37
0.34
0.21
0.20
−0.5
11.
310.
73−0
.05
−0.1
5(0
.03)
(0.0
7)(0
.05)
(0.0
4)(0
.03)
(0.0
3)(0
.23)
(0.4
7)(0
.52)
(0.4
5)(0
.31)
(0.0
9)Se
x−0
.01
0.01
0.00
−0.0
2−0
.01
−0.0
3−0
.21
0.12
−0.1
9−0
.14
−0.5
0−0
.53
(0.0
1)(0
.01)
(0.0
1)(0
.01)
(0.0
1)(0
.01)
(0.1
3)(0
.29)
(0.1
8)(0
.15)
(0.2
4)(0
.22)
Age
0.35
−0.3
10.
130.
400.
670.
770.
360.
010.
260.
460.
860.
39(0
.04)
(0.1
2)(0
.06)
(0.0
5)(0
.06)
(0.0
7)(0
.15)
(0.3
9)(0
.28)
(0.2
3)(0
.23)
(0.1
5)E
duca
tion
1.88
1.35
1.12
1.46
2.39
3.89
1.94
1.92
2.44
2.41
1.82
0.69
(0.0
7)(0
.13)
(0.0
8)(0
.09)
(0.1
2)(0
.18)
(0.4
0)(1
.00)
(0.7
8)(0
.64)
(0.5
5)(0
.22)
Rac
e/et
hnic
ity
0.08
−0.0
20.
060.
140.
110.
142.
532.
641.
674.
250.
940.
45(0
.02)
(0.0
6)(0
.04)
(0.0
3)(0
.04)
(0.0
4)(0
.58)
(1.1
2)(1
.09)
(1.0
3)(0
.85)
(0.4
0)L
abor
1.01
0.08
0.44
0.85
1.52
2.38
1.02
−0.4
80.
592.
291.
22−0
.18
(0.0
8)(0
.16)
(0.1
1)(0
.10)
(0.1
0)(0
.16)
(0.3
9)(0
.91)
(0.7
2)(0
.65)
(0.6
2)(0
.41)
Un
exp
lain
ed4.
837.
496.
916.
663.
79−0
.57
2.29
10.5
68.
971.
16−3
.88
−2.1
1(0
.15)
(0.3
2)(0
.23)
(0.1
8)(0
.19)
(0.2
7)(0
.62)
(1.0
8)(0
.96)
(1.2
0)(1
.23)
(0.9
6)R
egio
n0.
550.
160.
981.
150.
62−0
.13
−0.3
51.
801.
830.
58−4
.61
−1.5
7(0
.10)
(0.2
6)(0
.16)
(0.1
2)(0
.13)
(0.1
5)(0
.50)
(0.5
1)(0
.72)
(0.8
8)(1
.27)
(0.8
1)A
rea
−0.0
70.
36−0
.03
−0.1
7−0
.35
−0.3
4−0
.59
−0.6
0−1
.56
−1.0
7−0
.18
−0.1
1(0
.07)
(0.1
5)(0
.12)
(0.1
0)(0
.09)
(0.0
7)(0
.21)
(0.5
3)(0
.43)
(0.5
4)(0
.35)
(0.1
9)C
hild
ren
−0.0
9−0
.69
−0.3
70.
140.
770.
65−1
.43
−3.5
0−0
.95
−0.6
5−0
.67
−0.3
8(0
.11)
(0.2
5)(0
.21)
(0.1
3)(0
.12)
(0.1
2)(0
.22)
(0.4
6)(0
.32)
(0.3
9)(0
.31)
(0.0
8)Se
x0.
160.
060.
170.
230.
30−0
.04
−0.2
30.
22−0
.22
0.09
−0.7
4−0
.92
(0.0
6)(0
.16)
(0.1
0)(0
.08)
(0.0
8)(0
.11)
(0.2
8)(0
.65)
(0.4
0)(0
.34)
(0.5
2)(0
.46)
Age
0.29
−0.3
50.
030.
300.
720.
72−0
.10
0.11
−0.3
9−0
.40
0.82
0.45
(0.0
5)(0
.14)
(0.0
8)(0
.06)
(0.0
8)(0
.11)
(0.2
0)(0
.54)
(0.3
5)(0
.30)
(0.4
1)(0
.25)
Edu
cati
on2.
396.
034.
000.
83−2
.46
−4.1
73.
5113
.52
5.74
−4.0
4−2
.85
−2.9
2(0
.71)
(2.4
4)(1
.46)
(0.7
5)(0
.76)
(0.8
3)(2
.39)
(7.8
0)(6
.98)
(4.1
2)(2
.88)
(1.1
2)R
ace/
ethn
icit
y1.
473.
921.
72−0
.15
−0.5
8−0
.65
0.21
2.42
−0.2
5−2
.13
0.16
−0.5
1(0
.19)
(0.5
2)(0
.31)
(0.2
6)(0
.21)
(0.2
2)(0
.55)
(0.9
9)(0
.96)
(1.0
1)(1
.26)
(0.5
9)L
abor
1.05
−1.8
20.
081.
112.
564.
24−1
.81
−1.1
6−0
.89
−9.6
13.
981.
02(0
.38)
(0.7
7)(0
.53)
(0.5
3)(0
.62)
(0.7
6)(1
.52)
(3.2
1)(2
.64)
(2.5
7)(2
.49)
(2.6
5)In
terc
ept
−0.9
2−0
.18
0.33
3.22
2.19
−0.8
53.
08−2
.26
5.67
18.3
90.
202.
83(0
.76)
(2.4
0)(1
.65)
(0.9
5)(1
.03)
(1.1
6)(3
.22)
(8.9
2)(7
.36)
(5.3
8)(3
.91)
(3.1
6)
No
te:
Rob
ust
stan
dard
erro
rsin
pare
nthe
ses.
So
urc
e:O
wn
cons
truc
tion
base
don
2011
Cen
sus.
Review of Income and Wealth 2015
© 2015 International Association for Research in Income and Wealth
21
Review of Income and Wealth, Series 62, Supplement 1, August 2016
VC 2015 International Association for Research in Income and Wealth
S110

recent immigrants send to their home country might imply harsher living condi-tions for them as compared with native-born of similar characteristics andearnings.
Similar to the case of racial/ethnic minorities, the gap in wellbeing explainedby characteristics is small at the bottom (37 and 21 percent respectively) butincreases for higher quantiles, such that in both cases, more than 100 percent isexplained at the top. This is the result of a sharply shrinking gap in the case ofPanamanians, with an explained gap that is largest at the middle of the distribu-tion. In the case of Nicaraguans the gap is more stable, declining at the top, but theexplained gap is increasing with higher quantiles. In particular, this means thelarge unexplained gap found on average for Nicaraguans is mainly driven by whathappens at the bottom of the distribution (with a higher proportion of recentimmigrants).
Regarding the driving factors, these groups have many things in commonwith racial/ethnic minorities. In the difference at the mean, the lower achievededucation again plays the most significant role at around 20 percent for bothgroups and there is an important contribution from the labor market (around 10percent). The relevance of education, in the case of Nicaraguans, is consistent witha similar result for individual earnings in Gindling (2009).5 The other demographicfactors are not of much relevance, except that the householder’s age explains about4 percent of the gap for both groups, and the higher number of children explainsa similar share in the case of Nicaraguans.6
There are two main differences between immigrants from Panama and Nica-ragua that explain the mean gap for the former to a large extent, while more thanhalf of the gap for the latter remains unexplained. First, 24 percent of the gap inwellbeing between people born in Panama and those born in Costa Rica comesfrom differences in ethnicity because 44 percent of Panamanians are indigenousand another 13 percent are Afro-descendants. Second, another quarter of the gapis due to Panamanian immigrants being overrepresented in rural areas (13 percent)and the poorest regions of the country (10 percent). On the other hand, neitherrace/ethnicity nor location are especially relevant for explaining the gap in well-being for Nicaraguans. This suggests that the remaining gap must come fromelsewhere, probably associated with how differently their endowments are valuedin the labor market, either the result of some sort of discrimination against peopleof this nationality, or from a lower quality of their endowments (e.g., of theirhuman capital) in the host market.
Similar to what we found for mulattoes, in the case of Nicaraguans, there is anincreasing gap for higher quantiles that is mostly explained by education and laborvariables, and a decreasing relevance of the number of children and location.However, for Panamanians, education and labor variables tend to explain the
5The lower level of education of Nicaraguan immigrants can be explained because Nicaragua is aless-developed country, but also because of sorting. Among Nicaraguans with some migrant experi-ence, the higher their attained education, the higher their odds to migrate to the U.S. instead of to CostaRica (Vargas and Barquero, 2005).
6There is evidence suggesting less effective family planning among women born in Nicaragua dueto their larger proportion of unplanned children and of adolescent childbearing (González, 2005;Sintonen et al., 2013).
Review of Income and Wealth 2015
© 2015 International Association for Research in Income and Wealth
22
Review of Income and Wealth, Series 62, Supplement 1, August 2016
VC 2015 International Association for Research in Income and Wealth
S111

largest gap in the middle of the distribution. The region of residence is moreimportant in explaining the differential in higher quantiles, as with indigenouspeople, while the area of residence and the number of children, among otherfactors, decrease in importance.
As a result, when it comes to explaining the wellbeing differential at thebottom of the distribution, the largest contribution in the case of Nicaraguanscomes from their lower attained education, and to a lower extent, from theirhigher number of children, their poorer performance in the labor market, andtheir overrepresentation in poorer regions. In the case of Panamanians, the mainfactor is their higher proportion of indigenous people (who are poorer regardlessof their characteristics), their lower achieved education, and their higher propor-tion living in rural areas. In the case of both foreign minorities, had the groupsshared the same characteristics as the reference group, there would remain anunexplained gap that is especially higher in the case of Nicaraguans, but signifi-cant also for Panamanians. Thus, it is interesting to ask again whether we canidentify which characteristics have a different effect on wellbeing by populationgroup.
In the case of Nicaraguans, the group with the largest unexplained effect,there is a positive and significant contribution of most detailed effects, whichsuggests this group is taking less advantage of their endowments than native-born Costa Ricans. The most outstanding case is the large and significant coef-ficient effect of education (27 percent of the gap). This means Nicaraguans notonly have lower education but also have more difficulties in transforming it intobetter living conditions. This result is consistent with the lower returns to edu-cation for Nicaraguan immigrants found in Gindling (2009). This could resultfrom limited transferability of their human capital due to the lower quality oftheir education (at least as perceived by the host market) and from any sort ofdiscrimination (e.g., segregation into low-paid jobs, wage discrimination). AsGindling (2009) points out, in line with Chiswick (1978), an overall coefficientseffect of nearly zero does not necessarily imply that there is no wage discrimi-nation against Nicaraguan-born workers. The self-selection of immigrants (moreable and highly motivated individuals) can result in both a lower coefficient oneducation and the larger earnings equation intercept (due to their higher unob-served productivity), which is the case in Costa Rica. This is reinforced by thelarge effects also found for labor market variables (12 percent of the gap) and isalso consistent with the large prejudices against immigrants reported in CostaRica (e.g., Smith-Castro, 2009). Another salient coefficient effect is that of race/ethnicity, that in this context might be interpreted as an interaction effect ofethnicity and immigration: Nicaraguans belonging to an ethnic minority (Afro-descendants or indigenous) tend to be worse off than those who are white ormestizo.
For Panamanians, there are only two significant effects and both are nega-tive. Therefore, the wellbeing of this population is less diminished by theirhaving more children and living in rural areas; it may be the consequence ofthe specific economic activities in which this people engage. The gap inwellbeing would be about 20 percent higher if the effects were the same as thosefor native-born.
Review of Income and Wealth 2015
© 2015 International Association for Research in Income and Wealth
23
Review of Income and Wealth, Series 62, Supplement 1, August 2016
VC 2015 International Association for Research in Income and Wealth
S112

6.4. The Special Case of Blacks
Finally, we undertake the same decomposition exercise for the gap betweenwhites/mestizos and blacks (Table 3). Although the gap is, on average, prettysmall, its decomposition will reveal some interesting features of the situation of
TABLE 3
Decomposition of the Gap in Wellbeing (100·index) by Race/Ethnicity (Blacks)
Mean p10 p25 p50 p75 p90
White/mestizo 75.73 60.94 68.66 77.13 84.20 88.89(0.09) (0.13) (0.12) (0.11) (0.08) (0.05)
Black/African 74.30 58.46 66.57 76.12 83.71 88.20(0.29) (0.60) (0.49) (0.44) (0.28) (0.25)
Gap 1.43 2.49 2.09 1.01 0.49 0.69(0.29) (0.60) (0.50) (0.44) (0.28) (0.26)
Explained −0.09 0.25 −1.29 −0.52 0.64 0.26(0.29) (0.58) (0.48) (0.39) (0.30) (0.28)
Region 0.24 0.14 −0.59 0.31 0.93 0.37(0.17) (0.45) (0.37) (0.26) (0.20) (0.20)
Area −0.30 −0.64 −0.50 −0.39 −0.14 −0.07(0.07) (0.17) (0.11) (0.09) (0.04) (0.03)
Children 0.13 0.29 0.15 0.10 0.03 0.00(0.06) (0.15) (0.08) (0.05) (0.02) (0.02)
Sex 0.06 −0.13 −0.05 0.26 0.19 0.19(0.06) (0.12) (0.09) (0.10) (0.07) (0.07)
Age 0.00 0.03 0.01 0.02 −0.02 −0.02(0.02) (0.04) (0.03) (0.04) (0.04) (0.03)
Education −0.52 −0.21 −0.81 −0.82 −0.41 −0.23(0.11) (0.20) (0.18) (0.16) (0.13) (0.08)
Immigration 0.29 0.67 0.48 0.20 0.08 −0.02(0.08) (0.18) (0.14) (0.10) (0.07) (0.08)
Labor 0.01 0.08 0.02 −0.19 −0.02 0.03(0.11) (0.23) (0.17) (0.17) (0.13) (0.14)
Unexplained 1.52 2.24 3.38 1.53 −0.15 0.44(0.24) (0.68) (0.57) (0.37) (0.25) (0.27)
Region 0.12 0.19 0.80 0.20 −0.42 0.06(0.19) (0.65) (0.37) (0.30) (0.28) (0.22)
Area −0.30 −0.86 −0.65 −0.59 −0.13 −0.15(0.14) (0.46) (0.26) (0.21) (0.11) (0.08)
Children −0.02 0.70 −0.52 −0.25 −0.21 −0.21(0.24) (0.63) (0.40) (0.26) (0.19) (0.15)
Sex 0.10 0.23 0.32 −0.17 −0.02 −0.17(0.12) (0.26) (0.19) (0.20) (0.15) (0.16)
Age 0.12 −0.09 0.21 0.09 0.21 0.02(0.10) (0.24) (0.21) (0.16) (0.11) (0.09)
Education 5.02 4.65 7.23 3.47 2.09 0.80(2.02) (6.54) (3.85) (2.68) (1.29) (0.94)
Immigration 0.78 0.39 0.69 2.34 −0.56 −0.12(0.55) (1.21) (1.16) (0.94) (0.85) (1.12)
Labor 0.64 −1.76 −0.17 1.81 0.49 −0.33(0.64) (1.77) (1.18) (1.24) (0.97) (0.76)
Intercept −4.94 −1.20 −4.52 −5.37 −1.60 0.54(1.98) (6.97) (4.07) (2.95) (1.67) (1.55)
Note: Robust standard errors in parentheses.Source: Own construction based on 2011 Census.
Review of Income and Wealth 2015
© 2015 International Association for Research in Income and Wealth
24
Review of Income and Wealth, Series 62, Supplement 1, August 2016
VC 2015 International Association for Research in Income and Wealth
S113

this particular minority. On the one hand, as with the other cases, blacks have ahigher prevalence of some characteristics associated with a lower wellbeingthat jointly explain about 50 percent of the average gap (a smaller absolutemagnitude than other minorities): a larger share of immigrants (20 percent of thegap), more people living in poor regions (i.e., Atlantic Huetar including theLimón province, 17 percent), and more children in their households (9 percent).On the other hand, the distinctive fact of Costa Rican blacks is that, at the sametime, they also have a higher prevalence of some characteristics associated withhigher wellbeing (negative characteristics effects): higher attained education andhigher proportion of population living in urban areas, both related with thespecific origins previously discussed. If the distribution of these two character-istics among blacks were the same as among whites and mestizos, the gap inwellbeing should be nearly 60 percent larger (respectively 36 and 21 percent).Along these lines, Gradín (2012) studied the segregation of black womeninto the best occupations, associated with their relatively higher achievededucation.
The negative effects are larger than the positive effects, and the explainedportion of the overall gap is negative, although small. This means the wholeobserved gap remains unexplained (it is even a bit higher) after controlling forcharacteristics, and its magnitude is similar to that of mulattoes (0.015 versus0.014). Comparing the results for blacks and mulattoes, blacks have an averagehigher wellbeing than that of mulattoes because of their higher achieved education,better jobs, and higher urbanization, combined with a lower number of childrenand lower proportion of (Nicaraguan) immigrants among them. But both blacksand mulattoes experience a similar penalization by their race (after other charac-teristics have been controlled for).
The gap between whites/mestizo and blacks also shows a particular distribu-tive pattern. The observed gap is largest at the bottom of the distribution andcannot be explained by characteristics, because as with the mean gap, the positivecontribution of some characteristics is compensated by the negative effect associ-ated with others. The explained gap is even negative at the 25th and 50th quantiles.It is worth noting that the gap explained by education is negative over the entiredistribution (although not significant at the 10th percentile), as is the contributionof the area of residence.
Among the detailed unexplained effects, the large and significant positiveeffect of education is remarkable (it is significant at 10 percent at the mean and25th percentile), indicating that some blacks take little advantage of their higherlevels of education when it comes to translating that into a higher level of wellbe-ing. This is a reflection of this group having lower economic opportunities, whichis consistent with their high rates of migration and the perception of discriminationin the labor market against them, although we are not aware of any study that hastested wage discrimination against blacks.
7. Conclusions
In this paper we have documented the economic disadvantage of Africandescents, indigenous people, and immigrants in Costa Rica, analyzing the
Review of Income and Wealth 2015
© 2015 International Association for Research in Income and Wealth
25
Review of Income and Wealth, Series 62, Supplement 1, August 2016
VC 2015 International Association for Research in Income and Wealth
S114

gap in wellbeing along its entire distribution. Our results show the existence of aclear divide in the level of wellbeing in Costa Rica along racial, ethnic, andnational lines, which is especially evident among the poor. The fact that CostaRica stands out in the Central American region for showing better livingconditions, more equality, and superior political stability, indicates thatthese are not sufficient conditions for equality across the different demographicgroups.
We have also investigated the nature of these inequalities. We have shownthat the economic disadvantage of mulattoes, indigenous people, and immigrantsin Costa Rica is strongly associated with the higher prevalence among thesegroups of a number of characteristics that imply lower wellbeing. Theirlower education, the higher number of children in their households, or theiroverrepresentation in the less developed areas of the country, are amongst themain factors, but to a different degree of relevance in each case. The accumulationof immigrant and minority statuses is also associated with a lower wellbeing. Alarge part of the gap in wellbeing, especially among the poor and Nicaraguanimmigrants, still remains unexplained after controlling for these characteristics,however, indicating that the penalization of race/ethnicity/nationality goesbeyond observable characteristics.
We have shown that blacks also have a higher rate of immigrants, are over-represented on the poor Caribbean coast, and have more children than whites/mestizos. However, compared with the other minorities, the impact of thesefactors on wellbeing is smaller. And, unlike whites/mestizos, blacks have a higherprevalence than the majority of some characteristics associated with higher well-being, such as higher achieved education, or a higher proportion living in urbanareas. Consequently, the gap should be reversed (blacks having better wellbeing) ifthey had the same characteristics as whites/mestizos. The lower advantage thatsome blacks take of their higher education, compared with whites/mestizos, is alsoan important aspect for this group.
It was not the objective of this study to assess whether the economic disad-vantage of minorities is the result of discrimination. It is important to recall thatdiscrimination against these groups might be reflected in both explained andunexplained effects. Their lower wellbeing would be the result of discrimination ifthe lower education or the higher number of children of minorities is the result ofpoorer access to schooling and family planning, or if the areas where they live aresystematically neglected by the government. Discrimination can also be reflected inthe lower returns to some characteristics, especially education and participation inthe labor market. A higher visibility of minorities in all type of statistics in thefuture would be important for investigating in more depth the nature and thechannels of these racial/ethnic inequalities. The fact that the recent trends inpoverty and inequality show that Costa Rica is catching up with its neighbors inthis regard, should raise the concern that the relative disadvantage of minoritiesmight aggravate in the near future.
Review of Income and Wealth 2015
© 2015 International Association for Research in Income and Wealth
26
Review of Income and Wealth, Series 62, Supplement 1, August 2016
VC 2015 International Association for Research in Income and Wealth
S115
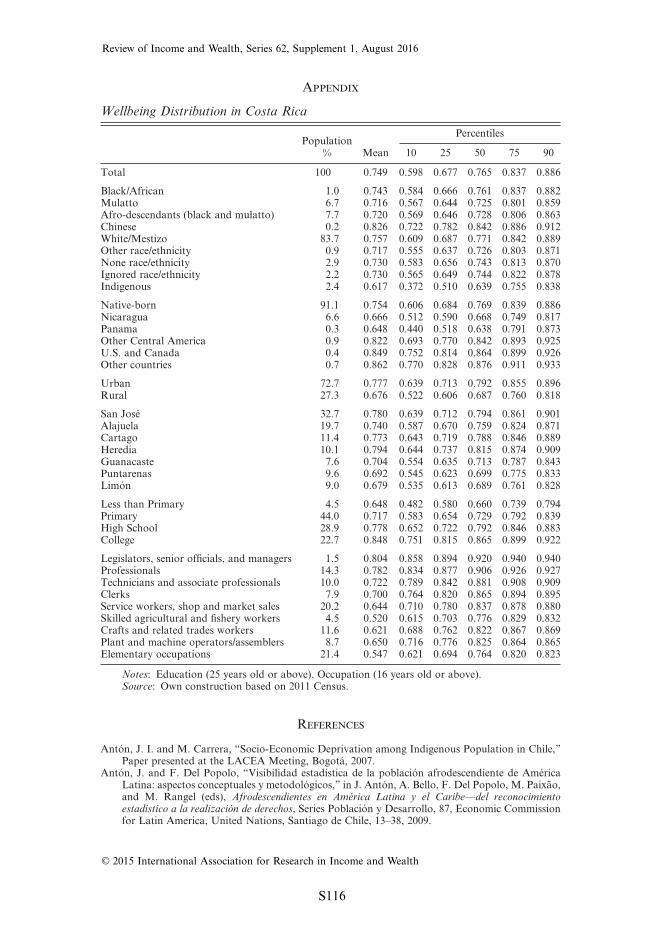
Appendix
Wellbeing Distribution in Costa Rica
Population% Mean
Percentiles
10 25 50 75 90
Total 100 0.749 0.598 0.677 0.765 0.837 0.886
Black/African 1.0 0.743 0.584 0.666 0.761 0.837 0.882Mulatto 6.7 0.716 0.567 0.644 0.725 0.801 0.859Afro-descendants (black and mulatto) 7.7 0.720 0.569 0.646 0.728 0.806 0.863Chinese 0.2 0.826 0.722 0.782 0.842 0.886 0.912White/Mestizo 83.7 0.757 0.609 0.687 0.771 0.842 0.889Other race/ethnicity 0.9 0.717 0.555 0.637 0.726 0.803 0.871None race/ethnicity 2.9 0.730 0.583 0.656 0.743 0.813 0.870Ignored race/ethnicity 2.2 0.730 0.565 0.649 0.744 0.822 0.878Indigenous 2.4 0.617 0.372 0.510 0.639 0.755 0.838
Native-born 91.1 0.754 0.606 0.684 0.769 0.839 0.886Nicaragua 6.6 0.666 0.512 0.590 0.668 0.749 0.817Panama 0.3 0.648 0.440 0.518 0.638 0.791 0.873Other Central America 0.9 0.822 0.693 0.770 0.842 0.893 0.925U.S. and Canada 0.4 0.849 0.752 0.814 0.864 0.899 0.926Other countries 0.7 0.862 0.770 0.828 0.876 0.911 0.933
Urban 72.7 0.777 0.639 0.713 0.792 0.855 0.896Rural 27.3 0.676 0.522 0.606 0.687 0.760 0.818
San José 32.7 0.780 0.639 0.712 0.794 0.861 0.901Alajuela 19.7 0.740 0.587 0.670 0.759 0.824 0.871Cartago 11.4 0.773 0.643 0.719 0.788 0.846 0.889Heredia 10.1 0.794 0.644 0.737 0.815 0.874 0.909Guanacaste 7.6 0.704 0.554 0.635 0.713 0.787 0.843Puntarenas 9.6 0.692 0.545 0.623 0.699 0.775 0.833Limón 9.0 0.679 0.535 0.613 0.689 0.761 0.828
Less than Primary 4.5 0.648 0.482 0.580 0.660 0.739 0.794Primary 44.0 0.717 0.583 0.654 0.729 0.792 0.839High School 28.9 0.778 0.652 0.722 0.792 0.846 0.883College 22.7 0.848 0.751 0.815 0.865 0.899 0.922
Legislators, senior officials, and managers 1.5 0.804 0.858 0.894 0.920 0.940 0.940Professionals 14.3 0.782 0.834 0.877 0.906 0.926 0.927Technicians and associate professionals 10.0 0.722 0.789 0.842 0.881 0.908 0.909Clerks 7.9 0.700 0.764 0.820 0.865 0.894 0.895Service workers, shop and market sales 20.2 0.644 0.710 0.780 0.837 0.878 0.880Skilled agricultural and fishery workers 4.5 0.520 0.615 0.703 0.776 0.829 0.832Crafts and related trades workers 11.6 0.621 0.688 0.762 0.822 0.867 0.869Plant and machine operators/assemblers 8.7 0.650 0.716 0.776 0.825 0.864 0.865Elementary occupations 21.4 0.547 0.621 0.694 0.764 0.820 0.823
Notes: Education (25 years old or above). Occupation (16 years old or above).Source: Own construction based on 2011 Census.
References
Antón, J. I. and M. Carrera, “Socio-Economic Deprivation among Indigenous Population in Chile,”Paper presented at the LACEA Meeting, Bogotá, 2007.
Antón, J. and F. Del Popolo, “Visibilidad estadística de la población afrodescendiente de AméricaLatina: aspectos conceptuales y metodológicos,” in J. Antón, A. Bello, F. Del Popolo, M. Paixão,and M. Rangel (eds), Afrodescendientes en América Latina y el Caribe—del reconocimientoestadístico a la realización de derechos, Series Población y Desarrollo, 87, Economic Commissionfor Latin America, United Nations, Santiago de Chile, 13–38, 2009.
Review of Income and Wealth 2015
© 2015 International Association for Research in Income and Wealth
27
Review of Income and Wealth, Series 62, Supplement 1, August 2016
VC 2015 International Association for Research in Income and Wealth
S116

Atal, J. P., H. Ñopo, and N. Winder, “New Century, Old Disparities: Gender and Ethnic Wage Gapsin Latin America,” IDB Working Paper Series IDB-WP-109, 2009.
Bello, A. and M. Paixão, “Una mirada a la situación de los derechos de los afrodescendientes enAmérica Latina,” in J. Antón, A. Bello, F. Del Popolo, M. Paixão, and M. Rangel (eds),Afrodescendientes en América Latina y el Caribe—del reconocimiento estadístico a la realización dederechos, Series Población y Desarrollo, 87, Economic Commission for Latin America, UnitedNations, Santiago de Chile, 39–85, 2009.
Blinder, A. S., “Wage Discrimination: Reduced Form and Structural Estimates,” Journal of HumanResources, 8, 436–55, 1973.
Campbell, E., “Afrodescendientes y Multiculturalismo según el Censo 2011,” Paper presented at thesymposium “Costa Rica a la luz del Censo 2011,” INEC, San José, Costa Rica, 2012.
Cappellari, L. and S. P. Jenkins, “Modeling Low Income Transitions,” Journal of Applied Economet-rics, 19, 593–610, 2004.
Chiswick, B. R., “The Effect of Americanization on the Earnings of Foreign-Born Men,” Journal ofPolitical Economy, 86, 897–921, 1978.
Chong, A. and H. Ñopo, “Discrimination in Latin America: An Elephant in the Room?” IADBWorking Paper 614, Inter-American Development Bank, Washington DC, 2007.
———, “The Mystery of Discrimination in Latin America,” Economía, 8, 79–107, 2008.Cruces, G., C. García, and F. Pinto, Visibilidad estadística Datos sobre población afrodescendiente en
censos y encuestas de hogares de América Latina, Proyecto regional Población afrodescendiente deAmérica Latina II, United Nations Development Program, Panama, 2012.
Cunningham, W. and J. P. Jacobsen, “Earnings Inequality Within and Across Gender, Racial, andEthnic Groups in Four Latin American Countries,” Policy Research Working Paper 4591, LatinAmerica and Caribbean Region, Human Development Department, The World Bank, Washing-ton DC, 2008.
de Ferranti, D., G. E. Perry, F. H. G. Ferreira, and M. Walton, “Group-Based Inequalities: The Rolesof Race, Ethnicity, and Gender,” in D. de Ferranti, G. E. Perry, F. H. G. Ferreira, and M. Walton(eds), Inequality in Latin America and the Caribbean: Breaking with History? World Bank LatinAmerican and Caribbean Studies, 77–106, 2004.
ECLAC, Censos 2010 y la inclusión del enfoque étnico: hacia una construcción participativa con pueblosindígenas y afrodescendientes de América Latina, Serie Seminarios y Conferencias, 57, EconomicCommission for Latin America, United Nations, Santiago de Chile, 2009.
———, Social Panorama of Latin America 2012, Economic Commission for Latin America, UnitedNations, Santiago de Chile, 2012.
Firpo, S., N. M. Fortin, and T. Lemieux, “Decomposing Wage Distributions Using RecenteredInfluence Function Regressions,” Unpublished Manuscript, University of British Columbia, 2007.
———, “Unconditional Quantile Regressions,” Econometrica, 77, 953–73, 2009.Fortin, M. N., T. Lemieux, and S. Firpo, “Decomposition Methods in Economics,” in O. Ashenfelter
and D. Card (eds), Handbook of Labor Economics, 4, North Holland, Amsterdam, 1–102, 2011.Fuentes, E., “Características demográficas y socioeconómicas de las poblaciones indígenas de Costa
Rica (Censo 2011),” Unpublished Manuscript, INEC, San José, Costa Rica, 2013.Gindling, T. H., “South–South Migration: The Impact of Nicaraguan Immigrants on Earnings,
Inequality and Poverty in Costa Rica,” World Development, 37, 116–26, 2009.Gindling, T. H. and J. D. Trejos, “The Distribution of Income in Central America,” in D.
Sánchez-Ancochea and S. Martí (eds), The Handbook of Central American Governance, Routledge,New York, 75–94, 2013.
González, M. I., “Comparación de las preferencias de fecundidad entre mujeres costarricenses ymujeres nicaragüenses en Costa Rica. 1999,” Población y Salud en Mesoamérica, 3, 1–21, 2005.
Gradín, C., “Why is Poverty so High among Afro-Brazilians? A Decomposition Analysis of the RacialPoverty Gap,” Journal of Development Studies, 45, 1–38, 2009.
———, “Occupational Segregation of Afro-Latinos,” in J. A. Bishop and R. Salas (eds), Inequality,Mobility and Segregation: Essays in Honor of Jacques Silber, Research on Economic Inequality,20, Emerald Group Publishing, Bingley, UK, 63–90, 2012.
———, “Race and Income Distribution: Evidence from the US, Brazil and South Africa,” Review ofDevelopment Economics, 18, 73–92, 2014.
Hall, G. and H. A. Patrinos (eds), Indigenous Peoples, Poverty and Human Development in LatinAmerica: 1994–2004, Palgrave-Macmillan, Basingstoke and New York, 2006.
IACHR, The Situation of People of African Descent in the Americas, Inter-American Commission onHuman Rights, Organization of American States, Washington DC, 2011.
IWGIA, “Indigenous Peoples in Costa Rica”, 2011 Yearbook article (http://www.iwgia.org/regions/latin-america/costa-rica), International Work Group for Indigenous Affairs, Copenhagen.2011.
Review of Income and Wealth 2015
© 2015 International Association for Research in Income and Wealth
28
Review of Income and Wealth, Series 62, Supplement 1, August 2016
VC 2015 International Association for Research in Income and Wealth
S117

———, The Indigenous World 2013, International Work Group for Indigenous Affairs, Copenhagen,2013.
King, M. C., “Occupational Segregation by Race and Sex in Brazil, 1989–2001,” Review of BlackPolitical Economy, 36, 113–25, 2009.
Lennox, C. and C. Minott, “Inclusion of Afro-Descendents in Ethnic Data Collection: TowardsVisibility,” International Journal on Minority and Group Rights, 18, 257–75, 2011.
López, L. A., Evaluación metodológica de la pregunta étnico-racial del censo 2011 de Costa Rica,Proyecto regional Población afrodescendiente de América Latina II, United Nations DevelopmentProgram, Panama, 2013.
Marquette, C. M., “Nicaraguan Migrants in Costa Rica,” Población y Salud en Mesoamérica, 4, 1–30,2006.
Medina, F. and M. Galván, “Descomposición del coeficiente de Gini por fuentes de ingreso: Evidenciaempírica para América Latina 1999–2005,” Serie Estudios estadísticos y prospectivos, 63, Eco-nomic Commission for Latin America, United Nations, Santiago de Chile, 2008.
Meléndez, C. and Q. Duncan, El Negro en Costa Rica, 12th edition, Editorial Costa Rica, San José,Costa Rica, 2012.
Minott, C., “Historia y avances legislativos de Costa Rica en materia de discriminación,” Seminariointernacional sobre el avance de equidad e inclusión social, Brasilia, 2005.
Murillo, C., “Vaivén de arraigos y desarraigos: identidad afrocaribeña en Costa Rica, 1870–1940,”Revista de Historia, 39, 187–206, 1999.
Ñopo, H., New Century, Old disparities: Gender and Ethnic Earning Gap in Latin Americaand the Caribbean, Inter-American Development Bank and World Bank, Washington DC,2012.
Oaxaca, R. L., “Male-Female Wage Differentials in Urban Labor Markets,” International EconomicReview, 14, 693–709, 1973.
Oaxaca, R. L. and M. R. Ransom, “Identification in Detailed Wage Decompositions,” Review ofEconomics and Statistics, 81, 154–57, 1999.
Patrinos, H. A., “The Costs of Discrimination in Latin America,” Studies in Comparative InternationalDevelopment, 35, 3–17, 2000.
Putnam, E., “Ideología Racial, Práctica Social y Estado Liberal en Costa Rica,” Revista de Historia, 39,139–86, 1999.
———, “La población afrocostarricense según los datos del censo de 2000,” in L. Rosero (ed.), CostaRica a la luz del censo del 2000, Centro Centroamericano de Población de la Universidad de CostaRica, San José, Costa Rica, 2004.
Rangel, M., “Una panorámica de las articulaciones y organizaciones de los afrodescendientes enAmérica Latina y el Caribe,” in J. Antón, A. Bello, F. Del Popolo, M. Paixão, and M. Rangel(eds), Afrodescendientes en América Latina y el Caribe—del reconocimiento estadístico a larealización de derechos, Series Población y Desarrollo, 87, Economic Commission for LatinAmerica, United Nations, Santiago de Chile, 87–103, 2009.
Salardi, P., “The Evolution of Gender and Racial Occupational Segregation in Brazil—1987 to 2006:Differences between Formal and Non-Formal Labour Markets,” Review of Income and Wealth,2014. doi: 10.1111/roiw.12159
Sandoval I., A. S. Solano, and C. Minott (eds), Percepciones de los costarricenses sobre la poblaciónafrodescendiente, UNICEF-IDESPO, San José, Costa Rica, 2010.
Sintonen, H., R. E. Bonilla-Carrión, and P. Ashorn, “Nicaraguan Migration and the Prevalence ofAdolescent Childbearing in Costa Rica,” Journal of Immigrant and Minority Health, 15, 111–18,2013.
Smith-Castro, V., “Experiencias de Discriminación Social de Inmigrantes Nicaragüenses en CostaRica: Reacciones Afectivas y Atribuciones Causales,” Revista Interamericana de Psicología/Interamerican Journal of Psychology, 44, 368–81, 2009.
Solano, E., “La población indígena en Costa Rica según el censo 2000,” in L. Rosero (ed.), Costa Ricaa la luz del censo del 2000, Centro Centroamericano de Población de la Universidad de Costa Rica,San José, Costa Rica, 2004.
Telles, E. E., “Racial Ambiguity among the Brazilian Population,” Ethnic and Racial Studies, 25,415–41, 2002.
Trejos, J. D., “Pobreza, desigualdad y oportunidades: una visión de largo plazo,” Serie de DivulgaciónEconómica, IICE-16, Instituto de Investigaciones en Ciencias Económicas, Universidad de CostaRica, San José, Costa Rica, 2012.
UNDP, Análisis de la situación socioeconómica de la población afroperuana y de la poblaciónafrocostarricense y su comparación con la situación de las poblaciones afrocolombiana yafroecuatoriana, Proyecto Regional Población afrodescendiente de América Latina II, UnitedNations Development Program, Panama, 2012.
Review of Income and Wealth 2015
© 2015 International Association for Research in Income and Wealth
29
Review of Income and Wealth, Series 62, Supplement 1, August 2016
VC 2015 International Association for Research in Income and Wealth
S118

Vargas, J. C. and J. A. Barquero, “Capital humano y social de los Nicaragüenses con experienciamigratoria a Costa Rica y Estados unidos,” Estudios Migratorios Latinoamericanos, 56, 123–43,2005.
Vásquez, W. F., “Ethnic and Gender Wage Discrimination in Guatemala,” Journal of DevelopingAreas, 44, 109–26, 2011.
Yun, M. S., “A Simple Solution to the Identification Problem in Detailed Wage Decompositions,”Economic Inquiry, 43, 766–72, 2005.
———, “Identification Problem and Detailed Oaxaca Decomposition: A General Solution and Infer-ence,” Journal of Economic and Social Measurement, 33, 27–38, 2008.
Supporting Information
Additional Supporting Information may be found in the online version of this article at thepublisher’s web-site:
Table A1: Summary variables used to construct the wellbeing composite indexTable A2: Sample composition (%) by race/ethnicity and country of birthTable A3: OLS (mean) and RIF (non-normalized) regressions of wellbeing index (·100) by
race/ethnicity (Robust standard errors in parentheses)Table A4: OLS (mean) and RIF (non-normalized) regressions of wellbeing index (·100) by
country of birth (Robust standard errors in parentheses)Figure A1: Aggregate decomposition of the gap in wellbeing at different points
Mean and selected quantilesFigure A2: Detailed decomposition (characteristics effect) of the gap in wellbeing
Mean and selected quantilesFigure A3: Aggregate decomposition of the gap in wellbeing
Mean and selected quantilesFigure A4: Detailed decomposition (characteristics effect) of the gap in wellbeing
Mean and selected quantilesFigure A5: Aggregate decomposition of the gap in wellbeing: Blacks
Mean and selected quantilesFigure A6: Detailed decomposition (characteristics effect) of the gap in wellbeing: Blacks
Mean and selected quantiles
Review of Income and Wealth 2015
© 2015 International Association for Research in Income and Wealth
30
Review of Income and Wealth, Series 62, Supplement 1, August 2016
VC 2015 International Association for Research in Income and Wealth
S119