Immigration and diversity in Brussels
23
246 Andrea Rea IMMIGRATION AND DIVERSITY Andrea Rea Brussels is a city built by waves of migration, first by migratory movements within Belgium and then, more recently, by the many migratory flows that have turned Brussels into an undeniably multicultural city. is multiculturality is seen in the very high proportion of foreigners who live in the city but also the cultural stamps on its component neighbourhoods. e diversity of Brussels’ population is socio-economic as well. In a nutshell, Brussels is a culturally diverse and socially fragmented city. Its socio-economic and ethnic fragmen- tation is reflected by strong spatial segregation, too. e foreigners who live in Brussels and the Brussels ‘natives’ of immigrant descent consist of both poorly and highly skilled workers, shopkeepers and businessmen, employees, and civil servants. All of this gives Brussels a kaleidoscope image. Its many hues are also a reflection of the city’s relatively weak identity compared with those of Flanders and Wallonia. Whilst it is true that Brussels has been a primarily French-speaking city since the 1960s, it is not defined by the French language alone. Several recent analyses stress the city’s international identity due to the more widespread use of English (Van Parijs, 2007; Corijn & Vloeberghs, 2009). Whilst this is true, it must not overshadow some other solid realities of the city, such as the use of Tamazight, Turkish, Lingala, Spanish, Polish, Portuguese, etc. All in all, Brussels cannot be reduced to a single identity, other than recognition of its multiculturality. Stating that Brussels is a mul- ticultural rather than international city, at a time when multiculturalism has become discredited by many European politicians (Merkel, Cameron, Sarkozy, Leterme), means recognising and not forgetting its great socio-economic diversity, especially its working-class background. e Brussels identity thus cannot be reduced to Belgium’s traditional cleavages, especially the French- speaking/Flemish-speaking divide, and even though French is the dominant language, French-speaking Belgian culture does not necessarily dominate everywhere. To be more precise, this culture has also been contaminated by and mixed with the cultures that have been reinvented by the city’s various waves of immigrants and the Brussels urban cultures that have transformed the city over the past few decades, as reflected in particular in the performing and other arts (song, theatre, cinema, literature, street performance, and so on). However, this last dimension will not be covered in this chapter. Instead, we shall concentrate on Brussels’ foreign population, employment, political participation, and integration policies in Brussels.
Transcript of Immigration and diversity in Brussels
246 A n d r e a R e a
immigration and diversityAndrea Rea
Brussels is a city built by waves of migration, first by migratory movements within Belgium and then, more recently, by the many migratory flows that have turned Brussels into an undeniably multicultural city. This multiculturality is seen in the very high proportion of foreigners who live in the city but also the cultural stamps on its component neighbourhoods. The diversity of Brussels’ population is socio-economic as well. In a nutshell, Brussels is a culturally diverse and socially fragmented city. Its socio-economic and ethnic fragmen-tation is reflected by strong spatial segregation, too. The foreigners who live in Brussels and the Brussels ‘natives’ of immigrant descent consist of both poorly and highly skilled workers, shopkeepers and businessmen, employees, and civil servants. All of this gives Brussels a kaleidoscope image. Its many hues are also a reflection of the city’s relatively weak identity compared with those of Flanders and Wallonia. Whilst it is true that Brussels has been a primarily French-speaking city since the 1960s, it is not defined by the French language alone. Several recent analyses stress the city’s international identity due to the more widespread use of English (Van Parijs, 2007; Corijn & Vloeberghs, 2009). Whilst this is true, it must not overshadow some other solid realities of the city, such as the use of Tamazight, Turkish, Lingala, Spanish, Polish, Portuguese, etc. All in all, Brussels cannot be reduced to a single identity, other than recognition of its multiculturality. Stating that Brussels is a mul-ticultural rather than international city, at a time when multiculturalism has become discredited by many European politicians (Merkel, Cameron, Sarkozy, Leterme), means recognising and not forgetting its great socio-economic diversity, especially its working-class background. The Brussels identity thus cannot be reduced to Belgium’s traditional cleavages, especially the French-speaking/Flemish-speaking divide, and even though French is the dominant language, French-speaking Belgian culture does not necessarily dominate everywhere. To be more precise, this culture has also been contaminated by and mixed with the cultures that have been reinvented by the city’s various waves of immigrants and the Brussels urban cultures that have transformed the city over the past few decades, as reflected in particular in the performing and other arts (song, theatre, cinema, literature, street performance, and so on). However, this last dimension will not be covered in this chapter. Instead, we shall concentrate on Brussels’ foreign population, employment, political participation, and integration policies in Brussels.
247I m m i g r a t i o n a n d d i v e r s i t y
the history of immigrAtion in brUssels
Brussels is doubtless better known internationally than Belgium, the country of which it is the capital. Brussels today refers as much to a city as to an institution, the umbrella institution for all the European institutions as a group. So, when the media, especially the international media, talk about Brussels, they refer primarily to the European Union’s institutions. However, Brussels has many institutional identities: capital of Belgium, capital of Flanders, a region of Belgium, and the European institutions’ capital – a strange fate for this city situated at the crossroads of many borders. Although Saskia Sassen (1991) does not consider Brussels to be a global city, it effectively is one: a mul-ticultural, international, bilingual city in which French- and Dutch-speakers live side by side.
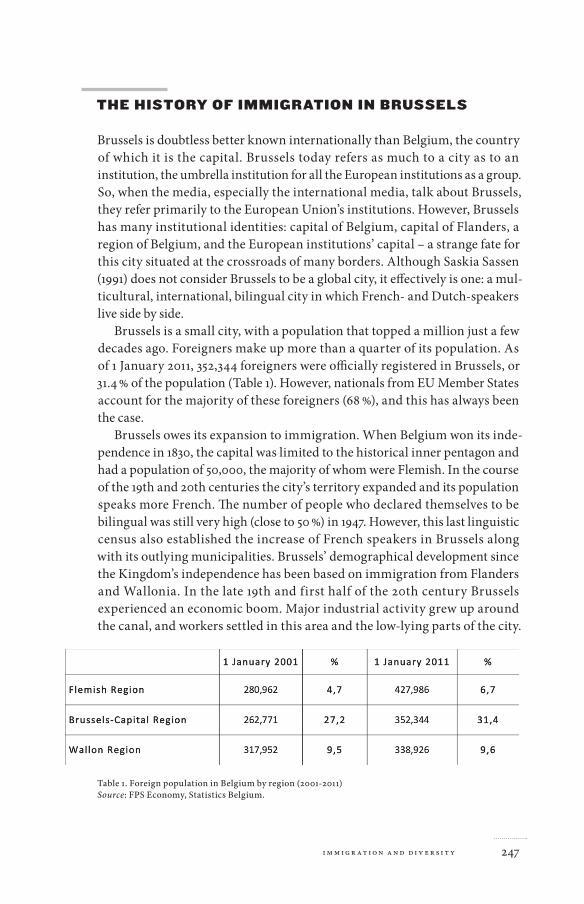
Brussels is a small city, with a population that topped a million just a few decades ago. Foreigners make up more than a quarter of its population. As of 1 January 2011, 352,344 foreigners were officially registered in Brussels, or 31.4 % of the population (Table 1). However, nationals from EU Member States account for the majority of these foreigners (68 %), and this has always been the case.
Brussels owes its expansion to immigration. When Belgium won its inde-pendence in 1830, the capital was limited to the historical inner pentagon and had a population of 50,000, the majority of whom were Flemish. In the course of the 19th and 20th centuries the city’s territory expanded and its population speaks more French. The number of people who declared themselves to be bilingual was still very high (close to 50 %) in 1947. However, this last linguistic census also established the increase of French speakers in Brussels along with its outlying municipalities. Brussels’ demographical development since the Kingdom’s independence has been based on immigration from Flanders and Wallonia. In the late 19th and first half of the 20th century Brussels experienced an economic boom. Major industrial activity grew up around the canal, and workers settled in this area and the low-lying parts of the city.
Table 1. Foreign population in Belgium by region (2001-2011)Source: FPS Economy, Statistics Belgium.
248 A n d r e a R e a
Up until the start of the 1970s the metalworking, garment, textile, automobile assembly, building, and food industries made the country’s capital its leading industrial city. The industrial facilities’ locations and the housing pattern helped to create a lasting pattern of urban segregation. A northwest/southeast axis continues to divide the city’s population by economic level and structure even today. The bulk of its working-class population lives in the north-west, in the neighbourhoods stretching along the canal’s two banks and the industrial zone. The population’s increase since World War II is also rooted in the setting up of public administrations in the city and an increase in intense commercial activity, generating a diversification of the population as well. Finally, Brussels took in great numbers of political refugees (French republicans, German socialists, and Polish nationalists) in the course of the 19th century, especially active participants in the 1871 ‘Commune of Paris’ uprising who subsequently fled France.
Up until 1960 Brussels’ foreign population was very small, accounting for 6-10 % of the total population. Whereas Wallonia and Flanders took in waves of immigrants between the two world wars and after World War II, starting in 1946, just a few businessmen and craftsmen trickled into Brussels. Immigrant workers began moving into Brussels in the early 1960s, just before immigration was officially halted in 1974. The city’s industrial and services activities were such that employers had to call upon more and more additional manpower. Whilst immigrants from southern Europe, basically Spaniards, made up the bulk of the influx in the beginning, Moroccans became the first foreign community in Brussels as of 1977. Although the Turkish population is numerically smaller than certain European foreign communities (the French, Italians, and Spaniards), Turks are perceived as being the second largest foreign community in Brussels.
The foreign population of Brussels surged in the 1970s, changing some of the capital’s neighbourhoods in a far-reaching and lasting way. Whilst immigration on work visas was halted in 1974, the greatest increase in the foreign population occurred after that date. This was due in particular to increased use of the family reunification measures offered by the law after the borders were sealed and the new arrivals’ high birth rates. Together, these two trends changed the fates of the country’s urban areas and school populations’ compositions. So, the foreign population counted by the 1981 census was particularly high, which led to many xenophobic reactions from certain citizens and many local officials. These reactions also stemmed from a failure to understand why the immigrant population was rising in certain neighbour-hoods although the immigration of ‘guest workers’ had been halted. The concentration of immigrant communities in certain municipalities resulted from their finding housing in Brussels’ working-class neighbourhoods,
249I m m i g r a t i o n a n d d i v e r s i t y
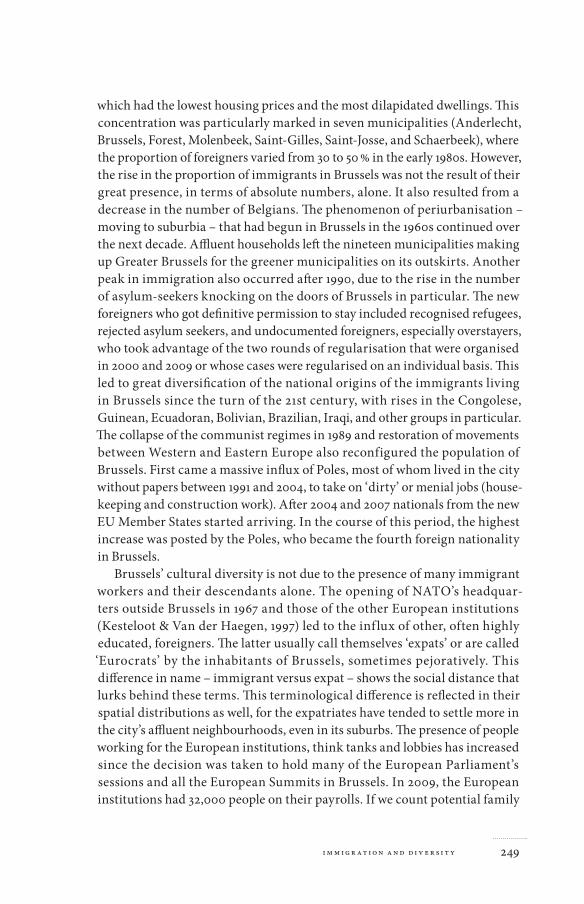
which had the lowest housing prices and the most dilapidated dwellings. This concentration was particularly marked in seven municipalities (Anderlecht, Brussels, Forest, Molenbeek, Saint-Gilles, Saint-Josse, and Schaerbeek), where the proportion of foreigners varied from 30 to 50 % in the early 1980s. However, the rise in the proportion of immigrants in Brussels was not the result of their great presence, in terms of absolute numbers, alone. It also resulted from a decrease in the number of Belgians. The phenomenon of periurbanisation – moving to suburbia – that had begun in Brussels in the 1960s continued over the next decade. Affluent households left the nineteen municipalities making up Greater Brussels for the greener municipalities on its outskirts. Another peak in immigration also occurred after 1990, due to the rise in the number of asylum-seekers knocking on the doors of Brussels in particular. The new foreigners who got definitive permission to stay included recognised refugees, rejected asylum seekers, and undocumented foreigners, especially overstayers, who took advantage of the two rounds of regularisation that were organised in 2000 and 2009 or whose cases were regularised on an individual basis. This led to great diversification of the national origins of the immigrants living in Brussels since the turn of the 21st century, with rises in the Congolese, Guinean, Ecuadoran, Bolivian, Brazilian, Iraqi, and other groups in particular. The collapse of the communist regimes in 1989 and restoration of movements between Western and Eastern Europe also reconfigured the population of Brussels. First came a massive influx of Poles, most of whom lived in the city without papers between 1991 and 2004, to take on ‘dirty’ or menial jobs (house-keeping and construction work). After 2004 and 2007 nationals from the new EU Member States started arriving. In the course of this period, the highest increase was posted by the Poles, who became the fourth foreign nationality in Brussels.
Brussels’ cultural diversity is not due to the presence of many immigrant workers and their descendants alone. The opening of NATO’s headquar-ters outside Brussels in 1967 and those of the other European institutions (Kesteloot & Van der Haegen, 1997) led to the inf lux of other, often highly educated, foreigners. The latter usually call themselves ‘expats’ or are called ‘Eurocrats’ by the inhabitants of Brussels, sometimes pejoratively. This difference in name – immigrant versus expat – shows the social distance that lurks behind these terms. This terminological difference is reflected in their spatial distributions as well, for the expatriates have tended to settle more in the city’s affluent neighbourhoods, even in its suburbs. The presence of people working for the European institutions, think tanks and lobbies has increased since the decision was taken to hold many of the European Parliament’s sessions and all the European Summits in Brussels. In 2009, the European institutions had 32,000 people on their payrolls. If we count potential family
250 A n d r e a R e a
members, this figure must be doubled. The Brussels-Europe Liaison Office adds another 1500 interns a year and 2000 people belonging to the parliamen-tary groups. This obviously puts a very special face on Brussels compared with the other cities of Europe and explains why there are so many EU Member State nationals in the Capital of Europe.
Over time, the immigrants of Moroccan and Turkish descent, who were particularly stigmatised, integrated the urban space, social relations, and imaginations. It should be added that changes in the law on acquiring Belgian citizenship led a great many Moroccans and Turks to become Belgian. So, close to two-thirds of the city’s Moroccan and Turkish residents became Belgian, with most of them retaining home-country citizenship as well. Official statistics do not provide a good reflection of people’s ethnic origins in Brussels. The ethnic social order that took shape over the past thirty years has helped to reinforce ethnic and racial segregation in housing, schools, and public areas. Whilst the presence of these immigrants and their descendants is no longer contested or illegitimate, it is not yet truly recognised. This is especially the case when reference is made to their religious identities, especially for Muslims. The ‘immigrant problem’ has given way, in certain respects, to the ‘Muslim problem’. There are many Muslims (Dassetto, 2011) and Muslim institutions (Torrekens, 2009) in the poor municipalities of Brussels. Although their presence has often been the subject of social and political issues that have sometimes been given very intense media coverage, especially the matter of wearing headscarves in school, at work, etc., this situation has produced very little actual violence or strife to date. Of course, there is a certain tension between some groups’ fear of people’s retreating into religion and the denun-ciation of Islamophobia by others in Brussels, but to date this tension has spawned very few open conflicts.
foreigners And people of foreign descent in brUssels
What does the word ‘foreigner’ encompass? The foreigner is first and foremost a legal category designating the ‘non-national’. However, it is worthwhile considering the differences that exist between ‘foreigner’ and ‘immigrant’. Before the European Union was established, the laws in most countries in Europe made a distinction between foreigners and nationals. Since the EU was set up, the Member States’ laws recognise three different categories: foreigners, EU Member State nationals, and their own nationals. These three categories lead to different types of citizenship. So, the national is a full-fledged citizen who enjoys all the rights conferred by the State of which s/he is a national.

251I m m i g r a t i o n a n d d i v e r s i t y
Based on the principle of non-discrimination enshrined in EU law since the 1957 Treaty of Rome, the rights of EU nationals have been broadened even when they live in a European country other than the one of which they are citizens. Still, it would be wrong to believe that the rights of EU nationals residing in a country other than their own are identical to those of the country’s nationals. So, they do not have all the political rights of a national and may be expelled from the territory on grounds of public security, for health reasons, or due to the absence of means of subsistence. This is also the case for the third category, i.e., nationals of non-EU States or ‘Third-country nationals’, as they are known in European parlance. Such foreigners have fewer rights than EU Member State nationals. However, this legal difference does not erase all the differences between non-EU and EU nationals. Whereas the former are often referred to as immigrants, the latter are more likely to be called expatriates. The difference between an immigrant and an expatriate is not a legal one; rather, it is social and symbolic. The immigrant is a social category that combines the legal dimension, the quality of foreigner, and the sociological dimension; it is that of individuals who have lower social and symbolic positions in the social hierarchy. In contrast, the expatriate is a social category in which the legal dimension is connected to a high social and symbolic rank in the social hierarchy. ‘Immigrant’ and ‘expatriate’ can then go on to combine with the categories of non-EU and EU nationals. Immigrants from third countries are generally considered to be ‘the Others’ in Europe (Bonjour et al., 2011). That is why the Japanese and Americans living in Brussels are usually considered to be expatriates whereas the Chinese and Brazilians are called immigrants. This categorisation also corresponds to the ideas that society has of the social categorisation of immigrants at a given time. So, it is important to underline that a Pole residing in Brussels in 1999 was usually labelled as an immigrant whereas a Pole residing in Brussels in 2010 was also labelled as an expatriate, since this corresponds to the two representations of Poles in Brussels that were current during these two time periods.
These different categorisations can also be presented in another guise following the example of Adrian Favell’s typology (2008). Favell distinguishes amongst three types of migration: traditional non-European immigration, Eurostars/Eurocities, and East-West Movers. The first category refers to the movements of low-skilled workers and asylum seekers. To these two groups we can then add the people who arrive under family reunification measures. This category embraces a very wide diversity of passports, ethnic origins, and religions. These foreigners are called ‘migrants’ because they have rather low positions in society’s social strata. The second category is an umbrella for those whom he calls ‘free movers’. These are highly educated individuals who work for private companies, international companies, and international
252 A n d r e a R e a
organisations such as the European institutions and NATO. They belong to the middle and upper classes and are perceived as and perceive themselves to be an elite. They often support a post-national project and are working for the development of a cosmopolitan identity. Those who work for the European institutions can be considered ‘pioneers of European Integration from below’. The third type is a hybrid category, that of East-West Movers. It specifically concerns people from the Eastern European countries that have joined the European Union who are avid users of the freedom of movement. These are people who arrived in Brussels after 1989. They are often very dynamic, well-educated, and skilled. However, they are less often perceived to be free movers than migrants. Several profiles of foreigners co-exist within this group: some are closer to traditional immigrants and others to free movers. This typology corresponds fairly well to the various types of foreigner that one finds in Brussels.
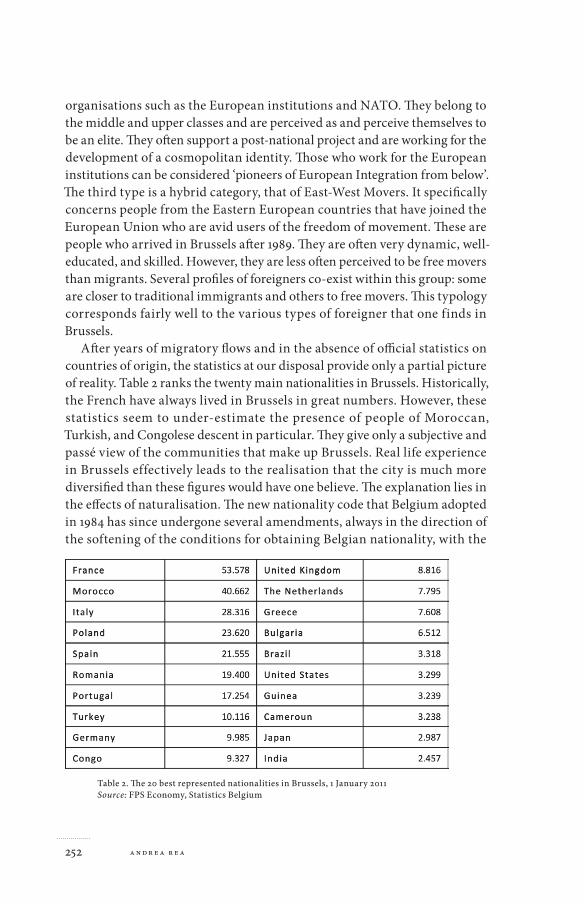
After years of migratory flows and in the absence of official statistics on countries of origin, the statistics at our disposal provide only a partial picture of reality. Table 2 ranks the twenty main nationalities in Brussels. Historically, the French have always lived in Brussels in great numbers. However, these statistics seem to under-estimate the presence of people of Moroccan, Turkish, and Congolese descent in particular. They give only a subjective and passé view of the communities that make up Brussels. Real life experience in Brussels effectively leads to the realisation that the city is much more diversified than these figures would have one believe. The explanation lies in the effects of naturalisation. The new nationality code that Belgium adopted in 1984 has since undergone several amendments, always in the direction of the softening of the conditions for obtaining Belgian nationality, with the
Table 2. The 20 best represented nationalities in Brussels, 1 January 2011Source: FPS Economy, Statistics Belgium

253I m m i g r a t i o n a n d d i v e r s i t y
exception of the last reform, of 2012, which toughened the conditions once again. So, 210,000 people in the Brussels-Capital Region became Belgian citizens between 1988 and 2007. The bulk of the new Belgians were originally Moroccans, Turks, and Congolese. Moreover, the statistics do not take account of the children who acquired Belgian citizenship by virtue of enforcement of the law granting citizenship to those who are born in Belgium ( jus soli). Based on the data available in 2010 (CECLR, 2011), close to two-thirds of the city’s Moroccans, Turks, and Congolese (approx. 90,000, 30,000 and 11,000 people, respectively) have become Belgians, whereas this trend is much weaker amongst EU Member State nationals, who tend more often to keep their original nationalities.
One of the main characteristics of these foreign populations’ presence in Brussels concerns their spatial patterns of residence, with a spatial concen-tration that espouses the strong spatial segregation by socio-economic level that characterises the ‘native’ population (Kesteloot et al., 2001; De Boosere & Willaert, 2006). Given the recent changes of nationality, statistics based on citizenship alone do not reflect the spatial segregation of ethnic minorities in Brussels properly. On 1 January the following municipalities in the BCR had the most foreigners: Saint-Gilles (45.7 %), Ixelles (44.3 %), Etterbeek (42.1 %), and Saint-Josse (40.2 %). With the exception of the last named, foreigners from the EU-27 were more numerous than third-country nationals. This distribu-tion corresponds to neither the distribution of ethnic minorities in Brussels nor residents’ own impressions of life in Brussels. The municipalities with histories of a strong foreign presence are Saint-Josse, Saint-Gilles, Schaerbeek, Molenbeek, Anderlecht, Forest and Brussels. The percentages of foreigners counted in the censuses of 1981 and 1991 varied between 52 and 39 %. Non-Europeans made up large shares of these percentages.
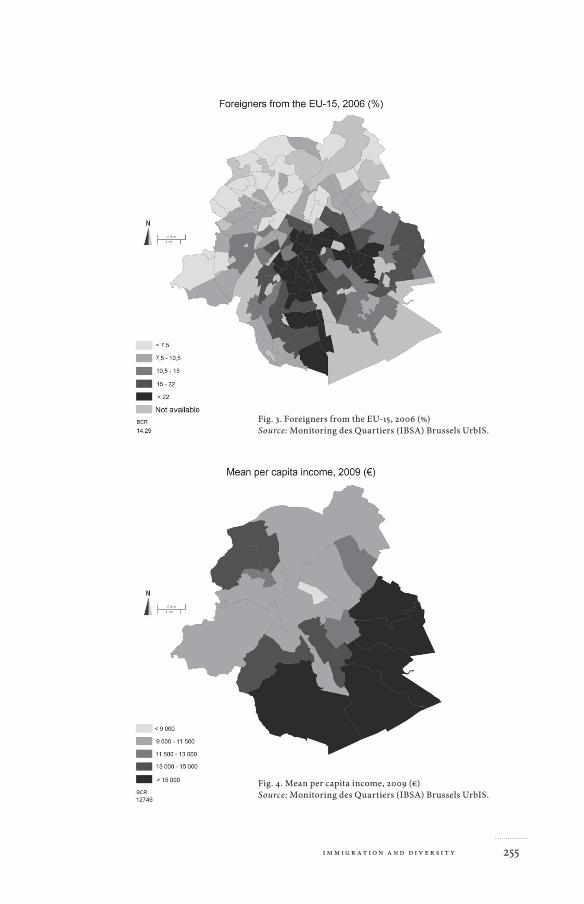
As the following figures, based on 2006 data, show, the city’s Moroccans live mostly along Brussels’ poor crescent, that is, around the canal for Anderlecht, Molenbeek and Brussels and in the low-lying parts of the city for Saint-Gilles, Forest, Schaerbeek and Saint-Josse (Figure 1). The Turkish population is even more clustered, basically in two municipalities, namely, Saint-Josse and Schaerbeek (Figure 2). In the 1960s, arriving foreigners first set foot in the city’s traditional transit neighbourhoods, i.e., along the canal and around the two main railroad stations (Midi and Nord). Unlike these two groups, EU-15 nationals are concentrated in the south-eastern part of the city in particular (Figure 3). The highest proportions of these populations are seen in Ixelles, Etterbeek, Saint-Gilles, Uccle and Woluwe-Saint-Lambert, that is, the region’s richest municipalities (Figure 4). Consequently, the spatial concentrations of the immigrants and their descendants result from a twofold process, namely, socio-economic factors and nationality. The intertwining of socio-economic

254 A n d r e a R e a
Fig. 1. Foreigners from North Africa (%)Source: Monitoring des Quartiers (IBSA) Brussels UrbIS.
Fig. 2. Foreigners from Turkey, 2006 (%)Source: Monitoring des Quartiers (IBSA) Brussels UrbIS.
255I m m i g r a t i o n a n d d i v e r s i t y
Fig. 3. Foreigners from the EU-15, 2006 (%)Source: Monitoring des Quartiers (IBSA) Brussels UrbIS.
Fig. 4. Mean per capita income, 2009 (€)Source: Monitoring des Quartiers (IBSA) Brussels UrbIS.
256 A n d r e a R e a
factors and national origins is particularly strong in Brussels, giving a picture of a socially and economically divided city. The fracture line of national origins settles into that of the population’s economic level.
In the 1960s Spaniards and other immigrants from southern Europe settled in these working-class neighbourhoods, which had previously taken in an influx of Polish Jews between 1920 and 1930. The Moroccan and Turkish immigrants subsequently settled in these same transit neighbourhoods, which had the lowest housing prices and most dilapidated accommodations (for example, certain houses did not have bathrooms). Whilst some people interpret this clustering as a tendency to cling to one’s own community, we must stress the structural causes of this settlement pattern, which have to do with the housing market’s structure, the families’ socio-economic levels, and the prestige associated with certain neighbourhoods. Since their arrival in the late 1960s, immigrants and their descendants have for the most part remained in the same neighbourhoods for the above-mentioned structural reasons. We must also add that a piece of legislation, namely, Article 18bis of the law of 15 December 1980 concerning residence by foreigners, gave burgomasters the possibility from 1985 to 1991 to ban all new moves by foreigners into their municipalities, in hopes of reducing their concentration. This article had the opposite effect, in a way, because it led to immigrants and their descendants’ staying put. Over time, immigrants’ residential conditions improved (Kesteloot, 2007). Immigrants now have more access to social housing, especially once they become Belgian, and more of them own their lodgings, especially in neighbourhoods where they have lived for thirty years. The economic crisis and unemployment in these populations have strengthened this tendency to remain in neighbourhoods where the odds of finding decent accommodation are slimmer. The new waves of immigrants are also settling in these neighbourhoods. So, there are many Latinos and Brazilians in Saint-Gilles and Forest, while one finds many Congolese in Molenbeek (the ‘African’ neighbourhood of Matongé in Ixelles is primarily a shopping and business district). Due to rising real estate prices and rents, many of the Congolese who used to live in Ixelles have moved to other municipalities where real estate pressures are lower. The same goes for the Poles who arrived in the late 1990s. Whilst their settlement pattern is more dispersed, they, too, tended to cluster in the municipalities of Brussels’ ‘first ring’, i.e., the inner city.
257I m m i g r a t i o n a n d d i v e r s i t y
foreigners And the lAboUr mArket
Brussels contributes 20 % of the country’s gross domestic product (GDP), whereas it accounts for only 10 % of Belgium’s population. What is more, the city has the highest growth rate in the country. Yet these data do not correspond to reality on the Brussels job market. Brussels had the highest unemployment rate in Belgium in 2012, i.e., 20.8 %, compared with 7 % in Flanders and 15 % in Wallonia. To explain this gap between the production of wealth and jobs on the one hand and a high unemployment rate on the other hand, two explanations can be put forward (Wayens et al., 2006). First, 55 % of jobs in Brussels are filled by people from outside Brussels. More than 400,000 people commute from Flanders and Wallonia each day to work in Brussels. The region’s residents profit only partially from its economic growth. Second, businesses, which sometimes require large amounts of space and are dependent on good road networks and driving conditions, avoid locating their facilities in Brussels. Instead, they prefer the suburban municipalities where they can not only find a more skilled workforce, but can also count on more solvent customers.
Consequently, the high unemployment rate cannot be attributed to a mismatch between the workers’ levels of training and employers’ needs, although such a gap does exist. We must also consider the arguments that explain the city’s social fragmentation and segregation. Of course, the inner-city neighbourhoods where numerous immigrants and people of immigrant descent live do have high percentages of low-skilled workers. According to Wayens and co-workers (2006), however, a difference neverthe-less persists between inhabitants of the poor crescent and those of the rest of the BCR with the same level of skills. For example, 17 % of the working age-population with university degrees and living in the poor crescent is unemployed, compared with 8 % with the same level of instruction in the rest of the region. Vandermotten (2008) confirmed the inequality of access to jobs for people with identical degrees according to the neighbourhood. So, he found an unemployment rate of 36 % for graduates of higher education in certain neighbourhoods of Molenbeek versus 5 % in the south-eastern part of the city. Of course, poor mastery of Dutch is a major handicap for getting a job in Brussels, even a low-skilled job such as working in a supermarket, for example. Okkerse and Termotte (2004) also showed in a study of graduates of higher education that Belgians of foreign descent were twice as likely, Turks and Moroccans six times as likely, and other non-EU foreigners four times as likely as native Belgians to end up unemployed.
To explain this situation, the two elements that characterise the situations of people of immigrant descent on the job market must be taken into account,
258 A n d r e a R e a
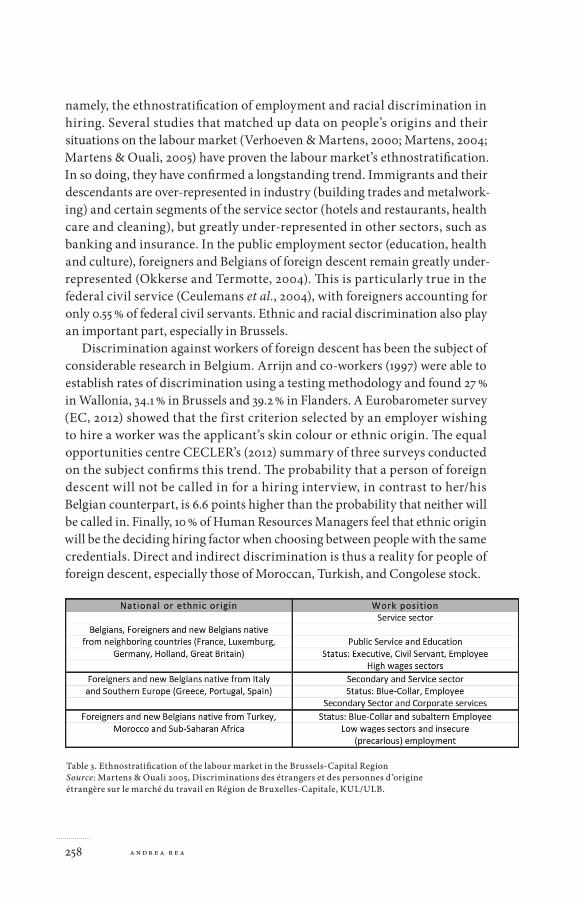
namely, the ethnostratification of employment and racial discrimination in hiring. Several studies that matched up data on people’s origins and their situations on the labour market (Verhoeven & Martens, 2000; Martens, 2004; Martens & Ouali, 2005) have proven the labour market’s ethnostratification. In so doing, they have confirmed a longstanding trend. Immigrants and their descendants are over-represented in industry (building trades and metalwork-ing) and certain segments of the service sector (hotels and restaurants, health care and cleaning), but greatly under-represented in other sectors, such as banking and insurance. In the public employment sector (education, health and culture), foreigners and Belgians of foreign descent remain greatly under-represented (Okkerse and Termotte, 2004). This is particularly true in the federal civil service (Ceulemans et al., 2004), with foreigners accounting for only 0.55 % of federal civil servants. Ethnic and racial discrimination also play an important part, especially in Brussels.
Discrimination against workers of foreign descent has been the subject of considerable research in Belgium. Arrijn and co-workers (1997) were able to establish rates of discrimination using a testing methodology and found 27 % in Wallonia, 34.1 % in Brussels and 39.2 % in Flanders. A Eurobarometer survey (EC, 2012) showed that the first criterion selected by an employer wishing to hire a worker was the applicant’s skin colour or ethnic origin. The equal opportunities centre CECLER’s (2012) summary of three surveys conducted on the subject confirms this trend. The probability that a person of foreign descent will not be called in for a hiring interview, in contrast to her/his Belgian counterpart, is 6.6 points higher than the probability that neither will be called in. Finally, 10 % of Human Resources Managers feel that ethnic origin will be the deciding hiring factor when choosing between people with the same credentials. Direct and indirect discrimination is thus a reality for people of foreign descent, especially those of Moroccan, Turkish, and Congolese stock.
Table 3. Ethnostratification of the labour market in the Brussels-Capital RegionSource: Martens & Ouali 2005, Discriminations des étrangers et des personnes d’origine étrangère sur le marché du travail en Région de Bruxelles-Capitale, KUL/ULB.
259I m m i g r a t i o n a n d d i v e r s i t y
Of course, low levels of qualification are also a major handicap. The data regarding academic performance, especially the PISA tests (Jacobs et al., 2009, 2011), show that the first two generations of immigrants do markedly less well in school than native Belgians, and this holds true in the Flemish- and French-speaking school systems alike. However, other information provided by the ministries of education show that many young people leave secondary schools without certificates, with children of immigrant stock figuring prominently amongst them. Moreover, the latter are often channelled towards technical and vocational schools, where they do not necessarily enrol in the most effective sections for finding a job in Brussels. The matter of social inequality’s leading to academic inequality is particularly important in Brussels, where competition between schools leads to very pronounced academic segregation, a problem that the French-speaking and Flemish Communities’ new decrees limiting parents’ choices of schools for their children are trying to address.
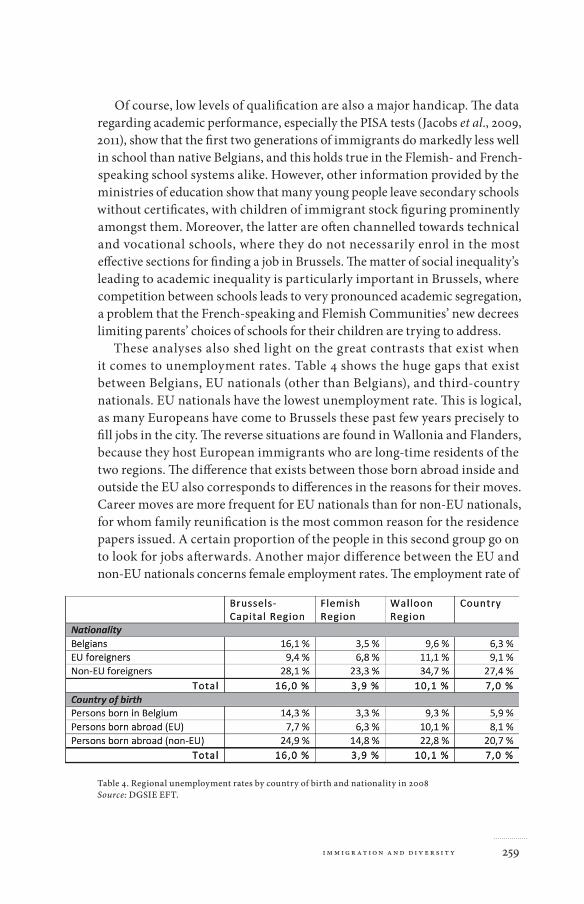
These analyses also shed light on the great contrasts that exist when it comes to unemployment rates. Table 4 shows the huge gaps that exist between Belgians, EU nationals (other than Belgians), and third-country nationals. EU nationals have the lowest unemployment rate. This is logical, as many Europeans have come to Brussels these past few years precisely to fill jobs in the city. The reverse situations are found in Wallonia and Flanders, because they host European immigrants who are long-time residents of the two regions. The difference that exists between those born abroad inside and outside the EU also corresponds to differences in the reasons for their moves. Career moves are more frequent for EU nationals than for non-EU nationals, for whom family reunification is the most common reason for the residence papers issued. A certain proportion of the people in this second group go on to look for jobs afterwards. Another major difference between the EU and non-EU nationals concerns female employment rates. The employment rate of
Table 4. Regional unemployment rates by country of birth and nationality in 2008Source: DGSIE EFT.

260 A n d r e a R e a
non-EU female immigrants is very low, and has been since the 1960s. In 2010, the employment rate of Belgian women was 58.7 %, compared with 55.2 % for European women and 37 % for non-European women. This great difference is explained in particular by family and personal reasons, especially in the case of the oldest women, who had major home-making duties.
Being present on the labour market concerns the members of not only the old waves of immigration, but the new ones, too. The new immigrants on the labour market belong to three categories and basically have two profiles: low-skilled workers and high-skilled workers. The former basically find work in ‘3D jobs’, i.e., jobs that are dirty, demanding and dangerous. They are undoc-umented workers, illegals whose situations have been regularised, or workers from the new EU Member States (mainly Poles, Romanians and Bulgarians). However, the employment of low-skilled workers has shifted from industry to the service sector, which explains, moreover, the surge in female job-related emigration (Timmerman et al., 2012). These workers are made up of two groups. The first one has been around a relatively long time, as it goes back to the early 1990s. Brussels effectively had a large population of undocumented foreigners in the 1990s (Adam et al., 2002), some of whom were regularised in 2000 and 2009. These were asylum seekers for whom the application procedure was extremely long and overstayers, that is, foreigners (students, temporary workers and tourists) who entered the country legally but remained after their authorisations to stay or enter the territory lapsed, plus ‘wetbacks’ who did not enter the territory legally. Many Poles who since 1991 needed only a tourist visa to enter Belgium also came during those years and remained illegally, until their situation changed in 2004. These undocumented residents lived inside the State’s borders whilst remaining outside its legal and social institutions. Keeping these immigrant workers in an irregular situation regarding their stay or employment status helped to reinforce their dependence on their employers and, consequently, to reduce their freedom and mobility. The work done by undocumented immigrants was concentrated in certain labour market segments that were not easy to relocate at the time (horticulture, construction, the hospitality industry, garment industry and services). Many Poles living in Brussels in irregular situations between 1995 and 2004 held illicit jobs in the building trades (for men) and housework (for women). In the 2000s some of them left these very unstable jobs, which were then filled by new immigrants, especially Latinos and Brazilians (Martiniello et al., 2010).
Another major process also took place in the 2000s. The EU’s enlargement to 27 Member States was accompanied by two movements. The first one consisted of the relocation of businesses, especially industrial concerns, from the EU-15 to the twelve new Member States in order to increase the businesses’ profit margins by manufacturing in low-wage countries. This process was
261I m m i g r a t i o n a n d d i v e r s i t y
accompanied by another movement that could be called ‘internal outsourcing’ (Rea, 2006). Belgium, like other countries, sought out immigrant workers amongst the nationals of the new EU Member States, especially from Poland, Romania, and Bulgaria. This gave rise to a sort of internalisation within the European area of the hiring pool for some low-skilled migrant workers. Given that Belgium imposed transitional measures for job market access, many Poles (from 2004 to 2009), Romanians and Bulgarians needed work permits. The number of work permits rose fivefold between 2004 and 2009. This steady increase was particularly pronounced in Flanders, where horticulture absorbed 95 % of the Polish workers (Martiniello et al., 2010). So, 53.4 % of the B permits issued in 2008 went to Poles, 13.5 % to Romanians and 6.3 % to Bulgarians. In 2010, Romanian and Bulgarian workers got 39.2 % and 15 % of the work permits issued, with Poles no longer needing such permits. The work permit, which was historically used to regulate labour migration, was thus used primarily by the nationals of the new EU Member States during the transition periods imposed on them. In Brussels, most of the permits were granted in the building and health care sectors. The labour market’s deregulation and businesses’ increasing reliance on subcontracting gave rise to another way to hire immigrant workers, namely, a boom in the number of self-employed people and employees on secondment. The number of Poles, Romanians and Bulgarians who have set themselves up as self-employed people since 2004 has risen sharply, reflecting a way to circumvent labour laws. Some employers even require their workers to become self-employed. This enables the employers to avoid applying for work permits and to shift social security costs to the workers. Since the transposition of the Services Directive (Directive 96/71/EC) and the 2002 Regulation on the secondment of workers, the number of workers on secondment who are no longer covered by Belgian social security has skyrocketed. A great many Polish and Romanian workers come to work in the building sector and services in Brussels under this status. The number of Polish, Romanian and Bulgarian workers on secondment exceeds the number of work permits issued to workers of these same nationalities. The same goes for third-country nationals: the number of those on secondment also exceeds the number of those with work permits. Labour migration concerns high-skilled workers as well. A large proportion of them consist of expatriates who come to work for international institutions in Brussels, especially for the European institutions. Others come from non-European countries, particu-larly Indians and Japanese working for international companies.

262 A n d r e a R e a
politicAl pArticipAtion
Whilst people of foreign descent are often subjected to labour market dis-crimination, they paradoxically enjoy fair political representation, both on the local and regional level. The numbers of Belgians of foreign extraction who stand for election and are elected have been rising steadily since the mid-1990s. This strong political participation and representation creates a unique situation Brussels from both the European and global standpoint. The municipal elections of 2000 were a landmark for the political participation of citizens of foreign extraction, at least in the Brussels-Capital Region, for the number of representatives of ethnic minorities who were elected rose considerably. Only 14 (2.1 %) of the 651 city councilmen elected in the 1994 municipal elections were of non-European descent. In contrast, 90 (13.8 %) of the 652 councilmen elected in the 2000 municipal elections were of non-European (mainly Moroccan) descent (Jacobs, Martiniello, & Rea, 2002). This trend was confirmed in the local elections of October 2006, for 138 (20 %) of the 663 city councilmen elected were of non-European descent, once again, mainly Moroccan (Jacobs & Rea, 2007), but also of Turkish and Congolese extraction. This figure rose yet again after the 2012 local elections, in which the first burgomaster of Turkish descent was elected.
The same process can be seen in the regional elections. In 1995, four (5.3 %) of a total of 75 regional MPs were of non-European descent (three of Moroccan and one of Tunisian roots). This representation was strengthened during the 1999 regional elections, rising to nine (12 % of the total), all of North African extraction (eight from Morocco and one from Tunisia). Belgians of non-Euro-pean extraction once again played a major role in the 2004 regional elections’ campaigns, and their efforts definitely paid off, for 17 of the 72 French-speaking members of the Brussels Regional Parliament belonged to ethnic minorities. Twelve of them had Moroccan roots, two had Turkish roots, and the others had Tunisian, Congolese, and Guinean backgrounds. Of the 17 Flemish-speakers elected to the Brussels Regional Parliament, one was of Moroccan descent. All in all, 20.2 % of the 89 regional MPs were thus of non-European extraction. The numbers rose yet again in 2009, and the trend spread to all the parties, with an increase for the (French-speaking) Christian Democratic Party (CDH). In the (French-speaking) Socialist Party, 12 of the 21 MPs in the regional parlia-mentary group are of foreign extraction. Of the 23 regional MPs of foreign extraction, 14 are of Moroccan background, three of Turkish background, three of Congolese background, one of Guinean background, one of Belgo-Libyan background, and one of Belgo-Rwandan background.
What is more, the growing success of politicians of foreign extraction has also affected the executive branch. So, on the local level, 12 councilmen of
263I m m i g r a t i o n a n d d i v e r s i t y
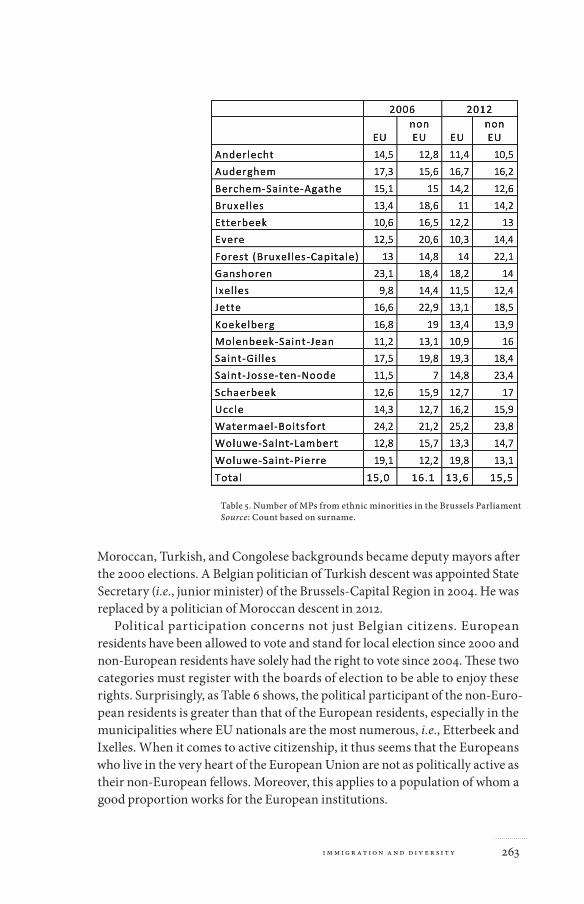
Moroccan, Turkish, and Congolese backgrounds became deputy mayors after the 2000 elections. A Belgian politician of Turkish descent was appointed State Secretary (i.e., junior minister) of the Brussels-Capital Region in 2004. He was replaced by a politician of Moroccan descent in 2012.
Political participation concerns not just Belgian citizens. European residents have been allowed to vote and stand for local election since 2000 and non-European residents have solely had the right to vote since 2004. These two categories must register with the boards of election to be able to enjoy these rights. Surprisingly, as Table 6 shows, the political participant of the non-Euro-pean residents is greater than that of the European residents, especially in the municipalities where EU nationals are the most numerous, i.e., Etterbeek and Ixelles. When it comes to active citizenship, it thus seems that the Europeans who live in the very heart of the European Union are not as politically active as their non-European fellows. Moreover, this applies to a population of whom a good proportion works for the European institutions.
Table 5. Number of MPs from ethnic minorities in the Brussels ParliamentSource: Count based on surname.

264 A n d r e a R e a
The strong political representation of Belgians of immigrant descent is explained by various factors (Jacobs et al., 2010). The first factor has to do with the acquisition of Belgian nationality coupled with ethnic concentration. The local electorates have increased, and at the same time the political parties have opened up to the ‘new Belgians’, as they are called. The spatial concentration of foreigners has thus led to strong political representation in the municipalities where such large ethnic communities reside. Political competition between French-speakers and Flemish speakers has increased ethnic minorities’ chances of being represented. It was very important for the French-speaking parties to capture this new electorate, the great majority of which speaks French in any event. Increasing the proportion of French-speakers by turning these ‘new Belgians’ into French-speaking voters, candidates and elected officials allows them to thwart the Flemish ambition to dominate the Brussels-Capital Region. The political representation of ethnic minorities is not just an issue for these new citizens. It can also be used by the dominant national components in the struggle around the very future of Brussels. This political competition does not concern issues of belonging to a certain Belgian community and ethnic group. It also has to do with the very pronounced social and economic divide that runs through the Brussels-Capital Region. The various social components of Brussels are now better represented politically. Structurally, the minorities’ strong political representation is above all the result of their strong participa-tion in elections. This results automatically from the law itself, for voting is compulsory in Belgium. Voting laws in Belgium provide an opportunity for what is called an ‘ethnic vote’ to emerge. The electoral system is more or less proportional. Voters may vote for either an entire list (a party) or for certain candidates in one list (split tickets are not allowed). In the second case, they cast ‘votes of preference’. The candidates’ positions on their parties’ electoral lists reflect the party’s preferences as to whom should be elected: the candidates at the top of the list are supposed to have greater chances of being elected than those at the bottom. The possibility given to the voters to cast votes of preference reduces the importance of the parties’ rankings by getting the voters involved in the competition amongst candidates on a given list. This
Table 6. Registration for local elections, 2006 and 2012Source: Ministry of the Interior.

265I m m i g r a t i o n a n d d i v e r s i t y
system explains why Belgians of foreign extraction are elected even when they are placed low down in the party’s initial ranking. They are elected thanks to the votes of preference. Then, in addition to this process, there is the influence of the ‘stemblok’ or voting blocs, that is, collective preferred choices that lead to groups of candidates’ being elected from the party lists.
chAllenges for the fUtUre
The challenges of the presence of immigrants and people of immigrant stock can be partially taken on board by integration policies, which are developed in duplicate in Brussels, where there is a Flemish integration policy and a French-speaking integration policy. Still, these policies have rather limited fields of action. On the Flemish side, two decrees govern the integration policy in Brussels. The first one, issued in 1998, concerns the recognition and financing of ethnic and cultural minorities. This policy supports self-organising by immigrants, cultural activities, and ‘living together’. A second decree, adopted more recently, aims to set up an integration pathway for newcomers. The idea is to provide Dutch language courses and courses on Belgian institutions and culture. This pathway is compulsory for some third-country nationals in Flanders, but not in Brussels. The French-speaking Community will soon have a similar policy. On the French-speaking side, the social cohesion decree of 2004 is aimed at supporting mainly literacy training, support for elementary schoolchildren, and ‘living together’ initiatives. These integration policies are important for old and new immigrants alike.
Nevertheless, more general policies are what will meet the two major challenges of immigration in Brussels. The first one is socio-economic. The second one concerns Brussels’ identity.
The failure to prevent young people of immigrant descent from being idle will ultimately become a risk factor. The feeling of being discriminated against and excluded increases resentment amongst such young people, who can also find in a new breakaway religious identity a solution to their despair, albeit at the risk of endangering Brussels’ social cohesion. Economic solutions must be found to boost the hiring of low-skilled young people. This indubitably requires an education reform as well in order to improve the scholastic achieve-ments of second- and third-generation immigrants. There is no contesting the need for implementing an affirmative action policy in Brussels to combat racial hiring discrimination.
When looking at Brussels’ identity it is important to assert more strongly its image as an open city (Delwit et al., 2007). Beyond the fact that Brussels is the institutional node of any advanced federal or confederal project put
266 A n d r e a R e a
on the table, Brussels must find its identity as a multicultural, international city. Exploiting the urban dimension of this identity would enable it to rise above the clash of the two national minorities and many ethnic minorities. However, such a city cannot be built by kicking out its most vulnerable residents and the descendants of low-skilled immigrants who came to this country seeking jobs, especially if such expulsions are reactions to real estate pressures and speculation. Various entities are doing their utmost to propose projects that would help to produce a Brussels identity that would transcend the traditional cleavages. This redefinition makes use of economic, social and urban factors, but cultural factors as well. Being a ‘Brusseler’ is also the result of the cosmopolitan and multicultural dimension of the city, which is on the verge of becoming a component of the future Brussels identity. From this standpoint, the Zinneke1 Parade is the most widely hailed and significant project to contribute to the construction of this open identity. This biennial parade gathers thousands of people of all social and cultural walks of life in the streets of Brussels. The extremely colourful Zinneke Parade is the fruit of intense work by the city’s inhabitants and associations. The event triggers the production of multicultural urban artistic creations that are highly symbolic of the mixing that typifies Brussels.
References
Adam, I., Ben Mohamed, N., Kagné, B. & Martiniello, M. & Rea, A. (2002). — Histoire sans-papiers. Brussels: Edition Vista.Arrijn, P., Feld, S. & Nayer, A. (1997). — Discrimination à l’embauche. Brussels: Services fédéraux des affaires Scientifiques, Techniques et Culturelles.Bonjour, S., Rea A., Jacobs D. (Eds) (2001). — The Others in Europe. Legal and Social Categorization in Context. Brussels: Presses de l’Université de Bruxelles.CECLR (Centre for Equal Opportunities and Opposition to Racism) (2011). —Migrations. Brussels. CECLR.CECLR (Centre for Equal Opportunities and Opposition to Racism) (2012). —Baromètre de l’emploi. Brussels. CECLR.Ceulemans, E., Ouali, N., Valkeneers, A., Janssens, K. & van de Maele, M. (2005). —Diversiteit in de Federale Overheid. Studie naar de tewerkstelling van vreemde-lingen en personen met een vreemde afkomst binnen het federale administratieve openbare ambt. Leuven: Centrum voor Sociologisch Onderzoek.Corijn, E. & Vloeberghs, E. (2009). — Bruxelles! Brussels: VUBPRESS.
1 Zinneke is Brusseler dialect for ‘mutt’. (Translator’s note)
267I m m i g r a t i o n a n d d i v e r s i t y
Dassetto, F. (2011). — L’iris et le croissant. Louvain-la-Neuve: Presses universitaires de Louvain.Deboosere, P. & Willaert, D. (2006), — Atlas de la santé et du social de Bruxelles-Capitale 2006, Brussels: Coll. Les Dossiers de l’Observatoire de Bruxelles.Delwit, P. Rea, A. & Swyngedouw, M. (Eds) (2007). — Bruxelles – Ville ouverte. Paris: L’Harmattan.Eurobarometer (2012). —Favell, A. (2008). Immigration, Migration and Free Movement in the Making —of Europe. In Checkel J. and Katzenstein P., European Identity. Cambridge: Cambridge University Press.Jacobs, D., Martiniello M., & Rea, A. (2002). Changing Patterns of Political —Participation of Citizens of Immigrant Origin in the Brussels Capital Region: The October 2000 Elections, Journal of International Migration and Integration/Revue de l’intégration et de la migration internationale, 3 (2), 2002, pp. 201-221.Jacobs, D., Bousetta, H., Rea, A., Martiniello, M. & Swyngedouw, M. (2006). Qui —sont les candidats aux élections bruxelloises? Le profil des candidats à l’élection au parlement de la Région de Bruxelles Capitale du 13 Juin 2004, Cahiers Migrations, Collection No. 37, Louvain-la-Neuve, Academia Bruylant.Jacobs, D., Rea, A., Teney, C., Callier L., Lothaire, S. (2009). L’ascenseur social reste —en panne. Les performances des élèves issus de l’immigration en Communauté française et en Communauté flamande. Brussels: Fondation Roi Baudouin.Jacobs, D., Teney, C., Rea, A., & Delwit P. (2010). Voting Patterns among Ethnic —Minorities in Brussels (Belgium) During the 2006 Local Elections. Acta politica. 45, pp. 273-297.Jacobs, D. & Rea, A. (2011). Gaspillage de talents. Les écarts de performances dans —l’enseignement secondaire entre élèves issus de l’immigration et les autres d’après l’étude PISA 2009. Brussels: Fondation Roi Baudouin.Jacobs, D. & Rea, A. (2007). Les élus non-Belgo-Belges. — L’agenda interculturel, 254, pp. 16-19.Kesteloot C. & Van Der Haegen H. (1997). Foreigners in Brussels 1981-1991: Spatial —Continuity and Social Change. Tijdschrift voor Sociale en Economische Geografie. 88, 2, pp. 105-119.Kesteloot C., De Turck A.M., Vandermotten C., Marissal P. & Van Hamme G. —(2001). Structures sociales et quartiers en difficulté dans les régions urbaines belges/ Sociale structuren en buurten in moeilijkheden in de Belgische stadsgewesten. Bruxelles: Politique des Grandes Villes/Grootstedenbeleid, Brussels.Kesteloot, C. (2007). Le logement des minorités à Bruxelles. In Delwit, P. Rea, A. & —Swyngedouw M. (Eds). Bruxelles ville ouverte. Paris: L’Harmattan. pp. 19-36.Martens, A. (2004). Discriminations et actions positives dans l’emploi en Flandre —et à Bruxelles. Quelques résultats de recherches empiriques. In Martiniello, M. &
268 A n d r e a R e a
Rea, A. Affirmative action. Des discours, des politiques et des pratiques en débat. Louvain-La-Neuve: Bruylant-Academia. pp. 160-195.Martens, A. & Ouali, N. (Eds) (2005). Discriminations des étrangers et des —personnes d’origine étrangère sur le marché du travail de la Région de Bruxelles-Capitale (Rapport de synthèse). Brussels & Leuven: Actiris.Martiniello, M., Rea, A., Timmerman, C., & Wets, J. (Eds) (2010). — Nouvelles migrations et nouveaux migrants en Belgique. Ghent: Academia Press.Okkerse, L. & Termotte, A. (2004). Etude statistique n° 111. Singularité des —étrangers sur le marché de l’emploi. A propos des travailleurs allochtones en Belgique. Brussels: National Institute of Statistics.Rea, A. (2006) — . Les politiques d’immigration : des migrations ordonnées aux migrations débridées In Khader, B., Martiniello, M., Rea, A. & Timmerman, C. (Eds.). Penser l’immigration et l’intégration autrement. Une initiative belge inter-universitaire. Brussels: Bruylant. pp. 177-208.Sassen, S. (1991). — The Global City. Princeton: Princeton University Press.Timmerman C, Martiniello M., Rea A. & Wets J. (Eds) (2012). — Femmes dans les processus migratoires contemporains, Ghent, Academia Press.Torrekens, C. (2009). — L’islam à Bruxelles. Brussels: Ed. de l’Université de Bruxelles.Van Parijs, P. (2007). Bruxelles capitale de l’Europe: les nouveaux défis linguis- —tiques. Brussels Studies, issue 6.Vandermotten, C. (2008). — Evolution socio-économique, reproduction sociale et formation à Bruxelles. Brussels: Commission Consultative Formation Emploi Enseignement.Verhoeven, H., Martens, A. (2000). — Arbeidsmarkt en diversiteit. Over de vreemde eend in de bijt. Leuven: Dossier Steunpunt WAV.Wayens, B. et al. (2006). Marché du travail In Deboosere, P., Willaert, D., — Atlas de la santé et du social de Bruxelles-Capitale 2006. Brussels: Les Dossiers de l’Observatoire de Bruxelles.