EUROPEAN COMMISSION Brussels, 9.12.2020 SWD(2020 ...
290
EN EN EUROPEAN COMMISSION Brussels, 9.12.2020 SWD(2020) 331 final COMMISSION STAFF WORKING DOCUMENT Accompanying the document COMMUNICATION FROM THE COMMISSION TO THE EUROPEAN PARLIAMENT, THE COUNCIL, THE EUROPEAN ECONOMIC AND SOCIAL COMMITTEE AND THE COMMITTEE OF THE REGIONS Sustainable and Smart Mobility Strategy – putting European transport on track for the future {COM(2020) 789 final}
-
Upload
khangminh22 -
Category
Documents
-
view
0 -
download
0
Transcript of EUROPEAN COMMISSION Brussels, 9.12.2020 SWD(2020 ...

EN EN
EUROPEAN COMMISSION
Brussels, 9.12.2020
SWD(2020) 331 final
COMMISSION STAFF WORKING DOCUMENT
Accompanying the document
COMMUNICATION FROM THE COMMISSION TO THE EUROPEAN
PARLIAMENT, THE COUNCIL, THE EUROPEAN ECONOMIC AND SOCIAL
COMMITTEE AND THE COMMITTEE OF THE REGIONS
Sustainable and Smart Mobility Strategy – putting European transport on track for the
future
{COM(2020) 789 final}

Contents
1 Introduction ........................................................................................................................................ 5
2 European mobility and transport – where are we heading? .............................................................. 9
2.1 Identifying the greenhouse gas emissions gap for transport ................................................. 9
2.2 Developments under current policies .................................................................................... 10
2.3 Overall economic, social and technological trends ............................................................... 17
2.3.1 Economic context ................................................................................................................. 17
2.3.2 Demographic trends .............................................................................................................. 23
2.3.3 New technologies, changing consumer behaviour and working conditions ......................... 26
2.4 Impact of the COVID-19 pandemic on the transport sector ............................................... 31
2.4.1 Air transport .......................................................................................................................... 32
2.4.2 Waterborne transport ............................................................................................................ 33
2.4.3 Road transport ...................................................................................................................... 35
2.4.4 Rail transport ........................................................................................................................ 36
2.4.5 Urban transport ..................................................................................................................... 37
3 Key policy developments over the last decade .................................................................................. 39
3.1 Sustainability ........................................................................................................................... 39
3.2 Digitalisation ............................................................................................................................ 46
3.3 Single Market .......................................................................................................................... 51
3.4 Safety & security ..................................................................................................................... 56
3.5 Social issues ............................................................................................................................. 60
3.6 Enforcement of the EU transport acquis .............................................................................. 66
4 Challenges to sustainable, smart and resilient mobility .................................................................. 70
4.1 The sustainability challenge ................................................................................................... 70
4.1.1 Zero- and low-emission vehicles and renewable and low carbon transport fuels ................. 81
4.1.1.1 Fuel supply ................................................................................................................... 88
4.1.1.2 Fuel infrastructure ........................................................................................................ 90
4.1.1.3 Other incentives ........................................................................................................... 91
4.1.1.4 Pollutant standards, batteries and roadworthiness........................................................ 92
4.1.2 Clean ports and airports ........................................................................................................ 95
4.1.2.1 Ports ............................................................................................................................. 95
4.1.2.2 Airports ...................................................................................................................... 100
4.1.3 Sustainable urban mobility ................................................................................................. 105
4.1.3.1 Urban vehicle access regulations ............................................................................... 109
4.1.3.2 Walking, cycling and micromobility ......................................................................... 110
4.1.3.3 Public transport, shared mobility and transport on demand ....................................... 115
4.1.3.4 Urban logistics ........................................................................................................... 117
4.1.4 Multimodality and modal shift ........................................................................................... 118
4.1.4.1 Improving multimodal freight operations .................................................................. 124
4.1.4.2 Rail freight ................................................................................................................. 127
4.1.4.3 Inland waterways ....................................................................................................... 130
4.1.4.4 Short sea shipping ...................................................................................................... 131
4.1.5 Better incentives to users .................................................................................................... 131
4.1.5.1 Pricing and internalisation of external costs .............................................................. 131
4.1.5.2 Better information to users......................................................................................... 140
4.2 The challenge of digitalisation and modernisation ............................................................. 144
4.2.1 Smart multimodal transport – challenges for seamless experience .................................... 144
4.2.1.1 Cross-border multimodal challenges ......................................................................... 145
2
4.2.1.2 Multimodal & collaborative economy challenges in urban context ........................... 147
4.2.2 Intelligent Transport Systems and connected, automated mobility .................................... 150
4.2.2.1 ITS challenges in road transport ................................................................................ 150
4.2.2.2 ITS challenges in other modes of transport................................................................ 152
4.2.3 Innovation and mobility of the future ................................................................................. 157
4.2.4 Digital enablers ................................................................................................................... 159
4.2.4.1 Data for smart transport and mobility ........................................................................ 160
4.2.4.2 Artificial Intelligence, 5G and other key enabling technologies ................................ 164
4.3 The challenge of making the transport sector more resilient ............................................ 166
4.3.1 Crisis resilience and management ...................................................................................... 167
4.3.1.1 Governance ................................................................................................................ 172
4.3.2 Infrastructure and investment ............................................................................................. 174
4.3.2.1 Capacity across modes ............................................................................................... 177
4.3.2.2 Future-proof infrastructure......................................................................................... 181
4.3.2.3 Access to funding....................................................................................................... 184
4.3.3 Single Market ..................................................................................................................... 187
4.3.3.1 Single Market for road transport ................................................................................ 187
4.3.3.2 Single European Railway Area .................................................................................. 188
4.3.3.3 Aviation Single Market .............................................................................................. 191
4.3.3.4 Waterborne Single Market ......................................................................................... 195
4.3.4 Social aspects ...................................................................................................................... 197
4.3.4.1 Workers’ rights and transition to automation and sustainability ................................ 197
4.3.4.2 Skills and attractiveness of transport jobs .................................................................. 203
4.3.4.3 Access to transport: affordability, availability and accessibility ................................ 205
4.3.4.4 Protection of European passengers and consumers.................................................... 211
4.3.5 Safety and security.............................................................................................................. 216
4.3.5.1 Ever evolving challenges ........................................................................................... 220
4.3.5.2 Safe and secure infrastructure .................................................................................... 224
4.3.5.3 Vehicle safety ............................................................................................................ 225
4.3.5.4 The human factor ....................................................................................................... 226
4.3.5.5 Ensuring a high and equal level of safety and security across modes ........................ 228
4.4 External dimension ............................................................................................................... 233
4.4.1 EU leadership ..................................................................................................................... 234
4.4.2 EU global competitiveness ................................................................................................. 235
4.4.3 External connectivity .......................................................................................................... 237
5 Description of the pathways/scenarios ........................................................................................... 241
5.1 Scenario design ...................................................................................................................... 241
5.2 Analysis of impacts of the pathways/scenarios ................................................................... 246
5.2.1 Impacts on transport activity .............................................................................................. 246
5.2.2 Technology development projections by transport mode ................................................... 248
5.2.2.1 Road transport ............................................................................................................ 248
5.2.2.2 Rail ............................................................................................................................. 251
5.2.2.3 Aviation ..................................................................................................................... 252
5.2.2.4 Inland waterways and national maritime ................................................................... 253
5.2.2.5 International maritime transport ................................................................................ 254
5.2.3 Energy demand and fuel mix projections ........................................................................... 255
5.2.4 GHG emissions from transport ........................................................................................... 257
5.2.5 Impacts on noise, NOx and particulate matter emissions ................................................... 260
5.2.6 Impacts on external costs of transport ................................................................................ 261
5.2.7 Investments ......................................................................................................................... 262
5.2.8 Social impacts ..................................................................................................................... 264
5.2.9 Sensitivity analysis on the COVID-19 pandemic ............................................................... 266
6 Annex I - Analytical methods ......................................................................................................... 268
6.1.1 Description of the modelling tools used ............................................................................. 268

3
6.1.1.1 Main modelling suite ................................................................................................. 268
6.1.2 Assumptions on technology, economics and energy prices ................................................ 277
6.1.2.1 Economic assumptions .............................................................................................. 277
6.1.2.2 Energy prices assumptions ......................................................................................... 278
6.1.2.3 Technology assumptions ............................................................................................ 280
6.1.3 Policies in the existing policies scenario (Baseline scenario) ............................................. 280
6.1.4 Policy scenarios .................................................................................................................. 284
List of figures
Figure 1: The EU’s pathway to sustained economic prosperity and climate neutrality, 1990-2050 ............ 7 Figure 2: Passenger and freight transport activity in the Baseline scenario (average growth rate per year)
.................................................................................................................................................................... 11 Figure 3: Projected evolution of international maritime transport activity in the Baseline scenario .......... 13 Figure 4: Projected evolution of energy consumption per transport mode in 2030 and 2050 relative to
2015 (% change) in the Baseline scenario .................................................................................................. 13 Figure 5: Share of alternative fuels used in transport (including international aviation and maritime) in the
Baseline scenario ........................................................................................................................................ 14 Figure 6: Fuels use in transport (including international aviation and maritime) in the Baseline scenario 15 Figure 7: CO2 emissions from transport (including international aviation but excluding international
maritime) in the Baseline scenario ............................................................................................................. 16 Figure 8: Passenger transport activity in the Baseline and the COVID-Baseline scenarios (cumulative
growth rates for 2015-2030 and 2015-2050) .............................................................................................. 19 Figure 9: Freight transport activity in the Baseline and COVID-Baseline scenarios (cumulative growth
rates for 2015-2030 and 2015-2050) .......................................................................................................... 20 Figure 10: CO2 emissions from transport (including international aviation but excluding international
maritime) in the Baseline and COVID-Baseline scenarios ........................................................................ 21 Figure 11: Workforce working at home several times per month in 2015 ................................................. 28 Figure 12: Market share of all but the principal railway undertakings in 2016 .......................................... 52 Figure 13: The use of EU Pilot concerning mobility and transport infringements between 2015-August
2020 ............................................................................................................................................................ 68 Figure 14: Evolution of transport activity in tonne- and passenger-kilometres in the EU .......................... 70 Figure 15: Share by mode in total transport GHG emissions, including international bunkers, in the EU-
27 in 2018 ................................................................................................................................................... 73 Figure 16: Evolution of GHG emissions by transport mode in the EU-27 (1990 = 1) ............................... 74 Figure 17: Evolution of final energy consumption by sector in the EU (million tonnes of oil equivalent) 82 Figure 18: Transport sector consumption of petroleum products & biofuels, 2000-18 .............................. 82 Figure 19: Number of BEV and PHEV passenger cars in 2020 ................................................................. 83 Figure 20: Number of inland vessels per year of construction in the Belgian and German fleet ............... 87 Figure 21: Number of inland vessels per year of construction in the Danube countries ............................ 87 Figure 22: Situation of the publicly accessible recharging points in 2018 across EU ................................ 91 Figure 23 Cruise ships docking in Barcelona emit 5 times more sulphur than the city’s 560,000 cars every
year ............................................................................................................................................................. 96 Figure 24 CO2 emissions per flight phases ............................................................................................... 103 Figure 25 ATM inefficiencies .................................................................................................................. 104 Figure 26: Annual mean NO2 concentrations observed at traffic stations, 2017 ...................................... 107 Figure 27: Percentile 90.4 of daily mean PM10 concentrations observed at traffic stations, 2017 .......... 108 Figure 28: Annual mean PM2.5 concentrations observed at traffic stations, 2017 .................................. 108 Figure 29: Main mode of transport on a typical day................................................................................. 113 Figure 30: Percentage of road fatalities on urban roads in the EU by transport mode, 2018 ................... 115 Figure 31: Passenger land transport modal split by country (%, 2018) and change in percentage points for
rail (2015-2018) ........................................................................................................................................ 120 Figure 32: Air routes between metropolitan regions where rail travel times are below 2.5 hours by train
.................................................................................................................................................................. 121 Figure 33: Air routes between metropolitan regions where rail travel times are below 4 hours by train . 122

4
Figure 34 Cost level and composition of intermodal transport compared to road-only transport ............ 125 Figure 35 Intermodal terminals with rail access occurrence in Europe .................................................... 126 Figure 36 Minimum rates of taxation laid down in the ETD (1 Jan 2010)
.............................................. 134
Figure 37 Purchase taxes in the EU in 2016 ............................................................................................. 137 Figure 38: Perceived quality of transport infrastructure in the EU countries ........................................... 176 Figure 39: Average peak-hour delay per representative driver (hours per year) in 2018 ......................... 178 Figure 40: Share of different items in household consumption expenditure in the EU ............................ 206 Figure 41: Conditions to switch to more environmentally friendly modes of transport ........................... 208 Figure 42: Road fatalities in the EU and current target ............................................................................ 217 Figure 43: Trend in road deaths per million inhabitants 2010-2019 ........................................................ 218 Figure 44: Overview of the policy scenarios ............................................................................................ 243 Figure 45: Passenger transport activity in the Baseline and the policy scenarios (cumulative growth rates
for 2015-2030 and 2015-2050) ................................................................................................................. 247 Figure 46: Freight transport activity in the Baseline and the policy scenarios (cumulative growth rates for
2015-2030 and 2015-2050) ...................................................................................................................... 248 Figure 47: Shares in the total cars stock by type of drivetrain technology in 2030 and 2050 .................. 249 Figure 48: Shares in the total vans stock by type of drivetrain technology in 2030 and 2050 ................. 250 Figure 49: Shares in the total heavy goods vehicle stock by type of drivetrain technology in 2030 and
2050 .......................................................................................................................................................... 250 Figure 50: Shares in the buses vehicle stock by type of drivetrain technology in 2030 and 2050 ........... 251 Figure 51: Aviation fuels mix in the Baseline and policy scenarios in 2030 and 2050 ............................ 252 Figure 52: Inland waterways and national maritime fuels mix in the Baseline and policy scenarios in 2030
and 2050 ................................................................................................................................................... 253 Figure 53: International maritime fuels mix in the Baseline and policy scenarios in 2030 and 2050 ...... 254 Figure 54: Change in total energy use in transport and in the final energy consumption in 2030 and 2050
compared to 2015 ..................................................................................................................................... 255 Figure 55: Share of alternative fuels in transport (including international aviation and maritime) in 2030
.................................................................................................................................................................. 256 Figure 56: Share of renewable energy in transport in 2030 ...................................................................... 257 Figure 57: Transport fuel mix (including international aviation and maritime) ....................................... 257 Figure 58: Tank to wheel CO2 emissions from transport (excluding international maritime) in 2030 in the
Baseline and policy scenarios ................................................................................................................... 258 Figure 59: Well to wheel CO2 emissions from transport (excluding international maritime) in 2030 and
2050 in the Baseline and policy scenarios ................................................................................................ 260 Figure 60: Change in NOx emissions and PM2.5 emissions in 2030 and 2050 compared to 2015 ......... 261 Figure 61: Change in external costs of air pollution in 2030 and 2050 compared to 2015 ...................... 261 Figure 62: Change in external costs of congestion and accidents in 2030 and 2050 compared to 2015 .. 262 Figure 63: Average annual investments in vehicles, rolling stock, vessels, airplanes and alternative fuels
infrastructure deployment in the Baseline and policy scenarios ............................................................... 263 Figure 64: Additional annual average investments for 2021-2030 under existing policies and to achieve
higher GHG emissions reductions - in billions euros (2015) ................................................................... 264 Figure 65: Households’ annual transport related expenditures in the Baseline and policy scenarios - in
billions euros (2015) ................................................................................................................................. 265 Figure 66: Impacts of at least 55% GHG emissions reduction on transport sector employment (% change
relative to the Baseline scenario) .............................................................................................................. 265 Figure 67: Comparison of key indicators in the MIX scenario and COVID-MIX variant ....................... 266 Figure 68: Interlinkages between models ................................................................................................. 269 Figure 69: Schematic representation of the PRIMES model .................................................................... 270 Figure 70: Schematic representation of the GEM-E3 model .................................................................... 276 Figure 71: Projected EU GDP (2015 = 100) ............................................................................................ 278 Figure 72: International fuel prices assumptions – non-COVID scenarios .............................................. 279 Figure 73: Oil price projections in 2030 according to various sources .................................................... 279 Figure 74: International fuel prices assumptions – COVID scenarios...................................................... 280 Figure 75: Scenario assumptions description (scenarios developed with the PRIMES-GAINS-GLOBIOM
modelling suite) ........................................................................................................................................ 285 Figure 83: Key modelling variables reflecting underlying policy assumptions ....................................... 288

5
1 INTRODUCTION
1. This Staff Working Document accompanies the Communication from the
Commission on the Sustainable and Smart Mobility Strategy, which sets out the
actions needed to ensure that every transport mode plays a role in delivering the
European Green Deal, that smart mobility enables seamless, safe and efficient
connectivity, and that a more resilient Single European Transport Area provides
connectivity for all EU citizens.
2. Sustainable, smart and resilient transport services and infrastructure are vital to
make full use of the economic strengths of all regions of the European Union, to
support the Single Market, recover from the current crisis and stimulate future
growth, and to enable economic, social and territorial cohesion, while preserving
our environment and our health. They also underpin our global competitiveness,
and our international connectivity. The EU transport system provides safe and
secure mobility for Europeans. The transport sector in the EU-27 employs more
than 10 million workers and comprises around 1.1 million enterprises, providing
services to people and businesses within the EU and globally1.
3. Mobility is a critical aspect of social inclusion and an important determinant of
human well-being, especially for disadvantaged groups. Transport, recognised as
an essential service in the European Pillar of Social Rights fulfils a basic need in
enabling citizens to integrate into society and the labour market, but also
constitutes a significant part of household expenditure. Enhanced connectivity and
market opening has contributed to linking transport networks, bringing the EU
together and making it more tangible and accessible for travellers. More needs to
be done however.
4. Addressing the climate and environmental crisis is the defining challenge of our
time and it is an opportunity to relaunch our economies in a sustainable manner. It
requires urgent and sustained action by all actors in our society to preserve the
health, prosperity, and well-being of people in Europe and all over the world.
Responding to this challenge, the European Green Deal2 has set a high level of
ambition for climate neutrality by 2050. It is also Europe’s growth strategy, which
aims to transform the EU into a fair and prosperous society with a resource-
efficient and competitive economy. The economic response to the COVID-19
pandemic offers a unique opportunity to accelerate the green transition.
5. Transport is the only economic sector in which greenhouse gas emissions are
higher than in 1990 and have started growing again since 2013 despite the
mitigation efforts undertaken. This is why the European Green Deal has set the key
objective to deliver a 90% reduction in transport-related greenhouse gas emissions
by 2050. It also stresses that transport is a significant contributor to air pollution
and noise, and has adverse effects on our lands, oceans, rivers and lakes, hence the
need to accelerate the shift to sustainable and smart mobility, and delivering zero
pollution and a toxic-free environment.
1 1.For statistical information, unless otherwise indicated (e.g. EU-27 is mentioned), EU data relating to the period before the
withdrawal of the UK from the Union (i.e. 31 January 2020) includes the UK.
2. For projections (going beyond 2019) reproduced in the document: Unless otherwise indicated (e.g. EU-27 is mentioned), all EU
data also includes the UK, although the UK withdrew from the Union on 31 January 2020. 2 Communication from the Commission to the European Parliament, the European Council, the Council, the European Economic and Social Committee and the Committee of the Regions ‘The European Green Deal’, COM(2019) 640 final.

6
6. In the 2030 Climate Target Plan3, on the basis of the analysis carried out in its
Impact Assessment, the Commission concluded that achieving 55% greenhouse
gas emissions reductions by 2030 is fully achievable, and would not only put the
EU firmly on track to achieve climate neutrality, but would also make EU business
and industry global trailblazers. Achieving at least 55% greenhouse gas emissions
reductions by 2030 would also improve the wellbeing of EU citizens by delivering
significant co-benefits for example in terms of health, improved air quality and
reduced environmental degradation, and it would strongly support the recovery
from the COVID-19 pandemic and the longer-term competitiveness and resilience
of the European economy. The European Green Deal is Europe’s growth strategy
and to ensure we use it to its full potential, it is essential that Next Generation EU
drives our competitive sustainability.
7. The impact assessment accompanying the 2030 Climate Target Plan4 has also
shown that if we only continue with existing policies, the transport sector would
fall short in delivering the contribution needed to achieve the economy-wide target
of at least 55% greenhouse gas emissions reduction by 2030 and climate neutrality
by 2050. Additional policies will thus be needed to close the gap. To achieve this, a
three-pronged set of actions must be taken to make each and every transport mode
more sustainable, make sustainable alternatives widely available, and put in place
the right incentives.
3 Communication from the Commission to the European Parliament, the Council, the European Economic and Social Committee
and the Committee of the Regions ‘Stepping up Europe’s 2030 climate ambition - Investing in a climate-neutral future for the
benefit of our people’, COM(2020) 562 final. 4 Impact Assessment accompanying the Communication from the Commission to the European Parliament, the Council, the
European Economic and Social Committee and the Committee of the Regions ‘Stepping up Europe’s 2030 climate ambition -Investing in a climate-neutral future for the benefit of our people’, SWD(2020) 176 final.

7
Figure 1: The EU’s pathway to sustained economic prosperity and climate neutrality,
1990-2050
Source: COM(2020) 562 final. Commission Communication “Stepping up Europe’s 2030 climate ambition Investing
in a climate-neutral future for the benefit our people
8. Making our mobility and transport smarter and more efficient can greatly help in
achieving our health and environmental objectives. Underpinned by the ubiquitous
presence of smartphones, and other digital technologies and solutions, ranging
from European space data and services to innovative business models, as well as
by the emergence of a shared, collaborative economy, smart mobility concepts can
help improve the use of infrastructure and resources. By integrating the different
transport modes and delivering multimodality, they can transform our travelling
and transport experience, making it safer, smoother, health supporting and, above
all, more sustainable. There is a need to offer a seamless multimodal experience to
all transport users to support sustainable choices, while taking advantage of
Intelligent Transport Systems for safer and more sustainable mobility. Research
and innovation are key to shape the mobility of the future, and the right enablers
for successful digital transformation must also be put in place.
9. The COVID-19 pandemic has had a severe impact on European mobility and the
sector. It has shown the importance of making our transport and mobility more
resilient. Transport workers have been on the frontline, ensuring that essential
services are maintained. They need quality jobs in order to be able to provide a
safe, reliable and affordable service for customers. In addition, despite some
progress, regulatory, administrative and technical barriers and burdens persist in
transport in the majority of Member States, causing inefficiencies and additional
costs to users and the fragmentation of the Single Market. There are still major
gaps and missing links in our infrastructure. At the same time, it is necessary to
modernise fleets in all modes to make them more sustainable.
10. Unless EU policy initiatives towards a Single European Transport Area are
thoroughly implemented at national level, the fragmentation of the transport

8
market will inevitably limit the future quality of transport services in the EU, as the
sector will miss out on the economies of scale and leave growth opportunities
untapped. Moreover, lack of enforcement of social rules, together with divergent
national practices have led to social issues, which may in turn worsen the quality of
transport services, create distortion in the market and lead to an uneven playing
field. Market opening, fair social conditions and quality jobs are thus intrinsically
linked.
11. While safety and security of transport in the EU has greatly progressed, and the EU
remains the safest transport area in the world, in particular in the most frequently
used mode, road transport, a substantial problem remains. In recent years the
reduction of fatalities on EU roads has stagnated, and there was still 22,700 lives in
2019.
12. This Staff Working Document provides an overview of the Commission services’
assessment of the aforementioned challenges – sustainability, digitalisation,
resilience – that the EU transport sector faces, underpinning the Strategy and the
actions put forward within in it. It also briefly describes the expected evolution of
European mobility if we were to rely on existing policies, and outlines some of the
key elements of the economic, social and technological context, including the
impact of the COVID-19 pandemic, and the substantial global dimension of
transport. In addition, it gives an overview of the key policy developments in the
transport sector since the adoption of the 2011 White Paper on transport5. Finally,
this Staff Working Document provides a description of the pathways/scenarios for
reaching the sustainability objectives for the sector, common to those supporting
the 2030 Climate Target Plan6.
5 White Paper Roadmap to a Single European Transport Area – Towards a competitive and resource efficient transport system,
COM(2011) 144 final. 6 However, this Staff Working Document does not analyse in detail the specificities of each action set out in the Strategy. Those will be adequately addressed for each initiative in line with established Better Regulation practices at the time of their development.

9
2 EUROPEAN MOBILITY AND TRANSPORT – WHERE ARE WE HEADING?
2.1 Identifying the greenhouse gas emissions gap for transport
13. The European Green Deal has set the key objective to deliver a 90% reduction in
transport-related greenhouse gas (GHG) emissions by 2050 relative to 1990. This
objective builds on the in-depth analysis accompanying “A Clean Planet for all - A
European strategic long-term vision for a prosperous, modern, competitive and
climate neutral economy”7,8
. Transport excluding international maritime currently
accounts for a quarter of all EU GHG emissions. Road transport alone represents
around 20% of the total.
14. The Commission has undertaken an analysis exploring the impact of key EU level
and Member States policies adopted by the end of 2019, in the so-called Baseline
scenario. To ensure consistency, the same Baseline scenario is used as in the
Impact assessment accompanying the Commission Communication “Stepping up
Europe’s 2030 climate ambition - Investing in a climate-neutral future for the
benefit of our people”9. The Baseline projections show that EU-27 transport
emissions would go down over time, thanks to policies in place driving the roll out
of zero- and low-emission vehicles and the recharging/refuelling infrastructure, the
uptake of renewable and low carbon fuels and improvements in transport system
efficiency. Emissions from transport including intra-EU aviation and intra-EU
maritime are projected to be 18% lower by 2030 compared to 2005, and 40% lower
by 2050 relative to 2005. Compared to 199010
however, this translates into 3%
higher emissions by 2030 and only 25% lower emissions by 2050, due to high
increases in transport emissions during the 1990s11
.
15. Building on the Baseline projections, several scenarios have been developed for
EU-27 in the context of the Impact Assessment accompanying the 2030
Climate Target Plan for increasing the EU’s GHG emission reductions target for
2030 to at least 55% compared with 1990 levels. By 2030, these scenarios achieve
increased climate ambition by intensification of current energy, transport and
climate policies or extension of carbon pricing to new sectors of the economy or
combination of both12 (see section 5). They all achieve climate neutrality by
2050. In addition, the scenarios explore different scopes for the emissions
reduction target that is particularly relevant for international aviation and maritime
transport: intra-EU versus intra- and extra-EU scope. The scenarios achieving
economy-wide emissions reductions of at least 55% by 2030, show that transport
emissions (including intra-EU aviation and intra-EU maritime) would need to
7 In-depth analysis in support of the Commission Communication “A Clean Planet for all - A European strategic long-term vision for a prosperous, modern, competitive and climate neutral economy”, COM(2018) 773, available at:
https://ec.europa.eu/clima/sites/clima/files/docs/pages/com_2018_733_analysis_in_support_en_0.pdf. 8 This covers international aviation but excludes international maritime in line with the 2030 climate and energy policy framework. The in-depth analysis has additionally shown that when the international maritime sector is considered part of the economy-wide net
zero greenhouse gas emissions target, the emissions from international maritime should go down by around 80% by 2050 relative to
1990 (87% decrease compared to 2005). 9 Impact assessment accompanying the Commission Communication “Stepping up Europe’s 2030 climate ambition - Investing in a
climate-neutral future for the benefit of our people”, SWD(2020) 176 final. 10 The base year for defining the level of the climate ambition for 2030 and 2050. 11 When all intra-EU and extra-EU aviation and maritime emissions are accounted, the Baseline scenario results in 13% reduction in
transport emissions by 2030 and 29% decrease by 2050 compared to 2005 levels. 12 While some policies, notably CO2 standards for light duty and heavy duty vehicles are represented in more detail, others are
represented in a more stylised manner and the impacts of such policies are subject to higher uncertainty. Subject to dedicated impact
assessment for each policy initiative, it is possible that different policy instruments, different parameters of these policies (e.g. in
case of CO2 standards for light duty and heavy duty vehicles) and nature of instruments (e.g. regulation, voluntary agreement, financing, information campaign) than the ones assumed in this modelling exercise might be necessary or desired.

10
decrease by 21-23% by 2030 relative to 2005 and 96-97% by 2050. This is
equivalent in terms of the 1990 comparison to reducing transport emissions by 1-
3% by 2030 and by around 94-96% by 205013
.
16. Comparing developments under existing policies (i.e. the Baseline scenario,
achieving 18% emissions reduction in transport by 2030 and 40% by 2050) with
scenarios achieving economy-wide emissions reductions of at least 55% by 2030
and climate neutrality by 2050 (21-23% emissions reduction in transport by 2030
and 96-97% by 2050), shows that additional policies are needed post-2020 in order
to close the gap, and provide a cost-effective transport contribution to the European
Green Deal. While reducing its environmental footprint, increasing the uptake of
renewable and low-carbon fuels and decreasing its GHG emissions, transport also
needs under the Green Deal to continue to meet society's needs, and deliver on its
zero pollution ambition by reducing its other negative environmental and health
impacts. The analysis in section 5 shows how to close this emission gap by 2030
and 2050. Curbing GHG emissions from transport also reduces the EU's
dependence on fossil fuels and brings clear co-benefits leading to reductions of
costs related to air, water, soil pollution, road crashes, congestion and noise
pollution.
2.2 Developments under current policies
17. The Baseline scenario is developed building on a set of assumptions, including
GDP and population projections, fuel prices projections and technology costs, as
well as policies adopted by the end of 2019. It reflects a wealth of policy measures
that drive: (i) the uptake of zero- and low-emission vehicles and the roll-out of
recharging/refuelling infrastructure14
; (ii) the uptake of renewable and low carbon
fuels15
; (iii) improvements in transport system efficiency - by making the most of
digital technologies and smart pricing and further encouraging multi-modal
integration and shifts towards more sustainable transport modes16
. It also includes
initiatives addressing road safety17
, and thus contributing to reducing the external
costs of transport.
18. For aviation, it takes account of the implementation of the EU Emission Trading
Scheme, the Single European Sky, the deployment of SESAR solutions, the
research and development of cleaner aircraft technologies lead by Clean Sky
public-private partnership and aircraft CO2 emissions standards, as part of the so-
called “basket of measures” that aim to reduce emissions from the sector.
19. For maritime, the Baseline scenario reflects the Energy Efficiency Design Index
(EEDI) and the Ship Energy Efficiency Management Plan (SEEMP) adopted by
the International Maritime Organisation (IMO), as well as IMO MARPOL Annex
VI rules as regards the reduction of nitrogen and sulphur oxides emissions, the
13 When all intra-EU and extra-EU aviation and maritime emissions are considered in the scope of EU-27 emissions reduction
target, the projections show that transport emissions (including intra- and extra-EU aviation and maritime) would need to decrease
by 19% by 2030 and 92% by 2050 compared to 2005 levels. 14 It includes the post-2020 CO2 standards for new light duty and heavy duty vehicles, the Clean Vehicles Directive and the
Directive on the deployment of alternative fuels infrastructure. 15 It covers the Renewables Energy Directive, the Fuel Quality Directive and the Directive on the deployment of alternative fuels infrastructure. 16 It includes the TEN-T Regulation supported by CEF funding, the fourth Railway Package, the Rail Freight Corridors Regulation,
the proposed revision of the Eurovignette Directive, the Directive on Intelligent Transport Systems, the European Rail Traffic
Management System European deployment plan, the Regulation establishing a framework for the provision of port services, the
revised EU urban mobility package, etc. 17 Based on the fatality and serious injury savings projected by the changes to the General Safety Regulation (Regulation (EU) 2019/2144) and the Road Infrastructure Safety Management Directive (Directive (EU) 2019/1936) agreed in 2019.

11
latter being transposed into EU legislation by the Sulphur Directive18
. The baseline
also accounts for other initiatives addressing air pollution from inland waterways
vessels19
.
20. The Baseline scenario is a projection of what would happen in the absence of
policy change and not a forecast of likely future developments. It builds on pre-
COVID-19 assumptions, which can be interpreted as assuming full economic
recovery to pre-COVID-19 pandemic levels by 2030. There are large uncertainties
related to the lengths of the pandemic and its impacts on economy and transport
activity. Alternative growth scenarios could also materialise. A discussion of the
impacts of COVID-19 pandemic and an alternative Baseline scenario reflecting the
COVID-19 pandemic is provided in the following section. A full description of
assumptions, including GDP and population projections, fuel prices projections
and technology costs, as well as policies underpinning the Baseline scenario is
provided in Annex I.
21. Significantly, even though the Baseline scenario fails to meet the climate
challenge, EU transport activity would also only continue to grow, albeit at a
slower pace than in the past. Freight transport activity for inland modes (expressed
in tonne-kilometres) would increase by just 33% between 2015 and 2030 (1.9% per
year) and just 56% for 2015-2050 (1.3% per year). Passenger traffic (expressed in
passenger-kilometres) growth would be even lower than for freight with a 19%
increase by 2030 (1.2% per year) and 34% by 2050 (0.8% per year). The annual
growth rates by mode, for passenger and freight transport, are provided in Figure 2.
Figure 2: Passenger and freight transport activity in the Baseline scenario (average
growth rate per year)
Source: Baseline scenario, PRIMES-TREMOVE transport model (E3Modelling)
Note: For aviation, domestic and international intra-EU activity is reported, to maintain the comparability with reported statistics.
For freight, inland navigation transport covers inland waterways and national maritime. International maritime is reported
separately.
22. Road transport would maintain its dominant role within the EU. The share of road
transport in inland freight would remain relatively stable by 2030 at 71% and
slightly decrease to 69% by 2050. For passenger transport, road modal share is
18 Directive (EU) 2016/802 of the European Parliament and of the Council of 11 May 2016 relating to a reduction in the sulphur
content of certain liquid fuels, OJ L 132, 21.5.2016, p. 58–78. 19 Regulation (EU) 2016/1628 of the European Parliament and of the Council of 14 September 2016 on requirements relating to gaseous and particulate pollutant emission limits and type-approval for internal combustion engines for non-road mobile machinery.
0.0%
0.5%
1.0%
1.5%
2.0%
2.5%
3.0%
Totalpassengertransport
Road Rail Intra-EUaviation
Inlandnavigationtransport
An
nu
al g
row
th r
ates
in t
he
Bas
elin
e
'15-'30
'30-'50
0.0%
0.5%
1.0%
1.5%
2.0%
2.5%
3.0%
Total freighttransport
Road Rail Inlandnavigationtransport
An
nu
al g
row
th r
ates
in t
he
Bas
elin
e
'15-'30
'30-'50

12
projected to decrease by 3 percentage points between 2015 and 2030 and by
additional 3 percentage points by 2050. Passenger cars would still contribute 70%
of passenger traffic by 2030 and about two thirds by 2050, despite growing at
lower pace relative to other modes, due to slowdown in car ownership increase
which is close to saturation levels in many Western European Member States.
23. Rail transport activity is projected to grow significantly faster than for road, driven
in particular by the assumed completion of the TEN-T core network by 2030 and
of the comprehensive network by 2050, supported by the CEF, Cohesion Fund and
ERDF funding. Passenger rail activity would go up by 32% between 2015 and
2030 (66% for 2015-2050), increasing its modal share by 1 percentage point by
2030 and an additional percentage point by 2050. Rail freight activity would grow
by 40% by 2030 and 81% during 2015-2050, resulting in similar increases in
modal share as for passenger rail by 2030 and two additional percentage points by
2050.
24. Based on pre-COVID-19 pandemic assumptions, domestic and international intra-
EU air transport would grow significantly (by 56% during 2015-2030 and 102% by
2050) and increase its share in overall transport demand (by 2 percentage points by
2030 and by additional 2 percentage points by 2050). Overall, aviation activity
including intra-EU and extra-EU flights is projected to go up by 54% by 2030 and
101% by 2050, putting pressure on airports capacity and on air traffic management.
25. Transport activity of freight inland navigation20
also benefits from the completion
of the TEN-T core and comprehensive network and the promotion of inland
waterway transport and would grow by 19% during 2015-2030 and by 35% by
2050. The significant growth in freight inland navigation and rail freight activity is
also supported by road pricing, the implementation of electronic documentation for
freight transport and the European Maritime Single Window environment.
26. International maritime transport activity would grow strongly in the Baseline (by
23% between 2015 and 2030 and 54% by 2050), due to rising demand for primary
resources and container shipping.
20 Inland navigation covers inland waterways and national maritime.

13
Figure 3: Projected evolution of international maritime transport activity in the Baseline
scenario
Source: Baseline scenario, PRIMES-TREMOVE transport model (E3Modelling)
27. Total energy use in transport, including international aviation and international
maritime, is projected to decrease by 3% between 2015 and 2030 and by 13% by
2050, which in the context of growing activity shows the projected progress in
terms of energy efficiency. These developments are mainly driven by the
implementation of the CO2 emission performance standards for new light duty and
heavy duty vehicles post-2020, supported by the roll-out of recharging and
refuelling infrastructure and also by the shift towards more energy efficient modes
such as rail and waterborne transport.
Figure 4: Projected evolution of energy consumption per transport mode in 2030 and 2050
relative to 2015 (% change) in the Baseline scenario
Source: Baseline scenario, PRIMES-TREMOVE transport model (E3Modelling)
28. Road transport is responsible for more than 70% of total energy use in transport but
this share is projected to significantly decline over time, to 68% by 2030 and 59%

14
by 2050 thanks to the progressive electrification of the sector and greater use of
more sustainable transport modes. On the other hand, use of bunker fuels for air
and maritime transport are projected to increase significantly by 2050. Their
respective shares would go up from around 12% to 14% for international maritime
and 15% for international air transport in 2030 (19% for international maritime and
18% for international air transport in 2050). Energy use in rail and inland
navigation transport would increase during 2015-2050 due to the shift from road
towards these modes, and despite their higher energy efficiency. Their respective
shares in the total energy use in transport would remain limited to around 2% by
2050.
29. Alternative fuels21
, including renewable and low carbon fuels, are projected to
represent 11.2% of transport energy demand (including international aviation and
maritime transport) in the Baseline scenario by 2030 and 22.6% by 2050. Around
5% of all transport fuels in 2030 would be of biological origin, as shown in Figure
5, driven by policy measures and notably the Renewable Energy Directive.
30. Electricity use in transport would steadily increase over time as a result of uptake
of zero and low-emission powertrains in road transport and further electrification
of rail. Its share in the total energy use in transport would go up from around 1.2%
in 2015 to 3.4% in 2030 and 8.3% in 2050 (see Figure 5). The uptake of hydrogen
would be facilitated by the increased availability of refuelling infrastructure, and is
projected to represent 2.4% of energy use in transport by 2050.
Figure 5: Share of alternative fuels used in transport (including international aviation and
maritime) in the Baseline scenario
Source: Baseline scenario, PRIMES-TREMOVE transport model (E3Modelling)
31. Battery electric vehicles would see faster growth beyond 2020, in particular in the
segment of light duty vehicles, driven by the CO2 emission performance standards,
supported by the rolling-out of recharging infrastructure. The share of battery
electric vehicles in the total stock of passenger cars would reach around 11% by
21 According to the Directive 2014/94/EU, ‘alternative fuels’ refer to fuels or power sources which serve, at least partly, as a
substitute for fossil oil sources in the energy supply to transport and which have the potential to contribute to its decarbonisation and
enhance the environmental performance of the transport sector. They include, inter alia: electricity, hydrogen, biofuels, synthetic
and paraffinic fuels, natural gas, including biomethane, in gaseous form (compressed natural gas (CNG)) and liquefied form (liquefied natural gas (LNG)), and liquefied petroleum gas (LPG).

15
2030 and 30% by 2050. The share of low and zero-emissions cars (including
battery electric, fuel cells and plug-in hybrids) is projected to go up to 16% by
2030 and 54% by 2050. For the light commercial vehicles segment, the share of
battery electric powertrains is projected at 6% by 2030 and 26% by 2050. Electric
buses are projected to represent around 8% of the vehicle stock by 2030, driven by
the implementation of the Clean Vehicles Directive and air quality concerns in
many cities banning combustion engine buses, while the uptake of electric and fuel
cell heavy goods vehicles is projected to be more limited in the Baseline scenario
(3% of vehicle stock by 2050)22
.
32. Liquefied Natural Gas (LNG) is projected to represent around 2.7% of the energy
use in transport by 2030 and 7.1% by 2050 in the Baseline scenario, driven by the
implementation of the Directive on the deployment of alternative fuels
infrastructure and of the Regulation on non-road mobile machinery, the TEN-T
Regulation and also by the MARPOL Annex VI rules as regards the reduction of
nitrogen and sulphur oxides emissions in the maritime transport. In the Baseline
scenario, the share of LNG use in heavy goods vehicles energy demand is
projected to go up to 6.8% by 2030 (12.9% by 2050) and for inland navigation to
3.7% by 2030 (8.3 by 2050). LNG would provide about 4.3% of maritime bunker
fuels by 2030 and 17.1% by 2050 – especially in the segment of short sea shipping.
33. Oil products would still represent about 89% of the EU transport sector needs
in 2030 and 77% in 2050, despite the current renewables policies, CO2 emission
performance standards for new light duty and heavy goods vehicles, and the
deployment of alternative fuels infrastructure which support some substitution
effects towards alternative fuels such as biofuels and biomethane, electricity,
hydrogen and natural gas.
Figure 6: Fuels use in transport (including international aviation and maritime) in the
Baseline scenario
Source: Baseline scenario, PRIMES-TREMOVE transport model (E3Modelling)
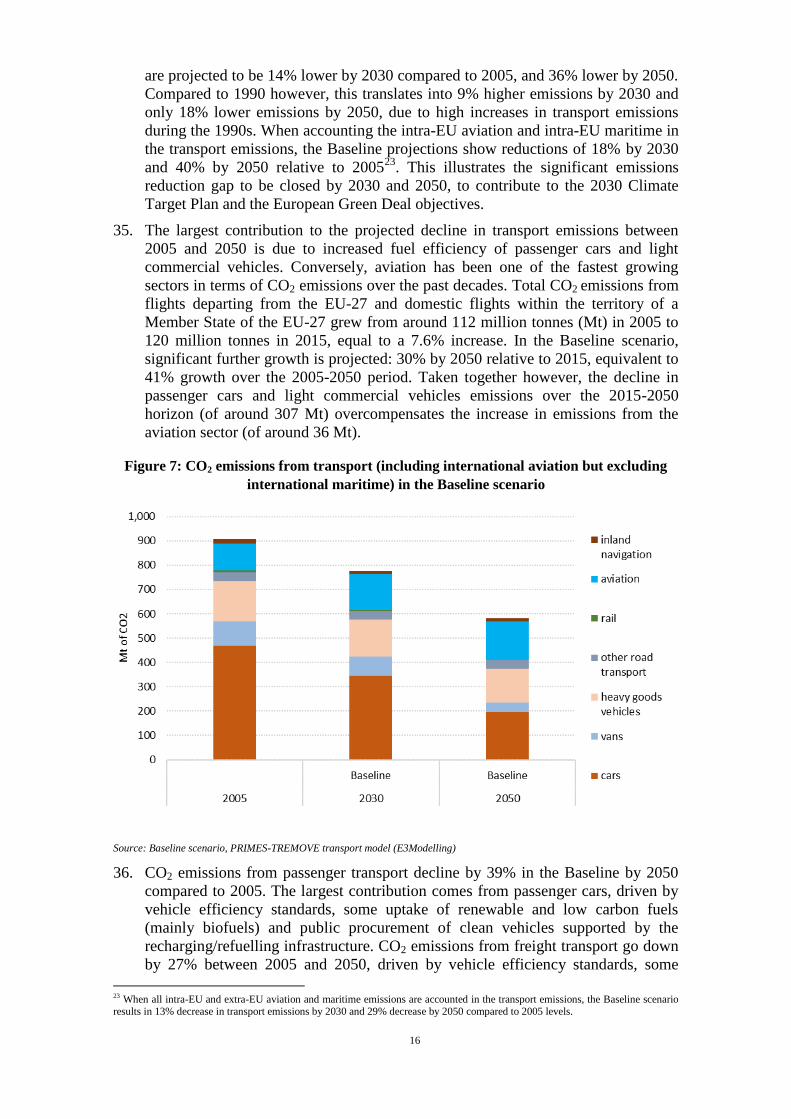
34. CO2 emissions from transport including international aviation but excluding
international maritime, in line with the 2030 climate and energy policy framework,
22 Impact Assessment accompanying the Communication from the Commission ‘Stepping up Europe’s 2030 climate ambition -Investing in a climate-neutral future for the benefit of our people’, SWD(2020) 176 final.
16
are projected to be 14% lower by 2030 compared to 2005, and 36% lower by 2050.
Compared to 1990 however, this translates into 9% higher emissions by 2030 and
only 18% lower emissions by 2050, due to high increases in transport emissions
during the 1990s. When accounting the intra-EU aviation and intra-EU maritime in
the transport emissions, the Baseline projections show reductions of 18% by 2030
and 40% by 2050 relative to 200523
. This illustrates the significant emissions
reduction gap to be closed by 2030 and 2050, to contribute to the 2030 Climate
Target Plan and the European Green Deal objectives.
35. The largest contribution to the projected decline in transport emissions between
2005 and 2050 is due to increased fuel efficiency of passenger cars and light
commercial vehicles. Conversely, aviation has been one of the fastest growing
sectors in terms of CO2 emissions over the past decades. Total CO2 emissions from
flights departing from the EU-27 and domestic flights within the territory of a
Member State of the EU-27 grew from around 112 million tonnes (Mt) in 2005 to
120 million tonnes in 2015, equal to a 7.6% increase. In the Baseline scenario,
significant further growth is projected: 30% by 2050 relative to 2015, equivalent to
41% growth over the 2005-2050 period. Taken together however, the decline in
passenger cars and light commercial vehicles emissions over the 2015-2050
horizon (of around 307 Mt) overcompensates the increase in emissions from the
aviation sector (of around 36 Mt).
Figure 7: CO2 emissions from transport (including international aviation but excluding
international maritime) in the Baseline scenario
Source: Baseline scenario, PRIMES-TREMOVE transport model (E3Modelling)
36. CO2 emissions from passenger transport decline by 39% in the Baseline by 2050
compared to 2005. The largest contribution comes from passenger cars, driven by
vehicle efficiency standards, some uptake of renewable and low carbon fuels
(mainly biofuels) and public procurement of clean vehicles supported by the
recharging/refuelling infrastructure. CO2 emissions from freight transport go down
by 27% between 2005 and 2050, driven by vehicle efficiency standards, some
23 When all intra-EU and extra-EU aviation and maritime emissions are accounted in the transport emissions, the Baseline scenario results in 13% decrease in transport emissions by 2030 and 29% decrease by 2050 compared to 2005 levels.

17
uptake of renewable and low carbon fuels and initiatives to improve the efficiency
of the transport system - making the most of digital technologies and smart pricing
and further encouraging multi-modal integration and shifts towards more
sustainable transport modes.
37. CO2 emissions from international maritime have decreased by 17% between 2005
and 2015. In the Baseline scenario they are however projected to go up by 18% by
2030 relative to 2015 and by 39% by 2050. Relative to 2005, this is equivalent to a
stabilisation of emissions by 2030 and 16% increase by 2050 which is not in line
with the economy-wide climate neutrality objectives.
38. NOx emissions are projected to go down by 53% between 2015 and 2030 (69% by
2050), mainly driven by the electrification of the road transport and in particular of
the light duty vehicles segment. The decline in particulate matter (PM2.5) would
be slightly lower by 2030 at 49% relative to 2015 (72% by 2050). Air quality
issues represent a particular concern in urban areas. In the Baseline scenario NOx
and PM2.5 emissions are projected to decrease at higher pace in urban relative to
inter-urban areas (69% reduction in NOx emissions by 2030 and 60% for PM2.5
emissions), thanks to the use of more sustainable alternative modes, including
active modes, and cleaner vehicles. Overall, external costs related to air pollutants
would decrease by about 60% by 2030 (78% by 2050)24
.
39. Congestion costs from transport are projected to increase by about 19% by 2030
and 33% by 2050, relative to 2015. Congestion on the inter-urban network would
be the result of growing freight transport activity along specific corridors, in
particular where these corridors cross urban areas with heavy local traffic. Thanks
to policies in place, external costs of accidents are projected to go down by about
14% by 2030 (20% for 2015-2050).
2.3 Overall economic, social and technological trends
2.3.1 Economic context
40. Economic growth plays a central role in the development of transport demand, so
the strong economic impact of the COVID-19 pandemic has had, and will continue
to have, a major impact. It materialises through three main channels. First, the
partial or full shut down of entire sectors, due to the measures enacted to contain
contagion, has severely disrupted domestic production in most countries, as well as
service sectors like transport and mobility. Second, the propagation of such
disruptions along global value chains has impaired the functioning of the EU
Single Market and of extra-EU supply chains. Third, the consequent loss of income
is generating another sizeable shock, which feeds back through the demand side. If
the situation is prolonged, financial strains will emerge and pose further barriers to
recovery.
41. According to Eurostat data, compared with the same quarter of the previous year,
in Q3 2020 the EU GDP decreased by 4.3 %, which represents a partial recovery
after a decrease of 13.9 % in the previous quarter. EU employment increased by
0.9 % compared to the previous quarter, but decreased by 1.8% compared to Q3
24 Covering NOx, PM and SOx; excluding international maritime.

18
2019.25
The Commission has published its Spring 2020 Economic Forecast for
2020-2021 for the EU-27 and at Member State level on 6 May.26
The forecast
shows that the euro area economy will contract by a record 7.8% in 2020 and grow
by 6.3% in 2021. The EU-27 economy is forecast to contract by 7.5% in 2020 and
grow by around 6% in 2021. Growth projections for the EU and the euro area have
been revised downwards by around nine percentage points compared to the
Autumn 2019 Economic Forecast.
42. The Commission‘s Autumn 2020 Economic Forecast for 2020-2022 was published
on 5 November.27
It shows that the EU-27 GDP is forecast to contract by about
7.5% this year before rebounding by 4% in 2021, which is less than previously
forecast, and by 3% in 2022. This implies that the output in the European economy
would barely return to pre-pandemic levels in 2022.
43. The economic slowdown estimated in the Autumn 2020 Economic Forecast leaves
its traces on households too.28
Despite being protected by government measures,
aggregate labour income is set to decrease in 2020 as many companies defer
decisions about employing new staff, reduce working hours or staff numbers.
Some segments of the workforce are likely to be affected more than others, with
the incomes of lower-wage earners and younger cohorts showing larger
vulnerability to downturns. All in all, both non-labour and labour incomes are
expected to drag disposable incomes to a similar degree in 2020, while turning
supportive again in both 2021 and 2022. The rise in unemployment in 2020 will
likely be substantial, and the rate only contained to 7.7% thanks to the short-time
work schemes that people across the EU have benefitted from, as well as by other
support schemes to firms, workers and the self-employed.29
The International
Labour Organization (ILO) estimates the loss of working hours compared to the
pre-crisis level in Europe at 11.8%.30
Finally, a Eurofound survey finds that 38% of
Europeans report their financial situation as worse than before the pandemic.31
Close to half of households indicate they cannot make ends meet, and over half
report they cannot maintain their standard of living for more than three months
without an income. Just from the narrow perspective of the impact on the sector,
this loss in household income is likely to aggravate the drop in tourism and
passenger transport demand beyond the pandemic.
44. As a large part of the world went into lockdown, fossil fuel prices collapsed with
crude oil spot prices halved compared to last year levels. The oil price is projected
to gradually recover over time, reaching USD 80/bbl in 2030 and USD 118/bbl in
2050. It is however projected to remain below the projected pre-COVID-19
pandemic levels.32
The situation is still evolving, and it is currently not possible to
understand the full impact of the unfolding pandemic. These estimates do not
include the possibility of more negative outcomes (e.g. due to a second epidemic
outbreak).
25 Eurostat (2020), ‘GDP and employment flash estimates for the third quarter of 2020’, available at: https://ec.europa.eu/eurostat/documents/2995521/10662173/2-13112020-AP-EN.pdf/0ac3f053-f601-091d-ea21-db1ecaca7e8c 26 European Commission (2020), ‘Spring 2020 Economic Forecast: A deep and uneven recession, an uncertain recovery’, available
at:https://ec.europa.eu/info/business-economy-euro/economic-performance-and-forecasts/economic-forecasts/spring-2020-economic-forecast-deep-and-uneven-recession-uncertain-recovery_en. 27 https://ec.europa.eu/info/sites/info/files/economy-finance/ip136_en.pdf 28 Ibid. 29 European Commission, Employment and Social Developments in Europe 2020. 30International Labour Organization (2020), ‘COVID-19 and the world of work - Third edition’.
https://www.ilo.org/wcmsp5/groups/public/@dgreports/@dcomm/documents/briefingnote/wcms_743146.pdf 31 Eurofound (2020). ‘Living, working and COVID-19’.
https://www.eurofound.europa.eu/sites/default/files/ef_publication/field_ef_document/ef20058en.pdf 32 Communication from the Commission ‘Stepping up Europe’s 2030 climate ambition - Investing in a climate-neutral future for the benefit of our people’, COM(2020) 562 final.

19
45. Drawing on Commission’s Spring 2020 Economic Forecast, it is estimated that real
GDP could be about 2.3% lower compared to pre-COVID-19 pandemic projections
by 2030. Based on the estimates for GDP and the fossil fuel prices projections, an
alternative Baseline scenario (so-called COVID-Baseline scenario) has been
developed with the PRIMES-GAINS modelling suite, to account for the impacts of
the COVID-19 pandemic on transport activity. This shows lasting changes in the
mobility trends by 2030 and 2050. The COVID-19 pandemic is projected to lead to
lower total passenger transport activity of about 4% by 2030 and 2050 relative to
the pre-COVID-19 pandemic situation, despite strong recovery starting in 2021.
Air transport would be most affected, driven by the reduced business travel and
more domestic tourism relative to the pre-COVID-19 pandemic situation. Less
commuting and preference given to individual transport modes would also have an
impact on rail and public transport activity. Road transport activity would be the
least affected in the medium to long term. A comparison between the growth in
transport activity, by transport mode, in the Baseline and the COVID-Baseline
scenarios is provided in Figure 8.
Figure 8: Passenger transport activity in the Baseline and the COVID-Baseline scenarios
(cumulative growth rates for 2015-2030 and 2015-2050)
Source: Baseline scenario, PRIMES-TREMOVE transport model (E3Modelling)
46. The growth of freight transport volumes tends to follow the rhythm of GDP
growth. As a result of the economic crisis 2008-2009, the volume of freight
transport in tonnes-kilometres in the EU-27 has dropped close to the level of 2000.
Since 2010 it’s been recovering slowly and only reached pre-crisis levels in 2017.
The volume of passenger-kilometres travelled in the EU-27 has grown quite
steadily over the last ten years and picked up notably since 2014.33
The recovery
after the extreme drop of activity due to the COVID-19 pandemic is projected to
take a longer period of time, until pre-pandemic transport volumes are reached
again.
47. The COVID-Baseline scenario projects lower contraction in the freight transport
activity relative to the passenger transport activity. In the medium to long term, it
also shows higher convergence to the pre-COVID-19 pandemic pace of growth
compared to the passenger transport activity. By 2030 and 2050, total freight
33 European Commission (2020), ‘EU Transport in Figures. Statistical Pocketbook 2020’.https://ec.europa.eu/transport/facts-fundings/statistics/pocketbook-2020_en
0% 20% 40% 60%
Inlandnavigationtransport
Extra-EUaviation
Intra-EUaviation
Railtransport
Roadtransport
Totalpassegertransport
Cumulative growth rates 2015-2030
COVID-Baseline
Baseline
0% 20% 40% 60% 80% 100%
Inlandnavigationtransport
Extra-EUaviation
Intra-EUaviation
Railtransport
Roadtransport
Totalpassegertransport
Cumulative growth rates 2015-2050
COVID-Baseline
Baseline

20
transport activity would be less than 3% below its projected pre-COVID-19
pandemic levels. Furthermore, the projections show that the pandemic would not
induce significant changes in the modal shares relative to the pre-COVID-19
pandemic. A comparison between the growth in transport activity, by transport
mode, in the Baseline and the COVID-Baseline scenarios is provided in Figure 9.
Figure 9: Freight transport activity in the Baseline and COVID-Baseline scenarios
(cumulative growth rates for 2015-2030 and 2015-2050)
Source: Baseline scenario, PRIMES-TREMOVE transport model (E3Modelling)
48. The COVID-Baseline projections show that emissions from transport including
international aviation but excluding international maritime would be 16% lower by
2030 compared to 2005, and 38% lower by 2050. Compared to 1990 however, this
translates into 7% higher emissions by 2030 and only 21% lower emissions by
2050, due to high increases in transport emissions during the 1990s. A comparison
between the changes in the CO2 emissions from transport relative to 2005 and to
1990, in the Baseline and the COVID-Baseline scenarios is provided in Figure 10.
When accounting the intra-EU aviation and intra-EU maritime in the transport
emissions, the COVID-Baseline projections show reductions of 19% by 2030 and
42% by 2050 relative to 2005. This shows that after the sharp decline in CO2
emissions during the COVID-19 pandemic, existing policies fall well short in
delivering the transport contribution to CO2 reductions under the European Green
Deal and the 2030 Climate Target Plan.
0% 20% 40%
Internationalmaritime
Inlandnavigationtransport
Railtransport
Roadtransport
Total freighttransport
Cumulative growth rates 2015-2030
COVID-Baseline
Baseline
0% 20% 40% 60% 80%
Internationalmaritime
Inlandnavigationtransport
Railtransport
Roadtransport
Total freighttransport
Cumulative growth rates 2015-2050
COVID-Baseline
Baseline

21
Figure 10: CO2 emissions from transport (including international aviation but excluding
international maritime) in the Baseline and COVID-Baseline scenarios
Source: Baseline scenario, PRIMES-TREMOVE transport model (E3Modelling)
49. Trade is a main determinant for freight demand. The WTO estimates world trade
volumes to fall by 13-32% in 2020. Almost all world regions are projected to
suffer double-digit declines, but exports from Asia and North America may be hit
the hardest. The WTO also considers that trade in services may be most directly
impacted. A recovery in 2021 is expected, depending on the duration of the
COVID-19 pandemic. Globally, road fuel use was down 11% for the year, jet fuel
down 33% and all other fuels down 7% in April compared to the previous year,
according to Rystad Energy.
50. Before the COVID-19 pandemic, the OECD projected international trade to grow
by 3.4% annually through 2030 and 3.2% annually through 2050.34
After the
previous economic crisis, though, international trade has grown modestly
compared to growth rates prior to the 2008 economic downturn. This trend can be
partly explained by cyclical factors in the wake of the downturn, but structural
factors also play a role. Trade in services, for instance, increased from 23% to 30%
between 2005 and 2017, the elasticity of trade to GDP has declined and the
expansion of global value chains has begun to slow.35
Therefore, it is difficult to
compare the effects of the previous economic crisis on international trade to the
likely effects of the crisis following the COVID-19 pandemic. The structural
economic consequences of the latter are yet to be seen, also because international
supply chains may be shortened in order to render them more robust against
disruptions.
51. Politically, the environment for international trade development has become more
uncertain with the rise of political movements in several countries that question
trade liberalisation and advocate more protectionist trade policy measures. The
widespread call for shorter supply chains and re-patriating value chains in the
context of the COVID-19 pandemic might constitute another significant challenge
for international trade flows in the near future.
34 International Transport Forum (2019), ‘Transport Outlook 2019. OECD Paris’. https://www.oecd-ilibrary.org/transport/itf-
transport-outlook-2019_transp_outlook-en-2019-en 35 Ibid.

22
52. The WTO estimates that the direct economic effects of more protectionist trade
policies have been modest to date but the uncertainty they generate may already be
having an impact through reduced investment spending.36
53. Other risks identified by the WTO include developing and emerging economies
experiencing capital outflows and financial contagion as interest rates may start to
rise in developed countries, with negative consequences for trade. Geopolitical
tensions could threaten resource supplies and upset production networks in certain
regions. Finally, structural factors such as the rebalancing of the Chinese economy
away from investment and toward consumption are still present and could weigh
on import demand due to the high import content of investment.37
54. Commercial shipping could intensify in in light of the decrease of the extent of ice
cover in the Artic Sea, which would shorten distances considerably from Asia to
both Europe and North America.38
Large transcontinental infrastructure projects
may establish alternative routes between major trade partners in East Asia and
Europe, while also increasing access to markets in Central Asia and other regions
including Africa. This can have an impact on port activity and the way surface
transport infrastructure is used. Some parts of current road, rail and river networks
could experience major reductions in traffic while others would see sharp
increases.
55. E-commerce has been steadily growing and is predicted to increase further, in
particular now that under the lockdown a larger share of consumers got acquainted
with buying online, and households re-assign some of their budgets away from
holidays and towards home goods (e.g. home entertainment and home exercise).39
Greater ease of purchase and returns can increase demand and foster a trend
towards more individualised, small-scale deliveries, leading to more freight
transport. To seize these the opportunities created by increase in demand for home
deliveries, e-commerce and carriers have to adapt delivery scheduling systems,
optimizing routing and managing in real time delivery volumes.
56. As regards long distance travel, the tourism sector40
is one of the hardest-hit by the
COVID-19 pandemic, with impacts on both travel supply and demand. Travel
restrictions, flight cancellations and frequency reduction have significantly
diminished the supply of travel services (both domestic and international), while
demand continues to retract due to fears of contagion.
57. OECD data shows that the EU-27 recorded USD 430,481 million in travel receipts
(exports) in 2018, representing almost 30% of worldwide figures.41
Passenger
transport was estimated at 17% of tourism exports in Europe in 2018, international
tourism receipts (hotels, restaurants etc.) making up the other 83% according to
UNWTO data.42
According to the same source, 53% of international tourism trips
in Europe were made by air transport, 40% by road, 4% by water and 3% by rail. It
is expected that, depending on de-confinement strategies of each Member State,
36 World Trade Organization (2018): ‘WTO downgrades outlook for global trade as risks accumulate’, press release of 27 September 2018. https://www.wto.org/english/news_e/pres18_e/pr822_e.htm. 37 Ibid. 38 International Transport Forum (2018), ‘Decarbonising Maritime Transport Pathways to zero-carbon shipping by 203520352035’https://www.oecd-ilibrary.org/docserver/b1a7632c-
en.pdf?expires=1565000545&id=id&accname=id24042&checksum=E8EF1EEA5165883BF77CEDEEC342B457. 39 HSBC Global Research, "Global Container Shipping: Rally still has legs as visibility emerges post 3Q20", 7 September 2020. 40 Tourism is one of many economic sectors that rely on transport services and create demand for transport. 41 OECD (2020), ‘Tourism Trends and Policies 2020’. http://www.oecd.org/cfe/tourism/oecd-tourism-trends-and-policies-
20767773.htm 42 UNWTO (2020), ‘Global and regional tourism performance’. https://www.unwto.org/global-and-regional-tourism-performance

23
the share of each mode in tourism may substantively change in 2020 and possibly
also in the near future.
58. The OECD estimates a 60% decline in international tourism in 2020, possibly up to
80% if the recovery is delayed until December.43
The organisation expects
domestic tourism – which represents over 75% of the sector in OECD countries, as
well as EU tourism to be the first to register a rebound.
59. In May 2020, the UNWTO estimated that international tourism could decline by
60% to 80% in 2020 globally, depending on the speed of containment and the
duration of travel restrictions as well as borders shutdown. The first quarter of
2020 experienced a decrease of 22% and USD 80 billion at global level, while
Europe experienced a -19% of international tourist arrivals. Globally, this would
translate into an estimated loss of USD 910 to 1,200 billion in international tourism
receipts (exports) and 100 to 120 million jobs directly at risk. Recovery estimates
remain mixed.
60. Finally, economic activity is also closely interrelated with the dynamics of energy
demand and the price of crude oil. The world oil price is not only an important cost
factor for the transport sector, but it can also have an effect on the choice of
transport mode (depending on the oil dependency of different modes) and
innovation, for example by affecting the economic attractiveness of alternative
fuels or energy efficiency measures.
61. Oil markets are going through a period of extraordinary change, in the short term
because demand has vanished in the context of the COVID-19 pandemic. In the
longer term, demand is shifting from developed economies and transport fuels to
Asia and petrochemicals.
62. The International Energy Agency (IEA) projects that, taking into account adopted
and planned policies, world-wide oil use in passenger cars will peak in the late
2020s and during the 2030s demand will increase by only 0.1 million barrels/day
on average each year. However there will be no definitive peak in oil use overall,
as there are continued increases in petrochemicals, lorries and the shipping and
aviation sectors. For Europe, IEA expects the total demand for crude oil to be 4
million barrel/day lower in 2040 than in 2018.44
63. However, the evolution of both oil demand and oil price will to a great extent
depend on the economic growth cycles of the world economy and on the level of
ambition with which more sustainable energy, climate and transport policies will
be pursued.
2.3.2 Demographic trends
Urbanisation
64. Freight and passenger mobility demand also grows as global population expands,
particularly in cities. Today in Europe, 74.9% of the population live in urban areas,
compared to just over 50% in 1950, making Europe one of the most urbanised
regions in the world. The growth of the urbanisation rate in Europe is expected to
continue, with the proportion of the population residing in urban areas projected to
43 OECD (2020), ‘Tourism Policy Responses to the Coronavirus (COVID-19)’. https://www.oecd.org/coronavirus/policy-
responses/tourism-policy-responses-to-the-coronavirus-covid-19-6466aa20/ 44 International Energy Agency (2019World Energy Outlook 2019’. https://www.iea.org/reports/world-energy-outlook-2019

24
reach 83.7% in 2050.45
It remains to be seen, whether the economic and social
impacts of the COVID-19 pandemic on our societies will slow down this dominant
long trend.
65. Single person households without children increased by 18.7 % between 2010 and
2019 in the EU, so if this trend continues, the pattern of transport demand,
particularly in urban areas, will change. During the last decade i.e. 2010-2019, the
total number of households in the EU increased by 7.0 %. In 2019, the EU-27
recorded 195 million households with on average 2.3 members per household.46
66. Steady urbanisation means that the problems affecting many urban areas, such as
congestion, air pollution, road crashes, noise and saturation of transport hubs are
likely to get worse. Transport represents an important source of air pollution and is
responsible for growing road congestion in cities. A growing number of cities
implement vehicle access restriction in the urban areas (most often in the centres)
to tackle increased noise, congestion and pollution, and improve safety (vulnerable
road users such as pedestrians, cyclists and users of powered two-wheelers now
account for 70% of road deaths in cities).
67. At the same time, passenger and freight transport volumes on the comprehensive
and core TEN-T network are growing. However, missing links and poor
connections, including between public transport and active modes of transport,
remain the main challenges for integrating the urban nodes on the TEN-T network.
They can also lead to bottlenecks and congestion at peak hour due to a lack of
connectivity, and to a high degree of dependence on personal motorised
transportation.
68. Indeed, the capacity, availability, accessibility and affordability of public transport
is an important overall issue for urban development, especially if the coverage and
frequency of public transport network are insufficient, or if there are barriers to
multi-modal solutions, such as the combination of private bike or car and public
transport.
69. Walking and cycling, often referred to as active modes of transport, are certainly
not new phenomena, but their importance in urban mobility has gained prominence
in recent years as stand-alone transport mode and as part of a multi-modal transport
solution. Given that almost half of all car trips in cities are of less than five
kilometres, there is high potential for further expansion of active mobility,
including in new fields, e.g. for freight transport via cargo-bikes and to connect
cities with their surrounding areas via e-bikes. The importance of walking and
cycling is gaining wider recognition, even more so since the COVID-19 pandemic.
Pedestrian zones are being created or extended in various cities across Europe.
Likewise, bike lanes are being rapidly developed and made permanent. Alternative
low and zero solutions for freight and parcel delivery in urban areas are coming on
stream. In addition, we observe a growing interest by employers to (financially)
support and motivate their staff to walk or cycle to work.
Ageing
70. Besides the relative growth of the share of the population living in urban areas,
ageing societies in Europe represent another demographic trend that is likely to
shape mobility patterns in the future. The demographic old-age dependency ratio
45 United Nations, Department of Economic and Social Affairs, Population Division (2019): ‘World Urbanization Prospects 2018:
Highlights (ST/ESA/SER.A/421)’. https://population.un.org/wup/Publications/Files/WUP2018-Highlights.pdf 46 https://ec.europa.eu/eurostat/statistics-explained/index.php/Household_composition_statistics

25
(people aged 65 or above relative to those aged 15-64) is projected to increase
significantly in the EU as a whole in the coming decades. From about 25% in
2010, it has risen to 29.6% in 2016 and it is projected to rise further, eventually
reaching 51.2% in 2070. This implies that the EU would move from four working-
age people for every person aged over 65 years in 2010 to around two working-age
persons over the projection horizon.47
71. The ageing of the population has a strong correlation with the number of persons
with disabilities and reduced mobility. It is estimated that in the EU there are
around 100 million persons with disabilities. Many of them have reduced mobility.
72. The ageing society will require more emphasis on accessibility, the provision of
safe, secure, reliable and adaptable transport services featuring appropriate
solutions for users with disabilities and reduced mobility. For instance, one can
expect higher demand for door-to-door mobility and driver assistance solutions.
Public transport providers will have to adapt to an increasing amount of passengers
with disabilities and reduced mobility, requiring investments in barrier-free
infrastructure and rolling stock. At the same time, for public expenditure a higher
ratio of older people will imply that more public resources will have to be devoted
to pension payments, health care and long-term care, which may lead to pressure
on the amount of funding available to public transport and maintenance of
transport infrastructure. This structural pressure on transport infrastructure
investments can be aggravated by cyclical factors. In the wake of the financial
crisis of 2008/09, the European Investment Bank (EIB) noted that infrastructure
investment had been disproportionally hit as fiscal consolidation had been biased
against capital expenditure, with prioritisation given to current expenditure such as
social transfers to mitigate the immediate effects of the crisis.48
This does not mean
that social transfers would not have been concerned by fiscal consolidation
measures, but fiscal consolidation after the crisis of 2008/09 has significantly
reduced room for public investments.
73. The picture of the demographic development in the EU can vary considerably from
one region to another. Over the past 25 years, some of the Eastern European
Member States have lost a large share of their population through a combination of
low fertility and, most notably, sizeable emigration. Pre-existing economic
disparities between Member States have encouraged many citizens to search for
work in places other than their country of origin. These developments have likely
been to the economic benefit of the EU as a whole, but not necessarily for all
sending Member States. This contributes to slowing the convergence between
Member States, and impacts areas such as transport infrastructure, education and
even population ageing.49
Intra-EU mobility has the biggest impact on the past and
projected population change in the eastern Member States, where it exacerbates
their population decline.
74. Our ageing society has not only an effect on the ‘demand’ side of transport, but
also on the ‘supply’ side. For instance, in inland waterway transport, where –
especially on the Rhine – most enterprises are family owned and family operated
47 European Commission (2017): ‘The 2018 Ageing Report Underlying Assumptions & Projection Methodologies, Institutional Paper 656565’. https://ec.europa.eu/info/publications/economy-finance/2018-ageing-report-underlying-assumptions-and-projection-
methodologies_en. 48 European Investment Bank (2017): ‘Investment Report 2017/2018. From Recovery to Sustainable Growth. Key Findings.
November 2017’. https://www.eib.org/attachments/efs/economic_investment_report_2017_en.pdf 49 Lutz W. (Ed.), Amran G., Bélanger A., Conte A., Gailey N., Ghio D., Grapsa E., Jensen K., Loichinger E., Marois G., Muttarak
R., Potančoková M., Sabourin P., Stonawski M., Demographic Scenarios for the EU - Migration, Population and Education - executive summary , EUR 29739 EN, Publications Office, Luxembourg, 2019.

26
SMEs, the aging of the entrepreneur/crew is a major challenge, as young people
seem to be less interested to pursue this profession, which requires living on the
barge.
75. New forms of electric mobility, such as electric bicycles are already contributing to
satisfying older people’s mobility needs in a flexible manner, allowing them to use
an active and healthy mode for ways where they would otherwise rely on private
cars or public transport. However, the new forms of e-mobility also bring about a
specific safety challenge50
and older people tend to be more vulnerable than
younger population groups.
2.3.3 New technologies, changing consumer behaviour and working conditions
76. There are several socio-economic and technological developments51
that have
emerged or become more prominent in the last ten years.
Collaborative economy
77. Firstly, the collaborative economy increasingly affects the way transport services
are organised with various bike and car sharing schemes, but also ride-sharing and
ride-hailing being deployed across the EU. Some of these schemes generate new
forms of work characterised by more flexible arrangements. These flexible work
arrangements should be implemented in accordance with EU labour law and social
protection.
78. Continuous digitalisation has made it possible to develop the concept of mobility
as a service (MaaS) – a mobility distribution model in which a customer’s major
transport needs are met by services integrating transport infrastructure, transport
services, information and payment services, and more. This approach is also
possible due to the removal of barriers between different transport modes and their
users, as well as the emergence of new collaborative economy solutions. The focus
in this approach is not on personal ownership of transport modes, but on mobility
per se, which is seen as service.
79. Data sharing and collaborative decision-making enabled by digital technologies
propose new solutions to old challenges. Businesses are interacting in ways
previously unimagined, new business models and services appear, based on
collaboration and sharing economy principles and enabled by data and advanced IT
technologies. For instance, in freight transport and logistics there is generally a
shift towards collaborative solutions, where partnerships are formed for the
purpose of optimization of operations by sharing equipment, vehicles and
information. Digital solutions should lead to synchro-mobility, a step change in
multimodal transport which will synchronise intermodal services between modes
as well as with shippers for optimal resource use and delivery times.
50 In Germany for instance, a country with a rapidly ageing society, 118 persons died in crashes riding an electric bicycle in 2019 (of which 85 were aged 65 or over), out of 445 cyclists killed – 17% more than in 2010. (based on
https://www.destatis.de/DE/Presse/Pressemitteilungen/2020/08/PD20_N049_46241.html). Although EU-wide comparable statistics
are not available, some studies suggest that the amount of “dismounting” crashes (i.e. people losing their balance) is higher on e-bikes than on normal bicycles, particularly for older users. However, many serious crashes of e-bikes involve a conflict with a
motorised vehicles, which reinforces the argument that segregated safe infrastructure could prevent many fatalities and injuries for
all vulnerable road users, i.e. cyclists, pedestrians, scooter riders. See for example: E-bike safety. A review of Empirical European
and North American Studies: https://wsd-pfb-sparkinfluence.s3.amazonaws.com/uploads/2019/10/EbikeSafety-VFinal.pdf and
Traffic safety of electric bicycles – A naturalistic cycling study: https://m.udv.de/en/road-user/electric-bicyclescars/road/cycling-
facilities/traffic-safety-electric-bicycles). 51 Some of the relevant technological developments are described more in detail in subsequent sections.

27
Teleworking
80. Telework has become much more widespread since the COVID-19 pandemic and
newly introduced arrangements could, at least partially, remain in place in the
longer term52
. Learning effects of remote working and improvements in technology
are likely to produce various ranges of effects on mobility and transport
behaviours.
81. The pandemic has revealed large differences in the prevalence of telework across
EU Member States, sectors and occupations. The preparedness for telework at a
large scale is higher in ICT- and knowledge-intensive sectors, and generally for
high-skilled workers, although with big differences across EU countries. In many
EU countries, more than half of the workers who have started working from home
since the pandemic had no prior experience with teleworking. If past trends are a
guide, the uneven ability to scale up telework could result in widening inequalities
across countries, firms, genders and workers53
, e.g. if there is uneven access to
broadband, barriers for persons with disabilities or IT illiteracy to telework or use
other ICT based applications. White-collar workers tend to have jobs that can be
better adapted to telework requirements than blue-collar workers.
82. Telework can have an impact particularly on urban passenger transport demand,
mainly during peak hours and hence also alleviate congestion as well as other
environmental externalities. Another sector expected to be affected is business
travel with the rise of web based meeting arrangements during the pandemic. With
more developed ICT equipment in modern office workplaces and more widespread
availability of fast internet, at least in urban areas, the technical preconditions for
telework arrangements have become easier to meet.
83. To date, large variations in the prevalence of telework exist. In the EU, before the
COVID-19 pandemic, the share of employees performing regular or occasional
telework (in urban and non-urban areas) was highest in Denmark (37%), Finland
(33%) and the Netherlands (30%). Relatively low shares of teleworking employees
were found in Central and Eastern Europe and in the Mediterranean countries.54
52 This could also entail an increase of the so-called “digital nomads”. 53 Source: European Commission (2020): ‘Telework in the EU before and after the COVID-19: where we were, where we head to’:
https://ec.europa.eu/jrc/sites/jrcsh/files/jrc120945_policy_brief_-_covid_and_telework_final.pdf 54 Eurofound and the International Labour Office (2017): ‘Working anytime, anywhere: The effects on the world of work,
Publications Office of the European Union, Luxembourg, and the International Labour Office, Geneva’. https://www.eurofound.europa.eu/publications/report/2017/working-anytime-anywhere-the-effects-on-the-world-of-work

28
Figure 11: Workforce working at home several times per month in 2015
Source: OECD calculations based on Eurofound-ILO research 2017.
84. At the same time, asked how much time they spend every day travelling to and
from work, 47% of the employees in the EU indicate a commuting time of more
than 30 minutes one way and 11% travel more than 60 minutes. The highest shares
of employees travelling more than 60 minutes from or to work are found in
Sweden (24%), Denmark (22%) and Belgium (22%).55
Digitalisation and automation
85. The increasing automation and digitalisation of transport offers a huge potential in
terms of safety, efficiency and sustainability and thus also new opportunities for
women in transport jobs, since new job profiles imply less heavy physical labour
and more digital skills. We are already seeing how new digital automotive
technologies can help reduce the number of deaths and serious injuries, enable
better organising and executing of travel and transport operations, lower energy
consumption and pollution, and optimise the use of resources and existing
infrastructure. It is also a powerful tool to overcome the disadvantages -
complexity, higher costs and risks of multimodal transport, and to facilitate the
better integration of the different modes of transport.
86. Based on existing policies for urban passenger transport and assuming an increased
uptake of teleworking, the OECD estimates that the share of urban passenger-
kilometres travelled in privately owned vehicles could decline from around 70% in
2015 to 40% by 2050 in the world. Shared modes that include shared vehicles
systems (e.g. free-floating or non-free-floating shared cars, bikes or scooters) and
optimised shared mobility services (e.g. a shared taxi, van or minibus with a driver)
represented only 1.5% of the urban passenger-kilometres travelled world-wide in
2015. However, they are expected to grow to over 20% of the total passenger
transport demand in cities by 2050 globally. The share of more traditional public
55 Eurofound (2017), ‘Sixth European Working Conditions Survey – Overview report (2017 update), Publications Office of the
European Union, Luxembourg’. https://www.eurofound.europa.eu/publications/report/2016/working-conditions/sixth-european-working-conditions-survey-overview-report

29
transport (bus, rail, metro) should grow modestly from 30% in 2015 to over 35% of
all urban passenger-kilometres travelled worldwide by 2050.56
87. Though opportunities are huge, at the same time there is still a lack of solid
framework conditions (e.g. legal and social aspects, required interoperable
infrastructure and interfaces). Alongside, technological challenges remain in this
fast-evolving field.
88. All transport modes are taking advantage of digital technologies, Internet of
Things, and automation. Furthermore, digital technologies also enable or accelerate
the emergence of new transportation solutions, ranging from progress towards
automated road vehicles, connected and automated lorries (platooning), driverless
goods delivery vehicles, or self-driving trains to unmanned aircraft and ships that
can offer taxi services over short distances, and other potential innovations.
Moreover, mobility intertwines with other sectors such as automotive,
environmental or digital, where new players take a more relevant, or even
dominant, position through the provision of new transport services based on
digitalisation.
89. Concerning drones, they can make a significant contribution to the development of
greener and cheaper local transport solutions in urban, peri-urban and inter-urban
contexts. The technology is already there, fully functional and offering a multitude
of applications, such as precision agriculture, infrastructure inspection, transport of
medical supplies, environmental compliance, atmospheric research, media and
entertainment, sport photos, filming, wildlife protection and research, disaster
relief, etc. The global drones market is forecast to increase from USD 4.9 billion in
2019 to USD 14.3 billion in 2028. Out of total, Europe’s drone start-up
investments is expected to represent only 9%, indicating a clear lag behind US and
Chinese firms’ investments in this technology. Commercial use will surpass the
consumer drone market in 2023, becoming the largest segment. It might grow more
than eightfold to reach USD 9.5 billion in 2028.57
In terms of jobs, for Europe,
employment is estimated to increase to about 150,000 jobs by 2050 in
manufacturing with additional jobs created in drone operator services.58
90. Air traffic management (ATM) is also a sector with increased use of digital
technologies, notably solutions brought by the SESAR project. Innovative
infrastructure projects can lead to substantial efficiency gains in the aviation sector
and a reduction of emissions resulting from aviation activities. It is the aim that
ATM system infrastructure progressively evolves with the adoption of advanced
digital technologies, allowing civil and military air navigation service providers
(ANSPs), airports and the network manager to provide their services in a cost-
efficient and effective way irrespective of national borders, supported by secure
information services. Moreover, ATM progressively needs to evolve into a data
ecosystem supported by a service-oriented architecture to enable the virtual
defragmentation of European skies.
91. With respect to automated road vehicles, similar developments can be observed.
Automated driving will, in the future, play a key role on the transformation of
mobility, and also on the automotive sector. Ultimately, safety is one of the crucial
underlying justifications for automated and connected vehicles. However, in the
56 ITF (2019): Transport Outlook 2019, OECD, Paris. International Transport Forum (2019), ‘Transport Outlook 2019, OECD,
Paris’. https://www.oecd-ilibrary.org/transport/itf-transport-outlook-2019_transp_outlook-en-2019-en 57 Estimates published by TEAL Group in press release on 16 June 2019: https://www.tealgroup.com/index.php/pages/press-
releases/60-teal-group-predicts-worldwide-civil-drone-production-will-almost-triple-over-the-next-decade. 58 Estimate provided by ASD, the Aero-Space and Defence Industries Association of Europe.

30
forthcoming transitional phase, where we will see mixed traffic of highly
automated and “traditional” vehicles as well as other road users like pedestrians
and cyclists, new safety risks require proper consideration. The driverless freight
delivery vehicles and connected and automated lorries hold a promise of
significant reductions in operational costs to make the freight delivery services
cheaper. The deployment of self-driving technologies should be well prepared to
prevent undesired social effects.
92. Besides, the large amount of generated data will significantly impact the complete
value chain, mainly on the digital and automotive sectors. The whole industrial
sector will need to evolve and adapt in a fast pace to stay ahead in global
competitiveness, while including all stakeholders and addressing societal needs.59
93. As new technologies have allowed for driver assistance and ever more advanced
active safety systems for vehicles, in the future they could lead to the emergence of
new mobility services based on highly or fully automated vehicles. Cooperative
intelligent transport services now being deployed in vehicles and on road
infrastructure will support the transition to automation. Highly automated road
vehicles function in certain areas (i.e. highways, ports and shuttles) and could
already be operational in the near future. Several large-scale EU demonstration
projects60
are already ongoing for both passenger cars, freight vehicles and public
transport in anticipation of this substantial change.
94. On the other hand, automation and digitalisation offers new mobility opportunities
and more comfort, which could lead to an increase in road transport demand,
which might increase for instance congestion.
95. Automation is also important for rail transport. It is already in widespread use on
metro systems and is now being extended to heavy rail too. It will bring very
significant energy savings due to more efficient driving, and (combined with the
latest versions of ERTMS) can allow capacity increases of more than 30% even on
the most congested infrastructure provided rail operations are adequately adapted
to benefit from digital innovation. Technologically it is far simpler than equivalent
road technologies, so with strong coordination between the rail infrastructure and
the operations on the rail network, it can and should be rapidly deployed.
Combined with increased automation of rail traffic management and timetabling, it
should lead to much greater flexibility in service provision.
Changes in industry and logistics in the EU
96. Further changes in the way the world economy and industry operates (e.g.
increasingly complex business structures and supply chains, growing importance of
software, 3D printing or shift to circular economy) will require further optimisation
of transport services, mainly in freight transport, and changes in design of transport
vehicles and infrastructure. The aforementioned elements have also an impact on
the employment in the transport sector, in terms of opportunities, required skills
and working conditions.
97. Great uncertainty surrounds the extent to which re-shoring and 3D printing will
dampen future growth of freight transport. If adopted extensively, both can affect
the type of goods moved, decrease the distances between production and
consumption centres and thus fundamentally alter today’s long and complex supply
59ERTRAC (2015): Automated Driving Roadmap 2015
https://www.ertrac.org/uploads/documentsearch/id38/ERTRAC_Automated-Driving-2015.pdf 60 https://knowledge-base.connectedautomateddriving.eu/projects/

31
chains. A significant decrease in the total value of internationally traded goods can
greatly reduce sea and air transport volumes.
98. Nonetheless, freight volumes are expected to continue to grow strongly. Before the
outbreak of the COVID-19 pandemic, global freight demand was projected to triple
between 2015 and 2050.61
Currently, the outlook for international trade is more
fragile although volumes are recovering. At the same time, freight transport and
logistics are undergoing major transformations, and these will likely be even more
disruptive in the future. Technology, business models, consumer behaviour, shifts
in trade patterns, and other factors all contribute to a changing transport landscape,
and how they play out can have a substantial impact on the projected growth. New
technologies and smart digital solutions supported by effective modernised
regulation are needed to accommodate this major increase in transport demand
sustainably – i.e. with only limited increase in assets and energy consumption.
Increased productivity and efficiency of the logistics and supply chains remains in
this context a key challenge. In container shipping, ship sizes and total capacity
have increased by a factor of 2.5 between 2004 and 2018 while the number of
companies has almost halved over the same period.62
E-commerce and last-mile
logistics are equally increasing significantly, a trend further accelerated as a
consequence of COVID-19 pandemic.
99. Digitalisation and automation of transport services also raise new challenges for
service providers, especially in terms of personal data protection, data sovereignty,
interoperability, cyber security and user acceptance. Cyber-attacks may lead to
delays of services, damage to physical systems, data theft, or even passenger
injuries. There are also concerns that remotely controlled aircraft and automated
rail and road vehicles may be subject to hacking or hi-jacking from distance.
Similar concerns arise in the maritime area, because of the growing digitalisation
of sea navigation.
2.4 Impact of the COVID-19 pandemic on the transport sector63
100. Although not reflecting a long-term trend, the COVID-19 pandemic is having
significant effects on the transport sector, which have the potential to shape the
sector for years to come.
101. Transport is one of the most severely affected sectors by the COVID-19 pandemic,
along with sectors such as tourism and hospitality. The impact was driven in the
short term by lockdown measures (including travel restrictions, tele-working and
home-schooling), other restrictions and voluntary avoidance efforts. This has led to
steep reductions in manufacturing and transport activity, as well as reduced activity
in service sectors such as retail stores, hotels and restaurants, etc. In addition it had
a huge impact on reduced levels of physical activity and general fitness among
children. The crisis has also highlighted the strategic importance of transport for
the supply of essential goods such as food, medicines and supply of essential
materials, particularly pronounced in certain remote regions such as the outermost
61 Source: OECD projections. 62 United Nations Conference on Trade and Development (2018): ‘Review of Maritime Transport 2018’.
https://unctad.org/en/PublicationsLibrary/rmt2018_en.pdf 63 Section 4.3.1 describes in detail some of the relevant measures that have been taken so far at European level to address the impact of the COVID-19 pandemic.
32
regions64
. The resilience of the transport and logistics system in Europe has been a
key contributing factor to managing the crisis effectively.
102. The pandemic’s short-term impact on the transport sector, in particular on
passenger transport, as well as on global supply chains is dramatic and
unprecedented on this scale in the post-war period. Lockdown measures led to a
prolonged standstill in production across many sectors creating supply chain
disruptions across the EU. This has led to a general fall in freight transport
demand. On the other hand, increased on-line shopping, including of essential
goods such as groceries and pantry items, have almost doubled the usual home
delivery rates. This increase of demand revealed limitations in last-mile delivery
capacity, also due to the lack of drivers, at least in the short run.
103. The long-term effects on transport activity will only become clear after the
pandemic has come to an end and will largely depend on the pace of the economic
recovery. Preliminary transport activity projections, reflecting the impacts of the
COVID-19 pandemic at EU-27 level, have been presented in section 2.3.
104. Behavioural changes already seen before the COVID-19 pandemic (e.g. urban
mobility) may affect certain transport modes as economies re-open, with long term
effects for some. Web-based meeting arrangements which have grown in use
during the pandemic are likely to become more frequent even beyond the
pandemic, thus adversely affecting business travel. Global supply chains may be
reorganised with a view of rendering them more robust against the fall-out due to
interruptions in freight distribution, affecting transport volume and patterns. The
growth in e-commerce may become a long term trend with a new level of
customers’ expectations for faster, contactless (safer in terms of contagion risk)
home deliveries, requiring the modernisation of corresponding delivery and
transport channels.
105. However this is clearly an ongoing and developing situation, and more time will be
needed to gather and analyse data in order to grasp the full impact of the current
crisis on the behaviour of passengers and transport users.
2.4.1 Air transport
106. Aviation is one of the EU transport sectors whose activity has been the hardest hit
by the COVID-19 pandemic, due to supressed demand following containment
measures taken by governments – including travel restrictions, lockdowns and
quarantine zones, as well as customers’ fear of contagion. Widespread flight
cancellations for consecutive months have caused major disruptions for passengers,
the aviation industry, the tourism sector and the EU economy as a whole.
107. After a positive evolution of the traffic situation following the removal of border
and travel restrictions in June, recovery dramatically slowed down following the
reintroduction of travel restrictions across Europe. Traffic in November 2020 was
59% below 2019 levels in terms of flights65
. In 2020, until mid-November there
was a loss of 1.5 billion passengers at European airports66
across the network
compared to 2019 levels. International passenger transport is likely to continue to
64 The EU counts nine outermost regions - French Guiana, Guadeloupe, Martinique, Mayotte, Reunion Island and Saint-Martin
(France), Azores and Madeira (Portugal), and the Canary Islands (Spain). They are located in the western Atlantic Ocean, the
Caribbean basin, the Amazonian forest and the Indian Ocean. In total, they are home to 4.8 million citizens. The special situation of
the outermost regions is recognised under Article 349 TFEU. 65 Source: Eurocontrol, traffic in mid-November (7-day moving average) 66 Source: ACI

33
be severely reduced due to lower demand and government restrictions in the next
years following the COVID-19 pandemic. Experiences from earlier network
disruptions, such as the 9/11 terrorist attack in 2001 and the Icelandic volcanic ash
incident in 2010, indicate that rebuilding may take a long time.
108. It must be underlined that there is a strong link between temporary border and
travel restrictions and the resumption of traffic. In particular quarantine
requirements led to a sharp drop in passenger bookings, although some other
factors such as squeezed household budgets, uncertainty over ticket refunds, and
fears of infection while travelling also contributed. Travel demand does therefore
in general tend to reflect the existence or the severity of travel restrictions in place
at national level, in particular if they are not co-ordinated between Member States.
Ensuring a co-ordinated approach at European level of national measures to
contain the COVID-19 pandemic is therefore likely to substantially improve
growth. The same applies for intercontinental travel where closed borders or travel
restrictions hamper travel.
109. This has affected every branch of the wide aviation value network, also resulting
e.g. in numerous delays and cancellations of aircraft orders, leading to a severe
decrease in the aeronautics industry’s order books.
110. According to Eurocontrol projections, air traffic growth volume in 2020 and 2021
will depend on the ability of European countries to coordinate their health and
sanitary measures.67
Overall, the Current Status Scenario by Eurocontrol envisaged
a loss of 55% of flights (6 million) in 2020. According to IATA recovery to 2019
level will not take place until 2024.
111. Taking all of the above into account, there will be a total industry loss in revenues
of approximately EUR 140 billion during 2020 for airlines, airports and air
navigation service providers. As a result, more than 7 million jobs supported by
aviation (including tourism) in Europe are now at risk, as estimated by IATA.68
The pressure on the sector has also resulted in raising the precariousness of work in
the aviation sector.
112. In response to this unprecedented decline in passenger air travel, the European
associations collectively representing the entire European aviation sector called for
measures to restore the public’s confidence in air travel. To this end, they stressed
the need for an effective coordination of national travel restrictions measures,
based on a common set of criteria, data and guidelines provided by the European
Centre for Disease Prevention and Control (ECDC) and the European Union
Aviation Safety Agency (EASA), and further improvements to the effective
enforcement of passenger rights to ensure legal certainty in travel.69
2.4.2 Waterborne transport
113. International freight transport is affected by both demand and supply of goods
effects related to the pandemic. Continued and uninterrupted maritime services are
of key strategic importance for the whole EU, with 75% of goods arriving to the
EU by sea. About 30% of all goods internally in the EU are transported by ships.
The COVID-19 pandemic has had a major impact on global shipping, affecting all
its segments from passenger ships to container ships and oil tankers. While some
67 Covering EUROCONTROL’s 41 members, including the EU and third countries such as Turkey and Ukraine. 68 IATA August update: https://www.iata.org/en/pressroom/pr/2020-08-13-01/ 69 European Aviation Round Table Report on the Recovery of European Aviation, November 2020.

34
ports have restricted passenger services, EU ports have remained open for cargo
transport. After an early effect of Chinese lockdown measures on global supply
chains, factory output has been picking-up after the relaxation of containment
measures.
114. EMSA reported70
that the number of ship calls at EU ports declined by 12.5% in
the first 39 weeks of 2020 compared to the same period in the previous year. The
most significantly affected sectors have been the cruises, passenger ships, roll-on-
roll-off-passenger and vehicle carriers. Meanwhile, the number of chemical tankers
ship calls increased in comparison with 2019 and the numbers for bulk carriers,
containerships, general cargo and oil tankers saw a limited decrease (up to 10%).
115. The impact of the inland navigation sector is estimated to a total loss of turnover
between EUR 2.2 and 4.4 billion considering a 90% reduction in passenger
transport and 25-30% reduction in freight transport during the crisis. Inland ports
have observed a decline in traffic due to the decrease of activity in seaports (e.g.
container trade with China).
116. Travel restrictions have also significantly reduced the number of passengers carried
by ferries, leading to financial difficulties for companies that provide essential
connections, in particular to islands and other remote regions. In order to ensure
basic connectivity across the territories of the EU and ensure continuity of services,
Member States have, apart from other support measures, also put in place
temporary public services obligations (“PSO”) and/or public service contracts
(“PSC”) to replace or support services that become commercially unviable due to a
sudden drop in passenger numbers.
117. Severe decrease in the sea transport of passengers impacted also the flows of goods
transported on ro-ro-passenger ships and on ferries, whose traffic is heavily
dependent on the revenues derived from passenger services. If demand for
passenger and personal vehicles’ transport remains low in a longer term, freight
transport business by these ships may not be possible without public support.
118. The cruise ship sector has also experienced severe operational losses. The capital
value of the cruise ship industry reportedly dropped by more than 70%. The
majority of cruise companies stopped operations, at the same time looking for
means to increase their credit capacity to manage the economic impact. The re-
uptake of activities has been limited, both as regards passengers and vessels, as
well as in geographical scope. The negative image of tourists and crew quarantined
on cruise ships during the pandemic will likely have a longer-lasting impact on
demand for this service, as well as for demand for new cruise ships, of which
around 90% are built in Europe.
119. In the maritime sector, the impact of the COVID-19 pandemic has reduced not
only the demand for transport and cargo services, but also the ability to supply
such services. It highlighted in particular the substantial consequences for
seafarers, whose working conditions severely deteriorated. Due to travel
restrictions and fewer connections, many ship-owners were unable to conduct
sufficient crew changes and repatriate maritime workers.
120. For all shipping segments with crew and passengers or persons on board, the issue
of crew changes, repatriation, medical care and other preventive and protective
measures are key to allow as uninterrupted operations as possible. Notable
COVID-19 outbreaks associated with shipping crews and passengers have
70 http://www.emsa.europa.eu/news-a-press-centre/covid19-impact/download/6386/3967/23.html

35
focussed attention on this issue. The social partners, ECSA and ETF issued
separate public statements urging authorities to facilitate swift and safe crew
changes, safe berthing places, exemptions from levies during prolonged lay-off
period, guarantee safe passage, as well as, of course, the provision of personal
protective equipment (PPE) to all working in the sector.
121. The majority of seafarers employed on ships, regardless of the flag of the ships, are
nationals from a limited number of labour-supplying countries; and certain traffic
routes and coastal States globally receive a disproportionately large volume of
incoming and outgoing vessels. In this context, the measures adopted by some third
countries have had an impact on European operations. At IMO and ILO level,
efforts are ongoing to provide a baseline of information sharing and respect for the
basic needs of crew changing and repatriation.
122. There have been cases of social unrest on board ships where maritime workers
have been stranded or had their contracts extended beyond the limit set by the
Maritime Labour Convention, 200671
, with no possibility to repatriate. The
European Commission and the High Representative have undertaken extensive
efforts to ensure maritime workers are recognised, globally, as essential or “key”
workers, can travel for work and repatriate after their contracts end. With COVID-
19 cases rebounding, variations in the pandemic situation locally and globally is
proving difficult to reach a stable arrangement on this front.
2.4.3 Road transport
123. The most affected segment of road passenger transport has been international
traffic, particularly coach tourism. After a period of partial reopening between July
and November, some international coach operators have been recently scaling back
again their services in some EU countries due to the second wave.
124. Road freight transport gradually picked-up starting in the second half of May,
according to real time indicators, such as German truck toll activity and pollution
levels. By mid-July, German truck toll activity was already tracking closely its
level over the same period of 2019, but has since failed to gain further momentum.
Road traffic in France, Italy and Spain broadly flattened over July and September,
stopping short of a full recovery. More recently, however, road traffic in both
France and Italy has increased somewhat and now stands around 10% below its
values for the same period of last year.
125. After major disruptions in road freight transport within the EU in the beginning of
March, the Commission’s Green Lanes initiative has improved the situation at
most internal borders. In November, the vast majority of borders continued to
comply with the 15 minutes waiting time mandated by the Green Lanes72
. Border
crossing points with Romania and Bulgaria continue to be impacted by long
queues. Others show occasional peaks in waiting time (Romania-Hungary,
Croatia). On the external borders of the EU, there continue to be long queues at
borders with Switzerland (which seem to be not COVID-related but due to customs
checks). There is a continued long waiting time at the Bulgaria-Serbia, Hungary-
Serbia, Greece-Albania borders. In particular, Röszke-Horgoš (Hungary-Serbia)
71 Maritime Labour Convention, 2006, as amended (MLC, 2006)
https://www.ilo.org/dyn/normlex/en/f?p=NORMLEXPUB:91:0::NO::P91_SECTION:MLCA_AMEND_A2 72 C(2020) 1897 final Communication “on the implementation of the Green Lanes under the Guidelines for border management
measures to protect health and ensure the availability of goods and essential services” and COM(2020) 685 final Communication “upgrading the transport Green Lanes to keep the economy going during the COVID-19 pandemic resurgence”

36
has experienced the highest waiting times since commencing monitoring of
waiting times.
126. Compared to pre-crisis levels, most Member States are still seeing important
decreases in demand for road freight transport. The IRU estimates the goods
transport losses to exceed EUR 800 billion globally73
.
127. Based on preliminary data from Member States, the Commission estimates that the
number of road fatalities during lockdown measures decreased across the EU in
March (-29%), April (-41%), May (-27%), June (-27%), July (-16%), August (-
16%) and September (-14%) compared to the average of the same month in the
previous three years74
. This means that around 3 000 lives fewer have been lost.
This is an unprecedented and of course welcome development, although the
number of deaths did not fall significantly in all Member States and not by the
same degree as the drop in traffic volumes.
128. As a result of lower traffic volumes compared to previous expectations, ratings
agencies have re-assessed negatively the outlook of a number of Europe’s
privately-owned toll road concessionaires.
2.4.4 Rail transport
129. Railways have experienced significant and unexpected disruption due to the
COVID-19 pandemic, with a huge drop in passenger mobility. During the peak of
the crisis ridership went down by more than 90% in several countries and many
international connections were stopped. After the drop of turnover by 35%
observed during the first semester, there has been a significant improvement of the
situation in July and August but pre-crisis levels are still far from having been
reached (July: -28% compared to same month of previous year; August: -27%).
However, the trend is not maintained as demonstrated by the figures of turnover
losses in September with -29%, due to the second wave of the pandemic hitting
countries across the EU and the expected impact on rail passenger travel. Smaller
independent operators are particularly badly hit and, according to their association
ALLRAIL, have so far not benefited from State aid to the same extent as
incumbent operators.
130. Rail freight continued to run reliably throughout the pandemic, ensuring supply
chains and suffering from much less disruption than other modes. Nonetheless, the
impact of the COVID-19 pandemic caused an approximate average decline in rail
freight revenues of 15% across the EU-27 during the first half of 2020 and lost
revenues of about EUR 48 million per week with a total estimated loss of EUR
1.25 billion accumulated over the first semester 2020. Rail infrastructure managers
are impacted by the COVID-19 pandemic due to the reduction in traffic and the
revenues it generates.75
73 Based on information provided by IRU as part of their submission to the open public consultation on the Sustainable and Smart Mobility Strategy, due to the COVID-19 pandemic in the goods road transport industry: revenue declined by 40% during the
confinement period (in comparison to 2019 figures); many transport operations such transport of automotive parts, clothing, flowers and construction materials have dramatically slowed by almost 100%; empty running increased by up to 40%; and new contracts
have declined by 60-90%. 74 This is confirmed by an analysis of the European Transport Safety Council (ETSC), which estimated, based on data from 25 Member States, that road fatalities decreased by an average of 36% during lockdown measures in April. European Transport Safety
Council: PIN report “The Impact of Covid-19 Lockdowns on Road Deaths in April 2020”, 9 July 2020 (https://etsc.eu/pin-report-
lockdowns-resulted-in-an-unprecedented-36-drop-in-road-deaths-in-the-eu/). 75
Opinion of the European Economic and Social Committee (TEN/716-EESC-2020) for the Proposal for a Regulation of the
European Parliament and of the Council establishing measures for a sustainable rail market in view of the COVID-19 pandemic [COM(2020) 260 final - 2020/0127 (COD)], Rapporteur-general: Alberto MAZZOLA, Plenary session: 553 - Jul 16, 2020

37
131. Intermodal transport suffered from lower demand from its traditional markets. At
the same time, it gained some new clients by demonstrating its potential for long
distance, Europe-wide transport of goods, with the local (usually around 50 km)
distribution organised by lorries or vans from the terminals to distribution centres
or factories, with a limited human interaction. Adequate network of multimodal
terminals, reliable rail (in particular the Rail Freight Corridors76
), but also inland
navigation and short sea shipping services are in this context essential.
2.4.5 Urban transport
132. Public transport operators have been severely hit by the COVID-19 pandemic: they
were required to maintain essential services in operation during the lockdown
period and to restore services as movement restrictions eased.
133. Public transport is likely to continue to be affected, especially in regions where
quarantine measures have reappeared. As of 15 November, the mobility trends for
public transport hubs (subway, bus and train stations) are -46 % in Netherlands, -
45% in Italy, -28% in Spain, Germany and -46% in France compared to the pre-
pandemic baseline.77
134. Nevertheless, most public transport companies – whether public or private –
maintained a high level of service where possible (between 70 and 100 percent of
the normal offer). Many of those who must continue commuting rely on public
transport systems, which are uniquely positioned to carry large volumes of
passengers through busy urban areas. Even during the pandemic, public transport
has remained the backbone of sustainable mobility and essential to economic
recovery. Although there is new and growing evidence that public transport riders
do not face higher infection risk than non-riders78
, public transport authorities have
had to take supplementary measures for disinfection and mask provision to reduce
risk for workers and passengers alike, incurring extra costs.
135. In addition, the need to ensure physical distancing severely reduced capacity,
which led the public authorities in several countries to appeal to citizens not to use
public transport (for instance to keep it free for essential workers and those without
alternatives). This appears to have contributed to a general public concern about
the safety of using public transport during the pandemic, and continued stagnation
in its use in many cities.
136. At the same time, the COVID-19 pandemic has led to a shift to individual modes
of transport, with walking and cycling often being the preferred mode in many
cities, combining the ‘active’ element (physical exercise) with the travel objective.
This has resulted in additional health benefits thanks to increased physical activity,
reducing a key risk factor of non-communicable diseases, such as cancer and
cardiovascular diseases. Cities have also been struggling to accommodate the
necessary distancing rules due to insufficient space for pedestrians and cyclists79
and many of them have therefore taken action to implement temporary measures,
https://www.eesc.europa.eu/fr/our-work/opinions-information-reports/opinions/proposal-regulation-european-parliament-and-
council-establishing-measures-sustainable-rail-market-view-covid-19-pandemic 76 In accordance with Regulation (EU) 913/2010, Rail Freight Corridors have been established in the EU to ensure a good quality rail network for competitive freight. 77 The baseline is the median value, for the corresponding day of the week, during the 5-week period Jan 3–Feb 6, 2020. Google
Community Mobility Reports: https://www.google.com/covid19/mobility/ 78 https://blogs.worldbank.org/transport/fight-against-covid-19-public-transport-should-be-hero-not-villain 79 One of the revelations of the pandemic was the disproportionate distribution of public space in favour of motorised traffic, with
cars accounting for ~30-40% of journeys but occupying ~70-80% of public space in European cities (COVID-19 SUMP Practitioner Briefing, https://www.eltis.org/sites/default/files/covid-19_sumppractitionersbriefing_final.pdf).

38
such as the widening of pavements and the roll-out of temporary cycle lanes. Many
cities are also now making these temporary lanes permanent to try to maintain or
further improve active mobility flows, also to help improve public health and
reduce mortality caused by non-communicable diseases. However, new individual
solutions accessible for those with disabilities and reduced mobility have not yet
materialised and existing ones are expensive and limited in offer.
137. A drop in air pollution in cities during the first period of lockdown measures is
confirmed by data published by the European Environment Agency80
. As first
round of lockdown measures eased, there were increasing indications that more
people are using private cars, partly because of continued concerns about the safety
of public transport. This led to a return to congestion, poorer air quality and
increased road safety risks. Therefore some cities in Europe, e.g. Milan or
Brussels, are re-thinking their sustainable urban mobility plans in order to
discourage the use of private cars. In addition, the EU High Level Group on Road
Safety has agreed on common principles to address road safety concerns, including
strengthened enforcement, measures to restore confidence in public transport, and
continued investment in road safety, including in order to make temporary safety
measures (adopted during lockdown) permanent, such as “pop-up bike lanes”81
.
138. New shared mobility services, such as e-bikes, e-scooters, shared cars, experienced
drastic reductions of service in quarantine areas and in several cities have been
slow to re-emerge even as movement restrictions were raised. The business models
of many companies offering shared mobility services already involved long periods
of loss-making and some of them may be driven (close) to bankruptcy or to change
their business model.
80https://www.eea.europa.eu/highlights/air-pollution-goes-down-as 81 Road safety measures in the COVID transitional era – common High Level Group principles as we exit the crisis, 2 July 2020
(https://ec.europa.eu/transport/road_safety/road-safety-measures-covid-transitional-era-common-high-level-group-principles-we-exit-crisis_en)

39
3 KEY POLICY DEVELOPMENTS OVER THE LAST DECADE
139. The 2011 White Paper for transport82
defined a vision for a competitive and
sustainable transport system, the implementation of which required an efficient
framework for transport users and operators, an early deployment of new
technologies and the development of adequate infrastructure. It set the paramount
goal of European transport policy as helping establish a system that underpins
European economic progress, enhances competitiveness and offers high quality
mobility services while using resources more efficiently.
140. This section highlights some of the additional measures that have been put in place
in the key policy areas over the last decade. Nevertheless, it needs to be recognised
that significant challenges remain, as described in the subsequent sections,
particularly in relation to meeting the need for sharper CO2 reductions from
transport in order to reach economy-wide climate neutrality by 2050 and the
increased ambition for 2030 of at least 55% GHG emission reduction.
3.1 Sustainability
141. On 28 November 2018, the Commission adopted a strategic long-term vision for
climate-neutral economy by 205083
, engaging all sectors of the economy and
society, to achieve the transition to a climate-neutral economy. The transport
sector, being one of the main sources of GHG emissions in the economy was
identified as playing an important role in this transition. The climate neutrality
objective was endorsed by the European Parliament84
and subsequently the
European Council85
.
142. The European Green Deal of December 2019 sets a strategic framework for a
climate-neutral EU economy by 2050. It sets a high level of ambition for climate
neutrality and healthy environment, accelerating the shift to sustainable and smart
mobility, and delivering a zero pollution ambition for a toxic-free environment and
the transition to a circular economy while leaving no one behind. To this end, it
calls for a 90% reduction in transport emissions by 2050. Priority actions of the
Green Deal for a shift to sustainable and smart mobility include boosting
multimodal transport, support the deployment of automated and connected
mobility solutions across modes, better addressing external costs of transport
activities through pricing, ramping up the production and deployment of
sustainable alternative transport fuels and reducing pollution from transport,
especially in cities86
, through for instance stricter air pollutant standards.
82 COM(2011) 144 final White Paper - Roadmap to a Single European Transport Area – Towards a competitive and resource
efficient transport system 83 Communication from the Commission to the European Parliament, the European Council, the Council, the European Economic
and Social Committee, the Committee of the Regions and the European Investment Bank ‘A Clean Planet for all A European
strategic long-term vision for a prosperous, modern, competitive and climate neutral economy’, COM(2018) 773 final. 84 European Parliament resolution of 14 March 2019 on climate change – a European strategic long-term vision for a prosperous,
modern, competitive and climate neutral economy in accordance with the Paris Agreement 85 European Council Conclusions of 12 December 2019 (EUCO 29/19) 86 New technologies, sustainable solutions and disruptive innovation are critical to achieve the objectives of the European Green
Deal. Four ‘Green Deal Missions’ are envisaged under Horizon Europe to deliver large-scale changes in areas such as adaptation to
climate change, oceans, cities and soil, bringing together a wide range of stakeholders including regions and citizens to accelerate
the transition to a sustainable future. The envisaged climate-neutral and smart Cities Mission could be particularly relevant in this
context as one of the strategic priority areas for joint action to accomplish decarbonisation within cities relies on “an efficient
mobility for all, clean, safe and connected”, including among others carbon free propulsion systems, new energy efficient vehicles, smart multimodal and integrated transport systems and solutions.

40
143. In March 2020 the Commission adopted a Communication on a new Circular
Economy Action Plan87
setting a future-oriented agenda for achieving a cleaner
and more competitive Europe. The development of transport infrastructures and the
production of different types of transport vehicles (airplanes, cars, trains, ships
etc.) require the use of substantial volumes of materials. The treatment of the end-
of-life stage of these vehicles also raises important environmental challenges,
while representing opportunities for the recovery of precious resources, notably
critical raw materials. There is a need for the transport sector to move to more
circular models, notably through business models for mobility, green public
procurement, changes in the design of vehicles and improvements in their
recycling.
144. In May 2020, the Commission adopted its Biodiversity Strategy for 2030.88
The
strategy introduces general goals on protection and restoration of nature and
biodiversity such legal protection of a minimum of 30% of the EU’s land area and
30% of the EU’s sea area, including 10% under strict protection, as well as
adoption of a legally binding instrument on restoration. Additionally, the Strategy
introduces specific goals such as restoration of freshwater ecosystems through
recreation of at least 25,000 km free-flowing rivers by 2030, reduction of nitrogen
pollution, reduction of impacts from invasive alien species and integration of
ecological corridors as part of a true Trans-European Nature Network.
Achievement of all of these goals will require close involvement of the transport
sector at the stage of planning, operation or upgrading of transport infrastructure.
145. In September 2020 the Commission adopted the Communication on Critical Raw
Materials Resilience89
setting out an action plan to ensure a secure and sustainable
supply of raw materials for a wide range of industrial ecosystems. Low and zero-
emission vehicles will increase demand for critical raw materials like lithium and
cobalt in batteries and rare earths for electric motors. Improved circular use of
materials, developing EU sourcing and diversifying sourcing from third countries
is a necessity for achieving resilient value chains in the transport sector.
146. The 2030 Climate Target Plan of September 2020 set out that all transport
sectors - road, rail, aviation and waterborne transport - will have to contribute to
the economy-wide at least 55% GHG reduction effort. A smart combination of
vehicle/vessels/aircraft efficiency improvements, fuel mix changes notably through
increased uptake of renewable and low-carbon fuels, greater use of sustainable
transport modes and multi-modal solutions, digitalisation for smart traffic and
mobility management, infrastructure pricing and other incentives can reduce GHG
emissions and at the same time significantly address noise pollution and improve
air quality. In addition, more use of sustainable options, such as an increased use of
existing urban bus and rail services can reduce emissions, congestion and pollution
while improving road safety, especially in urban areas.
147. In fact, the shift towards low-emission mobility was already an objective in the
Transport White Paper of 2011 ‘Roadmap to a Single European Transport Area’90
87 Communication from the Commission to the European Parliament, the European Council, the Council, the European Economic
and Social Committee and the Committee of the Regions ‘A new Circular Economy Action Plan For a cleaner and more competitive
Europe’, COM(2020) 98 final. 88 Communication from the Commission to the European Parliament, the Council, the European Economic and Social Committee
and the Committee of the Regions, ‘EU Biodiversity Strategy for 2030 - Bringing nature back into our lives’, COM(2020) 380 final. 89 Communication from the Commission to the European Parliament, the Council, the European Economic and Social Committee
and the Committee of the Regions, ‘Critical Raw Materials Resilience: Charting a Path towards greater Security and Sustainability’,
COM(2020) 474 final. 90 Roadmap to a Single European Transport Area – Towards a competitive and resource efficient transport system, COM(2011) 144 final.

41
and was supported by various initiatives. As shown in the evaluation report, the
White Paper and its implementation has contributed effectively to putting
European transport on the path of reducing in GHG emissions by 2030 and beyond.
However, this is no longer sufficient. Given the climate emergency and the revised
emission reduction target for 2030 as well as the objective of carbon neutrality in
2050, significantly increased mitigation efforts will be needed.
148. The European Strategy for Low-Emission Mobility91
was adopted in July 2016
to respond to increasing mobility needs of people and goods, while remaining
competitive and shifting towards low-emission mobility. The Strategy reconfirmed
and strengthened the 2011 White Paper goals and proposed an action plan: by mid-
century, GHG emissions from transport need to be at least 60% lower than in 1990
and be firmly on the path towards zero. Harmful emissions of air pollutants need to
be drastically reduced without delay.
149. The European Commission swiftly adopted proposals in the Action Plan of the
Strategy, notably the “Clean Energy for all Europeans” package in November
2016, and three Mobility Packages in May 2017, November 2017 and May
201892
. Elements of the first Mobility Package aimed to improve competition and
working conditions in the road freight sector, contribute to better road safety and
reduction of environmental impacts has been adopted and entered into force on 20
August 2020.
150. The second Mobility Package, focussing on clean mobility, included the proposal
for amending the Combined Transport Directive (92/106/EEC) 93
which is a key
EU measure to directly support modal shift from road-only transport to rail, inland
waterways and short sea transport. However, the negotiations in the European
Parliament and the Council led to draft amendments which, if adopted, would
significantly reduce the effectiveness of the Commission proposal. Therefore the
Commission decided to withdraw the 2017 proposal.
151. The second Mobility Package further responded to the challenge of making
mobility clean, competitive and connected through a combination of demand- and
supply-side measures on low-emission mobility. In concrete terms, it encompassed
a number of measures with the aim to enable a transition towards low and zero
emission mobility, such as a reform of the Clean Vehicles Directive, new CO2
standards for cars and vans, or a follow-up to the Action Plan related to the
Alternative Fuels Directive.
152. The third Mobility Package put forward an integrated policy for the future of road
safety. It included a Strategic Action Plan on Road Safety and proposals on vehicle
and infrastructure safety. The package also contained the first ever CO2 standards
for heavy-duty vehicles, a strategic Action Plan for the development and
manufacturing of batteries in Europe and a strategy on connected and automated
mobility.
91 Communication from the Commission to the European Parliament, the Council, the European Economic and Social Committee
and the Committee of the Regions ‘A European Strategy for Low-Emission Mobility’, COM(2016) 501 final. 92 https://ec.europa.eu/transport/modes/road/road-initiatives_en 93 A related point concerns amendments proposed by the co-legislators to Regulation (EU) 2020/1055 of the European Parliament
and of the Council of 15 July 2020 amending Regulations (EC) No 1071/2009, (EC) No 1072/2009 and (EU) No 1024/2012 with a
view to adapting them to developments in the road transport sector, in the context of the first Mobility Package. This Regulation authorises Member States to derogate from Article 4 of Directive 92/106/EEC “where necessary to avoid misuse of the latter
provision through the provision of unlimited and continuous services consisting in initial or final road legs within a host Member
State that form part of combined transport operations between Member States”. In that case, Member States may provide that the
cabotage rules of Regulation (EC) 1072/2009 apply to hauliers when they carry out initial and/or final road haulage legs within the
Member State concerned. According to Article 4 of Regulation (EU) 2020/1055, this rule will apply from 21 February 2022 The
Commission has announced that it will conduct an impact assessment regarding this aspect (See Council document 7045/20 ADD 2 of 1 April 2020).

42
153. The Commission also adopted an Urban Mobility Package in 2013, to help cities
in their transition towards sustainable urban mobility by reinforced support at
European, national and regional levels. It has the concept of sustainable urban
mobility planning (SUMP) at its centre, with dedicated European guidelines
adopted later on. It has proven an effective and increasingly popular tool,
implemented in cities in a large number of countries, and not only in the EU.
154. Key European legislation has been adopted to support the uptake of alternative
fuels, including electricity, over the last decade. This includes the directive on the
deployment of alternative fuels infrastructure94
, which requires Member States to
set up long-term National Policy Frameworks (NPFs) for the development of
markets for alternative fuels and the deployment of alternative fuels infrastructure.
It also requires the rollout of alternative fuels infrastructure along the core network
of the Trans-European Transport Network (TEN-T) and its urban nodes - with
milestones for 2020, 2025 and 2030 for different alternative fuels infrastructure for
roads and ports. The Directive sets common technical specifications for recharging
and refuelling stations to ensure interoperability and adequate consumer
information. In parallel, financial instruments have been established to support the
uptake of alternatively fuelled vehicles/vessels and their infrastructure, most
notably through the Connection Europe Facility.
155. The Commission also adopted an action plan on alternative fuels infrastructure95
to
support the implementation of the Alternative Fuels Infrastructure Directive and
mobilised considerable investment of public and private market actors through the
Connecting Europe Facility (CEF), the CEF blending facility and the CEF debt
instrument. Since 2014, more than EUR 6.8 billion of investments were thereby
supported for alternative fuels infrastructure and mobile assets, the vast majority
being for infrastructure. In particular the Blending Call for proposals launched in
2017/2018 aimed at combining grants with bank lending. Moreover, considerable
investment has been made in research and development to support progress with
technological and non-technological innovation. In this context, an important role
is played by transport-related research and innovation partnerships. These are
supported by and coordinated with European research and innovation on more
sustainable alternative fuels.
156. In 2019 the co-legislators adopted the Clean Energy for All Europeans package
that contained a number of legislative acts supporting the uptake of alternative
fuels, including renewable and low-carbon fuels. The revised renewables energy
directive (RED II) sets a 14% target for 2030 for the use of renewable transport
fuels. The Energy Performance of Buildings Directive (EPBD) requires the
installation of charging points or related pre-cabling in all new office and
apartment buildings and in those going through major renovations. Finally, the
electricity directive96
requires Member States to provide a framework to facilitate
the connection of recharging points to the distribution network and Distribution
System Operators to cooperate with the undertakings that own, develop, operate of
manage recharging points for electric vehicles. It also supports the cost-efficient
integration of electric vehicles into the electricity system by laying the basis for
94 Directive 2014/94/EU 95 Communication form the Commission to the European Parliament, the Council, the European Economic and Social Committee
and the Committee of the Regions Towards the broadest use of alternative fuels - an Action Plan on Alternative Fuels Infrastructure
under Article 10(6) of Directive 2014/94/EU, including the assessment of national policy frameworks under Article 10(2) of
Directive 2014/94/EU (COM (2017) 0652 final) 96 Regulation (EU) 2019/943 of the European Parliament and of the Council of 5 June 2019 on the internal market for electricity, OJ L 158, 14.6.2019, p. 54–124.

43
enabling smart charging and setting a framework for the development of bi-
directional charging (car batteries feeding electricity into the grid).
157. As part of the Mobility Packages, emission reduction of GHG and air pollutants
from road transport have been strengthened by the CO2 standards for new cars,
vans and heavy goods vehicles, by the Clean Vehicles Directive97
which relies
on public procurement rules; and by the deployment of recharging infrastructure
for electric vehicles and refuelling stations for fuel-cell vehicles and multimodal
travel information services supported by digital tools and data sharing.
158. In 2019, legislation was adopted with stricter CO2 emission performance standards
for cars as well as for light and heavy duty vehicles from 2025 and 2030.
159. The weights and dimensions directive98
was revised in 2015 and provides for
derogations on the maximal lengths to make heavy goods vehicles greener by
improving their aerodynamic performance. Derogations on weights are also
allowed for vehicles powered by alternative fuels. The directive was modified
again in 2019 to allow manufacturers to commercialise such vehicles already from
September 2020. This package was completed by implementing rules on the
vehicle approval legislation.
160. The revision of the Eurovignette Directive proposed by the Commission in 2017
aims at further implementing the “user and polluter pay” principles, by providing
that all road charging schemes applied to heavy duty vehicles reflect the level of
CO2 emissions. These revised rules should serve as an incentive for users to invest
in less polluting vehicles.
161. In the past decade, the EU has adopted a number of essential policy instruments to
address the environmental footprint of aviation. These instruments, are grouped in
a so-called “basket of measures”, namely market-based measures such as
emissions trading, research and development for greener aircraft design and
technology (CO2 standards, Clean Sky), more efficient air traffic management
operations (Single European Sky and SESAR), and the use of sustainable aviation
fuels.
162. CO2 emissions from aviation in the EU have been included in the EU emissions
trading system (EU ETS) since 2012. Under the EU ETS, all airlines operating in
Europe, European and non-European alike, are required to monitor, report and
verify their emissions, and to surrender allowances against those emissions.
Aircraft operators receive tradeable allowances covering on average, almost half of
emissions from their flights. It is estimated that between 2013 and 2019, a net
saving of more than 160 Mt CO2 has been achieved through the inclusion of
aviation in the EU ETS. The auctioning of allowances to the aviation sector has
moreover generated revenues which have been used in part for climate- and
energy-related purposes including the Innovation Fund for demonstration of
innovative low-carbon technologies. The EU ETS also contains incentives to
promote the use of Sustainable Aviation Fuels (SAF). For the time being, the scope
is limited to intra-EEA flights, with a “stop-the-clock” provision, as regards
outbound to and incoming flights from non-EEA countries, in the EU ETS
97
Directive (EU) 2019/1161 of the European Parliament and of the Council of 20 June 2019 amending Directive 2009/33/EC on the
promotion of clean and energy-efficient road transport vehicles (Text with EEA relevance.) PE/57/2019/REV/2 OJ L 188,
12.7.2019, p. 116–130 98 Directive (EU) 2015/719 of the European Parliament and of the Council of 29 April 2015 amending Council Directive 96/53/EC
laying down for certain road vehicles circulating within the Community the maximum authorised dimensions in national and international traffic and the maximum authorised weights in international traffic, OJ L 115, 6.5.2015, p. 1–10.

44
Directive which is valid until the end of 2023. This provision was intended to
provide momentum for a global market-based mechanism.
163. In 2016, the EU played a leading role in the adoption by the International Civil
Aviation Organization (ICAO) of the first ever sectoral scheme regulating CO2, the
Carbon Offsetting and Reduction Scheme for International Aviation (CORSIA).
All EU Member States will participate in the pilot-phase of the scheme, which will
start in 2021, with the aim to offset growth in emissions beyond 2020 levels99
,
without prejudice to the upcoming revision of the EU ETS Directive as regards
aviation. Depending on participation and quality of offsets used, at global level, the
ICAO CORSIA scheme could mitigate up to 2.5 billion tonnes of CO2 and
generate up to approximately USD 40 billion of climate financing by 2035. The
Commission is assessing different policy options for a legislative proposal to
implement further aspects of CORSIA in the EU, through amending the EU ETS
Directive.
164. The EU has also adopted new standards for aircraft CO2 emissions, which entered
into force in 2019100
. These standards, which follow the global standards adopted
by ICAO in 2017, provide additional requirements into the design process to focus
on fuel efficiency. Also the adoption of new aircraft engine non-volatile Particulate
Matter (nvPM) standards in ICAO was supported by the EU.
165. To develop the green and cutting-edge aircraft technology of the future, the EU
relies on the Clean Sky Joint Undertaking. With a budget of EUR 4 billion and
composed of over 600 entities from 27 countries, the Clean Sky 2 initiative (2014-
2024) was designed to build on the Clean Sky 1, which aimed to develop
technologies with reduced CO2, NOx and noise emissions.
166. The Single European Sky framework aims to make European skies more efficient,
and can deliver important environmental benefits. The SESAR project, sponsored
by the EU and the aeronautical industry, contributes to develop and deploy
innovative ATM solutions with a potential to further reduce emissions. In 2013, the
Commission proposed to complete the SES through amendments that could allow
to decrease emissions up to 10%. However, with no progress on this proposal, the
Commission presented an amended proposal on 22 September 2020101
, which is
expected to facilitate discussions between the co-legislators.
167. Recognising the need for long-term sustainability of aviation and the commitment
to continue efforts to reduce aviation sector’s negative environmental impacts, the
European associations collectively representing the entire European aviation called
for an EU Pact for Sustainable Aviation. Through collaboration between all
stakeholders in the aviation eco-system and policy-makers, the Pact is to contribute
to the implementation of the European Green Deal, by reaching the objectives of
significant CO2 emission reductions by 2030 and net-zero CO2 emissions by 2050
from all flights within and departing from the EU. The Pact will also consider the
feasibility of making 2019 the peak year for CO2 emissions from European
aviation while enabling the sector to continue delivering its social and economic
benefits.102
99 Following the major impact of the COVID-19 pandemic on international aviation, ICAO decided to use, during CORSIA’s pilot
phase from 2021 to 2023, the CO2 emissions of year 2019 as the baseline beyond which the growth of emissions from operators
concerned will be offset. 100 Commission Delegated Regulation (EU) 2019/897 of 12 March 2019 amending Regulation (EU) No 748/2012 as regards the
inclusion of risk-based compliance verification in Annex I and the implementation of requirements for environmental protection 101 COM(2020) 577 and COM(2020) 579 accompanied by SWD(2020) 187 102 European Aviation Round Table Report on the Recovery of European Aviation, November 2020.

45
168. Tackling maritime emissions is of key importance to reach the goals of the Paris
Agreement as the share of shipping emissions in global anthropogenic emissions
has increased from 2.8% in 2012 to 2.9% in 2018. In addition, international
shipping emissions are expected to grow quickly without the implementation of
appropriate policies at all levels.
169. At EU level, following up on the 2011 EU White Paper on Transport, the
Commission adopted a strategy on the decarbonisation of shipping in 2013, calling
for a gradual approach in the EU, starting with an EU monitoring, reporting and
verification (MRV) scheme, which was implemented through Regulation (EU)
2015/757 on the monitoring, reporting and verification of CO2 emissions from
maritime transport. In 2018, the revised Emission Trading System Directive (EU)
2018/410 calls for “action from the IMO or the Union to start from 2023, including
preparatory work on adoption and implementation and due consideration being
given by all stakeholders”. In 2019, the European Green Deal has outlined
measures to be developed, including a proposal to extend European emissions
trading to the maritime sector and legislative options to boost the production and
uptake of sustainable alternative fuels for the different transport modes. In 2020,
the Commission published its first annual report on the monitoring, reporting and
verification of CO2 emissions from ships, which confirmed that maritime transport
is a substantial CO2 emitter. In addition, the Climate Target Plan communication
confirmed that, in accordance with its international commitment to economy-wide
action under the Paris Agreement, the EU should include at least intra-EU
maritime transport in the EU ETS.
170. At the international level, the International Maritime Organization (IMO) agreed in
2018 to a first quantitative target: to peak GHG emissions from international
shipping as soon as possible and to reduce total annual GHG emissions by at least
50% by 2050 compared to 2008 (to be reviewed in 2023), while pursuing efforts to
achieve full decarbonisation as soon as possible in this century and following a
pathway of CO2 emissions reduction consistent with the Paris Agreement
temperature goals. It also sets the target to reduce the carbon intensity of
international shipping by at least 40% by 2030, pursuing efforts towards 70% by
2050, compared to 2008. The EU is closely involved in work to develop measures
for reaching these objectives at IMO level as shipping remains a fundamentally
global business.
171. Previously, the IMO's Marine Environment Protection Committee (MEPC)
adopted in 2011 a package of technical measures for new ships and operational
reduction measures for all ships. This package was composed of two main
measures: the Energy Efficiency Design Index (EEDI), which requires new ships
to comply with minimum mandatory energy efficiency performance levels,
increasing over time through different phases; and the Ship Energy Efficiency Plan
(SEEMP), which establishes a mechanism for shipowners to improve the energy
efficiency of both new and existing ships using operational measures such as
weather routing, trim and draught optimization, speed optimization, just-in-time
arrival in ports, etc. The regulations entered into force on 1 January 2013 and apply
to all ships of 400 gross tonnage and above, irrespective of flag and ownership.
These measures are the first ever mandatory global GHG reduction regime for an
entire industry sector103
.
103 http://www.imo.org/en/OurWork/Environment/PollutionPrevention/AirPollution/Pages/GHG-Emissions.aspx

46
172. As regards air quality, in 2016 the IMO confirmed the entry into force of the
stricter 0.5% global sulphur limit (down from 3.5%) in marine fuels from 1
January 2020. EU action was decisive in securing this decision. This framework is
anticipated in the EU Sulphur Directive of 2012, which also contains tighter limits
in the emission control areas established in the Baltic, North Sea and English
Channel. The fuel standards successfully reduced sulphur oxides in these protected
areas established by the IMO, and are instrumental in further reducing emission
pollutants across all EU waters as of January 2020. Similar low emission areas are
currently envisaged by the Mediterranean Countries under the Barcelona
Convention. The Commission will continue to engage with Mediterranean coastal
states104
to push for the creation of new Emission Control Areas to protect the
health of coastal citizens, their environment as well as sea-related economic
activities from NOx and other air shipping emissions.
173. Regulation 2016/1628105
on non-road mobile machinery was adopted in 2016
under which new engines for inland waterway vessels have to meet stricter
pollutant emission limits from 2019 for engines smaller than 300 KW, and 2020
for engine bigger than 300 KW, respectively.
Since 2017, the Commission (DG REFORM) manages the Structural Reform
Support Programme (SRSP) for technical support projects in EU Member States,
with a budget of EUR 222.8 million until 2020. Under the SRSP, Member States
can request support to implement reforms in a wide range of areas, including for
building sustainable and competitive economies. In the area of sustainable and
smart mobility, Member States have received technical support, among others, for
preparing regulations on sustainable mobility; performing gap analyses of a
national policy frameworks for alternative fuel infrastructure in transport;
improving inland navigations and traffic conditions in a major port area; and
supporting new transport and mobility masterplans. The Commission has proposed
a new Technical Support Instrument as part of the 2021-2027 Multiannual
Financial Framework so as to continue provide its support to improve Member
States’ administrative capacity to design, develop and implement reforms,
including in the area of sustainable and smart mobility.
In 2018, the Commission also issued a Communication on the principles of
subsidiarity and proportionality106
. It noted that “it is essential that the 41 national
Parliament chambers, 74 regional legislative assemblies, the 280 regions and the
80 000 local authorities, who are at the forefront of implementing EU laws, are
more fully engaged in the policy process. Active subsidiarity and a new way of
working with these entities will help deliver policies that work while strengthening
the understanding and ownership of what the Union does.”
3.2 Digitalisation
174. As explained in section 2.3.3, digitalisation in transport can bring huge
improvements in efficiency, safety and sustainability. This includes a better
organisation and integration of transport modes towards efficient multimodal door-
104 United Nations Environment Programme/MED Decision IG.24/8 ‘ Road Map for a Proposal for the Possible Designation of the
Mediterranean Sea, as a whole, as an Emission Control Area for Sulphur Oxides Pursuant to the International Convention for the
Prevention of Pollution from Ships (MARPOL) Annex VI, within the framework of the Barcelona Convention’. 105 Article 4: Engine categories 106
COM(2018) 703 final “The principles of subsidiarity and proportionality: Strengthening their role in the EU's policymaking”

47
to-door transport and by progressively introducing new technology, which has the
potential to reduce safety risks caused by human error in the longer term.
175. Research and innovation programmes (especially Horizon 2020107
and the
European Regional Development Fund) have been essential to test and validate
new technologies and solutions and prepare them for market deployment.
176. The EU has developed legislative and non-legislative digitalisation initiatives in all
transport modes, such as the Intelligent Transport Systems Directive, the Electronic
Freight Transport Information Regulation and a new Regulation on a European
Maritime Single Window environment. The Commission has also established a
dedicated expert group, the Digital Transport and Logistics Forum (DTLF), where
public and private stakeholders work together to support digitalisation in freight
transport and logistics; as well as the High level Steering Group for the
Governance of the of the Digital Maritime System and Services.
177. Similarly, a key element towards making maritime transport smarter is the
implementation of the EU Vessel Traffic Monitoring and Information System
(VTMIS) – the EU-wide interoperable and safe system that provides the digital
maritime picture for enhanced traffic and transport at sea. The main objective of
the VTMIS Directive108
is to: “establish in the [Union] Community a vessel traffic
monitoring and information system with a view to enhancing the safety and
efficiency of maritime traffic, improving the response of authorities to incidents,
accidents or potentially dangerous situations at sea, including search and rescue
operations, and contributing to a better prevention and detection of pollution by
ships.”
178. Better sharing of data between transport operators can be ensured by horizontal
initiatives or transport-specific ones, for example the Delegated Regulation on EU-
wide multi-modal travel information services109 and the Implementing Regulation
requiring freight rail undertakings to provide dynamic data to multimodal
terminals110.
179. In this regard, the European Strategy for Data111 aims at creating a single market
for data that will ensure Europe’s global competitiveness and data autonomy,
where data can flow within the EU and across sectors, for the benefit of all. In
particular, it highlights the need for cross-sectoral actions towards a European data
space through the development of sectoral data spaces in strategic areas such as
manufacturing, agriculture, health, and mobility. In the field of mobility, such data
spaces will facilitate access, pooling and sharing of data from existing and future
transport and mobility databases.
180. Based on the Commission's Intelligent Transport Systems (ITS) action plan of
2008, a dedicated legal framework was established with the entry into force of the
ITS Directive112
in 2010. This framework supports the harmonised deployment in
the EU of ITS solutions in road transport. It provides in particular for EU wide
107 Projects can be found in the TRIMIS database (https://trimis.ec.europa.eu/) 108 Directive 2002/59/EC of the European Parliament and of the Council of 27 June 2002 establishing a Community vessel traffic
monitoring and information system and repealing Council Directive 93/75/EEC, OJ L 208, 5.8.2002, p. 10–27. 109 Commission Delegated Regulation (EU) 2017/1926 of 31 May 2017 supplementing Directive 2010/40/EU of the European Parliament and of the Council with regard to the provision of EU-wide multimodal travel information services, OJ L 272,
21.10.2017, p. 1–13. 110 Commission Implementing Regulation (EU) 2017/2177 of 22 November 2017 on access to service facilities and rail-related
services, OJ L 307, 23.11.2017, p. 1–13. 111A European strategy for data, COM(2020) 66 final. 112 Directive 2010/40/EU of the European Parliament and of the Council of 7 July 2010 on the framework for the deployment of Intelligent Transport Systems in the field of road transport and for interfaces with other modes of transport, OJ L 207, 6.8.2010.

48
specifications in different domains, such as multimodal travel, real-time traffic and
safety-related information services113
. It supports both the deployment of services,
in particular through the financial support from the CEF programme114
, and the
organisation of the access to transport data through the creation of National (data)
Access Points115
.
181. Also in the remit of the ITS Directive, the interoperable EU-wide eCall system,
which automatically dials Europe's single emergency number 112 in the event of a
serious road crash and communicates the vehicle's location to the emergency
services, benefitted from the development of a specific legal framework116
(see
also the section on Safety).117
182. In 2016, the Commission presented a European strategy for the coordinated
deployment of cooperative intelligent transport systems (C-ITS)118
to avoid a
fragmented Single Market for cooperative transport. The strategy emphasises the
need for interoperability, established a list of mature Day 1 services and the need to
adopt a hybrid approach to communication technologies. It also addresses other
critical issues, including cyber-security and data protection. More recently, the
"Europe on the Move" Communication in 2018 highlighted the role of C-ITS in
enabling cooperative and in the future connected and automated mobility.
183. In line with the C-ITS Strategy, 14 Member States plus several associated
countries have started the large-scale deployment of interoperable C-ITS services
through the C-ROADS platform, a Member State driven harmonisation platform
supported through the Connecting Europe Facility. Since 2019, C-ITS based on
ITS-G5 has also been introduced at large scale in series-produced vehicles,
enabling safety critical information services increasing the road safety for every
equipped vehicle.
184. With the Communication “On the road to automated mobility: An EU strategy for
mobility of the future”119
, the Commission proposed in May 2018 a comprehensive
EU approach towards connected and automated mobility setting out a clear,
forward looking and ambitious European agenda. This agenda provides a common
vision and identifies supporting actions for developing and deploying key
technologies, services and infrastructure. In June 2019, the European Commission
has created a single EU wide platform grouping all relevant public and private
stakeholders to coordinate open road testing of connected and automated mobility
and making the link with pre-deployment activities. In addition, the European
Commission has proposed to establish a European Partnership under Horizon
Europe to give a clear long-term framework to the strategic planning of research
113European Commission, Intelligent Transport Systems Action Plan and Directive. https://ec.europa.eu/transport/themes/its/road/action_plan_en 114 Thanks to this support, a number of Member States declared in 2017 an up to 100% coverage of their TEN-T road network with
ITS such as real-time traffic information, incident detection, or traffic management and traffic control. 115European Commission, Intelligent Transport Systems Action Plan and Directive,
https://ec.europa.eu/transport/themes/its/road/action_plan/nap_en 116 https://ec.europa.eu/transport/themes/its/road/action_plan/ecall_en European Commission, Intelligent transport systems, The interoperable EU-wide eCall, https://ec.europa.eu/transport/themes/its/road/action_plan/ecall_en 117 In particular Decision No 585/2014/EU providing for the deployment of emergency call centres (eCall Public Safety Answering
Points) throughout the EU by October 2017 and Regulation (EU) 2015/758 providing for the mandatory fitting of 112-based eCall in-vehicle system on all new types of M1 and N1 vehicles from 31 March 2018 onward. 118 Communication from the Commission to the European Parliament, the Council, the European Economic and Social Committee
and the Committee of the Regions ‘A European strategy on Cooperative Intelligent Transport Systems, a milestone towards
cooperative, connected and automated mobility’, COM(2016) 766 final. 119 Communication from the Commission to the European Parliament, the Council, the European Economic and Social Committee
and the Committee of the Regions ‘On the road to automated mobility: An EU strategy for mobility of the future’, COM(2018) 283 final.

49
and pre-deployment programmes on connected, cooperative and automated
mobility at EU and national levels.
185. In support of the introduction and deployment of connected and automated
mobility), both the Gigabit Society Communication and the 5G Action Plan
(2016)120
established the goal of having uninterrupted 5G coverage in European
major terrestrial transport paths by 2025. Consequently, some Member States set
relevant cross-border corridors, in which new 5G based mobility services are being
tested in order to leverage their full potential.
186. In this regard, the recently published 5G Strategic Deployment Agenda presents a
common vision for investing in 5G-ecosystems in the field of Connected and
Automated Mobility and identifies the key drivers for accelerating infrastructure
roll-out. It will serve as a basis for the upcoming privately as well as publicly
supported deployment projects in this field with a particular focus on the upcoming
Connecting Europe Facility 2 Digital programme. It complements existing
deployment and provides an alternative for allowing connected vehicles to access
mission-critical information in real time, which will significantly contribute to road
safety, to a lower carbon footprint, and to a broad range of digital services for
drivers and passengers.
187. This agenda is complemented by the 5G Strategic Deployment Agenda for Rail,
looking at synergies between the dedicated rail radio network and Mobile Network
Operators (public networks), and to maximise the connectivity for Rail users. In
parallel, the upgrade of the Rail Radio System for safety-critical functions to 5G
(FRMCS) is developed in terms of standardisation and will be supported by
Connecting Europe Facility 2 Transport Programme, potentially by Connecting
Europe Facility 2 Digital and Synergic projects, as well as by the Cohesion Policy.
188. The Artificial Intelligence White Paper of 2020 deals with technological, ethical,
legal and socio-economic aspects to boost the EU's research and industrial capacity
and to put artificial intelligence (AI) at the service of European citizens and
economy. AI has become an area of strategic importance and a key driver of
economic development. It can bring solutions to many societal challenges,
especially those affecting the environment and sustainability. It also offers a large
potential for accessibility, provided that data and algorithms are inclusive of
persons with disabilities. Mobility applications, such as autonomous driving, are
identified as one key sector in which focus is needed.
189. The Commission adopted its strategy on Automated and connected mobility as part
of the third mobility package in May 2018 together with a legislative proposal on
the approval of automated/connected vehicles. Regulation (EU) 2144/2019121
, was
subsequently adopted by the legislator and will provide the EU industry with a
strong internal market to be able to compete globally.
190. A key element of making rail transport smart is the implementation of the
European Railway Traffic Management System (ERTMS) – the interoperable and
safe EU Signalling system that replaces 21 national systems. ERTMS is now a
global standard for train control and communication. Its development has provided
excellent opportunities for developing high value business and expertise within
120 Connectivity for a Competitive Digital Single Market - Towards a European Gigabit Society - COM(2016)587 & “5G for
Europe: An Action Plan" - COM(2016)588. 121 Regulation (EU) 2019/2144 of the European Parliament and of the Council of 27 November 2019 on type-approval requirements for motor vehicles and their trailers, OJ L 325, 16.12.2019, p. 1.

50
Europe and for export around the world. And it is being deployed in almost 50
countries around the world, with over 21,000 km deployed.
191. For inland navigation122
, significant steps have been taken to support the
deployment of harmonised River Information Services (RIS) in order to enable
seamless transport and traffic management on the European inland waterways. The
evolution of RIS needs to take into consideration new requirements stemming from
the digital transformation happening in the sector (e.g. digital ship operator
platforms, port information systems, synchromodality, corridor management,
Smart Shipping and Inland Waterways Autonomous Ships), including potential
adaptions and extensions of the legal framework on RIS. The legislative
framework on the River Information Services123
is currently being evaluated.
192. In order to facilitate the collection, exchange and maintenance of reference data
that forms the basis for many technical and operational services of RIS, the
Commission introduced the European Reference Data Management System
(ERDMS) and took over its operation. To improve the functioning of the ERDMS
and its compliance with evolving technical specifications and regulations, the
Commission is working on improvement of the system and its service levels to
ensure its fitness for the digital transformation in inland waterway transport.
193. The Directive (EU) 2017/2397 on the recognition of personal qualifications in
inland navigation requires Members States to keep electronic registers of such
qualifications, and the EC to set up an IT platform (the so called ECDB124
) for
exchanging information on crew certificates. This platform should be operational
by January 2022.
194. The Commission services are preparing a support study on a smart tachograph for
IWT. The general objective of the initiative is to contribute to a smooth and fairer
functioning of the IWT market, through the use of digital technologies, so that this
low carbon sector can play its role as a competitive actor in the logistic chain.
More specifically, the initiative aims at: 1) minimising the administrative burden;
2) improving enforcement; 3) increasing the uptake and acceptance of electronic
documents/solutions167
. In order to facilitate collection and exchange of data on
inland waterway vessels the Commission introduced the European Hull database
(EHDB). To improve the functioning of the EHDB and to ensure security of
vessels’ data the Commission is working on improvement of the system.
195. The 2017 Digital Inland Waterway Area (DINA) study125
identified three key
challenges that hamper the IWT sector’s competitiveness: inefficient navigation
and traffic management, inefficient integration of IWT in logistics processes and
high administrative burden for complying with legislation. In order to tackle
these challenges and recognising that ‘digitalisation helps reduce the administrative
burden and simplify procedure for authorities and businesses’, the 2018 DINA
122 Digitalisation of the inland waterways sector has been strongly supported by the Council, most recently in the Opatija
Declaration (Council conclusions on "EU Waterborne Transport Sector – Future outlook: Towards a carbon-neutral, zero accidents,
automated and competitive EU Waterborne Transport Sector" (Opatija declaration, 5 June 2020)) and by the European Parliament
(European Parliament resolution of 14 February 2019 on NAIADES II – An action programme to support inland waterway transport (2018/2882(RSP)). The former highlighted the importance of smooth integration among transport modes as well as increased
interoperability in the context of the logistics chain and encouraged data sharing in order to enable innovation and provision of new
services. 123 Directive 2005/44/EC of the European Parliament and of the Council of 7 September 2005 on harmonised river information
services (RIS) on inland waterways in the Community, OJ L 255, 30.9.2005, p. 152. 124 ECDB: European Crew Database 125The 2017 Digital Inland Waterway Area study: https://ec.europa.eu/transport/modes/inland/studies/inland_waterways_en

51
Staff Working Document126
initiated an examination of synergies with other
transport modes, which resulted the so called Digital Synergy Study127
.
196. The final report of the Digital Synergy Study was published128
in July 2020. The
study aimed at identifying informatics solutions and/or legislative frameworks with
digital aspect in other transport modes to assess their potential re-use in the IWT
sector. The study outcomes can be used by different actors in the IWT sector as a
useful source of information and potential guidance for current project activities or
the development of new initiatives ranging from pilot projects to cross border
systems. Digitalisation can act as accelerator to achieve the overall ambition to
improve IWT sector’s competitiveness and integration with other modes.
197. To support the digital transformation process in strategic transport sectors,
dedicated research and innovation partnerships have already been established for
rail (the Shift2Rail joint undertaking) and air traffic management (the SESAR Joint
Undertaking). These partnerships reflect requirements across the European
network, and also allow close alignment with regulatory bodies, aiding early
adoption of successful projects.
3.3 Single Market
198. In the last ten years, the Commission has taken several initiatives to further foster
the development of the Single European Transport Area. Progress towards this goal
has been made for all transport modes, for instance with the Fourth Railway
Package, the Blue Belt initiatives and efforts to build a Union information system
for maritime transport, the EU Aviation Strategy, urban mobility package and the
NAIADES Programme for inland waterways.
199. The successive railway packages have now created the conditions for a genuine
Single European Rail Area with open markets and technical interoperability, to
ensure that trains are able to operate with ease across national borders, and the
same rolling stock be used all across Europe but full implementation is still
required to reap the benefits..
200. Whilst the rail freight and international passenger services markets have been open
for competition for some time, rail domestic passenger markets are only being
opened by the Fourth Railway Package, which is currently being implemented:
European railway undertakings are allowed to offer rail services in any Member
State since 3 December 2019, subject to specific safeguards and transitional
provisions. Where services are economically not viable, the public service
contracts through which they are funded will have to be tendered from 2023
onwards at the latest. Experience from countries where such contracts are already
tendered shows that this leads to an improved offer and lower costs to the
authorities. Joint enforcement of sectorial and competition rules has been stepped
up, but those efforts are still much needed to ensure an effective market opening
and to remove the remaining market access barriers such as ticketing and access to
rolling stock will require attention, among several other issues. Rail market issues
are discussed in more detail in section 4 below.
126 Commission Staff Working Document on Digital Inland Navigation: https://ec.europa.eu/transport/modes/inland/news/2018-09-
20-towards-quality-inland-waterwaytransport_en 127 Identification of potential synergies/re-use of legislative framework with digital aspect and concrete informatics solutions in other
transport modes such as road, rail, maritime or air transport for potential re-use in the inland waterway transport 128Final report of the Digital Synergy Study: https://ec.europa.eu/transport/modes/inland/studies/inland_waterways_en

52
201. EU legislation as now implemented via the Technical Pillar of the Fourth Railway
Package provides a harmonised set of technical standards for the European
Railway network, and provides EU wide single vehicle authorisation and safety
certification for railway undertakings based on EU specifications and standards,
which the European Union Agency for Railways (ERA) issues for the Single
European Rail Area since June 2019129
. The Commission and ERA, together with
Member States, are identifying and eliminating national rules made redundant by
this new regime. Collectively, these measures will promote cross-border services,
enhance interoperability and permit the development of rolling stock and other rail
equipment standardised at EU level.
202. The EU has established 11 rail freight corridors, to enhance coordination between
infrastructure managers on issues linked to capacity allocation and management.
Regulation (EU) 913/2010130
on the rail freight corridors is currently under review.
Figure 12: Market share of all but the principal railway undertakings in 2016
Source: European Commission (2018): Rail Market Monitoring Survey 2018. IRG Rail Annual Reports. Greece, Ireland, Lithuania,
Luxembourg and Finland score 0 in both indicators. Passenger data: due to a methodological change in reporting, values are
mostly estimated by DG MOVE. Not applicable to Cyprus and Malta.
203. In the road transport sector, the market for international (intra-EU) freight and
passenger services has been entirely opened to competition, but domestic transport
remains largely protected. On the freight side, "cabotage", i.e. domestic transport
performed by foreign hauliers, is subject to the EU rules which were revised under
the first Mobility Package (adopted in July 2020), together with social rules for
road transport sector. One of the objectives of the revision was to improve the
working conditions of drivers, by clarifying the driving and rest time rules, by
establishing specific rules for posting of road transport workers and by improving
enforcement of those rules with the aid of smart tachograph and other digital
systems (e.g. IMI – Internal Market Information system). The other objective was
to eliminate distortions of competition on the internal road transport market by
clarifying the existing rules on the access to the haulage market and to the
profession of road transport operator and strengthening their enforcement.
Limitations to cabotage operations are part of the newly adopted rules.
129 Implementation was delayed for many Member States until June or October 2020 as permitted under the Directives and then on
account of COVID. 130 Regulation (EU) No 913/2010 of the European Parliament and of the Council of 22 September 2010 concerning a European rail network for competitive freight, OJ L 276, 20.10.2010, p. 22.
53
204. Since the early 1990s the aviation market has been gradually liberalised. The
creation of the aviation single market has produced significant socio-economic
benefits for passengers, businesses and regions. Air traffic has more than doubled
since 1990 and in 2018 more than a billion passengers travelled through some 500
European airports. More than 3,500 intra-EU routes provided access to both large
cities as well as peripheral regions. The fostering of competition in the market131
has contributed to making air travel affordable, to creating jobs and to stimulate
business.
205. While the Single Market for aviation has been a success, there remain challenges
and room for improvement in some areas of its functioning, in addition to the need
to make aviation more sustainable. In particular, the Single European Sky remains
incomplete. The current fragmentation of the airspace leads to inefficiencies,
additional fuel burn and extra costs for the whole aviation value chain.
206. In 2015, the Commission adopted the EU Aviation Strategy132
which pursued three
key priorities:
Tapping into growth markets, by improving services, market access and
investment opportunities with third countries, whilst guaranteeing a level
playing field;
Tackling limits to growth in the air and on the ground, by reducing capacity
constraints and improving efficiency and connectivity;
Maintaining high EU safety and security standards, by shifting to a risk and
performance based mind-set. Creating high quality jobs and maintaining a
strong social agenda.
207. The Single Market for aviation has delivered key achievements for European
citizens, regions and businesses. The over 1.1 billion passengers – an average
yearly growth of 6.9% between 2015 and 2018 – that travelled through European
airports in 2018 meant that the global share of EU traffic in terms of passengers
carried has remained stable at around 26%133
. Since 2015 close to 700 new routes
(city to city) have been opened within EU, representing an increase of 15%134
and
contributing to increasing connectivity. Over the same period, nearly 200
additional routes (+30%)135
have seen a third airline as an operator, contributing to
increase in competition and affordability within EU.
208. In the area of waterborne transport the Commission, in the policy framework of the
2011 White Paper, has taken initiatives to consolidate the internal market for sea
shipping services and better connect EU ports to create an EU maritime transport
space without barriers. In this context measures were adopted to improve maritime
surveillance capabilities for safe and efficient maritime transport and traffic, to
simplify procedures for regular shipping services and reporting formalities during
port calls, review restrictions of port services and improve transparency of ports’
financing.
131 In addition to the sectorial initiatives aiming at completing the Single market referred to in the present document, the Commission has adopted State Aid Guidelines for aviation in 2014 (Communication from the Commission — Guidelines on State
aid to airports and airlines, OJ C 99, 4.4.2014, p. 3–34). 132 Communication from the Commission to the European Parliament, the Council, the European Economic and Social Committee
and the Committee of the Regions ‘An Aviation Strategy for Europe’, COM/2015/0598 final. 133 Sources: Eurostat and ICAO 134 Source: OAG summer schedules (EU28 2015-2019) 135 Source: OAG summer schedules (EU28 2015-2019)

54
209. As regards international multimodal transport, the range of legal instruments
shippers and transport operators have to consider for each transport operation, is
very broad. This includes the rules applicable to vehicles (technical, safety and
environmental norms and standards), workers (e.g. professional qualifications,
working time), services (access to market) and goods (e.g. customs, rules
applicable to dangerous goods). Each operation is accompanied by a large amount
of information, which in vast majority of cases still involves paper documents at
one stage or another. Technical systems for the electronic exchange of transport
information vary between and within countries and transport modes. Some of these
problems will be tackled by the implementation of the eFTI Regulation136
which
establishes the conditions under which certain information relevant under the
acquis for intra-EU movements of freight is accepted by the authorities in
electronic form and which provides for common rules for processing the data for
intra-EU cargo movements.
210. Passengers in the EU are protected by a full set of passenger rights, whether they
travel by air, rail, ship, bus and coach. This framework provides a minimum level
of protection for people using transport services, including the most vulnerable, i.e.
persons with disabilities and reduced mobility. It recognises that passengers, as the
weaker party to the transport service contract, need to be treated fairly when the
service has not been provided as expected.
211. As a consequence, the framework addresses the three steps of the journey (prior,
during and after the journey) to facilitate mobility and social inclusion. It
contributes to reducing the negative impact of travel disruptions on users of
collective transport modes and to improving service quality for passengers. This
also contributes to the creation of a level playing field for transport operators
within and across modes in the EU and a European standard of passenger
protection, which is essential in the context of the single market. Today passenger
rights apply to a growing market of over 400 million citizens performing several
billions of journeys every year for private or business purpose. In this context,
passenger protection has become a cornerstone of EU transport policy137
, building
on international conventions and the general consumer protection framework of the
Union.
212. Attention is being paid to accessibility of transport service information for persons
with disabilities in the European Accessibility Act,138
complementing existing
passenger rights legislation which covers also the assistance to be provided to
passengers with disabilities and reduced mobility when travelling by air, rail,
waterborne or bus and coach transport. Accessibility is a key component of social
sustainability and inclusiveness, contributing to usability and durability.
213. In its Communication ‘A stronger and renewed strategic partnership with the EU's
outermost regions’139
, the Commission committed itself to reducing the outermost
regions' "accessibility gap" caused by remoteness from continental Europe,
insularity (in most cases) and difficult topography and to testing low-carbon
transport and energy efficient solutions.
136 Regulation (EU) 2020/1056 of the European Parliament and of the Council of 15 July 2020 on electronic freight transport information, OJ L 249, 31.7.2020, p. 33. 137 2011 White Paper 138 Directive (EU) 2019/882 of the European Parliament and of the Council of 17 April 2019 on the accessibility requirements for
products and services (Text with EEA relevance), OJ L 151, 7.6.2019, p. 70–115. 139 Communication from the Commission to the European Parliament, the Council, the European Economic and Social Committee,
the Committee of the Regions and the European Investment Bank ‘A stronger and renewed strategic partnership with the EU's outermost regions’, COM(2017) 623 final.

55
Infrastructure developments
214. To develop the Trans-European Transport Network (TEN-T Network), the EU
adopted a Regulation in 2013140
providing Union guidelines for transport
investment. The Regulation establishes a legally binding obligation to develop the
so-called "core" and "comprehensive" TEN-T Networks. The TEN-T covers all
transport modes and connections between them (ports, airports and other transport
terminals), they set standards and requirements to be met along the whole network,
and they include smart and innovative components to facilitate efficient
infrastructure use and high-quality services.
215. The core network is strategically the most important part of the TEN-T and must
be completed by 2030. The core network has been designed to connect the main
urban areas of the EU with the different transport modes and to ensure multimodal
connections to the most important ports. It includes about 67,000 km of railway
lines, 50,000 km of roads and 15,700 km of inland waterways. Motorways of the
Sea are the maritime dimension of the network. At this stage, about 8,500 km of
railway lines, 1,600 km of roads and some major inland waterway projects remain
to be newly constructed or substantially upgraded until 2030. The TEN-T network
serves also as basis for the deployment of alternative fuel infrastructure and digital
infrastructure.
216. Along the existing part of the TEN-T, efforts are still needed to fully comply with
the standards set out in the Regulation. However, significant progress has already
been made. Along the nine core network corridors, for example: 89% of the rail
infrastructure is electrified. 85 % of the inland waterways infrastructure meets the
requirements of a minimum draught of 2.5 m and of a minimum height of 5.25 m
under bridges. 89% of the TEN-T ports on the core network corridors are
connected to the railway network.
217. Projects of common interest, identified in accordance with the TEN-T Regulation,
can be supported under the Connecting Europe Facility (CEF). The CEF
Regulation141
, adopted in 2013, allocated a seven-year budget (2014-2020) of EUR
23.3 billion for investment projects in the transport sector.
140 Regulation (EU) No 1315/2013 of the European Parliament and of the Council of 11 December 2013 on Union guidelines for the
development of the trans-European transport network and repealing Decision No 661/2010/EU, OJ L 348, 20.12.2013, p. 1. 141 Regulation (EU) No 1316/2013 of the European Parliament and of the Council of 11 December 2013 establishing the Connecting Europe Facility, OJ L 348, 20.12.2013.

56
218. Cohesion policy provides substantial support to develop a multi-modal, door-to-
door European transport system which addresses the needs of commercial actors
and citizens for long-distance, cross-border transport, as well as for regional and
local mobility. In the period 2014-2020 around EUR 70 billion have been
programmed to support transport investments from Cohesion Fund and ERDF.
Around EUR 33.4 billion for TEN-T have been programmed and around EUR 36.6
billion for other national, regional and local infrastructure. This support is
delivered through over 200 national, regional, and Interreg programmes, tailored to
the particular situation in the Member States and regions (in line with relevant
national and regional transport plans). During the period 2014-2019, CEF
Transport has awarded EUR 23.3 billion in grants to co-finance projects of
common interest, out of which EUR 11.3 billion was transferred from the Cohesion
Fund. These funds are dedicated to completing the TEN-T Network, building
cross-border links to better integrate national networks and to foster digitalisation
and improved performance of the existing network.
3.4 Safety & security
Safety
219. For road safety, the Commission adopted in 2010 Road Safety Policy
Orientations142
that set a target of halving the number of road fatalities by 50% by
2020 and that included a mix of initiatives, focusing on improving vehicle safety,
the safety of infrastructure and road users' behaviour. Faced with stagnation in the
reduction of EU-wide fatality figures in the second half of the last decade, the
Commission received a strong mandate for a new road safety programme from the
EU Transport Ministers in the “Valletta Declaration” of 2017143
. The Commission
in 2018 adopted the Road Safety Policy Framework 2021-2030 as part of the Third
Mobility Package, along with a Strategic Action Plan on Road Safety, which set a
new target for 2021-30 to reduce deaths and – for the first time – serious injuries
by 50%. It also set out how the Safe System could be implemented at EU level –
i.e., focusing holistically on the different elements, such as vehicle safety,
infrastructure, road user behaviour such as speed, governance aspects and post-
crash care, with Key Performance Indicators to benchmark progress.144
220. In terms of vehicle safety, safety technologies and type-approval requirements
have been significantly upgraded for all vehicle categories in recent years. Lane
departure warning and advanced emergency braking for lorries were required as
from 2015 in the General Safety Regulation145
and anti-lock braking systems are
mandatory for motorcycles in the EU since 2016146
, eCall for emergencies in cars
and vans is required for new models since 2018147
. In 2019, the General Safety
142 Communication from the Commission to the European Parliament, the Council, the European Economic and Social Committee
and the Committee of the Regions ‘Towards a European road safety area: policy orientations on road safety 2011-2020’, COM(2010) 389 final. 143Council conclusions on road safety – endorsing the Valletta Declaration of March 2017
(http://data.consilium.europa.eu/doc/document/ST-9994-2017-INIT/en/pdf). 144 Communication from the Commission to the European Parliament, the Council, the European Economic and Social Committee
and the Committee of the Regions ‘Europe on the move - Sustainable Mobility for Europe: safe, connected, and clean’, COM(2018)
293 final. 145 Regulation (EC) No 661/2009 of the European Parliament and of the Council of 13 July 2009 concerning type-approval
requirements for the general safety of motor vehicles, their trailers and systems, components and separate technical units intended
therefor, OJ L 200, 31.7.2009, p. 1. 146 Regulation (EU) No 168/2013 of the European Parliament and of the Council of 15 January 2013 on the approval and market
surveillance of two- or three-wheel vehicles and quadricycles, OJ L 060 2.3.2013, p. 52 147 Regulation (EU) 2015/758 of the European Parliament and of the Council of 29 April 2015 concerning type-approval requirements for the deployment of the eCall in-vehicle system based on the 112 service, OJ L 123 19.5.2015, p. 77

57
Regulation was reviewed again148
, requiring cars, lorries and buses to be fitted with
a range of important new safety technologies such as Intelligent Speed Assistance,
Lane Keeping Assistance and Automated Emergency Braking. A number of the
most significant new safety systems will be mandatory from 2022 in new models
and by 2024 for all new cars.
221. The Directive on Road Infrastructure Safety Management was also upgraded in
2019149
. The Directive, which prescribes safety assessments at all stages of the
lifecycle of a road (design, construction, operation), now applies not only to TEN-
T roads, but also to all motorways as well as primary roads. The upgrade also
introduced a network-wide pro-active risk assessment and the obligation to take the
needs of vulnerable road users into account systematically in all safety
assessments.
222. In addition, the legal framework for the training of professional drivers was
upgraded in 2018150
, a package of measures on roadworthiness testing was adopted
in 2014151
and rules on the cross-border pursuit of road traffic offences were
introduced in 2011 (re-published in 2015)152
.
223. Aviation safety has been a great success story, not least because fatal accidents for
commercial air transport involving EU operators have fallen to zero since 2016153
.
Work in this area is influenced by the inherently international nature of the aviation
industry and most standards adopted at global level are implemented into EU
aviation safety legal framework. International cooperation is thus essential to
ensure aviation safety and development of globally agreed standards. The EU is
actively engaged in strengthening aviation safety at the international level, notably
through its work with the International Civil Aviation Organization (ICAO).
224. The European aviation safety system is based on a comprehensive set of common
safety rules, which are overseen by the European Commission, the European
Union Aviation Safety Agency (EASA) and the National Aviation Authorities. In
the context of the 2015 Aviation Strategy, a new Aviation Safety Regulation154
replacing Regulation 216/2008, has been elaborated and adopted. The aim is to
prepare the EU aviation safety system for the challenges of the future, including a
new era of innovation and digital technologies. It consists of a shift towards a risk
and performance-based approach, measures to increase efficiency of the system
and promotion of cooperative safety management between the EU and its Member
States. Furthermore, the 2015 Aviation Strategy recommended the adoption of a
basic legal framework for the safe development of drone operations in the EU, as
part of the new Aviation Safety Regulation. The new Aviation Safety Regulation
extended the EU safety rules to all drones and the recently adopted Implementing
148 Regulation (EU) 2019/2144 of the European Parliament and of the Council of 27 November 2019 on type-approval requirements for motor vehicles and their trailers, OJ L 325, 16.12.2019, p. 1. 149 Directive (EU) 2019/1936 of the European Parliament and of the Council of 23 October 2019 amending Directive 2008/96/EC on
road infrastructure safety management, OJ L 305, 26.11.2019, p. 1. 150 Directive (EU) 2018/645 of the European Parliament and of the Council of 18 April 2018 amending Directive 2003/59/EC on the
initial qualification and periodic training of drivers of certain road vehicles for the carriage of goods or passengers and Directive
2006/126/EC on driving licences, OJ L 112, 2.5.2018, p. 29. 151 Directive 2014/45/EU of the European Parliament and of the Council of 3 April 2014 on periodic roadworthiness tests for motor
vehicles and their trailers, OJ L 127, 29.4.2014, p. 51; Directive 2014/46/EU of the European Parliament and of the Council of
3 April 2014 amending Council Directive 1999/37/EC on the registration documents for vehicles, OJ L 127, 29.4.2014, p. 129; Directive 2014/47/EU of the European Parliament and of the Council of 3 April 2014 on the technical roadside inspection of the
roadworthiness of commercial vehicles circulating in the Union, OJ L 127, 29.4.2014, p. 134. 152 Directive (EU) 2015/413 of the European Parliament and of the Council of 11 March 2015 facilitating cross-border exchange of
information on road-safety-related traffic offences, OJ L 68, 13.3.2015, p. 9. 153 Source EASA https://www.easa.europa.eu/sites/default/files/dfu/easa_asr_2020.pdf 154 Regulation (EU) 2018/1139 of the European Parliament and of the Council of 4 July 2018 on common rules in the field of civil aviation and establishing a European Union Aviation Safety Agency, OJ L 212, 22.8.2018, p. 1.

58
Rules155
covering drone technical requirements and drone operations should help
opening the EU drone services and foster the development of the manufacturing
market.
225. As part of the 2015 Aviation Strategy, the Commission also presented a revised
European Aviation Safety Programme, laying out, through an integrated set of
regulations, processes and activities at Union level how aviation safety is managed
in the EU, and thus providing Member States a reference for the elaboration of
their own State Safety Programmes in the context of the ICAO.
226. The set of common safety rules is complemented with legislation on accident
investigation and on the reporting, analysis and follow-up of occurrences in civil
aviation which have been revised respectively in 2010156
and 2014157
.
227. Finally, the EU has concluded over the past years bilateral aviation safety
agreements with the United States of America, Canada, Brazil, China and Japan
and the Commission is undertaking technical cooperation projects with third
countries in the area of safety.
228. The legislative framework for maritime safety was thoroughly assessed by way of
the 2018 Maritime Transport Fitness Check. The maritime safety situation today is
one characterised by a limited amount of accidents and very few fatalities. Whilst it
remains hard to pinpoint ultimate safety outcomes to individual legislative acts, it
was concluded that overall EU maritime legislation has contributed to decisively
improve the safety situation at sea. The added value of EU intervention is shown
both by the swift adoption of international safety rules, as well as the harmonised
enforcement and implementation of such rules across the EU Member States and
for ships under an EU Member State flag.
229. The Directive (EU) 2016/1629 on technical standards for inland navigation
vessels was adopted by the European Parliament and the Council in October 2016.
This Directive strengthens the Internal Market ensuring technical harmonisation
throughout the Union's inland waterways while providing flexibility for taking into
account the particular features of each inland waterway section in the EU and to
ensure safety of inland navigation vessels.
230. Rail safety in the EU is assured via stringent safety requirements for the technical
specifications of rail vehicles and infrastructure as well as safety management tools
for rail operators and infrastructure providers set out in the Railway Safety and
Railway Interoperability Directives (2016/798 and 2016/797). These rules also
require the various elements of the Union rail system to be supervised by national
safety authorities, while authorisations to place rail vehicles on the market and to
operate as a railway operator are, in most of the cases, given by the European
Union Agency for Railways (ERA). The level of safety on EU railways is by far
the highest for surface mobility (0.1 fatality per billion passenger km), though it
can vary between Member States. The Commission and ERA work with Member
States to maintain these high levels of safety and share best practice to increase
safety levels where needed. Particular focus is put on the promotion of safety
155 Commission Implementing Regulation (EU) 2019/947 on the rules and procedures for the operation of unmanned aircraft, OJ L
152, 11.6.2019, p. 45; and Commission Delegated Regulation (EU) 945/2019 on unmanned aircraft systems and on third-country operators of unmanned aircraft systems, OJ L 152, 11.6.2019, p. 1. 156 Regulation (EU) No 996/2010 of the European Parliament and of the Council of 20 October 2010 on the investigation and
prevention of accidents and incidents in civil aviation and repealing Directive 94/56/EC, OJ L 295, 12.11.2010, p. 35–50. 157 Regulation (EU) No 376/2014 of the European Parliament and of the Council of 3 April 2014 on the reporting, analysis and
follow-up of occurrences in civil aviation, amending Regulation (EU) No 996/2010 of the European Parliament and of the Council
and repealing Directive 2003/42/EC of the European Parliament and of the Council and Commission Regulations (EC) No 1321/2007 and (EC) No 1330/2007, OJ L 122, 24.4.2014, p. 18–43.

59
culture and will come through the roll-out of the new versions of the European
railway signalling and train protection system. ERTMS ensures trains cannot over
speed or pass red signals.
Security
231. There is currently no EU legislation addressing land transport security (apart for
dangerous goods where there is some overlap of safety and security requirements).
Though theft of cargo from road and rail is estimated to cost some EUR 8 billion
per year, EU Transport Ministers, to date, have not called upon the Commission to
bring forward any legislation for EU security requirements for either road or rail
transport. The Commission has pursued efforts to implement an Action Plan to
improve rail passenger security, notably via the establishment of the EU Rail
Security Platform. The outcome of its work could potentially form the basis of a
regulatory initiative.
232. On road transport the Commission published a study in 2019 which concludes that
400 000 safe and secure parking places for lorries are lacking in the EU. Cargo
crimes are more frequent than ever, and about 75% of these incidents are
happening when lorries are parked in unsecure parking places. As a response to
this critical situation, both for drivers and cargo owners, the Commission is
promoting safe and secure parking areas and information provision about them,
making available CEF-funding and has set up an expert group to implement
common standards and certification procedures for safe and secure parking places.
233. Since 2002, the Commission has established common rules in the field of civil
aviation security aimed at protecting persons and goods from unlawful
interference with civil aircraft.
234. Regulation (EC) 300/2008158
lays down common rules and basic standards on
aviation security and procedures to monitor the implementation of the common
rules and standards. Since then, it has been supplemented through implementing
legislation as regards, among other, liquids, aerosols and gels, the use of security
scanners, the adoption of alternative security measures, controls of air cargo
internally as well as internationally and the specifications of national quality
control programmes. The Commission has powers to carry-out inspections to
verify compliance with the EU legislation.
235. In the maritime security domain, the Union benefits from a Regulation (EC)
725/2004159
covering security measures on board ships and the immediate interface
between ships and ports. Directive 2005/65/EC160
addressing elements of port
security not covered by the Regulation complemented it in 2005. The Commission
was also given powers to conduct inspections.
236. The Council in 2014 adopted a Maritime Security Strategy for the global maritime
domain to coordinate national policies and give a European response to maritime
threats and risks, cooperation within the EU and international bodies, such as the
International Maritime Organisation is progressing only slowly.
237. Various initiatives are on-going to tackle cyber security and the EU established a
dedicated agency – the EU Agency for Network and Information Security – for this
158 Regulation (EC) No 300/2008 of the European Parliament and of the Council of 11 March 2008 on common rules in the field of
civil aviation security and repealing Regulation (EC) No 2320/2002, OJ L 97, 9.4.2008, p. 72. 159 Regulation (EC) No 725/2004 of the European Parliament and of the Council of 31 March 2004 on enhancing ship and port
facility security, OJ L 129, 29.4.2004, p. 6. 160 Directive 2005/65/EC of the European Parliament and of the Council of 26 October 2005 on enhancing port security, OJ L 310, 25.11.2005, p. 28.

60
purpose. The Directive on Security of Network and Information Systems (NIS
Directive) constitutes a common baseline to enhance cyber-resilience, also in
transport.
238. The legislator also adopted Regulation (EU) 2144/2019161
which provides for the
Commission to adopt type approval rules on cars regarding their protection about
cyberattacks. These implementing rules are under development and are intended to
be applicable from July 2022.
3.5 Social issues
239. In 2018, the transport and storage services sector (including postal and courier
activities) in the EU-27 employed around 10.3 million persons162
, some 5.3 % of
the total workforce163
. Around 52% of them worked in land transport (road, rail
and pipelines), 3 % in water transport (sea and inland waterways), 4 % in air
transport and 27 % in warehousing and supporting and transport activities (such as
cargo handling, storage and warehousing) and the remaining 14 % in postal and
courier activities.
240. A third of transport workers are above 50 years old164
. Only 22% of transport
workers are women (most of which work in administrative positions). Less than
5% work as pilots, seafarers and truck or train drivers. While the labour markets
per transport mode may be separate, they may nevertheless have similar
characteristics165
: male-dominated, ageing, in need of highly mobile skilled
workers, labour shortages, fatigue and stress, work-life balance, skills mismatch,
global competition, law application and enforcement.
241. A well-functioning Single Market needs to be based on fair working conditions
ensuring a level playing field. Every EU worker has certain minimum rights
relating to health and safety at work, equal opportunities for women and men,
protection against discrimination, labour law. The EU Member States must make
sure that their national laws protect these rights, in particular those laid down by
EU law.
242. Many transport companies operate across borders. As outlined in the recent
Commission Communication on ‘A strong social Europe for just transitions166
, EU
rules need to be fit for purpose to guarantee that this happens in a fair and
transparent way and ensure fair competition among businesses, protect workers’
rights, and avoid double contributions and social dumping. To this end in the EU
adopted the set of social rules in road transport, including sector-specific rules on
posting of highly mobile road transport workers. The newly created European
Labour Authority (ELA) will be a key tool to facilitate the application and
enforcement of EU rules in this area, improving the functioning of the Single
Market. It will provide to individuals and employers information on working or
operating in another EU country, and support cooperation between national
161 Regulation (EU) 2019/2144 of the European Parliament and of the Council of 27 November 2019 on type-approval requirements
for motor vehicles and their trailers, OJ L 325, 16.12.2019, p. 1. 162 Figures on number of persons employed in transport, total workforce and shares per mode based on Eurostat Labour Force
Survey (age 15-64 years). 163 4.5 % of total employment if postal and courier activities are not included. 164 According to the European Transport Workers’ Federation, the average age of lorry drivers is around 45, while the average age
of bus and coach drivers is 55 years plus, and an estimated 98% of the drivers are male. 165 European Commission (2017), Study on a Pilot project: Making the EU transport sector attractive to future generations. 166 COM (2020) 14 final.

61
authorities, including on strengthening inspections, tackling undeclared work and
fighting fraud.
243. The transport sector often suffer from a negative image in terms of working
conditions, which may discourage in particular young people and women to look
for transport jobs. In a sector that has been largely liberalised and where the
mobility of workers is high, social protection and labour law rules remain primarily
a responsibility of the Member States. This can lead to a different implementation
and different levels of enforcement across the Member States. This brings
challenges in particular a lack of clarity on applicable social rules for some
workers and a low level of enforcement and the risk of unfair employment
practices. Social dialogue and the involvement of workers is one of the principles
of the European Pillar of Social Rights167
. At European level, employers’ and
workers’ organisations (the social partners) regularly meet within sectoral social
dialogue committees168
established in the various segments of the transport sector:
civil aviation, inland waterways, maritime transport, ports, railways, road transport,
including urban public transport. The Commission supports these committees,
which are intended as representative bodies for consultation, joint initiatives and
negotiation and were established with due regard for the autonomy of the social
partners. The Commission has regular exchanges with the European social partners
in the transport sector.
244. There is a risk of skills mismatch for certain transport workers and the need to keep
pace with changing skill requirements. Changes in skills requirements are most
visible in sectors that are strongly influenced by the green transition, notably in
transport. The “European Skills Agenda for sustainable competitiveness, social
fairness and resilience” is the EU’s response to these challenges, in transport and in
other sectors. A flagship action of the Skills Agenda is the “Pact for Skills”, which
will bring together stakeholders, private and public, and will, among others, set up
large-scale partnerships, including at regional level, in strategic industrial
ecosystems and priority areas identified in the European Green Deal. These
partnerships can build on the “Blueprint for sectoral cooperation on skills”169
for
gathering sectoral skills intelligence, mapping key occupation needs, defining
occupational profiles and developing training programmes. Three Blueprint
Alliances are relevant to sustainable transport: one for automotive170
, one for
maritime shipping171
and one for rail supply and transport industries. To be able to
comply with EU accessibility legislation and provide better service for persons
with disabilities and those with reduced mobility, training to enhance skills on
these areas is needed.
245. Another flagship action of the Skills Agenda is the Commission Proposal for a
Council Recommendation on VET for sustainable competitiveness, social fairness
and resilience172
. It proposes that by 2025, 8% of learners in vocational education
and training benefit from a learning mobility abroad. Learning and working
placements abroad teach young people not only job-specific technical but also soft
167https://ec.europa.eu/commission/priorities/deeper-and-fairer-economic-and-monetary-union/european-pillar-social-
rights/european-pillar-social-rights-20-principles_en 168 In line with Commission Decision of 20 May 1998 on the establishment of Sectoral Dialogue Committees promoting the
Dialogue between the social partners at European level (notified under document number C(1998) 2334) (98/500/EC), https://eur-
lex.europa.eu/legal-content/EN/TXT/?uri=CELEX:01998D0500-20130701. 169 https://ec.europa.eu/social/main.jsp?catId=1415&langId=en 170 https://www.project-drives.eu/en/home 171 https://www.skillsea.eu/ 172 COM (2020) 275 final

62
skills, such as adaptability, resilience, intercultural or language skills - skills that
are very sought after, and not only in the transport sector.
246. Digitalisation and automation are already affecting employment in certain sectors,
including transport. The Commission is looking how to address associated social
impacts, through cooperation with interested parties, including social partners, and
by supporting research in the field. The 2017 Digital Transport Days addressed the
social impact of digitalisation and automation and concluded that the social
dimension should be at the heart of the transition (technical standards are not
enough). A Commission conference in 2018 confirmed that stakeholders expect
public authorities to be active in accompanying the transition. This was also
addressed during the 2019 Digital Transport Days in a dedicated session on
‘Managing the transition towards digitalisation and automation – social aspects’.
Women in transport
247. With the setting-up of the ‘Women in Transport – EU Platform for change’173
in
2017, first steps were taken to address the sector’s gender gap and lack of
attractiveness. Meanwhile, all important EU associations covering all transport
modes, including social partners, have joined this action-oriented platform that
aims at increasing the number of women employed in the sector by putting forward
and exchanging good practices. Until now companies have brought 18 different
actions to the platform. Another tool is the Declaration on equal opportunities for
women and men in the transport sector. In 2019 the Commission published174
a list
of measures that companies can take to improve their gender balance (based on
real case studies) and powerful messages on what a gender policy can bring about
for companies. In rail for example, social partners are negotiating an agreement to
promote the employment of women in the railway sector.
Persons with disabilities175
and reduced mobility
248. The EU and all Member States are parties to the UN Convention on the Rights of
Persons with Disabilities. According to the Convention, States parties shall take
appropriate measures to ensure access to persons with disabilities, on an equal
basis with others to transportation. These measures include the identification and
elimination of obstacles and barriers to accessibility inter alia in buildings, road
and transportation. Appropriate measures to be adopted also concern services open
or provided to the public. Moreover States parties are to take appropriate measures
inter alia to develop, promulgate and monitor the implementation of minimum
standards and guidelines for the accessibility, to ensure that private entities offering
facilities and services which are open or provided to the public take into account all
aspects of accessibility for persons with disabilities, to provide training for
stakeholders and forms of live assistance and intermediaries and to promote other
appropriate forms of assistance and support to persons with disabilities to ensure
their access to information. State Parties shall take effective measures to ensure
personal mobility with the greatest possible independence for persons with
disabilities, including by facilitating the personal mobility of persons with
disabilities in the manner and at the time of their choice, and at affordable cost.
249. Attention is being paid to accessibility of transport for persons with disabilities in
the European Accessibility Act176
, complementing existing passenger rights
173 https://ec.europa.eu/transport/themes/social/women-transport-eu-platform-change_en 174 https://op.europa.eu/en/publication-detail/-/publication/6f833428-54f9-11e9-a8ed-01aa75ed71a1 175 The European Disability Forum estimates the number of persons with disabilities to be over 100 million in Europe. 176 Directive 2019/ 882

63
legislation. Accessibility is a key component of social sustainability contributing to
usability and durability. The Technical Specifications for the accessibility of the
railway system for persons with reduced mobility (PRM TSI) have been amended
in 2019, to ensure inventories of assets, including a website providing practical
information about the accessibility of railway stations.
Road transport
250. The revision of the road transport social legislation adopted under the first Mobility
Package provides urgent solutions to the current social and employment challenges
in the sector. These include: revised rules on driving and rest times – to improve
working conditions by giving more flexibility for drivers to organise their activities
and by obliging employers to ensure adequate accommodation for drivers and
enable them to return home at regular intervals; revised enforcement requirements,
in particular for the rules on the tachograph which controls the driving and rest
time of drivers - to improve the efficiency and consistency of enforcement
practices; and the sector specific rules on the posting of drivers - to adapt the
application of posting rules to the highly mobile nature of the road transport
workforce and ensure more uniform and lighter administrative and control
measures.
Rail transport
251. The Commission is engaged in dialogue with stakeholders to promote young
people and especially young women, who can help replace an ageing workforce.
With a budget of EUR 4 million, “Rail supply and transport industries” (including
both manufacturers of trains and train equipment and provision of services) is one
of the sectors included in the fourth wave of the Blueprint initiative, starting in
2021177
.
252. Language requirements for train drivers were revised in 2016, to allow the
exemption from the B1 level language requirement for train drivers if they only
reach the border station of a neighbouring Member State, while ensuring that
safety is not be negatively impacted. The sector is currently exploring options such
as rail-specific communication terminology, or a lower general language level
combined with alternative, electronic means to support effective communication
without the stringent language requirements. The European legal framework for
train driver licensing and training has been evaluated in 2019, modernisation to
meet digital challenges and for creating a level playing field for new rail service
operators seems necessary.
253. The Commission has been supporting the sectoral social dialogue committee on
railways, which promotes the dialogue between the social partners in the sectors at
European level. The committee has put the social impact of
automation/digitalisation on its work programme, and carries out activities to
anticipate and manage change. The Shift2Rail Joint Undertaking has contracted a
study to identify what skills will be most important in the future for different
categories of railway staff.
Aviation
177 In the rail sector, digitalisation and digitisation have a strong impact on production, processes, operations and skill needs. The
key digital innovations include driverless operations, automation of planning, predictive maintenance and automation of traffic
control. Under the coordination of the University of Genoa, the STAFFER (Skill Training Alliance For the Future European Rail
System) Alliance, including key European suppliers, operators, infrastructure managers as well as universities, will address shortage
in particular occupational field such as system engineers and architects, software developers, IT security specialists and big data analysts.

64
254. Maintaining and promoting high social standards was highlighted as a priority in
the 2015 Aviation Strategy for Europe ensuring worker protection and a level
playing field for airlines. The work done so far in this context lays the ground for
any further action necessary to: improve legal certainty for mobile aircrew and
airlines; support better enforcement of applicable social and employment law
acquis for aircrew; develop and enhance competency-based training; pursue efforts
to address social issues in aviation at the international level, including ICAO and
the ILO, as well as including relevant provisions in comprehensive air transport
agreements with partners worldwide; to establish, in coordination with
stakeholders, a human dimension roadmap to accompany the digital transformation
in air traffic management.
255. Since the 2000s the EU has also sought to include ambitious social and labour
clauses in its aviation agreements with third countries. In some cases, the EU has
secured the application of the EU social acquis of relevance to aviation, in
particular among those neighbourhood countries with which aviation agreements
are in force.
256. To support better enforcement of applicable social and employment law acquis for
aircrew, a practice guide was published in 2016 on applicable labour law and
competent courts, which is also relevant for the transport sector.
257. In the context of the evaluation of the Air Services Regulation, the Commission
services assessed possible unintended social impacts of the legislation, notably on
working conditions of aircrews.
258. In March 2019, the Commission published a Report focusing on aircrew which
took stock of progress on the social agenda in aviation, also drawing on the
findings of a study on aircrew’s employment and working conditions in today's EU
aviation market. It outlined concrete actions for a stronger social agenda to be
implemented in the short term. It concluded that better enforcement is key to
improve the situation for aircrew. The Commission renewed its commitment to
support Member States in this. An expert group with Member State experts both
from the aviation and employment side of the administration was set up. The
conclusions of the expert group will be taken into account when assessing possible
options for future action at EU level. In February 2020, the European Platform
Tackling Undeclared Work which promotes collaboration between competent
authorities organised a seminar to tackle undeclared work in the air transport
sector, with a special focus on bogus self-employment of aircrews178
.
259. As regards ATM, in June 2017, the Commission adopted a Communication on
Aviation: Open and Connected Europe accompanied by a Staff Working Document
on practises favouring service continuity. An expert group with representatives of
the ATM industry and social partners was set up to assess the impact of the Single
European Sky in 2019 on staff working practices. A study was launched on the
working conditions in the air traffic management sector, the issues air traffic
controllers are facing and how things will evolve in the next 15 years or more.
260. The European associations collectively representing the entire European aviation
recognised in their report the importance of the social dimension in the EU Pact for
Sustainable Aviation. They called for ensuring that social and employment rights
enshrined in European and national legislation are applied effectively for all
workers and highlighted the particular importance of effective oversight and
178 https://ec.europa.eu/social/BlobServlet?docId=22457&langId=en

65
enforcement of the social acquis. Moreover they called on the industry to ensure
secure and fair working conditions, and stressed the need to ensure that the social
dialogue structures are used effectively.179
Waterborne transport
261. Working and living conditions for seafarers are regulated mainly at international
level through the Maritime Labour Convention of ILO (which entered into force in
2013), and are further implemented at EU level through various Directives180
.
Directive 2008/106181
on the minimum level of training of seafarers, as amended,
incorporates into EU law the International Maritime Organisation’s Convention on
Standards of Training, Certification and Watchkeeping (STCW) for Seafarers. The
Directive applies to seafarers serving on board seagoing ships flying the flag of a
Member State. Following a REFIT exercise, it was amended in 2019 in order to
legally clarify the scope of seafarers’ certificates mutually recognized by EU
Member States, and to raise the efficiency of the EU centralized mechanism to
recognize third countries at EU level. Furthermore, Council Directive 1999/63/EC
concerning the Agreement on the organisation of working time of seafarers sets out
minimum standards for the working conditions of seafarers. In inland waterway
transport, Directive 2014/112/EU was adopted to lay down more specific
requirements relating to the organisation of the working time taking into account
the specificities of this transport mode, in particular that certain categories of
workers have not only their place of work but also their accommodation or living
quarters on board the vessel182
.
262. There are also a number of non-legislative initiatives and projects183
to enhance the
attractiveness of the seafarer profession and improve working and living
conditions.
263. Directive (EU) 2017/2397, on the recognition of professional qualifications in
inland navigation and repealing Council Directives 91/672/EEC and 96/50/EC, was
adopted by the European Parliament and the Council. With this Directive, crew
members can find work more easily in a cross-border environment as the EU
certificates of qualification will be valid on all EU inland waterways. At the same
time, the new rules will be built on a modern competence based system that will
provide new career prospects and contribute to safety.
264. Within the sectoral social dialogue committee for inland waterways transport,
social partners exchange views on issues relevant to the sector, such as the
application of horizontal social legislation (e.g. working time and social security)
in the IWT sector, as well as developments stemming from EU inland waterways
179 European Aviation Round Table Report on the Recovery of European Aviation, November 2020. 180 Directive 2013/54/EU of the European Parliament and of the Council of 20 November 2013 concerning certain flag State
responsibilities for compliance with and enforcement of the Maritime Labour Convention, 2006, OJ L 329, 10.12.2013, p. 1; Directive 2013/38/EU of the European Parliament and of the Council of 12 August 2013 amending Directive 2009/16/EC on port
State control, OJ L 218, 14.8.2013, p. 1; and Council Directive (EU) 2018/131 implementing the Agreement concluded by the
European Community Shipowners' Associations (ECSA) and the European Transport Workers' Federation (ETF) to amend Directive 2009/13/EC in accordance with the amendments of 2014 to the Maritime Labour Convention, 2006, as approved by the
International Labour Conference on 11 June 2014, OJ L 22, 26.1.2018, p. 28. 181 Directive 2008/106/EC of the European Parliament and of the Council of 19 November 2008 on the minimum level of training of seafarers (recast), OJ L 323, 3.12.2008, p. 33. 182 Directive 2014/112/EU of 19 December 2014 implementing the European Agreement concerning certain aspects of the
organisation of working time in inland waterway transport, concluded by the European Barge Union (EBU), the European Skippers
Organisation (ESO) and the European Transport Workers' Federation (ETF), OJ L 367, 23.12.2014, p.86. 183 Study on social aspects within the maritime transport sector, https://op.europa.eu/en/publication-detail/-/publication/a14413d7-
bf30-11ea-901b-01aa75ed71a1; SkillSea project, https://www.skillsea.eu/, EU – ILO high level dialogue; EMSA training programs and capacity building for third countries (ie on MLC 2006).

66
legislation and policies, e.g. development of databases and digital tools for the
implementation of legislation concerning professional qualifications.
265. The EU sectoral social dialogue committee in the port sector provides the social
partners with a framework to develop a joint approach to the social challenges
related to port labour relations, including working conditions, health and safety
questions, digitalisation, training requirements and professional qualifications.
3.6 Enforcement of the EU transport acquis
Background
266. The Treaties entrust the Commission with the task of ensuring that EU law is
properly applied. The Commission’s monitoring/infringement work takes place in
the context of the major policy overhaul that was introduced by the 2016
Communication from the Commission on EU law: Better results through better
application184
, which underlines the need for a more strategic approach to
enforcement actions.
267. Such enforcement is one of the means to assist Member States in their efforts to
implement EU law, and to ensure that they live up to their responsibilities in
correctly applying EU legislation. According to the Communication, moreover, the
Commission will prioritise its enforcement efforts on the most important breaches
of EU law affecting the interests of its citizens and business. The Communication
also encourages good cooperation and communication between the Commission
and the Member States as a method conducive to reaching compliance at an early
stage, rather than having to resort to infringement procedures. The Communication
further recalls that the work done to ensure the effective enforcement of existing
Union law should be recognised as being of equivalent importance to the work
devoted to developing new legislation.
268. The importance of the Commission’s work on monitoring the implementation of
EU legislation in the field of mobility and transport was emphasised by President
von der Leyen in her mission letter to the Commissioner Vălean, where the need to
focus on the application and enforcement of EU law in the field of transport, and
the need to take swift action if EU law is breached, were underlined as key
objectives185
. Co-operation with Member States is also encouraged by the
President, in particular to support their efforts when implementing EU legislation.
Enforcement of the transport acquis
269. The importance of the transport area translates both into the large number of
relevant legislative and non-legislative acts (25% of the EU legislative corpus,
including over 70 Directives and 200 Regulations) and the sensitivity of a number
of transport issues (such as safety, security, technical standards, social rules and
environmental protection).
270. The Commission’s commitment to and proactivity in monitoring the
implementation of the transport acquis, often with the support of dedicated Safety
184 Communication from the Commission — EU law: Better results through better application (C/2016/8600), OJ C 18, 19.1.2017,
p. 10. 185 Mission letter from the President-elect of the European Commission to the Commissioner-designate for Transport, Ms. Adina Vălean, dated from 7 November 2019.

67
Agencies, led over the last decade to its managing of an infringement portfolio of
circa 1,800 cases accounting for the Directorate-General for Mobility and
Transport (DG MOVE). A large proportion of these cases arises from Member
States’ failure to timely notify the Commission of their national implementing
measures of Directives (1,000 cases). Complaints by citizens and businesses over
the application of the transport acquis also play an increasingly significant role.
271. The Commission’s monitoring initiatives in the area cover notably the non-
communication of national measures transposing Directives and non-conformity
cases (i.e. cases of incorrect transposition of Directives), as well as the
implementation of decisions from the Court of Justice but also address the need to
pursue persistent failures in correctly applying EU law and breaches of the
fundamental freedoms. In the area of transport, particular attention has been
devoted to cases falling under EU policy priorities in this area, such as safety and
security, digitalisation and decarbonisation, sustainable/intelligent transport, and
the completion of the single market.
272. In recent years, the Commission monitored in particular the national implementing
measures aimed at creating a single European rail area. This concerns aspects
relevant to competition186
in this field the regulatory oversight and financial
architecture of the railway sector, the power of national regulators, the improved
framework for investment in rail, and the fair and non-discriminatory access to rail
infrastructure and rail-related services. The Commission has also been very active
in monitoring safety rules in road transport (particularly regarding the training of
drivers, roadworthiness inspections and safety requirements for tunnels), maritime
transport issues (training of seafarers, accident investigations and marine
equipment) and aviation (Single European Sky, airport charges, groundhandling
and aviation safety technical requirements and administrative procedures).
273. To better monitor the compliance of transposition measures by Member States, the
Commission has developed a number of tools to assist Member States transposing
and implementing EU law correctly and on time, which include guidance
documents, implementation plans, expert groups, explanatory documents, training,
organising workshops and holding package meetings.
274. To facilitate the implementation of the transport acquis, the Commission has relied
among others on the organisation of workshops in Member States, for instance,
with representatives of national and regional competent authorities for the award of
public service contracts. In these workshops ex ante interpretative guidance is
provided of the relevant provisions of EU law applied to concrete practical
questions, thus enhancing legal certainty and administrative capacity.
275. The Commission also organised transport infringement package meetings with
Member States (20 meetings in the period 2017-2019) which allowed for dedicated
discussions of infringements/EU Pilots and of general infringement policies. By
establishing strong communication channels with the Member States, the
Commission is able to engage in ex ante and ex post assessments of infringement
procedures, to improve its knowledge of national administrations’ transposition
and implementation constraints, thus contributing to the swift correction of
shortcomings.
186 In addition to the Commission improving competition directly, through antitrust enforcement. See e.g. Commission Decision of
18 December 2013 in case AT.39678/AT.39731 Deutsche Bahn, and Commission Decision of 2 October 2017 in case AT.39813 Baltic Rail.

68
State of play regarding mobility and transport
276. At the end of 2019, 1,564 infringement cases remained open at Commission level,
of which 203 concerned mobility and transport. Of these infringement cases, 44
concerned the rail sector, 43 road safety, 24 road transport, and the remaining 92
concerned other policy areas (digitalisation, maritime, aviation, sustainable
transport, passenger rights):
277. As far as the types of infringements handled by DG MOVE are concerned,
between 2015-2019, in broad terms, two-thirds of the infringement cases in the
field of transport were opened for non-communication of national implementing
measures of Directives (while they account for more than 80% for the Commission
as a whole). The remaining cases were opened as own-initiative cases for non-
conformity or incorrect application. They are most often the result of a breach of
legal obligations (such as absence of reporting, absence of connection to a network,
etc.) rather than the operational conclusions arising from a comprehensive
overview of the enforcement of the EU transport legislation within the Member
States.
278. More than half of the infringement cases (297) handled between 2015 and 2019 by
DG MOVE involve safety and security issues. The achievement of the single
market and the development of new technologies (digitalisation and alternative
fuels) are the other main targets of DG MOVE’s monitoring efforts.
279. The number of contacts established with Member States through the structured
problem-solving dialogue tool known as EU Pilot decreased substantially over the
2015-2018 period. The EU Pilot tool was set up as a means to quickly resolve
potential breaches of EU law at an early stage without resorting to an infringement
procedure. However, in 2019-2020, DG MOVE restarted contacting Member
States through EU Pilot, which has a proven record of flexibility and effectiveness.
Figure 13: The use of EU Pilot concerning mobility and transport infringements between
2015-August 2020
0
200
400
600
800
1000
0
20
40
60
80
100
120
140
2015 2016 2017 2018 2019 2020*
DG MOVE Commission

69
280. Finally, DG MOVE receives and handles over one hundred complaints per year
(2019: DG MOVE, 161; Commission: 3525) regarding legislation in the field of
transport, mostly on incorrect implementation issues relating to passenger rights,
public service obligations, recognition of driving licences, market and professional
access, port services, and independence and powers of air regulatory bodies.
281. Of the 161 complaints received in 2019, 53 concerned road safety, 28 road
transport, 22 passenger rights and 58 concerned other areas.
0
200
400
600
800
1000
0
20
40
60
80
100
120
140
2015 2016 2017 2018 2019 2020*
DG MOVE Commission

70
4 CHALLENGES TO SUSTAINABLE, SMART AND RESILIENT MOBILITY
4.1 The sustainability challenge
282. Transport currently accounts for almost a quarter of all EU GHG emissions (road
transport alone is 20% of total) and it is also a major contributor to air pollution, a
problem particularly acute in urban areas. Noise pollution remains a major health
problem in Europe, with the transport sector being the main cause. Illegal
discharges of oily waste, hazardous substances, sewage and garbage as well as
underwater noise from ships harm and disturb the marine and river environment.
Transport infrastructure also exerts pressure on terrestrial and aquatic ecosystems,
in particular from habitats loss, degradation and fragmentation. In total, the
external costs of transport related to GHG emissions (direct and indirect, from
power generation and well-to-tank emissions), air and noise pollution, and habitat
loss due to the transport infrastructure has been recently estimated to amount to
about EUR 388 billion/year in the EU-27187
.
283. Transport is the only economic sector whose GHG emissions are higher than in
1990 and have been growing again since 2013 despite the mitigation efforts
already undertaken. On the one hand, this reflects the close link between economic
activity and transport as well as the important role that mobility plays in the life of
citizens: between 1995 and 2018, the number of tonne-kilometres and passenger-
kilometres transported in the EU-27 has increased by more than 30 %.
Figure 14: Evolution of transport activity in tonne- and passenger-kilometres in the EU
Source: EU Transport in Figures. Statistical Pocketbook 2020. Index values based on 1995 = 100.
(1) : passenger cars, powered two-wheelers, buses & coaches, tram & metro, railways, intra-EU air, intra-EU sea (2) : road, rail, inland waterways, oil pipelines, intra-EU air, intra-EU sea
187 Own calculations based on CE Delft (2019), ‘Handbook on the External Costs of Transport. Version 2019’

71
GDP: at constant year 2005 prices and exchange rates
284. On the other hand, it also shows that the sector remains overly dependent on oil
due to insufficient progress in overcoming technological constraints, in developing
and deploying cost-effective clean alternatives, as well as in switching to more
sustainable transport modes. This is due to the combined effect of market failures,
inadequate market signals, regulatory shortcomings and insufficient policy
alignment at various governmental levels, in addition to weak international
cooperation. Furthermore, transport is not a uniform industrial sector, but covers
various modes operating under very different conditions, which in turn influences
their decarbonisation potential.
285. Based on the analysis underlying the 2030 Climate Target Plan and in line with
Communication on the European Green Deal, in order to reach the objective of a
climate-neutral economy by 2050, a reduction of 90% in transport CO2 emissions
must be achieved, relative to 1990 levels. This raises the ambition of the existing
target of 60% (from 2011 White Paper) and requires significant efforts compared
to developments under current trends and policies (i.e. projected to deliver around
18% emissions reductions by 2050 relative to 1990).
286. All transport modes need to become more sustainable as all are indispensable for
our interconnected transport system (see below sections 4.1.1 and 4.1.2). In the
meantime, as each mode is in the process of decarbonising, more sustainable
alternatives need to be made available now (see below section 4.1.3 and 4.1.4), and
there is a need to rethink the incentives for transport users to make more
sustainable choices (see below section 4.1.5).
287. This will lead to a transport system in which people and businesses have the
freedom to choose their preferred ways of moving or doing business, while making
all transport modes cleaner in a technologically neutral manner, and providing the
right mix of incentives to support sustainable choices.
Key externalities of transport188
288. Transport is a key enabling service to the whole economy contributing to economic
growth and to satisfy the mobility needs of people. Efficient and accessible
transport services are crucial to ensure the connectivity of our societies, from
remote areas such as the outermost regions to our largest cities. Yet, transport
activities also produce negative externalities to the environment and to society. In
the context of pressing environment and climate challenges, updated and
comprehensive assessment of the external costs of transport activities are an
important aspect to be taken into account by EU transport policy. According to the
“Handbook on the External Costs of Transport”, commissioned by the
Commission, the external environmental costs of transport (linked to GHG
emissions, local air pollution, noise, energy production, habitat damage189
),
together with the costs of congestion and crashes sum up in the EU-27 to almost
EUR 900 billion annually190
.
289. Road transport causes more than 80% of such external costs (approximately EUR
550 billion in passenger transport and EUR 170 billion for freight). These costs
188 With the exception of water pollution, all environmental impacts mentioned in this section are included in the EUR 900 billion
figure mentioned. 189 Air pollution and habitat damage costs include the impact on biodiversity. 190 Own calculation based on CE Delft (2019), ‘Handbook on the External Costs of Transport. Version 2019’. All figures in this section exclude UK.

72
include road crash costs (almost EUR 250 billion), congestion costs (some EUR
230 billion) and environmental costs (almost EUR 250 billion).
290. Other modes cause smaller total external costs than road191192
, namely:
Maritime: almost EUR 90 billion (mostly air pollution)
Aviation: almost EUR 40 billion (mostly climate change)
Rail: less than EUR 20 billion (the biggest being noise)
Inland waterways: around EUR 3 billion (mostly air pollution).
291. The high modal share of road is clearly an important reason for this, but road also
shows the highest average external costs across modes (costs per passenger-
kilometre and ton-kilometre). Looking at passenger transport, cars show the
highest average193
costs194
. Buses and coaches, trains and aviation have similar
magnitude of average external costs, three to four times less than cars. The lowest
external costs are shown by rail: the average costs of aviation and buses and
coaches is 10% higher than in rail.
292. As far as freight is concerned, lorries show the highest average costs, followed by
inland waterways (roughly 50% less than lorries), rail (roughly two third less than
lorries) and maritime (80% less than lorries).
293. The above includes all external costs of individual transport modes, i.e.
environmental costs as well as crashes and congestion, with the exception of
walking and cycling where data at EU level is not available.
294. It should be noted that road users, while producing the highest costs to the society,
are also those who “pay back” the most, in terms of transport related taxes and
charges195
. Overall, road is the mode paying the highest share of its total costs,
nearly 50%. However, there are good economic reasons to exclude fixed
infrastructure costs from the cost coverage indicators, therefore charging only the
marginal infrastructure costs. Excluding them leads to the rail sector showing the
highest cost coverage of 80% (with high-speed rail paying even more than it costs
to society).
Environmental costs
295. Looking at just the environmental costs196
, cars and aviation are the passenger
modes with the highest external costs. Rail and collective road transport (all buses
and coaches) produce the smallest environmental external costs, both in total and
per passenger kilometre, with the exception of active modes. Compared with cars
and aviation, the level of environmental costs in euro per kilometre is about 30%
lower for rail, and 50% lower for collective road transport197
. On the freight side,
lorries have the highest environmental footprint, closely followed by inland
191 Note that, for aviation and maritime, the handbook focuses on a sample of (air)ports. The costs presented here are then scaled up
at EU-27 level and include extra-EU activity. The EU-27 figures should be taken with caution, as scaling-up assumes that the sample of (air)ports is representative of the Union as a whole. 192 Congestion/scarcity costs are not included for modes other than transport for methodological reasons 193 The average cost is driven, for all modes, by the occupancy factor. For cars, this is on average equal to about 1.6 passenger/vehicle. Increasing the number of passenger per vehicle could lead to a significant cost reduction. 194 Motorcycles are actually the passenger mode with the highest external costs per passenger-kilometre, due to high accident and
noise costs. However, the total cost of motorcycles is limited due to their low modal share. 195 In the EU-27, road users paid more than EUR 300 billion in 2016, while rail users around EUR 18 billion and inland waterway
users about EUR 200 million. Source: CE Delft (2019), Overview on Transport taxes and charges in Europe
https://ec.europa.eu/transport/sites/transport/files/studies/transport-taxes-and-charges-in-europe-isbn-978-92-79-99561-3.pdf 196 These costs are already included in EUR 900 billion figure. They include climate change, air pollution, noise and habitat damage
costs. 197 Motorcycles are the mode with the highest average environmental costs due to their high noise costs, but their total costs remain limited.

73
waterway transport. On average, rail environmental costs are almost half and
maritime almost one third of those of lorries.
296. In 2018, the transport sector contributed 30.5% of the EU-27 final energy
consumption198
. 24.6% of GHG emissions (31.8% above the 1990 levels) in the
EU stemmed from transport, excluding international maritime. Including
international maritime, the share of GHG emissions was 27.2% in 2018.
297. The share of GHG emissions from transport (including international aviation and
maritime) in EU-27 total GHG emissions has increased from 16.5 % in 1990 to
27.2% in 2018. The level of GHG emissions from road transport alone have
increased by 26.8% between 1990 and 2018 and accounts for 71.8% of the
transport GHG emissions.199
Figure 15: Share by mode in total transport GHG emissions, including international
bunkers, in the EU-27 in 2018200
Source: Transport in the EU. Statistical Pocketbook 2020. For railways, indirect emissions from electricity consumption are
excluded.
298. When looking at GHG emissions from individual modes of transport in the EU,
and including international bunkers, the rise in emissions from aviation since 1990
stands out, whereas the railway sector has been the only transport mode to
consistently reduce GHG emissions since 1990.
198 Final energy consumption excludes international maritime and aviation. 199European Commission, ‘EU Transport in Figures. Statistical Pocketbook 2020’. https://ec.europa.eu/transport/facts-
fundings/statistics/pocketbook-2020_en 200 European Commission, ‘EU Transport in Figures. Statistical Pocketbook https://ec.europa.eu/transport/facts-fundings/statistics/pocketbook-2020_en

74
Figure 16: Evolution of GHG emissions by transport mode in the EU-27 (1990 = 1)
Source: European Commission (2020) : EU Transport in Figures. Statistical Pocketbook 2020. For railways, indirect emissions
from electricity consumption are excluded.
299. Road transport is by far the mode with the highest total GHG emissions,
accounting for around 72% of the total transport emissions. After a decrease
mainly caused by the 2008-2009 economic crisis and high oil prices, emissions
from road transport started growing again in 2014, at an average yearly pace of
1.5%.
300. Aviation has a much lower share in GHG emission than road transport, but
emissions would increase as air traffic is projected to increase in Europe and
worldwide.201
According to the data reported by Members States to the United
Nations Framework Convention on Climate Change, the CO2 emissions of all
flights departing from EU and EFTA increased from 88 to 171 million tonnes
(+95%) between 1990 and 2016. Between 2014 and 2017, average fuel burn per
passenger kilometre flown has reduced at an average rate of 2.8% per annum.
However, this efficiency gain was not sufficient to counterbalance the increase in
CO2 emitted due to the growth in the number of flights, aircraft size and flown
distance. During the 2013-2017 phase, the total verified CO2 emissions from
aviation covered by the EU ETS increased from 53.5 Mt in 2013 to 64.3 Mt in
2017, equal to an average increase of 4.7% per year. Beyond CO2, although more
research is needed to fully understand the non-CO2 climate impacts from aviation
activities, these have recently been estimated to be at least as important in total as
those of CO2 alone. The Commission has provided and updated analysis of the
science and potential policy measures to address these non-CO2 drivers of climate
change.202
201 See section 2.2 for the description of the Baseline scenario. 202 COM(2020) 747 final, “Updated analysis of the non-CO2 climate impacts of aviation and potential policy measures pursuant to EU Emissions Trading System Directive Article 30(4)”

75
301. EU waterborne transport consists of two very distinct segments: international
shipping (ships calling from third countries in EU ports and sailing between two
EU Member States) and inland navigation (ships sailing within the same EU
Member State, including inland waterways). GHG emissions from inland
navigation are subject to the EU Effort Sharing Regulation. Member States have to
implement measures to fulfil the Union’s target of reducing its GHG emissions by
30% below 2005 levels in 2030 in these sectors.
302. Data collected from the EU MRV system203
confirmed that CO2 emissions from
maritime transport are substantial, with over 138 million tonnes of CO2 released
into the atmosphere in 2018. This represents over 3.7% of total EU-27 plus UK
CO2 emissions. While compared to other modes of transport, maritime transport
remains the most carbon efficient mode of transport per ton km, the reported CO2
emissions in the EU, based on the fuel sold and also accounting for the inland and
domestic navigation, make up around 14% of the total transport CO2 emissions.
303. The EU's CO2 emissions from inland and domestic navigation204
are about 16
million tonnes of CO2 and have decreased over time (about 26% below 1990
levels). This decrease is related to the renewal of the fleet, increase in energy
efficiency (EU standards for inland waterways have been put in place since 2003).
304. On the contrary, CO2 emissions from the EU-related international shipping (i.e.
from ships calling to EEA ports from third countries and ships sailing between 2 or
more EU Member States) have continued to increase, and are currently around one
third above 1990 levels. This increase is primarily driven by the growth in
transport activity and the current heavy reliance on oil derivatives despite the
uptake of energy efficient technologies.
305. Direct GHG emissions from rail transport are very low, due to the majority of
traffic running on electrified lines, representing only 0.4% of transport emissions.
On this basis, shifting substantially more passengers and freight to rail would
significantly contribute to decarbonising transport.
Air pollution
306. Transport is responsible for more than half of all nitrogen oxides (NOx) emissions
and significantly contributes to the total emissions of the other air pollutants. The
situation has improved though compared to the past. NOx emissions from road
transport decreased by 37% between 2007 and 2017 (non-road transport: -20%).205
During the same period, emissions of total particulate matters that have diameter
less than 2.5 micrometre (PM2.5) by road transport decreased by 42%, in non-road
transport the decrease was 28% in the same timeframe206
. Sulphur oxides (SOx)
emissions from road transport and non-road transport were 70% and 60% lower in
2017 than in 2007, respectively.
307. SOx and NOx are known to be harmful to human health since they are precursors of
PM pollution and ozone, causing respiratory symptoms and lung disease. In the
atmosphere, SOx can lead to acid rain, which harms crops, forests and aquatic
species, and contributes to the acidification of the oceans. NOx deposition in the
203 More insight into the CO2 emissions from maritime transport in 2019 can be found in the Commission report [EU MRV report]
published in May 2020. C(2020) 3184 final. 204 Covering inland waterway transport and domestic maritime navigation 205 Source: Eurostat. 206 However, the emissions of nanoparticles are not well represented by this metric and some new technologies could have led to an increase. Diesel and gasoline direct injection vehicles have been found to emit huge amounts of nanoparticles.

76
oceans and seas induces eutrophication, which together with acidification, is a
severe pressure on marine biodiversity.
308. The contribution of road transport to harmful NOx concentrations is particularly
problematic in urban areas, because emissions occur close to the ground and
mainly in densely populated areas. In “street canyons”, i.e. streets enclosed by a
high density of usually tall buildings and high levels of road traffic, NOx emissions
can be very high, leading to exceedances of air quality standards. 95% of the EU
urban population remain exposed to pollutant concentrations above WHO air
quality guidelines207
and majority of EU Member States are in breach of the Union
air quality legislation.
309. While gaseous emissions from transport are mostly arising from fuel combustion,
other releases contribute to both non-methane volatile organic compounds
(NMVOCs) (from fuel evaporation) and primary PM pollution, namely from road
transport - exhaust and non-exhaust (from tyre- and brake-wear, and road
abrasion). Combustion engines remain a significant source of transport
nanoparticles. The relative importance of non-exhaust emissions for the larger
sizes of particles has increased since the introduction of vehicle particulate
abatement technologies, which reduced exhaust emissions208
for some types of
vehicles.
310. Maritime transport also contributes significantly to air pollution in Europe209
as
ship combustion generates SOx, NOx and particulate matter. Even though
international and EU legislation has lowered the allowed sulphur content of marine
fuels, these continue to contain more sulphur than fuels used on land. NOx
reducing engine standards or retrofits are also much less stricter.
311. Air transport also contributes to air pollution especially in the vicinity of airports.
More precisely air quality is influenced not only by the emissions from aircraft
engines, but also from other sources such as ground operations, surface access road
transport and airport on-site energy generation and heating. The most significant
emissions related to health impacts from aviation activities are particulate matter
(PM), nitrogen oxides (NOx) and volatile organic compounds (VOCs)210
. The
ICAO technical design standards limit emissions of NOx, carbon monoxide (CO)
and unburnt hydrocarbons (HFC)211
. The general EU air quality legislation212
establishing limit values for the certain pollutants (mainly NOx and particulates in
the case of aircraft emissions) also applies at and around airports.
312. Black Carbon213
is of great relevance for the EU in view of the on-going
developments of the EU's air quality policy and the interlinkages to EU climate
change policy. EU legislation addresses Black Carbon in the Directive 2008/50/EC
of the European Parliament and of the Council on ambient air quality and cleaner
air for Europe by setting binding air quality standard requirements on PM10 and
207 Source: European Environment Agency. 208 European Environment Agency (2018): Progress of EU Transport Sector Towards its Environment and Climate Objectives.
TERM Briefing. 22.11.2018: https://www.eea.europa.eu/themes/transport/term/term-briefing-2018. 209 A Commission-funded research study by IIASA (“The potential for cost effective air emission reductions from international
shipping through designation of further Emission Control Areas in EU waters with focus on the Mediterranean Sea") provides
emission projections to 2030 and beyond, while also noting that the designation of an Emission Control Area in the Mediterranean Sea could, by 2030, cut emissions of SO2 and NOx from international shipping by 80 and 20 percent, respectively, compared to
current legislation. https://www.iiasa.ac.at/web/home/research/researchPrograms/air/Shipping_emissions_reductions_main.pdf 210 European Aviation Environmental Report (2019) https://ec.europa.eu/transport/sites/transport/files/2019-aviation-environmental-
report.pdf 211 https://www.icao.int/environmental-protection/Pages/LAQ_TechnologyStandards.aspx 212 Directive 2008/50/EC: https://eur-lex.europa.eu/legal-content/EN/ALL/?uri=CELEX:32008L0050 213 Black carbon are a constituent of particular matter dispersed in the air, and they are a major component of soot.
77
PM2.5214
. Although the Directive excludes PM emissions from international
maritime shipping, future reductions of PM emissions from maritime transport due
to the reduction of sulphur content and uptake of alternative fuels will contribute to
a decrease of long range transboundary air pollution affecting background
concentrations of air pollution in the EU. The joint Communication by the
Commission and the High Representative of the Union for Foreign Affairs and
Security Policy215
on An Integrated European Policy for the Arctic of April 2016
outlines that the EU should contribute to international efforts to limit emissions of
short-lived climate pollutants such as black carbon and methane that further
accelerate climatic changes in the Arctic216
.
Noise pollution
313. Noise pollution is the second largest health problem due to transport in the EU,
with road traffic being the most widespread source of environmental noise. An
estimated 120 million Europeans are affected by noise levels dangerous for health,
mostly from road transport, above the recommended WHO levels217
. 48,000 new
cases of ischaemic heart disease are causes each year by transport, and 6,500,000
citizen have their sleep heavily disturbed218
. It is also harmful to nature and certain
eco-systems exposed to it219
.
314. Transport related noise generates an external cost of about EUR 60 billion in the
EU-27.220
According to the latest data reported under the Environmental Noise
Directive221
, around 100 million people in the EU are exposed to average sound
levels of 55 dB or higher during the day, evening and night for road traffic noise,
20 million for railway noise and 4 million for aircraft noise. Similarly, road traffic
is by far the biggest source of environmental noise during night time, affecting
around 75 million people, followed by rail with 15 million people, air with 1.5
million people and industrial noise with 0.5 million people. While aircraft noise
214 In addition, the 1999 Gothenburg Protocol to the 1979 Geneva Convention on Long Range Transboundary Air Pollution (CLRTAP) to which the EU is a Party, as amended in 2012, explicitly includes obligations to reduce Black Carbon in the context of
achieving binding emission targets for particulate matter (PM2.5). The new National Emission Ceiling Directive (Directive (EU)
2016/2284 of the European Parliament and of the Council of 14 December 2016 on the reduction of national emissions of certain atmospheric pollutants, amending Directive 2003/35/EC and repealing Directive 2001/81/EC) which entered into force on 31
December 2016 sets national reduction commitment for total PM2,5 emissions for Member States to be attained by 2020 and 2030
and transposes the Protocol's reporting requirements, stressing that in the National Air Pollution Control Programmes, Member
States shall prioritise emission reduction measures for black carbon. 215 JOIN(2016)21 final 216 To that end, the Commission agreed on the new 'Black Carbon in the Arctic' project (EUR 1.5 million ) under the Partnership
Instrument. The project aims to initiate a process of setting clear commitments and/or targets on major black carbon sources with the
potential to affect the Arctic, and to move forward a process leading to enhanced international cooperation on black carbon policy in the Arctic region. The project's main focus of action is to address BC emissions from gas flaring and from domestic heating.
However, BC emissions from international shipping are also addressed in the project. 217https://www.euro.who.int/en/health-topics/environment-and-health/noise/publications/2018/environmental-noise-guidelines-for-the-european-region-2018 218 https://www.eea.europa.eu/publications/environmental-noise-in-europe 219 A growing number of studies have indicated that (man-made) noise influences the wellbeing of animals. Noise may result in behavioural change in animals, leading to reduced reproductive success and species density (Dutilleux, 2012). Due to the novel
nature of research in this area, it is not yet possible to quantify these effects (Dutilleux, 2012). Source: Internalisation Handbook
2019. 220CE Delft (2019): ), ‘Handbook on the External Costs of Transport. Version 2019’.
https://op.europa.eu/en/publication-detail/-/publication/9781f65f-8448-11ea-bf12-01aa75ed71a1 221 Directive 2002/49/EC of the European Parliament and of the Council of 25 June 2002 relating to the assessment and management
of environmental noise - Declaration by the Commission in the Conciliation Committee on the Directive relating to the assessment
and management of environmental noise, OJ L 189, 18.7.2002, p. 12; and Commission Directive (EU) 2015/996 of 19 May 2015
establishing common noise assessment methods according to Directive 2002/49/EC of the European Parliament and of the Council, , OJ L 168, 1.7.2015, p. 1.

78
does not affect a wide geographical area, it causes more stress and disrupted sleep
than road or railway at the same noise levels.222
315. Although modern electric passenger trains running on well-maintained track are
relatively quiet, older freight wagons equipped with cast iron brake blocks can
generate a significant noise issue, in particular since many freight trains are
operated at night. This is a public health and political concern in some Member
States, and leads to substantial opposition to increases in rail freight. Retrofitting of
freight wagons with composite brake blocks (replacing cast iron brake blocks) is
the most efficient way of addressing the matter223,224
. The banning of “noisy”
freight wagons from the busiest rail freight routes from December 2024 as a result
of the revised Technical Specification for Interoperability for Noise will largely
address the European dimension of the issue.
316. In spite of technological improvements which have made aircraft less noisy, the
problem of aircraft noise in the EU has continuously increased in the past years.
This is due to the continuous overall growth of air traffic in Europe as well as the
expansion from population affected by aviation noise, linked to demographic
growth and weak land use planning. Noise from aircraft is the third largest source
of noise pollution affecting EU citizens, and research shows that people perceive
noise from aircraft as more annoying than noise from road or rail, at the same noise
level exposure. It is estimated that in 2017, more than 2.5 million EU citizens were
subject to 55 dB noise level from aircraft, an increase of 12% as compared to 2005.
With the expected continued overall growth of air traffic in Europe in the next
decades - generating more flights in particular at medium size airports, the total
population affected by critical noise levels from aircraft will likely further increase,
especially at regional airports. Aircraft noise at night time is also a growing
concern. In 2017, around 1 million EU citizens were exposed to at least 50 dB
aircraft noise levels at night, an increase by 13% as compared to 2005.
Water pollution
317. According to a recent report from the European Environment Agency225
, the
increased threats posed by overexploitation of marine resources, pollution and
climate change call for urgent action to bring Europe’s seas back to good
condition, and we are running out of time to reverse decades of neglect and misuse.
318. Illegal discharges of oily waste, hazardous substances, sewage and garbage from
ships harm the marine & river environment. The use of antifouling agents for ship
paint is another source of emissions of toxic substances, generally organic
222 EEA (2018): ‘TERM Briefing ‘Progress of EU Transport Sector Towards its Environment and Climate Objectives’. https://www.eea.europa.eu/themes/transport/term/term-briefing-2018. 223 DG MOVE Staff Working Document (SWD) on Rail Noise, December 2015 224 The Technical Standards for Interoperability (TSI) Regulation on noise,(Commission Regulation (EU) 1304/2014, as revised by Regulation (EU) 2019/774 adopted in May 2019), bans, from December 2024, the use of “loud” freight wagons from the most
intensely used freight routes in Europe, the so-called “quieter routes” (defined as a part of the railway infrastructure with a minimum
length of 20 km on which the average number of daily operated freight trains during the night-time is higher than 12). Since the wagon fleet is used interchangeably across Europe, and many freight flows use the “quieter routes” for part of their journey, the
2019 provisions will effectively result in a phasing out of cast-iron block wagons from general use. Limited exceptions are
provided for special cases. Apart from the amended TSI Noise, the Commission has also made available CEF budget to co-finance the retrofitting of freight
wagons: EUR 20 million in 2014, EUR 20 million in 2016 and EUR 35 million in 2019, totalling EUR 75 million in three calls.
The three CEF calls resulted in applications worth EUR 53 million and have resulted in around 207 000 freight wagons being
retrofitted. Further, Implementing Regulation (EU) 2015/429 provides the modalities for Member States wishing to introduce noise-
differentiated track access charges. Such schemes have been introduced by The Netherlands, Austria, Germany, Czechia (starting
2020) and a similar State-aid scheme has been introduced by Italy. The Implementing Regulation is currently being evaluated. 225 https://www.eea.europa.eu/highlights/europes-seas-face-uncertain-future

79
pollutants, metal-organic compounds or heavy metals. In maritime transport and
inland waterways, waste water and ballast water leads to the pollution of seawater,
lakes or rivers. The emissions mainly occur in ports but also affects inland
waterways, and can lead to substantial water and sediment pollution226
.
319. In inland navigation there is no common rule at EU level on protecting rivers
against wastes from vessels. The absence of a policy and regulatory framework
creates a “gap” in relation to the protection of waters and it would require close
cooperation with relevant international organizations to address this.
320. Maritime transport and tourism (cruises) can also be a significant source of plastic
pollution, as demonstrated also by its accumulation along shipping routes. The
accidental loss of 342 containers in 2019 in the North Sea and the resulting waste
dissemination is another case in point. The EU is aware of the problem and, further
to adopting a new Directive on Port Reception Facilities focused on reducing litter
from shipping and fishing as a follow-up of its Strategy for Plastics and the
Circular Economy Action Plan, is considering additional initiatives to tackle sea-
based sources of marine litter, including microplastics, in close cooperation with
international partners and other relevant initiatives, notably the IMO Action Plan to
address marine plastic litter from ships.
Biodiversity loss
321. Transport can also cause several significant negative impacts on ecosystems and
biodiversity. The design and use of road, rail and waterborne transport
infrastructure alters the quality and connectivity of habitats and can create physical
barriers to the movement of plants and animals between habitat areas. Species can
be injured or killed by vehicles, become isolated by habitat fragmentation or
incapable of fulfilling their life cycle, lose their habitat, or exhibit behavioural
changes that put their survival at risk, such as feeding on or near roads, or changes
in migratory behaviour including for migratory fish, which can prevent them from
reproducing and consequently exerts high pressure on the survival of populations.
Fragmentation of rivers and deterioration of their hydrological and morphological
conditions is one of the main pressure affecting freshwater in the EU. Barriers in
rivers can also prevent the flow of sediments and consequently affect downstream
water bodies. The development and use of transport infrastructure can also increase
pollution levels in surrounding habitats.
322. Noise and light pollution can affect the breeding success of many species of birds
and mammals (e.g. bats) as well as their feeding, migration and wintering needs.
Noise from ships can alter the capacity of fish and marine mammals to locate
themselves, their capacity to search for food and to escape from predators.
323. Furthermore, transport infrastructure and vehicles can serve as a vector for the
spread of invasive alien species (through hull fouling, ballast water in relation to
maritime and inland waterways transport, stowaway species attached to vehicles,
infrastructure facilitating dispersal of species across physical and environmental
barriers (e.g. a mountain range now crossed by a tunnel, new canals etc.).227
Invasive alien species have significant impacts on native species through
competition, predation, etc., may cause alteration and/or loss of native habitats, or
even impact overall ecosystem functioning.
226 There is also a risk of remobilising those pollutants during dredging operations. 227 European Environment Agency (2015): TERM Report 2015.

80
324. The loss and fragmentation of habitats through land use for transport infrastructure
are estimated to amount to EUR 37 billion annually at EU-27 level.228
The biggest
share of these costs is produced by road infrastructure. However, railway
infrastructure also tends to have a high impact on habitat, as well as inland
waterways.
325. Transport activities lead to other negative impacts on soil and water through
abrasion of brakes, tyres, road surfaces and rail track (road, rail). Tyre abrasion in
particular is one of the largest sources of microplastics, ending up in the food
chain. Finally the deposit of combustion emissions from air onto land and into
water may be the cause of severe instances of eutrophication and acidification
hampering linked biodiversity.
Insufficient physical activity
326. Over-reliance on individual cars, in particular in urban areas, is linked with
insufficient levels of regular physical activity for adults and children, and related
health problems, including premature deaths229
. A review of 28 health impact
studies related to greater active transport and less car use found people who
switched from using a car to active transport received substantial health benefits
from increased physical activity. This benefit well outweighed any risks cyclists or
pedestrians might experience from exposure to air pollution or being involved in
motor vehicle crashes230
. Being physically inactive is associated with many non-
communicable diseases, such as cancer, cardiovascular diseases,
overweight/obesity, dementia, type 2 diabetes and stress and anxiety. One study
found that people who get insufficient exercise have a 20-30% increased risk of
all-cause mortality compared with people who exercise for 30 minutes a day. The
European Code against Cancer231
, an initiative of the European Commission,
informs individual citizens about actions they can take for themselves or their
families to reduce their risk of cancer. The Code calls for people to be physically
active in everyday life and to limit the time spent sitting.
327. Walking and cycling (combined with public transport or shared mobility if
necessary) provide the opportunity for city dwellers, particularly those who do not
have time for other exercise, to incorporate more physical activity into their daily
routines232
. The Commission’s sustainable urban mobility planning (SUMP)
concept and published guidelines provide an appropriate approach to facilitate
active mobility in cities. In addition, the WHO’s Health Economic Assessment
Tool (HEAT)233
estimates the value of reduced mortality that results from regular
walking or cycling and should be part of comprehensive cost–benefit analyses of
transport interventions or infrastructure projects, in particular at urban level.
Degradation of public space
228 CE Delft (2019), ‘Handbook on the External Costs of Transport. Version 2019’.
https://op.europa.eu/en/publication-detail/-/publication/9781f65f-8448-11ea-bf12-01aa75ed71a1 229 In order to avoid major negative health consequences, WHO recommends for adults at least 30 minutes a day of moderate physical activity, such as walking or cycling: https://www.who.int/news-room/fact-sheets/detail/physical-activity 230 https://www.sciencedirect.com/science/article/pii/S0091743516000402 231 https://cancer-code-europe.iarc.fr/index.php/en/ 232 Recognising positive impact of regular physical activity, including on increased productivity and reduced absenteeism, a rising
number of employers offer (financial) support schemes for their employees to cycle to work 233https://www.euro.who.int/en/health-topics/environment-and-health/Transport-and-health/activities/guidance-and-tools/health-economic-assessment-tool-heat-for-cycling-and-walking

81
328. Road and parking infrastructure for individual cars contributes to soil sealing and
takes up valuable space that could be used to create green areas as well as
pedestrian and cycling infrastructure, which are beneficial for people’s physical
and mental well-being234
. The average car is parked more than 90% of the time.235
In addition, the COVID-19 pandemic has highlighted the issue of distribution of
public space in favour of motorised traffic: with cars accounting for ~30-40% of
journeys and occupying ~70-80% of public space in European cities, there was
often insufficient space left for people to walk and cycle whilst complying with
social distancing requirements.
329. While visual pollution per se is a lesser concern than safety or noise, in the future it
is possible that frequent sighting of remotely-piloted or autonomous aircraft in the
sky, in particular in urban environments, may negatively impact social acceptance
of their operations, and heighten concerns, justified or not, about privacy, safety or
security. Therefore public acceptance is key for new technologies such as drones
and Urban Air Mobility.
4.1.1 Zero- and low-emission vehicles and renewable and low carbon transport
fuels
330. Transport modes prevalent for our mobility and transport must be sustainable for
the objective set in the Communication on the European Green Deal is to be
attained. To achieve this, it is necessary to boost the production and uptake of low-
and zero- emission vehicles, vessels and aircraft, supported by renewable and low-
carbon fuels for road, waterborne, air and rail transport. There is need to ensure
that the sustainable vehicles and fuels are supplied by the industry, put in place the
necessary infrastructure, and incentivise demand by end-users. It will also be
necessary to support research and innovation on competitive and future-proof
technologies, products and services.
331. The European Green Deal stresses the need to ramp up production and distribution
of renewable and low carbon fuels. It notes the relevance of complete alternative
fuels connectivity throughout the EU and sets the objective of having 1 million
public recharging and refuelling points in place by 2025.
332. This is because EU-27 transport still relies on oil for about 93% of its energy
needs. Most energy consumed in road, air and waterborne transport is fossil fuel
based. Road transport depended on oil products for 94% of its energy use and rail
transport for 23% in 2018. While air transport relies only on kerosene, inland
navigation uses few types of fuels, but all petroleum based. International shipping
is capable of using a variety of oil based fuels, mainly heavier fuel oils due to their
lower cost. In addition a few ships use liquefied natural gas fuel because of its
lower pollution characteristics. The total EU oil import bill is estimated at EUR
227.5 billion in 2018236
.
234 https://ec.europa.eu/environment/nature/ecosystems/docs/Table%201%20GI.pdf 235The European car is parked 92% of the time according to the report ‘Ellen MacArthur Foundation, 2015, Growth Within: A
Circular Economy Vision for a Competitive Europe.
https://www.ellenmacarthurfoundation.org/assets/downloads/publications/EllenMacArthurFoundation_Growth-Within_July15.pdf 236 SWD (2020) 951 final.

82
Figure 17: Evolution of final energy consumption by sector in the EU (million tonnes of oil
equivalent)237
333. After reaching its peak in 2007, oil consumption in transport (including
international aviation and maritime) reduced by 12.2% during 2007-2013 (-2.1%
per year). Since 2014, oil consumption has been following an upward trend at an
average rate of 1.9% per year. The growth in transport activity, the shift towards
larger cars and the low oil prices were the main reasons for the increasing energy
consumption.
Figure 18: Transport sector consumption of petroleum products & biofuels, 2000-18238
Source: Eurostat Energy Balances
334. Until 2017, the average fuel efficiency of new light duty vehicles has been
improving over time and this has helped to improve the fuel economy of the whole
237 Source: European Commission (2020): Transport in Figures. Statistical Pocketbook 2020. 238 Figure 1.3 in Cambridge Econometrics (2020) Oil Dependency in the EU https://www.transportenvironment.org/sites/te/files/publications/2020_CE_Oil_Dependency_in_EU_report.pdf
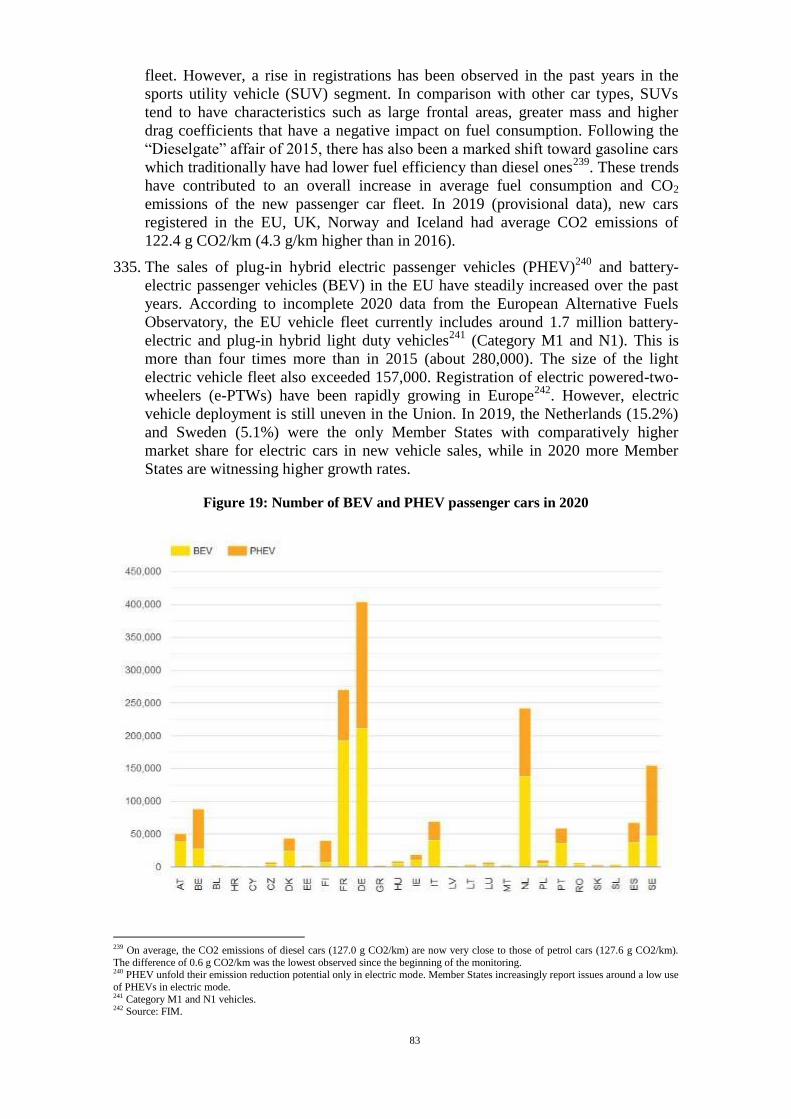
83
fleet. However, a rise in registrations has been observed in the past years in the
sports utility vehicle (SUV) segment. In comparison with other car types, SUVs
tend to have characteristics such as large frontal areas, greater mass and higher
drag coefficients that have a negative impact on fuel consumption. Following the
“Dieselgate” affair of 2015, there has also been a marked shift toward gasoline cars
which traditionally have had lower fuel efficiency than diesel ones239
. These trends
have contributed to an overall increase in average fuel consumption and CO2
emissions of the new passenger car fleet. In 2019 (provisional data), new cars
registered in the EU, UK, Norway and Iceland had average CO2 emissions of
122.4 g CO2/km (4.3 g/km higher than in 2016).
335. The sales of plug-in hybrid electric passenger vehicles (PHEV)240
and battery-
electric passenger vehicles (BEV) in the EU have steadily increased over the past
years. According to incomplete 2020 data from the European Alternative Fuels
Observatory, the EU vehicle fleet currently includes around 1.7 million battery-
electric and plug-in hybrid light duty vehicles241
(Category M1 and N1). This is
more than four times more than in 2015 (about 280,000). The size of the light
electric vehicle fleet also exceeded 157,000. Registration of electric powered-two-
wheelers (e-PTWs) have been rapidly growing in Europe242
. However, electric
vehicle deployment is still uneven in the Union. In 2019, the Netherlands (15.2%)
and Sweden (5.1%) were the only Member States with comparatively higher
market share for electric cars in new vehicle sales, while in 2020 more Member
States are witnessing higher growth rates.
Figure 19: Number of BEV and PHEV passenger cars in 2020
239 On average, the CO2 emissions of diesel cars (127.0 g CO2/km) are now very close to those of petrol cars (127.6 g CO2/km).
The difference of 0.6 g CO2/km was the lowest observed since the beginning of the monitoring. 240 PHEV unfold their emission reduction potential only in electric mode. Member States increasingly report issues around a low use
of PHEVs in electric mode. 241 Category M1 and N1 vehicles. 242 Source: FIM.

84
Source: European Alternative Fuels Observatory243
336. As regards Compressed Natural Gas (CNG) light-duty vehicles, Italy was the
Member State with the largest fleet (close to 1.1 million), whereas fleets in other
Member States were considerably smaller. The light-duty vehicle fleet fuelled by
CNG in the whole EU has increased slightly since 2015, from about 1.2 million
vehicles to 1.36 million vehicles.
337. Heavy-duty vehicle fleets in the bus and coach segment included approximately
20,000 CNG/Liquefied Natural Gas (LNG) buses and coaches, approximately
2,200 battery-electric buses and around 100 hydrogen buses. Zero-emission buses
are rapidly growing in importance, also due to the requirements of the revised
Clean Vehicles Directive. In 2019, 15% of all new bus registrations were
alternatively-powered vehicles, according to ACEA. Concerning heavy-duty road
freight transport, natural gas currently represents the main alternative fuel, with
approximately 24,000 CNG and 4,000 LNG lorries in operation in 2019. While
zero-emission lorries are still in an early stage of market development,
demonstration fleets of electric lorries for regional use profiles are already in
operation.
338. In addition to various national and European support schemes and measures to
boost R&I towards clean vehicles such as the successful European Green Vehicles
Initiative, the European CO2 standards have been the key driver of the uptake of
the low and zero-emission light-duty vehicles.
339. Current CO2 emission performance standards require average CO2 emissions from
new cars and vans to be respectively 37.5% and 31% lower in 2030 compared to
2021; in the case of lorries, average 2030 CO2 emissions must be 30% lower than
the 2021 baseline. For all three categories, emission reductions of 15% are required
by 2025. These standards will further drive low and zero-emission vehicles in the
market.
340. While rail is already largely electrified, it is not economic to electrify some parts
of the network (e.g. rural branch lines or production site feeder lines), while it is
difficult or impossible for others (e.g. parts of ports where catenary would interfere
with cargo handling). Hydrogen, and battery electric rolling stock would allow the
elimination of remaining diesel operations. Such alternative fuels powered trains,
whose development is supported by Shift2Rail Joint Undertaking and Fuel Cells
and Hydrogen Joint Undertaking (FCH JU), can bring rail to zero direct CO2
emissions, decrease air pollution, and improve rail’s multimodal performances
(hybrid locomotives244
can switch from an electrified line to a terminal eliminating
the need for additional shunting locomotives).
341. Substantial emission reduction has been achieved in the aviation sector by
improving the fuel efficiency of aircraft engines and design. The sustained policy
and industrial efforts to improve aviation sustainability have allowed to reduce
noise from aircraft and fuel burn per passenger by respectively 14% and 24%
between 2005 and 2017. However, the overall sustained growth of air traffic
(+60% over the same period) has continued to outpace the environmental
improvements. Substantial public and private investments and adequate policy
frameworks are needed to accelerate the decarbonisation of air transport.
243 https://www.eafo.eu. 244 Hybrid stock (electric with diesel generator available) provides a shorter term fix avoiding diesel operations where electric power is available.

85
342. New aircraft models provide 20% to 25% of improved fuel efficiency compared to
the previous generation.245
Promoting fleet modernisation by an earlier retirement
from circulation of old aircraft and their replacement with a significantly more
fuel-efficient aircraft can generate significant CO2 per each flight in the transition
until breakthrough clean aircraft are developed and commercially available for
deployment. Ensuring the capacity of European industry to increase the
environmental performance of aircraft would have an important impact on the
greening of global air transport as European aircraft today represent 45% of the
worldwide commercial fleet and European engines power 70% of single-aisle
aircraft in the world.
343. In the longer-term, new disruptive technologies need to be developed and deployed
in the market, notably to unleash the full potential of sustainable fuels and
otherwise provide for new clean methods of propulsion and power generation in
aircraft.
344. This requires considerable investment in research and innovation, such as
envisaged under the Horizon Europe programme by the proposed set-up of a Clean
Aviation partnership with the aviation industry and further investment in
collaborative research in clean aviation technology. The partnership should follow
in the footsteps of the Clean Sky Joint Undertaking, which had a participation of
1.7 billion EUR from the EU budget246
. The priority focus should be on the
development of technologies that can generate the largest impact on overall
aviation emissions, notably hybrid and full electric prolusion, ultra-efficient
aircraft configurations, and the development of sustainable alternatives such as the
emerging potential of hydrogen powered aircraft. Accompanying measures would
be necessary to develop infrastructure and production capacity for hydrogen.
345. The stimulus for the development of new technologies should be seen in
conjunction with the measures taken relating to innovation, production and
deployment of sustainable aviation fuels (SAF). This is because in order to
decrease significantly its emissions, the aviation sector will especially need to rely
on the use of liquid SAF in the years to come. Indeed, whereas other transport
modes have access to various sources of energy including renewable energy,
aviation is still almost exclusively reliant on liquid fossil fuel, due to the physical
properties of flying.
346. Concerning the nature of waterborne transport and the availability of alternative
fuels in particular, it is important to distinguish between transport on sea
(maritime) and inland waterways. The main distinction in maritime transport is to
be done between deep sea shipping (long distance and high energy density
requirements) and short-sea shipping, incl. domestic voyages (shorter distances
with more technological alternatives available due to the nature of traffic, regular
port calls, etc. requiring therefore a lower energy density).
347. The environmental challenges faced by the maritime sector impose to continue
improving the energy efficiency of the fleet, the rapid advancements in the
development and deployment of innovative low or zero emissions technologies and
the widespread use of sustainable alternative fuels247
. This requires the cooperation
245 Based on: International Council on Clean Transport, “Fuel burn of new commercial jet aircraft: 1960 to 2019”, September 2020;
ICAO environmental report 2019, Chapter 1 Aviation and environment outlook. 246 In a Strategic Research and Innovation Agenda issued by an aviation industry stakeholder group with reference to the envisaged
partnership under Horizon Europe, the overall investment effort needed to achieve climate goals is estimated at 12 billion EUR over
a 10 year period (2020-2030), within the aim to develop marketable products towards 2035 and achieving climate neutrality in 2050. 247 See also Council Conclusions on "EU Waterborne Transport Sector – Future outlook: Towards a carbon-neutral, zero accidents, automated and competitive EU Waterborne Transport Sector” https://www.consilium.europa.eu/media/44311/st08648-en20.pdf
86
of all actors in the maritime sector: fuel suppliers, vessel and engine manufacturers,
shipping operators, port authorities and service providers, etc. in particular to
demonstrate commercially viable zero-emissions vessels by 2030. Whereas various
technologies, including the use of hydrogen or electric propulsion, are being
successfully tested for short journeys, the situation is more complex for deep-sea
shipping, which has significantly higher power needs, requires much greater
autonomy and the availability of global network of refuelling stations.
348. The Commission is preparing the “FuelEU Maritime” initiative, with the aim to
deliver a legislative proposal at the beginning of 2021 to boost the demand for
renewable and low carbon fuels in maritime transport. Reduction of GHG
emissions from international shipping is also being addressed at global level at the
International Maritime Organization (IMO) and the EU is one of the key drivers of
the IMO’s work in this area. The agreement at IMO on new mandatory measures
setting carbon intensity performance targets for all existing vessels has been
reached in November 2020248
. The new measures add further requirements to
existing energy efficiency measures, which state that all vessels must put in place
the so-called Ship Energy Efficiency Management Plan (SEEMP) to demonstrate
their efforts to improve ship’s energy efficiency and all vessels built after 2013
must abide by compulsory energy efficiency standards (the Energy Efficiency
Design Index, EEDI). In parallel, preparatory work has commenced to support the
uptake of alternative low- and zero-emission fuels in shipping, with the EU
advocating a lifecycle (well-to-wake) approach to GHG emissions.
349. In accordance with the first EU Annual Report on Carbon Dioxide Emissions from
Maritime Transport (data collected in 2018 in the framework of the MRV
regulation), more than 90% of all monitored ships have reported the use of heavy
fuel oil (HFO). In terms of amounts of fuel consumed, HFO represented a little
more than 70% of the fuel consumed by the monitored fleet in 2018. Gas oil
accounted for only 10% of the total fuel consumed and another 10% was covered
by light fuel oil and diesel oil taken together. The global limit on sulphur in marine
fuel has been reduced which means that more of these cleaner fuels are likely to be
used. These types of low sulphur fuels are generally used for auxiliary engines and
boilers when ships are berthing in EU ports or during the operation of a ship in SOx
Emission Control Areas (SECAs). The use of Liquefied Natural Gas (LNG)
represents only 3% of the total amount of fuel consumed. It is mostly used by LNG
and gas carriers. Even though the number of LNG-fuelled vessels continued to
increase in 2019 across all ship types, these remain a very small fraction of the
fleet. In accordance with DNV GL’s Alternative Fuels Insight database, the total
number of commissioned LNG ships worldwide has just passed the threshold of
300 in 2019 with about half of them already in operation and the remaining ones
on order.
350. At present, there is yet no consensus on the most realistic pathway to decarbonise
the maritime sector as a number of fuel/technology combinations could become
more competitive over time. In addition, the solutions are likely to be different for
individual ships, different ship types and market segments. The key objective is to
support the fuels that lead to the most GHG emissions reduction from a “well to
wake” perspective, while being sustainable, available at sufficient scale in the mid
and long term, safe and affordable. On the short-term, advanced biofuels and
248 https://www.imo.org/en/MediaCentre/PressBriefings/pages/42-MEPC-short-term-measure.aspx

87
biogas are likely to be the first sustainable alternative fuels available to shipping
companies.
351. While LNG delivers significant air quality benefits compared to other fossil fuels
(reductions in SOx, NOx and PM emissions), it remains a fossil fuel and present
limited advantages in terms of GHG emissions. It is therefore important to
continue supporting a broader basket of fuel and technologies including
electric/hybrid propulsion, advanced liquid biofuels, bio-LNG, liquid and gaseous
synthetic fuels as well as the use of hydrogen. Support measures should aim at
boosting demand for them, their production and distribution.
352. Due to the nature of the sector, the situation for inland waterways is similar to
short-sea shipping (availability of network infrastructure, lower power
requirements) and alternatives can be developed and deployed more quickly
(including for instance with regards to electricity, and hydrogen). In 2018, more
than 15,000 inland cargo vessels were registered in Europe. Looking at the vessels’
age structure, inland navigation fleet is relatively old: the majority of vessels were
constructed before 2000 and before 2003 there were no provisions for the emission
limits from engines used in IWT.
Figure 20: Number of inland vessels per year of construction in the Belgian and German
fleet
Source: CCNR based on German Waterway and Shipping administration, Belgian Ministry of Transport. Included are dry
cargo vessels, liquid cargo vessels and push&tug boats.
Figure 21: Number of inland vessels per year of construction in the Danube countries
353. There has been a slow innovation uptake concerning greening in the IWT sector.
The relatively slow pace of innovation is mainly caused by:

88
the long serviceable lifetime of engines in inland vessels (30,000 to over
200,000 hours, depending on the engine type) which translates to ca. 40 years
of operation;
the small and specific market for inland vessels and their engines, making it a
less attractive market for engine manufacturers;
the lack of incentives for vessel operators/owners to increase the
environmental performance of the engines;
The lack of information on existing possibilities for greening, in particular
regarding their consequences for actual emissions (and how they relate to
possible emission regulation) and the business case of the vessel
operators/owners.
354. The number of newly built and repowered vessels in the EU is limited to several
dozen per year. Compared to other shipping markets, inland market potential is low
and the emission limits are the most stringent. International engine manufacturers
thus often prioritise their development capacity for engineering engines for markets
with greater sales potential. This hinders the modernisation of the powertrains in
the European fleet.
355. Whilst potential solutions to enable clean climate neutral shipping exist, these are
largely premature and investment in research and innovation, such as envisaged
under the Horizon Europe programme through the establishment of the Zero
Emission Waterborne Transport partnership, is required. It is envisaged that the
partnership focus on decarbonised clean shipping and seek to demonstrate
deployable solutions, appropriate for all main ship types by 2030. Addressing
efficiency improvement, electrification, renewable energies such as wind, take up
of new fuels such as hydrogen within new and retrofitted marine and inland
waterway ships.
4.1.1.1 Fuel supply
356. The deployment of vehicles, vessels and aircraft as well as infrastructure and
services needs to happen everywhere in the EU, in an interoperable manner.
However, there are a number of issues that prevent the uptake of sustainable
transport fuels: limitation of appropriate supply, lack of a suitable
refuelling/recharging network and low or fragmented demand for the sustainable
fuels and vehicles/vessels, influenced also by pricing and tax regimes.
357. The lack of appropriate supply is particularly relevant for certain fuels, namely
sustainable biofuels, e-fuels, clean hydrogen, and biogas. Apart from electricity
from renewable sources there is still considerable lack of availability of renewable
energy sources for transport: the EU share of renewable energy in transport
reached 8.3% in 2018249
.
358. Air and waterborne transport must have priority access to sustainable liquid and
gaseous fuels, since suitable alternatives do not exist for these modes, and these
fuels are the furthest from mass production and use.
249 The share is defined according to the Directive 2009/28/EC on promotion of the use of energy from renewable sources
established accounting criteria for the 2020 targets on renewable energy sources. This is not the same as the share in unit of energy used.

89
359. Sustainable aviation fuels (SAF) are fully compatible with current aircraft
technology and already certified up to 50% of the fuel used in a flight. Although
they have the potential to make an important contribution to tackling GHG
emissions in aviation (emission savings can go up to 80% compared to
conventional jet fuel), this potential is still largely untapped. Current production
and use of SAF is below 0.1% of total jet fuel consumption in the EU. While the
Renewable Energy Directive and the EU Emissions Trading Scheme contain some
mechanisms intended to reward the use of SAF, these measures have so far limited
impact to boost SAF supply and demand.
360. As a concrete deliverable of the European Green Deal, the Commission is
preparing the “ReFuelEU Aviation” initiative, with the aim to deliver a legislative
proposal at the beginning of 2021 to boost the sustainable aviation fuels market.
Several Member States also intend to promote SAFs in their national legislations
(such as Finland, France, Germany, the Netherlands, Spain and Sweden).
361. Sustainable advanced biofuels are not produced at scale, and most biofuel
consumption happens at a low percentage blending with conventional fuels.
Power-to-liquid and power-to-gas fuels from renewable sources are available only
at demonstration scale. While there could be sufficient demand for all types of
sustainable transport fuels catering for all the key products along the refining
process, there is still a lack of investments in production capacity, also due to
limited sustainable production. Volumes are limited and the resulting product price
is not competitive with the fossil-based alternatives, even factoring in the carbon
price and other existing incentives. In a vicious circle, the resulting lack of demand
at such prices does not trigger the necessary investments in feedstock renewable
electricity production and refining capacity that could bring about the required
economies of scale. A long-term policy framework with strong incentives and
closer industrial cooperation appear therefore necessary to break this circle and
boost confidence for major investments, particularly for those transport modes that
have no other technologically-viable and proportionate current decarbonisation
alternative.
362. These issues also affect waterborne and long-distance heavy-duty road transport.
While battery- and fuel-cell electric vehicles already represent a viable option for
buses and for urban and regional delivery vehicles, alternatives to diesel for long-
haul lorries and coaches are not yet widely available. Battery- and fuel-cell electric
long-haul lorries and coaches are now in market development, with 331 battery-
electric new registered heavy goods vehicles (N2 and N3 categories) in 2019, with
larger numbers expected on the EU markets in the next 5 years.
363. On the other hand, LNG vehicles would require significant efficiency
improvements in order to meet the required CO2 emission targets in 2030 and
would need to find solutions to significantly reduce the emitted air pollutants.
Synthetic fuels and biogas, that may have very high cost and renewable energy
production needs are not available at scale either, and similarly to sustainable
advanced biofuels, they also require fully addressing the issue of urban air quality.
Shipping can be flexible in the types of deployable advanced biofuels and may be
able to use lower cost fuel options which would not be deployable in other
transport modes. An example is bio-ammonia, which however, is an extremely
hazardous substance and would have to be handled accordingly.

90
4.1.1.2 Fuel infrastructure
364. Equally significant is the challenge that the lack of a suitable network of
recharging and refuelling infrastructure poses. Two-thirds of EU cars park
overnight on the street or in public car parks250
. There are in particular four issues
in relation to this:
1) While there has been considerable progress in some Member States, there are
still not enough recharging and refuelling points in all Member States and for
all modes. While the formal requirements of the Alternative Fuels
Infrastructure Directive251
(whereby Member States have to adopt a policy
framework for the development of the market as regards alternative fuels in the
transport sector and to make sure that an “appropriate number” of recharging or
refuelling points are available) appear to be fulfilled, infrastructure planning
under national policy frameworks in many Member States risks not to be in
line with the required update of zero and low-emission vehicles and
infrastructure needed to meet the increased ambitions under the European
Green Deal.
2) There is no comprehensive network connectivity across borders and modes
with minimum coherence in the EU. Recharging and refuelling points are
distributed unevenly among Member States and within single Member States.
Consumers and businesses also perceive the uneven development of different
alternative fuel recharging and refuelling stations as a barrier in acquiring or
investing in vehicles powered by alternative fuels.
3) Users of an alternative fuels road vehicle often face problematic conditions for
using that infrastructure, particularly when departing from their home
fuelling/recharging model. This is particularly relevant in the area of electric
mobility, where there is a lack of coherent and transparent user information on
availability, accessibility and usability of recharging stations as well as a broad
variety of approaches to using and paying at these stations, in particular for
cross-border users.
4) If not managed in a smart way, there is a risk that the rapidly increasing fleet of
electric vehicles may lead to congestion in the electricity grid, in particular at
peak times and at distribution level252
.
365. To illustrate the first issue, in 2019, the territory of the EU hosted more than
200,000 publicly accessible filling stations253
for alternative fuels, out of which
about 194,000 were electric charging points, including around 22,000 fast-charging
points. There are also 125 fuelling stations for hydrogen, as well as almost 4,000
filling stations for natural gas, out of which 249 LNG refuelling stations, and
34,000 LPG filling stations available.254
250 JRC, 2012, Driving and parking patterns of European car drivers --- a mobility survey
https://publications.jrc.ec.europa.eu/repository/bitstream/JRC77079/driving%20and%20parking%20patterns%20-%20final_online.pdf
251 Directive 2014/94/EU 252 The widespread use of electrified vehicles will lead to the need to increase electricity production. Section 5 shows however that on a well to wheel basis, CO2 emissions will decrease in all policy scenarios. This is due to the reduction in the energy use in
transport and higher uptake of renewables and low carbon fuels driven by policies, but also due to the power generation sector that
is set to achieve decarbonisation by 2050. The power generation mix plays an important role in this time perspective considering the
large scale electrification of transport. 253 There were about 75000 petrol stations in the EU at the end of 2018. Source: FuelsEurope https://www.fuelseurope.eu/wp-
content/uploads/SR_FuelsEurope-2019-48.pdf 254 Source: European Alternative Fuels Observatory (EAFO).

91
366. Whereas the number of alternative fuel filling stations has increased since 2011,
the number of electric vehicles per charging point is increasing too: on average,
one charging point serves seven vehicles.255
However, the situation of
recharging/refuelling infrastructure differs across EU countries. As Figure 22
shows, the infrastructure is not spread evenly, and parts of the EU transport
network are not well equipped. Hydrogen refuelling infrastructure is still thinly
spread with up to 125 stations (with a large concentration in Germany). It is clear
that in view of the expected acceleration of electric vehicle ramp up, the pace of
infrastructure roll out needs to increase: the European Green Deal set the indicative
target of 1 million public recharging and refuelling points by 2025.
Figure 22: Situation of the publicly accessible recharging points in 2018 across EU256
Source: EAFO
4.1.1.3 Other incentives
367. In recent years an increase in average CO2 emissions of new vehicles has been
observed, together with a diverse, but still low, share of low and zero-emission
vehicles among Member States. With this respect, the CO2 emission standards will
drive manufacturers to invest in zero and low emission vehicles, to accelerate their
deployment.
368. Several experiences across different EU Member States and third countries show
that reducing registration and vehicle taxes for those vehicles is a very effective
means of triggering consumer demand, in addition to other demand-side incentives
such as energy taxes, company car taxation257
, scrappage and purchasing schemes
255 Ibid. 256 Source: State of the Art on Alternative Fuels Transport Systems in Europe. Own elaboration based on data from (EAFO, 2019) 257 T&E, 2020, Company cars: how European governments are subsidising pollution and climate change
https://www.transportenvironment.org/publications/company-cars-how-european-governments-are-subsidising-pollution-and-climate-change

92
and premiums, purchase subsidies or favourable infrastructure charges, etc. CO2-
based road charging as set out in the Eurovignette Directive currently under
negotiation would be an important incentive for greening fleets.
369. Additional policy measures could promote the uptake of zero emission vehicles
and sustainable fuels. Public procurement can play a key role in particular in those
segments – such as buses and fleets – where it represents a major share of the
market. For example the pooled procurement by several cities of clean and safe
vehicles (buses, refuse collection vehicles etc.) along with financial support for
infrastructure measures and retrofitting of vehicles, for instance with turning
assistants could be instrumental.
370. Concerning public transport in particular, the Clean Vehicles Directive258
and the
Clean Bus Europe Platform will help the transition towards low- and zero-emission
options. By requiring a minimum share of public procurement of cars, vans, lorries
and buses to be covered through clean (and zero-emission) vehicles, the Clean
Vehicles Directive will help mobilise this potential in the period 2021-2030. The
Directive must be transposed by August 2021, and it sets ambitious targets for two
five-year periods (2021-2025 and 2026-2030). Post-2030 targets will be set as part
of a 2027 revision.
371. In addition, given the significant additional costs of zero-emission solutions
available for long-distance lorries, the adaptation of the Weights and Dimension
Directive259
for allowing zero-emission heavy-goods vehicles additional weight
and dimensions on freight tonnage could increase the competitiveness of zero-
emission vehicles.
372. Transporting more goods with fewer lorries might increase efficiency and
sustainability260
. So-called European Modular Systems (EMS), which are longer
lorries of up to 25.25 metres typically used on inter-urban roads between transport
centres, allow reducing fuel consumption and emissions by up to 15%261
and at the
same time congestion.
373. Specifically, the legislation on the maximum weights and dimensions of road
vehicles provides for limited circumstances where derogations to the maximum
dimensions of the lorries can be granted. The use of such vehicles, in particular the
modular concepts, in international transport is however very restricted while their
use would be justified for long haul on certain infrastructure. Today,
adjacent Member States who wish to use these derogations to authorise longer
lorries to cross the border between them can only do so if specific conditions are
met. Currently, use of modular lorries is allowed in Finland and Sweden, and is
being trialled in Denmark, the Netherlands, Belgium Spain, Portugal, Czech
Republic and some German Länder.
4.1.1.4 Pollutant standards, batteries and roadworthiness
374. The Commission responded to the Dieselgate affair by overhauling its legislative
framework for type approval and market surveillance, introducing new tests in
258 Directive (EU) 2019/1161 of the European Parliament and of the Council of 20 June 2019 amending Directive 2009/33/EC on the promotion of clean and energy-efficient road transport vehicles, OJ L 188, 12.7.2019, p. 116. 259 Council Directive 96/53/EC of 25 July 1996 laying down for certain road vehicles circulating within the Community the
maximum authorized dimensions in national and international traffic and the maximum authorized weights in international traffic,
OJ L 235, 17.9.1996, p. 59. 260 International Transport Forum (2019) ‘Transport Outlook 2019. OECD Paris’. https://www.oecd-ilibrary.org/transport/itf-
transport-outlook-2019_transp_outlook-en-2019-en 261 ACEA, 2019, High Capacity Transport. https://www.acea.be/uploads/publications/ACEA_Paper-High_Capacity_Transport.pdf

93
vehicle type approval and during in-service conformity for checking real driving
emissions (RDE) on the road262
and is currently preparing a legislative proposal for
stricter emission limits for cars, vans, buses and lorries.
375. A proposal on the EURO 7 is expected in the second half of 2021. The
Commission is studying all the relevant issues, such as the simplification of the
legislation, technological neutrality, adaptation to connectivity and automation,
durability and lifetime compliance, stricter emission limits covering all conditions
of use, and possible inclusion of pollutants not yet regulated. The proposal is
expected to include also requirements for in-vehicle battery durability.
376. The Commission proposal on batteries, including EV batteries, establishes several
sustainability criteria. EV batteries should comply with those criteria to enter (or to
be allowed in) the Union market. Moreover the end of life of such batteries,
including second-life, recycling efficiencies and materials recovery targets are also
covered. Concerning the sustainability criteria, they cover several aspects along the
entire life cycle of the batteries, such as the extraction of the minerals used in their
manufacturing (the responsible sourcing or supply chain due diligence), the
obligation on incorporation a certain level of recycled materials when batteries are
manufactures and the carbon footprint of the batteries. Other aspects cover
labelling and information disclosure to end-users and economic operators and
extended producer responsibility.
377. Following the new stricter emissions limits, more effective emission testing should
also be part of periodic technical inspections and technical roadside checks of
vehicles. This concerns in particular testing for NOx and particulate matter.
378. Particles emitted by diesel engines are filtered by the diesel particulate filter (DPF),
while currently all gasoline direct injection (GDI) vehicles also filter particle
emissions via a gasoline particulate filter (GPF). The current framework requires
the visual inspection of the filters as a method to verify if the filter is leaking,
absent or defective. However, this method has proven to be ineffective, as the filter
is often inaccessible (hidden or too hot to check) and the casing is often filled with
some material to hide the traces of the filter removal. According to a Dutch study
of 2016263
, in approximately 5-7% of diesel cars with a DPF, the filter was
removed or defective. While this does not seem a lot, a well-functioning DPF
filters out about 99% of the so-called micro particles. These particles are so small
that they enter the human body through inhalation via the lungs and have severe
negative health effects.
379. The impact on the overall fleet emissions is very large, for instance a study on
vehicles in Prague found that 1% of a fleet with a broken DPF doubles the
emissions of the whole fleet, while 1% with a removed DPF due to excess engine-
out PM (x10) emissions increase fleet emissions by a factor 10. The most effective
solution would be the tailpipe testing of the exhaust gas verifying the particle
numbers.
380. The main reason to tamper with DPF appears to be related to the very significant
cost of the replacement filter, amounting to several thousand euros especially for
262 Regulation (EU) 2018/858 of the European Parliament and of the Council of 30 May 2018 on the approval and market
surveillance of motor vehicles and their trailers, and of systems, components and separate technical units intended for such vehicles,
amending Regulations (EC) No 715/2007 and (EC) No 595/2009 and repealing Directive 2007/46/EC (Text with EEA relevance.)
14.6.2018; OJ L 151/1 263 Kadijk, G., Spreen, J.S. and Mark, P.J. van der, Investigation into a Periodic Technical Inspection test method to check for
presence and proper functioning of Diesel Particulate Filters in light duty diesel vehicles. Delft, 10 June 2016. TNO report TNO 2016 R10735

94
heavy duty vehicles. In an older vehicle where the DPF has not been installed
during the manufacturing, retrofits can be very effective in reducing emissions,
eliminating up to 90 percent of pollutants in some cases, and Germany, Sweden
and the Netherlands have experience with national retrofitting schemes for DPFs.
However retrofitting may not be an appropriate solution as long as the cost of
replacement DPFs has not been lowered enough to make it a reasonable repair in
light of the market value of the vehicle in question.
381. After years of research and development conducted by some Member States, there
is now a method and suitable equipment at periodical technical inspections to test
particle number (PN), which indicate a malfunctioning of the DPF. Belgium,
Germany and the Netherlands will introduce testing from 2021. The introduction of
the new testing method for PN at EU level will require the revision of the
roadworthiness framework, but in the meantime the Commission is closely
following the Member States’ experiences and it is looking at possible ways to
support the Member States’ efforts.
382. Another issue to consider in this context is tampering with the vehicle’s Selective
Catalytic Reduction (SCR) system, mainly a problem linked to heavy goods
vehicles. The SCR system uses AdBlue, a liquid developed to react in the SCR and
decrease NOx emissions from diesel engines. Vehicles are in principle protected
from running without AdBlue, but systems exist that bypass the vehicle controls
(AdBlue killers). This is done in order to save its cost which can be a significant
saving especially for operators of fleets of lorries. Such tampering is already a
reason for failure of a technical roadside inspection of a vehicle, if detected.
However, in the absence of a suitable NOx testing method and equipment, it is
difficult to detect the often very sophisticated tampering. The Commission is
closely following the progress in the development of such testing methods in view
of possible legislative action. However, it is also not enough to rely on the legal
framework only. The practice of some Member States combining several measures,
such as high fines, on-site checks of transport company fleets, withdrawal of
transport operator and transport manager licences, follow-up actions after
identified manipulations appear to yield good results. The Commission is helping
to spread this know-how, via Member States’ experts in the Roadworthiness
Committee.
383. The development and supervision of harmonised testing methods for
roadworthiness checks, as well as coherence with vehicle type approval, at EU
level would have great added value, but requires additional technical capacity and
resources.
384. Tyres are an important consideration in road safety. Nevertheless, tyres are a
significant cause of noise above 30 km/h and low performing tyres increase noise
and its health effects. Regulating rolling resistance affects the energy consumption,
and emissions of vehicles as well, thus again tyres are key in reducing carbon
footprint. Last but not least tyres are a main cause of the microplastics released in
the environment. Different factors influence the abrasion rate of tyres. Tyre design,
type of their raw materials and external parameters such as roads, vehicle
characteristics that can be regulated as well as ambient meteorological conditions
to be taken into account, are some of these factors.
385. The Report from the Group of Chief Scientific Advisors264
calls attention to the
growing scientific evidence on the hazards of the uncontrolled, irreversible, and
264 https://ec.europa.eu/info/sites/info/files/research_and_innovation/groups/sam/ec_rtd_sam-mnp-opinion_042019.pdf
95
long-term ecological risks due to microplastics do exist for some coastal waters
and sediments.
4.1.2 Clean ports and airports
386. Ports and airports play an essential role for our international connectivity, for the
European economy, and for their regions. There are many best practices already in
place by the most sustainable airports and ports265
. Our airports and ports can be
made clean by deploying sustainable alternative fuels, and feeding stationed
vessels and aircraft with green power instead of fossil energy; incentivising the
development and use of new, cleaner and quieter aircraft and vessels; modulating
airport charges; greening ground movements at airports as well as port services and
operations; and through a wider use of smart traffic management. Public and
private investment in aviation and waterborne transport in research for cutting edge
technologies, in fleet renewals, in local renewable energy production, and in more
sustainable multimodal access increase.
4.1.2.1 Ports
387. The EU has more than 1,400 inland and seaports, including 329 sea ports and 103
inland ports which are part of the trans-European transport network. Together, they
accommodate the safe passage of 75% of the EU’s external trade, one-third of
intra-European trade and 400 million passengers annually. Beyond the traffic
generated in terms of shipping (freight and cruise/passenger), ports are economic
and industrial hubs of their own, and therefore host other major sources of GHG
emissions and pollution (air, noise and water): energy production facilities and
refineries, landside operations in terminals, and hinterland connections (rail, road,
inland waterways). European ports are therefore at the same time critical nodes of
transport, energy and industry that constitute a key ecosystem contributing to
building European strategic value chains. In this respect ports also have an
important role to play in the implementation of the Green Deal.
388. As ports are often located close to heavily populated urban areas, pollution bears
direct impact on liveability and quality of life around those areas, be it for ports’
workers or citizens living nearby. Ongoing air quality infringements are a concern
for a number of EU coastal cities. Prior to the COVID-19 pandemic, coastal cities
were also particularly affected by the growing popularity of the cruise industry,
which relies heavily on highly fuel-intensive ‘mega-vessels’.
389. Exhaust gases from ships are a significant source of air pollution, in particular
through sulphur oxide emissions resulting from the burning of fuel oil. Sulphur
oxides are harmful to the human respiratory system and make breathing difficult.
Ships traditionally used fuel oils for propulsion, which contained a sulphur content
of up to 3.50 %, however, since 1 January 2020 a global sulphur cap with a limit of
0.5% applies. For comparison, the sulphur content of fuels used in lorries or
passenger cars must not exceed 0.001%.
265 Such as the EcoPorts or Airport Carbon Accreditation initiatives, developed by the European Sea Ports Organisation (ESPO) and
ACI EUROPE, respectively. ACI Sustainability Strategy for the Airport Industry https://www.aci-europe.org/press-
release/44-new-sustainability-strategy-guides-airports-towards-enhanced-societal-value.html

96
Figure 23 Cruise ships docking in Barcelona emit 5 times more sulphur than the city’s
560,000 cars every year266
390. Since 2012, the EU has taken firm action to reduce the sulphur content of marine
fuels through the Sulphur Directive. In some very fragile ecosystems such as the
Baltic Sea, the North Sea and the English Channel – designated as ‘Sulphur Oxides
Emissions Control Areas' (SECAs) – the maximum sulphur content was reduced to
0.1%, in 2015. Also, passenger ships spending more than two hours at berth are
already subject to the 0.1% sulphur standard. Such stricter sulphur limits have
more than halved sulphur dioxide concentrations around SECAs, bringing health
benefits to people in coastal regions and ports, while the overall economic impacts
on the sector remained minimal. However, the stricter limit has prompted some
ship owners to install exhaust gas cleaning systems whose operation, in particular
in open-loop mode, has the consequence of transferring pollutants, including
polyaromatic hydrocarbons and heavy metals, from the air to the sea water, with
potentially negative consequences, especially for port and coastal waters.
391. The designation of the North Sea and the Baltic Sea as NOx Emission Control Area
(NECA) starting from 1 January 2021 is expected to further accelerate the uptake
of cleaner vessels in Europe. In practice, all new vessels built as of 2021 will be
required to reduce their NOx emissions by 80% compared to the present emission
levels when sailing in these areas. This target can be achieved through the use of
engine technologies and after-treatment with catalysts or by using Liquefied
Natural Gas (LNG) as fuel.
392. In addition, on-shore power supply represents an attractive solution to reduce local
pollution generated by vessels at berth in EU ports. This potential has already fully
been recognised by Article 4(5) of Directive (EU) 2014/94 on Alternative Fuels
Infrastructure, according to which shore-side electricity supply shall be installed as
a priority in ports of the Trans-European Transport Network (TEN-T) Core
Network, and in other ports, by 31 December 2025, unless there is no demand and
the costs are disproportionate to the benefits, including environmental benefits. The
preparatory work for the evaluation of Directive 2014/94 was launched in 2019 and
should identify, inter alia, how effective these provisions have been to deploy on-
shore power supply in European ports.
266 EPSC Strategic Note 32 of 28 October 2019 ‘Clean Transport at Sea’. Based on analysis done by Transport & Environment https://www.transportenvironment.org/news/cruise-ships-poisoning-city-air-sulphur-much-cars-%E2%80%93-new-data-reveals

97
393. Ports have an important role to fulfil to enable the roll-out and uptake of alternative
fuels in waterborne transport, including for alternative fuels corridors for inland
waterways transport. Ports thus have a clear potential to become alternative energy
hubs and to ensure the development of alternative fuels infrastructure through the
cooperation and coordinated action of all the relevant ports to guarantee
comprehensive and sufficient supply of alternative fuels.
394. In addition to the regulatory approach, the Commission has also identified the
promotion of shore-side electricity as a priority for transport investment. It is
highlighted in the TEN-T Guidelines and through the Connecting Europe Facility
that the Commission has been supporting several projects since 2014, such as
ELEMED and TWIN PORT III, for the deployment of onshore power supply in
EU ports. Moreover, alternative fuel infrastructure, such as onshore power supply,
is eligible under the General Block Exemption Regulation and can thus be funded
with public support.
395. To further incentivise the deployment and use of shore-side electricity, Member
States can also ask for an authorisation to apply a reduced rate of taxation on
electricity directly provided to vessels at berth in a port in accordance with
Article 19 of the Energy Taxation Directive. Denmark, Germany, Spain and
Sweden, have applied for and been granted such authorisations. France and Italy
have recently been granted the derogation.
396. Furthermore, the Communication on the European Green Deal announced action to
oblige docked ships to use shore-side electricity, which could provide further
impulse to the rollout. Alternative solutions, based on different technology, such as
hybrid-ships with batteries charging while at sea, which can then be used when the
ship is at berth should also be considered. The Commission is following up on the
European Green Deal announcement in the context of the “FuelEU Maritime”
initiative for a legislative proposal in 2021
Electrification of port infrastructure and ‘ground handling’ equipment to reduce
emissions
397. In addition to the need for reductions of environmental impact of the sea side of the
maritime transport chain, there is an important potential for such reductions in the
ports themselves, e.g. through the use of alternative fuels in cargo handling
equipment or in vessels used for technical-nautical services (pilotage, towage or
mooring), the monitoring of the environmental performance of port operations and
the replacement of diesel-powered machinery with either electric or gas-powered
port machinery (e.g. rubber tyred gantry cranes, mobile harbour cranes, reach
stackers, shunting locomotives). Train feeder lines to ports and their electrification
support ease of access to sustainable distribution channels for maritime cargo.
398. Digitalisation of port processes and data sharing among port stakeholders could
bring further optimisations in logistics operations and thus reduce unnecessary
freight movements. Further automation of container management and port
operations as well as the adaptation of ports and port infrastructure to automated
transport modes could contribute to further enhancing the efficiency of operations.
Such measures would contribute reducing pollution and thus to improved air
quality in port areas and cities, as well as mitigate health risks for port workers
exposed to the combustion exhaust fumes of cargo handling equipment used in
ports.

98
399. EcoPorts under the European Sea Ports Organisation is the main environmental
initiative of the European port sector and aims to raise awareness on environmental
protections through cooperation and sharing of knowledge between ports and
improve their environmental management267
. It has developed a self-diagnosis
method (SDM) to assess the environmental management programme of ports in
relation to the performance of the sector and international standards as well as a
port environmental review system (PERS) with an independently reviewed
certification valid for a period of 2 years.
Promoting the use of environmentally differentiated port fees
400. As regards environmental charging, the 2013 Ports Policy Communication,
encouraged a more consistent application of environmentally differentiated port
infrastructure charges. According to the Port Services Regulation 2017/352, port
infrastructure charges may vary, in accordance with the port’s own commercial
strategy and its spatial planning policy, in order to promote a more efficient use of
the port infrastructure, short sea shipping or a high environmental performance,
energy efficiency or carbon intensity of transport operations. It also called for the
Commission, together with Member States, to elaborate guidelines on common
classification criteria for vessels for the purpose of voluntary environmental
charging. Subsequently, there are around 30 ports in Europe that apply
differentiated charges268
(in the form of rebates) for vessels that have a better
environmental performance than legally required. This is a market incentive that
can stimulate fleet greening.
Optimisation of port calls to reduce emissions from maritime transport
401. A port call is a particularly important event in the whole maritime transport chain
and a potential bottleneck in the entire logistic chain. The benefits of just-in-time
arrival in terms of emission savings would potentially be significant if smart
routing / steaming was implemented.
402. An international task force on port call optimisation269
is working to establish
standards for the exchange of information and data between all stakeholders, such
as the ports and the vessels. The aim would be to have agreed standards recognised
at the level of the International Maritime Organisation (IMO). The challenges
related to port call optimisation has also been retained as one of the discussion
topics of the Sustainable Ports Subgroup under the European Ports Forum.
Implementation of the new Directive on Port Reception Facilities (PRF)
403. Although most marine litter originates from land, a significant amount – an
estimated 300,000 tonnes – of waste is discharged from ships into our seas, which
poses an increasing threat to the marine environment. In this context the Directive
(EU) 2019/883 on port reception facilities now also covers all plastic household
and operational waste from ships, as well as fishing gear and other waste. It also
applies to ‘passively fished waste’ – waste picked up by fishermen at sea. All ship 267 http://www.ecoports.com/ 268 COGEA for the European Commission: “Study on differentiated port infrastructure charges to promote environmentally friendly
maritime transport activities and sustainable transportation”, June 2017: https://ec.europa.eu/transport/sites/transport/files/2017-06-
differentiated-port-infrastructure-charges-report.pdf. 269 https://portcalloptimization.org/

99
types must comply, from small recreational vessels to large container and
passenger ships, as well as the whole range of ports visited by those ships. It has
introduced 100% indirect fee for garbage (MARPOL Annex V), meaning that
fishing vessels can now dispose of passively fished waste and old/derelict fishing
gear without paying extra charges.
404. This new Directive on Port Reception Facilities entered into force in June 2019 and
has a two-fold objective: (1) reduce discharges of waste from ships at sea, and (2)
ensure the efficiency of maritime operations in port. Currently work is ongoing to
ensure implementation of the Directive (transposition deadline mid-2021). Four
Implementing Acts are foreseen:
On methods for calculation of sufficient waste storage capacity;
On criteria to determine that ships meet the requirements in relation to the
ship’s on-board waste management (including discharge waters and sludge
from exhaust gas cleaning systems), with a view to qualifying for a reduced
delivery fee;
On monitoring data methodology and format for reporting of passively fished
waste; and
On a risk-based targeting mechanism to provide for uniform conditions for
selecting ships for inspection.
405. A new Sub-Group on waste from ships under the European Sustainable Shipping
Forum advises the European Commission on issues related to the implementation
and operation of the Directive.
Preventing ship-source oil pollution
406. While the number of possible oil spills detected in European waters has dropped by
half, from an average of 11 possible spills per 1000 km2 monitored in 2007 to five
possible spills per 1000 km2 monitored in 2017, also thanks to the satellite
monitoring services provided by the European Maritime Safety Agency, other
types of marine pollution are increasing.
407. The new Directive on Port Reception Facilities (Directive (EU) 2019/883) calls on
the Commission to assess the desirability of a review of Directive 2005/35/EC, in
particular a possible extension of its scope, in order to align Directive 2005/35/EC
to the relevant MARPOL Convention provisions prohibiting the discharges of
waste from ships (recital 13). Directive 2005/35/EC regulates enforcement and
sanctions with respect to illegal discharges of substances covered by MARPOL
Annex I and II only (oily substances and noxious liquid substances).
408. However, Member States as contracting parties to the MARPOL Convention, also
have to ensure that no illegal discharges take place involving packaged harmful
substances (Annex III), sewage (Annex IV), garbage (Annex V), and if such
discharges occur, that they are properly sanctioned. To strengthen the
implementation and enforcement of the MARPOL discharge prohibitions included
in these Annexes, through EU law, the scope of Directive 2005/35/EC needs to be
widened. This would be in line with Member State obligations as MARPOL
contracting parties, and also reflect existing regional cooperation in the framework
of the regional sea conventions; in particular HELCOM, OSPAR and Barcelona
Convention have established regional compliance networks to improve cooperation
on the enforcement of the MARPOL norms, including operational
detection/response actions, and the application of sanctions

100
Issues related to enforcement of rules for ships calling at EU ports to ensure the same
level of environmental performance
409. Some difficulties in enforcing environmental rules for ships calling at EU ports
arise from the international nature of shipping. Many non-EU flag states do not
actively enforce environmental rules and thereby obtain a cost advantage over
compliant flags, while putting the environmental burden on those states and areas
where their ships trade.
410. Today, the Paris Memorandum of Understanding on Port State Control aims at
eliminating the operation of sub-standard ships through a harmonized system of
Port State control. Annually more than 18,000 inspections take place on board
foreign ships in the Paris Memorandum of Understanding ports270
, ensuring inter
alia that these ships meet the international environmental standards (MARPOL). In
order to support the Port State Control inspections, the European Maritime Safety
Agency (EMSA) has developed the THETIS database271
.
411. For ships visiting EU ports, certain additional requirements apply due to specific
EU legislation (e.g. Sulphur Directive, Port Reception Facilities Directive, MRV
Regulation, Ship Recycling). In order to enable users to be able to record and
exchange data on inspections and verifications foreseen by this specific EU
legislation, EMSA has developed an extension to THETIS, THETIS-EU, which
facilitates targeting and alerts on the basis of predefined requirements.
4.1.2.2 Airports
412. Air transport provides air connectivity which is a key enabler for the free
movement of people, goods and services underpinning the EU internal market as
well as EU cohesion, economic integration and inclusive growth. By connecting
EU to the rest of the world and remote areas, such as the outermost regions,
aviation also supports tourism, export-focused industries and inward investment,
supporting jobs and economic growth.
413. Airports are generally built in the vicinity of dense residential area or very close to
major cities. While air connectivity brings significant socio-economic benefits, it
also comes with climate, environmental and health challenges related to aircraft
greenhouse, pollutant and noise emissions. Airports are hence subject to a range of
cross-cutting environmental rules including on air quality, noise, and planning
permissions (e.g. nature protection areas). Some airports are covered under ETS
due to local power generation. The environmental impact of each airport varies
greatly depending on the size of the airport, its activities and the type of aircraft
operating at it.
414. Decarbonising air transport sector, next to addressing the challenges related to
aircraft emissions reductions (including air and noise pollution) (see section 4.1.1,
4.1.4 and 4.1.5), would also require investments into airport infrastructure and
operations to optimise air traffic management and strengthen the integration of
270 This mean ships carrying a different flag than the country in which the port is. 271 THETIS is a single window information system combining port call information (from SafeSeaNet system also hosted by
EMSA) and inspection data. The system guides its users through a risk based targeting mechanism to ships which should be inspected and allows the results of inspections to be recorded.

101
airports into a genuinely multimodal network. It would necessitate improving
airports' energy efficiency, ensuring the supply and infrastructure for sustainable
aviation fuels, and hydrogen for hydrogen-powered airport operations and related
services as well as renewable energy generation on-site, together with
electrification and greening measures of airside activities such as groundhandling,
ground traffic operations and aircraft on the ground, and other measures reducing
environmental impacts.
415. In June 2019, as part of the aviation industry ambition, vision and roadmap, ACI
EUROPE and its members (203 airports) committed to net zero carbon emissions
from airport operations fully within their own control by 2050 at the latest,
reducing absolute emissions to the furthest extent possible and addressing any
remaining emissions through investment in carbon removal and storage. Three
airports have already reached this target, while several others have announced to
reach it before 2030.
416. So far, 162 European airports (representing 67.2% of European air passenger
traffic) have volunteered to join the Airport Carbon Accreditation programme,
which provides a common framework for carbon management with the primary
objective to encourage and enable airports to implement best practices. 51 airports
are carbon neutral suggesting good progress towards the ACI EUROPE target of
100 carbon neutral airports by 2030 and confirming the importance airports place
on carbon neutrality.272
In November 2020, the programme added further
obligations, namely alignment with the Paris Agreement, extended carbon footprint
covering all significant operational emissions from third parties, including airlines,
and enhanced stakeholder engagement.273
Airport charges, slot allocation and groundhandling services
417. The existing framework on airport charges, airport slots allocation and
groundhandling services can also play an important role in making the sector more
sustainable.
418. Airport charges are paid by airlines to airports for the use of facilities and
services, which are exclusively provided by the airport managing body and which
are related to landing, take-off, lighting and parking of aircraft and processing of
passengers and freight. While the Directive requires that airport charges are non-
discriminatory, it permits modulations for environmental issues provided that they
are relevant, objective and transparent. The 2019 evaluation of the Directive
showed that only 61% of airports modulate charges on account of noise and only
20% of airports do so on account of NOx emissions. The 2019 evaluation did not
find any airports that would modulate airport charges on account of CO2 emissions.
The planned revision of the Airport Charges Directive could aim to ensure the
setting of airport charges is strategically aligned with the Green Deal
Communication and environmental ambitions of the EU.
419. Current rules concerning the allocation of slots do not contain measures that would
align slot allocation with environmental objectives. However, the Slot Regulation
states that slot-coordinators shall take into account industry rules, such as the
Worldwide Slot Guidelines in the slot allocation process. In their 11th
version,
published June 2020 the guidelines state that slot coordinators should try to ensure
that due account is taken of environmental factors in the allocation of available
272 Source: https://www.airportco2.org/ 273 Source: https://www.airportcarbonaccreditation.org/aca-media/news.html

102
slots. Environmental concerns could also be considered in local rules which apply
to specific airports. However, their scope is quite limited with only a local impact.
420. Groundhandling is an essential service provided for airport users and often
represent important costs for them. It involves ground administration and
supervision, handling of passengers, baggage, mail, freight, and ramps, aircraft
services, fuel and oil handling, aircraft maintenance, flight operations and crew
administration, surface transport and catering services. Groundhandling services
generate GHG and air pollutant emissions at airports. These are caused by usage of
diesel fuel for airport vehicles and ground support equipment (GSE), fossil fuel for
electricity and heating, jet fuel for auxiliary power units (APUs) that power aircraft
at airport gates, and other sources. Airport operators can implement several
measures to reduce the environmental impact of groundhandling services,
including provision of electric buses for passenger transport, pre-conditioned air
fixed power units to avoid GPU/APU (which run on diesel or kerosene),
centralised de-icing pads to avoid contamination of groundwater, and alternative
fuels for ground support equipment. Ground support equipment could also be
pooled for use by all groundhandling service providers. Under this approach, either
by agreement or as mandated by the airport, groundhandling equipment at the
airport is owned centrally by the airport itself or by a leasing company on behalf of
the airport. Such equipment can consist of for example electric lower deck loaders,
electric conveyor belt loaders, electric passenger steps, main deck loaders, electric
baggage tractors, power tractors and cool container dollies. The groundhandlers are
then required to use the (modern and environmentally friendly) equipment to serve
the aircraft, which they are contracted to handle.
421. The Groundhandling Directive274
leaves it to the Member States to ensure the
adequate level of environmental protection. Member States may make the
groundhandling activity conditional upon obtaining the approval of a public
authority independent of the managing body of the airport. The criteria for such
approval can include environmental protection. The Directive allows the limitation
of the number of groundhandling service providers in case of four categories of
groundhandling services: baggage handling, ramp handling, fuel and oil handling
and freight and mail handling. In case such a limitation is applied, the providers
need to be selected in a public tender and the Member States may establish
standard conditions or technical specifications covering also environmental
aspects.
422. The Groundhandling Directive is currently being evaluated. This evaluation will
closely examine issues related to the environmental and climate impact of
groundhandling activities (particularly noise and emissions) and to climate change
mitigation/adaptation policies employed by and/or incumbent (and enforced) upon
groundhandling service providers and airports.
Addressing “airside” ground vehicle movements
423. Aircraft ground movements at airports have an impact on the local air quality as
well as on the local noise emissions. Aircraft ground movements include taxiing
from the aircraft stand to the start of the runway and vice-versa. Figure 24 shows
the total aviation CO2 emissions per flight phases for flights in the ECAC region in
274 Council Directive 96/67/EC of 15 October 1996 on access to the groundhandling market at Community airports, OJ L 272, 25.10.1996, p. 36

103
2019. It indicates that 4% of CO2 emissions, i.e. 8.6 million tonnes of CO2 came
from aircraft ground movements, including the take-off run.
Figure 24 CO2 emissions per flight phases
424. Overall, it is estimated that around 6% of CO2 emissions in aviation, i.e. 11.6
million tonnes of CO2 are generated by ATM routing inefficiencies275
. As
illustrated in Figure 25, of these, around 13% are estimated to be due to
inefficiencies in aircraft ground movement, i.e. taxi-out for 9% and taxi-in for 4%.
However, these estimated ATM inefficiencies are not based on actual fuel burn,
and it is the view of some experts - including Eurocontrol - that actual
inefficiencies could be higher and up to 10%. This can be explained by the fact that
there are likely further inefficiencies, which until now are unaccounted for, for
instance, related to the flight level and aircraft speed.
275
Modulated air navigation charges can encourage eliminating such inefficiencies, especially if rolled out in a harmonised and
effective scheme across the EU.

104
Figure 25 ATM inefficiencies
425. Solutions provided through the SESAR project are available for airports, airspace
users and air navigation service providers to optimise usage of the airspace and the
sequencing of ground traffic operations of aircraft before take-off and after
landing. Large deployment of such solutions would allow engine running time
reductions thus less emission for local residents. Examples of SESAR solutions
include taxi route displays for pilots, pre-departure sequencing supported by route
planning, wake turbulence separation optimisation, traffic optimisation on single
and multiple runway airports, enhanced guidance assistance to aircraft and vehicles
on the airport surface combined with routing, time-based separation, and others.
426. The Directive on the deployment of alternative fuels infrastructure276
does
currently not contain any specific obligations for Member States to decarbonise
ground movements. However, it stipulates that the national policy framework, to
be adopted by Member States, must consider the need to install electricity supply at
airports for stationary aircraft. Moreover, hydrogen-powered airport operations and
related services will also require adequate refuelling infrastructure at airports.
Impact of noise on local residents
427. Long-term exposure to aircraft noise is linked with a variety of health impacts,
including ischaemic heart disease, sleep disturbance, annoyance and cognitive
impairment. The legislative instruments in place, notably the “Balanced Approach”
Regulation277
, shall be applied by Member States in order to meet specific noise
abatement objectives at the level of individual airports, where clear objectives of
reduction in population exposure to noise should be set through the Environmental
276 Directive 2014/94/EU 277 Regulation (EU) No 598/2014 of the European Parliament and of the Council of 16 April 2014 on the establishment of rules and
procedures with regard to the introduction of noise-related operating restrictions at Union airports within a Balanced Approach and repealing Directive 2002/30/EC, OJ L 173, 12.6.2014, p. 65.

105
Noise Directive278
. The Regulation compels Member States to ensure that the
Balanced Approach is adopted in respect of aircraft noise management at those
airports where a noise problem has been identified. The “Balanced Approach”
refers to the process developed by the International Civil Aviation Organization
under which the range of available measures, namely the reduction of aircraft noise
at source, land-use planning and management, noise abatement operational
procedures and operating restrictions, is considered in a consistent way with a view
to addressing the noise problem in the most cost-effective way on an airport-by-
airport basis.
Greener access to the airport
428. Today, an important share of passengers still use their car to access European
airports. Although greener alternatives exist (rail, bus shuttles), these may not
always be deemed the most practical or economical by passengers and not always
seamlessly integrated into urban transport. In addition, car parks are still a
significant source of revenue for airports. On average, 36% of passengers travelled
to airports by public transport in 2018, compared to 43% in 2016279
.
429. The Connecting Europe Facility (CEF) is financing multimodal connections to
airports, such as the “Genoa Erzelli” in Italy or the connection of the Budapest-
Arad railway line to the multimodal hub at Budapest Airport. The TEN-T
Regulation requires that for airports on the network, both core and comprehensive,
the improvement of multimodal interconnections with other transport modes is
given priority280
. In practice, this is very much focused on rail and light rail i.e.
sustainable passenger connections.
430. Generally speaking, airports and the companies operating at airports are self-
financing from user charges and commercial revenues, and the possibility to grant
compatible State aid is limited under the current State aid rules, including under the
2014 EU Guidelines on State aid to airports and airlines. The Commission is
conducting a Fitness check of State aid rules, including those for airports. Should
this process conclude on the need to revise the rules for airports, current limitation
could be revisited in respect of green investment. This would be particularly
welcomed by smaller regional airports, many of which are essential to regional
connectivity but are loss-making (71% of “small airports” are reportedly loss-
making).
4.1.3 Sustainable urban mobility
431. The EU cannot rely only on technological solutions delivering in the future:
immediate action to adapt our mobility and transport system is needed today to
tackle climate change and reduce pollution, and a number of solutions already
exist. In addition to making each and every transport mode more sustainable,
sustainable alternatives need to be made widely available.
432. Urbanisation has been increasing in the past decades and this trend is likely to
continue. So our mobility is an equally increasingly urban question, and poses
278 Directive 2002/49/EC of the European Parliament and of the Council of 25 June 2002 relating to the assessment and management
of environmental noise - Declaration by the Commission in the Conciliation Committee on the Directive relating to the assessment
and management of environmental noise, OJ L 189, 18.7.2002, p. 12. 279 2016 and 2018 data was based on airport reports representing 56% and 64% of European traffic respectively.
https://ec.europa.eu/transport/sites/transport/files/2019-aviation-environmental-report.pdf 280 Articles 26 and 39 of Regulation (EU) N° 1315/2013

106
challenges both for those who live in cities and those who travel into them, often
every day. Urban congestion costs, for example, are estimated to account for EUR
180 billion per year in terms of delay costs and about EUR 32 billion per year in
terms of deadweight loss at EU-27 level.281
In addition, model estimates indicate
that urban transport is responsible for about 22% of EU's CO2 emissions from
transport.282
433. The ability of a city to host infrastructure for public transport, cycling, walking and
other mobility systems, depends primarily on its spatial setup and economic
standing. In cities of high urban density, more people can be served by shorter
networks (pedestrian pavements, cycling lanes, bus routes etc.). On the contrary,
cities with urban sprawl need to construct and maintain much more infrastructure
per inhabitant. The way various activities (work, residence, leisure, culture,
commerce, etc.) are located within a city also plays an important role on proximity
and transport needs.283
Cities and towns can facilitate safe active mobility and
creation of recreational spaces allowing physical activity, parks and green zones
through inclusive urban planning and design.
434. The Urban Mobility Package of 2013284
, the main EU policy basis, aimed to
support cities to improve their urban mobility, with the concept of sustainable
urban mobility plans (SUMPs) in the centre of the approach. Related EU
guidelines were published to support local authorities in the process. The EU
approach to urban mobility has inspired many cities within and beyond Europe,
with over 1,000 SUMPs in place now285
. Whilst the guidelines continue to be used
extensively, major new trends in many areas of urban mobility have emerged and a
wealth of practical SUMP experience has been acquired over the last few years.
Therefore a major overhaul took place in October 2019: a revision of the
Guidelines itself, as well as the development of a range of complementary guides
on specific aspects of SUMP286
.
435. The preliminary evaluation results of the 2013 Urban Mobility Package indicate
that the package was a relevant step towards sustainable mobility, but the problems
identified in 2013 still exist, with some – such as congestion or deteriorating
climate and local environment – getting worse. In addition, as indicated by the
Court of Auditors in their performance audit of the EU urban mobility policy and
funding, no real progress at local level is possible without stronger involvement of
Member States.
436. Clearer guidance is needed on mobility management at local and regional level,
and on connectivity with rural and suburban areas so that commuters are given
sustainable mobility options. European policies and financial support should also
reflect the importance of urban mobility for the overall functioning of the TEN-T,
with provisions for first/last mile solutions that include multimodal mobility hubs,
park-and-ride facilities, and safe, active mobility infrastructure.
281 The delay cost gives a value of the travel time lost relative to a free-flow situation. The deadweight loss costs is the part of the delay costs which is regarded as a proper basis for transport pricing. CE Delft (2019) ‘Handbook on the External Costs of Transport.
Version 2019’.
https://op.europa.eu/en/publication-detail/-/publication/9781f65f-8448-11ea-bf12-01aa75ed71a1. 282 Estimates based on the PRIMES-TREMOVE model developed by E3Modelling. 283 Paris, for example, through the ‘15 minute city’ project is aiming in such urban organization, where all everyday needs can be
covered by a walk or cycling ride of maximum 15 minutes. 284 COM(2013) 913 final It should be noted that an evaluation of the UMP, where UVARs are also considered, will be accomplished
by the end of 2020. 285 https://www.eltis.org/mobility-plans/city-database 286 https://www.eltis.org/mobility-plans/guidelines-developing-and-implementing-sustainable-urban-mobility-plan-2nd-edition

107
437. Under the Environmental Noise Directive, Member States have to prepare action
plans to reduce noise from transport in approximately 500 European
agglomerations. Nevertheless, reduction of noise in urban areas require a mix of
global and local actions that result in noise reduction for instance the improvement
of the vehicle fleet needs to be accompanied by the deployment of better tyres and
better roads. In that sense, the Environmental Noise Directive could be enhanced to
coordinate the efforts needed for this co-benefit.
438. Under the Ambient Air Quality Directives287
, Member States have to comply with
air quality standards for a number of pollutants harmful for human health,
including limit values for nitrogen dioxide and particulate matter (PM10 and
PM2.5). In over 130 cities located in a majority of Member States, limit values for
one or more of these pollutants have been exceeded for many years, with
significant consequences for public health and the economy. Specific measures are
not prescribed, although an increasing number of cities have turned to SUMPs
which can contain different measures focusing on various aspects of urban
mobility, with urban vehicles access regulations (UVARs) being one of them.
Figure 26: Annual mean NO2 concentrations observed at traffic stations, 2017288
Source: European Environment Agency.
287 Directive 2008/50/EC of the European Parliament and of the Council of 21 May 2008 on ambient air quality and cleaner air for
Europe, OJ L 152, 11.6.2008, p. 1; and Directive 2004/107/EC of the European Parliament and of the Council of 15 December 2004
relating to arsenic, cadmium, mercury, nickel and polycyclic aromatic hydrocarbons in ambient air, OJ L 23, 26.1.2005, p. 3. 288 The figure shows the annual mean concentrations of nitrogen dioxide (NO2) observed at traffic stations in 2017. Source: https://www.eea.europa.eu/data-and-maps/indicators/exceedances-of-air-quality-objectives-7/assessment-2

108
Figure 27: Percentile 90.4 of daily mean PM10 concentrations observed at traffic stations,
2017289
Source: European Environment Agency.
Figure 28: Annual mean PM2.5 concentrations observed at traffic stations, 2017290
Source: European Environment Agency.
289 The map shows the Percentile 90.4 of daily mean PM10 concentrations at traffic stations. This represents the 36th highest value
in a complete series. It is related to the PM10 daily limit value, which allows 35 exceedances of the 50 µg/m3 threshold over a 1-
year period. Dots in the last two colour categories indicate stations with concentrations above this daily limit value. Only stations for
which more than 75 % of data are valid have been included in the map. Source: https://www.eea.europa.eu/data-and-
maps/indicators/exceedances-of-air-quality-objectives-7/assessment-2 290 The figure shows the annual mean concentrations of particulate matter (PM2.5) observed at traffic stations in 2017. Source: https://www.eea.europa.eu/data-and-maps/indicators/exceedances-of-air-quality-objectives-7/assessment-2

109
4.1.3.1 Urban vehicle access regulations
439. In recent years, more and more European cities have started to introduce different
kinds of Urban Vehicle Access Regulations (UVARs) to pursue a variety of policy
objectives ranging from air quality to liveability and infrastructure optimisation.
440. Regulating vehicle access to cities should be part of integrated mobility policies:
Sustainable Urban Mobility Plans (SUMPs) should, whenever applicable, cover
also the question of UVAR. In order to support cities in better grasping this aspect,
a dedicated guide on UVARs was published in October 2019 within the revised
guidelines on SUMPs.291
441. While urban mobility is largely a matter of national and local competence, the
diversity of UVARs, in particular low-emission zones (LEZs), has posed new
challenges for passenger and freight transport by creating obstacles to the seamless
mobility of vehicles across the EU. If access of private cars to cities is to be
restricted, doing it on a more harmonised or coordinated basis seems to be
necessary, given that at present more than one quarter of the overnight trips carried
out by EU residents in 2017 were abroad (the vast majority of which were in
another EU Member State), and in two-thirds of the cases by car. It is clear that
there is a need for better coordination across Member States despite the different
EU policy initiatives and as shown by studies292
that have addressed UVARs at EU
level over the past years.
442. The lack of harmonisation or transparency has been the basis of concerns
expressed by some stakeholders for example in relation to the availability of
information online and in foreign languages, the difficulties for foreign drivers in
particular to comply with the rules and issues related to enforcement, the level of
fines, or the lack of provision of sustainable alternatives such as public transport.
There are also concerns relating to different rules for access of domestic and
foreign vehicles. On the other side of the argument, some cities report that existing
UVARs are often not fully respected, sometimes also noting problems in enforcing
fines. At the same time, it should be possible to use a comparable methodology for
vehicles from all EU countries, which could remove the need for registration of
vehicles that comply with the LEZ-criteria, and thus reduce the administrative
burden for foreign vehicle owners and city administrations.
443. There are different types of UVAR. Low Emission Zones restrict access by the
most polluting vehicles to a specific area within a city. The Commission is
currently aware of over 300 low-emission areas.293
Designating a certain area as a
LEZ or environmental zone can result in a substantial decrease of emissions within
the LEZ and therefore are a tool to reduce air pollution in cities. Often LEZs are
implemented where and when EU air quality standards are breached294
.
444. There are also congestion charging schemes, different types of parking regulations,
and a growing trend towards other traffic restriction schemes, such as Low Traffic
Neighbourhoods, roads which offer priority to cyclists or pedestrians, or pedestrian
only zones. The Commission has received fewer concerns about such schemes.
291 https://www.eltis.org/sites/default/files/uvar_brochure_2019-09-26_digital_version_v2.pdf 292 Including the UVAR study from 2017, the 2009 Action plan on urban mobility and the 2009 ARS study 293 A map of the existing low-emission zones is available here. 294 As defined in the Ambient Air Quality Directive 2008/50/EC

110
4.1.3.2 Walking, cycling and micromobility
445. Active mobility modes such as walking and cycling are low-cost and emission-free
forms of mobility, and thus the most sustainable ones. Together with public
transport, new shared mobility and micromobility solutions they have a great
potential to reduce local CO2, air and noise emissions, improve human health, as
well as congestion and pressure on valuable urban space and infrastructure295
.
However, as with other forms of mobility, attention always needs to be paid to
those persons with disabilities or reduced mobility that cannot always participate
on those active mobility modes on an equal basis with others.
446. Ensuring that walking and cycling are safe, accessible and attractive encourages a
reduction in the number of unnecessary car trips, especially in cities. Regular
walking and cycling can also help to reduce the incidence of major non-
communicable diseases (such as cardiovascular diseases, diabetes,
overweight/obesity, cancer296
) due to more physical activity. Physical inactivity
and sedentary lifestyles are one of the main driving causes of the rise in these
diseases. Walking and cycling therefore contribute to reducing the significant
pressure on health care and social protection systems and have also direct
economic gains with effects on commercial activity and shifts local expenditure
towards more local business297
. Nevertheless active mobility also needs to be made
safe – 70% of road fatalities in urban areas are to walkers, cyclists (as well as
motorcyclists and other vulnerable road users) and many more are seriously
injured. So the allocation of the public space for mobility in cities needs to be
addressed. Segregated walking and cycling infrastructure is effective in
encouraging active mobility and ensuring its safety, and where active mobility
mixes with motorised traffic in cities, reducing speeds e.g. to 30 km/h, has been
recommended in the Stockholm Declaration of the Third Global Ministerial
Conference on Road Safety in February 2020298
. Returns to investment from
building safe footpaths and road crossings, bike lanes and bike parking are in any
case substantial.
447. Congestion in urban areas is one of the biggest issues, with huge negative social,
environmental and economic impacts. Measures improving walking and cycling
conditions can reduce congestion in cities. For example, pedestrianisation
improves mobility and accommodates more people during rush hours (Dublin),
cycling improvements lead to 45% less car traffic and faster public transport
(Copenhagen) or cycle highway network reduces the need for 50 000 car trips daily
(Ruhr area)299
. The EU-funded CIVITAS FLOW300
project identified a broad set of
benefits from more walking and cycling.
448. So due to the range of co-benefits that can be generated, cycling and walking
therefore contribute to fulfilling objectives in a number of EU policy areas, in
particular: reducing congestion in transport and mobility; low carbon development;
innovation and technology; air pollution; industrial competitiveness and economic
growth; environment and climate change; human health; local development and
cohesion; equity and accessibility; and sustainable tourism.
295 International Transport Forum, 2020, Good to Go? Assessing the Environmental Performance of New Mobility https://www.itf-
oecd.org/good-to-go-environmental-performance-new-mobility 296 The Commission is currently working on the Europe’s Beating Cancer Plan. 297 Research has shown that improving conditions for active mobility can increase retail sales by 30%. Moreover, people who walk
to shopping areas can spend up to 40% more and retail vacancies can be up to 17% lower after improvements to make these areas
more walkable. Transport for London, 2019, http://content.tfl.gov.uk/walking-cycling-economic-benefits-summary-pack.pdf 298 https://www.roadsafetysweden.com/contentassets/b37f0951c837443eb9661668d5be439e/stockholm-declaration-english.pdf 299 FLOW, 15 Quick Facts for Cities, http://h2020-flow.eu/fileadmin/user_upload/Deliverables/15_quick_facts_eng_FINAL.pdf 300 http://h2020-flow.eu/

111
449. Walking is the most inexpensive mode of transport. Consequently, ensuring that
there are safe accessible and attractive conditions for walking is key. Almost every
public transport trip starts or ends with at least a short walk. Research indicates that
the reach of the existing public transport system can be extended significantly
simply by making walking to and from hubs and stops easier, less prone to barriers
and more pleasant by creating attractive urban spaces that are well connected to
public transport infrastructure301
. According to a recent Eurobarometer survey, just
over four in ten (42%) use walking as their mode of transport or in combination
with the main mode.302
According to the estimates of Walk21 Foundation, the
economic benefits of walking amount to more than EUR 250 billion – 40% of it
due to improved mental and physical health. Research at a city level points to
regular walking leading to a 14% reduction in the risk of mortality compared to
those who do not regularly walk, with substantial economic benefits as well303
.
450. According to the estimates of the European Cyclists’ Federation, the economic
benefits of cycling in the EU are very substantial and amount to more than EUR
150 billion per year304
, including EUR 6.5 billion environmental benefits, with
health benefits providing the lion’s share of the rest.
451. When it comes to EU policy, the 2011 Transport White Paper acknowledged the
importance of promoting cycling as an alternative to car use. The White Paper also
acknowledged the importance of cycling in delivering clean and sustainable urban
mobility and of cycling as an integral part of the urban transport system. In the
Commission’s 2016 Strategy for Low Emission Mobility, active travel, i.e.,
walking and cycling was promoted as a local action by cities to be encouraged,
enabled and embedded into Sustainable Urban Mobility Plans (SUMP) in enabling
and encouraging cycling. Support for the development of SUMPs was one of the
main elements of the Commission’s 2013 Urban Mobility package, with urban
logistics, access restrictions, urban road user charging and the deployment of
Intelligent Transport Systems (ITS) also interacting with cycling. Beyond urban
areas, EuroVelo305
, the network of 17 long-distance cycle routes is an important
contributor to the cycle tourism industry in Europe306
, and in parallel, EPaths has
the potential to make a similar contribution to the walking tourism industry. The
overall contribution of cycling and walking to tourism revenues is valued at more
than EUR 176 billion.
452. The importance of cycling has been recognised by Member States307
as well: in
2018, the EU’s Transport and Environment Ministers met in Graz, Austria, to
Research has shown that improving conditions for active mobility can increase retail sales by 30%. Moreover, people who walk to
shopping areas can spend up to 40% more and retail vacancies can be up to 17% lower after improvements to make these areas more
walkable. Transport for London, 2019, http://content.tfl.gov.uk/walking-cycling-economic-benefits-summary-pack.pdf 302 https://www.roadsafetysweden.com/contentassets/b37f0951c837443eb9661668d5be439e/stockholm-declaration-english.pdf 302 FLOW, 15 Quick Facts for Cities, http://h2020-flow.eu/fileadmin/user_upload/Deliverables/15_quick_facts_eng_FINAL.pdf 302 http://h2020-flow.eu/ 302 While some effects can be relatively easily quantified and assessed within a cost-benefit analysis (CBA) framework, others are
much more difficult, such as better quality of life. These benefits also vary based on the local conditions. The FLOW project
captured the various benefits into a dedicated FLOW Impact Assessment Tool. https://civitas.eu/tool-inventory/flow-impact-assessment-tool
https://www.researchgate.net/publication/332710219_Evaluation_of_walking_level_health_and_economic_benefits_by_europe_hea
lth_economic_assessment_tool_for_walking_heat_-_for_walking 304 ECF, The benefits of cycling. https://ecf.com/what-we-do/cycling-economy/economic-benefits 305 www.eurovelo.com 306 Source: ECF 307 An informal Transport Council held under the Luxembourg Presidency in 2015 recognised cycling as being a climate-friendly
mode of transport. The Luxembourg declaration called for the Commission to take action to integrate cycling into multimodal
transport policy, including smart mobility; develop an EU level strategic document on cycling; and set up a European focal point for cycling to serve as a one-stop-shop for relevant questions and facilitate exchange of best practices.

112
discuss pathways leading to clean mobility. They adopted the “Graz
declaration”308
, which includes acknowledging cycling as an equal mode of
transport, developing a European strategic and supportive framework to promote
active mobility, and integrating active mobility in the current and future European
funding and financing schemes. A recent joint statement by the Benelux countries
stressed the importance of cycling and the urgent need for stimulating bicycle use
as a necessary, safe and healthy alternative in (urban) mobility. Many stakeholders
see a need for a more strategic, EU-level approach to be taken to enable and
promote cycling in the EU309
.
453. In order to develop the full potential of the active modes of transport, cycling and
walking have to be taken seriously in urban mobility policies, including in
transport planning, allocation of space and budgets. According to a 2020
Commission working paper, walking and cycling perform well in cities with dense
road networks, higher densities and fewer steep slopes310
. While many cities have
been rediscovering them as the ideal urban mode of transportation and have gone a
long way in promoting their use in recent years and months, their full potential is
still untapped in many places. While about 17 % of the EU population
stated in a 2019 Eurobarometer survey311
that they use bicycle or scooter
as their primary mode of transportation, there are huge differences in cycle use
across the continent.
454. The full potential of cycling and walking in delivering a more sustainable and
resilient urban mobility needs to be recognised and supported by key trip
destinations including public transport operators, schools and universities, retailers,
hospitals, and leisure centres. Employers in general can encourage better employee
health through active mobility. Promotion campaigns and workplace schemes,
supported by the necessary infrastructure investment, to make walking and cycling
easier and more attractive have been shown to enable healthier communities,
reduce absenteeism and improve overall employee wellbeing and increased
productivity.
http://www.eu2015lu.eu/en/actualites/communiques/2015/10/07-info-transports-declaration-velo/07-Info-Transport-Declaration-of-
Luxembourg-on-Cycling-as-a-climate-friendly-Transport-Mode---2015-10-06.pdf At the 2016 Informal Meeting of EU Ministers responsible for Urban Matters Within the EU, the ‘Pact of Amsterdam’ was established and noted that cycling was one of the
elements to be focused on in delivering sustainable and efficient urban mobility.
https://ec.europa.eu/regional_policy/sources/policy/themes/urban-development/agenda/pact-of-amsterdam.pdf 308 https://www.eu2018.at/latest-news/news/10-30-Graz-Declaration.html 309 The European Cyclists’ Federation (ECF), supported by a number of other organisations, developed its own strategy and set of
recommendations in 2017 310 Poelman, H. Dijkstra, L. and Ackermans, L. (2020): How many people can you reach by public transport, bicycle or on foot in
European Cities? Measuring urban accessibility for low-carbon modes. Regio Working Papers 01/2020. 311 Special Eurobarometer 495 https://ec.europa.eu/commfrontoffice/publicopinion/index.cfm/survey/getsurveydetail/instruments/special/surveyky/2226
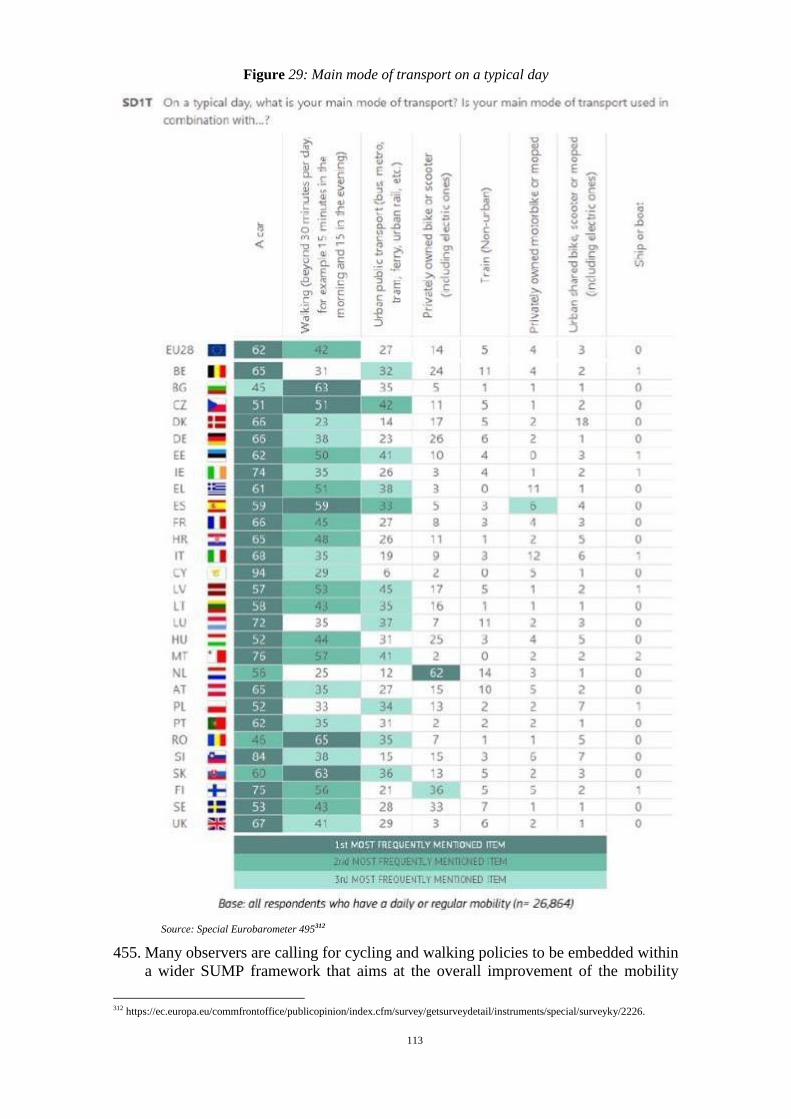
113
Figure 29: Main mode of transport on a typical day
Source: Special Eurobarometer 495312
455. Many observers are calling for cycling and walking policies to be embedded within
a wider SUMP framework that aims at the overall improvement of the mobility
312 https://ec.europa.eu/commfrontoffice/publicopinion/index.cfm/survey/getsurveydetail/instruments/special/surveyky/2226.

114
system of a town or city. In order to support towns and cities in this task, the
Commission issued in 2019 Guidance on cycling projects in the EU313
, a resource
that enables users to identify the most relevant information for their situation. In
addition, the SUMP guidelines revised in 2019 include, for the first time, dedicated
annexes on supporting and encouraging walking314
and cycling315
in sustainable
urban mobility planning.
456. The sharing of limited space for mobility in cities can lead to conflicts between
transport users, in particular where the use of sustainable modes of transport like
cycling and walking and new forms of micromobility are being promoted.
Currently, 38% of road fatalities in the EU occur in urban areas, 70% of which are
vulnerable road users (pedestrians, cyclists and motorcyclists). To avoid such
tensions, the objectives of sustainability and safety need to be brought together
from the outset. It is important that urban mobility planning in cities that aims to
make transport cleaner and more sustainable seeks at the same time to make it
safer. Among the key measures to address this concern is investment in safe
cycling and walking infrastructure in cities while at the same time managing car
use and introducing lower default speed limits.
457. It is only if actual and perceived safety is high that more people will choose to
walk and cycle. Fear of sharing the road with dense motorised traffic is a primary
reason that puts people off from cycling (and to lesser extent walking). To support
local authorities and stakeholders in that regard, the revised SUMP guidelines
include also a dedicated guide on urban road safety and active travel in sustainable
urban mobility planning316
.
313 https://ec.europa.eu/transport/themes/urban/cycling/guidance-cycling-projects-eu_en 314 https://www.eltis.org/sites/default/files/supporting_and_encouraging_walking_in_sumps.pdf 315 https://www.eltis.org/sites/default/files/supporting_and_encouraging_cycling_in_sumps.pdf 316 https://www.eltis.org/sites/default/files/urban_road_safety_and_active_travel_in_sumps.pd_.pdf According to experts, efforts to improve facilities for cyclists in Paris are showing impressive results. The mayor’s office published
statistics early 2020 showing that bicycle use in both the centre of Paris and the suburbs rose by 54% in one year following a
considerable increase in cycle lanes, many of them separated from motorised traffic. That is still well below the total for car trips of
14.8 million, but car trips are down 5% since 2010. Research shows the most common reason for cycling is commuting by bike.
That also explains why money has been invested in the so-called RER-V cycle network, which aims to expand cycle paths outside
the ‘Péripherique’ Paris ring road so cycling to work is a viable option for people in the suburbs.

115
Figure 30: Percentage of road fatalities on urban roads in the EU by transport mode, 2018
Source: CARE database317
458. Micromobility represents a potentially huge global market and key players
(regulators, industry, consumers) need to work closely together to make it a
success. Micromobility is also widely praised for its potential to reduce congestion,
yet the jury is out whether it replaces or complements public transport by covering
primarily first/last mile trips. Cities – and other regulators – play a key role in
authorising or banning operators and in defining conditions under which the
service can be provided. They also play a role, together with public transport
companies, to enable synergies with shared micro-mobility options.
459. These new personal mobility devices, in particular shared e-scooters, which were
deployed in large numbers in cities all over Europe, also raise a number of safety
concerns – some related to the safety of the devices themselves (e.g. their centre of
gravity, brakes, lights), some to their safe use (e.g. use on pavements and cycle
paths, helmets).
460. Differences between the rules that apply, often even within a Member State, make
it difficult for visitors to follow local rules correctly, and hamper the business of
sharing scheme operators that wish to operate in more than one country. Shared or
not, micro-mobility vehicles need to operate in a regulatory framework that defines
where they can be used (e.g. roads, bike lanes, pavements, pedestrian areas, 30 kph
areas), at what speed, after which training, as of what age and in compliance with
which safety rules (e.g. protective equipment, lights, turn signals, etc.).
4.1.3.3 Public transport, shared mobility and transport on demand
461. Urban transportation is a dynamic system where one component impacts on the
other. Users, through their modal choices, are influencing the development of the
urban transport system. One of the main challenges that cities face is mitigating the
vicious cycle triggering an increased reliance on the private conventionally fuelled
car in particular. There is a positive correlation between cities that have achieved a
high share of public transport usage and reduced congestion. However, continuous
investments backed by a long term strategy and density to stabilize demand are 317 https://ec.europa.eu/transport/road_safety/specialist/statistics_en

116
needed. It is equally needed to create the right conditions for public transport to
flourish, such as, for example congestion charging or parking management.318
462. According to a 2020 working paper by DG REGIO319
, in virtually all European
cities analysed, at least 80 % of the population has easy access to public transport.
In addition, 56 % of an average city’s population has access to at least 10
departures an hour. Access to high-frequency departures is generally higher in
cities with at least 1 million inhabitants and considerably lower in cities with fewer
than 250 000 inhabitants, although there are some exceptions.
463. There is room for improvement of accessibility of public transport. A comparison
between the population accessible by public transport with the nearby population
in 42 European cities shows that within 30 minutes people can only reach 24 % of
the population living within a distance of 7.5 kilometres.320
464. According to the latest EC survey on Quality of Life in European Cities321
, across
the surveyed cities, the share of public transport users varies from less than 30 % to
slightly more than 60 % and this share increases with city size. In most countries,
the share of public transport use is highest in capital cities, in part because these
cities tend to have an extensive public transport network with frequent services.
465. A high use of public transport and satisfaction with public transport go hand in
hand, as on average three out of four city residents are satisfied with public
transport, and a positive relation is seen between public transport satisfaction and
satisfaction about living in a city. Out of key aspects of public transport:
affordability, safety, accessibility, frequency, and reliability of service, public
transport frequency is found to be the largest driver for users’ satisfaction322
.
Public transport plays a key role in connectivity and provides ample economic
opportunities, with many quality local jobs that are impossible or hard to
delocalise. Urban and suburban public transport services carry approximately 185
million passengers on an average working day across the EU, providing the
backbone of urban mobility in many EU cities. The public transport sector alone
employs around 2 million people in the EU, being a very important employer in
almost every city, and the economic value of public transport services are
estimated at EUR 130 - 150 billion per year323
.
466. Public transport is one of the most cost-efficient way to decarbonise people’s daily
mobility. It is also one of the safest ways to move people around, and in a
sustainable manner. Its social aspects should not be underestimated, neither: it
provides a relatively affordable mobility option for a large part of the population
contributing to enhancing connectivity. As it brings people together, it plays
important role in social cohesion and local development, too.
318 Alonso Raposo, M. (Ed.), Ciuffo, B. (Ed.), Alves Dies, P., Ardente, F., Aurambout, J-P., Baldini, G., Baranzelli, C., Blagoeva, D., Bobba, S., Braun, R., Cassio, L., Chawdhry, P., Christidis, P., Christodoulou, A., Corrado, S., Duboz, A., Duch Brown, N.,
Felici, S., Fernández Macías, E., Ferragut, J., Fulli, G., Galassi, M-C., Georgakaki, A., Gkoumas , K., Grosso, M., Gómez Vilchez,
J., Hajdu, M., Iglesias, M., Julea, A., Krause, J., Kriston, A., Lavalle, C., Lonza, L., Lucas, A., Makridis, M., Marinopoulos, A., Marmier, A., Marques dos Santos, F., Martens, B., Mattas, K., Mathieux, F., Menzel, G., Minarini, F., Mondello, S., Moretto, P.,
Mortara, B., Navajas Cawood, E., Paffumi, E., Pasimeni, F., Pavel, C., Pekár, F., Pisoni, E., Raileanu, I-C., Sala, S., Saveyn, B.,
Scholz, H., Serra, N., Tamba, M., Thiel, C., Trentadue, G., Tecchio, P., Tsakalidis, A., Uihlein, A., van Balen, M., Vandecasteele, I., (2019). The future of road transport - Implications of automated, connected, low-carbon and shared mobility, EUR 29748 EN,
Publications Office of the European Union, Luxembourg, ISBN 978-92-76-14318-5, doi: 10.2760/668964, JRC116644.
https://ec.europa.eu/jrc/en/publication/eur-scientific-and-technical-research-reports/future-road-transport. 319 Poelman, H. Dijkstra, L. and Ackermans, L. (2020): How many people can you reach by public transport, bicycle or on foot in
European Cities? Measuring urban accessibility for low-carbon modes. Regio Working Papers 01/2020. 320 Ibid. 321 European Commission (2020), Report on the quality of life in European cities 2020, Publications Office of the European Union:
Luxembourg. 322 Ibid. 323 UITP

117
467. When it comes to reducing congestion, a full standard bus carries the same number
of people as 40 cars while a full metro set carries the equivalent of 600 (assuming
current average occupancy rates for cars). In addition to traffic reduction, it frees
up space otherwise used for parking in dense urban areas.
468. Public transport, being normally linked with active mobility, contributes positively
to public health policies by improving health of individuals, in particular in urban
areas. According to a recent research study, compared with commuting by private
motorised vehicle, rail commuters had a 10% lower rate of all-cause mortality and
a 21% decreased rate of cardiovascular disease mortality, in addition to a 12%
reduced rate of incident cancer324
.
469. Public transport and especially light rail provides low-emission affordable mobility
with limited need for public space. However, procurement of light rail, like tram
and metro, remains extremely costly due to the very high customisation and the
absence of EU interoperability standards. More ‘off the shelf’ products and joint
procurement would lead to costs reductions and thereby more attractive mass
transport market.
470. A dynamic, sustainable and safe local passenger transport on demand is also part of
the solution to the challenges cities face today. Things have changed in recent
years, mainly thanks to digital technology and the emergence of intermediation
platforms. The right solutions to ensure that passenger transport on demand can
deliver efficient services to citizens, while taking into account environmental and
social concerns including working conditions of drivers. In 2016, the Commission
adopted its communication “A European agenda for the collaborative economy325
”,
has already provided some useful guidance in this regard, but there is clearly need
for further clarity. The related issues are further discussed in section 4.3.5.
4.1.3.4 Urban logistics
471. Urban logistics is an integral part of urban mobility. It is a fast-developing industry
paramount for the growth of the cities’ economic activities, but it is a significant
contributor to congestion, pollution as well as to road accidents. For instance, in
Europe it is responsible for 25 % of urban transport related CO2 emissions and 30-
50 % of other transport related pollutants. In addition a growing urban population
combined with other trends such as e-commerce and home delivery together with
an ageing population will lead to an increase in demand for goods and services
with a consequent increase in urban freight demand.
472. Hence a special consideration to Sustainable Urban Logistics Planning (SULP) is
needed326
. This is of high relevance for cities as urban logistics planning is a
complex process. There is significant potential to improve operations and services,
and captive fleets, such as mail delivery vehicles and refuse collection vehicles,
can be well suited for the early introduction of new types of vehicles, alternative
fuels and safety technology to reduce emissions and safety risks.
473. Thanks to the Directive on the deployment of alternative fuels infrastructure327
, to
CO2 emission performance standards for cars and light- and heavy-duty vehicles328
324 https://www.thelancet.com/journals/lanplh/article/PIIS2542-5196(20)30079-6/fulltext 325 COM (2016/0356 final 326 A dedicated topic guide in the context of SUMP was published in October 2019.
https://www.eltis.org/sites/default/files/sustainable_urban_logistics_planning_0.pdf 327 Directive 2014/94/EU 328 Regulation (EU) 2019/631 and Regulation (EU) 2019/1242

118
and to the Clean Vehicles Directive329
, the key elements of the regulatory
framework to promote sustainable alternative fuels and zero- and low-emission
vehicles are now in place. This framework is complemented by platforms for
exchange of best practice like CIVITAS and ELTIS as well as EU financial
support.
474. Multimodal integration of urban logistics, including the use of zero and low
emission vehicles, urban rail and inland navigation is important. It can create a
reliable and safe alternative to road only solutions, making better use of the
available infrastructure and services, thus contributing to a strong, resilient and
integrated transport system. Smaller suburban hubs or depots can avoid operations
of several delivery services on the same routes by an effective use of common
package stations. The last mile delivery in the city centres can then be transformed
into cleaner modes such as electric vehicles, cargo bikes330
or zero emission inland
vessels.
475. Urban and regional freight services have seen significant innovation through the
deployment of real-time smart logistics information and tracking networks,
warehouse automation, a growing fleet of electric delivery vehicles and the
emergence of sustainable micro-distribution by cargo bikes or other micro-
vehicles, including, potentially, drones. While digital solutions have already been
in use for some time, next steps include the sharing of data and information to
consumers, retailers and distributors to squeeze efficiency from the system.
Furthermore data collection and sharing of data are pivotal areas for reinforced
cooperation as well as that of working on common indicators for urban logistics.
4.1.4 Multimodality and modal shift
476. The European Green Deal states that: “Multimodal transport needs a strong boost.
This will increase the efficiency of the transport system. As a matter of priority, a
substantial part of the 75% of inland freight carried today by road should shift
onto rail and inland waterways”.
477. ‘Multimodality’ in the transport sector, or "multimodal transport" refers to the use
of different modes (or means) of transport on the same journey. The concept
applies to both freight and passenger transport and in both cases can now be driven
on by the growing trend towards digitalisation. Multimodality takes advantage of
the strengths of the different modes, such as convenience, speed, cost, reliability,
predictability, and in combination, can offer more efficient transport solutions for
people and goods which will help ease the pressure on our congested transport
infrastructure, and make the whole sector more environmentally friendly, safer,
and cost efficient.
478. The whole EU would benefit from a more resource-efficient transport system, in
particular one that better optimises the combined use of soft modes, individual
road, collective road and rail as well as longer-distance air transport for passengers,
and rail, waterborne and road transport for freight. Multimodality can provide an
attractive and efficient alternative to private car ownership and transport by lorries.
However infrastructure, tools and incentives for multi-modal connectivity are still
limited and vary widely between Member States and regions. Multimodal transport
329 Directive 2009/33/EC 330 The KoMoDo project in Berlin involved cargo bikes being used for the last-mile delivery of packages. 28,000 kilometres of
journeys by vans have been avoided as a result. Districts are now putting the experience obtained here to use in similar projects. https://www.berlin.de/sen/uvk/en/traffic/transport-planning/cycling/

119
is hindered also by administrative barriers and excessive complexity due to
differences in sectoral and modal legislations at both the EU and national levels.
479. To understand the current role each transport mode plays in the EU-27 for freight,
it is worth noting that the modal split has not significantly changed since 2008. For
the external trade of the EU in 2018, maritime transport was the predominant
mode, representing 46.7% of the value of exports and imports, followed by air
transport (20.6 % and road transport (20.4%). For intra-EU trade, maritime
transport counted for 29.2 % of the modal split in 2018 (2008: 25.9 %), whereas
road transport represented half of the modal split for freight in 2018 (51%, slightly
less than in 2008). The modal share of rail freight transport has decreased
marginally from 13.2% in 2008 to 12.6% in 2018. The (low) share of inland
navigation in the modal split for freight slightly decreased from 4.6% to 3.9 %
during the same period.331
480. For passenger transport in the EU-27, cars remain the dominant mode of transport,
with a share of 71.7 % in 2018 (2008: 72.6%). Intra-EU aviation has expanded its
modal share from 7.1 % in 2008 to 9.6 % in 2018 and is thus ahead of buses and
coaches (8 % in 2018) and railways (6.9% in 20178.332
481. Looking at land transport only, the passenger car dominates within the EU-27, with
a share of 78 % in 2008 and 80 % in 2018. Throughout the same period, the rail
mode share rose from 7.3% to 7.7 % and tram and metro mode share rose from
1.6% to 1.7%. Bus and coach share instead fell from 10.3% to 9 %. Looking at
each country, the figure below shows that in 2018 Austria, the Netherlands and
France were the only countries where rail had a share of more than 10%. Between
2015 and 2018, the rail modal share increased333
the most in Poland, Czechia,
Austria and Estonia and decreased the most in Denmark, Hungary and Croatia
(change in percentage points).
331 Source: European Commission (2020): EU Transport in Figures. Statistical Pocketbook 2020. Air and Sea: estimates; only
domestic and intra-EU-28 transport. Road: national and international haulage performed by European drivers within the EU
territory. 332 Ibid. 333 Based on Eurostat modal shares data, which includes passenger cars; trains; and motor coaches, buses and trolleys

120
Figure 31: Passenger land transport modal split by country (%, 2018) and change in
percentage points for rail (2015-2018)334
Source: Eurostat and statistical pocketbook 2020.
482. According to a detailed analysis of rail passenger services by DG REGIO, rail
transport performance is widely disparate across the European Union335
. While
cities consistently perform better than towns, suburbs and rural areas in all
countries, there are also cities with no rail services during peak travelling hours.
483. Analysis shows that improving the offer of high-speed rail services would provide
passengers with an alternative to short-haul flights. In particular where high-speed
rail services can be linked to form an attractive offer with long distance flights (e.g.
Paris, Frankfurt, Amsterdam), this could not only reduce CO2 emissions compared
to short-haul feeder flights, but also free up scarce airport capacity and avoid
maintaining unprofitable air routes. This would however require investments into
improving the access of high-speed rail to airports.
334 2011 data for EU 27 as shown in
COM(2019) 51 final https://ec.europa.eu/transport/sites/transport/files/staff_working_document_-_6th_rmms_report.pdf 335 https://ec.europa.eu/regional_policy/sources/docgener/work/032020_rail_transport_performance.pdf

121
Figure 32: Air routes between metropolitan regions where rail travel times are below 2.5
hours by train
Source: EBP work for the European Commission

122
Figure 33: Air routes between metropolitan regions where rail travel times are below 4
hours by train
Source: EBP work for the European Commission
484. Improving the offer in high-speed services is not only a question of providing
adequate infrastructure but also of offering cheaper and more flexible and reliable
rail services: market opening under the Fourth Railway Package will allow railway
undertakings other than the national incumbent to offer services on any line in the
EU (with exceptions to protect the viability of public service operations) from
December 2020. However, international passenger services, including long-
distance services and night trains, face the following problems336
:
Traffic planning and management is often insufficiently coordinated by
infrastructure managers and authorities across borders;
Access to rail service facilities, ticket sale and real-time travel information
during the journey can be difficult because not ensured seamlessly and across
service providers;
336 These issues will be discussed in depth in the sections that follow.

123
Technical interoperability, in particular the use of different power systems and
legacy signalling systems remains a challenge to cross-border service
provision. Unjustified differences in national safety and operating rules cause
obstacles to seamless transport.
Acquisition of rolling stock is challenging for new entrants due to the absence
of a well-functioning second had rolling stock market.
Different approaches to charging and taxation across modes result in
comparatively high prices for long distance passenger rail (rail infrastructure
use is charged per km and mark-ups tend to focus on longer distance
passenger rail as other market segments, such as, for instance, freight
transport are less able to bear mark-ups).
Market opening will turn high-speed services that complied with certain
publicly imposed requirements into hybrid services (partly open access, partly
PSO based), which may raise legal and financial challenges for competent
authorities and infrastructure manager.
485. Night trains could offer an interesting and more environmentally friendly
alternative to car and air travel and the political interest for the promotion of night
train services in Europe has gained traction. This market segment could be further
developed, either on a commercial basis (open access) or through tendered PSOs,
within the framework established in the Fourth Railway Package.
486. Bus and coach transport is a very efficient and affordable mode of transport, which
is able to complement rail transport in areas not benefitting from rail infrastructure
and for bringing passengers from and to multi-modal hubs. Moreover, it has the
potential of becoming zero emissions with the same technologies used for lorries.
However, despite these benefits, the modal share of bus and coach transport has
remained unchanged, while the use of passenger cars has kept increasing. The
Commission made a proposal337
to address this situation, through amendments to
Regulation (EC) No 1073/2009, but the proposal has not made progress in the
Council.
487. Article 20 of Regulation 1008/2008 allows Member States to limit or ban flights
when serious environmental problems exist, in particular when more sustainable
modes of transport provide appropriate levels of service. Several Member States
are considering such measures to contribute to the goal of climate neutrality. In
doing so, they will have to make sure that any such measures is non-
discriminatory, does not distort competition between air carriers and is not more
restrictive than necessary to relieve the problem. Such a measure cannot exceed
three years, after that it will have to be reviewed.
488. Key barriers to increased multimodality, in particular for passengers, can be
overcome by the solutions offered by digitalisation. These issues will be discussed
further in section 4.2.1.
489. Research and innovation will play a vital role to develop and validate new
solutions for an integrated transport system with seamless transfer between modes
and traffic management across sectors to ensure availability of efficient door-to-
door mobility solutions also in times of local disruptions (weather events, traffic
incidents etc.). Large scale demonstrations could help to validate better solutions.
337Proposal for a Regulation of the European Parliament and of the Council amending Regulation (EC) No 1073/2009 on common rules for access to the international market for coach and bus services [COM(2017)647].

124
4.1.4.1 Improving multimodal freight operations
490. Effective management of freight transport and logistics chains is a precondition for
EU industrial competitiveness and a more sustainable transport sector. Industry
depends on high-quality, efficient and multimodal logistics chains to organise the
transport of raw materials and goods across the EU and beyond.
491. While logistics is primarily a business-related activity, fragmented and
incompatible rules and standards can create considerable red tape and
inefficiencies to the logistics industry and affect also the competitiveness of
multimodal transport vis-à-vis road-only transport. Therefore, suboptimal
functioning of supply chains also results in higher transport emissions. The
industry is asking for a coherent EU approach to logistics and multimodal transport
that demands co-operation and co-ordination between different dimensions of
transport policy and beyond.
492. One key aspect of the efficient use of transport is a high load factor. For example,
road transport is known for having a share of empty runs of about 20%, which
obviously reduces the overall load factor. Part of these empty runs can be
explained by the use of dedicated equipment (e.g. lorries designed for milk
transport), which typically cannot carry return loads as well as by the necessary
empty driving when going to load cargo. But more often the reason is fragmented
markets where loads cannot be arranged for return journeys. For rail freight
transport, the share of empty wagons in single wagonload transport reported by
three major operators is in the range of 30 to 65 %338
, which is particularity striking
given increasing capacity constraints and expensive infrastructure. Consequently,
there is ample room to improve the load factors and it would provide an immediate
relief in congestion and decrease in CO2 emissions for each tonne transported.
Digitalisation of and transparency on available wagon load may play a key role.
493. The modal share of non-road hinterland freight was around 28% in 2018339
. (~6%
for IWT; 18.7% rail340
). The competitiveness of rail freight transport increases
proportionally to the distance. Consequently, around 50% of volumes are moved
across borders (compared to 6% of passenger traffic), giving the rail freight market
an obvious European dimension.
494. There are several factors inherent to intermodal transport that generate additional
costs for the operators and users (related to transhipment and additional transaction
costs) and other disadvantages such as longer delivery times, complexity, higher
risks and lower reliability. The figure below illustrates, based on cost data from the
2017 Survey study341
, the costs incurred by shippers when choosing intermodal
(rail-road) transport compared to road transport only. In addition, the rail freight,
short sea shipping and inland waterways sectors need to continue to adjust to the
changing characteristics of the market, where supply chain management is
expected to become more flexible and faster.
338 PWC et al. (2015) Study on Single Wagonload Traffic in Europe – challenges, prospects and policy options. Final report, July
2015, https://ec.europa.eu/transport/sites/transport/files/2015-07-swl-final-report.pdf 339 17.9 % rail ; 5.7% inland waterways; 4.4% pipelines. Source: European Commission (2020): EU Transport in Figures. Statistical
Pocketbook 2020 340 Figures do not include pipelines. https://ec.europa.eu/eurostat/statistics-explained/index.php?title=Freight_transport_statistics_-
_modal_split 341 TRT (2017) – Gathering additional data on EU combined transport – Final report

125
Figure 34 Cost level and composition of intermodal transport compared to road-only
transport
Source: European Commission342
495. Adequate conditions need to be created incentivising the industry to use intermodal
transport instead of road-only transport. The amendment of the only dedicated
instrument, the Combined Transport Directive, was proposed in 2017. However,
the positions of three institutions were far apart and, given a risk of ending up in a
situation in which the incentives for combined transport could be further
weakened, the Commission decided to withdraw the proposal. This means that the
support measures in force for combined transport remain insufficient and are out of
date.
496. The internal market for intermodal transport is poorly developed also due to lack of
transhipment infrastructure (terminals), inefficiencies due to variations in sectoral
legislation and the differences in technical norms and standards used by Member
States and between the modes.
497. First of all, infrastructure bottlenecks still exist and further work is needed both at
EU and Member States level as regards investments in cross-border infrastructure,
in particular the main corridors. The density and choice of type of multimodal
terminals and logistics hubs needs to take into account new trends and developing
needs of the industry, in particular in urban areas. The distances between rail/road
terminals on the TEN-T Core and Comprehensive networks are still well above
300 km in many regions; limiting the possibility of short (> 150km) road legs.
While the availability of terminals is mostly sufficient in Benelux, Germany,
Austria, Czechia and Slovakia, their density in Finland and in many Eastern-
European countries, as well as in some regions of Sweden, Italy, France and
Hungary is such that it is not possible to use intermodal transport. Improved
statistical data on combined transport flows would help to prioritise such
investments.
342
Commission Staff Working Document, Impact assessment, Accompanying the Proposal for a Directive of the European
Parliament and of the Council amending Directive 92/106/EEC on the establishment of common rules for certain types of combined
transport of goods between Member States, SWD(2017) 362 final

126
Figure 35 Intermodal terminals with rail access occurrence in Europe343
498. Second, multimodal freight transport activities are subject to various sectoral rules.
The range of legal instruments concerned is very broad, including the rules
applicable to vehicles (technical, safety, environmental norms and standards), to
personnel (e.g. professional qualifications, working time, posting of workers), to
services (market access) and goods (e.g. customs, provisions for dangerous goods).
At the same time, the prevalence of sectoral and modal approach has led to gaps
where e.g. no tailored approach exist at EU level for multimodal investment
projects either as regards state aid or for project assessment.
499. Quick implementation of comprehensive digital solutions would cut red tape and
lower the administrative burden deriving from different sectoral and national
requirements. Further digitalisation and solutions to data sharing are needed to
support efficient functioning of transport corridors. These are further discussed in
section 4.2.
500. EU transport policy aims to overcome barriers arising from a lack of coordination
of technical norms and standards between Member States and transport modes. For
example, the TEN-T Guidelines set common parameters for the length of trains.
EU legislation on rail interoperability and safety allows trains to operate under a
harmonised set of rules and the Commission is working with the EU Railway
Agency and Member States to ensure superfluous national rules are withdrawn. A
continued effort to ensure harmonised framework conditions is important to avoid
unnecessary costs for multimodal transport.
501. Finally, the lack of internalisation of the external costs of all modes continues to
penalise the competitiveness of intermodal transport vis-à-vis road-only transport.
In the absence of pricing mechanisms fully reflecting the ‘polluter pays’ principle,
343 Pastori et al. (2018) , Research for TRAN Committee – Modal shift in European transport: a way forward, European Parliament,
Policy Department for Structural and Cohesion Policies, Brussels https://www.europarl.europa.eu/RegData/etudes/STUD/2018/629182/IPOL_STU(2018)629182_EN.pdf
127
intermodal transport remains financially disadvantaged except on very long
distances of the order of magnitude of 600 km, unless public support is provided to
compensate for the uncovered external costs of competing modes.
4.1.4.2 Rail freight
502. Given the potential role of rail freight in the internal market, the EU adopted
legislation344
to open competition between rail freight service providers from 1
January 2007. In addition, eleven rail freight corridors have been established by
Regulation (EU) No 913/2010 to specifically support international rail freight
transport. The focus of the legislation was on fair and non-discriminatory
conditions for the provision and use of railway infrastructure.
503. In parallel to opening the rail freight market, the EU developed legislation on
railway interoperability with a view to reduce the technical, and operational
barriers to cross-border rail traffic, while reducing the impact on human health,
notably by setting noise limits. The technical pillar of the Fourth Railway Package
includes substantial elements both harmonising EU requirements for rail vehicles
and operations, and facilitating the clean-up and elimination of obstacles to
seamless rail services caused by redundant national rules. Taken together these will
reduce the cost of rail equipment and operations.
504. On the infrastructure side, diverging parameters, for example with respect to train
length and loading gauge, continue to pose a significant barrier to more efficient
freight operations.
505. Full deployment of ERTMS (the European Rail Traffic Management System) and
the harmonisation of respective operating rules at EU level will further reduce
costs and complexity for rail operators (since they will no longer need different
safety systems for each Member State), and in the medium term will allow
substantial cost savings to rail infrastructure managers and potentially major
capacity increases. In the short term however, it imposes locomotive upgrade costs
(hardware, training, testing and certification) on operators with already small profit
margins.
506. Despite the above mentioned measures, a number of issues continue to affect the
performance of rail freight:
507. Due to structural economic change, notably the declining importance of heavy
industry in the EU, the goods being transported have undergone profound change,
greatly reducing the freight flows where rail had a clear competitive advantage,
e.g. in the transport of mass commodities such as coal and iron ore. Rail freight is
less competitive for the increasing share of goods that require flexibility and more
reliability, such as high-value components moved between manufacturers as part of
complex supply chains and consumer goods.
508. For customers, rail freight’s attractiveness suffers from lack of punctuality,
reliability, predictability and flexibility. In the first quarter of 2018, the percentage
of freight trains delayed more than 3 hours reached 50% along the Alpine corridor.
In this context fits reference to efforts to reduce delays such as the agreement by
corridors, to reduce the maximum border crossing time to 2 hours, which passenger
trains manage mostly without dedicated border stops. In the Green Lanes upgrade
344 Directive 2004/51/EC of the European Parliament and of the Council of 29 April 2004 amending Council Directive 91/440/EEC on the development of the Community's railways
128
communication345
adopted on 28 October 2020, the Commission announced
continuous monitoring of schedule adherence and on time performance of rail
freight trains at border stations, including dwelling times.
509. Information on the composition of trains, location and expected time of arrival
(ETA), type of cargo and load factors etc. is scarce. Digital systems to plan, deliver
and monitor rail services are often national. A European digital layer is in
preparation, to a large extent on the basis of the technical specifications for
telematics applications for freight and passenger services (TAF and TAP TSI), but
it is not yet fully in place and use. In addition, capacity and traffic management is
generally not coordinated between rail infrastructure and service facilities such as
intermodal terminals. This hinders the ability to optimise the infrastructure, traffic
and fleet management from an end-to-end perspective.
510. The performance of single wagon freight is hindered by the need for wagons to be
manually coupled each time they are shunted – in spite of the fact that automated
couplers are in widespread use in the rest of the world (since the late 19th
century
in North America). To date the cost of transforming the EU wagon fleet and the
need to arrange a rapid migration at European level have prevented use of this in
the EU, but the potential of modern coupling systems (which would also permit
power and data transmission) means this issue needs to be urgently addressed.
Work on specifications for Digital Automatic Couplers is being carried out in
Shift2Rail Joint Undertaking with a view of incorporating it into the TSI.
511. Freight has usually a low priority both in capacity planning, i.e. when preparing
rail timetables, and in operational traffic management, i.e. during operations, in
case of delays. In addition, cross-border freight services often remain “trapped”
between different priorities set at national level, reducing their speed and reliability
for customers and resource productivity for operators.
512. Traditional rules for capacity allocation and management based on the definition of
a yearly timetable for individual train paths also hinder more market driven
business models. Rail is often unable to respond to short-notice requests for
services from freight customers, with new services requiring months of pre-
planning. Due to historical reasons and the prevalence of domestic traffic, such as
commuter and regional traffic, there is still a lack of capacity of adequate quality
available for cross-border freight traffic. This can be aggravated by lack of cross-
border coordination of traffic management but also works on neighbouring
networks, fragmentation and national orientation of IT tools used for capacity
planning and traffic management, or poor cooperation on issues such as charging
and performance. All of these issues have a clear network dimension and the
current lack of coordination hinders the achievement of a truly Single European
Railways Area.
513. Infrastructure managers seem to underemphasize their role as ‘traffic managers’ as
opposed to managing the rail infrastructure assets. In some Member States,
sophisticated schemes are in place to monitor and improve the state of the network
but the impact of infrastructure works for maintenance and renewal on traffic is
often not sufficiently taken into account. This is often caused by a lack of uptake of
digital tools and automation of infrastructure managers business processes.
345
COM(2020) 685 final Communication “upgrading the transport Green Lanes to keep the economy going during the COVID-19
pandemic resurgence”

129
514. Profitability in the rail freight sector remains low, limiting the motivation for
investment in new technologies and innovation or diversification of business areas
to support growth strategies. New operators have entered the market but operate
mostly in niches, serving specific corridors or industries. Many incumbent rail
freight operators are in chronic loss and rely on regular recapitalisation and/or
reorganisation to survive. Some market segments, like single wagon load and
combined transport, are highly subsidised – or have simply disappeared. Overall,
freight operators still have a way to go to better realise market potentials and to
optimise operations and business models. In addition, the absence of a level
playing field with other modes and high operational costs, e.g. for intermodal
transhipment and single wagon load, increase the challenge of finding a viable
business model.
515. Investments into infrastructure (at EU and national level) have not always
supported operational improvements and infrastructure maintenance works are not
duly coordinated across borders. Furthermore, in the event of incidents or
infrastructure works, it has been difficult to provide diversionary routes with
suitable characteristics (train length, gauge, axle load, etc.) even along the key axes
included in the Rail Freight Corridors (RFCs). This can deeply affect both rail
competitiveness and EU businesses. As an example, the total losses from the
Rastatt, Germany incident in August/September 2017, where a major freight line
was closed for 8 weeks, have been estimated at approximately EUR 2 billion346
.
516. The Regulation establishing the Rail Freight Corridors347
is currently under
evaluation. More efficient use of rail infrastructure capacity at the EU level would
be instrumental for making rail freight transport more competitive, both in
multimodal context and as a mode on its own. Stronger cross-border traffic
management cooperation, coordination and smooth operations suffering less
obstacles from redundant national rules remain a significant challenge for the
sector, which should be considered with the involvement and commitment of
Member States, infrastructure managers, infrastructure users and customers of
freight services.
517. Effective management of EU rail infrastructure is another important subject when
it comes to building a truly single European railway area. An important element is
the need to redesign the governance process for managing railway capacity so that
it enables rail freight operators to provide transport services in line with the needs
of their customers in terms of reliability, punctuality and flexibility. This requires a
management process that considers rail capacity in a continuous manner across all
planning and operational phases, and which is supported by state-of-the art digital
tools. Such an approach would overcome the current lack of continuity and
integration, creating a transparent link between the mid- to long-term capacity
needs expected by operators and customers, the planning of infrastructure works
restricting available capacity by infrastructure managers and the flexible,
discrimination-free allocation of capacity when concrete capacity needs are known,
including a short-notice allocation of train paths for spot traffic and in the event of
disruptions. In addition, experience with the Rail Freight Corridors has shown that
due to the prevalence of mixed-used lines in the EU railway network, a
comprehensive approach to capacity management – comprising both passenger and
346https://www.railfreight.com/corridors/2018/04/22/economic-damage-of-rastatt-incident-2-2-billion-euros/ ;
http://www.hupac.com/EN/Study-Rastatt-disruption-b26dcc00?MasterId=g1_3725 347 Regulation (EU) No 913/2010 of the European Parliament and of the Council of 22 September 2010 concerning a European rail network for competitive freight, OJ L 276, 20.10.2010, p. 22.

130
freight traffic – is currently absent and hinders optimal utilisation of network
capacity (see also section 4.3.2).
518. In order to implement such a novel governance approach in a harmonised and
effective manner, it may be necessary to provide for rules whereby, to an extent,
management of capacity takes place at a level beyond national borders. In some
cases, the most appropriate way to do so may be to strengthen the role and
competences of the existing rail freight corridors. In others, it may be more
efficient to coordinate or assign certain tasks and functions at the EU level. It is
necessary to thoroughly assess different options and to consider a possible revision
of the Regulation establishing the Rail Freight Corridors348
and, if necessary,
corresponding provisions of Directive 2012/34/EU establishing a single European
rail area.
4.1.4.3 Inland waterways
519. Inland waterway transport is particularly relevant for certain corridors, for instance,
current market characteristics show that for cross-border traffic within the Rhine-
Alpine Corridor, inland waterways have a share of 54%. This mode of transport is
especially important for some goods segments. In particular, inland navigation is
successful in conquering new market shares within the liquid cargo and container
segments: its modal share for chemicals and containers show the most potential for
further increase, at least since 2008. Waterways in the heart of main European
cities start playing an increasing role in the transport of people and the urban
distribution of consumer goods, building materials and waste which helps to reduce
traffic problems and emissions.
520. The successive NAIADES action plans contributed to largely maintaining the
modal share of inland waterway transport in the overall transport mix, despite an
economic crisis, changing markets, an imperfect governance framework and the
lack of dedicated funding. The work is not finished yet. Much remains to be done
to make better use of inland waterway transport and thereby create added value for
Europe. The current Naiades II programme ending in 2020 is addressing challenges
to be tackled to use the untapped potential of IWT to reach a more sustainable
transport system.
521. To make IWT an attractive, reliable and green mode of transport the crucial thing
is close cooperation with all relevant organisation at international and regional
level. A common approach is needed in relation to the future development of this
sector. Without an inland waterway transport agenda for Europe, there is the risk of
returning to fragmented and uncoordinated actions that hamper the EU Single
Market and result in more redundancies and barriers, deteriorating cross-border
traffic, widening the digital divide and jeopardising synergies. It would lead to a
declining role of inland waterway transport in the transport system. It would also
deprive our economy and society from the benefit of innovations resulting from
cooperation with other sectors.
348 Regulation (EU) No 913/2010 of the European Parliament and of the Council of 22 September 2010 concerning a European rail network for competitive freight, OJ L 276, 20.10.2010, p. 22.

131
4.1.4.4 Short sea shipping
522. When adding air and maritime transport to the inland modes, road still keeps its
leading position, followed by maritime transport. In 2018, road accounted for just
over half of all tonne-kilometres performed in the EU. Maritime transport came
next, with almost a third of the total transport performance, followed by rail
(13.0 %) and inland waterways (4.1 %). In terms of tonne-kilometres performed,
air transport plays only a marginal role in intra EU freight transport, with a share of
0.4 %.
523. However, the EU maritime industry is unable to fully benefit from internal market
in short sea shipping due to diverging national measures, including burdensome
non-harmonised reporting obligations at each port call. Better integration of
maritime transport in the entire logistic chain, as well as exploiting ancillary
maritime sustainability measures is needed. The new Regulation (EU) 2019/1239
establishing a European Maritime Single Window environment (EMSWe), once
implemented, can simplify fulfilling the reporting obligations, but considerable
efforts have to be undertaken for the implementation of the new regulation.
524. However, although the EMSWe regulation does not harmonise the measures by
Member States, it provides for the first time a complete overview of such measures
and establishes a notification obligation for new legislation for Member States,
posing a limit to the proliferation of data requests which create barriers to internal
market in short sea shipping. Furthermore, use of simplified digital procedures for
internal market operations would improve the competitiveness of short sea
shipping as compared to other modes of transport where no comparable obligations
exist on transport of goods between Member States.
525. This includes the issue of making certain information publicly available e.g.
Automatic Identification System (AIS) and actual time or arrival/departure. In this
regard, the EMSWe regulation provides that arrival/departure times of ships must
be made public available, allowing for better planning of cargo and vessel
movements, and for increased integration of all modes linked to and centred
around ports.
4.1.5 Better incentives to users
526. Currently, transport user do not give enough consideration to sustainability. People
need to be made aware of the environmental impact of their travel, purchases and
day-to-day mobility. In other words, the right incentives need to be put in place, in
addition to making each and every transport mode more sustainable and making
sustainable alternatives widely available.
4.1.5.1 Pricing and internalisation of external costs
527. As regards incentives, pricing instruments are powerful tools to green the transport
sector. Even though both the “polluter-pays” and the “user-pays” principles have
been on the EU agenda for a long time349
, today in the EU no mode fully pays the
349 For instance, the user pays principle is enshrined in the Treaties (Article 191 paragraph 2).
In its communication ‘Strategy for the internalisation of external costs’ (SEC(2008) 2207, accompanying COM(2008)435), the
Commission has laid down a common methodology to charge all external costs across the whole transport sector.
In the 2011 ‘White Paper Roadmap to a Single European Transport Area : Towards a competitive and resource efficient transport system’, the EC called for, i.a., “the full and mandatory internalisation of external costs for road and rail transport”
132
external and infrastructure costs they are directly350
responsible for351;352
(see also
above). This is a problem that the Commission has repeatedly highlighted and tried
to address: the pricing of transport services often does not cater for correct price
signals and thus prevents an economic effective resource allocation as well as a fair
burden sharing among users, polluters and society as a whole. In turn,
internalisation of external costs would result in polluters and users fully taking
responsibility for the costs they generate, thereby providing them with a strong
incentive to reduce those costs by opting for alternatives, better technological
solutions (i.e. cleaner vehicles), changing use patterns (i.e. using vehicles in times
when there is no congestion) or decreasing use.
528. Nonetheless, despite a Commission proposal353
to do so, carbon pricing has been
introduced only in a fragmented manner across the transport modes, either through
coverage by ETS (aviation for intra-EU flights, electric rail) or via the CO2
component in fuel taxes, but only in certain Member States354
. Distance-based road
charging for passenger cars and vans has been implemented only in a few countries
in Europe, while the current systems of VAT and of the taxation of energy
products often discourage the use of sustainable transport solutions or prevent the
further incentivising of greener purchases by consumers. Taxation of vehicles in
particular, which could encourage the uptake of cleaner solutions, lacks
harmonisation in relation to CO2.
529. Other policy instruments (e.g. regulatory measures) aim more directly at reducing
certain externalities (for instance, standards define the acceptable limits of
pollutant emissions emitted by a new vehicle). Such measures are very effective in
addressing specific market failures such as the principal agent problem or
consumer myopia. Appropriate pricing measures, such as cap & trade GHG
emission trading system, can be complementary to such regulatory instruments:
they specifically correct market failures by internalising external costs and thereby
enable market forces to find the economically most advantageous solution to
deliver the desired policy outcome (e.g. reduction of GHG emissions) and
incentivise people to opt for the most advantageous choice.
530. Several pricing instruments already exist in EU legislation but, on average, they
do not allow full cost coverage. Furthermore, they are not differentiated enough
according to the level of external and infrastructure costs.
531. Marginal social cost pricing is considered – from a theoretical economic point of
view – as a first-best approach. It is defined as a situation where transport users are
charged with a levy equal to marginal external (and infrastructure) costs, thereby
excluding fixed infrastructure costs. It is also in line with the framework set in the
2011 White Paper for Transport for smart pricing and taxation for transport.
However, implementing internalisation measures in line with such principle is
Also the Commission Communication of 2016 on ‘A European Strategy for Low-Emission Mobility’ emphasized the need for
further action in applying the ‘polluter pays’ and ‘user pays’ principles More recently, in its “in-depth analysis in support of the commission communication COM(2018) 773” concerning the climate long-
term strategy, the lack of internalisation is mentioned as one of the problems hindering the uptake of green technologies 350 This implies excluding the fixed infrastructure costs from the analyses. It recognises that fixed infrastructure costs are sunk costs and that paying for these costs may result in (further) underutilisation of existing infrastructure (e.g. rail). 351 “Sustainable Transport Infrastructure Charging and Internalisation of Transport Externalities”, CE DELFT, 2019
https://ec.europa.eu/transport/themes/sustainable-transport/internalisation-transport-external-costs_en 352 Within each mode there may be specific segments where the cost coverage is higher than in other segments. For high speed trains
for example, the current taxes and charges do cover all external and variable infrastructure costs, but not fixed costs of
infrastructure. 353 COM(2011) 169 final Proposal for a COUNCIL DIRECTIVE amending Directive 2003/96/EC restructuring the Community
framework for the taxation of energy products and electricity 354 Member States that adopted, under their national legislation, CO2 taxes that are linked to fuel volumes have to respect the provisions under Articles 1(2) of Directive 2008/118 and 4(2) of Directive 2003/96.

133
technically challenging, as the level of costs can change very quickly: the external
cost of congestion varies depending on the actual level of congestion. Transport
users could find it difficult to understand or take into account continuously
fluctuating cost. For these reasons, a certain degree of simplification is inevitable.
A few examples of existing instruments are provided below, covering different
modes.
532. The Energy Taxation Directive provides a framework for taxing motor fuels,
heating fuels and electricity. Currently it essentially follows however a
predominantly fiscal logic, meaning that the system of taxation often has no link to
the actual damage caused by the fuel, for instance in terms of carbon emissions. In
addition, the minimum rates of taxation of the same fuel are very different
depending on whether it is burnt in a heater/boiler or in an engine. Differing
conditions in Member States may also hamper the development of an internal
market of sustainable alternative fuels at sufficient scale.
533. The ETD has provided for mandatory exemptions to fuels used in international
aviation and maritime since 2003355
. As acknowledged in Recital 8 of the
Directive, the objective of the mandatory exemptions was to respect existing
international obligations while safeguarding the competitiveness of European
industry vis-à-vis third countries. However, as stated in a recent Commission
evaluation of the Energy Tax Directive, the presence of sector-specific energy tax
exemptions or reductions such as in the aviation and maritime sectors, may weaken
the incentives for investing in more energy-efficient capital stock and production
processes in these sectors and may affect the level playing field with other
transport modes.
534. In its conclusions of 5 December 2019, the Council has invited the Commission to
analyse and evaluate possible options with a view to publishing in due course a
proposal for the revision of the Energy Taxation Directive. In particular, the
Council calls on the Commission to update provisions in the future proposal in
order to ensure that they are practicable and provide greater certainty and clarity in
its implementation, taking notably into consideration relevant sectors, such as
aviation, considering their specificities and existing exemptions and international
dimension.
535. These considerations include the risk of carbon leakage (e.g. vessels can take
advantage of fuelling outside EU jurisdiction; intercontinental air traffic can bypass
the EU and connect at non-EU hubs, and short-haul flying can be replaced by
driving) which can additionally affect the competitive position of EU companies
and have negative unintended consequences contradicting the EU climate
objectives. A recent paper of Eurocontrol for the ECAC airspace356
shows that
16.5% of flights are able to perform full fuel tankering357
and 4.5% partial fuel
tankering with additional negative impacts on CO2 emissions, because of carrying
more fuel than necessary358
.
355 According to Article 14 of the ETD, Member States must exempt from taxation energy products supplied for use as fuel for the
purpose of air navigation other than in private pleasure-flying and energy products supplied for use as fuel for the purposes of
navigation within Union waters (including fishing), other than private pleasure craft, and electricity produced on board a craft. Member States may limit the scope of the exemptions to international and intra-EU transport. In addition, where a Member State has
entered into a bilateral agreement with another Member State, it may also waive the exemptions, in which case it may apply a level
of taxation below the minimum level set out in the ETD. 356 Composed of 44 countries, including the EU Member States. 357 Fuel tankering is a practice whereby an aircraft carries more fuel than required for its flight in order to reduce or avoid refuelling
at the destination airport. 358 Source: https://www.eurocontrol.int/publication/fuel-tankering-european-skies-economic-benefits-and-environmental-impact

134
536. For waterborne transport the high capacity of tanks provides even more flexibility
in fuelling outside EU jurisdiction (with a particularly high risk for diverting the
short sea shipping routes to neighbouring third countries). For a deep sea shipping,
according to a study by Ricardo359
, on a single bunkering a Panamax bulk carrier
can stay at sea for 56 days. Fuel suppliers could also avoid incurring the duty on
fuel sold by setting up offshore bunkering facilities (e.g. beyond a 12nm zone).
Past experience with California’s 1991 decision to lift the fuel tax exemption
shows that within a year Californian bunker sales had collapsed as ships bunkered
elsewhere, especially in Panama360
. Quantifying the above-described risk of
fuelling outside EU jurisdiction and the consequences thereof from the perspective
of revenue generation, negative impacts on emissions and competition would
require future in-depth analysis.
Figure 36 Minimum rates of taxation laid down in the ETD (1 Jan 2010) 361
Source: European Commission.
359 Source : https://ec.europa.eu/clima/sites/clima/files/transport/shipping/docs/ghg_maritime_report_en.pdf 360 Source : https://ec.europa.eu/clima/sites/clima/files/transport/shipping/docs/ghg_maritime_report_en.pdf 361SEC(2011) 409 final Impact Assessment for Proposal for a COUNCIL DIRECTIVE amending Directive 2003/96/EC
restructuring the Community framework for the taxation of energy products and electricity, Table 1 https://ec.europa.eu/smart-regulation/impact/ia_carried_out/docs/ia_2011/sec_2011_0409_en.pdf
135
537. Revenues from fuel and electricity taxation amount to more than EUR 200 billion
per year362
which corresponds to about 1.6 % of the EU-27 GDP and to about half
the total revenues of road, rail and inland waterways.
538. Today, the revenues from transport taxes and charges are only partly earmarked for
expenditure for transport infrastructure and significant differences exist between
modes. Earmarking of revenues may be used to gain public support for future
initiatives to increase the extent of internalisation of external and infrastructure
costs of transport. On the contrary, if no alternative mobility options are provided,
increasing the taxes or charges on a specific mode might be perceived as a measure
aiming simply at increasing tax revenues and its impact on greening the transport
sector might be limited to a reduction in demand.
Other Market-Based Measures
539. Intra-EU aviation has been included in the EU Emission Trading Scheme (ETS)
since 2012 and electrified forms of transport (e.g. rail, electrified cars etc.) are
indirectly included, as power generation is covered by the ETS. The purchase of
allowances by aircraft operators under the EU Emissions Trading System (ETS)
resulted in a net reduction of 27 million tonnes of CO2 emissions for the year 2017,
reaching over 100 million tonnes over five years.363
540. The application of the EU ETS is currently suspended in relation to flights to and
from countries outside the European Economic Area to allow for the development
of an international instrument in the International Civil Aviation Organization
(ICAO). All European States will join the pilot phase of the new Carbon Offsetting
and Reduction Scheme for International Aviation as of 2021, with the aim of
offsetting emissions above 2020 levels, without prejudice to the upcoming revision
of the EU ETS Directive as regards aviation. This international scheme will require
airlines flying between participating countries to offset all emissions beyond
2019/2020 levels.
541. In the 2030 Climate Target Plan364
it was stated that the Commission will propose
to reduce the free allocation of allowances, increasing the effectiveness of the
carbon price signal in this sector, while taking into account other policy measures
such as revised energy taxation and the ReFuelEU initiatives.
542. As regards maritime transport, the European Green Deal puts forward a basket of
measures addressing, among other things, energy efficiency improvements and the
uptake of alternative fuels. The introduction of correct pricing signals through the
extension of the ETS is an important part of this basket of measures. The European
Green Deal also recalls that European measures should be coordinated with action
at global level, notably with the IMO. In the light of progress at global level, the
Commission will give fresh political consideration to the international aspects of
the EU ETS, taxation and fuel policies for maritime to ensure the gradual
decarbonisation of all fuel use from transport relating to the EU with the ambition
to include international emissions from navigation into the EU ETS. The
Commission is currently carrying out a preparatory work to assess the impact of
extending an EU ETS to maritime transport.
362 Including VAT, almost entirely coming from road users. Excluding VAT revenues amount to about EUR 170 billion. Source: CE
Delft, 2019: Transport taxes and charges in Europe 363 European Environment Agency, European Union Aviation Safety Agency, Eurocontrol (2019): ‘European Aviation
Environmental Report 2019’. https://ec.europa.eu/transport/sites/transport/files/2019-aviation-environmental-report.pdf 364 COM(2020) 562 final

136
543. It is also worth noticing that the IMO identified a similar basket of candidate
measures at global level, showing that all countries and the industry have aligned
on the need for actions on different fronts. While short-term measures should be
finalised and agreed by 2023, mid- and long-term measures are only expected after
2023. However, discussions on market-based measures are expected to start in the
course of 2021 in conjunction with the industry proposal on a fuel levy to fund
research activities at global level. Past discussions included a fuel levy and an ETS,
though these were temporarily put aside by an agreement on mandatory energy
efficiency standards for new built ships - to date the only legally binding standards
that apply to an entire global industry and to all countries.
544. Road transport is subject to several different measures having the same objective
of reducing CO2 emissions and other external costs, including CO2 standards, fuel
and vehicle taxes and road charges. In terms of available alternative technologies
to replace fossil fuels, private cars, urban and short distance delivery light lorries
and heavy long distance road haulage are clearly distinct. Inclusion of road
transport in the EU ETS could give the sector a clear signal and capture fleet
emissions under a cap. Especially with increasing electrification, a case could be
made to treat all vehicles alike. A measure to this effect may be combined with the
other existing measures such as CO2 standards and road charging.
Taxation of vehicles
545. When it comes to low- and zero-emission vehicles an important factor to be taken
into account is their still rather high initial purchase costs. While the total cost of
ownership (TCO) is often competitive with conventional vehicles – and incentives
such as reduced annual circulation tax can further increase their attractiveness – the
fact remains that for many consumers the initial purchase costs can represent an
important obstacle and many fail to make purchases on the basis of TCO. The
evolution of the battery prices, which reduced dramatically over the last years, and
which are projected to continue decreasing significantly, will have a positive
impact on the affordability of vehicles. In addition, there are two key areas where
steps could be taken by Member States to send a clear market signal in favour of
low- and zero-emission vehicles:
Vehicle purchase/registration taxes and VAT: reduced rates for
purchase/registration taxes for zero-emission vehicles would provide an
important stimulus to their faster deployment, by reducing their steep initial
purchase cost and making them more competitive; overcoming the
fragmentation of the Single Market for the automotive industry (see figure
below). This would ideally be accompanied by a modulation of the
corresponding taxation of other vehicles based on CO2 and air pollutant
emissions per km. This should also be accompanied by the adoption of the
Commission proposal on VAT rates, which would allow Member States to
lower VAT on zero-emission cars.
Circulation/ownership tax: a similar approach could be followed for the
circulation / ownership tax. On the one hand, this would not directly reduce
the initial purchase cost; however, the amount of the yearly tax to be paid
allows for a clear assessment and can be an important element influencing
buyers’ decisions when choosing a new vehicle

137
Figure 37 Purchase taxes in the EU in 2016
Source: CE Delft365
546. The fiscal treatment of company cars would be another possible area of
intervention: the preferential tax treatment of company cars applied in some
Member States weakens efforts to internalise external costs and decarbonise
mobility, by effectively promoting the daily use and purchase of larger and more
polluting vehicles, especially when combined with other incentives, such as free
parking at the workplace. If preferential treatment were at least to be accorded on
the basis of the vehicle’s environmental performance, it could instead provide a
365 CE Delft, 2019: Transport taxes and charges in Europe https://ec.europa.eu/transport/sites/transport/files/studies/transport-taxes-and-charges-in-europe-isbn-978-92-79-99561-3.pdf

138
clear market signal and accelerate market take-up of low- and zero-emission
vehicles.
547. According to the Commission proposal for a Council Directive amending Directive
2006/112/EC as regards rates of value added tax366
, Member States would in future
be allowed to apply a maximum of two reduced rates of a minimum of 5%. This
possibility is subject to a few conditions, notably to make sure that no distortions
of competition within the Single Market arise. A list of goods and services to
which reduced rates may not be applied is annexed to the proposal. It leaves
Member States the possibility to reduce VAT to be paid on the supply of
environmentally-friendly vehicles such as electric cars, if and when the proposal
will be adopted.
548. Transport services, like any other service supplied by a taxable person within the
EU, are subject to VAT. Historically however, Member States considered applying
VAT to international air and maritime transport administratively too complicated
and costly. This is why for international passenger transport, sea and air are exempt
of VAT in the whole of the EU-27. At the same time, this VAT treatment is not
given to competing modes, such as in particular rail in some Member States. The
recent Tax Action Plan367
has however announced a proposal by 2022 where this
exemption will be re-examined with a view to VAT treatment on an equal footing
between transport modes and an alignment with the objectives of the Green Deal.
Infrastructure charging
549. For road infrastructure, Directive 1999/62/EC (Eurovignette Directive)
prescribes the principle for charging heavy goods vehicles. The Commission
adopted a legislative proposal to amend it in May 2017, in order to extend the
scope of the Directive to buses/coaches, cars and vans, to introduce differentiation
of tolls and user charges per criterion such as noise, air pollutants and CO2
emissions of the vehicle, and to gradually move away from time-based user
charging (vignettes) to distance-based pricing.
550. While the European Parliament adopted an ambitious position in October 2018,
including effectively replacing time-based vignettes with distance-based tolls,
Member States are not yet ready to agree on strong road pricing measures for cars.
Other elements of the text (e.g. the requirement to vary tolls based on CO2 for
lorries or the possibility to apply external CO2 charges or a congestion charge)
would still contribute to the objective of the decarbonisation of transport. In
addition, in 2019 the EETS Directive on interoperable electronic tolling was
adopted, which will, inter alia, help the national authorities to recover unpaid
charges. Indeed, smart, distance-based road charging, with varied rates for the type
of vehicle and the time-of-use, is an effective tool to incentivise sustainable and
economically efficient choices, manage traffic and reduce congestion.
551. In line with the user pays – polluter pays principle, for rail, infrastructure charging
could play a much more supportive role towards the policy objectives. This would
require both a better application and a rethinking of the applicable rules:
552. The charges for rail infrastructure are set under the provisions of Directive
2012/34/EU.368 369
The Directive foresees two basic components of a charge: direct
366 COM(2018) 20 final. 367 COM(2020) 312 final 368 Directive 2012/34/EU of the European Parliament and of the Council of 21 November 2012 establishing a single European railway area (recast), OJ L343, 14.12.2012, p. 32.

139
costs, which railway undertaking always have to pay, and mark-ups. Direct costs
cover the costs directly incurred by the train run (but not costs related to the initial
construction of the infrastructure). Mark-ups are foreseen as an exception to the
basic charging principle of direct costs and can be levied only if the market can
bear them. They cover additional costs of the infrastructure manager that are not
covered by State subsidies.
553. Mark-ups increase the price of rail services. In some market segments (in particular
high-speed rail), the cost burden on rail services (levied through taxes and charges)
is currently significantly higher than their marginal infrastructure usage (direct
costs) and external costs.370
According to the Directive, direct cost charging
represents the general principle, mark-ups are applied only if the market can bear
them. However, where infrastructure manager’s limit charges to direct cost, this
helps strengthen the competitiveness of rail services compared to other modes of
transport. Particularly long-distance passenger services are currently often subject
to high mark-ups. The current track access charge regime also raises questions as
regards rail’s competitiveness versus aviation over longer distances. Since track
access charges are charged per train/km or track/km, rail charges increase linearly
with distance.
554. A further aspect is that delays in the rail system ought to be paid for by those who
cause them. Directive 2012/34 foresees performance schemes to reward
punctuality. However, in practice, a large number of Member States have so far
failed to introduce such a system, probably in part because they have struggled to
design a system that is at the same time effective but not too complex. Better
compliance, if necessary on the basis of further EU guidance, would be necessary
to enhance the overall punctuality of the rail system.
555. Track access charges can be modulated to set incentives for the use of specific
technologies or vehicles, for example by reflecting environmental costs in the
charges, such as noise (Art.31 (5) or by incentivising equipping trains with
ERTMS (Art. 32(4)). Member States can already introduce noise differentiated
track access charges, but there is currently no obligation to have such a scheme in
place and only a few countries have done so. Further analysis would also be
required to see whether charging could be used to better incentivise energy
efficiency and the installation of ERTMS.
556. As regards airport charges, the EU has introduced legislation (Directive
2009/12/EC) to ensure that certain minimum criteria are fulfilled with regard to
setting of airport charges. Notably, such charges must be transparent, must be
established through a dedicated process involving the participation of airport users,
they must be non-discriminatory and an independent supervisory authority must be
empowered to review compliance with the Directive. The Directive does not
provide for any actual (including minimum or maximum) levels of airport charges.
Concerning ports, a study published in June 2017 identified around 30 ports in
Europe that apply differentiated charges (in the form of rebates) for vessels that
have a better environmental performance than legally required371
.
369 In addition, two specific implementing acts clarify the modalities for the calculation of the cost that is directly incurred as a result of operating the train service and for the application of the charging for the cost of noise effects. References. 370 Sustainable Transport Infrastructure Charging and Internalisation of Transport Externalities: Main Findings, May 2019, Table 5,
https://ec.europa.eu/transport/sites/transport/files/studies/internalisation-study-summary-isbn_978-92-76-03076-8.pdf 371 COGEA for the European Commission: “Study on differentiated port infrastructure charges to promote environmentally friendly
maritime transport activities and sustainable transportation”, June 2017: https://ec.europa.eu/transport/sites/transport/files/2017-06-
differentiated-port-infrastructure-charges-report.pdf.

140
4.1.5.2 Better information to users
557. In line with the EU priority to move towards a green and carbon-neutral economy,
more focus is needed for motivating on the one hand the offer of more sustainable
services or operations and on the other hand the consumers to improve the
sustainability of their transport choices. Consumers and businesses lack the right
information that could help making their mobility and transport more sustainable.
It is important to leverage the increasing interest of consumers for greener choices
and to remove the many barriers they still face. Information on environmental
performance of transport services should become easily available and be
trustworthy, advertised green benefits should not be misleading.
558. However, no specific and universally accepted framework for calculating and
reporting CO2 emissions from transport services exists. The availability of various
methodologies, initiatives and calculation tools limits the potential to reliably
measure, compare and benchmark various transport services, as well as to develop
relevant transparency and information tools, such as eco-label programs and
scoreboards in line with the principles of the ‘sunshine regulation’. The European
CEN standard EN 16258, published in 2013, is the only standard specifically
focused on carbon footprint measurement of transport services. However, since it
leaves room for interpretation it does not guarantee a fully harmonised
implementation and thereby comparability. The lack of a harmonised classification
framework makes it also difficult to reward the best performance and pioneers of
innovative technologies.
559. The study and stakeholder consultation undertaken by the Commission in 2014 on
the standardised carbon footprint methodology for transport services372
, recognised
a clear need for a common methodological framework for carbon footprinting both
at the EU and international scale. Further, the Commission co-financed between
2011 and 2019 two consecutive RTD projects addressing the calculation, reporting
and verification of logistics emissions. The projects addressed the methodology
development, verification and certification of the calculations/method and labelling
to reward business. They also looked at the issues of the data quality, collection
and exchange. The projects were closely interlinked with the work of the Global
Logistics Emissions Council (GLEC), a platform for industry initiatives,
associations and multinationals that developed the ‘GLEC framework for Logistics
Emissions Methodologies’. The RTD projects in cooperation with GLEC
supported the process which leads to the establishment of a specific ISO working
group in 2019 working on a global standard for transport and logistics emissions
calculation The envisaged revision of the abovementioned CEN 16258 standard
will piggyback the ISO process.
560. The Commission is considering to launch an initiative to develop a harmonised
framework to establish a fair benchmarking tool to companies and customers
wishing to procure more sustainable services. Such a system, taking into
consideration the existing EU frameworks373
,preferably aligned at global scale,
would also facilitate the development of complementary measures and tools, such
as GHG certification schemes, eco-labelling, green procurements, creating further
opportunities towards emission reduction. Logistics operators should be able to
372 https://ec.europa.eu/transport/sites/transport/files/themes/strategies/studies/doc/2014-12-introduction-of-a-standardised-carbon-
footprint-methodology.pdf 373 Such as Product Environmental Footprint and Organisation Environmental Footprint rules,
https://ec.europa.eu/environment/eussd/smgp/

141
compare and benchmark various transport and logistics services and to provide
reliable information to clients on environmental impact of their orders. Shippers
could include carbon efficiency as a criterion in their transport decisions. All this
creating opportunities towards innovative solutions, cutting costs and further
emission reduction.
561. After the sharp increase in e-commerce during the COVID-19 pandemic, it
becomes even more important to provide information to clients on the transport-
related environmental impact of their orders and provide transport choices at, for
example, longer delivery times but lower emission levels. As the results of the
recent Eurobarometer survey showed374
, among respondents who buy goods online
or by phone, six in ten (59%) would pick up a delivery themselves at a pick-up
point, while 42% would wait longer for the delivery if it was done by a green mode
of transport.
562. Information about environmental (including carbon) footprint of each transport
mode could be integrated into travel information systems, indicating also the
monetised impact, to inform consumers and raise their awareness; in the second
step, the footprint could be included in the ticketing/pricing systems. The current
delegated regulation 2017/1926 on EU-wide multimodal travel information
services contains some relevant elements.
563. Examples of emission reduction effects supported by carbon accounting, can be
provided from the perspective of sector specific carbon reduction schemes and
individual companies. As regards the sector specific schemes, Logistics Emissions
Reduction Scheme (LERS) and Smartway program can be mentioned in particular.
LERS is a UK-based green freight benchmarking program, reporting that in 2018
its members achieved a 4% reduction in their CO2 emissions, while LERS member
emissions are in general close to 13% lower per vehicle km than the industry
average.
564. The U.S. Smartway program, benchmarking the efficiency of transport operations
and run as a public-private partnership, has attracted since 2004 over 3,700
partners, who saved together 280 million barrels of oil and prevented from the
emission of 134 million tonnes of air pollutants. Also individual companies see the
benefits of accounting carbon footprint of transport and logistics services375
.
565. Navigation solutions, are now ubiquitous: they come in-built in vehicles, can be
attached to the vehicles in form of dedicated devices or can be simply downloaded
to smartphones. These solutions guide millions of drivers everyday on their trips,
all around the world, showing them the fastest way to get to their destination.
566. However, all too often the fastest way is not the ‘best’ way to get to the destination
if the algorithm took into account other important factors such as fuel consumption
and related environmental impacts. Eco-routing navigation solutions can help
374 Special Eurobarometer 495.
https://ec.europa.eu/commfrontoffice/publicopinion/index.cfm/survey/getsurveydetail/instruments/special/surveyky/2226 375 OIA Global is a non-asset-based supply chain provider managing customer’s transportation, packaging design and optimization, and raw materials sourcing. OIA Global calculates and reports its own and also customers emissions by using a standardised CO2
accounting method. As a supply chain provider with packaging optimization expertise, OIA Global optimized the space used to
transport shoes for a global footwear retailer. In 2016, this retailer was able to ship 48% more units per m3, resulting in $1.24 million reduced transport costs and 43% lower CO2 emissions, or 152 grams per pair of shoes.
FM Logistic is a family-owned independent logistics company, which also uses methodology to calculate carbon footprint from its
activities. FM Logistics set the interim targets for 2022, including 20% reduction of the warehousing carbon footprint compared to
2018.
LENOVO, one of the global technology leaders, supports a 2050 reduction target of 40-70% for transport and transhipment
emissions compared to 2018/19. Subcontracting reduction targets, pending final approval, are 25% CO2e per tonne-km of transported product by 2029/30 from a 2018/19 baseline.

142
addressing this problem as they enables users to reduce their fuel consumption and
CO2 and air pollutant emissions at the route choice level376
and therefore their use
should be promoted.
567. In addition to precise information on the impact of individual trips, experience
from other industries and EU policies, notably the EU Ecolabel and the EU Energy
label, demonstrated that labels377
can be effective tools for communicating
environmental performance and preventing proliferation of green claims.
568. For example, tyre energy labels378
provide a clear and common classification of
tyres performance for rolling resistance, braking on wet surfaces and external
noise379
. The labels help consumers make informed decisions when they are buying
tyres as they can easily set their priority choice based on the 3 parameters.
569. The Car Labelling Directive (Directive 1999/94/EC) aims to raise consumer
awareness on fuel use and CO2 emissions of new passenger cars in order to support
the purchase or lease of fuel-efficient cars. A label should be attached to all new
cars or displayed nearby the point of sale showing fuel economy and CO2
emissions. Moreover, at or through the point of sale further information on fuel
consumption and CO2 emissions of all new car models should be available
(posters, printed guide and promotional material).
570. The Commission evaluated Directive 1999/94/EC in 2016. It showed that
consumer awareness about CO2 emissions and fuel economy has risen steadily
since the implementation of the Directive. A number of Member States have set
further mandatory or voluntary requirements regarding information tools. While
the relevance of the Directive remains, the Directive also underlined the need and
benefits for further clarification and simplification. Those include the need to
address differences in label design in Member States following the absence of a
common methodology, the lack of provisions on alternative fuelled vehicles or the
lack of provisions concerning of air pollutant emissions, among other. Information
on fuel consumption and emissions would also need to be adapted to the provisions
of the Worldwide harmonized Light vehicles Test Procedure (WLTP) test cycle.
The Commission issued a recommendation380
to Member States in 2017, asking
them to ensure that WLTP information would be incorporated into the national
labels.
571. In order to address the problem of diverging CO2 emissions and fuel consumption
values between what is communicated through the registration certificates and
what the users actually experience in reality, and in order to strengthen consumer
awareness, the Commission adopted the new Worldwide harmonized Light
376 A recent study noted that “An investigation conducted in Sweden (Ericsson et al., 2006) found that 46% of trips based on the
spontaneous route choice of the traveller were not the most eco-friendly. Fuel consumption on such trips could be reduced by 8.2%
if the most eco-friendly route was chosen. Similarly, Ahn and Rakha (2013) reported that fuel savings over networks range between 3.3% and 9.3% when compared to typical travel time minimization routing strategies.
Zeng et al. 2020. Eco-routing problem considering fuel consumption and probabilistic travel time budget, Transportation Research
Part D: Transport and Environment, Volume 78, January 2020, 102219 377
As part of the informal agreement with the European Year of Rail 2021 , the Commission is asked to consider launching a study
on the feasibility of creating a European label to promote goods and products transported by rail.
https://www.consilium.europa.eu/en/press/press-releases/2020/11/12/european-year-of-rail-2021-informal-agreement-with-the-european-parliament/ 378 Regulation (EC) No 1222/2009 first introduced the obligation of placing car and van tyres on the EU market with a sticker
showing the label. That regulation has been reviewed and will be replaced by Regulation (EU) 2020/740 from 1 May 2021 onwards,
when new requirements will start applying. Under the new regulation, bus and truck tyres will also be covered. 379 In 2016, the European tyre industry committed to further reduce the rolling resistance coefficient of truck tyres by 1% per year
until 2030. Source: ETRma 380 C(2017) 3525 final

143
vehicles Test Procedure (WLTP)381
and has introduced mandatory monitoring of
the discrepancy between real world fuel consumption and the certified values
through accurate382
on-board fuel consumption monitoring systems. A series of
tools that provide indicative vehicle in-use information to consumers have also
been funded by European projects.
572. The European Union Aviation Safety Agency has also started a demonstration
project for the feasibility of developing an environmental label for aviation that
could potentially capture the environmental performances, notably of aircraft,
airlines, flights and airports. This would need to be in line with the methodologies
and policy objectives of the Green Claim initiative, announced by the Circular
Economy Action Plan in March 2020, to be adopted in 2021. Such labelling,
should the Commission decide to take it forward, would require a holistic approach
and would need to take into account the existing methodologies and policy
objectives.
573. Furthermore, awareness raising is an area where the European Commission has
invested for years. Earlier this year, the Commission has proposed to declare 2021
the European Year of Rail, in order to promote rail as a sustainable form of
transport. The European Mobility Week383
is of particular relevance. It is the
Commission’s leading awareness-raising campaign promoting behavioural change
in favour of sustainable transport modes. It takes place from 16-22 September
every year and culminates in the well-known Car-free Day.
574. By taking part, towns and cities can showcase the benefits of cleaner transport
choices and make progress towards better mobility in Europe. Local authorities are
strongly encouraged to use European Mobility Week to measure air quality, test
new pedestrian areas and transport measures and get feedback from the public. At
the same time, organisations, businesses, schools etc. can register their Mobility
Action to become a part of the EMW campaign and to show what they are doing to
promote sustainable mobility. In 2019 there was a record-breaking participation,
with over 3,100 cities registered from 50 countries as well as 1028 ‘mobility
actions’ in 56 countries. However, it is highly variable used – three countries
(Austria, Spain and Turkey) each have participation from more than 500 cities,
while the European Mobility Week’s footprint is much slighter elsewhere,
suggesting there is potential to develop this tool further. Finally, each year we give
EMW awards to reward local authorities judged to have implemented the best
European Mobility Week in line with the annual theme.
575. Working with employers and their internal mobility offer to their employees, as
well as with schools and universities and their pupils/students can also be a way to
influence the behavioural change. Lasting change in behaviour is key when it
comes to shifting to sustainable mobility, and proposing a good offer and
incentives – combining economic and social aspects – by employers/schools etc.
can be a powerful tool in that regard384
.
381Fontaras, G., Ciuffo, B., Zacharof, N., Tsiakmakis, S., Marotta, A., Pavlovic, J., Anagnostopoulos, K., 2017. The difference
between reported and real-world CO2 emissions: How much improvement can be expected by WLTP introduction? Transportation
Research Procedia, World Conference on Transport Research - WCTR 2016 Shanghai. 10-15 July 2016 25, 3933–3943. https://doi.org/10.1016/j.trpro.2017.05.333 382 Pavlovic J, Fontaras G, Broekaert S, Ciuffo B, Ktistakis M, Grigoratos T (2020) How accurately can we measure vehicle fuel
consumption in real world operation? Transportation Research Part D: Transport and Environment., 2021. 383 https://mobilityweek.eu 384 The following examples of registered Mobility Actions can be invoked in this context:
Decathlon is organising a commuting competition among all staff in the country (around 11,000 people) with the aim of boosting sustainable mobility by collecting "sustainable kilometres”. https://mobilityweek.eu/registered-actions/?action_uid=TqYZQxSf

144
4.2 The challenge of digitalisation and modernisation
576. Digitalisation, automation, the emergence of the shared, collaborative economy
and platforms, which are challenging the current and traditional mobility and
transport landscape, will be key for building a smart, green and resilient
transportation system. New ICT technologies, including artificial intelligence (AI),
impact the way transport organisations operate. They pave the way for innovation,
allow new services and business models to enter the market and challenge the
incumbents. Digitalisation also facilitates novel ways of collaboration within and
beyond the sector, including between supply chain actors. At the same time users’
behaviour and expectations – both passengers and businesses – evolve rapidly with
demands for more efficiency, less emissions and better performance of the whole
transport system. This rapid transformation brings a number of opportunities. It can
make the transport system more connected, multimodal and efficient allowing a
better organisation and execution of travel and transport operations. It can help
make better use of infrastructure and resources as well as integrate different modes
of transport. It can ultimately make mobility safer by helping reduce safety risks
involving human error. It can make transport and mobility more inclusive and
cleaner, by for instance increasing the use of public, collective and shared
transport. Ultimately it can help to better serve both citizens and businesses.
577. At the same time, however, it raises a number of challenges, from the ability of the
sector to adapt its business models to a new reality, through more horizontal
questions of data availability and accessibility, resilience to cyber-incidents, the
availability of the necessary infrastructure allowing for digitalisation, protection of
personal data to the potential impact on jobs and required skillset.
578. All transport modes have started to embrace this disruptive change, although at a
different pace. Reaping the full benefits of digitalisation and automation often
requires a coordinated change across the network and simultaneously on
infrastructure and vehicles. However, underlying conditions allowing the transport
sector to take full advantage of digitalisation to achieve sustainable, seamless, safe
and smart mobility across the modes, as well as to minimise the risks, are not yet
optimal to take advantage of these opportunities. EU support to research and
innovation is helping to seize these opportunities and mitigate risks, but more
needs to be done.
4.2.1 Smart multimodal transport – challenges for seamless experience
579. We are still far from a perfect smart and multimodal mobility experience across the
European Union, in which solutions are interoperable and can be combined and
First self driving shuttle in Luxembourg, set-up to solve last mile problems between an office building and the train station among
employees at Campus Contern, Luxembourg https://mobilityweek.eu/registered-actions/?action_uid=tKDkH0xg Navantia is implementing an annual programme of incentives together with Ciclogreen to encourage its employees to travel
environmentally friendly to work on a daily basis; walking, biking, car sharing or using public transportation is rewarded with an
incentive; https://mobilityweek.eu/registered-actions/?action_uid=mCRuJeWw The Regional Inspectorate of Environment and Water in Plovdiv (Bulgaria) organised a literary competition under the theme "Walk
to the end of the city”, with participants submitting a piece of literature that explores the theme.
https://mobilityweek.eu/action-in-the-spotlight/literature-competition/
Scoala Gimnazială (City of Baia Mare, Romania) organises a competition for its students who will ‘design attractive posters
regarding the bike routes in the city, to be posted in central places frequented by a lot of people’ https://mobilityweek.eu/registered-
actions/?country=RO&action_uid=2T3XbT9P

145
integrated smoothly along a single travel chain. At the moment travellers are not
yet able to plan, book and enjoy their trips across Europe with the same ease as
they would do for a domestic journey. They often encounter disproportionate and
discriminatory registration requirements attached to the use of many types of
services– from public transport and rail through to electric vehicle charging and car
rentals.
4.2.1.1 Cross-border multimodal challenges
580. A seamless cross-border multimodal transport environment is highly desirable but
still an unmet challenge. From a passenger perspective, each transport mode
currently still operates in a mostly isolated system. Planning and purchasing
tickets/mobility services for multimodal journeys is often cumbersome, as we lack
a conducive environment for EU-wide, multimodal information and ticketing and
purchase services.385
There are a number of barriers, including the availability and
accessibility of data, legal and commercial barriers ranging from the lack of
cooperation between suppliers for payment system interoperability to the existence
of different licence, insurance and distribution agreements.
581. For rail, significant work has been undertaken to enable data exchanges - through
legislation (Technical Specification for Interoperability of Telematics Applications
for Freight/Passenger Services TAP/TAF TSI386
and recently the recast of the rail
passenger rights Regulation387
), EU funded research in the framework of
Shift2Rail and sector-driven initiatives (Full Service Model). Whilst the technical
issues seem to have been largely overcome, it remains very difficult for passengers
to buy cross-border or even through-tickets combining in a journey services of
several operators, or even to get an overview of the existing offer.
582. In fact, rail ticketing is currently largely in the hands of the incumbent railway
undertakings, who sell mainly through their websites and at times stifle
competition by refusing to sell tickets of other operators. This situation is all the
more problematic since incumbents’ financing still largely depends on public
support in the form of public service compensation. Such financing usually
supports the incumbent’s rail ticketing platforms, with no conditionality to make
those platforms accessible to competitors. At the same time, they sometimes
withhold their best offers and real time traffic information from third party
vendors, thus hindering the emergence of a strong independent ticketing market.
583. The barriers to ticket distribution do not only hamper smooth multimodal
experiences for passengers but also constitute market access barriers for new
companies that would like to provide rail services, thus limiting the potential
benefits of market opening. A number of national regulators have become active
on the issue388
, but a European solution is still missing to ensure seamless travel
and fair competition throughout the single European railway area. Under Article
13a(2) of the Rail Governance Directive, the Commission shall present a report to
385 “Remaining challenges for EU-wide integrated ticketing and payment systems”, European Commission, Grimaldi Studio Legale,
VVA, Wavestone, 2019 386 https://ec.europa.eu/transport/modes/rail/interoperability/interoperability/telematic_applications_en 387 https://www.consilium.europa.eu/en/press/press-releases/2020/10/21/improved-rail-passenger-rights-council-approves-the-
informal-deal/ 388Bundeskartellamt:
https://www.bundeskartellamt.de/SharedDocs/Meldung/EN/Meldungen%20News%20Karussell/2019/28_11_2019_DB_Mobilität.ht
ml;jsessionid=78C82035F037E081EDD1C18249A94842.1_cid362; Swedish Competition Authority: www.konkurrensverket.se/globalassets/konkurrens/beslut/18-0230-och-18-0380-beslut.pdf

146
the European Parliament and the Council by 31 December 2022 on rail ticketing
platforms, accompanied, if appropriate, by legislative proposals.
584. For mobility platforms, which would like to offer multimodal services (provide
real time information, and/or sell/issue tickets, offer new services), access and re-
use of data needed to develop their services is often hampered, including due to
interoperability challenges at EU level (data formats, protocols for data exchanges
etc.).
585. Another issue concerns the promotion of intermodal solutions combining aviation
and rail journeys through Computer Reservation Systems (CRSs). CRSs are
computerised reservation networks used by travel agents (online and offline),
online reservation sites and large corporations as a single point of access for
booking airlines tickets, rail tickets, but also other items such as hotel rooms, rental
cars, and other travel related items. CRSs are also used by some metasearch sites in
order to obtain information about the services of airlines that participate in CRSs.
586. When adopted in 2009, replacing the Regulation previously governing this
matter389
, the Regulation for the Computer Reservation Systems390
Code of
Conduct took steps to promote rail transport and inter-modal transport. This
included allowing rail operators and CRSs to freely negotiate booking fees and
contractual terms for ticket distribution. Rail ticket information is also subject to
the neutral display requirement which applies generally to air ticket information,
whenever rail and air tickets are displayed together in the primary display. The
evaluation391
found that there is insufficient evidence to confirm that the
Regulation on the CRS Code of Conduct remains an appropriate instrument to
promote rail transport and inter-modal transport.
587. The potential of digitalisation is not used to its fullest for drivers either. Nowadays,
around 60% of the population of the European Union holds a valid driving licence,
representing some 270 million citizens. Many European drivers make cross-border
trips within the Union for private or professional purposes or change their country
of residence.
588. Digital driving licences would be convenient for drivers, reduce the risk of fraud
and facilitate enforcement.392
Unless interoperability is ensured, these
developments are likely to lead to a patchwork of different national rules that could
hamper the full exploitation of the potential of digitalisation in this area.
589. The lack of Union rules providing for digital driving licences is also
disadvantageous for cross-border enforcement of traffic offences. The possibility
of real-time checking of licences and preventing driving licence tourism is
currently limited. Furthermore, there is no mutual recognition of driving
disqualifications and penalty points, given that Member States have different
systems of adding or subtracting points for different degrees of traffic offences,
which can eventually lead to the withdrawal of the licence.
590. At the moment it is also cumbersome for the drivers to demonstrate compliance
with urban vehicle access regulation (UVAR) criteria when travelling across
Member States. The current identification/declaration of vehicle characteristics is
389 Council Regulation (EEC) No 2299/89 of 24 July 1989 on a code of conduct for computerised reservation systems, OJ 1989 L
220, p. 1. 390 Regulation (EC) 80/2009 on Air Ticket Distribution and on a Code of Conduct for Computerised Reservation Systems and
repealing Council Regulation (EEC) No 2299/89, OJ L 35, 4.2.2009, p. 47. 391 SWD(2020) 9 final 392 The Commission is currently carrying out an evaluation of Directive 2006/126/EC on driving licences, which introduced a standard format for all driving licences issued in the EU and standardised administrative validity periods.

147
done by registering manually in a city system, by buying a sticker, and/or using
number plate recognition. The process is often lengthy and cumbersome. Despite
the potential of fast digitalisation of the automotive sector, an EU-wide digital
sticker or other form of digital vehicle identity such as ENPR, communicating
digitally the vehicle characteristics to the relevant authority is far from being a
reality.
591. In fact, seamless identification for all mobility-related services across modes,
which could facilitate and encourage multimodal choices of European travellers, is
not available either. At the moment, despite a ubiquitous use of smartphones and
digital solutions, there is no EU tool recognised in all Member States that would
enable Europeans to use one mobility account, with all necessary personal
information, preferences, banking account details, driving licence or other potential
documents such as the licence plate of their car (or even its characteristics (EURO
norm)), to avoid the burden to register each time they want to get access to
parkings, to city centres, to get access to and use mobility services, or to store (or
even replace) all tickets/proofs of purchase (e.g. urban public transport, train,
plane, taxi/PHV, shared mobility solutions, etc.).
592. The advantages of digital solutions are also supported by the general public. In the
recent Eurobarometer survey on mobility and transport393
, citizens identified the
most useful digital solutions for their future personal mobility. A single ticketing
tool for all urban journeys in any European city came top of the list (19%), with the
digital driving licences valid anywhere in Europe second (10%). Citizens are also
interested in solutions allowing them to pay tolls, parking and other charges in real
time and directly from a smartphone or other device as well as in simple
procedures to access areas subject to UVARs in different European cities. These
solutions need to be accessible for persons with disabilities and reduced mobility as
well.
4.2.1.2 Multimodal & collaborative economy challenges in urban context
593. Seamless and smart multimodality facilitated by digitalisation is also key in urban
and sub-urban areas. Urban transport plays a key role for developing a European
transport system that offers seamless door-to-door mobility, for long distance and
cross-border transport as well as for regional and local mobility.
594. The majority of long distance freight and passenger journeys start or finish in
urban areas. The corridors of the trans-European network pass through many urban
areas with related challenges for urban roads. Cities increasingly face problems
caused by mobility and transport: congestion, road crashes, air and noise pollution.
Transport CO2 emissions are rising, with urban transport representing close to ¼ of
them394
. The question of how to improve mobility while tackling these problems is
a common challenge to all major cities in Europe.
595. At the same time, access to information and to an increased variety of transport
services enabled by ICT technologies put individual travellers much more in
control of how they want to travel. More and more often they expect to have a
choice, adapted to their demand rather than have their travel routine dictated by
transport operators.
393 Special Eurobarometer 495.
https://ec.europa.eu/commfrontoffice/publicopinion/index.cfm/Survey/getSurveyDetail/search/495/surveyKy/2226 394 SWD (2016) 244 final. According to the EU Reference scenario 2016, based on PRIMES-TREMOVE model developed by the National Technical University of Athens (ICCS-E3MLab).

148
596. This growing pressure on urban passenger transport systems has increased the
demand for new and innovative solutions with various forms of transport services
being integrated into a single mobility service accessible on demand, including also
shared and collaborative mobility services (car-, bike-sharing, ride-hailing, e-
scooters etc.).
597. Building on these new modes and the developments in information and
communication technologies, the “Mobility as a Service” (MaaS) concept, which
assumes that various forms of transport services – both traditional and innovative
ones - are integrated into a service accessible on demand, has recently come to
light. In practice, a successful MaaS involves many actors (local, regional and
national operators, public, private, etc.) putting forward and reassigning available
resources to make multimodal travel easier, more efficient and accessible.
598. While MaaS holds the promise of making urban mobility smarter, more-user
friendly and sustainable, in some cities the close competition between different
stakeholders makes them unwilling to share information, expose their business
models and collaborate with their competitors, in turn making it difficult to come
up with a true Mobility as a Service scheme. There are also challenges related to
data, which is key to blend services together. The availability and accessibility to
relevant data sets in digital, machine readable format and interoperability of
different systems (booking, payment, ticketing, authentication, etc.) is still not
optimal.
599. Simultaneously, an increasing number of cities have witnessed a steady shift
towards shared and collaborative mobility services enabled by the emergence of
intermediary platforms. Those platforms enable the sale of mobility services,
acting as intermediary between customers and mobility service providers, and in
some cases, create new mobility services themselves e.g. e-scooters, bike-sharing,
car-sharing and ride-hailing.
600. The development of new mobility services may present many opportunities.
However, it does not mean that the current mobility offer automatically becomes
more efficient or it replaces the old one. Regardless of new mobility service
availability, public transport remains the backbone of mobility in urban and sub-
urban areas. Multiple US and European research highlights395
that new mobility
services need to complement rather than replace public transport. They show that
measures such as ensuring the proper infrastructure can help integrate these
services between themselves and with local public transport. However, integration
is already lagging behind in some European cities for more traditional services.
601. As far as ride-hailing is concerned, in most Member States, both taxis and private
hire vehicles with driver (PHV) exist next to each other. Taxis and PHVs have
traditionally coexisted and served distinct markets. However, on-line platforms
have radically changed – or even disrupted - this situation, blurring these
traditional boundaries, creating a flourishing new sector and bringing taxis and
PHVs in increasing competition. Local on-demand passenger transport has shifted
from being organised locally, often based on low-tech dispatch centres, to co-
existing with pan-European or global companies using sophisticated technologies
and algorithms.
395 See for instance Transport and Environment, 201, 9Europe’s giant ‘taxi’ company: is Uber part of the problem or the solution?; and Schaller Consulting, 2018, The New Automobility: Lyft, Uber and the Future of American Cities,

149
602. This development has generally increased the quality and efficiency of the ways in
which taxi and PHV services are provided. The possibility to order PHVs and taxis
on-line, thanks to apps using geo-localisation services, has been welcomed by
users and triggered an increase in demand. According to the recent Eurobarometer,
users perceive traditional taxi services and private hire vehicles as similar type of
service, appreciating the availability and ease of booking as positive aspects of
both.396
603. However, this has not been without tensions and led to different national legislative
responses. Ensuring a level playing field between these two types of actors is just
one of the challenges. Addressing legal uncertainty is another one - ride-hailing
platforms, which are essential for PHV services, are objecting to the fact that the
legal environment is constantly changing and differing between EU Member
States. Compliance with as many regulatory regimes as the cities they want to
serve is a barrier to develop a single market for these players.
604. While the new services have the potential to improve the overall mobility system
by offering alternatives, e.g. by helping people choose new modes of travelling and
reducing ownership of private cars, which are responsible for the lion’s shares of
emissions from the transport sector. However, this is yet to be proven at a large
scale. There are legitimate concerns about the real environmental impact, including
whether they would indeed decrease car ownership and traffic, unless the vehicles
used are sustainable ones.397
In this context, it seems worth exploring how the use
of cleaner vehicles can contribute to mitigating the environmental impact and how
a shift to low and zero-emission vehicles for taxi and PHV services could be
encouraged/achieved.
605. Part of the possible negative impact is also the result of constraining and obsolete
rules - taxis are often limited to picking up passengers in dedicated geographical
areas resulting in empty return driving when taxies, after a trip out of these areas,
are forced to return to these areas for picking up passengers. PHVs are often
obliged to return to the ‘garage’ after each trip, also resulting in much empty
driving. This is due to rules that pre-date the arrival of on-line platforms and
therefore ignore the efficiency gains they can bring, thus causing unnecessary
emissions.
606. Concerns are often raised about the working conditions of drivers and the
employment status of platform workers. Certain drivers working for platforms are
self-employed, not well protected under labour law. Moreover, the fact that there
are generally no common requirements on professional competences nor
harmonised rules on driving and rest times, could be a risk in terms of the security
of users and road safety.
607. Last but not least, these new services also raise a number of other issues from the
use of public space, road safety, maintenance, liability, insurance as well as overall
integration of different mobility services into coherent urban mobility.
608. While new mobility services become a day to day reality, there is currently no
specific EU legislation for the services or intermediary platforms related to taxis,
road e-scooters or bikes. National governments and cities struggle with applying
396 Special Eurobarometer 495 on Mobility and Transport.
https://ec.europa.eu/commfrontoffice/publicopinion/index.cfm/Survey/getSurveyDetail/search/495/surveyKy/2226 397 Europe’s giant ‘taxi’ company: is Uber part of the problem or the solution?; Source:
https://www.transportenvironment.org/sites/te/files/T%26E_Europe%20s%20giant%20taxi%20company%20is%20Uber%20part%20of%20the%20problem%20or%20the%20solut...%20%281%29.pdf

150
existing laws or, in some cases, create new rules, which sometimes restrict the
emergence of these new services. Businesses, on the other hand, miss legal clarity
allowing to take informed decisions about possible investments.398
The recently
updated Sustainable Urban Mobility Planning guidelines399
take these new
developments into consideration but do not constitute a binding legal framework.
4.2.2 Intelligent Transport Systems and connected, automated mobility
4.2.2.1 ITS challenges in road transport
609. Another major trend, relevant both for urban and non-urban environment is the
deployment of Intelligent Transport Systems (ITS) and related solutions, which are
revolutionising the way we move and travel. The general public is well aware of
the innovation ITS have brought about in the mobility e.g. vehicle-navigation
systems, traffic information integrated with navigation, parking systems.
610. Beyond specific ITS use-cases, applying various information and communication
technologies has also a huge potential to fundamentally change mobility across the
modes, making it safer (e.g. by reducing human error in driving), more accessible
(e.g. bringing mobility to those who cannot drive themselves e.g. elderly or
disabled people), more efficient and sustainable (e.g. by making it a lot easier to
share vehicles).
611. Yet, the development and deployment of connected and automated mobility
systems might pose a multitude of challenges: from the development of
technologies for the vehicle, its integration within the multimodal transport system,
its interaction with the surrounding environment and other (in particular
vulnerable) road users impacting road safety to the need for complementary
investments in digital and physical infrastructure. There are also a number of
related policy challenges – from regulation and standards, through ethics and
impact on professional drivers.
612. Public acceptance of this promising technology has not yet been established. The
majority of citizens are not yet ready to simply trust a driverless vehicle to behave
safely, whether inside a car or on a pedestrian crossing. The recent Special
Eurobarometer survey on “Expectations and concerns of connected and automated
driving”400
showed that a majority of those surveyed would feel comfortable in
automated vehicles that are being supervised by a human operator in it, but less
than half say they would feel comfortable in the case where a human operator is
supervising the vehicle remotely. For the time being, a majority would not feel
comfortable in the presence of fully automated vehicles on the roads either. The
transfer of control between machine and driver and under what conditions is one of
the big issues to ensure technology acceptance and safety.
613. As for driving such vehicles, two thirds of respondents would feel comfortable if
they could take back control at any point in time, while for just over half it would
be enough to be able to take back control if the vehicle does not understand the
398Study on passenger transport by taxi, hire car with driver and ridesharing in the EU, 2016;
https://ec.europa.eu/transport/sites/transport/files/2016-09-26-pax-transport-taxi-hirecar-w-driver-ridesharing-final-report.pdf. 399 In particular the dedicated topical guides on integration of shared mobility approaches in SUMP, on Mobility as a Service
(MaaS) and SUMP, and on the role of Intelligent Transport Systems (ITS) in SUMP: https://www.eltis.org/mobility-plans/topic-
guides-0 400Special Eurobarometer 496 on Expectations and concerns of connected and automated driving, April 2020; https://data.europa.eu/euodp/en/data/dataset/S2231_92_1_496_ENG
151
situation.401
But there are also safety considerations with respect to how drivers
take back control (e.g. when an automated car encounters a situation it cannot deal
with, such as an atypical maintenance lane).
614. Part of the issue is that transition to higher levels of automation in road transport
allowing for safe interaction between highly automated and “traditional” vehicles
in “mixed traffic” and with non-motorised road users need to be fully addressed.
Questions related to human-machine interactions and awareness (e.g. how can
other road users recognise highly automated vehicles and predict their behaviour,
where previously there would be eye contact between users) will be at the centre of
this issue.
615. A large part of the answer will come from Cooperative ITS (C-ITS), enabling
direct communication between vehicles and their surrounding infrastructure.
Already today C-ITS based on ITS-G5 is deployed on commercial non-automated
series-vehicles. As highlighted by the 2016 strategy for C-ITS, accelerated
deployment of C-ITS will bring increased road safety and pave the way for higher
levels of automation.
616. A number of Advanced Driver Assistance systems, which have great potential in
preventing crashes and/or their severity, will become mandatory for all new vehicle
models (in 2022) and later for all new vehicles (in 2024) under the revised General
Vehicle Safety Regulation (see also sections 3.4 and 4.3). In order to ensure safe
operation of the assistance systems throughout a vehicle’s lifetime, roadworthiness
testing centres will need access to relevant data.
617. Last but not least, the current traffic rules are not yet fit for higher levels of
automation. Those rules are set by Member States based on international
conventions managed by the United National Economic Commission for Europe
(UNECE). In contrast to UN conventions on vehicle safety, the EU is so far not a
contracting party to the conventions related to traffic rules and only has observer
status, which could hamper its ability to coordinate Member State positions. An
aligned and holistic European approach to global questions on automated driving,
including traffic rules, testing or liability aspects, would be desirable from a single
market perspective and for promoting European industrial global leadership, as
well as in terms of materialization of road safety benefits.
618. For the time being, the legal and policy framework defining links between vehicles
and traffic management, between public and privately owned data, and between
collective and individual transport, are not sufficiently developed. There is no
coordination mechanism at the EU level that would help ensure consistency of the
deployment and management of ITS and CCAM across Europe. There is no
coherent way of implementing a type-approval for connected and automated
vehicles and their emissions testing and roadworthiness inspection methods, for
example.
619. Competition in the automotive industry is shifting from building cars (hardware) to
software-centric, connected services. Moreover, fragmentation in the industry
might affect EU competitiveness significantly, taking into account that industry
approach in Europe could be conservative compared to other developers.
620. In this context, the emergence of new mobile radio communication systems such as
5G and its vertical application to the automotive and transport sectors can act as a
catalyst to accelerate the way towards multi-service mobility and transport
401 Ibid.

152
ecosystems and contribute to the resilience and sovereignty of the European
industry in the field. This strong expectation of multiple ecosystems enabled by a
common 5G network infrastructure associated with connected vehicles and road
infrastructure will enable to combine different technologies, sensors (in vehicles
and on the ground), high accuracy location, precise positioning, high definition
mapping, converged AI on devices, at the network edge (including Mobile Edge
Computing) and in the cloud, and, in particular high quality direct and network
communications between all moving and fixed elements (vehicles, bikes,
pedestrians, and road infrastructure).
621. This vision has been the basis for the CEF Digital programme over the 2021-2027
period, which includes an indicative list of 5G Corridors envisaged for funding,
based on TEN-T corridors. It received the support of leading European industry
associations, ACEA, CEDR, GSMA and 5GAA, through the publication, on 2
October 2020, of a 5G Strategic Deployment Agenda for CAM402
. The roll-out of
5G corridors, in complement with deployment activities in the fields of C-ITS and
CCAM, will provide a strong basis to Europe for the development of the multi-
service ecosystem for mobility and transport.
622. While a number of research, large-scale demonstration and testing projects are
taking place in EU Member States (some with Commission support), they are not
numerous or coordinated well enough across the EU.403
To address the most
pressing challenges, the EU is currently supporting the set-up of a new public
private partnership, based on a vision that maximises the societal benefits of
CCAM and its potential to create new, more inclusive, shared and sustainable
mobility services. This proposed partnership should establish links with other
partnerships (under Horizon Europe), in which activities relevant for connected
and automated mobility are planned.
623. However, even with such a partnership in place, further coordination capacity may
be needed at EU level in relation to the deployment and management of ITS and
CCAM across Europe, including in areas such as road infrastructure, type-approval
and market surveillance, roadworthiness inspection methods, traffic rules for
automated mobility, as well as to other detailed EU level safety and related tasks,
and for the preparation of technical rules, coordination among national authorities'
actions, and collection and analysis of relevant data.
4.2.2.2 ITS challenges in other modes of transport
624. To achieve a truly intelligent transport system, efficient capacity allocation and
traffic management, automation and digitalisation must also be addressed across
other transport modes as they help to avoid a capacity crunch on the one hand and
reduce CO2 emissions on the other.
625. Rail is a highly complex operating environment, consisting of a number of systems
which are or should be automated, and where interoperability between diverse
infrastructure networks and vehicles (rolling stock) is required.
626. The key elements include passenger and freight information (relating to ticket, seat
reservation, freight consignment and location), timetable design (advance planning
to optimise use of network capacity, rolling stock and personnel and allow public
402 https://5g-ppp.eu/wp-content/uploads/2020/10/20201002_5G_SDA_for_CAM_Final.pdf 403 See SWD [XXX], Impact Assessment accompanying the Proposal for a Council Regulation establishing the Joint Undertakings under Horizon Europe. European Partnership for cooperative, connected and automated mobility
153
timetables to be produced, freight services sold etc.), traffic management (near real
time control of operations, to resolve conflicts between trains, prioritise services,
where inevitable real world problems prevent the timetable being operated
precisely as planned), signalling (ensuring switches are set and train movements
controlled to prevent conflicts between trains and get them to their intended
destination), train protection systems (systems on board trains to ensure they do not
pass signals set at danger, and in modern systems, to ensure they do not exceed the
safe speed for the line and signal aspect) as well as train automation (automated
functions drive the train itself – either as an assistance to the driver; taking over
functions from the driver but retaining him for passenger confidence and
emergency tasks, or allowing completely unattended operations).
627. Taking these in reverse order: in rail, automatic train operations (ATOs) are
essential to make the most of capacity while ensuring energy saving, reliability and
safety. While some metros have been automated for many years, higher automation
levels and autonomy on mainlines are not yet ready on main lines, preventing the
appearance of more flexible services. ATO would also allow higher capacity (since
the speed of an automated train can be precisely matched to the minimum safe
distance from the previous train).
628. Introduction of rail automation is much simpler than in road, since the overall
environment is already highly controlled. Nevertheless the availability of common
standards for equipment and train operation, which are needed to ensure
interoperability, is not yet optimal. The standards for Automatic Train Operations
Grade of Automation 1 and 2404
were developed within the S2R JU programme,
and are now available. They will be included in the next revision of the CCS
(Control Command and Signalling) Technical specifications for Interoperability,
scheduled for 2022.
629. In order to reap the full advantages of automation and not to break interoperability,
rail ATO in the EU should be based on the common EU train protection/signalling
system (ERTMS). Despite its name, the European Rail Traffic Management
System does not yet include traffic management – rather it harmonises automatic
train protection and communication systems, which ensure that trains stop where
they need to, and travel at a safe speed for the line that they are on. Efforts have
been made to improve interoperability by replacing 21 obsolete national systems
with one, helping to greatly reduce the cost of rail equipment, growing the capacity
of the rail network, and improving railway safety.
630. However, due to the complexity of replacing legacy systems in Member States (the
system itself needs to be partly installed beside the track and partly on board
trains), as well as its substantial costs, the ERTMS deployment in Europe is slower
than wished. Part of the challenge is that a standard, modular system architecture
for rail control and signalling that would help speed up the deployment of ERTMS
and lower the deployment costs does not exist yet, though this is being addressed
through the Shift2Rail programme and its successor.
631. Network wide deployment is now underway in several member states, with many
others planning it: such deployment allows the legacy systems to be removed
completely. The latest versions of ERTMS (Level 2 and 3) will allow most
trackside equipment to be removed, leading to substantial cost savings for
infrastructure managers over the medium term (estimated at EUR 1bn per year for
404 The train is driven automatically, stopping is automated but a driver in the cab is required to start automatic driving of the train.

154
DE alone). Reduced maintenance needs also increase rail capacity and reliability
since fewer route closures for maintenance are required.
632. Traffic management is another key aspect of achieving smart rail operations. It
helps manage the paths of trains through the network, ensuring they keep to
timetable and re-planning them when things go wrong. Currently this is managed
by a patchwork of tools at regional level.
633. Higher levels of European Train Control Systems (ETCS) and the Future Railway
Mobile Communication System (FRMCS) will accelerate the digitalisation of rail
operations and enable safer and more secure higher traffic density on rail tracks.
Advanced 5G communications systems will contribute to this process, but also to a
better connectivity environment for train passengers. A first version of a Strategic
Deployment Agenda “5G connectivity and spectrum for rail”, released on in April
2020 by the rail infrastructure managers and rail undertakings associations, EIM
and CER, provides guidance to the deployment of 5G connectivity infrastructure
for digital rail operations and ‘Gigabit Train’ for passengers in the perspective of
CEF Digital.
634. The ability of 5G infrastructure to deliver high quality, secure and ultra-reliable
connectivity to both FRMCS and Gigabit Train, as well as to CAM in areas where
rail tracks and roads run in parallel, will enable to speed-up the deployment process
and lower the overall costs.
635. There are also challenges related to automation and traffic management in the
European airspace. Digitalisation holds promise to substantially improve the
situation. Progress has been achieved on the research and innovation side through
the SESAR project. However, today Air Traffic Management (ATM) still relies to
a large extent on an outdated technology.
636. Scalability of ATM - in a safe, efficient and effective way - remains one of the
most important challenges for the sector. Today this is not fully achievable due to
the fragmented and monopolistic nature of ATM in Europe.
637. A true network oriented approach405
to ATM in Europe is also missing. The local
approach to Air Navigation Services provision is less effective and leads to
congestion and capacity crisis whereas experience shows that more effective
network coordination decreases delays and congestion.
638. The shortcomings of the current ATM system lead to a number of environmental
challenges. The congestion above Europe in 2018 and 2019 led to environmentally
sub-optimal flight paths in terms of CO2 emissions, when pilots had to fly around
congested airspace sectors. The way the ATM services are charged is also not
optimal from the environmental perspective. Under the current system, airspace
users optimise their routings by minimising not only the sum of fuel costs, but also
the route charges. This may lead to choosing to fly longer routes because the
charges are lower in a certain charging zone. The overall “benefit pool” of ATM
405 The Airspace Architecture Study, carried out by the SESAR Joint Undertaking in collaboration with the Network Manager and
released on 5 March 2019, defines how Europe’s airspace architecture should look in the medium- to long-term (2025-2035), and
what practical steps would need to be taken to make it a reality. It is estimated that a reduction of nautical miles flown between 4 and 10 NM in 2030 and between 7 and 13 NM in 2035 per flight could be achieved. Considering the traffic forecast up to 2035 as
projected before the outbreak of the COVID-19 pandemic, and linear increase in the reduction of nautical miles saved, the total
benefit was estimated to be between 30 and 60 millions of tons of CO2 over the 2019-2035 time period. That implies optimising
flight trajectories thanks to SESAR solutions such as free route airspace operations, airspace reorganisation and 4D trajectory
management, which can alone generate between 240 and 450 kg savings of CO2 emissions on average per flight. Revised long-term
traffic forecasts for post COVID-19 scenarios are not available at the time of writing this report. It can however be assumed that traffic will resume and pick up again until 2035 and some of this CO2 saving potential can be realised over this time frame.

155
sector is at least 11.6 Mt of excess CO2 emissions that ATM can directly
influence406
.
639. Challenges of automation and smooth integration into a smart transport system are
also relevant for the deployment of drones – a growing business in Europe,
delivering services in all environments (from mapping, infrastructure inspections,
delivery of goods and e-commerce, to mention just a few), with a potential to
reduce congestion, accidents and make mobility cleaner.
640. These ATM challenges are addressed through the Single European Sky framework
and in particular through its technological pillar, the SESAR project. SESAR aims
to establish the ‘digital European sky’ that will allow the optimal use of the
European airspace through innovative technological and operational solutions
based on a high degree of digitalisation and automation. The digital European sky
addresses air and ground operations offering solutions for civil and military
airspace users, airports, air navigation service providers. More efficient flight
trajectories will also allow modern aircraft to fully exploit their greener and quieter
technologies.
641. Drone deliveries can solve last/first mile logistics issues for some areas of Europe.
Analyses by the JRC indicates that under the most technologically realistic
scenario, up to 7% of EU citizens could get access to such services. When
considering technological improvements scenarios, this range is extended to 30%.
Furthermore, results suggest that due the differences in population and land-use
patterns in the different Member States, the potential drone coverage across Europe
could be very heterogeneous, with the Germany, Italy and France appearing as the
most likely countries where drone-beehives may have the most efficient
development407
.
642. Several solutions were successfully demonstrated in Horizon 2020 (e.g. CIVITAS
and the EIP SCC Smart Cities living labs) and with support from the European
Regional Development Fund. Smarter, integrated deliveries will cut overall traffic
and provide better information on delivery times408
, while the use of cleaner
vehicles will help to reduce local pollution levels. These types of solutions can
deliver cascading benefits on the urban mobility systems and are incentivized by
pricing and city interventions – public space allocation for micro distribution
centres on bikes, facilitation between private stakeholders.
643. The deployment of drones may be facilitated by the U-space services, in specific
Geographical Zones defined as ‘U-space’ airspace. U-space services allow drone
operators to rely on a high level of digitalisation and automation, permitting a safe,
efficient and secure access to airspace for large numbers of drones, while
addressing an appropriate interface with manned aviation and air traffic services.
644. Whilst these rules can contribute to counter or mitigate possible security risks e.g.
in case of malicious use of drones at the same time, every incident increases the
risk of losing public trust and acceptance, which are crucial for taking advantage of
the economic and employment opportunities of drones and drone-related services.
Drones pose also a number of urban mobility challenges – flying at very low
406 It should be noted, however, that there are a number of reasons why the actual trajectory flown can vary from the unimpeded
trajectory, and therefore 100% efficiency is not always achievable (e.g. due to adverse weather, avoidance of ‘Danger Areas’, need
to maintain minimum separation). 407 https://ec.europa.eu/jrc/en/publication/last-mile-delivery-drones-estimation-viable-market-potential-and-access-citizens-across-
european 408 The majority (80%) of the time this delivery is not urgent and the Flemish Institute for Logistics has calculated that if three quarters of deliveries were done to picking-up points instead of home, the environmental cost would be reduced by 60 to 80%.

156
levels, they require a rethink of the boundaries of urban and public space, including
urban infrastructure planning, levels of noise and safeguards to ensure citizens’
confidence, for instance in relation to privacy.
645. There are barriers to achieving a fully intelligent transport system in the
waterborne sector as well. In case of Maritime Autonomous Surface Ships (MASS)
there is no EU policy and regulatory framework that would enable and facilitate
cross-border testing and trials at sea. Such testing and trials as for example
undertaken within the Horizon 2020 autoship project409
, is important not only for
such type of ships, but also for the necessary maritime monitoring and control of
such ships in the future
646. First steps to address the situation have been taken through operational guidelines
and the further development of the vessel traffic monitoring and information
system410
in order to enable seamless maritime transport and traffic management of
both manned and unmanned ships. Due to the international nature of shipping,
linking ports of countries worldwide, harmonized technical standards, developed
with an active participation of stakeholders, are necessary.
647. The absence of adequate policy and regulatory framework also applies for Inland
Waterways Autonomous Ships, despite launching several sector initiatives in the
context of Smart Shipping on local and regional level. A holistic view on
automation of the sector, covering adjustments of existing regulations (e.g. on
vessel-, crew-, infrastructure requirements, incentives for the sector to invest in
automation), is missing. Meanwhile, steps have been taken to support the
deployment of harmonised River Information Services (RIS) in order to enable
seamless transport and traffic management on the European inland waterways. The
evolution of RIS needs to take into consideration new requirements stemming from
the digital transformation happening in the sector (e.g. digital ship operator
platforms, port information systems, synchromodality, corridor management,
Smart Shipping, and Inland Waterways Autonomous Ships).
648. The study supporting the evaluation of Directive 2005/44/EC on harmonised river
information services (RIS)411
highlighted that a full harmonisation and
interoperability of RIS has not been achieved yet, due to different speeds in
implementation and varying data quality. Potential adaptions and extensions of the
legal framework on RIS may help closing the harmonisation and interoperability
gaps. Among others, streamlined revision cycles for the RIS technical
specifications in the European Committee for standards in the field of inland
navigation (CESNI) could facilitate the evolution of RIS towards Smart Shipping
and help the digital transformation of the sector with a view to the synchromodal
developments in transport.
649. Further support through the Connecting Europe Facility Programme would
contribute to the implementation of River Information Services (RIS) on national
as well as river corridor level as required by the TEN-T Regulation in order to
ensure a smooth transition into full operation of RIS until 2030.
650. Whereas the digital transformation of maritime ports is progressing fast, smaller
inland ports are often lagging behind in the digitalisation of business processes and
the digital integration of hinterland transport chains. This issue could be addressed
409 https://www.autoship-project.eu/ 410 Directive 2002/59/EC of the European Parliament and of the Council of 27 June 2002 establishing a Community vessel traffic
monitoring and information system and repealing Council Directive 93/75/EEC, OJ L 208, 5.8.2002, p. 10. 411 https://op.europa.eu/en/publication-detail/-/publication/1f0e2c53-7ebe-11ea-aea8-01aa75ed71a1

157
by actions supporting the implementation of single windows and port community
systems for inland ports, building upon the established frameworks and
experiences of their maritime counterparts and using the full potential of existing
and emerging river information services.
651. The Commission services have started preparatory work related to a smart
tachograph for Inland Waterways (IWT), which could improve the functioning of
the IWT market, minimise the administrative burden, improve enforcement and
increase the uptake and acceptance of electronic documents/solutions. This is part
of a broader effort to create a modern, coherent, flexible and well-enforceable
legislative framework at the EU level for IWT, facilitated also by digital tools, as
requested by the EU social partners.
4.2.3 Innovation and mobility of the future
652. Achieving the Green Deal in the field of mobility, making full use of digitalisation
and maintaining the EU industry’s global competitiveness cannot happen without
research and innovation support.412
For example, R&D investments in the
automotive industry reached EUR 57.4 billion in 2018, i.e. 28% of EU spending
(source ACEA) 413
, mainly on clean vehicles and also a large amount spent on
digitalisation and mobility of the future. There is currently a risk of significant
decrease in the R&D effort which has major spill-over and cross-fertilisation
effects for other sectors of the EU economy and competitiveness.
653. The research and innovation framework programme Horizon 2020 already
deployed EUR 5 billion for the period 2014-2020 to develop and test innovative
solutions for seamless, green, integrated, inclusive, affordable, safe, secure and
resilient transport systems. Furthermore, research and close-to-market innovation is
supported by the European Regional Development Fund, within the framework of
Smart Specialisation. By investing in both technology and socio-economic
research, pooling resources and sharing risks, the programme supported improving
the transport sector’s efficiency in the use of natural resources and reducing its
dependence on fossil fuels, thus reducing its environmental impact while
sustaining the European transport manufacturing industries and related services to
maintain or take worldwide leadership. Facilitating strategic planning and a trans-
national approach to common European and global problems, it tackled growing
mobility needs for people and goods and enabled public acceptance and uptake of
new technologies.414
654. However, challenges still persist as far as the full innovation cycle from policy-
based need for research to large market deployment is concerned. The transport
sector requires a close alignment between R&I initiatives for specific modes and a
systemic approach towards a multimodal integrated transport system that is safe,
secure, efficient, affordable, sustainable and based on user needs for hassle-free
door-to-door passenger mobility and freight transport. However, this is still not the
case.
655. There is currently still an insufficiently strong pathway between R&I projects,
policy development and the market introduction of innovation. Furthermore the
412 STRIA roadmap on mobility service, 2019 413 SWD(2020) 98 final 414 Interim evaluation of Horizon 2020 (Commission Staff Working Document, SWD(2017)220 and 221)

158
coordination needed between EU and national funding programmes (where about
80% of public R&I funding is programmed) is not yet optimal.
656. The transport sector with its large assets (esp. aircraft, trains, vessels) and long-
term investment cycles for infrastructure (roads, rail, ports, inland waterways,
airports and traffic management) also requires specific strategic approaches for
large scale innovation deployment. It is expected that this can best be achieved by
specific public-private partnerships such as in aviation (Clean Sky and SESAR)
and rail (Shift2Rail), if accompanied by a suitable regulatory framework and
market measures to ensure uptake of results. Similar initiatives are being
investigated to achieve zero emission waterborne transport and for connected,
cooperative and automated mobility as well as clean road transport.415
657. Under Horizon 2020416
and in the framework of smart specialisation thematic
platforms417
, partnerships have successfully engaged major, strategic industrial
partners in research and innovation in the respective industrial sectors, thus
becoming important drivers for a systemic transformation strengthening Europe's
competitiveness. They helped respond to major socio-economic challenges in areas
where well-identified market risks and fragmentation require a long-term concerted
effort. They also linked activities across the innovation cycle, from research
outcomes to closer-to-market activities, facilitating the creation of an internal
market for innovative technologies, products and services. These partnerships will
have to strengthen even further their impact, accelerating research, development
and demonstrations of innovative technologies and operational solutions as well as
increasing market uptake. They are expected to develop close synergies with
national and regional initiatives, acting as dynamic change agents, strengthening
linkages within their respective ecosystems and along the value chains, as well as
pooling resources and efforts towards the common EU objectives.
658. The need for systemic change in transport also requires a new approach between
innovations in those sectors relevant for this transformation. The decarbonisation
of transport can only be successful in close collaboration with the energy sector
and its work on smart electric grids, batteries and production of innovation
alternative fuels (hydrogen, biofuels, and synthetic fuels). Digitalisation and
automation in transport relies on technology transfer and application of latest
technologies in the areas of big data, artificial intelligence as well as information
and communication technologies.
659. Activities of citizens’ engagement can be promoted in order to involve a
representative group of people in the co-design of the future transport system, to
increase awareness about the potential added value of new technologies in their
daily life and to ensure the development of a transport system properly addressing
peoples' needs while recognising their diversity. A network of ‘European Living
Labs’ could be established in order to engage with citizens at a local and practical
level.
660. Mastering the threefold challenges of GHG neutrality, digitalisation and
competitiveness requires much higher efforts and funding for R&I than in the past.
A more integrated approach has been proposed with a common R&I cluster on
415Orientations towards the first Strategic Plan for Horizon Europe, Annex 7
(https://ec.europa.eu/info/sites/info/files/research_and_innovation/strategy_on_research_and_innovation/documents/ec_rtd_orientati
ons-he-strategic-plan_122019.pdf) 416 Interim evaluation of the Joint Undertakings operating under Horizon 2020 (Commission Staff Working Document, SWD(2017)
338) 417 https://s3platform.jrc.ec.europa.eu/mobility

159
climate, energy and mobility. EU support to R&I will be vital to avoid fragmented
approaches and prepare larger European markets for innovation uptake. Financial
instruments such as blending under InvestEU or under the EIC can leverage private
innovation deployment funding.
661. In addition, so far the EU has not yet developed a coherent policy and research
framework related to “mobility of the future” innovations. Often cross-modal, and
not so long ago only abstract ideas, technological breakthroughs and innovative
business models requiring new policy and regulatory solutions are maturing at a
very fast pace with physical prototypes and projects springing around.
662. Furthermore, mobility is facing a massive transformation, as new digital
technologies enable innovative related businesses. As such, a redesign of
conventional siloed approaches to transportation modes and mobility is taking
place, blurring the traditional roles. This phenomenon is amplified with the
entrance of new actors from other sectors.
663. Hyperloop for example418
, is a concept which essentially allows the transport of
people and goods at very high speeds via magnetically levitated (mag-lev) pods in
vacuum tubes. Potential speeds of over 1000 km/h are in theory possible. Thus it
could potentially compete with aviation over long distances – while being
electrically powered and thus readily decarbonised.
664. The technology is still at an early development stage, with its true economic and
technical feasibility still to be demonstrated. Nevertheless, given its potential it is
important that the EU can help to assess the potential of the new technology and
potential services and can support the development of a suitable regulatory,
standardisation, safety and interoperability framework.
665. At the same time some of the brightest engineers in the world are racing to make
previously science fiction personal air vehicles a reality. While none are ready to
fly yet commercially, some industry representatives point to the possibility to
having them ready in the near future, with tests starting as early as 2020/2021.419
666. While many of Europe’s strategic competitors have pushed ahead with developing
an enabling environment for emerging technologies, the case for Europe to become
the test bed and pilot deployment destination for these innovative and potentially
game-changing technologies is not obvious. While inventors and investors are
ready to test them, it is often not clear how these new transport means should be
approached from a regulatory point of view, in particular, with respect to
traditional vs adaptive and flexible regulatory responses. The EU is often
considered too complex and not ‘friendly’ enough to deploy new ideas. EU
Member States may also be tempted to proceed on their own to gain a competitive
edge and avoid lengthy coordination processes.
4.2.4 Digital enablers
667. The transition towards smart mobility - more efficient, user-friendly and
sustainable can only happen if the right digital enablers are in place. In this regard,
shaping a proper data economy for mobility; analysing available spectrum and
needs; boosting connectivity infrastructure deployment; or designing a clear
418
Another concept being considered is that of underground freight transport.
https://www.admin.ch/gov/fr/accueil/documentation/communiques.msg-id-80871.html 419 See e.g.: https://www.digitaltrends.com/cars/all-the-flying-cars-and-taxis-currently-in-development/

160
framework for using Artificial Intelligence and other breakthrough technologies,
should be fundamental pillars towards the successful transport transformation.
4.2.4.1 Data for smart transport and mobility
668. Data is at the heart of this digital transformation. Exchanging data is a prerequisite
for a seamless passenger experience across modes, allowing integrated planning,
ticketing, and purchase. Furthermore, exchanging data enables operators to
optimise their operational and maintenance processes. In addition, data governance
should be based on a systemic approach in which all sectors benefit from the data
exchange, especially when implementing smart cities. The industry is actually
requesting more action on the connectivity side, data governance, data sharing, and
communication.
669. Interoperability is a precondition for successfully linking data flows and distributed
systems across sectors, borders and transport modes – and with related areas such
as security, energy, health, environment etc. The European Interoperability
Framework420
is currently under review as part of the Commission’s commitment
to presenting a strengthened EU interoperability strategy by the end of 2021. This
will directly support sectoral digital transformation strategies, such as mobility.
670. Data exchange is equally important for smoother logistics, so that choices on
transport modes and routes could be made and adjusted in real time, based on
traffic conditions, availability of vehicles, vessels and infrastructure, cargo location
and final destination. Transport and logistics operators need sufficient information
on the network and traffic conditions to be able to predict reliable journey times
and optimise costs, energy consumption and environmental impact – from tackling
congestion to minimising local air pollution. Information on planned works or
capacity restrictions is needed to plan for the most suitable modal choice to make
effective multimodal transport, integrating all modes of transport a reality. Real-
time information on the localisation of goods and their transhipment would also
enable the activation of smart contracts linked to goods handling along the logistic
chain, making the EU logistics more efficient as a whole and enabling door-to-door
service.
671. The use of infrastructure and therefore optimisation of capacity could also be
improved thanks to services based on data exchange. For driverless vehicles and
trains, on their part, timely access to information on physical infrastructure usage
rules (e.g. traffic rules for road transport) could be paramount for correct
functioning.
672. The access to real-time traffic and logistics data in freight transport is crucial to
ensure smooth flow of goods across the European borders and contribute to
reducing empty runs. The Galileo Green Lane App allowing for real time
visualization of congestion at the European road border crossing points proved its
benefits in facilitating cross-border carriage of goods in the time of cross-border
traffic restrictions introduced by the Member States due to COVID-19 pandemic.
673. Data is also key for improving road safety. Large amounts of in-vehicle data that
are extremely valuable for traffic management, roadworthiness tests, investigation
of crashes (particularly useful in terms of road safety for those resulting in fatality
420
https://joinup.ec.europa.eu/collection/nifo-national-interoperability-framework-observatory/eif-european-interoperability-
framework-0 https://ec.europa.eu/isa2/shaping-future-interoperability-policy_en

161
or serious injury, and in the longer run, also for the analysis of incidents and “near
misses”) are already generated in all recent vehicle models, and volumes of such
data are set to increase with higher levels of automation.
674. Data is key for improving aviation safety. Based on EU research and TEN-T
programs, EASA launched the initiative Data4Safety, for secured identification of
anomalies and potential incidents precursors by analysing operational data from the
operators that voluntary participate in the initiative.
675. To take advantage of the opportunities presented by the data economy, several
modal and multimodal rules have already been put in place, though challenges
remain.
676. The Intelligent Transport Systems Directive and four of its Delegated
Regulations421
mandate the creation of National Access Points (NAP) as a single
point of access for users to the ITS data to facilitate access, easy exchange and
reuse of transport data (multimodal, road safety-related, safe and secure parking,
real-time traffic and travel data). Since the adoption of the delegated regulations,
National Access Points422
have been established in most Member States and
although implementation is not yet complete, the developments represent
significant progress in setting up an EU backbone infrastructure for ITS data.423
677. Those early stages of implementation made it already apparent that Member States
are faced with common challenges and are looking for common solutions through
working further together. Yet, currently there is no place where NAPs operators
and National Bodies/competent authorities can work together on common issues
related to the development, operation and evolution of NAPs or on new challenges
such as e.g. data collection activities and negotiations with private data providers
and/or global players. Therefore, as announced in the European strategy for data in
February 2019, the Commission will establish a stronger coordination
mechanism to federate the National Access Points established under the ITS
Directive and contribute to the development of the common European mobility
data space.
678. Also, although NAPs allow data to be shared, the usage of the data provided by
them is still relatively low, partly due to the fact that they have been created only
recently. The services related to the exchange of static road attribute data used for
updating digital maps are an exception, progressing well but in need to expand to
local levels. For the multimodal information services a lot of static data (such as
schedules and basic fares for all transport modes) has also become more accessible.
Still, the accessibility of dynamic data (e.g. real-time information on disruption and
delays, dynamic fares and seat availability) has been left to discretion of Member
States making it difficult for service providers to have access to them.
679. Despite the legislation in place, reluctance to share data continues to be a limiting
factor. This is due to issues of lack of trust, high expected costs and unclear
benefits for those providing the data.424
Also, the quality of safety-related data is
not yet optimal. Last but not least, the data layers (e.g. road and multimodal data,
421 Directive (EU) 2010/40 of the European Parliament and of the Council on the framework for the deployment of Intelligent
Transport Systems in the field of road transport and for interfaces with other modes of transport and its four delegated Regulations: (EU) 885/2013 (provision of information services for safe and secure parking places for lorries and commercial vehicles); (EU)
886/2013 (data and procedures for the provision, where possible, of road safety-related minimum universal traffic information free
of charge to users); (EU) 962/2015 (the provision of EU-wide real-time traffic information services); (EU) 1926/2017 (the provision
of EU-wide Multimodal Travel Information Services). 422 https://ec.europa.eu/transport/themes/its/road/action_plan/nap_en 423 SWD(2019) 368 final Ex post evaluation of the Intelligent Transport Systems Directive 2010/40/EU 424 Ibid.

162
traffic and travel data) are not yet structured and coordinated well enough and tools
allowing effective accessibility, exchanging and data collection are missing.
680. Similarly, through-ticketing for railway journeys, allowing passengers to purchase
one ticket covering multiple operators and networks, is not systematically available
in the European Single Railway Area. Technical preconditions for the issuing of
through-tickets are met, inter alia through TAP TSI and industry initiatives, but
underlying commercial agreements between railway undertakings and between
railway undertakings and ticket vendors are lagging behind. The same is true for
multi-modal ticketing.
681. Further progress is also needed to develop comprehensive digital solutions to
facilitate effective management of multimodal transport flows. At the moment,
operators are often requested to report information on cargo on board several times
to several authorities, and the potential of the re-use of data is not fully exploited.
Legal acts introducing sectoral reporting obligations for maritime transport (such
as health, border controls, customs, transport) have been developed in an isolated
manner so transport operators have to deal with a patchwork of processes and data
requirements.
682. The implementation of the Maritime Single Window Regulation and Regulation on
Electronic Freight Transport Information425
, covering a major part of business to
government data exchange will take place in coming 5 years until 2025.
683. The European Maritime Single Window environment, once fully implemented,
will guarantee harmonised submission and reuse of data under ship related
reporting obligations for all EU port calls through national single windows.
Furthermore, the EU Customs Union is already equipped with several EU-wide
(trans-EU) IT systems and a diversity of national systems and a diversity of
national systems. Harmonisation of processes and data in the area of customs is
ongoing. In addition, further legal work is needed to harmonise different sectorial
data requirements.
684. For cargo documentation, the application of the Regulation on Electronic Freight
Transport Information426
(eFTI) as of 2025 is expected to allow industry to cut
administrative costs for the equivalent of 75-102 million work hours yearly,
leading to overall savings between EUR 20 and EUR 27 billion until 2040427
.
Paper sheets for the equivalent of up to 900.000 trees annually would also be
saved, and better integration of transport information flows across the different
transport modes should facilitate efficient multimodality, with positive impacts on
emissions reduction. However, the regulation covers only cargo related
information, while the other documentation required for transportation, related to
vehicles and drivers, is handled by a number of separate systems. For full user
benefits, the eFTI data sharing environment should be in the future interlinked with
the systems handling vehicle and driver data, by providing for their interoperability
and interconnectivity. Further interconnectivity should also be explored with the
EU e-customs and maritime single window environments.
685. For the inland waterways, the introduction of harmonised River Information
Services (RIS) supports the sector’s digitalisation progress.
425 COM(2018) 279 - 2018/0140/COD 426 COM(2018) 279 - 2018/0140/COD 427Impact assessment accompanying electronic Freight Transport Information Regulation, https://eur-lex.europa.eu/resource.html?uri=cellar:810e3b10-59bb-11e8-ab41-01aa75ed71a1.0001.02/DOC_1&format=PDF

163
686. However, there are still areas, in particular in road transport, where digital
exchange of information is not yet universally accepted.
687. Despite progress made across different modes (with respective challenges, the real
data economy in the transport sector has not yet been realised due to the lack of a
well-functioning data ecosystem for the transport sector as a whole (beyond mere
reporting and business-to-administration data exchange). Existing data is not
sufficiently shared neither within nor across modes, due to different standards,
habits, lack of trust, commercial sensitivities and, in certain cases, data ownership
concerns. Data availability and willingness to share is hampered by the absence of
a ‘trusted environment for data sharing’ across mobility sectors where transport
operators, users, infrastructure managers, public authorities, agencies, and other
relevant stakeholders can easily connect and exchange data in a secure and
interoperable way.
688. For example, in case of EU-wide multimodal ticketing and payment systems
distribution of relevant data (e.g. on fares) is vital for those services. But currently,
transport service providers can exclude third parties from the further use of their
data. 428
A single booking for a door-to-door multimodal delivery, with options for
a time of the delivery, cost and its environmental impact, is not yet possible either.
Harmonised real-time multimodal cargo, carrier and traffic information together
with interoperable optimisation tools would facilitate the dynamic and automated
re-routing of cargo, thus, constantly ensuring the optimal match with the set
conditions.
689. Many public and private sector organisations have already platforms in place
facilitating data sharing in support of business and legal compliance processes.
However, sharing information on a more universal basis requires interoperability, a
trusted and secure environment, harmonised procedures and data models. The
Digital Transport and Logistics Forum (DTLF) will facilitate the access to data
through developing solutions for interconnecting existing sources of information
and data platforms and defining minimum service levels. It supports not only the
implementation of the Regulation on Electronic Freight Transport Information for
business to administration data exchange, but aims at establishing a technical,
organisational and legal framework and governance structure for cost-effective and
secured business to business data exchange.
690. Clear and transparent rules on data sharing within and across modes are also
necessary to prevent a potentially distorting situations, in which the incumbent or a
single platform dictates transport conditions. In the current set-up a few actors in
the value chain might have a near monopoly on certain types of key data sets
limiting the innovation capacity of other actors as well as the potential for new
entrants.
691. An example of this is when vehicle manufacturers or digital platforms owners have
a privileged access to car data and to vehicle resources, proposing services directly
to the driver and not allowing for fair competition between service providers.
Similar for mobility platforms, ticketing and payments systems, where main
operators are reluctant to give access to their data. This was also the case in air
ticket distribution in the past and led to the adoption of the Regulation on a Code of
Conduct for computerised reservation systems (CRS)429
. However, due to market
428 “Remaining challenges for EU-wide integrated ticketing and payment systems”, European Commission, Grimaldi Studio Legale ,
VVA , Wavestone, 2019 429 Regulation 80/2009. The first Regulation on a CRS Code of Conduct was adopted in 1989.

164
and technological changes, there are questions as to whether the objectives of the
CRS Code of Conduct are still relevant, and whether it remains fit for purpose.430
692. Urban mobility will greatly improve if data exchange models and cross-sectoral
platforms are properly defined and accommodated, for instance through good
practices on implementing interoperable urban digital platforms for cross-domain
data management, building capacity for creating urban digital twins and promoting
AI-enabled urban data services.
693. In view of the above, and in order to take advantage of the opportunities of the data
economy and to position Europe at the forefront of the development of an
intelligent transport system, in its Communication on a European Strategy for
Data, the Commission announced it would create a common European mobility
data space to facilitate access, pooling and sharing of data from existing and future
transport and mobility databases and platforms.431
4.2.4.2 Artificial Intelligence, 5G and other key enabling technologies
694. This untapped data potential is also likely to hamper the possibility of reaping the
benefits of key technologies such as Artificial Intelligence (AI). At the moment,
the sector does not have a comprehensive roadmap that would allow it to unlock
the full potential of AI, also beyond data issues, and manage related challenges in
transport and logistics sectors.
695. The Commission has so far developed a horizontal approach to AI. The AI strategy
adopted in 2018432
is based on three pillars: boosting EU technological and
industrial capacity and AI uptake across the economy; preparing for socio-
economic change, and ensuring an appropriate ethical and legal framework. In
May 2019, the Commission also published a Communication on AI’s
trustworthiness, designed to increase its public acceptance. The Communication
presented the ethics guidelines and announced the pilot phase to refine the
assessment list that helps organisations implement these guidelines. 433
In the
following White Paper on Artificial Intelligence - A European approach to
excellence and trust434
, the Commission further elaborated the need to focus on a
two-pronged approach in AI: building an ecosystem of excellence and an
ecosystem of trust.
696. Recognising the benefits of AI, the EU has funded many projects in this domain.
The new Digital Europe Programme will provide further funding for AI projects,
including for testing AI, including embodied AI, use across different sectors. With
the funding of research and innovation in AI in the Horizon Europe and Digital
Europe programmes respectively, the Commission is also shaping the European AI
landscape, in order to build it on European strengths and be in line with European
values. In the mobility sector several specific applications already show high
potential – e.g. automated driving (which relies on on-board ability to combine
planned data and real-time data often consisting of images, to optimise
performances – including on energy, and ensure high level of safety), predictive
functions (of maintenance / emergencies or dysfunctions, computation of Expected
Time of Arrival).
430 COM(2020) 9 final 431 COM (2020) 66 final 432 COM(2018) 237 final 433 COM(2019)168 final 434 COM(2020) 65 final

165
697. The Commission has so far developed a horizontal approach to AI. The AI strategy
adopted in 2018435
is based on three pillars: boosting EU technological and
industrial capacity and AI uptake across the economy; preparing for socio-
economic change, and ensuring an appropriate ethical and legal framework. In
May 2019, the Commission also published a Communication on AI’s
trustworthiness, designed to increase its public acceptance. The Communication
presented the ethics guidelines and announced the pilot phase to refine the
assessment list that helps organisations implement these guidelines.
698. Recognising the benefits of AI, the EU has funded many projects in this domain.
The new Digital Europe Programme will provide further funding for AI projects,
including for testing AI use across different sectors. In the mobility sector several
specific applications already show high potential – e.g. automated driving (which
relies on on-board ability to combine planned data and real-time data often
consisting of images, to optimise performances – including on energy, and ensure
high level of safety), predictive functions (of maintenance / emergencies or
dysfunctions, computation of Expected Time of Arrival).
699. In parallel, mode-specific initiatives in the field of AI have also emerged.
Eurocontrol, together with the European Commission and a wide range of partner
organisations set up a European Aviation High Level Group on AI (the EAAI
HLG) with the goals of advancing the understanding among aviation/ATM actors
of AI and its potential, demystifying the topic, and helping accelerate the uptake of
AI in the aviation sector. The “FLY AI Action Plan” published in March 2020
provided a series of recommendations, notably to create a federated AI
infrastructure containing historical data for training purposes and to develop AI
applications, together with an appropriate governance structure. It also
recommended accelerating the deployment of AI notably in the areas of cyber and
non-safety-critical applications, as well as to conduct more AI research to help
respond to the safety-criticality of aviation/ATM operations.436
700. In the rail sector, AI can be used for predictive maintenance, mobility
management, and the creation of new smart services. Business analytics coupled
with Artificial Intelligence can improve the status and reliability of rail
components, as well as provide reliable transport demand forecasts, therefore
allowing the network to be used at its optimal capacity and cost-efficiency.
701. Artificial intelligence is becoming increasingly important for the maritime industry
as well. The rise of automation in the maritime supply chain along with the
demand for more autonomous shipping has led to an increase in the demand for AI.
Predictive maintenance, intelligent scheduling, and real-time analytics, are among
possible applications, on sea but also for inland navigation.
702. Road transport is one of the sectors where the automation of driving assistance
systems has most successfully been applied, and where the application of AI may
open up entirely new possibilities for entering onto higher level of vehicle
automation, connectivity and cooperation between various road users.
703. However, AI faces limitations and challenges like any other technology. Data is the
foundation of all AI systems – quality (including as regards representativity),
quantity, integrity and legality are important factors. It also faces challenges, such
435 COM(2018) 237 final 436 https://www.eurocontrol.int/publication/fly-ai-report

166
as the need to comply with safety, personal data protection rules and to resist
cybersecurity risks.
704. In the transport sector it is also crucial to assess if the introduction of AI might
create new safety risks that are not taken into account in the current safety
legislative framework. Certification processes in transport are traditionally based
on technical specifications. The use of software is already encompassed in them,
but only for fully predictable outcomes, which is not the case for AI and machine
learning, posing also additional challenges related to liability.
705. Data and services derived from space systems, including satellite images, satellite
navigation and satellite communications are key enablers for smart and sustainable
transport. Galileo – Europe’s Global Navigation Satellite System (GNSS) is
providing enhanced quality and range of services, unaffected by strategic choices
(being the only civil Satellite-based Positioning, Navigation and Timing system
worldwide). Among its potential, Galileo, reinforced by a regional European
Geostationary Navigation Overlay Service (EGNOS), could dramatically change
traffic management, simplify signalling and enhance its performances, leading to a
strong increase in capacity, combining various transport modes. Galileo is also a
critical component for connected and autonomous driving thanks to its unique
features of decimetre-level accuracy and signal and data authentication.
Copernicus, Europe’s Earth Observation Programme, is providing data and
information that help underpin the modal shift of transport in urban areas towards
more sustainable and smart mobility.
706. The availability of adequate, efficient harmonised radio spectrum for critical
applications in the transport sector is another vital enabler for the successful
digitalisation of the transport sector. On the one hand, seamless and continuous
broadband connectivity for passengers is required while on-board of any transport
mode for best use of commercial services offered to users by Mobile Network
Operators.
707. On the other hand, vehicles rely more and more on connectivity depending on the
performance of the network while transport safety cannot be compromised. This
brings about new challenges. In the case of rail, the safety critical applications are
based on the obsolete GSM technology and legacy infrastructure, which is being
progressively phased out. The phase in of a new technology, based on 5G, will
require a migration before the final decommissioning of the existing radio system.
However, the current spectrum allocation imposes constraints for the co-existence
of the two systems and technological solutions causing a capacity challenge.
708. 5G itself is expected to become a major enabler for the digitalisation of transport
and the emergence of new mobility solutions in Europe. It will come with high
reliability, mission critical services, and a distributed and flexible architecture. To
reap its benefits, comprehensive coverage of the whole transport network and the
continuity and evolution of existing services are needed.
4.3 The challenge of making the transport sector more resilient
709. In order to make the twin transition to sustainable and smart mobility and transport
truly successful and the whole system more resilient, in addition to specific
measures to increase the sector’s crisis resilience, there is need to boost investment,
upgrade EU transport infrastructure and modernise fleets, while deepening the
167
Single Market, and providing fair social conditions for workers and making
mobility just and fair for users. All while ensuring that safety and security remain
paramount.
4.3.1 Crisis resilience and management
710. As described in section 2, the transport sector has been heavily hit by the
pandemic. From the onset of the COVID-19 pandemic, the Commission has been
working with Member States to ensure economic continuity and to ease the shock,
notably by maintaining the flow of freight, preserving the supply chains, and
securing essential travel, as well as ensuring the functioning of the Single Market
and maintaining the highest levels of transport safety and security.
711. The COVID-19 pandemic has shown that it is important to have adequate crisis
management and support structures in place that can be quickly activated as needed
and that provide a well-defined, predictable and reliable framework for reacting to
crises that affect the transport sector. Such a framework could comprise different
components dealing with the various challenges that the transport sector could face
in the case of various shocks. Efficient and effective joint coordination structures
and mechanisms at EU-level could ensure a common response and actions that are
harmonised, complimentary and in full respect of the acquis and basic EU
principles. In the Council conclusions of October 2020437
, the Council asked the
Commission to swiftly draw up a pandemic and other major crisis contingency
plan for the European freight transport sector and to extend, where appropriate, the
contingency plan to passenger transport and transport in general. The Council also
stressed that in major crisis situations, the TEN-T corridors and other essential
cross-border connections should be kept operational.
712. The COVID-19 pandemic has in particular highlighted the importance of
maintaining essential transport services at all times. In that regard measures are
needed to protect the survivability and business continuity of the sector, including
clear and non-discriminatory rules on financial support.
713. The temporary State aid framework set up during the COVID-19 pandemic allows
Member States to support the transport sector during the crisis by providing
emergency liquidity. At the same time, the integrity of the Single Market and level
playing field for operators must be maintained, including by ensuring that there is
no discrimination among incumbents and new market entrants, and that no new
barriers for competition are introduced.
714. Furthermore, regulatory and technical specifications and standards are needed in
crises situations in order to ensure the functioning of the transport system, for
instance through health and sanitary protocols. The relevant components could be
developed on the basis of the work done and lessons learned during the COVID-19
pandemic as well as previous relevant crisis situations.
715. The pandemic has proven that the European transport system is fragile and further
efforts are needed based on the lessons learnt through the actions taken during the
crisis. In particular as regards the impacts of climate change, from road and rail
networks to ports, airports and inland waterways, critical transport resources are
facing unprecedented threats from a climate, which is already changing. The need
437 https://www.consilium.europa.eu/en/press/press-releases/2020/10/23/pandemic-contingency-plan-for-freight-transport-council-adopts-conclusions/

168
for climate-proofing has become an essential consideration and priority for the
transport sector.
716. The European Green Deal notes – in the context of a new, more ambitious EU
strategy on adaptation to climate change – that climate change will continue to
create significant stress in Europe in spite of the mitigation efforts.
717. Flooding from high precipitation and extreme storms, in possible association with
related impacts including landslides and slope failures, will bring major risks
across the region for all modes of transport (road - and airport - infrastructure,
railway and inland waterways). At the same time there is also greater risk of
increased water scarcity and low water levels in our waterways.
718. Rising sea levels and greater wave activity causing erosion put vital coastal
transport infrastructure (i.e. coastal roads, railways, seaports and airports) at risk.
Over 60% of EU seaports438
may be under high inundation risk by 2100, causing
disruptions to operations and damages to port infrastructure and vessels, especially
along the North Sea coast, where the traffic of over 500 ports accounts for up to
15% of the world’s cargo transport.
719. Rising temperatures linked to increased heatwaves and drier and hotter summers
will affect roads and railways, where pavement damage and damage to track and
electricity catenary, damages to bridges and increased landslides in mountainous
areas are among key risks. Areas considered particularly worthy of more detailed
analysis include roads in Southern Europe (South-Eastern France, Italy, Western
Balkans, Portugal, Spain, Greece and Turkey) as well as in Nordic countries
(Norway, Sweden and Finland). Climate proofing not only individual infrastructure
investment projects, but also existing transport corridors, networks and systems
will be increasingly relevant, as the majority of the existing infrastructure is built
for the past climatic conditions439
.
720. Strengthening the efforts on climate-proofing, resilience building, prevention and
preparedness is crucial. Work on climate adaptation should continue to influence
public and private investments, including on nature-based solutions. It will be
important to ensure that across the EU, investors, insurers, businesses, cities and
citizens are able to access data and to develop instruments to integrate climate
change into their risk management practices.
721. The capacity of infrastructure is also closely linked to the resilience of
infrastructure in the case of disruptions. For rail, to improve the international
contingency management, European rail infrastructure managers have unanimously
approved the International Contingency Management Handbook and its
implementation from timetable period 2019. The purpose of the handbook is to
define standardised procedures that allow continuation of freight and passenger
traffic flows at the highest possible level despite an international disruption and to
assure transparency of the status of the disruption and its impact on traffic flows
for all relevant stakeholders across Europe. The Commission is following up on its
implementation. However, recent incidents in which the Handbook has been
applied have shown that there are limits to improving the resilience of railway
438UNECE: https://www.unece.org/info/media/presscurrent-press-h/transport/2020/unece-study-maps-transport-infrastructure-at-
high-risk-due-to-climate-change-in-pan-european-region-and-canada/doc.html 439 For example: According to the European Federation of Inland Ports (EFIP) and Inland Navigation Europe (INE) (part of their
submission for the open public consultation on the Sustainable and Smart Mobility Strategy) in 2018 the prolonged low water levels of the Rhine resulted in a decrease of Germany’s industrial production by EUR 5 billion.

169
networks via operational measures. In certain cases, infrastructure investments will
be unavoidable to create additional possibilities for rerouting traffic.
722. In addition, ensuring the resilience of transport and mobility against various
security threats is essential. For example, as all transport modes become
increasingly technology-dependent, cyberattacks can have a paralysing impact on
our economy and could potentially cause accidents and casualties.
In response to the COVID-19 pandemic, the Commission took a number440
of steps
at EU level relevant for the transport sector, which can be divided into two broad
categories:
1. Measures to help Member States manage the crisis at the borders, enabling new
health measures to be introduced while sustaining supply chains and availability of
goods and essential services across the EU:
- issued Guidelines for border management measures to protect health and ensure
the availability of goods and essential services (16 March)441
;
- invited Member States to designate the relevant internal border-crossing points
of the TEN-T network as well as additional major border-crossing points to the
extent necessary, as “green lane” border crossings; and urged Member States to set
up safe passage transit corridors along the entire TEN-T network (23 March)442
;
- recommended the suspension of all types of driving restrictions in place (week-
end bans, night bans, sectoral bans, etc.) for freight transport and asked Member
States to consider the urgent suspension of the ban on transport workers spending
rest periods in vehicle cabins (23 March)443
;
- asked Member States for a better tailored application of rules such as travel
restrictions, visa and other requirements for transport workers (23 March)444
;
- issued guidelines to facilitate air cargo operations (26 March)445
;
- presented practical guidance to ensure the free movement of critical workers (30
March)446
;
- adopted guidance on repatriating cruise ship passengers and protecting ship
crews, including sanitary advice, recommendations for crew changes,
disembarking, and repatriation for seafarers and passengers (8 April)447
; and
- adopted a package of measures to support the transport sector448
solving
operational problems, removing administrative burdens, and increasing regulatory
flexibility (29 April)449
.
440 The text box provides an illustrative, non-exhaustive list of measures taken. The full overview of activities can be found at:
https://ec.europa.eu/info/live-work-travel-eu/coronavirus-response_en#euactions 441 C(2020) 1753 final, , OJ C 86I, 16.3.2020, p.1. 442 C(2020) 1897 final, OJ C 96I, 24.3.2020, p.1. 443 C(2020) 1897 final, OJ C 96I, 24.3.2020, p.1. 444 C(2020) 1897 final, OJ C 96I, 24.3.2020, p.1. 445 C(2020) 2010 final, OJ C 100I, 27.3.2020, p.1. 446 C(2020) 2051 final, OJ C 102, 30.3.2020, p.12. 447 C(2020) 3100 final, OJ C 119, 14.4.2020, p. 1. 448 https://ec.europa.eu/transport/media/news/2020-04-29-coronavirus-package-measures-support-transport-sector_en 449 Apart from aviation (COM (2020) 178 final), the package also included an amendment to the regulation on port charges,
providing Member States and port authorities the flexibility to defer, reduce or lift port infrastructure charges for port users. For rail,
the Commission proposed to extend the deadline by which some Member States must transpose EU law on rail safety and
interoperability by three months. For road transport, the package included the extension of several licences and authorisations.
Separately, at the request of several Member States, the Commission authorised derogations from driving and rest times for drivers until end of May.

170
- upgraded the Green Lane approach to ensure that multi-modal transport works
effectively in areas including rail and waterborne freight and air cargo, and
provides additional guidance to facilitate application in practice, on issues such as
electronic documentation, and availability of rest and refuelling points450
The Commission services have also:
- coordinated with Member States the establishment of single national contact
points for COVID-19-related transport issues and established a dedicated EU
platform (18 March)451
;
- provided practical guidance as regards the implementation of temporary
derogations from the general rules on driving and rest times in the road sector (18
March) 452
;
- informed Member States on Commission services’ view regarding inability to
comply with certain provisions of legislation in relation to licences, certificates and
inspections (26 March)453
;
2. Measures to help relieve financial and operational pressures on the sector:
- prepared measures to maintain the flow of liquidity to the economy, and to
alleviate the employment impact for hardest hit sectors, including through the
Coronavirus Response Investment Initiative (13 March)454
;
- put forward a dedicated investment initiative (13 March)455
;
- made a legislative proposal on the protection of historical rights on airport slots
(13 March)456
;
- made a legislative proposal to make certain rules of the Air Services Regulation
more flexible for airlines, Member States and the Commission in view of COVID-
19 pandemic457
- adopted the Communication “Temporary Framework for State aid measures to
support the economy in the current COVID-19 outbreak”458
(19 March, 3 April, 8
May, 29 June and 13 October for its amended version);
- proposed the activation of the general escape clause of the Stability and Growth
Pact (20 March)459
;
450 COM(2020) 685 final 451 https://ec.europa.eu/transport/coronavirus-response_en 452 https://ec.europa.eu/transport/sites/transport/files/derogation_request_art14.docx. The Commission published guidance to help Member States to prepare the derogations to the rules on driving and rest time. While providing flexibility to drivers and road
operators to carry out transport operations, these derogations should be proportionate and avoid jeopardizing road safety and
minimum working conditions for drivers. 453 https://ec.europa.eu/transport/news/2020-03-27-exceptional-measures-inability-comply-legislation_en. The information note of
the Commission services highlighted that the measures taken by Member States in the area of licences and certificates should
remain proportionate and sufficiently short, such as three months, so as to avoid that they benefit situations well after the termination of public measures intended to contain the epidemic. 454 COM(2020) 112 final 455 COM(2020) 113 final 456 COM(2020)0827 final which led to the adoption of Regulation (EU) 2020/459 of the European Parliament and of the Council of
30 March 2020 amending Council Regulation (EEC) No 95/93 on common rules for the allocation of slots at Community airports,
OJ L 99, 31.3.2020, p. 1. 457 COM(2020) 178 final which led to the adoption of Regulation (EU) 2020/696 of the European Parliament and of the Council of
25 May 2020 amending Regulation (EC) No 1008/2008 on common rules for the operation of air services in the Community in view
of the COVID-19 pandemic, OJ L 165, 27.5.2020, p. 1–6. 458 C(2020)1863 final, OJ C 091I of 20.3.2020, p.1. ,
https://ec.europa.eu/competition/state_aid/what_is_new/TF_consolidated_version_amended_3_april_8_may_29_june_and_13_oct_
2020_en.pdf 459 COM(2020) 123 final

171
- issued interpretative guidelines on EU passenger rights regulations in the context
of the developing situation with COVID-19 on (18 March)460
;
- proposed to establish a European instrument for temporary support to mitigate
unemployment risks in an emergency (SURE) following the COVID-19
outbreak461
;
- issued guidance on State aid rules and public service obligation rules in air,
maritime and land transport in the support of the transport sector during the
COVID-19 pandemic and the recovery phase (19 and 26 May) 462
;
- proposed a Regulation establishing measures for a sustainable rail market in
view of the COVID-19 pandemic (19 June)463
regarding charging.
Following the immediate crisis response measures, and taking into account that
with the improvement of the epidemiological situation Member States started
lifting restrictions on travel, on 13 May the Commission adopted a package of
guidelines and recommendations on restoring tourism and transport464
.
Building on the Joint European Roadmap, this proposal aimed to help EU countries
in guiding them towards lifting travel restrictions, safely restoring transport services
and resuming tourism activities. This package included in particular guidelines on
the progressive restoration of transport services and connectivity, setting out
general principles and mode-specific recommendations for the safe and gradual
restoration of passenger transport by air, rail, road and waterways. The guidelines
included a series of recommendations on the need to limit contact between
passengers and transport workers, and passengers themselves, reducing the density
of passengers where feasible, and on the use of personal protective equipment,
such as face masks, and on adequate protocols in case passengers present COVID-
19 symptoms. The package also included a recommendation which aims to make
travel vouchers an attractive alternative to cash reimbursement for consumers465
.
The guidelines were complemented by specific guidelines issued by EASA for
aviation466
, ERA for railways467
and EMSA for cruises468
in May and July 2020.
As a follow-up to the package of 13 May 2020, the Commission has continued
intensive coordination efforts with Member States to facilitate the implementation
of the guidelines and recommendations, including by daily contacts through the
network of national transport contact points for transport and exchanges in the
context of the EU Integrated Political Crisis Response (IPCR).
Moreover, on 26 May, the European Commission has put forward its proposal for a
major recovery plan. To ensure the recovery is sustainable, even, inclusive and fair
for all Member States, the European Commission proposed to create a new
recovery instrument, Next Generation EU, embedded within a powerful, modern
and revamped long-term EU budget.
460 C(2020) 1830 final, OJ C 89I, 18.3.2020, p.1. 461 COM(2020) 139 final 462 https://ec.europa.eu/competition/state_aid/what_is_new/air_transport_overview_sa_rules_during_coronavirus.pdf
https://ec.europa.eu/competition/state_aid/what_is_new/maritime_transport_overview_sa_rules_during_coronavirus.pdf https://ec.europa.eu/competition/state_aid/what_is_new/land_transport_overview_rules_during_coronavirus.pdf 463 COM(2020) 260 final 464 https://ec.europa.eu/commission/presscorner/detail/en/ip_20_854 465 Commission Recommendation (EU) 2020/648 of 13 May 2020 on vouchers offered to passengers and travellers as an alternative
to reimbursement for cancelled package travel and transport services in the context of the COVID-19 pandemic, OJ L 151,
14.5.2020, p. 10. 466https://www.easa.europa.eu/sites/default/files/dfu/EASA-ECDC_COVID-
19_Operational%20guidelines%20for%20management%20of%20passengers_v2.pdf 467 https://www.era.europa.eu/sites/default/files/events-news/docs/covid-19_rail_protocol_en.pdf 468 https://emsa.europa.eu/emsa-documents/latest/download/6376/3978/23.html

172
At the beginning of July, a dedicated COVID-19 SUMP Practitioner Briefing was
published, focusing on green recovery in urban mobility. It takes stock of SUMP-
related issues and all the good practices that cities have been introducing and still
plan to implement as restrictions ease. It also includes lessons learned for
immediate, mid-term and longer-term actions that European cities and regions are
developing.469
Finally, on 4 September, the Commission adopted a proposal for a Council
Recommendation to ensure that any measures taken by Member States that restrict
free movement due to the coronavirus pandemic are coordinated and clearly
communicated at the EU level.
4.3.1.1 Governance
723. In line with the Commission's dedication to Better Regulation, there is need to
significantly reduce the administrative burden for Member States, the Commission
and other EU institutions. Current planning and reporting requirements - both for
the Commission and Member States - are dispersed across a wide range of separate
pieces of legislation adopted at different points in time. This has sometimes led to
redundancy, incoherence, overlaps and lack of integration between the transport
areas and modes. It makes effective response to crisis and adequate contingency
planning very difficult.
724. In order to comply with requirements laid down in EU transport legislation, EU
Member States need to fulfil numerous reporting obligations. Substantively, such
obligations serve different purposes, as Member States report to the Commission
for monitoring purposes, on implementation achievements or submit progress and
activity reports to name just a few. Typically, these requirements are laid down in
specific legal acts establishing an obligation to comply with highly specialized
requirements each.
725. Often, the reporting periods covered are fixed to one or two years respectively, as
defined by the legal act establishing the obligation470
. Yet, reporting obligations
may also initially rest dormant and only be triggered by certain events471
.
726. Reporting requirements vary in their demand for execution. Usually, they are
template-based, employing a questionnaire method and are built on pre-defined
indicators472
.
727. Overall, different reporting schemes might bear effectiveness and efficiency gaps.
The Commission has already taken effort to map the entire EU legislative stock
looking to identify burdens, gaps and inefficient or ineffective measures in REFIT
(Regulatory Fitness and Performance Programme473
). With regard to reporting
obligations there remains potential for further analysis. Streamlining all different
Member States reporting requirements should bear potential to see how
administrative burdens could be alleviated and strive to improving governance
while focusing on EU added value.
469 https://www.eltis.org/sites/default/files/covid-19_sumppractitionersbriefing_final.pdf 470 A reporting obligation occurring every two years can be seen, for example in Article 26 (1) in the Regulation to pursue the
occupation of road transport operator (Regulation (EC) No. 1071/2009). 471 As an example, this can be seen in Art. 8 (2) of the Flag State directive (Directive 2009/21/EC). 472 This, for example, can be seen in the waterborne sector in Art. 22 EMSW Regulation (Regulation EU 2019/1239), or as
implemented in the rail sector in the Annex to the Commission Implementing Regulation on the reporting obligations of the
Member States in the framework of rail market monitoring (Commission Implementing Regulation (EU) 2015/1100). 473 SWD(2013) 401

173
728. Therefore there appears to be a need to consolidate the existing patchwork of
national reporting obligations from the main pieces of EU legislation across
transport by replacing different existing sectorial reports with one comprehensive
integrated plan and report. This could significantly simplify Member States'
obligations: it could reduce, align and update such requirements, and remove
existing duplications. An appropriate transport governance framework, could
enable establishing and tracking progress of comparable national transport plans
among Member States.
729. For such a framework to be fully effective, and in order to be able to monitor
progress to the achievements of European objectives, it is needed to improve the
coverage and level of details of transport statistics. On some aspects, the persistent
lack of comparable and complete transport data and statistics needs to be
addressed.
730. The biggest gap in European transport statistics remains in the passenger
mobility area. An estimated 83% of mobility in Europe by private cars, buses,
urban transport and other modes (including active ones, such as cycling) is
currently not covered by official European statistics or not sufficiently detailed to
enable the right policy decisions. The political demand for passenger mobility
statistics is increasing, especially considering the ongoing changes in mobility
patterns due to technology developments (alternative fuelled vehicles, shared
mobility, mobility as a service, multimodality, intelligent transport systems, and
big data). Harmonised statistics on passenger mobility are collected on voluntary
basis, which results in low country coverage. Without better regulated data
collection, not much use can be made of these.
731. Another gap in the existing official statistics concerns the statistics on
infrastructure, vehicle stock and traffic volumes which are currently collected on a
voluntary basis and therefore not available for all countries (especially concerning
information on alternative fuel infrastructure and vehicles).
732. There is also a lack of data and comparison between EU countries on transport
prices and public and private investments in transport infrastructure, including
recharging and refuelling infrastructure, as well as investments in sustainable
public transport474
.
733. Another important aspect is the need to align the existing methodologies across
modes and between transport and energy statistics, in particular for data on energy
consumption in transport. This would allow to have comparable indicators across
modes and report transport energy intensities for the passenger and freight sectors,
and to analyse their evolution over time, which is not possible based on existing
European statistics.
734. As far as urban mobility data is concerned, there is no legal requirement at the EU
level to systematically collect relevant local/urban transport data, resulting in very
different approaches across Member States. As a consequence, the development of
common policy initiatives helping to manage urban mobility challenges is
hindered. As cities and urban areas continue to develop Sustainable Urban
Mobility Plans (SUMPs) and work towards EU policy goals, it is important for this
progress to be documented to ensure that such achievements become visible. The
Commission has therefore developed, through a 2-year pilot project with almost 50
474 The State aid Scoreboard in the railway sector highlights the heterogeneity of Member States’ efforts to accurately report the
level of public financing in that sector. https://ec.europa.eu/competition/state_aid/scoreboard/index_en.html

174
cities, a first set of indicators that support cities to perform a standardised
evaluation of their mobility system and to measure improvements that result from
new mobility practices or policies475
.
735. The issue of lack of urban mobility data was also recognised by the Court of
Auditors476
that, in its 2020 report on EU urban mobility policy and funding
recommended to the Commission, among others, to ‘propose legislation requiring
Member States to collect and submit regularly relevant data on urban mobility and
on the adoption of SUMPs in all EU urban nodes of the core and comprehensive
TEN-T networks, including their surrounding areas.
736. In November 2019, the Commission launched a study on new mobility patterns.
The study aims at creating an extensive data collection covering the areas of
passenger mobility, urban logistics, fleet composition, transport activity and traffic
for the EU Member States.
4.3.2 Infrastructure and investment
737. Beyond enabling a well-functioning internal market, transport infrastructure
across the European Union is a key element to ensure connectivity, sustainable
economic growth and cohesion among Member States.
738. Although significant progress has been made to develop the European transport
network, our infrastructure remains a network of the 20th
century, is not fully
connected and interoperable and often in worsening condition in terms of quality
and capacity, and is only marginally equipped with the sustainable and smart
solutions that would be needed to allow climate-neutral mobility, due to the lack of
adequate public and private investment over the last decades and excessive time
needed to renovate and upgrade.
739. The availability and quality of transport infrastructure varies between Member
States and is relatively low in the eastern part of the EU. It is negatively affected
by shrinking resources dedicated to upgrade and maintenance as well as the lack of
resilience to climate change and weather extremes. Since the previous global
economic crisis, the EU has been suffering from low levels of investment in
transport infrastructure. This has held back the modernisation of the EU's transport
system.477 Government investment continues to remain low as a share of GDP in
the EU, levelling out at 2.7% in 2016, the lowest level in 20 years478. Generally,
investment in infrastructure has halted its decline, but it is still at 20% below pre-
crisis levels, thus slowing economic convergence. Total infrastructure investment
stands at a 15-year low of 1.6% of GDP, down from a peak of 2.2% in 2009, with
transport infrastructure the most badly affected. The decline is strongest in
countries with the lowest infrastructure quality, pointing to a slowdown in the
convergence process.479
740. Overall, from 2009 to 2017, the EU saw a 15% decline in infrastructure investment
activities (as a share of GDP). This decline was more pronounced in regions with
475 https://ec.europa.eu/transport/themes/urban/urban_mobility/sumi_en 476 European Court of Auditors, Special report 06/2020: Sustainable Urban Mobility in the EU: No substantial improvement is possible without Member States’ commitment 477 European Commission (2019), ‘Transport in the European Union - Current Trends and Issues’.
https://ec.europa.eu/transport/sites/transport/files/2019-transport-in-the-eu-current-trends-and-issues.pdf. 478 European Investment Bank (2019), ‘EIB Investment Report 2019/2020. Accelerating Europe's Transformation’.
https://www.eib.org/en/publications/investment-report-2019 479 European Commission (2019), ‘Transport in the European Union - Current Trends and Issues’. https://ec.europa.eu/transport/sites/transport/files/2019-transport-in-the-eu-current-trends-and-issues.pdf..

175
poor infrastructure quality, thus reinforcing infrastructure investment gaps and
raising concerns about the effect not only on economic competitiveness but also on
economic and social convergence within the EU.480
741. In fact, infrastructure investment remains below the level before the financial crisis
of 2008. The comparison with 2008 levels is most striking for the countries of
central and eastern Europe, where current investment levels are around 35% lower
than before the crisis, followed by southern Europe (with 30% lower investment
levels). Real infrastructure investment has surpassed 2008 levels in western and
northern Europe, but even there investment rates (i.e. investment as a share of
GDP) lag behind their pre-crisis levels.481
742. Despite a major progress achieved over the last decade in upgrading infrastructure
in cohesion Member States, they are still lagging behind in terms of connectivity
and accessibility. Equally, limited investment in rural areas and outermost regions
has been hampering their connectivity and accessibility as compared to urban areas
across the EU.
743. Analysing at regional level how many people living in a 120-kilometre radius can
be reached within a 90-minute drive by car, a working paper from the Commission
estimates that within the EU, Bulgaria, Croatia, Poland, Romania and Slovakia
have the lowest road transport performance, while Belgium and the Netherlands
score highest. The performance of Spain and Portugal, which have benefited from
a longer period of support from ERDF and the Cohesion Fund, is now above the
EU average.482
744. However, the transport performance of a country also depends on how urbanised it
is. Most metropolitan regions outperform other regions. On average, cities
outperform rural areas although not all cities perform that well. Cities in eastern
EU Member States achieve a lower performance, especially the smaller ones.483
745. In global comparison in 2019, four EU countries are among the top ten economies
in the world in terms of the perceived quality of their roads, railways, air and water
transport infrastructure: the Netherlands (2), Germany (7), Spain (9) and France
(10).484
480 European Investment Bank (2019), ‘EIB Investment Report 2019/2020. Accelerating Europe's Transformation’. https://www.eib.org/en/publications/investment-report-2019 481 Ibid. 482 European Commission (2019): ), DG REGIO Working Paper – ‘Road Transport Performance in Europe, Introducing a New
Accessibility Framework’. https://ec.europa.eu/regional_policy/en/information/publications/working-papers/2019/road-transport-
performance-in-europe . 483 Ibid. 484 World Economic Forum (2019), ‘The Global Competiveness Report 2019’.

176
Figure 38: Perceived quality of transport infrastructure in the EU countries
Source: World Economic Forum 2019 (includes access to seaport services for landlocked countries).
746. There is broader uncertainty about long-term needs and policy directions and on
how to best balance between private and public investment. Given the long time
for implementation of transport infrastructure and its long-term effect and well
as the life span of assets (planes, trains, ships etc.), this requires foresight and
stability in terms of planning and prioritising.
747. Decarbonising and cleaning the transport sector requires significant investment,
inter alia for developing and testing new solutions as well as the renewal of mobile
assets and related enabling infrastructures. According to the Commission
Communication “Stepping up Europe’s 2030 climate ambition - Investing in a
climate-neutral future for the benefit of our people” the additional investments for
2021-2030 in vehicles (incl. rolling stock, vessels, aircraft) and alternative fuels
infrastructure deployment are estimated at EUR 130 billion per year, compared to
the previous decade. The “green and digital transformation investment gap” for
infrastructure would add an additional EUR 100 billion per year485
. Just to
complete the TEN-T core network and build it as a truly multimodal system, EUR
300 billion will need to be invested over the next 10 years.
748. The renewal of vehicle fleet across would bring EU added value in particular by
improving cross border connectivity (for instance in rail), underpin the
environmental objectives and creating economic benefits in terms of GDP
stimulation and jobs.
749. In addition, a significant increase in the share of intermodal operations can only be
achieved with substantial increases in numbers and capacities of intermodal
terminals and the capacity of key railway trunk routes and nodes. However, current
investment rates are not in line with perceived investment needs.
750. Despite efforts to pool and better guide research activities for example in the rail,
road and aviation sectors, as explained above, R&D&I in the transport sector
485 SWD(2020) 98 final, based on TEN-T related estimates and EIB calculations. This estimate does not include the costs of equity
repairs, or that of the regular renewal of the fleet, which however may be delayed due to the impact of the COVID-19 pandemic on transport companies.

177
remains fragmented and sluggish, with only insufficient funding available in most
areas and long lead times preventing rapid deployment. We need to address the
chicken and egg problem that investment in new technologies will only happen
when there is sufficient confidence that new tech will actually be used. So need
strong deployment plans with full legal backing.
751. The European Recovery Instrument (‘Next Generation EU’) will support critical
recovery investments and reform priorities until 31 December 2024. The
Commission will issue bonds to finance EUR 750 billion of Next Generation EU
which are to be repaid in the period 2027-2058. Two thirds of the Next Generation
EU budget will fund the grant component of the Recovery and Resilience Facility
and reinforce other key crisis and recovery EU programmes. The rest of the budget
will be on-lent to Member States, still under the Recovery and Resilience Facility
(see also in section 4.3.2.3).
752. The Sustainable Europe Investment Plan is the investment pillar of the European
Green Deal. The plan will crowd-in private investments through the EU’s budget
guarantee under the InvestEU Programme. It further includes the public sector loan
facility under the Just Transition Mechanism, notably to facilitate public sector
investments in the regions most affected by the transition. Support to public
administrations and project promoters in identifying, structuring and executing
sustainable projects will also be provided.
753. The EU in June 2020 adopted a regulation setting up an EU-wide classification
system, or "taxonomy", for sustainable activities. The taxonomy will contribute to
private sector investment in new green technologies and modes of transport by
providing businesses and investors with a common language to identify
environmentally sustainable economic activities. The taxonomy will cover a wide
range of transport sectors and will be constantly updated to keep pace with
technological developments.
4.3.2.1 Capacity across modes
754. The lower levels of investment come in a time when Europe is facing capacity
crunch across many modes. As demand for transport has kept growing, current
infrastructure is not able to cope with the growing number of passengers and users,
causing congestion, delays and generating heavy costs for ordinary travellers and
businesses alike. Congestion is an issue that the Commission has already identified
as pressing in the 2011 White Paper on transport.486
Progress has been very limited
over the last ten years. Mainly in densely populated countries of the EU, such as
the Benelux countries or Malta, road congestion continues to be an important
problem
755. Annual road congestion external costs have been estimated in monetary terms to
amount to almost 2% of the EU-27 GDP.487
The slow deployment of smart
mobility systems, which could better manage traffic flows, and problems with
interoperability are causing considerable economic losses, both in unexploited
capacity and in duplicating equipment.
487 CE Delft (2019), ‘Handbook on the External Costs of Transport. Version 2019’. https://op.europa.eu/en/publication-detail/-/publication/9781f65f-8448-11ea-bf12-01aa75ed71a1
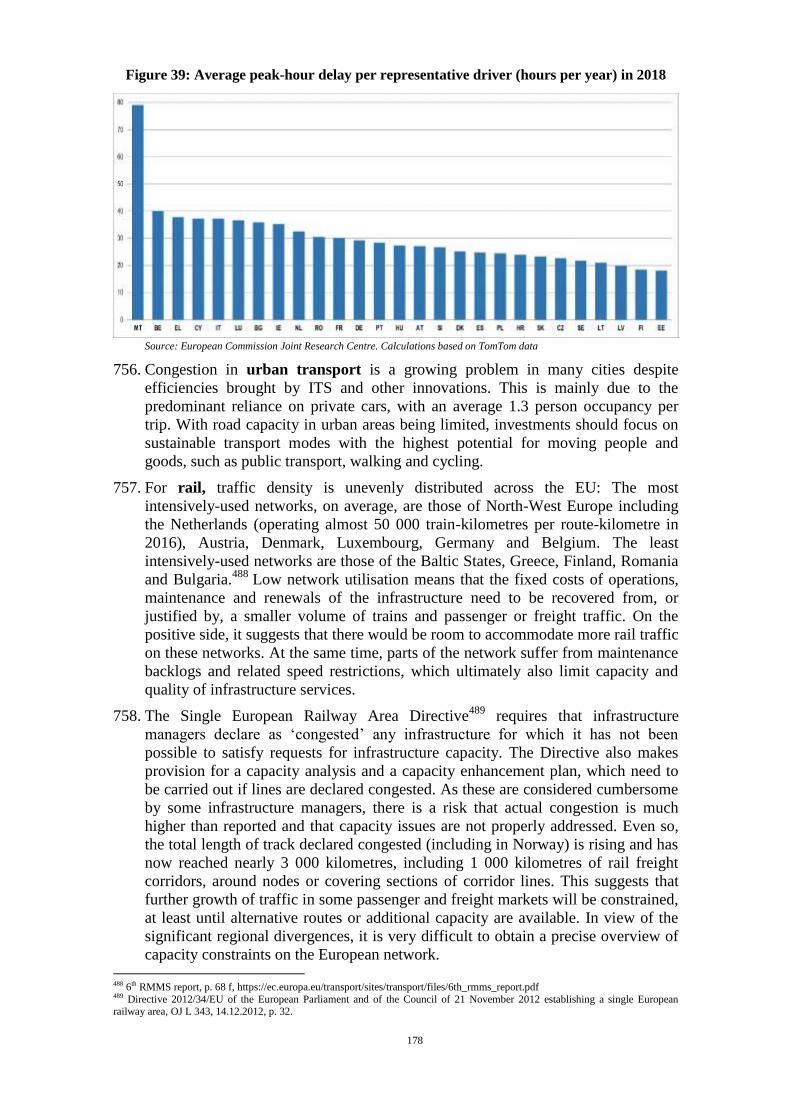
178
Figure 39: Average peak-hour delay per representative driver (hours per year) in 2018
Source: European Commission Joint Research Centre. Calculations based on TomTom data
756. Congestion in urban transport is a growing problem in many cities despite
efficiencies brought by ITS and other innovations. This is mainly due to the
predominant reliance on private cars, with an average 1.3 person occupancy per
trip. With road capacity in urban areas being limited, investments should focus on
sustainable transport modes with the highest potential for moving people and
goods, such as public transport, walking and cycling.
757. For rail, traffic density is unevenly distributed across the EU: The most
intensively-used networks, on average, are those of North-West Europe including
the Netherlands (operating almost 50 000 train-kilometres per route-kilometre in
2016), Austria, Denmark, Luxembourg, Germany and Belgium. The least
intensively-used networks are those of the Baltic States, Greece, Finland, Romania
and Bulgaria.488
Low network utilisation means that the fixed costs of operations,
maintenance and renewals of the infrastructure need to be recovered from, or
justified by, a smaller volume of trains and passenger or freight traffic. On the
positive side, it suggests that there would be room to accommodate more rail traffic
on these networks. At the same time, parts of the network suffer from maintenance
backlogs and related speed restrictions, which ultimately also limit capacity and
quality of infrastructure services.
758. The Single European Railway Area Directive489
requires that infrastructure
managers declare as ‘congested’ any infrastructure for which it has not been
possible to satisfy requests for infrastructure capacity. The Directive also makes
provision for a capacity analysis and a capacity enhancement plan, which need to
be carried out if lines are declared congested. As these are considered cumbersome
by some infrastructure managers, there is a risk that actual congestion is much
higher than reported and that capacity issues are not properly addressed. Even so,
the total length of track declared congested (including in Norway) is rising and has
now reached nearly 3 000 kilometres, including 1 000 kilometres of rail freight
corridors, around nodes or covering sections of corridor lines. This suggests that
further growth of traffic in some passenger and freight markets will be constrained,
at least until alternative routes or additional capacity are available. In view of the
significant regional divergences, it is very difficult to obtain a precise overview of
capacity constraints on the European network. 488 6th RMMS report, p. 68 f, https://ec.europa.eu/transport/sites/transport/files/6th_rmms_report.pdf 489 Directive 2012/34/EU of the European Parliament and of the Council of 21 November 2012 establishing a single European railway area, OJ L 343, 14.12.2012, p. 32.

179
759. The analysis of railway capacity and current or potential future bottlenecks is
hampered by the fact that there is currently no harmonised way to define railway
capacity – and, consequently, capacity bottlenecks – and that the methodologies
and assumptions to forecast demand differ widely between Member States. In
order to overcome this situation, common definitions and methods have to be
defined at EU-level which may require the establishment of a body with the
necessary expertise and resources. So far, agreement on a more common approach
was impeded by the close link between the capacity issue and the investment
planning, which is still dominated by national approaches given the prevalence of
national-level financing for investments in new and upgraded infrastructure.
760. Notwithstanding this lack of a common approach to assess capacity and capacity
bottlenecks, various reports and studies of the Rail Freight Corridors confirm the
existence or prospect of capacity bottlenecks for rail freight transport. Bottlenecks
exist mainly in major and smaller urban nodes, such as Lyon, Milan and various
nodes in Germany, as well as on intensively used strategic axes on which several
flows overlap on a single line, such as the access lines to the transalpine crossings
of Rhine-Alpine and Scandinavian-Mediterranean corridor or the key Czech rail
axis between Prague and Česká Třebová.
761. An issue of specific importance is the availability of capacity in case of disruptions
affecting the main lines included in the corridors. Due to the existing density of the
railway network, disruptions at a single location may bring traffic along entire
corridors to a standstill, which obviously has a very negative impact on the
reliability of rail transport. A number of recent cases has shown that despite
improvements in international coordination in the wake of the catastrophic 2017
disruption of the Rhine-Alpine at Rastatt, only a limited share of trains can be re-
routed during disruptions of strategic lines. According to the best available
information, only 10 to 25 % of freight trains could be diverted during the
disruptions close to Modane (FR) in 2018, Perpignan (FR) and Auggen (DE) in
2020.
762. Building new rail lines is very expensive and takes a long time. It will therefore be
crucial to make better use of the existing infrastructure. Better cross-border
coordination on traffic planning, to seamless transport management and planning
of works would allow for a more efficient use of capacity, as would the systematic
deployment of ERTMS and automated train operation (ATO). Optimisation of
capacity management could also release capacity.
763. Timetables are the key structuring element for railway traffic but the current
process to design them is the result of decades-long historical development. It is
not in line with current needs of transport users, e.g. as regards flexibility and
predictability, and it does not facilitate proper cross-border coordination. This
results in a waste of capacity which could be removed at relatively low cost. The
railway sector currently develops key elements to do so in the context of the so-
called ‘Timetable Redesign’ project. Implementation of this project would require
public support in the form of changes to the regulatory framework. The TEN-T
parameters, in particular train length and loading gauge - which will lead to
capacity increases - have to be in place in 2030 as a minimum.
764. Ports have long been the places where industries can prosper, creating valuable
employment, and providing much needed connectivity for European trade. The
challenges the sector is facing are numerous: global political changes, new
shipping alliances along with ultra-large container vessels, new technologies
creating new business models, lack of investments, stronger environmental
180
requirements. The estimated investment needs for maritime ports infrastructure is
around EUR 5 billion per year until 2027.
765. Inland navigation is one of the most CO2 efficient mode of transport per tons of
goods. Unfortunately the sector is small and face difficulties not only to finance
infrastructure investments but also to comply with environmental rules. Inland
waterways infrastructure needs, including inland ports is around EUR 47 billion
between 2021 & 2027. Current CEF support is around EUR 1.8 billion for IWT.
This shows that at the European level under investment might hamper the
development of inland navigation as alternative to road, if not complemented by
other sources of financing.
766. In the area of air traffic management, many inefficiencies remain, partly due to the
still fragmented airspace and the absence of a completed Single European Sky. The
current fragmentation of the European airspace still leads to operational
inefficiencies and large volumes of unnecessary fuel burn.
767. The use of the EU’s transport system is not optimised either, due to lack of
coherent modal and multimodal infrastructure. Intermodal travel cannot become
a reality if airports and freight terminals are not linked with efficient transport
solutions on the ground and if airports and freight terminals serving the same
conurbation are not linked effectively. Interoperability between ports (both inland
and maritime), and hinterland connections remain an issue. The number of multi-
modal platforms and transhipment nodes is not optimal either. Equally, the efficiency of cross-border travel is constrained by a fragmented high speed rail
network.
768. The TEN-T Regulation establishes guidelines for the development of a trans-
European transport network. A number of its requirements are aimed at
sustainable, safe, secure, inclusive and smart transport solutions. It provides for the
removal of bottlenecks and filling of gaps in the transport networks, facilitating
multi-modality, introducing harmonised interoperability standards or smart
infrastructure components as well as charging and refuelling equipment for
emission-free vehicles. Catching up of countries with less developed infrastructure
is necessary to ensure better connection into the single market. This includes in
particular cross border infrastructure.
769. Horizon Europe is envisaged to include R&I actions to identify and demonstrate
solutions towards sustainable multimodality, including infrastructure and network
management. The development of the comprehensive network, which ensures
accessibility of all regions to the trans-European networks, is to be assessed in
particular when revising the TEN-T Regulation. The Commission has proposed the
adoption of new rules regarding the Connecting Europe Facility490
. The intention
is inter alia to support the deployment of a digital infrastructure along the TEN-T
corridors, and to create the conditions for the large-scale testing of advanced
connected and automated mobility applications and services, including for other
modes of transport such as rail and inland waterways. In the medium term, after
2025, such deployment may have reached scale effects. At that point, connected
transport paths may contribute to the digital transformation of vertical industries in
the field of mobility and transport, and in particular automotive and rail.
490
COM (2018) 438 Proposal for a Regulation of the European Parliamanet and of the Council establishing the Connecting Europe
Facility and repealing Regulations (EU) No 1316/2013 and (EU) No 283/2014

181
770. Within urban areas, the infrastructure for the most sustainable and cost-efficient
ways of transportation, active mobility, is often inadequate and not matching the
rising demand. More walking and cycling would help to achieve the European
Green Deal as well as air quality requirements, tackle road congestion, and both
encourage active mobility while making it safer. A systematic inclusion of the
carbon impact and health benefits of active mobility in infrastructure and transport
projects and policies is needed. The respective WHO Health Economic Assessment
Tool (HEAT) elaborated with UNECE491
should be applied at local, national and
EU levels.
771. Active mobility infrastructure would enable better last mile solutions for
multimodal transport in cities. Support needs to be directed towards
multimodal/mobility hubs and urban distribution centres (consolidation/micro-
consolidation centres). Zero-emission light electric (freight and personnel) vehicles
such as cargo e-bikes and shared e-bikes schemes can decarbonise urban mobility
and increase its efficiency.
4.3.2.2 Future-proof infrastructure
772. Insufficient investment in infrastructure over the past decade also led to a
maintenance backlog. Crumbling bridges, degrading road and rail infrastructure
became a painful reality with higher risk of congestions, accidents, increased noise
and lower level of service to society. Several issues have to be considered in this
respect. First, delaying maintenance works in order to cut expenditure in the
context of tight budgets usually leads to increased costs when taking into account
the whole life cycle of infrastructure. A persistent lack in regular maintenance and
renewal reduces performance and capacity of the infrastructure (e.g. through speed
reductions and disruptions).
773. Second, maintenance should be addressed from the outset: infrastructure should be
designed and implemented in a sustainable way, through the lifecycle approach,
taking into account future maintenance needs, taking into account research work
done in this area.
774. Third, maintenance activities may have impact on the capacity of the network (e.g.
sections which are not usable during maintenance works). Compensating
maintenance backlogs by massive maintenance and renewal programmes may
reduce significantly infrastructure availability in the short to medium term.
775. For rail, the backlog in maintenance means that more works will need to be carried
out on the network in coming years, making close coordination between
infrastructure managers more important than ever. In the past, failure to coordinate
such works across borders has often led to significant complications, delays and
financial losses for railway undertakings and has hampered the competitiveness of
rail vis-à-vis other transport modes. Digitalisation of need identification and
maintenance planning is expected to reduce infrastructure barriers caused by
maintenance works.
776. The quality of infrastructure planning and implementation is also weakened by the
decreasing project management and implementation capacity across Member
States due to cuts in human resources. This situation has been exacerbated by the
financial crisis: following lower levels of investment over the past years, public
491http://www.euro.who.int/en/health-topics/environment-and-health/Transport-and-health/activities/guidance-and-tools/health-economic-assessment-tool-heat-for-cycling-and-walking

182
administrations had less resources. As infrastructure managers often depend to a
large extent on increasingly scarce public funding, transport projects are
particularly impaired by this reduced capacity to prepare projects.
777. The lack of administrative capacity has led in certain Member States to situations
where available funds could not be absorbed, procedures being contested, public
consultations not properly conducted, projects delayed, etc.
778. This reduced administrative capacity also leads to consequences in the field of
public procurement, with suboptimal outcomes. While the current legal framework
established the Most Economically Advantageous Tender (MEAT) principle492
, in
practice the lowest-priced offers tend to be awarded the contract, which often leads
to compromising quality. Furthermore, instruments in the existing legal
framework that can contribute to ensuring a level playing field in public
procurement are not fully exploited.493
779. Furthermore, procedures to monitor, maintain and renew infrastructure such that it
remains to in good quality are sometimes not in place or not properly implemented.
However, good practice examples494
do exist in this area and could provide a
blueprint to improve performance elsewhere.
780. Another challenge relates to accessibility. Currently one in six citizens in the EU
suffers from some kind of disability or are of reduced mobility because of their age
or other circumstances (e.g. obesity), and the share of this population will grow
significantly because of the ageing of population and insufficient physical activity
(also related to car use). At the same time the current passenger transport
infrastructure is not always accessible enough for this population, so they either
travel with private cars or left excluded from transportation, which has a negative
impact in their life (lack of social inclusion, less job opportunities, worse access to
healthcare).
781. Climatic changes that potentially affect transport systems include both gradual
ones, such as sea level rise, and intensification of extreme events. Climate change
adaptation need to cover all transport modes and requires horizontal action. This
includes:
Identifying the level of vulnerability of the transport system, highlighting the
rapid detection of disruptions
Implementing a systemic approach for the planning, design, construction,
operation and management of transport infrastructures having into account the
effects of climate is essential for overcoming the impact of future changes and
become climate-proof.
782. In particular for road and rail infrastructure, key vulnerabilities include495
:
Mainly heavy precipitation and river flooding
Sea level rise and storm surges
492 MEAT enables the contracting authority to take account of criteria that reflect qualitative, technical and sustainability aspects as
well as price. 493 Member States may use the options to regulate participation to public tenders, as explained in the 2019 Guidance on the
participation of third-country bidders and goods in the EU procurement market (in particular Article 25 of Directive 2014/24/EU
and Article 85 of Directive 2014/25/EU). 494 For instance, in rail there are some examples of excellent monitoring and managing the state-of-repair of infrastructure, e.g.
https://www.eba.bund.de/DE/Themen/Finanzierung/LuFV/IZB/izb_node.html 495https://publications.jrc.ec.europa.eu/repository/bitstream/JRC72217/transport%20and%20climate%20change%20final%20report.pdf

183
Increasing average temperature all over Europe could require changes in
maintenance operations, or even adaptation of some infrastructure elements,
and practices and represent extra costs.
783. For airports and seaports, the greatest risks relate to inundation and higher wind
gust speeds; sea level rise, storm surges and inundation, respectively.496
784. Inland waterways are vulnerable to climate change because river navigation
depends on precipitation and water levels for its operations. Droughts and floods
have the most disruptive impacts for inland waterways because low water levels
impose limitations to navigation services. Hence inland waterway transport is
directly affected and already feels the impact of climate change. Recent drought
periods as well as floods disrupt inland navigation activities by imposing
restrictions on the amounts of loads transported, increasing the number of vessels
to compensate reduced load factors and a shift to less energy-efficient modes, i.e.
undermining its capacity to contribute to transport decarbonisation goals. In the
case of the Rhine, the other modes of transport do not dispose of sufficient capacity
to absorb the shift.
785. Inland waterways can exert pressure on aquatic ecosystems, mainly due to
modification in the hydromorphology of rivers, fragmentation of ecosystems,
disruption of ecological flow, or pollution of water and sediment. An integrated
approach is needed. Therefore, waterway transport needs a reliable, safe, cost-
effective and climate resilient infrastructure network. Since inland waterways have
multiple functions: water supply, energy generation, recreation, biodiversity, this
requires an integrated water policy to ensure that such infrastructures have a
neutral or positive impact on biodiversity and do not compromise the achievement
of good status of the water bodies they relate to, in line with the objectives of the
Water Framework Directive, the Habitats Directive and the Biodiversity Strategy.
The Water Framework Directive provides the right framework for integrated water
management at the basin level. The Fitness Check of this Directive however shows
that there is a need to strengthen its implementation, and to better integrate it with
other sectoral policies including the navigation policy. The multi-dimensional
functions of rivers, canals and lakes must be taken into account when developing
waterways while dealing with climate change. An integrative approach among all
water users towards ecologic, societal, economic and safety-related functions is a
condition sine qua non for a successful climate responsive policy in terms of
adaptation.
786. These trends imply a growing need for finding synergies between the transport,
energy and digital sectors, which are not yet harnessed to the full extent, including
for the deployment of alternative fuels infrastructure. New approach to the design
of network and business models is needed, which should also take into
consideration the impact of the climate change on the current and future
infrastructure as well as demographic changes impacting the mobility patters of the
future. Horizon Europe calls for proposals are planned to help to develop and test
new methods of transport infrastructure maintenance and upgrade, with a view to
improving safety, climate resilience and environmental impact (incl. habitat and
biodiversity) and develop new solutions to accommodate connected mobility.
These R&I actions are also expected to accommodate new and evolving transport
modes and improved integration of transport infrastructure and energy systems.
496 https://publications.jrc.ec.europa.eu/repository/bitstream/JRC108865/jrc108865_final.pdf
184
787. Finally, facilitating the movement of military troops and assets is essential for the
security of European citizens and to allow for more efficient deployment of EU
armed forces abroad. Today, there are obstacles which are hampering the
movement of military equipment and personnel across the EU, including physical,
legal and regulatory barriers. Military mobility is a key priority for the EU-NATO
cooperation. Transport infrastructure is not always fit for the specific needs of
military transport which has specific requirements (e.g. in terms of weight of the
vehicles on bridges or dimensions of tunnels). The Commission services and the
European External Action Service (EEAS) 497
are comparing the military and the
civilian requirements to identify gaps and synergies. The Gap Analysis will also
inform the subsequent definition of the dual-use infrastructure requirements, which
will constitute the legal basis for CEF co-funding through the military mobility
envelope. Finally, the Commission in consultation with the Member States and
relevant stakeholders will develop a dual-use project pipeline over 2020 to identify
investment priorities before CEF co-funding starts in 2021.
4.3.2.3 Access to funding
788. In view of the above, investment into connectivity, both at national and European
level, requires a strategic approach both in terms of levels to close the
underinvestment gap and in terms of coherent, future-proof priorities. It should be
based on three main axes:
Effective use-based infrastructure charging covering a significantly greater
share of infrastructure costs;
A greater participation of private capital, in particular through green
financing, while preserving European control of key infrastructure;
A reinforced complementarity of public funding sources at national and
European level
789. At the moment, however, investment is defined quite narrowly and is not
necessarily aligned with all policy goals in particular decarbonisation and health.
The focus is predominantly put on new infrastructure but does not address
upgrading and maintenance. There are also limited investment options for movable
assets (vehicles, vessels), active mobility infrastructure, retrofitting and renewal of
vehicles that could help adapt to the current and future challenges, including safety,
modernisation and cleaning the transport sector as a whole. The renewal of the rail
and vessels fleet would bring EU added value in particular by improving cross
border connectivity, underpin the environmental objective of modal shift and
creating economic benefits in terms of GDP stimulation and jobs. Last but not
least, limited access to investment for smaller market players (SMEs, especially in
the road and waterborne sectors) is hampering innovation investments in these
sectors. These issues are addressed by the InvestEU regulation which foresees
support to maintenance, mobile assets and seamless support to SMEs through the
Sustainable Infrastructure and SME Windows.
790. At the EU level the coordination and coherence of support across different EU
programmes (Connecting Europe Facility, Cohesion Fund, ERDF and InvestEU)
and European Investment Bank’s support as regards objectives and conditions
497 A Joint Commission and High Representative Action Plan on Military Mobility was adopted in March 2018. It identifies EU-
level actions to support the protection / defence of the Union. In the area of transport, the Action Plan identifies two areas for action: (i) transport infrastructure development; and (ii) transport of dangerous goods.

185
underlying public funding is not optimal either. Conditionality to receiving funding
may need to be better aligned, in line with relevant European policies.
791. The Recovery and Resilience Facility will be one of the main tools for the
recovery, with an unprecedented EUR 672.5 billion of frontloaded non-repayable
support as well as loans during the crucial first years of the recovery. The Member
States will encompass in their recovery and resilience plans their national agenda
of reforms and investments designed in line with the relevant country specific
recommendations and EU policy objectives, centred on the green and digital
transitions. The Facility will support Member States’ efforts to strengthen
effectively their social and economic resilience, and hence their economies’ growth
potential and job creation, thereby supporting the EU objectives.
In the Communication ‘Annual Sustainable Growth Strategy 2021’498
the
Commission highlighted that “investing in sustainable mobility can also strongly
support the recovery. Measures addressing transport can bring significant
greenhouse gas emission reductions and improvements to air quality, while
fostering productivity growth. In designing their national recovery and resilience
plans, Member States should consider such measures as investing in public
transport and in infrastructure that supports the shift towards more sustainable
and smart mobility, including seamless and efficient European multimodal
networks as well as upgrading Trans-European Transport Network networks for
passengers and freight. Reforms and investments aimed at boosting demand for
zero- and low-emission vehicles and accelerating the rollout of recharging and
refuelling infrastructure are also key for achieving this goal. This should be
complemented by investments in low carbon energy technologies and value chains,
including hydrogen or batteries, and on sustainable energy infrastructure.
Reforming the environmental incentives provided by the taxation of vehicles and
fuels will be particularly important to accompany this trend.”
The Annual Sustainable Growth Strategy 2021 also set out a number of European
flagships as “pursuing these flagships will ensure the success of the recovery of
Europe; it will make Europe a digital and greener continent and will increase the
cohesion among Member States”. Among them is Recharge and refuel: “Promoting
future-proof clean technologies to accelerate the use of sustainable, accessible and
smart transport, charging and refuelling stations and extension of public transport
will make European cities and regions cleaner, accelerate the industrial transition
and contribute to reaching the Paris climate objectives. By 2025, the flagship will
aim to build one out of the three million charging points needed in 2030 and half of
the 1000 hydrogen stations needed”.
In addition to guidance to Member States Recovery and Resilience Plans499
, the
Commission also provided examples of component of reforms and investments,
including on clean, smart and fair urban mobility500
.
792. Closer policy dialogue between the EC and the EIB has been established with the
revision of the EIB transport lending policy. The Cleaner Transport Facility has
been established as an umbrella for EU support to the deployment of smart and
sustainable transport (covering CEF including Blending Operations and CEF Debt
Instrument; EIB own-risk; and European Fund for Strategic Investment). Also, the
Safer Transport Platform was established as a gateway to advisory services to
498 COM(2020) 575 final 499
https://ec.europa.eu/info/departments/recovery-and-resilience-task-force_en#Documents 500
https://ec.europa.eu/info/sites/info/files/component_clean_urban_mobility.pdf

186
support the uptake of funding and financing opportunities for projects that improve
road safety. Lastly, funds from the NER300 programme501
can be channelled
through the CEF Debt Instrument for electric mobile assets and renewable energy
transport infrastructure.
793. Furthermore there is a need to improve the capacity to plan, design and procure
transport infrastructure projects at local and regional level. At those levels,
advisory services and related resources would be required in order to prepare
projects. Relevant programmes are already operating in collaboration with the EIB,
including: the Joint Assistance to Support Projects in European Regions
(JASPERS); the European Local ENergy Assistance (ELENA); and more generally
through the European Investment Advisory Hub.
794. All these trends will need to be taken into consideration in the review of the EU-
level transport infrastructure network policy (based on the TEN-T Regulation and
supported predominantly by CEF and the Cohesion Fund and ERDF). This policy
has been crucial to connect national transport networks, overcome technical
barriers (inter-operability) and enhance major transport axes across the Union. In
addition, investments in the transport sector and TEN-T network in particular were
also supported by the EIB, including under the European Fund for Strategic
Investment. Around 20% of the total lending of the EIB goes to the transport
sector, representing EUR 59 billion since 2014. The largest share of the loans has
gone to the projects in the rail sector, followed by road and urban mobility. The
core network, which represents around 55% of TEN-T railways, 43% of TEN-T
roads and the whole TEN-T inland waterway network in addition to many ports,
airports and other transport terminals and inter-modal junctions must be completed
by 2030. It must be then complemented by the comprehensive network
(completion by 2050), which seeks to ensure full geographical accessibility across
the Union.
795. This should help in also reflecting the importance and challenges of regional or
local freight transport networks as the corridors mainly relate to long-distance
transport services. Infrastructure provision in urbanised areas needs to be better
linked with the management and optimisation of traffic flows. While bottlenecks
can appear in and/or around cities, e.g. congested ring roads, solutions might be
found on the corridor (e.g. stimulating multi-modality) or vice versa.
796. However, the full roll-out of the TEN-T network needs substantial investments, as
estimated by the European Corridors Coordinators Work Plans, to upgrade existing
networks, construct missing links, which are not always prioritised by Member
States’ national authorities, improve interoperability and network capacity, among
others. The current estimations envisage that EUR 300 billion will be needed to
complete the TEN-T core network alone.
797. Comprehensive Transport Strategies provide a stable, long term framework for
investments planning in the transport sector. The existence of such plans is a pre-
requisite (ex-ante conditionality, enabling condition) to access support from the
Cohesion Fund and ERDF. These national and regional plans include measures at
the level of the TEN- core and comprehensive network, and also provide the link
between local/regional transport networks and the TEN-T.
501 NER 300 is a funding programme pooling together about EUR 2 billion for innovative low-carbon technology, focusing on the
demonstration of environmentally safe Carbon Capture and Storage (CCS) and innovative renewable energy technologies on a commercial scale within the EU.

187
798. Railways transport infrastructure has been identified as the segment most in need
of investment to finalise the TEN-T network and maintain/modernize the existing
network, with around 60% of the total demand for funding/financing. Fixed
infrastructure costs are comparatively low per km for aviation and road and very
high for rail, due to the very different nature of the infrastructure involved502
. On
the other side, marginal costs are very different by mode, once external costs are
being considered.
799. Due to a combination of market failures and the lack of level playing field between
the modes, cross border infrastructure in general and railway infrastructure projects
in particular are often not financially viable and struggle to attract private capital.
Also, regulatory aspects and state infrastructure ownership remain a barriers to
tapping into capital market investment in transport projects.
4.3.3 Single Market
800. Mobility keeps Europe moving and the economy growing: people need to
commute and travel, while businesses must be able to deliver goods and services.
Without transport, the internal market simply would not function, nor would
European industry be competitive. Transport services accounts for about 5% of
total EU Gross Value Added. The volume of transported goods in the EU, as well
as the passenger transport activity, increased by about 30 % between 1995 and
2017.
801. The functioning of the EU Single Market hinges on a dense network of transport
infrastructure, highly competitive transport services and a sound regulatory
framework to ensure the highest standards of safety and security, as well as
international competitiveness and connectivity. An effective and vibrant internal
transport market is key to driving innovation and entrepreneurship, increasing
service quality and lowering transport costs for the benefit of European citizens
and businesses. Completing the Single European Transport Area envisioned by the
2011 White Paper503
therefore still remains the cornerstone of European transport
policy.
4.3.3.1 Single Market for road transport
802. In July 2020, the European Parliament and the Council adopted the so-called
Mobility Package I504
. The package contains a number of social and market rules
for the commercial road transport sector, intended inter alia to enhance working
conditions for drivers, as well as to eliminate distortion of competition between
operators in the sector, by removing notably unfair business practices such as
letterbox companies. Now the efforts must concentrate on effective and consistent
enforcement of these rules. The Commission is currently analysing the impact of
502 Overview of transport infrastructure expenditure and costs: https://ec.europa.eu/transport/sites/transport/files/studies/overview-
transport-infrastructure-expenditures-costs-isbn-978-92-79-96920-1.pdf 503 White Paper – Roadmap to a Single European Transport Area – Towards a competitive and resource efficient transport system,
COM (2011) 144 final. 504 Regulation (EU) No 2020/1054 of the European Parliament and of the Council of 15 July 2020 amending Regulation (EC) No 561/2006 as regards minimum requirements on maximum daily and weekly driving times, minimum breaks and daily and weekly
rest periods and Regulation (EU) No 165/2014 as regards positioning by means of tachographs; Regulation (EU) 2020/1055 of the
European Parliament and of the Council of 15 July 2020 amending Regulations (EC) No 1071/2009, (EC)No 1072/2009 and 9EU)
1024/2012 with a view to adapting them to developments in road transport sector; Directive (EU) 2020/1057 of the European
Parliament and of the Council of 15 July 2020 laying down specific rules with respect to Directive 96/71/EC and Directive
2014/67/EU for posting drivers in road transport sector and amending Directive 2006/22/EC as regards enforcement requirements and Regulation (EU) No 1024/2012.

188
certain provisions such as the mandatory return of the truck at regular intervals to
one of the operational centres of the undertaking.
803. To further enhance the smooth functioning of the EU passenger transport by bus
and coach, the Commission services will assess the adequacy of current driving
and rest time rules for bus and coach drivers. Should the assessment demonstrate
that, specificities of the bus and coach sector justify specific rules on driving and
rest times, the Commission may propose relevant adaptations.
4.3.3.2 Single European Railway Area
804. With the implementation of the Fourth Railway Package (a set of 6 legislative
measures adopted in 2016) the internal market for railway services is set to be
completed, resulting in a Single European Railway Area. This package puts the
emphasis on competition to deliver the efficiency and innovation. This is the final
step of a gradual process which started already in the 1990s.
805. The Fourth Railway Package comprises a ‘technical pillar’ and a
‘market/governance pillar’. The market pillar opens up to EU-wide competition the
market for domestic passenger services, which covers over 2/3 of all passenger
services. This follows the markets for rail freight and international passenger
services, which have been open to competition for years. Some Member States
(Austria, Czechia, Germany, Italy, Sweden) have already partially opened their
domestic markets, with positive results in terms of passenger volumes, quality of
service, choice, and in some cases rail fares. The Commission is closely
monitoring Member States’ implementation of the new legal framework.
806. From December 2020, EU railway companies anywhere in the EU will enjoy the
right to offer international and domestic rail services on a commercial basis, where
economically feasible (with possible exceptions related to economical interference
with existing Public Service Contracts). This is known as ‘open access
competition’, and has already helped to improve services and frequencies, and
reduce fares on some lines.
807. Furthermore, the package introduces the principle of mandatory competitive
tendering for public service contracts for rail. These contracts usually involve
public subsidies, because the public service obligations make them unprofitable.
Historically, they were awarded directly to the incumbent national railway
company.
808. As regards enforcement, it is important to bear in mind access to service facilities
(in respect of which details are regulated by way of a Commission Regulation505
),
which remains an essential condition for competition to develop on a fair basis, in
particular the maintenance of rolling stock.
Cross-border passenger services
809. In line with the ambition to promote sustainable modes of transport, there is a
growing wish to support cross-border rail passenger services. As described above,
the enabling regulatory framework is in place, but this kind of services are
currently underdeveloped.
505 Commission Implementing Regulation (EU) 2017/2177 of 22 November 2017 on access to service facilities and rail-related
services, https://eur-lex.europa.eu/legal-content/EN/TXT/?uri=CELEX%3A32017R2177

189
810. Member State initiatives, notably from the Netherlands and from Germany, aim at
promoting the development of new and revival of cross-border services, including
night train services. The Netherlands have set up a Member State platform which
will work on concrete measures to remove obstacles. Germany has developed the
so-called Trans Europe Express 2.0 concept which aims at the development of a
long distance cross-border high speed and night services network.
811. These Member State initiatives are welcome, provided they comply with all
relevant rules, including the relevant rail legislation, especially regarding market
access506
and State aid rules507
.
812. Finding neutral timetable information and easy ticketing options (also discussed in
section 4.2.1) are essential for the development of a successful network of cross-
border rail passenger services. Unequivocal, enforceable and clearly communicated
passenger rights are similarly essential to attract new passengers to rail.
4.3.3.2.1 Market access for public transport services by rail
813. Although the relevant legislation is in place, market access for public transport
services by rail is still hampered by several factors:
Access to information is essential to ensure that rail operators can submit
serious offers in tendering procedures. It is the object of a specific provision in
the 2016 amendments to the Regulation n°1370/2007. Nonetheless, there are
still extensive debates and litigations in Member States on the scope of the
information to be provided, which negatively affects the conduct of
competitive tendering procedures.
Access to rolling stock is identified as a major bottleneck for new entrants.
The amended Regulation n°1370/2007 provides that competent authorities
must assess whether measures to facilitate access to rolling stock are
necessary but are not obliged to adopt any such measures.
Ticketing for rail (through- or combined tickets) is hindered by several factors,
in particular the recurring issue of access to dynamic information on fares,
reservations and real-time traffic information (also discussed in section 4.2).
In addition, according to studies508
, the rules applicable to PSO compensation
could constitute hurdles to revenue sharing between PSO and commercial
operators via (combined) ticketing schemes.
The contracts that are directly awarded for long periods, as mentioned above,
have the effect of foreclosing the market accordingly.
4.3.3.2.2 Rail rolling stock availability
814. Rolling stock availability is a major barrier for new entrants. With the European
Union Agency for Railways (ERA) becoming the single authorisation authority
and bringing significantly enhanced harmonisation of technical requirements, rail
gets much closer to the situation of road and aviation, where the same vehicles and
aircraft can be used anywhere in the EU, increasing market flexibility and reducing
the risks for vehicle owners. However, the lack of ‘go-everywhere’ rail rolling
stock continues to increase cost. Establishing a rail system architecture that further
506 In particular Directive 2012/34/EU establishing a single European rail area, as amended by the Fourth Railway Package,
https://eur-lex.europa.eu/legal-content/EN/TXT/?uri=CELEX:02012L0034-20190101 507 Mostly, Regulation n°1370/2007 and the Community guidelines on State aid for railway undertakings of 22/7/2008. 508 Including study on “Remaining challenges for EU-wide integrated ticketing and payment systems”, European Commission,
Grimaldi Studio Legale , VVA , Wavestone, 2019 https://op.europa.eu/en/publication-detail/-/publication/8a7b0dd0-df3d-11e9-9c4e-01aa75ed71a1/language-en

190
aligns technical specifications for interoperability and the elimination of obstacles
caused by redundant national technical, safety and operating rules will help the rail
sector to modernise und become more attractive for new service providers and
clients.
815. Due to high costs and business risks, time lags and potential interoperability issues,
smooth and non-discriminatory access to rolling stock is fundamental for
alternative rail operators to enter new markets509
. This is particularly true for
passenger services (including night trains), regardless if they are provided under
PSO contracts or commercially. Smaller operators risk lacking the appropriate
financial resources to engage in significant investments for buying rolling stock in
order to enter a new domestic market or to compete for bigger PSO contracts.
816. The secondary markets and leasing markets for passenger rolling stock are very
limited, making it harder for new entrants to access rail markets. In some reported
instances, incumbents scrap or sell abroad redundant rolling stock instead of selling
or leasing them to new entrants (especially if new entrants would compete on the
same markets)510
. Rail regulatory bodies acknowledge that, although the rolling
stock market is not regulated, limited access to this market may severely restrict
access to the railway market for new entrants511
.
817. The Regulation on public passenger transport services by rail and by road512
includes some provisions related to rolling stock in the framework of competitive
tendering procedures for the attribution of public service obligations. Before
launching such procedures, competent authorities must assess the need for
measures to ensure effective and non-discriminatory access to suitable rolling
stock, taking into account the presence of rolling-stock leasing companies or
equivalent in the relevant market. Competent authorities could then decide to take
“appropriate measures” to ensure effective and non-discriminatory access to
suitable rolling stock.
818. The Commission also called the EU rail regulatory bodies to oversee the
assessment of rolling stock market to be performed by the competent authorities. In
the medium to long term, the tendency of competent authorities themselves to own
or finance rolling stock for Public Service contracts and progress in interoperability
levels will lead to better access to rolling stock. However, the availability of rolling
stock needs to be ensured also in the short to medium term to avoid barriers to the
development of the single rail market. It remains necessary to carefully review
existing models of procurement and financing of new and second hand rolling
stock and determine a policy to facilitate access, addressing also State aid aspects.
4.3.3.2.3 Rail interoperability
819. From a technical point of view, seamless rail transport throughout the EU requires
two main things. First, networks with harmonised characteristics and trains
designed to run on these networks. Second, harmonised operational rules between
the EU countries and operators (railway undertakings and infrastructure managers)
to allow efficient cross-border traffic.
820. Although the Fourth Railway Package provides for rail operators to receive a
single safety certificate from ERA for operations throughout the EU, operational
509 See also CER “Public Service Rail Transport in the European Union: an Overview”, June 2017. 510 See ALLRAIL contribution of 22 May 2019 to the consultation of stakeholders of future transport strategy. 511 See IRG-Rail contribution to the stakeholders’ consultation on the future transport strategy of 12 May 2017. 512 Regulation (EC) No 1370/2007 of the European Parliament and of the Council of 23 October 2007 on public passenger transport services by rail and by road and repealing Council Regulations (EEC) Nos 1191/69 and 1107/70, OJ L 315, 3.12.2007, p. 1.

191
and safety rules are not yet fully harmonised, adding to the complexity and cost of
cross border operations, and in particular resulting in stops and checks at borders
between Member States creating substantial delays. Differences in national
operational rules are also an obstacle to the development of pan-European digital
and automation solutions. Thus a major thrust of the future work of the
Commission, with the help of ERA, may be to harmonise these processes or
eliminate national rules leaving freedom for individual operators to optimise the
approach while ensuring safety.
821. In addition to EU-level harmonisation, the Commission is working on a voluntary
basis with the sector and Member States along Rail Freight Corridors to build trust
and solve the main issues: harmonisation of braking tests, checks at borders, timely
information on train composition between countries, as well as rules on language
competence, referred to as Issues Logbook.
822. Work is being conducted by the Commission on Technical Specifications for
Interoperability (TSIs), taking into account the next challenges ahead, linked to
various aspects of innovation like digitalisation, automation, decarbonisation and
cybersecurity, but also the interest in stability and predictability. A major issue in
rail is a chicken and egg problem whereby new innovations only have a business
case if they are widely deployed on both rolling stock and infrastructure. The EU
can assist in overcoming this issue by joint development of new technologies
(through the rail research partnership with rapid follow up in revised standards),
with commonly agreed deployment plans and via funding support from CEF. In
addition, a system architecture could be developed, splitting infrastructure and
rolling stock into modular components which would more readily be updated.
4.3.3.3 Aviation Single Market
4.3.3.3.1 Rules for air services
823. The Air Services Regulation513
provides a common set of rules regulating the
provision of air services within the Union, i.e. flights carrying passengers, cargo
and/or mail for remuneration and/or hire. It contains three sets of rules on the
licensing of EU carriers, the right of EU carriers to operate intra-EU flights and on
pricing of intra-EU air services.
824. The evaluation published in July 2019514
found that the Regulation had had overall
positive effects and brought sizeable EU added value in creating the EU internal
aviation market. On the other hand, it identified a number of shortcomings in all
three areas covered by the Regulation which may disproportionally affect certain
parts of the market and/or stakeholders, and where improvements may be
beneficial for the good functioning of the internal market for aviation.
825. An assessment of the impact of possible policy changes was launched following
the publication of the evaluation, and a support study carried out. However, the
dramatic changes to the situation facing the air services sector resulting from the
COVID-19 pandemic means that further analysis is required as to the expected
impact of different measures. This future work will also consider how the
framework may be adapted to better support the recovery and resilience of the
513 Regulation (EC) No 1008/2008 of the European Parliament and of the Council of 24 September 2008 on common rules for the
operation of air services in the Community (Recast), OJ L 293, 31.10.2008, p. 3. 514 SWD(2019) 295 final

192
sector in the medium to long-term, as well as to promote social and environmental
sustainability as far as possible.
4.3.3.3.2 Airport charges
826. Effective competition between suppliers, in this case airports, encourages cost-
effective operations, drives down prices and increases quality. It also enables
operators to make long-term investments in facilities and services that match the
requirements of the customers, in this case airlines and air passengers. The absence
of effective competition between airports could manifest itself in a range of ways.
Airports could choose to maintain airport charges at current levels but allow
quality to fall or could seek to raise airport charges above levels warranted by costs
faced by an efficient operator or by long-term investments. This could be the case
where airports operate efficiently and extract excessively high margins, which
would normally not be achievable in a competitive market. It could also occur
where airports operate inefficiently by allowing their costs to rise or by not
adopting cost-saving or innovative technologies, or a combination of these.
Historically, the reason why governments impose economic regulation on airports
(as well as other utility and public infrastructure providers), has been to curb ex
ante the risk that they misuse the significant market power they may hold.
827. This is also why in 2009, the European Union adopted a Directive on airport
charges (“the Airport Charges Directive”). The Airport Charges Directive has
established a common European framework for regulating essential features of the
airport charges setting process. The Directive has introduced a number of process-
based requirements (consultation, transparency, non-discrimination) that airports
and airlines need to comply with when the airport charges are negotiated. The
oversight and enforcement role has been given to independent supervisory
authorities (ISAs). The Directive applies to EU/EEA airports whose annual traffic
is over 5 million passenger movements and to the airport with the highest
passenger movement in each Member State.
828. In July 2019, the Commission published an evaluation of the Directive. This
evaluation has indicated that some of the elements of the Directive deserve
consideration. Certain questions do not find an explicit answer in the Directive, for
example as regards the requirements pertaining to the independence of the
supervisory authority in certain cases. It is also not clear whether the Directive
optimally focuses regulatory intervention on cases involving a risk of misuse of
significant market power, and ultimately on harm being imposed on EU
consumers.
829. As announced in the 2015 Aviation Strategy, a revision of the Airport Charges
Directive is expected. The above mentioned evaluation will provide the
background to such revision.
830. Capacity constraints at airports are an important factor in assessing the level of
competition between airports. At certain locations (small airports) there is
overcapacity and the airports struggle to cover their costs – such airports are more
proactive in attracting airlines. In contrast, and recognising the ongoing impact on
future demand for airport services of the COVID-19 pandemic and related
uncertainties, some airports (in particular the largest) have struggled with the
challenge of increasing capacity to keep pace with demand. Such congested
airports have been less able to increase volumes and hence have had less incentive
to reduce airport charges or improve further service quality.

193
4.3.3.3.3 Slots
831. Airport capacity could also be influenced by inefficient allocation of slots. The
number of EU congested airports has increased from 98 to 104 in the last 8 years,
to such an extent that at some of them no slots are available. More than 50 per cent
of the congested airports worldwide are located in Europe. While the existing slot
framework has managed to contain flight delays to a reasonable level, there are still
issues regarding the capacity utilisation and the efficiency of the allocation of slots.
Recent air carrier bankruptcies have shown the economic value of slots (in many
cases, slots are the most valuable asset air carriers have). The current allocation
system might inhibit competition between air carriers, by freezing slot allocation
and by giving an advantage to incumbent airlines as a result of the ‘grandfathering’
rules. The "use it or lose it" rule has led to behaviours by air carriers holding on to
slots even if they are unable to use them profitably, as opposed to making them
available to competitors or new entrants. The widespread lack of transparency on
the available capacity at airports that can be allocated, as well as on some
parameters used by the slot coordinator allocation, can affect the efficiency of the
process.
832. Further, an increased awareness of environmental concerns has started debates on
how to include environmental criteria in the slot allocation process. Lastly, the
recent COVID-19 pandemic has shown that the resilience of the Regulation to
quickly and efficiently respond to the needs of the market under such
circumstances should be improved. The Slot Regulation was quickly amended as a
result of the decrease in air traffic resulting from the pandemic, by exempting
airlines from certain slot use requirements. As the situation evolves and the market
slowly recovers the issue is no longer whether airlines should simply be exempted
from the rules or not. It is rather how to grant airlines relief but also gradually
return to a new normal. All the foregoing considerations should be taken into
account when discussions on the 2011 proposal will resume.
4.3.3.3.4 Groundhandling
833. While capacity is a bottleneck both in the air and on the ground, air carriers cannot
provide services without efficient and high quality groundhandling services.
Whether the lack of capacity of groundhandling services themselves contributes to
the lack of airport capacity or whether improved groundhandling services could
contribute to unlock capacity issues at congested airports are questions to be
clarified.
4.3.3.3.5 Computerised Reservation Systems
834. There are questions as to whether the ex-ante competition Regulation on a Code of
Conduct for computerised reservation systems (CRS) remains fit for purpose. An
evaluation of the Regulation on the CRS Code of Conduct515
found that in the
current context, the Regulation is less relevant than before for preventing distortion
of competition in air ticket distribution. At the same time, the evaluation showed
that new developments, such as the rise of new players and distribution channels
for air tickets, may require different action to improve market efficiency and
encourage fair competition, in so far as these aspects are not already covered by
existing horizontal legislation. The Commission is preparing an impact assessment
515 SWD(2020) 9 final, and Executive Summary SWD(2020) 11 final. https://ec.europa.eu/transport/sites/transport/files/legislation/swd20200009.pdf

194
of the full range of policy options, including possible revision, as a follow-up to the
evaluation.
4.3.3.3.6 Rules for air navigation services
Providers of data and terminal air navigation service providers
835. The fact that the European Air Traffic Management (ATM) system comprises a
patchwork of national ATM systems operated by national air navigation service
providers (ANSPs) means that interoperability and network efficiency creates an
obstacle for sharing data. ATM capacity cannot be scaled to meet changes and
fluctuations in demand. In 2018, delays grew disproportionately compared to
traffic – traffic grew 14% but delays grew 273%. The main constraints are lack of
flexibility of staff and technology. The seasonal peaks of traffic make this issue
even more complex.
836. The SESAR project has delivered new concepts and technologies but this has not
translated into technology uptake at a sufficiently rapid pace, partly due to the
challenge of availability of the required standards. A single market for ATM data
services and terminal air navigation services is needed to foster interoperability and
the take-up of innovative technologies and processes of providing air navigation
services.
837. Currently, air traffic services are almost everywhere provided by vertically
integrated national ANSPs. Those national ANSPs are each responsible for
producing, processing and combining this data to make it available to their
frontline operators, who will use it to provide air traffic services for airspace users.
Most of this data is currently not shared between ANSPs. Remote provision of air
traffic services is not possible as along as all needed ATM data are not available
across the network. The shift to new service delivery models could enable further
rationalisation of the underlying infrastructure, whereby the focus will move from
local infrastructure to service provision complying with performance requirements.
Achieving a resilient European ATM system requires an evolution of the existing
model so that the necessary ATM data (such as communication, navigation,
satellite, meteorological and aeronautical information data) can be shared and
made available to ANSP throughout the Union. The onset of a new European
market for ATM data services would need to be underpinned by technical
solutions, legal requirements and service delivery structures in order to function
effectively.
Regulatory oversight of air navigation services
838. The Single European Sky has contributed to certain improvements in the
performance and modernisation of the European ATM sector but it has not yet
generated the expected paradigm change in terms of performance by ANSPs and
has not sufficiently reduced fragmentation of the European ATM system.
Currently, the Commission is the de-facto economic regulator of monopolistic air
navigation service providers. It adopts implementing Decisions, based on the
advice from the independent Performance Review Body (PRB). Those Decisions
are adopted under qualified majority voting of Member States that are at the same
time the owners of the regulated entities. To increase the efficiency and
effectiveness of the economic regulation, the Commission proposed in its recent
SES2+ amended proposal516
to establish a fully independent European regulator.
Furthermore, economic regulatory oversight of air navigation services that are
516 COM(2020)579 final.
195
provided under monopolistic conditions is not effective. Where National
Supervisory Authorities (NSAs) lack independence from entities that exert
ownership rights over regulated service providers, conflicts of interest inevitably
hamper service quality and price.
839. Defragmentation of the European airspace requires economic regulation and
monitoring across borders where and as long as competitive supply of services
does not prevail. Presently, economic regulation lacks the necessary independence
from the entities that exert ownership rights over the regulated undertakings. Users
lack trust and confidence in national economic regulatory bodies, they do not lodge
complaints and the national supervisory authorities generally hesitate to take
stringent decisions and do not apply penalties to enforce them. National economic
regulators have no procedures to exchange dossiers, to handle cases jointly. They
do not exchange information on cases, there is no joint investigation, and site
inspections of service providers are not foreseen in Union legislation on economic
regulation.
840. According to a survey at the level of the National Supervisory Authority
Coordination Platform-Performance Working Group, airspace users do not lodge
complaints with NSA on aspects of economic regulation. Economic regulators
have to be able to impose penalties where a regulated entity does not abide by their
decision or does not give access to requested information. Although Single
European Sky legislation foresees the instrument of penalties, most national
economic regulators have not used it. Similarly, judicial appeals against decisions
of regulators or air navigation service providers have rarely occurred.
841. Effective regulation can ensure transparency and effective stakeholder
consultation. Airlines should understand what they pay for and they should be able
to curb excessive surpluses of service providers, as long as air navigation services
are not provided on market conditions. Surpluses of regulated undertakings in
excess of surpluses in competitive sectors can indicate monopolistic pricing and
ineffective price regulation. Conversely, where air navigation services previously
provided under monopolistic service provision were shifted to be provided under
market conditions, the competent authorities witnessed a significant drop of the
price with the same or better service quality.
4.3.3.4 Waterborne Single Market
4.3.3.4.1 Inland waterways transport market rules
842. The existing legislation concerning the Inland waterways transport (IWT) market is
globally old (adopted between the 1960s and 1990s) and so does not sufficiently
take into account the changes occurred in the sector as well as the geographical
extension of the European Union.
843. There is therefore a need to evaluate the existing IWT market access related
legislation, in terms notably of excessive regulatory burdens, unintended effects,
overlaps, gaps, inconsistencies and/or obsolete measures which may have appeared
over time and represent barriers for a smooth and fair IWT market.
844. Finally, mobility within the IWT internal market is hampered by the absence of an
appropriate legal framework on crewing requirements at EU level. Operators face
various requirements when operating cross-border. Current applicable national
rules regarding crewing requirements (including rest times) are considered

196
outdated, do not take account of technical and educational developments and, in
general, of the workload of the crew.
4.3.3.4.2 Mutual recognition of boating licences (maritime and inland waterways)
845. Contrary to car driving licences, the national boating licences for recreational craft
are often not mutually recognised by the EU Member States, nor do all EU
Member States recognise the UNECE’s International Certificate for Operators of
Pleasure Craft (ICC)517
and there are no EU level measures to address this
problem. This means for example that in case of moving from one Member State to
another (e.g. from Belgium to Germany), EU citizens lose their boating licence.
846. Improved mutual recognition of boating certificates and in particular the ICC could
ensure free movement of people as well as support employment in the yachting and
marinas sector thanks to increased recreational boating in and between Member
States. Today the sector counts about 253,000 directly employed persons (372,000
including indirect employment).
4.3.3.4.3 Regulatory oversight of ships operating in EU
847. In relation to the maritime transport, while the rulemaking is international, the
control and enforcement mechanisms are weak and essentially left to the individual
States. It is widely acknowledged that lack of enforcement is the weak point of
international maritime regulation since IMO is a decision making body but lacks
any control and enforcement mandate. Only in 2016, mandatory audits to all the
IMO States were commenced with the aim of determining the extent to which they
give full and complete effect to their obligations and responsibilities as flag, port
and coastal States. However, the results of the individual audits are not publicly
available and there is no system of sanctions for the States that are not
promulgating and implementing the international conventions.
848. Whereas through the EU a reasonable level playing field was achieved between EU
Member States, this is not the case between EU flags and third country flags. The
IMO States have very different levels of capacity to give full effect to the
international rules. This creates distortion of competition and undermines the
effectiveness of the regulatory framework since it may cost less for a shipowner to
be registered under a flag of a third State that does not fully enforce all the rules –
while ships still compete for the same cargo and sail anywhere in the world.
849. As a result, the number of EU ships in the world fleet is slowly decreasing. Today,
the Commission's 2004 Guidelines on State aid to maritime transport include the
tonnage tax to address this issue. Under tonnage tax schemes, maritime transport
companies pay taxes on the basis of the ship tonnage (i.e. the size of the shipping
fleet) rather than on the basis of their actual taxable profits. Such schemes can be
approved by the Commission under EU State aid rules. Without such schemes, an
even greater number of ships would be flagged out for tax reasons.
850. Apart from the competitiveness aspect, this also poses a maritime and
environmental safety problems. Weak enforcement of international rules
undermines flag State responsibility as the first line of defence to ensure maritime
safety. Coordinated and harmonised enforcement mechanisms based on port State
Control also involving the European Maritime Safety Agency (EMSA) are
517 International Certificate for Operators of Pleasure Craft, Resolution No. 40 adopted by the UNECE Working Party on Inland Water Transport

197
available when it comes to ensuring implementation of the international rules on
board vessels calling to EU ports regardless of flag.
4.3.4 Social aspects
851. The transport sector is a major contributor to the EU economy, supporting millions
of jobs across the EU and being a key driver of European integration. The sector
represented around 5% of the EU workforce in 2017.
852. European social standards and rules protecting consumers are among the strongest
of the world. Yet, certain developments puts those aspects at risk: the economic
downturn due to the pandemic, uneven level playing field amid growing
international competition, erosion of traditional social structures and demographic
change, are among the challenges that should be addressed to keep a high-skilled
workforce in Europe, protect workers’ rights and to ensure that the green and
digital transitions are just and inclusive518
. To foster mobility of people, the
transport sector should also remain affordable, available (including for persons
with disabilities519
and reduced mobility or living in rural and remote areas),
accessible, and offer high quality services.
853. Mobility is a critical aspect of social inclusion and an important determinant of
well-being including for vulnerable groups of society. Transport fulfils a basic
need and has an enabling function insofar that it affects household’s income as
well as citizens’ ability to integrate into society and the labour market. For
example, public transport enables access to various public services, such as health
services, childcare, education, long-term care, housing, labour market and social
services as well as leisure activities. It follows from Principle 20 of the European
Pillar of Social Rights that certain transport services can be considered essential
services to which everyone has the right to access. The same principle also states:
‘Support for access to such services shall be available for those in need.’ Yet,
important barriers that can make it difficult for people to access these services
include income, age, gender, disability or reduced mobility and territorial
inequalities/ spatial segregation.
4.3.4.1 Workers’ rights and transition to automation and sustainability
854. Workers in the transport sector face a number of challenges when it comes to
social rules and their application.
855. First, it might be difficult to identify applicable social rules. Some mobile
transport workers cross one or several borders on a daily basis. It can therefore be
sometimes challenging to identify which are the applicable labour law and social
security rules. A large majority of competences regarding social security and
518 This Commission is further strengthening social dialogue and social partner involvement in the definition of EU initiatives. President Ursula von der Leyen stressed her firm commitment to strengthen social dialogue and to engage with social partners at the
EU level across all of our priorities, including sectoral initiatives having a social dimension. The Commission Communication of 27
May on the Recovery Plan also underlined the need for a close cooperation with social partners to achieve a fair and inclusive recovery. In times of economic crisis, a well-functioning social dialogue becomes even more important to create the conditions for a
sustainable recovery.
In this context, DG MOVE and DG EMPL organised a dedicated hearing with all the transport social partners on the Strategy for
Sustainable and Smart Mobility. The objective of the hearing was to complement the open public consultation through a targeted
consultation of social partners. Moreover, social partners were given the opportunity to send written material, in addition to the
formal Open Public Consultation. 519 The European Disability Forum estimates the number of persons with disabilities to be over 100 million in Europe.

198
applicable law lays in the hands of Member States. This is a problem for the
protection of workers’ rights and for the level playing field.
856. Recent studies520
have shown that 40% of drivers in the road transport sector
across the EU work regularly more than the allowed maximum average 48 hours
per week. The picture is similar in other transport modes. Atypical legal
constructions also often divert legal responsibilities and may result in less
favourable working conditions for workers.
857. In maritime transport, the jurisdiction relevant for social security protection
changes frequently as the consequence of seafarers operating on relatively short-
term contracts. It becomes an incoherent patchwork.
858. There is also a need for clarifying the social security rules for the inland waterway
transport sector. There are currently several regimes applicable on EU waterways.
There is a need for clarifying key concepts and applicable rules as well as for a
single regime at EU level.
859. In a liberalised and competitive aviation market that requires greater flexibility and
cost-effectiveness, airlines’ business models have evolved significantly. In this
context, various employment arrangements and practices have developed in the
sector. Low-cost flights, that typically operate point to point, grew by 61% from
2007 to 2016. With the increase in point to point routes, the number of operational
bases has steadily grown since 2008, and aircraft and aircrews of the same airline
are increasingly based outside the principal place of business of the airline.
860. This trend has intensified the cross-border nature of aircrew activities and added
complexity to their legal status under EU and national law. While all staff benefit
from the protection offered by EU law they may enjoy different rights and levels of
protection depending on the national law that applies to them. It has created
uncertainty as to what labour law applies to the employment contract of aircrews
assigned to a home base outside the principal place of business of the airline, how
to apply the existing rules and what court has jurisdiction but also which authority
should ensure enforcement of their national labour legislation in the case of
aircrews based in their country but working for an air carrier seated in another
country. Moreover, the contractual home base may not always correspond to the
place from where the aircrews effectively start and finish their duty.
861. Taking into account structural changes in the aviation market, the Commission
decided to work on how to improve the social agenda for aircrews. In 2015, the
Commission presented an Aviation strategy for Europe, which highlighted the
social agenda in aviation as a priority and commissioned soon after a study on
employment and working conditions of aircrews in the EU internal aviation
market.521
According to this study, the majority of aircrew members who
responded to the survey (82% of pilots and 88% of cabin crew) said that the labour
law applicable to their contract is that of their contractual home base. Air carriers
who tend to operate multiple operational bases where aircrews are based were
found to be more likely to apply the law corresponding to the country where they
have their principle place of business, regardless of where their aircrews are based.
862. In March 2019, the Commission issued a report on maintaining and promoting
high social standards in aviation, focusing on aircrews. The Commission, in the
520 Ex-post evaluation of social legislation in road transport and its enforcement, Final report, Page 127.
https://ec.europa.eu/transport/sites/transport/files/facts-fundings/evaluations/doc/2016-ex-post-eval-road-transport-social-
legislation-final-report.pdf 521 https://op.europa.eu/en/publication-detail/-/publication/97abb7bb-54f3-11e9-a8ed-01aa75ed71a1

199
context of its expert group on social matters related to aircrews, has been looking
at the specific issue of enforcement of applicable labour law and its application to
aircrews in the light of existing EU law and at how this could be further improved
by identifying best practices and providing recommendations. A document drawn
up in September 2020 on this subject, highlights in particular the need to further
improve enforcement of applicable labour law by the authorities of the country
where the aircrews concerned are based for the better protection of aircrews and
the proper functioning of the internal market, and to raise awareness for the benefit
of both crew members and airlines.
863. In this context, an updated Practice guide on Jurisdiction and applicable law in
international disputes between the employee and the employer was adopted by the
European Judicial Network in November 2020 to reflect all the important
clarifications brought by the European Court of Justice in its judgments since the
first Guide was published in 2016. Its aim is to guide practitioners and provide
further clarity and better information on the rules on jurisdiction and applicable law
and consequently assure better protection of aircrew and a level playing field
between carriers. The Updated Practice Guide will contribute to the correct
enforcement of the rights that workers draw from EU and national law.
864. In the field of Air Traffic Management, where labour agreements are concluded at
the national level, the Commission has invited staff associations522
to participate in
the developments of a roadmap on the implementation of the Single European Sky
reform.
865. Airport groundhandling services are a competitive and labour-intensive industry.
Such industry features have led to pressure to reduce costs which may have
impacted working and employment conditions. The Commission is carrying out an
evaluation of the Groundhandling Directive which will look at possible unintended
social impacts on groundhandling workers. Moreover, the work undertaken by
EASA on safety standards on this matter should allow to improve the situation.
866. Second, the level of social protection can be insufficient. Through the European
Pillar of Social Rights, the EU works to safeguard the rights of citizens by ensuring
equal opportunities and access to the labour market, fair working conditions, and
social protection and inclusion. EU employment legislation guarantees minimum
levels of protection that apply to everyone living and working in the EU. The EU
provides common rules to protect social security rights when moving within
Europe523
.The rules on social security coordination do not replace national systems
with a single European one. All Member States remain free to decide who is to be
insured under their legislation, which benefits are granted and under what
conditions. There can be big discrepancies between Member States.
867. These discrepancies, if coupled with disregard for applicable social rules by certain
operators and with ineffective enforcement by authorities, can give rise to
precarious employment practices and harsh working conditions, and lead to social
dumping. The lack of proper enforcement of social rules occurs too often. These
cover low detection of infringements to social rules and poor execution of
penalties. This is partially linked to the above mentioned problem of unclear
applicable rules. Social security and applicable law lays this responsibility with the
Member States.
522 In the context of EGHD: Expert Group on the Human Dimension of the Single European Sky 523 Regulation (EC) No 883/2004, social security coordination.

200
868. Traditionally the port labour market has in many places been subject to regulations
and collective agreements necessary to adapt to the irregularity of port traffic and
the ensuing fluctuations in labour demand. The current evolutions in the shipping
sector, in particular the development of megaships, with massive volumes of cargo
to be loaded/unloaded, brings additional constraints on the organisation of port
labour and on working conditions.
869. In the maritime transport sector, precarious working conditions often stem from
fierce cost-based competition in the sector, as EU carriers face strong competition
from non-EU carriers in particular from Asia. Since seafarers can be recruited
anywhere in the world, shipowners increasingly tend to recruit seafarers through
manning companies in low cost labour supplying States, including for vessels
flying the EU MS flag. The salary is low compared to European standards and
social security protection is scattered between flag States. The difference in labour
cost can therefore be quite considerable on and between vessels operating under
the same national jurisdiction. In practice, this can mean that national legislation
such as on minimum wage can be circumvented. Other national rules, such as anti-
discrimination legislation on the prohibition of mandatory pregnancy testing, can
also be circumvented when the seafarers is recruited though manning companies in
third countries before arriving to Europe to serve on a vessel.
870. Inland navigation is not an exception and also face challenges to improve
workers’ working conditions, in particular in the river cruise sector. Concerns have
also been raised about the application of the rules on posting of workers due to the
highly mobile nature of the workforce as well as the heavy administrative burden
faced by the small and medium-sized enterprises that make up most of the inland
navigation sector.
871. In waterborne transport, the enforcement authorities therefore tend to focus more
on vessels safety related issues as low hanging fruits since controls on working and
living conditions (social rules) are more difficult to detect. Besides in inland
navigation, there is no extra-territoriality principle (as it exists in road transport).
The fact that the offences committed in a Member State during a journey cannot be
sanctioned in any other Member State for a certain period considerably decreases
the effectiveness of the enforcement.
872. Working and living conditions for seafarers are regulated through the Maritime
Labour Convention of the International Labour Organization (ILO) setting
minimum standards. Those minimum standards are in most essentials retained at
EU level in the Directive implementing the European social partner’s agreement.
Control issues at EU level are incorporated into the overall EU legislation for flag
and port State control. The EU sectoral social dialogue committee in the port sector
provides the social partners with a framework to develop a joint approach to the
social challenges related to port labour relations, including working conditions,
health and safety questions, digitalisation, training requirements and professional
qualifications.
873. The International Maritime Organization’s Convention on Standards of Training,
Certification and Watchkeeping for Seafarers (STCW) ensures the minimum level
of training for seafarers on board vessels and it is implemented in to EU law by the
Directive 2008/106 as amended. The STCW Convention includes a common
system of EU-wide recognition of third countries that comply with the
requirements therein. The systems in third countries is monitored regularly by the
Commission with the assistance of European Maritime Safety Agency. This

201
monitoring scheme also includes verification of the compliance by the Member
States.
874. In road transport, the preparatory work524
leading to the Commission’s proposal
in 2017 (Mobility Package 1) has identified a number of issues behind the problem
of inadequate working and social conditions of drivers, such as illicit employment
practices, long periods away from home and inadequate resting facilities as well as
issues related to enforcement. Regulation (EU) 2020/1054525
adopted in July 2020
aims to address these issues (see also section 3.5). The top priority of the
Commission is to ensure common understanding of the legislation and monitor its
consistent application and effective enforcement by the Member States.
875. The set of rules adopted in July 2020 under Mobility Package I not only clarifies
and strengthens certain provisions in the road transport legislation but also includes
enhanced enforcement requirements. The new enforcement regime should
significantly improve compliance with the social and market rules in road transport
by eliminating precarious employment and business practices.
876. Platform work is understood as all labour provided through, on, or mediated by
online platforms in a wide range of sectors, including transport (drivers and
delivery workers). The main challenges identified in a recent study526
include
employment status, information available to the workers about their working
conditions, dispute resolution, collective rights and non-discrimination. According
to this study, national legislation on working conditions and social protection of
platform workers is still rare527
. There is some sector-specific legislation, such as
on personal transportation services and food delivery services provided through
platforms. It regulates the working conditions and social protection for persons in
non-standard employment or enhances the rights and protection of the self-
employed. Given that platform workers are mostly treated as self-employed, their
collective representation poses a challenge and trade unions do not necessarily
defend the interests of platform workers528
. On 30 June 2020, the Commission
launched a process – comprising both a public consultation and informal
consultations with stakeholders – to ensure that the EU competition rules do not
stand in the way of collective bargaining for vulnerable self-employed people,
including platform workers.529
877. Overall, changes in the sector, in particular those relating to automation and
digitalisation are bringing many challenges. Jobs in the transport sector, especially
low- and middle-skilled jobs, are at high risk of automation. At the same time, the
ongoing digital transformation presents new opportunities, such as an improved
working environment or completely new jobs. A recent consultation of the SME
panel revealed that transport companies on average do not think their labour force
is well prepared for the transition to automation and digitalisation, almost half
(44%) thinks it is even insufficiently or not prepared at all. Over one in three (37%)
responding transport SMEs indicate that it has a need for guidance on how to
524 SWD(2017) 186 final 525 Regulation (EU) 2020/1054 of the European Parliament and of the Council of 15 July 2020 amending Regulation (EC) No 561/2006 as regards minimum requirements on maximum daily and weekly driving times, minimum breaks and daily and weekly
rest periods and Regulation (EU) No 165/2014 as regards positioning by means of tachographs; OJ L 249, 31.7.2020, p. 1. 526 European Commission (2020), Study to gather evidence on the working conditions of platform workers, https://ec.europa.eu/social/main.jsp?langId=en&catId=89&newsId=9582&furtherNews=yes#navItem-1 527 The study found that France is the only Member State that has enacted national legislation with a view to improving the labour
and social rights of platform workers. 528 Eurofound (2019), Platform work: Maximising the potential while safeguarding standards, Publications Office of the European
Union, Luxembourg. 529 European Commission press release IP/20/1937, 30 June 2020, "Competition: The European Commission launches a process to address the issue of collective bargaining for the self-employed".
202
anticipate or manage the transition towards automation and digitalisation. Another
33% indicate it does not know whether additional guidance is needed, which might
be an indication of insufficient insights in how automation and digitalisation might
affect the future of work and the workforce.
878. At this stage, the exact pace, scope and impact of automation in transport is unclear
and estimates of how many jobs or tasks will become redundant or will change
considerably in the future vary significantly.
879. In aviation, digitalisation is not expected to generate unemployment in Air Traffic
Management but will require the definition of new competency profiles, which
shall be supported by amended regulations for the licensing and training of traffic
controllers and technical personnel. Some reskilling of staff will also be necessary,
notably by adapting the training methods to more automated tools.
880. Digitalisation and automation also require a significant adaptation of port
workers’ training and skills and may have profound impact on local communities.
Under the research topic “The Port of the Future” Horizon 2020 finances four
research projects looking at the possible future developments of ports and port
operations530
. The Connecting Europe Facility is funding the project iTerminals
4.0, which will develop and perform Internet of Things (IoT) solutions and
operational pilots at eight European container terminals531
. In a recent study of the
potential and impact of transport automation, the World Maritime University
points to the rapid development of port automation and the importance of training
and reskilling of the workforce in ports532
.
881. At the same time, development of new technologies is contributing in changing
the shipping industry. Equally, the role of seafarers and crew members in inland
navigation changes or is expected to change as technology on board and onshore
change. Paper charts are replaced by electronic, navigation started to rely on
autopilot, engine room are frequently operating unattended, thus in general systems
on board becoming more autonomous and able to make decisions. This requires a
change of the education, training and employment philosophy in the sector. Since
some position would become redundant as replaced by the new technology
seafarers, crew, still being needed, would have to become more specialised and
learn to operate surrounded by technology as a new co-worker.
882. Transition to more sustainable transport will also impact the workforce. As stated
in the Communication on the European Green Deal, pro-active re-skilling and
upskilling are necessary to reap the benefits of the ecological transition. The
proposed European Social Fund+, Just Transition Fund as well as the Recovery
and Resilience Facility will play an important role in helping Europe’s workforce
to acquire the skills they need to transfer from declining sectors to growing sectors
and to adapt to new processes.533
530 See DocksTheFuture https://www.docksthefuture.eu/, COREALIS https://www.corealis.eu/, Port Forward
https://www.portforward-project.eu/, and PIXEL https://pixel-ports.eu/. 531 See https://ec.europa.eu/inea/en/connecting-europe-facility/cef-transport/2018-eu-tm-0135-s 532 See World Maritime University (2019), Transport 2040: Automation, Technology, Employment – The Future of Work,
https://commons.wmu.se/cgi/viewcontent.cgi?article=1071&context=lib_reports 533 Furthermore the 2019 annual edition of ‘Employment and Social Developments in Europe’ acknowledges that “If well managed,
the shift towards a climate-neutral economy can provide employment opportunities for all skill levels. The sectors supporting a
transition towards green jobs are mainly construction, transport, manufacturing and services sectors. The highest proportions of
employment in green(able) jobs are found in construction (73%), transport (61%) and in manufacturing, energy and waste
management and professional service activities There is a contrast in skill composition between new and emerging green jobs on the
one hand and non-green ‘green rival’ jobs on the other. This contrast is significant for all sectors, notably manufacturing, construction and transport, which have high proportions of workers in low-skilled employment in non-green jobs. This illustrates the

203
883. In recent years, the increasing globalisation of value chains, new business models
and forms of work, as well as technological developments, put the industrial
relations systems face to critical challenges and ask for revitalised industrial
policies in the transport sectors. Trade unions, employer organisations and public
authorities play an important role in the governance of the employment
relationship, through collective bargaining and sectoral collective agreements. The
improvement of the functioning of social dialogue and adequate involvement of
social partners are crucial to ensure resilience of the transport labour market on
both short and long term.
4.3.4.2 Skills and attractiveness of transport jobs
884. The success of EU transport largely depends on the availability of a skilled
workforce. There is a risk of skills mismatch for certain transport sectors already
today and the workforce will need to keep pace with changing skill requirements
caused by automation and digitalisation, as well as by transition to a more
sustainable mobility. The availability of skilled workers may also be impacted by
the COVID-19 pandemic534
which particularly hit the transport sector and its
workers.
885. Any shortage of transport workers535
could compromise growth and reduce
European connectivity. This risk exists in all modes with an ageing workforce (a
third of workers are above 50 years old and mostly male536
). This is notably due to
the lack of attractiveness of the sector, in particular for young people and women.
886. Furthermore, as explained in the previous section, the transport sector often suffers
from harsh working conditions. These include atypical hours, long periods away
from home or frequent problems of harassment and lead to a general lack of
attractiveness of jobs in the transport sector.
887. This lack of attractiveness and the need to make the transport sector more
appealing to women were also raised by stakeholders in their responses to the
public consultations on the ‘Sustainable and Smart Mobility Strategy’: a survey of
more than 2,770 women transport workers from across Europe showed that “what
is most needed in the transport sector is to eliminate the entrenched male culture,
to provide safe workplaces where women are not exposed to violence and
harassment by colleagues, superiors or customers, to have full access to proper
sanitary facilities, to end unequal pay and to foster a good work-life balance”537
.
888. A further reason for not being appealing is the lack of information about what the
sector does and what the career prospects are with sometimes reduced
employability and overall attractiveness of careers due to very specific
qualifications. The European sectoral social dialogue committees, the first Mobility
skills challenges of the transition to the green economy and the need for significant upskilling in these sectors. The skills profile of
new and emerging green jobs, the fastest growing category, can be seen as a proxy for future skill needs in these sectors.” 534 This is notably highlighted by aviation professionals and workers’ associations in the context of their COVID-19 statement https://www.eurocockpit.be/news/covid-19-aviation-time-rethink, https://www.etf-europe.org/wp-content/uploads/2020/09/COVID-
19-statement-ETF-230920.pdf 535 For instance, there is an acute need for skilled drivers in freight and passenger road transport sector. According to IRU research, Europe is facing the most acute driver shortage in decades. In 2019, the freight sector had a driver shortage of 23% and the
passenger transport sector of 19%. This is a growing trend as IRU estimates that the shortage of freight drivers will rise to 36% in
2020. Awaiting the automation of transport operations the sector needs swift short term solutions to satisfy the transport demand,
even though disturbed temporarily by COVID-19 pandemic.
536 According to the European Transport Workers’ Federation, the average age of trucks drivers is around 45, while the average age
of bus and coach drivers is 55 years plus, and an estimated 98% of the drivers are male.
537 Survey by the European Transport Workers’ Federation.

204
Package proposed in 2017 and the ‘Women in Transport – EU Platform for
change’538
have started addressing these issues.
889. To fight today’s driver shortage, comprehensive measures are needed. For
instance, for long distance road transport, the establishment of a comprehensive
network of safe and secure parking will contribute to better working conditions and
allow easier access to the profession for female drivers. The emerging highly
automated driving technologies may help to address the issue of shortage and
gender imbalance of drivers in the road sector. Driverless lorries in long-distance
operations and remotely controlled vehicles may attract newcomers, including
women, with the right skillsets required to operate or monitor such highly
automated vehicles.
890. The ageing of the transport workforce also increases the need for developing
lifelong learning programmes and increasing recruitment efforts for new
technology-based skills and knowledge. In particular for key occupations such as
train drivers this will be crucial to fully tap into the potential of digitalisation and
automation.
891. Removing more and more staff from train technical functions will make them
available for service jobs at terminals and station platforms or on board trains and
may thus increase the quality and safety of services and help reducing cost. The
opportunities offered by the technological innovation could help identifying ways
to attract young people and women to the sector. Training and communication
skills must adapt accordingly. The EU rules on the certification of train drivers is
an important contribution in helping skillset to remain adequate in changing
circumstances. Should these rules be revised, the impact of technological
developments must be taken into account in order to shape the skills and job profile
of future train drivers.
892. In aviation, the level of attractiveness of the sector, which still remains generally
high, has however been somewhat degraded over the past years due to fierce cost-
based competition among market players. The situation is different in the segment
of air traffic management workers, where wages remain attractive but working
conditions may be affected locally by staff shortages and increasing requirements
for flexibility in work organisation.
893. The attractiveness of waterborne transport suffers from harsh working conditions,
such as atypical hours, long periods away from home, and reported cases of
harassment. A further reason for the lack of appeal is the scarcity of information
about what the sector does and what the career prospects are.
894. Maritime transport appears to have continuing difficulties in attracting European
youngsters. One of the reasons include a general perception of harsh working and
living conditions, and the absence of a modern working environment i.e. access to
internet on board of vessels. The seafarer’s profession has also taken a reputational
hit from reported experiences of forced labour, working under unacceptable
conditions.
895. Waterborne is a sector predominantly employing males, with women representing
no more than 2% of seafarers globally. From a geographical perspective, the
majority of seafarers originates from Asia (Philippines, India and Turkey) and
Eastern Europe (Ukraine, Russia). In the EU, the main labour supplying countries
are Romania, Bulgaria, Poland and Croatia.
538 https://ec.europa.eu/transport/themes/social/women-transport-eu-platform-change_en

205
896. EU social policy in maritime transport aims at ensuring decent living and working
conditions for seafarers, as well as adequate social protection to maintain the
attractiveness of the profession; alongside enhancing adequate education levels. A
main vehicle for Commission policy development of social issues in waterborne
transport has also been the sectoral social dialogue between the social partners.
However, as of today there is no systematic EU dialogue at expert level with
Member State on these issues.
897. The Commission has initiated a number of projects and studies, among which the
“SkillSea Project” under the “Blueprint for sectoral cooperation on skills”, to be
concluded in 2023. The Commission also recently published a study on social
aspects within maritime transport sector. The study examined policy achievements,
gaps and shortcomings on social aspects since the ad-hoc Task Force on Maritime
Employment and Competitiveness (2011) was set-up; its recommendations are
being further discussed with European social partners and Member States.
898. To increase the accessibility of transport, professionals also need to be trained on
accessibility and on providing assistance to passengers with disabilities and
reduced mobility. The legislative developments enhancing accessibility for persons
with disabilities and reduced mobility and requiring the provision of assistance for
these persons provide new business and job opportunities in these markets.
899. The European Commission remains active at all international fora in discussions
and actions on adapting the global regulation to new realities of the transport
workforce, taking into account the pandemic crisis, as well as to make transport
more resilient to any crisis in the future.
4.3.4.3 Access to transport: affordability, availability and accessibility
900. Affordability of transport is a crucial issue. Indeed, whereas the Single Market in
transport led to lower prices and more choices, increasing Europeans’ connectivity,
mobility remains expensive for people who are more vulnerable. In fact, for users
of transport services in the EU, consumer prices for operation of personal transport
equipment and for transport services have increased at a faster pace between 2005
and 2018 than overall consumer price inflation.539
Yet, the share of transport in
final household expenditure on consumption has remained basically unchanged at
13% from 2005 to 2018. This figure varies depending on the Member State - in
2018, the share of household expenditure devoted to transport was largest in
Slovenia (16.9%), ahead of Lithuania and Luxembourg (both 15.8%), and the
smallest in Slovakia (6.8%), Croatia (9.7%) and Czechia (10.4%).
901. The price index for fuels and lubricants for the operation of personal transport
equipment has increased by 9% from 2015 to 2019 (the price index for overall
transport services, purchase and operation of personal transport equipment has
increased by 8% over this period). The consumer price index for passenger
transport services has also increased from 2015 to 2019, although differently for
each mode: rail: + 5%; aviation: + 7%; waterborne: +4%; and road transport:
+5%.540
Yet, the share of transport in final household expenditure on consumption
has remained basically unchanged at 13% from 2005 to 2018.
539 As measured by the harmonised index of consumer prices. Source: European Commission (2020): EU Transport in Figures.
Statistical Pocketbook 2020. 540 Source: European Commission (2020): EU Transport in Figures. Statistical Pocketbook 2020.

206
Figure 40: Share of different items in household consumption expenditure in the EU541
902. In the EU-27, 2.3 % of the population cannot afford public transport and in some
Member States more than 5% of the population cannot afford public transport (e.g.
Romania, Bulgaria). Low-income households struggle even more to afford public
transport. On average, 5.4% of the population with the lowest income in the EU-27
cannot afford public transport, and in some Member States this share can reach up
to 20 % (19.5% Bulgaria, 17.3% Hungary, 11.9 % Romania)542
.
903. In 2018, private households in the EU-27 spent EUR 931 billion or roughly 13% of
their total consumption on transport-related items. Around 30 % of this sum
(around EUR 262 billion) was used to purchase vehicles, around half (EUR 510
billion) was spent on the operation of personal transport equipment (e.g. to buy
fuel for the car) and the rest (EUR 159 billion) was spent for transport services
(e.g. bus, train, plane tickets).
904. As regards to private cars: the EU counts 531 cars per 1,000 inhabitants.
Luxembourg has the highest car density in the EU (690 per 1,000 people) and
Latvia the lowest (329). In Latvia, nearly half of all household (48.8%) do not own
a car, while more than 31% of French families have two cars (ACEA Report,
2019). The daily use of cars is also closely related to income levels: respondents
who almost never have difficulties paying bills are more likely to use a car on a
daily basis (52%) than those who have difficulties paying their bills most of the
time (37%), so car ownership and use can be correlated with income and wealth
levels. On average, 6.5 % of all EU citizens cannot afford a car and in some
countries, this share exceeds 20% (Hungary, Bulgaria and Romania).
905. When choosing between different transport modes, the unemployed are the most
likely to use urban public transport: 23 % against an average of 19 %
541 Source: Eurostat. 542 Source: Eurostat, EU-SILC Survey, data for 2014
207
(Eurobarometer 406, 2013). In Brussels, 53% of households do not have access to
a car. Two thirds of the poorer households in Berlin do not have access to a car.
Policies aimed at addressing the “affordability of car use” therefore have a very
different impact depending on whether they are addressing car use in urban or rural
areas, where car use is much more prevalent.
906. At-risk groups for transport poverty include households with low incomes, the
unemployed, ethnic minority members, or households that have children, or
members with reduced mobility (including persons with disabilities, elderly
persons). Rural and peri-urban communities are more at risk because they lack
access to alternatives to car-use.
907. Transport poverty increases social exclusion as citizens might not have the means
to get to work, services, social networks, and to reach essential facilities they are
entitled to. Lack of mobility can lead to social disadvantage and exclusion. In
general, groups more at risk of social exclusion are especially subject to transport
disadvantage.
908. According to the European Social Policy Network (ESPN) report on “Access to
essential services for people on low incomes in Europe”543
, the lack of availability
and affordability are the two main barriers that affect access of people on low
incomes to adequate public transport services in the EU. In those Member States
where targeted measures are in place for low-income people, those include reduced
tariffs, subsidies as well as social protection measures. The latter are often linked
to minimum income schemes, also for eligibility. In addition, improving the quality
of the infrastructures (e.g. improved physical accessibility) is one of the ways to
improve access to essential transport services.
909. Unless done with due consideration to the people in vulnerable situations in our
societies, including persons with disabilities and reduced mobility, internalising
external costs and more sustainable transport could, because of higher transport
costs, raise concerns over the transport affordability and risk of connectivity’s loss
in remote areas or for people on low incomes, especially where provision of public
transport is poor.
910. Price signals are important to incentivise greener options and choices. However, if
transport is to remain affordable, this cannot only be about making polluting modes
of transport more expensive by internalising external costs, but also about reducing
the costs generally on more sustainable alternatives. Specific compensation
schemes and the effective use of taxation and subsidy will be key to ensure a
socially and geographically fair transition.
911. The importance of keeping transport affordable in a context of transition towards
making it sustainable is illustrated by the respondents to the Eurobarometer on
Mobility and Transport544
who state that their switch to more environmentally
friendly modes of transport would be subject to the condition of it not being more
expensive.
543 ESPN(2020), Access to essential services for people on low incomes in Europe. An analysis of policies in 35 countries, Brussels:
European Commission. 544 Special Eurobarometer 495 https://ec.europa.eu/commfrontoffice/publicopinion/index.cfm/Survey/getSurveyDetail/instruments/SPECIAL/surveyKy/2226

208
Figure 41: Conditions to switch to more environmentally friendly modes of transport
912. Availability of transport is another key issue. The Eurobarometer on Mobility and
Transport545
shows that the less urbanised the respondent’s environment is, the
more likely they are to say there is no alternative to taking the car: 46% who live in
rural villages say this, compared to 25% living in large towns. A study focusing on
smart transport services in rural areas546
, concluded the predominant absence of
specific policies for rural transport with very few obligations to provide rural
mobility services. Organisational arrangements for rural shared mobility need to be
strengthened.
913. Public services obligations (PSOs) play an essential role in ensuring connectivity, a
high level of quality of service and in keeping transport affordable. Transport
services provided under PSOs are socially, economically and politically very
significant: most urban bus, metro and tram services; 2/3 of all passenger rail
transport services; 180 air routes connecting peripheral and development regions;
about 1% of EU GDP and of total employment. PSOs provides connectivity that is
vital for EU remote regions: a 10% increase in connectivity stimulates GDP by an
additional 0.5%547
.
914. While the principle and usefulness of PSOs as a tool to ensure affordable services
and availability is generally acknowledged by all stakeholders across transport
modes, the scope and specification of PSOs can be contentious and have a negative
impact on the functioning of the internal market.
915. The tendering process is perceived burdensome and inflexible. Besides,
stakeholders highlight a risk of non-genuine PSOs imposed by Member States.
When the scope of the PSO goes beyond a real public need and/or covers services
that can provided commercially, the compensation and/or exclusive rights granted
to a specific operator for the provision of the public service can prevent market
545 Ibid. 546 https://ruralsharedmobility.eu 547 SWD(2019) 295 final

209
entry and distort competition. This issue was highlighted in the 2019 evaluation of
Regulation n°1008/2008 on air services: unnecessary PSOs on routes that could be
commercially viable may have the effect of driving away competitors, effectively
reducing the connectivity of remote regions.
916. This is all the more problematic as a badly designed PSO may be subject to ex-post
complaints (based on the infringement of sectorial and/or State aid rules) and
possible annulments following intervention by the Commission or national courts.
Such a scenario may result in a disruption of the public transport service. It may
also have severe financial impact on the operator in charge of the public service: in
application of State aid rules, a Commission Decision concluding that the PSO
remit is incorrectly specified may result in the recovery of the entire compensation
received by the operator.
917. The discretionary power enjoyed by Member States is limited by the sectorial
rules developed at EU level as well as State aid rules applicable to services of
general economic interest (SGEIs)548
.
918. In accordance with State rules applicable to SGEIs, sectorial provisions on PSOs
and their specifications are currently laid down in Regulation (EC) n°1370/2007 on
public passenger transport services by rail and by road, Regulation (EEC)
n°3577/92 on maritime cabotage and Regulation (EC) n° 1008/2008 on air
services. Although the concept of PSOs is in essence the same for all modes, there
are some differences between these provisions, for example, Regulation (EC)
n°1370/2007 specifically authorises the grouping of cost covering and non-
covering services in the same public service contract, which is not specifically
allowed under the other regulations. This feature is basically motivated by the
network character of land transport services compared to point-to point services in
air and maritime transport. Regulation (EC) n°1008/2008 imposes more constraints
on Member States when they specify PSOs.
919. The increasing number of complaints regarding a possible manifest error in the
definition of PSOs creates a threat to the legal certainty of the award procedures of
public service contracts. This serious challenge calls for an increased effort by
most public authorities to better design their economic intervention. That being
said, this should ultimately help channel public financing to where it is more
urgently needed (social aid, financing of infrastructure, etc…)
920. As regards passenger rights, PSO could provide for a certain minimum standard
for services that do not fall under mandatory rules on passenger rights. Currently,
far more than half of the rail services are tendered under the PSOs rules, while
mandatory rules on passenger rights apply only for parts of the services concerned
(which is mostly due to exemptions applied by Member States in accordance with
Regulation (EC) No1371/2007).
921. Furthermore, even under the more specific PSO provisions of Regulation (EC)
n°1008/2008, stakeholders have identified divergences in implementation of these
provisions between Member States. They also highlight the complexity and
548
T-289/03 BUPA and others v Commission, EU:T:2008:29, para 172. Communication from the Commission on the application
of the European Union State aid rules to compensation granted for the provision of services of general economic interest, OJ C 8,
11.01.2012, p. 4, para. 46. See also Commission Decision C(2012) 2257 final of 25 April 2012 on Germany- State aid granted by
Germany to the Zweckverband and Tierkörperbeseitigung in Rhineland- Palatinate, Saarland, Rheingau-Taunus-Kreis and
Landkreis Limburg- Weilburg, (NN23/2010 and N15/2004), OJ L 236, 01.09.2012, p. 1, para 176. An appeal by that decision was
rejected by the General Court in Case T-309/12 Zweckverband and Tierkörperbeseitigung v Commission, EU:IT:T:2014:676.

210
burdensome nature of the procedure for the attribution of PSO (e.g. lack of time to
prepare tenders, the complexity of the contracts).
922. Finally, not all rules regarding PSOs refer specifically to environmental
requirements. Such references are lacking in Regulation (EC) 1008/2008 and
Regulation (EEC) 3577/92. Regulation (EC) 1370/2007 leaves competent
authorities the possibility to establish social and qualitative criteria for PSO, which
may also include criteria related to environmental protection (see 17th
recital).
923. Accessibility to transport also remains a challenge. Persons with disabilities and
reduced mobility face challenges to travel and limited access to transport. One in
six people in the EU have a disability that ranges from mild to severe. Over one
third of people aged over 75 have disabilities that restrict their ability to move.
These numbers are set to rise as the EU population grows progressively older. By
2070, 30.3% of the population is projected to be aged 65 years or older (compared
to 20.3% in 2019) and 13.2% is projected to be aged 80 years or older (compared
to 5.8% in 2019) 549
.
924. Our ageing society requires more emphasis on the provision of safe, secure,
reliable and accessible transport services featuring appropriate solutions for users
with disabilities and reduced mobility. In addition, specialised transport solutions
are also required. For instance, one can expect higher demand for door-to-door
mobility and driver assistance solutions. Public transport providers will have to
adapt to an increasing amount of passengers with disabilities and reduced mobility,
requiring investments in barrier-free infrastructure and rolling stock.
925. Digitalisation of the transport sector, while bringing many opportunities, also
comes with challenges and can limit accessibility to transport for people with few
digital skills, poor IT literacy or with limited access to internet. In 2019, the
percentage of people who have at least basic digital skills reached 58% (up from
55% in 2015). A large part of the EU population, however, still lacks basic digital
skills550
.
926. The EU passenger rights legislation (adopted mostly between 2004 and 2011)
ensures that persons with disability and reduced mobility are not discriminated
when they intend to use collective transport (air, rail, bus and coach and
waterborne transport) and if necessary they receive special assistance free of
charge to use those transport modes. Most recently, the Commission proposed to
amend the regulation on rail passenger rights in 2017 to extend the rights of
passengers with disabilities and reduced mobility to services which are not covered
under the current rules. The reform had been provisionally agreed by the Council
presidency and the European Parliament in October 2020551
. The Commission
started to evaluate the legislation related to the three other modes of transport to
assess whether amendment of those regulations are necessary. Persons with
disabilities and reduced mobility demand enjoying their rights on equal basis with
others in line with the UN Convention on the Rights of Persons with Disabilities.
927. The Commission adopted Technical Specifications for the accessibility of the
railway system for persons with reduced mobility to ensure the accessibility of rail
infrastructure and rolling stock. This Regulation was amended in 2019, to ensure
549 Report on the impact of demographic change, COM/2020/241 final, https://ec.europa.eu/info/strategy/priorities-2019-2024/new-
push-european-democracy/impact-demographic-change-europe_en. 550 Digital Economy and Society Index Report 2020 - Human Capital, https://ec.europa.eu/digital-single-market/en/human-capital. 551https://www.consilium.europa.eu/en/press/press-releases/2020/10/21/improved-rail-passenger-rights-council-approves-the-informal-deal/

211
inventories of assets, including a website providing practical information about the
accessibility of railway stations.
928. The Trans-European Transport (TEN-T) Guidelines also contain provisions on the
need to make accessible the TEN-T Network for users with disabilities and reduced
mobility. One aim of the upcoming revision of the TEN-T Guidelines is to ensure
that accessibility requirements are better reflected in the future development of the
network.
929. Persons with disabilities, especially in aviation ask for revision of safety rules to
ensure that these would not conflict their rights to travel on equal basis with others.
930. Finally, the European Accessibility Act552
contains some accessibility requirements
that can be used to render operational the general accessibility provisions,
providing presumption of compliance. Additional accessibility requirements are
needed to cover transport elements not covered by the European Accessibility Act.
4.3.4.4 Protection of European passengers and consumers
931. The EU framework for passengers’ rights provides a minimum level of protection
for people using collective transport services. They protect passengers in cases of
disruptions during all phases of the journey, promoting quality of services in all
public transport modes (air, rail, waterborne, bus and coach). The framework has
developed gradually from a mode-specific approach defining a comprehensive set
of rules into a wider concept bringing common basic rights to the passengers to
protect them against disruptions and poor transport service quality. It also
minimises travel disruptions, improves passenger information and ensures service
quality together with a level playing field for transport operators within and across
modes, creating a European standard for passenger protection. Three key principles
encompass the current rules on passenger rights: the non-discrimination of
passengers; the availability of accurate, timely and accessible information to all
passengers; and an immediate and proportionate assistance when required. Yet
there are currently no specific rules for multimodal journeys, and some existing
rules may require completion or updating.
932. Notwithstanding the substantial progress made in this area during the last fifteen
years, some challenges remain. Despite the efforts of the Commission to raise
awareness over the years in respect of passenger rights, such as through large-scale
communication campaigns, there is a need for further improvement of passengers’
awareness about their rights and how to claim them, as passengers’ knowledge
about the existence of EU passenger rights is still too low, according to a
Eurobarometer553
, as highlighted by the graphic below. Diverging views remain on
the perceived financial burden for carriers and the perceived administrative burden
for passengers claiming their rights.
933. Enforcement is left mainly to national enforcement bodies (NEBs), the
Commission facilitating the cooperation among NEBs from different countries.
Owing partly to the significant differences across Member States, both in terms of
the way NEBs are structured and organised, as well as the enforcement powers
they have, inconsistencies remain when it comes to the application of the
552 Directive (EU) 2019/882 of the European Parliament and of the Council of 17 April 2019 on the accessibility requirements for
products and services (Text with EEA relevance) PE/81/2018/REV/1 OJ L 151, 7.6.2019, p. 70–115 553 Special Eurobarometer 485 – Passenger Rights. Field work February-March 2019, publ. January 2020. See: https://ec.europa.eu/commfrontoffice/publicopinion/index.cfm/survey/getsurveydetail/instruments/special/surveyky/2200

212
legislation by operators across Member States. There is also a sustained demand
for legal clarity, as national courts keep asking the Court of Justice of the EU to
interpret certain provisions of the passenger rights regulations, particularly in air
passenger transport regarding issues related to financial compensations in the event
of long delay or flight cancellation. Under the general consumer protection
framework, joint actions can be taken under the new Consumer Protection
Cooperation (CPC) Regulation (EU) 2017/2394 as of January 2020).
Representative actions554
in the collective interest of passengers are also expected
to be possible within the next two years.
934. Persons with disabilities and reduced mobility still consider that they do not enjoy
equal access to public transport: they demand more accessibility and the
elimination of the pre-notification requirement necessary to give assistance to them
in case they cannot use independently public transport (or at least to shorten such
periods which they consider extremely long at the moment). Regarding rail, this
pre-notification will be reduced now from 48 to 24 hours.555
Figure 52: Passengers’ knowledge about the existence of EU passenger rights
935. The Commission has made proposals to consolidate air and rail passenger rights
Regulations (namely in 2013 and 2017, respectively). The Council and the European
Parliament reached a provisional agreement on the Commission’s proposal for the
recast of the rail passenger rights in October 2020. A study dated January 2020
gives a detailed view of the level of protection of air passenger rights in the EU556
.
936. Currently there is no EU legislation guaranteeing the rights of passengers
combining different modes of transport during their journey. In this context, the
Commission published an external study on passenger rights in the multi-modal
context last year557
. Evaluation studies of the waterborne, bus and coach and air
PRM regulations are carried out in 2020-2021 as well as a review of the good
practices in the field of passenger rights to get a full overview of the state of play
across modes.
554Directive (EU) 2020/1828 of the European Parliament and of the Council of 25 November 2020 on representative actions for the
protection of the collective interests of consumers and repealing Directive 2009/22/EC (Text with EEA relevance) OJ L 409, 4.12.2020, p. 1–27 555 https://www.consilium.europa.eu/en/press/press-releases/2020/10/21/improved-rail-passenger-rights-council-approves-the-
informal-deal/ 556 Study on the level of protection of air passenger rights in the EU, January 2020.
https://ec.europa.eu/transport/themes/passengers/news/2020-01-13-air-passenger-rights-study_en 557 Exploratory study on passenger rights in multimodal transport, September 2019. https://op.europa.eu/en/publication-detail/-/publication/f176da6f-d9ca-11e9-9c4e-01aa75ed71a1

213
937. The COVID-19 pandemic and the related traffic collapse have reinforced the need
for clarification of the passenger rights framework. The Commission adopted
Interpretative Guidelines on 18 March 2020558
as well as a Recommendation on
vouchers (EU) 2020/648 on 13 May 2020559
, which confirmed that EU passenger
rights continue to apply during the pandemic. In this Recommendation, which was
part of a package of guidelines and recommendations on how to safely revive
transport services and connectivity560
, the Commission reiterated that passengers
have the right to choose between reimbursements in cash or to accept a voucher
offered by the carrier in the event of travel service cancellation. It also sets out key
features to ensure that vouchers are fair for consumers if they are offered instead of
reimbursement. In particular, (i) vouchers should be valid for at least 12 months;
(ii) if the voucher is not redeemed after the period of validity, carriers should
automatically reimburse its amount within 14 days; (iii) vouchers could be used for
payments related to new bookings before the voucher’s expiry date, even where the
new service is to be performed by another carrier who forms part of the same
group of companies; and (iv) vouchers should be transferable to another person at
no additional cost. To make the vouchers more attractive to passengers, carriers
could even issue them for a higher value than the amount due to be reimbursed in
cash. Where vouchers and transport tickets could be backed by a certain guarantee
scheme (which is already a solution in a few Member States), such operation-
reassuring aspects would have positive implications on the actors in the transport
sector – in cases where extraordinary events, such as the COVID-19 pandemic,
would lead to significant travel disruptions.
938. Regarding consumer protection, whereas the EU is equipped with a strong and
protective legal framework, some loopholes have been identified in the transport
sector, including in the areas of bankruptcies, odometer or mileage fraud and
unclear pricing practices in aviation.
939. Bankruptcies of transport carriers are a source of very significant damages which
are difficult to anticipate and which can leave passengers in distress and without
any protection. In air transport, since 2011, 87 airline bankruptcies have occurred
in Europe, which has led to a consolidation of the European airline industry.
Bankruptcies of air carriers result in disruption for passengers, workers
(bankruptcies are estimated to have affected around 37,000 jobs) and competitors.
To better predict difficulties and monitor the financial health of air carriers, EU
rules require competent licensing authorities to monitor compliance of airlines,
notably with financial requirements. In case of financial difficulty and to avoid the
high levels of disruption caused by a sudden revocation of the operating licence,
airlines may be granted a temporary licence for a maximum duration of twelve
months if there are realistic prospects of financial restructuration. However,
recently temporary licences are seldom used by Member States, as generally not
recognised to be the most effective solution to rescue airlines from and insolvency.
561 In the context of the COVID-19 pandemic, Regulation 2020/696 has recognised
this issue and temporarily allowed the possibility, under certain conditions, for a
558 Commission Notice - Interpretative Guidelines on EU passenger rights regulations in the context of the developing situation with Covid-19, OJ C 89I, 18.3.2020, p. 1–8. See https://eur-lex.europa.eu/legal-content/EN/TXT/?uri=CELEX:52020XC0318(04) 559 Commission Recommendation (EU) 2020/648 of 13 May 2020 on vouchers offered to passengers and travellers as an alternative
to reimbursement for cancelled package travel and transport services in the context of the COVID-19 pandemic, OJ L 151,
14.5.2020, p. 10-16. See https://eur-lex.europa.eu/eli/reco/2020/648/oj 560https://ec.europa.eu/info/live-work-travel-eu/health/coronavirus-response/travel-and-transportation-during-coronavirus-
pandemic_en 561 Evaluation of Regulation 1008/2008, SWD(2019) 295 final.
214
Member State to maintain the operating license (as opposed to issuing a temporary
license). 562
940. There is currently no specific protection of passengers for the purchase of stand-
alone tickets in the event of insolvency / bankruptcy of the carriers under any EU
passenger rights’ regulations. By contrast, travellers buying a package travel,
combining transport and hotel for instance, are protected to a certain degree, under
the Package Travel Directive (PTD).
941. As far as stand-alone tickets are concerned (which are the major part of tickets by
far), across Europe, there only exist partial solutions for the protection of
passengers in the case of the carrier’s insolvency.
942. In 2013, the Commission adopted, together with the proposal for amending
Regulation 261/2004 on air passenger rights, a Communication on passenger
protection in the event of airline insolvency. After the recent insolvencies the
Commission services assessed the situation again: the study on air passenger rights,
published January 2020, estimated that in total, between 2011 and 2019, 5.6
million passengers were impacted by airline insolvencies in some way. During the
2011-19 period 0.04% of total EU passengers were somehow affected by airline
bankruptcies. In 2019 this percentage peaked to 0.14% due to the bankruptcies of
Thomas Cook, Germania, Aigle Azur and WOW air563
.
943. 2020, marked by the COVID-19 pandemic, is expected to be particularly difficult
on that front. Some regional and charter airlines already filed for administration or
liquidation earlier this year, especially within the regional airlines segment, while
network carriers may do better thanks to national governments’ support. The other
modes face similar challenges.
944. In 2019, the European Parliament called in a Resolution on the Commission to
carry out a stocktaking of the existing EU legislation in relation to airline
bankruptcy, consumer protection, travel packages, passenger rights in light of the
recent collapse of the Thomas Cook Group in order to evaluate the possible need
for legislative clarification and improvement and other measures required to avoid
similar situations in the future. The analysis was performed by January 2020 in air
transport and further thinking is in progress, in the context of COVID-19
pandemic. In particular, insolvencies are not covered and should be addressed from
the perspective of the passengers (reimbursement of the price of the ticket or
repatriation) for all modes of transport.
945. The Commission has been following up to its Communication on passenger
protection in the event of airline insolvency, notably by encouraging the national
authorities competent for air services and those competent for passengers rights to
coordinate their actions to ensure appropriate monitoring of the financial position
of air carriers and where necessary adopt a coordinated approach to the suspension
of their operations to minimise the impact on passengers. The Commission also
engaged with EU air transport associations to formalise the existing voluntary
agreements on the provision of rescue fares and their effective promotion.
946. In its recent Recommendation on vouchers, the Commission has proposed that
Member States find solutions for the insolvency protection of vouchers for travel
packages as well as stand-alone transport tickets. Some Member States have
562 Summary report on Regulation (EU) 2020/696 adopted by the Commission on 13/11/2020, COM(2020) 714 final. 563 Study on the level of protection of air passenger rights in the EU, January 2020. See: https://ec.europa.eu/transport/themes/passengers/news/2020-01-13-air-passenger-rights-study_en

215
decided to extend their insolvency protection schemes for travel packages also to
vouchers issued in the context of the COVID-19 pandemic.
947. Some stakeholders expressed their views regarding the insolvency protection for
transport tickets and vouchers in the context of COVID-19 pandemic. In particular,
consumer and passenger associations advocate for traveller guarantee funds or
other means to better protect passengers’ financial interests against carriers’
bankruptcies (e.g. limitation of pre-payments, “pay as you check in”). In recital 13
of the Commission Recommendation (EU) 2020/648 on vouchers, it was also
highlighted that the burden sharing between the different actors in the travel supply
chain is unfair and financially not sustainable. For example, if a traveller, who
booked a package with a flight component, cancels the package travel contract in
accordance with the Package Travel Directive, the organiser has to refund the
traveller the full price, irrespective of whether or not he still holds the money or
will be able to recover it from the airline, if the flight was operated.
948. Mileage or odometer fraud is also a problem that affects consumers who buy
second-hand vehicles. The distance that a vehicle has travelled is one of the major
factors that influence the value and the price of a vehicle. Odometer fraud involves
selling a vehicle for a higher price than its real value after winding back the
odometer. Beside the financial harm caused directly, odometer fraud also may also
entail a road safety aspect. A vehicle with less mileage may be perceived to be in a
better condition than it actually is, so the owner might take the vehicle for a check
later or important maintenance may be delayed, leading to higher risk in road
safety. According to a European Parliament study, the malpractice is particularly
relevant in cross-border trade of used vehicles. Cars with rolled-back odometers
were estimated to account for between 30% and 50% of the total number of
vehicles traded across borders. The resulting financial losses are estimated to be
very high564
.
949. The EU-wide rules on roadworthiness that came into force in 2018 support the
fight against odometer fraud. During roadworthiness tests, authorities have to
check the odometer reading, register the data and make it available for the
inspector at the next test. This facilitates the detection of fraud.
950. Data exchange reduces the opportunity for odometer fraud in cross-border, second-
hand car sales. There could indeed be significant benefits in mandating the cross-
border exchange of odometer data between national authorities at EU level. As a
first step, a pilot programme and exchanges of test data have started in 2019 with a
number of volunteering Member States that are keen to progress in this field. The
pilot will run until the end of 2020. The technical specifications are ready and
Member States were invited to start their development to connect.
951. Poor quality of services also affects attractiveness of certain transport modes for
users. Although improvement in the quality of the infrastructure networks in the
last decades is not disputable, the management of disruptions overall looks sub-
optimal. There remains a growing concern with the predictability of transport
services: e.g. lack of accurate information, traffic jams, delays and waiting times,
last minute cancellation of transport service, lack of definition of minimum service
level.
564 European Parliamentary Research Service (2018): Odometer manipulation in motor vehicles in the EU (study), European Added
Value Assessment accompanying the EP’s legislative initiative report https://www.europarl.europa.eu/RegData/etudes/STUD/2018/615637/EPRS_STU(2018)615637_EN.pdf
216
952. While there have been some EU initiatives, including legal rules, to enable real-
time travel and traffic information services, there is scope for improvement as
regards the amount, access and accuracy of information across the whole EU
transport network. Enabling tools and technologies (intelligent transport systems,
artificial intelligence, sensors, high power computing, etc.) are needed to
improving the quality of information services.
953. Discontinuity in service may notably result from weather or major public-health
related issues or from human-made disruptions. Disruptions to transport services
may also be a result of industrial actions. Workers and employers, or their
respective organisations, have, in accordance with Union law and national laws
and practices, the right to negotiate and conclude collective agreements at the
appropriate levels and, in cases of conflicts of interest, to take collective action to
defend their interests, including strike action. According to Eurofound565
, the
transport sector is one of the sectors most affected by disputes of national
significance, in particular the railway and air transport sectors.
954. Whereas the right to strike is a fundamental right of workers and must be
protected, industrial actions may have a significant impact of the provision of
transport services. For example, in 2014, strikes in aviation contributed to 13.4% of
total en-route delays that year. In addition, the additional distance flown in the
European airspace to circumvent the areas affected by strikes in the period 2014-
2015 amounted to 2.2 million kilometres, contributing to degraded environmental
performance, and raising the costs of airlines with increased fuel consumption.
Industrial actions also result in flight cancellations for passengers, which in turn
decreases the revenue of airlines. Although the occurrence of strikes has
significantly decreased in the past 5 years, it is still necessary to mitigate their
detrimental impact on passengers and the economy.
955. In 2016, the Commission issued a study566
to identify options for improving Air
Traffic Management service continuity in the event of strikes. Building on the
results, the Commission published a Staff Working Document567
with a set of
recommended mitigation measures. These reflect best practices used in some
Member States. The Commission has also mandated the Network Manager to
mitigate the impact of strikes on flight delays network wide. The Network
Manager fulfils this mission by maintaining a register of best practices collected
from the air navigation service providers, and with a reinforced coordination of
network operations during the strikes.
4.3.5 Safety and security
956. Safety and security are at the heart of the transport system and are the pre-
condition to any sustainable transport system. Fatalities as well as life-changing
injuries, whether due to safety or security reasons cause grief and suffering. They
are burdensome for the society and affect the public’s trust in transport. They may
also have significant environmental impacts. Further increasing the level of safety
with a holistic “Safe System” approach568
and strengthening the resilience of
565 Eurofound (2019), Annual review of working life 2018, Publications Office of the European Union, Luxembourg. 566https://ec.europa.eu/transport/sites/transport/files/2017-03-06-study-on-options-to-improve-atm-service-continuity-in-the-event-
of-strikes.pdf 567https://ec.europa.eu/transport/sites/transport/files/swd20170207-practices-favouring-air-traffic-management-service-
continuity.pdf 568 The “Safe System” approach to road safety, derived from European best practices and recommended globally by the World Health Organisation, accepts that collisions will continue to occur to some extent, but aims for a more forgiving system that protects

217
transport in Europe must therefore remain the first priority both for regulators and
for the industry569
.
957. European mobility enjoys today an unprecedented high level of safety and security.
Yet, it must further improve to secure the confidence of passengers in all modes of
transport and to successfully address increasingly complex challenges.
958. Roads in Europe are the safest in the world. The EU in 2019 had about 51 deaths
annually per million inhabitants, against 182 deaths per million globally, 110
deaths per million in the USA and 93 deaths per million in geographical Europe.
But every fatality is one too many on the way to “Vision Zero”, the EU’s goal to
eliminate all fatalities and serious injuries from road transport by 2050.
959. EU-wide progress over the past two decades has been remarkable: the number of
people killed in road crashes fell by 43% between 2000 and 2010 and by another
23% between 2010 and 2019. This shows that progress has been made and can still
be made. Yet, even with this progress, in 2019, an estimated 22,700 road traffic
fatalities were recorded in the 27 EU Member States and about five times as many
serious injuries, which often have life-changing consequences. And while the
underlying trend remains downward, progress has slowed sharply in most countries
since 2013, some countries are seeing fatalities even increasing again, and the EU
target of halving the number of road deaths by 2020 (relative to the 2010 baseline)
will not be met570
.
Figure 42: Road fatalities in the EU and current target
all users from death and serious injury. Better vehicle construction, improved infrastructure, lower speeds etc. should work together
to reduce the impact of crashes and form layers of protection ensuring that, if one element fails, another will compensate. 569 The need to prioritise safety is notably highlighted by aviation professionals and workers’ associations in the context of their post COVID-19 statement
https://www.eurocockpit.be/news/covid-19-aviation-time-rethink, https://www.etf-europe.org/wp-content/uploads/2020/09/COVID-
19-statement-ETF-230920.pdf 570 Press release: “Road safety: Europe’s roads are getting safer but progress remains too slow” (11/06/2020)
https://ec.europa.eu/transport/media/news/2020-06-11-road-safety-statistics-2019_en. 2020 still may prove to be an outlier with
early indications that the number of road fatalities is likely to drop significantly in view of the measures taken to tackle coronavirus, but not by enough to meet the target.

218
960. The EU average of 51 road deaths per million inhabitants also masks significant
differences between Member States. While the performance gap between the
Member States has narrowed significantly since the year 2000, there are still
proportionally four times more road deaths in the worst performing country than in
the best one.
Figure 43: Trend in road deaths per million inhabitants 2010-2019
More than half (53%) of all road fatalities in the EU occur on rural roads and 8%
on motorways. However, 38% of the fatalities occur in urban areas where
vulnerable road users’ account for 70% of road deaths, with pedestrians being the
most affected group. While road deaths fell by more than 20% between 2010 and
2018571
, the number of cyclists killed actually increased by 6% in urban areas.
Figure 55: Percentage of road fatalities in the EU by transport mode, 2018
571 While the total number of road fatalities is available for 2019, disaggregated data by type of road and transport mode are currently available up to 2018 only.

219
Source: CARE database
961. Compared to road, rail is a very safe mode of transport, although there are still too
many fatalities involving railways. Altogether 1 721 significant accidents, 885
fatalities and 760 serious injuries were recorded in the EU-28 countries in 2018. A
steady decrease in significant accidents and resulting casualties has been recorded
in the period 2010-2018, for which harmonised data are available across the Union.
Figure 56: Number of significant accidents, fatalities, and serious injuries in rail572
962. Regarding aviation, which is the safest mode of transport, whereas 2018 (14 fatal
accidents with 534 fatalities worldwide) was globally worse than 2017 (9 fatal
accidents with 67 fatalities worldwide), 2019 showed 268 fatalities in 13 fatal
accidents573
. No fatal accidents involving EU Member States airlines occurred
since 2016574
.
572 Source: ERA, 2020, Report on Railway Safety and Interoperability in the EU 2020
https://www.era.europa.eu/sites/default/files/library/docs/safety_interoperability_progress_reports/report_on_railway_safety_and_in
teroperability_in_the_eu_2020_en.pdf 573 Global figures are for fatalities involving large aeroplane passenger and cargo operations worldwide.
Source: EASA https://www.easa.europa.eu/sites/default/files/dfu/easa_asr_2020.pdf 574Accidents involving commercial air transport airline and air-taxi aeroplanes. Source: EASA https://www.easa.europa.eu/sites/default/files/dfu/easa_asr_2020.pdf

220
Figure 56: Fatal accidents involving large aeroplane passenger and cargo operations
Source: EASA Annual Safety Review 2020
963. In maritime transport, during the 2011-2018 period, a total of 696 lives were lost.
The decrease observed since 2015 was reversed in 2018. Crew have been the most
impacted category of victims over this period with 566 fatalities. The number of
fatalities recorded in 2018 is 53. As to occurrences, 3,174 were reported in 2018,
and the average per year over the past five years is of 3,239 marine casualties or
incidents.575
4.3.5.1 Ever evolving challenges
964. Few could have predicted the enormous health safety challenge that the
coronavirus pandemic has posed to the transport sector. New health protocols and
guidelines on the operation of transport services576
had to be issued, operations and
equipment had to be drastically changed and revamped. Yet, most collective modes
still struggle to regain the trust of passengers, be that in public transport, high-
speed rail, coaches or flying.
965. Unfortunately this latest development is just one of the constantly evolving
challenges that the transport sector has to face, and demonstrates the need for a
flexible and varied framework that can be easily adapted and offers a diverse range
of solutions so as to cope with the different kinds of challenges that may arise. For
example, the transport sector remains an attractive target for terrorists and
criminals. The main challenge is to reconcile the security of persons and goods
with the openness and efficiency of the transport system. Security needs to be
taken into account at the design stage of the process for vehicles and
infrastructures, in order to make them resilient to ever evolving threats. However,
in many cases, transport is lacking rapid and efficient certification processes.
575 Source: EMSA, http://www.emsa.europa.eu/accident-investigation-publications/annual-overview.html 576C/2020/3139, Communication from the Commission Guidelines on the progressive restoration of transport services and
connectivity – COVID-19 2020/C 169/02, OJ C 169, 15.5.2020, p. 17–29. Additional guidelines:
EASA
https://www.easa.europa.eu/sites/default/files/dfu/EASA-ECDC_COVID-
19_Operational%20guidelines%20for%20management%20of%20passengers_v2.pdf
ERA https://www.era.europa.eu/sites/default/files/events-news/docs/covid-19_rail_protocol_en.pdf EMSA https://emsa.europa.eu/emsa-documents/latest/download/6376/3978/23.html

221
966. The introduction of new technologies (e.g. drones, e-scooters, Hyperloop) can also
affect the safety and security of transport and its users. These include new
technologies that are key to enable a more sustainable transport system (e.g.
alternative fuels, electric vehicles) and that may involve increased risk for safety
and for security. These should be addressed in order to make the twin transition
towards sustainability and digitalisation successful.
967. Drones create new services, can contribute to decarbonisation and bring value to
many businesses, including airports operations, but put in the wrong hands, they
can pose serious safety and security concerns – as recent high profile incidents
demonstrated. In 2018, more than 10 million mass market drones and 1.3 million
specialised drones were sold globally. In 2022 these figures are expected to be
respectively be 35 million and 9.2 million. Since September 2018, the EU has the
responsibility for ensuring that these drones operations are safe, secure, green and
respectful of people privacy. EU-wide rules adopted in 2019 will make it easier for
local authorities to restrict operations in sensitive areas, next to airports or prisons
for instance. They will also greatly facilitate the identification and localisation of a
drone and its pilot, with important provisions such as mandatory registration,
marking and remote identification. And they will ensure that drones operations are
as safe as those in manned aviation.
968. More legislative work is required as certification requirements for the drone, the
operator and the remote pilot need to be defined. There is also a need to ensure that
large scale drone operations in the very low level airspace remain safe and secure.
Further initiatives in the field of Drone Traffic Management, the so-called ‘U-
space’ should enable drones to be adequately separated from each other and protect
all other airspace users, as well as people, animals and buildings on the ground
from hazardous proximity. Further work is also needed to ensure that European
airports are well prepared to deal with unauthorised drones’ incursions, so that
closure and diversions remain a last-resort measure only. This also raises the issue
of counter-drones technologies, i.e. how to “take-down” a hostile drone. But it is
imperative that these technologies do not threaten other legitimate airspace users,
such as airliners.
969. On urban roads, sharing schemes of bicycles and especially of e-scooters, have
mushroomed rapidly. In some cities, up to 8 different operators have deployed e-
scooters. Although the sector was severely hit by the COVID-19 pandemic, e-
scooters remain easily accessible and popular and have the potential to reduce car
trips, and thereby congestion and emissions. They might usefully complement
public transport, potentially resulting in wider use and acceptance of the latter. At
this point, however, reliable and comparable statistics are missing.
970. At the same time, new personal mobility devices also raise a number of serious
concerns – some related to the safety of the devices themselves, some to their safe
use in traffic, some to the operation of the sharing schemes (use of public space
and sustainability). Comparable data across Member States is still missing, but first
data released by some Member States577
and anecdotal evidence from medical
sources points to a lot of injuries, including fatal ones.
577 Germany reported statistics for the first time covering the first quarter of 2020, during which 251 e-scooter users were injured
and one died (https://www.destatis.de/EN/Press/2020/07/PE20_N035_46241.html). France also reported statistics for the first time
in 2020, indicating that 10 people were killed in 2019 using “Engins de Déplacement Personnel (EDP) motorisés”
(https://www.onisr.securite-routiere.gouv.fr/sites/default/files/2020-05/2020%2005%2030%20Présentation%20Bilan%20Définitif%20ONISR%202019%20vMS.pdf).

222
971. Currently, only few Member States have regulations in place. Regulatory
divergence makes it difficult for visitors to follow local rules correctly (e-scooters
in particular are popular with tourists), and negatively affects sharing scheme
operators that wish to operate in more than one country.
972. A solid statistical basis – for both safety/crash data and mobility patterns (modal
share, substitution of rides previously made on other modes, etc.) – is needed.
Crash injury data would mostly be needed from hospitals. In many countries,
cooperation between the police and the medical sector on data gathering is not yet
working very well. Mobility pattern data needs to be gathered more systematically
from operators of sharing schemes and verified as far as possible.
973. For the devices themselves, there are a number of EU tools to influence safety. An
EU framework for certification and market surveillance could be considered, be it
in the framework of type approval, the machinery directive or a standard in order
to ensure that the devices themselves fulfil certain safety requirements. A study
into these issues is ongoing, with results expected in early 2021.
974. Regarding their use, the EU has no competence to set traffic rules. However, the
Commission could issue guidance to Member States (on vehicle classification,
which infrastructure they are entitled to use (i.e. sharing walking/cycling
infrastructure), minimum age, helmet, insurance) and urge Member States to
coordinate their policies.
975. Finally, shared new mobility services in general should in any case be part of a
local transport plan. Since 2013, the Commission provides a concept on
Sustainable Urban Mobility Planning (SUMP), with related European guidelines.
These guidelines, intended for local authorities, have recently been revised and
include, among others, a dedicated guide on Integration of Shared Mobility
Approaches in Sustainable Urban Mobility Planning578
. Exchange of experience
and good practices between cities could be fostered, involving relevant city
networks. These and related safety and sustainability issues are also being
considered in the context of the revision of the Urban Mobility Package.
976. Third area of evolving challenges is exponential growth of traffic and congestion
as it becomes increasingly complex in certain modes of transport to maintain high
levels of safety and security in a context of congested and gridlocked traffic. In
addition, rapid growth brings risk of cutting corners on security/safety.
977. With traffic growth, the challenge is to always enhance the level of safety in order
to sustain the growth with no additional incident or accident. The safety factor is
then key for infrastructure development and planning for the future.
978. In terms of air navigation, a system to enable the de-confliction of trajectories is a
vital tool to mitigate the risk of a collision between aircraft, notably in situations of
high air traffic controllers’ workload. When fed by numerous data exchange
between the aircraft and ATM, technology is essential to assist the human in its
tasks, in providing options and contingency plan to avoid mid-air collision.
979. In airports, where a lot of movements from different vehicles occurs, the biggest
safety threat is the runway incursion during a landing or take-off phase. Also on
the apron, contact between vehicles and aircraft can cause hidden damages on an
aircraft fuselage, putting at risk the flight when the cabin will be pressurised. With
578 https://www.eltis.org/sites/default/files/integration_of_shared_mobility_approaches_in_sumps.pdf

223
dozens of movement per hours on a runway, every vehicle must be adequately
controlled and followed to avoid collision on the ground.
980. Regular maintenance and management of air navigation aids is a major challenge
as it is the guarantee for precise guidance of aircraft. Both for en-route and
approach phases, ground or satellite based guidance stations need to be carefully
maintained to provide a high level of reliance.
981. In addition, as all transport modes become increasingly technology-dependent,
resilience against cyber-attacks is essential. From a legislative point of view,
cybersecurity is primarily addressed at EU level by a horizontal framework
composed of the Directive on security of network and information systems (NIS
Directive) and the Cybersecurity Act. The latter will create the first-EU wide
certification framework for ICT products, processes and services, which could
have significance for transport (for instance by addressing 5G security). As for the
NIS Directive, it required Member States to designate “Operators of Essential
Services” (OES) across all economic sectors. These OES are required to take some
cybersecurity measures (both technical and organisational) and to notify serious
incidents to the national authority. This approach however has led to some
inconsistencies among Member States. This was documented in a report published
by the Commission on 28 October 2019. To close those gaps, the Commission has
announced its intention to review the NIS Directive in Q4 2020. An impact
assessment will investigate various policy options, including possible regulatory
interventions (e.g. amending the existing Directive or proposing a new legislative
act by repealing the current one), soft law measures (e.g. guidelines on the
identification of OES) as well as a combination of the two.
982. For the transport sector, the NIS Directive is an important baseline and step
forward in cybersecurity. At the same time, it can be less adapted to a sector like
transport, which is a “system of systems” and prone to loopholes stemming from
divergent Member State implementation. In aviation, for example, the evolution of
the international framework (ICAO Annex 17 on Security) has already required the
adoption of secondary legislation on cybersecurity in aviation security
(Implementing Regulation 2019/1583). EASA has also launched two rule-making
tasks to address cybersecurity from a safety angle. In maritime, there have been
some advances at the level of the IMO, and some mandatory rules touching on
cybersecurity are set in EU maritime security legislation.
983. The specificities of the sector therefore need to be addressed in consultation with
transport stakeholders, taking into account existing obligations, as well as avoiding
duplication and excessive burden on Member States. We should also ensure that
critical transport infrastructure is cyber secure by design, and continue to improve
digital skills and cyber-awareness among the labour force, so that all employees
can really be the first line of defence against cyber-attacks.
984. Civil aviation remains an attractive target for terrorist activity in today's
geopolitical situation. The speed at which the EU is able to adapt aviation security
rules to evolving threats to civil aviation is a critical element in tackling this risk.
985. The purpose is to investigate existing mechanisms and explore future options for
the adaptability of aviation security in response to an act or an anticipated
imminent act of unlawful interference against civil aviation in order to protect air
passengers travelling outbound from EU airports and to protect air passengers
travelling inbound to the EU from third countries. This should also cover cases
such as the overflight of conflict zones and cybersecurity.

224
986. The objective is to assess how EU Member States and air transport operators are
today placed to act upon time-critical threat information that requires adapting
aviation security measures to ensure an adequate level of protection for air
passengers.
987. As such, options should be identified for the design and administration of
mechanisms that can adapt to protect air passengers travelling outbound from EU
airports and air passengers travelling inbound to the EU from third countries
(including the overflight of their territories) from imminent acts of unlawful
interference against civil aviation.
988. Furthermore, with climate change, the extreme climate events will multiply. Lack
of resilience/robustness/contingency measures to resist severe weather events or
traffic disruptions affect safety and resilience of the transport system.
4.3.5.2 Safe and secure infrastructure
989. Ensuring safe and secure infrastructure is also a challenge and a pre-requisite for
sustainable mobility, notably where a specific infrastructure is needed to enable
traffic of low emissions vehicles. Many pieces of transport infrastructure are
ageing or lacking maintenance, which is a major safety concern.
990. Lack of information on the state of maintenance and repair of the EU’s transport
infrastructure does not permit necessary preventive actions to be taken which could
avoid disasters from occurring. In addition, there are no EU-wide applicable
standards for construction of certain transport infrastructure, in particular roads and
bridges (each country sets its own standards). When building or upgrading
infrastructure, future maintenance should be taken into account, in line with the
lifecycle approach; sensors installed in the infrastructure could for instance
facilitate the assessment of maintenance needs.
991. The collapse of Genoa’s Morandi bridge highlighted the lack of reliable
information on the state of maintenance or repair of much of the EU’s transport
infrastructure. The EU has a significant proportion of ageing structures as part of
its transport network but no common approach on ensuring that the appropriate
levels of maintenance are being undertaken.
992. The EU Tunnel Safety Directive579
sets EU-wide minimum safety requirements for
long road tunnels on the TEN-T network to ensure that they are adequate for the
volume of traffic and have emergency exits to prevent them from becoming death
traps in an accident. These rules, in force since 2004, have been found to still be fit
for purpose, in spite of some implementation difficulties in a few countries.
However, no comparable rules for auditing, inspecting and reporting on
infrastructure quality (e.g. structural quality or quality over lifetime) exist for
bridges or other sensitive infrastructure.
993. The revised Road Infrastructure Safety Management Directive580
obliges Member
States to systematically assess the safety risks for using TEN-T roads, motorways
and primary roads as well as all EU-funded roads and, on that basis, to establish a
risk-based prioritised action plan. EU funding support needs to be well aligned
with the outcomes of this process. Funding should also be foreseen for tunnel
579 Directive 2004/54/EC of the European Parliament and of the Council of 29 April 2004 on minimum safety requirements for
tunnels in the Trans-European Road Network, OJ L 167, 30.4.2004, p. 39. 580 Directive (EU) 2019/1936 of 23 October 2019 amending Directive 2008/96/EC on road infrastructure safety management, OJ L 305, 26.11.2019, p. 1.

225
upgrades. The revision of the TEN-T guidelines offers the opportunity to consider
infrastructure quality and EU-wide safety standards as well as the resilience of
infrastructure.
994. In an era of increasing automation, safe interaction between the vehicle and the
physical and digital infrastructure is required. For road traffic, reliable physical
infrastructure including clear road signs and markings will remain indispensable.
In order to enable in vehicle driver assistance systems like Intelligent Speed
Assistance and Lane Keeping Assistance (see below) to function properly across
Europe and to prepare a safe roll-out of more highly automated vehicles, EU-wide
minimum specifications for properly reading and detecting road signs and
markings are necessary. Moreover, discrepancies between physical and digital
infrastructure (e.g. physical road signs indicating different speed limits from
information available digitally for example in navigators) need to be prevented.
995. Crashes at rail-road level crossings account for a small proportion of road crashes
(up to 2% of road fatalities), but for some 30% of fatalities from the railways
perspective. Frequent causes of crashes include bad evaluation of risk, lack of
attention, and misunderstanding of road signs. Increasing the safety of level
crossings (where they cannot be removed) is a shared responsibility for both road
and rail operators. At EU level, the Commission is working on closer cooperation
between Member States and between the road and rail sector in the collection and
analysis of crash data as well as in elaborating safety criteria for investment. In
addition, exchanges of good practice are helpful for example as regards preventive
design, new technologies (in particular C-ITS services) and collaboration in
enforcement.
996. Ensuring security of transport infrastructure is also essential, notably to ensure
passengers’ confidence and it has strong financial and logistical for the sector. In
aviation, rules on security have improved the consistency of security standards
implemented across Europe and helped in levelling the playing field for the benefit
of better traveling experience and security. However, according to Airports
Council International (ACI - Europe) the aviation security system has also become
over the years “a layer cake” of security measures, the overall complexity of which
might create imbalances in the security system. To their views it is questionable
whether the EU and Member States can continue to rely on the continued
accumulation of security measures to mitigate the threat effectively. They call for a
need for a more systematic cost-benefit approach with impact assessment
conducted on each new piece of legislation adopted in the field of security in order
to ensure it is sustainable and efficient.
4.3.5.3 Vehicle safety
997. Innovations in road vehicle technology can help both mitigate the severity of
crashes and reduce the likelihood of crashes. Thanks to successive iterations of the
Vehicle General Safety Regulation and the Pedestrian Safety Regulation, the EU
has had a big impact in improving the safety of road vehicles.
998. The revision of the Vehicle General Safety Regulation, adopted in early 2019581
,
which mandates a range of new advanced safety features (including Intelligent
581 Regulation (EU) 2019/2144 of the European Parliament and of the Council of 27 November 2019 on type-approval requirements
for motor vehicles and their trailers, and systems, components and separate technical units intended for such vehicles, as regards their general safety and the protection of vehicle occupants and vulnerable road users, OJ L 325, 16.12.2019, p. 1.

226
Speed Assistance, Emergency Lane Keeping System, Direct Vision requirements
for buses and lorries as well as new requirements for tyres, is conservatively
estimated to save at least 7,300 lives and avoid 38,900 serious injuries by 2030. It
is crucial to maintain the high level of ambition of the regulation in all
implementing legislation, which is in the process of being developed. The
possibilities of retrofitting of existing fleets with certain safety features, for
example pedestrian and cyclist detection for lorries and buses, should be further
explored.
999. The General Safety Regulation will also help for crash investigation, as all new
vehicles will be required to be fitted with event data recorders. Possibilities to
compile this data, access rights and usage modalities need to be explored.
Moreover, it needs to be considered if and how the collection of anonymised data
on the safety performance of automation technologies should be regulated in order
to allow for road safety research and development. This involves important data
access and protection issues.
1000. Vehicle procurement also presents an interesting opportunity to positively
influence road safety and fast-track the introduction of new safety technology. This
holds for private owners of large vehicle fleets and companies requiring logistics
services, but also for public procurement. The EU is exploring how it can
financially assist initiatives for fleet safety upgrades in the context of the “Safer
Transport Platform” (see above).
1001. The EU-wide eCall, a system that automatically dials Europe's single emergency
number 112 in the event of a serious road crash and communicates the vehicle's
location to the emergency services, has been mandatory for all new car models
since 2018. It can speed up emergency response times by 40% in urban areas and
50% in the countryside. According to the applicable type approval legislation
(Article 12 of Regulation (EU) 2015/758), the Commission is to investigate the
need to equip other categories of vehicles with eCall, such as heavy goods
vehicles, buses and coaches, powered two-wheelers, and agricultural tractors, and
present if appropriate a legislative proposal to that effect. Preparatory actions have
already been launched and are well advanced or completed, such as support to
European standardisation organisations to define the necessary technical
specifications for these categories of vehicles, and support to testing for this
extension and for aftermarket through CEF-funded projects such as i_HeERO582
and sAFE583
. The extension of eCall is expected to bring about considerable
benefits, e.g. for Powered Two-Wheelers a 3 to 8% reduction in fatalities and a
reduction of up to 10% in serious injuries584
. The eCall legal framework needs also
to evolve to adapt to new telecommunication technologies (packet-switched
networks).
4.3.5.4 The human factor
1002. Addressing the human factor is also essential to ensure safe and secure transport.
Indeed, human behaviour affects transport safety, be it the consumption of drugs or
alcohol, distraction when driving or speed. Traffic crashes related to alcohol
consumption are a major cause for concern. Dangerous distractions caused by the
use of mobile phones and other devices have strongly increased.
582 https://iheero.eu/ 583 https://safe112.eu/ 584 Source: i_HeERO

227
1003. About one third of fatal road crashes are (partly) caused by excessive or
inappropriate speed. And higher speed crashes lead to far more damage than
lower speed ones. Based on research results,585
the European Transport Safety
Council (ETSC) has calculated that if mean speeds were to drop by only 1 km/h on
all roads across the EU, more than 2,200 road deaths could be prevented every
year. The problem of drink-driving is difficult to quantify (data collection
methods vary widely), but it is realistic to estimate that alcohol is involved in
around 25% of all road deaths586
. According to the EU strategy supporting Member
States in reducing alcohol related harm587
, about one crash in four can be linked to
alcohol consumption. The magnitude of the influence of drugs is even more
difficult to ascertain, as no harmonised test methods exist and data is not yet
collected systematically. However, it has been shown that driving under the
influence of some prescription drugs and illegal drugs can multiply the risk of a
crash by a factor of 2 to 7588
. In addition, a growing amount of evidence suggests
that distraction whilst driving, in particular by mobile devices like smartphones,
but also by electronic systems integrated in vehicles, is a major factor in causing
crashes. Research found that the risk of being involved in a crash is increased by
12.2 times when dialling and 6.1 times when texting589
. In epidemiological
research, about 5 to 25% of car crashes have been attributed to driver distraction.590
On the technical level, the revised Vehicle General Safety Regulation will
introduce driver drowsiness and distraction warning technology, assessing the
driver's alertness and warning the driver if needed, to be installed in vehicles on a
mandatory basis.
1004. On all of the above, the Commission works closely with Member States as these
matters have traditionally been dealt with at national or even sub-national level.
Focusing on general education and awareness has been shown to have limited
effect, but driver licensing, targeted education and awareness raising, supported by
strong and sustained compliance and enforcement regimes, all have an important
role to play. The EU Driving Licence Directive591
, which established a harmonised
EU licence model and introduced minimum requirements for obtaining licences,
will have to be kept up to date with developments in vehicle and infrastructure
technology. Current cross-border enforcement legislation592
, which tackles the
biggest offences including speeding, running red lights, failure to use safety belts
and drink driving, is limited to the exchange of information between authorities on
traffic offences committed abroad. The Commission services are currently
assessing how it could be made more effective. Another question to examine is
whether the mutual recognition of driving disqualifications and of penalty points
between countries (where a penalty point system exists) could also be feasible and
add value.
585 Elvik et al. (2019): Elvik R, Vadeby A, Hels T and van Schagen I (2019) Updated estimates of the relationship between speed
and road safety at the aggregate and individual levels. 586 European Commission (2014), Study on the prevention of drink-driving by the use of alcohol interlock devices, Final Report. 587 https://ec.europa.eu/health/ph_determinants/life_style/alcohol/documents/alcohol_com_625_en.pdf 588 Final report of DRUID project (2012) (http://www.emcdda.europa.eu/publications/thematic-papers/druid_en) 589 Dingus et al (2016): Driver crash risk factors and prevalence evaluation using naturalistic driving data. 590Report on Driver Distraction 2018, European Road Safety Observatory
https://ec.europa.eu/transport/road_safety/sites/roadsafety/files/pdf/ersosynthesis2018-driverdistraction.pdf 591 Directive 2006/126/EC of the European Parliament and of the Council of 20 December 2006 on driving licences (Recast), OJ L
403, 30.12.2006, p. 18. 592 Directive (EU) 2015/413 of the European Parliament and of the Council of 11 March 2015 facilitating cross-border exchange of information on road-safety-related traffic offences, OJ L 68, 13.3.2015, p. 9.

228
1005. In addition, EU level recommendations such as the Recommendation on the
maximum permitted blood alcohol content for drivers593
from 2001 have had clear
positive impact. A possible update of this Recommendation would benefit from the
addition of guidance on the fitting of alcohol interlock devices (linking in with the
General Safety Regulation, which facilitates the installation of these devices).
Similar recommendations or guidance in other areas concerning road user safety
such as speed are under active consideration.
1006. While bringing many opportunities for safety improvements, automation also
carries new challenges for safety and security. It notably requires adapted training.
The phase in which drivers are expected to be ready to take back control suddenly
is extremely problematic.
1007. Increasing levels of automation in transport carry the promise of diminishing the
potential harm of mistakes and deliberate misbehaviour of human drivers.
However, unless entire transport systems are fully automated (and humans banned
from driving), there will always be a human factor to take into account, which will
become particularly acute in mixed traffic between highly automated vehicles and
“traditional” vehicles. Even in fully automated systems, non-motorised transport
users like pedestrians and cyclists will need to be protected.
1008. Risks may also arise from employees whose role provides them with privileged
access to secured locations, secured items or security sensitive information, thus
giving them a potential tactical advantage in perpetrating or facilitating an act of
unlawful interference (insider threat). Efficient and effective rules on whistle-
blowing are here an important aspect.
4.3.5.5 Ensuring a high and equal level of safety and security across modes
1009. There is an uneven level of safety across modes: it is much more mature in
some modes than in others. When considering the existence of safety culture in the
various transport modes, it is fair to say that it has reached a level of mature
development in air transport; has progressed, in comparison to the past, in the
maritime sector; is still at an early stage in the rail; and with a lot of development
ahead for the road transport sector, although we are now committed to delivering
the Safe System (also known as Vision Zero) approach (which borrows particularly
from aviation) in road safety, in line with international best practices. This is
compounded by an equally uneven level of security risk assessment across modes.
1010. Half of all goods moved inside the EU and more of 80% of passengers are
transported by road. Whereas the relative crash risk in the different transport
modes tends to be skewed in public perception, road fatalities constitute 97% of all
transport deaths in the EU (around 23,000 a year) and generate a yearly cost of
EUR 282 billion, or 2% of GDP. In addition, road safety levels vary widely across
the EU. The worst performing countries record nearly four times as many fatalities
per million inhabitants as the best performing countries. EU legislation and best
practices exchange have already helped facilitate convergence, but more efforts are
needed.
1011. Improved data collection and analysis of accidents and incidents in all modes as
well as closer cooperation across modes can help to better understand the causes of
593 Commission recommendation of 17 January 2001 on the maximum permitted blood alcohol content (BAC) for drivers of
motorised vehicles.

229
crashes and to identify the best remedies. Issues in relation to human-machine
interface also present similarities across modes.
1012. In aviation, EU rules impose on Member States to conduct investigation in cases
of accidents or serious incidents. In addition, occurrences are required to be
reported, analysed and followed up with adequate safety actions.
1013. As regards road safety, harmonised reporting of fatalities and serious injuries in
the CARE group is an example of excellent cooperation between Member States,
going beyond what is legally required. However, there are still difficulties with the
reporting of serious injuries according to the agreed common definition, and only
very few Member States carry out systematic in-depth investigation of road
crashes. An in-depth investigation system at EU level, gathering data on road and
rail crashes, especially one focused on unpacking the causal factors of deaths and
fatal injuries in a particular crash would greatly assist safety authorities in
developing further safety policies and, in the long run, an occurrence reporting and
investigation approach similar to the one established in aviation. This would
require clear rules on the access and use of data generated by vehicles and
connected infrastructure, as well as additional capacity at EU level.
1014. The main share of cargo crime in road transport (around 70%) occurs when
lorries are parked at non-secured parking areas. Such crimes are affecting the
overall supply chain and it impacts drivers, who reportedly – at a rate of 25% -
have been exposed to attacks or violence when resting in their cabins. Regrettably,
it has been estimated that there is a serious lack of safe and secure parking areas of
around 100,000 spaces in the EU. Such safe and secure parking areas could
considerably reduce cargo crime and they could at the same time provide drivers
with better and safer resting conditions, which are crucial for road safety and more
generally for the social well-being of drivers594
.
1015. In maritime, third country flagged vessels can call into any EU port. It is
therefore essential to have a robust and harmonised system of vessel inspections
independent of their flag to verify the competency of the officers and crew on
board, the condition of the ship and its equipment, its compliance with the
requirements of the international conventions on safety and environmental
protection and that the vessel is manned and operated in compliance with
applicable international law. This is currently achieved through Port State
control595
(PSC) but it has been observed that over the last ten years more
environmental checks (related to sulphur596
, GHG emissions, ship-recycling) are
being added to the inspection requirements (either at the international or EU level)
and it is expected that this will further increase in the medium term. It will
therefore be necessary to try to support the inspection effort of the competent
authorities in the Member States.
1016. To improve the inspection process more use should be made of existing and
future capabilities in the field of electronic information (e-certificates etc.) to allow
for more targeted inspections concentrating on operational issues rather than
documentation. The more information is provided to inspection authorities (both to
inspectors and port State control officers) in an agreed electronic format in advance
of inspection, the more efficient and targeted it can be. Consideration could also be
594 According to IRU, Europe is lacking daily 100,000 parking spots for truck drivers, to take their legally mandatory breaks and
rests, whilst most of the existing parking areas are below acceptable standards. 595 Directive 2009/16/EC of the European Parliament and of the Council of 23 April 2009 on port State control, OJ L 131,
28.5.2009, p. 57. 596 COM(2018) 188 final

230
given to the idea of developing an incentive mechanism for further enhancing EU
quality shipping taking inspiration from e.g. the US Coast Guard “Qualship21”
programme.
1017. Containers lost at sea pose a problem for both navigational safety and the marine
environment. While the number of containers lost overboard is relatively small the
impact can be large. As a first step, it is important that the size of the problem is
understood and it is therefore proposed that a single mandatory global reporting
system for lost containers based on the EU model is pursued at IMO level. As it
seems that there are significant problems with the verified gross mass (VGM) of
containers it is proposed that a single system for VGM linked with third part
verification of VGM is trialled and that third party verification of container
contents (on a sample basis) could be considered, this also links with the growing
problem of container fires due to undeclared or wrongly declared cargos.
Consideration also needs to be given to the issues of container standards, their
stacked strength and periodic inspection.
1018. An important aspect of improving maritime safety is the investigation of
maritime accidents so that lessons can be learned. Currently Directive 2009/18/EC
incorporates the principles underlying the relevant international requirements
(IMO) into EU law. This being said the establishment of a permanent accident
investigation body is seen as a heavy resource burden for smaller member States
and states with small fleets. It may be opportune to identify means to support to
Member States in the exercise of their accident investigation obligations either by
sharing and/or pooling resources, making use of the European Maritime Safety
Agency (EMSA) and benefitting from EU-wide facilities.
1019. Safety in sea ports is closely related to evolutions in the shipping sector. Social
partners have raised concerns about increased safety risks posed by mega-sized
vessels or the growing number of overweight and mis-declared containers.
Attention should also be brought to the need to increase the safety of port workers
handling cargo on-board ships. The question of safety for workers at ship recycling
facilities is also a source of concern. The EU Ship Recycling Regulation sets out
criteria in that respect, which need to be complied with by shipowners of vessels
flying an EU flag and yards included in the EU list of ship recycling facilities597
.
1020. In line with the evolution of international rules and technological change of the
waterborne sector, the overall safety framework (Directives on flag state
responsibilities, port state control and accident investigation) there may be a need
to review, in particular as regards the role and responsibilities of States as Flag
States, to ensure internal coherence and external fitness of such rules.
1021. Another important aspect of safe and sustainable maritime shipping relates to
conditions within which ships are treated at their end of their life-cycle. The EU
Ship Recycling Regulation aims, among others, to prevent, reduce, minimise and,
to the extent practicable, eliminate accidents, injuries and other adverse effects on
human health and the environment caused by ship recycling. It also aims to
facilitate the ratification of the 2009 Hong Kong International Convention for the
Safe and Environmentally Sound Recycling of Ships. The EU Ship Recycling
Regulation may need to be revised and strengthened in order to ensure that its
objectives are fully achieved in practice.
597 https://ec.europa.eu/environment/waste/ships/list.htm

231
1022. In inland navigation, harmonised technical standards have been put in place
(technical requirements for vessels and professional requirements for crew
members) but there is still a lack of common rules for inspection bodies ensuring
an equal high level of service as in other modes of transport. Similarly, the lack of
uniform criteria concerning the conditions for registering inland navigation vessels
does not guarantee a minimum level of quality of national registries.
1023. Finally, although air transport stands out as an exception in view of the robust
safety oversight system it has developed, weak Member State enforcement of
applicable rules also pose safety and security challenges in the transport sector. In
the EU, there are insufficient resources dedicated to performing oversight, which
affects the ability of authorities to enforce EU rules on safety and security. In
addition, in maritime transport there is a lack of a comprehensive framework that
would ensure that every single ship trading in EU waters, regardless of its flag,
would meet the applicable internationally agreed requirements. And in some areas,
rules and oversight are very fragmented (e.g. rules on the use of personal mobility
devices).
1024. In road transport, the Cross-Border Enforcement Directive598
provides Member
State authorities with access to each other’s vehicle registers via an electronic
information system that enables the identification of the presumed non-resident
offender in cases where it was impossible to stop the vehicle and/or identify the
driver. However, an evaluation of the Directive showed that approximately half of
the detected road traffic offences committed by non-residents were not investigated
and approximately half of the financial penalties for those road traffic offences by
non-residents that had been investigated were not successfully enforced. Practically
all offences where offenders refused to pay financial penalties were not enforced.
Therefore, the Directive needs to be made more effective. In addition, the mutual
recognition of driving disqualifications might be considered.
1025. Regulation (EC) No 391/2009 on the ship inspection and certification
companies, the so-called “recognised organisations” (ROs), has brought about in
the last 11 years significant improvements in maritime safety. This was achieved
by enhanced monitoring of ROs to which EU flags entrust the safety inspections of
their fleet. However, after 11 years the Regulation is showing some limitations. A
significant number of third-country ships calling at EU ports (around 10% of all
ships calling) is still inspected by non-EU recognised organisations. Therefore,
third flags using ROs are escaping the scrutiny imposed to the rest of the ships.
There are also conflicts of interest in the provision of consultancy services. The
ROs are increasingly providing consultancy services in parallel with inspection and
certification. This has created instances whereby the ROs are advisers to the same
ship-owner whose ships are afterwards being inspected. In addition, the Regulation
does not regulate a new phenomenon appeared in the last 11 years under which the
ROs are entering into agreements between themselves to conduct work on behalf
of each other leading to a full certification issued by a RO without itself
conducting the inspection.
1026. Remote inspections already existed before the COVID-19 pandemic and have
now become the norm for around 40% of the inspections tacking place. The
provision of remote inspections leading to full certification is regulated neither in
EU legislation nor by way of international conventions.
598 Directive (EU) 2015/413 of the European Parliament and of the Council of 11 March 2015 facilitating cross-border exchange of information on road-safety-related traffic offences, OJ L 68, 13.3.2015, p. 9.

232
1027. In addition, and in accordance with Article 14 (1) of Regulation (EC) 2009/391,
the Commission is empowered to adopt criteria to measure the effectiveness of the
rules and procedures of the ROs. This is the only missing piece of the revamp of
the legislative framework introduced in 2009 regarding the monitoring and
oversight of ROs. These criteria could reflect at EU level relevant criteria and
standards (Goal based standards for the rules of classification societies) agreed at
the IMO level, allowing an assessment of ROs at an additional level: whether their
rules are meeting the internationally agreed standards or not. Furthermore,
Commission decision 2009/491/EC on criteria to measure performance of ROs
could also be updated, to determine when such performance is to be considered an
unacceptable threat to safety or the environment.
1028. Transition to risk based approach also brings challenges, notably for
oversight, as it moves away from rules compliance checking. It is a new way for
competent authorities and industry, based on known risks and safety performance,
to discharge their responsibilities and find a way to better target the safety areas of
greater concern or need. It is a way of performing surveillance based on the risk
profile where, besides the insurance of compliance with the regulations, a focus is
on the management of operational risk(s). This in turn requires a mechanism for
better identifying hazards, measuring associated risks as well as providing a way to
demonstrate how these risk(s) can effectively be mitigated. This approach can
enable the competent authorities and industry to focus their attention on
organisations and/or transport activities that require additional or higher attention,
i.e. making best use of limited resources. A key enabler for this approach to be
catered for in the regulatory framework, is the ability and capability to collect,
analyse and exchange safety data. Access to data is essential to support a risk-
based approach as part of an effective (safety) management system.
1029. In this context, the increased focus on strengthened inter-modality across the
various modes of transport constitutes a catalyst for developing a ‘harmonised’
approach to safety oversight and management.

233
4.4 External dimension
1030. Transport is international by nature. Broad and deep transport connectivity
strengthens our economies and helps our societies prosper. Transport plays a
crucial role in connecting the EU with its neighbours and ensuring safe, efficient
and sustainable mobility for people and goods. In an increasingly globalised world,
it is the lifeblood of our economies. With most third countries, machinery and
transport equipment represents 40-50% of total exports. Transport services
accounts on average for 17 % of total services exports. EU transport policy is
influenced - and in many areas determined - by the global regulatory framework.
And with emerging global powers consolidating their economic and regulatory
reach, the EU is confronted with a more diverse global arena to assert its
transport agenda. Although its economic power and influence in international
transport organisations remain significant, on the global stage the EU is facing
more challenges in exercising a global role that is commensurate with its
regulatory, economic and technical strengths.
1031. This is notably the case in areas of aviation and maritime transport, which
inherently have a strong global dimension, and where the ambitious EU approach
is often questioned, especially on topics such as sustainability, competition,
social matters and the rule of law. For land transport, there is an evident need for
more effective coordination of international rules, as well as a need to strengthen
the EU position and influence in the ongoing harmonisation of rail transport.
1032. It is essential that road transport operators established in non-EU countries apply
equivalent high social standards when operating transport services on the territory
of the EU. This would prevent distortions of competition between EU operators
and non EU-operators and ensure that all workers carrying out activities on the EU
territory benefit from the same minimum rights. The rules governing, in general,
the transport operations for non-EU operators under AETR (Accord Européen sur
les Transports Routiers) are only partially aligned with the EU social rules for the
road transport sector. The EU has been discussing with the AETR non-EU
countries the alignment of requirements on installation and use of smart tachograph
in commercial vehicles operating on and through the EU territory.
1033. At more fundamental level, recent geopolitical developments are challenging
some of the core principles around which the global multilateral system was built,
thus putting global trade and transport under increased pressure. In addition, the
distortions of competition and the state-driven strategies of some among the EU’s
global partners have meant the EU has had to have a tighter grip on defending its
strategic interests at home and abroad. Foreign ownership and investment projects
at home bearing on strategic transport nodes and infrastructure are thus being
subject to closer scrutiny. The EU has already equipped itself to face security and
public order threats: Regulation (EU) 2019/452599
has introduced a framework
under which Member States can screen foreign direct investments into the EU on
the grounds of security or public order. It provides a mechanism for cooperation
between Member States, and between Member States and the Commission, with
regard to foreign direct investments likely to affect security or public order; and
gives the Commission the possibility to issue an opinion on such investments. To
further improve the protection of a level playing field and safeguard strategic
interests in the transport sector, there might be a need to establish clearer rules for
599 Regulation (EU) 2019/452 of the European Parliament and of the Council of 19 March 2019 establishing a framework for the
screening of foreign direct investments into the Union, OJ L 79I , 21.3.2019, p. 1.

234
all owners of strategic transport infrastructure in terms of non-discriminatory
access for users, availability for public service needs, requirements for dual use,
respect of technical standards, etc. At the same time, where restrictions exist to
foreign investments in the EU (e.g. ownership and control of airlines), they could
limit the ability of EU companies to compete globally.
1034. More widely, better coordination and integration of the EU's external transport
agenda with other external policy goals, including in trade and cooperation, can
create synergy effects, lead to mutual reinforcement and improve effectiveness in
achieving external policy objectives in these policy areas.
4.4.1 EU leadership
1035. The EU’s ability to be heard internationally and follow through its intent
depends on its ability to influence, as such, the global standard setting in transport.
The 2017 Singapore Opinion of the European Court of Justice600
largely clarified
the EU's external competences in the field of transport, also as regards the issue of
exclusive external competence. In 2011 the EU acceded to the Convention
concerning International Carriage by Rail (COTIF), and joined the
intergovernmental organization dedicated to such carriage (OTIF). This is the first
accession of this kind in the area of transport.
1036. In the rail sector, the EU model is the basis of the OTIF technical legislation and
is also taken as the starting point by various countries and in global fora (e.g. OTIF
technical legislation) for the development of safety and interoperability regulations.
The European Rail Traffic Management System (ERTMS) is also implemented
beyond the Union and has the potential to become a global reference.
1037. In the maritime sector, the EU plays a key role in driving forward the safety and
environmental standards set at global level by the International Maritime
Organization (IMO). Capacity building and outreach to developing countries,
namely LDCs and SIDS, is a pre-requisite for an inclusive global transition to
sustainable shipping. Among others, the EU therefore funds the Global Maritime
Technology Cooperation Centres, promoting technologies and operations to
improve energy efficiency in the maritime sector and help navigate shipping into a
low-carbon future.
1038. In the inland waterways sector, the EU cooperates with other international
organisations, such as the UN-ECE, CCNR601
or the Danube Commission on
various topics related to standards and safety. These organisations have members
from both the EU and non-EU countries: this can facilitate integration and
harmonisation of approaches between EU and non-EU states.
1039. The EU is a world leader in road safety, with just 2% of the estimated 1.35
million fatalities per year occurring on EU roads. The EU’s example is often cited,
and know-how and good practice from the EU and its Member States is in high
demand. The EU takes its leadership role seriously, for example in supporting the
road safety work of its immediate neighbours (Western Balkans and Eastern
Partnership), in intensified cooperation with Africa (following the work of the EU-
Africa Taskforce on Transport) and in contributing to UN Road Safety Fund602
.
The EU also plays a strong role vis-à-vis the United Nations Economic
600 Opinion 2/15 of the Court of 16 May 2017, ECLI:EU:C:2017:376. 601 Commission centrale pour la navigation du Rhin (CCNR) 602 The European Commission is a member of and currently chairs the Advisory Board of the UN Road Safety Fund.

235
Commission for Europe (UNECE), in particular as regards vehicle regulations
(World Forum for Harmonisation of Vehicle Regulations, Working Party 29). It is
assessing how its role could also be reinforced as regards traffic rules (Global
Forum for Road Traffic Safety, Working Party 1). As an example both the recent
testing cycle and the on-road tests for the emission type approvals of cars were
developed with the leadership of the Union, represented by the Commission. A
stronger EU role as regards traffic rules in UNECE could also be beneficial.
1040. When it comes to urban mobility, the EU concept of sustainable urban mobility
planning (with dedicated guidelines) has become a point of reference worldwide,
with many cities beyond the EU getting inspired by the EU SUMP approach and
translating the guidelines into local languages. In addition, an EU-funded project -
MobiliseYourCity - has become the leading global partnership for sustainable
urban mobility planning, with more than 60 member cities in 32 countries with a
combined population of over 75 million people. It accelerates the transition to
sustainable urban mobility in countries of the Global South by disseminating
knowledge, tools and guidelines based on the Commission’s SUMP concept603
.
1041. Similarly, when it comes to campaigns raising awareness and promoting
behavioural change in urban mobility, European Mobility Week604
is the world-
wide leader and a point of reference. It gradually attracts more and more cities
from outside of the EU, with over 2,945 cities from 53 countries covering almost
all continents registered in 2020 edition.
1042. In the field of aviation, all EU Member States are members of ICAO. In areas of
Union competence, the positions of the Union are established in accordance with
the Treaties and are binding on the Union Member States. On a more operational
level, there are existing ties with ICAO through the EU-ICAO Memorandum of
Cooperation. Technical cooperation offered by the EU to ICAO and ICAO States
in areas of key importance such as safety, security and environment also plays a
fundamental role in building the EU’s influence in the decision making spheres at
global level.
1043. The EU is funding technical cooperation projects in a number of third-
countries. Third country cooperation takes place also via EU agencies such as
EMSA or EASA, which play a key role in technical cooperation activities; for
example through EMSA’s capacity building activities to non-EU countries
bordering the Black and Caspian Sea, to name a notable example.
1044. The EU has also a long-standing tradition in promoting international cooperation
via R&I programs. With the overarching objective of international cooperation, the
R&I programmes set high-level objectives of strengthening EU science in
technology, fostering EU industrial competitiveness and innovation performance,
or delivering on the EU’s strategic priorities, such as the Paris Agreement on
climate and tackling global challenges that affect the quality of our daily lives.
However, the programmes are sometimes missing further sector and project
specific goals for global and industrial competitiveness.
4.4.2 EU global competitiveness
1045. Promoting high EU standards that ensure safe, secure, smart and sustainable
transport is a key international cooperation goal. It is instrumental in supporting
603 https://mobiliseyourcity.net/about_the_partnership 604 https://mobilityweek.eu/home/
236
EU industry access to foreign markets, but more importantly, it is the only way to
successfully address major challenges such as the decarbonisation and
digitalisation of transport. For instance, the EU has state of the art aviation safety,
security and air traffic management regulatory frameworks. The joint and
coordinated promotion of EU’s regulatory standards in the safety, interoperability,
social, employment and environmental fields on one side, and the consolidation of
EU technical standards as global references on the other side can create synergies
and have beneficial effects. They can reinforce each other in ensuring that the “EU
model” keeps its attractiveness and is applied widely beyond the EU borders. This
would also support ensuring a level-playing field with non-EU countries.
1046. This is especially relevant for the aviation industry. Whether it is in the area of
standardisation, innovative technologies or regulations, the promotion of EU
standards at global level has many advantages. It contributes to harmonisation of
the regulatory frameworks for global aviation, meaning that the industry can
operate in more world regions with the same standards. Secondly, it allows
European industry more easily to reach new markets and tap into the growth of
other regions of the world.
1047. However, in the area of technical standards, the EU and its companies are not
yet playing a role commensurate with their industrial importance, e.g. in areas such
as ATM, drones and cyber security. EU standards bodies such as EUROCAE are
playing a key role and could help the EU industry to be better represented in
leading international standard-setting bodies.
1048. Ensuring a level playing field on global markets will be a key challenge for the
EU to secure a prosperous and successful environment for its transport sector, but
also to achieve the key policies and ambitions the EU has set out in this sector –
including sustainability. Today, there appears to be two main problems associated
with this. Problems arising from the degree of market access available to European
suppliers of transport equipment and/or service providers as compared to those of
third countries; and issues of level playing field, where European transport
operators do not compete under comparable conditions, in particular as regards
regulatory requirements (e.g. technical, social, safety and environmental standards,
State aid or financial rules) as those of third country operators serving the same
markets. This objective can be achieved by promoting international standards in
different fora or through the negotiation of bilateral agreements between the EU
and the respective third country. International standards can prove to be valuable in
promoting environmental and social sustainability globally and ensuring a level
playing field for European companies. Most notably, the ILO’s Maritime Labour
Convention of 2006 and its occupational safety and health standards serve as a
good basis for promoting a level playing field.
1049. In addition, the Union adopted a regulation605
on safeguarding competition in air
transport in 2019. This regulation lays down rules on the conduct of investigations
by the Commission and on the adoption of redressive measures, relating to
practices distorting competition between Union air carriers and third-country air
carriers and causing, or threatening to cause, injury to Union air carriers.
605 Regulation (EU) 2019/712 of the European Parliament and of the Council of 17 April 2019 on safeguarding competition in air transport, OJ L 123, 10.5.2019, p. 4.

237
4.4.3 External connectivity
1050. In addition to participation in multilateral organisations, the EU pursues its
global transport agenda via bilateral and multilateral agreements. There are
several horizontal trade or cooperation agreements with third countries, which
cover also transport, including the provision of transport services (e.g. maritime
transport services). Waterborne transport is particularly important accounting for
the transport of 75% of extra-EU trade. Given its importance for connectivity and
cargo, a chapter on international maritime transport services, which includes
maritime auxiliary services as well as ports services, is hence provided for in EU
trade deals, generally Free-Trade-Agreements (FTAs). The EU has recently
concluded important trade deals with a maritime transport component, such as with
Canada, Singapore, and Vietnam; the EU is currently negotiating trade deals with
maritime transport provisions also with Australia, New Zealand, China etc.
1051. The above mentioned 2017 Singapore Opinion of the European Court of Justice
has clarified a number of competence-related issues, in particular issues of external
competence, including in the area of maritime transport.
1052. Furthermore sectoral transport agreements already exist with several strategic
third countries, in particular in the aviation sector, but also the road and maritime
sectors (EU – China Maritime Transport Agreement). It may be explored with
which third countries the EU should negotiate new transport agreements, for
example in order to promote regulatory alignment.
1053. Like the EU’s internal market, the extra-EU market has seen growing
competition with emerging carriers from third countries rapidly developing their
market shares. This accrued new competition creates challenges for traditional EU
carriers to adapt where non-EU airlines have expanded their international
operations considerably. Such airlines have benefitted from geography, strategic
support from their respective home countries and, in some cases, a rapidly-growing
domestic market.
1054. Whereas the emergence of such airlines has enlarged choices for passengers,
they also represent a challenge to the connectivity provided by network carriers
based in the EU. Market access for air services is governed by a complex web of
bilateral air services agreements with little role for ICAO. The EU has developed
and signed comprehensive agreements with a number of key aviation partners.
These EU-level agreements provide a comprehensive framework governing the
aviation relationship between the third country and all EU Member States together.
They cover already 45% of all external air traffic from the EU. Experience shows
that significant benefits arise from such agreements, notably in terms of
connectivity and affordability. The EU’s comprehensive aviation agreements
therefore seek to establish a broad ranging relationship going well beyond traffic
rights, to include technical cooperation and ambitious competition, social and
environmental standards. Liberalisation of air services markets is strongly linked
with a more level playing field.
1055. Recently negotiated new agreements such as with Qatar have set a new model
for the EU’s external aviation relations, and have strengthened the confidence of
EU Member States in a joint approach towards third country partners. Further
engagement is essential between the EU and third countries of strategic interest
where an EU comprehensive agreement adds value. This has also been recognised
by the European associations collectively representing the entire European
aviation. Their urgent call and accompanying report considers that the EU and
Member States should continue to promote a competitive EU aviation industry

238
globally, including through EU negotiated bilateral and multilateral aviation
agreements where added value and economic benefits have been demonstrated for
the EU aviation ecosystem, as well as consumers, based on fair competition and
high standards in areas such as safety, consumer protection, environment and
social rights.606
1056. Transport is a key component of policies and instruments under the enlargement
process (Western Balkans) and under the EU neighbourhood policy (Eastern
Partnership and Union for the Mediterranean). Connectivity in these regions at the
EU borders is pursued through the extension of the TEN-T policy and networks,
with two interlinked objectives: (i) ensuring consistency and effectiveness of an
integrated multimodal connectivity between the networks of the EU and of its
partners; (ii) focusing EU cooperation (including as regards financial support, e.g.
through the Investment Action Plan in the Eastern Partnership).
1057. At this stage, the EU has reached an agreement to extend the TEN-T network to
the Western Balkans, the Eastern Partnership607
and the comprehensive network
in Turkey. Work of the Southern Mediterranean partners608
on a Trans-
Mediterranean Transport Network is underway, pending the approval still awaited
by some non-EU countries in the region. Also Norway, Iceland and Liechtenstein
(EFTA-EEA countries) are covered by the extended TEN-T networks, through the
European Economic Area Agreement.
1058. On soft measures, the EU actively supports regulatory reforms and convergence
and strengthened technical dialogue. This addresses notably safety, sustainable
connectivity and high-level and rules-based standards in all transport modes, with
the operational involvement of the European Transport Agencies.
1059. In particular, the Transport Community Treaty with the six Western Balkans
(WB6) countries constitutes a high level of policy integration in the transport
sector. Through this international agreement, the EU and WB6 aim at progressive
access to the EU transport market for all modes of transport, except aviation which
is covered by the European Common Aviation Area Agreement (ECAA), in
exchange for applying EU norms and at an integrated regional market through
specific action plans focusing on rail, road safety and cross-border facilitation. The
TCT Permanent Secretariat was established in 2019 and became fully operational
in 2020 following the ongoing recruitment process conducted with the support of
the Commission.
1060. Over 90% of world economic growth over the next decade will occur outside
Europe. Ensuring adequate links (through political, economic and regulatory
cooperation) with these growth centres by promoting connectivity, the uptake of
highly advanced and modern EU standards (on safety, security, social,
environmental and other requirements) and boosting the role of European
stakeholders, especially the EU transport industry, can benefit the EU and its
global partners. Due to its impressive growth, there has been, over the last few
years, considerable focus on ASEAN as a region. There is now a well-established
Transport Dialogue at the highest technical level, with the EU being the only non-
Asian Transport Dialogue partner of ASEAN. There is also a Transport Dialogue
with Singapore, considering it is an important transport hub and world leader in
digitalisation and decarbonisation of transport, as well as with Japan. Taking into
606 European Aviation Round Table Report on the Recovery of European Aviation, November 2020. 607 Armenia, Azerbaijan, Belarus, Georgia, Moldova and Ukraine 608 The Southern Partnership of the European Neighbourhood Policy covers Algeria, Egypt, Israel, Jordan, Lebanon, Libya, Morocco, Palestine*, Syria (cooperation suspended since 2011) and Tunisia.

239
account technological developments, discussions are also on-going on deepening
transport relations with Australia. The Republic of Korea, as another key transport
innovator and leader, e.g. in hydrogen technology, and the Gulf Cooperation
Countries also need to be prioritised as partners for the implementation of the
EU's global transport policies.
1061. Considering the global nature of transport operations in many modes, especially
aviation and maritime transport, deepening relationship with other key global
partners can be beneficial. Depending on resources and future developments,
deepened and structured relations could also be considered with Mexico, India,
China, Colombia and others.
1062. Strengthening ties with countries in Africa is another area were efforts are being
prioritised. In transport, the building on existing transport cooperation in areas of
common concerns (e.g. aviation safety and security, maritime security, maritime
transport and sustainability of international transport) and on the
recommendations of the ‘Africa-Europe Alliance Task Force on Transport and
Connectivity’ on aviation, road safety and sustainable infrastructure connectivity,
which should be now implemented, can be bilaterally beneficial. Integrated
transport systems and infrastructure corridors at continental level are an essential
pre-condition for the African Continental Free Trade Area (AfCFTA). The EU can
share its experience as regards the development and implementation of a
continental single market and sustainable transport, including through support for
sectoral initiatives such as the Single African Aviation Transport Market
(SAATM). Currently, the EU is negotiating the Post-Cotonou Agreement with the
African-Caribbean-Pacific countries (ACP). The EU – ACP negotiations also
contain a maritime transport component with the aim of continuing to ensure non-
discriminatory access to international maritime transport markets vis-à-vis the
ACP.
1063. In addition to focusing on developing relations with new transport partners, in
light of geopolitical, economic and other developments, and in particular the
challenges faced by all nations (including climate change or the COVID-19
pandemic), the EU needs to strengthen its engagement with its global strategic
partners, in particular the US, China and Japan. A wide range of issues and topics
across all transport modes (safety, security, market access, technical standards,
decarbonisation, digitalisation, connectivity) are covered in the close relations that
are forged with the EU’s major trading partners and competitors in the global
market. In addition to existing agreements with the US (e.g. the air transport "Open
Sky" agreement) and China (safety & maritime agreements), efforts should be
continued to reinforce engagement through various sectoral dialogues (e.g. on
safety and security with the US), enhance exchanges on connectivity policies (e.g.
within the EU-China Connectivity Platform609
which is looking at possible
synergies between the TEN-T and China’s Belt and Road Initiative with the main
goal being transparency, reciprocity and a level playing field as we strive towards
sustainable and interoperable transport links between Asia and Europe), and re-
invigorate the long-established cross-modal dialogues (e.g. with Japan and China).
A Joint Study on Sustainable Railway-based corridors is to be launched and co-
financed with China that will evaluate the most sustainable links between Europe
and China in the broadest sense (economic, financial, fiscal, environmental and
social). Throughout the implementation of the study, wide stakeholder
609
https://ec.europa.eu/transport/themes/international/eu-china-connectivity-platform_en
240
consultations will be conducted with all countries concerned, EU Member States,
industry representatives, civil society and relevant international organisations.
Currently, EU – China negotiations on a bilateral investment agreement are on-
going. These negotiations include provisions on maritime transport with the aim to
align with certain aspects of the existing bilateral maritime transport relations
developed under the EU – China Maritime Transport Agreement.
1064. Finally, it is of high importance that the EU and the UK to conclude an
agreement on the EU-UK partnership, including transport. The ongoing EU –
UK negotiations on a future agreement include ambitious transport components.
The chapters on air and road transport are key to ensure connectivity after the end
of the transition period foreseen by the EU-UK Withdrawal Agreement. As regards
maritime transport, EU – UK international markets and trade are currently open. In
order to ensure that market access is maintained and that there is no discriminatory
treatment, the EU proposed to include in the agreement a chapter on international
maritime transport services. The EU also proposed transport-specific rules on level
playing field in the air and road transport chapters.

241
5 DESCRIPTION OF THE PATHWAYS/SCENARIOS
5.1 Scenario design
1065. Section 2.2 showed that with existing policies (in the Baseline scenario), a
declining trend in emissions from transport including intra-EU aviation and intra-
EU maritime is expected by 2030 and 2050 (18% reduction for 2005-2030 and
40% for 2005-2050) but greater efforts are needed to deliver the transport
contribution to the 2030 Climate Target Plan and to the European Green Deal. This
section describes several stylised pathways/scenarios addressing the challenges
identified in section 4. All scenarios described below close the gap needed to
deliver the transport contribution to the 2030 Climate Target Plan and the climate
neutrality by 2050.
1066. The pathways/scenarios described in this section have been developed in the
context of the impact assessment underpinning the 2030 Climate Target Plan610
.
They cover all sectors of the economy and at the same time include a range of
transport policies that address the challenges of sustainable, smart and resilient
mobility. This ensures full consistency between the analytical work underpinning
the 2030 Climate Target Plan and the Sustainable and Smart Mobility Strategy.
1067. This section provides a description of the scenario setup, drawing on the impact
assessment accompanying the 2030 Climate Target Plan, focusing on the scenarios
and variants most relevant for the transport sector. A full description of all
scenarios and sectors concerned is provided in the impact assessment
accompanying the 2030 Climate Target Plan.
1068. The PRIMES-GAINS-GLOBIOM economic modelling toolset used for
assessing the scenarios covers in detail all sectors of the EU economy and their
related GHG emissions and CO2 absorptions. Energy and industrial CO2 emissions
are assessed with the PRIMES model, including the PRIMES-TREMOVE model
for the transport sector. Non-CO2 emissions (CH4, N2O and F-gases) of the waste,
energy, agriculture and industry sectors are assessed with the GAINS model. Land
use emissions and removals are assessed with the GLOBIOM model. See Annex I
for more detailed information on this modelling suite.
1069. The scenarios were constructed around a set of specific policies that either focus
on carbon pricing (e.g. through inclusion of new sectors in the ETS) or focus on
regulatory measures (e.g. CO2 emission standards for vehicles, blending mandates
for renewable and low carbon fuels in transport, renovation requirements, support
for electrification of transport and heating, etc.) or combine the two types of
instruments. Stylised modelling applying these general policy incentives allows to
discover where there is emissions reduction potential and how policies interact.
This approach allows to compare the different sets of policy options, the resulting
synergies and trade-offs in a coherent framework. On the other hand, there are
inherent limitations in such modelling exercise, notably in terms of detailed
representation of specific policies, differentiated impacts on economic actors as
well as specific challenges that will be encountered in the implementation of these
polices.
610 EC (2020), Impact assessment accompanying the Commission Communication “Stepping up Europe’s 2030 climate ambition - Investing in a climate-neutral future for the benefit of our people”, SWD(2020) 176 final
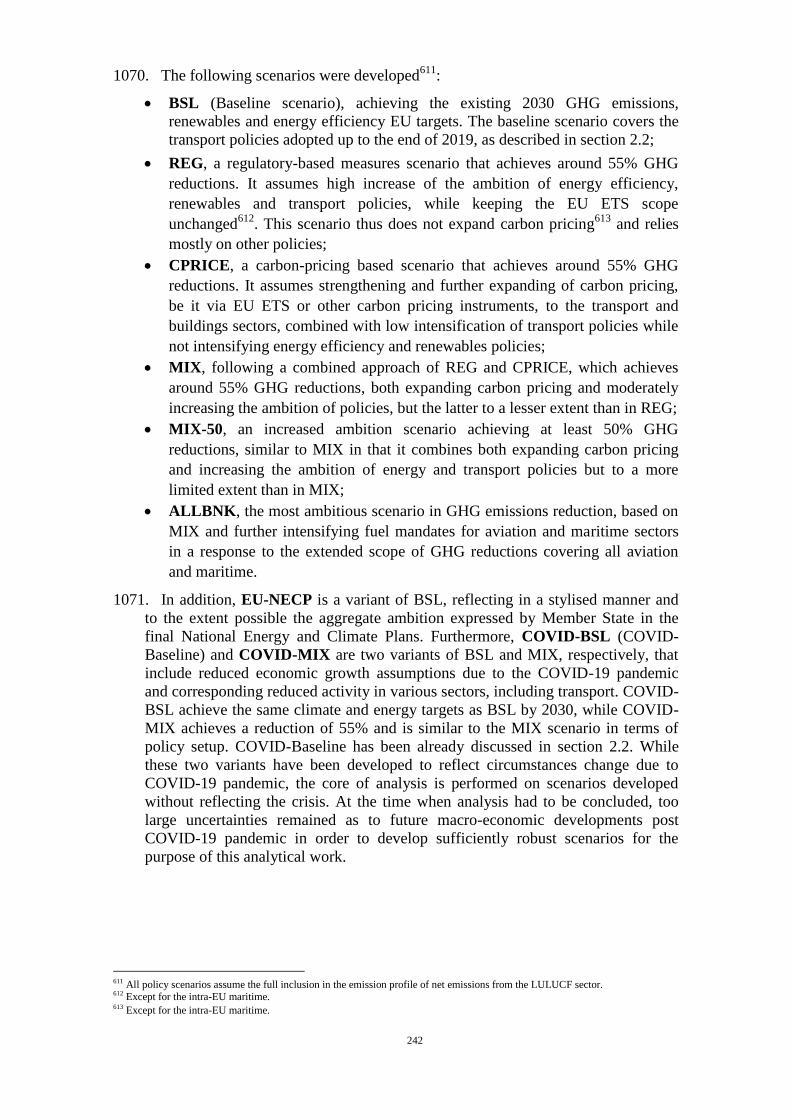
242
1070. The following scenarios were developed611
:
BSL (Baseline scenario), achieving the existing 2030 GHG emissions,
renewables and energy efficiency EU targets. The baseline scenario covers the
transport policies adopted up to the end of 2019, as described in section 2.2;
REG, a regulatory-based measures scenario that achieves around 55% GHG
reductions. It assumes high increase of the ambition of energy efficiency,
renewables and transport policies, while keeping the EU ETS scope
unchanged612
. This scenario thus does not expand carbon pricing613
and relies
mostly on other policies;
CPRICE, a carbon-pricing based scenario that achieves around 55% GHG
reductions. It assumes strengthening and further expanding of carbon pricing,
be it via EU ETS or other carbon pricing instruments, to the transport and
buildings sectors, combined with low intensification of transport policies while
not intensifying energy efficiency and renewables policies;
MIX, following a combined approach of REG and CPRICE, which achieves
around 55% GHG reductions, both expanding carbon pricing and moderately
increasing the ambition of policies, but the latter to a lesser extent than in REG;
MIX-50, an increased ambition scenario achieving at least 50% GHG
reductions, similar to MIX in that it combines both expanding carbon pricing
and increasing the ambition of energy and transport policies but to a more
limited extent than in MIX;
ALLBNK, the most ambitious scenario in GHG emissions reduction, based on
MIX and further intensifying fuel mandates for aviation and maritime sectors
in a response to the extended scope of GHG reductions covering all aviation
and maritime.
1071. In addition, EU-NECP is a variant of BSL, reflecting in a stylised manner and
to the extent possible the aggregate ambition expressed by Member State in the
final National Energy and Climate Plans. Furthermore, COVID-BSL (COVID-
Baseline) and COVID-MIX are two variants of BSL and MIX, respectively, that
include reduced economic growth assumptions due to the COVID-19 pandemic
and corresponding reduced activity in various sectors, including transport. COVID-
BSL achieve the same climate and energy targets as BSL by 2030, while COVID-
MIX achieves a reduction of 55% and is similar to the MIX scenario in terms of
policy setup. COVID-Baseline has been already discussed in section 2.2. While
these two variants have been developed to reflect circumstances change due to
COVID-19 pandemic, the core of analysis is performed on scenarios developed
without reflecting the crisis. At the time when analysis had to be concluded, too
large uncertainties remained as to future macro-economic developments post
COVID-19 pandemic in order to develop sufficiently robust scenarios for the
purpose of this analytical work.
611 All policy scenarios assume the full inclusion in the emission profile of net emissions from the LULUCF sector. 612 Except for the intra-EU maritime. 613 Except for the intra-EU maritime.

Figure 44: Overview of the policy scenarios

1072. The GHG emissions reduction target in CPRICE, MIX, MIX-50 and REG
scenarios cover intra-EU aviation and intra-EU maritime emissions. In the
ALLBNK scenario, the GHG emissions reduction target cover both intra-EU and
extra-EU aviation and maritime emissions. By comparing the BSL, MIX-50, MIX
one can assess the impact of 50% and 55% GHG emissions reduction targets. By
further comparing with the ALLBNK scenario that achieves 55% GHG reduction
including all aviation and maritime emissions in the GHG target scope one can
look at the impact of a different scope on this ambition. By comparing BSL, MIX-
50, REG, MIX, CPRICE and ALLBNK one can look into how increased GHG
ambition relates to renewables and energy efficiency ambition, as well as different
transport policies. By comparing REG, MIX and CPRICE one can assess how
energy and transport policies can interact with extending or not carbon pricing to
additional sectors.
1073. All scenarios include a range of policies that address the challenges of
sustainable, smart and resilient mobility discussed in section 4, or assume an
intensification of such policies relative to the baseline. CPRICE scenario assumes
strengthening and further expanding of carbon pricing to the road and maritime
transport sectors, be it via EU ETS or other carbon pricing instruments. It includes
the ReFuelEU aviation and FuelEU maritime initiatives and policy initiatives that
drive improvements in transport system efficiency and support greater use of more
sustainable transport modes relative to the BSL scenario:
− Incentives for intermodal freight transport;
− Initiatives to increase and better manage the capacity of railways, inland
waterways and short sea shipping, supported by the TEN-T infrastructure and
CEF funding;
− Gradual internalisation of CO2, air pollution and noise costs (“smart” pricing);
− Incentives to improve the performance of air navigation service providers in
terms of efficiency and to improve the utilisation of air traffic management
capacity;
− Revision of roadworthiness checks legislation;
− Implementation of the EURO 7 air pollution standard;
− Limitedly increase in ambition for CO2 emission standards for vehicles
(passenger cars, vans, trucks and buses) as of 2030 or 2035, supported by the
roll-out of recharging and refuelling infrastructure. For cars this corresponds to
a reduction of around 40% in 2030 compared to the 2021 target.614
1074. MIX-50 and MIX scenarios assume for road and maritime transport an
expansion of carbon pricing, renewable and low carbon fuels mandate (including
ReFuelEU aviation and FuelEU maritime initiatives), and a set of policies in
addition to those included in the CPRICE scenario that foster and intensify the
development of public transport and greater use of more sustainable transport
614 The existing legislation sets for newly registered passenger cars, an EU fleet-wide average emission target of 95 gCO2/km from 2021, phased in from 2020. For newly registered vans, the EU fleet-wide average emission target is 147 gCO2 /km from 2020
onward. Stricter EU fleet-wide CO2 emission targets, start to apply from 2025 and from 2030. In particular emissions will have to
reduce by 15% from 2025 for both cars and vans, and by 37.5% and 31% for cars and vans respectively from 2030, as compared to
2021. From 2025 on, also trucks manufacturers will have to meet CO2 emission targets. In particular, the EU fleet-wide average CO2
emissions of newly registered trucks will have to reduce by 15% by 2025 and 30% by 2030, compared to the average emissions in
the reference period (1 July 2019–30 June 2020). For cars, vans and trucks, specific incentive systems are also set to incentivise the uptake of zero and low-emission vehicles.

245
modes and multi-modal solutions through a large and well-integrated range of
clean and connected mobility options:
− Additional efforts to improve the functioning of the transport system: support
to multimodal mobility and intermodal freight transport by rail, inland
waterways and short sea shipping;
− Deployment of the necessary infrastructure, smart traffic management systems,
transport digitalisation and fostering connected and automated mobility;
− Further actions on clean airports and ports to drive reductions in energy use,
CO2 and air pollution emissions;
− Additional measures to reduce noise and air pollutants in urban areas;
− Pricing measures such as in relation to energy taxation (e.g. alignment of
minima on energy content for diesel and petrol), and infrastructure charging;
− Other measures incentivising behavioural change;
− Medium intensification of the CO2 emission standards for cars, vans, trucks
and buses (as of 2030) as compared to CPRICE, supported by large scale roll-
out of recharging and refuelling infrastructure. For cars this corresponds to a
reduction of around 50% in 2030 compared to the 2021 target.
1075. REG scenario keeps the EU ETS scope unchanged, except for the intra-EU
maritime. It assumes high increase of the ambition of renewable and low carbon
fuels mandate (including ReFuelEU aviation and FuelEU maritime initiatives), and
of policies that drive transport system efficiency and digitalisation in addition to
those in the MIX scenario:
− Further measures related to intelligent transport systems, digitalisation,
connectivity and automation of transport - supported by the TEN-T
infrastructure;
− Additional measures to improve the efficiency of road freight transport;
− Incentives for low and zero emissions vehicles in vehicle taxation;
− Increasing the accepted load/length for road in case of zero-emission High
Capacity Vehicles;
− Additional measures in urban areas to address climate change and air pollution;
− Pricing measures such as in relation to energy taxation (e.g. alignment of
minima on energy content for diesel and petrol and mirroring the alignment in
terms of energy content at Member State level);
− Higher intensification of the CO2 emission standards for cars, vans, trucks and
buses (as of 2030) as compared to MIX, leading to lower CO2 emissions and
fuel consumption and further incentivising the deployment of zero- and low-
emission vehicles, supported by the large scale roll-out of recharging and
refuelling infrastructure. For cars this corresponds to a reduction of around
60% in 2030 compared to the 2021 target.
1076. ALLBNK scenario builds on MIX scenario and further intensifies fuel mandates
for aviation and maritime sectors in a response to the extended scope of GHG
reductions covering all aviation and maritime sectors. All other transport policies
of the MIX scenario are also included in ALLBNK.
1077. The following section discusses the results of the MIX-50, REG, MIX, CPRICE
and ALLBNK scenarios. For the transport sector, the EU-NECP variant includes
the same policies at EU and MS levels as the BSL and thus their results are very
similar. For this reason, the results of the EU-NECP variant are not reported in the

246
section below. The analysis of the COVID-MIX variant is presented at the end and
discussed in relation to the COVID-BSL.
5.2 Analysis of impacts of the pathways/scenarios
5.2.1 Impacts on transport activity
1078. Passenger transport activity is projected to continue growing relative to 2015
(about 18-20% increase by 2030 and 32-34% by 2050) in all policy scenarios.
Active policies in place for stimulating change in the transport system and
fostering greater use of more sustainable transport modes and multi-modal
solutions through a large and well-integrated range of clean and connected
mobility options615
, put however a brake on the expansion of passenger cars
activity compared to the Baseline.
1079. In CPRICE scenario, the carbon pricing and the gradual internalisation of
external costs (“smart” pricing) for buses, cars and vans, favour greater use of rail.
The MIX and REG scenarios also reflect specific measures that support
multimodal mobility and investments in sustainable, safe and smart transport,
measures that incentivise connected mobility and improved traffic management
and measures to support sustainable urban transport. In addition, the REG scenario
covers additional measures to push digitalisation and automation in transport. Rail
transport activity is projected to increase the most in the MIX, REG and ALLBNK
scenarios, by 10-13% in 2030 relative to BSL (13-16% in 2050). This is equivalent
to 46-49% growth over the 2015-2030 period (88-93% growth for 2015-2050).
High speed rail activity would double by 2030 and triple by 2050, relative to 2015,
replacing some short-haul flights.
1080. Incentives for sustainable urban transport and the review of energy taxation
would lead to higher impact on passenger cars in the MIX, REG and ALLBNK
scenarios relative to CPRICE, resulting in 0.8-1.8% decrease in cars activity
relative to the BSL in 2030 (around 6% reduction in 2050). At the same time,
measures promoting urban policies that curb pollutant emissions and increase the
efficiency of transport operations drive greater use of collective transport modes
(i.e. buses, but also tram and metro where available) in these scenarios; the activity
of buses and coaches goes up substantially compared to BSL (8.5-10.8% increase
in 2030 and up to 16% in 2050).
1081. CPRICE and ALLBNK scenarios show higher impacts on intra-EU air transport
activity, driven by carbon pricing and other technical and operational measures,
projecting a decline of 0.7 to 1.1% by 2030 compared to BSL respectively (over
2% reduction in 2050). In general, ALLBNK strengthens the effects of MIX. In the
less ambitious MIX-50 scenario, intra-EU air transport activity reduces by 0.4%
compared to BSL in 2030 (1.7% decrease in 2050). The impact on extra-EU air
transport is similar with the highest impact projected in the ALLBNK scenario
(1.1% decrease in 2030 and 1.7% in 2050 relative to BSL). Compared to 2015
however all scenarios project sustained growth for both intra and extra-EU air
transport activity.
615 Integrating the sharing economy and connected, cooperative and automated mobility in the existing transport set-up is extremely
important. At the same time, it is important to ensure that the direction is right, leading to emissions reduction in transport, and
limiting rebound effects. For example, there is a risk that vehicle automation would increase the demand for mobility or willingness
to spend time in traffic, with adverse environmental effects as a consequence. Hence automation and connectivity need to go hand in hand in order to achieve overall system efficiency improvements.

247
1082. Activity of passenger inland navigation (inland waterways and national maritime
transport) increases most in MIX, REG and ALLBNK (30-31% for 2015-2030 and
51% for 2015-2050), supported by policies.
Figure 45: Passenger transport activity in the Baseline and the policy scenarios
(cumulative growth rates for 2015-2030 and 2015-2050)
Source: PRIMES-TREMOVE transport model (E3Modelling)
Note: For aviation, domestic and international intra-EU activity is reported, to maintain the comparability with reported statistics.
1083. For freight transport activity, greater use of rail, inland waterways and short
sea shipping is projected in all scenarios, driven by initiatives to increase and better
manage the capacity of railways and waterborne transport, incentives for
intermodal transport and gradual internalisation of external costs (“smart” pricing).
1084. Rail freight activity is projected to increase significantly in the MIX-50, MIX,
REG and ALLBNK scenarios relative to the BSL (by 9-13% in 2030 and 11-17%
in 2050), with the highest increase taking place in REG. This is equivalent to 53-
58% rise in rail freight transport activity during 2015-2030 and 102-111% for
2015-2050. Inland waterways and national maritime transport activity would be 7-
11% higher relative to the BSL in 2030 and 13-15% higher in 2050 (equivalent to
27-32% growth for 2015-2030 and 53-56% for 2015-2050) in the MIX-50, MIX,
REG and ALLBNK. These significant impacts are driven by support to multimodal
mobility and intermodal freight transport by rail, inland waterways and short sea
shipping. The impacts are more limited in the CPRICE scenario that relies more on
carbon pricing.
1085. Road freight activity declines by 1.7 to 3.1% in 2030 relative to the BSL in the
policy scenarios (2.1 to 6.3% decrease in 2050). The highest decrease relative to
the BSL is projected in REG, driven by the revision of energy taxation, ambitious
measures to gradually internalise the external costs (“smart” pricing) and other
measures to improve the efficiency of road freight transport, and in the ALLBNK
scenario. In MIX-50, road transport activity declines by 2.2% in 2030 relative to
BSL (4.8% decrease in 2050). Compared to 2015 however road freight transport
activity still shows sustained growth over time.
1086. International intra-EU and extra-EU maritime transport activity is projected to
grow slightly less than in BSL (around 22% for 2015-2030) despite some shifts
taking place from road to short sea shipping. This is primarily due to lower imports
and thus transport demand for fossil fuels. Short sea shipping, covering national
and a part of international maritime transport activity, would grow by 23-24% in
the MIX-50, MIX, REG and ALLBNK scenarios by 2030 relative to 2015 and 46-
49% by 2050.

248
1087. Overall, inland waterways and short sea shipping activity is projected to growth
by 23-24% in the MIX-50, MIX, REG and ALLBNK scenarios by 2030 relative to
2015 and 47-50% by 2050.
Figure 46: Freight transport activity in the Baseline and the policy scenarios (cumulative
growth rates for 2015-2030 and 2015-2050)
Source: PRIMES-TREMOVE transport model (E3Modelling)
Note: Excluding international maritime.
5.2.2 Technology development projections by transport mode
5.2.2.1 Road transport
1088. CO2 emissions standards for vehicles play a key role in emissions reductions,
energy consumption and uptake of powertrain technologies. Intensification of their
stringency has an important impact on the penetration of zero- and low-emission
vehicles and on GHG emission reductions by 2030. They are instrumental in
further reducing emissions and energy consumption in the period post-2030
leading to a faster penetration of zero-emission vehicles. The uptake of renewable
and low carbon fuels such as biofuels, biomethane and e-fuels (enabled by their use
in internal combustion engines), carbon pricing and the improvements in the
transport system efficiency, enabled by digitalisation and greater use of more
sustainable transport modes, also play an important role in reducing road transport
CO2 emissions.
1089. It is important to note that amongst the three main pollutants of road transport
(CO2, noise and air pollutants), reduction of CO2 emissions imply air pollutants
reductions as well, thus constituting an additional benefit. This is not the case for
noise, that need specific other technological solutions to be implemented together
with the CO2 emissions standards. Zero-emission vehicles can still emit the same
noise levels as traditional combustion engine ones.
1090. For passenger cars, the evolution of the vehicle stock by type of drivetrain
technology in 2030 and 2050 is shown in Figure 47. The share of battery electric
cars in vehicles stock is projected to go up to 11-14% in the policy scenarios (e.g.
32 million vehicles in the MIX scenario). The share of low and zero emission cars
(including battery electric, fuel cells and plug-in hybrids) would increase from 16%

249
in 2030 in BSL to up to 20% in the policy scenarios, driven by the assumed
tightening of the vehicle standards supported by the deployment of the recharging
infrastructure for electric vehicles and refuelling infrastructure for fuel cells616
.
Figure 47: Shares in the total cars stock by type of drivetrain technology in 2030 and 2050
Source: PRIMES-TREMOVE transport model (E3Modelling)
1091. These shares will increase rapidly post 2030 thanks to the fleet renewal (vehicle
standards apply to new vehicles, therefore there is a delay between their
introduction and the powertrain changes in the stock of vehicles), driving down
GHG emissions from road transport even more steeply than in the period up to
2030. For example, in the REG scenario the share of zero and low emissions cars
(ZLEV) is projected at 47% by 2035, out of which 33% zero emission cars (ZEV).
In the CPRICE scenario the shares of ZLEV and ZEV by 2035 would be 33% and
23%, respectively. This compares with 27% ZLEV and 17% ZEV projected in the
baseline. This shows that the impact of CO2 emissions standards set for 2030
would be very significant, albeit with a time delay.
1092. By 2050, almost all cars (between 88-99% of the vehicle stock) need to be low
or zero emission in order for the climate neutrality target to be attainable. Large
scale deployment of recharging infrastructure for electric vehicles and refuelling
infrastructure for fuel cells would be needed to support these developments, as well
as sustainable batteries. In the REG scenario, ZEV are projected to represent 99%
of the fleet, due to strong vehicle efficiency policies. On the other hand, with
existing policies and targets, as in BSL, ZLEV are projected to reach 54% of the
stock in 2050, but fossil ICEs remain common in the fleet. This shows that
intensification of the existing CO2 emission standards is necessary.
1093. For vans, the penetration of zero emission vehicles in the fleet in 2030 is
projected to go up from 7% in BSL to up to 8% in the policy scenarios, while the
share of ZLEV would increase from 11% in BSL to up to 14% in the policy
scenarios. Similarly to cars, these developments would need to be driven by tighter
vehicle efficiency standards supported by the deployment of recharging and
refuelling infrastructure, as well as sustainable batteries. In the long run, the share
of ZLEV would range from 87% in CPRICE to 97% in REG, while ZEV would
represent between 75% and 93% in the same scenarios. Similar considerations as
for the cars segment applies to the vans, including the need to intensify the existing
616 The impacts of promotion and industrial deployment of proof clean technologies, the reorganisation, streamlining and modernisation of supply chains and production capacity are not specifically quantified here.
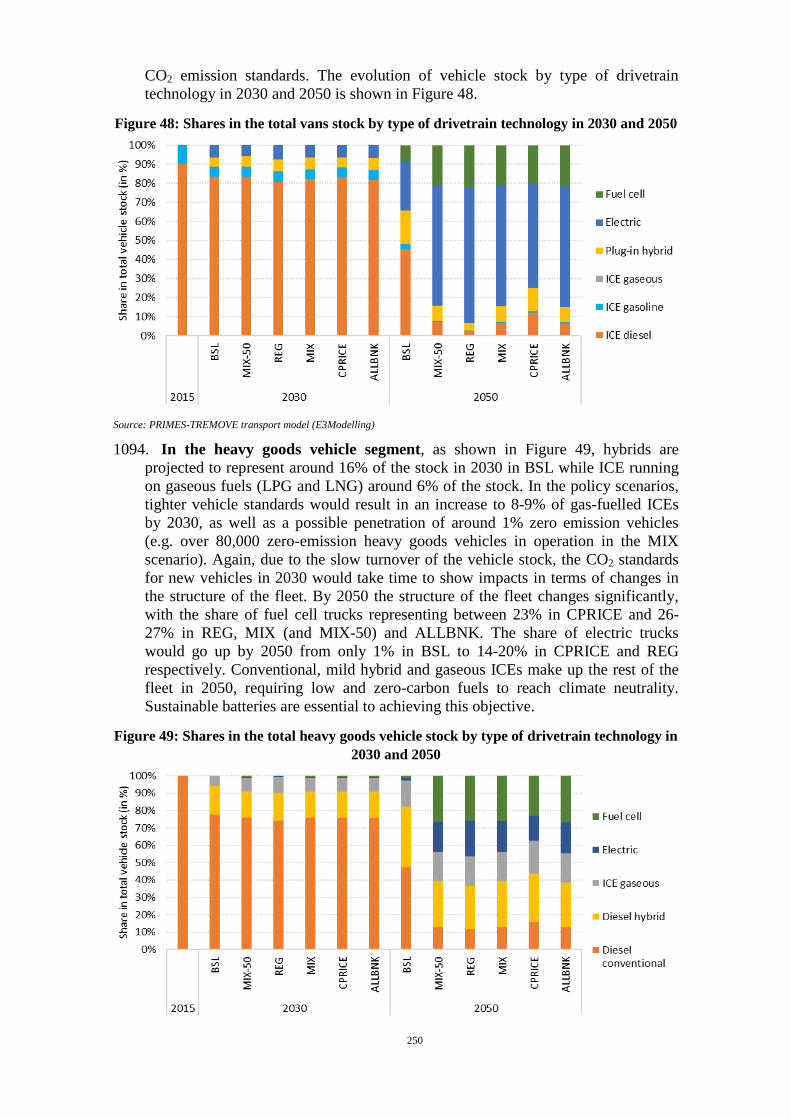
250
CO2 emission standards. The evolution of vehicle stock by type of drivetrain
technology in 2030 and 2050 is shown in Figure 48.
Figure 48: Shares in the total vans stock by type of drivetrain technology in 2030 and 2050
Source: PRIMES-TREMOVE transport model (E3Modelling)
1094. In the heavy goods vehicle segment, as shown in Figure 49, hybrids are
projected to represent around 16% of the stock in 2030 in BSL while ICE running
on gaseous fuels (LPG and LNG) around 6% of the stock. In the policy scenarios,
tighter vehicle standards would result in an increase to 8-9% of gas-fuelled ICEs
by 2030, as well as a possible penetration of around 1% zero emission vehicles
(e.g. over 80,000 zero-emission heavy goods vehicles in operation in the MIX
scenario). Again, due to the slow turnover of the vehicle stock, the CO2 standards
for new vehicles in 2030 would take time to show impacts in terms of changes in
the structure of the fleet. By 2050 the structure of the fleet changes significantly,
with the share of fuel cell trucks representing between 23% in CPRICE and 26-
27% in REG, MIX (and MIX-50) and ALLBNK. The share of electric trucks
would go up by 2050 from only 1% in BSL to 14-20% in CPRICE and REG
respectively. Conventional, mild hybrid and gaseous ICEs make up the rest of the
fleet in 2050, requiring low and zero-carbon fuels to reach climate neutrality.
Sustainable batteries are essential to achieving this objective.
Figure 49: Shares in the total heavy goods vehicle stock by type of drivetrain technology in
2030 and 2050

251
Source: PRIMES-TREMOVE transport model (E3Modelling)
1095. For buses, the uptake of zero emission vehicles in the fleet in 2030 is projected
to go up from 8% in BSL to 17-22% in the policy scenarios, due to the assumed
extension of the CO2 emission standards to this vehicle segment supported by the
deployment of recharging infrastructure. The highest uptake is projected in the
REG scenario. By 2050, 92 to 98% of the fleet would be electric in the policy
scenarios. The evolution of vehicle stock by type of drivetrain technology in 2030
and 2050 is shown in Figure 50. While buses are mostly used in the urban
environment where electrification is a viable option, coaches travel longer
distances and face similar limitations to those faced by heavy goods vehicles. For
coaches, the outcome is more similar to that for heavy goods vehicles, although
fuel cells gain more significant market shares.
Figure 50: Shares in the buses vehicle stock by type of drivetrain technology in 2030 and
2050
Source: PRIMES-TREMOVE transport model (E3Modelling)
1096. Overall for the road transport sector, renewable and low carbon fuels are
projected to represent 10-11% of the fuel mix by 2030 and 94 to 98% by 2050. In
the long run (by 2050), electricity would represent 30 to 42% of the energy use in
road transport, while hydrogen would provide an additional 31 to 40%. Biofuels
and biomethane are projected to contribute a lower share (6 to 15%), while e-fuels
would represent 10 to 17% of the energy mix. The highest uptake of electricity and
hydrogen would take place in the REG scenario (42 and 40%, respectively) driven
by the stringent CO2 standards for vehicles, accompanied by the large scale
deployment of recharging and refuelling infrastructure.
5.2.2.2 Rail
1097. For rail, all scenarios show electrification as the main option. In BSL scenario,
around 89% of the rolling stock used for passenger rail is projected to be electric
by 2050, and 79% for freight rail. This requires significant efforts, supported by the
assumed completion of the core TEN-T network by 2030 and of the comprehensive
TEN-T network by 2050. In the policy scenarios, by 2050 electric rolling stock
would represent around 94-95% for passenger rail and 88-89% for freight rail; rail
infrastructure would need to be largely electrified by 2050 to support such
significant changes. Hydrogen powertrains would additionally contribute around
1% of the rolling stock used for passenger rail and around 2% for freight rail in the

252
REG, MIX (and MIX-50) and ALLBNK. This is a viable option for rail sections
that are difficult to electrify.
5.2.2.3 Aviation
1098. Currently, air transport relies entirely on petroleum products. The contribution
of liquid biofuels is marginal, at less than 0.1% of air transport energy use. In the
Baseline scenario, liquid biofuels (i.e. bio-kerosene) are projected to represent
around 0.2% of the energy demand in air transport by 2030 and close to 3% by
2050.
Figure 51: Aviation fuels mix in the Baseline and policy scenarios in 2030 and 2050
Source: PRIMES-TREMOVE transport model (E3Modelling)
1099. Liquid biofuels and e-liquids represent the main alternatives for reducing the
carbon intensity of air transport fuels, with the required energy density to provide
for longer distance flights. In the policy scenarios, driven by fuel policies including
ReFuelEU aviation initiative, renewable and low carbon fuels are projected to
represent 3 to 8% of the energy use in 2030 and 63 to 68% in 2050. The highest
uptake in 2030 is projected in REG and ALLBNK scenarios and the lowest in the
MIX-50, with MIX scenario falling in between at 5%. The largest part of
renewable and low carbon fuels by 2030 would be provided by liquid biofuels,
with e-fuels representing between 0.7% and 2% of the energy use. E-fuels are
however projected to contribute a more significant share by 2050, providing up to
35% of the energy use in air transport. Despite the significant uptake of liquid
biofuels and e-liquids in the policy scenarios, 32 to 37% of the aviation fuels
would still remain fossil fuel based by 2050.
1100. Electric aircraft only materialise in very small numbers in the policy scenarios
by 2050. However, there are some developments on full electrification of aviation
ongoing, while Airbus, Rolls-Royce and Siemens are developing a hybrid-electric
demonstration aircraft. Hybridisation can significantly increase aircraft efficiency,
for example by modifying the aircraft design to reduce the overall weight, thus
reducing fuel consumption.

253
5.2.2.4 Inland waterways and national maritime
1101. Inland waterways and national maritime are represented together in modelling.
This is due to the fact that a split of energy statistics between the two is not
currently available. In the Baseline scenario, a large share of the vessels fleet
(88%) is projected to be powered by liquid fuels by 2050. LNG vessels would
represent around 12% of the fleet by 2050, driven by CEF funding and the
assumed availability of LNG refuelling infrastructure, plus the Sulphur Directive,
regulating air pollution deriving from sulphur content in marine fuels, that is also
relevant for national maritime.
1102. In the policy scenarios, energy efficiency improvements would provide a
significant contribution in decreasing greenhouse gas emissions. Energy intensity
would go down by 36-38% during 2005-2030 (45-49% decrease for 2005-2050).
The highest improvements are projected in the REG scenario, driven by a
combination of carbon pricing, technical and operational measures (e.g. engine
optimisation, hull design, speed optimisation, capacity utilisation, voyage
optimisation, etc.) and higher electrification of the fleet.
Figure 52: Inland waterways and national maritime fuels mix in the Baseline and policy
scenarios in 2030 and 2050
Source: PRIMES-TREMOVE transport model (E3Modelling)
1103. Electric vessels would represent 11 to 18% of the vessels fleet in 2050 with the
highest share in the REG scenario and the lowest in CPRICE scenario while fuel
cell vessels are projected at around 6% of the fleet. Propulsion systems powered by
liquid fuels would maintain a dominant role by 2050 (between 59% in REG to 67%
in CPRICE), followed by those powered by gaseous fuels (15-16%). However, the
carbon intensity of both liquid and gaseous fuels would decrease significantly
relative to the Baseline.
1104. Renewable and low carbon fuels would represent 8 to 13% of the fuel mix by
2030 and 85-90% by 2050, driven by fuel policies including FuelEU maritime
initiative and supported by the deployment of refuelling infrastructure. While
liquid biofuels provide the largest share by 2030, by 2050 e-liquids would
represent 37 to 42% of the energy use in inland waterways and national maritime,
followed by liquid biofuels (30-38%) and decarbonised gases (9-10%). Electricity
and hydrogen contribute together 9 to 13% of the fuel mix by 2050.

254
5.2.2.5 International maritime transport
1105. In the Baseline scenario, international maritime transport is projected to be
dominated by the use of fossil fuels. Natural gas would provide around 17% of
energy demand by 2050 driven by the SOx and NOx requirements of Annex VI to
the MARPOL Convention of the IMO (as well as by the Sulphur Directive in the
EU, transposing IMO rules and promoting as well other low sulphur sustainable
alternative fuels) and the assumed availability of refuelling infrastructure for LNG.
Heavy fuel oil and marine diesel oil would provide the rest of the fuel use.
1106. In the policy scenarios, renewable and low carbon fuels are projected at 5.5 to
13.5% of the fuel mix by 2030, with 5.5% in the less ambitious MIX-50 scenario,
7.5% in the MIX and 13.5% in ALLBNK that assumes an extended scope of GHG
reductions covering all aviation and maritime. By 2050 they would represent 86-
88% of the energy use in international maritime. The uptake of renewable and low
carbon fuels is driven by fuel policies including FuelEU maritime initiative and
supported by the deployment of refuelling infrastructure.
Figure 53: International maritime fuels mix in the Baseline and policy scenarios in 2030
and 2050
Source: PRIMES-TREMOVE transport model (E3Modelling)
1107. Liquid biofuels would represent 39-40% of the fuel mix by 2050, while e-liquids
would contribution up to 20%. Low carbon gases (bio-LNG and e-gas) are
projected to represent 20 to 22% of the fuel mix and hydrogen another 7-8%.
1108. The share of marine diesel oil and heavy fuel oil is projected to reduce
significantly over time. As a result, the CO2 intensity (expressed in tons of CO2 per
tonne-kilometre) is projected to go down between 13% in the less ambitious MIX-
50 scenario (15% in the MIX) and 21% in ALLBNK by 2030 relative to 2015. By
2050, CO2 intensity is projected to decrease by 89-91%.
1109. Energy efficiency, measured as tons of oil equivalent per million tonnes-
kilometres, is projected to provide significant contribution to the achievement of
emissions reductions in all policy scenarios (15-18% improvements over 2015-
2050, equivalent to 42-43% improvements over 2005-2050) driven by a
combination of carbon pricing, technical and operational measures.

255
5.2.3 Energy demand and fuel mix projections
1110. Total energy use in transport (including international aviation and maritime) is
projected to decrease in all scenarios and this in the context of growing activity
thus showing progress in terms of energy efficiency: by 3% in the Baseline
scenario during 2015-2030 and 4-6% in the policy scenarios (13% reduction by
2050 in the Baseline and 35-40% in the policy scenarios). Final energy
consumption (excluding international aviation and maritime) would reduce at
faster pace: by 31% between 2015 and 2030 in the Baseline and 32-33% in the
policy scenarios (45% by 2050 in the Baseline and 64-70% in the policy
scenarios).
Figure 54: Change in total energy use in transport617
and in the final energy
consumption618
in 2030 and 2050 compared to 2015
Source: PRIMES-TREMOVE transport model (E3Modelling)
1111. The higher energy savings in terms of final energy demand are due to road
transport and are driven by the assumed tightening of the vehicle standards, carbon
pricing and policies that improve the functioning of the transport system and lead
to greater use of sustainable transport modes, enabled by digitalisation and
supported by the TEN-T infrastructure. Road transport currently represents over
70% of the total energy use in transport and over 90% of the final energy demand.
Its share in total energy use is however projected to remain significant by 2050 in
all scenarios (above 45%) despite the significant energy savings that would be
achieved by the sector.
1112. REG achieves the highest savings relative to the Baseline in terms of total
energy use and final energy consumption, due to higher intensification of vehicle
standards assumed in this scenario relative to MIX, further measures related to
intelligent transport systems, digitalisation, connectivity and automation of
transport, incentives for sustainable urban transport, pricing measures and energy
taxation but also greater use of sustainable transport modes. By 2050, around 70%
of the total energy savings relative to the Baseline are projected to take place in
passenger transport.
1113. Alternative fuels619
including renewable and low carbon fuels are projected to
increase in all policy scenarios relative to the Baseline. In CPRICE scenario the
617 Including international aviation and maritime. 618 According to Eurostat methodology, final energy consumption in transport excludes international aviation and maritime.

256
share of alternative fuels would go up to 13.5% by 2030, driven by carbon pricing
and policy measures towards reducing emissions in aviation and maritime.
Biofuels and biomethane would represent 6.4% in CPRICE by 2030. The share of
biofuels and biomethane increases further in MIX and REG scenarios by 2030
(6.6% and 6.9% of transport energy demand, respectively) thanks to dedicated fuel
policies, including for aviation and maritime. Overall, total alternative fuels are
projected at around 14% of the transport fuel mix in MIX and 15.1% in REG by
2030620
. E-fuels would represent around 0.2% of the transport energy demand in
CPRICE and MIX and 0.4% in REG, driven by fuel obligations for aviation and
maritime. The share of alternative fuels would go up to 15.5% in ALLBNK, driven
by higher ambition policies focussed in particular on aviation and maritime fuels in
this scenario, and higher carbon pricing. The share of e-fuels would also be slightly
higher at around 0.6% by 2030 in ALLBNK. In MIX-50, the share of alternative
fuels is projected to be lower at around 13.2%.
Figure 55: Share of alternative fuels in transport (including international aviation and
maritime) in 2030
Source: PRIMES-TREMOVE transport model (E3Modelling)
1114. The share of renewable energy in transport621
is projected to significantly
increase by 2030 driven by the assumed fuel policies leading to the uptake of
advanced biofuels and electric vehicles. The share of renewables would reach 20%
in MIX-50 and between 22% in CPRICE to 26% in REG and ALLBNK. The MIX
scenario falls between CPRICE and REG and projects a share of renewable energy
in transport of 24% by 2030.
619 According to the Directive 2014/94/EU, ‘alternative fuels’ refer to fuels or power sources which serve, at least partly, as a substitute for fossil oil sources in the energy supply to transport and which have the potential to contribute to its decarbonisation and
enhance the environmental performance of the transport sector. They include, inter alia: electricity, hydrogen, biofuels, synthetic
and paraffinic fuels, natural gas, including biomethane, in gaseous form (compressed natural gas (CNG)) and liquefied form
(liquefied natural gas (LNG)), and liquefied petroleum gas (LPG). 620 Not accounting for multipliers. 621 According to Articles 25-27 of Directive 2018/2001/EC (revised RED) where specific caps and multipliers apply for different renewable fuels.

257
Figure 56: Share of renewable energy in transport in 2030
Source: PRIMES-TREMOVE transport model (E3Modelling)
1115. By 2050, the large majority of fossil fuels is projected to be replaced by
renewable and low carbon fuels in all policy scenarios, in order to reach climate
neutrality. Fossil fuels would only represent 13-14% of the fuel mix, with oil
products being primarily used in sectors such as aviation and maritime. Electricity
use is projected at 19-23% of the total energy use in transport, mainly driven by the
electrification of road transport, while hydrogen would provide around 18-20% of
the fuel mix. Liquid biofuels and biomethane would contribute 24-27% of the total
energy use in transport and e-fuels an additional 21-23%. The projected evolution
of total energy use in transport by fuel type is provided in Figure 57.
Figure 57: Transport fuel mix (including international aviation and maritime)
Source: PRIMES-TREMOVE transport model (E3Modelling)
5.2.4 GHG emissions from transport
1116. Total tank to wheel CO2 emissions from transport (excluding international
maritime)622
are projected to decline by 10% in Baseline by 2030 compared to
622 Emissions from transport are reported on a tank to wheel basis, in line with the Impact assessment accompanying the Commission Communication “Stepping up Europe’s 2030 climate ambition - Investing in a climate-neutral future for the benefit of

258
2015 (14% reduction relative to 2005). In the policy scenarios they would reduce
between 13% (in CPRICE and MIX-50) to 16% (in REG and ALLBNK) compared
to 2015. This is equivalent to 16% to 19% decrease relative to 2005. As shown in
Figure 58, the largest contribution to this decline is due to the increased fuel
efficiency of cars, as well as vans. Intensification of the CO2 emission standards
for vehicles in 2030 has a very important impact already for emission reduction by
2030, while also bringing significant co-benefits for air pollutant emissions. This
will be instrumental to further reduce emissions and energy consumption in the
period post-2030, when the effects will be stronger as a result of the fleet renewal.
Greater use more sustainable transport modes would also provide a significant
contribution.
Figure 58: Tank to wheel CO2 emissions from transport (excluding international
maritime) in 2030 in the Baseline and policy scenarios
Source: PRIMES-TREMOVE transport model (E3Modelling)
1117. CO2 emissions from passenger transport would decline by 13% in the Baseline
scenario by 2030 compared to 2015, and between 15% in CPRICE and 18% in
REG and ALLBNK scenarios. Vehicle efficiency standards for passenger cars that
drive the increased use of electric vehicles, together with carbon pricing,
infrastructure charging and taxation, as well as measures that support multimodal
mobility, enabled by digitalisation, and support for sustainable urban transport all
contribute towards the emissions reductions in passenger transport. CO2 emissions
from freight transport are projected to go down by 3% in the Baseline by 2030
compared to 2015, and decline between 8% in CPRICE, MIX, REG and 9% in
ALLBNK, driven by vehicle efficiency standards and initiatives to increase and
better manage the capacity of railways and waterborne transport, incentives for
intermodal transport and gradual internalisation of external costs (“smart” pricing).
In MIX-50, by 2030, CO2 emissions from passenger transport would decline by
14%, whereas CO2 emissions from freight transport would go down by 7%, both
compared to 2015.
1118. Aviation has been one of the fastest growing sectors in terms of CO2 emissions
over the past decades. Total CO2 emissions from flights departing from the EU-27
and domestic flights within the territory of a Member State of the EU-27 grew
our people”. It should be noted that the modelling assigns tank to wheel emissions of zero to biofuels, electricity and e-fuels, to
avoid double counting. These emissions are accounted in other sectors and reported in the Impact assessment accompanying the
Commission Communication “Stepping up Europe’s 2030 climate ambition - Investing in a climate-neutral future for the benefit of our people”. Emissions from transport on a well to wheel basis are reported below.
259
from around 112 million tonnes (Mt) in 2005 to 120 Mt in 2015, equal to a 7.6%
increase. For the future, significant further growth is projected: 25% by 2030
relative to 2015 in the Baseline scenario, equivalent to 34% growth over the 2005-
2030 period. The decline in cars and vans emissions over the 2015-2030 horizon is
however projected to overcompensate the increase in aviation emissions. In the
policy scenarios, CO2 emissions reductions between 5 Mt (MIX-50) and 14 Mt
(ALLBNK) are projected for air transport in 2030 relative to the Baseline due to
fuel policies, carbon pricing, and other technical and operational measures,
including action on clean airports. The decrease in CO2 emissions relative to the
Baseline is much higher in 2050, between 99 Mt (MIX-50, REG, MIX, ALLBNK)
and 106 Mt (CPRICE), driven by the large penetration of biofuels and e-fuels and
carbon pricing. Nevertheless, lower emissions reductions are projected in aviation
relative to road transport sector, where more technological options are available.
1119. By 2050, CO2 emissions from transport (excluding international maritime) are
projected to go down by over 90% compared to 2015 (90-91% reduction relative to
1990) in order to meet the climate neutrality targets. This implies a very rapid
decline in emissions post-2030. The emissions reduction profile is strongly
impacted by the type of policy combinations developed for 2030. The size of these
reductions are consistent with the impact of stringent vehicle standards, as well as
of renewable fuels and policies driving improvements in the efficiency of the
transport system and greater use of more sustainable transport modes, making full
use of the benefits of transport digitalisation and connected, cooperative and
automated mobility.
1120. The emissions from international maritime sector are projected to go up in the
Baseline, by 18% by 2030 relative to 2015, as explained in section 2.2. In the
policy scenarios they would reduce by 13-19% relative to the Baseline in 2030 (12-
13% decrease in REG, MIX, CPRICE and 19% in ALLBNK), driven by carbon
pricing, fuel policies and other technical and operational measures. Relative to
2015, emissions from international maritime would however still be 3-4% higher in
the REG, MIX and CPRICE scenarios and 4% lower in ALLBNK by 2030. Steep
emissions reductions are projected post-2030 in all scenarios, driven by the large
scale uptake of renewable and low carbon fuels, in order to reach climate
neutrality. By 2050, emissions from international maritime would be 84-86% lower
relative to 2015, equivalent to 80-82% reduction compared to 1990.
1121. Transport emissions including intra-EU aviation and intra-EU maritime are
projected to decline by 13% in Baseline by 2030 compared to 2015 (18% reduction
relative to 2005). In the policy scenarios they would reduce between 16% (in
CPRICE and MIX) to 18% (in REG and ALLBNK) by 2030 relative to 2015, with
MIX-50 showing 15% decrease. This is equivalent to 20% to 23% emissions
reductions relative to 2005, with the highest decrease projected in REG and
ALLBNK. By 2050, the policy scenarios show 95-96% emissions reductions
relative to 2015.
1122. On well to wheel basis623
, CO2 emissions (excluding international maritime) go
down by 10% in the Baseline scenario by 2030 and by 32% by 2050 relative to
2015. In the policy scenarios, higher emissions reductions are projected (13 to 16%
reduction by 2030 and over 90% reduction by 2050) due to the reduction in the
energy use in transport and higher uptake of renewables and low carbon fuels
623 Only EU emissions for the domestic production are covered by the quantified well to wheel emissions. Worldwide upstream
emissions related to the sourcing of fossil fuels are not reflected in this modelling exercise. For biofuels, well to wheel CO2 emission factors reflect the energy use in the production process. Indirect land-use change (ILUC) emissions are not included.

260
driven by policies, but also due to the power generation sector that is set to achieve
decarbonisation by 2050. The power generation mix plays an important role in this
time perspective considering the large scale electrification of transport.
Figure 59: Well to wheel CO2 emissions from transport (excluding international maritime)
in 2030 and 2050 in the Baseline and policy scenarios
Source: PRIMES-TREMOVE transport model (E3Modelling)
1123. The well to wake emissions from international maritime sector624
are projected
to reduce by 8-10% relative to the Baseline (10% decrease in MIX, CPRICE and
ALLBNK) in 2030, driven by carbon pricing, fuel policies and other technical and
operational measures. Relative to 2015, emissions from international maritime
would however still be 5-8% higher by 2030. Steep emissions reductions are
projected post-2030 in all scenarios, driven by the large scale uptake of renewable
and low carbon fuels and the decarbonisation of the power generation mix. By
2050, emissions from international maritime on the well to wake basis would be
70-72% lower relative to 2015.
5.2.5 Impacts on noise, NOx and particulate matter emissions
1124. Transport related activities have significant impacts on air, water and land
pollution and noise levels. All policy scenarios show co-benefits on the
environment focusing on air pollution.
1125. NOx emissions (excluding international shipping) are projected to decrease in
all policy scenarios, by 54-55% by 2030 relative to 2015. The highest NOx
emissions reductions by 2030 would take place in REG and ALLBUNK, driven by
the uptake of zero and low emissions vehicles, policies that lead to greater use of
sustainable transport modes, and incentives for sustainable urban transport. The
reduction in NOx emissions would be more significant by 2050 (84-85% decrease
relative to 2015) due to the large scale uptake of zero emission vehicles. The
decline in particulate matter (PM2.5) would be less pronounced by 2030 at 50-
52% but PM2.5 emissions would go down by around 88-89% by 2050. The highest
emissions reductions are achieved again in the REG scenario due to the large
uptake of zero emission vehicles.
624 Only EU emissions for the domestic production are covered by the quantified well to wheel emissions. Worldwide upstream
emissions related to the sourcing of fossil fuels are not reflected in this modelling exercise. For biofuels, well to wheel CO2 emission factors reflect the energy use in the production process. Indirect land-use change (ILUC) emissions are not included.

261
Figure 60: Change in NOx emissions and PM2.5 emissions in 2030 and 2050 compared to
2015
Source: PRIMES-TREMOVE transport model (E3Modelling)
1126. Noise in the majority of the real situations depends, for road vehicles, on the
tyres and road surface, for railway on the quality of wheels and rails, and for
aircrafts on the engines and aircraft frame. Electric vehicles are sometimes
associated with ‘no noise’ pollution which is however not the case. As a result,
very little benefits are foreseen by a renewal of the fleet or changes in traffic. By
2030 an increase of noise is foreseen for all modes relative to 2015 due to the
increase of the number of vehicles. By 2050 the increased number of electric
vehicles could lead, for road only, to a limited benefit in terms of noise reduction.
The impacts are limited unless other specific measures are adopted that benefit the
fleet renewal and at the same time target noise, as well as CO2 and air pollutant
emissions reductions.
5.2.6 Impacts on external costs of transport
1127. External costs associated to air pollutants625
would decrease in all policy
scenarios, by about 61-63% by 2030 (93-94% reduction by 2050) compared to
2015 due to lower energy use in transport, driven by improvements in energy
efficiency, and increased use of renewable and low carbon fuels, as well as
sustainable batteries. REG scenario shows the highest reduction (63% by 2030 and
94% by 2050), while MIX also shows significant decrease (62% by 2030 and 93%
by 2050). The estimation of external costs associated to air pollutants draws on the
methodology of the 2019 Handbook on the external costs of transport626
. The
impacts on health, crop losses, material and building damage and biodiversity loss
(due to acidification of soil and to the eutrophication of ecosystems) are also
included. Soil and water pollution due to heavy metals, organic toxic substances,
waste and ballast water and oil spills is however not covered.
Figure 61: Change in external costs of air pollution in 2030 and 2050 compared to 2015
Source: PRIMES-TREMOVE transport model (E3Modelling)
1128. All policy scenarios are projected to result in somewhat lower congestion costs
relative to the Baseline scenario. This is due to measures related to “smart pricing”
625 Including NOx, PM2.5 and SOx emissions; excluding international maritime transport. 626 Source : https://op.europa.eu/en/publication-detail/-/publication/9781f65f-8448-11ea-bf12-01aa75ed71a1

262
and multimodal mobility, enabled by digitalisation. The impacts are more visible
by 2050 despite the fact that the measures are assumed to be implemented post-
2020. MIX, REG and ALLBNK show similar reductions in congestion costs
relative to the Baseline scenario by 2050, while CPRICE (mainly driven by carbon
pricing) shows more limited impact.
Figure 62: Change in external costs of congestion and accidents in 2030 and 2050
compared to 2015
Source: PRIMES-TREMOVE transport model (E3Modelling)
1129. Policies promoting greater use of more sustainable transport modes and
multimodality as well as the large scale deployment of intelligent transport systems
are projected to result in significant co-benefits in terms of improved road safety
and reduction of fatalities and injuries. For 2015-2030, the policy scenarios result
in a decrease of external costs of accidents by 15 to 17%. The highest impacts are
projected in the REG, MIX and ALLBNK scenarios. By 2050 external costs of
accidents would go down by 21 to 27% relative to 2015.
1130. Additional welfare effects in the transport sector result particularly from greater
use of active modes such as walking and cycling, and public transport or a
combination of these options. The most significant co-benefits of greater use of
active modes of transport arise from increased physical activity and leads to lower
levels of non-communicable diseases (such as overweight/obesity), various mental
diseases and pre-mature mortality. Associated co-benefits would include reduced
congestion, noise and air pollution.627
In addition to health benefits, there are social
and economic gains of active mobility.
5.2.7 Investments
1131. The average annual investments in vehicles, rolling stock, vessels, airplanes and
alternative fuels infrastructure deployment are estimated at around EUR 492 billion
during the 2011-2020 period628
. Under existing policies (in the baseline scenario),
627 COMBI-Project (2015). Literature review on social welfare impacts of energy efficiency improvement actions, Deliverable 5.1,
available at: http://combi-project.eu. The project receives funding from the EU's Horizon 2020 programme (No 649724). 628 EC (2020), Impact assessment accompanying the Commission Communication “Stepping up Europe’s 2030 climate ambition -
Investing in a climate-neutral future for the benefit of our people”, SWD(2020) 176 final. For transport the projections represent the
entire cost of transport fleet purchased and alternative fuels infrastructure deployed unlike for other sectors, notably buildings where only energy-related costs are projected.

263
these investments are projected to go up to EUR 611 billion per year during 2021-
2030 and to EUR 697 billion per year during 2031-2050629
.
Figure 63: Average annual investments in vehicles, rolling stock, vessels, airplanes and
alternative fuels infrastructure deployment in the Baseline and policy scenarios
Source: PRIMES-TREMOVE transport model (E3Modelling)
1132. Focusing on 2021-2030 period, reducing GHG emissions from transport, to
contribute towards the at least 55% economy-wide emission reduction target by
2030, will require significant additional investments. This in turn will reduce fuel
expenses and dependence on fossil fuel imports, and improve the EU's energy
security. In the policy scenarios, the total investments in the transport fleet and
alternative fuels infrastructure deployment are projected at EUR 608 to EUR 623
billion per year on average for 2021-2030 and EUR 726 to EUR 736 billion per
year for 2031-2050. Importantly, the existing policies lead to the bulk of these
investments. The additional investments needed to contribute towards the at least
55% economy-wide emission reduction target by 2030 are estimated at EUR 10 to
EUR 12 billion per year for 2021-2030 relative to developments under existing
policies (i.e. the Baseline scenario).
1133. Comparing 2021-2030 to 2011-2020 period, average annual investments in the
fleet and alternative fuels infrastructure deployment will need to be EUR 116 to
EUR 131 billion higher. The lowest investments relative to the previous decade are
projected in the CPRICE scenario (EUR 116 billion per year), due to the carbon
pricing that results in lower road transport activity relative to the Baseline. In the
other scenarios, the average annual investments range between EUR 128 and EUR
131 billion per year. The highest investments would be needed in the MIX and
REG scenarios (EUR 130 and EUR 131 billion, respectively) due to the vehicle
efficiency standards and large scale deployment of alternative fuels infrastructure,
as well as measures that support multimodal mobility, enabled by digitalisation,
and support for sustainable urban transport.
629 This does not include related investments for revamping of production lines, development of future-proof clean technologies, of new entrant technologies etc., which are usually accounted for in the manufacturing sector investments.

264
Figure 64: Additional annual average investments for 2021-2030 under existing policies
and to achieve higher GHG emissions reductions - in billions euros (2015)
Source: PRIMES-TREMOVE transport model (E3Modelling)
1134. In addition, investments in infrastructure will be needed to support multimodal
mobility, digitalisation and sustainable urban transport. Current investments related
to the core TEN-T network and other interurban and urban infrastructure are
estimated at 135 billion euros per year. For 2021-2030, the green transformation
investment gap for infrastructure is estimated at EUR 100 billion per year630
(EUR
30 billion for the core TEN-T network, EUR 35 billion for other interurban
infrastructure and EUR 35 billion for urban transport infrastructure)631
.
1135. Overall, during 2021-2030632
, the additional investment needs for sustainable
and smart mobility cover both vehicles, rolling stock, vessels, airplanes, alternative
fuels infrastructure deployment (EUR 116 to EUR 131 billion per year) and green
investments to deliver on Europe’s wider transport infrastructure (EUR 100 billion
per year).
5.2.8 Social impacts
1136. In the Baseline scenario, households’ annual transport related expenditures are
projected at EUR 1,028 billion per year on average for 2021-2030 or 12.8% of
households’ income. In the policy scenarios, the households’ annual transport
related expenditures over the 2021-2030 period would go up by 1.3 to 2.1%
relative to the Baseline, the highest increase taking place in ALLBNK scenario.
The increase in the share of total transport costs in households' expenditures would
be limited, to 0.2-0.3 percentage points relative to the Baseline.
630 This includes rapid transit systems, port and airports, multi-modal logistics, safety, traffic management. 631 SWD(2020) 98 final. The estimates are based on TEN-T Work Plans, the European Investment Bank, and also use the
assumption that the baseline investments needed in transport infrastructure is in the range of 1% of GDP. Given that EU Member
States have faced a reduction in the fiscal space since the financial crisis of 2012, there is an accumulated backlog of transport
investment in the past decade. These figures are based on the assumption that this investment gap needs to be covered in the future. 632 Compared to the previous decade (2011-2020).

265
Figure 65: Households’ annual transport related expenditures in the Baseline and policy
scenarios - in billions euros (2015)
Households' expenditures on
transport - annual average for 2021-
2030 (% change compared to the
Baseline)
BSL
(bil.
EUR
'2015)
MIX-50 REG MIX CPRICE ALLBNK
Total transport costs 1,028 1.6% 1.6% 1.7% 1.3% 2.1%
Share of total transport costs in
households' expenditures (in %) 12.8% 13.0% 13.0% 13.0% 13.0% 13.1% Source: PRIMES-TREMOVE transport model (E3Modelling)
1137. As possible negative outcome of the transition, households in the lower income
deciles might have to compensate higher expenditures related to transport by
reducing consumption of other goods. Several policies are possible to mitigate
negative distributional effects. Energy taxation plays an important role in how the
burden is shared among citizens. Progressive tax rates would have the effect of
reducing the costs for vulnerable consumers. Furthermore, a tax shift from labour
to carbon could take the form of targeted labour tax cuts for low-income earners’.
1138. The impact assessment accompanying the Commission Communication
“Stepping up Europe’s 2030 climate ambition - Investing in a climate-neutral
future for the benefit of our people” has shown that the increased climate ambition
would have limited impacts on the employment in the transport sector. The impacts
of transport-related measures will depend on the design of the specific measures
that will be subject to future impact assessments.
1139. Employment impacts are assessed under a number of scenarios and variants.
Given the critical role of economic interactions with the rest of the world, two
levels of climate ambition are considered for countries or blocks outside the EU:
(1) implementation of Nationally Determined Contributions under the Paris
Agreement (“fragmented action”); and (2) mitigation efforts that are compatible
with the achievement of the 1.5°C target (“global action”). In addition, variants are
assessed regarding the way carbon revenues are used by governments. JRC-GEM-
E3 model was used to assess the impacts at sectoral level. For this purpose,
exogenous assumptions from the MIX scenario were used in the JRC-GEM-E3
model.
1140. In the absence of complementary policies (recycling of carbon revenues to lower
labour taxes), employment in the air transport sector is projected to be around 3.7%
below the Baseline scenario in 2030 under the 55% “fragmented action” scenario.
The impacts on land and waterborne transport would be more limited (0.5%
decrease for land transport and 0.3% reduction for waterborne transport relative to
the Baseline scenario in 2030). Complementary policies could nevertheless avoid
negative impacts on employment altogether (i.e. for land transport) or generate a
small positive impact relative to the Baseline (0.5% increase in the air transport
employment in 2030 and 0.2% in waterborne transport).
Figure 66: Impacts of at least 55% GHG emissions reduction on transport sector
employment (% change relative to the Baseline scenario)
Employment relative to the Baseline scenario in 2030 with diversified policy setup
Fragmented action Global action
Air transport -3.7 | 0.5 -3.8 | 1.5
Land transport -0.5 | 0.0 -0.7 | 0.1
Waterborne transport -0.3 | 0.2 -4.1 | -2.9

266
Source: JRC-GEM-E3 model
1141. The expected significant shifts in the sectoral composition of employment and
the associated job changes that workers will have to go through633
over the next
decade under higher climate ambition would generate challenges for the labour
market and the labour force. The nature of the challenges relate to the ability of
workers to move from a job in a given sector and occupation to another sector and
potentially another occupation requiring different skills. They also relate to the
ability of the labour market to match labour demand and labour supply, and the
ability of the education and vocational training systems to train or re-train workers,
which would call for significant investment in human capital. Regional shifts in
employment, e.g. with employment creation and employment destruction
potentially occurring in different locations, create additional challenges when
labour mobility across regions and/or countries is constrained.
5.2.9 Sensitivity analysis on the COVID-19 pandemic
1142. As explained in section 2.3, the impact of the COVID-19 pandemic is uncertain.
For this analysis an evaluation was made how reduced economic growth and
moderate additional structural change may impact the transport sector. While the
short-term projections point to a sharp drop in GDP in 2020 followed by
significant recovery in 2021, the pandemics is projected in this setting to result in a
permanent loss of GDP of around 2.3% by 2030 compared to the pre-COVID
projections, as explained in section 2.3.
1143. The potential impacts of the COVID-19 pandemic on the EU-27 transport
activity and CO2 emissions by 2030 and 2050 with existing policies have been
explained in section 2.3. They showed that despite the sharp decline in CO2
emissions during the COVID-19 pandemic, existing policies fall well short in
delivering the transport contribution to CO2 reductions under the European Green
Deal and the 2030 Climate Target Plan. In the COVID-Baseline emissions from
transport excluding international maritime would only be 2.2% lower by 2030 and
3.4% lower by 2050 relative to the pre-COVID Baseline.
1144. As explained in section 5.1 a variant of the MIX scenario has been also
developed, that includes reduced economic growth assumptions due to the
COVID-19 pandemic and corresponding reduced activity in the EU-27 transport
sector. The COVID-MIX variant achieves a reduction of 55% in the economy-wide
GHG emissions and is similar to the MIX scenario in terms of policy setup,
including for the transport sector.
1145. A comparison of the key indicators in the MIX and COVID-MIX scenarios is
provided in the table below. It shows that the lower transport activity relative to the
pre-COVID Baseline results in slightly higher reductions in energy use and
transport CO2 emissions in the COVID-MIX variant relative to the MIX scenario.
By 2030, however, the change in the share of renewable energy in transport is very
limited compared to the MIX scenario. This is also the case with respect to the
technology mix by transport mode.
Figure 67: Comparison of key indicators in the MIX scenario and COVID-MIX variant
2030
MIX COVID-MIX
633 For example transitioning from a job in a sector experiencing net losses in employment to a new job in another sector, or transitioning within sector but to a different job more aligned with the needs of the green economy.

267
CO2 emissions reductions from transport (excluding
international maritime) compared to 2015 (%) -14% -16%
CO2 emissions reductions from transport including intra-EU
aviation and maritime compared to 2015 (%) -16% -18%
RES transport share (%) 23.7% 23.5%
Total energy savings in transport compared to 2015 (%) -5% -8%
Final energy savings in transport compared to 2015 (%) -12% -14%
MIX COVID-MIX
Average annual investments during the 2021-2030 period in bn
EUR'15 622 607
Additional average annual investments during 2021-2030
compared to the 2011-2020 period in bn EUR'15 130 132
Source: PRIMES-TREMOVE transport model (E3Modelling)
Note: The figures above relate to investments in vehicles, rolling stock, vessels, airplanes and alternative fuels infrastructure
deployment
1146. A critical conclusion that can be drawn from the COVID sensitivity analysis
relates to the additional investment needs, which are not affected to any significant
extent. The COVID-MIX variant still requires a similar additional amount of
investments in vehicles, rolling stock, vessels, airplanes and alternative fuels
infrastructure deployment during 2021-2030 compared to the 2011-2020 period.
1147. The current economic recession and the limited negative impact on GDP
projected by 2030 therefore do not reduce the need to invest strongly in the coming
decade to support the sustainable and smart mobility. It must be noted also that
significant behavioural changes relating to consumption habits and mobility
patterns were not assumed to take place to a significant extent under the COVID
variants. As indicated in the in-depth analysis in support of the Communication “A
clean planet for all”, however, such behavioural changes may reduce investment
needs if they are adopted widely and to a significant extent.
1148. While investments in the necessary green capital goods improve overall resource
efficiency and stimulate more sustainable long-term growth, triggering them at the
necessary scale in the current circumstance will be even more challenging than
before the crisis and will require additional incentives coupled with a supportive
regulatory environment. The scale and focus of the recovery packages currently
being put in place at the level of the EU and individual Member States therefore
will be of importance for the achievement of sustainable and smart mobility that
contributes towards a higher level of climate ambition by 2030, and socially and
environmentally sustainable growth, in a context where private investors may face
challenging financial situations.

268
6 ANNEX I - ANALYTICAL METHODS
6.1.1 Description of the modelling tools used
6.1.1.1 Main modelling suite
The main model suite used to produce the scenarios presented in this Staff Working
Document has a successful record of use in the Commission's energy and climate policy
assessments. In particular, it has been used for the Commission’s proposal for Long
Term Strategy634
as well as for the 2020 and 2030 EU’s climate and energy policy
framework.
The PRIMES and PRIMES-TREMOVE models are the core elements of the modelling
framework for energy, transport and CO2 emission projections. The GAINS model is
used for non-CO2 emission projections and the GLOBIOM-G4M models for projections
of LULUCF emissions and removals and the CAPRI model is used for agricultural
activity projections.
The model suite thus covers:
The entire energy system (energy demand, supply, prices and investments to the
future) and all GHG emissions and removals from the EU economy.
Time horizon: 1990 to 2070 (5-year time steps).
Geography: individually all EU Member States, EU candidate countries and, where
relevant Norway, Switzerland and Bosnia and Herzegovina.
Impacts: on the energy system (PRIMES and its satellite model on biomass),
transport (PRIMES-TREMOVE), agriculture (CAPRI), forestry and land use
(GLOBIOM-G4M), atmospheric dispersion, health and ecosystems (acidification,
eutrophication) (GAINS); macro-economy with multiple sectors, employment and
social welfare (GEM-E3).
The modelling suite was recently updated in the context of the in-depth analysis of the
proposal for an EU Long Term Strategy, with addition of a new buildings module,
improved representation of electricity sector, more granular representation of hydrogen
and synthetic fuels produced with electricity (“e-fuels”), as well updated interlinkages of
the models to improve land use and non-CO2 modelling.
The models are linked with each other in such a way to ensure consistency in the
building of scenarios (Figure 68). These inter-linkages are necessary to provide the core
of the analysis, which are interdependent energy, transport and GHG emissions trends.
634 https://ec.europa.eu/clima/sites/clima/files/docs/pages/com_2018_733_analysis_in_support_en_0.pdf

269
Figure 68: Interlinkages between models
6.1.1.1.1 Energy: the PRIMES model
The PRIMES model (Price-Induced Market Equilibrium System)635
is a large scale
applied energy system model that provides detailed projections of energy demand,
supply, prices and investment to the future, covering the entire energy system including
emissions. The distinctive feature of PRIMES is the combination of behavioural
modelling (following a micro-economic foundation) with engineering aspects, covering
all energy sectors and markets. The model has a detailed representation of policy
instruments related to energy markets and climate , including market drivers, standards,
and targets by sector or overall. It simulates the EU Emissions Trading System in its
current form. It handles multiple policy objectives, such as GHG emissions reductions,
energy efficiency, and renewable energy targets, and provides pan-European simulation
of internal markets for electricity and gas.
PRIMES offer the possibility of handling market distortions, barriers to rational
decisions, behaviours and market coordination issues and it has full accounting of costs
(CAPEX and OPEX) and investment on infrastructure needs. The model covers the
horizon up to 2070 in 5-year interval periods and includes all Member States of the EU
individually, as well as neighbouring and candidate countries. PRIMES is designed to
analyse complex interactions within the energy system in a multiple agent – multiple
markets framework.
Decisions by agents are formulated based on microeconomic foundation (utility
maximization, cost minimization and market equilibrium) embedding engineering
constraints and explicit representation of technologies and vintages; optionally perfect or
imperfect foresight for the modelling of investment in all sectors.
PRIMES allows simulating long-term transformations/transitions and includes non-linear
formulation of potentials by type (resources, sites, acceptability etc.) and technology
learning. Figure 69 shows a schematic representation of the PRIMES model.
635 More information and model documentation: https://e3modelling.com/modelling-tools/primes/

270
Figure 69: Schematic representation of the PRIMES model
It includes a detailed numerical model on biomass supply, namely PRIMES-Biomass,
which simulates the economics of supply of biomass and waste for energy purposes
through a network of current and future processes. The model transforms biomass (or
waste) feedstock, thus primary feedstock or residues, into bio-energy commodities which
undergo further transformation in the energy system e.g. as input into power plants,
heating boilers or fuels for transportation. The model calculates the inputs in terms of
primary feedstock of biomass and waste to satisfy a given demand for bio-energy
commodities and provides quantification of the required production capacity (for plants
transforming feedstock into bioenergy commodities). Furthermore, all the costs resulting
from the production of bioenergy commodities and the resulting prices are quantified.
The PRIMES-Biomass model is a key link of communication between the energy system
projections obtained by the core PRIMES energy system model and the projections on
agriculture, forestry and non-CO2 emissions provided by other modelling tools
participating in the scenario modelling suite (CAPRI, GLOBIOM/G4M, GAINS).
PRIMES is a private model maintained by E3Modelling636
, originally developed in the
context of a series of research programmes co-financed by the European Commission.
The model has been successfully peer-reviewed, most recently in 2011637
; team members
regularly participate in international conferences and publish in scientific peer-reviewed
journals.
636 E3Modelling (https://e3modelling.com/) is a private consulting, established as a spin-off inheriting staff, knowledge and software-
modelling innovation of the laboratory E3MLab from the National Technical University of Athens (NTUA). 637 SEC(2011)1569 : https://ec.europa.eu/energy/sites/ener/files/documents/sec_2011_1569_2.pdf

271
Sources for data inputs
A summary of database sources, in the current version of PRIMES, is provided below:
• Eurostat and EEA: Energy Balance sheets, Energy prices (complemented by other
sources, such IEA), macroeconomic and sectoral activity data (PRIMES sectors
correspond to NACE 3-digit classification), population data and projections,
physical activity data (complemented by other sources), CHP surveys, CO2 emission
factors (sectoral and reference approaches) and EU ETS registry for allocating
emissions between ETS and non ETS
• Technology databases: ODYSSEE-MURE638
, ICARUS, Eco-design, VGB (power
technology costs), TECHPOL – supply sector technologies, NEMS model
database639
, IPPC BAT Technologies640
• Power Plant Inventory: ESAP SA and PLATTS
• RES capacities, potential and availability: JRC ENSPRESO641
, JRC EMHIRES642
,
RES ninja643
, ECN, DLR and Observer, IRENA
• Network infrastructure: ENTSOE, GIE, other operators
• Other databases: District heating surveys (e.g. from COGEN), buildings and houses
statistics and surveys (various sources, including ENTRANZE project644
, INSPIRE
archive, BPIE645
), JRC-IDEES646
, update to the EU Building stock Observatory647
6.1.1.1.2 Transport: the PRIMES-TREMOVE model
The PRIMES-TREMOVE transport model projects the evolution of demand for
passengers and freight transport, by transport mode, and transport vehicle/technology,
following a formulation based on microeconomic foundation of decisions of multiple
actors. Operation, investment and emission costs, various policy measures, utility factors
and congestion are among the drivers that influence the projections of the model. The
projections of activity, equipment (fleet), usage of equipment, energy consumption and
emissions (and other externalities) constitute the set of model outputs.
The PRIMES-TREMOVE transport model can therefore provide the quantitative analysis
for the transport sector in the EU, candidate and neighbouring countries covering
activity, equipment, energy and emissions. The model accounts for each country
separately which means that the detailed long-term outlooks are available both for each
country and in aggregate forms (e.g. EU level).
In the transport field, PRIMES-TREMOVE is suitable for modelling soft measures (e.g.
eco-driving, labelling); economic measures (e.g. subsidies and taxes on fuels, vehicles,
emissions; ETS for transport when linked with PRIMES; pricing of congestion and other
externalities such as air pollution; accidents and noise; measures supporting R&D);
regulatory measures (e.g. CO2 emission performance standards for new passenger and
heavy duty vehicles; EURO standards on road transport vehicles; technology standards
for non-road transport technologies, deployment of Intelligent Transport Systems) and
638 https://www.odyssee-mure.eu/ 639 Source: https://www.eia.gov/outlooks/aeo/info_nems_archive.php 640 Source: https://eippcb.jrc.ec.europa.eu/reference/ 641 Source: https://data.jrc.ec.europa.eu/collection/id-00138 642 Source: https://data.jrc.ec.europa.eu/dataset/jrc-emhires-wind-generation-time-series 643 Source: https://www.renewables.ninja/ 644 Source: https://www.entranze.eu/ 645Source: http://bpie.eu/ 646 Source: https://ec.europa.eu/jrc/en/potencia/jrc-idees 647 Source: https://ec.europa.eu/energy/en/eubuildings

272
infrastructure policies for alternative fuels (e.g. deployment of refuelling/recharging
infrastructure for electricity, hydrogen, LNG, CNG). Used as a module that contributes to
the PRIMES model energy system model, PRIMES-TREMOVE can show how policies
and trends in the field of transport contribute to economy-wide trends in energy use and
emissions. Using data disaggregated per Member State, the model can show
differentiated trends across Member States.
The PRIMES-TREMOVE has been developed and is maintained by E3Modelling, based
on, but extending features of, the open source TREMOVE model developed by the
TREMOVE648
modelling community. Part of the model (e.g. the utility nested tree) was
built following the TREMOVE model.649
Other parts, like the component on fuel
consumption and emissions, follow the COPERT model.
Data inputs
The main data sources for inputs to the PRIMES-TREMOVE model, such as for activity
and energy consumption, comes from EUROSTAT database and from the Statistical
Pocketbook "EU transport in figures650
. Excise taxes are derived from DG TAXUD
excise duty tables. Other data comes from different sources such as research projects
(e.g. TRACCS project) and reports.
In the context of this exercise, the PRIMES-TREMOVE transport model is calibrated to
2005, 2010 and 2015 historical data.
6.1.1.1.3 Non-CO2 GHG emissions and air pollution: GAINS
The GAINS (Greenhouse gas and Air Pollution Information and Simulation) model is an
integrated assessment model of air pollutant and greenhouse gas emissions and their
interactions. GAINS brings together data on economic development, the structure,
control potential and costs of emission sources and the formation and dispersion of
pollutants in the atmosphere.
In addition to the projection and mitigation of greenhouse gas emissions at detailed sub-
sectorial level, GAINS assesses air pollution impacts on human health from fine
particulate matter and ground-level ozone, vegetation damage caused by ground-level
ozone, the acidification of terrestrial and aquatic ecosystems and excess nitrogen
deposition of soils.
Model uses include the projection of non-CO2 GHG emissions and air pollutant
emissions for EU Reference scenario and policy scenarios, calibrated to UNFCCC
emission data as historical data source. This allows for an assessment, per Member State,
of the (technical) options and emission potential for non-CO2 emissions. Health and
environmental co-benefits of climate and energy policies such as energy efficiency can
also be assessed.
648 Source: https://www.tmleuven.be/en/navigation/TREMOVE 649 Several model enhancements were made compared to the standard TREMOVE model, as for example: for the number of vintages
(allowing representation of the choice of second-hand cars); for the technology categories which include vehicle types using
electricity from the grid and fuel cells. The model also incorporates additional fuel types, such as biofuels (when they differ from standard fossil fuel technologies), LPG, LNG, hydrogen and e-fuels. In addition, representation of infrastructure for refuelling and
recharging are among the model refinements, influencing fuel choices. A major model enhancement concerns the inclusion of
heterogeneity in the distance of stylised trips; the model considers that the trip distances follow a distribution function with different
distances and frequencies. The inclusion of heterogeneity was found to be of significant influence in the choice of vehicle-fuels
especially for vehicles-fuels with range limitations. 650 Source: https://ec.europa.eu/transport/facts-fundings/statistics_en

273
The GAINS model is accessible for expert users through a model interface651
and has
been developed and is maintained by the International Institute of Applied Systems
Analysis652
. The underlying algorithms are described in publicly available literature.
GAINS and its predecessor RAINS have been peer reviewed multiple times, in 2004,
2009 and 2011.
Sources for data inputs
The GAINS model assess emissions to air for given externally produced activity data
scenarios. For Europe, GAINS uses macroeconomic and energy sector scenarios from the
PRIMES model, for agricultural sector activity data GAINS adopts historical data from
EUROSTAT and aligns these with future projections from the CAPRI model. Projections
for waste generation, organic content of wastewater and consumption of F-gases are
projected in GAINS in consistency with macroeconomic and population scenarios from
PRIMES. For global scenarios, GAINS uses macroeconomic and energy sector
projections from IEA World Energy Outlook scenarios and agricultural sector projections
from FAO. All other input data to GAINS, i.e., sector- and technology- specific emission
factors and cost parameters, are taken from literature and referenced in the
documentation.
6.1.1.1.4 Forestry and land-use: GLOBIOM-G4M
The Global Biosphere Management Model (GLOBIOM) is a global recursive dynamic
partial equilibrium model integrating the agricultural, bioenergy and forestry sectors with
the aim to provide policy analysis on global issues concerning land use competition
between the major land-based production sectors. Agricultural and forestry production as
well as bioenergy production are modelled in a detailed way accounting for about 20
globally most important crops, a range of livestock production activities, forestry
commodities as well as different energy transformation pathways.
GLOBIOM covers 50 world regions / countries, including the EU-27 Member States.
Model uses include the projection of emissions from land use, land use change and
forestry (LULUCF) for EU Reference scenario and policy scenarios. For the forestry
sector, emissions and removals are projected by the Global Forestry Model (G4M), a
geographically explicit agent-based model that assesses afforestation, deforestation and
forest management decisions. GLOBIOM-G4M is also used in the LULUCF impact
assessment to assess the options (afforestation, deforestation, forest management, and
cropland and grassland management) and costs of enhancing the LULUCF sink for each
Member State.
The GLOBIOM-G4M has been developed and is maintained by the International
Institute of Applied Systems Analysis653
.
Sources for data inputs
The main market data sources for GLOBIOM-EU are EUROSTAT and FAOSTAT,
which provide data at the national level and which are spatially allocated using data from
the SPAM model654
. Crop management systems are parameterised based on simulations
from the biophysical process-based crop model EPIC. The livestock production system
651 Source: http://gains.iiasa.ac.at/models/ 652 Source: http://www.iiasa.ac.at/ 653 Source : http://www.iiasa.ac.at/ 654 See You, L., Wood, S. (2006). An Entropy Approach to Spatial Disaggregation of Agricultural Production, Agricultural Systems
90, 329–47 and http://mapspam.info/ .

274
parameterization relies on the dataset by Herrero et al655
. Further datasets are
incorporated, coming from the scientific literature and other research projects.
GLOBIOM is calibrated to FAOSTAT data for the year 2000 (average 1998 - 2002) and
runs recursively dynamic in 10-year time-steps. In the context of this exercise, baseline
trends of agricultural commodities are aligned with FAOSTAT data for 2010/2020 and
broadly with AGLINK-COSIMO trends for main agricultural commodities in the EU
until 2030.
The main data sources for G4M are CORINE, Forest Europe (MCPFE, 2015)656
,
countries’ submissions to UNFCCC and KP, FAO Forest Resource Assessments, and
national forest inventory reports. Afforestation and deforestation trends in G4M are
calibrated to historical data for the period 2000-2013.
6.1.1.1.5 Agriculture: CAPRI
CAPRI is a global multi-country agricultural sector model, supporting decision making
related to the Common Agricultural Policy and environmental policy and therefore with
far greater detail for Europe than for other world regions. It is maintained and developed
in a network of public and private agencies including the European Commission (JRC),
Universities (Bonn University, Swedish University of Agricultural Sciences, Universidad
Politécnica de Madrid), research agencies (Thünen Institute), and private agencies
(EuroCARE, in charge for use in this modelling cluster); the model takes inputs from
GEM-E3, PRIMES and PRIMES Biomass model, provides outputs to GAINS, and
exchanges information with GLOBIOM on livestock, crops, and forestry as well as
LULUCF effects.
The CAPRI model provides the agricultural outlook for the Reference Scenario, in
particular on livestock and fertilisers use, further it provides the impacts on the
agricultural sector from changed biofuel demand. Depending on need it may also be used
to run climate mitigation scenarios, diet shift scenarios or CAP scenarios.
Cross checks are undertaken ex-ante and ex-post to ensure consistency with GLOBIOM
on overlapping variables, in particular for the crop sector.
Sources for data inputs
The main data source for CAPRI is EUROSTAT. This concerns data on production,
market balances, land use, animal herds, prices, and sectoral income. EUROSTAT data
are complemented with sources for specific topics (like CAP payments or biofuel
production). For Western Balkan regions a database matching with the EUROSTAT
inputs for CAPRI has been compiled based on national data. For non-European regions
the key data source is FAOSTAT, which also serves as a fall back option in case of
missing EUROSTAT data. The database compilation is a modelling exercise on its own
because usually several sources are available for the same or related items and their
reconciliation involves the optimisation to reproduce the hard data as good as possible
while maintaining all technical constraints like adding up conditions.
In the context of this exercise, the CAPRI model uses historical data series at least up to
2017, and the first simulation years (2010 and 2015) are calibrated to reproduce the
historical data as good as possible.
655 Herrero, M., Havlík, P., et al. (2013). Biomass Use, Production, Feed Efficiencies, and Greenhouse Gas Emissions from Global
Livestock Systems, Proceedings of the National Academy of Sciences 110, 20888–93. 656 MCPFE (2015). Forest Europe, 2015: State of Europe's Forests 2015. Madrid, Ministerial Conference on the Protection of Forests
in Europe: 314.

275
6.1.1.1.6 Global climate and energy policy context: POLES-JRC
The POLES-JRC model used to provide the global energy and climate policy context is
operated by the JRC657
.
POLES is a global energy model that covers the entire energy balance, from final energy
demand, transformation and power production to primary supply and trade of energy
commodities across countries and regions. It allows assessing the contribution to future
energy needs of the various energy types (fossil fuels, nuclear, renewables) and energy
vectors.
In addition, it calculates the evolution of GHG emissions: endogenously for the energy-
industry sectors and through linkage with specialist models for GHG emissions from
land-use and agriculture (GLOBIOM-G4M), and air pollution (GAINS).
The model includes a detailed geographical representation, with a total of 39 non-EU-27
regions and countries covering the world; that includes all G20 countries, detailed OECD
and the main non-OECD economies. It operates on a yearly time step, allowing
integrating recent developments.
The POLES model is well suited to evaluate the evolution of energy demand in the main
world economies and international markets as well as to assess international climate and
energy policies. The POLES model has participated in numerous research projects, and
has contributed to peer-reviewed analyses published widely658
.
Sources for data inputs659
Data on socio-economic activity come from the UN and IIASA (population), the World
Bank, IMF and OECD (GDP and economic activity), sectoral databases on industrial and
mobility activity.
The main energy data sources of the POLES-JRC model are IEA, Enerdata, BGR,
USGS, Platts, BP, NEA.
Fossil energy production costs are based on Rystad, complemented by information from
the literature. Renewables potentials are based on NREL, DLR, and GLOBIOM,
complemented by information from the literature. The technology costs and learning
curves are based on extensive literature review, including but not limited to IEA and the
SETIS database.
Emissions data are for UNFCCC, EDGAR, National inventories, FAO.
POLES-JRC work developed for this exercise is based on JRC work for the Global
Energy and Climate Outlook (GECO) report series660
. The POLES-JRC model was
updated with historical data up to 2018 (population, GDP, energy balances) and 2019
(international energy prices, GDP projections). It includes country policies that have
been legislated as of June 2019 or correspond to objectives found in the UNFCCC’s
Nationally Determined Contributions.
6.1.1.1.7 GEM-E3
GEM-E3 is a large scale multi-sectoral CGE model that features a series of modelling
innovations that enables its departure from the constraining framework of
657 https://ec.europa.eu/jrc/en/poles 658 https://ec.europa.eu/jrc/en/poles/publications 659 For non-EU. Sources for the EU are consistent with those of the PRIMES energy model. 660 https://ec.europa.eu/jrc/en/geco

276
standard/textbook CGE models (where all resources are assumed to be fully used) to a
modelling system that features a more realistic representation of the complex economic
system. The key innovations of the model relate to the explicit representation of the
financial sector, semi-endogenous dynamics based on R&D induced technical progress
and knowledge spillovers, the representation of multiple households, unemployment in
the labour market and endogenous formation of labour skills. The model has detailed
sectoral and geographical coverage, with 51 products and 46 countries/regions (global
coverage) and it is calibrated to a wide range of datasets comprising of IO tables,
financial accounting matrices, institutional transactions, energy balances, GHG
inventories, bilateral trade matrices, investment matrices and household budget surveys.
All countries in the model are linked through endogenous bilateral trade transactions
identifying origin and destination. Particular focus is placed on the representation of the
energy system where specialised bottom-up modules of the power generation, buildings
and transport sectors have been developed. The model is recursive dynamic coupled with
a forward-looking expectations mechanism and produces projections of the economic
and energy systems until 2100 in increasing time steps: annual from 2015 to 2030 and
then five-year period until 2100. Figure 70 shows a schematic representation of the
GEM-E3 model.
Figure 70: Schematic representation of the GEM-E3 model
The model has been used to provide the sectoral economic assumptions as input for this
modelling exercise. GEM-E3 produces consistent sectorial value added and trade
projections matching GDP and population projections by country taken from other
sources such as the ECFIN t+10 projections for economic activity, the Europop and the
Ageing Report. The model can also be used to assess the impacts of the energy and
climate targets on macroeconomic aggregates such as GDP and employment.
The most important results, provided by GEM-E3 are: Full Input-Output tables for each
country/region identified in the model, dynamic projections in constant values and
deflators of national accounts by country, employment by economic activity and by skill
and unemployment rates, capital, interest rates and investment by country and sector,
private and public consumption, bilateral trade flows, consumption matrices by product
and investment matrix by ownership branch, GHG emissions by country, sector and fuel

277
and detailed energy system projections (energy demand by sector and fuel, power
generation mix, deployment of transport technologies, energy efficiency improvements).
This analysis has used mainly the European Commission’s JRC version
JRC-GEM-E3661
, complemented by the GEM-E3-FIT version operated by
E3Modelling662
. Detailed documentation is publicly available.
Sources663
for data inputs
• EUROSTAT, WIOD, EU-KLEMS and GTAP: Input Output tables, National
Accounts, Employment, Institutional Transactions, Labour force and Participation
rates, Bilateral Trade, GHG emissions, Capital stock, taxes, Household consumption
by purpose
• National Statistical Offices: Consumption Matrices
• ECB: Bonds, Treasury bills
• ILO: Employment, Unemployment rate
• World Bank: Infrastructure
• IMF and OECD: Interest rates, Inflation, Bonds, Treasury bills
6.1.2 Assumptions on technology, economics and energy prices
In order to reflect the fundamental socio-economic, technological and policy
developments, the Commission prepares periodically an EU Reference Scenario on
energy, transport and GHG emissions. The latest one dates from 2016664
and is currently
being revised. This update is not yet finalised and work is ongoing on Member States
details and the related consultations. Furthermore this work will also be updated to
incorporate the impacts of the COVID-19 pandemic.
The scenarios assessment as used in this Staff Working Document incorporate the latest
developments in the update of the Reference scenario, notably related to the socio-
economic assumptions, energy price projections and technological assumptions.
6.1.2.1 Economic assumptions
The modelling work is based on socio-economic assumptions describing the expected
evolution of the European society. Long-term projections on population dynamics and
economic activity form part of the input to the energy model and are used to estimate
final energy demand. Population projections from Eurostat665
are used to estimate the
evolution of the European population that is projected to change very little in total
number in the coming decades.
Pre-COVID economic assumptions
The pre-COVD socio-economic assumptions were prepared before the COVID pandemic
unfolded. The long-term evolution of economic activity was estimated from three
sources: DG ECFIN’s short term economic forecast, t+10 projections and the 2018
Aging Report projections elaborated by the European Commission. For the short-term
(2020-2021), the projections are based on actual growth forecast by the Directorate
General for Economic and Financial Affairs (Autumn Forecast 2019). Projections up to
661 Source: https://ec.europa.eu/jrc/en/gem-e3/model 662 Source: https://e3modelling.com/ 663 The data sources of energy statistics are the same as in the PRIMES model. 664 https://ec.europa.eu/energy/data-analysis/energy-modelling/eu-reference-scenario-2016_en 665 https://ec.europa.eu/eurostat/web/population-demography-migration-projections/population-projections-data

278
2029 use the associated t+10 work from DG ECFIN, which is based on projections of
potential output growth and a closure of any output gap in the medium term. The long-
term per capita GDP growth projections of the 2018 Ageing Report are used for the
period 2030-2070666
. Figure 71 shows the projected evolution of the EU GDP up to 2050.
Transport activity projections complement the socio-economic projections.
Figure 71: Projected EU GDP (2015 = 100)
These pre-COVID socio-economic assumptions were used as modelling inputs for all
scenario runs, except COVID-BSL and COVID-MIX.
Post-COVID assumptions
The COVID-19 pandemic upended economic projections made in preparation of this
analysis. In particular, the Commission’s Spring Economic Forecast 2020 projected that
the EU economy would contract by 7.4% in 2020 and pick up in 2021 with growth of
6.1%. Together with the associated revision of DG ECFIN’s t+10 projections, this
implies that real GDP in 2030 could be approximately 2.3% lower compared to the pre-
COVID estimates presented above, based on the Autumn Forecast 2019.
Beyond the update of the population and growth assumptions, an update of the
projections on the sectoral composition of GDP was also carried out. This aims to
integrate the potential medium- to long-term impacts of the COVID-19 pandemic on the
structure of the economy, even though this is clouded with uncertainty.
6.1.2.2 Energy prices assumptions
Alongside socio-economic projections, EU energy modelling requires projections of
international fuel prices. The projections of the POLES-JRC model – elaborated by the
Joint Research Centre in the context of the Global Energy and Climate Outlook 2019
(GECO 2019) – are used to obtain long-term estimates of the international fuel prices.
The projected evolution of fossil fuel prices is lower than estimates used by the European
Commission in the Reference 2016 Scenario. Among other factors, the development of
666 The 2018 Ageing Report: Economic and Budgetary Projections for the EU Member States (2016-2070):
https://ec.europa.eu/info/publications/economy-finance/2018-ageing-report-economic-and-budgetary-projections-eu-member-states-
2016-2070_en

279
unconventional oil and gas resources increased fossil fuel supply estimates for the
coming decade.
Figure 72 shows the international fuel prices that were used in the different “pre-
COVID” scenarios (BSL, MIX-50, REG, MIX, CPRICE, ALLBNK).
Figure 72: International fuel prices assumptions – non-COVID scenarios
in USD'15 per
boe 2000 '05 '10 '15 '20 '25 '30 '35 '40 '45 '50
Oil 38.4 65.4 86.7 52.3 58.0 73.2 86.9 93.9 100.8 110.4 125.5
Gas (NCV) 26.5 35.8 45.8 43.7 35.7 39.9 41.8 47.9 57.3 56.7 58.9
Coal 11.2 16.9 23.2 13.1 13.2 16.9 18.4 19.8 20.8 21.8 22.8
in EUR'15 per boe 2000 '05 '10 '15 '20 '25 '30 '35 '40 '45 '50
Oil 34.6 58.9 78.2 47.2 52.3 66.0 78.3 84.7 90.9 99.5 113.2
Gas (NCV) 23.4 31.7 40.6 38.7 31.6 35.4 37.0 42.4 50.7 50.2 52.1
Coal 9.9 15.0 20.6 11.6 11.7 14.9 16.3 17.5 18.4 19.3 20.1
Source: JRC, POLES-JRC model, derived from GECO 2019
In order to obtain robust results, international fuel price assumptions were compared to
the similar projections from several sources. Figure 73 shows the comparison between
projected oil prices in 2030 and estimates from selected studies by international
organizations: Rystad, World Bank, Energy Information Administration, International
Energy Agency. The price used in the EU Reference Scenario 2016667
is also reported for
comparison.
Figure 73: Oil price projections in 2030 according to various sources
Note: Rystad and World Bank estimates as of 2019
The COVID crisis has had a major impact on international fuel prices. In the months
following the first wave of outbreaks, a majority of countries across the world enacted
lockdowns, hence limiting transport of people and goods and changing work pattern.
This impacted energy demand with a historic shock only seen worse during the Spanish
667 https://ec.europa.eu/energy/data-analysis/energy-modelling/eu-reference-scenario-2016_en
020406080
100120140
WB Oil price Rystad Oilprice
IEO2019Reference
WEO2019StatedPolicies
ImpactAssessment
BSL
WEO2019Currentpolicies
EU REF 2016
WB Rystad EIA IEA COM IEA COM
USD
20
15
/ b
l

280
flu, the Great Depression and World War II.668
The demand decrease during the 2008
financial crisis came nowhere near the impact of COVID. The lost demand left an
oversupply leading to decreasing prices.
This impact hit oil first and foremost, being the main fuel for transport (culminating in
negative oil prices in one occurrence). Coal consumption also decreased sharply due to
lower electricity demand. In general, fossil fuels were most strongly affected. This effect
on prices compared to pre-COVID estimates is expected to be still felt up to 2030,
although this will depend on the recovery of global oil demand as well as on the
compliance with the OPEC+ existing and possible future deals669
to adjust supply.
Figure 74 shows the alternative assumptions retained to reflect the COVID impact on the
fuel prices in the two COVID scenarios analysed (COVID-BSL and COVID-MIX).
Figure 74: International fuel prices assumptions – COVID scenarios
in USD'15 per boe 2000 ‘05 ‘10 ‘15 ‘20 ‘25 ‘30 ‘35 ‘40 ‘45 ‘50
Oil 38.4 65.4 86.7 52.3 37.2 58.6 80.1 90.4 97.4 105.6 117.9
Gas (NCV) 26.5 35.8 45.8 43.7 22.2 31.5 40.9 44.9 52.6 57.0 57.8
Coal 11.2 16.9 23.2 13.1 10.1 13.9 17.6 19.1 20.3 21.3 22.3
in EUR'15 per boe 2000 2005 ‘10 ‘15 ‘20 ‘25 ‘30 ‘35 ‘40 ‘45 ‘50
Oil 34.6 58.9 78.2 47.2 33.5 52.8 72.2 81.5 87.8 95.2 106.3
Gas (NCV) 23.4 31.7 40.6 38.7 19.7 27.9 36.2 39.7 46.6 50.5 51.2
Coal 9.9 15.0 20.6 11.6 8.9 12.3 15.6 16.9 18.0 18.9 19.7
Source: Estimates, derived from JRC, POLES-JRC model, GECO 2019
6.1.2.3 Technology assumptions
Modelling scenarios on the evolution of the energy system is highly dependent on the
assumptions on the development of technologies - both in terms of performance and
costs. For the purpose of this modelling exercise, these assumptions have been updated
based on a rigorous literature review carried out by external consultants in collaboration
with the JRC670
.
Continuing the approach adopted in the long-term strategy in 2018, the Commission
consulted technology assumption with stakeholders in 2019. In particular, the technology
database of the main model suite (PRIMES, PRIMES-TREMOVE, GAINS, GLOBIOM,
and CAPRI) benefited from a dedicated consultation workshop held on 16th
May 2018
and a more recent one on 11th
November 2019. EU Member States representatives had
also the opportunity to comment on the costs elements during a workshop held on 25th
November 2019. The updated list of technology assumptions will be published together
with the upcoming Reference Scenario update.
6.1.3 Policies in the existing policies scenario (Baseline scenario)
In order to assess the trajectory that is entailed by the recent policies and objectives
adopted at EU level, a Baseline scenario was developed.
668 IEA, Global Energy Review 2020, June 2020 669 IEA, Oil Market Report, June 2020 and US EIA, July 2020. 670 JRC118275

281
It assumes that measures are taken either at EU or MS level in order to achieve the
energy and climate 2030 targets671
, as adopted by EU leaders on October 2014672
, further
refined on May 2018 with the agreement on the Effort Sharing Regulation and enhanced
on June 2018 with the agreement on the recast of Renewable Energy Directive and the
revised Energy Efficiency Directive.
In addition to the headline targets, some of the policies included in this baseline are:
The EU Emissions Trading System673
(EU ETS) covers 45% of EU GHG emissions,
notably from industry, the power sector and aviation. Emissions for the ensemble of
sectors under the system are capped to reduce by 43% by 2030 compared to 2005. The
baseline scenario additionally assumes that the Market Stability Reserve will ensure
that the ETS contributes to the achievement of the overall target cost-effectively. MSR
functioning is set to be reviewed674
in 2021 and every five years after to ensure its aim
of tackling structural supply-demand imbalances.
Aviation emissions are also covered by the EU ETS. The EU, however, decided in
2014 to limit the scope of the EU ETS to flights within the EEA until 2016 to support
the development of a global measure by the International Civil Aviation Organization
(ICAO).675
In light of the adoption of a Resolution by the 2016 ICAO Assembly on
the global measure, the EU has decided to maintain the geographic scope of the EU
ETS limited to intra-EEA flights from 2017 until the end of 2023.676
The EU ETS for
aviation will be subject to a new review in the light of the international developments
related to the operationalisation of CORSIA. The next review should consider how to
implement the global measure in Union law through a revision of the EU ETS
legislation. In the absence of a new amendment, the EU ETS would revert back to its
original full scope from 2024.
The Effort Sharing Regulation677
(ESR) sets binding annual reduction targets for
member states, with an aim to reduce emissions by 30% compared to 2005 by 2030.
The ESR targets are set according to national wealth and cost-effectiveness. The ESR
allows for flexibilities such as transfers between member states.
The Land Use, Land Use Change and Forestry Regulation678
(LULUCF regulation),
whereby accounted emissions should not exceed removals and that includes incentive
to improve land use practices, flexibility and trading, flexibility towards ESR.
CO2 emission standards for new cars and vans679
and for new trucks680
have been
defined, and will contribute towards reducing emissions from the road transport
sector.
The Fuel Quality Directive681
requires a reduction of the GHG intensity of transport
fuels by a minimum of 6% to be achieved by 2020.
671 The 2030 climate and energy framework did set three key targets for the year 2030: (a) at least 40% cuts in greenhouse gas emissions (from 1990 levels), (b) at least 27% share for renewable energy, and (c) at least 27% improvement in energy efficiency.
They built on the 2020 climate and energy package. 672 Conclusions of the European Council of 23 and 24 October 2014. 673 Directive 2003/87/EC 674 Decision (EU) 2015/1814 675 Regulation (EU) 421/2014 676 Regulation (EU) 2017/2392 677 Regulation (EU) 2018/842 678 Regulation (EU) 2018/841 679 Regulations (EU) 2019/631 680 Regulation (EU) 2019/1242 681 Directive 2009/30/EC

282
The revised Renewable Energy Directive682
entered into force in 2018. It establishes a
new binding renewable energy target for the EU for 2030 of at least 32%, with a
clause for a possible upwards revision by 2023.
The Energy Efficiency Directive was amended in 2018683
establishing a target of at
least 32.5% for 2030. This means in absolute terms, that EU energy consumption
should be no more than 1128 Mtoe of primary energy and no more than 846 Mtoe of
final energy.684
The Directive allows for a possible upward revision in the target in
2023.
The Energy Performance of Buildings Directive and its amendment in 2018685
aim to
achieve a highly energy efficient and decarbonised building stock and to create a
stable environment for investment decisions. It established an obligation for Member
States to present long-term renovation strategies, aiming at decarbonising the national
building stocks by 2050, with indicative milestones for 2030 and 2040.
The Ecodesign and Energy Labelling Directives establish a framework for a set of
regulations to improve the energy efficiency of different product categories. They help
eliminate the least performing products from the market, and support competitiveness
and harmonised standards throughout the internal market.
In the field of transport, besides the post-2020 CO2 standards for new light duty and
heavy duty vehicles, the Clean Vehicles Directive and the Directive on the
deployment of alternative fuels infrastructure contribute to the roll-out of recharging
infrastructure. Furthermore, the uptake of sustainable alternative fuels is supported by
the Renewables Energy Directive and Fuel Quality Directive. Improvements in
transport system efficiency (by making the most of digital technologies and smart
pricing and further encouraging multi-modal integration and shifts towards more
sustainable transport modes) are facilitated by e.g. the TEN-T Regulation supported
by CEF funding, the fourth Railway Package, the proposed revision of the
Eurovignette Directive, the Directive on Intelligent Transport Systems, the European
Rail Traffic Management System European deployment plan, the Regulation
establishing a framework for the provision of port services, and others.
For aviation, in addition to implementation of the EU Emission Trading Scheme, the
Baseline reflects the Union-wide air transport performance targets for the key
performance area of environment, Clean Sky, Single European Sky and SESAR, and
aircraft CO2 emissions standards, as part of the so-called “basket of measures” that
aim to reduce emissions from the sector.
For maritime shipping, in addition to emissions being monitored under the Regulation
on Monitoring, Reporting and Verification of Maritime Emissions686
, the Baseline
scenario reflects the Energy Efficiency Design Index (EEDI) and the Ship Energy
Efficiency Management Plan (SEEMP) adopted by the International Maritime
Organisation, as well as the Sulphur Directive. The Baseline also accounts for other
initiatives addressing air pollution from inland waterways vessels, as well as road
safety, and thus reducing the external costs of transport.
682 Directive 2018/2001/EU 683 Amendment 2018/2002 of Directive 2012/27/EU 684 This takes into account the withdrawal of the United Kingdom and the Commission decision for an equivalent target after EU law
no longer applies to the United Kingdom. 685 Directive 2010/31/EU and amendement 2018/844/EU 686 Regulation (EU) 2015/757

283
In addition, these policies will continue pushing further GHG emissions reduction, and
increasing energy savings and renewable energies deployment after 2030, either because
they do not have a "sunset clause" (notably ETS, and since recently, Article 7 in revised
EED), or because of the technological learning and cost reductions that they are expected
to induce. Moreover, most actions in the energy system have long-term impacts (e.g.
construction of well-insulated houses, efficient power plants or other types of
infrastructure). The baseline captures these dynamics, but it needs to be emphasised that
no intensification of policies post-2030 was assumed and no target for GHG emissions
reduction in 2050 was set concerning climate neutrality.
Moreover, BSL has been specifically built for the purpose of the development of long-
term decarbonisation scenarios. It does not reflect specific, short-term Member State
policies, and, in particular, no consultation with the Member States has taken place to
verify that current or updated policies are adequately represented, as currently being
included under the National Energy and Climate Plans (NECPs).
Beyond specific climate and energy policies, a range of other policies will definitely play
an important role in achieving reductions of GHG emissions of the EU economy.
First of all, some sectoral policies will affect directly the dynamics of GHG emission.
This is the case of transport and industrial policies for instance, which will affect notably
the way and the forms in which energy is consumed, and thus will modify associated
GHG emissions. Agricultural policy and waste policy will play an important role on
sectoral methane and nitrous oxide emissions, two powerful GHGes, and will also
contribute to the supply of renewable fuels to the energy sector, and thus to its capacity
to mitigate GHG (and notably CO2) emissions.
Second, other, more “horizontal”, policies are to play an indirect, but crucial, role in
shaping the capacity of the EU economy to deliver GHG reductions. Such policies are
often referred to as “enabling policies” and aim at ensuring a favourable environment for
the transformation. They relate to the steering of investments, technological
development, economic adaptation, and are critical to guarantee social inclusiveness.
This Commission has launched in 2020 a number of key initiatives that are relevant for
this assessment:
- the European Green Deal Investment Plan687
- the European Industrial Strategy688
- the Circular Economy Action Plan689
- the Farm to Fork Strategy690
- the EU Biodiversity Strategy for 2030691
These policies have not been considered in the baseline, but they will contribute to
achieving a higher climate target, and are thus reflected in the policy analysis.
A key element to play a role on the evolution by 2030 of GHG emissions in the EU is the
MFF692
for 2021-2027, which is being negotiated. A number of policies and funding
tools under this framework matter for the GHG profile, notably to steer investments
687 https://ec.europa.eu/commission/presscorner/detail/en/qanda_20_24 688 COM(2020) 102 final, 689 COM(2020) 98 final 690 COM(2020) 381 final 691 COM(2020) 380 final 692 In May 2020, the Commission has proposed a powerful, modern and revamped long-term EU budget boosted by Next Generation
EU - see COM(2020) 442 final

284
towards the climate objective, to accelerate research and development on clean solutions
with Horizon Europe693
or through the ambitious CAP strategic plans694
.
Finally, the Baseline scenario considers key national policies that are existing or reflected
in the national NECPs.
6.1.4 Policy scenarios
The following overview provides the scenario description used in the modelling suite covering all
sectors of the economy.
693 https://ec.europa.eu/info/horizon-europe-next-research-and-innovation-framework-programme_en 694 https://ec.europa.eu/info/food-farming-fisheries/key-policies/common-agricultural-policy/future-cap_en

285
Figure 75: Scenario assumptions description (scenarios developed with the PRIMES-GAINS-GLOBIOM modelling suite)
Scenario Baseline REG MIX / MIX-50 CPRICE ALLBNK
Brief description Achieving the current 2030
EU targets
No extension of ETS scope
to buildings and road
transport, but extension of
ETS to intra-EU maritime
navigation
Extension of ETS scope to
buildings, road transport
and intra-EU maritime
navigation but also
keeping road transport and
buildings in ESR
Extension of ETS scope to
buildings, road transport
and intra-EU maritime
navigation; buildings and
road transport are taken out
of the ESR
Most ambitious scenario
for GHG reductions
Achievement of EE 32.5%
target;
Achievement of 32% RES
target
High ambition increase of
EE and RES policies.
There is no carbon price
applied in buildings and
road transport
Medium/low ambition
increase of EE and RES
policies in non-ETS
because RES and EE
legislation is revised to
contribute to higher GHG
target.
Additionally, a carbon
price is also applied in
buildings and road
transport
Carbon pricing as the
principal instrument to
reduce CO2 emissions, no
intensification of EE or
RES policies, some
intensification of policies
related to transport CO2
Applies the GHG target on
a broader scope including
all international aviation
and international maritime
navigation
Target scope EU-27
Aviation Intra + Extra EU aviation
is included
Intra EU aviation and navigation included Intra + Extra EU aviation
and navigation included Maritime navigation
International Intra + Extra
EU maritime navigation
not included
Achieved reduction
(including net LULUCF
sink)
Around 55% At least 50% and
Around 55% Around 55% Around 55%
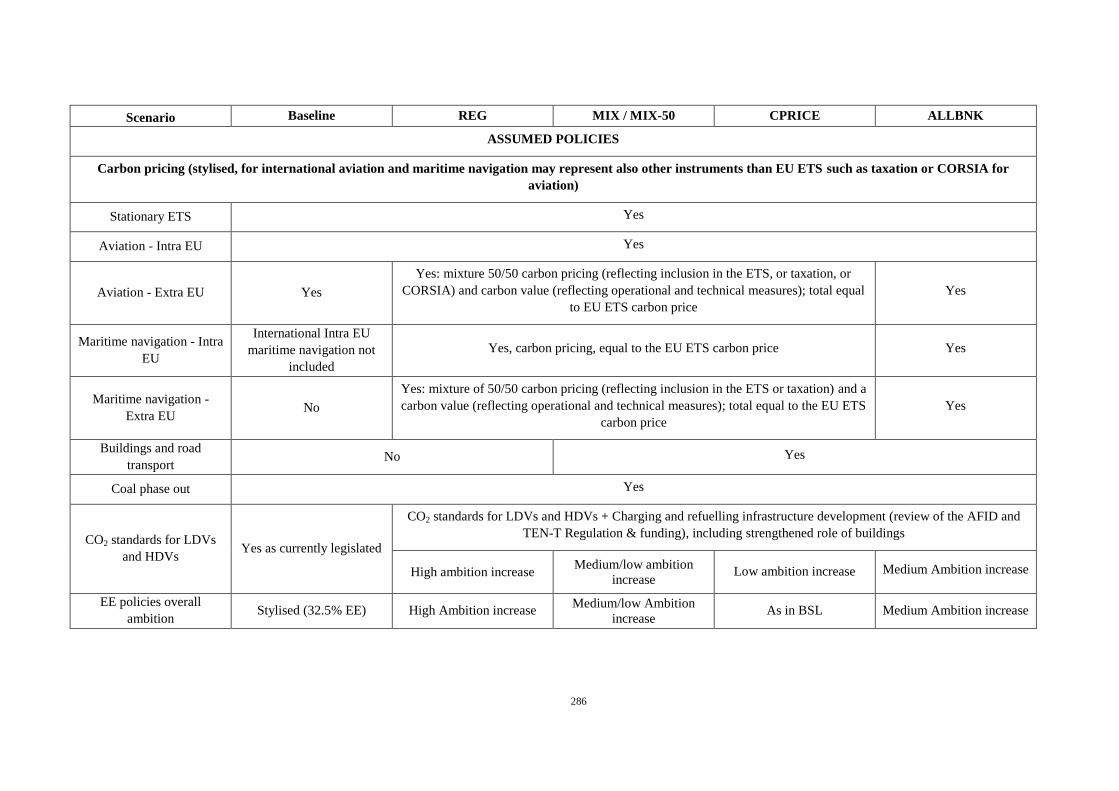
286
Scenario Baseline REG MIX / MIX-50 CPRICE ALLBNK
ASSUMED POLICIES
Carbon pricing (stylised, for international aviation and maritime navigation may represent also other instruments than EU ETS such as taxation or CORSIA for
aviation)
Stationary ETS Yes
Aviation - Intra EU Yes
Aviation - Extra EU Yes
Yes: mixture 50/50 carbon pricing (reflecting inclusion in the ETS, or taxation, or
CORSIA) and carbon value (reflecting operational and technical measures); total equal
to EU ETS carbon price
Yes
Maritime navigation - Intra
EU
International Intra EU
maritime navigation not
included
Yes, carbon pricing, equal to the EU ETS carbon price Yes
Maritime navigation -
Extra EU No
Yes: mixture of 50/50 carbon pricing (reflecting inclusion in the ETS or taxation) and a
carbon value (reflecting operational and technical measures); total equal to the EU ETS
carbon price
Yes
Buildings and road
transport No Yes
Coal phase out Yes
CO2 standards for LDVs
and HDVs Yes as currently legislated
CO2 standards for LDVs and HDVs + Charging and refuelling infrastructure development (review of the AFID and
TEN-T Regulation & funding), including strengthened role of buildings
High ambition increase Medium/low ambition
increase Low ambition increase Medium Ambition increase
EE policies overall
ambition Stylised (32.5% EE) High Ambition increase
Medium/low Ambition
increase As in BSL Medium Ambition increase

287
Scenario Baseline REG MIX / MIX-50 CPRICE ALLBNK
EE in Buildings + Industry Stylised (32.5% EE)
High Ambition increase
(increase in renovation
rate, support for heat
pumps uptake)
Medium/low Ambition
increase
(increase in renovation
rate, support for heat
pumps uptake)
As in BSL As in MIX
EE in Transport
(see details in the section
below)
As currently legislated +
proposed revision of the
Eurovignette Directive
High Ambition increase Medium/low Ambition
increase Low Ambition increase As in MIX
RES policies overall
ambition Stylised (32% RES) High Ambition increase
Medium/low Ambition
increase High Ambition increase Medium Ambition increase
RES in buildings +
Industry Stylised (32.5% EE)
High Ambition increase
(incentives for uptake of
RES in heating and
cooling)
Medium/low Ambition
increase
(incentives for uptake of
RES in heating and
cooling)
As in BSL As in MIX
RES policies in ETS Stylised (32% RES)
Implications of the new offshore strategy
RES in transport and
policies impacting
transport fuel content
Stylised (32% RES)
High ambition increase of
fuel policies (Renewable
and low carbon fuels
mandate, including
ReFuelEU aviation and
FuelEU maritime
initiatives)
Medium/low ambition
increase of fuel policies
(Renewable and low
carbon fuels mandate,
including ReFuelEU
aviation and FuelEU
maritime initiatives)
Low ambition increase of
fuel policies (reflecting
ReFuelEU aviation and
FuelEU maritime
initiatives)
Very high ambition
increase of fuel policies
(reflecting ReFuelEU
aviation and FuelEU
maritime initiatives)
Additional non-CO2
policies (represented by
carbon value)
No Medium Ambition increase High Ambition increase

288
Scenario Baseline REG MIX / MIX-50 CPRICE ALLBNK
LULUCF policies No No (Separate scenarios assessment of impact of policies that enhance the LULULCF sink)
These policies are presented in the PRIMES modelling tool where some take the form of explicit policies such as for instance improved product energy
performance standards, vehicle CO2 standards and fuel mandates and others are induced by Energy Efficiency, Renewable Energy and non-CO2 values,
which reflect generic incentives altering investment decisions towards increased energy efficiency and renewable energy options (including removal of
non-market barriers and consumer behaviour in favour of energy efficiency) and abatement of non-CO2 emissions. Figure 76 shows that these values for
the different scenarios typically are higher in policy scenarios that are based on regulatory approaches than in scenarios that are more based on carbon
pricing. The values in the Baseline reflect the existing policy framework required to meet the current climate and energy targets. The transport policies
included in each scenario are provided in section 5.
Figure 76: Key modelling variables reflecting underlying policy assumptions
Scenarios Carbon price ETS sectors
(EUR'15/ t of CO2)
Non CO2 carbon values
(EUR'15/ t of CO2) 695
Average renewables value
(EUR'15/ MWh)
Average energy efficiency value
(EUR'15/ toe)
Baseline 32 0.0 91 891
MIX-50 36 0.6 94 951 REG 32 10 177 1270
MIX 44 10 112 1194
CPRICE 60 10 49 891
ALLBNK 65 55 111 1202
695 Mitigation potential based on the GAINS model marginal abatement cost curve but interpolated to fit PRIMES optimisation.