EUROPEAN COMMISSION Brussels, 14.7.2021 SWD(2021 ...
274
EN EN EUROPEAN COMMISSION Brussels, 14.7.2021 SWD(2021) 204 final PART 2/2 COMMISSION STAFF WORKING DOCUMENT Summary Report on the statistics on the use of animals for scientific purposes in the Member States of the European Union and Norway in 2018
-
Upload
khangminh22 -
Category
Documents
-
view
2 -
download
0
Transcript of EUROPEAN COMMISSION Brussels, 14.7.2021 SWD(2021 ...

EN EN
EUROPEAN COMMISSION
Brussels, 14.7.2021
SWD(2021) 204 final
PART 2/2
COMMISSION STAFF WORKING DOCUMENT
Summary Report on the statistics on the use of animals for scientific purposes in the
Member States of the European Union and Norway in 2018

1
PART C:
MEMBER STATE DATA 2018
MEMBER STATE COMPARATIVE TABLES FOR 2018
MEMBER STATE DATA 2018 .............................................................................................. 10
VI Member State narratives and data submissions 2018 ......................................................... 10
VI.1. Introduction..................................................................................................................... 10
VI.2. Member State narratives and data submissions for 2018 ............................................... 11
Austria ...................................................................................................................................... 11
Austria: Narrative 2018 ............................................................................................................. 11
Austria: Statistical Data 2018 .................................................................................................... 12
Section 1: Numbers of animals used for the first time for research, testing, routine production
and educational (including training) purposes ......................................................................... 12
Section 2: Numbers of all uses of animals for research, testing, routine production and
educational (including training) purposes ................................................................................ 14
Section 3: Creation and maintenance of genetically altered animal lines ............................... 17
Belgium .................................................................................................................................... 19
Belgium: Narrative 2018 ........................................................................................................... 19
Belgium: Statistical Data 2018 .................................................................................................. 26
Section 1: Numbers of animals used for the first time for research, testing, routine production
and educational (including training) purposes ......................................................................... 26
Section 2: Numbers of all uses of animals for research, testing, routine production and
educational (including training) purposes ................................................................................ 28
Section 3: Creation and maintenance of genetically altered animal lines ............................... 32
Bulgaria .................................................................................................................................... 34
Bulgaria: Narrative 2018 ........................................................................................................... 34
Bulgaria : Statistical Data 2018 ................................................................................................. 35
Section 1: Numbers of animals used for the first time for research, testing, routine production
and educational (including training) purposes ......................................................................... 35

2
Section 2: Numbers of all uses of animals for research, testing, routine production and
educational (including training) purposes ................................................................................ 36
Section 3: Creation and maintenance of genetically altered animal lines ............................... 39
Croatia ...................................................................................................................................... 40
Croatia: Narrative 2018 ............................................................................................................. 40
Croatia: Statistical Data 2018 .................................................................................................... 45
Section 1: Numbers of animals used for the first time for research, testing, routine production
and educational (including training) purposes ......................................................................... 45
Section 2: Numbers of all uses of animals for research, testing, routine production and
educational (including training) purposes ................................................................................ 46
Section 3: Creation and maintenance of genetically altered animal lines ............................... 49
Cyprus ...................................................................................................................................... 50
Cyprus: Narrative 2018 ............................................................................................................. 50
Cyprus: Statistical Data 2018..................................................................................................... 51
Section 1: Numbers of animals used for the first time for research, testing, routine production
and educational (including training) purposes ......................................................................... 51
Section 2: Numbers of all uses of animals for research, testing, routine production and
educational (including training) purposes ................................................................................ 52
Section 3: Creation and maintenance of genetically altered animal lines ............................... 54
Czechia ..................................................................................................................................... 55
Czechia: Narrative 2018 ............................................................................................................ 55
Czechia: Statistical Data 2018 ................................................................................................... 56
Section 1: Numbers of animals used for the first time for research, testing, routine production
and educational (including training) purposes ......................................................................... 56
Section 2: Numbers of all uses of animals for research, testing, routine production and
educational (including training) purposes ................................................................................ 57
Section 3: Creation and maintenance of genetically altered animal lines ............................... 61
Denmark ................................................................................................................................... 63
Denmark: Narrative 2018 .......................................................................................................... 63
Denmark: Statistical Data 2018 ................................................................................................. 65
Section 1: Numbers of animals used for the first time for research, testing, routine production
and educational (including training) purposes ......................................................................... 65

3
Section 2: Numbers of all uses of animals for research, testing, routine production and
educational (including training) purposes ................................................................................ 67
Section 3: Creation and maintenance of genetically altered animal lines ............................... 71
Estonia...................................................................................................................................... 73
Estonia: Narrative 2018 ............................................................................................................. 73
Estonia: Statistical Data 2018 .................................................................................................... 74
Section 1: Numbers of animals used for the first time for research, testing, routine production
and educational (including training) purposes ......................................................................... 74
Section 2: Numbers of all uses of animals for research, testing, routine production and
educational (including training) purposes ................................................................................ 75
Section 3: Creation and maintenance of genetically altered animal lines ............................... 78
Finland ..................................................................................................................................... 79
Finland: Narrative 2018 ............................................................................................................. 79
Finland: Statistical Data 2018 .................................................................................................... 80
Section 1: Numbers of animals used for the first time for research, testing, routine production
and educational (including training) purposes ......................................................................... 80
Section 2: Numbers of all uses of animals for research, testing, routine production and
educational (including training) purposes ................................................................................ 82
Section 3: Creation and maintenance of genetically altered animal lines ............................... 85
France ....................................................................................................................................... 87
France: Narrative 2018 .............................................................................................................. 87
France: Statistical Data 2018 ..................................................................................................... 90
Section 1: Numbers of animals used for the first time for research, testing, routine production
and educational (including training) purposes ......................................................................... 90
Section 2: Numbers of all uses of animals for research, testing, routine production and
educational (including training) purposes ................................................................................ 92
Section 3: Creation and maintenance of genetically altered animal lines ............................... 96
Germany ................................................................................................................................... 98
Germany: Narrative 2018 .......................................................................................................... 98
Germany: Statistical Data 2018 ............................................................................................... 101
Section 1: Numbers of animals used for the first time for research, testing, routine production
and educational (including training) purposes ....................................................................... 101

4
Section 2: Numbers of all uses of animals for research, testing, routine production and
educational (including training) purposes .............................................................................. 103
Section 3: Creation and maintenance of genetically altered animal lines ............................. 107
Greece .................................................................................................................................... 109
Greece: Narrative 2018 ........................................................................................................... 109
Greece: Statistical Data 2018 .................................................................................................. 111
Section 1: Numbers of animals used for the first time for research, testing, routine production
and educational (including training) purposes ....................................................................... 111
Section 2: Numbers of all uses of animals for research, testing, routine production and
educational (including training) purposes .............................................................................. 112
Section 3: Creation and maintenance of genetically altered animal lines ............................. 115
Hungary.................................................................................................................................. 116
Hungary: Narrative 2018 ......................................................................................................... 116
Hungary: Statistical Data 2018 ................................................................................................ 117
Section 1: Numbers of animals used for the first time for research, testing, routine production
and educational (including training) purposes ....................................................................... 117
Section 2: Numbers of all uses of animals for research, testing, routine production and
educational (including training) purposes .............................................................................. 119
Section 3: Creation and maintenance of genetically altered animal lines ............................. 123
Ireland .................................................................................................................................... 124
Ireland: Narrative 2018 ........................................................................................................... 124
Ireland: Statistical Data 2018 .................................................................................................. 126
Section 1: Numbers of animals used for the first time for research, testing, routine production
and educational (including training) purposes ....................................................................... 126
Section 2: Numbers of all uses of animals for research, testing, routine production and
educational (including training) purposes .............................................................................. 127
Section 3: Creation and maintenance of genetically altered animal lines ............................. 130
Italy ........................................................................................................................................ 132
Italy: Narrative 2018 ................................................................................................................ 132
Italy: Statistical Data 2018 ....................................................................................................... 135
Section 1: Numbers of animals used for the first time for research, testing, routine production
and educational (including training) purposes ....................................................................... 135

5
Section 2: Numbers of all uses of animals for research, testing, routine production and
educational (including training) purposes .............................................................................. 137
Section 3: Creation and maintenance of genetically altered animal lines ............................. 141
Latvia ..................................................................................................................................... 143
Latvia: Narrative 2018 ............................................................................................................. 143
Latvia: Statistical Data 2018 .................................................................................................... 148
Section 1: Numbers of animals used for the first time for research, testing, routine production
and educational (including training) purposes ....................................................................... 148
Section 2: Numbers of all uses of animals for research, testing, routine production and
educational (including training) purposes .............................................................................. 150
Section 3: Creation and maintenance of genetically altered animal lines ............................. 153
Lithuania ................................................................................................................................ 154
Lithuania: Narrative 2018 ........................................................................................................ 154
Lithuania: Statistical Data 2018 ............................................................................................... 155
Section 1: Numbers of animals used for the first time for research, testing, routine production
and educational (including training) purposes ....................................................................... 155
Section 2: Numbers of all uses of animals for research, testing, routine production and
educational (including training) purposes .............................................................................. 157
Section 3: Creation and maintenance of genetically altered animal lines ............................. 160
Luxembourg ........................................................................................................................... 161
Luxembourg: Narrative 2018 .................................................................................................. 161
Luxembourg: Statistical Data 2018 ......................................................................................... 162
Section 1: Numbers of animals used for the first time for research, testing, routine production
and educational (including training) purposes ....................................................................... 162
Section 2: Numbers of all uses of animals for research, testing, routine production and
educational (including training) purposes .............................................................................. 164
Section 3: Creation and maintenance of genetically altered animal lines ............................. 166
Malta ...................................................................................................................................... 167
Malta: Narrative 2018 ............................................................................................................. 167
Malta: Statistical Data 2018 .................................................................................................... 167
Section 1: Numbers of animals used for the first time for research, testing, routine production
and educational (including training) purposes ....................................................................... 167

6
Section 2: Numbers of all uses of animals for research, testing, routine production and
educational (including training) purposes .............................................................................. 169
Section 3: Creation and maintenance of genetically altered animal lines ............................. 171
Netherlands ............................................................................................................................ 172
Netherlands: Narrative 2018 ................................................................................................... 172
Netherlands: Statistical Data 2018 .......................................................................................... 173
Section 1: Numbers of animals used for the first time for research, testing, routine production
and educational (including training) purposes ....................................................................... 173
Section 2: Numbers of all uses of animals for research, testing, routine production and
educational (including training) purposes .............................................................................. 175
Section 3: Creation and maintenance of genetically altered animal lines ............................. 179
Poland .................................................................................................................................... 181
Poland: Narrative 2018 ........................................................................................................... 181
Poland: Statistical Data 2018 .................................................................................................. 184
Section 1: Numbers of animals used for the first time for research, testing, routine production
and educational (including training) purposes ....................................................................... 184
Section 2: Numbers of all uses of animals for research, testing, routine production and
educational (including training) purposes .............................................................................. 185
Section 3: Creation and maintenance of genetically altered animal lines ............................. 189
Portugal .................................................................................................................................. 190
Portugal: Narrative 2018 ......................................................................................................... 190
Portugal: Statistical Data 2018 ................................................................................................ 193
Section 1: Numbers of animals used for the first time for research, testing, routine production
and educational (including training) purposes ....................................................................... 193
Section 2: Numbers of all uses of animals for research, testing, routine production and
educational (including training) purposes .............................................................................. 195
Section 3: Creation and maintenance of genetically altered animal lines ............................. 198
Romania ................................................................................................................................. 200
Romania: Narrative 2018 ........................................................................................................ 200
Romania: Statistical Data 2018 ............................................................................................... 201
Section 1: Numbers of animals used for the first time for research, testing, routine production
and educational (including training) purposes ....................................................................... 201

7
Section 2: Numbers of all uses of animals for research, testing, routine production and
educational (including training) purposes .............................................................................. 202
Section 3: Creation and maintenance of genetically altered animal lines ............................. 205
Slovakia.................................................................................................................................. 206
Slovakia: Narrative 2018 ......................................................................................................... 206
Slovakia: Statistical Data 2018 ................................................................................................ 207
Section 1: Numbers of animals used for the first time for research, testing, routine production
and educational (including training) purposes ....................................................................... 207
Section 2: Numbers of all uses of animals for research, testing, routine production and
educational (including training) purposes .............................................................................. 209
Section 3: Creation and maintenance of genetically altered animal lines ............................. 212
Slovenia.................................................................................................................................. 213
Slovenia: Narrative 2018 ......................................................................................................... 213
Slovenia: Statistical Data 2018 ................................................................................................ 214
Section 1: Numbers of animals used for the first time for research, testing, routine production
and educational (including training) purposes ....................................................................... 214
Section 2: Numbers of all uses of animals for research, testing, routine production and
educational (including training) purposes .............................................................................. 215
Section 3: Creation and maintenance of genetically altered animal lines ............................. 218
Spain ...................................................................................................................................... 219
Spain: Narrative 2018 .............................................................................................................. 219
Spain: Statistical Data 2018 ..................................................................................................... 224
Section 1: Numbers of animals used for the first time for research, testing, routine production
and educational (including training) purposes ....................................................................... 224
Section 2: Numbers of all uses of animals for research, testing, routine production and
educational (including training) purposes .............................................................................. 226
Section 3: Creation and maintenance of genetically altered animal lines ............................. 230
Sweden ................................................................................................................................... 232
Sweden: Narrative 2018 .......................................................................................................... 232
Sweden: Statistical Data 2018 ................................................................................................. 239
Section 1: Numbers of animals used for the first time for research, testing, routine production
and educational (including training) purposes ....................................................................... 239

8
Section 2: Numbers of all uses of animals for research, testing, routine production and
educational (including training) purposes .............................................................................. 241
Section 3: Creation and maintenance of genetically altered animal lines ............................. 244
United Kingdom..................................................................................................................... 246
United Kingdom: Narrative 2018 ............................................................................................ 246
United Kingdom: Statistical Data 2018 ................................................................................... 250
Section 1: Numbers of animals used for the first time for research, testing, routine production
and educational (including training) purposes ....................................................................... 250
Section 2: Numbers of all uses of animals for research, testing, routine production and
educational (including training) purposes .............................................................................. 252
Section 3: Creation and maintenance of genetically altered animal lines ............................. 256
Norway ................................................................................................................................... 258
Norway: Narrative 2018 .......................................................................................................... 258
Norway: Statistical Data 2018 ................................................................................................. 259
Section 1: Numbers of animals used for the first time for research, testing, routine production
and educational (including training) purposes ....................................................................... 259
Section 2: Numbers of all uses of animals for research, testing, routine production and
educational (including training) purposes .............................................................................. 260
Section 3: Creation and maintenance of genetically altered animal lines ............................. 264
VII Member State comparative tables for 2018 ..................................................................... 266
Introduction ............................................................................................................................ 266
Table 1.1: Numbers of animals used for the first time for research, testing, routine production
and educational purposes by species and Member State (Part 1) (2018) .............................. 267
Table 1.2: Numbers of animals used for the first time for research, testing, routine production
and educational purposes by species and Member State (Part2) (2018) .............................. 268
Table 2.1: All uses (first use and all subsequent reuses) of animals for research, testing,
routine production and educational purposes by species and Member State (Part 1) (2018)
................................................................................................................................................. 269
Table 2.2: All uses (first use and all subsequent reuses) of animals for research, testing,
routine production and educational purposes by species and Member State (Part2) (2018)270
Table 3.1: Uses of animals for the creation of new genetically altered animal lines in basic,
translational and applied research by species, reuse and Member State1) (2018) ................ 271

9
Table 3.2: Uses of animals for the maintenance of colonies of established genetically altered
animal lines by species, reuse and Member State1) (2018) .................................................... 273

10
MEMBER STATE DATA 2018
VI Member State narratives and data submissions 2018
VI.1. Introduction
Member States submitted 2018 statistical data to the Commission using the categorisation of data
attributes provided in the Annex II of Commission Implementing Decision 2012/707/EU. In
addition, each Member State has provided a narrative for their data of 2018.
The submissions include data from all 28 Member States of the Union in 2018, and Norway.
The Member State data tables in the following pages are presented respecting the same three-
way division as the Union report.
Numbers of animals used for purposes of research, testing, routine production and
education (including training) – Section 1 (IV.1)
Details of all uses (first and any subsequent reuse) of animals for the purposes of
research, testing, routine production and education (including training) - Section 2 (IV.2)
Numbers and uses of animals for the creation and maintenance of genetically altered
animals in the Union – Section 3 (IV.3)
In some cases, the numbers referred to in the Member State narratives may differ from those
shown in the respective Member State data tables. This is due to the fact that some Member
States when having compiled the narratives, have not distinguished animals used directly in
research and testing from those used for the creation and maintenance of genetically altered
animals but instead used the combined total numbers.
In addition, it is important to know that some Member States may require additional data to be
reported at national level; for example, statistics on the number of animals killed for organs
and/or tissue. Therefore, national statistical publications sometimes differ from the data reported
to the Commission. To ensure that the data is harmonised and comparable at Union level, only
the data required by Commission Implementing Decision 2020/569/EU are submitted for
publication in the Union report.

11
VI.2. Member State narratives and data submissions for 2018
Austria
Austria: Narrative 2018
1. General information on any changes in trends observed since the previous reporting period.
In Austria the total number of animals used for scientific purposes in 2018 is 237.727 (2017: 264.071),
which is a decrease of approx. 10 % or in absolute numbers 26.344 animals. In comparison with the
previous two years an increase was observed in 2017, while in 2018 the number of animals used for
scientific purpose declined almost to the level of 2016 (236.459 animals).
2. Information on significant increase or decrease in use animals in any of the specific areas and
analysis of the reasons thereof.
The total number of fish (zebra fish and other fish) used for scientific purposes in 2018 is 28.441 (2017:
20.927). Zebra fish were mainly used for the purposes “Basic Research, Other“ in particular cell and
developmental biology and “Basic Research, Endocrine system/metabolism” and “Translational and
applied research, Human Musculoskeletal Disorders”. Other fish were mainly used for the purposes
“Basic Research, Ethology/Animal Behaviour/ Animal Biology” and “Protection of the natural
environment in the interests of the health or welfare of human beings or animals”.
With regard to the categories of purposes, a decrease is observed in “Basic research, Nervous System”
(from 16.591 to 11.678 animals used in 2018), “Regulatory use and routine production type, Quality
control (incl batch safety and potency testing), Pyrogenicity testing” (from 9.125 to 1.923 rabbits in
2018) and “Maintenance of colonies of established genetically altered animals, not used in procedures”
(from 29.361 to 12.045 animals in 2018). An increase is observed for “Basic research, Oncology” (from
25.406 to 28.696 animals in 2018) and „Translational and applied research, Human Cancer“ (from
14.506 to 17.094 animals in 2018).
3. Information on any changes in trends in actual severities and analysis of the reasons thereof.
No significant changes are observed. 4. Particular efforts to promote the principle of replacement, reduction and refinement and its
impacts on statistics if any.
The competent authorities promote the 3R principle at all steps of the authorization processes, in
particular by putting emphasis on minimizing pain suffering, distress and lasting harm by adequate
humane endpoints.
5. Further breakdown on the use of "other" categories if a significant proportion of animal use is
reported under this category.

12
“Other rodents” include the common vole; “Other mammals” include i.a. wild boar and red deer, “Other
birds” i.a. Columbidae, Anser anser, Corvus corax and Passer domesticus; “Other fish” include i.a.
Alburnus alburnus, Chondrostoma nasus and Rutilus rutilus; “Other amphibian” include Ambystoma
mexicanum and Staurois parvus.
6. Details on cases where the 'severe' classification is exceeded, whether pre-authorised or not,
covering the species, numbers, whether prior exemption was authorised, the details of the use and
the reasons why 'severe' classification was exceeded.
Procedures involving severe pain, suffering or distress that is likely to be long-lasting and cannot be
ameliorated, as referred to in Article 15(2) were not performed.
Austria: Statistical Data 2018
Section 1: Numbers of animals used for the first time for research, testing, routine
production and educational (including training) purposes
Numbers of animals used for the first time by species Animal species Number of animals Percentage
Mice 161338 81.72%
Rats 3805 1.93%
Guinea-Pigs 484 0.25%
Hamsters (Syrian) 162 0.08%
Other rodents 842 0.43%
Rabbits 3111 1.58%
Cats 6 0%
Dogs 77 0.04%
Horses, donkeys and cross-breeds 13 0.01%
Pigs 1546 0.78%
Goats 42 0.02%
Sheep 42 0.02%
Cattle 467 0.24%
Other mammals 80 0.04%
Domestic fowl 2302 1.17%
Other birds 323 0.16%
Xenopus 448 0.23%
Other amphibians 1085 0.55%
Zebra fish 7370 3.73%
Other fish 13881 7.03%
Total 197424 100.00%
Place of birth of animals other than non-human primates Place of birth Number of animals Percentage
Animals born in the EU at a registered breeder 146854 74.39%
Animals born in the EU but not at a registered breeder 17397 8.81%
Animals born in rest of Europe 30926 15.66%
Animals born in rest of world 2247 1.14%
Total 197424 100.00%

13
Source of non-human primates NHP Source (origin) Number of animals Percentage
No data reported
Generation of non-human primates NHP Generation Number of animals Percentage
No data reported

14
Section 2: Numbers of all uses of animals for research, testing, routine production and
educational (including training) purposes
First use versus reuses Animal species First uses Reuses Total
Mice 161338 365 161703
Rats 3805 3805
Guinea-Pigs 484 484
Hamsters (Syrian) 162 16 178
Other rodents 842 842
Rabbits 3111 18 3129
Cats 6 6
Dogs 77 36 113
Horses, donkeys and cross-breeds 13 55 68
Pigs 1546 2 1548
Goats 42 42
Sheep 42 8 50
Cattle 467 28 495
Other mammals 80 80
Domestic fowl 2302 2302
Other birds 323 323
Xenopus 448 1 449
Other amphibians 1085 1085
Zebra fish 7370 7370
Other fish 13881 13881
Total 197424 529 197953
Uses of animals in research, testing, routine production and education (including training) by main
categories of scientific purposes Purpose Category Number of
uses Percentage
Basic Research 90949 45.94%
Translational and applied research 77341 39.07%
Regulatory use and Routine production 20787 10.5%
Protection of the natural environment in the interests of the health or welfare of human beings or animals
5925 2.99%
Preservation of species 62 0.03%
Higher education or training for the acquisition, maintenance or improvement of vocational skills
2889 1.46%
Total 197953 100.00%
Basic research related uses Basic research Number of uses Percentage
Oncology 17556 19.3%
Cardiovascular Blood and Lymphatic System 6458 7.1%
Nervous System 11407 12.54%
Respiratory System 151 0.17%
Gastrointestinal System including Liver 2328 2.56%
Musculoskeletal System 4235 4.66%
Immune System 23307 25.63%
Urogenital/Reproductive System 719 0.79%
Sensory Organs (skin, eyes and ears) 1025 1.13%

15
Endocrine System/Metabolism 5515 6.06%
Multisystemic 4153 4.57%
Ethology / Animal Behaviour /Animal Biology 7489 8.23%
Other basic research 6606 7.26%
Total 90949 100.00%
Translational and applied research related uses Translational and applied research Number of uses Percentage
Human Cancer 17094 22.1%
Human Infectious Disorders 42382 54.8%
Human Cardiovascular Disorders 2907 3.76%
Human Nervous and Mental Disorders 4550 5.88%
Human Respiratory Disorders 309 0.4%
Human Gastrointestinal Disorders including Liver 645 0.83%
Human Musculoskeletal Disorders 2059 2.66%
Human Immune Disorders 669 0.87%
Human Urogenital/Reproductive Disorders 18 0.02%
Human Sensory Organ Disorders (skin, eyes and ears) 280 0.36%
Human Endocrine/Metabolism Disorders 809 1.05%
Other Human Disorders 1696 2.19%
Animal Diseases and Disorders 3226 4.17%
Diagnosis of diseases 629 0.81%
Non-regulatory toxicology and ecotoxicology 68 0.09%
Total 77341 100.00%
Regulatory uses and Routine production Regulatory uses and Routine production Number of uses Percentage
Quality control (incl batch safety and potency testing) 19712 94.83%
Toxicity and other safety testing including pharmacology 965 4.64%
Routine production 110 0.53%
Total 20787 100.00%
Regulatory uses - Quality control (including batch safety and potency testing) Regulatory uses - Quality control (including batch safety and potency testing) Number of uses Percentage
Batch safety testing 1074 5.45%
Pyrogenicity testing 1923 9.76%
Batch potency testing 16116 81.76%
Other quality controls 599 3.04%
Total 19712 100.00%
Regulatory uses - Toxicity and other safety testing including pharmacology Regulatory uses - Toxicity and other safety testing including pharmacology Number of uses Percentage
Repeated dose toxicity 87 9.02%
Neurotoxicity 36 3.73%
Target animal safety 842 87.25%
Total 965 100.00%
Regulatory uses - Toxicity and other safety testing including pharmacology - Acute and sub-acute toxicity
testing methods Regulatory uses - Toxicity and other safety testing including pharmacology - Acute and sub-acute toxicity testing methods
Number of uses
Percentage
No data reported

16
Regulatory uses - Toxicity and other safety testing including pharmacology - Repeated dose toxicity Regulatory uses - Toxicity and other safety testing including pharmacology - Repeated dose toxicity
Number of uses
Percentage
up to 28 days 45 51.72%
29 - 90 days 42 48.28%
Total 87 100.00%
Regulatory uses - Toxicity and other safety testing including pharmacology - Ecotoxicity Regulatory uses - Toxicity and other safety testing including pharmacology - Ecotoxicity Number of uses Percentage
No data reported
Regulatory uses by type of legislation Type of legislation Number of uses Percentage
Legislation on medicinal products for human use 19799 95.75%
Plant protection product legislation 842 4.07%
Other legislation 36 0.17%
Total 20677 100.00%
Regulatory uses by origin of regulatory requirement Origin of legislative requirement Number of uses Percentage
Legislation satisfying EU requirements 17396 84.13%
Legislation satisfying Non-EU requirements only 3281 15.87%
Total 20677 100.00%
Routine production uses by product type Product type Number of uses Percentage
Blood based products 110 100%
Total 110 100.00%
Uses of animals in research, testing, routine production and education (including training) by first use and
reuses Reuse Number of uses Percentage
No 197424 99.73%
Yes 529 0.27%
Total 197953 100.00%
Uses of animals in research, testing, routine production and education (including training) by severity Severity Number of uses Percentage
Non-recovery 5082 2.57%
Mild [up to and including] 113870 57.52%
Moderate 61224 30.93%
Severe 17777 8.98%
Total 197953 100.00%
Uses of animals in research, testing, routine production and education (including training) by genetic status
of animals Genetic status Number of uses Percentage
Not genetically altered 132129 66.75%
Genetically altered without a harmful phenotype 50057 25.29%
Genetically altered with a harmful phenotype 15767 7.97%
Total 197953 100.00%

17
Section 3: Creation and maintenance of genetically altered animal lines
All uses of animals for the creation of new genetically altered animal lines by species, first uses and reuses Animal species First uses Reuses Total
Mice 20525 20525
Rabbits 14 14
Zebra fish 7064 7064
Other fish 126 126
Total 27729 27729
Uses of animals for the creation of new genetically altered animal lines by severity Severity Number of uses Percentage
Mild [up to and including] 26032 93.88%
Moderate 1633 5.89%
Severe 64 0.23%
Total 27729 100.00%
Uses of animals for the creation of new genetically altered animal lines by genetic status of the animals Genetic status Number of uses Percentage
Not genetically altered 5587 20.15%
Genetically altered without a harmful phenotype 14383 51.87%
Genetically altered with a harmful phenotype 7759 27.98%
Total 27729 100.00%
Uses of animals for the creation of new genetically altered animal lines by type of basic research purposes Basic research Number of uses Percentage
Oncology 11140 40.17%
Cardiovascular Blood and Lymphatic System 1097 3.96%
Nervous System 271 0.98%
Gastrointestinal System including Liver 463 1.67%
Immune System 2397 8.64%
Endocrine System/Metabolism 1061 3.83%
Multisystemic 6533 23.56%
Other basic research 4767 17.19%
Total 27729 100.00%
Uses of animals for the creation of new genetically altered animal lines by type of translational and applied
research purposes Translational and applied research Number of uses Percentage
No data reported
All uses of animals for the maintenance of established genetically altered animal lines by species Animal species First uses Reuses Total uses
Mice 12045 12045
Total 12045 12045
Uses of animals for the maintenance of established genetically altered animal lines by severity Severity Number of uses Percentage
Mild [up to and including] 11603 96.33%
Moderate 442 3.67%
Total 12045 100.00%

18
Uses of animals for the maintenance of established genetically altered animal lines by genetic status of the
animals Genetic status Number of uses Percentage
Not genetically altered 1472 12.22%
Genetically altered without a harmful phenotype 7815 64.88%
Genetically altered with a harmful phenotype 2758 22.9%
Total 12045 100.00%

19
Belgium
Belgium: Narrative 2018
1. General information on any changes in trends observed since the previous reporting period.
Compared to 2017 (543,074 animals used), there is an increase of 2.43% in the number of animals used
for scientific purposes in 2018 (556,271 animals used). The increase in 2018 is the result of an increased
use of mice in maintenance of colonies of established genetically altered animals (not used in other
procedures) and an increased use of other fish in preservation of species (mainly research on the impact
of axial flow pumps on different species).
In 2018 it was noted by the European Commission that the percentage of Maintenance in Belgium was
lower than the European average of 6%. This raised the question of whether this concept was
understood correctly. Therefore, active contact was made with the institutions to explain the concept.
Consequently, we see that this category shows a significant increase in 2018. 5.15% of the animal use
now falls under Maintenance, which is more in line with the European average.
Number of use in 2016 Number of use in 2017 Number of use in 2018
534854 543074 556271
Since 2015, the numbers of re-used animals continues to decline. Compared to 2017 there is a decrease
of 7.17% and even a decrease of 42.57% compared to the numbers of 2016.
Re-Use
Number of use
in 2016
Number of use
in 2017
Number of use
in 2018
No 526723 538043 551601
Yes 8131 5031 4670
Total uses 534854 543074 556271
On the species grouping level, there are no significant changes.
Species
Number of use
in 2016
Number of use
in 2017
Number of use
in 2018
Mammals 441476 442398
454576
30734 46812 45412

20
Birds
Fish 62221 52462
54843
Amphibians 1226 1241 1116
Reptiles 172 181
324
Cephalopods 0 0
0
Total uses 535829 543094
556271
Within the mammals category we notice that the use of mice is slightly increasing throughout the years
(increase of 3.84% compared to 2016 and 4.64% compared to 2017). The use of rabbits increased more
rapidly with an increase of 28.18% compared to 2016 and an increase of 6.37% compared to 2017. The
use of pigs is also rising with an increase of 49.56% since 2016 and an increase of 9.24% since 2017. The
increase compared to the use in 2017 is the result of an increase in research in the domain of the
Cardiovascular Blood and Lymphatic System. In recent decades, porcine (pig) models have become very
popular for cardiovascular research. Their physiology, heart size, immune system and anatomy closely
resemble that of humans and their coronaries have very little collateral circulation.
On the other hand a decrease was noted for rats and guinea-pigs. As you can see in the table below, the
use of rats decreased by 34.06% since 2016 and by 16.04% since 2017. This change can be explained at
least in part by a reduced use of rat studies (and increased use of mouse studies) in Alzheimer's
research. The use of guinea-pigs decreased by 13.52% since 2016 and by 9.72% since 2017 due to a
reduction of the use of this species in the Regulatory field.
Animal Species
Number of use
in 2016
Number of use
in 2017
Number of use
in 2018
Mice 336052 334054 348937
Rats 30337 23826 20003
Guinea-Pigs 16223 15541 14029
Rabbits 48036 57888 61575
Pigs 3630 4970 5429
In the birds category, there is an increase for domestic fowl compared to 2016 (49.46%) but a status quo
compared to 2017. The other birds increased significantly compared to 2016 (37.86%) but decreased
this year (13.01%).
Animal
Species
Number of use
in 2016
Number of use
in 2017
Number of use
in 2018
26230 39674 39203

21
Domestic fowl
Other birds 4504 7138 6209
In the fish category, there is a decrease in the use of zebra fish compared to 2016 (30.47%) and
compared to 2017 (8.9%). The decrease in the use of zebra fish compared to 2017 can partly be
explained by the fact that a number of large projects requiring more laboratory animals ended in 2017.
The use of other fish however increased by 15.92% compared to 2016 (and by 20.45% compared to
2017). The increase in 2018 is, among other things, due to an increasing use of larvae of North Sea sole
(research that was temporarily put on hold in 2017 and was restarted in 2018) and the use of fish in
research on the impact of axial flow pumps.
Animal Species
Number of use
in 2016
Number of use
in 2017
Number of use
in 2018
Zebra fish 37256 28435 25904
Other Fish 24965 24027 28939
2. Information on significant increase or decrease in use animals in any of the specific areas and
analysis of the reasons thereof.
Between 2017 and 2018, basic research diminished by 7.73%. This was in particular due to decreases in
the area of Immune System. Other important decreases were noted in the area of the Nervous System
and other basic research. However, the research in the domain of the Cardiovascular Blood and
Lymphatic System significantly increased (31.49%) between 2017 and 2018.
During the same time period Translational and applied research augmented by 3.74%. We noted a
significant increase in the research on Human cancer (18,138 animal uses in 2018 compared to 12,720 in
2017) and in Animal Diseases and Disorders (22,693 animal uses in 2018 compared to 17,960 in 2017). A
decrease was noted in Non-regulatory toxicology and ecotoxicology (10,308 animal uses in 2018
compared to 13,111 animals in 2017).
3. Information on any changes in trends in actual severities and analysis of the reasons thereof.
Within the actual severities classification we noted that the category "severe" decreased from 15.61% to
12.48%. The decrease in severity is mainly the result of a decrease in research in Oncology and Immune
System. These types of research are more often classified as “severe” because of the induction of
tumours leading to metastases, tumours that lead to cachexia, invasive bone tumours, ulcerating
tumours, loss of immunity, etc.
4. Particular efforts to promote the principle of replacement, reduction and refinement and its
impacts on statistics if any.

22
No specific new initiatives in 2018. Continuation of the RE-Place project to create a database that brings
together expertise on alternative methods for animal testing.
5. Further breakdown on the use of "other" categories if a significant proportion of animal use is
reported under this category.
1. Other fish
52,77% of the fishes are reported under the “other” category.
They are mostly Cichlidae (Oreochromis niloticus represents 26.46% of other fish), Anguillidae
(Anguilla anguilla represents 16.62% of other fish), Salmonidae (Salmo salar and Oncorhynchus
mykiss represent 16.50% of other fish), Cyprinidae (Cyprinus carpio, Rutilis rutilis and Abramis brama
represent 19.54% of other fish), Moronidae (Dicentrarchus labrax represents 5.87% of other fish),
Soleidae (Solea solea represents 5.34% of other fish).
Other Species Number of uses
Oreochromis niloticus 7656
Anguilla anguilla 4811
Oncorhynchus mykiss 3820
Cyprinus carpio 2853
Dicentrarchus labrax 1700
Rutilis rutilis 1600
Solea solea 1544
Abramis brama 1200
Salmo salar 955
Nothobranchius furzeri 567
Gasterosteus aculeatus 547
Kryptolebias marmoratus 460
Poecilia reticulata 300
Lota lota 270
Pleuronectes platessa 131
Limanda limanda 104
Gadus morhua 65
Clarias gariepinus 50
Raja clavata 38
Ophthalmotilapia ventralis 28
Synodontis grandiops 26
Microsynodontis batesii 16
Pseudotropheus saulosi 14
Neogobius melanostomus 12
Ophthalmotilapia nasuta 11
Pygocentrus nattereri 9
Poecilia sphenops 8
Raja brachyura 8
Nimbochromis venustus 7

23
Parophidion vasali 7
Myleus schomburgkii 6
Synodontis eupterus 6
Alosa fallax 5
Carassius auratus 5
Catoprion mento 5
Metynnis hypsauchen 5
Piaractus brachypomus 5
Pygopristis denticulata 5
Gerochromis niloticus 4
Raja undulata 4
Synodontis njassae 4
Synodontis soloni 4
Botia morleti 3
Chromobotia macracanthus 3
Idotropheus sprengerae 3
Myloplus rubripinnis 3
Pantodon buchholzi 3
Pygocentrus cariba 3
Sahyadria denisonii 3
Serrasalmus maculatus 3
Serrasalmus spilopleura 3
Synodontis ilebrevis 3
Ancistrus dolichopterus 2
Botia modesta 2
Epalzeorhynchos bicolor 2
Helostoma temminkii 2
Iodotropheus sprengerae 2
Maylandia zebra 2
Pangasianodon hypophthalmus 2
Pangasius sp. 2
Pygocentrus piraya 2
Raja montagui 2
Serrasalmus elongatus 2
Synodontis sp. 2
Colossoma macropomum 1
Corydoras panda 1
Corydoras sp. 1
Hyphessobrycon sp. 1
Hypostomus plecostomus 1
Metynnis lippincottianus 1
Pterophyllum confer scalare 1
Puntigrus tetrazona 1
Serrasalmus manueli 1
Synodontis victoriae 1

24
Total uses: 28939
2. Other amphibians
24.82% of the amphibians are reported under the “other” category.
They are mostly Ranidae (Lithobates catesbeianus larva) (64.98% of other amphibians),
Ceratophrydae (in order of importance: Ceratophrys cornuta, Ceratophrys cranwelli, Ceratophrys
ornate, Lepidobatrachus laevis, Ceratophrys aurita and Ceratophrys stolzmanni) (18.41% of other
amphibians) and Salamandridae (Salamandra atra) (10.47% of other amphibians).
Other Amphibians Number of uses
Lithobates catesbeianus (larve) 180
Salamandra atra 29
Ceratophrys cornuta 13
Ceratophrys cranwelli 12
Ceratophrys ornata 9
Lepidobatrachus laevis 9
Bombina orientalis 7
Ceratophrys aurita 6
Chacophrys pierotti 4
Phrynomantis microps 3
Ceratophrys stolzmanni 2
Dyscophus guineti 2
Xenopus muelleri 1
Total uses: 277

25
3. Other birds
13,67% of the birds are reported under the “other” category.
They are mostly Paridae (Parus major and Cyanistis caeruleus) (61,23% of other birds) and
Phasianidae (Meleagris gallopavo, Coturnix japonica, Coturnix coturnix) (34.47% of other birds).
The other birds are members of Columbidae (Columba livia), Laridae (Larus fuscus), Fringillidae
(Serinus canaria), Estrildidae (Taeniopygia guttata) and Sturnidae (Sturnus vulgaris).
Other Birds Number of uses
Parus major 3038
Meleagris gallopavo 1847
Cyanistis caeruleus 764
Coturnix japonica 287
Columba livia 94
Larus fuscus 58
Serinus canaria 53
Taeniopygia guttata 38
Sturnus vulgaris 24
Coturnix coturnix 6
Total uses: 6209
26
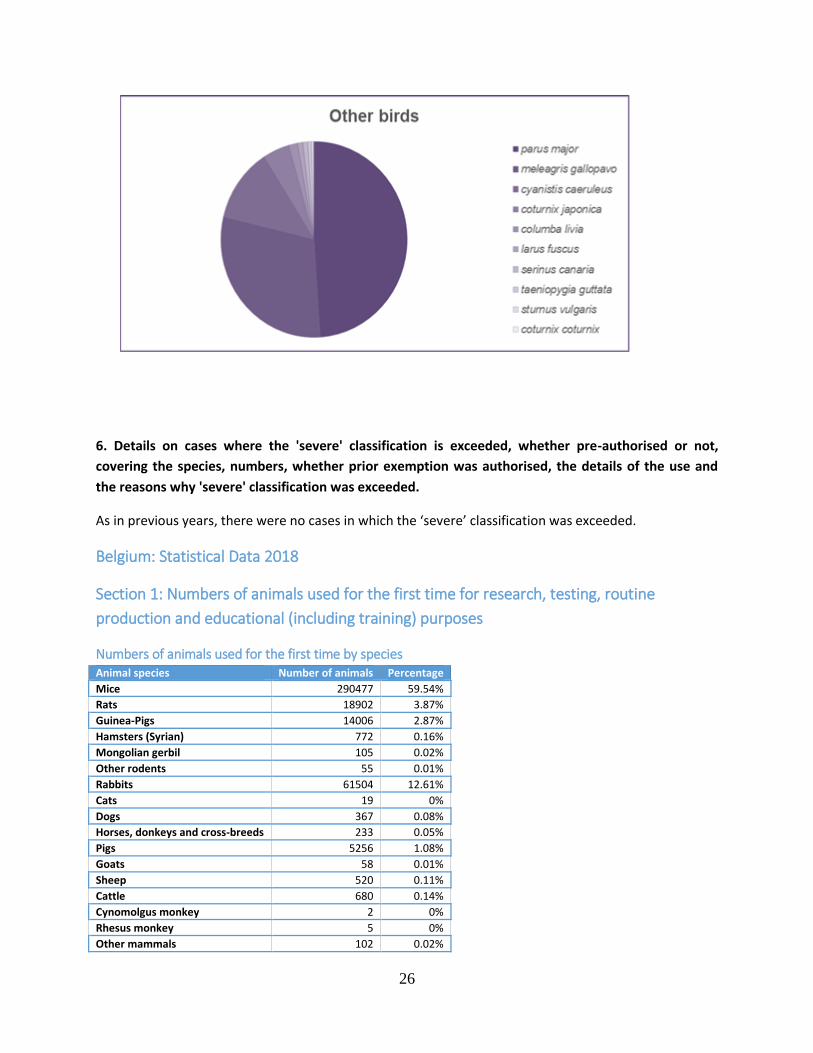
6. Details on cases where the 'severe' classification is exceeded, whether pre-authorised or not,
covering the species, numbers, whether prior exemption was authorised, the details of the use and
the reasons why 'severe' classification was exceeded.
As in previous years, there were no cases in which the ‘severe’ classification was exceeded.
Belgium: Statistical Data 2018
Section 1: Numbers of animals used for the first time for research, testing, routine
production and educational (including training) purposes
Numbers of animals used for the first time by species Animal species Number of animals Percentage
Mice 290477 59.54%
Rats 18902 3.87%
Guinea-Pigs 14006 2.87%
Hamsters (Syrian) 772 0.16%
Mongolian gerbil 105 0.02%
Other rodents 55 0.01%
Rabbits 61504 12.61%
Cats 19 0%
Dogs 367 0.08%
Horses, donkeys and cross-breeds 233 0.05%
Pigs 5256 1.08%
Goats 58 0.01%
Sheep 520 0.11%
Cattle 680 0.14%
Cynomolgus monkey 2 0%
Rhesus monkey 5 0%
Other mammals 102 0.02%

27
Domestic fowl 39184 8.03%
Other birds 6163 1.26%
Reptiles 54 0.01%
Xenopus 810 0.17%
Other amphibians 12 0%
Zebra fish 20380 4.18%
Other fish 28177 5.78%
Total 487843 100.00%
Place of birth of animals other than non-human primates Place of birth Number of animals Percentage
Animals born in the EU at a registered breeder 461068 94.51%
Animals born in the EU but not at a registered breeder 21797 4.47%
Animals born in rest of Europe 309 0.06%
Animals born in rest of world 4662 0.96%
Total 487836 100.00%
Source of non-human primates NHP Source (origin) Number of animals Percentage
Animals born at a registered breeder within EU 5 71.43%
Animals born in Asia 2 28.57%
Total 7 100.00%
Generation of non-human primates NHP Generation Number of animals Percentage
F2 or greater 7 100%
Total 7 100.00%

28
Section 2: Numbers of all uses of animals for research, testing, routine production and
educational (including training) purposes
First use versus reuses Animal species First uses Reuses Total
Mice 290477 641 291118
Rats 18902 651 19553
Guinea-Pigs 14006 23 14029
Hamsters (Syrian) 772 772
Mongolian gerbil 105 105
Other rodents 55 55
Rabbits 61504 71 61575
Cats 19 15 34
Dogs 367 1317 1684
Horses, donkeys and cross-breeds 233 69 302
Pigs 5256 173 5429
Goats 58 1 59
Sheep 520 8 528
Cattle 680 170 850
Cynomolgus monkey 2 2
Rhesus monkey 5 36 41
Other mammals 102 69 171
Domestic fowl 39184 19 39203
Other birds 6163 46 6209
Reptiles 54 270 324
Xenopus 810 29 839
Other amphibians 12 265 277
Zebra fish 20380 1 20381
Other fish 28177 762 28939
Total 487843 4636 492479
Uses of animals in research, testing, routine production and education (including training) by main
categories of scientific purposes Purpose Category Number of
uses Percentage
Basic Research 216638 43.99%
Translational and applied research 121546 24.68%
Regulatory use and Routine production 140896 28.61%
Protection of the natural environment in the interests of the health or welfare of human beings or animals
359 0.07%
Preservation of species 5598 1.14%
Higher education or training for the acquisition, maintenance or improvement of vocational skills
7442 1.51%
Total 492479 100.00%
Basic research related uses Basic research Number of uses Percentage
Oncology 48183 22.24%
Cardiovascular Blood and Lymphatic System 11858 5.47%
Nervous System 31995 14.77%
Respiratory System 4937 2.28%
Gastrointestinal System including Liver 16108 7.44%

29
Musculoskeletal System 7061 3.26%
Immune System 48884 22.56%
Urogenital/Reproductive System 4348 2.01%
Sensory Organs (skin, eyes and ears) 2719 1.26%
Endocrine System/Metabolism 9666 4.46%
Multisystemic 4518 2.09%
Ethology / Animal Behaviour /Animal Biology 14256 6.58%
Other basic research 12105 5.59%
Total 216638 100.00%
Translational and applied research related uses Translational and applied research Number of uses Percentage
Human Cancer 18138 14.92%
Human Infectious Disorders 15412 12.68%
Human Cardiovascular Disorders 1272 1.05%
Human Nervous and Mental Disorders 28971 23.84%
Human Respiratory Disorders 6783 5.58%
Human Gastrointestinal Disorders including Liver 1706 1.4%
Human Musculoskeletal Disorders 984 0.81%
Human Immune Disorders 2435 2%
Human Urogenital/Reproductive Disorders 815 0.67%
Human Sensory Organ Disorders (skin, eyes and ears) 5709 4.7%
Human Endocrine/Metabolism Disorders 1749 1.44%
Other Human Disorders 22 0.02%
Animal Diseases and Disorders 22678 18.66%
Animal Welfare 2323 1.91%
Diagnosis of diseases 5038 4.14%
Non-regulatory toxicology and ecotoxicology 7511 6.18%
Total 121546 100.00%
Regulatory uses and Routine production Regulatory uses and Routine production Number of uses Percentage
Quality control (incl batch safety and potency testing) 61229 43.46%
Other efficacy and tolerance testing 18296 12.99%
Toxicity and other safety testing including pharmacology 4407 3.13%
Routine production 56964 40.43%
Total 140896 100.00%
Regulatory uses - Quality control (including batch safety and potency testing) Regulatory uses - Quality control (including batch safety and potency testing) Number of uses Percentage
Batch safety testing 5225 8.53%
Batch potency testing 53362 87.15%
Other quality controls 2642 4.31%
Total 61229 100.00%
Regulatory uses - Toxicity and other safety testing including pharmacology Regulatory uses - Toxicity and other safety testing including pharmacology Number of uses Percentage
Acute and sub-acute 821 18.63%
Repeated dose toxicity 850 19.29%
Genotoxicity 3 0.07%
Kinetics 486 11.03%
Ecotoxicity 1096 24.87%
Safety testing in food and feed area 971 22.03%

30
Target animal safety 180 4.08%
Total 4407 100.00%
Regulatory uses - Toxicity and other safety testing including pharmacology - Acute and sub-acute toxicity
testing methods Regulatory uses - Toxicity and other safety testing including pharmacology - Acute and sub-acute toxicity testing methods
Number of uses
Percentage
LD50, LC50 310 37.76%
Non lethal methods 511 62.24%
Total 821 100.00%
Regulatory uses - Toxicity and other safety testing including pharmacology - Repeated dose toxicity Regulatory uses - Toxicity and other safety testing including pharmacology - Repeated dose toxicity
Number of uses
Percentage
up to 28 days 730 85.88%
29 - 90 days 120 14.12%
Total 850 100.00%
Regulatory uses - Toxicity and other safety testing including pharmacology - Ecotoxicity Regulatory uses - Toxicity and other safety testing including pharmacology - Ecotoxicity Number of uses Percentage
Acute toxicity 1096 100%
Total 1096 100.00%
Regulatory uses by type of legislation Type of legislation Number of
uses Percentage
Legislation on medicinal products for human use 55900 66.6%
Legislation on medicinal products for veterinary use and their residues 25087 29.89%
Medical devices legislation 1047 1.25%
Food legislation including food contact material 740 0.88%
Feed legislation including legislation for the safety of target animals, workers and environment
62 0.07%
Other legislation 1096 1.31%
Total 83932 100.00%
Regulatory uses by origin of regulatory requirement Origin of legislative requirement Number of uses Percentage
Legislation satisfying EU requirements 69020 82.23%
Legislation satisfying national requirements only [within EU] 310 0.37%
Legislation satisfying Non-EU requirements only 14602 17.4%
Total 83932 100.00%
Routine production uses by product type Product type Number of uses Percentage
Blood based products 56918 99.92%
Monoclonal antibody by mouse ascites method 11 0.02%
Other product types 35 0.06%
Total 56964 100.00%
Uses of animals in research, testing, routine production and education (including training) by first use and
reuses Reuse Number of uses Percentage
No 487843 99.06%

31
Yes 4636 0.94%
Total 492479 100.00%
Uses of animals in research, testing, routine production and education (including training) by severity Severity Number of uses Percentage
Non-recovery 19391 3.94%
Mild [up to and including] 254533 51.68%
Moderate 149835 30.42%
Severe 68720 13.95%
Total 492479 100.00%
Uses of animals in research, testing, routine production and education (including training) by genetic status
of animals Genetic status Number of uses Percentage
Not genetically altered 387661 78.72%
Genetically altered without a harmful phenotype 89253 18.12%
Genetically altered with a harmful phenotype 15565 3.16%
Total 492479 100.00%

32
Section 3: Creation and maintenance of genetically altered animal lines
All uses of animals for the creation of new genetically altered animal lines by species, first uses and reuses Animal species First uses Reuses Total
Mice 29382 21 29403
Rats 239 239
Zebra fish 5523 5523
Total 35144 21 35165
Uses of animals for the creation of new genetically altered animal lines by severity Severity Number of uses Percentage
Non-recovery 1174 3.34%
Mild [up to and including] 28854 82.05%
Moderate 4485 12.75%
Severe 652 1.85%
Total 35165 100.00%
Uses of animals for the creation of new genetically altered animal lines by genetic status of the animals Genetic status Number of uses Percentage
Not genetically altered 5962 16.95%
Genetically altered without a harmful phenotype 24034 68.35%
Genetically altered with a harmful phenotype 5169 14.7%
Total 35165 100.00%
Uses of animals for the creation of new genetically altered animal lines by type of basic research purposes Basic research Number of uses Percentage
Oncology 7817 22.29%
Cardiovascular Blood and Lymphatic System 5843 16.66%
Nervous System 6648 18.96%
Gastrointestinal System including Liver 3718 10.6%
Musculoskeletal System 889 2.54%
Immune System 1902 5.42%
Urogenital/Reproductive System 882 2.52%
Sensory Organs (skin, eyes and ears) 377 1.08%
Endocrine System/Metabolism 5107 14.56%
Multisystemic 1838 5.24%
Other basic research 45 0.13%
Total 35066 100.00%
Uses of animals for the creation of new genetically altered animal lines by type of translational and applied
research purposes Translational and applied research Number of uses Percentage
Human Cardiovascular Disorders 60 60.61%
Human Urogenital/Reproductive Disorders 24 24.24%
Animal Diseases and Disorders 15 15.15%
Total 99 100.00%
All uses of animals for the maintenance of established genetically altered animal lines by species Animal species First uses Reuses Total uses
Mice 28403 13 28416
Rats 211 211
Total 28614 13 28627

33
Uses of animals for the maintenance of established genetically altered animal lines by severity Severity Number of uses Percentage
Mild [up to and including] 28273 98.76%
Moderate 313 1.09%
Severe 41 0.14%
Total 28627 100.00%
Uses of animals for the maintenance of established genetically altered animal lines by genetic status of the
animals Genetic status Number of uses Percentage
Not genetically altered 346 1.21%
Genetically altered without a harmful phenotype 26428 92.32%
Genetically altered with a harmful phenotype 1853 6.47%
Total 28627 100.00%

34
Bulgaria
Bulgaria: Narrative 2018
1. General information on any changes in trends observed since the previous reporting period.
The total number of animals, used for 2018, compared to 2017 is reduced. The number of re-used
animals is increased. The used animals are only animals born in the EU at register breeder. The number
of used rodents is slightly increased, but the number of used rabbits and artiodactyla are reduced.
2. Information on significant increase or decrease in use animals in any of the specific areas and
analysis of the reasons thereof.
The number of used for 2018 animals, compared to 2017 is reduced. In some cases, depending on the
project type, the Ethic Commission made recommendations for reduction of the used animals. The
project authorization is not given of projects, who do not consider with the recommendation. It was
asked, some of the tests to be filmed.
3. Information on any changes in trends in actual severities and analysis of the reasons thereof.
The procedures with non-recovery severity are increased. The number of procedures with moderate or
severe severity are decreased. The reason for minimizing the procedures with severe severity in 2018 is:
a lot of procedures for the purpose of training students were filmed;
existing scientific publications in connection with experiments conducted for the same purpose.
The reason for increasing the procedures with non-recovery severity is the following:
Often, in one authorization project are combined several diagnostic procedures, related to diagnostic
purposes or testing new pharmaceutical products for which there is no literature available regarding the
subsequent impact on treated animals.
4. Particular efforts to promote the principle of replacement, reduction and refinement and its
impacts on statistics if any.
The number of re-used animals is increased. Often, the Ethic Commission made recommendations
for reduction of the used animals.
5. Further breakdown on the use of "other" categories if a significant proportion of animal use is
reported under this category.
No.

35
6. Details on cases where the 'severe' classification is exceeded, whether pre-authorised or not,
covering the species, numbers, whether prior exemption was authorised, the details of the use and
the reasons why 'severe' classification was exceeded.
No.
Bulgaria : Statistical Data 2018
Section 1: Numbers of animals used for the first time for research, testing, routine
production and educational (including training) purposes
Numbers of animals used for the first time by species Animal species Number of animals Percentage
Mice 1176 16.78%
Rats 1861 26.55%
Guinea-Pigs 1800 25.68%
Rabbits 293 4.18%
Dogs 25 0.36%
Pigs 104 1.48%
Domestic fowl 60 0.86%
Rana 1420 20.26%
Other amphibians 270 3.85%
Total 7009 100.00%
Place of birth of animals other than non-human primates Place of birth Number of animals Percentage
Animals born in the EU at a registered breeder 7009 100%
Total 7009 100.00%
Source of non-human primates NHP Source (origin) Number of animals Percentage
No data reported
Generation of non-human primates NHP Generation Number of animals Percentage
No data reported

36
Section 2: Numbers of all uses of animals for research, testing, routine production and
educational (including training) purposes
First use versus reuses Animal species First uses Reuses Total
Mice 1176 1176
Rats 1861 16 1877
Guinea-Pigs 1800 1 1801
Rabbits 293 132 425
Dogs 25 25
Pigs 104 104
Domestic fowl 60 60
Rana 1420 1420
Other amphibians 270 270
Total 7009 149 7158
Uses of animals in research, testing, routine production and education (including training) by main
categories of scientific purposes Purpose Category Number of
uses Percentage
Basic Research 2439 34.07%
Translational and applied research 97 1.36%
Regulatory use and Routine production 2955 41.28%
Higher education or training for the acquisition, maintenance or improvement of vocational skills
1667 23.29%
Total 7158 100.00%
Basic research related uses Basic research Number of uses Percentage
Cardiovascular Blood and Lymphatic System 94 3.85%
Nervous System 1236 50.68%
Gastrointestinal System including Liver 9 0.37%
Musculoskeletal System 195 8%
Immune System 15 0.62%
Sensory Organs (skin, eyes and ears) 64 2.62%
Endocrine System/Metabolism 500 20.5%
Multisystemic 326 13.37%
Total 2439 100.00%
Translational and applied research related uses Translational and applied research Number of uses Percentage
Human Cardiovascular Disorders 30 30.93%
Human Respiratory Disorders 37 38.14%
Human Endocrine/Metabolism Disorders 30 30.93%
Total 97 100.00%
Regulatory uses and Routine production Regulatory uses and Routine production Number of uses Percentage
Quality control (incl batch safety and potency testing) 2782 94.15%
Toxicity and other safety testing including pharmacology 173 5.85%
Total 2955 100.00%

37
Regulatory uses - Quality control (including batch safety and potency testing) Regulatory uses - Quality control (including batch safety and potency testing) Number of uses Percentage
Batch safety testing 2650 95.26%
Pyrogenicity testing 132 4.74%
Total 2782 100.00%
Regulatory uses - Toxicity and other safety testing including pharmacology Regulatory uses - Toxicity and other safety testing including pharmacology Number of uses Percentage
Skin irritation/corrosion 30 17.34%
Repeated dose toxicity 60 34.68%
Pharmaco-dynamics (incl safety pharmacology) 73 42.2%
Ecotoxicity 10 5.78%
Total 173 100.00%
Regulatory uses - Toxicity and other safety testing including pharmacology - Acute and sub-acute toxicity
testing methods Regulatory uses - Toxicity and other safety testing including pharmacology - Acute and sub-acute toxicity testing methods
Number of uses
Percentage
No data reported
Regulatory uses - Toxicity and other safety testing including pharmacology - Repeated dose toxicity Regulatory uses - Toxicity and other safety testing including pharmacology - Repeated dose toxicity
Number of uses
Percentage
> 90 days 60 100%
Total 60 100.00%
Regulatory uses - Toxicity and other safety testing including pharmacology - Ecotoxicity Regulatory uses - Toxicity and other safety testing including pharmacology - Ecotoxicity Number of uses Percentage
Acute toxicity 10 100%
Total 10 100.00%
Regulatory uses by type of legislation Type of legislation Number of uses Percentage
Legislation on medicinal products for human use 2822 95.5%
Legislation on medicinal products for veterinary use and their residues 133 4.5%
Total 2955 100.00%
Regulatory uses by origin of regulatory requirement Origin of legislative requirement Number of uses Percentage
Legislation satisfying EU requirements 2955 100%
Total 2955 100.00%
Routine production uses by product type Product type Number of uses Percentage
No data reported
Uses of animals in research, testing, routine production and education (including training) by first use and
reuses Reuse Number of uses Percentage
No 7009 97.92%
Yes 149 2.08%
Total 7158 100.00%

38
Uses of animals in research, testing, routine production and education (including training) by severity Severity Number of uses Percentage
Non-recovery 2881 40.25%
Mild [up to and including] 3849 53.77%
Moderate 428 5.98%
Total 7158 100.00%
Uses of animals in research, testing, routine production and education (including training) by genetic status
of animals Genetic status Number of uses Percentage
Not genetically altered 7158 100%
Total 7158 100.00%

39
Section 3: Creation and maintenance of genetically altered animal lines
All uses of animals for the creation of new genetically altered animal lines by species, first uses and reuses Animal species First uses Reuses Total
No data reported
Uses of animals for the creation of new genetically altered animal lines by severity Severity Number of uses Percentage
No data reported
Uses of animals for the creation of new genetically altered animal lines by genetic status of the animals Genetic status Number of uses Percentage
No data reported
Uses of animals for the creation of new genetically altered animal lines by type of basic research purposes Basic research Number of uses Percentage
No data reported
Uses of animals for the creation of new genetically altered animal lines by type of translational and applied
research purposes Translational and applied research Number of uses Percentage
No data reported
All uses of animals for the maintenance of established genetically altered animal lines by species Animal species First uses Reuses Total uses
No data reported
Uses of animals for the maintenance of established genetically altered animal lines by severity Severity Number of uses Percentage
No data reported
Uses of animals for the maintenance of established genetically altered animal lines by genetic status of the
animals Genetic status Number of uses Percentage
No data reported

40
Croatia
Croatia: Narrative 2018
1. General information on any changes in trends observed since the previous reporting period.
Animal Species used for scientific procedures
Data for 2018, 2017 and 2016:
Animal Species 2018 2017 2016
number % number % number %
Mice 18,295 70.87 19,806 69.41 14,976 68.38
Rats 6,885 26.67 7,700 26.99 5,762 26.31
Guinea Pigs 17 0.07 21 0.07 71 0.32
Rabbits 250 0.97 426 1,49 704 3.21
Horses, donkeys &
cross-breeds
18 0.07 25 0.09 27 0.12
Pigs 20 0.08 2 0.01 2 0.01
Sheep 22 0.09 39 0.14 49 0.22
Cattle - - 30 0.11 50 0.23
Domestic fowl 275 1.07 255 0.89 260 1.19
Zebra fish 34 0.13 230 0.81 0 0
Summary 25,816 100 28,534 100 21,901 100
Compared to the data for 2016 and 2017, the data for 2018 shows:
- an overall decrease in the total number of animals used for scientific purposes and most in mice,
rats, guinea pigs, rabbits, horses, sheep and zebra fish
- slightly increase in the number of domestic fowl and the increase of the number of pigs used for
scientific purposes and
- totally decrease in the number of cattle used for scientific purposes.
Re-use vs first use
Data for 2018, 2017 and 2016:
Re-Use 2018 2017 2016
number % number % number %
No 25,769 99.82 28,431 99.64 21,790 99.49
Yes 47 0.18 103 0.36 111 0.51
Total uses 25,816 100 28,534 100 21,901 100
Compared to the data for 2016 and 2017, the data for 2018 shows there are no significant changes in
the proportion of Re-use vs first use.

41
Genetically altered animals
Data for 2018, 2017 and 2016:
Genetic Status 2018 2017 2016
number % number % number %
Not genetically
altered
24,711 95.72 26,027 91.21 19,422 88.68
Genetically altered
without a harmful
phenotype
968 3.75 2,452 8.59 2,350 10.73
Genetically altered
with a harmful
phenotype
137 0.53 55 0.19 129 0.59
Summary 25,816 100 28,534 100 21,901 100
Compared to the data for 2016 and 2017, the data for 2018 shows:
- number of not genetically altered animals slightly decreased than in 2017
- there is overall decrease of the number of genetically altered animals without a harmful
phenotype in the three years period
- number of genetically altered animals with a harmful phenotype is slightly higher than in 2016
and significantly higher than in 2017.
The proportion of animals used for scientific purposes within three types of genetically status did not
change significantly during three years period.
Creation of New Genetically altered lines
Data for 2018, 2017 and 2016:
Creation of New
GL
2018 2017 2016
number % number % number %
No 25,782 99.87 28,304 99.19 21,901 100
Yes 34 0.13 230 0.81 0 0
Summary 25,816 100 28,534 100 21,901 100
Compared to the data for 2017, the data for 2018 shows the decrease of number of animals used for
creation of new genetically altered lines while in 2016 the new genetically altered lines was not
reported.
Origins of animals
Data for 2018, 2017 and 2016:
Place of Birth 2018 2017 2016
number % number % number %
Animals born in the 25,739 99.88 28,292 99.51 21,701 99.59

42
EU at a registered
breeder
Animals born in the
EU but not at a
registered breeder
30 0.12 60 0.21 89 0.41
Animals born in the
rest of Europe
0 0 0 0 0 0
Animals born in the
rest of world
0 0 79 0.28 0 0
Summary 25,769 100 28,431 100 21,790 100
Compared to the data for 2016 and 2017, the data for 2018 shows there are no significant changes
regarding the place of birth of animals.
Legislative Requirement
Data for 2018, 2017 and 2016:
Legislative
Requirement
2018 2017 2016
number % number % number %
Legislation
satisfying EU
requirements
2,461 9.53 2,182 7.65 988 4.52
Legislation
satisfying national
requirements only
(within EU)
0 0 0 0 0 0
Legislation
satisfying Non-EU
requirements only
0 0 0 0 0 0
Compared to the data for 2016 and 2017, the data for 2018 shows that there is a slightly increase of
number of animals used for scientific purposes regarding the legislation satisfying EU requirements.
Primates have never been used for scientific purposes in Croatia.
2. Information on significant increase or decrease in use animals in any of the specific areas and
analysis of the reasons thereof.
Purpose Category
Data for 2018, 2017 and 2016:
Purpose Category 2018 2017 2016
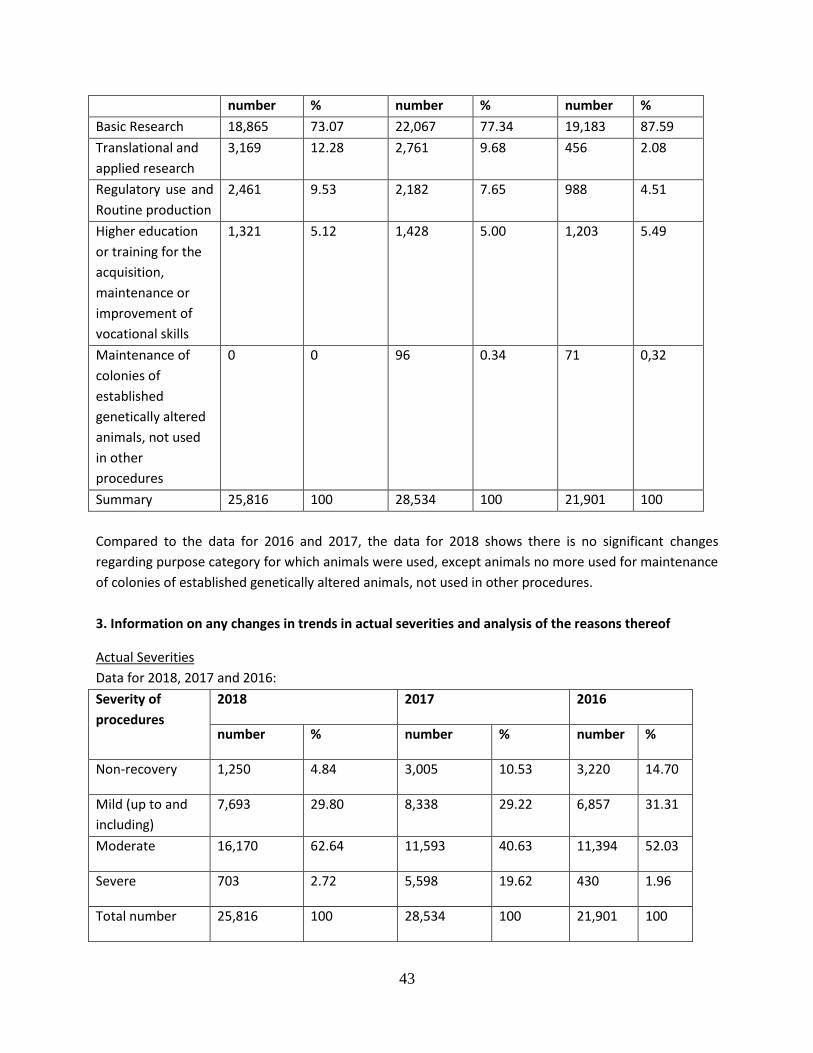
43
number % number % number %
Basic Research 18,865 73.07 22,067 77.34 19,183 87.59
Translational and
applied research
3,169 12.28 2,761 9.68 456 2.08
Regulatory use and
Routine production
2,461 9.53 2,182 7.65 988 4.51
Higher education
or training for the
acquisition,
maintenance or
improvement of
vocational skills
1,321 5.12 1,428 5.00 1,203 5.49
Maintenance of
colonies of
established
genetically altered
animals, not used
in other
procedures
0 0 96 0.34 71 0,32
Summary 25,816 100 28,534 100 21,901 100
Compared to the data for 2016 and 2017, the data for 2018 shows there is no significant changes
regarding purpose category for which animals were used, except animals no more used for maintenance
of colonies of established genetically altered animals, not used in other procedures.
3. Information on any changes in trends in actual severities and analysis of the reasons thereof
Actual Severities
Data for 2018, 2017 and 2016:
Severity of
procedures
2018 2017 2016
number % number % number %
Non-recovery 1,250 4.84 3,005 10.53 3,220 14.70
Mild (up to and
including)
7,693 29.80 8,338 29.22 6,857 31.31
Moderate 16,170 62.64 11,593 40.63 11,394 52.03
Severe 703 2.72 5,598 19.62 430 1.96
Total number 25,816 100 28,534 100 21,901 100

44
Compared to the data for 2016 and 2017, the data for 2018 shows an increase in number of animals
used in moderate procedures and significant decrease in number of animals used in severe and non-
recovery procedures.
There is a decrease in numbers of animals used in severe procedures because more attention during the
planning and evaluation of the projects has been paid to the development and use of humane end
points.
4. Particular efforts to promote the principle of replacement, reduction and refinement and its
impacts on statistics if any.
- 3rs CroLASA Congress: Laboratory Animals in Scientific Research, 25-26 October 2018, Zagreb, Croatia
- Workshop on the Severity Classification and Reporting under EU Directive 2010/63/EU, 26 October
2018, Zagreb, Croatia
- 3rs CroLASA Congress: Laboratory Animals in Scientific Research, Round table “Retrospective
Assessment of the Project”, 26 October 2018, Zagreb, Croatia
5. Further breakdown on the use of "other" categories if a significant proportion of animal use is
reported under this category.
Purpose Category
Data for 2018, 2017 and 2016:
Purpose Category 2018 2017 2016
number % number % number %
Regulatory use and routine
production – Quality control (incl
batch safety and potency testing) -
Other quality controls
900 76.60 1,195 75.39 360 43.32
For regulatory use and routine production - Quality control (incl batch safety and potency testing) -
Other quality controls in 2016, 2017 and 2018 tests performed have been required by EU Pharmacopeia
and animals used in tests are mice.
6. Details on cases where the 'severe' classification is exceeded, whether pre-authorised or not,
covering the species, numbers, whether prior exemption was authorised, the details of the use and
the reasons why 'severe' classification was exceeded.
The exceeded 'severe' classification was not authorised and also not reported.

45
Croatia: Statistical Data 2018
Section 1: Numbers of animals used for the first time for research, testing, routine
production and educational (including training) purposes
Numbers of animals used for the first time by species Animal species Number of animals Percentage
Mice 18295 71.09%
Rats 6873 26.71%
Guinea-Pigs 12 0.05%
Rabbits 250 0.97%
Pigs 20 0.08%
Sheep 10 0.04%
Domestic fowl 275 1.07%
Total 25735 100.00%
Place of birth of animals other than non-human primates Place of birth Number of animals Percentage
Animals born in the EU at a registered breeder 25705 99.88%
Animals born in the EU but not at a registered breeder 30 0.12%
Total 25735 100.00%
Source of non-human primates NHP Source (origin) Number of animals Percentage
No data reported
Generation of non-human primates NHP Generation Number of animals Percentage
No data reported

46
Section 2: Numbers of all uses of animals for research, testing, routine production and
educational (including training) purposes
First use versus reuses Animal species First uses Reuses Total
Mice 18295 18295
Rats 6873 12 6885
Guinea-Pigs 12 5 17
Rabbits 250 250
Horses, donkeys and cross-breeds 18 18
Pigs 20 20
Sheep 10 12 22
Domestic fowl 275 275
Total 25735 47 25782
Uses of animals in research, testing, routine production and education (including training) by main categories of scientific purposes Purpose Category Number of
uses Percentage
Basic Research 18865 73.17%
Translational and applied research 3135 12.16%
Regulatory use and Routine production 2461 9.55%
Higher education or training for the acquisition, maintenance or improvement of vocational skills
1321 5.12%
Total 25782 100.00%
Basic research related uses Basic research Number of uses Percentage
Oncology 502 2.66%
Cardiovascular Blood and Lymphatic System 569 3.02%
Nervous System 1241 6.58%
Respiratory System 2975 15.77%
Gastrointestinal System including Liver 3512 18.62%
Musculoskeletal System 173 0.92%
Immune System 4740 25.13%
Urogenital/Reproductive System 568 3.01%
Sensory Organs (skin, eyes and ears) 946 5.01%
Endocrine System/Metabolism 636 3.37%
Multisystemic 2681 14.21%
Ethology / Animal Behaviour /Animal Biology 37 0.2%
Other basic research 285 1.51%
Total 18865 100.00%
Translational and applied research related uses Translational and applied research Number of uses Percentage
Human Nervous and Mental Disorders 31 0.99%
Human Respiratory Disorders 2587 82.52%
Human Gastrointestinal Disorders including Liver 100 3.19%
Human Musculoskeletal Disorders 70 2.23%
Human Endocrine/Metabolism Disorders 220 7.02%
Other Human Disorders 120 3.83%
Diagnosis of diseases 7 0.22%

47
Total 3135 100.00%
Regulatory uses and Routine production Regulatory uses and Routine production Number of uses Percentage
Quality control (incl batch safety and potency testing) 1175 47.74%
Toxicity and other safety testing including pharmacology 1251 50.83%
Routine production 35 1.42%
Total 2461 100.00%
Regulatory uses - Quality control (including batch safety and potency testing) Regulatory uses - Quality control (including batch safety and potency testing) Number of uses Percentage
Batch safety testing 275 23.4%
Other quality controls 900 76.6%
Total 1175 100.00%
Regulatory uses - Toxicity and other safety testing including pharmacology Regulatory uses - Toxicity and other safety testing including pharmacology Number of uses Percentage
Acute and sub-acute 268 21.42%
Kinetics 983 78.58%
Total 1251 100.00%
Regulatory uses - Toxicity and other safety testing including pharmacology - Acute and sub-acute toxicity
testing methods Regulatory uses - Toxicity and other safety testing including pharmacology - Acute and sub-acute toxicity testing methods
Number of uses
Percentage
Non lethal methods 268 100%
Total 268 100.00%
Regulatory uses - Toxicity and other safety testing including pharmacology - Repeated dose toxicity Regulatory uses - Toxicity and other safety testing including pharmacology - Repeated dose toxicity
Number of uses
Percentage
No data reported
Regulatory uses - Toxicity and other safety testing including pharmacology - Ecotoxicity Regulatory uses - Toxicity and other safety testing including pharmacology - Ecotoxicity Number of uses Percentage
No data reported
Regulatory uses by type of legislation Type of legislation Number of uses Percentage
Legislation on medicinal products for human use 2151 88.66%
Legislation on medicinal products for veterinary use and their residues 275 11.34%
Total 2426 100.00%
Regulatory uses by origin of regulatory requirement Origin of legislative requirement Number of uses Percentage
Legislation satisfying EU requirements 2426 100%
Total 2426 100.00%
Routine production uses by product type Product type Number of uses Percentage
Blood based products 35 100%
Total 35 100.00%

48
Uses of animals in research, testing, routine production and education (including training) by first use and
reuses Reuse Number of uses Percentage
No 25735 99.82%
Yes 47 0.18%
Total 25782 100.00%
Uses of animals in research, testing, routine production and education (including training) by severity Severity Number of uses Percentage
Non-recovery 1250 4.85%
Mild [up to and including] 7693 29.84%
Moderate 16136 62.59%
Severe 703 2.73%
Total 25782 100.00%
Uses of animals in research, testing, routine production and education (including training) by genetic status
of animals Genetic status Number of uses Percentage
Not genetically altered 24677 95.71%
Genetically altered without a harmful phenotype 968 3.75%
Genetically altered with a harmful phenotype 137 0.53%
Total 25782 100.00%

49
Section 3: Creation and maintenance of genetically altered animal lines
All uses of animals for the creation of new genetically altered animal lines by species, first uses and reuses Animal species First uses Reuses Total
Zebra fish 34 34
Total 34 34
Uses of animals for the creation of new genetically altered animal lines by severity Severity Number of uses Percentage
Moderate 34 100%
Total 34 100.00%
Uses of animals for the creation of new genetically altered animal lines by genetic status of the animals Genetic status Number of uses Percentage
Not genetically altered 34 100%
Total 34 100.00%
Uses of animals for the creation of new genetically altered animal lines by type of basic research purposes Basic research Number of uses Percentage
No data reported
Uses of animals for the creation of new genetically altered animal lines by type of translational and applied
research purposes Translational and applied research Number of uses Percentage
Non-regulatory toxicology and ecotoxicology 34 100%
Total 34 100.00%
All uses of animals for the maintenance of established genetically altered animal lines by species Animal species First uses Reuses Total uses
No data reported
Uses of animals for the maintenance of established genetically altered animal lines by severity Severity Number of uses Percentage
No data reported
Uses of animals for the maintenance of established genetically altered animal lines by genetic status of the
animals Genetic status Number of uses Percentage
No data reported

50
Cyprus
Cyprus: Narrative 2018
1. General information on any changes in trends observed since the previous reporting period.
In 2018, the number of the projects and the animals used, increased. Specifically, in 2017, were running
8 projects and during 2018, 15 projects, that means an increase of 87.5%.
Also, in a project, 100 animals were classified in “severe” procedures, which means an increase of 5.32%
in this category of procedures.
2. Information on significant increase or decrease in use animals in any of the specific areas and
analysis of the reasons thereof.
During 2018, there was a significant increase in the number of animals participating in several projects,
due to the increase of the number of projects. Specifically, the number of animals used, increased by
35,58%.
3. Information on any changes in trends in actual severities and analysis of the reasons thereof.
100 animals were classified in “severe” procedures, due to the fact that in 2018, a project was
authorized to involve severe procedures.
4. Particular efforts to promote the principle of replacement, reduction and refinement and its
impacts on statistics if any.
The National Committee for Welfare of Animals used for Scientific Purposes, ensures the 3Rs
implementation at the Project evaluation during the procedure for licencing.
5. Further breakdown on the use of "other" categories if a significant proportion of animal use is
reported under this category.
There were no significant proportion of animals used under the category “other”.
6. Details on cases where the 'severe' classification is exceeded, whether pre-authorised or not,
covering the species, numbers, whether prior exemption was authorised, the details of the use and
the reasons why 'severe' classification was exceeded.
There were no such cases for the year 2018.

51
Cyprus: Statistical Data 2018
Section 1: Numbers of animals used for the first time for research, testing, routine
production and educational (including training) purposes
Numbers of animals used for the first time by species Animal species Number of animals Percentage
Mice 1461 100%
Total 1461 100.00%
Place of birth of animals other than non-human primates Place of birth Number of animals Percentage
Animals born in the EU at a registered breeder 1461 100%
Total 1461 100.00%
Source of non-human primates NHP Source (origin) Number of animals Percentage
No data reported
Generation of non-human primates NHP Generation Number of animals Percentage
No data reported

52
Section 2: Numbers of all uses of animals for research, testing, routine production and
educational (including training) purposes
First use versus reuses Animal species First uses Reuses Total
Mice 1461 349 1810
Total 1461 349 1810
Uses of animals in research, testing, routine production and education (including training) by main
categories of scientific purposes Purpose Category Number of uses Percentage
Basic Research 1432 79.12%
Translational and applied research 378 20.88%
Total 1810 100.00%
Basic research related uses Basic research Number of uses Percentage
Oncology 267 18.65%
Nervous System 435 30.38%
Musculoskeletal System 298 20.81%
Urogenital/Reproductive System 54 3.77%
Multisystemic 228 15.92%
Other basic research 150 10.47%
Total 1432 100.00%
Translational and applied research related uses Translational and applied research Number of uses Percentage
Human Infectious Disorders 200 52.91%
Human Gastrointestinal Disorders including Liver 120 31.75%
Animal Diseases and Disorders 58 15.34%
Total 378 100.00%
Regulatory uses and Routine production Regulatory uses and Routine production Number of uses Percentage
No data reported
Regulatory uses - Quality control (including batch safety and potency testing) Regulatory uses - Quality control (including batch safety and potency testing) Number of uses Percentage
No data reported
Regulatory uses - Toxicity and other safety testing including pharmacology Regulatory uses - Toxicity and other safety testing including pharmacology Number of uses Percentage
No data reported
Regulatory uses - Toxicity and other safety testing including pharmacology - Acute and sub-acute toxicity
testing methods Regulatory uses - Toxicity and other safety testing including pharmacology - Acute and sub-acute toxicity testing methods
Number of uses
Percentage
No data reported

53
Regulatory uses - Toxicity and other safety testing including pharmacology - Repeated dose toxicity Regulatory uses - Toxicity and other safety testing including pharmacology - Repeated dose toxicity
Number of uses
Percentage
No data reported
Regulatory uses - Toxicity and other safety testing including pharmacology - Ecotoxicity Regulatory uses - Toxicity and other safety testing including pharmacology - Ecotoxicity Number of uses Percentage
No data reported
Regulatory uses by type of legislation Type of legislation Number of uses Percentage
No data reported
Regulatory uses by origin of regulatory requirement Origin of legislative requirement Number of uses Percentage
No data reported
Routine production uses by product type Product type Number of uses Percentage
No data reported
Uses of animals in research, testing, routine production and education (including training) by first use and
reuses Reuse Number of uses Percentage
No 1461 80.72%
Yes 349 19.28%
Total 1810 100.00%
Uses of animals in research, testing, routine production and education (including training) by severity Severity Number of uses Percentage
Non-recovery 102 5.64%
Mild [up to and including] 1560 86.19%
Moderate 48 2.65%
Severe 100 5.52%
Total 1810 100.00%
Uses of animals in research, testing, routine production and education (including training) by genetic status
of animals Genetic status Number of uses Percentage
Not genetically altered 978 54.03%
Genetically altered without a harmful phenotype 805 44.48%
Genetically altered with a harmful phenotype 27 1.49%
Total 1810 100.00%

54
Section 3: Creation and maintenance of genetically altered animal lines
All uses of animals for the creation of new genetically altered animal lines by species, first uses and reuses Animal species First uses Reuses Total
Mice 68 68
Total 68 68
Uses of animals for the creation of new genetically altered animal lines by severity Severity Number of uses Percentage
Mild [up to and including] 68 100%
Total 68 100.00%
Uses of animals for the creation of new genetically altered animal lines by genetic status of the animals Genetic status Number of uses Percentage
Genetically altered without a harmful phenotype 68 100%
Total 68 100.00%
Uses of animals for the creation of new genetically altered animal lines by type of basic research purposes Basic research Number of uses Percentage
Nervous System 68 100%
Total 68 100.00%
Uses of animals for the creation of new genetically altered animal lines by type of translational and applied
research purposes Translational and applied research Number of uses Percentage
No data reported
All uses of animals for the maintenance of established genetically altered animal lines by species Animal species First uses Reuses Total uses
No data reported
Uses of animals for the maintenance of established genetically altered animal lines by severity Severity Number of uses Percentage
No data reported
Uses of animals for the maintenance of established genetically altered animal lines by genetic status of the
animals Genetic status Number of uses Percentage
No data reported

55
Czechia
Czechia: Narrative 2018
1. General information on any changes in trends observed since the previous reporting period.
The statistical data has been collected since 1993 in the Czech Republic. Also in year 2018 continue
trend increasing number of animal used for preservation of species since 2015.
In 2018 statistical data there are no other changes in trends observed since the previous reporting
periods.
2. Information on significant increase or decrease in use animals in any of the specific areas and
analysis of the reasons thereof.
There is no significant increase or decrease in use animals in any of the specific areas. We expect
increase in use animals in few years, especially in regulatory testing, because of development of
facilities.
3. Information on any changes in trends in actual severities and analysis of the reasons thereof.
There are no changes in trends in actual severity.
4. Particular efforts to promote the principle of replacement, reduction and refinement and its
impacts on statistics if any.
There are no impacts of principle of 3Rs on 2018 statistical data. We are expecting this impact in
subsequent years.
5. Further breakdown on the use of "other" categories if a significant proportion of animal use is
reported under this category.
Categories “other” has been used where is appropriate. When “other” has been used, “specify other”
has been always fulfilled.
6. Details on cases where the 'severe' classification is exceeded, whether pre-authorised or not,
covering the species, numbers, whether prior exemption was authorised, the details of the use and
the reasons why 'severe' classification was exceeded.
Classification “severe” is not exceeded in 2018 statistical data.

56
Czechia: Statistical Data 2018
Section 1: Numbers of animals used for the first time for research, testing, routine
production and educational (including training) purposes
Numbers of animals used for the first time by species Animal species Number of animals Percentage
Mice 67527 31.19%
Rats 21270 9.82%
Guinea-Pigs 1188 0.55%
Hamsters (Syrian) 24 0.01%
Mongolian gerbil 49 0.02%
Other rodents 717 0.33%
Rabbits 2555 1.18%
Cats 78 0.04%
Dogs 425 0.2%
Ferrets 80 0.04%
Other carnivores 38 0.02%
Horses, donkeys and cross-breeds 201 0.09%
Pigs 1719 0.79%
Goats 24 0.01%
Sheep 499 0.23%
Cattle 1565 0.72%
Other mammals 130 0.06%
Domestic fowl 20333 9.39%
Other birds 1364 0.63%
Reptiles 263 0.12%
Xenopus 20 0.01%
Zebra fish 7215 3.33%
Other fish 89251 41.22%
Total 216535 100.00%
Place of birth of animals other than non-human primates Place of birth Number of animals Percentage
Animals born in the EU at a registered breeder 202608 93.57%
Animals born in the EU but not at a registered breeder 13371 6.17%
Animals born in rest of Europe 148 0.07%
Animals born in rest of world 408 0.19%
Total 216535 100.00%
Source of non-human primates NHP Source (origin) Number of animals Percentage
No data reported
Generation of non-human primates NHP Generation Number of animals Percentage
No data reported

57
Section 2: Numbers of all uses of animals for research, testing, routine production and
educational (including training) purposes
First use versus reuses Animal species First uses Reuses Total
Mice 67527 1461 68988
Rats 21270 206 21476
Guinea-Pigs 1188 1188
Hamsters (Syrian) 24 24
Mongolian gerbil 49 49
Other rodents 717 717
Rabbits 2555 59 2614
Cats 78 78
Dogs 425 325 750
Ferrets 80 80
Other carnivores 38 38
Horses, donkeys and cross-breeds 201 16 217
Pigs 1719 575 2294
Goats 24 4 28
Sheep 499 386 885
Cattle 1565 1321 2886
Other mammals 130 7 137
Domestic fowl 20333 57 20390
Other birds 1364 26 1390
Reptiles 263 263
Xenopus 20 20
Zebra fish 7215 7215
Other fish 89251 467 89718
Total 216535 4910 221445
Uses of animals in research, testing, routine production and education (including training) by main
categories of scientific purposes Purpose Category Number of
uses Percentage
Basic Research 71821 32.43%
Translational and applied research 22655 10.23%
Regulatory use and Routine production 56482 25.51%
Protection of the natural environment in the interests of the health or welfare of human beings or animals
55110 24.89%
Preservation of species 7517 3.39%
Higher education or training for the acquisition, maintenance or improvement of vocational skills
7860 3.55%
Total 221445 100.00%
Basic research related uses Basic research Number of uses Percentage
Oncology 6946 9.67%
Cardiovascular Blood and Lymphatic System 8926 12.43%
Nervous System 10908 15.19%
Respiratory System 322 0.45%
Gastrointestinal System including Liver 2326 3.24%
Musculoskeletal System 87 0.12%

58
Immune System 11389 15.86%
Urogenital/Reproductive System 7254 10.1%
Sensory Organs (skin, eyes and ears) 146 0.2%
Endocrine System/Metabolism 4137 5.76%
Multisystemic 2658 3.7%
Ethology / Animal Behaviour /Animal Biology 2827 3.94%
Other basic research 13895 19.35%
Total 71821 100.00%
Translational and applied research related uses Translational and applied research Number of uses Percentage
Human Cancer 4877 21.53%
Human Infectious Disorders 2398 10.58%
Human Cardiovascular Disorders 2026 8.94%
Human Nervous and Mental Disorders 717 3.16%
Human Gastrointestinal Disorders including Liver 350 1.54%
Human Musculoskeletal Disorders 60 0.26%
Human Immune Disorders 97 0.43%
Human Urogenital/Reproductive Disorders 283 1.25%
Human Sensory Organ Disorders (skin, eyes and ears) 193 0.85%
Human Endocrine/Metabolism Disorders 1840 8.12%
Other Human Disorders 141 0.62%
Animal Diseases and Disorders 3404 15.03%
Animal Welfare 1285 5.67%
Diagnosis of diseases 4936 21.79%
Non-regulatory toxicology and ecotoxicology 48 0.21%
Total 22655 100.00%
Regulatory uses and Routine production Regulatory uses and Routine production Number of uses Percentage
Quality control (incl batch safety and potency testing) 10551 18.68%
Other efficacy and tolerance testing 682 1.21%
Toxicity and other safety testing including pharmacology 28512 50.48%
Routine production 16737 29.63%
Total 56482 100.00%
Regulatory uses - Quality control (including batch safety and potency testing) Regulatory uses - Quality control (including batch safety and potency testing) Number of uses Percentage
Batch safety testing 682 6.46%
Pyrogenicity testing 53 0.5%
Batch potency testing 9684 91.78%
Other quality controls 132 1.25%
Total 10551 100.00%
Regulatory uses - Toxicity and other safety testing including pharmacology Regulatory uses - Toxicity and other safety testing including pharmacology Number of uses Percentage
Acute and sub-acute 2141 7.51%
Skin irritation/corrosion 8 0.03%
Skin sensitisation 444 1.56%
Eye irritation/corrosion 6 0.02%
Repeated dose toxicity 814 2.85%
Reproductive toxicity 52 0.18%
Developmental toxicity 458 1.61%

59
Kinetics 142 0.5%
Ecotoxicity 23990 84.14%
Safety testing in food and feed area 80 0.28%
Target animal safety 48 0.17%
Other toxicity/safety testing 329 1.15%
Total 28512 100.00%
Regulatory uses - Toxicity and other safety testing including pharmacology - Acute and sub-acute toxicity
testing methods Regulatory uses - Toxicity and other safety testing including pharmacology - Acute and sub-acute toxicity testing methods
Number of uses
Percentage
LD50, LC50 651 30.41%
Other lethal methods 44 2.06%
Non lethal methods 1446 67.54%
Total 2141 100.00%
Regulatory uses - Toxicity and other safety testing including pharmacology - Repeated dose toxicity Regulatory uses - Toxicity and other safety testing including pharmacology - Repeated dose toxicity
Number of uses
Percentage
up to 28 days 94 11.55%
29 - 90 days 332 40.79%
> 90 days 388 47.67%
Total 814 100.00%
Regulatory uses - Toxicity and other safety testing including pharmacology - Ecotoxicity Regulatory uses - Toxicity and other safety testing including pharmacology - Ecotoxicity Number of uses Percentage
Acute toxicity 22440 93.54%
Other ecotoxicity 1550 6.46%
Total 23990 100.00%
Regulatory uses by type of legislation Type of legislation Number of
uses Percentage
Legislation on medicinal products for human use 2443 6.15%
Legislation on medicinal products for veterinary use and their residues 11212 28.21%
Medical devices legislation 637 1.6%
Industrial chemicals legislation 982 2.47%
Feed legislation including legislation for the safety of target animals, workers and environment
64 0.16%
Other legislation 24407 61.41%
Total 39745 100.00%
Regulatory uses by origin of regulatory requirement Origin of legislative requirement Number of uses Percentage
Legislation satisfying EU requirements 22767 57.28%
Legislation satisfying national requirements only [within EU] 16978 42.72%
Total 39745 100.00%
Routine production uses by product type Product type Number of uses Percentage
Blood based products 775 4.63%
Monoclonal antibody by mouse ascites method 93 0.56%
Other product types 15869 94.81%

60
Total 16737 100.00%
Uses of animals in research, testing, routine production and education (including training) by first use and
reuses Reuse Number of uses Percentage
No 216535 97.78%
Yes 4910 2.22%
Total 221445 100.00%
Uses of animals in research, testing, routine production and education (including training) by severity Severity Number of uses Percentage
Non-recovery 12214 5.52%
Mild [up to and including] 80680 36.43%
Moderate 105495 47.64%
Severe 23056 10.41%
Total 221445 100.00%
Uses of animals in research, testing, routine production and education (including training) by genetic status
of animals Genetic status Number of uses Percentage
Not genetically altered 190772 86.15%
Genetically altered without a harmful phenotype 26635 12.03%
Genetically altered with a harmful phenotype 4038 1.82%
Total 221445 100.00%

61
Section 3: Creation and maintenance of genetically altered animal lines
All uses of animals for the creation of new genetically altered animal lines by species, first uses and reuses Animal species First uses Reuses Total
Mice 9464 9464
Rats 141 141
Hamsters (Syrian) 89 89
Domestic fowl 100 100
Total 9794 9794
Uses of animals for the creation of new genetically altered animal lines by severity Severity Number of uses Percentage
Non-recovery 6418 65.53%
Mild [up to and including] 628 6.41%
Moderate 2748 28.06%
Total 9794 100.00%
Uses of animals for the creation of new genetically altered animal lines by genetic status of the animals Genetic status Number of uses Percentage
Not genetically altered 144 1.47%
Genetically altered without a harmful phenotype 9587 97.89%
Genetically altered with a harmful phenotype 63 0.64%
Total 9794 100.00%
Uses of animals for the creation of new genetically altered animal lines by type of basic research purposes Basic research Number of uses Percentage
Cardiovascular Blood and Lymphatic System 111 1.15%
Nervous System 641 6.65%
Immune System 2587 26.84%
Urogenital/Reproductive System 5932 61.54%
Other basic research 369 3.83%
Total 9640 100.00%
Uses of animals for the creation of new genetically altered animal lines by type of translational and applied
research purposes Translational and applied research Number of uses Percentage
Animal Diseases and Disorders 100 64.94%
Animal Welfare 54 35.06%
Total 154 100.00%
All uses of animals for the maintenance of established genetically altered animal lines by species Animal species First uses Reuses Total uses
Mice 626 626
Total 626 626
Uses of animals for the maintenance of established genetically altered animal lines by severity Severity Number of uses Percentage
Mild [up to and including] 626 100%
Total 626 100.00%

62
Uses of animals for the maintenance of established genetically altered animal lines by genetic status of the
animals Genetic status Number of uses Percentage
Genetically altered without a harmful phenotype 626 100%
Total 626 100.00%

63
Denmark
Denmark: Narrative 2018
1. General information on any changes in trends observed since the previous reporting period
In 2018, the overall number of animals used for experimental procedures in Denmark was 249,747. The
number is slightly higher than in 2017, where the total number of animals was 235,512 resulting in a 6 %
increase. The increase can be explained by a rise in the use of mainly mice but also in mink and domestic
fowl compared to 2017.
The majority of experimental procedures used mice (70 %), rats (15 %) and fish (6 %) and together these
species were used in approx. 91 % of all experimental procedures in 2018. A high percentage of
experimental procedures involving mice and rats are Oncology and Immune system (basic research
purposes) and Human Endocrine / Metabolism Disorders and Human Nervous and Mental Disorders
(translational and applied research purposes). Fish are mostly used for experimental procedures
involving Ethology / Animal behavior / Animal biology (basic research purpose) and animal diseases and
disorders (translational and applied research purpose).
The overall distribution in purposes of procedures for all animal species are 41 % Basic research, 46 %
Translational and applied research and 10 % Regulatory testing for 2018.
The severity assessment for 2018 shows that 61 % of experimental procedures in animals were mild and
32 % were moderate. Only 1 % of the animals used for experimental procedures experienced severe
suffering in 2018 and this confirms the trend from the previous years.
2. Information on significant increase or decrease in used animals in any of the specific areas and
analysis of the reasons thereof
The number of mice and rats has remained stable for several years. In 2018 the number of mice is
slightly higher (175.708 mice) compared to 2017 (163.281 mice) resulting in roughly 8 % increase, but
there is no obvious reason. A rising use of GA animals could affect the number of mice, but the use of
GA animals has not changed significantly from 2017 to 2018. The explanation could therefore be that in
a small country like Denmark, a strengthened focus from a few research groups can have a large impact
on the statistics.
The use of 3.077 mink in 2018 is remarkably high, as the number in 2017 was only 935 animals. This is
due to two research groups, where one is new, both studying animal welfare and animal behavior in
mink for farming. The research focus is especially on nutrition/metabolism and weaning of cups and the
vast majority of these experiments are within mild severity.
Finally, there has been an increase in the use of domestic fowls from 402 animals in 2017 to 2.283
animals in 2018. A large public interest has caused an increased research effort on animal welfare for
domestic fowls used in farming with special focus on combatting infectious diseases and pathology.

64
In recent years, Denmark is experiencing an increased public interest in animal welfare in farm animals.
Therefore, the need for research within this area will probably continue the following years.
3. Information on any changes in trends in actual severities and analysis of the reasons thereof
There has been an increase in the percentage of mild severity from 53 % in 2017 to 61 % in 2018 and a
small drop in the percentage of moderate severity from 36 % in 2017 to 32 % in 2018. There is no
apparent explanation for this change, but the Danish competent authority will follow the numbers
closely in order to identify any lasting changes.
The number of animals experiencing severe severity has increased from 0.74 % in 2017 to 1.14 % in
2018. Compared to the number from 2016, which was 1.57%, the numbers are relatively stable and
consistently low. As Denmark generally has few animals experiencing severe severity, a changed focus
from just one or two research groups can affect the statistical outcome in one way or the other.
4. Particular efforts to promote the principle of replacement, reduction and refinement and its
impacts on statistics if any.
The Danish National Committee supports the animal welfare bodies by hosting a yearly meeting,
providing platforms for charring best practice and dissemination of guidelines.
The National Committee has also initiated a survey to optimize the use of animals for the purpose of
higher education and training in relation to the 3R’s. In Denmark, 2 % of all animals used for scientific
research purposes fall into this category.
The Danish 3R-center is still working hard to promote the 3R’s and one way is by funding research.
Another event is the 3R-centers annual symposium, which is open to all interested. In 2018, some of the
key topics were improving reproducibility and translatability, animal free methods and unconscious bias
in scientific research. Further information is available on www.3rcenter.dk.
The Danish Animal Experiments Inspectorate hosts three annual mini-seminars for both scientific staff
and animal caretakers. The seminars are a good forum for discussing best practice and new models, as
well as disseminating information on the legislation and correct statistical reporting.
5. Further breakdown on the use of "other" categories if a significant proportion of animal use is
reported under this category
On three cases the use of the category ‘Other’ is relatively high in Denmark – this concerns ‘other
carnivores’, ‘other fish’ and ‘other birds’.
Denmark has a large proportion of commercial aquaculture and fur production. Therefore, the
distribution of carnivores and fish in the category ‘other’ is very high. The number of ‘other fish’ (82 %) is
due to a large research focus on farming especially rainbow trout, seabass, cod and salmon. The number
of ‘other carnivores’ (90 %) is due to a large research focus on improving animal welfare for farming
mink.

65
Research involving “other birds” are primarily field studies on i.e. common eider, common redstart and
willow warbler with focus on population research and spread of diseases studies.
6. Details on cases where the 'severe' classification is exceeded, whether pre-authorised or not,
covering the species, numbers, whether prior exemption was authorised, the details of the use and
the reasons why 'severe' classification was exceeded.
Denmark has no cases where the ‘severe’ classification was exceeded in 2018.
Denmark: Statistical Data 2018
Section 1: Numbers of animals used for the first time for research, testing, routine
production and educational (including training) purposes
Numbers of animals used for the first time by species Animal species Number of animals Percentage
Mice 172248 70.12%
Rats 36360 14.8%
Guinea-Pigs 2659 1.08%
Hamsters (Syrian) 292 0.12%
Other rodents 13 0.01%
Rabbits 3116 1.27%
Cats 3 0%
Dogs 357 0.15%
Other carnivores 3077 1.25%
Horses, donkeys and cross-breeds 178 0.07%
Pigs 6977 2.84%
Goats 13 0.01%
Sheep 75 0.03%
Cattle 1997 0.81%
Other mammals 28 0.01%
Domestic fowl 2283 0.93%
Other birds 559 0.23%
Reptiles 155 0.06%
Rana 809 0.33%
Xenopus 429 0.17%
Other amphibians 94 0.04%
Zebra fish 2028 0.83%
Other fish 11888 4.84%
Total 245638 100.00%
Place of birth of animals other than non-human primates Place of birth Number of animals Percentage
Animals born in the EU at a registered breeder 212734 86.6%
Animals born in the EU but not at a registered breeder 23373 9.52%
Animals born in rest of Europe 2866 1.17%
Animals born in rest of world 6665 2.71%
Total 245638 100.00%
Source of non-human primates NHP Source (origin) Number of animals Percentage

66
No data reported
Generation of non-human primates NHP Generation Number of animals Percentage
No data reported

67
Section 2: Numbers of all uses of animals for research, testing, routine production and
educational (including training) purposes
First use versus reuses Animal species First uses Reuses Total
Mice 172248 2263 174511
Rats 36360 920 37280
Guinea-Pigs 2659 2659
Hamsters (Syrian) 292 292
Other rodents 13 13
Rabbits 3116 3116
Cats 3 3
Dogs 357 13 370
Other carnivores 3077 270 3347
Horses, donkeys and cross-breeds 178 3 181
Pigs 6977 666 7643
Goats 13 13
Sheep 75 3 78
Cattle 1997 2 1999
Other mammals 28 1 29
Domestic fowl 2283 2283
Other birds 559 559
Reptiles 155 155
Rana 809 809
Xenopus 429 960 1389
Other amphibians 94 94
Zebra fish 2028 2028
Other fish 11888 11888
Total 245638 5101 250739
Uses of animals in research, testing, routine production and education (including training) by main
categories of scientific purposes Purpose Category Number of
uses Percentage
Basic Research 101815 40.61%
Translational and applied research 117026 46.67%
Regulatory use and Routine production 24225 9.66%
Protection of the natural environment in the interests of the health or welfare of human beings or animals
1598 0.64%
Preservation of species 943 0.38%
Higher education or training for the acquisition, maintenance or improvement of vocational skills
5132 2.05%
Total 250739 100.00%
Basic research related uses Basic research Number of uses Percentage
Oncology 22009 21.62%
Cardiovascular Blood and Lymphatic System 5251 5.16%
Nervous System 15611 15.33%
Respiratory System 2608 2.56%
Gastrointestinal System including Liver 3676 3.61%
Musculoskeletal System 2935 2.88%

68
Immune System 25598 25.14%
Urogenital/Reproductive System 1119 1.1%
Sensory Organs (skin, eyes and ears) 401 0.39%
Endocrine System/Metabolism 11364 11.16%
Multisystemic 215 0.21%
Ethology / Animal Behaviour /Animal Biology 6370 6.26%
Other basic research 4658 4.57%
Total 101815 100.00%
Translational and applied research related uses Translational and applied research Number of uses Percentage
Human Cancer 8285 7.08%
Human Infectious Disorders 7899 6.75%
Human Cardiovascular Disorders 4200 3.59%
Human Nervous and Mental Disorders 27344 23.37%
Human Respiratory Disorders 48 0.04%
Human Gastrointestinal Disorders including Liver 303 0.26%
Human Musculoskeletal Disorders 398 0.34%
Human Immune Disorders 2678 2.29%
Human Urogenital/Reproductive Disorders 904 0.77%
Human Sensory Organ Disorders (skin, eyes and ears) 126 0.11%
Human Endocrine/Metabolism Disorders 44717 38.21%
Other Human Disorders 6537 5.59%
Animal Diseases and Disorders 9314 7.96%
Animal Welfare 2516 2.15%
Diagnosis of diseases 1231 1.05%
Non-regulatory toxicology and ecotoxicology 526 0.45%
Total 117026 100.00%
Regulatory uses and Routine production Regulatory uses and Routine production Number of uses Percentage
Quality control (incl batch safety and potency testing) 18545 76.55%
Other efficacy and tolerance testing 619 2.56%
Toxicity and other safety testing including pharmacology 4275 17.65%
Routine production 786 3.24%
Total 24225 100.00%
Regulatory uses - Quality control (including batch safety and potency testing) Regulatory uses - Quality control (including batch safety and potency testing) Number of uses Percentage
Batch safety testing 3484 18.79%
Batch potency testing 15061 81.21%
Total 18545 100.00%
Regulatory uses - Toxicity and other safety testing including pharmacology Regulatory uses - Toxicity and other safety testing including pharmacology Number of uses Percentage
Acute and sub-acute 160 3.74%
Skin irritation/corrosion 16 0.37%
Skin sensitisation 118 2.76%
Repeated dose toxicity 2292 53.61%
Reproductive toxicity 480 11.23%
Kinetics 361 8.44%
Pharmaco-dynamics (incl safety pharmacology) 687 16.07%
Ecotoxicity 154 3.6%

69
Other toxicity/safety testing 7 0.16%
Total 4275 100.00%
Regulatory uses - Toxicity and other safety testing including pharmacology - Acute and sub-acute toxicity
testing methods Regulatory uses - Toxicity and other safety testing including pharmacology - Acute and sub-acute toxicity testing methods
Number of uses
Percentage
Non lethal methods 160 100%
Total 160 100.00%
Regulatory uses - Toxicity and other safety testing including pharmacology - Repeated dose toxicity Regulatory uses - Toxicity and other safety testing including pharmacology - Repeated dose toxicity
Number of uses
Percentage
up to 28 days 1174 51.22%
29 - 90 days 895 39.05%
> 90 days 223 9.73%
Total 2292 100.00%
Regulatory uses - Toxicity and other safety testing including pharmacology - Ecotoxicity Regulatory uses - Toxicity and other safety testing including pharmacology - Ecotoxicity Number of uses Percentage
Acute toxicity 154 100%
Total 154 100.00%
Regulatory uses by type of legislation Type of legislation Number of uses Percentage
Legislation on medicinal products for human use 22525 96.1%
Industrial chemicals legislation 634 2.7%
Other legislation 280 1.19%
Total 23439 100.00%
Regulatory uses by origin of regulatory requirement Origin of legislative requirement Number of uses Percentage
Legislation satisfying EU requirements 23439 100%
Total 23439 100.00%
Routine production uses by product type Product type Number of uses Percentage
Blood based products 786 100%
Total 786 100.00%
Uses of animals in research, testing, routine production and education (including training) by first use and
reuses Reuse Number of uses Percentage
No 245638 97.97%
Yes 5101 2.03%
Total 250739 100.00%
Uses of animals in research, testing, routine production and education (including training) by severity Severity Number of uses Percentage
Non-recovery 14016 5.59%
Mild [up to and including] 151794 60.54%
Moderate 82027 32.71%
Severe 2902 1.16%

70
Total 250739 100.00%
Uses of animals in research, testing, routine production and education (including training) by genetic status
of animals Genetic status Number of uses Percentage
Not genetically altered 212489 84.75%
Genetically altered without a harmful phenotype 28009 11.17%
Genetically altered with a harmful phenotype 10241 4.08%
Total 250739 100.00%

71
Section 3: Creation and maintenance of genetically altered animal lines
All uses of animals for the creation of new genetically altered animal lines by species, first uses and reuses Animal species First uses Reuses Total
Mice 3281 3281
Zebra fish 649 649
Total 3930 3930
Uses of animals for the creation of new genetically altered animal lines by severity Severity Number of uses Percentage
Non-recovery 109 2.77%
Mild [up to and including] 3787 96.36%
Moderate 31 0.79%
Severe 3 0.08%
Total 3930 100.00%
Uses of animals for the creation of new genetically altered animal lines by genetic status of the animals Genetic status Number of uses Percentage
Not genetically altered 1947 49.54%
Genetically altered without a harmful phenotype 1982 50.43%
Genetically altered with a harmful phenotype 1 0.03%
Total 3930 100.00%
Uses of animals for the creation of new genetically altered animal lines by type of basic research purposes Basic research Number of uses Percentage
Oncology 1 0.03%
Nervous System 415 10.81%
Gastrointestinal System including Liver 6 0.16%
Urogenital/Reproductive System 119 3.1%
Endocrine System/Metabolism 150 3.91%
Multisystemic 358 9.32%
Other basic research 2791 72.68%
Total 3840 100.00%
Uses of animals for the creation of new genetically altered animal lines by type of translational and applied
research purposes Translational and applied research Number of uses Percentage
Human Musculoskeletal Disorders 60 66.67%
Human Endocrine/Metabolism Disorders 30 33.33%
Total 90 100.00%
All uses of animals for the maintenance of established genetically altered animal lines by species Animal species First uses Reuses Total uses
Mice 179 179
Total 179 179
Uses of animals for the maintenance of established genetically altered animal lines by severity Severity Number of uses Percentage
Mild [up to and including] 2 1.12%
Moderate 173 96.65%
Severe 4 2.23%
Total 179 100.00%

72
Uses of animals for the maintenance of established genetically altered animal lines by genetic status of the
animals Genetic status Number of uses Percentage
Genetically altered with a harmful phenotype 179 100%
Total 179 100.00%

73
Estonia
Estonia: Narrative 2018
1. General information on any changes in trends observed since the previous reporting period.
There were less project applications submitted and consequently authorisations granted in 2018
comparing to previous years. The number of animals used has been decreasing year after year with now
a minor decline of 4,64% from 3146 animals used in 2017 to 3000 in 2018. Use of GA animals increased
from 38% in 2017 to 48% in 2018. Of those animals 0.5% had a harmful phenotype (none in 2017). While
for creation of new GL 2,8% of animals were used in 2017, no animals were used for that purpose in
2018. Mice were still the most commonly used species, however their use dropped 23,35% from 2578
animals in 2017 to 1976 animals in 2018. Also, use of rats declined by almost 1/5 in 2018. There was an
increase in the use of cattle, fish and rabbits. In 2017 and 2018 all animals used were born in the EU. In
2017 94,28% of all animals used were born at a registered breeder and in 2018 it had dropped to 83,9%.
No re-use occurred neither in 2017 nor 2018.
2. Information on significant increase or decrease in use animals in any of the specific areas and
analysis of the reasons thereof.
The most significant change in use of animals occurred in the maintenance of GA colonies, where uses
increased from 12,5% in 2017 to 21,4% of all uses in 2018 since laboratories are using more GA lines.
The most uses overall still occurred in basic research which accounted for 76% of all uses in 2017 and
72,1% in 2018 with numbers of animals 2392 and 2165 respectively. The numbers dropped slightly due
to fewer active projects during the reporting year. In 2017 oncology was the area of basic research with
the highest numbers of animals used (41% of animals used for basic research and ~1/3 of all uses) but in
2018 it was Ethology/Animal Behaviour/Animal Biology (22,3% of animals used in basic research and
16,1% of all uses). This change was due to more projects being authorised for research of wildlife
populations. In 2017 3,56% of all uses were for regulatory use, none in 2018. The decrease in use of
animals was insignificant, ranging from 1,6% to 0,1% in 2018 compared to 2017 in translational and
applied research and education and training.
3. Information on any changes in trends in actual severities and analysis of the reasons thereof.
Of all uses in 2017 44,02% were classified as mild, 43,04% moderate, 8,74% severe and 4,2% non-
recovery. In 2018 the proportions were 29,87% mild, 48,27% moderate, 5,83% severe and 16,03% non-
recovery. The rise in non-recovery in 2018 was due to the increased use of animals in cardiovascular
system research.
4. Particular efforts to promote the principle of replacement, reduction and refinement and its
impacts on statistics if any.
We have continued the process of carefully evaluating each application along with their compliance to
the 3Rs. The members of our PAC include experts in mathematical statistics, pharmacology and welfare

74
of experimental animals who along with other members of the committee help make sure that use of
3Rs has been considered and applied.
5. Further breakdown on the use of "other" categories if a significant proportion of animal use is
reported under this category.
The proportion of animals classified as “other” was 16,1% of all animals used in 2018. 72 birds were
classified as “other” and accounted for 2,4% of all animals used. Of those 42 were great tits (Parus
major) and 30 were common gulls (Larus canus). “Other” fish accounted for 13,7% of all animals used in
2018. All 411 fish categorised as “other” were northern pike (Esox lucius).
6. Details on cases where the 'severe' classification is exceeded, whether pre-authorised or not,
covering the species, numbers, whether prior exemption was authorised, the details of the use and
the reasons why 'severe' classification was exceeded.
There haven’t been any cases where severity has exceeded the “severe” classification. Also, no projects
exceeding severe classification have been authorised.
Estonia: Statistical Data 2018
Section 1: Numbers of animals used for the first time for research, testing, routine
production and educational (including training) purposes
Numbers of animals used for the first time by species Animal species Number of animals Percentage
Mice 1333 56.55%
Rats 295 12.52%
Rabbits 12 0.51%
Pigs 4 0.17%
Cattle 163 6.92%
Domestic fowl 67 2.84%
Other birds 72 3.05%
Other fish 411 17.44%
Total 2357 100.00%
Place of birth of animals other than non-human primates Place of birth Number of animals Percentage
Animals born in the EU at a registered breeder 1874 79.51%
Animals born in the EU but not at a registered breeder 483 20.49%
Total 2357 100.00%
Source of non-human primates NHP Source (origin) Number of animals Percentage
No data reported
Generation of non-human primates NHP Generation Number of animals Percentage
No data reported

75
Section 2: Numbers of all uses of animals for research, testing, routine production and
educational (including training) purposes
First use versus reuses Animal species First uses Reuses Total
Mice 1333 1333
Rats 295 295
Rabbits 12 12
Pigs 4 4
Cattle 163 163
Domestic fowl 67 67
Other birds 72 72
Other fish 411 411
Total 2357 2357
Uses of animals in research, testing, routine production and education (including training) by main
categories of scientific purposes Purpose Category Number of
uses Percentage
Basic Research 2165 91.85%
Translational and applied research 154 6.53%
Higher education or training for the acquisition, maintenance or improvement of vocational skills
38 1.61%
Total 2357 100.00%
Basic research related uses Basic research Number of uses Percentage
Oncology 373 17.23%
Cardiovascular Blood and Lymphatic System 359 16.58%
Nervous System 361 16.67%
Gastrointestinal System including Liver 36 1.66%
Musculoskeletal System 32 1.48%
Immune System 154 7.11%
Sensory Organs (skin, eyes and ears) 72 3.33%
Endocrine System/Metabolism 190 8.78%
Multisystemic 84 3.88%
Ethology / Animal Behaviour /Animal Biology 483 22.31%
Other basic research 21 0.97%
Total 2165 100.00%
Translational and applied research related uses Translational and applied research Number of uses Percentage
Animal Diseases and Disorders 154 100%
Total 154 100.00%
Regulatory uses and Routine production Regulatory uses and Routine production Number of uses Percentage
No data reported
Regulatory uses - Quality control (including batch safety and potency testing) Regulatory uses - Quality control (including batch safety and potency testing) Number of uses Percentage
No data reported

76
Regulatory uses - Toxicity and other safety testing including pharmacology Regulatory uses - Toxicity and other safety testing including pharmacology Number of uses Percentage
No data reported
Regulatory uses - Toxicity and other safety testing including pharmacology - Acute and sub-acute toxicity
testing methods Regulatory uses - Toxicity and other safety testing including pharmacology - Acute and sub-acute toxicity testing methods
Number of uses
Percentage
No data reported
Regulatory uses - Toxicity and other safety testing including pharmacology - Repeated dose toxicity Regulatory uses - Toxicity and other safety testing including pharmacology - Repeated dose toxicity
Number of uses
Percentage
No data reported
Regulatory uses - Toxicity and other safety testing including pharmacology - Ecotoxicity Regulatory uses - Toxicity and other safety testing including pharmacology - Ecotoxicity Number of uses Percentage
No data reported
Regulatory uses by type of legislation Type of legislation Number of uses Percentage
No data reported
Regulatory uses by origin of regulatory requirement Origin of legislative requirement Number of uses Percentage
No data reported
Routine production uses by product type Product type Number of uses Percentage
No data reported
Uses of animals in research, testing, routine production and education (including training) by first use and
reuses Reuse Number of uses Percentage
No 2357 100%
Total 2357 100.00%
Uses of animals in research, testing, routine production and education (including training) by severity Severity Number of uses Percentage
Non-recovery 481 20.41%
Mild [up to and including] 896 38.01%
Moderate 805 34.15%
Severe 175 7.42%
Total 2357 100.00%
Uses of animals in research, testing, routine production and education (including training) by genetic status
of animals Genetic status Number of uses Percentage
Not genetically altered 1554 65.93%
Genetically altered without a harmful phenotype 788 33.43%

77
Genetically altered with a harmful phenotype 15 0.64%
Total 2357 100.00%

78
Section 3: Creation and maintenance of genetically altered animal lines
All uses of animals for the creation of new genetically altered animal lines by species, first uses and reuses Animal species First uses Reuses Total
No data reported
Uses of animals for the creation of new genetically altered animal lines by severity Severity Number of uses Percentage
No data reported
Uses of animals for the creation of new genetically altered animal lines by genetic status of the animals Genetic status Number of uses Percentage
No data reported
Uses of animals for the creation of new genetically altered animal lines by type of basic research purposes Basic research Number of uses Percentage
No data reported
Uses of animals for the creation of new genetically altered animal lines by type of translational and applied
research purposes Translational and applied research Number of uses Percentage
No data reported
All uses of animals for the maintenance of established genetically altered animal lines by species Animal species First uses Reuses Total uses
Mice 643 643
Total 643 643
Uses of animals for the maintenance of established genetically altered animal lines by severity Severity Number of uses Percentage
Moderate 643 100%
Total 643 100.00%
Uses of animals for the maintenance of established genetically altered animal lines by genetic status of the
animals Genetic status Number of uses Percentage
Genetically altered without a harmful phenotype 643 100%
Total 643 100.00%

79
Finland
Finland: Narrative 2018
1. General information on any changes in trends observed since the previous reporting period.
In year 2018, 110 723 procedures were done in Finland, which was 8 % more than in 2017 (102 575
procedures).
The overall picture was quite similar as in previous years, the most used species being mice, rats, zebra
fish and other fish. The use of mice and zebra fish included regularly gene modification.
2. Information on significant increase or decrease in use animals in any of the specific areas and
analysis of the reasons thereof.
The changes seemed to be caused by changes in activities of single research groups. The severe
procedures decreased from 13 % (year 2017) to 11 % of all procedures in mice and rats.
The greatest increases in the numbers of procedures occurred with Other fish, Dogs and Other rodents
(8 971, 3 236 and 1 849 animals more, respectively).
Other fish (mainly salmon species) were used in Basic Research in areas of Immune system,
Ethology/Animal Behaviour/Animal Biology and Urogenital/Reproductive System. The increases in
numbers were due to increased research in these areas. The severity of procedures were mainly Mild.
Dogs used in procedures were mainly needed for purpose of Translational and Applied Research/Animal
Diseases and Disorders, where 5981 pet dogs and 187 pet cats gave a blood sample for the studies of
disease genes. Pets participated also in patient studies (31 procedures in cats and 159 in dogs). Dogs
bred and used in laboratory included 157 procedures with 117 re-use. Severity of dog procedures were
Mild (6 258 procedures) or Moderate (39 procedures).
Other rodents used were voles needed for studies in Basic Research, Ethology/Animal Behaviour/Animal
Biology.
3. Information on any changes in trends in actual severities and analysis of the reasons thereof.
The severity of procedures were classified as 10 % Non-recovery, 52 % Mild, 32 % Moderate and 6 %
Severe. The severe procedures involved 4857 mice (7 125 in 2017) and 1 940 rats (1 568 in 2017). As in
previous years, the severe procedures were done mainly in the purpose of Human nervous and mental
disorders in translational research (4802 procedures, 29 % decrease).
4. Particular efforts to promote the principle of replacement, reduction and refinement and its
impacts on statistics if any.
The National Committee for the Protection of Animals Used for Scientific and Educational Purposes in
Finland promoted education and 3R information sharing in Finland via 3R working group. The group

80
organized four courses 2018-2019: In vitro models, Ethical principles in using laboratory animals, In
silico -training, and Modern Methods in Life Science and Drug Research. The 3R group will arranged
meetings with researchers using and developing replacement models and the responsible persons from
institutions using animals to make further plans of a 3R Consortium in Finland. The Consortium aims to
act as a national focal point on 3Rs and promote the 3Rs on national level. It will organize education,
share information and promote co-research projects. The coordinator of 3R-consortium is FICAM, The
Finnish Centre for Alternative Methods, Tampere university. FICAM participated in 3R activities listed
above.
5. Further breakdown on the use of "other" categories if a significant proportion of animal use is
reported under this category.
-
6. Details on cases where the 'severe' classification is exceeded, whether pre-authorised or not,
covering the species, numbers, whether prior exemption was authorised, the details of the use and
the reasons why 'severe' classification was exceeded.
The severe classification was not exceeded in any procedures.
Finland: Statistical Data 2018
Section 1: Numbers of animals used for the first time for research, testing, routine
production and educational (including training) purposes
Numbers of animals used for the first time by species Animal species Number of animals Percentage
Mice 47444 45.11%
Rats 10890 10.35%
Guinea-Pigs 1 0%
Hamsters (Syrian) 72 0.07%
Other rodents 2539 2.41%
Rabbits 186 0.18%
Cats 218 0.21%
Dogs 6180 5.88%
Other carnivores 35 0.03%
Horses, donkeys and cross-breeds 144 0.14%
Pigs 958 0.91%
Sheep 1348 1.28%
Cattle 165 0.16%
Other mammals 319 0.3%
Domestic fowl 5468 5.2%
Other birds 1063 1.01%
Reptiles 30 0.03%
Other amphibians 77 0.07%
Zebra fish 7339 6.98%
Other fish 20700 19.68%
Total 105176 100.00%

81
Place of birth of animals other than non-human primates Place of birth Number of animals Percentage
Animals born in the EU at a registered breeder 75710 71.98%
Animals born in the EU but not at a registered breeder 25524 24.27%
Animals born in rest of Europe 14 0.01%
Animals born in rest of world 3928 3.73%
Total 105176 100.00%
Source of non-human primates NHP Source (origin) Number of animals Percentage
No data reported
Generation of non-human primates NHP Generation Number of animals Percentage
No data reported

82
Section 2: Numbers of all uses of animals for research, testing, routine production and
educational (including training) purposes
First use versus reuses Animal species First uses Reuses Total
Mice 47444 55 47499
Rats 10890 61 10951
Guinea-Pigs 1 1
Hamsters (Syrian) 72 72
Other rodents 2539 2539
Rabbits 186 186
Cats 218 218
Dogs 6180 117 6297
Other carnivores 35 35
Horses, donkeys and cross-breeds 144 92 236
Pigs 958 958
Sheep 1348 1348
Cattle 165 25 190
Other mammals 319 319
Domestic fowl 5468 5468
Other birds 1063 1063
Reptiles 30 30
Other amphibians 77 77
Zebra fish 7339 7339
Other fish 20700 20700
Total 105176 350 105526
Uses of animals in research, testing, routine production and education (including training) by main
categories of scientific purposes Purpose Category Number of
uses Percentage
Basic Research 58571 55.5%
Translational and applied research 37275 35.32%
Regulatory use and Routine production 7481 7.09%
Preservation of species 46 0.04%
Higher education or training for the acquisition, maintenance or improvement of vocational skills
2153 2.04%
Total 105526 100.00%
Basic research related uses Basic research Number of uses Percentage
Oncology 3499 5.97%
Cardiovascular Blood and Lymphatic System 3453 5.9%
Nervous System 8598 14.68%
Respiratory System 150 0.26%
Gastrointestinal System including Liver 419 0.72%
Musculoskeletal System 557 0.95%
Immune System 11553 19.72%
Urogenital/Reproductive System 4985 8.51%
Sensory Organs (skin, eyes and ears) 481 0.82%
Endocrine System/Metabolism 2268 3.87%
Multisystemic 8641 14.75%

83
Ethology / Animal Behaviour /Animal Biology 12417 21.2%
Other basic research 1550 2.65%
Total 58571 100.00%
Translational and applied research related uses Translational and applied research Number of uses Percentage
Human Cancer 4177 11.21%
Human Infectious Disorders 2481 6.66%
Human Cardiovascular Disorders 671 1.8%
Human Nervous and Mental Disorders 17395 46.67%
Human Gastrointestinal Disorders including Liver 74 0.2%
Human Musculoskeletal Disorders 346 0.93%
Human Immune Disorders 264 0.71%
Human Urogenital/Reproductive Disorders 42 0.11%
Human Sensory Organ Disorders (skin, eyes and ears) 2462 6.6%
Human Endocrine/Metabolism Disorders 1066 2.86%
Other Human Disorders 198 0.53%
Animal Diseases and Disorders 6946 18.63%
Animal Welfare 133 0.36%
Diagnosis of diseases 459 1.23%
Non-regulatory toxicology and ecotoxicology 561 1.51%
Total 37275 100.00%
Regulatory uses and Routine production Regulatory uses and Routine production Number of uses Percentage
Quality control (incl batch safety and potency testing) 4478 59.86%
Other efficacy and tolerance testing 218 2.91%
Toxicity and other safety testing including pharmacology 1309 17.5%
Routine production 1476 19.73%
Total 7481 100.00%
Regulatory uses - Quality control (including batch safety and potency testing) Regulatory uses - Quality control (including batch safety and potency testing) Number of uses Percentage
Batch safety testing 4478 100%
Total 4478 100.00%
Regulatory uses - Toxicity and other safety testing including pharmacology Regulatory uses - Toxicity and other safety testing including pharmacology Number of uses Percentage
Acute and sub-acute 15 1.15%
Repeated dose toxicity 102 7.79%
Kinetics 259 19.79%
Pharmaco-dynamics (incl safety pharmacology) 933 71.28%
Total 1309 100.00%
Regulatory uses - Toxicity and other safety testing including pharmacology - Acute and sub-acute toxicity
testing methods Regulatory uses - Toxicity and other safety testing including pharmacology - Acute and sub-acute toxicity testing methods
Number of uses
Percentage
Non lethal methods 15 100%
Total 15 100.00%
Regulatory uses - Toxicity and other safety testing including pharmacology - Repeated dose toxicity Regulatory uses - Toxicity and other safety testing including pharmacology - Repeated dose Number of Percentage

84
toxicity uses
29 - 90 days 6 5.88%
> 90 days 96 94.12%
Total 102 100.00%
Regulatory uses - Toxicity and other safety testing including pharmacology - Ecotoxicity Regulatory uses - Toxicity and other safety testing including pharmacology - Ecotoxicity Number of uses Percentage
No data reported
Regulatory uses by type of legislation Type of legislation Number of
uses Percentage
Legislation on medicinal products for human use 1349 22.46%
Legislation on medicinal products for veterinary use and their residues 4609 76.75%
Feed legislation including legislation for the safety of target animals, workers and environment
47 0.78%
Total 6005 100.00%
Regulatory uses by origin of regulatory requirement Origin of legislative requirement Number of uses Percentage
Legislation satisfying EU requirements 6005 100%
Total 6005 100.00%
Routine production uses by product type Product type Number of uses Percentage
Blood based products 1476 100%
Total 1476 100.00%
Uses of animals in research, testing, routine production and education (including training) by first use and
reuses Reuse Number of uses Percentage
No 105176 99.67%
Yes 350 0.33%
Total 105526 100.00%
Uses of animals in research, testing, routine production and education (including training) by severity Severity Number of uses Percentage
Non-recovery 11048 10.47%
Mild [up to and including] 54237 51.4%
Moderate 33382 31.63%
Severe 6859 6.5%
Total 105526 100.00%
Uses of animals in research, testing, routine production and education (including training) by genetic status
of animals Genetic status Number of uses Percentage
Not genetically altered 81147 76.9%
Genetically altered without a harmful phenotype 19274 18.26%
Genetically altered with a harmful phenotype 5105 4.84%
Total 105526 100.00%

85
Section 3: Creation and maintenance of genetically altered animal lines
All uses of animals for the creation of new genetically altered animal lines by species, first uses and reuses Animal species First uses Reuses Total
Mice 3773 3773
Zebra fish 1139 1139
Total 4912 4912
Uses of animals for the creation of new genetically altered animal lines by severity Severity Number of uses Percentage
Non-recovery 272 5.54%
Mild [up to and including] 2845 57.92%
Moderate 1794 36.52%
Severe 1 0.02%
Total 4912 100.00%
Uses of animals for the creation of new genetically altered animal lines by genetic status of the animals Genetic status Number of uses Percentage
Not genetically altered 2007 40.86%
Genetically altered without a harmful phenotype 2758 56.15%
Genetically altered with a harmful phenotype 147 2.99%
Total 4912 100.00%
Uses of animals for the creation of new genetically altered animal lines by type of basic research purposes Basic research Number of uses Percentage
Oncology 115 2.84%
Cardiovascular Blood and Lymphatic System 17 0.42%
Nervous System 662 16.33%
Gastrointestinal System including Liver 69 1.7%
Immune System 1219 30.08%
Endocrine System/Metabolism 431 10.63%
Multisystemic 1540 38%
Total 4053 100.00%
Uses of animals for the creation of new genetically altered animal lines by type of translational and applied
research purposes Translational and applied research Number of uses Percentage
Human Cancer 148 17.23%
Human Infectious Disorders 314 36.55%
Human Cardiovascular Disorders 13 1.51%
Human Nervous and Mental Disorders 77 8.96%
Human Immune Disorders 307 35.74%
Total 859 100.00%
All uses of animals for the maintenance of established genetically altered animal lines by species Animal species First uses Reuses Total uses
Mice 285 285
Total 285 285
Uses of animals for the maintenance of established genetically altered animal lines by severity Severity Number of uses Percentage
Mild [up to and including] 196 68.77%

86
Moderate 89 31.23%
Total 285 100.00%
Uses of animals for the maintenance of established genetically altered animal lines by genetic status of the
animals Genetic status Number of uses Percentage
Not genetically altered 37 12.98%
Genetically altered without a harmful phenotype 102 35.79%
Genetically altered with a harmful phenotype 146 51.23%
Total 285 100.00%

87
France
France: Narrative 2018
1. General information on any changes in trends observed since the previous reporting period.
The 2018 survey comprises responses from the 630 establishments approved for the use of laboratory
animals (user establishments), with a response rate of 100%. Of these 630 establishments, 86 stated
that they had not used any animals in experimental procedures requiring project authorisation under
the Directive in 2018.
The number of times animals were used fell again very slightly: 1 910 519 uses in 2018 as compared to
1 914 174 in 2017 and 1 918 481 in 2016. This stable level of around 1.9 million uses that has been
observed since 2016 is due to the duration of authorised projects, which is usually 5 years. It
corroborates the figures in the 2016 and 2017 reports; many user establishments for which the
responses were missing did not have any use of animals to report.
As an indication, the number of uses reported per user establishment for 2018 is 3 033, as compared to
3 467 for 2017.
In general, the species used in procedures, the degree of severity and the proportion of genetically
modified animals are very similar to previous years.
The 2018 figures confirm the dominance of the mouse model in experimental procedures (62% of uses,
as compared to 59% in 2017). Rats (8%) and rabbits (7%) remain the next most popular species. All
species of fish combined represent 13% of uses, as compared to 15% in 2017.
Logically, greater variation can be seen in species linked to specific procedures. No use of bats was
reported in 2018, as compared to 18 000 in 2017, all of which were at one user establishment. Likewise,
219 uses of cephalopods were reported in 2018, for studies in ethology, as compared to one single use
in 2017 by a national museum. There were 159 uses of prosimians reported in 2018, as compared to 86
in 2017, for basic research on neurogenesis, cortical organisation and the seasonal phenotype of these
primates.
The number of uses of cats increased in 2018 from 867 to 1 185. The vast majority of these were
regulatory tests of tolerance for veterinary medicines or studies regarding cat nutrition.
The use of primates decreased by 6.3%, from 3 746 to 3 510. In 67% of cases, primates used for the first
time were individuals of generation F2, as compared to 63% in 2017. This represents progress towards
the target of 100% by 2022. The proportion of primates being reused was 26% in 2018, as compared to
38% in 2017.
All species combined, the number of reuses increased by 6.2% to 42 771 in 2018. The trend is towards a
reduction in the number of animals used in scientific procedures.

88
The number of uses of genetically modified animals increased, from 22.4% to 25.4%. As in 2017, the vast
majority of these were mice (88.7%). The proportion of harmful phenotypes remained low (2.8% in 2017
and 3.0% in 2018).
2. Information on significant increase or decrease in use of animals in any of the specific areas and
analysis of the reasons thereof.
The three main areas of use remained relatively stable compared with the previous year. Basic research
decreased slightly but remains the main area of use, at 36%. In contrast, use in applied research
increased (from 25% to 28%) and in 2018 overtook development, production or quality and safety
testing of medicines and food (which fell from 30% to 27%).
Among the other areas of use, which are less significant in terms of number, maintenance of colonies of
genetically altered animals increased by 8%, teaching and professional development increased by 14%
(while still representing only 2% of use), species conservation increased by 49% (2% of use) due to a
project on allis shad and twaite shad (Alosa alosa and Alosa fallax) with 9 400 uses.
3. Information on any changes in trends in actual severities and analysis of the reasons thereof.
As in previous years, the vast majority of experimental procedures were of mild or moderate severity
(75%). Severe and non-recovery procedures represented 18.7% and 6.3% of all procedures respectively.
The trend in the degree of severity from 2017 is for a decrease in the number of animals used in mild
procedures and a slight increase in moderate, severe and non-recovery procedures. It is difficult to tell
as yet whether this trend corresponds to a real trend in the severity of procedures or if it reflects a
stricter application of the evaluation criteria for severity linked to increasing awareness among those
working with the animals.
2016
2017
2018
0
10
20
30
40
50
PE légères PE modérées PE sévères PE Sans réveil
40 37,9
16,6 5,5
36,8 40,8
17
5,4
31,9
43,1
18,7
6,3
Evolution de la sévérite des procédures
2016 2017 2018

89
The increase in the number of severe procedures can also be explained by the increasing production of
reagents for diagnostic tests for diseases such as toxoplasmosis, in connection with the national policy
for detection of the disease in pregnant women. The French authorities are working with the user
establishments to explore possible ways of refining the production techniques in order to reduce their
severity for the animals concerned.
4. Particular efforts to promote the principle of replacement, reduction and refinement and its
impacts on statistics if any.
As in the previous year, France continues to actively promote the principles of replacement, refinement
and reduction (‘3R’). This commitment is demonstrated in particular through the project authorisation
process. It also translates into increasingly robust training requirements for staff responsible for caring
for animals or for carrying out and designing scientific projects. In addition, all those involved benefit
from the exchange of best practice promoted by the professional associations for animal
experimentation (AFSTAL, GIRCOR and OPAL) or at national meetings such as the conference of chairs of
animal ethics committees on 7 October 2019 with 120 participants, organised by the Ministry of
Research.
The recommendations for good experimental practice given by the national committee for
consideration of ethics in animal experimentation (for example on ascites) also contribute to the correct
application of the 3R principle.
The national platform for the development of alternative methods, FRANCOPA, which is a member of
the European network ECOPA and brings together all stakeholders, also works actively to promote the
three Rs.
5. Further breakdown on the use of “other” categories if a significant proportion of animal use is
reported under this category.
This year a particular effort has been made to assign specific categories to the uses declared in ‘other’
categories. Hence, for basic research, the ‘other’ category represents only 0.3% of uses as compared to
3.2% in 2017. The only uses still categorised as ‘other’ concern research on embryo development.
As in 2017, the category ‘other fish’ is still very large, with 12% of uses (231 760 animals). This category
includes farmed and wild fish such as European seabass (53 000), rainbow trout (20 000), eel (12 000),
salmon (12 000) and shad (9 400), the reproduction, physiology and diet of which are the subject of
numerous studies, particularly by user establishments within public research bodies such as the National
Institute for Agricultural Research (INRA) and the National Institute for Ocean Science (Ifremer).
The category ‘other birds’ accounts for 1.5% of uses (29 095, compared to 46 029 chickens). The
research carried out on these ‘other birds’ is basic or translational research or research in animal biology
on domestic species such as turkey (24 000) or duck (900), or wild species such as albatross (500) or
cormorant (60).

90
The routine production of products other than blood products or monoclonal antibodies (e.g. PR53)
accounts for 56 184 uses. The two main projects in this category concern the production of proteins
from milk for therapeutic use and the production of a vaccine strain for turkeys.
6. Details on cases where the ‘severe’ classification is exceeded, whether pre-authorised or not,
covering the species, numbers, whether prior exemption was authorised, the details of the use and
the reasons why ‘severe’ classification was exceeded.’
No authorisation was issued in 2018 for applications exceeding the ‘severe’ classification with intense
pain which is likely to be long-lasting and cannot be ameliorated.
France: Statistical Data 2018
Section 1: Numbers of animals used for the first time for research, testing, routine
production and educational (including training) purposes
Numbers of animals used for the first time by species Animal species Number of animals Percentage
Mice 1073232 61.23%
Rats 150225 8.57%
Guinea-Pigs 41678 2.38%
Hamsters (Syrian) 5193 0.3%
Hamsters (Chinese) 20 0%
Mongolian gerbil 596 0.03%
Other rodents 2311 0.13%
Rabbits 129357 7.38%
Cats 437 0.02%
Dogs 2569 0.15%
Ferrets 28 0%
Other carnivores 29 0%
Horses, donkeys and cross-breeds 122 0.01%
Pigs 14714 0.84%
Goats 158 0.01%
Sheep 3137 0.18%
Cattle 1173 0.07%
Prosimians 159 0.01%
Marmoset and tamarins 59 0%
Cynomolgus monkey 2285 0.13%
Rhesus monkey 34 0%
Vervets (Chlorocebus spp.) 16 0%
Baboons 17 0%
Other species of Old World Monkeys (Cercopithecoidea) 22 0%
Other mammals 89 0.01%
Domestic fowl 45210 2.58%
Other birds 28798 1.64%
Reptiles 18 0%
Rana 256 0.01%
Xenopus 8844 0.5%
Other amphibians 458 0.03%
Zebra fish 20457 1.17%

91
Other fish 221002 12.61%
Cephalopods 203 0.01%
Total 1752906 100.00%
Place of birth of animals other than non-human primates Place of birth Number of animals Percentage
Animals born in the EU at a registered breeder 1476570 84.36%
Animals born in the EU but not at a registered breeder 184109 10.52%
Animals born in rest of Europe 63413 3.62%
Animals born in rest of world 26222 1.5%
Total 1750314 100.00%
Source of non-human primates NHP Source (origin) Number of animals Percentage
Animals born at a registered breeder within EU 309 11.92%
Animals born in Asia 606 23.38%
Animals born in America 12 0.46%
Animals born in Africa 1611 62.15%
Animals born elsewhere 54 2.08%
Total 2592 100.00%
Generation of non-human primates NHP Generation Number of animals Percentage
F1 709 27.35%
F2 or greater 1733 66.86%
Self-sustaining colony 150 5.79%
Total 2592 100.00%

92
Section 2: Numbers of all uses of animals for research, testing, routine production and
educational (including training) purposes
First use versus reuses Animal species First uses Reuses Total
Mice 1073232 14273 1087505
Rats 150225 5213 155438
Guinea-Pigs 41678 49 41727
Hamsters (Syrian) 5193 5193
Hamsters (Chinese) 20 20
Mongolian gerbil 596 596
Other rodents 2311 602 2913
Rabbits 129357 1972 131329
Cats 437 748 1185
Dogs 2569 1645 4214
Ferrets 28 28
Other carnivores 29 29
Horses, donkeys and cross-breeds 122 360 482
Pigs 14714 255 14969
Goats 158 552 710
Sheep 3137 1167 4304
Cattle 1173 1083 2256
Prosimians 159 159
Marmoset and tamarins 59 147 206
Cynomolgus monkey 2285 724 3009
Rhesus monkey 34 28 62
Vervets (Chlorocebus spp.) 16 16
Baboons 17 19 36
Other species of Old World Monkeys (Cercopithecoidea) 22 22
Other mammals 89 15 104
Domestic fowl 45210 819 46029
Other birds 28798 297 29095
Reptiles 18 2102 2120
Rana 256 256
Xenopus 8844 445 9289
Other amphibians 458 458
Zebra fish 20457 204 20661
Other fish 221002 9990 230992
Cephalopods 203 16 219
Total 1752906 42725 1795631
Uses of animals in research, testing, routine production and education (including training) by main
categories of scientific purposes Purpose Category Number of
uses Percentage
Basic Research 654346 36.44%
Translational and applied research 542128 30.19%
Regulatory use and Routine production 517169 28.8%
Protection of the natural environment in the interests of the health or welfare of human beings or animals
3665 0.2%
Preservation of species 36807 2.05%
Higher education or training for the acquisition, maintenance or improvement of vocational 41510 2.31%

93
skills
Forensic enquiries 6 0%
Total 1795631 100.00%
Basic research related uses Basic research Number of uses Percentage
Oncology 70077 10.71%
Cardiovascular Blood and Lymphatic System 35451 5.42%
Nervous System 128947 19.71%
Respiratory System 12492 1.91%
Gastrointestinal System including Liver 56309 8.61%
Musculoskeletal System 21896 3.35%
Immune System 112216 17.15%
Urogenital/Reproductive System 27795 4.25%
Sensory Organs (skin, eyes and ears) 13397 2.05%
Endocrine System/Metabolism 38905 5.95%
Multisystemic 13387 2.05%
Ethology / Animal Behaviour /Animal Biology 118675 18.14%
Other basic research 4799 0.73%
Total 654346 100.00%
Translational and applied research related uses Translational and applied research Number of uses Percentage
Human Cancer 143266 26.43%
Human Infectious Disorders 40065 7.39%
Human Cardiovascular Disorders 14391 2.65%
Human Nervous and Mental Disorders 50273 9.27%
Human Respiratory Disorders 8811 1.63%
Human Gastrointestinal Disorders including Liver 9156 1.69%
Human Musculoskeletal Disorders 13652 2.52%
Human Immune Disorders 36851 6.8%
Human Urogenital/Reproductive Disorders 3243 0.6%
Human Sensory Organ Disorders (skin, eyes and ears) 3197 0.59%
Human Endocrine/Metabolism Disorders 14852 2.74%
Other Human Disorders 5786 1.07%
Animal Diseases and Disorders 82495 15.22%
Animal Welfare 2980 0.55%
Diagnosis of diseases 96675 17.83%
Plant diseases 14 0%
Non-regulatory toxicology and ecotoxicology 16421 3.03%
Total 542128 100.00%
Regulatory uses and Routine production Regulatory uses and Routine production Number of uses Percentage
Quality control (incl batch safety and potency testing) 206430 39.92%
Other efficacy and tolerance testing 14347 2.77%
Toxicity and other safety testing including pharmacology 108325 20.95%
Routine production 188067 36.36%
Total 517169 100.00%
Regulatory uses - Quality control (including batch safety and potency testing) Regulatory uses - Quality control (including batch safety and potency testing) Number of uses Percentage
Batch safety testing 35433 17.16%

94
Pyrogenicity testing 9578 4.64%
Batch potency testing 153524 74.37%
Other quality controls 7895 3.82%
Total 206430 100.00%
Regulatory uses - Toxicity and other safety testing including pharmacology Regulatory uses - Toxicity and other safety testing including pharmacology Number of uses Percentage
Acute and sub-acute 3091 2.85%
Skin irritation/corrosion 1709 1.58%
Skin sensitisation 12141 11.21%
Eye irritation/corrosion 231 0.21%
Repeated dose toxicity 22719 20.97%
Carcinogenicity 1846 1.7%
Genotoxicity 498 0.46%
Reproductive toxicity 8051 7.43%
Developmental toxicity 5951 5.49%
Neurotoxicity 1133 1.05%
Kinetics 18063 16.67%
Pharmaco-dynamics (incl safety pharmacology) 5396 4.98%
Phototoxicity 411 0.38%
Ecotoxicity 25308 23.36%
Safety testing in food and feed area 983 0.91%
Target animal safety 232 0.21%
Other toxicity/safety testing 562 0.52%
Total 108325 100.00%
Regulatory uses - Toxicity and other safety testing including pharmacology - Acute and sub-acute toxicity
testing methods Regulatory uses - Toxicity and other safety testing including pharmacology - Acute and sub-acute toxicity testing methods
Number of uses
Percentage
LD50, LC50 735 23.78%
Other lethal methods 148 4.79%
Non lethal methods 2208 71.43%
Total 3091 100.00%
Regulatory uses - Toxicity and other safety testing including pharmacology - Repeated dose toxicity Regulatory uses - Toxicity and other safety testing including pharmacology - Repeated dose toxicity
Number of uses
Percentage
up to 28 days 13312 58.59%
29 - 90 days 6133 27%
> 90 days 3274 14.41%
Total 22719 100.00%
Regulatory uses - Toxicity and other safety testing including pharmacology - Ecotoxicity Regulatory uses - Toxicity and other safety testing including pharmacology - Ecotoxicity Number of uses Percentage
Acute toxicity 8548 33.78%
Chronic toxicity 16648 65.78%
Bioaccumulation 22 0.09%
Other ecotoxicity 90 0.36%
Total 25308 100.00%
Regulatory uses by type of legislation Type of legislation Number of Percentage

95
uses
Legislation on medicinal products for human use 228314 69.37%
Legislation on medicinal products for veterinary use and their residues 46456 14.12%
Medical devices legislation 22809 6.93%
Industrial chemicals legislation 6557 1.99%
Plant protection product legislation 4010 1.22%
Biocides legislation 1180 0.36%
Food legislation including food contact material 821 0.25%
Feed legislation including legislation for the safety of target animals, workers and environment
3011 0.91%
Other legislation 15944 4.84%
Total 329102 100.00%
Regulatory uses by origin of regulatory requirement Origin of legislative requirement Number of uses Percentage
Legislation satisfying EU requirements 325287 98.84%
Legislation satisfying national requirements only [within EU] 1038 0.32%
Legislation satisfying Non-EU requirements only 2777 0.84%
Total 329102 100.00%
Routine production uses by product type Product type Number of uses Percentage
Blood based products 79108 42.06%
Monoclonal antibody by mouse ascites method 53073 28.22%
Other product types 55886 29.72%
Total 188067 100.00%
Uses of animals in research, testing, routine production and education (including training) by first use and
reuses Reuse Number of uses Percentage
No 1752906 97.62%
Yes 42725 2.38%
Total 1795631 100.00%
Uses of animals in research, testing, routine production and education (including training) by severity Severity Number of uses Percentage
Non-recovery 116755 6.5%
Mild [up to and including] 548618 30.55%
Moderate 774226 43.12%
Severe 356032 19.83%
Total 1795631 100.00%
Uses of animals in research, testing, routine production and education (including training) by genetic status
of animals Genetic status Number of uses Percentage
Not genetically altered 1413762 78.73%
Genetically altered without a harmful phenotype 333870 18.59%
Genetically altered with a harmful phenotype 47999 2.67%
Total 1795631 100.00%

96
Section 3: Creation and maintenance of genetically altered animal lines
All uses of animals for the creation of new genetically altered animal lines by species, first uses and reuses Animal species First uses Reuses Total
Mice 31965 31965
Rats 2489 4 2493
Rabbits 258 258
Zebra fish 3746 3746
Total 38458 4 38462
Uses of animals for the creation of new genetically altered animal lines by severity Severity Number of uses Percentage
Non-recovery 2742 7.13%
Mild [up to and including] 16668 43.34%
Moderate 17858 46.43%
Severe 1194 3.1%
Total 38462 100.00%
Uses of animals for the creation of new genetically altered animal lines by genetic status of the animals Genetic status Number of uses Percentage
Not genetically altered 12294 31.96%
Genetically altered without a harmful phenotype 21151 54.99%
Genetically altered with a harmful phenotype 5017 13.04%
Total 38462 100.00%
Uses of animals for the creation of new genetically altered animal lines by type of basic research purposes Basic research Number of uses Percentage
Oncology 1792 4.83%
Cardiovascular Blood and Lymphatic System 296 0.8%
Nervous System 16495 44.43%
Gastrointestinal System including Liver 99 0.27%
Musculoskeletal System 921 2.48%
Immune System 2098 5.65%
Urogenital/Reproductive System 15 0.04%
Sensory Organs (skin, eyes and ears) 434 1.17%
Endocrine System/Metabolism 125 0.34%
Multisystemic 12397 33.4%
Ethology / Animal Behaviour /Animal Biology 1561 4.21%
Other basic research 889 2.39%
Total 37122 100.00%
Uses of animals for the creation of new genetically altered animal lines by type of translational and applied
research purposes Translational and applied research Number of uses Percentage
Human Cancer 137 10.22%
Human Infectious Disorders 545 40.67%
Human Cardiovascular Disorders 245 18.28%
Human Respiratory Disorders 23 1.72%
Human Immune Disorders 10 0.75%
Human Endocrine/Metabolism Disorders 248 18.51%
Animal Diseases and Disorders 132 9.85%
Total 1340 100.00%

97
All uses of animals for the maintenance of established genetically altered animal lines by species Animal species First uses Reuses Total uses
Mice 73036 42 73078
Rats 1855 1855
Dogs 5 5
Zebra fish 720 720
Other fish 768 768
Total 76384 42 76426
Uses of animals for the maintenance of established genetically altered animal lines by severity Severity Number of uses Percentage
Non-recovery 768 1%
Mild [up to and including] 44821 58.65%
Moderate 30710 40.18%
Severe 127 0.17%
Total 76426 100.00%
Uses of animals for the maintenance of established genetically altered animal lines by genetic status of the
animals Genetic status Number of uses Percentage
Genetically altered without a harmful phenotype 73030 95.56%
Genetically altered with a harmful phenotype 3396 4.44%
Total 76426 100.00%

98
Germany
Germany: Narrative 2018
1. General information on any changes in trends observed since the previous reporting period.
In 2018, some 2 million vertebrates were used in Germany in animal testing within the meaning of
Section 7(2) of the German Animal Welfare Act (Tierschutzgesetz). Section 7(2) of the Animal Welfare
Act defines the term ‘animal test’. The figures are virtually unchanged compared to the previous year.
Approximately 83% of the animals used for testing were rodents, mostly mice and rats, with mice
accounting for around 72%. Approximately 9% of the animals were fish, around 4% were rabbits and
around 2% were birds. Here, too, the figures are virtually unchanged compared to the previous year.
2. Information on significant increase or decrease in use animals in any of the specific areas and
analysis of the reasons thereof.
Killing for scientific purposes
In addition to the requirements of the EU Laboratory Animals Directive, Germany also records animals
killed for scientific purposes without first having undergone procedures or treatments, for instance in
order to use these animals’ organs or cell material for scientific purposes. Some 686 000 animals were
used for this purpose in 2018, which is approximately 51 000 fewer than in the previous year. These
animals are not included in the number of laboratory animals submitted to the European Commission.
Genetically modified animals
The number of genetically modified animals has remained largely stable in comparison to the previous
year. Around 1 295 000 animals of the total number of animals used were genetically modified. These
animals thus accounted for approximately 44% (compared to 40% in 2017). This concerned in particular
mice (92%) and fish (8%).
Primates
The number of primates used fell slightly. In 2018 a total of 3 324 primates were used, which is 201
fewer than in the previous year.
Dogs and cats
The number of dogs and cats used was 3 993 and 765, respectively, used in particular for statutory
testing and for applied research. Compared to the previous year there was a slight increase in the
number of dogs (3 334 in 2017) and cats (718 in 2017).
Scientific purposes
Although many scientific questions can be answered nowadays through the use of cell cultures,
computer-assisted procedures and other alternative methods, it is not yet possible to do without the
use of animals for medical research and other scientific purposes. Specifically, approximately 47% of the
animals used in animal testing within the meaning of Section 7(2) of the Animal Welfare Act were used
for basic research and approximately 15% were used for researching human and animal diseases.
Around 23% of the animals were used in the production and quality control of medical products or for

99
toxicological safety tests. Around 15% were needed for other purposes, such as training or further
education or for breeding genetically modified animals.
Compared to 2017 there was thus a slight overall decrease in the area of basic research (around 3%) and
for the production and quality control of medical products and toxicological safety tests (around 4%),
while there was a significant increase of around 9% in other areas, in particular for the purpose of
maintaining colonies of genetically modified animals.
Basic research
Within basic research, research into the nervous system (around 19%) and the immune system
(around 19%) was particularly important in 2018. These figures are virtually unchanged compared
to the previous year.
Human and animal diseases
In the area of research into human and animal diseases, there was an emphasis on human cancers.
Approximately 39% of the animals used for testing in this field of research were used for this
purpose. This is a slight decrease compared to 2017 (around 41%).
Toxicological safety tests
2018 saw an increase compared to the previous year, in particular in the area of testing medical
products for pyrogens and in the production of monoclonal antibodies. Although alternative
methods are increasingly being used in this field, testing on animals is still required to demonstrate
that products are safe and effective due to the complex interaction between medicinal products
and the organism.
3. Information on any changes in trends in actual severities and analysis of the reasons thereof.
The severity of tests within the meaning of Section 7(2) of the Animal Welfare Act was predominantly
‘mild’ (approximately 61%). Around 27% of the tests were classified as ‘moderate’ and 6% were
classified as ‘severe’. Compared to the previous year, there was a slight increase of 2% in tests whose
severity was classified as ‘mild’ and a very small increase of about 1% in tests classified as ‘severe’. The
share of tests on animals carried out entirely under general anaesthesia and from which the animal
never regained consciousness was around 6%, which is slightly lower than in the previous year (about
9%).
4. Particular efforts to promote the principle of replacement, reduction and refinement and its
impacts on statistics if any.
The German Federal Ministry of Food and Agriculture (Bundesministerium für Ernährung und
Landwirtschaft, BMEL) is endeavouring to reduce the number of animals used in tests. Various projects
are therefore being launched and supported with the aim of replacing animal testing with alternative
methods as quickly as possible. These projects include setting up and running the German Centre for the
Protection of Laboratory Animals (Deutsches Zentrum zum Schutz von Versuchstieren, Bf3R), promoting

100
research by the German Federal Institute for Risk Assessment (Bundesinstitut für Risikobewertung, BfR),
supporting the Foundation for the promotion of alternate and complementary methods to reduce
animal testing (Stiftung zur Förderung von Ersatz- und Ergänzungsmethoden zur Einschränkung von
Tierversuchen) and annually awarding the BMEL’s Animal Welfare Research Prize. In 2016 the amount of
the prize was increased from €15 000 to €25 000.
5. Further breakdown on the use of ‘other’ categories if a significant proportion of animal use is
reported under this category.
Category ‘other animal species’
This category, particularly ‘other fish species’ and ‘other bird species’, comprises a large number of
animal species.
With regard to fish, primarily local wild fish (e.g. grayling, common roach, stickleback, brown trout, eel)
were used for the purposes of basic ethological research and research into species conservation. This
partially concerned animals caught in the wild which were re-released after the test was finished. The
severity classification was generally ‘mild’.
Among birds, primarily turkeys and local wild bird species (e.g. tit, duck, common buzzard, pigeon,
hawk) were used. While turkeys were mainly used for the purpose of researching various animal
diseases, various wild bird species were used in the context of basic ethological research. This primarily
concerned birds caught in the wild which were re-released after the test was finished. The severity
classification for the animals involved was generally ‘mild’.
Moreover, ‘other rodents’ and ‘other amphibians’ comprise a small number of additional species.
Rodents, in particular voles, bank voles and yellow-necked mice, were primarily used in basic ethological
research. This partially concerned animals caught in the wild which were re-released after the test was
finished. The severity classification was generally ‘mild’. Amphibians, in particular salamander and
axolotl, were mainly used for research into species conservation and basic research. The severity
classification was generally ‘mild’ to ‘moderate’.
Category ‘other uses’
The emphasis in this category is on ‘basic research’ and ‘regulatory purposes’.
In the context of basic research there was particular emphasis on the following areas:
creating and genotyping new genetically modified animal lines as models for human and animal
diseases;
research into molecular developmental genetics;
research into molecular pathomechanisms;
testing various new methods for marker, blood and biopsy sampling with the goal of refining these
methods;
research in the field of human and animal microbiology;

101
research in the field of gerontology.
The severity classification for the animals involved was generally ‘mild’ to ‘moderate’.
In the area of regulatory tests the emphasis was mainly on the following topics:
testing new diagnostic and therapeutic procedures in the field of human cancers;
testing the effectiveness and mode of action of feed additives;
testing the effectiveness and mode of action of substances in the field of obesity research;
pharmacodynamic tests in the context of developing therapies in the area of human or animal
tumour diseases (e.g. radiopharmaceuticals).
The severity classification for the animals involved was generally ‘mild’ to ‘moderate’.
Category ‘other legal provisions’
The following other legal provisions are relevant in this category:
testing of substances hazardous to water pursuant to the Administrative Regulation under the
Water Resources Act (Verwaltungsvorschrift zum Wasserhaushaltsgesetz);
testing of products under Regulation (EC) No 1272/2008 (fibre persistence test);
testing of products under the Infection Protection Act (Infektionsschutzgesetz);
testing of products under the Animal Vaccine Regulation (Tierimpfstoffverordnung).
The severity classification for the animals involved varied considerably (from ‘mild’ to ‘severe’).
6. Details on cases where the ‘severe’ classification is exceeded, whether pre-authorised or not,
covering the species, numbers, whether prior exemption was authorised, the details of the use and
the reasons why ‘severe’ classification was exceeded.
The ‘severe’ classification was not exceeded in any tests carried out in Germany in 2018.
Germany: Statistical Data 2018
Section 1: Numbers of animals used for the first time for research, testing, routine
production and educational (including training) purposes
Numbers of animals used for the first time by species Animal species Number of animals Percentage
Mice 1104144 67.77%
Rats 214039 13.14%
Guinea-Pigs 13946 0.86%
Hamsters (Syrian) 932 0.06%
Mongolian gerbil 3283 0.2%
Other rodents 2895 0.18%
Rabbits 81185 4.98%
Cats 556 0.03%

102
Dogs 2108 0.13%
Ferrets 69 0%
Other carnivores 389 0.02%
Horses, donkeys and cross-breeds 431 0.03%
Pigs 17595 1.08%
Goats 475 0.03%
Sheep 4613 0.28%
Cattle 6828 0.42%
Prosimians 11 0%
Marmoset and tamarins 188 0.01%
Cynomolgus monkey 2314 0.14%
Rhesus monkey 51 0%
Baboons 10 0%
Squirrel monkey 25 0%
Other mammals 1423 0.09%
Domestic fowl 22596 1.39%
Other birds 6909 0.42%
Reptiles 146 0.01%
Rana 834 0.05%
Xenopus 1464 0.09%
Other amphibians 1459 0.09%
Zebra fish 58144 3.57%
Other fish 80107 4.92%
Cephalopods 59 0%
Total 1629228 100.00%
Place of birth of animals other than non-human primates Place of birth Number of animals Percentage
Animals born in the EU at a registered breeder 1495142 91.92%
Animals born in the EU but not at a registered breeder 91292 5.61%
Animals born in rest of Europe 24751 1.52%
Animals born in rest of world 15444 0.95%
Total 1626629 100.00%
Source of non-human primates NHP Source (origin) Number of animals Percentage
Animals born at a registered breeder within EU 371 14.27%
Animals born in Asia 1791 68.91%
Animals born in Africa 437 16.81%
Total 2599 100.00%
Generation of non-human primates NHP Generation Number of animals Percentage
F1 217 8.35%
F2 or greater 1724 66.33%
Self-sustaining colony 658 25.32%
Total 2599 100.00%

103
Section 2: Numbers of all uses of animals for research, testing, routine production and
educational (including training) purposes
First use versus reuses Animal species First uses Reuses Total
Mice 1104144 21420 1125564
Rats 214039 6301 220340
Guinea-Pigs 13946 283 14229
Hamsters (Syrian) 932 8 940
Mongolian gerbil 3283 83 3366
Other rodents 2895 47 2942
Rabbits 81185 3992 85177
Cats 556 209 765
Dogs 2108 1871 3979
Ferrets 69 22 91
Other carnivores 389 389
Horses, donkeys and cross-breeds 431 361 792
Pigs 17595 1255 18850
Goats 475 24 499
Sheep 4613 138 4751
Cattle 6828 479 7307
Prosimians 11 52 63
Marmoset and tamarins 188 31 219
Cynomolgus monkey 2314 561 2875
Rhesus monkey 51 14 65
Vervets (Chlorocebus spp.) 14 14
Baboons 10 10
Squirrel monkey 25 25
Other species of Old World Monkeys (Cercopithecoidea) 7 7
Other mammals 1423 16 1439
Domestic fowl 22596 247 22843
Other birds 6909 422 7331
Reptiles 146 6 152
Rana 834 834
Xenopus 1464 970 2434
Other amphibians 1459 1459
Zebra fish 58144 58144
Other fish 80107 415 80522
Cephalopods 59 59
Total 1629228 39248 1668476
Uses of animals in research, testing, routine production and education (including training) by main
categories of scientific purposes Purpose Category Number of
uses Percentage
Basic Research 792580 47.5%
Translational and applied research 313879 18.81%
Regulatory use and Routine production 484254 29.02%
Protection of the natural environment in the interests of the health or welfare of human beings or animals
8289 0.5%
Preservation of species 14088 0.84%
Higher education or training for the acquisition, maintenance or improvement of vocational 55386 3.32%

104
skills
Total 1668476 100.00%
Basic research related uses Basic research Number of uses Percentage
Oncology 79316 10.01%
Cardiovascular Blood and Lymphatic System 79709 10.06%
Nervous System 161311 20.35%
Respiratory System 19825 2.5%
Gastrointestinal System including Liver 29006 3.66%
Musculoskeletal System 15806 1.99%
Immune System 171780 21.67%
Urogenital/Reproductive System 16369 2.07%
Sensory Organs (skin, eyes and ears) 17582 2.22%
Endocrine System/Metabolism 52045 6.57%
Multisystemic 83899 10.59%
Ethology / Animal Behaviour /Animal Biology 65612 8.28%
Other basic research 320 0.04%
Total 792580 100.00%
Translational and applied research related uses Translational and applied research Number of uses Percentage
Human Cancer 120911 38.52%
Human Infectious Disorders 26912 8.57%
Human Cardiovascular Disorders 15505 4.94%
Human Nervous and Mental Disorders 35144 11.2%
Human Respiratory Disorders 9565 3.05%
Human Gastrointestinal Disorders including Liver 10876 3.47%
Human Musculoskeletal Disorders 3154 1%
Human Immune Disorders 17298 5.51%
Human Urogenital/Reproductive Disorders 2069 0.66%
Human Sensory Organ Disorders (skin, eyes and ears) 5394 1.72%
Human Endocrine/Metabolism Disorders 17452 5.56%
Other Human Disorders 6226 1.98%
Animal Diseases and Disorders 23551 7.5%
Animal Welfare 5568 1.77%
Diagnosis of diseases 5113 1.63%
Plant diseases 18 0.01%
Non-regulatory toxicology and ecotoxicology 9123 2.91%
Total 313879 100.00%
Regulatory uses and Routine production Regulatory uses and Routine production Number of uses Percentage
Quality control (incl batch safety and potency testing) 188944 39.02%
Other efficacy and tolerance testing 17656 3.65%
Toxicity and other safety testing including pharmacology 203965 42.12%
Routine production 73689 15.22%
Total 484254 100.00%
Regulatory uses - Quality control (including batch safety and potency testing) Regulatory uses - Quality control (including batch safety and potency testing) Number of uses Percentage
Batch safety testing 12349 6.54%
Pyrogenicity testing 6291 3.33%

105
Batch potency testing 169182 89.54%
Other quality controls 1122 0.59%
Total 188944 100.00%
Regulatory uses - Toxicity and other safety testing including pharmacology Regulatory uses - Toxicity and other safety testing including pharmacology Number of uses Percentage
Acute and sub-acute 6547 3.21%
Skin irritation/corrosion 515 0.25%
Skin sensitisation 6573 3.22%
Eye irritation/corrosion 100 0.05%
Repeated dose toxicity 20113 9.86%
Carcinogenicity 794 0.39%
Genotoxicity 3086 1.51%
Reproductive toxicity 16614 8.15%
Developmental toxicity 23570 11.56%
Neurotoxicity 152 0.07%
Kinetics 29617 14.52%
Pharmaco-dynamics (incl safety pharmacology) 70183 34.41%
Ecotoxicity 22152 10.86%
Safety testing in food and feed area 1859 0.91%
Target animal safety 1080 0.53%
Other toxicity/safety testing 1010 0.5%
Total 203965 100.00%
Regulatory uses - Toxicity and other safety testing including pharmacology - Acute and sub-acute toxicity
testing methods Regulatory uses - Toxicity and other safety testing including pharmacology - Acute and sub-acute toxicity testing methods
Number of uses
Percentage
LD50, LC50 1631 24.91%
Other lethal methods 215 3.28%
Non lethal methods 4701 71.8%
Total 6547 100.00%
Regulatory uses - Toxicity and other safety testing including pharmacology - Repeated dose toxicity Regulatory uses - Toxicity and other safety testing including pharmacology - Repeated dose toxicity
Number of uses
Percentage
up to 28 days 13012 64.69%
29 - 90 days 4257 21.17%
> 90 days 2844 14.14%
Total 20113 100.00%
Regulatory uses - Toxicity and other safety testing including pharmacology - Ecotoxicity Regulatory uses - Toxicity and other safety testing including pharmacology - Ecotoxicity Number of uses Percentage
Acute toxicity 10432 47.09%
Chronic toxicity 7623 34.41%
Endocrine activity 790 3.57%
Bioaccumulation 3267 14.75%
Other ecotoxicity 40 0.18%
Total 22152 100.00%
Regulatory uses by type of legislation Type of legislation Number of
uses Percentage

106
Legislation on medicinal products for human use 311642 75.91%
Legislation on medicinal products for veterinary use and their residues 18048 4.4%
Medical devices legislation 8044 1.96%
Industrial chemicals legislation 38500 9.38%
Plant protection product legislation 30216 7.36%
Biocides legislation 426 0.1%
Food legislation including food contact material 510 0.12%
Feed legislation including legislation for the safety of target animals, workers and environment
1952 0.48%
Other legislation 1227 0.3%
Total 410565 100.00%
Regulatory uses by origin of regulatory requirement Origin of legislative requirement Number of uses Percentage
Legislation satisfying EU requirements 400507 97.55%
Legislation satisfying national requirements only [within EU] 2624 0.64%
Legislation satisfying Non-EU requirements only 7434 1.81%
Total 410565 100.00%
Routine production uses by product type Product type Number of uses Percentage
Blood based products 69804 94.73%
Monoclonal antibody by mouse ascites method 1565 2.12%
Other product types 2320 3.15%
Total 73689 100.00%
Uses of animals in research, testing, routine production and education (including training) by first use and
reuses Reuse Number of uses Percentage
No 1629228 97.65%
Yes 39248 2.35%
Total 1668476 100.00%
Uses of animals in research, testing, routine production and education (including training) by severity Severity Number of uses Percentage
Non-recovery 123863 7.42%
Mild [up to and including] 910142 54.55%
Moderate 526752 31.57%
Severe 107719 6.46%
Total 1668476 100.00%
Uses of animals in research, testing, routine production and education (including training) by genetic status
of animals Genetic status Number of uses Percentage
Not genetically altered 1132375 67.87%
Genetically altered without a harmful phenotype 436493 26.16%
Genetically altered with a harmful phenotype 99608 5.97%
Total 1668476 100.00%

107
Section 3: Creation and maintenance of genetically altered animal lines
All uses of animals for the creation of new genetically altered animal lines by species, first uses and reuses Animal species First uses Reuses Total
Mice 103224 1014 104238
Rats 979 979
Rabbits 16 16
Ferrets 4 4
Pigs 29 4 33
Marmoset and tamarins 10 10
Other amphibians 100 100
Zebra fish 46203 46203
Other fish 2809 2809
Total 153370 1022 154392
Uses of animals for the creation of new genetically altered animal lines by severity Severity Number of uses Percentage
Non-recovery 14269 9.24%
Mild [up to and including] 109113 70.67%
Moderate 29291 18.97%
Severe 1719 1.11%
Total 154392 100.00%
Uses of animals for the creation of new genetically altered animal lines by genetic status of the animals Genetic status Number of uses Percentage
Not genetically altered 32945 21.34%
Genetically altered without a harmful phenotype 102454 66.36%
Genetically altered with a harmful phenotype 18993 12.3%
Total 154392 100.00%
Uses of animals for the creation of new genetically altered animal lines by type of basic research purposes Basic research Number of uses Percentage
Oncology 10098 6.96%
Cardiovascular Blood and Lymphatic System 14728 10.14%
Nervous System 26131 18%
Respiratory System 275 0.19%
Gastrointestinal System including Liver 2338 1.61%
Musculoskeletal System 8662 5.97%
Immune System 13542 9.33%
Urogenital/Reproductive System 11065 7.62%
Sensory Organs (skin, eyes and ears) 5861 4.04%
Endocrine System/Metabolism 8634 5.95%
Multisystemic 30136 20.76%
Ethology / Animal Behaviour /Animal Biology 827 0.57%
Other basic research 12879 8.87%
Total 145176 100.00%
Uses of animals for the creation of new genetically altered animal lines by type of translational and applied
research purposes Translational and applied research Number of uses Percentage
Human Cancer 1238 13.43%
Human Infectious Disorders 203 2.2%

108
Human Cardiovascular Disorders 1653 17.94%
Human Nervous and Mental Disorders 996 10.81%
Human Respiratory Disorders 552 5.99%
Human Gastrointestinal Disorders including Liver 3138 34.05%
Human Immune Disorders 91 0.99%
Human Urogenital/Reproductive Disorders 107 1.16%
Human Sensory Organ Disorders (skin, eyes and ears) 783 8.5%
Human Endocrine/Metabolism Disorders 279 3.03%
Other Human Disorders 7 0.08%
Animal Welfare 169 1.83%
Total 9216 100.00%
All uses of animals for the maintenance of established genetically altered animal lines by species Animal species First uses Reuses Total uses
Mice 309563 210 309773
Rats 1492 1492
Domestic fowl 219 219
Zebra fish 3868 3868
Other fish 494 494
Total 315636 210 315846
Uses of animals for the maintenance of established genetically altered animal lines by severity Severity Number of uses Percentage
Non-recovery 545 0.17%
Mild [up to and including] 285190 90.29%
Moderate 14847 4.7%
Severe 15264 4.83%
Total 315846 100.00%
Uses of animals for the maintenance of established genetically altered animal lines by genetic status of the
animals Genetic status Number of uses Percentage
Genetically altered without a harmful phenotype 278082 88.04%
Genetically altered with a harmful phenotype 37764 11.96%
Total 315846 100.00%

109
Greece
Greece: Narrative 2018
1. General information on any changes in trends observed since the previous reporting period.
A further significant increase in the use of animals for the creation of new genetic lines is reported and
can be attributed to the increase of funding by European research projects as well as the increase of
research interest in this field.
A further significant increase in the use of animals born in the EU but not by a registered breeder has
been reported. This refers to fish of domestic species and cephalopods that have been captured in the
Greek seas.
2. Information on significant increase or decrease in use animals in any of the specific areas and
analysis of the reasons thereof.
A) A significant use of fish is depicted in Greek statistical data in 2018 compared to other MS. This is due
to the fact that Greece is a Mediterranean country and has a number of user establishments dealing
with studies on fish biology, behaviour/ethology and production methods of aquaculture species.
Dicentrarchus labrax and Sparus aurata are the main species used. In user establishments, fishes are
maintained under similar commercial production conditions, and most of the projects consist of
variations in the rearing parameters (temperature, photoperiod, dissolved oxygen, tank size, feed type
and frequency, rearing density, etc.) that may cause stress to the animals and are classified as “mild”.
B) A significant increase in the use of domestic fowl is reported due to authorisation of relevant projects
performed in 2018 by a user establishment. In 2017 there had been no relevant authorisation.
C) It has to be noted that the use of various species differs among each year according to the protocols
authorised and funding received by user establishments. Minor changing trends can be recorded.
D) A continuous increase in the use of genetically altered animals without a harmful phenotype has
been noted during the last years, due to the type of projects authorised and the research trends of
recent years globally. This is also correlated with the relevant increase of the use of mice in 2018 in
Greece.
F) It has to be noted that the purpose of animals used for scientific purposes differs among each year
according to the protocols authorised and funding received by user establishments. Minor changing
trends can be recorded.
G) It has to be noted that the use of animals for various systems either for basic or translational and
applied research varies among each year according to the nature of protocols chosen by researchers.

110
3. Information on any changes in trends in actual severities and analysis of the reasons thereof.
A) Animals with “Non recovery” severity seem to have further diminished due to a declared decrease in
higher education trainings programs that are performed with the use of live animals in Greece.
B) Animals with “moderate” severity seem to have increased. This can be attributed to the training of
project evaluation committees that took place in Greece in 2019 by the Greek National Committee for
the protection of animals used for scientific purposes which has led to the implementation of better
criteria for the assessment of severity and, thus, better enforcement of legislation.
C) In translational/applied research for human cancer a decrease back to previous levels has been noted
in 2018 compared to 2017 which has resulted in the relevant decrease of the severe use of those
animals.
4. Particular efforts to promote the principle of replacement, reduction and refinement and its
impacts on statistics if any.
Laboratory animal science training courses are organised annually in Greece.
The Greek National Committee for the protection of animals used for scientific purposes has organised 2
trainings for members of Greek project evaluation committees in 2019 where many issues regarding the
enforcement of legislation have been clarified including classification of severity.
5. Further breakdown on the use of "other" categories if a significant proportion of animal use is
reported under this category.
A) A significant proportion of other fish is reported in Greece for 2018 although with a decreasing trend
compared to 2017. This can be attributed to the improvement of reporting procedures by the relevant
user establishments as well as the improvement of the authorisation procedures followed for these
projects by the local competent authorities. Greece is a leading country in Mediterranean fish
production and significant research is carried out in this field compared to other MS. Sparus aurata and
Dicentrarchus labrax are the leading species, with Argyrosomous regius and Seriola dumerili to follow.
Procedures on fish include behavioural studies or drug testing, which cause stress to the animals and are
classified as “mild”.
B) A number of rodents have been reported under ‘Translational/ Applied research”: Other human
disorders, as having been used in multisystemic protocols including arthritis and enteropathy.
6. Details on cases where the 'severe' classification is exceeded, whether pre-authorised or not,
covering the species, numbers, whether prior exemption was authorised, the details of the use and
the reasons why 'severe' classification was exceeded.
No such case reported for 2018.

111
Greece: Statistical Data 2018
Section 1: Numbers of animals used for the first time for research, testing, routine
production and educational (including training) purposes
Numbers of animals used for the first time by species Animal species Number of animals Percentage
Mice 23768 65.96%
Rats 1769 4.91%
Guinea-Pigs 16 0.04%
Rabbits 402 1.12%
Dogs 9 0.02%
Pigs 375 1.04%
Sheep 8 0.02%
Rhesus monkey 1 0%
Domestic fowl 656 1.82%
Zebra fish 63 0.17%
Other fish 8932 24.79%
Cephalopods 33 0.09%
Total 36032 100.00%
Place of birth of animals other than non-human primates Place of birth Number of animals Percentage
Animals born in the EU at a registered breeder 32938 91.42%
Animals born in the EU but not at a registered breeder 3093 8.58%
Total 36031 100.00%
Source of non-human primates NHP Source (origin) Number of animals Percentage
Animals born at a registered breeder within EU 1 100%
Total 1 100.00%
Generation of non-human primates NHP Generation Number of animals Percentage
F2 or greater 1 100%
Total 1 100.00%

112
Section 2: Numbers of all uses of animals for research, testing, routine production and
educational (including training) purposes
First use versus reuses Animal species First uses Reuses Total
Mice 23768 23768
Rats 1769 1769
Guinea-Pigs 16 16
Rabbits 402 402
Dogs 9 12 21
Pigs 375 375
Sheep 8 8
Rhesus monkey 1 1
Domestic fowl 656 656
Zebra fish 63 63
Other fish 8932 88 9020
Cephalopods 33 33
Total 36032 100 36132
Uses of animals in research, testing, routine production and education (including training) by main
categories of scientific purposes Purpose Category Number of
uses Percentage
Basic Research 19063 52.76%
Translational and applied research 6238 17.26%
Regulatory use and Routine production 6815 18.86%
Protection of the natural environment in the interests of the health or welfare of human beings or animals
3093 8.56%
Higher education or training for the acquisition, maintenance or improvement of vocational skills
923 2.55%
Total 36132 100.00%
Basic research related uses Basic research Number of uses Percentage
Oncology 2346 12.31%
Cardiovascular Blood and Lymphatic System 867 4.55%
Nervous System 1411 7.4%
Respiratory System 894 4.69%
Gastrointestinal System including Liver 357 1.87%
Musculoskeletal System 445 2.33%
Immune System 3635 19.07%
Urogenital/Reproductive System 352 1.85%
Sensory Organs (skin, eyes and ears) 1201 6.3%
Endocrine System/Metabolism 376 1.97%
Multisystemic 135 0.71%
Ethology / Animal Behaviour /Animal Biology 6028 31.62%
Other basic research 1016 5.33%
Total 19063 100.00%
Translational and applied research related uses Translational and applied research Number of uses Percentage
Human Cancer 1099 17.62%

113
Human Infectious Disorders 423 6.78%
Human Cardiovascular Disorders 725 11.62%
Human Nervous and Mental Disorders 422 6.76%
Human Respiratory Disorders 40 0.64%
Human Gastrointestinal Disorders including Liver 508 8.14%
Human Musculoskeletal Disorders 239 3.83%
Human Immune Disorders 1645 26.37%
Human Sensory Organ Disorders (skin, eyes and ears) 226 3.62%
Other Human Disorders 461 7.39%
Animal Diseases and Disorders 310 4.97%
Diagnosis of diseases 44 0.71%
Non-regulatory toxicology and ecotoxicology 96 1.54%
Total 6238 100.00%
Regulatory uses and Routine production Regulatory uses and Routine production Number of uses Percentage
Quality control (incl batch safety and potency testing) 37 0.54%
Toxicity and other safety testing including pharmacology 6778 99.46%
Total 6815 100.00%
Regulatory uses - Quality control (including batch safety and potency testing) Regulatory uses - Quality control (including batch safety and potency testing) Number of uses Percentage
Other quality controls 37 100%
Total 37 100.00%
Regulatory uses - Toxicity and other safety testing including pharmacology Regulatory uses - Toxicity and other safety testing including pharmacology Number of uses Percentage
Skin sensitisation 79 1.17%
Repeated dose toxicity 66 0.97%
Safety testing in food and feed area 6633 97.86%
Total 6778 100.00%
Regulatory uses - Toxicity and other safety testing including pharmacology - Acute and sub-acute toxicity
testing methods Regulatory uses - Toxicity and other safety testing including pharmacology - Acute and sub-acute toxicity testing methods
Number of uses
Percentage
No data reported
Regulatory uses - Toxicity and other safety testing including pharmacology - Repeated dose toxicity Regulatory uses - Toxicity and other safety testing including pharmacology - Repeated dose toxicity
Number of uses
Percentage
> 90 days 66 100%
Total 66 100.00%
Regulatory uses - Toxicity and other safety testing including pharmacology - Ecotoxicity Regulatory uses - Toxicity and other safety testing including pharmacology - Ecotoxicity Number of uses Percentage
No data reported
Regulatory uses by type of legislation Type of legislation Number of uses Percentage
Legislation on medicinal products for human use 182 2.67%
Food legislation including food contact material 6633 97.33%
Total 6815 100.00%

114
Regulatory uses by origin of regulatory requirement Origin of legislative requirement Number of uses Percentage
Legislation satisfying EU requirements 6815 100%
Total 6815 100.00%
Routine production uses by product type Product type Number of uses Percentage
No data reported
Uses of animals in research, testing, routine production and education (including training) by first use and
reuses Reuse Number of uses Percentage
No 36032 99.72%
Yes 100 0.28%
Total 36132 100.00%
Uses of animals in research, testing, routine production and education (including training) by severity Severity Number of uses Percentage
Non-recovery 2159 5.98%
Mild [up to and including] 16680 46.16%
Moderate 12899 35.7%
Severe 4394 12.16%
Total 36132 100.00%
Uses of animals in research, testing, routine production and education (including training) by genetic status
of animals Genetic status Number of uses Percentage
Not genetically altered 24722 68.42%
Genetically altered without a harmful phenotype 9611 26.6%
Genetically altered with a harmful phenotype 1799 4.98%
Total 36132 100.00%

115
Section 3: Creation and maintenance of genetically altered animal lines
All uses of animals for the creation of new genetically altered animal lines by species, first uses and reuses Animal species First uses Reuses Total
Mice 7724 7724
Total 7724 7724
Uses of animals for the creation of new genetically altered animal lines by severity Severity Number of uses Percentage
Mild [up to and including] 7404 95.86%
Moderate 320 4.14%
Total 7724 100.00%
Uses of animals for the creation of new genetically altered animal lines by genetic status of the animals Genetic status Number of uses Percentage
Not genetically altered 320 4.14%
Genetically altered without a harmful phenotype 7404 95.86%
Total 7724 100.00%
Uses of animals for the creation of new genetically altered animal lines by type of basic research purposes Basic research Number of uses Percentage
Oncology 140 2.15%
Cardiovascular Blood and Lymphatic System 700 10.73%
Nervous System 1690 25.9%
Gastrointestinal System including Liver 1350 20.69%
Immune System 2324 35.62%
Other basic research 320 4.9%
Total 6524 100.00%
Uses of animals for the creation of new genetically altered animal lines by type of translational and applied
research purposes Translational and applied research Number of uses Percentage
Human Nervous and Mental Disorders 1200 100%
Total 1200 100.00%
All uses of animals for the maintenance of established genetically altered animal lines by species Animal species First uses Reuses Total uses
Mice 831 831
Total 831 831
Uses of animals for the maintenance of established genetically altered animal lines by severity Severity Number of uses Percentage
Mild [up to and including] 315 37.91%
Moderate 516 62.09%
Total 831 100.00%
Uses of animals for the maintenance of established genetically altered animal lines by genetic status of the
animals Genetic status Number of uses Percentage
Genetically altered without a harmful phenotype 265 31.89%
Genetically altered with a harmful phenotype 566 68.11%
Total 831 100.00%

116
Hungary
Hungary: Narrative 2018
1. General information on any changes in trends observed since the previous reporting period.
The total number of animals used for experimental and other scientific purposes in 2018 was 120.522
which represents 14.4% decrease compared of 2017 and 29.14 % decrease compared the same figure of
2016. The number of re-used animals was 3.447 which represent 55% decrease compared of 2017 and
138 % increase compared with the data of 2016.
The number of genetically altered animal used without a harmful phenotype in 2018 was 8.677 which
represent about 109.86% increase compared with the previous years. The used of genetically altered
animal with a harmful phenotype shows significant increase in 2018 compared with the previous years.
The data of origin of animals do not show significant difference compare with the previous years.
2. Information on significant increase or decrease in use animals in any of the specific areas and
analysis of the reasons thereof.
The vast majority (94.62%) of used animals were warm-blooded vertebrates. There was decrease in the
proportion of mammals (form 78.21% to 70.47%), while the proportion of birds and fish increased (the
birds from 19.36% to 24.16% and the fish from 2.42% to 5.38%).
The proportion of rodents among mammals decreased from 95.92% to 94.39%. There was 20.58%
decrease in the number of mice and 32.32% in the number of rats. In case of guinea-pigs was 16%
decrease. Hamsters were not used for scientific purposes in neither 2017 nor 2018. The number of
rabbits used for scientific purposes increased by 127% in 2018.
The number of used cats in experiments was a small decrease (16 compared to 15). The number of dogs
decreased by 8%. 5 non-human primate was used in 2018 (compared to the 2 Rhesus monkeys in 2017).
The number of horses, donkeys and cross-breeds used for scientific purpose represents significant
increase in 2018 compare with the previous years (from 0 to 15).
There was 7% decrease in the number of pigs. The use of cattle for scientific purposes was the same in
2017 and 2018.
The number of domestic fowl increased by 112%, and the number of other birds show significant
decrease (from 2.084 to 786).
The proportion of zebra fish increased from 2.443 to 3.744 and other fish increased by 233%.
When analysed by the purposes of the use of animals a decrease can be observed in regulatory use and
routine production (about 7%). The proportion of basic research, animals in applied and translational
research shows decrease than in 2017.

117
3. Information on any changes in trends in actual severities and analysis of the reasons thereof.
The proportion of mild uses was increased from 50.00% to 54.32% and moderate uses decreased from
28.38% to 23.37%, while severe uses increased from 12.80% to 13.33%. On the other hand non-
recoveries increased from 8.82% to 8.98%.
4. Particular efforts to promote the principle of replacement, reduction and refinement and its
impacts on statistics if any.
Due to the stringent national measures the use of non-human primates for scientific purposes has been
replaced by other methods where possible and the number of them is very low in Hungary. The use of
non-human primates occurs only when there is not any alternative method.
5. Further breakdown on the use of "other" categories if a significant proportion of animal use is
reported under this category.
There were two projects with Poecilia reticulata using concerning a national legislation to control of
discharges of used water and wastewater and from the other hand the field of environmental
protection.
Two projects with mice and one with rabbits: Proprietary transgenic animals are used for the production
of antibodies (rabbit, mouse). These transgenic animals have a much better immune response capacity
to produce antibodies than the wild type for the production of antibodies to the wild-type. These
animals cannot be replaced by any alternative method due to their ability to provide a special immune
response. In the case of an exceptionally high number of animals, the company is considered to be
responsible for the development of antibodies, which mainly uses rabbits. A minimum number of
animals are sought for the production of a sufficient quantity of serum, but a significant amount of
blood serum is required for the production of certain specific heavy antibodies, which justifies the
inclusion of more animals in the experiment.
6. Details on cases where the 'severe' classification is exceeded, whether pre-authorised or not,
covering the species, numbers, whether prior exemption was authorised, the details of the use and
the reasons why 'severe' classification was exceeded.
Number of 'severe' cases shows decrease compared with 2018 and 2017 from 18.016 % to 16.065%.
Hungary: Statistical Data 2018
Section 1: Numbers of animals used for the first time for research, testing, routine
production and educational (including training) purposes
Numbers of animals used for the first time by species Animal species Number of animals Percentage
Mice 52116 44.59%
Rats 22951 19.64%
Guinea-Pigs 4850 4.15%

118
Rabbits 1957 1.67%
Cats 15 0.01%
Dogs 369 0.32%
Horses, donkeys and cross-breeds 10 0.01%
Pigs 2103 1.8%
Cattle 33 0.03%
Domestic fowl 28326 24.23%
Other birds 786 0.67%
Zebra fish 781 0.67%
Other fish 2585 2.21%
Total 116882 100.00%
Place of birth of animals other than non-human primates Place of birth Number of animals Percentage
Animals born in the EU at a registered breeder 110559 94.59%
Animals born in the EU but not at a registered breeder 4473 3.83%
Animals born in rest of Europe 1516 1.3%
Animals born in rest of world 334 0.29%
Total 116882 100.00%
Source of non-human primates NHP Source (origin) Number of animals Percentage
No data reported
Generation of non-human primates NHP Generation Number of animals Percentage
No data reported

119
Section 2: Numbers of all uses of animals for research, testing, routine production and
educational (including training) purposes
First use versus reuses Animal species First uses Reuses Total
Mice 52116 47 52163
Rats 22951 24 22975
Guinea-Pigs 4850 17 4867
Rabbits 1957 28 1985
Cats 15 15
Dogs 369 59 428
Horses, donkeys and cross-breeds 10 5 15
Pigs 2103 145 2248
Cattle 33 33
Rhesus monkey 5 5
Domestic fowl 28326 2 28328
Other birds 786 786
Zebra fish 781 1628 2409
Other fish 2585 152 2737
Total 116882 2112 118994
Uses of animals in research, testing, routine production and education (including training) by main
categories of scientific purposes Purpose Category Number of
uses Percentage
Basic Research 36826 30.95%
Translational and applied research 26122 21.95%
Regulatory use and Routine production 54016 45.39%
Higher education or training for the acquisition, maintenance or improvement of vocational skills
2030 1.71%
Total 118994 100.00%
Basic research related uses Basic research Number of uses Percentage
Oncology 4388 11.92%
Cardiovascular Blood and Lymphatic System 3622 9.84%
Nervous System 16176 43.93%
Respiratory System 372 1.01%
Gastrointestinal System including Liver 1901 5.16%
Musculoskeletal System 334 0.91%
Immune System 3189 8.66%
Urogenital/Reproductive System 2471 6.71%
Sensory Organs (skin, eyes and ears) 329 0.89%
Endocrine System/Metabolism 835 2.27%
Multisystemic 1811 4.92%
Ethology / Animal Behaviour /Animal Biology 436 1.18%
Other basic research 962 2.61%
Total 36826 100.00%
Translational and applied research related uses Translational and applied research Number of uses Percentage
Human Cancer 5410 20.71%

120
Human Infectious Disorders 641 2.45%
Human Cardiovascular Disorders 37 0.14%
Human Nervous and Mental Disorders 748 2.86%
Human Gastrointestinal Disorders including Liver 7 0.03%
Human Musculoskeletal Disorders 141 0.54%
Human Immune Disorders 2240 8.58%
Human Urogenital/Reproductive Disorders 28 0.11%
Human Sensory Organ Disorders (skin, eyes and ears) 488 1.87%
Human Endocrine/Metabolism Disorders 110 0.42%
Animal Diseases and Disorders 11409 43.68%
Animal Welfare 2863 10.96%
Diagnosis of diseases 1657 6.34%
Non-regulatory toxicology and ecotoxicology 343 1.31%
Total 26122 100.00%
Regulatory uses and Routine production Regulatory uses and Routine production Number of uses Percentage
Quality control (incl batch safety and potency testing) 24109 44.63%
Other efficacy and tolerance testing 873 1.62%
Toxicity and other safety testing including pharmacology 28416 52.61%
Routine production 618 1.14%
Total 54016 100.00%
Regulatory uses - Quality control (including batch safety and potency testing) Regulatory uses - Quality control (including batch safety and potency testing) Number of uses Percentage
Batch safety testing 9318 38.65%
Pyrogenicity testing 20 0.08%
Batch potency testing 14379 59.64%
Other quality controls 392 1.63%
Total 24109 100.00%
Regulatory uses - Toxicity and other safety testing including pharmacology Regulatory uses - Toxicity and other safety testing including pharmacology Number of uses Percentage
Acute and sub-acute 12039 42.37%
Skin irritation/corrosion 556 1.96%
Skin sensitisation 2532 8.91%
Eye irritation/corrosion 288 1.01%
Repeated dose toxicity 7165 25.21%
Carcinogenicity 85 0.3%
Genotoxicity 96 0.34%
Reproductive toxicity 1181 4.16%
Developmental toxicity 122 0.43%
Kinetics 1548 5.45%
Ecotoxicity 2533 8.91%
Target animal safety 16 0.06%
Other toxicity/safety testing 255 0.9%
Total 28416 100.00%
Regulatory uses - Toxicity and other safety testing including pharmacology - Acute and sub-acute toxicity
testing methods Regulatory uses - Toxicity and other safety testing including pharmacology - Acute and sub-acute toxicity testing methods
Number of uses
Percentage
LD50, LC50 11499 95.51%

121
Non lethal methods 540 4.49%
Total 12039 100.00%
Regulatory uses - Toxicity and other safety testing including pharmacology - Repeated dose toxicity Regulatory uses - Toxicity and other safety testing including pharmacology - Repeated dose toxicity
Number of uses
Percentage
up to 28 days 3314 46.25%
29 - 90 days 2051 28.63%
> 90 days 1800 25.12%
Total 7165 100.00%
Regulatory uses - Toxicity and other safety testing including pharmacology - Ecotoxicity Regulatory uses - Toxicity and other safety testing including pharmacology - Ecotoxicity Number of uses Percentage
Acute toxicity 2533 100%
Total 2533 100.00%
Regulatory uses by type of legislation Type of legislation Number of
uses Percentage
Legislation on medicinal products for human use 17252 32.31%
Legislation on medicinal products for veterinary use and their residues 26854 50.29%
Industrial chemicals legislation 423 0.79%
Plant protection product legislation 6331 11.86%
Food legislation including food contact material 255 0.48%
Feed legislation including legislation for the safety of target animals, workers and environment
342 0.64%
Other legislation 1941 3.63%
Total 53398 100.00%
Regulatory uses by origin of regulatory requirement Origin of legislative requirement Number of uses Percentage
Legislation satisfying EU requirements 50527 94.62%
Legislation satisfying national requirements only [within EU] 1941 3.63%
Legislation satisfying Non-EU requirements only 930 1.74%
Total 53398 100.00%
Routine production uses by product type Product type Number of uses Percentage
Blood based products 95 15.37%
Monoclonal antibody by mouse ascites method 134 21.68%
Other product types 389 62.94%
Total 618 100.00%
Uses of animals in research, testing, routine production and education (including training) by first use and
reuses Reuse Number of uses Percentage
No 116882 98.23%
Yes 2112 1.77%
Total 118994 100.00%
Uses of animals in research, testing, routine production and education (including training) by severity Severity Number of uses Percentage
Non-recovery 10773 9.05%

122
Mild [up to and including] 64770 54.43%
Moderate 27386 23.01%
Severe 16065 13.5%
Total 118994 100.00%
Uses of animals in research, testing, routine production and education (including training) by genetic status
of animals Genetic status Number of uses Percentage
Not genetically altered 110318 92.71%
Genetically altered without a harmful phenotype 7960 6.69%
Genetically altered with a harmful phenotype 716 0.6%
Total 118994 100.00%

123
Section 3: Creation and maintenance of genetically altered animal lines
All uses of animals for the creation of new genetically altered animal lines by species, first uses and reuses Animal species First uses Reuses Total
Mice 157 157
Rabbits 36 36
Zebra fish 1335 1335
Total 193 1335 1528
Uses of animals for the creation of new genetically altered animal lines by severity Severity Number of uses Percentage
Non-recovery 54 3.53%
Mild [up to and including] 692 45.29%
Moderate 782 51.18%
Total 1528 100.00%
Uses of animals for the creation of new genetically altered animal lines by genetic status of the animals Genetic status Number of uses Percentage
Not genetically altered 154 10.08%
Genetically altered without a harmful phenotype 717 46.92%
Genetically altered with a harmful phenotype 657 43%
Total 1528 100.00%
Uses of animals for the creation of new genetically altered animal lines by type of basic research purposes Basic research Number of uses Percentage
Cardiovascular Blood and Lymphatic System 36 2.36%
Nervous System 133 8.7%
Urogenital/Reproductive System 24 1.57%
Multisystemic 1335 87.37%
Total 1528 100.00%
Uses of animals for the creation of new genetically altered animal lines by type of translational and applied
research purposes Translational and applied research Number of uses Percentage
No data reported
All uses of animals for the maintenance of established genetically altered animal lines by species Animal species First uses Reuses Total uses
No data reported
Uses of animals for the maintenance of established genetically altered animal lines by severity Severity Number of uses Percentage
No data reported
Uses of animals for the maintenance of established genetically altered animal lines by genetic status of the
animals Genetic status Number of uses Percentage
No data reported

124
Ireland
Ireland: Narrative 2018
1. General information on any changes in trends observed since the previous reporting period.
There was an 18% decrease in animal use from the previous year (2017).
Translational and Applied research increased by 29% and Regulatory use and Routine
Production decreased by 26%, with the other project purposes remaining stable.
The use of mice has dropped by 28% from the previous year but remains the most commonly
used species at 75%. Rabbits have dropped by 58%, sheep by 51% and dogs by 100%.
The use of zebrafish has increased by 1300% and the use of other fish by 182%.
There was a 73% decrease on reuse from the previous year.
2. Information on significant increase or decrease in use animals in any of the specific areas and
analysis of the reasons thereof.
This decrease in total animal use (from 2017 to 2018) is mainly accounted for by a 26% decrease
in regulatory testing. However, this followed an increase in regulatory testing by 14% from 2016
to 2017. The increase in the previous period was largely due to the breakdown of a cell based
assay resulting in the need to revert to a mouse assay. The shift downwards seen in 2018 is
likely due to the issues with this particular cell based assay being rectified, as well as a shift to
non-animal alternatives for other similar products, due to regulatory approval being received for
other cell based assays.
The increase in Translational and Applied research in 2018 may be due to a greater emphasis
being put on ensuring animal research is translatable, but may also be related to users becoming
more familiar with the reporting requirements.
The reduction in dogs from 2017 to 2018 was due to the closure of a large dog facility. The
decrease in rabbits relates primarily to a reduction in pyrogen testing on rabbits due to the
transition to non-animal alternative tests. The increased use of ‘other fish’ represents a greater
research focus on the behaviour and conservation of wild fish. The increase in zebrafish is due to
a large zebrafish project being authorised during 2018. The HPRA is not aware of any significant
factor underlying the reduction in the numbers of sheep undergoing procedures in 2018. It
should be noted however that to date in Ireland sheep have only been used for agricultural
research (ovine nutritional studies, ovine reproductive studies etc.), and it may be possible that
in 2018 studies of this nature were conducted, but the techniques utilised did not reach the
threshold of a procedure.

125
The 73% decrease on reuse from 2017 to 2018 is part of a trend as reuse has been decreasing
consistently over the past 5 years. This is likely due to a reduction in the use of species that are
more traditionally reused, e.g. rabbits, dogs and cats.
3. Information on any changes in trends in actual severities and analysis of the reasons thereof.
There was a 17% drop from the previous year in the number of severe procedures reported. The
reduction in the proportion of procedures reported as severe is attributed to the reduction in regulatory
use of animals, as well as efforts made by the HPRA, animal welfare bodies, and animal users to reduce
the severity of procedures through the implementation of refinements and earlier humane endpoints.
4. Particular efforts to promote the principle of replacement, reduction and refinement and its
impacts on statistics if any.
We have focused significant efforts (over the past number of years) in ensuring that there is a
move to non-animal alternatives for batch potency testing; and this is now reflected in the 2018
figures as batch potency testing dropped by 28% from 2017. For the animals that still must be
used for this type of testing, we have also mandated the implementation of humane endpoints
for these tests. This has resulted in the percentage of animals used for batch potency testing,
which were reported as ‘severe’, having decreased to 25% in 2018, down from 37% in 2017. We
have also endeavoured to ensure that rabbit pyrogen testing is replaced where possible, and
have had extensive communications with pharmaceutical companies that historically utilised
this type of animal test to ensure this is the case. Since 2014 there has been a 76% reduction in
this type of testing.
5. Further breakdown on the use of "other" categories if a significant proportion of animal use is
reported under this category.
There was no significant use of the ‘other’ categories at all. With regards to species, ‘other fish’ account
for 9% of animal use and ‘other birds’ less than 1%. These relate to studies of wild animals, such as
tagging and conservation projects.
6. Details on cases where the 'severe' classification is exceeded, whether pre-authorised or not,
covering the species, numbers, whether prior exemption was authorised, the details of the use and
the reasons why 'severe' classification was exceeded.
This was not exceeded during 2018.

126
Ireland: Statistical Data 2018
Section 1: Numbers of animals used for the first time for research, testing, routine
production and educational (including training) purposes
Numbers of animals used for the first time by species Animal species Number of animals Percentage
Mice 149256 75.05%
Rats 21595 10.86%
Guinea-Pigs 589 0.3%
Rabbits 171 0.09%
Ferrets 288 0.14%
Horses, donkeys and cross-breeds 54 0.03%
Pigs 1662 0.84%
Goats 19 0.01%
Sheep 644 0.32%
Cattle 2957 1.49%
Other mammals 1 0%
Domestic fowl 30 0.02%
Other birds 654 0.33%
Xenopus 42 0.02%
Zebra fish 3054 1.54%
Other fish 17854 8.98%
Total 198870 100.00%
Place of birth of animals other than non-human primates Place of birth Number of animals Percentage
Animals born in the EU at a registered breeder 185182 93.12%
Animals born in the EU but not at a registered breeder 4908 2.47%
Animals born in rest of Europe 7680 3.86%
Animals born in rest of world 1100 0.55%
Total 198870 100.00%
Source of non-human primates NHP Source (origin) Number of animals Percentage
No data reported
Generation of non-human primates NHP Generation Number of animals Percentage
No data reported

127
Section 2: Numbers of all uses of animals for research, testing, routine production and
educational (including training) purposes
First use versus reuses Animal species First uses Reuses Total
Mice 149256 149256
Rats 21595 21595
Guinea-Pigs 589 589
Rabbits 171 171
Ferrets 288 288
Horses, donkeys and cross-breeds 54 54
Pigs 1662 1662
Goats 19 19
Sheep 644 644
Cattle 2957 180 3137
Other mammals 1 1
Domestic fowl 30 30
Other birds 654 654
Xenopus 42 42
Zebra fish 3054 3054
Other fish 17854 17854
Total 198870 180 199050
Uses of animals in research, testing, routine production and education (including training) by main
categories of scientific purposes Purpose Category Number of
uses Percentage
Basic Research 7734 3.89%
Translational and applied research 38337 19.26%
Regulatory use and Routine production 143895 72.29%
Protection of the natural environment in the interests of the health or welfare of human beings or animals
8741 4.39%
Higher education or training for the acquisition, maintenance or improvement of vocational skills
343 0.17%
Total 199050 100.00%
Basic research related uses Basic research Number of uses Percentage
Oncology 30 0.39%
Cardiovascular Blood and Lymphatic System 59 0.76%
Nervous System 2968 38.38%
Respiratory System 82 1.06%
Gastrointestinal System including Liver 511 6.61%
Musculoskeletal System 46 0.59%
Immune System 1707 22.07%
Urogenital/Reproductive System 28 0.36%
Sensory Organs (skin, eyes and ears) 24 0.31%
Endocrine System/Metabolism 6 0.08%
Multisystemic 107 1.38%
Ethology / Animal Behaviour /Animal Biology 2166 28.01%
Total 7734 100.00%

128
Translational and applied research related uses Translational and applied research Number of uses Percentage
Human Cancer 1202 3.14%
Human Infectious Disorders 768 2%
Human Cardiovascular Disorders 971 2.53%
Human Nervous and Mental Disorders 9369 24.44%
Human Respiratory Disorders 227 0.59%
Human Gastrointestinal Disorders including Liver 1063 2.77%
Human Musculoskeletal Disorders 788 2.06%
Human Immune Disorders 5838 15.23%
Human Urogenital/Reproductive Disorders 122 0.32%
Human Sensory Organ Disorders (skin, eyes and ears) 4110 10.72%
Human Endocrine/Metabolism Disorders 1347 3.51%
Animal Diseases and Disorders 3425 8.93%
Animal Welfare 9095 23.72%
Diagnosis of diseases 12 0.03%
Total 38337 100.00%
Regulatory uses and Routine production Regulatory uses and Routine production Number of uses Percentage
Quality control (incl batch safety and potency testing) 143578 99.78%
Toxicity and other safety testing including pharmacology 300 0.21%
Routine production 17 0.01%
Total 143895 100.00%
Regulatory uses - Quality control (including batch safety and potency testing) Regulatory uses - Quality control (including batch safety and potency testing) Number of uses Percentage
Batch safety testing 4587 3.19%
Pyrogenicity testing 145 0.1%
Batch potency testing 138846 96.7%
Total 143578 100.00%
Regulatory uses - Toxicity and other safety testing including pharmacology Regulatory uses - Toxicity and other safety testing including pharmacology Number of uses Percentage
Ecotoxicity 300 100%
Total 300 100.00%
Regulatory uses - Toxicity and other safety testing including pharmacology - Acute and sub-acute toxicity
testing methods Regulatory uses - Toxicity and other safety testing including pharmacology - Acute and sub-acute toxicity testing methods
Number of uses
Percentage
No data reported
Regulatory uses - Toxicity and other safety testing including pharmacology - Repeated dose toxicity Regulatory uses - Toxicity and other safety testing including pharmacology - Repeated dose toxicity
Number of uses
Percentage
No data reported
Regulatory uses - Toxicity and other safety testing including pharmacology - Ecotoxicity Regulatory uses - Toxicity and other safety testing including pharmacology - Ecotoxicity Number of uses Percentage
Acute toxicity 300 100%
Total 300 100.00%

129
Regulatory uses by type of legislation Type of legislation Number of uses Percentage
Legislation on medicinal products for human use 143556 99.78%
Legislation on medicinal products for veterinary use and their residues 22 0.02%
Other legislation 300 0.21%
Total 143878 100.00%
Regulatory uses by origin of regulatory requirement Origin of legislative requirement Number of uses Percentage
Legislation satisfying EU requirements 143878 100%
Total 143878 100.00%
Routine production uses by product type Product type Number of uses Percentage
Blood based products 17 100%
Total 17 100.00%
Uses of animals in research, testing, routine production and education (including training) by first use and
reuses Reuse Number of uses Percentage
No 198870 99.91%
Yes 180 0.09%
Total 199050 100.00%
Uses of animals in research, testing, routine production and education (including training) by severity Severity Number of uses Percentage
Non-recovery 1065 0.54%
Mild [up to and including] 109654 55.09%
Moderate 54606 27.43%
Severe 33725 16.94%
Total 199050 100.00%
Uses of animals in research, testing, routine production and education (including training) by genetic status
of animals Genetic status Number of uses Percentage
Not genetically altered 189518 95.21%
Genetically altered without a harmful phenotype 5991 3.01%
Genetically altered with a harmful phenotype 3541 1.78%
Total 199050 100.00%

130
Section 3: Creation and maintenance of genetically altered animal lines
All uses of animals for the creation of new genetically altered animal lines by species, first uses and reuses Animal species First uses Reuses Total
Mice 253 253
Rats 40 40
Total 293 293
Uses of animals for the creation of new genetically altered animal lines by severity Severity Number of uses Percentage
Mild [up to and including] 211 72.01%
Moderate 82 27.99%
Total 293 100.00%
Uses of animals for the creation of new genetically altered animal lines by genetic status of the animals Genetic status Number of uses Percentage
Not genetically altered 40 13.65%
Genetically altered without a harmful phenotype 186 63.48%
Genetically altered with a harmful phenotype 67 22.87%
Total 293 100.00%
Uses of animals for the creation of new genetically altered animal lines by type of basic research purposes Basic research Number of uses Percentage
Gastrointestinal System including Liver 91 59.48%
Immune System 22 14.38%
Multisystemic 40 26.14%
Total 153 100.00%
Uses of animals for the creation of new genetically altered animal lines by type of translational and applied
research purposes Translational and applied research Number of uses Percentage
Human Cardiovascular Disorders 33 23.57%
Human Nervous and Mental Disorders 67 47.86%
Human Musculoskeletal Disorders 40 28.57%
Total 140 100.00%
All uses of animals for the maintenance of established genetically altered animal lines by species Animal species First uses Reuses Total uses
Mice 457 457
Total 457 457
Uses of animals for the maintenance of established genetically altered animal lines by severity Severity Number of uses Percentage
Mild [up to and including] 337 73.74%
Moderate 99 21.66%
Severe 21 4.6%
Total 457 100.00%
Uses of animals for the maintenance of established genetically altered animal lines by genetic status of the
animals Genetic status Number of uses Percentage
Not genetically altered 428 93.65%

131
Genetically altered with a harmful phenotype 29 6.35%
Total 457 100.00%

132
Italy
Italy: Narrative 2018
1. General information on any changes in trends observed since the previous reporting period.
The downward trend in the total number of animals used for scientific purposes for the first time (‘naive’ animals) continued also in 2018. In total, 553 208 animals were used in scientific procedures in 2018, a decline of 3.76% compared to the previous year (see Figure 1).
Figure 1
Total number of animals used in Italy in the period 2015-2018
2. Information on significant increase or decrease in use animals in any of the specific areas and analysis of the reasons thereof.
In terms of species, rodents and rabbits accounted for 86% of the animals, including reused animals,
used in testing in 2015-2018 (see Table 1). Within these species, the number of rodents fell compared to
the previous year.
There was a decrease in the number of non-human primates compared to 2017. Non-human primates
are primarily used for regulatory tests (toxicity and other safety tests) required by European and
international law, at a rate which has continued increasing (from 86.75% in 2015 to 99% in 2018).
Accordingly there has been a percentage decrease in non-human primates used in basic research over
the three-year period (from 11.67% in 2015 to 1% in 2018).

133
The most frequently used species was Macaca fascicularis. In 2018 generation F1 animals accounted for
24% of the animals used owing to reduced availability of generation F2 animals from breeders and
suppliers of non-human primates and the simultaneous increase in the number of regulatory tests.
Table 1
Animal
species
% of
2015 total
% of
2016 total
% of
2017 total
% of
2018 total
Mean (%)
2015-2018
% difference
between years
2015-2018
Rodents 89.02% 87.43% 84.73% 83.49% 86.17% -5.53%
Rabbits 1.66% 2.49% 3.33% 2.19% 2.42% +0.53%
Total rodents
+ rabbits 90.68% 89.82% 88.06% 85.68% 88.56% -5.00%
Total other
animal
species
9.32% 10.18% 11.94% 14.32% 11.44% +5.00%
Total (all
species) 100.00% 100.00% 100.00% 100.00% 100.00%
The breakdown for all animal species was as follows in 2018 (see Table 2):
29.11% of the animals were used in basic biological studies.
32.74% were used in translational or applied research.
37.36% were used for regulatory use and routine production.
79% were used for other purposes.
No animals were used for forensic studies.
Table 2
Animal use by purpose of study
Purpose of study 2015 2016 2017 2018
Basic research 37.26% 35.42% 33.55% 29.11%
Translational research 24.92% 26.54% 26.48% 32.74%
Regulatory testing 36.07% 37.11% 38.96% 37.36%
Other 1.75% 0.93% 1.01% 0.79%
The downward trend in the number of animals used for basic research and the increase in animals used
for translational or applied research was confirmed in 2018.
Regulatory testing (experiments that are compulsory under national, European or international law) was
the most common purpose (see Table 2).

134
3. Information on any changes in trends in actual severities and analysis of the reasons thereof.
Data on the level of suffering felt by animals (see Table 3) was recorded for the fifth time in 2018.
Table 3
Suffering level /
year
Non-recovery Mild (up to and
including)
Moderate Severe
2015 6.16% 47.58% 39.44% 6.82%
2016 4.81% 50.42% 36.11% 10.66%
2017 5.49% 48.45% 30.55% 15.50%
2018 4.12% 50.10% 28.62% 17.16%
Comparing the data for 2015 to 2018 shows that:
there were slight variations in the ‘non-recovery’ and ‘mild’ suffering levels, which together
account for 54%;
there was a slight decrease in the ‘moderate’ suffering level;
there was an increase of 1.66% in the ‘severe’ category.
Mice accounted for 78% of the increase in the ‘severe’ suffering level and was thus the most affected
species.
4. Particular efforts to promote the principle of replacement, reduction and refinement and its impact on statistics if any.
Legislative Decree No 26/2014, which transposes the Directive, designated the laboratory of the
Department for cell substrates and cellular immunology of the Lombardy and Emilia-Romagna Animal
Disease Prevention Institute as the single contact point charged with providing advice on the suitability
and regulatory appropriateness of alternative procedures proposed for validation studies.
National Committee for the Protection of Animals Used for Scientific Purposes
The National Committee for the Protection of Animals Used for Scientific Purposes was set up in 2017. It
is made up of members representing academia, public scientific research institutions, the Ministry of
Health, the Italian National Institute of Health and the National Reference Centre for Alternative
Methods and Welfare and Care of Laboratory Animals.
After drawing up its rules of procedure, its activities included providing the Ministry of Health with
advice on preparing the draft ministerial decree on staff training.
In 2018 the National Committee organised a first convention of animal welfare bodies (Organismi
Preposti al Benessere Animale), the outcome of which was that animal welfare bodies should be
coordinated nationally with the aim of harmonising their work and sharing best practice, in particular as

135
regards preliminary assessment of research projects with a view to issuing the reasoned opinion needed
for authorisation applications for such projects.
Animal welfare bodies
In general terms, 2018 confirmed the trend towards greater awareness among and increased capacity
for intervention by the animal welfare bodies in assessing research projects so as to issue reasoned
opinions. This made it possible to verify, to the best possible extent, the correct application of the ‘3Rs’
principle, particularly as regards the replacement or reduction of animal use, with clear results in the
basic research area.
As far as staff skills are concerned, conferences, workshops and courses were organised by various
public or private bodies, with experts from the Ministry of Health participating as lecturers/speakers in
numerous events.
5. Further breakdown on the use of ‘other’ categories if a significant proportion of animal use is reported under this category.
The ‘other’ heading is used for the main sub-sectors, which mainly concern the regulatory field. More
specifically:
Animals used in routine production:
Other efficacy and tolerance testing (regarding immunogenicity for human vaccines)
Other efficacy and tolerance testing (regarding production of inactivated antigens for animal
vaccines)
Animals used in the toxicity/ecotoxicity testing sector:
Other tests: Diagnostic ecotoxicity testing on waste
6. Details on cases where the ‘severe’ classification is exceeded, whether pre-authorised or not, covering the species, numbers, whether prior exemption was authorised, the details of the use and the reasons why ‘severe’ classification was exceeded.
There were no cases in which the ‘severe’ classification was exceeded.
Italy: Statistical Data 2018
Section 1: Numbers of animals used for the first time for research, testing, routine
production and educational (including training) purposes
Numbers of animals used for the first time by species Animal species Number of animals Percentage
Mice 330716 60.45%
Rats 111057 20.3%
Guinea-Pigs 13852 2.53%
Hamsters (Syrian) 288 0.05%

136
Other rodents 698 0.13%
Rabbits 12141 2.22%
Dogs 365 0.07%
Ferrets 9 0%
Pigs 1457 0.27%
Goats 16 0%
Sheep 96 0.02%
Cattle 638 0.12%
Cynomolgus monkey 473 0.09%
Other mammals 25 0%
Domestic fowl 40382 7.38%
Other birds 409 0.07%
Xenopus 222 0.04%
Zebra fish 12115 2.21%
Other fish 22124 4.04%
Cephalopods 46 0.01%
Total 547129 100.00%
Place of birth of animals other than non-human primates Place of birth Number of animals Percentage
Animals born in the EU at a registered breeder 503191 92.05%
Animals born in the EU but not at a registered breeder 42027 7.69%
Animals born in rest of Europe 60 0.01%
Animals born in rest of world 1378 0.25%
Total 546656 100.00%
Source of non-human primates NHP Source (origin) Number of animals Percentage
Animals born at a registered breeder within EU 2 0.42%
Animals born in Asia 251 53.07%
Animals born in Africa 220 46.51%
Total 473 100.00%
Generation of non-human primates NHP Generation Number of animals Percentage
F1 114 24.1%
F2 or greater 359 75.9%
Total 473 100.00%

137
Section 2: Numbers of all uses of animals for research, testing, routine production and
educational (including training) purposes
First use versus reuses Animal species First uses Reuses Total
Mice 330716 517 331233
Rats 111057 209 111266
Guinea-Pigs 13852 226 14078
Hamsters (Syrian) 288 288
Other rodents 698 698
Rabbits 12141 859 13000
Dogs 365 76 441
Ferrets 9 9
Horses, donkeys and cross-breeds 15 15
Pigs 1457 69 1526
Goats 16 20 36
Sheep 96 60 156
Cattle 638 55 693
Marmoset and tamarins 1 1
Cynomolgus monkey 473 38 511
Other mammals 25 25
Domestic fowl 40382 1771 42153
Other birds 409 409
Xenopus 222 23 245
Zebra fish 12115 12115
Other fish 22124 279 22403
Cephalopods 46 46
Total 547129 4218 551347
Uses of animals in research, testing, routine production and education (including training) by main
categories of scientific purposes Purpose Category Number of
uses Percentage
Basic Research 158745 28.79%
Translational and applied research 180790 32.79%
Regulatory use and Routine production 208263 37.77%
Protection of the natural environment in the interests of the health or welfare of human beings or animals
2110 0.38%
Higher education or training for the acquisition, maintenance or improvement of vocational skills
1439 0.26%
Total 551347 100.00%
Basic research related uses Basic research Number of uses Percentage
Oncology 38504 24.26%
Cardiovascular Blood and Lymphatic System 9258 5.83%
Nervous System 66746 42.05%
Respiratory System 727 0.46%
Gastrointestinal System including Liver 2445 1.54%
Musculoskeletal System 7302 4.6%
Immune System 11504 7.25%
Urogenital/Reproductive System 2279 1.44%

138
Sensory Organs (skin, eyes and ears) 4731 2.98%
Endocrine System/Metabolism 4044 2.55%
Multisystemic 1637 1.03%
Ethology / Animal Behaviour /Animal Biology 4245 2.67%
Other basic research 5323 3.35%
Total 158745 100.00%
Translational and applied research related uses Translational and applied research Number of uses Percentage
Human Cancer 53139 29.39%
Human Infectious Disorders 20268 11.21%
Human Cardiovascular Disorders 2163 1.2%
Human Nervous and Mental Disorders 23263 12.87%
Human Respiratory Disorders 16517 9.14%
Human Gastrointestinal Disorders including Liver 3533 1.95%
Human Musculoskeletal Disorders 11459 6.34%
Human Immune Disorders 4256 2.35%
Human Urogenital/Reproductive Disorders 1728 0.96%
Human Sensory Organ Disorders (skin, eyes and ears) 1884 1.04%
Human Endocrine/Metabolism Disorders 4788 2.65%
Other Human Disorders 3104 1.72%
Animal Diseases and Disorders 20489 11.33%
Animal Welfare 1183 0.65%
Diagnosis of diseases 12839 7.1%
Non-regulatory toxicology and ecotoxicology 177 0.1%
Total 180790 100.00%
Regulatory uses and Routine production Regulatory uses and Routine production Number of uses Percentage
Quality control (incl batch safety and potency testing) 106515 51.14%
Other efficacy and tolerance testing 38468 18.47%
Toxicity and other safety testing including pharmacology 60938 29.26%
Routine production 2342 1.12%
Total 208263 100.00%
Regulatory uses - Quality control (including batch safety and potency testing) Regulatory uses - Quality control (including batch safety and potency testing) Number of uses Percentage
Batch safety testing 27200 25.54%
Pyrogenicity testing 2243 2.11%
Batch potency testing 73895 69.38%
Other quality controls 3177 2.98%
Total 106515 100.00%
Regulatory uses - Toxicity and other safety testing including pharmacology Regulatory uses - Toxicity and other safety testing including pharmacology Number of uses Percentage
Acute and sub-acute 10171 16.69%
Skin irritation/corrosion 870 1.43%
Skin sensitisation 10636 17.45%
Eye irritation/corrosion 153 0.25%
Repeated dose toxicity 7516 12.33%
Genotoxicity 623 1.02%
Reproductive toxicity 790 1.3%
Developmental toxicity 4355 7.15%

139
Neurotoxicity 600 0.98%
Kinetics 6298 10.34%
Pharmaco-dynamics (incl safety pharmacology) 968 1.59%
Ecotoxicity 6083 9.98%
Safety testing in food and feed area 9456 15.52%
Target animal safety 654 1.07%
Other toxicity/safety testing 1765 2.9%
Total 60938 100.00%
Regulatory uses - Toxicity and other safety testing including pharmacology - Acute and sub-acute toxicity
testing methods Regulatory uses - Toxicity and other safety testing including pharmacology - Acute and sub-acute toxicity testing methods
Number of uses
Percentage
LD50, LC50 1453 14.29%
Other lethal methods 62 0.61%
Non lethal methods 8656 85.1%
Total 10171 100.00%
Regulatory uses - Toxicity and other safety testing including pharmacology - Repeated dose toxicity Regulatory uses - Toxicity and other safety testing including pharmacology - Repeated dose toxicity
Number of uses
Percentage
up to 28 days 3293 43.81%
29 - 90 days 3691 49.11%
> 90 days 532 7.08%
Total 7516 100.00%
Regulatory uses - Toxicity and other safety testing including pharmacology - Ecotoxicity Regulatory uses - Toxicity and other safety testing including pharmacology - Ecotoxicity Number of uses Percentage
Acute toxicity 4424 72.73%
Other ecotoxicity 1659 27.27%
Total 6083 100.00%
Regulatory uses by type of legislation Type of legislation Number of
uses Percentage
Legislation on medicinal products for human use 125134 60.77%
Legislation on medicinal products for veterinary use and their residues 41415 20.11%
Medical devices legislation 16788 8.15%
Industrial chemicals legislation 6935 3.37%
Plant protection product legislation 140 0.07%
Biocides legislation 56 0.03%
Food legislation including food contact material 10981 5.33%
Feed legislation including legislation for the safety of target animals, workers and environment
412 0.2%
Other legislation 4060 1.97%
Total 205921 100.00%
Regulatory uses by origin of regulatory requirement Origin of legislative requirement Number of uses Percentage
Legislation satisfying EU requirements 191112 92.81%
Legislation satisfying national requirements only [within EU] 3027 1.47%
Legislation satisfying Non-EU requirements only 11782 5.72%
Total 205921 100.00%

140
Routine production uses by product type Product type Number of uses Percentage
Blood based products 1582 67.55%
Other product types 760 32.45%
Total 2342 100.00%
Uses of animals in research, testing, routine production and education (including training) by first use and
reuses Reuse Number of uses Percentage
No 547129 99.23%
Yes 4218 0.77%
Total 551347 100.00%
Uses of animals in research, testing, routine production and education (including training) by severity Severity Number of uses Percentage
Non-recovery 22749 4.13%
Mild [up to and including] 277150 50.27%
Moderate 156763 28.43%
Severe 94685 17.17%
Total 551347 100.00%
Uses of animals in research, testing, routine production and education (including training) by genetic status
of animals Genetic status Number of uses Percentage
Not genetically altered 441685 80.11%
Genetically altered without a harmful phenotype 92540 16.78%
Genetically altered with a harmful phenotype 17122 3.11%
Total 551347 100.00%

141
Section 3: Creation and maintenance of genetically altered animal lines
All uses of animals for the creation of new genetically altered animal lines by species, first uses and reuses Animal species First uses Reuses Total
Mice 4426 4426
Rats 18 18
Pigs 25 25
Zebra fish 556 556
Other fish 226 226
Total 5251 5251
Uses of animals for the creation of new genetically altered animal lines by severity Severity Number of uses Percentage
Non-recovery 226 4.3%
Mild [up to and including] 1369 26.07%
Moderate 2669 50.83%
Severe 987 18.8%
Total 5251 100.00%
Uses of animals for the creation of new genetically altered animal lines by genetic status of the animals Genetic status Number of uses Percentage
Not genetically altered 970 18.47%
Genetically altered without a harmful phenotype 3052 58.12%
Genetically altered with a harmful phenotype 1229 23.41%
Total 5251 100.00%
Uses of animals for the creation of new genetically altered animal lines by type of basic research purposes Basic research Number of uses Percentage
Oncology 2485 70.08%
Cardiovascular Blood and Lymphatic System 71 2%
Nervous System 501 14.13%
Gastrointestinal System including Liver 6 0.17%
Musculoskeletal System 84 2.37%
Immune System 99 2.79%
Urogenital/Reproductive System 10 0.28%
Endocrine System/Metabolism 254 7.16%
Multisystemic 36 1.02%
Total 3546 100.00%
Uses of animals for the creation of new genetically altered animal lines by type of translational and applied
research purposes Translational and applied research Number of uses Percentage
Human Cancer 130 7.62%
Human Cardiovascular Disorders 4 0.23%
Human Nervous and Mental Disorders 605 35.48%
Human Respiratory Disorders 33 1.94%
Human Gastrointestinal Disorders including Liver 31 1.82%
Human Musculoskeletal Disorders 49 2.87%
Human Urogenital/Reproductive Disorders 40 2.35%
Other Human Disorders 813 47.68%
Total 1705 100.00%

142
All uses of animals for the maintenance of established genetically altered animal lines by species Animal species First uses Reuses Total uses
Mice 828 828
Total 828 828
Uses of animals for the maintenance of established genetically altered animal lines by severity Severity Number of uses Percentage
Mild [up to and including] 719 86.84%
Moderate 104 12.56%
Severe 5 0.6%
Total 828 100.00%
Uses of animals for the maintenance of established genetically altered animal lines by genetic status of the
animals Genetic status Number of uses Percentage
Genetically altered without a harmful phenotype 583 70.41%
Genetically altered with a harmful phenotype 245 29.59%
Total 828 100.00%

143
Latvia
Latvia: Narrative 2018
1. General information on any changes in trends observed since the previous reporting period. In 2016 competent authority has approved 3 projects, in 2017 – 13, but in 2018 - 8. Since the previous years, animal amount used for scientific purposes have not significantly changed (5458 in 2016 and 5289 in 2017), but decreased 4417 –in 2018. During the 2016 active licence was for 17 projects, in 2017 – for 25, but in 2018 – for 29 projects. However it does not mean that in all projects all procedures were performed and projects realised as planned. In some cases projects or procedures were stopped for a while because the lack of financing or additional research before preclinical trials. Year by year the science quickly develops and that is why researchers after getting new information concerning their research topic uses in vitro methodology as much as possible, and it results with decreasing total amount of animals. In most of cases, especially in long lasting projects (5-year projects), researchers use less animals as they have written down in project licence application.
In 2018 increased the use of genetically altered animals without harmful phenotype. In previous two years 60 genetically altered animals were used per year, however in 2018 -315 (total increase from 1.13% to 7.13%). The main reason for this is related to studies concerned specific diseases and their treatment. As to evaluate new substances for treatment and new methods of therapy, the pathological model is needed. As the science continuously develops, now is less harmful to use already genetically altered animal as a model instead of making pathological state model using specific diet or surgery. In most of cases by using genetically altered animals we can get the very beginning of the disease/pathological state that has no clinical signs, but can be detected only by specific diagnostic devices or analysis. However thus very beginning of pathological state is enough for the study and in result animals are exposed to a lighter procedure. Moreover, in some cases using animals as the models for studies of vaccines and immunological treatment of cancer, there is a need for model that is very close to human in some specific nuances (for example some cell receptors). Using genetically altered animals we can replace the use of species with higher sensitivity with species with lover sensitivity (for example instead of using primates is possible to use mice or rats).
2. Information on significant increase or decrease in use animals in any of the specific areas and analysis of the reasons thereof.
Comparing last three years the total amount of used mice have decreased from 84.3% in 2016 (n=4601) to 63.0% (3332) in 2016 but in 2018 – increased percentage distribution however total amount of using this species decreased 67.4% (2975) (see Fig.1). The total amount of used rats have increased from 11.58% (n=632) in 2016 to 33.94% (1795) in 2017, but decreased in 2018 to 24.7% (1093). The reason for these changes is that in 2017 researchers have realized more projects where rats were included. In some specific investigations or testing of new substances rats were preferred because of their size. Rat’s bigger size comparing to mice allow researchers to get more biological samples (for example – tissue, blood samples or tumour cells) for in vitro testing and in the same time also allow to use less animals and get more necessary data. Compeering previous years in 2018 49 wild birds were used for study concerned to protection of natural environment in the interests of health of animals. In 2018 the project was continued from previous years.

144
Figure 1
3. Information on any changes in trends in actual severities and analysis of the reasons thereof.
All animals used in procedures come from EU origin, and the biggest part 93.46% from the registered breeder.
The biggest part of all animals were used in mild procedures (see Fig. 2 and Fig. 3) – 46.55. (n=2056 from which 1996 were used for planned mild procedures, but 30 mice (Purpose - Basic Research (Nervous System)) and 24 rats (Purpose - Trans/Appl Research (Human Nervous and Mental Disorders)) were used as control group in moderate procedure and were shame operated that finally did not cause further disabilities or dysfunctions except skin cut and finally resulted as a mild procedure.

145
Figure 2
In total 150 (3.4%) animals in 2018 were used in severe procedures from which 135 animals were used for planned severe procedures 4 mice (for purpose Trans/Appl Research (Human Nervous and Mental Disorders)) and 48 rats from three projects went through severe planned procedure( for purpose Trans/Appl Research (Human Cardiovascular Disorders)).
1. During moderate procedure (Basic Research (Oncology)) 7 mice developed urinary obstruction due to the tumour mass growth into urethra, and resulted in hydronephrosis.
2. During moderate procedure (Trans/Appl Research (Human Cancer)) 8 mice lost weight more than 25% and therefore animals were humanely killed and were not included in further manipulations

146
Figure 3
In moderate procedures in 2018 were used 1267 (28.68%) animals from which 878 mice and 286 rats were exposed to previous planned moderate procedures, but
1. 72 mice used in Basic Research (Oncology) purpose underwent moderate procedure instead of planned severe because of the formation of metastases was smaller as planned previous and thus easer for animals.
2. one mice from planned mild procedure (Trans/Appl Research (Animal Diseases and Disorders)) died without previously detectable signs of suffering.
In 2018 in non-recovery procedures were used 944 animals from which 932 were used for planned non-recovery procedures – a)Higher education or training for the acquisition, maintenance or improvement of vocational skills – 24 pigs, b) Trans/Appl Research (Human Cardiovascular Disorders) – 563 rats, c) Trans/Appl Research (Human Nervous and Mental Disorders) – 310 mice and 30 rats. Animals from planned severe procedures – 2 rats from procedure with Trans/Appl Research (Human Cardiovascular Disorders) purpose and mice from previous planned moderate procedure – 5 from procedure with Trans/Appl Research (Human Nervous and Mental Disorders) purpose and 2 from procedure with Trans/Appl Research (Human Cardiovascular Disorders) purpose died during the surgical manipulations before any other tests therefore actually were exposed to non-recovery procedures. In general observation there are evident changes in severity of procedures. Comparing previous year in 2018 decreased animal using in severe and non-recovery procedures. That is explained by continuous advising and asking scientists to use more lighter procedures, as well as they use consult each other and take a part in international projects in this way getting best experience and practice from foreign colleagues. The main research purpose is translation and applied research. This is explained with trend between researchers mainly to devote their activities to investigation of new substances with therapeutic effect.

147
In this research branch (translation and applied research )for the last year decreased animal using, especially in harder procedures (see Fig. 4), but in 2018 increased animal using in mild procedures. However in basic research field decreased total amount of used animals as well as decreased amount of used animals in mild procedures, but increased animal using for moderate procedures. That is because of several studies devoted to basic cancer development processes with additional aim to detect immunological aspects that could serve as a next step for discovering new immunological treatment for this serious disease.
Figure 4
Reason for animal amount changes mentioned previous (tendency to decrease animal using in harmful procedures from 2015 to 2018) is a result of scientist more carefully planned work and choosing new less harmful research methods. During the continuous scientific work researchers are looking for new alternative methods and ways to minimize animal using in procedures as well as project evaluation commission suggestions concerning 3RS principles are taken in notice. Moreover, project authors strive to use more in vitro, in silico and ex vivo methods (for example – isolated organs, cells or organelles instead of live animal using), especially for toxicity and effectivity first stage tests. As well as scientists uses organs and tissue from animals that were used in other procedures as a control group animals after euthanasia. 4. Particular efforts to promote the principle of replacement, reduction and refinement and its impacts on statistics if any. Authors of scientific projects strive to use in silico, in vitro and ex vivo methods in substance testing processes to detect most effective sample before animal using as well as explore literature and collaborate with other scientists doing research and use other surveys to avoid repeated studies and to use as little as possible animals in procedures. During the project evaluation process competent authority and experts ensures and verifies the project scientific utility and benefits, analyse possibility to replace animals with alternative methods as well as evaluate presented animal amount in procedures

148
and research methods and techniques. Competent authority and experts verifies weather it is possible to achieve the objectives pursued in project according to the project plan. If there are any possibility to decrease animal sufferings or to decrease a total amount of animals in procedures, applicants are strictly obligated to make changes in project before authorization. In addition – during inspections each project is checked according to approved methodology. 5. Further breakdown on the use of "other" categories if a significant proportion of animal use is reported under this category. In 2018, as the project was continued from 2014, 28 pigs were used in non-recovery procedures for higher education purposes (human and veterinary surgeons training). After procedure (surgical intervention) pigs were euthanized. As much as possible manipulations (cuts, trainings of surgical techniques) were done with each animal under anaesthesia and narcosis to decrease a total amount of animals. Also in 2018 120 Salmo salar and 120 Salmo trutta was used for study concerned to protection of natural environment in the interests of health of animals. Study was devoted for finding more effective ways to contribute the survival of juvenile fish after release into wild water bodies. Comparing previous year, in 2018 49 wild birds were used in wild nature research project. This project was authorized in previous year, but financial difficulties did not allow to realize project in 2017, but in 2018 after improvement of financial position, this project was resumed. 6. Details on cases where the 'severe' classification is exceeded, whether pre-authorised or not, covering the species, numbers, whether prior exemption was authorised, the details of the use and the reasons why 'severe' classification was exceeded. During the year 2018 there have not been any cases or detected information from users that the 'severe' classification was exceeded in any of procedures.
In 2018 users have not asked competent authority to approve procedures where the 'severe'
classification is exceeded.
Latvia: Statistical Data 2018
Section 1: Numbers of animals used for the first time for research, testing, routine
production and educational (including training) purposes
Numbers of animals used for the first time by species Animal species Number of animals Percentage
Mice 2975 67.35%
Rats 1093 24.75%
Rabbits 36 0.82%
Pigs 24 0.54%
Other birds 49 1.11%
Other fish 240 5.43%
Total 4417 100.00%

149
Place of birth of animals other than non-human primates Place of birth Number of animals Percentage
Animals born in the EU at a registered breeder 4128 93.46%
Animals born in the EU but not at a registered breeder 49 1.11%
Animals born in rest of Europe 240 5.43%
Total 4417 100.00%
Source of non-human primates NHP Source (origin) Number of animals Percentage
No data reported
Generation of non-human primates NHP Generation Number of animals Percentage
No data reported

150
Section 2: Numbers of all uses of animals for research, testing, routine production and
educational (including training) purposes
First use versus reuses Animal species First uses Reuses Total
Mice 2975 2975
Rats 1093 1093
Rabbits 36 36
Pigs 24 24
Other birds 49 49
Other fish 240 240
Total 4417 4417
Uses of animals in research, testing, routine production and education (including training) by main
categories of scientific purposes Purpose Category Number of
uses Percentage
Basic Research 890 20.15%
Translational and applied research 3203 72.52%
Regulatory use and Routine production 60 1.36%
Protection of the natural environment in the interests of the health or welfare of human beings or animals
240 5.43%
Higher education or training for the acquisition, maintenance or improvement of vocational skills
24 0.54%
Total 4417 100.00%
Basic research related uses Basic research Number of uses Percentage
Oncology 141 15.84%
Cardiovascular Blood and Lymphatic System 30 3.37%
Nervous System 265 29.78%
Musculoskeletal System 88 9.89%
Endocrine System/Metabolism 72 8.09%
Ethology / Animal Behaviour /Animal Biology 294 33.03%
Total 890 100.00%
Translational and applied research related uses Translational and applied research Number of uses Percentage
Human Cancer 352 10.99%
Human Infectious Disorders 30 0.94%
Human Cardiovascular Disorders 653 20.39%
Human Nervous and Mental Disorders 1795 56.04%
Human Urogenital/Reproductive Disorders 145 4.53%
Animal Diseases and Disorders 216 6.74%
Non-regulatory toxicology and ecotoxicology 12 0.37%
Total 3203 100.00%
Regulatory uses and Routine production Regulatory uses and Routine production Number of uses Percentage
Toxicity and other safety testing including pharmacology 60 100%
Total 60 100.00%

151
Regulatory uses - Quality control (including batch safety and potency testing) Regulatory uses - Quality control (including batch safety and potency testing) Number of uses Percentage
No data reported
Regulatory uses - Toxicity and other safety testing including pharmacology Regulatory uses - Toxicity and other safety testing including pharmacology Number of uses Percentage
Skin sensitisation 60 100%
Total 60 100.00%
Regulatory uses - Toxicity and other safety testing including pharmacology - Acute and sub-acute toxicity
testing methods Regulatory uses - Toxicity and other safety testing including pharmacology - Acute and sub-acute toxicity testing methods
Number of uses
Percentage
No data reported
Regulatory uses - Toxicity and other safety testing including pharmacology - Repeated dose toxicity Regulatory uses - Toxicity and other safety testing including pharmacology - Repeated dose toxicity
Number of uses
Percentage
No data reported
Regulatory uses - Toxicity and other safety testing including pharmacology - Ecotoxicity Regulatory uses - Toxicity and other safety testing including pharmacology - Ecotoxicity Number of uses Percentage
No data reported
Regulatory uses by type of legislation Type of legislation Number of uses Percentage
Legislation on medicinal products for human use 60 100%
Total 60 100.00%
Regulatory uses by origin of regulatory requirement Origin of legislative requirement Number of uses Percentage
Legislation satisfying EU requirements 60 100%
Total 60 100.00%
Routine production uses by product type Product type Number of uses Percentage
No data reported
Uses of animals in research, testing, routine production and education (including training) by first use and
reuses Reuse Number of uses Percentage
No 4417 100%
Total 4417 100.00%
Uses of animals in research, testing, routine production and education (including training) by severity Severity Number of uses Percentage
Non-recovery 944 21.37%
Mild [up to and including] 2056 46.55%
Moderate 1267 28.68%
Severe 150 3.4%
Total 4417 100.00%

152
Uses of animals in research, testing, routine production and education (including training) by genetic status
of animals Genetic status Number of uses Percentage
Not genetically altered 4102 92.87%
Genetically altered without a harmful phenotype 315 7.13%
Total 4417 100.00%

153
Section 3: Creation and maintenance of genetically altered animal lines
All uses of animals for the creation of new genetically altered animal lines by species, first uses and reuses Animal species First uses Reuses Total
No data reported
Uses of animals for the creation of new genetically altered animal lines by severity Severity Number of uses Percentage
No data reported
Uses of animals for the creation of new genetically altered animal lines by genetic status of the animals Genetic status Number of uses Percentage
No data reported
Uses of animals for the creation of new genetically altered animal lines by type of basic research purposes Basic research Number of uses Percentage
No data reported
Uses of animals for the creation of new genetically altered animal lines by type of translational and applied
research purposes Translational and applied research Number of uses Percentage
No data reported
All uses of animals for the maintenance of established genetically altered animal lines by species Animal species First uses Reuses Total uses
No data reported
Uses of animals for the maintenance of established genetically altered animal lines by severity Severity Number of uses Percentage
No data reported
Uses of animals for the maintenance of established genetically altered animal lines by genetic status of the
animals Genetic status Number of uses Percentage
No data reported

154
Lithuania
Lithuania: Narrative 2018
1. General information on any changes in trends observed since the previous reporting period.
In 2018, there were 3286 laboratory animals used for scientific or educational purposes in Lithuania. In
comparison to the previous year, 520 (were 2766) more animals were used in the projects.
It was caused by the fact, that more establishments were approved and started performing projects. The
number of users increased from 8 in 2013 to 12 in 2015 to 14 in 2017 and to 15 in 2019.
In 2018 were the large increase in the use of fish for “Basic Research”, “Higher education or training for
the acquisition, maintenance or improvement of vocational skills” and “(Regulatory use/Toxicity and..)
Genotoxicity”.
2. Information on significant increase or decrease in use animals in any of the specific areas and
analysis of the reasons thereof.
The most common primary purpose for using animals was regulatory use / toxicity / routine production
(Genotoxicity, Non lethal methods, Pharmaco-dynamics, Blood based products) (~ 45 %), then basic
research (Oncology, Nervous System, Immune System) (~ 22 %), for the purpose “Translational and
applied research” (~ 12,9%), and for the purpose “Higher education or training for the acquisition,
maintenance or improvement of vocational skills” (~ 10,4 %).
The reason for some other changes in use of animals in any of the specific areas is that some approved
establishments did not perform any projects in 2018 and other started or continued new projects in the
end of the previous year.
3. Information on any changes in trends in actual severities and analysis of the reasons thereof.
Most part of the animals (~92 %) were used for the procedures classified as mild [up to and including]
severity, (~6 %) for the procedures classified as moderate and (~ 2 %) for non-recovery severity.
Decrease in use of animals for the procedures classified as moderate and non-recovery during year
2018-2019. More animals were used for the procedures classified as mild because some establishment
did not perform any projects due to reconstruction of premises for some time.
There were no exceeding of the ‘severe’ classification reported in 2018 and previous year because
National Committee is encouraging users do not perform projects or organize project in such a way
where animals could not be used for procedures classified as severe.

155
4. Particular efforts to promote the principle of replacement, reduction and refinement and its
impacts on statistics if any.
Activities undertaken under Article 47 of Directive 2010/63/EU on the protection of animals used for
scientific purposes to contribute to the development, validation and promotion of alternative
approaches and dissemination of information thereon at the national level for the period 2013–2015 are
publically available on the webpage of the European Commission
http://ec.europa.eu/environment/chemicals/lab_animals/3r/pdf/Article_47_LT.pdf
5. Further breakdown on the use of "other" categories if a significant proportion of animal use is
reported under this category.
As regards the category “Other”, other fish (Oncorhynchus mykiss 89,5%, Salmo salar 10,5% from total
fish amount) (~ 41 % from total animals amount) were used during the reporting in 2018.
The clearest trend in 2018 was the large increase in the use of fish for research. The main reason is, that
established started performing projects with specific focus on fish.
6. Details on cases where the 'severe' classification is exceeded, whether pre-authorised or not,
covering the species, numbers, whether prior exemption was authorised, the details of the use and
the reasons why 'severe' classification was exceeded.
No authorisations for projects where the 'severe' classification is exceeded were granted during the
reporting period.
No exemptions under article 6(4)(a) of Directive 2010/63/EU were granted in 2018.
Lithuania: Statistical Data 2018
Section 1: Numbers of animals used for the first time for research, testing, routine
production and educational (including training) purposes
Numbers of animals used for the first time by species Animal species Number of animals Percentage
Mice 1573 47.87%
Rats 311 9.46%
Guinea-Pigs 15 0.46%
Rabbits 31 0.94%
Pigs 4 0.12%
Other fish 1352 41.14%
Total 3286 100.00%
Place of birth of animals other than non-human primates Place of birth Number of animals Percentage
Animals born in the EU at a registered breeder 3286 100%
Total 3286 100.00%

156
Source of non-human primates NHP Source (origin) Number of animals Percentage
No data reported
Generation of non-human primates NHP Generation Number of animals Percentage
No data reported

157
Section 2: Numbers of all uses of animals for research, testing, routine production and
educational (including training) purposes
First use versus reuses Animal species First uses Reuses Total
Mice 1573 1573
Rats 311 311
Guinea-Pigs 15 15
Rabbits 31 31
Pigs 4 4
Other fish 1352 1352
Total 3286 3286
Uses of animals in research, testing, routine production and education (including training) by main
categories of scientific purposes Purpose Category Number of
uses Percentage
Basic Research 1005 30.58%
Translational and applied research 551 16.77%
Regulatory use and Routine production 348 10.59%
Higher education or training for the acquisition, maintenance or improvement of vocational skills
1382 42.06%
Total 3286 100.00%
Basic research related uses Basic research Number of uses Percentage
Oncology 387 38.51%
Nervous System 142 14.13%
Musculoskeletal System 4 0.4%
Immune System 472 46.97%
Total 1005 100.00%
Translational and applied research related uses Translational and applied research Number of uses Percentage
Human Infectious Disorders 199 36.12%
Human Nervous and Mental Disorders 54 9.8%
Human Sensory Organ Disorders (skin, eyes and ears) 13 2.36%
Other Human Disorders 28 5.08%
Non-regulatory toxicology and ecotoxicology 257 46.64%
Total 551 100.00%
Regulatory uses and Routine production Regulatory uses and Routine production Number of uses Percentage
Toxicity and other safety testing including pharmacology 45 12.93%
Routine production 303 87.07%
Total 348 100.00%
Regulatory uses - Quality control (including batch safety and potency testing) Regulatory uses - Quality control (including batch safety and potency testing) Number of uses Percentage
No data reported

158
Regulatory uses - Toxicity and other safety testing including pharmacology Regulatory uses - Toxicity and other safety testing including pharmacology Number of uses Percentage
Acute and sub-acute 30 66.67%
Skin sensitisation 15 33.33%
Total 45 100.00%
Regulatory uses - Toxicity and other safety testing including pharmacology - Acute and sub-acute toxicity
testing methods Regulatory uses - Toxicity and other safety testing including pharmacology - Acute and sub-acute toxicity testing methods
Number of uses
Percentage
Non lethal methods 30 100%
Total 30 100.00%
Regulatory uses - Toxicity and other safety testing including pharmacology - Repeated dose toxicity Regulatory uses - Toxicity and other safety testing including pharmacology - Repeated dose toxicity
Number of uses
Percentage
No data reported
Regulatory uses - Toxicity and other safety testing including pharmacology - Ecotoxicity Regulatory uses - Toxicity and other safety testing including pharmacology - Ecotoxicity Number of uses Percentage
No data reported
Regulatory uses by type of legislation Type of legislation Number of uses Percentage
Legislation on medicinal products for veterinary use and their residues 45 100%
Total 45 100.00%
Regulatory uses by origin of regulatory requirement Origin of legislative requirement Number of uses Percentage
Legislation satisfying EU requirements 45 100%
Total 45 100.00%
Routine production uses by product type Product type Number of uses Percentage
Blood based products 303 100%
Total 303 100.00%
Uses of animals in research, testing, routine production and education (including training) by first use and
reuses Reuse Number of uses Percentage
No 3286 100%
Total 3286 100.00%
Uses of animals in research, testing, routine production and education (including training) by severity Severity Number of uses Percentage
Non-recovery 71 2.16%
Mild [up to and including] 3016 91.78%
Moderate 199 6.06%
Total 3286 100.00%

159
Uses of animals in research, testing, routine production and education (including training) by genetic status
of animals Genetic status Number of uses Percentage
Not genetically altered 3286 100%
Total 3286 100.00%

160
Section 3: Creation and maintenance of genetically altered animal lines
All uses of animals for the creation of new genetically altered animal lines by species, first uses and reuses Animal species First uses Reuses Total
No data reported
Uses of animals for the creation of new genetically altered animal lines by severity Severity Number of uses Percentage
No data reported
Uses of animals for the creation of new genetically altered animal lines by genetic status of the animals Genetic status Number of uses Percentage
No data reported
Uses of animals for the creation of new genetically altered animal lines by type of basic research purposes Basic research Number of uses Percentage
No data reported
Uses of animals for the creation of new genetically altered animal lines by type of translational and applied
research purposes Translational and applied research Number of uses Percentage
No data reported
All uses of animals for the maintenance of established genetically altered animal lines by species Animal species First uses Reuses Total uses
No data reported
Uses of animals for the maintenance of established genetically altered animal lines by severity Severity Number of uses Percentage
No data reported
Uses of animals for the maintenance of established genetically altered animal lines by genetic status of the
animals Genetic status Number of uses Percentage
No data reported

161
Luxembourg
Luxembourg: Narrative 2018
1. General information on any changes in trends observed since the previous reporting period.
In Luxembourg we could observe a decrease in the total number of uses from 25.841 total uses in 2017
to 14 656 in 2018. This trend is due to the completion of a big project with the use of zebrafish.
Considering the distribution among the species, a total number of 5 572 mammals were used in
procedures in 2017 and 7 817 mammals 2019. These figures represent an increase of 40,3% of the total
uses of mammals from 2017 to 2018.
In 2017, 20 173 zebrafishes were used and zebrafishes represented the most used species.
In 2018, mice are the most used species with 7 817 number of uses and the number uses of zebrafishes
drops to 6 728 uses.
Regarding the purpose of the animal uses, no trends ware observed during the last year. The main
category is basic research, followed by translational and applied research, maintenance of colonies and
higher education and training.
2. Information on significant increase or decrease in use animals in any of the specific areas and
analysis of the reasons thereof.
In Luxembourg two main institutions are involved in animal testing. Both modernised and expanded
their facilities during the last years. Additionally, a new facility was authorised in 2017.
Due to the small number of the parties involved in animal experiments (5 facilities in total), the
development of the animal facilities has a strong impact on the total number of animals used. In
particular a big project with zebrafish was completed in 2017, which has an impact on the decrease of
43, 28% of the total number of uses in 2018.
3. Information on any changes in trends in actual severities and analysis of the reasons thereof.
Comparing the actual severities from 2017 to 2018 no trend were observed.
4. Particular efforts to promote the principle of replacement, reduction and refinement and its
impacts on statistics if any.
The particular efforts taken to promote the principle of the Three Rs have been:
- The focus is put on the education of the users. Notably additional minimum requirements have been
adopted for the personal involved in animal experiment,
- A meeting with the animal welfare bodies took place focusing on the 3Rs,

162
- Refinement of the housing and care of the animals is ensured, inter alia, by modernisation of the
animal facilities and by a new animal facility. Another point is the environment enrichment of the cages
or aquariums, in particular, providing animals with appropriate housing that allows the expression of
species-specific behaviours, such as nesting opportunities for mice.
- During the inspection attention is put on points such as that the staff follows the project protocol and
in particularly that the humane endpoints are respected and the score sheets are reviewed. When
procedures are conducted which involve pain or invasive procedures, it is verified that these procedures
are carried out under appropriate general or local anaesthesia and that appropriate analgesia or another
method is used to ensure that pain, suffering and distress are kept to a minimum.
- Additional care is taken during the project evaluation , inter alia, a review of the referenced literatures,
a check of the most up to date references have been considered, a check whether there are alternative
methods in place and the statistical calculation is reviewed. Regarding the alternative methods, it is
checked if all measures are taken to reduce pain, suffering or lasting harms, if the humane endpoints are
appropriate, if the housing, health checks of the animals are appropriate etc.
-Regarding the Reduction the national research institutes are collaborating with other research groups
and are sharing data and resources (animals, tissue, organs and equipment) between research groups.
Furthermore one institute owns an IRM, which enables longitudinal studies in the same animals and
which is put at the disposal of the other institutes
5. Further breakdown on the use of "other" categories if a significant proportion of animal use is
reported under this category.
The category “other” was not reported.
6. Details on cases where the 'severe' classification is exceeded, whether pre-authorised or not,
covering the species, numbers, whether prior exemption was authorised, the details of the use and
the reasons why 'severe' classification was exceeded.
In 2018 there was no case where the severe-classification has been exceeded.
Luxembourg: Statistical Data 2018
Section 1: Numbers of animals used for the first time for research, testing, routine
production and educational (including training) purposes
Numbers of animals used for the first time by species Animal species Number of animals Percentage
Mice 7019 51.04%
Rats 111 0.81%
Zebra fish 6621 48.15%
Total 13751 100.00%

163
Place of birth of animals other than non-human primates Place of birth Number of animals Percentage
Animals born in the EU at a registered breeder 13751 100%
Total 13751 100.00%
Source of non-human primates NHP Source (origin) Number of animals Percentage
No data reported
Generation of non-human primates NHP Generation Number of animals Percentage
No data reported

164
Section 2: Numbers of all uses of animals for research, testing, routine production and
educational (including training) purposes
First use versus reuses Animal species First uses Reuses Total
Mice 7019 650 7669
Rats 111 111
Zebra fish 6621 6621
Total 13751 650 14401
Uses of animals in research, testing, routine production and education (including training) by main
categories of scientific purposes Purpose Category Number of
uses Percentage
Basic Research 13294 92.31%
Translational and applied research 936 6.5%
Higher education or training for the acquisition, maintenance or improvement of vocational skills
171 1.19%
Total 14401 100.00%
Basic research related uses Basic research Number of uses Percentage
Oncology 2691 20.24%
Nervous System 7584 57.05%
Immune System 3019 22.71%
Total 13294 100.00%
Translational and applied research related uses Translational and applied research Number of uses Percentage
Human Cancer 867 92.63%
Human Immune Disorders 69 7.37%
Total 936 100.00%
Regulatory uses and Routine production Regulatory uses and Routine production Number of uses Percentage
No data reported
Regulatory uses - Quality control (including batch safety and potency testing) Regulatory uses - Quality control (including batch safety and potency testing) Number of uses Percentage
No data reported
Regulatory uses - Toxicity and other safety testing including pharmacology Regulatory uses - Toxicity and other safety testing including pharmacology Number of uses Percentage
No data reported
Regulatory uses - Toxicity and other safety testing including pharmacology - Acute and sub-acute toxicity
testing methods Regulatory uses - Toxicity and other safety testing including pharmacology - Acute and sub-acute toxicity testing methods
Number of uses
Percentage
No data reported

165
Regulatory uses - Toxicity and other safety testing including pharmacology - Repeated dose toxicity Regulatory uses - Toxicity and other safety testing including pharmacology - Repeated dose toxicity
Number of uses
Percentage
No data reported
Regulatory uses - Toxicity and other safety testing including pharmacology - Ecotoxicity Regulatory uses - Toxicity and other safety testing including pharmacology - Ecotoxicity Number of uses Percentage
No data reported
Regulatory uses by type of legislation Type of legislation Number of uses Percentage
No data reported
Regulatory uses by origin of regulatory requirement Origin of legislative requirement Number of uses Percentage
No data reported
Routine production uses by product type Product type Number of uses Percentage
No data reported
Uses of animals in research, testing, routine production and education (including training) by first use and
reuses Reuse Number of uses Percentage
No 13751 95.49%
Yes 650 4.51%
Total 14401 100.00%
Uses of animals in research, testing, routine production and education (including training) by severity Severity Number of uses Percentage
Non-recovery 594 4.12%
Mild [up to and including] 10447 72.54%
Moderate 3153 21.89%
Severe 207 1.44%
Total 14401 100.00%
Uses of animals in research, testing, routine production and education (including training) by genetic status
of animals Genetic status Number of uses Percentage
Not genetically altered 8048 55.89%
Genetically altered without a harmful phenotype 5400 37.5%
Genetically altered with a harmful phenotype 953 6.62%
Total 14401 100.00%

166
Section 3: Creation and maintenance of genetically altered animal lines
All uses of animals for the creation of new genetically altered animal lines by species, first uses and reuses Animal species First uses Reuses Total
Mice 148 148
Total 148 148
Uses of animals for the creation of new genetically altered animal lines by severity Severity Number of uses Percentage
Mild [up to and including] 39 26.35%
Moderate 109 73.65%
Total 148 100.00%
Uses of animals for the creation of new genetically altered animal lines by genetic status of the animals Genetic status Number of uses Percentage
Genetically altered with a harmful phenotype 148 100%
Total 148 100.00%
Uses of animals for the creation of new genetically altered animal lines by type of basic research purposes Basic research Number of uses Percentage
Oncology 148 100%
Total 148 100.00%
Uses of animals for the creation of new genetically altered animal lines by type of translational and applied
research purposes Translational and applied research Number of uses Percentage
No data reported
All uses of animals for the maintenance of established genetically altered animal lines by species Animal species First uses Reuses Total uses
Zebra fish 107 107
Total 107 107
Uses of animals for the maintenance of established genetically altered animal lines by severity Severity Number of uses Percentage
Mild [up to and including] 107 100%
Total 107 100.00%
Uses of animals for the maintenance of established genetically altered animal lines by genetic status of the
animals Genetic status Number of uses Percentage
Genetically altered without a harmful phenotype 107 100%
Total 107 100.00%

167
Malta
Malta: Narrative 2018
1. General information on any changes in trends observed since the previous reporting period.
A scientific program involving live fish has been approved in 2017. Another scientific research has
been approved in the same year and will have a duration period of 3 years.
2. Information on significant increase or decrease in use animals in any of the specific areas and
analysis of the reasons thereof.
In view of the above fact, it was a significant increase of the use of live animals for scientific
purposes. The animals involved for the second approved research were 250,000 fish and it was
chosen as the minimum requirement for accurate statistical testing.
3. Information on any changes in trends in actual severities and analysis of the reasons thereof.
The severity of the research program in the second study has increased due to the nature of the
proposal (study on toxicity in fish).
4. Particular efforts to promote the principle of replacement, reduction and refinement and its
impacts on statistics if any.
The two scientific project manager actually ongoing declared that the three principle are being
observed.
5. Further breakdown on the use of "other" categories if a significant proportion of animal use is
reported under this category.
N/A
6. Details on cases where the 'severe' classification is exceeded, whether pre-authorised or not,
covering the species, numbers, whether prior exemption was authorised, the details of the use
and the reasons why 'severe' classification was exceeded.
N/A. Both the studies have a severity classified as mild pain.
Malta: Statistical Data 2018
Section 1: Numbers of animals used for the first time for research, testing, routine
production and educational (including training) purposes
Numbers of animals used for the first time by species Animal species Number of animals Percentage
Other fish 119 100%
Total 119 100.00%

168
Place of birth of animals other than non-human primates Place of birth Number of animals Percentage
Animals born in the EU at a registered breeder 119 100%
Total 119 100.00%
Source of non-human primates NHP Source (origin) Number of animals Percentage
No data reported
Generation of non-human primates NHP Generation Number of animals Percentage
No data reported

169
Section 2: Numbers of all uses of animals for research, testing, routine production and
educational (including training) purposes
First use versus reuses Animal species First uses Reuses Total
Other fish 119 119
Total 119 119
Uses of animals in research, testing, routine production and education (including training) by main
categories of scientific purposes Purpose Category Number of uses Percentage
Translational and applied research 119 100%
Total 119 100.00%
Basic research related uses Basic research Number of uses Percentage
No data reported
Translational and applied research related uses Translational and applied research Number of uses Percentage
Animal Diseases and Disorders 119 100%
Total 119 100.00%
Regulatory uses and Routine production Regulatory uses and Routine production Number of uses Percentage
No data reported
Regulatory uses - Quality control (including batch safety and potency testing) Regulatory uses - Quality control (including batch safety and potency testing) Number of uses Percentage
No data reported
Regulatory uses - Toxicity and other safety testing including pharmacology Regulatory uses - Toxicity and other safety testing including pharmacology Number of uses Percentage
No data reported
Regulatory uses - Toxicity and other safety testing including pharmacology - Acute and sub-acute toxicity
testing methods Regulatory uses - Toxicity and other safety testing including pharmacology - Acute and sub-acute toxicity testing methods
Number of uses
Percentage
No data reported
Regulatory uses - Toxicity and other safety testing including pharmacology - Repeated dose toxicity Regulatory uses - Toxicity and other safety testing including pharmacology - Repeated dose toxicity
Number of uses
Percentage
No data reported
Regulatory uses - Toxicity and other safety testing including pharmacology - Ecotoxicity Regulatory uses - Toxicity and other safety testing including pharmacology - Ecotoxicity Number of uses Percentage
No data reported

170
Regulatory uses by type of legislation Type of legislation Number of uses Percentage
No data reported
Regulatory uses by origin of regulatory requirement Origin of legislative requirement Number of uses Percentage
No data reported
Routine production uses by product type Product type Number of uses Percentage
No data reported
Uses of animals in research, testing, routine production and education (including training) by first use and
reuses Reuse Number of uses Percentage
No 119 100%
Total 119 100.00%
Uses of animals in research, testing, routine production and education (including training) by severity Severity Number of uses Percentage
Mild [up to and including] 119 100%
Total 119 100.00%
Uses of animals in research, testing, routine production and education (including training) by genetic status
of animals Genetic status Number of uses Percentage
Not genetically altered 119 100%
Total 119 100.00%

171
Section 3: Creation and maintenance of genetically altered animal lines
All uses of animals for the creation of new genetically altered animal lines by species, first uses and reuses Animal species First uses Reuses Total
No data reported
Uses of animals for the creation of new genetically altered animal lines by severity Severity Number of uses Percentage
No data reported
Uses of animals for the creation of new genetically altered animal lines by genetic status of the animals Genetic status Number of uses Percentage
No data reported
Uses of animals for the creation of new genetically altered animal lines by type of basic research purposes Basic research Number of uses Percentage
No data reported
Uses of animals for the creation of new genetically altered animal lines by type of translational and applied
research purposes Translational and applied research Number of uses Percentage
No data reported
All uses of animals for the maintenance of established genetically altered animal lines by species Animal species First uses Reuses Total uses
No data reported
Uses of animals for the maintenance of established genetically altered animal lines by severity Severity Number of uses Percentage
No data reported
Uses of animals for the maintenance of established genetically altered animal lines by genetic status of the
animals Genetic status Number of uses Percentage
No data reported

172
Netherlands
Netherlands: Narrative 2018
1. General information on any changes in trends observed since the previous reporting period.
In 2018, the Dutch establishments reported 401,895 animals used in procedures. This is 75,655 (15.8%)
less than in 2017. Especially the number of mice (-50,469), and zebrafish (-32,089) and other birds (-
7,598) was reduced. The number of other fish (+9,399), guinea pigs (+5,627) and rabbits (+4,024) and
dogs (+107) was increased.
In 2018 animals were 10,522 times reused, which is 616 animals less than in 2017 (11,138). Reuse
mainly takes place for the purpose of fundamental research and education and training.
2. Information on significant increase or decrease in use animals in any of the specific areas and
analysis of the reasons thereof.
The total number of animal uses in 2018 is within the normal range of fluctuation of previous years. The
increase in the number of rabbits is attributed to the increased use of genetically modified rabbits for
the treatment of genetic disorders in humans. The increase in guinea pigs is related to the relocation of
activities of a commercial breeder to the Netherlands. The increase in the number of dogs is caused by
an increase of trials for the development of drugs against various types of cancer, neurological-,
cardiovascular- and immunological diseases.
In 2018, 71,710 procedures were reported with the use of genetically altered animals. This is a reduction
of 61,655 animals compared to 2017 (133,365). Most animal testing on genetically modified animals
have carried out on mice (79.9%) and zebrafish (17.3%).
3. Information on any changes in trends in actual severities and analysis of the reasons thereof.
The actual severities reported in 2018 (mild 61.9%, moderate 25.7%, severe 1.5%, and non-recovery:
10.9%) are generally in line with the actual severities reported in 2017.
4. Particular efforts to promote the principle of replacement, reduction and refinement and its
impacts on statistics if any.
In the Netherlands, continuous efforts have been taken to promote the principles of the 3R’s. However,
it is not possible to trace back these efforts to specific items in the statistics.
5. Further breakdown on the use of "other" categories if a significant proportion of animal use is
reported under this category.
Other carnivores: 74 Mustela lutreola (European (Russian) mink), 5 Martes martes (European pine
marten), 5 Meles meles (European badger).

173
Other birds: 4091 Parus major (great tit), 1372 Limosa limosa (black tailed godwit), 1261 Ficedula
hypoleuca (European pied flycatcher), 1041 Cyanistes caeruleus (Eurasian blue tit).
Other fish: 11,723 Anguilla anguilla (European eel), 2195 Pimephales promelas (fathead minnow), 1890
Gasterosteus aculeatus (three horned stickleback), 1540 Oreochromis niloticus (tilapia), 1417 Cyprinus
carpio, 1339 Rutilus rutilus (common roach).
6. Details on cases where the 'severe' classification is exceeded, whether pre-authorised or not,
covering the species, numbers, whether prior exemption was authorised, the details of the use and
the reasons why 'severe' classification was exceeded.
In 2018 exceedance of the severity classification ‘severe’ has not been reported and no exemption was
authorised.
Netherlands: Statistical Data 2018
Section 1: Numbers of animals used for the first time for research, testing, routine
production and educational (including training) purposes
Numbers of animals used for the first time by species Animal species Number of animals Percentage
Mice 142687 37.34%
Rats 90275 23.62%
Guinea-Pigs 11372 2.98%
Hamsters (Syrian) 911 0.24%
Mongolian gerbil 105 0.03%
Other rodents 668 0.17%
Rabbits 13622 3.56%
Cats 69 0.02%
Dogs 542 0.14%
Ferrets 437 0.11%
Other carnivores 84 0.02%
Horses, donkeys and cross-breeds 84 0.02%
Pigs 10502 2.75%
Goats 114 0.03%
Sheep 543 0.14%
Cattle 1634 0.43%
Marmoset and tamarins 42 0.01%
Rhesus monkey 109 0.03%
Other mammals 225 0.06%
Domestic fowl 49131 12.86%
Other birds 13514 3.54%
Reptiles 125 0.03%
Xenopus 273 0.07%
Zebra fish 19881 5.2%
Other fish 25206 6.6%
Total 382155 100.00%

174
Place of birth of animals other than non-human primates Place of birth Number of animals Percentage
Animals born in the EU at a registered breeder 284949 74.59%
Animals born in the EU but not at a registered breeder 88610 23.2%
Animals born in rest of world 8445 2.21%
Total 382004 100.00%
Source of non-human primates NHP Source (origin) Number of animals Percentage
Animals born at a registered breeder within EU 151 100%
Total 151 100.00%
Generation of non-human primates NHP Generation Number of animals Percentage
Self-sustaining colony 151 100%
Total 151 100.00%

175
Section 2: Numbers of all uses of animals for research, testing, routine production and
educational (including training) purposes
First use versus reuses Animal species First uses Reuses Total
Mice 142687 3671 146358
Rats 90275 1304 91579
Guinea-Pigs 11372 71 11443
Hamsters (Syrian) 911 911
Mongolian gerbil 105 105
Other rodents 668 668
Rabbits 13622 166 13788
Cats 69 51 120
Dogs 542 474 1016
Ferrets 437 38 475
Other carnivores 84 84
Horses, donkeys and cross-breeds 84 62 146
Pigs 10502 92 10594
Goats 114 11 125
Sheep 543 100 643
Cattle 1634 1973 3607
Marmoset and tamarins 42 3 45
Rhesus monkey 109 51 160
Other mammals 225 225
Domestic fowl 49131 1875 51006
Other birds 13514 370 13884
Reptiles 125 125
Xenopus 273 128 401
Zebra fish 19881 19881
Other fish 25206 80 25286
Total 382155 10520 392675
Uses of animals in research, testing, routine production and education (including training) by main
categories of scientific purposes Purpose Category Number of
uses Percentage
Basic Research 144093 36.7%
Translational and applied research 112229 28.58%
Regulatory use and Routine production 118310 30.13%
Protection of the natural environment in the interests of the health or welfare of human beings or animals
1678 0.43%
Preservation of species 1548 0.39%
Higher education or training for the acquisition, maintenance or improvement of vocational skills
14801 3.77%
Forensic enquiries 16 0%
Total 392675 100.00%
Basic research related uses Basic research Number of uses Percentage
Oncology 30247 20.99%
Cardiovascular Blood and Lymphatic System 3203 2.22%
Nervous System 16269 11.29%
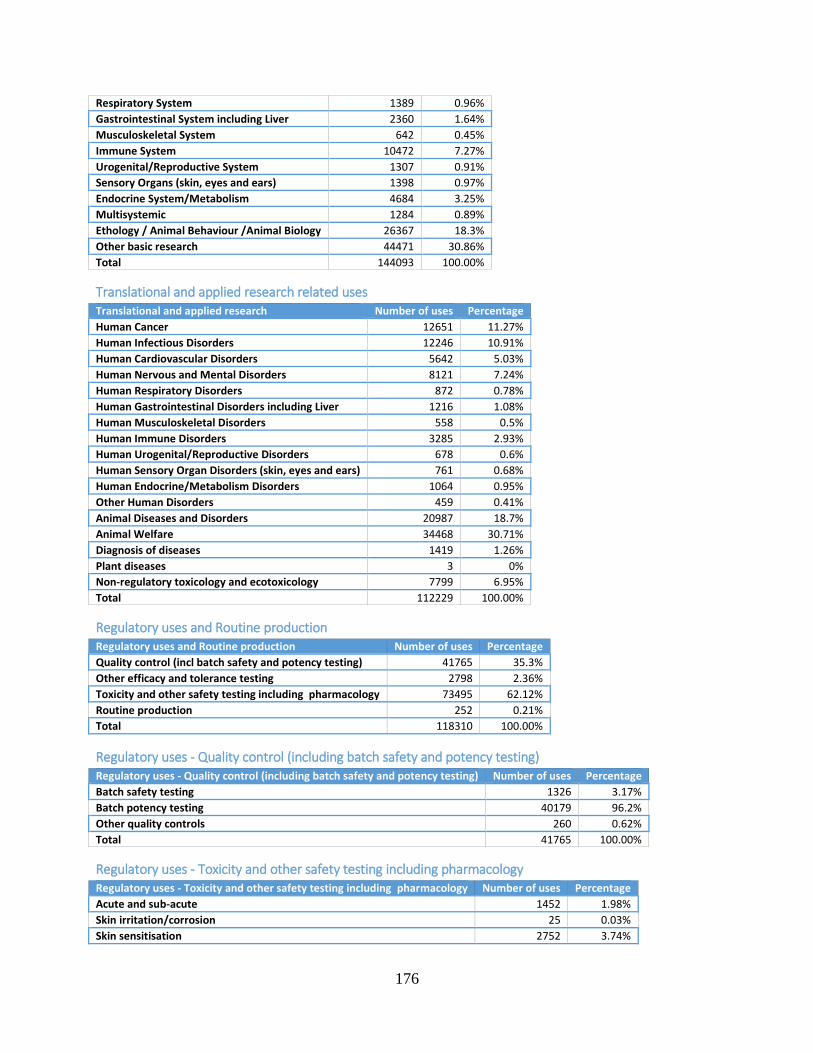
176
Respiratory System 1389 0.96%
Gastrointestinal System including Liver 2360 1.64%
Musculoskeletal System 642 0.45%
Immune System 10472 7.27%
Urogenital/Reproductive System 1307 0.91%
Sensory Organs (skin, eyes and ears) 1398 0.97%
Endocrine System/Metabolism 4684 3.25%
Multisystemic 1284 0.89%
Ethology / Animal Behaviour /Animal Biology 26367 18.3%
Other basic research 44471 30.86%
Total 144093 100.00%
Translational and applied research related uses Translational and applied research Number of uses Percentage
Human Cancer 12651 11.27%
Human Infectious Disorders 12246 10.91%
Human Cardiovascular Disorders 5642 5.03%
Human Nervous and Mental Disorders 8121 7.24%
Human Respiratory Disorders 872 0.78%
Human Gastrointestinal Disorders including Liver 1216 1.08%
Human Musculoskeletal Disorders 558 0.5%
Human Immune Disorders 3285 2.93%
Human Urogenital/Reproductive Disorders 678 0.6%
Human Sensory Organ Disorders (skin, eyes and ears) 761 0.68%
Human Endocrine/Metabolism Disorders 1064 0.95%
Other Human Disorders 459 0.41%
Animal Diseases and Disorders 20987 18.7%
Animal Welfare 34468 30.71%
Diagnosis of diseases 1419 1.26%
Plant diseases 3 0%
Non-regulatory toxicology and ecotoxicology 7799 6.95%
Total 112229 100.00%
Regulatory uses and Routine production Regulatory uses and Routine production Number of uses Percentage
Quality control (incl batch safety and potency testing) 41765 35.3%
Other efficacy and tolerance testing 2798 2.36%
Toxicity and other safety testing including pharmacology 73495 62.12%
Routine production 252 0.21%
Total 118310 100.00%
Regulatory uses - Quality control (including batch safety and potency testing) Regulatory uses - Quality control (including batch safety and potency testing) Number of uses Percentage
Batch safety testing 1326 3.17%
Batch potency testing 40179 96.2%
Other quality controls 260 0.62%
Total 41765 100.00%
Regulatory uses - Toxicity and other safety testing including pharmacology Regulatory uses - Toxicity and other safety testing including pharmacology Number of uses Percentage
Acute and sub-acute 1452 1.98%
Skin irritation/corrosion 25 0.03%
Skin sensitisation 2752 3.74%

177
Eye irritation/corrosion 34 0.05%
Repeated dose toxicity 8304 11.3%
Carcinogenicity 508 0.69%
Genotoxicity 32 0.04%
Reproductive toxicity 28678 39.02%
Developmental toxicity 24923 33.91%
Kinetics 858 1.17%
Pharmaco-dynamics (incl safety pharmacology) 2 0%
Phototoxicity 108 0.15%
Ecotoxicity 3680 5.01%
Safety testing in food and feed area 1120 1.52%
Target animal safety 1019 1.39%
Total 73495 100.00%
Regulatory uses - Toxicity and other safety testing including pharmacology - Acute and sub-acute toxicity
testing methods Regulatory uses - Toxicity and other safety testing including pharmacology - Acute and sub-acute toxicity testing methods
Number of uses
Percentage
Non lethal methods 1452 100%
Total 1452 100.00%
Regulatory uses - Toxicity and other safety testing including pharmacology - Repeated dose toxicity Regulatory uses - Toxicity and other safety testing including pharmacology - Repeated dose toxicity
Number of uses
Percentage
up to 28 days 3936 47.4%
29 - 90 days 3605 43.41%
> 90 days 763 9.19%
Total 8304 100.00%
Regulatory uses - Toxicity and other safety testing including pharmacology - Ecotoxicity Regulatory uses - Toxicity and other safety testing including pharmacology - Ecotoxicity Number of uses Percentage
Acute toxicity 1283 34.86%
Chronic toxicity 1935 52.58%
Reproductive ecotoxicity 240 6.52%
Bioaccumulation 222 6.03%
Total 3680 100.00%
Regulatory uses by type of legislation Type of legislation Number of
uses Percentage
Legislation on medicinal products for human use 27385 23.2%
Legislation on medicinal products for veterinary use and their residues 26549 22.49%
Medical devices legislation 17 0.01%
Industrial chemicals legislation 60022 50.84%
Plant protection product legislation 1674 1.42%
Biocides legislation 126 0.11%
Food legislation including food contact material 1165 0.99%
Feed legislation including legislation for the safety of target animals, workers and environment
1120 0.95%
Total 118058 100.00%
Regulatory uses by origin of regulatory requirement Origin of legislative requirement Number of uses Percentage

178
Legislation satisfying EU requirements 115945 98.21%
Legislation satisfying Non-EU requirements only 2113 1.79%
Total 118058 100.00%
Routine production uses by product type Product type Number of uses Percentage
Other product types 252 100%
Total 252 100.00%
Uses of animals in research, testing, routine production and education (including training) by first use and
reuses Reuse Number of uses Percentage
No 382155 97.32%
Yes 10520 2.68%
Total 392675 100.00%
Uses of animals in research, testing, routine production and education (including training) by severity Severity Number of uses Percentage
Non-recovery 43764 11.15%
Mild [up to and including] 240879 61.34%
Moderate 102214 26.03%
Severe 5818 1.48%
Total 392675 100.00%
Uses of animals in research, testing, routine production and education (including training) by genetic status
of animals Genetic status Number of uses Percentage
Not genetically altered 324356 82.6%
Genetically altered without a harmful phenotype 65538 16.69%
Genetically altered with a harmful phenotype 2781 0.71%
Total 392675 100.00%

179
Section 3: Creation and maintenance of genetically altered animal lines
All uses of animals for the creation of new genetically altered animal lines by species, first uses and reuses Animal species First uses Reuses Total
Mice 7978 2 7980
Total 7978 2 7980
Uses of animals for the creation of new genetically altered animal lines by severity Severity Number of uses Percentage
Mild [up to and including] 7078 88.7%
Moderate 880 11.03%
Severe 22 0.28%
Total 7980 100.00%
Uses of animals for the creation of new genetically altered animal lines by genetic status of the animals Genetic status Number of uses Percentage
Not genetically altered 5829 73.05%
Genetically altered without a harmful phenotype 2151 26.95%
Total 7980 100.00%
Uses of animals for the creation of new genetically altered animal lines by type of basic research purposes Basic research Number of uses Percentage
Oncology 4005 51.43%
Cardiovascular Blood and Lymphatic System 824 10.58%
Nervous System 404 5.19%
Respiratory System 65 0.83%
Gastrointestinal System including Liver 584 7.5%
Musculoskeletal System 12 0.15%
Immune System 806 10.35%
Urogenital/Reproductive System 73 0.94%
Multisystemic 28 0.36%
Other basic research 987 12.67%
Total 7788 100.00%
Uses of animals for the creation of new genetically altered animal lines by type of translational and applied
research purposes Translational and applied research Number of uses Percentage
Human Cancer 104 54.17%
Human Nervous and Mental Disorders 88 45.83%
Total 192 100.00%
All uses of animals for the maintenance of established genetically altered animal lines by species Animal species First uses Reuses Total uses
Mice 1186 1186
Zebra fish 54 54
Total 1240 1240
Uses of animals for the maintenance of established genetically altered animal lines by severity Severity Number of uses Percentage
Mild [up to and including] 988 79.68%
Moderate 240 19.35%
Severe 12 0.97%

180
Total 1240 100.00%
Uses of animals for the maintenance of established genetically altered animal lines by genetic status of the
animals Genetic status Number of uses Percentage
Genetically altered with a harmful phenotype 1240 100%
Total 1240 100.00%

181
Poland
Poland: Narrative 2018
1. General information on any changes in trends observed since the previous reporting period.
In 2018, the slight downward trend in the number of animals used continued in Poland. Thanks to the
training provided, there is a noticeably better understanding of the definition of the procedure and of
reporting rules, resulting in more accurate and measurable reports. There is also a clear shift away from
teaching with live animals.
2. Information on significant increase or decrease in use animals in any of the specific areas and
analysis of the reasons thereof.
The fluctuation observed in the number of animals used of certain species seems to be a natural
consequence of the end of one type of experiment and the start of others, connected to the receipt of
research grants linked to an increase in the popularity of a given field of research or, for example, to
orders from external parties. This is also likely to be the reason why the number of farm animals being
used decreased significantly in 2018.
In experiments, there was a noticeable trend away from various species of fish to Danio rerio. This is
clear from the proportion of Danio rerio in the total number of fish used in research in Poland, which
increased from 15% in 2017 to 53.88% in 2018.
There is also a clear shift away from teaching with live animals. For most species, the number of animals
used in teaching has decreased by between 50% and 98.5% since 2015 and there are individual species
where it has stopped altogether.
3. Information on any changes in trends in actual severities and analysis of the reasons thereof.
In 2018 there was a noticeable upward trend in severe and moderate experiments. However, these
changes are not significant; in rodents, for instance, severe procedures have increased from 32.32% to
36.50% to 39.92% over the last three years.
4. Particular efforts to promote the principle of replacement, reduction and refinement and its
impacts on statistics if any.
The statutory tasks of the National Ethics Committee on Animal Experiments (NEC) are to pursue the
three Rs and promote alternative research. The NEC supports training courses for persons planning or
carrying out experiments in programmes that incorporate this topic. This information is also provided to
local ethics committees on animal experiments (during annual training courses, via the NEC’s website
and through direct contact). Unit welfare teams also use the NEC’s website, advice and
recommendations. When issuing authorisation for experiments to be carried out, Ethics Committees are
required to take into account the existence of alternative methods and the application of the three Rs in
specific experiments. To this end, the application template for authorisation contains a specific field in

182
which the user must enter the method of applying the three Rs in a given experiment. In 2018
applications also included an additional obligation, as a reminder that procedures must not be carried
out, or must be terminated immediately, if alternative methods to the procedure set out in the
application are approved in the European Union during the period in which the Commission’s
authorisation is valid. In 2017 the NEC also took the initiative to set up a cooperation network between
units and bodies involved in the application of alternative methods.
Furthermore, welfare teams monitor how the three Rs principle is applied. Their activities are monitored
by the NEC, which prepares a comprehensive analysis of their activity reports each year.
5. Further breakdown on the use of "other" categories if a significant proportion of animal use is
reported under this category.
In Poland a fairly large number of nutritional experiments are carried out in which the activities
performed fall within the definition of a procedure. However, in the reporting table there is no separate
category for nutritional tests in the list of objectives, hence these are placed in the ‘other’ group. A
similar situation arises in the case of procedures involving the transfer of embryos.
There is also one user which, under routine manufacturing procedures required by law, employs tests
not included in the list provided in the report (API). This user tests herbal medicinal products and its
activities in Poland account for 88.1% of tests under the category ‘legally required/routine production’.
In 2018, the animal species included in the ‘other’ category, accounting for over 10% of a given group,
were:
‘Other’ species of carnivore (other Carnivora): Mustela nivalis, Mustella lutreola, Vulpes and
Nyctereutes procyonoides. These species account for 93.51% of all species of carnivore and are
used in basic research related to species biology and behaviour, and in translational and applied
research in the field of animal diseases and disorders.
‘Other’ species of mammal (other Mammalia): Capreolus, Cervus elaphus, Eptesicus serotinus,
Monodelphis domestica, Muntiacus reevesi, Myotis alcathoe, Myotis bechsteinii, Myotis brandtii,
Myotis, Myotis mystacinus, Neomys anomalus, Neomys fodiens, Nyctalus leisleri, Nyctalus
leisleri, Sorex araneus, Talpa europaea and Talpa europaea. These species account for 23.33% of
all species of mammal and are used in basic research related to species biology and behaviour
and the protection of the natural environment in the interests of the health or welfare of human
beings or animals.
‘Other’ species of bird (other Aves): Acanthis cabaret, Acanthis flammea, Acrocephalus
paludicola, Actitis hypoleucos, Anas platyrhynchos, Anser domesticus, Calidris alba, Calidris
canutus, Calidris falcinellus, Calidris ferruginea, Calidris pugnax, Caprimulgus europaeus,
Charadrius dubius, Charadrius hiaticula, Chlidonias hybrida, Chroicocephalus ridibundus, Ciconia,
Columba livia, Coturnix, Coturnix japonica, Cyanistes caeruleus, Cygnus olor, Dromaiinae,
Emberiza citrinella, Emberiza schoeniclus, Erithacus rubecula, Ficedula hypoleuca, Fringilla

183
coelebs, Fringilla montifringilla, Fulica atra, Gallinago, Garrulus glandarius, Haliaeetus albicilla,
Hirundo rustica, Laniuscollurio, Larus argentatus, Meleagris gallopavo, Milvus migrans, Milvus,
Motacilla alba, Motacilla flava, Parus major, Passer domesticus, Pyrrhula, Spinus, Sterna
hirundo, Sylvia atricapilla, Taeniopygia guttata, Tetrao urogallus, Tringa glareola, Tringa
ochropus, Tringa totanus and Turdus merula, These species account for 75.01% of all species of
bird used in research. They are mainly used in basic research related to the cardiovascular blood
and lymphatic system, the gastrointestinal system including the liver, the immune system, the
urogenital and reproductive system, to multisystemic research, ethology, animal behaviour or
animal biology, and to the differentiation of blood parasites. In addition, they are used in
translational research on human immune disorders, animal diseases and disorders, animal
welfare, and the diagnosis of diseases. They are also used in manufacturing, including of
medicinal products, API and herbal starting material, and in regulatory testing (quality control,
including batch safety and potency testing, batch efficacy testing, single-dose acute toxicity
testing, LD50 or LC50 testing and batch animal immunology product testing). In addition, they
are used in research concerning the protection of the natural environment in the interests of
the health or welfare of human beings or animals, and research into species behaviour.
‘Other’ species of fish (other Pisces): Acipenser gueldenstadtii, Carassius auratus, Carassius,
Cobitis elongatoides, Cobitis taenia, hybrids Cobitis, Coregonus lavaretus, Cyprinus carpio, Gadus
morhua, Neogobius melanostomus, Oncorhynchus mykiss, Perca fluviatilis, Poecilia reticulata,
Sander lucioperca and Scardinius erythrophthalmus. These species account for 46.11% of all fish
species used in research. They are mainly used in basic research related to the cardiovascular
blood and lymphatic system, immune system, urogenital and reproductive system, ethology and
animal behaviour and biology. They are also used in translational research and in research on
animal welfare. Six individuals of the species Carassius auratus were also used for higher
education or training for the acquisition or improvement of vocational skills.
‘Other’ species of amphibian (other Amphibia): Rana arvalis. These species account for 96.49%
of all amphibian species used in research. They are mainly used in basic research related to
ethology and animal behaviour and or animal biology.
6. Details on cases where the 'severe' classification is exceeded, whether pre-authorised or not,
covering the species, numbers, whether prior exemption was authorised, the details of the use and
the reasons why 'severe' classification was exceeded.
No such cases were found.

184
Poland: Statistical Data 2018
Section 1: Numbers of animals used for the first time for research, testing, routine
production and educational (including training) purposes
Numbers of animals used for the first time by species Animal species Number of animals Percentage
Mice 81028 53.03%
Rats 27787 18.19%
Guinea-Pigs 5596 3.66%
Hamsters (Syrian) 25 0.02%
Mongolian gerbil 122 0.08%
Other rodents 5928 3.88%
Rabbits 812 0.53%
Cats 7 0%
Dogs 5 0%
Other carnivores 216 0.14%
Horses, donkeys and cross-breeds 18 0.01%
Pigs 601 0.39%
Goats 52 0.03%
Sheep 447 0.29%
Cattle 198 0.13%
Other mammals 388 0.25%
Domestic fowl 2352 1.54%
Other birds 7818 5.12%
Reptiles 12 0.01%
Other amphibians 330 0.22%
Zebra fish 10262 6.72%
Other fish 8781 5.75%
Total 152785 100.00%
Place of birth of animals other than non-human primates Place of birth Number of animals Percentage
Animals born in the EU at a registered breeder 135297 88.55%
Animals born in the EU but not at a registered breeder 16890 11.05%
Animals born in rest of Europe 56 0.04%
Animals born in rest of world 542 0.35%
Total 152785 100.00%
Source of non-human primates NHP Source (origin) Number of animals Percentage
No data reported
Generation of non-human primates NHP Generation Number of animals Percentage
No data reported

185
Section 2: Numbers of all uses of animals for research, testing, routine production and
educational (including training) purposes
First use versus reuses Animal species First uses Reuses Total
Mice 81028 67 81095
Rats 27787 39 27826
Guinea-Pigs 5596 5596
Hamsters (Syrian) 25 25
Mongolian gerbil 122 122
Other rodents 5928 237 6165
Rabbits 812 128 940
Cats 7 7
Dogs 5 3 8
Other carnivores 216 216
Horses, donkeys and cross-breeds 18 29 47
Pigs 601 2 603
Goats 52 7 59
Sheep 447 147 594
Cattle 198 4 202
Other mammals 388 388
Domestic fowl 2352 310 2662
Other birds 7818 173 7991
Reptiles 12 12
Other amphibians 330 330
Zebra fish 10262 10262
Other fish 8781 8781
Total 152785 1146 153931
Uses of animals in research, testing, routine production and education (including training) by main
categories of scientific purposes Purpose Category Number of
uses Percentage
Basic Research 113559 73.77%
Translational and applied research 13695 8.9%
Regulatory use and Routine production 24666 16.02%
Protection of the natural environment in the interests of the health or welfare of human beings or animals
215 0.14%
Preservation of species 679 0.44%
Higher education or training for the acquisition, maintenance or improvement of vocational skills
1117 0.73%
Total 153931 100.00%
Basic research related uses Basic research Number of uses Percentage
Oncology 6882 6.06%
Cardiovascular Blood and Lymphatic System 7172 6.32%
Nervous System 58550 51.56%
Respiratory System 377 0.33%
Gastrointestinal System including Liver 4183 3.68%
Musculoskeletal System 754 0.66%
Immune System 5961 5.25%

186
Urogenital/Reproductive System 2592 2.28%
Sensory Organs (skin, eyes and ears) 731 0.64%
Endocrine System/Metabolism 3481 3.07%
Multisystemic 9577 8.43%
Ethology / Animal Behaviour /Animal Biology 12132 10.68%
Other basic research 1167 1.03%
Total 113559 100.00%
Translational and applied research related uses Translational and applied research Number of uses Percentage
Human Cancer 3732 27.25%
Human Infectious Disorders 100 0.73%
Human Cardiovascular Disorders 534 3.9%
Human Nervous and Mental Disorders 166 1.21%
Human Respiratory Disorders 1065 7.78%
Human Gastrointestinal Disorders including Liver 324 2.37%
Human Musculoskeletal Disorders 11 0.08%
Human Immune Disorders 70 0.51%
Human Urogenital/Reproductive Disorders 12 0.09%
Human Sensory Organ Disorders (skin, eyes and ears) 20 0.15%
Human Endocrine/Metabolism Disorders 612 4.47%
Other Human Disorders 198 1.45%
Animal Diseases and Disorders 222 1.62%
Animal Welfare 2015 14.71%
Diagnosis of diseases 2845 20.77%
Non-regulatory toxicology and ecotoxicology 1769 12.92%
Total 13695 100.00%
Regulatory uses and Routine production Regulatory uses and Routine production Number of uses Percentage
Quality control (incl batch safety and potency testing) 16195 65.66%
Other efficacy and tolerance testing 52 0.21%
Toxicity and other safety testing including pharmacology 7915 32.09%
Routine production 504 2.04%
Total 24666 100.00%
Regulatory uses - Quality control (including batch safety and potency testing) Regulatory uses - Quality control (including batch safety and potency testing) Number of uses Percentage
Batch safety testing 2400 14.82%
Pyrogenicity testing 192 1.19%
Batch potency testing 12812 79.11%
Other quality controls 791 4.88%
Total 16195 100.00%
Regulatory uses - Toxicity and other safety testing including pharmacology Regulatory uses - Toxicity and other safety testing including pharmacology Number of uses Percentage
Acute and sub-acute 1053 13.3%
Skin irritation/corrosion 189 2.39%
Skin sensitisation 673 8.5%
Eye irritation/corrosion 25 0.32%
Repeated dose toxicity 210 2.65%
Reproductive toxicity 217 2.74%
Developmental toxicity 1312 16.58%

187
Kinetics 1331 16.82%
Ecotoxicity 2673 33.77%
Safety testing in food and feed area 112 1.42%
Other toxicity/safety testing 120 1.52%
Total 7915 100.00%
Regulatory uses - Toxicity and other safety testing including pharmacology - Acute and sub-acute toxicity
testing methods Regulatory uses - Toxicity and other safety testing including pharmacology - Acute and sub-acute toxicity testing methods
Number of uses
Percentage
LD50, LC50 519 49.29%
Non lethal methods 534 50.71%
Total 1053 100.00%
Regulatory uses - Toxicity and other safety testing including pharmacology - Repeated dose toxicity Regulatory uses - Toxicity and other safety testing including pharmacology - Repeated dose toxicity
Number of uses
Percentage
29 - 90 days 210 100%
Total 210 100.00%
Regulatory uses - Toxicity and other safety testing including pharmacology - Ecotoxicity Regulatory uses - Toxicity and other safety testing including pharmacology - Ecotoxicity Number of uses Percentage
Acute toxicity 2551 95.44%
Chronic toxicity 122 4.56%
Total 2673 100.00%
Regulatory uses by type of legislation Type of legislation Number of
uses Percentage
Legislation on medicinal products for human use 15938 65.96%
Legislation on medicinal products for veterinary use and their residues 1542 6.38%
Medical devices legislation 2137 8.84%
Industrial chemicals legislation 1714 7.09%
Plant protection product legislation 2731 11.3%
Feed legislation including legislation for the safety of target animals, workers and environment
100 0.41%
Total 24162 100.00%
Regulatory uses by origin of regulatory requirement Origin of legislative requirement Number of uses Percentage
Legislation satisfying EU requirements 23709 98.13%
Legislation satisfying national requirements only [within EU] 360 1.49%
Legislation satisfying Non-EU requirements only 93 0.38%
Total 24162 100.00%
Routine production uses by product type Product type Number of uses Percentage
Blood based products 60 11.9%
Other product types 444 88.1%
Total 504 100.00%

188
Uses of animals in research, testing, routine production and education (including training) by first use and
reuses Reuse Number of uses Percentage
No 152785 99.26%
Yes 1146 0.74%
Total 153931 100.00%
Uses of animals in research, testing, routine production and education (including training) by severity Severity Number of uses Percentage
Non-recovery 6126 3.98%
Mild [up to and including] 35881 23.31%
Moderate 50547 32.84%
Severe 61377 39.87%
Total 153931 100.00%
Uses of animals in research, testing, routine production and education (including training) by genetic status
of animals Genetic status Number of uses Percentage
Not genetically altered 144148 93.64%
Genetically altered without a harmful phenotype 7557 4.91%
Genetically altered with a harmful phenotype 2226 1.45%
Total 153931 100.00%

189
Section 3: Creation and maintenance of genetically altered animal lines
All uses of animals for the creation of new genetically altered animal lines by species, first uses and reuses Animal species First uses Reuses Total
Mice 99 99
Rats 21 21
Other mammals 70 70
Total 190 190
Uses of animals for the creation of new genetically altered animal lines by severity Severity Number of uses Percentage
Non-recovery 24 12.63%
Mild [up to and including] 2 1.05%
Moderate 163 85.79%
Severe 1 0.53%
Total 190 100.00%
Uses of animals for the creation of new genetically altered animal lines by genetic status of the animals Genetic status Number of uses Percentage
Not genetically altered 111 58.42%
Genetically altered without a harmful phenotype 79 41.58%
Total 190 100.00%
Uses of animals for the creation of new genetically altered animal lines by type of basic research purposes Basic research Number of uses Percentage
Nervous System 185 97.37%
Multisystemic 5 2.63%
Total 190 100.00%
Uses of animals for the creation of new genetically altered animal lines by type of translational and applied
research purposes Translational and applied research Number of uses Percentage
No data reported
All uses of animals for the maintenance of established genetically altered animal lines by species Animal species First uses Reuses Total uses
Mice 136 136
Total 136 136
Uses of animals for the maintenance of established genetically altered animal lines by severity Severity Number of uses Percentage
Mild [up to and including] 136 100%
Total 136 100.00%
Uses of animals for the maintenance of established genetically altered animal lines by genetic status of the
animals Genetic status Number of uses Percentage
Genetically altered without a harmful phenotype 136 100%
Total 136 100.00%

190
Portugal
Portugal: Narrative 2018
1. General information on any changes in trends observed since the previous reporting period.
In 2018 there was an increase in animal use compared to the previous year (2017). The total number of
animals used in 2018 is 81107, which constitutes a 34,7% increase in animal use, compared to 2017
(total uses: 52983).
Mice continue to be the most used animal species (72,77%), followed by the entry Other fish (15,38%),
Rats (6,62%) and Zebra fish (4,57%).
There is a significant increase in the use of Fish (19,95%) compared to 2017 (3,98%).
All animal species used in 2018 showed an increase compared to 2017, except Other rodents, Other
mammals and Cephalopods that decreased. Domestic fowl was not used in 2018.
The use of Mammals dropped 14,90% but the the use of Fish increased 15,97% compared to the
previous year.
There was a decrease on reuse (total reuses: 300) compared to the previous year (total reuses: 1509).
Compared to the previous year, there was an obvious increase in the use of animals in Basic research,
Translational and applied research, Maintenance of colonies of established genetically altered animals,
not used in other procedure and in the Protection of the natural environment in the interests of the
health or welfare of human beings or animals.
Regulatory use and Routine prodution represents only 0,4% of all uses and animals used in Higher
education or training for the acquisition, maintenance or improvement of vocational skills had a slight
decrease compared to 2017, representing only 0,28% of all uses in 2018.
2. Information on significant increase or decrease in use animals in any of the specific areas and
analysis of the reasons thereof.
The increase in animal numbers in 2018 is mainly due to increased Basic research (64,73% of all use),
Maintenance of colonies of established genetically altered animals, not used in other procedures
(19,99% of all use), Translational and applied research (13,47% of all use) and Protection of the natural
environment in the interests of the health or welfare of human beings or animals (1,13% of all use).
The increase in Basic reseach is related to the increase of studies in Oncology, Nervous System,
Respiratory System, Sensory organs, Endocrine System/Metabolism, Multisystemic, Ethology/Animal
behaviour/Animal Biology and Other Basic research (Animal nutrition, Nutrition, Infection, Embryonic
development, for example).

191
The increase in Translational and applied research is related to the increase of studies in Human
Infectious disorders, Human Cardiovascular Disorders, Human cancer, Human Gastrointestinal Disorders
including Liver, Human Endocrine/metabolism Disorders and Other Human Disorders. Despite there was
a very slight drop in the use of animals for studying Human Nervous and Mental Disorders, compared to
the previous year, this is the second category of purposes for which more animals were used in
Translational and applied research, representing 20,62% of all uses in this category.
The reason for an increase in uses reported in the category Maintenance of colonies of established
genetically altered animals not used in other procedures, compared to the previous year, may be due to
an increase in the existance of more genetically lines.
In fact, in the latest years, there has been an increase on the use of genetically altered animals (with or
without a harmful phenotype) and, in 2018, the percentage of use of genetically altered animals is
49,71% of all uses.
The significant increase in the use of Other fish (15,38% of all uses) is mainly due to an increase in
studies in the areas of Animal nutrition, digestibility and infectious diseases to support the field of
Aquaculture an in studies of Basic research linked to the Immune system and Ethology, Animal
behaviour and Animal biology.
3. Information on any changes in trends in actual severities and analysis of the reasons thereof.
In 2018, the percentages reported for each of the categories of actual severities experienced by the
animals were as follows:
Non-recovery: 3,16%
Mild: 67,96%
Moderate: 18,98%
Severe: 9,90%
Compared to the previous year, this represents an increase of 15,45% in Mild procedures (52,51% to
67,96%), a decrease of 0,65% in Non-recovery procedures (3,81% to 3,16%), a decrease of 5,05% in
Moderate procedures (24,03% to 18,98%) and a decrease of 9,76% in Severe procedures (19,66% to
9,90%).
In general terms, We consider that this might probably due to a much wider and expressive aplication of
human endpoints and to aquisition of knowledge and competence in monitoring the animals by the
Animal Welfare Bodies.
Concerning the Non-recovery procedures, we have had an effort for clarifying the confusions that
usually rise with the attribution of this category of severity.
4. Particular efforts to promote the principle of replacement, reduction and refinement and its
impacts on statistics if any.

192
Despite not always being evident that the principle of replacemnet, reduction and refinement has an
obvious impact and reflex on the statistics, somehow, we think it is the case.
The promotion and the implementation of the 3Rs is always present in all the authorisation processes
and in the details that involve the use of animals for scientific purposes and is somehow applied by all
the persons who in the course of the performance of their responsibilities are confronted with its
application.
The competent authority has always contributed to the promotion of 3Rs, whether when carrying out
inspections to establishments, when evaluating scientific projects submitted for subsequent
authorization or in any opportunity it has to talk about the theme.
On the other hand, at the level of an establishment where animals are bred, used or from which are
supplied for scientific purposes, the Animal Welfare Body has implicit functions for implementing
measures to improve animal welfare and to promote 3Rs on a daily basis.
5. Further breakdown on the use of "other" categories if a significant proportion of animal use is
reported under this category.
In 2018, the further breakdown on the use of “other” categories is as follows:
On Animal species:
“Other birds” include pigeons (Columba livia);
“Other fish” include:
Goby (Pomatoschistus microps)
Seabass (Dicentrarchus labrax)
Seabream (Sparus aurata)
Argyrosomus argirosomus regius
Atherina presbyter
Onchorrynchy mykis
Oreochromis mossambicus
Oreochromis niloticus
Scyliorhinus canicula

193
On Purpose:
In Basic Research, “Other” include:
Nutrition
Animal nutrition/Digestibility
Obesity studies
Infectious disease / Infection
Malaria studies
Embrionic development
Intestinal microbiota composition
Genetic disorders
Bacterial metabolite profile in vivo
In Translational and applied research, “Other Human Disorders” include Aging.
6. Details on cases where the 'severe' classification is exceeded, whether pre-authorised or not,
covering the species, numbers, whether prior exemption was authorised, the details of the use and
the reasons why 'severe' classification was exceeded.
These cases have not occurred.
Portugal: Statistical Data 2018
Section 1: Numbers of animals used for the first time for research, testing, routine
production and educational (including training) purposes
Numbers of animals used for the first time by species Animal species Number of animals Percentage
Mice 41745 66.98%
Rats 5361 8.6%
Other rodents 37 0.06%
Rabbits 55 0.09%
Pigs 175 0.28%
Sheep 18 0.03%
Other mammals 2 0%
Zebra fish 2448 3.93%
Other fish 12474 20.02%
Cephalopods 8 0.01%
Total 62323 100.00%

194
Place of birth of animals other than non-human primates Place of birth Number of animals Percentage
Animals born in the EU at a registered breeder 56569 90.77%
Animals born in the EU but not at a registered breeder 4829 7.75%
Animals born in rest of Europe 199 0.32%
Animals born in rest of world 726 1.16%
Total 62323 100.00%
Source of non-human primates NHP Source (origin) Number of animals Percentage
No data reported
Generation of non-human primates NHP Generation Number of animals Percentage
No data reported

195
Section 2: Numbers of all uses of animals for research, testing, routine production and
educational (including training) purposes
First use versus reuses Animal species First uses Reuses Total
Mice 41745 60 41805
Rats 5361 5361
Other rodents 37 37
Rabbits 55 55
Cats 2 2
Dogs 18 18
Horses, donkeys and cross-breeds 9 9
Pigs 175 175
Goats 88 88
Sheep 18 22 40
Cattle 20 20
Other mammals 2 2
Other birds 66 66
Xenopus 15 15
Zebra fish 2448 2448
Other fish 12474 12474
Cephalopods 8 8
Total 62323 300 62623
Uses of animals in research, testing, routine production and education (including training) by main
categories of scientific purposes Purpose Category Number of
uses Percentage
Basic Research 50231 80.21%
Translational and applied research 10924 17.44%
Regulatory use and Routine production 322 0.51%
Protection of the natural environment in the interests of the health or welfare of human beings or animals
918 1.47%
Higher education or training for the acquisition, maintenance or improvement of vocational skills
228 0.36%
Total 62623 100.00%
Basic research related uses Basic research Number of uses Percentage
Oncology 5190 10.33%
Cardiovascular Blood and Lymphatic System 1045 2.08%
Nervous System 5773 11.49%
Respiratory System 517 1.03%
Gastrointestinal System including Liver 298 0.59%
Musculoskeletal System 104 0.21%
Immune System 16068 31.99%
Urogenital/Reproductive System 52 0.1%
Sensory Organs (skin, eyes and ears) 73 0.15%
Endocrine System/Metabolism 1908 3.8%
Multisystemic 430 0.86%
Ethology / Animal Behaviour /Animal Biology 4116 8.19%
Other basic research 14657 29.18%

196
Total 50231 100.00%
Translational and applied research related uses Translational and applied research Number of uses Percentage
Human Cancer 307 2.81%
Human Infectious Disorders 3785 34.65%
Human Cardiovascular Disorders 1901 17.4%
Human Nervous and Mental Disorders 2252 20.62%
Human Gastrointestinal Disorders including Liver 515 4.71%
Human Musculoskeletal Disorders 196 1.79%
Human Urogenital/Reproductive Disorders 35 0.32%
Human Sensory Organ Disorders (skin, eyes and ears) 256 2.34%
Human Endocrine/Metabolism Disorders 122 1.12%
Other Human Disorders 256 2.34%
Animal Diseases and Disorders 20 0.18%
Diagnosis of diseases 995 9.11%
Non-regulatory toxicology and ecotoxicology 284 2.6%
Total 10924 100.00%
Regulatory uses and Routine production Regulatory uses and Routine production Number of uses Percentage
Toxicity and other safety testing including pharmacology 322 100%
Total 322 100.00%
Regulatory uses - Quality control (including batch safety and potency testing) Regulatory uses - Quality control (including batch safety and potency testing) Number of uses Percentage
No data reported
Regulatory uses - Toxicity and other safety testing including pharmacology Regulatory uses - Toxicity and other safety testing including pharmacology Number of uses Percentage
Kinetics 245 76.09%
Safety testing in food and feed area 77 23.91%
Total 322 100.00%
Regulatory uses - Toxicity and other safety testing including pharmacology - Acute and sub-acute toxicity
testing methods Regulatory uses - Toxicity and other safety testing including pharmacology - Acute and sub-acute toxicity testing methods
Number of uses
Percentage
No data reported
Regulatory uses - Toxicity and other safety testing including pharmacology - Repeated dose toxicity Regulatory uses - Toxicity and other safety testing including pharmacology - Repeated dose toxicity
Number of uses
Percentage
No data reported
Regulatory uses - Toxicity and other safety testing including pharmacology - Ecotoxicity Regulatory uses - Toxicity and other safety testing including pharmacology - Ecotoxicity Number of uses Percentage
No data reported
Regulatory uses by type of legislation Type of legislation Number of uses Percentage
Legislation on medicinal products for human use 245 76.09%

197
Food legislation including food contact material 77 23.91%
Total 322 100.00%
Regulatory uses by origin of regulatory requirement Origin of legislative requirement Number of uses Percentage
Legislation satisfying EU requirements 322 100%
Total 322 100.00%
Routine production uses by product type Product type Number of uses Percentage
No data reported
Uses of animals in research, testing, routine production and education (including training) by first use and
reuses Reuse Number of uses Percentage
No 62323 99.52%
Yes 300 0.48%
Total 62623 100.00%
Uses of animals in research, testing, routine production and education (including training) by severity Severity Number of uses Percentage
Non-recovery 2566 4.1%
Mild [up to and including] 37968 60.63%
Moderate 14158 22.61%
Severe 7931 12.66%
Total 62623 100.00%
Uses of animals in research, testing, routine production and education (including training) by genetic status
of animals Genetic status Number of uses Percentage
Not genetically altered 39563 63.18%
Genetically altered without a harmful phenotype 19209 30.67%
Genetically altered with a harmful phenotype 3851 6.15%
Total 62623 100.00%

198
Section 3: Creation and maintenance of genetically altered animal lines
All uses of animals for the creation of new genetically altered animal lines by species, first uses and reuses Animal species First uses Reuses Total
Mice 1038 1038
Zebra fish 1230 1230
Total 2268 2268
Uses of animals for the creation of new genetically altered animal lines by severity Severity Number of uses Percentage
Mild [up to and including] 1127 49.69%
Moderate 1043 45.99%
Severe 98 4.32%
Total 2268 100.00%
Uses of animals for the creation of new genetically altered animal lines by genetic status of the animals Genetic status Number of uses Percentage
Not genetically altered 1221 53.84%
Genetically altered without a harmful phenotype 526 23.19%
Genetically altered with a harmful phenotype 521 22.97%
Total 2268 100.00%
Uses of animals for the creation of new genetically altered animal lines by type of basic research purposes Basic research Number of uses Percentage
Oncology 1488 65.61%
Cardiovascular Blood and Lymphatic System 145 6.39%
Nervous System 221 9.74%
Immune System 184 8.11%
Endocrine System/Metabolism 195 8.6%
Other basic research 35 1.54%
Total 2268 100.00%
Uses of animals for the creation of new genetically altered animal lines by type of translational and applied
research purposes Translational and applied research Number of uses Percentage
No data reported
All uses of animals for the maintenance of established genetically altered animal lines by species Animal species First uses Reuses Total uses
Mice 16177 16177
Rats 9 9
Zebra fish 30 30
Total 16216 16216
Uses of animals for the maintenance of established genetically altered animal lines by severity Severity Number of uses Percentage
Mild [up to and including] 16026 98.83%
Moderate 190 1.17%
Total 16216 100.00%

199
Uses of animals for the maintenance of established genetically altered animal lines by genetic status of the
animals Genetic status Number of uses Percentage
Genetically altered without a harmful phenotype 15501 95.59%
Genetically altered with a harmful phenotype 715 4.41%
Total 16216 100.00%

200
Romania
Romania: Narrative 2018
1. General information on any changes in trends observed since the previous reporting period.
Since the previous reporting year, there was a decrease in the number of total animals used for scientific
purposes, from 14642 in 2017 to 12195 in 2018.
2. Information on significant increase or decrease in use animals in any of the specific areas and
analysis of the reasons thereof.
There was a significant drop in oncology within the basic research.
There was a decrease in batch potency testing within regulatory use and routine production due to a
drop in the vaccines production. There was also a drop in acute and sub-acute within regulatory use and
routine production. Moreover, there was an increase in pyrogenicity testing due to a high number of
tests performed for countries using the Russian Pharmacopoeia.
3. Information on any changes in trends in actual severities and analysis of the reasons thereof.
There were no significant variations in terms of severity of the projects.
4. Particular efforts to promote the principle of replacement, reduction and refinement and its
impacts on statistics if any.
The decrease in the number of total animals used for scientific purposes is a mirror of the promotion of
the principle of replacement, reduction and refinement.
5. Further breakdown on the use of "other" categories if a significant proportion of animal use is
reported under this category.
No significant proportion of animal use was reported under “other " categories.
6. Details on cases where the 'severe' classification is exceeded, whether pre-authorised or not,
covering the species, numbers, whether prior exemption was authorised, the details of the use and
the reasons why 'severe' classification was exceeded.
There were not cases where “severe” classification was exceeded.

201
Romania: Statistical Data 2018
Section 1: Numbers of animals used for the first time for research, testing, routine
production and educational (including training) purposes
Numbers of animals used for the first time by species Animal species Number of animals Percentage
Mice 6758 57.86%
Rats 3642 31.18%
Guinea-Pigs 380 3.25%
Hamsters (Syrian) 18 0.15%
Rabbits 371 3.18%
Pigs 48 0.41%
Sheep 109 0.93%
Domestic fowl 114 0.98%
Rana 240 2.05%
Total 11680 100.00%
Place of birth of animals other than non-human primates Place of birth Number of animals Percentage
Animals born in the EU at a registered breeder 10071 86.22%
Animals born in the EU but not at a registered breeder 1541 13.19%
Animals born in rest of world 68 0.58%
Total 11680 100.00%
Source of non-human primates NHP Source (origin) Number of animals Percentage
No data reported
Generation of non-human primates NHP Generation Number of animals Percentage
No data reported

202
Section 2: Numbers of all uses of animals for research, testing, routine production and
educational (including training) purposes
First use versus reuses Animal species First uses Reuses Total
Mice 6758 6758
Rats 3642 3642
Guinea-Pigs 380 66 446
Hamsters (Syrian) 18 18
Rabbits 371 248 619
Horses, donkeys and cross-breeds 2 2
Pigs 48 48
Sheep 109 140 249
Cattle 3 3
Domestic fowl 114 56 170
Rana 240 240
Total 11680 515 12195
Uses of animals in research, testing, routine production and education (including training) by main
categories of scientific purposes Purpose Category Number of
uses Percentage
Basic Research 4559 37.38%
Translational and applied research 4615 37.84%
Regulatory use and Routine production 1908 15.65%
Higher education or training for the acquisition, maintenance or improvement of vocational skills
1113 9.13%
Total 12195 100.00%
Basic research related uses Basic research Number of uses Percentage
Oncology 766 16.8%
Cardiovascular Blood and Lymphatic System 849 18.62%
Nervous System 969 21.25%
Respiratory System 70 1.54%
Gastrointestinal System including Liver 60 1.32%
Musculoskeletal System 24 0.53%
Immune System 563 12.35%
Urogenital/Reproductive System 55 1.21%
Sensory Organs (skin, eyes and ears) 133 2.92%
Endocrine System/Metabolism 54 1.18%
Multisystemic 844 18.51%
Ethology / Animal Behaviour /Animal Biology 172 3.77%
Total 4559 100.00%
Translational and applied research related uses Translational and applied research Number of uses Percentage
Human Cancer 95 2.06%
Human Infectious Disorders 90 1.95%
Human Cardiovascular Disorders 310 6.72%
Human Nervous and Mental Disorders 10 0.22%
Human Gastrointestinal Disorders including Liver 50 1.08%

203
Human Musculoskeletal Disorders 70 1.52%
Human Immune Disorders 306 6.63%
Human Sensory Organ Disorders (skin, eyes and ears) 192 4.16%
Human Endocrine/Metabolism Disorders 305 6.61%
Animal Diseases and Disorders 48 1.04%
Diagnosis of diseases 2312 50.1%
Non-regulatory toxicology and ecotoxicology 827 17.92%
Total 4615 100.00%
Regulatory uses and Routine production Regulatory uses and Routine production Number of uses Percentage
Quality control (incl batch safety and potency testing) 1534 80.4%
Toxicity and other safety testing including pharmacology 24 1.26%
Routine production 350 18.34%
Total 1908 100.00%
Regulatory uses - Quality control (including batch safety and potency testing) Regulatory uses - Quality control (including batch safety and potency testing) Number of uses Percentage
Batch safety testing 681 44.39%
Pyrogenicity testing 372 24.25%
Batch potency testing 385 25.1%
Other quality controls 96 6.26%
Total 1534 100.00%
Regulatory uses - Toxicity and other safety testing including pharmacology Regulatory uses - Toxicity and other safety testing including pharmacology Number of uses Percentage
Ecotoxicity 24 100%
Total 24 100.00%
Regulatory uses - Toxicity and other safety testing including pharmacology - Acute and sub-acute toxicity
testing methods Regulatory uses - Toxicity and other safety testing including pharmacology - Acute and sub-acute toxicity testing methods
Number of uses
Percentage
No data reported
Regulatory uses - Toxicity and other safety testing including pharmacology - Repeated dose toxicity Regulatory uses - Toxicity and other safety testing including pharmacology - Repeated dose toxicity
Number of uses
Percentage
No data reported
Regulatory uses - Toxicity and other safety testing including pharmacology - Ecotoxicity Regulatory uses - Toxicity and other safety testing including pharmacology - Ecotoxicity Number of uses Percentage
Chronic toxicity 24 100%
Total 24 100.00%
Regulatory uses by type of legislation Type of legislation Number of uses Percentage
Legislation on medicinal products for human use 1023 65.66%
Legislation on medicinal products for veterinary use and their residues 511 32.8%
Medical devices legislation 24 1.54%
Total 1558 100.00%

204
Regulatory uses by origin of regulatory requirement Origin of legislative requirement Number of uses Percentage
Legislation satisfying EU requirements 1330 85.37%
Legislation satisfying Non-EU requirements only 228 14.63%
Total 1558 100.00%
Routine production uses by product type Product type Number of uses Percentage
Blood based products 350 100%
Total 350 100.00%
Uses of animals in research, testing, routine production and education (including training) by first use and
reuses Reuse Number of uses Percentage
No 11680 95.78%
Yes 515 4.22%
Total 12195 100.00%
Uses of animals in research, testing, routine production and education (including training) by severity Severity Number of uses Percentage
Non-recovery 1959 16.06%
Mild [up to and including] 4196 34.41%
Moderate 5202 42.66%
Severe 838 6.87%
Total 12195 100.00%
Uses of animals in research, testing, routine production and education (including training) by genetic status
of animals Genetic status Number of uses Percentage
Not genetically altered 11756 96.4%
Genetically altered without a harmful phenotype 439 3.6%
Total 12195 100.00%

205
Section 3: Creation and maintenance of genetically altered animal lines
All uses of animals for the creation of new genetically altered animal lines by species, first uses and reuses Animal species First uses Reuses Total
No data reported
Uses of animals for the creation of new genetically altered animal lines by severity Severity Number of uses Percentage
No data reported
Uses of animals for the creation of new genetically altered animal lines by genetic status of the animals Genetic status Number of uses Percentage
No data reported
Uses of animals for the creation of new genetically altered animal lines by type of basic research purposes Basic research Number of uses Percentage
No data reported
Uses of animals for the creation of new genetically altered animal lines by type of translational and applied
research purposes Translational and applied research Number of uses Percentage
No data reported
All uses of animals for the maintenance of established genetically altered animal lines by species Animal species First uses Reuses Total uses
No data reported
Uses of animals for the maintenance of established genetically altered animal lines by severity Severity Number of uses Percentage
No data reported
Uses of animals for the maintenance of established genetically altered animal lines by genetic status of the
animals Genetic status Number of uses Percentage
No data reported

206
Slovakia
Slovakia: Narrative 2018
1. General information on any changes in trends observed since the previous reporting period.
Increased number of animals used in the projects was also caused by the fact that more approved
establishments of the users have merged into larger law organizations, e.g. to the Biomedical Center SAS
Bratislava, the Centre of Bioscience SAS or Centre of Experimental Science SAS Bratislava. Therefore, the
possibilities of performance of the projects have raised. In 2018, more establishments started to use
more actively 2 large new establishments serving as complexes for the users, e.g. Central Animal
establishment of the Pavilion of Medical Science Bratislava and Establishment for Immunodeficient
Mice. By merging more approved user establishments into one organization several originally approved
user establishments have lost their legal subjectivity and became only organizational units of the given
subject. This is also the reason of decreased number of approved user establishments in comparison to
the previous years. The number of approved projects for 2018 has decreased due to the legislative
requirements regarding length of approval of the project, which has raised up to 5 years, since 2013.
This has caused decrease of the number of new applications because the users already had projects
approved for quite a long time of 5 years. Nevertheless, increased number of animals used in the
projects has been recorded of approved user establishments approved since 2017 could fully perform
the projects. These establishments have been undergone reconstruction changes, they were in a
transitional period to reach 1 January 2017 for harmonization of Annex III of the Directive No.:
2010/63/EU./
2. Information on significant increase or decrease in use animals in any of the specific areas and
analysis of the reasons thereof.
The number of animals used in regulated project performed for the purpose of control of effectiveness
and safety of chemical substances, medical products has increased significantly up to 27,44% of the total
number of used animals in comparison to 2017. Multiple orders for performance of these projects were
from the foreign sponsors. In 2018, the number of user establishments, performing also regulated
projects, related to orders from the foreign sponsors, increased. In the Slovak Republic, the most of
animals are used in the area of basic research (up to 64,60% of the total number of animals.
3. Information on any changes in trends in actual severities and analysis of the reasons thereof.
In comparison to 2017, the number of projects classified as “mild” decreased to 21,46 % of the overall
number from 2017, when the projects with mild severity used 33,21% of overall number of used
animals. At the same time, the percentage of animals used in projects classified as “moderate”
represented 68,02% of the overall number compared to 2017. That year, the number of animals used
in projects classified as moderate was 57,47% of overall number of used animals. The reason is , that
several projects in 2018 have got the purpose of the project in the area of nervous system research and
urogenital system research. In several cases, the animals are subject to pathological changes in health,
paying maximum attention to 3R, analgesia and human endpoint. The percentage of animals used in

207
projects classified as “severe” increased to 7,82 % from the total number. In 2017, in severe projects
only 2,27 % of the total number of animals was used. Based on the retrospective assessments and
mainly regulated projects it was found that some regulated projects after their performance were
classified as severe, what increased the percentage of animals used in the severe projects.
4. Particular efforts to promote the principle of replacement, reduction and refinement and its
impacts on statistics if any.
In SK, high efforts are being made to the submission of applications for approval of the project, where
the applicant must describe in details steps 3R, human end point and used analgesia and anaesthesia,
apart from the other requirements. High attention is paid to 3R principles, human endpoint and
searching of alternative methods at each training of the users, breeders and suppliers.
5. Further breakdown on the use of "other"categories if a significant proportion of animal use is
reported under this category.
The common animal species for performance of the projects are used in SK; only in “other birds”
category one approved user establishment is using species Taeniopygia guttata and Lonchura striata
domestica.
6. Details on cases where the 'severe' classification is exceeded, whether pre-authorised or not,
covering the species, numbers, whether prior exemption was authorised, the details of the use and
the reasons why 'severe' classification was exceeded.
In SK no cases of exceeding the “severe” classification in projects was reported in 2018. This is not even
possible that such a case would occurs. Rather the contrary, several projects classified as “severe”, after
retrospective assessment have got the actual severity “moderate” or “mild”. All projects are authorized
by the Decision, where the exact process of execution of the project is described in details and
classification of severity of each procedure performed on the animal and its consequences. In case of
execution of the project wilfully outside the approved methodology, the user would be punished by a
financial fine, cancellation of the project or by other repressive means according to the type of violation
of the law
Slovakia: Statistical Data 2018
Section 1: Numbers of animals used for the first time for research, testing, routine
production and educational (including training) purposes
Numbers of animals used for the first time by species Animal species Number of animals Percentage
Mice 6666 39.62%
Rats 8878 52.77%
Guinea-Pigs 752 4.47%
Mongolian gerbil 9 0.05%
Rabbits 244 1.45%
Cats 12 0.07%

208
Pigs 2 0.01%
Domestic fowl 237 1.41%
Other birds 23 0.14%
Total 16823 100.00%
Place of birth of animals other than non-human primates Place of birth Number of animals Percentage
Animals born in the EU at a registered breeder 16823 100%
Total 16823 100.00%
Source of non-human primates NHP Source (origin) Number of animals Percentage
No data reported
Generation of non-human primates NHP Generation Number of animals Percentage
No data reported

209
Section 2: Numbers of all uses of animals for research, testing, routine production and
educational (including training) purposes
First use versus reuses Animal species First uses Reuses Total
Mice 6666 6666
Rats 8878 8878
Guinea-Pigs 752 752
Mongolian gerbil 9 9
Rabbits 244 31 275
Cats 12 12
Pigs 2 2
Domestic fowl 237 6 243
Other birds 23 23
Total 16823 37 16860
Uses of animals in research, testing, routine production and education (including training) by main
categories of scientific purposes Purpose Category Number of
uses Percentage
Basic Research 11364 67.4%
Translational and applied research 638 3.78%
Regulatory use and Routine production 4828 28.64%
Higher education or training for the acquisition, maintenance or improvement of vocational skills
30 0.18%
Total 16860 100.00%
Basic research related uses Basic research Number of uses Percentage
Oncology 916 8.06%
Cardiovascular Blood and Lymphatic System 1075 9.46%
Nervous System 4414 38.84%
Respiratory System 471 4.14%
Gastrointestinal System including Liver 171 1.5%
Musculoskeletal System 23 0.2%
Immune System 624 5.49%
Urogenital/Reproductive System 1910 16.81%
Sensory Organs (skin, eyes and ears) 9 0.08%
Endocrine System/Metabolism 543 4.78%
Ethology / Animal Behaviour /Animal Biology 481 4.23%
Other basic research 727 6.4%
Total 11364 100.00%
Translational and applied research related uses Translational and applied research Number of uses Percentage
Human Cancer 42 6.58%
Human Cardiovascular Disorders 124 19.44%
Human Nervous and Mental Disorders 226 35.42%
Human Musculoskeletal Disorders 17 2.66%
Human Urogenital/Reproductive Disorders 63 9.87%
Human Sensory Organ Disorders (skin, eyes and ears) 16 2.51%
Human Endocrine/Metabolism Disorders 100 15.67%

210
Other Human Disorders 50 7.84%
Total 638 100.00%
Regulatory uses and Routine production Regulatory uses and Routine production Number of uses Percentage
Quality control (incl batch safety and potency testing) 665 13.77%
Toxicity and other safety testing including pharmacology 4132 85.58%
Routine production 31 0.64%
Total 4828 100.00%
Regulatory uses - Quality control (including batch safety and potency testing) Regulatory uses - Quality control (including batch safety and potency testing) Number of uses Percentage
Batch safety testing 542 81.5%
Batch potency testing 123 18.5%
Total 665 100.00%
Regulatory uses - Toxicity and other safety testing including pharmacology Regulatory uses - Toxicity and other safety testing including pharmacology Number of uses Percentage
Acute and sub-acute 492 11.91%
Skin sensitisation 418 10.12%
Repeated dose toxicity 168 4.07%
Genotoxicity 4 0.1%
Reproductive toxicity 2499 60.48%
Developmental toxicity 542 13.12%
Other toxicity/safety testing 9 0.22%
Total 4132 100.00%
Regulatory uses - Toxicity and other safety testing including pharmacology - Acute and sub-acute toxicity
testing methods Regulatory uses - Toxicity and other safety testing including pharmacology - Acute and sub-acute toxicity testing methods
Number of uses
Percentage
LD50, LC50 492 100%
Total 492 100.00%
Regulatory uses - Toxicity and other safety testing including pharmacology - Repeated dose toxicity Regulatory uses - Toxicity and other safety testing including pharmacology - Repeated dose toxicity
Number of uses
Percentage
up to 28 days 78 46.43%
29 - 90 days 90 53.57%
Total 168 100.00%
Regulatory uses - Toxicity and other safety testing including pharmacology - Ecotoxicity Regulatory uses - Toxicity and other safety testing including pharmacology - Ecotoxicity Number of uses Percentage
No data reported
Regulatory uses by type of legislation Type of legislation Number of
uses Percentage
Legislation on medicinal products for human use 542 11.3%
Legislation on medicinal products for veterinary use and their residues 123 2.56%
Medical devices legislation 9 0.19%
Industrial chemicals legislation 3487 72.69%
Food legislation including food contact material 542 11.3%

211
Feed legislation including legislation for the safety of target animals, workers and environment
90 1.88%
Other legislation 4 0.08%
Total 4797 100.00%
Regulatory uses by origin of regulatory requirement Origin of legislative requirement Number of uses Percentage
Legislation satisfying EU requirements 4797 100%
Total 4797 100.00%
Routine production uses by product type Product type Number of uses Percentage
Blood based products 31 100%
Total 31 100.00%
Uses of animals in research, testing, routine production and education (including training) by first use and
reuses Reuse Number of uses Percentage
No 16823 99.78%
Yes 37 0.22%
Total 16860 100.00%
Uses of animals in research, testing, routine production and education (including training) by severity Severity Number of uses Percentage
Non-recovery 475 2.82%
Mild [up to and including] 3044 18.05%
Moderate 11966 70.97%
Severe 1375 8.16%
Total 16860 100.00%
Uses of animals in research, testing, routine production and education (including training) by genetic status
of animals Genetic status Number of uses Percentage
Not genetically altered 15347 91.03%
Genetically altered without a harmful phenotype 501 2.97%
Genetically altered with a harmful phenotype 1012 6%
Total 16860 100.00%

212
Section 3: Creation and maintenance of genetically altered animal lines
All uses of animals for the creation of new genetically altered animal lines by species, first uses and reuses Animal species First uses Reuses Total
No data reported
Uses of animals for the creation of new genetically altered animal lines by severity Severity Number of uses Percentage
No data reported
Uses of animals for the creation of new genetically altered animal lines by genetic status of the animals Genetic status Number of uses Percentage
No data reported
Uses of animals for the creation of new genetically altered animal lines by type of basic research purposes Basic research Number of uses Percentage
No data reported
Uses of animals for the creation of new genetically altered animal lines by type of translational and applied
research purposes Translational and applied research Number of uses Percentage
No data reported
All uses of animals for the maintenance of established genetically altered animal lines by species Animal species First uses Reuses Total uses
Mice 473 473
Rats 259 259
Total 732 732
Uses of animals for the maintenance of established genetically altered animal lines by severity Severity Number of uses Percentage
Mild [up to and including] 732 100%
Total 732 100.00%
Uses of animals for the maintenance of established genetically altered animal lines by genetic status of the
animals Genetic status Number of uses Percentage
Not genetically altered 534 72.95%
Genetically altered without a harmful phenotype 11 1.5%
Genetically altered with a harmful phenotype 187 25.55%
Total 732 100.00%

213
Slovenia
Slovenia: Narrative 2018
1. General information on any changes in trends observed since the previous reporting period.
In 2018, 5.104 animals were used for scientific purposes, which is quite similar to the previous year. 93% of all used animals were rodents (mice and rats) and rabbits. Mice is still the most commonly used species (88%). Other animals (pigs, sheep, cattle, horses, poultry and fish) were used in very low number (approx. 7%). No cats, dogs and non-human primates were used for scientific purposes in 2018. 2. Information on significant increase or decrease in use animals in any of the specific areas and
analysis of the reasons thereof.
The majority of animals (approx. 57%) were used for the purpose of oncology, endocrine, immune and gastrointestinal system including liver. The highest number of rodents was used for the research of endocrine system. Further on, 115 mice were used for the purpose of preservation of species, more specifically, cryopreservation for the preservation of two lines of mice – fat and slim line. These two lines are unique in the world and are of major importance for further research in the field of discovering new genes for obesity and slimness, which could lead to development of medicine for obesity related diabetes. There was a slight drop in the number of animals in regulatory use and routine production, where less than 40% were used. The reason is in the replacement of in vivo methods, which follows the 3R principle of replacement and the termination of certain projects for certain markets, which leads in reduction of use of animals for regulatory purposes 3. Information on any changes in trends in actual severities and analysis of the reasons thereof.
Majority of procedures in Slovenia are classified as mild (over 87%), around 12% are moderate and less than 1% severe or non-recovery. All animals used in procedures classified as severe were used for basic research. 4. Particular efforts to promote the principle of replacement, reduction and refinement and its
impacts on statistics if any.
3R principle is generally followed, e.g. use of minimal number of animals, use of rodents, re-use, application of new techniques. We try to promote reduction, replacement and refinement principle during training courses for persons dealing with laboratory animals, meetings with animal welfare officers, different workshops, etc. In 2018, there was a poster on new methods of handling mice published. Scientists compared the use of tunnels and open hand towards handling by the tail. The conclusion was that the use of tunnels and open hand ease daily handling and lowers the discomfort of laboratory mice. 5. Further breakdown on the use of "other" categories if a significant proportion of animal use is
reported under this category.

214
There was no significant number of use under category “other” in 2018. 50 fish (Rainbow trout) were used in procedures for the purpose of higher education. 6. Details on cases where the 'severe' classification is exceded, whether pre-authorised or not,
covering the species, numbers, whether prior exemption was authorised, the details of the use and
the reasons why 'severe' classification was exceeded.
“Severe” classification was never exceeded.
Slovenia: Statistical Data 2018
Section 1: Numbers of animals used for the first time for research, testing, routine
production and educational (including training) purposes
Numbers of animals used for the first time by species Animal species Number of animals Percentage
Mice 3841 86.55%
Rats 235 5.3%
Rabbits 6 0.14%
Pigs 48 1.08%
Sheep 45 1.01%
Cattle 2 0.05%
Domestic fowl 211 4.75%
Other fish 50 1.13%
Total 4438 100.00%
Place of birth of animals other than non-human primates Place of birth Number of animals Percentage
Animals born in the EU at a registered breeder 4380 98.69%
Animals born in rest of world 58 1.31%
Total 4438 100.00%
Source of non-human primates NHP Source (origin) Number of animals Percentage
No data reported
Generation of non-human primates NHP Generation Number of animals Percentage
No data reported

215
Section 2: Numbers of all uses of animals for research, testing, routine production and
educational (including training) purposes
First use versus reuses Animal species First uses Reuses Total
Mice 3841 599 4440
Rats 235 235
Rabbits 6 64 70
Horses, donkeys and cross-breeds 2 2
Pigs 48 48
Sheep 45 1 46
Cattle 2 2
Domestic fowl 211 211
Other fish 50 50
Total 4438 666 5104
Uses of animals in research, testing, routine production and education (including training) by main
categories of scientific purposes Purpose Category Number of
uses Percentage
Basic Research 1069 20.94%
Translational and applied research 1832 35.89%
Regulatory use and Routine production 1982 38.83%
Preservation of species 115 2.25%
Higher education or training for the acquisition, maintenance or improvement of vocational skills
106 2.08%
Total 5104 100.00%
Basic research related uses Basic research Number of uses Percentage
Oncology 226 21.14%
Cardiovascular Blood and Lymphatic System 60 5.61%
Nervous System 45 4.21%
Gastrointestinal System including Liver 309 28.91%
Immune System 112 10.48%
Urogenital/Reproductive System 46 4.3%
Endocrine System/Metabolism 265 24.79%
Multisystemic 6 0.56%
Total 1069 100.00%
Translational and applied research related uses Translational and applied research Number of uses Percentage
Human Cancer 1487 81.17%
Human Endocrine/Metabolism Disorders 140 7.64%
Animal Diseases and Disorders 136 7.42%
Diagnosis of diseases 69 3.77%
Total 1832 100.00%
Regulatory uses and Routine production Regulatory uses and Routine production Number of uses Percentage
Quality control (incl batch safety and potency testing) 1982 100%
Total 1982 100.00%

216
Regulatory uses - Quality control (including batch safety and potency testing) Regulatory uses - Quality control (including batch safety and potency testing) Number of uses Percentage
Batch safety testing 45 2.27%
Pyrogenicity testing 64 3.23%
Batch potency testing 1873 94.5%
Total 1982 100.00%
Regulatory uses - Toxicity and other safety testing including pharmacology Regulatory uses - Toxicity and other safety testing including pharmacology Number of uses Percentage
No data reported
Regulatory uses - Toxicity and other safety testing including pharmacology - Acute and sub-acute toxicity
testing methods Regulatory uses - Toxicity and other safety testing including pharmacology - Acute and sub-acute toxicity testing methods
Number of uses
Percentage
No data reported
Regulatory uses - Toxicity and other safety testing including pharmacology - Repeated dose toxicity Regulatory uses - Toxicity and other safety testing including pharmacology - Repeated dose toxicity
Number of uses
Percentage
No data reported
Regulatory uses - Toxicity and other safety testing including pharmacology - Ecotoxicity Regulatory uses - Toxicity and other safety testing including pharmacology - Ecotoxicity Number of uses Percentage
No data reported
Regulatory uses by type of legislation Type of legislation Number of uses Percentage
Legislation on medicinal products for human use 1982 100%
Total 1982 100.00%
Regulatory uses by origin of regulatory requirement Origin of legislative requirement Number of uses Percentage
Legislation satisfying EU requirements 1982 100%
Total 1982 100.00%
Routine production uses by product type Product type Number of uses Percentage
No data reported
Uses of animals in research, testing, routine production and education (including training) by first use and
reuses Reuse Number of uses Percentage
No 4438 86.95%
Yes 666 13.05%
Total 5104 100.00%
Uses of animals in research, testing, routine production and education (including training) by severity Severity Number of uses Percentage
Non-recovery 32 0.63%
Mild [up to and including] 4460 87.38%

217
Moderate 607 11.89%
Severe 5 0.1%
Total 5104 100.00%
Uses of animals in research, testing, routine production and education (including training) by genetic status
of animals Genetic status Number of uses Percentage
Not genetically altered 4603 90.18%
Genetically altered without a harmful phenotype 411 8.05%
Genetically altered with a harmful phenotype 90 1.76%
Total 5104 100.00%

218
Section 3: Creation and maintenance of genetically altered animal lines
All uses of animals for the creation of new genetically altered animal lines by species, first uses and reuses Animal species First uses Reuses Total
No data reported
Uses of animals for the creation of new genetically altered animal lines by severity Severity Number of uses Percentage
No data reported
Uses of animals for the creation of new genetically altered animal lines by genetic status of the animals Genetic status Number of uses Percentage
No data reported
Uses of animals for the creation of new genetically altered animal lines by type of basic research purposes Basic research Number of uses Percentage
No data reported
Uses of animals for the creation of new genetically altered animal lines by type of translational and applied
research purposes Translational and applied research Number of uses Percentage
No data reported
All uses of animals for the maintenance of established genetically altered animal lines by species Animal species First uses Reuses Total uses
No data reported
Uses of animals for the maintenance of established genetically altered animal lines by severity Severity Number of uses Percentage
No data reported
Uses of animals for the maintenance of established genetically altered animal lines by genetic status of the
animals Genetic status Number of uses Percentage
No data reported

219
Spain
Spain: Narrative 2018
1. General information on any changes in trends observed since the previous reporting period.
Information can be collected by the breeders, suppliers or users of animals used for scientific purposes,
or by the competent authorities in the Autonomous Communities. Information collected at regional
level is submitted to the State authorities responsible for managing it for the purpose of complying with
the obligation laid down in Article 54(2) of Directive 2010/63/EU.
The procedure for collecting, managing and processing the information was launched in 2014.
Nevertheless, there are various factors that cast doubt on any comparison between data from different
years. The following factors are particularly significant: the large amount of data to be recorded; the
collection system that includes the establishments; the regional authorities, which sometimes also have
systems in place with different levels of communication; and the large turnover of staff involved.
The number of projects authorised slightly decreased, but this decrease does not affect the number of
uses. This is due, among other circumstances, to the increase in the number of projects involving
productive species in feeding studies and vaccine testing. Such projects account for the relatively high
numbers of animals.
The use of mammals has not changed substantially. There are, however, variations in the use of fish,
amphibians, reptiles and cephalopods.
With regard to the use of fish, there is a significant increase under the heading ‘other fish’, largely due to
studies carried out on animals at the stage of independently feeding larval forms.
Use of amphibians remains stable in the case of animals of the genus Xenopus in projects that make use
of its greater regeneration capacity or the fact that its organs function at an early stage. Animals
designated ‘other amphibians’ are used in research into conservation biology, as well as the impact of
invasive species on the natural environment. Such research uses larval forms at various stages and
involves groups of individuals in varying numbers.
For reptiles, given the low number of centres that use them, four in total, and the limited number of
projects, the completion of a single project produces an apparently significant variation in use.
Use of cephalopods has increased due to the development of various lines of research into diseases,
and greater understanding of their biology and reproduction.
In the information on how to report severity, as a consequence of the amount of work under way,
severity is being reported more accurately.

220
In assessing the figures on uses, it must be taken into account that, as in previous years, projects in the
field of animal nutrition are undertaken in commercial production conditions. For this reason, relatively
large groups of animals are used, which significantly increases the figures for uses of animals.
2. Information on significant increase or decrease in use animals in any of the specific areas and
analysis of the reasons thereof.
With regard to the origins of the animals, the number of animals born in registered establishments in
the EU appears to have decreased with a corresponding increase in those born in unregistered
establishments, in accordance with the rules on animals used for scientific purposes. In reality, however,
this does not reflect an actual change but rather the confusion created by this classification among
those responsible for providing the information. In Spain, any establishments that might at any time
house animals must be registered in accordance with the rules on animal health. Information providers
often classify animals as coming from ‘centres registered in the EU’ when they come from centres
registered for health-related purposes only, and not specifically from establishments registered under
the rules on protection of animals used for scientific and teaching purposes.
There is a notably high number of uses of hens and ‘other fish’ born in registered establishments. In
these cases, the animals were born in the same establishment in which they will be used. Hens are used
in studies that simulate commercial situations and therefore involve large flocks. Studies involving ‘other
fish’ often take place at very early stages, on independently feeding larval forms, during which all of the
fish involved come from the same batch of eggs. Furthermore, it is often necessary to simulate
commercial breeding conditions, which increases the number of animals included in the studies.
There has been an increase in the proportion of animals involved in the creation of new lines of
genetically altered animals. This is probably linked to the development of new techniques for creating
such lines.
With regard to the purposes, there is a notable sustained increase in animals involved in maintaining
lines of genetically altered animals. This is due both to greater use of genetically altered animals, and to
animals subject to invasive tissue sampling techniques being included in the numbers.
In the case of the use of animals in translational and applied research, there is an increase within the
group of human diseases related especially to the respiratory system, followed by the group of diseases
of the nervous and endocrine system. It is possible that this alteration is due to the funding lines for
research projects, as well as to the interest and impact of such diseases on public health and society.
There is also an increase in use for the purpose of research into ‘animal diseases’. This is due to interest
in improvement and competitiveness in various production sectors and, above all, to concern for the
health situation of European and North African livestock. In particular, there is an increase in the
number of uses of the porcine species, especially in studies related to diseases affecting the species. This
is linked to the considerable economic importance of pigs within national livestock production, and
concern within the sector to improve the quality and competitiveness of production.

221
3. Information on any changes in trends in actual severities and analysis of the reasons thereof.
Looking at trends in actual severities, there is a continued decline in the proportion of animals subject to
non-recovery procedures. However, this is not considered an actual change but rather is due to a better
understanding of what a non-recovery procedure is, along with better evaluation of actual severities
rather than reporting the prospective severities authorised for projects.
In addition, there is also emphasis on improving the design and implementation of monitoring protocols
adapted to the particular circumstances of experimental procedures, for example including relevant
clinical parameters for evaluation. This involves establishing end-point criteria clearly defined according
to the type of procedure, and also applying such specific end-point criteria at an early stage.
4. Particular efforts to promote the principle of replacement, reduction and refinement and its
impacts on statistics if any.
Work has continued in the direction taken in previous years.
General measures:
o Appropriate training for staff with ongoing training to maintain skills;
o Stressing the importance of researchers establishing preliminary statistical studies in order to determine the number of animals to be used;
o Requesting researchers to expand and supplement project authorisation files, especially with regard to monitoring protocols and critical factors;
o In some Autonomous Communities, decisions to authorise projects include reminders that project managers are required to replace, reduce and refine their methods during their projects in order to ensure that any changes in the availability of alternatives are duly considered and used as soon as possible;
o In teaching, use of animals has been replaced by other techniques. In research, it has been reduced to the minimum necessary in order for results to be statistically significant;
o Samples have been reduced to the minimum necessary in order for results to be statistically significant;
o Active promotion of a culture of ethical evaluation, including promoting the practice of the Ethics Committee reviewing any activities involving animals or animal samples, even if they are outside the scope of Directive 2010/63/EU of 22 September;
o There was emphasis on the requirement to review the literature to assess the possibilities of replacing, reducing and refining, and also on thorough assessment during project evaluation of the suitability of the sources consulted;
o Establishing and revising standard operating procedures with regard to animals.

222
On replacement:
Promoting the use of carcasses in teaching and research, coordinating acts of euthanasia where possible in order to optimise use of carcasses, or using organs and parts from slaughterhouses, carcasses from butchers/fishmongers, and remains of samples provided for teaching purposes. In universities, carcasses are used prior to using live animals;
Promoting alternatives, such as audio-visual methods and use of artificial bio-models in teaching;
Promoting and checking use of prior in vitro testing where procedures allow.
On reduction:
Thorough checking of sample sizes in prior evaluations of projects;
Promoting use of pilot studies that can help, for example, in selecting the correct size for groups;
Reducing the sources of variation: procedural conditions, conditions of the animals and environmental conditions;
Recently there has been emphasis on correctly selecting the sex of animals in studies and including a balance;
Sequencing of procedures in order to use the least number of animals.
On refinement:
Improving websites with information on refining the most common procedures;
Monitoring of anaesthetic and analgesic techniques in procedures;
Establishing and checking monitoring protocols and end-point criteria (in evaluation and execution of projects);
Improvements at facilities: e.g. providing thermal blankets for rodents, both for surgery and post-operatively;
Introducing and maintaining measures for enhancing the environment;
In teaching, the practice has begun of establishing individual records in order to monitor the involvement of animals in teaching. Records are kept not only for species for which it is a regulatory requirement, such as dogs, but is also for equines used in teaching. This has allowed the use of animals to be standardised across courses. It has also allowed a maximum age to be set for animals in teaching, together with efforts to find outcomes such as adoption once the teaching procedures have finished.
These measures are applied during project evaluation and authorisation, and during inspections and in
the communications among those involved.

223
5. Further breakdown on the use of "other" categories if a significant proportion of animal use is
reported under this category.
The following can be reported with regard to ‘other animal species’:
Use of other animal species represented over 11% of all uses of animals in 2018 in Spain. This was a significant increase compared to previous levels. Most of the uses were of ‘other fish’ (over 96%), often at very early stages of development and in large groups.
In general, in the majority of cases, the research conducted using these animals was for the following purposes: protecting the environment; preserving bio-diversity; and studying the biology and behaviour of the species itself, e.g. wild animals, marine mammals and lynxes.
In some cases, they are used in research projects concerning the nervous system (deer) or reproduction issues (mouflon).
Some groups of birds were used in studies on animal diseases, for example pigeons in studies of highly pathogenic avian influenza, as well as on non-regulatory toxicology and, very occasionally, for training, maintaining and developing professional skills.
Most of the fish involved belong to species in commercial production or species being reared in aquaculture. For this reason, in addition to research on their particular biology, studies are also being conducted into diseases that affect them, their prevention and treatment.
In the case of ‘used for other purposes’, please note the following:
In the 2018 report, in the section on basic research, the use of animals reported as ‘other’ represents a significant increase. Use of these animals was partly accounted for by studies on mitochondrial dysfunction, the influence of environmental factors on the proportion of sexes and in studies on the palatability of veterinary products.
For the purpose ‘regulatory use and routine production’, the following are significant: producing antigens; using animals to validate analytical methods; and establishing and testing periods for suppressing medication and detecting development of abnormal toxicities.
6. Details on cases where the 'severe' classification is exceeded, whether pre-authorised or not,
covering the species, numbers, whether prior exemption was authorised, the details of the use and
the reasons why 'severe' classification was exceeded.
This situation has not arisen in Spain.

224
Spain: Statistical Data 2018
Section 1: Numbers of animals used for the first time for research, testing, routine
production and educational (including training) purposes
Numbers of animals used for the first time by species Animal species Number of animals Percentage
Mice 411189 57.64%
Rats 51183 7.17%
Guinea-Pigs 9289 1.3%
Hamsters (Syrian) 669 0.09%
Other rodents 539 0.08%
Rabbits 18932 2.65%
Cats 89 0.01%
Dogs 856 0.12%
Ferrets 130 0.02%
Other carnivores 3 0%
Horses, donkeys and cross-breeds 112 0.02%
Pigs 11828 1.66%
Goats 198 0.03%
Sheep 2024 0.28%
Cattle 1349 0.19%
Cynomolgus monkey 271 0.04%
Baboons 3 0%
Other mammals 179 0.03%
Domestic fowl 79631 11.16%
Other birds 2446 0.34%
Reptiles 192 0.03%
Xenopus 1246 0.17%
Other amphibians 266 0.04%
Zebra fish 30174 4.23%
Other fish 86687 12.15%
Cephalopods 3919 0.55%
Total 713404 100.00%
Place of birth of animals other than non-human primates Place of birth Number of animals Percentage
Animals born in the EU at a registered breeder 665394 93.31%
Animals born in the EU but not at a registered breeder 45971 6.45%
Animals born in rest of world 1765 0.25%
Total 713130 100.00%
Source of non-human primates NHP Source (origin) Number of animals Percentage
Animals born at a registered breeder within EU 3 1.09%
Animals born in Asia 73 26.64%
Animals born in Africa 198 72.26%
Total 274 100.00%

225
Generation of non-human primates NHP Generation Number of animals Percentage
F1 4 1.46%
F2 or greater 270 98.54%
Total 274 100.00%

226
Section 2: Numbers of all uses of animals for research, testing, routine production and
educational (including training) purposes
First use versus reuses Animal species First uses Reuses Total
Mice 411189 6251 417440
Rats 51183 360 51543
Guinea-Pigs 9289 230 9519
Hamsters (Syrian) 669 97 766
Other rodents 539 539
Rabbits 18932 3534 22466
Cats 89 187 276
Dogs 856 276 1132
Ferrets 130 130
Other carnivores 3 3
Horses, donkeys and cross-breeds 112 57 169
Pigs 11828 155 11983
Goats 198 207 405
Sheep 2024 164 2188
Cattle 1349 223 1572
Cynomolgus monkey 271 129 400
Baboons 3 3
Other mammals 179 5 184
Domestic fowl 79631 32 79663
Other birds 2446 48 2494
Reptiles 192 192
Xenopus 1246 1246
Other amphibians 266 266
Zebra fish 30174 735 30909
Other fish 86687 1155 87842
Cephalopods 3919 3919
Total 713404 13845 727249
Uses of animals in research, testing, routine production and education (including training) by main
categories of scientific purposes Purpose Category Number of
uses Percentage
Basic Research 373829 51.4%
Translational and applied research 217798 29.95%
Regulatory use and Routine production 118868 16.34%
Protection of the natural environment in the interests of the health or welfare of human beings or animals
6245 0.86%
Preservation of species 488 0.07%
Higher education or training for the acquisition, maintenance or improvement of vocational skills
10021 1.38%
Total 727249 100.00%
Basic research related uses Basic research Number of uses Percentage
Oncology 49488 13.24%
Cardiovascular Blood and Lymphatic System 34819 9.31%
Nervous System 68108 18.22%

227
Respiratory System 2530 0.68%
Gastrointestinal System including Liver 7625 2.04%
Musculoskeletal System 9417 2.52%
Immune System 23838 6.38%
Urogenital/Reproductive System 7292 1.95%
Sensory Organs (skin, eyes and ears) 4224 1.13%
Endocrine System/Metabolism 19953 5.34%
Multisystemic 52330 14%
Ethology / Animal Behaviour /Animal Biology 89243 23.87%
Other basic research 4962 1.33%
Total 373829 100.00%
Translational and applied research related uses Translational and applied research Number of uses Percentage
Human Cancer 36911 16.95%
Human Infectious Disorders 12610 5.79%
Human Cardiovascular Disorders 7809 3.59%
Human Nervous and Mental Disorders 35370 16.24%
Human Respiratory Disorders 3439 1.58%
Human Gastrointestinal Disorders including Liver 7231 3.32%
Human Musculoskeletal Disorders 3386 1.55%
Human Immune Disorders 6198 2.85%
Human Urogenital/Reproductive Disorders 1591 0.73%
Human Sensory Organ Disorders (skin, eyes and ears) 9800 4.5%
Human Endocrine/Metabolism Disorders 17939 8.24%
Other Human Disorders 82 0.04%
Animal Diseases and Disorders 54941 25.23%
Animal Welfare 5186 2.38%
Diagnosis of diseases 6963 3.2%
Plant diseases 3 0%
Non-regulatory toxicology and ecotoxicology 8339 3.83%
Total 217798 100.00%
Regulatory uses and Routine production Regulatory uses and Routine production Number of uses Percentage
Quality control (incl batch safety and potency testing) 67259 56.58%
Other efficacy and tolerance testing 1779 1.5%
Toxicity and other safety testing including pharmacology 45885 38.6%
Routine production 3945 3.32%
Total 118868 100.00%
Regulatory uses - Quality control (including batch safety and potency testing) Regulatory uses - Quality control (including batch safety and potency testing) Number of uses Percentage
Batch safety testing 23829 35.43%
Pyrogenicity testing 8802 13.09%
Batch potency testing 32174 47.84%
Other quality controls 2454 3.65%
Total 67259 100.00%
Regulatory uses - Toxicity and other safety testing including pharmacology Regulatory uses - Toxicity and other safety testing including pharmacology Number of uses Percentage
Acute and sub-acute 7891 17.2%
Skin irritation/corrosion 80 0.17%

228
Skin sensitisation 1165 2.54%
Eye irritation/corrosion 3 0.01%
Repeated dose toxicity 8814 19.21%
Developmental toxicity 2038 4.44%
Neurotoxicity 2352 5.13%
Kinetics 1878 4.09%
Pharmaco-dynamics (incl safety pharmacology) 692 1.51%
Ecotoxicity 756 1.65%
Safety testing in food and feed area 19917 43.41%
Target animal safety 211 0.46%
Other toxicity/safety testing 88 0.19%
Total 45885 100.00%
Regulatory uses - Toxicity and other safety testing including pharmacology - Acute and sub-acute toxicity
testing methods Regulatory uses - Toxicity and other safety testing including pharmacology - Acute and sub-acute toxicity testing methods
Number of uses
Percentage
LD50, LC50 6435 81.55%
Other lethal methods 30 0.38%
Non lethal methods 1426 18.07%
Total 7891 100.00%
Regulatory uses - Toxicity and other safety testing including pharmacology - Repeated dose toxicity Regulatory uses - Toxicity and other safety testing including pharmacology - Repeated dose toxicity
Number of uses
Percentage
up to 28 days 4466 50.67%
29 - 90 days 1506 17.09%
> 90 days 2842 32.24%
Total 8814 100.00%
Regulatory uses - Toxicity and other safety testing including pharmacology - Ecotoxicity Regulatory uses - Toxicity and other safety testing including pharmacology - Ecotoxicity Number of uses Percentage
Acute toxicity 284 37.57%
Chronic toxicity 472 62.43%
Total 756 100.00%
Regulatory uses by type of legislation Type of legislation Number of uses Percentage
Legislation on medicinal products for human use 33847 29.45%
Legislation on medicinal products for veterinary use and their residues 55458 48.26%
Medical devices legislation 823 0.72%
Industrial chemicals legislation 4583 3.99%
Plant protection product legislation 245 0.21%
Food legislation including food contact material 19917 17.33%
Other legislation 50 0.04%
Total 114923 100.00%
Regulatory uses by origin of regulatory requirement Origin of legislative requirement Number of uses Percentage
Legislation satisfying EU requirements 108420 94.34%
Legislation satisfying national requirements only [within EU] 4759 4.14%
Legislation satisfying Non-EU requirements only 1744 1.52%
Total 114923 100.00%

229
Routine production uses by product type Product type Number of uses Percentage
Blood based products 60 1.52%
Monoclonal antibody by mouse ascites method 65 1.65%
Other product types 3820 96.83%
Total 3945 100.00%
Uses of animals in research, testing, routine production and education (including training) by first use and
reuses Reuse Number of uses Percentage
No 713404 98.1%
Yes 13845 1.9%
Total 727249 100.00%
Uses of animals in research, testing, routine production and education (including training) by severity Severity Number of uses Percentage
Non-recovery 38547 5.3%
Mild [up to and including] 346395 47.63%
Moderate 282027 38.78%
Severe 60280 8.29%
Total 727249 100.00%
Uses of animals in research, testing, routine production and education (including training) by genetic status
of animals Genetic status Number of uses Percentage
Not genetically altered 509494 70.06%
Genetically altered without a harmful phenotype 191065 26.27%
Genetically altered with a harmful phenotype 26690 3.67%
Total 727249 100.00%

230
Section 3: Creation and maintenance of genetically altered animal lines
All uses of animals for the creation of new genetically altered animal lines by species, first uses and reuses Animal species First uses Reuses Total
Mice 31915 86 32001
Rats 1605 1605
Pigs 4 4
Zebra fish 2257 2257
Other fish 1126 1126
Total 36907 86 36993
Uses of animals for the creation of new genetically altered animal lines by severity Severity Number of uses Percentage
Non-recovery 1142 3.09%
Mild [up to and including] 21920 59.25%
Moderate 13854 37.45%
Severe 77 0.21%
Total 36993 100.00%
Uses of animals for the creation of new genetically altered animal lines by genetic status of the animals Genetic status Number of uses Percentage
Not genetically altered 12759 34.49%
Genetically altered without a harmful phenotype 19450 52.58%
Genetically altered with a harmful phenotype 4784 12.93%
Total 36993 100.00%
Uses of animals for the creation of new genetically altered animal lines by type of basic research purposes Basic research Number of uses Percentage
Oncology 9546 38.11%
Cardiovascular Blood and Lymphatic System 166 0.66%
Nervous System 5428 21.67%
Respiratory System 9 0.04%
Gastrointestinal System including Liver 147 0.59%
Musculoskeletal System 143 0.57%
Immune System 400 1.6%
Sensory Organs (skin, eyes and ears) 4285 17.11%
Endocrine System/Metabolism 259 1.03%
Multisystemic 4491 17.93%
Other basic research 174 0.69%
Total 25048 100.00%
Uses of animals for the creation of new genetically altered animal lines by type of translational and applied
research purposes Translational and applied research Number of uses Percentage
Human Cancer 1463 12.25%
Human Nervous and Mental Disorders 123 1.03%
Human Gastrointestinal Disorders including Liver 55 0.46%
Human Musculoskeletal Disorders 168 1.41%
Human Immune Disorders 21 0.18%
Human Endocrine/Metabolism Disorders 9993 83.66%
Animal Diseases and Disorders 122 1.02%
Total 11945 100.00%

231
All uses of animals for the maintenance of established genetically altered animal lines by species Animal species First uses Reuses Total uses
Mice 68801 68801
Rats 1 1
Zebra fish 3052 3052
Total 71854 71854
Uses of animals for the maintenance of established genetically altered animal lines by severity Severity Number of uses Percentage
Mild [up to and including] 67495 93.93%
Moderate 4318 6.01%
Severe 41 0.06%
Total 71854 100.00%
Uses of animals for the maintenance of established genetically altered animal lines by genetic status of the
animals Genetic status Number of uses Percentage
Not genetically altered 7399 10.3%
Genetically altered without a harmful phenotype 57059 79.41%
Genetically altered with a harmful phenotype 7396 10.29%
Total 71854 100.00%

232
Sweden
Sweden: Narrative 2018
1. General information on any changes in trends observed since the previous reporting period.
Total number of uses
There was a decrease in the total number of uses reported for 2018 (274,655 uses) compared to 2017
(324,771 uses) and 2016 (344,766 uses).
Genetic status
The use of genetically altered animals with a harmful phenotype decreased 2018 (27,341 uses)
compared to 2017 (36,929 uses); but were proportionally similar (10% and 11%). The corresponding use
for 2016 was 22,293 uses (6%).
Place of birth
Fewer of the animal uses in 2018 were with animals born in the EU but not at a registered breeder
(29,671 uses) compared to 2017 (64,675 uses) and 2016 (67,459 uses). More of the animal uses in 2018
were with animals born in rest of Europe (15,975 uses) compared to 2017 (1,608 uses) and 2016 (5,884
uses).
Non-human Primate Source
All the 14 uses of non-reused non-human primates in 2018 were of primates born in Asia. This differs
from 2017 where most uses (19 uses, 76%) were of primates born in America, but is the same as 2016
were all were born in Asia (38 uses).
Species
Mice had 173,998 uses in 2018, which is a decrease compared to 2017 (220,281 uses) and 2016
(255,949 uses). The main purpose for 2018 as well as 2017 and 2016 was Basic research, on Immune
System, Cardiovascular Blood and Lymphatic System, Nervous System, Oncology, and Endocrine
System/Metabolism.
Rats had 15,438 uses in 2018, which is a decrease compared to 2017 (19,321 uses) and 2016 (21,218
uses). For 2018 as well as for 2017 and 2016, Basic Research, especially about the Nervous System, was
the main purpose (although about 3,000 fewer uses were reported as Nervous System for 2018
compared to 2017).
Cats had four uses in 2018, which is a decrease compared to 2017 (104 uses) and 2016 (94 uses). All four
cats in 2018 were reported as Basic Research, Musculoskeletal System; this category had no uses in 2017
but 54 uses in 2016.
Dogs had 531 uses in 2018, which is an increase compared to 2017 (386 uses) and 2016 (204 uses). The
main difference from 2017 and 2016 is the increase in Basic Research to 304 uses (29 and 12 uses in

233
2017 respectively 2016) of which 150 uses were Oncology and 150 uses Ethology/Animal
Behaviour/Animal Biology.
Other carnivores had 237 uses in 2018, which is an increase compared to 2017 (140 uses) and 2016 (167
uses). In contrast to 2017 and 2016, none was recorded as Basic Research and more were reported as
Preservation of Species (2018: 201 uses, 2017: 73 uses, 2016: no uses).
Horses, donkeys and cross-breeds had 146 uses in 2018 which is an increase compared to 2017 (41 uses)
but a large decrease compared to 2016 (824 uses). The increase compared to 2017 is mainly in Higher
Education or Training for the Acquisition, Maintenance or Improvement of Vocational Skills (2018: 100
uses, 2017: 26 uses). Most uses in 2016 are from a single user who reported 741 uses (in Translational
and Applied Research, more specifically Animal Diseases and Disorders).
Goats had 261 uses in 2018, which is an increase compared to both 2017 (30 uses) and 2016 (58 uses).
The main use in 2018 was in Translational and Applied Research (228 uses) foremost in Animal Diseases
and Disorders (213 uses).
Cattle had 2,394 uses in 2018, which is an increase compared to both 2017 (1,420 uses) and 2016 (1,436
uses). The use of cattle is rather similar for the three years except the 930 uses in Animal Diseases and
Disorders (Translational and Applied Research) in 2018 (2017: 49 uses, 2016: 32 uses).
Rhesus monkeys had 10 uses in 2018, which is a decrease compared to both 2017 (23 uses) and 2016
(28 uses). All uses in 2018 were reported as Basic Research about the Nervous System (5 uses) and about
the Immune System (5 uses). This contrasts to 2017 and 2016 where all uses were in Translational and
Applied Research, Human Infectious Disorders.
The frogs Rana temporaria och Rana pipiens had 2 uses in 2018, which is a decrease compared to both
2017 (308 uses) and 2016 (623 uses). For 2017 the uses were reported as Protection of the Natural
Environment in the Interests of the Health or Welfare of Human Beings or Animals (200 uses), and
Translational and Applied Research, more specifically Non-regulatory Toxicology and Ecotoxicology (108
uses). For 2016 most uses (600) were reported as Protection of the Natural Environment in the Interests
of the Health or Welfare of Human Beings or Animals. The 2018 uses were in Translational and Applied
Research, Animal Diseases and Disorders, specifically testing for prevalence of Batrachochytrium.
Zebra fish has gradually increased since 2016. For 2018 36,476 uses were reported (2017: 29,158 uses,
2016: 24,607 uses). A main change is the increase of uses within Basic Research within Cardiovascular
Blood and Lymphatic System (2018: 16,799 uses, 2017: 7,282 uses and 2016: 1,758 uses).
2. Information on significant increase or decrease in use animals in any of the specific areas and
analysis of the reasons thereof.
The uses in overall are similar 2016-2018. One change is the gradual decrease of Basic Research to
212,517 uses in 2018 (2017: 232,174 uses, 2016: 283,240 uses). Another change is that the category

234
Preservation of species has increased to 6,295 uses in 2018 compared to 617 uses in 2017 and no uses in
2016. In 2018, 79% of these uses were Other fish. Another change is that Maintenance of Colonies of
Established Genetically Altered Animals, not used in other Procedures decreased to 69 uses in 2018
compared to 1,679 uses in 2017 and 445 uses in 2016. Regarding maintenance, the previous main user
has not reported any uses for 2018, significantly lowering the total number.
The number of uses in 2018 for many of the categories under Basic Research are either similar to 2017
or to 2016. A change is that Nervous System decreased to 35,775 uses in 2018 compared to 53,425 uses
in 2017 and 51,837 uses in 2016. Furthermore, Multisystemic decreased to 7,257 uses from 10,201 uses
in 2017 and 31,111 uses in 2016. In addition, Sensory Organs (skin, eyes and ears) has gradually
decreased to 2,262 uses in 2018 (2017: 3,150 uses, 2016: 4,523 uses).
The number of uses in 2018 for many of the categories under Translational and Applied Research are
either similar to 2017 or to 2016. A change is that Human Cancer has gradually decreased to 7,737 uses
in 2018 compared to 10,841 uses in 2017 and 14,014 uses in 2016.
In addition, Non-regulatory Toxicology and Ecotoxicology increased to 6,253 uses in 2018 compared to
1,998 uses in 2017 and 1,955 uses in 2016. Furthermore, Other Human Disorders decreased to 1,020
uses in 2018 compared to 2,323 uses in 2017 and 3,802 uses in 2016.
Although there are no conclusive data, one could speculate that the decrease in uses under Other
Human Disorders in part is due to a better understanding of the reporting system, leading to more
detailed categorization.
3. Information on any changes in trends in actual severities and analysis of the reasons thereof.
The actual severities were proportionally very similar 2018 and 2016. For 2017, a larger proportion of
severe uses was reported compared to 2018 and 2016. The uses with severe severity decreased to
25,492 uses (9%) in 2018, compared to 41,058 uses (13%) in 2017, and 29,577 uses (9%) in 2016.
Most uses classified as severe in 2018 were reported as Basic Research (85%), foremost about the
Immune System and Nervous System. The number of severe uses in the subcategory Immune System
increased to 7,306 in 2018 from 4,558 uses in 2017 and 5,935 uses in 2016. The number of severe uses
in the subcategory Nervous System decreased to 4,398 in 2018 from 12,466 uses in 2017 and 7,744 uses
in 2016.
It is unclear what the changes depends on.
4. Particular efforts to promote the principle of replacement, reduction and refinement and its
impacts on statistics if any.

235
The Swedish 3Rs Center is the executive body of the Swedish National Committee for the Protection of
Animals Used for Scientific Purposes. As such, the 3Rs Center assists the Committee in carrying out its
tasks by e.g. developing advice on alternative methods, disseminating information on the 3Rs, and
supporting the local animal welfare bodies, the regional ethics committees and authorities concerned
with animal experiments.
At the end of 2017, the Swedish National Committee tasked the Swedish 3Rs Center with developing
guidelines for group housing of male mice. The project consists of three parts: a questionnaire, local
workshops, and a systematic literature review. Ten laboratory animal facilities, whose use of mice
corresponds to more than 95% of the total use of laboratory mice in Sweden, take part in the project.
During 2018, the questionnaire were sent out and eight local workshops were held in various locations
around Sweden. During the workshops, information was collected about the current situation, including
experienced problems. Measures tested by the facilities, and what these measures have resulted in,
were also discussed and recorded. More workshops was held in 2019, after which the material was
compiled. A systematic literature search was conducted in 2018 with the help of the Karolinska
Institute’s library and was further processed in 2019.
On November 15, 2018, the Swedish 3Rs Center co-organised a meeting for the Swedish animal welfare
bodies. The meeting had two main purposes. The first purpose was to promote collaboration between
the animal welfare bodies, as well as between the animal welfare bodies and the 3Rs Center. The
second purpose of the meeting was to support the animal welfare bodies in moving their work forward.
During 2018, the 3Rs Center developed its website structure and published new pages on the website
about animal welfare bodies, how to apply for research funding for 3R-projects, and links to other
organisations that work with animal welfare and issues related to the 3Rs. The 3Rs Center has also
posted news about 3R on the website.
5. Further breakdown on the use of "other" categories if a significant proportion of animal use is
reported under this category.
Other carnivores
31% of the carnivores were recorded as other carnivores. These 237 uses consist of Arctic fox (Vulpes
lagopus, 126 uses), brown bear (Ursus arctos, 58 uses), raccoon dog (Nyctereutes procyonoides, 36
uses), wolf (Canis lupus, 8 uses), wolverine (Gulo gulo, 5 uses), and lynx (Lynx lynx, 4 uses). The uses of
other carnivores were reported as Preservation of Species (202 uses) and Protection of the Natural
Environment in the Interests of the Health or Welfare of Human Beings or Animals (36 uses).
Other birds
90% of the birds were reported as other birds. These 10,625 uses consist mostly of Eurasian blue tit
(Cyanistes caeruleus, 3,842 uses), collared flycatcher (Ficedula albicollis, 1,932 uses) and great tit (Parus

236
major, 1,421 uses). Most uses of other birds were reported as Basic research (9,653 uses, of which 8,578
was specified as Ethology/Animal Behaviour/Animal Biology).
Other fish
41% of the reported fish constitutes other fish. Of the 25,539 uses of other fish most are reported as
Atlantic salmon (Salmo salar, 4,605 uses), European perch (Perca fluvialis, 3,431), brown trout (Salmo
trutta, 3,297 uses), Atlantic herring (Clupea harengus, 2,679 uses) and goldsinny wrasse (Ctenolabrus
rupestris, 2,500 uses). Most uses of other fish were reported as Basic Research (11,850 uses, of which
5,922 were in Ethology/Animal Behaviour/Animal Biology) and Translational and Applied Research
(6,095 uses, of which 5,530 were in Non-regulatory Toxicology and Ecotoxicology).
Other amphibians
89% of the amphibians are registered as other amphibians. This category (2,538 uses) consists mostly of
moor frog (Rana arvalis, 2,100 uses), Iberian ribbed newt (Pleurodeles waltl, 279 uses) and common
toad (Bufo bufo, 122 uses). Most uses of other amphibians were reported as Basic Research (2,396 uses,
of which 2,100 was in Ethology/Animal Behaviour/Animal Biology).
6. Details on cases where the 'severe' classification is exceeded, whether pre-authorised or not,
covering the species, numbers, whether prior exemption was authorised, the details of the use and
the reasons why 'severe' classification was exceeded.
There has been no such case in SE up to this date. Appendix The European Commission noticed some irregularities in the Swedish statistics for 2016 and 2017. After being in contact with those users, we have adjusted their reports. We have used the updated numbers in the present narrative.
Animal group Animal species 2016 2017 2018
Rodents Mice 255,946 220,281 173,998
Rats 21,218 19,321 15,438
Guinea-Pigs 422 409 623
Hamsters (Syrian) 0 34 39
Hamsters (Chinese) 0 0 0
Mongolian gerbil 0 0 0
Other rodents 63 5 181
Lagomorphs Rabbits 1,447 1,574 1,738
Carnivores Cats 94 104 4
Dogs 204 386 531
Ferrets 0 0 0
Other carnivores 167 140 237

237
Ungulates Horses, donkeys & cross-breeds 824 41 146
Pigs 1,840 1,557 1,579
Goats 58 30 261
Sheep 27 35 46
Cattle 1,436 1,420 2,394
Primates Prosimians 0 0 0
Marmosets and tamarins 0 0 0
Cynomolgus monkey 10 2 10
Rhesus monkey 28 23 10
Vervets Chlorocebus spp. 0 0 0
Baboons 0 0 0
Squirrel monkey 0 0 0
Other species of New World Monkeys
(Ceboidea) 0 0 0
Other species of Old World Monkeys
(Cercopithecoidea) 0 0 0
Other species of non-human primates 0 0 0
Apes 0 0 0
Other mammals Other mammals 427 327 483
Birds Domestic fowl 971 1,452 1,153
Other birds 11,583 11,269 10,625
Reptiles Reptiles 380 0 529
Amphibians Rana 623 308 2
Xenopus 441 261 298
Other amphibians 3,923 2,694 2,538
Fish Zebra fish 24,607 29,158 36,476
Other fish 18,024 33,940 25,539
Cephalopods Cephalopods 0 0 0
Total uses 344,766 324,771 274,655

238
Severity
2016 2017 2018 Number of % Number of % Number of %
Non-recovery 6,427 2 9,324 3 6,128 2
Mild (up to and including) 111,460 32 109,850 34 88,829 32
Moderate 197,302 57 164,539 51 154,206 56
Severe 29,577 9 41,058 13 25,492 9
Totally 344,766 100 324,771 100 274,655 100
Genetic Status 2016 2017 2018 Number of % Number of % Number of %
Not genetically altered 145,476 42 149,970 46 132,720 48
Genetically altered without a harmful
phenotype 176,997 51 137,872 42 114,594 42
Genetically altered with a harmful phenotype 22,293 6 36,929 11 27,341 10
Totally 345,433 100 325,838 100 274,655 100
Basic research
(first use and re-use)
2016 2017 2018
Number of % Number of % Number of %
Oncology 28,930 10 22,549 10 24,836 12
Cardiovascular Blood and Lymphatic
System 39,229 14 44,502 19 47,707 22
Nervous System 51,837 18 53,425 23 35,775 17
Respiratory System 2,732 1 7,362 3 1,697 1
Gastrointestinal System including
Liver 6,256 2 1,531 1 2,180 1
Musculoskeletal System 7,120 3 4,220 2 4,471 2
Immune System 41,870 15 23,194 10 32,131 15
Urogenital/Reproductive System 2,658 1 6,543 3 2,073 1
Regulatory use and routine production
2016 2017 2018 Number of % Number of % Number of %
Quality control (incl batch safety and potency
testing) 1,048 40 773 32 1,080 83
Other efficacy and tolerance testing 120 5 235 10 120 9
Toxicity and other safety testing including
pharmacology 1,426 55 1,416 58 106 8
Routine production 5 <1 0 0 0 0
Totally 2,599 100 2,424 100 1,306 100
Re-use 2016 2017 2018 Number of % Number of % Number of %
No 338,632 98 318,169 98 267,057 97
Yes 6,134 2 6,602 2 7,598 3
Totally 344,766 100 324,771 100 274,655 100

239
Sensory Organs (skin, eyes and ears) 4,523 2 3,150 1 2,262 1
Endocrine System/Metabolism 25,651 9 28,055 12 20,334 10
Multisystemic 31,111 11 10,201 4 7,257 3
Ethology / Animal Behaviour
/Animal Biology 16,487 6 16,914 7 18,397 9
Other basic research 24,836 9 10,528 5 13,397 6
Totally 283,240 100 232,174 100 212,517 100
Translational and applied research
(first use and re-use)
2016 2017 2018 Number
of
% Number of % Number of %
Human Cancer 14,014 28 10,841 19 7,737 17
Human Infectious Disorders 973 2 1,328 2 1,350 3
Human Cardiovascular Disorders 5,606 11 6,483 12 4,660 10
Human Nervous and Mental Disorders 4,523 9 9,737 17 10,942 24
Human Respiratory Disorders 5,806 11 5,077 9 4,279 9
Human Gastrointestinal Disorders including
Liver 279 1 0 0 56 <1
Human Musculoskeletal Disorders 246 <1 862 2 504 1
Human Immune Disorders 1,441 3 9,271 17 1,161 3
Human Urogenital/Reproductive Disorders 75 <1 255 <1 74 <1
Human Sensory Organ Disorders (skin,
eyes and ears) 292 1 500 1 48 <1
Human Endocrine/Metabolism Disorders 3,288 7 5,687 10 5,491 12
Other Human Disorders 3,802 8 2,323 4 1,020 <1
Animal Diseases and Disorders 1,160 2 704 1 1,799 4
Animal Welfare 6,578 13 105 <1 528 1
Diagnosis of diseases 530 1 542 1 355 1
Plant diseases 0 0 0 0 0 0
Non-regulatory toxicology and
ecotoxicology 1,955 4 1,998 4 6,253 14
Totally 50,568 100 55,713 100 46,257 100
Sweden: Statistical Data 2018
Section 1: Numbers of animals used for the first time for research, testing, routine
production and educational (including training) purposes
Numbers of animals used for the first time by species Animal species Number of animals Percentage
Mice 158425 67%
Rats 14034 5.94%
Guinea-Pigs 623 0.26%
Hamsters (Syrian) 39 0.02%
Other rodents 41 0.02%
Rabbits 1730 0.73%

240
Cats 4 0%
Dogs 409 0.17%
Other carnivores 192 0.08%
Horses, donkeys and cross-breeds 24 0.01%
Pigs 1308 0.55%
Goats 249 0.11%
Sheep 46 0.02%
Cattle 1426 0.6%
Cynomolgus monkey 4 0%
Rhesus monkey 10 0%
Other mammals 174 0.07%
Domestic fowl 1153 0.49%
Other birds 10550 4.46%
Reptiles 529 0.22%
Rana 2 0%
Xenopus 276 0.12%
Other amphibians 2538 1.07%
Zebra fish 17476 7.39%
Other fish 25189 10.65%
Total 236451 100.00%
Place of birth of animals other than non-human primates Place of birth Number of animals Percentage
Animals born in the EU at a registered breeder 188974 79.93%
Animals born in the EU but not at a registered breeder 29449 12.46%
Animals born in rest of Europe 15975 6.76%
Animals born in rest of world 2039 0.86%
Total 236437 100.00%
Source of non-human primates NHP Source (origin) Number of animals Percentage
Animals born in Asia 14 100%
Total 14 100.00%
Generation of non-human primates NHP Generation Number of animals Percentage
F2 or greater 14 100%
Total 14 100.00%

241
Section 2: Numbers of all uses of animals for research, testing, routine production and
educational (including training) purposes
First use versus reuses Animal species First uses Reuses Total
Mice 158425 692 159117
Rats 14034 772 14806
Guinea-Pigs 623 623
Hamsters (Syrian) 39 39
Other rodents 41 140 181
Rabbits 1730 8 1738
Cats 4 4
Dogs 409 122 531
Other carnivores 192 45 237
Horses, donkeys and cross-breeds 24 122 146
Pigs 1308 271 1579
Goats 249 12 261
Sheep 46 46
Cattle 1426 968 2394
Cynomolgus monkey 4 6 10
Rhesus monkey 10 10
Other mammals 174 86 260
Domestic fowl 1153 1153
Other birds 10550 75 10625
Reptiles 529 529
Rana 2 2
Xenopus 276 22 298
Other amphibians 2538 2538
Zebra fish 17476 3789 21265
Other fish 25189 350 25539
Total 236451 7480 243931
Uses of animals in research, testing, routine production and education (including training) by main
categories of scientific purposes Purpose Category Number of
uses Percentage
Basic Research 182154 74.67%
Translational and applied research 45965 18.84%
Regulatory use and Routine production 1306 0.54%
Protection of the natural environment in the interests of the health or welfare of human beings or animals
3253 1.33%
Preservation of species 6295 2.58%
Higher education or training for the acquisition, maintenance or improvement of vocational skills
4958 2.03%
Total 243931 100.00%
Basic research related uses Basic research Number of uses Percentage
Oncology 23921 13.13%
Cardiovascular Blood and Lymphatic System 29181 16.02%
Nervous System 34045 18.69%
Respiratory System 1536 0.84%

242
Gastrointestinal System including Liver 2180 1.2%
Musculoskeletal System 4114 2.26%
Immune System 25999 14.27%
Urogenital/Reproductive System 1093 0.6%
Sensory Organs (skin, eyes and ears) 2262 1.24%
Endocrine System/Metabolism 19464 10.69%
Multisystemic 7139 3.92%
Ethology / Animal Behaviour /Animal Biology 18397 10.1%
Other basic research 12823 7.04%
Total 182154 100.00%
Translational and applied research related uses Translational and applied research Number of uses Percentage
Human Cancer 7736 16.83%
Human Infectious Disorders 1350 2.94%
Human Cardiovascular Disorders 4370 9.51%
Human Nervous and Mental Disorders 10942 23.81%
Human Respiratory Disorders 4279 9.31%
Human Gastrointestinal Disorders including Liver 56 0.12%
Human Musculoskeletal Disorders 504 1.1%
Human Immune Disorders 1161 2.53%
Human Urogenital/Reproductive Disorders 74 0.16%
Human Sensory Organ Disorders (skin, eyes and ears) 48 0.1%
Human Endocrine/Metabolism Disorders 5490 11.94%
Other Human Disorders 1020 2.22%
Animal Diseases and Disorders 1799 3.91%
Animal Welfare 528 1.15%
Diagnosis of diseases 355 0.77%
Non-regulatory toxicology and ecotoxicology 6253 13.6%
Total 45965 100.00%
Regulatory uses and Routine production Regulatory uses and Routine production Number of uses Percentage
Quality control (incl batch safety and potency testing) 1080 82.7%
Other efficacy and tolerance testing 120 9.19%
Toxicity and other safety testing including pharmacology 106 8.12%
Total 1306 100.00%
Regulatory uses - Quality control (including batch safety and potency testing) Regulatory uses - Quality control (including batch safety and potency testing) Number of uses Percentage
Batch potency testing 1080 100%
Total 1080 100.00%
Regulatory uses - Toxicity and other safety testing including pharmacology Regulatory uses - Toxicity and other safety testing including pharmacology Number of uses Percentage
Repeated dose toxicity 30 28.3%
Kinetics 76 71.7%
Total 106 100.00%
Regulatory uses - Toxicity and other safety testing including pharmacology - Acute and sub-acute toxicity
testing methods Regulatory uses - Toxicity and other safety testing including pharmacology - Acute and sub-acute toxicity testing methods
Number of uses
Percentage

243
No data reported
Regulatory uses - Toxicity and other safety testing including pharmacology - Repeated dose toxicity Regulatory uses - Toxicity and other safety testing including pharmacology - Repeated dose toxicity
Number of uses
Percentage
up to 28 days 30 100%
Total 30 100.00%
Regulatory uses - Toxicity and other safety testing including pharmacology - Ecotoxicity Regulatory uses - Toxicity and other safety testing including pharmacology - Ecotoxicity Number of uses Percentage
No data reported
Regulatory uses by type of legislation Type of legislation Number of uses Percentage
Legislation on medicinal products for human use 226 17.3%
Legislation on medicinal products for veterinary use and their residues 1080 82.7%
Total 1306 100.00%
Regulatory uses by origin of regulatory requirement Origin of legislative requirement Number of uses Percentage
Legislation satisfying EU requirements 1306 100%
Total 1306 100.00%
Routine production uses by product type Product type Number of uses Percentage
No data reported
Uses of animals in research, testing, routine production and education (including training) by first use and
reuses Reuse Number of uses Percentage
No 236451 96.93%
Yes 7480 3.07%
Total 243931 100.00%
Uses of animals in research, testing, routine production and education (including training) by severity Severity Number of uses Percentage
Non-recovery 5763 2.36%
Mild [up to and including] 80258 32.9%
Moderate 134046 54.95%
Severe 23864 9.78%
Total 243931 100.00%
Uses of animals in research, testing, routine production and education (including training) by genetic status
of animals Genetic status Number of uses Percentage
Not genetically altered 131611 53.95%
Genetically altered without a harmful phenotype 99103 40.63%
Genetically altered with a harmful phenotype 13217 5.42%
Total 243931 100.00%

244
Section 3: Creation and maintenance of genetically altered animal lines
All uses of animals for the creation of new genetically altered animal lines by species, first uses and reuses Animal species First uses Reuses Total
Mice 14629 14629
Rats 632 632
Zebra fish 15093 118 15211
Total 30354 118 30472
Uses of animals for the creation of new genetically altered animal lines by severity Severity Number of uses Percentage
Non-recovery 365 1.2%
Mild [up to and including] 8388 27.53%
Moderate 20091 65.93%
Severe 1628 5.34%
Total 30472 100.00%
Uses of animals for the creation of new genetically altered animal lines by genetic status of the animals Genetic status Number of uses Percentage
Not genetically altered 926 3.04%
Genetically altered without a harmful phenotype 15491 50.84%
Genetically altered with a harmful phenotype 14055 46.12%
Total 30472 100.00%
Uses of animals for the creation of new genetically altered animal lines by type of basic research purposes Basic research Number of uses Percentage
Oncology 915 3.03%
Cardiovascular Blood and Lymphatic System 18526 61.39%
Nervous System 1730 5.73%
Respiratory System 161 0.53%
Musculoskeletal System 357 1.18%
Immune System 5949 19.71%
Urogenital/Reproductive System 980 3.25%
Endocrine System/Metabolism 870 2.88%
Multisystemic 118 0.39%
Other basic research 574 1.9%
Total 30180 100.00%
Uses of animals for the creation of new genetically altered animal lines by type of translational and applied
research purposes Translational and applied research Number of uses Percentage
Human Cancer 1 0.34%
Human Cardiovascular Disorders 290 99.32%
Human Endocrine/Metabolism Disorders 1 0.34%
Total 292 100.00%
All uses of animals for the maintenance of established genetically altered animal lines by species Animal species First uses Reuses Total uses
Mice 69 69
Total 69 69

245
Uses of animals for the maintenance of established genetically altered animal lines by severity Severity Number of uses Percentage
Moderate 69 100%
Total 69 100.00%
Uses of animals for the maintenance of established genetically altered animal lines by genetic status of the
animals Genetic status Number of uses Percentage
Genetically altered with a harmful phenotype 69 100%
Total 69 100.00%

246
United Kingdom
United Kingdom: Narrative 2018
Please note that the submitted data combines data from the separate Great Britain and Northern Ireland collections. The Home Office published 2018 data for Great Britain on the 18 July 2019 and the statistical release can be accessed online here: https://www.gov.uk/government/statistics/statistics-of-scientific-procedures-on-living-animals-great-britain-2018. The Northern Ireland Department for Health (NIDH) published their 2018 data here: https://www.health-ni.gov.uk/publications/statistics-scientific-procedures-living-animals-northern-ireland. The information submitted to the EU differs from the information published by the Home Office and the NIDH. The key difference is that the UK releases include procedures assessed as having sub-threshold severity for the purpose of procedure ‘[PG43] Maintenance of colonies of established genetically altered animals, not used in other procedures’, whereas this information is neither required by nor provided to the EU. In addition, the UK data releases separate procedures assessed as being of sub-threshold from those of mild severity, whereas all such procedures (i.e. all procedures other than PG43) are combined into the “Mild [up to and including]” category when the data is submitted to the EU. Likewise, additional details are also collected in the UK data for the source of animals (i.e. distinguishing between animals born in the UK and animals born in the rest of the EU), as are further species breakdowns for some animals (e.g. birds, dogs). These sub-categories of data are aggregated to form the EU categories prior to submission to the EU. 1. General information on any changes in trends observed since the previous reporting period. In 2018, a total of 2.44 million procedures were completed. This represents a decrease of 5% (137,000) compared with the 2.57 million procedures completed in 2017. Of the 2.44 million procedures, 1.83 million (75%) were experimental procedures and 612,000 (25%) related to the creation and breeding of genetically altered animals that were not used in further procedures. Since 2017, experimental procedures have decreased by 4% (80,000) and creation and breeding procedures have decreased by 9% (57,000). The reduction in the number of procedures recorded as being for creation and/or breeding appears to be due to a decrease in the number of mice bred but not used compared to 2017 There were 2.36 million animals used for the first time in completed procedures in 2018, representing a decrease of 6% (146,000) compared with 2017. The reason for this is not clear but appears to reflect a reduction in research activity across several sectors and is not confined to any particular purpose. 2. Information on significant increase or decrease in use animals in any of the specific areas and analysis of the reasons thereof. Of the 1.83 million experimental procedures completed in 2018, the majority involved the use of mice

247
(60%), fish (16%) and rats (9%). Comparing with 2017, there were notable changes1 to the number of procedures involving:
rats, which decreased by 63,000 (-27%) to 171,000 procedures in 2018;
guinea pigs, which decreased by 16,000 (-71%) to 6,400 procedures in 2018;
birds2, which increased by 16,000 (+12%) to 147,000 procedures in 2018;
rana, which increased by 570 (+525%) to 680 procedures in 2018;
goats, which decreased by 250 (-81%) to 60 procedures in 2018; Of the 612,000 procedures in 2018 related to the creation and breeding of genetically altered animals not used in further procedures, the majority involved mice (79%), fish3, (21%), and rats (0.5%). Comparing with 2017, there were notable changes4 to the number of procedures involving:
mice, which decreased by 80,000 (-14%) to 480,000 procedures in 2018;
fish5, which increased by 22,000 (+21%) to 126,000 procedures in 2018;
xenopus, which increased by 1,100 (+168%) to 1,700 procedures in 2018;
sheep, which increased by 160 (+918%) to 170 procedures in 2018;
pigs, which increased by 90 (+70%) to 210 procedures in 2018; 3. Information on any changes in trends in actual severities and analysis of the reasons thereof. Of the 1.83 million experimental procedures completed in 2018:
5% (90,000) were assessed as non-recovery, compared with 7% (135,000) in 2017;
63% (1.16 million) were assessed as (up to and including) mild, compared with 61% (1.17 million) in 2017;
27% (489,000) were assessed as moderate, compared with 26% (504,000) in 2017;
5% (88,000) were assessed as severe, compared with 5% (95,000) in 2017. Of the 612,000 procedures in 2018 related to the creation and breeding of genetically altered animals not used in further procedures:
0.08% (510) were assessed as non-recovery, compared with 0.07% (470) in 2017;
87% (532,000) were assessed as (up to and including) mild, compared with 85% (570,000) in 2017;
7% (41,000) were assessed as moderate, compared with 8% (55,000) in 2017;
6% (38,000) were assessed as severe, compared with 6% (43,000) in 2017. In relation to the creation and breeding of genetically altered animals not used in further procedures, the main reason for severe assessments is that animals in breeding colonies were found dead with no clear explanation for the cause of death; the default position being that where the death cannot be excluded from being procedural, it is recorded as ‘severe’. Home Office continues to look to improve the guidance provided in this area, particularly with respect to fish. Because the UK has in the past regulated the breeding of genetically altered (GA) animals (regardless of phenotype), in contrast to most other Member States, there remain a large number of animals bred on
1 Covers the three largest numeric and the three largest percentage changes between 2017 and 2018.
2 Specifically, domestic fowl and other bird species.
3 Specifically, Zebrafish and other fish species.
4 Covers the three largest numeric and the three largest percentage changes between 2017 and 2018.
5 Specifically, Zebrafish and other fish species.

248
mild severity protocols which were assessed as having mild actual severity. Some of these reflect invasive genotyping methods, and this is particularly common for fish. The Home Office believes however that there remains some over reporting of the actual severity of GA animals. Nevertheless, the reduction in the overall numbers of procedures by severity for creation and breeding of animals for use in 2018 suggests that the ongoing education and improved guidance for users on this matter is having an impact. 4. Particular efforts to promote the principle of replacement, reduction and refinement and its impacts on statistics if any. The UK has subscribed to the three principles of replacement, reduction and refinement (the 3Rs) for a number of years but recent years has seen the principles of the 3Rs placed more firmly at the core of animal scientific research. This is principally achieved through the project licence evaluation process, provision of advice by the Inspectorate of the Animals in Science Regulation Unit and through the National Centre for the Replacement, Refinement and Reduction of Animals in Research (NC3Rs). This commitment is not focused on baseline numbers, which would be evident through the statistics, and which are influenced by a range of extraneous factors. Instead, it encompasses replacement, reduction and refinement more broadly, putting them at the heart of a science-led approach.
5. Further breakdown on the use of "other" categories if a significant proportion of animal use is reported under this category.
Basic research “other category” included:
Embryology, cell and molecular biology;
Genetics;
Parasitology;
Studies of infectious agents where it was the agent, rather than the disease, under investigation;
Nutrition
Provision of material for ex vivo use (unspecified)
Infectious disease
Regulatory use, routine production “other”:
Antigens, infectious agents including parasites, oocytes, etc;
Antibodies (but not by ascites method);
Urine.
Regulatory use, quality control “other”:
Method development, agent standardisation;
Vaccine stability and testing of seed materials;
Cell line characterisation.
Regulatory use Other efficacy Testing of traps Diagnostics for OIE.
Regulatory use, legislative purpose “other”:

249
Mainly production of reagents, controls and validation standards.
Diagnostics for OIE
REACH
EU Water Framework Directive
Regulatory use, toxicity “other”:
Effects on non-target (i.e. ASPA non-Schedule 2) species;
Metabolism, DMPK
Internal validation and pilot studies.
Also testing of ballast water (ecotoxicity)
Use of this category appears to indicate some confusion in the classification of toxicity testing Regulatory Use: Other legislative requirements
Mainly production to meet industry specifications.
Provision of standard reagents, controls
Trap approval
EU Water Framework Directive
REACH
Diagnostics OIE
Many researchers appear to have problems in deciding how to classify some common procedures, in
particular the re-derivation.cyropreservation of GA lines. Either additional categories or guidance would
be beneficial.
6. Details on cases where the 'severe' classification is exceeded, whether pre-authorised or not, covering the species, numbers, whether prior exemption was authorised, the details of the use and the reasons why 'severe' classification was exceeded. Not applicable.

250
United Kingdom: Statistical Data 2018
Section 1: Numbers of animals used for the first time for research, testing, routine
production and educational (including training) purposes
Numbers of animals used for the first time by species Animal species Number of animals Percentage
Mice 1094432 62.54%
Rats 169340 9.68%
Guinea-Pigs 6445 0.37%
Hamsters (Syrian) 1416 0.08%
Mongolian gerbil 492 0.03%
Other rodents 839 0.05%
Rabbits 10691 0.61%
Cats 37 0%
Dogs 2909 0.17%
Ferrets 466 0.03%
Other carnivores 308 0.02%
Horses, donkeys and cross-breeds 86 0%
Pigs 4298 0.25%
Goats 58 0%
Sheep 4973 0.28%
Cattle 5073 0.29%
Marmoset and tamarins 92 0.01%
Cynomolgus monkey 2270 0.13%
Rhesus monkey 110 0.01%
Other mammals 861 0.05%
Domestic fowl 140049 8%
Other birds 6481 0.37%
Reptiles 104 0.01%
Rana 675 0.04%
Xenopus 1742 0.1%
Other amphibians 768 0.04%
Zebra fish 202053 11.55%
Other fish 92833 5.31%
Total 1749901 100.00%
Place of birth of animals other than non-human primates Place of birth Number of animals Percentage
Animals born in the EU at a registered breeder 1621088 92.77%
Animals born in the EU but not at a registered breeder 117091 6.7%
Animals born in rest of Europe 1557 0.09%
Animals born in rest of world 7693 0.44%
Total 1747429 100.00%
Source of non-human primates NHP Source (origin) Number of animals Percentage
Animals born at a registered breeder within EU 383 15.49%
Animals born in Asia 538 21.76%
Animals born in Africa 1551 62.74%
Total 2472 100.00%

251
Generation of non-human primates NHP Generation Number of animals Percentage
F1 246 9.95%
F2 or greater 714 28.88%
Self-sustaining colony 1512 61.17%
Total 2472 100.00%

252
Section 2: Numbers of all uses of animals for research, testing, routine production and
educational (including training) purposes
First use versus reuses Animal species First uses Reuses Total
Mice 1094432 988 1095420
Rats 169340 2062 171402
Guinea-Pigs 6445 6445
Hamsters (Syrian) 1416 1416
Mongolian gerbil 492 18 510
Other rodents 839 839
Rabbits 10691 468 11159
Cats 37 193 230
Dogs 2909 1636 4545
Ferrets 466 466
Other carnivores 308 308
Horses, donkeys and cross-breeds 86 10356 10442
Pigs 4298 105 4403
Goats 58 58
Sheep 4973 49338 54311
Cattle 5073 1055 6128
Marmoset and tamarins 92 21 113
Cynomolgus monkey 2270 664 2934
Rhesus monkey 110 50 160
Other mammals 861 28 889
Domestic fowl 140049 68 140117
Other birds 6481 497 6978
Reptiles 104 104
Rana 675 675
Xenopus 1742 3642 5384
Other amphibians 768 9 777
Zebra fish 202053 3130 205183
Other fish 92833 1544 94377
Total 1749901 75872 1825773
Uses of animals in research, testing, routine production and education (including training) by main
categories of scientific purposes Purpose Category Number of
uses Percentage
Basic Research 995914 54.55%
Translational and applied research 318241 17.43%
Regulatory use and Routine production 495378 27.13%
Protection of the natural environment in the interests of the health or welfare of human beings or animals
13800 0.76%
Preservation of species 1037 0.06%
Higher education or training for the acquisition, maintenance or improvement of vocational skills
1327 0.07%
Forensic enquiries 76 0%
Total 1825773 100.00%

253
Basic research related uses Basic research Number of uses Percentage
Oncology 124761 12.53%
Cardiovascular Blood and Lymphatic System 68674 6.9%
Nervous System 214090 21.5%
Respiratory System 12524 1.26%
Gastrointestinal System including Liver 28796 2.89%
Musculoskeletal System 30519 3.06%
Immune System 225497 22.64%
Urogenital/Reproductive System 38277 3.84%
Sensory Organs (skin, eyes and ears) 25388 2.55%
Endocrine System/Metabolism 35486 3.56%
Multisystemic 68975 6.93%
Ethology / Animal Behaviour /Animal Biology 73137 7.34%
Other basic research 49790 5%
Total 995914 100.00%
Translational and applied research related uses Translational and applied research Number of uses Percentage
Human Cancer 91543 28.77%
Human Infectious Disorders 76475 24.03%
Human Cardiovascular Disorders 5368 1.69%
Human Nervous and Mental Disorders 51154 16.07%
Human Respiratory Disorders 7000 2.2%
Human Gastrointestinal Disorders including Liver 3335 1.05%
Human Musculoskeletal Disorders 5746 1.81%
Human Immune Disorders 5275 1.66%
Human Urogenital/Reproductive Disorders 2727 0.86%
Human Sensory Organ Disorders (skin, eyes and ears) 7111 2.23%
Human Endocrine/Metabolism Disorders 2733 0.86%
Other Human Disorders 8723 2.74%
Animal Diseases and Disorders 15087 4.74%
Animal Welfare 5299 1.67%
Diagnosis of diseases 4636 1.46%
Non-regulatory toxicology and ecotoxicology 26029 8.18%
Total 318241 100.00%
Regulatory uses and Routine production Regulatory uses and Routine production Number of uses Percentage
Quality control (incl batch safety and potency testing) 136935 27.64%
Other efficacy and tolerance testing 27922 5.64%
Toxicity and other safety testing including pharmacology 147636 29.8%
Routine production 182885 36.92%
Total 495378 100.00%
Regulatory uses - Quality control (including batch safety and potency testing) Regulatory uses - Quality control (including batch safety and potency testing) Number of uses Percentage
Batch safety testing 8445 6.17%
Pyrogenicity testing 638 0.47%
Batch potency testing 106839 78.02%
Other quality controls 21013 15.35%
Total 136935 100.00%

254
Regulatory uses - Toxicity and other safety testing including pharmacology Regulatory uses - Toxicity and other safety testing including pharmacology Number of uses Percentage
Acute and sub-acute 15738 10.66%
Skin irritation/corrosion 123 0.08%
Skin sensitisation 2040 1.38%
Eye irritation/corrosion 40 0.03%
Repeated dose toxicity 38892 26.34%
Carcinogenicity 10349 7.01%
Genotoxicity 4333 2.93%
Reproductive toxicity 32612 22.09%
Developmental toxicity 15150 10.26%
Neurotoxicity 248 0.17%
Kinetics 4604 3.12%
Pharmaco-dynamics (incl safety pharmacology) 4885 3.31%
Ecotoxicity 11733 7.95%
Safety testing in food and feed area 289 0.2%
Target animal safety 512 0.35%
Other toxicity/safety testing 6088 4.12%
Total 147636 100.00%
Regulatory uses - Toxicity and other safety testing including pharmacology - Acute and sub-acute toxicity
testing methods Regulatory uses - Toxicity and other safety testing including pharmacology - Acute and sub-acute toxicity testing methods
Number of uses
Percentage
LD50, LC50 10252 65.14%
Other lethal methods 23 0.15%
Non lethal methods 5463 34.71%
Total 15738 100.00%
Regulatory uses - Toxicity and other safety testing including pharmacology - Repeated dose toxicity Regulatory uses - Toxicity and other safety testing including pharmacology - Repeated dose toxicity
Number of uses
Percentage
up to 28 days 20109 51.7%
29 - 90 days 12063 31.02%
> 90 days 6720 17.28%
Total 38892 100.00%
Regulatory uses - Toxicity and other safety testing including pharmacology - Ecotoxicity Regulatory uses - Toxicity and other safety testing including pharmacology - Ecotoxicity Number of uses Percentage
Acute toxicity 2894 24.67%
Chronic toxicity 6568 55.98%
Endocrine activity 1313 11.19%
Bioaccumulation 955 8.14%
Other ecotoxicity 3 0.03%
Total 11733 100.00%
Regulatory uses by type of legislation Type of legislation Number of
uses Percentage
Legislation on medicinal products for human use 201850 64.59%
Legislation on medicinal products for veterinary use and their residues 38777 12.41%
Medical devices legislation 948 0.3%
Industrial chemicals legislation 37869 12.12%

255
Plant protection product legislation 15772 5.05%
Biocides legislation 322 0.1%
Food legislation including food contact material 2619 0.84%
Feed legislation including legislation for the safety of target animals, workers and environment
9981 3.19%
Other legislation 4355 1.39%
Total 312493 100.00%
Regulatory uses by origin of regulatory requirement Origin of legislative requirement Number of uses Percentage
Legislation satisfying EU requirements 285929 91.5%
Legislation satisfying national requirements only [within EU] 2224 0.71%
Legislation satisfying Non-EU requirements only 24340 7.79%
Total 312493 100.00%
Routine production uses by product type Product type Number of uses Percentage
Blood based products 83961 45.91%
Other product types 98924 54.09%
Total 182885 100.00%
Uses of animals in research, testing, routine production and education (including training) by first use and
reuses Reuse Number of uses Percentage
No 1749901 95.84%
Yes 75872 4.16%
Total 1825773 100.00%
Uses of animals in research, testing, routine production and education (including training) by severity Severity Number of uses Percentage
Non-recovery 90329 4.95%
Mild [up to and including] 1157902 63.42%
Moderate 489062 26.79%
Severe 88480 4.85%
Total 1825773 100.00%
Uses of animals in research, testing, routine production and education (including training) by genetic status
of animals Genetic status Number of uses Percentage
Not genetically altered 1089973 59.7%
Genetically altered without a harmful phenotype 617725 33.83%
Genetically altered with a harmful phenotype 118075 6.47%
Total 1825773 100.00%
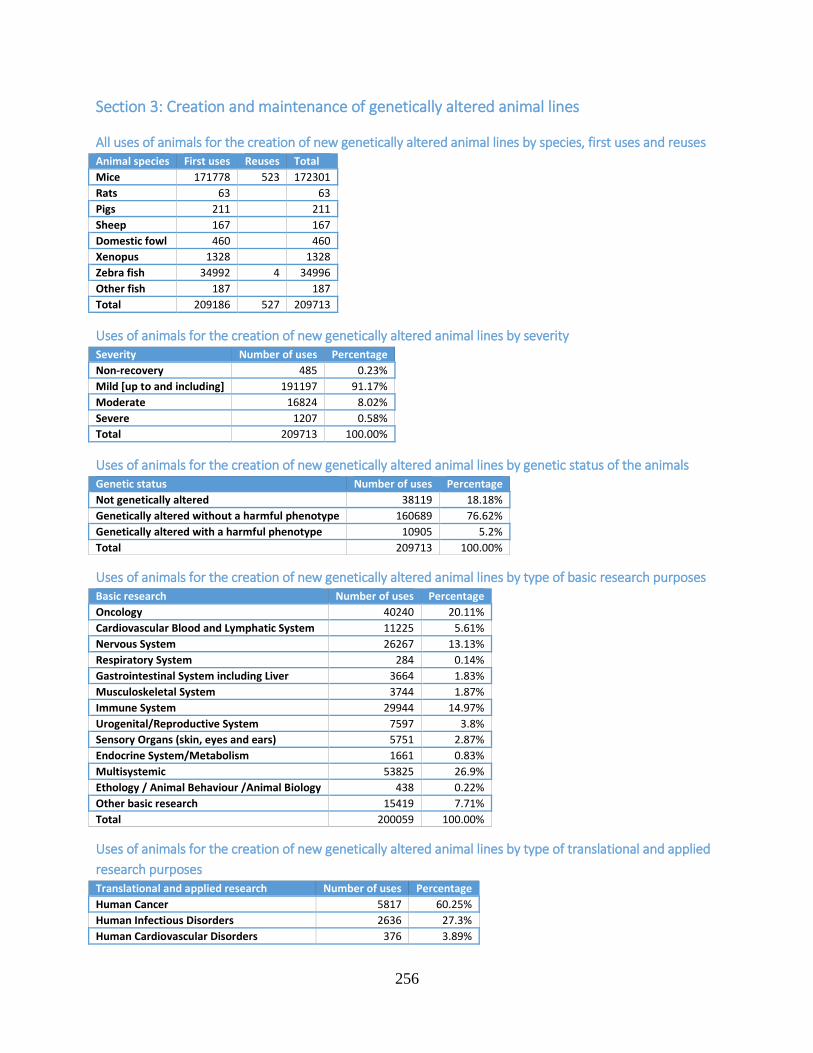
256
Section 3: Creation and maintenance of genetically altered animal lines
All uses of animals for the creation of new genetically altered animal lines by species, first uses and reuses Animal species First uses Reuses Total
Mice 171778 523 172301
Rats 63 63
Pigs 211 211
Sheep 167 167
Domestic fowl 460 460
Xenopus 1328 1328
Zebra fish 34992 4 34996
Other fish 187 187
Total 209186 527 209713
Uses of animals for the creation of new genetically altered animal lines by severity Severity Number of uses Percentage
Non-recovery 485 0.23%
Mild [up to and including] 191197 91.17%
Moderate 16824 8.02%
Severe 1207 0.58%
Total 209713 100.00%
Uses of animals for the creation of new genetically altered animal lines by genetic status of the animals Genetic status Number of uses Percentage
Not genetically altered 38119 18.18%
Genetically altered without a harmful phenotype 160689 76.62%
Genetically altered with a harmful phenotype 10905 5.2%
Total 209713 100.00%
Uses of animals for the creation of new genetically altered animal lines by type of basic research purposes Basic research Number of uses Percentage
Oncology 40240 20.11%
Cardiovascular Blood and Lymphatic System 11225 5.61%
Nervous System 26267 13.13%
Respiratory System 284 0.14%
Gastrointestinal System including Liver 3664 1.83%
Musculoskeletal System 3744 1.87%
Immune System 29944 14.97%
Urogenital/Reproductive System 7597 3.8%
Sensory Organs (skin, eyes and ears) 5751 2.87%
Endocrine System/Metabolism 1661 0.83%
Multisystemic 53825 26.9%
Ethology / Animal Behaviour /Animal Biology 438 0.22%
Other basic research 15419 7.71%
Total 200059 100.00%
Uses of animals for the creation of new genetically altered animal lines by type of translational and applied
research purposes Translational and applied research Number of uses Percentage
Human Cancer 5817 60.25%
Human Infectious Disorders 2636 27.3%
Human Cardiovascular Disorders 376 3.89%

257
Human Nervous and Mental Disorders 374 3.87%
Human Musculoskeletal Disorders 15 0.16%
Human Immune Disorders 35 0.36%
Human Urogenital/Reproductive Disorders 229 2.37%
Other Human Disorders 155 1.61%
Animal Diseases and Disorders 17 0.18%
Total 9654 100.00%
All uses of animals for the maintenance of established genetically altered animal lines by species Animal species First uses Reuses Total uses
Mice 307839 279 308118
Rats 2769 2769
Sheep 6 6
Domestic fowl 278 278
Xenopus 336 55 391
Zebra fish 90242 90242
Other fish 191 191
Total 401661 334 401995
Uses of animals for the maintenance of established genetically altered animal lines by severity Severity Number of uses Percentage
Non-recovery 20 0%
Mild [up to and including] 340902 84.8%
Moderate 24332 6.05%
Severe 36741 9.14%
Total 401995 100.00%
Uses of animals for the maintenance of established genetically altered animal lines by genetic status of the
animals Genetic status Number of uses Percentage
Not genetically altered 18231 4.54%
Genetically altered without a harmful phenotype 330940 82.32%
Genetically altered with a harmful phenotype 52824 13.14%
Total 401995 100.00%

258
Norway
Norway: Narrative 2018
1. General information on any changes in trends observed since the previous reporting period.
2018 is the first EU reporting period for Norway, so no comparison with previous EU reports can be
made.
2. Information on significant increase or decrease in use animals in any of the specific areas and
analysis of the reasons thereof.
2018 is the first EU reporting period for Norway, so no comparison with previous EU reports can be
made.
3. Information on any changes in trends in actual severities and analysis of the reasons thereof.
2018 is the first EU reporting period for Norway, so no comparison with previous EU reports can be
made
4. Particular efforts to promote the principle of replacement, reduction and refinement and its
impacts on statistics if any.
We have an extensive dialog with the applicant while evaluating the application, often resulting in
refinements and sometimes also reductions. This is however hard to show in statistics.
5. Further breakdown on the use of "other" categories if a significant proportion of animal use is
reported under this category.
Of other species of fish around 59,3 % were salmon, followed by cod (23%), other marine fish (15,9%),
other salmonides (1,6%) and other fresh water species (0,1%).
6. Details on cases where the 'severe' classification is exceeded, whether pre-authorised or not,
covering the species, numbers, whether prior exemption was authorised, the details of the use and
the reasons why 'severe' classification was exceeded.
We have no cases where 'severe' classification is exceeded.

259
Norway: Statistical Data 2018
Section 1: Numbers of animals used for the first time for research, testing, routine
production and educational (including training) purposes
Numbers of animals used for the first time by species
Animal species Number of animals Percentage
Mice 52300 3.17%
Rats 5104 0.31%
Guinea-Pigs 378 0.02%
Other rodents 2251 0.14%
Rabbits 18 0%
Cats 4 0%
Dogs 139 0.01%
Other carnivores 204 0.01%
Horses, donkeys and cross-breeds 2 0%
Pigs 669 0.04%
Goats 25 0%
Sheep 3174 0.19%
Cattle 1305 0.08%
Other mammals 1918 0.12%
Domestic fowl 1762 0.11%
Other birds 13053 0.79%
Reptiles 20 0%
Rana 2 0%
Other amphibians 186 0.01%
Zebra fish 33660 2.04%
Other fish 1534373 92.96%
Total 1650547 100.00%
Place of birth of animals other than non-human primates
Place of birth Number of animals Percentage
Animals born in the EU at a registered breeder 1420323 86.05%
Animals born in the EU but not at a registered breeder 166452 10.08%
Animals born in rest of Europe 60091 3.64%
Animals born in rest of world 3681 0.22%
Total 1650547 100.00%
Source of non-human primates
NHP Source (origin) Number of animals Percentage
No data reported
Generation of non-human primates
NHP Generation Number of animals Percentage
No data reported

260
Section 2: Numbers of all uses of animals for research, testing, routine production and
educational (including training) purposes
First use versus reuses
Animal species First uses Reuses Total
Mice 52300 3378 55678
Rats 5104 2 5106
Guinea-Pigs 378 378
Other rodents 2251 2251
Rabbits 18 18
Cats 4 4
Dogs 139 6 145
Other carnivores 204 204
Horses, donkeys and cross-breeds 2 1 3
Pigs 669 7 676
Goats 25 25
Sheep 3174 15 3189
Cattle 1305 52 1357
Other mammals 1918 65 1983
Domestic fowl 1762 1762
Other birds 13053 38 13091
Reptiles 20 20
Rana 2 2
Other amphibians 186 186
Zebra fish 33660 4500 38160
Other fish 1534373 8800 1543173
Total 1650547 16864 1667411
Uses of animals in research, testing, routine production and education (including training) by main
categories of scientific purposes
Purpose Category Number of uses
Percentage
Basic Research 852927 51.15%
Translational and applied research 751124 45.05%
Regulatory use and Routine production 34728 2.08%
Protection of the natural environment in the interests of the health or welfare of human beings or animals
17858 1.07%
Preservation of species 9497 0.57%
Higher education or training for the acquisition, maintenance or improvement of vocational skills
1026 0.06%
Forensic enquiries 251 0.02%
Total 1667411 100.00%
Basic research related uses
Basic research Number of uses Percentage
Oncology 17340 2.03%
Cardiovascular Blood and Lymphatic System 11563 1.36%
Nervous System 31905 3.74%
Respiratory System 507 0.06%
Gastrointestinal System including Liver 5003 0.59%

261
Basic research Number of uses Percentage
Musculoskeletal System 181 0.02%
Immune System 30969 3.63%
Urogenital/Reproductive System 1171 0.14%
Sensory Organs (skin, eyes and ears) 470 0.06%
Endocrine System/Metabolism 6510 0.76%
Multisystemic 113495 13.31%
Ethology / Animal Behaviour /Animal Biology 596267 69.91%
Other basic research 37546 4.4%
Total 852927 100.00%
Translational and applied research related uses
Translational and applied research Number of uses Percentage
Human Cancer 8760 1.17%
Human Infectious Disorders 472 0.06%
Human Cardiovascular Disorders 238 0.03%
Human Nervous and Mental Disorders 1985 0.26%
Human Gastrointestinal Disorders including Liver 35 0%
Human Immune Disorders 326 0.04%
Human Endocrine/Metabolism Disorders 350 0.05%
Other Human Disorders 121 0.02%
Animal Diseases and Disorders 671497 89.4%
Animal Welfare 67283 8.96%
Diagnosis of diseases 39 0.01%
Non-regulatory toxicology and ecotoxicology 18 0%
Total 751124 100.00%
Regulatory uses and Routine production
Regulatory uses and Routine production Number of uses Percentage
Quality control (incl batch safety and potency testing) 23562 67.85%
Other efficacy and tolerance testing 895 2.58%
Toxicity and other safety testing including pharmacology 2288 6.59%
Routine production 7983 22.99%
Total 34728 100.00%
Regulatory uses - Quality control (including batch safety and potency testing)
Regulatory uses - Quality control (including batch safety and potency testing) Number of uses Percentage
Batch safety testing 1746 7.41%
Batch potency testing 20283 86.08%
Other quality controls 1533 6.51%
Total 23562 100.00%
Regulatory uses - Toxicity and other safety testing including pharmacology
Regulatory uses - Toxicity and other safety testing including pharmacology Number of uses Percentage
Acute and sub-acute 40 1.75%
Kinetics 180 7.87%
Ecotoxicity 60 2.62%
Target animal safety 2008 87.76%
Total 2288 100.00%

262
Regulatory uses - Toxicity and other safety testing including pharmacology - Acute and sub-acute toxicity
testing methods
Regulatory uses - Toxicity and other safety testing including pharmacology - Acute and sub-acute toxicity testing methods
Number of uses
Percentage
LD50, LC50 40 100%
Total 40 100.00%
Regulatory uses - Toxicity and other safety testing including pharmacology - Repeated dose toxicity
Regulatory uses - Toxicity and other safety testing including pharmacology - Repeated dose toxicity
Number of uses
Percentage
No data reported
Regulatory uses - Toxicity and other safety testing including pharmacology - Ecotoxicity
Regulatory uses - Toxicity and other safety testing including pharmacology - Ecotoxicity Number of uses Percentage
Acute toxicity 60 100%
Total 60 100.00%
Regulatory uses by type of legislation
Type of legislation Number of uses Percentage
Legislation on medicinal products for human use 20115 75.21%
Legislation on medicinal products for veterinary use and their residues 6530 24.42%
Other legislation 100 0.37%
Total 26745 100.00%
Regulatory uses by origin of regulatory requirement
Origin of legislative requirement Number of uses Percentage
Legislation satisfying EU requirements 26065 97.46%
Legislation satisfying national requirements only [within EU] 580 2.17%
Legislation satisfying Non-EU requirements only 100 0.37%
Total 26745 100.00%
Routine production uses by product type
Product type Number of uses Percentage
Blood based products 12 0.15%
Other product types 7971 99.85%
Total 7983 100.00%
Uses of animals in research, testing, routine production and education (including training) by first use and
reuses
Reuse Number of uses Percentage
No 1650547 98.99%
Yes 16864 1.01%
Total 1667411 100.00%
Uses of animals in research, testing, routine production and education (including training) by severity
Severity Number of uses Percentage
Non-recovery 77095 4.62%
Mild [up to and including] 946467 56.76%
Moderate 562161 33.71%
Severe 81688 4.9%
Total 1667411 100.00%

263
Uses of animals in research, testing, routine production and education (including training) by genetic status
of animals
Genetic status Number of uses Percentage
Not genetically altered 1637243 98.19%
Genetically altered without a harmful phenotype 27008 1.62%
Genetically altered with a harmful phenotype 3160 0.19%
Total 1667411 100.00%

264
Section 3: Creation and maintenance of genetically altered animal lines
All uses of animals for the creation of new genetically altered animal lines by species, first uses and reuses
Animal species First uses Reuses Total
Mice 2282 900 3182
Zebra fish 49 49
Other fish 11800 11800
Total 14131 900 15031
Uses of animals for the creation of new genetically altered animal lines by severity
Severity Number of uses Percentage
Non-recovery 2760 18.36%
Mild [up to and including] 12269 81.62%
Moderate 2 0.01%
Total 15031 100.00%
Uses of animals for the creation of new genetically altered animal lines by genetic status of the animals
Genetic status Number of uses Percentage
Genetically altered without a harmful phenotype 14987 99.71%
Genetically altered with a harmful phenotype 44 0.29%
Total 15031 100.00%
Uses of animals for the creation of new genetically altered animal lines by type of basic research purposes
Basic research Number of uses Percentage
Oncology 490 7.86%
Nervous System 2053 32.95%
Gastrointestinal System including Liver 412 6.61%
Urogenital/Reproductive System 3000 48.15%
Multisystemic 276 4.43%
Total 6231 100.00%
Uses of animals for the creation of new genetically altered animal lines by type of translational and applied
research purposes
Translational and applied research Number of uses Percentage
Animal Diseases and Disorders 8800 100%
Total 8800 100.00%
All uses of animals for the maintenance of established genetically altered animal lines by species
Animal species First uses Reuses Total uses
Mice 4177 4177
Zebra fish 9 9
Total 4186 4186
Uses of animals for the maintenance of established genetically altered animal lines by severity
Severity Number of uses Percentage
Mild [up to and including] 4186 100%
Total 4186 100.00%

265
Uses of animals for the maintenance of established genetically altered animal lines by genetic status of the
animals
Genetic status Number of uses Percentage
Genetically altered without a harmful phenotype 4155 99.26%
Genetically altered with a harmful phenotype 31 0.74%
Total 4186 100.00%

266
VII Member State comparative tables for 2018
Introduction
Based on the recalculated Member State data, three comparative tables are provided for 2018 covering:
Numbers of animals, by species, used for purposes of research, testing, routine production and education (including training)
Numbers of all uses (first and any subsequent reuse) of animals, by species, for the purposes of research, testing, routine
production and education (including training)
Numbers and uses of animals, by species, for the creation and maintenance of genetically altered animals
All comparative tables include the 28 Member States of the Union in 2018, and Norway.

267
Table 1.1: Numbers of animals used for the first time for research, testing, routine production and educational purposes by species and Member State (Part 1) (2018)
AT BE BG CY CZ DE DK EE EL ES FI FR HR HU IE
Mammals
Rodents
Mice 161,338 290,477 1,176 1,461 67,527 1,104,144 172,248 1,333 23,768 411,189 47,444 1,073,232 18,295 52,116 149,256
Rats 3,805 18,902 1,861 0 21,270 214,039 36,360 295 1,769 51,183 10,890 150,225 6,873 22,951 21,595
Guinea-Pigs 484 14,006 1,800 0 1,188 13,946 2,659 0 16 9,289 1 41,678 12 4,850 589
Hamsters (Syrian) 162 772 0 0 24 932 292 0 0 669 72 5,193 0 0 0
Hamsters (Chinese) 0 0 0 0 0 0 0 0 0 0 0 20 0 0 0
Mongolian gerbil 0 105 0 0 49 3,283 0 0 0 0 0 596 0 0 0
Other rodents 842 55 0 0 717 2,895 13 0 0 539 2,539 2,311 0 0 0
Rabbits
Rabbits 3,111 61,504 293 0 2,555 81,185 3,116 12 402 18,932 186 129,357 250 1,957 171
Carnivores
Cats 6 19 0 0 78 556 3 0 0 89 218 437 0 15 0
Dogs 77 367 25 0 425 2,108 357 0 9 856 6,180 2,569 0 369 0
Ferrets 0 0 0 0 80 69 0 0 0 130 0 28 0 0 288
Other carnivores 0 0 0 0 38 389 3,077 0 0 3 35 29 0 0 0
Farm animals
Horses, donkeys and cross-breeds 13 233 0 0 201 431 178 0 0 112 144 122 0 10 54
Pigs 1,546 5,256 104 0 1,719 17,595 6,977 4 375 11,828 958 14,714 20 2,103 1,662
Goats 42 58 0 0 24 475 13 0 0 198 0 158 0 0 19
Sheep 42 520 0 0 499 4,613 75 0 8 2,024 1,348 3,137 10 0 644
Cattle 467 680 0 0 1,565 6,828 1,997 163 0 1,349 165 1,173 0 33 2,957
Non-human primates
Prosimians 0 0 0 0 0 11 0 0 0 0 0 159 0 0 0
Marmoset and tamarins 0 0 0 0 0 188 0 0 0 0 0 59 0 0 0
Squirrel monkey 0 0 0 0 0 25 0 0 0 0 0 0 0 0 0
Cynomolgus monkey 0 2 0 0 0 2,314 0 0 0 271 0 2,285 0 0 0
Rhesus monkey 0 5 0 0 0 51 0 0 1 0 0 34 0 0 0
Vervets (Chlorocebus spp.) 0 0 0 0 0 0 0 0 0 0 0 16 0 0 0
Baboons 0 0 0 0 0 10 0 0 0 3 0 17 0 0 0
Other species of old world monkeys (Cercopithecoidea)
0 0 0 0 0 0 0 0 0 0 0 22 0 0 0
Other mammals
Other mammals 80 102 0 0 130 1,423 28 0 0 179 319 89 0 0 1
Birds
Domestic fowl 2,302 39,184 60 0 20,333 22,596 2,283 67 656 79,631 5,468 45,210 275 28,326 30
Other birds 323 6,163 0 0 1,364 6,909 559 72 0 2,446 1,063 28,798 0 786 654
Reptiles
Reptiles 0 54 0 0 263 146 155 0 0 192 30 18 0 0 0
Amphibians
Rana 0 0 1,420 0 0 834 809 0 0 0 0 256 0 0 0
Xenopus 448 810 0 0 20 1,464 429 0 0 1,246 0 8,844 0 0 42
Other amphibians 1,085 12 270 0 0 1,459 94 0 0 266 77 458 0 0 0
Fish
Zebra fish 7,370 20,380 0 0 7,215 58,144 2,028 0 63 30,174 7,339 20,457 0 781 3,054
Other fish 13,881 28,177 0 0 89,251 80,107 11,888 411 8,932 86,687 20,700 221,002 0 2,585 17,854
Cephalopods
Cephalopods 0 0 0 0 0 59 0 0 33 3,919 0 203 0 0 0
Totals
Total 197,424 487,843 7,009 1,461 216,535 1,629,228 245,638 2,357 36,032 713,404 105,176 1,752,906 25,735 116,882 198,870
% 1.9 4.6 0.1 0 2 15.4 2.3 0 0.3 6.7 1 16.6 0.2 1.1 1.9

268
Table 1.2: Numbers of animals used for the first time for research, testing, routine production and educational purposes by species and Member State (Part2) (2018)
IT LT LU LV MT NL NO PL PT RO SE SI SK UK Total %
Mammals
Rodents
Mice 330,716 1,573 7,019 2,975 0 142,687 52,300 81,028 41,745 6,758 158,425 3,841 6,666 1,094,432 5,505,169 52.1
Rats 111,057 311 111 1,093 0 90,275 5,104 27,787 5,361 3,642 14,034 235 8,878 169,340 999,246 9.5
Guinea-Pigs 13,852 15 0 0 0 11,372 378 5,596 0 380 623 0 752 6,445 129,931 1.2
Hamsters (Syrian) 288 0 0 0 0 911 0 25 0 18 39 0 0 1,416 10,813 0.1
Hamsters (Chinese) 0 0 0 0 0 0 0 0 0 0 0 0 0 0 20 0
Mongolian gerbil 0 0 0 0 0 105 0 122 0 0 0 0 9 492 4,761 0
Other rodents 698 0 0 0 0 668 2,251 5,928 37 0 41 0 0 839 20,373 0.2
Rabbits
Rabbits 12,141 31 0 36 0 13,622 18 812 55 371 1,730 6 244 10,691 342,788 3.2
Carnivores
Cats 0 0 0 0 0 69 4 7 0 0 4 0 12 37 1,554 0
Dogs 365 0 0 0 0 542 139 5 0 0 409 0 0 2,909 17,711 0.2
Ferrets 9 0 0 0 0 437 0 0 0 0 0 0 0 466 1,507 0
Other carnivores 0 0 0 0 0 84 204 216 0 0 192 0 0 308 4,575 0
Farm animals
Horses, donkeys and cross-breeds 0 0 0 0 0 84 2 18 0 0 24 0 0 86 1,712 0
Pigs 1,457 4 0 24 0 10,502 669 601 175 48 1,308 48 2 4,298 83,997 0.8
Goats 16 0 0 0 0 114 25 52 0 0 249 0 0 58 1,501 0
Sheep 96 0 0 0 0 543 3,174 447 18 109 46 45 0 4,973 22,371 0.2
Cattle 638 0 0 0 0 1,634 1,305 198 0 0 1,426 2 0 5,073 27,653 0.3
Non-human primates
Prosimians 0 0 0 0 0 0 0 0 0 0 0 0 0 0 170 0
Marmoset and tamarins 0 0 0 0 0 42 0 0 0 0 0 0 0 92 381 0
Squirrel monkey 0 0 0 0 0 0 0 0 0 0 0 0 0 0 25 0
Cynomolgus monkey 473 0 0 0 0 0 0 0 0 0 4 0 0 2,270 7,619 0.1
Rhesus monkey 0 0 0 0 0 109 0 0 0 0 10 0 0 110 320 0
Vervets (Chlorocebus spp.) 0 0 0 0 0 0 0 0 0 0 0 0 0 0 16 0
Baboons 0 0 0 0 0 0 0 0 0 0 0 0 0 0 30 0
Other species of old world monkeys (Cercopithecoidea)
0 0 0 0 0 0 0 0 0 0 0 0 0 0 22 0
Other mammals
Other mammals 25 0 0 0 0 225 1,918 388 2 0 174 0 0 861 5,944 0.1
Birds
Domestic fowl 40,382 0 0 0 0 49,131 1,762 2,352 0 114 1,153 211 237 140,049 481,812 4.6
Other birds 409 0 0 49 0 13,514 13,053 7,818 0 0 10,550 0 23 6,481 101,034 1
Reptiles
Reptiles 0 0 0 0 0 125 20 12 0 0 529 0 0 104 1,648 0
Amphibians
Rana 0 0 0 0 0 0 2 0 0 240 2 0 0 675 4,238 0
Xenopus 222 0 0 0 0 273 0 0 0 0 276 0 0 1,742 15,816 0.1
Other amphibians 0 0 0 0 0 0 186 330 0 0 2,538 0 0 768 7,543 0.1
Fish
Zebra fish 12,115 0 6,621 0 0 19,881 33,660 10,262 2,448 0 17,476 0 0 202,053 461,521 4.4
Other fish 22,124 1,352 0 240 119 25,206 1,534,373 8,781 12,474 0 25,189 50 0 92,833 2,304,216 21.8
Cephalopods
Cephalopods 46 0 0 0 0 0 0 0 8 0 0 0 0 0 4,268 0
Total 547,129 3,286 13,751 4,417 119 382,155 1,650,547 152,785 62,323 11,680 236,451 4,438 16,823 1,749,901 10,572,305 100
% 5.2 0 0.1 0 0 3.6 15.6 1.4 0.6 0.1 2.2 0 0.2 16.6 100

269
Table 2.1: All uses (first use and all subsequent reuses) of animals for research, testing, routine production and educational purposes by species and Member State (Part 1) (2018)
AT BE BG CY CZ DE DK EE EL ES FI FR HR HU IE
Mammals
Rodents
Mice 161,703 291,118 1,176 1,810 68,988 1,125,564 174,511 1,333 23,768 417,440 47,499 1,087,505 18,295 52,163 149,256
Rats 3,805 19,553 1,877 0 21,476 220,340 37,280 295 1,769 51,543 10,951 155,438 6,885 22,975 21,595
Guinea-Pigs 484 14,029 1,801 0 1,188 14,229 2,659 0 16 9,519 1 41,727 17 4,867 589
Hamsters (Syrian) 178 772 0 0 24 940 292 0 0 766 72 5,193 0 0 0
Hamsters (Chinese) 0 0 0 0 0 0 0 0 0 0 0 20 0 0 0
Mongolian gerbil 0 105 0 0 49 3,366 0 0 0 0 0 596 0 0 0
Other rodents 842 55 0 0 717 2,942 13 0 0 539 2,539 2,913 0 0 0
Rabbits
Rabbits 3,129 61,575 425 0 2,614 85,177 3,116 12 402 22,466 186 131,329 250 1,985 171
Carnivores
Cats 6 34 0 0 78 765 3 0 0 276 218 1,185 0 15 0
Dogs 113 1,684 25 0 750 3,979 370 0 21 1,132 6,297 4,214 0 428 0
Ferrets 0 0 0 0 80 91 0 0 0 130 0 28 0 0 288
Other carnivores 0 0 0 0 38 389 3,347 0 0 3 35 29 0 0 0
Farm animals
Horses, donkeys and cross-breeds 68 302 0 0 217 792 181 0 0 169 236 482 18 15 54
Pigs 1,548 5,429 104 0 2,294 18,850 7,643 4 375 11,983 958 14,969 20 2,248 1,662
Goats 42 59 0 0 28 499 13 0 0 405 0 710 0 0 19
Sheep 50 528 0 0 885 4,751 78 0 8 2,188 1,348 4,304 22 0 644
Cattle 495 850 0 0 2,886 7,307 1,999 163 0 1,572 190 2,256 0 33 3,137
Non-human primates
Prosimians 0 0 0 0 0 63 0 0 0 0 0 159 0 0 0
Marmoset and tamarins 0 0 0 0 0 219 0 0 0 0 0 206 0 0 0
Squirrel monkey 0 0 0 0 0 25 0 0 0 0 0 0 0 0 0
Cynomolgus monkey 0 2 0 0 0 2,875 0 0 0 400 0 3,009 0 0 0
Rhesus monkey 0 41 0 0 0 65 0 0 1 0 0 62 0 5 0
Vervets (Chlorocebus spp.) 0 0 0 0 0 14 0 0 0 0 0 16 0 0 0
Baboons 0 0 0 0 0 10 0 0 0 3 0 36 0 0 0
Other species of old world monkeys (Cercopithecoidea)
0 0 0 0 0 7 0 0 0 0 0 22 0 0 0
Other mammals
Other mammals 80 171 0 0 137 1,439 29 0 0 184 319 104 0 0 1
Birds
Domestic fowl 2,302 39,203 60 0 20,390 22,843 2,283 67 656 79,663 5,468 46,029 275 28,328 30
Other birds 323 6,209 0 0 1,390 7,331 559 72 0 2,494 1,063 29,095 0 786 654
Reptiles
Reptiles 0 324 0 0 263 152 155 0 0 192 30 2,120 0 0 0
Amphibians
Rana 0 0 1,420 0 0 834 809 0 0 0 0 256 0 0 0
Xenopus 449 839 0 0 20 2,434 1,389 0 0 1,246 0 9,289 0 0 42
Other amphibians 1,085 277 270 0 0 1,459 94 0 0 266 77 458 0 0 0
Fish
Zebra fish 7,370 20,381 0 0 7,215 58,144 2,028 0 63 30,909 7,339 20,661 0 2,409 3,054
Other fish 13,881 28,939 0 0 89,718 80,522 11,888 411 9,020 87,842 20,700 230,992 0 2,737 17,854
Cephalopods
Cephalopods 0 0 0 0 0 59 0 0 33 3,919 0 219 0 0 0
Total 197,953 492,479 7,158 1,810 221,445 1,668,476 250,739 2,357 36,132 727,249 105,526 1,795,631 25,782 118,994 199,050
% 1.8 4.6 0.1 0 2 15.4 2.3 0 0.3 6.7 1 16.6 0.2 1.1 1.8

270
Table 2.2: All uses (first use and all subsequent reuses) of animals for research, testing, routine production and educational purposes by species and Member State (Part2) (2018)
IT LT LU LV MT NL NO PL PT RO SE SI SK UK Total %
Mammals
Rodents
Mice 331,233 1,573 7,669 2,975 0 146,358 55,678 81,095 41,805 6,758 159,117 4,440 6,666 1,095,420 5,562,916 51.5
Rats 111,266 311 111 1,093 0 91,579 5,106 27,826 5,361 3,642 14,806 235 8,878 171,402 1,017,398 9.4
Guinea-Pigs 14,078 15 0 0 0 11,443 378 5,596 0 446 623 0 752 6,445 130,902 1.2
Hamsters (Syrian) 288 0 0 0 0 911 0 25 0 18 39 0 0 1,416 10,934 0.1
Hamsters (Chinese) 0 0 0 0 0 0 0 0 0 0 0 0 0 0 20 0
Mongolian gerbil 0 0 0 0 0 105 0 122 0 0 0 0 9 510 4,862 0
Other rodents 698 0 0 0 0 668 2,251 6,165 37 0 181 0 0 839 21,399 0.2
Rabbits
Rabbits 13,000 31 0 36 0 13,788 18 940 55 619 1,738 70 275 11,159 354,566 3.3
Carnivores
Cats 0 0 0 0 0 120 4 7 2 0 4 0 12 230 2,959 0
Dogs 441 0 0 0 0 1,016 145 8 18 0 531 0 0 4,545 25,717 0.2
Ferrets 9 0 0 0 0 475 0 0 0 0 0 0 0 466 1,567 0
Other carnivores 0 0 0 0 0 84 204 216 0 0 237 0 0 308 4,890 0
Farm animals
Horses, donkeys and cross-breeds 15 0 0 0 0 146 3 47 9 2 146 2 0 10,442 13,346 0.1
Pigs 1,526 4 0 24 0 10,594 676 603 175 48 1,579 48 2 4,403 87,769 0.8
Goats 36 0 0 0 0 125 25 59 88 0 261 0 0 58 2,427 0
Sheep 156 0 0 0 0 643 3,189 594 40 249 46 46 0 54,311 74,080 0.7
Cattle 693 0 0 0 0 3,607 1,357 202 20 3 2,394 2 0 6,128 35,294 0.3
Non-human primates
Prosimians 0 0 0 0 0 0 0 0 0 0 0 0 0 0 222 0
Marmoset and tamarins 1 0 0 0 0 45 0 0 0 0 0 0 0 113 584 0
Squirrel monkey 0 0 0 0 0 0 0 0 0 0 0 0 0 0 25 0
Cynomolgus monkey 511 0 0 0 0 0 0 0 0 0 10 0 0 2,934 9,741 0.1
Rhesus monkey 0 0 0 0 0 160 0 0 0 0 10 0 0 160 504 0
Vervets (Chlorocebus spp.) 0 0 0 0 0 0 0 0 0 0 0 0 0 0 30 0
Baboons 0 0 0 0 0 0 0 0 0 0 0 0 0 0 49 0
Other species of old world monkeys (Cercopithecoidea)
0 0 0 0 0 0 0 0 0 0 0 0 0 0 29 0
Other mammals
Other mammals 25 0 0 0 0 225 1,983 388 2 0 260 0 0 889 6,236 0.1
Birds
Domestic fowl 42,153 0 0 0 0 51,006 1,762 2,662 0 170 1,153 211 243 140,117 487,074 4.5
Other birds 409 0 0 49 0 13,884 13,091 7,991 66 0 10,625 0 23 6,978 103,092 1
Reptiles
Reptiles 0 0 0 0 0 125 20 12 0 0 529 0 0 104 4,026 0
Amphibians
Rana 0 0 0 0 0 0 2 0 0 240 2 0 0 675 4,238 0
Xenopus 245 0 0 0 0 401 0 0 15 0 298 0 0 5,384 22,051 0.2
Other amphibians 0 0 0 0 0 0 186 330 0 0 2,538 0 0 777 7,817 0.1
Fish
Zebra fish 12,115 0 6,621 0 0 19,881 38,160 10,262 2,448 0 21,265 0 0 205,183 475,508 4.4
Other fish 22,403 1,352 0 240 119 25,286 1,543,173 8,781 12,474 0 25,539 50 0 94,377 2,328,298 21.5
Cephalopods
Cephalopods 46 0 0 0 0 0 0 0 8 0 0 0 0 0 4,284 0
Total 551,347 3,286 14,401 4,417 119 392,675 1,667,411 153,931 62,623 12,195 243,931 5,104 16,860 1,825,773 10,804,854 100
% 5.1 0 0.1 0 0 3.6 15.4 1.4 0.6 0.1 2.3 0 0.2 16.9 100

271
Table 3.1: Uses of animals for the creation of new genetically altered animal lines in basic, translational and applied research by species, reuse and Member State1) (2018)
Reuse2)
AT BE CY CZ DE DK EL ES FI FR HR HU IE IT LU NL NO PL PT SE UK Total %
Mice
No 20,525 29,382 68 9,464 103,224 3,281 7,724 31,915 3,773 31,965 0 157 253 4,426 148 7,978 2,282 99 1,038 14,629 171,778 444,109 99.4
Yes 0 21 0 0 1,014 0 0 86 0 0 0 0 0 0 0 2 900 0 0 0 523 2,546 0.6
Total 20,525 29,403 68 9,464 104,238 3,281 7,724 32,001 3,773 31,965 0 157 253 4,426 148 7,980 3,182 99 1,038 14,629 172,301 446,655 100.0
Rats
No 0 239 0 141 979 0 0 1,605 0 2,489 0 0 40 18 0 0 0 21 0 632 63 6,227 99.9
Yes 0 0 0 0 0 0 0 0 0 4 0 0 0 0 0 0 0 0 0 0 0 4 0.1
Total 0 239 0 141 979 0 0 1,605 0 2,493 0 0 40 18 0 0 0 21 0 632 63 6,231 100.0
Hamsters (Syrian)
No 0 0 0 89 0 0 0 0 0 0 0 0 0 0 0 0 0 0 0 0 0 89 100.0
Yes 0 0 0 0 0 0 0 0 0 0 0 0 0 0 0 0 0 0 0 0 0 0 0.0
Total 0 0 0 89 0 0 0 0 0 0 0 0 0 0 0 0 0 0 0 0 0 89 100.0
Rabbits
No 14 0 0 0 16 0 0 0 0 258 0 36 0 0 0 0 0 0 0 0 0 324 100.0
Yes 0 0 0 0 0 0 0 0 0 0 0 0 0 0 0 0 0 0 0 0 0 0 0.0
Total 14 0 0 0 16 0 0 0 0 258 0 36 0 0 0 0 0 0 0 0 0 324 100.0
Ferrets
No 0 0 0 0 0 0 0 0 0 0 0 0 0 0 0 0 0 0 0 0 0 0 0.0
Yes 0 0 0 0 4 0 0 0 0 0 0 0 0 0 0 0 0 0 0 0 0 4 100.0
Total 0 0 0 0 4 0 0 0 0 0 0 0 0 0 0 0 0 0 0 0 0 4 100.0
Pigs
No 0 0 0 0 29 0 0 4 0 0 0 0 0 25 0 0 0 0 0 0 211 269 98.5
Yes 0 0 0 0 4 0 0 0 0 0 0 0 0 0 0 0 0 0 0 0 0 4 1.5
Total 0 0 0 0 33 0 0 4 0 0 0 0 0 25 0 0 0 0 0 0 211 273 100.0
Sheep
No 0 0 0 0 0 0 0 0 0 0 0 0 0 0 0 0 0 0 0 0 167 167 100.0
Yes 0 0 0 0 0 0 0 0 0 0 0 0 0 0 0 0 0 0 0 0 0 0 0.0
Total 0 0 0 0 0 0 0 0 0 0 0 0 0 0 0 0 0 0 0 0 167 167 100.0
Marmoset and
tamarins
No 0 0 0 0 10 0 0 0 0 0 0 0 0 0 0 0 0 0 0 0 0 10 100.0
Yes 0 0 0 0 0 0 0 0 0 0 0 0 0 0 0 0 0 0 0 0 0 0 0.0
Total 0 0 0 0 10 0 0 0 0 0 0 0 0 0 0 0 0 0 0 0 0 10 100.0
Other mammals
No 0 0 0 0 0 0 0 0 0 0 0 0 0 0 0 0 0 70 0 0 0 70 100.0
Yes 0 0 0 0 0 0 0 0 0 0 0 0 0 0 0 0 0 0 0 0 0 0 0.0
Total 0 0 0 0 0 0 0 0 0 0 0 0 0 0 0 0 0 70 0 0 0 70 100.0
Domestic fowl
No 0 0 0 100 0 0 0 0 0 0 0 0 0 0 0 0 0 0 0 0 460 560 100.0
Yes 0 0 0 0 0 0 0 0 0 0 0 0 0 0 0 0 0 0 0 0 0 0 0.0
Total 0 0 0 100 0 0 0 0 0 0 0 0 0 0 0 0 0 0 0 0 460 560 100.0
Xenopus
No 0 0 0 0 0 0 0 0 0 0 0 0 0 0 0 0 0 0 0 0 1,328 1,328 100.0
Yes 0 0 0 0 0 0 0 0 0 0 0 0 0 0 0 0 0 0 0 0 0 0 0.0
Total 0 0 0 0 0 0 0 0 0 0 0 0 0 0 0 0 0 0 0 0 1,328 1,328 100.0
Other amphibians
No 0 0 0 0 100 0 0 0 0 0 0 0 0 0 0 0 0 0 0 0 0 100 100.0
Yes 0 0 0 0 0 0 0 0 0 0 0 0 0 0 0 0 0 0 0 0 0 0 0.0
Total 0 0 0 0 100 0 0 0 0 0 0 0 0 0 0 0 0 0 0 0 0 100 100.0
Zebra fish
No 7,064 5,523 0 0 46,203 649 0 2,257 1,139 3,746 34 0 0 556 0 0 49 0 1,230 15,093 34,992 118,535 98.8
Yes 0 0 0 0 0 0 0 0 0 0 0 1,335 0 0 0 0 0 0 0 118 4 1,457 1.2
Total 7,064 5,523 0 0 46,203 649 0 2,257 1,139 3,746 34 1,335 0 556 0 0 49 0 1,230 15,211 34,996 119,992 100.0
Other fish
No 126 0 0 0 2,809 0 0 1,126 0 0 0 0 0 226 0 0 11,800 0 0 0 187 16,274 100.0
Yes 0 0 0 0 0 0 0 0 0 0 0 0 0 0 0 0 0 0 0 0 0 0 0.0
Total 126 0 0 0 2,809 0 0 1,126 0 0 0 0 0 226 0 0 11,800 0 0 0 187 16,274 100.0
All Species
No 27,729 35,144 68 9,794 153,370 3,930 7,724 36,907 4,912 38,458 34 193 293 5,251 148 7,978 14,131 190 2,268 30,354 209,186 588,062 99.3
Yes 0 21 0 0 1,022 0 0 86 0 4 0 1,335 0 0 0 2 900 0 0 118 527 4,015 0.7
Total 27,729 35,165 68 9,794 154,392 3,930 7,724 36,993 4,912 38,462 34 1,528 293 5,251 148 7,980 15,031 190 2,268 30,472 209,713 592,077 100.0

272
Table notes:
1) Table includes only those Member States that have reported data for this purpose
2) Reuse “No” = numbers of animals used for the first time;
Reuse “Yes” = all subsequent reuses;
Total = numbers of all uses.

273
Table 3.2: Uses of animals for the maintenance of colonies of established genetically altered animal lines by species, reuse and Member State1) (2018)
Reuse2)
AT BE CZ DE DK EE EL ES FI FR IE IT LU NL NO PL PT SE SK UK Total %
Mice
No 12,045 28,403 626 309,563 179 643 831 68,801 285 73,036 457 828 0 1,186 4,177 136 16,177 69 473 307,839 825,754 99.9
Yes 0 13 0 210 0 0 0 0 0 42 0 0 0 0 0 0 0 0 0 279 544 0.1
Total 12,045 28,416 626 309,773 179 643 831 68,801 285 73,078 457 828 0 1,186 4,177 136 16,177 69 473 308,118 826,298 100.0
RRats
No 0 211 0 1,492 0 0 0 1 0 1,855 0 0 0 0 0 0 9 0 259 2,769 6,596 100.0
Yes 0 0 0 0 0 0 0 0 0 0 0 0 0 0 0 0 0 0 0 0 0 0.0
Total 0 211 0 1,492 0 0 0 1 0 1,855 0 0 0 0 0 0 9 0 259 2,769 6,596 100.0
Dogs
No 0 0 0 0 0 0 0 0 0 5 0 0 0 0 0 0 0 0 0 0 5 100.0
Yes 0 0 0 0 0 0 0 0 0 0 0 0 0 0 0 0 0 0 0 0 0 0.0
Total 0 0 0 0 0 0 0 0 0 5 0 0 0 0 0 0 0 0 0 0 5 100.0
Sheep
No 0 0 0 0 0 0 0 0 0 0 0 0 0 0 0 0 0 0 0 6 6 100.0
Yes 0 0 0 0 0 0 0 0 0 0 0 0 0 0 0 0 0 0 0 0 0 0.0
Total 0 0 0 0 0 0 0 0 0 0 0 0 0 0 0 0 0 0 0 6 6 100.0
Domestic fowl
No 0 0 0 219 0 0 0 0 0 0 0 0 0 0 0 0 0 0 0 278 497 100.0
Yes 0 0 0 0 0 0 0 0 0 0 0 0 0 0 0 0 0 0 0 0 0 0.0
Total 0 0 0 219 0 0 0 0 0 0 0 0 0 0 0 0 0 0 0 278 497 100.0
Xenopus
No 0 0 0 0 0 0 0 0 0 0 0 0 0 0 0 0 0 0 0 336 336 85.9
Yes 0 0 0 0 0 0 0 0 0 0 0 0 0 0 0 0 0 0 0 55 55 14.1
Total 0 0 0 0 0 0 0 0 0 0 0 0 0 0 0 0 0 0 0 391 391 100.0
Zebra fish
No 0 0 0 3,868 0 0 0 3,052 0 720 0 0 107 54 9 0 30 0 0 90,242 98,082 100.0
Yes 0 0 0 0 0 0 0 0 0 0 0 0 0 0 0 0 0 0 0 0 0 0.0
Total 0 0 0 3,868 0 0 0 3,052 0 720 0 0 107 54 9 0 30 0 0 90,242 98,082 100.0
Other fish
No 0 0 0 494 0 0 0 0 0 768 0 0 0 0 0 0 0 0 0 191 1,453 100.0
Yes 0 0 0 0 0 0 0 0 0 0 0 0 0 0 0 0 0 0 0 0 0 0.0
Total 0 0 0 494 0 0 0 0 0 768 0 0 0 0 0 0 0 0 0 191 1,453 100.0
All Species
No 12,045 28,614 626 315,636 179 643 831 71,854 285 76,384 457 828 107 1,240 4,186 136 16,216 69 732 401,661 932,729 99.9
Yes 0 13 0 210 0 0 0 0 0 42 0 0 0 0 0 0 0 0 0 334 599 0.1
Total 12,045 28,627 626 315,846 179 643 831 71,854 285 76,426 457 828 107 1,240 4,186 136 16,216 69 732 401,995 933,328 100.0
Table notes:
1) Table includes only those Member States that have reported data for this purpose
2) Reuse “No” = numbers of animals used for the first time;
Reuse “Yes” = all subsequent reuses;
Total = numbers of all uses.


 XXX ...](https://static.fdokumen.com/doc/165x107/6331f85c7f0d9c38da013703/european-commission-brussels-xxx-2022-xxx-.jpg)