
EUROPEAN COMMISSION Strasbourg, 14.12.2021 SWD ...
174
EN EN EUROPEAN COMMISSION Strasbourg, 14.12.2021 SWD(2021) 472 final COMMISSION STAFF WORKING DOCUMENT IMPACT ASSESSMENT REPORT Accompanying the document Proposal for a REGULATION OF THE EUROPEAN PARLIAMENT AND OF THE COUNCIL on Union guidelines for the development of the trans-European transport network, amending Regulation (EU) 2021/1153 and Regulation (EU) No 913/2010 and repealing Regulation (EU) 1315/2013 {COM(2021) 812 final} - {SEC(2021) 435 final} - {SWD(2021) 471 final} - {SWD(2021) 473 final}
-
Upload
khangminh22 -
Category
Documents
-
view
0 -
download
0
Transcript of EUROPEAN COMMISSION Strasbourg, 14.12.2021 SWD ...

EN EN
EUROPEAN COMMISSION
Strasbourg, 14.12.2021
SWD(2021) 472 final
COMMISSION STAFF WORKING DOCUMENT
IMPACT ASSESSMENT REPORT
Accompanying the document
Proposal for a
REGULATION OF THE EUROPEAN PARLIAMENT AND OF THE COUNCIL
on Union guidelines for the development of the trans-European transport network,
amending Regulation (EU) 2021/1153 and Regulation (EU) No 913/2010 and repealing
Regulation (EU) 1315/2013
{COM(2021) 812 final} - {SEC(2021) 435 final} - {SWD(2021) 471 final} -
{SWD(2021) 473 final}

Table of contents
1 INTRODUCTION: POLITICAL AND LEGAL CONTEXT ..................................... 1
1.1 Political context ................................................................................................. 1
1.2 Legal and policy context ................................................................................... 2
2 PROBLEM DEFINITION .......................................................................................... 6
2.1 What are the problems? ..................................................................................... 7
2.2 What are the problem drivers? ........................................................................ 13
2.3 How will the problem evolve? ........................................................................ 24
3 WHY SHOULD THE EU ACT? .............................................................................. 27
3.1 Legal basis ....................................................................................................... 27
3.2 Subsidiarity: Necessity of EU action ............................................................... 27
3.3 Subsidiarity: Added value of EU action .......................................................... 28
4 OBJECTIVES: WHAT IS TO BE ACHIEVED? ..................................................... 29
4.1 General objectives ........................................................................................... 29
4.2 Specific objectives ........................................................................................... 31
5 WHAT ARE THE AVAILABLE POLICY OPTIONS? .......................................... 33
5.1 What is the baseline from which options are assessed? .................................. 33
5.2 Description of the policy options and measures .............................................. 36
5.2.1 Links between the problems, problem drivers and specific objectives in relation to each
policy option 46
5.2.2 Contribution of each policy option to the European Green Deal ................................... 51
5.3 Discarded policy measures at an early stage ................................................... 53
6 WHAT ARE THE IMPACTS OF THE POLICY OPTIONS? ................................. 53
6.1 Economic impacts ........................................................................................... 55
6.1.1 Investment needs ........................................................................................................... 55
6.1.2 Impacts on GDP ............................................................................................................. 57
6.1.3 Impact on SMEs ............................................................................................................ 59
6.1.4 Administrative burden ................................................................................................... 59
6.1.5 Impacts on transport activity .......................................................................................... 60
6.2 Social impacts .................................................................................................. 63
6.2.1 Impacts on employment ................................................................................................. 63
6.2.2 Road Safety .................................................................................................................... 64
6.2.3 Connectivity and cohesion, including outermost regions .............................................. 65
6.2.4 Accessibility for all users ............................................................................................... 66
6.2.5 Impacts on health ........................................................................................................... 67
6.3 Environmental impacts .................................................................................... 67
6.3.1 CO2 emission reduction ................................................................................................. 67
6.3.2 Air Pollutant emissions reduction .................................................................................. 68
6.3.3 Impacts on noise, biodiversity and water ....................................................................... 69
6.4 Impacts on resilience of the transport infrastructure incl. maintenance .......... 71
7 HOW DO THE OPTIONS COMPARE? .................................................................. 74

7.1 Effectiveness .................................................................................................... 74
7.2 Efficiency ........................................................................................................ 79
7.3 Coherence ........................................................................................................ 81
7.4 Proportionality and subsidiarity ...................................................................... 81
7.5 Summary of the comparison of options, including stakeholder views ............ 82
8 PREFERRED OPTION ............................................................................................. 83
9 HOW WILL ACTUAL IMPACTS BE MONITORED AND
EVALUATED? ......................................................................................................... 84
ANNEX 1: PROCEDURAL INFORMATION ................................................................ 86
ANNEX 2: STAKEHOLDER CONSULTATION ........................................................... 90
ANNEX 3: WHO IS AFFECTED AND HOW? ............................................................... 98
ANNEX 4: ANALYTICAL METHODS ........................................................................ 102
ANNEX 5: LINKS BETWEEN THE CONCLUSIONS OF THE TEN-T EX-
POST EVALUATION AND THE IMPACT ASSESSMENT ............................... 147
ANNEX 6: OVERVIEW OF SPECIFIC POLICY OBJECTIVES, MEASURES
AND POLICY OPTIONS ....................................................................................... 152
ANNEX 7: RESILIENCE CASE - POTENTIAL RISK OF FLOODING OF
EU27 TRANSPORT INFRASTRUCTURES ......................................................... 158
ANNEX 8: DISCARDED POLICY MEASURES ......................................................... 166
ANNEX 9: TEN-T KEY PERFORMANCE INDICATORS ......................................... 169

Glossary
Term or acronym Meaning or definition
AF Alternative Fuels
AFIR Alternative Fuels Infrastructure Regulation
CEF Connecting Europe Facility
CNC Core Network Corridors
EGD European Green Deal
ERTMS European Rail Traffic Management System
ESIF European Structural and Investment Fund
ETC European Transport Corridors
ETS Emission Trading Scheme
GHG Greenhouse Gases
GT Gross Tonnage
HDV Heavy Duty Vehicle
IA Impact Assessment
ITS Intelligent Transport Systems (ITS)
IWT Inland Waterway Transport
IWW Inland Waterways
LDV Light Duty Vehicle
MaaS Mobility as a Service
MoS Motorways of the Sea
MS Member State(s)
NAPCP National Air Pollution Control Programme
NECP National Energy and Climate Plan
OPC Open Public Consultation
OPS Onshore Power Supply
OR Outermost Region(s)
P2W Powered two wheelers
PO Policy Option
PM Particulate Matter Emissions
RFC Rail Freight Corridors
RoPax Roll-On-Roll-Off-Passenger-ship/ferry
RRF Recovery and Resilience Facility
RRT Rail-Road-Terminal
SO Specific Objective
SSMS Sustainable and Smart Mobility Strategy
SSS Short Sea Shipping
SUMP Sustainable Urban Mobility Plan
TEN-T Trans-European Transport Network

TFEU Treaty on the Functioning of the European Union
VOC Volatile Organic Compounds Emissions
WFD Water Framework Directive

1
1 1 INTRODUCTION: POLITICAL AND LEGAL CONTEXT
This impact assessment (IA) accompanies a legislative proposal for the revision of
Regulation (EU) 1315/2013 – Union guidelines for the development of the trans-
European transport network (TEN-T). The aim of the TEN-T Regulation is to build an
effective EU-wide and multimodal transport infrastructure network across the European
Union.
1.1 1.1 Political context
The European Green Deal1, adopted by the European Commission in December 2019,
puts climate action at its core, by setting an EU climate neutrality objective by 2050. In
the domain of transport, the European Green Deal (EGD) calls for a 90% reduction in
greenhouse gas emissions from transport in order for the EU to become a climate-neutral
economy by 2050, while working towards the zero-pollution ambition2. It also calls for
shifting a substantial part of the 75% of inland freight carried today by road to rail and
inland waterways. Short-sea shipping and zero-emission vehicles can also contribute to
greening freight transport. The transport sector should also contribute to the objectives of
the biodiversity strategy for 2030 which aims to put Europe's biodiversity on a path to
recovery by 2030.
To achieve this systemic change, the Sustainable and Smart Mobility Strategy (SSMS)3
sets out the need to: (1) make all transport modes more sustainable, (2) make sustainable
alternatives widely available in a multimodal transport system and (3) put in place the
right incentives to drive the transition. As regards the second pillar, the SSMS sets the
following concrete milestones: rail freight traffic will increase by 50% by 2030 and
double by 2050; transport by inland waterways and short sea shipping will increase by
25% by 2030 and by 50% by 2050; traffic on high-speed rail will double by 2030 and
triple by 2050; scheduled collective travel under 500 km should be carbon-neutral by
2030 within the EU; by 2030, there will be at least 100 climate-neutral cities in Europe.
To create the enabling conditions in terms of infrastructure for such systemic change, the
revision of Regulation (EU) 1315/2013, including all delegated Regulations and
delegated acts that followed its adoption4, is a key action of both the EGD and the
SSMS5. It is part of a package of legislative initiatives aiming at contributing to the goals
of decarbonisation, digitalisation and higher resilience of transport infrastructure. Next to
the revision of the TEN-T Regulation, there will be the review of the Intelligent
Transport Systems (ITS) Directive and the urban mobility package – all due by the end of
1 COM(2019)640 final 2 COM/2021/400 final Commission Communication “Pathway to a Healthy Planet for All EU Action Plan:
'Towards Zero Pollution for Air, Water and Soil'” 3 COM (2020)789 final 4 Since the entry into force of Regulation (EU) 1315/2013, the European Commission adopted delegated
Regulations, aiming to adapt the maps of the network to evolving conditions. 5 Action 55 of the Sustainable and Smart Mobility Strategy: Revision of the Regulation on the Trans-
European Transport Network (TEN-T)

2
2021. Closely related to TEN-T is also the revision of the Alternative Fuels Infrastructure
Directive into a new Regulation (AFIR) as part of the ‘Delivering the European Green
Deal’ initiatives that have been presented in July 2021.
1.2 1.2 Legal and policy context
“Connecting Europe” is the very purpose of the TEN-T. The TEN-T policy as defined in
the Regulation is about connecting businesses and economic operators by creating the
arteries that are necessary for smooth passenger and freight transport flows, which are in
return vital for the internal market. TEN-T is about connecting European citizens, since it
allows for better and faster transport connections throughout Europe, and especially
crossing the borders. It is about connecting regions since the TEN-T ensure economic,
social and territorial cohesion by improving the accessibility across the EU, including a
better connectivity of the outermost regions and other remote, insular, peripheral and
mountainous regions as well as sparsely populated areas. It is also about connecting
Europe with the rest of the world, since transport connections to our neighbouring and
other third countries are of paramount importance for accessing world markets and
making Europe a strong global actor. And finally it is about connecting funding and
financing since the TEN-T Regulation defines the priorities and conditions for
(European) funding and financing decisions.
The TEN-T Regulation provides a key legal basis for infrastructure-related measures for
all forms of transport in the EU and aims at creating a multimodal network of rail, inland
waterways, short sea shipping routes and roads which are linked to urban nodes,
maritime and inland ports, airports and terminals across the EU. The TEN-T is hence the
very basis for an infrastructural response to enable sustainable forms of transport, to
provide for improved multimodal and interoperable transport solutions and for an
enhanced intermodal integration of the entire logistic chain.
The TEN-T Regulation translates the overall purpose of a European multimodal transport
system into four specific objectives6: 1) Contribution to the cohesion of the Union; 2)
Contribution to the efficiency of the transport network; 3) Contribution to the
sustainability of the transport network; 4) Increased benefits for all users of the transport
network. The main elements and features of the current TEN-T Regulation thereby are:
A Europe-wide network indicated in the maps annexed to the Regulation7 and
identified through a coherent EU-wide planning methodology8. The current TEN-T
covers around 30% of passenger inland traffic and close to 70% of freight inland
traffic9 and is composed of two multimodal network layers:
o a ‘comprehensive’ network which is the ground layer to ensure accessibility of all
European regions: it is comprised of 123,274 km of railway lines and 114,459 km
6 Regulation (EU) 1315/2013, Article 4, Objectives of the trans-European transport network 7 see: https://ec.europa.eu/transport/infrastructure/tentec/tentec-portal/site/index_en.htm 8 The planning methodology for the trans-European transport network (TEN-T) of 7 January 2014,
SWD(2013) 542 final 9 ASTRA estimates developed by M-FIVE and TRUST model estimates developed by TRT.

3
of roads, 557 ports (294 maritime ports, 223 inland ports, 40 maritime/inland
(mixed) ports), 220 Rail-Road-Terminals (RRT) and 353 airports;
o a ‘core’ network which is the part of the comprehensive network of highest
strategic importance and of highest implementation priority because it captures
the major transport flows across Europe10. The core network is comprised of
67,448 km of railway lines, 49,741 km of roads and 15,732 km of inland
waterways, 164 core ports (80 maritime, 60 inland ports and 24 maritime/inland
(mixed) ports), 116 RRT and 93 airports11.
The Regulation sets clear completion deadlines – 2030 for the core network and 2050
for the comprehensive network.
Ambitious and binding infrastructure standards and requirements for all transport
modes to achieve interoperability and quality of the network, for both comprehensive
and core network; for the latter it defines particularly high capacity and quality
standards.
Innovative implementation instruments to ensure the realisation of the core network
by 2030, i.e. nine core network corridors (CNC) as well as two horizontal priorities
(European Rail Traffic Management System (ERTMS) and Motorways of the Sea
(MoS)) led by eleven European Coordinators.12
Synergies with other EU policy instruments
As the main pillar of EU transport infrastructure policy, the TEN-T Regulation acts as
enabler and also depends on complementary policies. The standards and requirements set
in the TEN-T Regulation are directly connected with the relevant objectives and needs in
other transport sectors/fields and thus with other more sector-specific legislations (e.g.
per transport mode). This means, for example, that the TEN-T rail infrastructure – for
ensuring seamless cross-border transport and mobility – has to comply with
interoperability legislation set in railway policy. Similarly, TEN-T road infrastructure has
to take up and comply with EU legislation on road safety. The implementation of sectoral
policies also needs a strong TEN-T Regulation framework since the TEN-T provide the
infrastructure network for the implementation of other sectoral measures or other pieces
10 TRUST estimates for 2020 show that passenger inland traffic on the TEN-T core network is near 63% of
traffic of the comprehensive network and that freight inland traffic is 73% of traffic of the TEN-T comprehensive network.
11 All figures on comprehensive and core network including UK. Status 2020. 12 The nine CNC are a subset of the core network representing between 70-80% of the core network
length, depending on the transport mode. They represent the most important long-distance transport flows along the core network and consequently ensure the continuity of the most strategic EU connections. They are led by eleven European Coordinators which act as ambassadors and mediators for infrastructure planning at all territorial levels and bring together all relevant stakeholders in so called “Corridor Fora”. They aim at ensuring a better alignment of EU level and national planning and a timely implementation of the network in line with the required standards. They set out the priorities for future infrastructure planning in dedicated “work plans”. Furthermore, the Commission is empowered to adopt “implementing acts” for the cross-border and horizontal dimensions of the core network corridor work plans.

4
of legislation13, some of which however go beyond the TEN-T.
The TEN-T Regulation performance on indicators such as those related to modal shift,
better service quality, uptake of recharging/refuelling infrastructure, etc. depends on
coordinated efforts with related policy fields. This particularly relates to the synergies
between TEN-T and AFIR as well as TEN-T and ITS, since both are intrinsically
dependent on each other. For instance, the AFIR regulates the provision of
charging/fuelling points on the TEN-T whilst the TEN-T Regulation provides the
infrastructure basis for their wide deployment in a European network perspective.
Similarly, the ITS regulates the provision of intelligent transport systems on the TEN-T,
as part of a broader package of measures. Both AFIR and ITS need a definition of the
TEN-T for their implementation (i.e. a geographical scope of application), which is
provided by the maps contained in the TEN-T Regulation. These considerations also
apply to other initiatives which are part of the SSMS action plan, such as the revision of
the Rail Freight Corridor Regulation, the revision of the urban mobility package, the
launch of the NAIADES III initiative etc. The full potential on modal shift, better service
quality, uptake of recharging/refuelling infrastructure, etc. can only be achieved when
also these initiatives, including the revision of the TEN-T Regulation, are implemented
together. However, it needs to be underlined that the TEN-T Regulation (and thus its
revision) only regulates the network in its design and structure, its standards and
requirements and its governance and monitoring structure. For instance, the TEN-T
Regulation will define the alignment of the European Transport Corridors that shall
replace the Rail Freight Corridors14 and Core Network Corridors as announced in the
SSMS. In this regard, the TEN-T Regulation will already make one important step ahead
of the revision of the RFC Regulation (foreseen in 2022) which will then regulate
operational questions of rail freight transport in view of the ETC.
Funding and financing of the TEN-T
The investment needs to realise the TEN-T network under the current Regulation are
significant – about EUR 1.5 trillion for the TEN-T comprehensive network and other
transport investments up to 2050. They could never be realised with EU funding and
financing alone. Therefore, a sound mix of grants at national and EU level, of innovative
financing (e.g. blending instruments) and of private financing (e.g. loans) is needed to
realise the TEN-T in line with the standards defined in the current Regulation, but also in
13 For instance, TEN-T is the basis for the Ports Services Regulation: Regulation (EU) 2017/352 of the
European Parliament and of the Council of 15 February 2017 establishing a framework for the provision of port services and common rules on the financial transparency of ports.
14 Regulation (EU) 913/2010 concerning a European rail network for competitive freight of 9 November 2010, required Member States to establish international market-oriented Rail Freight Corridors in order to meet three main challenges: strengthening cooperation between infrastructure managers on key aspects such as the allocation of paths, deployment of interoperable systems and infrastructure development; finding the right balance between freight and passenger traffic along the RFCs, giving adequate capacity for freight in line with market needs and ensuring that common punctuality targets for freight trains are met; promoting intermodality between rail and other transport modes by integrating terminals into the corridor management process. Initially, 9 RFC were created. Their alignment can be modified as well as new RFC can be created upon initiative of Member States. To date, there are 11 RFC.

5
line with each of the policy options elaborated in this impact assessment. In terms of EU
funding, the TEN-T Regulation is directly linked to the Regulation of the Connecting
Europe Facility (CEF) as it defines the projects of common interest that are eligible under
CEF. In addition, the TEN-T infrastructure is largely funded by the European Structural
and Investment Fund (ESIF) and since recently also through the Recovery and Resilience
Facility (RRF).
Indeed, all national recovery and resilience plans (RRPs) submitted so far to the
European Commission for financing by the EU Resilience and Recovery Facility include
both reforms and investments in favour of sustainable transport. Based on those 22 plans
endorsed so far, more than 62 EJR billion has been climate tracked in the policy area of
sustainable mobility. The TEN-T network has been an important area of investment
within this field, with many investments in rail transport to both aid the modal shift and
make rail transport greener and safer. Relevant projects in RRPs relate to newly built or
upgraded railways on the TEN-T core and comprehensive networks, as well as the
reconstruction and modernisation of existing railway lines on the TEN-T networks. The
RRF can also support projects assisting multi-modality across the TEN-T network.
At the same time, the TEN-T implementation does not limit itself to EU funding only.
On the contrary, the TEN-T will be mainly realised through national funding and through
other (private) financing sources. For instance, the TEN-T implementation report for
2016 and 201715 states that the total investment made in the TEN-T network in 2016 and
2017 amounts to more than EUR 91 billion. The majority of these investments have been
met by national resources (73%). Out of the EUR 91 billion, EUR 11.5 billion were
financed through EIB loans, EUR 9.8 billion were co-funded by the European Structural
and Investment Funds (ERDF and CF) and EUR 3.1 billion by the CEF. Hence, it is clear
that a major part of funding will have to be assured by Member States who also are the
primary actors in terms of project planning.
Evaluation of the existing Regulation
The evaluation of the TEN-T Regulation (SWD(2021)117final)16 concluded that the
TEN-T provides all relevant actors (i.e. Member States, regions, cities, transport industry,
infrastructure managers of all transport modes, users) with a common policy framework
which works towards the gradual completion of the common and consistent European
transport infrastructure network. As such, it adds a European perspective to national
infrastructure planning and addresses needs and benefits beyond single national
approaches. However, the evaluation also concluded that efforts need to be stepped up in
order to reach new political targets. Indeed, since the establishment of the TEN-T
Regulation in 2013 the policy context has changed significantly, particularly through the
adoption of the EGD and the SSMS as well as the Zero Pollution Action Plan (ZPAP).
15 COM(2020)433 final 16 Evaluation of the Regulation (EU) N° 1315/2013 on Union Guidelines for the development of a trans-
European transport network, SWD (2021) 117 final of 26 May 2021; see also: Support study for the evaluation of Regulation (EU) N° 1315/2013 (https://op.europa.eu/en/publication-detail/-/publication/1f938a68-4c20-11ec-91ac-01aa75ed71a1/language-en/format-PDF/source-243058839)

6
The links between the conclusions of the ex-post evaluation (incl. the shortcomings
identified) and the impact assessment are presented in Annex 5.
2 2 PROBLEM DEFINITION
The TEN-T Regulation covers a very comprehensive, integrated and inter-sectoral field
of intervention. Indeed, it encompasses not only all forms of transport and all types of
transport nodes but also provides a harmonised framework to address a wide variety of
cross-cutting issues such as the digitalisation of and innovation in transport
infrastructure, interoperable solutions, cooperation and governance aspects for
infrastructure planning and investments as well as monitoring and reporting systems for
the TEN-T. These issues are addressed by specific policy interventions, with the TEN-T
providing for the infrastructure basis of European transport. As a result, the problems
addressed by the TEN-T revision are widespread and highly interdependent (see Figure
1) and address not only problems with regard to the TEN-T infrastructure as such (e.g. in
terms of network design, network infrastructure, standards etc.) but also with regard to
the governance of the TEN-T. To address the complexity at stake, the following problem
definition has been developed based on the results of the evaluation of the current TEN-T
Regulation and the objectives set by the Sustainable and Smart Mobility Strategy, the
Zero Pollution Action Plan and more generally the European Green Deal.
Figure 1: Overview of problem drivers and identified problems

7
2.1 2.1 What are the problems?
Due to its very broad policy nature, the TEN-T revision has inevitably to address a mix
of problems which can be grouped into four main categories:
Problem area 1: Insufficient and/or incomplete TEN-T infrastructure standards and
lack of integration of standards for alternative fuels infrastructure on the TEN-T that
does not enable higher use of more sustainable forms of transport
Transport is one of the main sources of greenhouse gas, air pollutant and noise emissions.
Transport (excluding international maritime traffic) currently accounts for almost a
quarter of all EU GHG emissions (road transport alone represents 20% of the total) and is
a major contributor to air pollution, a problem particularly acute in urban areas17. The
current TEN-T Regulation partially addressed this problem by introducing certain
infrastructure standards which render the sustainable modes of transport, i.e. rail, inland
waterways and short sea shipping, more competitive and efficient, and increase their
capacity and hence incentivize more activity in sustainable forms of transport.
The TEN-T evaluation states that future challenges of the European transport system
overall – with ambitious climate change objectives, the digital transition or a significantly
enhanced focus on user expectations – will place increasing demand on TEN-T policy.
The evaluation emphasized that the TEN-T shall keep pace with the new ambitions on
decarbonisation until 2030 and beyond by a substantial reinforcement of the concrete
measures and requirements (i.e. standards) underpinning the sustainability objective. In
this regard, a recalibration of certain standards or requirements and an integrated network
approach, centred on interoperability and efficiency increase, is needed.18
The evaluation of the current TEN-T Regulation also concluded that its potential as an
infrastructure basis for modal shift has not been fully exploited yet. For instance,
progress in implementing the existing requirement to enable the operation of freight
trains with at least 740 m length – which would significantly increase productivity and
capacity of rail freight transport and thereby the potential for modal shift – remains
unsatisfactory even on the horizon 2030. Similarly, the UNECE’s White Paper on IWT19
highlights that one of the major challenges will be to ensure good navigability conditions
on free-flowing rivers, especially due to increasingly more frequent periods of extreme
weather events and their impacts on water levels and respectively on water bound traffic.
Last but not least, the potential of short sea shipping as an alternative to road transport
within Europe has not been fully exploited yet. It lacks a concrete definition, objectives
and a coherent and integrated concept for its development in Europe.
The problem of standards also relates to their completion date. Indeed, the deadline for
completion of the comprehensive network by 2050 comes too late in order to still support
the climate law targets by 2050. Similarly, the evaluation also outlined that a
17 Sustainable and Smart Mobility Strategy (2020), SWD(2020)331 final 18 Evaluation of the TEN-T Regulation, SWD(2021)117final 19 UNECE 2020, White Paper on the Progress, Accomplishment and Future of Sustainable Inland Water
Transport

8
strengthened complementarity between core and comprehensive networks could also be
ensured through an alignment of standards and requirements in fields such as railway
infrastructure, rail safety or urban nodes. Indeed, the fact that there are differing
ambitions with regard to standards and requirements for both network layers challenges
their functional complementarity in terms of a seamless connectivity throughout the
TEN-T.
Last but not least, the TEN-T Regulation focused so far on setting standards per transport
mode, but disregarded the potential of alternative fuels deployment, even though the
TEN-T’s Europe-wide network approach offers a unique opportunity for the wide
deployment of alternative fuels. The lack of continuous and coherent coverage of
alternative fuel infrastructure for all modes of transport and across the entire TEN-T is
one great challenge and problem. TEN-T does so far not exploit this network potential
and also does not cater for the adequate infrastructure in place that is needed for the
successful deployment of alternative fuels (e.g. on safe and secure parkings on roads).
Problem area 2: Capacity bottlenecks and insufficient network connectivity to all
regions that hamper multimodality
Another problem on the TEN-T are capacity bottlenecks, an insufficient network
connectivity which hampers multimodality and a persistent poor connectivity to some
regions (in particular the outermost regions). Such capacity bottlenecks appear for all
modes of transport since passenger and freight transport volumes on the comprehensive
and core TEN-T are growing (see chapter 6.1).
This is confirmed by a study on Scenarios for the Development of Multimodal Transport
in the TRITIA20 which highlights that despite a significant number of investments
undertaken, the European Union does not have a sufficiently interconnected,
interoperable and resource-efficient cross-border multimodal transport infrastructure
network. According to the study, this is a result of the different national priorities set by
each Member State, which prevent a harmonised approach to ensure a more
interconnected infrastructure.
In the case of rail infrastructure, the length of infrastructure reaching or exceeding its
capacity limits is constantly increasing. The length of tracks declared congested by rail
infrastructure managers in the 27 Member States amounted to 2,261 kilometres in 2018
(1,339 km on lines designated to Rail Freight Corridors) – which is almost double the
figure from 201521. Bottlenecks exist mainly in major and smaller urban nodes as well as
on intensively used strategic axes on which several flows overlap on a single line. A
secondary problem making it more difficult to address the issue of capacity bottlenecks is
the lack of commonly applied, objective standards to define the capacity of rail
infrastructure and its degree of use22.
20 Kramarz et al (2020), Scenarios for the Development of Multimodal Transport in the TRITIA Cross-
Border Area 21 https://ec.europa.eu/transport/sites/default/files/com20210005-7th-rmms-report.pdf. 22 See pages 39 to 42 of the evaluation of the Rail Freight Corridor Regulation, SWD(2021) 134 final.

9
With regard to road transport, most bottlenecks appear in and/or around cities, e.g.
congested ring roads. Additionally, for rail they occur on sections where several major
domestic and cross-border traffic flows overlap, e.g. in the hinterland of major ports and
on the access lines to strategic routes such as the Alpine and Fehmarn Belt crossings. For
maritime ports, capacity bottlenecks are mainly caused during a port call which can
evolve into a potential bottleneck for the entire logistic chain. In addition, maritime links
are not sufficiently well integrated in the entire logistic chain, which is often due to a lack
of quality of last mile connections to the port – both sea-side and land-side connections,
impacting also on capacity and congestion. In terms of terminals, the distances between
rail/road terminals on the TEN-T core and comprehensive networks are still well above
300 km in many regions, limiting the possibility of short (<150 km) road legs. In
addition, the availability of terminals is not sufficient throughout Europe in such that it is
not possible to use intermodal transport.23 As regards rail and inland waterways, parts of
the EU’s TEN-T rail and inland waterway networks are not capable of handling the type
of traffic which operators and users would like to carry. Headroom is insufficient to
allow taller load units (or multiple stacks) to be moved by train or barge. Navigation
depth prevents larger barges from penetrating further upstream. Route capacity is
constrained by lack of passing sidings and level-free connecting loops on busy rail
routes, by major variations in water levels on free flowing stretches of rivers, or simply
because there are not enough links in the network. Long and slower combined transport
rail services have to share the tracks with short and faster passenger services.24
Missing links and poor connections, including between public transport and active modes
of transport, remain the main challenges for integrating the urban nodes on the TEN-T.
They can also lead to bottlenecks and congestion at peak hours due to a lack of
connectivity, and to a high degree of dependence on personal motorised transportation.25
Problem area 3: Insufficient safety and reliability of the TEN-T infrastructure
Insufficient safety and reliability of the TEN-T infrastructure is another major problem
for the efficiency of the TEN-T. Indeed, accidents caused by an inadequate safety level
of the transport network significantly add on to the problem of congestion and
disturbances of the transport system.
Safety and security are therefore at the heart of the transport system and are the
precondition to any sustainable transport system. If we look at roads, the EU had about
51 deaths annually per million inhabitants in 2019. The report “Preparatory work for an
EU Road Safety Strategy”26 states that the comprehensive TEN-T (while it only entails
around 4% of the total network (excluding urban roads) contributes to a disproportionate
11% of deaths. Even though the infrastructure as such is not formally considered one of
23 SWD(2020)331final 24 TEN-T Evaluation (case study 3 on standards: https://op.europa.eu/en/publication-detail/-
/publication/11f31ae6-4c1d-11ec-91ac-01aa75ed71a1/language-en/format-PDF/source-243059721 25 SWD(2020)331final 26 https://op.europa.eu/en/publication-detail/-/publication/bd17c6de-6549-11e8-ab9c-
01aa75ed71a1/language-en

10
the most important causing factors for accidents, higher quality roads lead to less (and
less serious) accidents.
Compared to road, rail is a very safe mode of transport, although there are still too many
fatalities involving railways (especially at level crossings). Altogether 1,721 significant
accidents, 885 fatalities and 760 serious injuries were recorded in the EU27 countries
plus UK in 2018. A steady decrease in significant accidents and resulting casualties has
been recorded in the period 2010-2018, for which harmonised data are available across
the Union27.
Next to safety related issues, the reliability of the TEN-T infrastructure is also often
hampered through man-made or natural and climate related events. The impact of
temperature increases, changes in precipitation regimes or sea-level rise affect28 –
directly or indirectly – the productivity of nearly all economic sectors in all EU Member
States, including transport. This is especially true for regions, in particular outermost
regions and other remote islands, being cut off transport links during extreme weather
events and other crisis. The recent events during the COVID-19 pandemic have also
shown how such events can heavily disrupt traffic, especially cross-border and in remote
regions, and how it can hamper the continued supply of essential goods. The limited
ability of some modes, in particular rail and inland waterways, to ensure the continuity of
traffic during major disruptions of the main network, is aggravated by the non-integration
of proper rail diversionary routes into the TEN-T as well as the difficulty to switch to
another transport mode if there is a disruption on one of them.
Another element adding on the reliability of the transport network is related to foreign
direct investments. Such investments on the TEN-T can contribute to the Union's growth
by enhancing its competitiveness, creating jobs, bringing in capital, technologies,
research and innovation, expertise, and by opening new markets for the Union's exports.
However, it has become apparent that under specific circumstances, they could distort
transport flows on the network by not complying with TEN-T standards and hence affect
security or public order on critical infrastructure. Indeed, while in principle the same
standards apply to the TEN-T infrastructure, independent of the source of financing,
experience has shown that projects with foreign direct investment have a higher risk of
not fully applying all standards. Problems have been observed in case of investments by
non-EU companies in the EU. Non-EU investors provide funding but also impose often
their own technology which is not compatible with the TEN-T requirements. For
example, there have been several cases of investments by foreign companies to develop
rail infrastructure with no installation of ERTMS. The risk of non-compliance with
technical standards, for instance by using different IT or telematics systems, is therefore
higher when the investment stems from outside the EU. This could be to the detriment of
transport activities carried out by EU operators. This issue has also been flagged in the
Council conclusions “A Globally Connected Europe” of 12 July 202129, where the
Council “notes that other key economies have developed their own approaches and tools
27 SWD(2020)331final 28 Especially maritime ports are vulnerable to sea-level rise effects 29 https://data.consilium.europa.eu/doc/document/ST-10629-2021-INIT/en/pdf

11
for connectivity and underlines the need for all such initiatives and actions to apply high
international standards.”
Greater awareness of such investments is thus necessary to allow intervention of public
authorities if it appears that they are likely to affect security or public order. Regulation
(EU) 2019/452 provides a comprehensive framework at Union level for the screening of
foreign direct investments on the grounds of security or public order30. Currently the EU
Member States are obliged to notify foreign direct investments when they are undergoing
screening pursuant to their mechanism and the Commission and other Member States
have the possibility to initiate a cooperation on foreign investments not undergoing
screening. The problem is that not all Member States have a fully-fledged screening
mechanism allowing the screening of foreign direct investments into critical transport
infrastructure. In these cases the EU Regulation does not oblige Member States to
perform such monitoring31. Only when a Member State performs a control of foreign
investments, it must inform the Commission. Last but not least, the control is limited to
matters linked to security or public order and thus addresses transport safety indirectly.
However it is not aimed at ensuring compliance with requirements like the ones in the
TEN-T Regulation (e.g. interoperability of the network).
Problem area 4: Inadequate TEN-T governance instruments and TEN-T network
design
The fourth problem area concerns on the one side the inadequate TEN-T governance
instruments and on the other side the design of the TEN-T as such.
As regards the TEN-T governance, the evaluation came to the conclusion that the current
instruments are powerful, but not entirely sufficient to address the increasing challenges
at stake, nor fully adequate to respond to new arising policy priorities. For instance, the
scope of the current governance instruments (e.g. European Coordinators’ mandates) is
not wide enough to address all new challenges and policy priorities (for instance with
regard to resilience and maintenance aspects, climate adaptation issues or the third
country dimension of TEN-T – topics and geographical zones that their current mandate
(and the related corridor studies) do not cover). The ECA has recommended to strengthen
the role of European Coordinators.32
Next to it, the current Regulation only foresees one work plan by each European
Coordinator, whilst in practice they saw the need to do an update on average every two
years as to stimulate the discussions with stakeholders and the national priority setting.
The sequencing of work plans was thus judged as not sufficient.
30 Where the Commission considers that a foreign direct investment is likely to affect programmes of
Union interest, including the trans-European transport network, on grounds of security or public order, the Commission may issue an opinion addressed to the Member State where the foreign direct investment is planned or has been completed.
31 However also the MS without a screening mechanism in place are required to comply with certain obligations, including the obligation to provide information to the Commission, when requested, and to take into account the Commission’s opinion.
32 Special Report 10/2020: EU transport infrastructures: more speed needed in megaproject implementation to deliver network effects on time

12
Most importantly however, the existing governance instruments do not sufficiently
address the problem of insufficiently aligned national priorities with TEN-T priorities.
Indeed, one major issue is that the priorities defined in the national (investment) plans
and programmes are not sufficiently aligned with the priorities set in the TEN-T
Regulation and in the Coordinators’ work plans. The related case study of the TEN-T
evaluation concluded that the national plans currently do not completely reflect Member
States’ obligations under the TEN-T Regulation with regard to network planning and
implementation. For instance, TEN-T priorities are not consistently included in national
planning and investment programmes. This is partially due to the fact that the work plans
of the European Coordinators (and hence their priorities) are not legally binding, even if
the plans are adopted by Member States. To adopt binding measures, the Commission
has made use of implementing decisions for the implementation of certain major cross-
border projects. This has been welcomed by the European Court of Auditors33, but has
not been exploited at a wider scale, due also to the limitation of the scope of this
instrument in the Regulation.
In addition, to date, no transport master plan at national level provides an overview of
current and expected TEN-T completion rates in terms of compliance with the
requirements of the TEN-T Regulation by 203034. Monitoring of progress is therefore
rendered more difficult, in particular also since several Member States report in their own
national monitoring against other deadlines than the TEN-T deadlines for completion of
the network (2030, 2050). There is also no coherent and regular reporting on national
priorities which makes the control of respect of TEN-T priorities difficult.
In terms of monitoring and reporting at EU level, the reporting landscape of the current
TEN-T contains too many elements which are not sufficiently aligned in terms of
content, frequency and scope. This leads to a distorted reporting landscape with
incomparable outputs due to the absence of coherent and harmonised definitions, data
gaps, outdated data and inconsistencies. In addition, current reporting is lacking the
coverage of new horizontal reporting priorities to reflect the EU’s political priorities,
such as digitalisation, decarbonisation, military mobility, resilience, improvement of
services. Furthermore, the process to timely get high quality data to monitor the
compliance with the TEN-T standards is cumbersome. The report from the ECA35
confirmed such shortcomings in the Commission’s monitoring tools.
As regards the TEN-T design, the current TEN-T does not fully match the new needs. For
instance, the network as defined in the current Regulation does not fully cover the needs
of cross-border rail freight transport, a fact highlighted by the differences in alignment
between the Core Network Corridors (CNC) with the Rail Freight Corridors (RFC).
Indeed, currently parts of the RFC are not on the TEN-T. Similarly, 93% of the EU
33 Special Report 10/2020: EU transport infrastructures: more speed needed in megaproject
implementation to deliver network effects on time 34 TEN-T Evaluation: support study on national plans:
https://webgate.ec.testa.eu/publications/studiesdb/Consultation.xhtml?studyProjectId=14812 35 https://www.eca.europa.eu/Lists/ECADocuments/SR20_09/SR_Road_network_EN.pdf

13
military transport network36 overlaps with the current TEN-T. Considering the costs to
build or modernise infrastructure, it is essential to ensure synergies between the two
networks by including into the TEN-T those sections of the EU military transport
network which also have a civilian use in line with the TEN-T methodology, so that
investments can serve the dual use of infrastructure.
The problems above render the monitoring and governance of TEN-T priorities difficult.
2.2 2.2 What are the problem drivers?
Several drivers underpin the above mentioned problems and result from regulatory,
technological or market barriers.
Problem Driver 1.1: Sustainable modes of transport not fully efficient and fully
attractive for users
Rail freight: The current TEN-T Regulation defines a number of standards and
requirements especially for rail freight (e.g. electrification of railway lines, train length of
740 m, 22.5t axle load, deployment of ERTMS) and inland waterway transport that aim
at providing the necessary infrastructure for an increased competitiveness and
attractiveness of these modes compared to road transport. However, since the entry into
force of the TEN-T Regulation in 2013 the modal shares of road, rail and inland
waterways have stagnated37. This indicates that efforts so far might not have been
sufficient, although infrastructure, and therefore TEN-T is not the sole driver influencing
modal choice. Many issues are stemming from operational aspects (border procedures,
national safety requirements etc.) that are out of scope of the TEN-T and for example
dealt with by the RFC Regulation or the Combined Transport Directive.
The evaluation of the TEN-T Regulation concluded that the requirements for 740 m long
trains and minimum 22.5t axle load are not yet sufficiently implemented throughout the
network and sufficient multimodal terminal infrastructure is often still lacking. Indeed,
the compliance of the network of the CNC with the 22.5t axle load requirement is at 81%
per 2017 data, with outages mainly in Romania, Hungary, Poland and Ireland. For freight
train length, the compliance versus the parameter of 740 m or longer sidings for trains is
at an average 43% per 2017 data.38 Especially infrastructure upgrades to enable the
operation of freight trains with at least 740 m length remains a significant challenge: this
is as a key requirement to enhance the productivity and capacity of rail freight transport.
The lack of progress in the implementation of this requirement means that the potential
36 Geographic data defined in tables 2.17-2.43 of the Military requirements for Military Mobility within
and beyond the EU, update (ST 10921/19), 4 July 2019, approved by the Council on 15 July and consolidated with the remaining part on 19 July (ST 11373/19) (not published in the Official Journal).
37 According to « EU transport in figures Statistical Pocketbook 2020 » the modal share of road in intra EU-27 freight transport between 2013 and 2018 increased from 50.5% to 51.0% while rail fell from 12.8% - 12.6% and inland waterway transport from 5.1% to 4.0%
38 COM(2020) 433 final

14
for modal shift remains untapped39. In addition, stakeholders in the consultations to the
evaluation40 as well as to the impact assessment indicated the lack of a clear operational
definition of the requirement. The current definition leaves broad room for interpretation,
e.g. to consider it as fulfilled if the operation of individual 740 m trains is possible during
night hours without passenger traffic. However, capacity for freight trains is also needed
during day time, including congested peak hours. In this case, the fulfilment of the
requirement requires upgrades of sidings, to ‘park’ freight trains while being overtaken
by passenger trains.
A further issue identified in the evaluation and the impact assessment work, mainly by
rail stakeholders, is that (freight) traffic does often not originate and/or terminate on the
core network but uses other comprehensive or secondary lines on its journey. Thus
stakeholders argue that applying length and weight requirements only on the core
network is insufficient to address operational and market needs.
Furthermore, the analysis revealed that the current requirements might not be sufficient
to support multimodal transport: semi-trailers are a de-facto standard for long-distance
freight transport on road, accounting for more than 95% of traffic. However, there is no
requirement on the TEN-T rail network to enable the circulation of semi-trailers of the
P400 dimension41, which optimises the use of the maximum dimensions permissible for
road vehicles in most Member States. The circulation of P400 semi-trailers is currently
not possible on a significant portion the TEN-T. Road-rail combined transport using
semi-trailers has been the most dynamically growing segment of rail freight in the last
ten years and accounts for around 20% of traffic of the major operators of intermodal
transport in the EU42. Given the prevalence of semi-trailers in road transport, a significant
potential for further modal shift remains untapped. In this context, operators providing
multimodal transport services clearly call for an additional infrastructure requirement
making the circulation of P400 intermodal loading units possible on standard wagons
throughout the rail network.
Rail passenger: The SSMS sets out how the completion of TEN-T, including the high-
speed lines, will provide better connections along the main corridors. It further notes that
when suitable alternatives are in place at competitive prices, frequencies and comfort
levels, people choose the more sustainable mode. It also underlines that the needs of all
users should be taken into consideration, including persons with disabilities, persons with
reduced mobility, and gender related aspects.43
39 740m long freight trains can increase the capacity by up to 25-30% on most networks and have the
potential to substitute 52 trucks (ERA (2021), Fostering the railway sector through the European Green Deal, Part 2 – Freight)
40 Railway experts consulted for TEN-T evaluation case study 3: https://op.europa.eu/en/publication-detail/-/publication/11f31ae6-4c1d-11ec-91ac-01aa75ed71a1/language-en/format-PDF/source-243059721
41 In accordance with UIC leaflet 596-6, the “P400” classification refers to semi-trailers with a total height of up to 4.0 m and width of 2.6 m to be transported on pocket wagons.
42 International Union for Road-Rail Combined Transport (UIRR), UIRR Annual Report 2019-20 43 Whenever the term of accessibility of “all users” is used, it includes persons with disabilities, persons
with reduced mobility, and persons travelling with small children in buggies

15
In the framework of the TEN-T evaluation stakeholders noted that TEN-T policy should
take a step forward with regard to rail passenger services. For example, there currently is
no minimum speed requirement for passenger railway lines. Notwithstanding certain
success stories like the Barcelona–Madrid44 or the Berlin–Munich high-speed lines, the
overall picture of the TEN-T for passengers is more that of a patchwork rather than a
network. This was also confirmed in the special report of the ECA on “A European high-
speed rail network: not a reality but an ineffective patchwork”45. A case study performed
under the TEN-T evaluation46 concluded that setting a minimum track-speed ambition for
passenger railway lines (e.g. 160 km/h) can provide attractive travel times and higher
connectivity if operations are coordinated and well-managed.
Inland waterways: As regards inland navigation, the Good Navigation Status study47
argues that inland waterway transport (IWT) on the TEN-T can only fulfil its
transportation role when there is sufficient capacity for cross-border European traffic,
which has not yet been achieved. Local waterway sections on the TEN-T which do not
have sufficient draught and height under bridges may prevent inland navigation from
ensuring efficient, reliable and punctual services. Such bottlenecks may hamper the
functioning of the TEN-T, undermining the full potential of inland waterway transport.
However, the evaluation of the TEN-T Regulation also found that the specificities and
hydro-morphology of inland waterways have not been taken into account in the
definition of the TEN-T standards, leading to the establishment of standards that are not
realistic in the entire flow of rivers.
Short Sea Shipping: The SSMS sets out the goal to increase transport by inland
waterways and short sea shipping by 25% by 2030 and by 50% by 2050. The TEN-T
Regulation does not yet reflect such objectives, since it does not equally address short sea
shipping (SSS) compared to the other transport modes. Indeed, in terms of SSS, only the
funding concept of Motorways of the Sea under the Connecting Europe Facility is
included in the Regulation. A modal shift from road to SSS would however require a
more coherent and integrated concept covering the entire logistic chain, better integrating
maritime links into the TEN-T, and establishing more stringent standards with regard to
the quality of last mile connections to ports, both in terms of infrastructure and digital
systems.
Problem Driver 1.2: Lack of integration of alternative fuels infrastructure on the TEN-
T hampering seamless mobility
The TEN-T will be an important enabler for the roll-out of recharging and refuelling
stations. The availability of sufficient and interoperable infrastructure providing
minimum services to consumers, is key to foster the market uptake of such vehicles and
44 Since opening this line, modal split between air and rail changed from 85% plane/15% train in 2008 to
38% air/62% rail in 2016. 45 Special report n° 19/2018: A European high-speed rail network: not a reality but an ineffective
patchwork 46 TEN-T Evaluation, case study 5: https://op.europa.eu/en/publication-detail/-/publication/af63e4a5-
4c1b-11ec-91ac-01aa75ed71a1/language-en/format-PDF/source-243059780 47 Good Navigation Status - Guidelines towards achieving a Good Navigation Status, DG MOVE, 2018

16
achieve the EU’s Climate Target Plan objectives48, as well as to reduce emissions of air
pollutants from traffic. For road transport alone, the European Green Deal sets the
objective of having at least one million publicly accessible recharging and refuelling
stations in place by 2025 that establishes a springboard for the necessary much larger
roll-out of such infrastructure until 2030, as shown in the impact assessment
accompanying the revision of the Directive on alternative fuels infrastructure into a
Regulation (AFIR). Under the AFIR, requirements for alternative fuels infrastructure
would also be foreseen for ports and for electricity supply for stationary aircrafts in
airports.
At present, the references to the alternative fuels in the TEN-T Regulation are very
general, without any stringent requirements. In principle, the infrastructure on the core
network should ensure the “availability of alternative clean fuels” for most of the
transport modes without going into much detail. Furthermore, following the revision of
the AFIR, the TEN-T Regulation will have to be brought in line with the new obligations
set out in the AFIR for the core and comprehensive network.
48 https://ec.europa.eu/clima/policies/eu-climate-action/2030_ctp_en

17
Problem Driver 2.1: Outdated definition and insufficient deployment of digital tools to
manage traffic on the entire TEN-T
The evaluation of the TEN-T Regulation found that in the current TEN-T Regulation, the
topic of digitalisation is a horizontal enabler of relevance to the specific objectives of
enhancing the efficiency of the TEN-T, making it more sustainable and increasing the
benefits for its users in all modes of transport.
However, the evaluation also identified a number of challenges with regard to
digitalisation that hamper the deployment of digital tools across the TEN-T:
There is currently no shared understanding of what digitalisation means in relation to
TEN-T policy. The current terminology used in the Regulation only refers to a
selection of telematics applications in the different modes (VTMIS, ITS, RIS,
ERTMS etc.)49. Consequently it neglects a broader range of digital systems,
applications and services beyond those already existing applications.
There is limited data available and accessible, for example concerning information
such as infrastructure conditions, the position of vehicles/vessels/wagons, cargo, and
traffic density.50
From a logistics perspective, digital infrastructure related to terminals needs to be
further developed in order to increase the efficiency and service level of terminals
and strengthen their role in the multimodal logistics chain.
Due attention needs to be paid to the integration, coherence and interoperability of
systems – between different transport modes and along the supply chain. As
digitalisation is a fast developing field, the evaluation also identified the risk of a
potential two-speed deployment to occur, where distinct differences in the level of
digitalisation appear, for example, between Northern Europe and Southern Europe, or
between Western and Eastern Europe. A more coherent TEN-T framework could help to
alleviate this problem and in addition help to avoid the occurrence of insufficient
interoperable systems between certain Member States and/or regions.
Problem Driver 2.2: Lack of full interoperability of the network
As presented under Driver 1.1, the implementation of certain infrastructure requirements
on the TEN-T is currently still insufficient, especially in a cross-border context, thus
creating bottlenecks for seamless transport flows and negatively impacting on the
interoperability of the whole TEN-T. As presented above, a further issue is that
infrastructure requirements are not consistently applied to the core and comprehensive
49 Those are systems using information, communication, navigation or positioning/localisation
technologies in order to manage infrastructure, mobility and traffic and are mostly related to vehicle connectivity applications.
50 Digital Transport and Logistics Forum, Background: http://www.dtlf.eu/sites/default/files/public/uploads/fields/page/field_file/dtlf_background_docume
nt.pdf

18
networks and thus again creating potential bottlenecks for traffic that is not originating
and terminating on the core network.
Multimodal transport terminals play a central role in ensuring interoperability of the
TEN-T. As has been identified in the evaluation of the TEN-T Regulation, in order to
fulfil this role, terminals would need to upgrade their handling capacity to ensure
competitive and seamless transport chains for intermodal services. Furthermore, their
first and last mile connections (and for ports the wider hinterland connections) ideally
need to fulfil the same requirements as the TEN-T infrastructure (e.g. 740 m train length,
electrification etc.). The evaluation concluded that this is not sufficiently addressed in the
current Regulation which does not set any binding requirements for terminals.
The evaluation also concluded that in terms of the deployment of digital tools,
interoperability needs are insufficiently addressed and that current provisions are
inappropriate to ensure the network-wide continuity of relevant requirements. This is
most apparent in the case of ERTMS where the track side deployment, a key condition
for interoperability and the enhancement of safety and more efficient capacity51 use
shows the lowest compliance rate of all TEN-T requirements (11% in 2017).52 Thus a
faster and more-wide spread implementation of ERTMS would be a precondition for rail
freight interoperability and capacity increases with a view to the objectives defined in the
EGD and SSMS.
Problem Driver 2.3: Lack of integration of urban nodes in the TEN-T Regulation
The evaluation of the TEN-T Regulation found that the current Regulation leads to
suboptimal policy results in terms of urban nodes fulfilling their full functionality for the
TEN-T (i.e. ensuring a link between urban and interregional/international traffic) and
thus foregoing potential for the contribution to the EGD objectives. Decarbonisation of
transport and reducing noise and air pollution requires an effective multimodal transport
system and accelerated development of more sustainable modes in urban areas. The
following issues can be observed with regard to urban nodes in TEN-T:
Multimodality is currently hampered by the insufficient number of efficient transfer
hubs for passengers and freight allowing for a smooth transfer between modes and
lacking possibilities for seamless door-to-door travel through integrated ticketing and
travel information as well as innovative mobility services.
Urban nodes frequently present bottlenecks for TEN-T traffic flows due to
congestion. The TEN-T does not include requirements to address this problem.
The lack of complementarity between TEN-T, the sustainable urban mobility
planning including clean and innovative solutions as well as e.g. Air Quality Plans
and Noise Action Plans.
51 ERTMS allows the reduction of minimum distances/times between trains, leading to capacity gains of
up to 30%. 52 TEN-T implementation report 2016 and 2017 COM(2020) 433 final

19
The TEN-T Regulation currently does not provide sufficient clarity of the definition of
TEN-T urban nodes. For instance, the Regulation contains a list of 79 urban nodes53
which were used to structure the TEN-T core network under the TEN-T planning
methodology whilst the Article 30 applies a functional definition of urban nodes and
refers thus to all urban nodes of the network. This, as the evaluation concluded,
weakened the contribution of the Regulation to the objectives of “user benefits” and
“sustainability”.
Problem Driver 3.1: Insufficient quality and lack of consequent maintenance of
infrastructure
The evaluation of the TEN-T Regulation concluded that while TEN-T policy has played
an important role in the development and improvement of infrastructure along the TEN-
T, the situation is less positive with regard to the reduction in the quality gaps caused by
insufficient and incoherent infrastructure monitoring and maintenance as each Member
State has a specific inspection regime in place.54 Furthermore, it concluded that
insufficient attention is paid to infrastructure quality in the process of building new and
upgrading existing infrastructure on the TEN-T.
In the case of TEN-T road infrastructure, the special report from the European Court of
Auditors on “The EU core road network“55 noted that insufficient maintenance by
Member States puts the state of the core road network at risk in the medium to long term.
National maintenance budgets are steadily decreasing rather than evolving in line with
the increasing length of infrastructure and ageing of crucial links. The report states that
although this could potentially have an impact on the full functionality of the core
network by 2030, the Commission does not have tools to verify whether Member States
have a solid system in place ensuring proper maintenance of their networks. Events in
recent years like the collapse of the bridge in Genoa in August 2018 as well as issues in
other modes of transport have increased the political attention for maintenance of
infrastructure.
This analysis was also confirmed by stakeholders in the TEN-T evaluation case study on
standards who largely agreed that applying a life-cycle approach for example to road
infrastructure, aiming to ensure continuously high-quality of TEN-T roads and including,
as necessary, aspects of preventive maintenance could contribute to further enhancing the
quality of TEN-T road infrastructure and its operation. Similar considerations apply to
others modes as well. The current provisions in the TEN-T Regulation on maintenance
are however very limited and mainly refer to the need of rehabilitation of railway lines
53 79 nodes for EU-27 (without UK); 88 nodes for EU-28 54 In the example of bridges, inspections are an important element of the life-cycle approach. Different
procedures are in place to ensure the monitoring of infrastructure in Member States. In France, they are governed by the ITSEOA (Instruction Technique pour la Surveillance et l'Entretien des Ouvrages d'Art). In Spain, there are three levels of inspections, which take place at different intervals, and in Germany, periodical structural health monitoring of bridges take place every 3 to 6 years to grade their structural health.
55 https://www.eca.europa.eu/Lists/ECADocuments/SR20_09/SR_Road_network_EN.pdf

20
neglected in the past and in the case of ports to equipment that ensures the maintenance
of port to port approaches.
Problem Driver 3.2: Lack of resilience to natural events or man-made factors
Resilience of transport networks is understood as the capacity of the infrastructure to
withstand, adapt and recover from crisis and shocks of either technical, administrative or
digital nature. It not only concerns natural disasters but also other crisis (incl. new
security requirements and new civil and environmental protection needs). Although the
current Regulation already specifies that appropriate measures should be taken to ensure
resilience to climate change and other environmental disasters, such measures are not
further specified.
Especially the concept of climate resilience is of growing importance in light of the
increasing adverse effects of climate change that affects different regions and transport
modes in different ways. In terms of infrastructure quality, climate change brings about
new challenges (such as increased precipitation, rapid and large temperature changes and
differences and the increase in the strength and frequency of extreme weather events such
as draughts, floods and hurricanes).
Various studies have analysed the impacts of climate change on the EU’s transport
system56 but reliable information for the different modes of transport or specifically for
the TEN-T are lacking. For the period 1998–2010 annual direct costs for the whole
transport sector (infrastructure repair/maintenance, vehicle damage, increased operational
costs) due to climate change have been estimated at EUR 2.5 billion. A further EUR 1
billion annually can be attributed to indirect costs from transport disruptions. Immediate
effects are the closure of a piece of infrastructure that makes it impossible for a corridor
to be used and requires the need for traffic to bypass it (e.g. on the Brenner pass57 or in
the Middle Rhine incident in March 2021)58. Rail freight transport is particularly affected
as it has limited possibilities to re-route traffic via other lines and due to interoperability
and infrastructure challenges.
Also inland waterways and short sea shipping (SSS) are vulnerable to climate change.
For instance, droughts and floods have the most disruptive impacts on inland waterways
and ports because extreme (low/high) water levels impose limitations to navigation
services59. As an example, the IA support study estimated that 108 TEN-T ports are at
risk by a 1-in-20-years river flooding event, this is 21% of all ports in the network (see
Annex 7). In addition, 10.000 km of TEN-T rail network and 6.700 km of TEN-T road
56 www.weather-project.eu and www.weather-project.eu/weather/inhalte/research-
network/ewent.php 57 ScanMed RFC Annual Report 2020 (p. 10 and 27) 58 The incident, caused by landslides in the context of heavy rainfalls, interrupted the rail freight service
on Europe’s most frequently used rail freight route for about two months. The alternative routes extend the length of freight train routes on the Rhine-Alpine corridor by up to 300 km.
59 However, low waters affect vessels’ loading degrees and cargo transport to a different degree, depending on the regions. e.g. on the Upper and Middle Rhine (Basel to Cologne), vessels’ maximum loading degrees fell to levels between 40 % and 50 %, while they remained above 60 % for the Lower Rhine (Cologne to Duisburg).

21
network would be affected. Economic losses due to flooding were estimated in the JRC
PESETA IV project which concluded that “in 2050 annual economic losses due to
flooding in the EU can be 2.7 times larger assuming a 2°C warming scenario.”60
With the COVID-19 crisis it became clear that also such types of events can have an
adverse and far reaching impact on the transport system and especially on smooth cross-
border transport operations to ensure the availability of goods and essential services.
Problem Driver 3.3: Lack of safety conditions for TEN-T road infrastructure
According to the TEN-T Regulation (Art. 17(3)) the road network shall be constituted of
either motorways or express roads or even conventional strategic roads, leaving the
choice to the Member States. In this framework, the audit of the ECA has shown
different approaches, with some Member States deciding to build exclusively motorways
while others are building all three types of road classes. As the type of road has a
significant impact on the safety features (separated lanes, level crossings, interchanges
etc.) and could also lead to bottlenecks in case a road is not continued on the other side of
the border to the same standard, a clarification and streamlining of this requirement in the
TEN-T Regulation is needed.
The same ECA report criticizes the lack of clarity concerning Art. 39(2)(c) of the TEN-T
Regulation, which requires “the development of rest areas on motorways approximately
every 100 km […] to provide appropriate parking space for commercial road users with
an appropriate level of safety and security”. The auditors suggest that it should be made
more explicit what is meant by a safe and secure parking or provide a framework which
would allow the determination of sufficient parking availability. So far Member States
have applied their own criteria to classify parking areas as safe and secure. However, the
“Study on Safe and Secure Parking Places for Trucks”61 clearly demonstrated that there
is a lack of parking areas and a need to set parking standards (net shortfall of approx.
100,000 spaces). It would thus need to be further clarified which level of safety and
security standards should apply to rest areas on TEN-T motorways and how frequent
such areas should be available throughout the network. In addition, the putting in place of
these parkings should also be an opportunity to deploy alternative fuel infrastructures
(see driver 1.2).
In principle, tunnels over 500 m on TEN-T sections need to comply with the provisions
of Directive 2004/54/EC on minimum safety requirements for tunnels in the Trans-
European Road Network62. However there is a legal uncertainty as to the binding
deadline for certain tunnels to comply with the Directive. Findings from the evaluation of
the TEN-T Regulation confirmed that the challenge of bringing all TEN-T road tunnels
over 500 m into compliance with its requirements was not yet completed and so the
minimum safety standard prescribed by the Directive is not yet fully in place.
60 Dottori et al. 2020, p.6 61 https://ec.europa.eu/transport/sites/default/files/2019-study-on-safe-and-secure-parking-places-for-
trucks.pdf 62 https://eur-lex.europa.eu/legal-content/EN/TXT/?uri=celex:32004L0054

22
Problem Driver 4.1: Multiple and insufficiently coordinated layers of network
Coordination between Core Network Corridors (CNC) and Rail Freight Corridors
(RFC): Infrastructure development and more efficient operations complement each other
in making rail freight transport more competitive. Operational solutions can often be
implemented faster and more cost-efficiently than infrastructure improvements (e.g.
improved timetables versus construction of new sidings). At the same time, some
operational issues cannot be solved without infrastructure enhancements, e.g. repeated,
systematic delays of freight trains due to congested infrastructure in urban nodes. In
addition, operational issues put at risk the benefits resulting from infrastructure
investments. An illustrative example is the question of the dwelling times of freight trains
at border stations, which in many cases are in the order of several hours on average and
annihilate any gains in transit times achievable by infrastructure investments63. As a
result, cooperation and coordination between stakeholders involved in the governance of
the RFCs and CNCs have been set up as from the creation of the CNCs. There have been
a number initiatives, good practices, going from mere exchange of information to
agreeing on activities and goals. Such cooperation has been done mainly on a corridor
basis. Nevertheless, the coexistence of two separate structures has proven to be
suboptimal for the following reasons:
There are various cases of overlapping activities, for example the RFC investment
plan or the RFC ERTMS plan that overlap to a certain extent with the CNC studies
and the CNC Work Plans.
The RFCs and CNCs are not geographically aligned making coordination more
complex64. This is due to the fact that the RFC regulation allows to add new sections
and create new RFC corridors. This also contributes to the duplication of activities.
There is therefore an important untapped potential for streamlining, increased
effectiveness and synergies. The European Coordinators could benefit more from RFC
knowledge and activities, especially in the area of infrastructure investments (e.g.
identification of priority projects, coordination of deployment of the TEN-T parameters,
in particular 740 m trains). Inversely, the RFCs could benefit more from the European
Coordinators’ political influence to progress on operational issues.
Dual use infrastructure (Military Mobility): Dual use infrastructure (Military Mobility) is
a new dimension of the TEN-T policy, as underlined by the report of the European
Parliament on the revision of the TEN-T guidelines.65 The EU military transport network
is a multimodal network, which for the most part (93%) overlaps with the TEN-T.
However, there are sections in the military transport network which are not part of the
63 See the evaluation of the RFC Regulation, https://ec.europa.eu/info/law/better-regulation/have-your-
say/initiatives/2118-Evaluation-of-the-rail-freight-network_en. 64 For the alignment of the CNC and RFC, see maps on:
https://ec.europa.eu/transport/themes/infrastructure/ten-t_en and https://ec.europa.eu/transport/themes/infrastructure/ten-t_en
65 https://www.europarl.europa.eu/doceo/document/TA-9-2021-0010_EN.html

23
TEN-T, but are also of civilian use and of European added value. These sections which
are of dual use could be included in the TEN-T as to increase synergies.
Problem Driver 4.2: National investment plans not sufficiently aligned with priorities
of the TEN-T Regulation
The study on national plans and programmes undertaken in the framework of the TEN-T
evaluation revealed that national plans currently do not completely reflect Member
States’ obligations under the TEN-T Regulation with regard to network planning and
implementation. According to the Art. 49(2) of the TEN-T Regulation, these plans and
programmes should contain abstracts allowing the Commission to assess Member States’
progress regarding the development of the TEN-T.
However, to date, none of the national plans analysed in the study presents details on
how MS are fulfilling their obligations. The TEN-T is in most cases not identified in the
plans, nor are the deadlines 2030 (core network) and 2050 (comprehensive network)
acknowledged66. This hinders an unambiguous assessment of the expected status of the
network, of possible delays in the implementation of the TEN-T objectives and
consequently renders it difficult to take the appropriate counter measures.
Problem Driver 4.3: Lack of competence of European Coordinators in certain fields
In its 2020 report on “EU transport infrastructures”67 the European Court of Auditors has
found that although the Coordinators are responsible for long and complex corridors,
they have limited resources and only informal powers at their disposal. The Court
especially criticizes the non-binding nature of work plans and the limited resources
dedicated to corridor forum meetings. It concludes that this framework gives the
Commission a too distant role in overseeing the Member States efforts in implementing
the network and putting its timely completion at risk. The Court ultimately recommends
that the role of the European Coordinators shall be strengthened by enhancing the
enforcement of the corridor work plans, by allowing their presence at key meetings of
management boards of major projects, and by improving their role in terms of
communication of the TEN-T policy objectives.
Findings from the evaluation of the TEN-T Regulation point in the same direction with
interviewees consulted in the case study on core network corridors stating that neither the
Coordinators nor the European Commission currently have the necessary tools to enforce
the prioritisation of investment on the core network vis-a-vis Member States. Reinforcing
the role of the Coordinators would also allow to address some of the issues described
under Driver 4.1 and 4.2.
66 The study found, insufficient information in the national plans of 21 Member States (78%) to
confidently conclude that the TEN-T network will be completed by 2030. For 9 Member States (33%), there is strong indication of non-completion with TEN-T requirements, due to the lack of projects to cover gaps in the network or explicit statements in the plan that certain sections will not reach compliance by 2030.
67 ECA Special Report 10/2020

24
2.3 2.3 How will the problem evolve?
Problem area 1: Insufficient and/or incomplete TEN-T infrastructure standards and lack
of integration of standards for alternative fuels infrastructure on the TEN-T
Without additional regulatory action at EU level the problem of insufficient and
incomplete TEN-T infrastructure standards as well as the lack of integration of standards
for alternative fuels infrastructure is likely to continue to exist. Indeed, as highlighted
above, the current standards are not sufficient to address the challenges of today’s TEN-T
system and to support the delivery of the SSMS milestones68.
Rail freight: Slow implementation of the 740 m criterion would persist. Furthermore,
without clarifying this requirement, Member States would continue to apply different
approaches to fulfil this parameter limiting the interoperability of the network.
Furthermore the lack of relevant requirements on the comprehensive network would
continue to weaken the attractiveness of rail freight transport as traffic often does not
originate or terminate on the core network and as the need to re-route traffic during
disruptions of the core network requires adequate infrastructure on the comprehensive
network. Finally, by not introducing a requirement making the circulation of P400
intermodal loading units throughout the network possible, a significant potential for
model shift of freight to rail would be forgone. The Coordinators’ work plans69 show
significant differences between the corridors as regards the capability of infrastructure to
run such loading units. This reduces the market potential of multimodal transport.
Rail passenger: In its audit on “A European high-speed rail network”70 the ECA
concludes that the current TEN-T for passengers is more a patchwork rather than a
network. Contributing to that is the fact that there is no requirement for a minimum line
speed on TEN-T core network passenger lines. This leads to a situation of very differing
line speeds between Member States as well as within Member States71 negatively
impacting attractive travel times and reliability of services and thus the potential of
shifting more passengers from other modes to (cross-border) rail. Without such a
minimum requirement, while catering for specific network situations, it would be very
likely that the current situation and thus the patchwork approach would persist.
Inland waterways: While it is the safest mode of transport and has significant potential to
absorb more traffic from other less sustainable modes inland waterway transport is also
very exposed to climate change effects and subject of environmental concerns. Inflexible
requirements on draught and height under bridges, which take account of the
hydrography of the inland waterway will not guarantee sufficient capacity to absorb
additional volumes. On the other hand, as is the case for all sectors of transport, if climate
68 i.e. increasing traffic on high-speed rail by 100% by 2030 and by 200% by 2050, increasing the rail
freight traffic by 50% by 2030 and by 100% by 2050; increasing the inland waterways and short sea shipping activity by 25% by 2030 and by 50% by 2050
69 https://ec.europa.eu/transport/sites/default/files/4th_workplan_nsm.pdf 70 ECA Special Report 2018 N°19 71 https://www.openrailwaymap.org/

25
change and environmental concerns (e.g. biodiversity) are not taken into account, an
unrealistic picture of the potential of IWT would be given.
Short Sea Shipping: Without a more coherent and integrated concept towards short sea
shipping covering the entire logistic chain, integrating better the maritime links into the
TEN-T, as well as more stringent standards with regard to the quality of last mile
connection of ports, the attractiveness and thus the potential of this transport mode for
modal shift would be undermined.
Alternative fuels: Without an integration of the AFIR standards in the TEN-T, the
opportunity to provide a real network perspective for the deployment of alternative fuels
across Europe would be missed out. More importantly, infrastructure needs would not be
in place to ensure full cross-border transport connectivity on the TEN-T for alternative
fuel vehicles. This will not ensure that the TEN-T Regulation supports the
decarbonisation and cleaner air objective for the transport sector, in line with the SSMS
objective.
Problem area 2: Capacity bottlenecks and insufficient network connectivity to all regions
that hamper multimodality
Without additional action, capacity bottlenecks will continue to appear and grow since
passenger and freight transport volumes on the comprehensive and core network are
generally growing while the capacity is not increasing at the same pace72.
On the infrastructure side capacity and multimodality is mainly hampered by the slow
implementation of certain standards (or the lack thereof) on the TEN-T, by a lack of
capacity in multimodal transport terminals and by the slow implementation of digital
tools such as ERTMS. By not addressing these issues this would continue to negatively
affect seamless cross-border transport flows but also flows especially around urban nodes
where TEN-T infrastructures are often heavily congested. Furthermore, additional
capacity and operational efficiency would not be gained if certain standards are not also
extended to certain sections of the comprehensive network and last mile sections to
transport nodes where most of the traffic originates or terminates.
As regards network connectivity, without clarifying the concept of “telematics
applications” to also include digital systems, applications and services beyond those
already included in the TEN-T Regulation, there would be a significant risk that systems
and (new) applications are not applied coherently and at the same speed across the EU,
potentially creating new barriers to interoperability and seamless transport operations.
Furthermore, by not introducing minimum requirements on digitalisation, for example in
terminals or ports, a significant potential for capacity and efficiency increases in such
infrastructures that are essential enablers of the multimodal logistics chain would be
foregone.
72 An illustrative example is the Rhine Alpine Corridor which is one of the busiest while at the same time
most mature core network corridors. Issues with capacity bottlenecks are highlighted in its 4th work plan: https://ec.europa.eu/transport/sites/default/files/4th_workplan_ralp.pdf

26
Finally, one of the biggest potentials in ensuring better interoperability and additional
capacity on the railways lies in the consistent implementation of ERTMS. By not
addressing the slow implementation of especially the track side deployment of this
technology, a significant potential for capacity increases without constructing new
infrastructures would remain untapped. At the same time, by not setting a clear deadline
for the de-commissioning of the national legacy systems, increase in operational
efficiencies, interoperability and reductions in costs would remain underexploited.
Problem area 3: Insufficient safety and reliability of the TEN-T infrastructure
While the underlying trend remains downward, progress has slowed sharply in most
countries since 2013. Some countries are seeing fatalities even increasing again, and the
EU target of halving the number of road deaths by 2020 (relative to the 2010 baseline)
will not be met73. An insufficient safety level and lack of reliability of the TEN-T
infrastructure would thus persist without additional EU level intervention. The TEN-T
can however be part of the solution by imposing safety standards for the transport
network, in particular the road network.
Similarly, the reliability of the TEN-T is impacted by man-made and natural or climate
related events. Such events are of increasing nature notably due to the effects of climate
change. When building infrastructure, it is therefore needed to already take into account
such potential events and plan and construct the infrastructure in a way that it resists to
such effects (e.g. no infrastructure extension in flooding areas, built-in sensors in bridges
alerting deterioration).74
Last but not least, foreign direct investments are increasing. It would become problematic
if investors decided, for example, to replace technical infrastructure standards or IT
systems of a port/airport/infrastructure facility to non-EU or non-TEN-T standards as this
may affect continuity of the TEN-T network, hence public order and security of critical
infrastructures.
Problem area 4: Inadequate TEN-T governance instruments and TEN-T network design
Without additional action taken from the side of the EU, the problem of inadequate TEN-
T governance instruments and TEN-T design would persist. This would in particular
endanger the timely implementation of the TEN-T by the given deadlines. In addition,
new arising (policy) priorities such as on greening and digitalisation would not be
covered without a strengthened and widened role of the European Coordinators.
Similarly, there would be continuous divergence between the work of the European
Coordinators on the CNC and the work of the RFC, which would lead to the situation
that unused synergies (e.g. in terms of overlapping tasks) would persist.
73 Press release: “Road safety: Europe’s roads are getting safer but progress remains too slow”
(11/06/2020);https://ec.europa.eu/transport/media/news/2020-06-11-road-safety-statistics-2019_en.
74 See also: EU Strategy on Adaptation to Climate Change, COM(2021) 82 final

27
In terms of priority setting, there is a risk that the national priorities would continue to
prevail European priorities or at least not be fully aligned. Reporting and monitoring of
the TEN-T implementation would not allow reducing the existing burden and red tape to
both Member States and the Commission. With regard to the TEN-T design, several of
the proposed policy measures (such as the creation of the European Transport Corridors)
would not be possible to be implemented without an adaptation of the TEN-T maps.
3 3 WHY SHOULD THE EU ACT?
3.1 3.1 Legal basis
The Treaty on the Functioning of the European Union (TFEU) (Articles 170-172)
stipulates the establishment and development of trans-European networks in the areas of
transport, telecommunications and energy infrastructures75. The Union shall aim at
promoting the interconnection and interoperability of national networks as well as access
to such networks. It shall take account in particular of the need to link islands, landlocked
and peripheral with the central regions of the Union (Article 170 TFEU). For this
purpose, the Union shall establish a series of guidelines covering the objectives, priorities
and broad lines of measures envisaged in the sphere of trans-European networks. These
guidelines shall identify projects of common interest, shall implement any measures that
may prove necessary to ensure the interoperability of the networks, in particular in the
field of technical standardisation and may support projects of common interest supported
by Member States. Furthermore, the Union may also contribute, through the Cohesion
Fund set up pursuant to Article 177, to the financing of specific projects in Member
States in the area of transport infrastructure. To ensure interoperability of networks
cooperation with third countries is equally foreseen (Article 171 TFEU).
3.2 3.2 Subsidiarity: Necessity of EU action
The TFEU defines that the trans-European networks shall enable citizens of the Union,
economic operators and regional communities to derive full benefit from an area without
internal frontiers. They shall also take account of the need to strengthen economic, social
and territorial cohesion of the Union and to promote its overall harmonious development.
TEN-T policy is thereby, by its nature, a policy that extends beyond Member States
borders since it focusses on a single European network scheme across borders. Such
European wide network can obviously not be established by one Member State alone. If
Member States developed infrastructure purely on their own, national interests would
often outweigh the European interest. Indeed, experience shows that Member States tend
to prioritise projects on their territory. As such, the benefits of a European sustainable
and high quality transport network would be foregone. In this case, it would be likely that
issues of cross-border connectivity and interoperability would also not be sufficiently
addressed since intra-national connections are mostly prioritised by Member States even
75 Treaty on the Functioning of the European Union, Title XVI, Trans-European Networks (Articles 170 –
172)

28
if cross-border projects are essential to exploit the benefits of the entire network and to
remove bottlenecks which generate congestion. This would not only lead to the risk of a
lack of seamless travel connectivity across Europe, but also lead to possible incoherence
of national planning approaches. In return, different standards and interoperability
requirements in different EU Member States would hamper the seamless transport flows
throughout the EU and even increase costs for transport users. Overall, a seamless TEN-
T without physical gaps, integrating intelligent and innovative solutions is key to
facilitating the internal market, achieving Cohesion objectives and – not least -
contributing to the Green Deal objectives.
3.3 3.3 Subsidiarity: Added value of EU action
Since its establishment as an EU policy in 1993, the added value of TEN-T policy overall
has always been strongly affirmed by Member States, regions, cities and industrial
stakeholders. The EU added value of TEN-T has also been one of the main conclusions
of the evaluation of the current TEN-T Regulation. Indeed, concentrating efforts towards
the creation of a common, Europe-wide transport network is clearly acknowledged as a
vision (and well progressing achievement) whose benefits go beyond isolated national
action. Ensuring a common and coherent EU-wide basis for the identification of ‘projects
of common interest’ and, correspondingly, for the alignment of planning and
implementation efforts of a wide range of actors is a clear and widely recognised added
value of TEN-T.
The TEN-T core network identifies the infrastructure which is of highest strategic
importance and of highest implementation priority because it captures the major transport
flows across Europe. Interoperability through technical standardisation is a key area of
intervention for TEN-T policy, as called for by Art 171 of the TFEU. Increasing
multimodality by increased use of railways and inland waterways requires a network
approach across all EU Member States, as those modes become very efficient over long
distances and hence for transnational transport. The interconnection of the national
networks by creating or improving cross-border connections is by its very nature of high
EU added value.
This also accounts for the dimension of urban nodes as it is important that urban traffic is
well connected with interregional and international traffic. Indeed, the role of urban
nodes on the TEN-T goes beyond the local level, as transport activities on the TEN-T
start and/or end in such nodes, or transit them, requiring good coordination between the
different levels in order to avoid bottlenecks.
However, urban mobility is and shall remain a policy mainly under the remit of the
Member States (local authorities). EU action should remain limited to aspects of urban
mobility which are connected with interregional and international traffic. This also
accounts for the maintenance of infrastructure: while maintaining infrastructure is and
will remain the main responsibility of Member States, it is essential to guarantee through
minimum rules in the TEN-T Regulation that the TEN-T will continue to provide a high
quality of services to citizens and businesses.

29
4 4 OBJECTIVES: WHAT IS TO BE ACHIEVED?
The overarching goal of the revision of the TEN-T Regulation is to support the delivery
of the objectives defined in the European Green Deal and the Sustainable and Smart
Mobility Strategy. Indeed, since the adoption of the TEN-T Regulation in 2013, the
policy context has changed substantially – the ongoing revision is thus the opportunity to
modernize the legal framework and to align it with the new political priorities. The
revision of the TEN-T Regulation will support making transport on the TEN-T greener,
more efficient and resilient by promoting more sustainable forms of transport (rail, inland
waterways and short sea shipping) and by fostering multimodality and interoperability
between them (ports, airports, rail-road terminals). The revision will also contribute to a
better integration of the urban nodes as well as the core network corridors with the rail
freight corridors. Last but not least the revision should cater for the conditions to
efficiently deploy alternative fuels and smart, digital solutions across the TEN-T and to
improve and optimise the existing governance and monitoring systems of the current
TEN-T Regulation. It should also be noted that all selected objectives received wide
support from the consulted stakeholders (see Annex 2).
4.1 4.1 General objectives
The revision of the TEN-T Regulation aims at reaching four general objectives: First of
all, it aims to enable to make transport greener in view of the 90% GHG emissions
reductions in transport and the zero pollution ambition by 2050. Indeed, the
environmental impacts induced by transport not only in terms of GHG emissions and
other air pollution emissions, but also in terms of noise or even soil pollution is a serious
problem as described in chapter 2. TEN-T can provide the appropriate infrastructure
basis as to alleviate congestion (and hence reduce emissions) and reduce GHG emissions
and pollution of air and water through incentives for more activity of sustainable forms
of transport and through the application of TEN-T standards. The coherent network of
the TEN-T thereby also offers the unique opportunity to foster integrated decarbonisation
solutions and to provide an overarching policy framework for their deployment. This also
benefits various related sectoral legislative acts, such as AFIR or the ITS Directive, as
well as future legislative initiatives. Indeed, without the appropriate infrastructure basis
and a wide network approach, alternative fuels could not be deployed efficiently since
their efficiency and acceptance by end-users depend on a wide deployment on the
transport network. The objective of ensuring that TEN-T provides the enabling
conditions for a decarbonisation of transport was ranked as most important objective in
the public consultation for all groups of stakeholders (see Annex 2).
Greening transport also means making it more biodiversity friendly. The Biodiversity
Strategy for 203076 sets important objectives in terms of protecting and restoring nature
including legal protection of a minimum of 30% of the EU’s land area and 30% of the
EU’s sea area as well as maintenance of ecological corridors and restoration of free
flowing rivers. Development of new and upgrades of existing transport infrastructure will
therefore have to be done in a way which does not jeopardise the achievement of these
76 COM(2020) 380 final

30
strategic objectives. Prioritisation of green infrastructure, e.g. in relation to protection of
ecological connectivity, can facilitate this process. Site-specific conservation objectives
will have to be used as a benchmark for authorisation of any plans of projects, which can
affect the integrity of the Natura 2000 sites.
Equally important is to facilitate seamless and efficient transport in order to better
connect people and businesses across Europe. The TEN-T Regulation needs to address
the existing capacity bottlenecks in the TEN-T, the insufficient intermodality and
interoperability links, the lack of connectivity (in particular in urban nodes and remote
areas such as the outermost regions) and lack of quality of the last mile connections. The
focus should be on research and innovation and technologies which allow for more
digital solutions which in return also positively impact the decarbonisation objectives.
The resilience of the transport network has shown to be important not only recently in the
context of the Covid-19 pandemic but also more generally over the past years. Indeed,
several natural disasters due to extreme weather events or man-made disasters (accidents,
other disturbances of the traffic) have interrupted the transport flows significantly in the
past years77. One important objective of the revision is therefore to increase the resilience
of the TEN-T to climate change and to natural or man-made disasters.
Even if the evaluation of the current TEN-T Regulation has demonstrated that the right
implementation instruments are at hand (core network corridors, work plans, etc.), the
evaluation also pointed out that there was a need to even further strengthen such tools
and to harmonise and streamline the reporting and monitoring instruments. As a cross-
cutting overall objective, the TEN-T revision will therefore aim at improving the
efficiency of the governance tools of the TEN-T Regulation.
Figure 2: Overview of general objectives and their interlinkages with specific objectives
77 e.g. rail tunnel collapse Aug.-Sept. 2017 near DE town of Rastatt; Morandi bridge collapse in Genova in
Aug 2018

31
4.2 4.2 Specific objectives
Based on the four general objectives, six specific objectives have been defined which are
highly interrelated (see Figure 2).
SO1: To provide the infrastructure basis to increase activity by more sustainable forms
of transport, notably by incentivizing rail freight and high-speed rail traffic, inland
waterways and short sea shipping in line with the milestones of the SSMS
In order to address the challenges linked to climate change and air pollution, it is
essential to decarbonise transport by boosting the uptake of more sustainable forms of
transport, notably rail, inland waterways78 and short sea shipping, by passengers and
freight operators. To this end, the milestones introduced by the SSMS are very ambitious.
The TEN-T is the ground building basis for the implementation of such ambitious goals.
Only if the right infrastructure is in place, the respective services can follow.
SO2: To ensure an improved network quality across TEN-T and to provide for
decarbonised multimodal, interoperable solutions and an optimal intermodal integration
of the entire logistic chain, including a better integration of maritime links into TEN-T
A lack of multimodality and interoperability across the 27 EU Member States and in
particularly across borders is still one important challenge to be addressed in order to
ensure seamless transport flows along the entire TEN-T. To this end, the revision of the
TEN-T Regulation shall concentrate on measures for improved multimodal and
interoperable solutions and an optimal intermodal integration of the entire logistic chain.
Here in particular the role of inland waterways and short sea shipping links but also of
ports and terminals should be better taken into account. TEN-T is unique because of its
multimodal character which needs to be further strengthened. This in return would also
help in boosting the uptake of sustainable forms of transport, including the increase of
efficiency and decarbonisation, low noise and reduced air pollution of each single mode
(see SO1).
SO3: To digitalise the infrastructure of all modes (as to limit congestion) and to improve
safety and security of transport also in view of addressing the needs of passengers and
freight
The digitalisation of infrastructure of all modes has proven to be an important element in
order to limit congestion and hence also GHG and air and water pollution emissions. The
TEN-T Regulation will support digitalisation efforts and measures – an aspect which has
not been looked at in detail back in 2013, since the technologies were not that advanced
yet as they are today. However, digitalisation not only can contribute to the
decarbonisation of transport, but is also an important element to improve the safety and
security of transport. Ensuring higher safety and security standards along the TEN-T
would in addition also contribute to more seamless transport flows since often accidents
78 Any development or upgrade of inland waterways will, have to take the multi-functionality of EU
rivers into account including their role of protecting biodiversity and contribution to the integrity of Natura 2000 sites.

32
lead to important traffic disturbances and disruptions and hence to increased costs79. It
would also contribute to a more equal access and use of the network by female users and
workers.
SO4: To reinforce the role of the urban nodes as to enable seamless passenger flows
between the TEN-T and local networks and develop multimodality in freight transport
through better integration of sustainable modes of transport
Urban mobility policy is gaining more importance in view of the achievement of the
EGD and SSMS objectives. Indeed, the European population is to a large extent
concentrated in urban agglomerations, which are therefore the origin and destination of
most traffic flows. Hence, traffic in urban nodes is particularly dense and congested,
often leading to capacity bottlenecks. It is therefore important that the last mile
connectivity not only within urban nodes, but also with the rest of the intraregional and
international transport system is of good quality and with better accessibility for all users.
This shall be addressed by better connections between short and long-distance travels
(“last mile”), e.g. through the creation of multimodal passenger hubs. In addition, the
planning at the level of TEN-T needs to be better coordinated with the planning and
development at the level of urban nodes. The interaction of urban nodes with TEN-T
shall therefore be better taken into account.
SO5: To improve the preparedness and resilience of infrastructure, including through
better maintenance and a nature-based adaptation to climate change
A well-functioning transport system depends on infrastructure that is resilient to natural
or man-made disasters. Indeed, several (important) disruptions have occurred over the
past years due to such disasters which caused severe negative impacts on the transport
flows in terms of delays and increased costs. It is therefore important that TEN-T builds
upon an infrastructure that is prepared and resilient to such events. Maintenance of the
infrastructure is in this context also of utmost importance as to prevent disruptions and
accidents.
SO6: To better align national (investment) planning with TEN-T priorities and to
increase synergies between different policy instruments (e.g. CNC vs. RFC)
TEN-T policy sets priorities of European interest and added-value. However, national
priorities are sometimes not fully aligned with European priorities. For instance, from a
European perspective it is of utmost important to enhance cross-border connections
between two EU Member States in order to allow seamless transport flows across the
EU. From a national perspective, national transport sections are however often the
prevailing priority. Apart from the priority setting, also the timing of infrastructure
investments are often not well coordinated on both sides of a border. It is therefore
crucial that there is a better alignment of national (investment) planning and
programming with the TEN-T priorities. Moreover, several instruments to foster
sustainable transport at European level co-exist (such as the urban and regional policy
79 The digitalisation of transport has also a role in increasing resilience. For instance, the digitalisation of
inland waterway transport will help in better adapting to changing water levels.

33
supported by the European Structural and Investment Funds, several European urban
initiatives (Eurocities, Urbact initiatives etc.)). It is therefore important to efficiently
exploit their synergies and avoid redundancies.
5 5 WHAT ARE THE AVAILABLE POLICY OPTIONS?
5.1 5.1 What is the baseline from which options are assessed?
The EU Reference Scenario 2020 (REF2020) represents the starting point for assessing
the options in this impact assessment. The EU Reference scenario 2020 reflects the range
of foreseen national policies and measures of the final National Energy and Climate
Plans (NECPs) that Member States submitted in 2019 according to the Governance
Regulation80. The EU Reference scenario 2020 also takes into account the impacts of the
COVID-19 pandemic that had a significant impact on the transport sector. More detailed
information about the preparation process, assumptions and results are included in the
Reference scenario publication81.
Building on the Reference scenario 2020, the Baseline scenario for this impact
assessment has been designed to include the initiatives of the ‘Delivering the European
Green Deal’ package and other measures of the MIX policy scenario82. The MIX
scenario follows a balanced approach of carbon pricing instruments and regulatory-based
measures to deliver on the ambition of at least 55% emission reductions by 2030 and
climate neutrality by 2050. The Baseline scenario is commonly used by this impact
assessment and the one underpinning the review of the ITS Directive, to ensure
consistency83.
80 Regulation (EU) 2018/1999 81 Link to webpage with publication – to be available in July. 82 The MIX scenario is broadly consistent with the initiatives proposed by the Commission on 14 July
2021. The differences are not expected to have any significant impact on the developments in transport activity and in particular on the modal shares, that are very relevant for the baseline scenario of this initiative. The common scenarios underpinning the impact assessment accompanying the 2030 Climate Target Plan and the staff working document accompanying the Sustainable and Smart Mobility Strategy have shown that strong regulatory measures are needed to drive higher use of more sustainable transport modes.
83 It should be noted that the MIX scenario underpinning the impact assessments accompanying the ‘Delivering the European Green Deal’ package covers the initiatives adopted in July 2021 but also some other initiatives of this year and of the following year (e.g. for transport, CO2 standards for heavy duty vehicles, the revision of the TEN-T Regulation, the revision of the ITS Directive, the revision of the Rail Freight Corridors Regulation and of the Combined Transport Directive, etc.). For this reason, only a few adjustments had to be made in order to provide a suitable Baseline scenario for this impact assessment. This however does not mean that the Baseline scenario deviates from the balanced approach of the MIX scenario, combining carbon pricing instruments and regulatory-based measures. These two initiatives were represented in a stylised way in the MIX scenario, ahead of the respective legislative proposals. In order to provide a meaningful Baseline for the two impact assessments, showing how the problem would evolve without further EU level intervention, it has been assumed that only the current EU level legislation (i.e. the current TEN-T Regulation and the current ITS Directive) is in place for these two initiatives. In addition, for the Rail Freight Corridors Regulation and for the Combined Transport Directive it has been assumed that only the current EU legislation is in place. This is because of the important synergies between the revision of the TEN-T

34
In terms of transport network, the Baseline scenario assumes the completion of the core
TEN-T by 2030 and of the comprehensive TEN-T by 2050 and no further EU level
intervention besides the existing TEN-T Regulation. It also assumes the full
electrification of the core TEN-T rail network by 2030 and of the comprehensive TEN-T
rail network by 2050, in line with the existing TEN-T Regulation.
The assumption of the completion of the core and comprehensive network by the given
deadlines has been made as the evaluation results showed that, overall, the completion of
the core network can be expected by 2030 or shortly after. Indeed, the evaluation
highlighted that “in spite of incoherence in the approaches to infrastructure planning and
implementation, the key TEN-T policy milestone - the completion of the core network by
2030 - heads in the right direction”. Certainly, some delays for a limited number of
projects are observed based on the very close monitoring of over 3000 projects included
in the “core network corridor project list” (a comprehensive database that is monitored
every six months and provides regular updates on the progress made in completing the
projects). However, the limited number of projects (between 40 and 50 out of over 3000
projects, according to the TEN-T evaluation results) as well as the limited delays of a few
years (which is to be considered as minor taking into consideration that the planning and
implementation of major infrastructure projects can stretch over more than 20 years and
once implemented those infrastructures last for more than 100 years) did not justify a
different baseline scenario, since the potential impacts of such delays are not significant
when looking at the overall picture. In addition, the evaluation report noted that most
Member States concerned appear confident that they will be able to remedy the current
delays. Moreover, there are already a number of existing and new instruments aiming at
addressing and solving such delays (e.g. European Coordinators, use of implementing
decisions84). Most importantly in this context, the Directive on streamlining measures for
advancing the realisation of the trans-European transport network85 will address the issue
of delays, by focussing specifically on delays due to lengthy permitting procedures. A
maximum time limit of four years will apply to the entire permit-granting process.
Member States have to transpose the Directive by August 2023. Finally, the baseline
Regulation and the forthcoming revisions of the Rail Freight Corridors Regulation and of the Combined Transport Directive, that need to be enabled by the availability of high quality infrastructure for their success. All other assumptions were kept unchanged.
84 Implementing decisions play an important role, especially for the implementation and monitoring of the major cross-border projects as well as the TEN-T horizontal priorities. A few implementing decisions were already established under the current TEN-T Regulation (e.g. for ERTMS, Rail Baltica, Seine-Escaut, Evora-Merida). These Commission decisions have been elaborated in very close collaboration with the concerned Member States and infrastructure managers. They set the exact milestones to be achieved for the completion of such projects. As such, they are also a very solid base for the monitoring of those projects since regular progress can be checked per milestone and appropriate measures taken in case of delays. When adopting these implementing decision, the Member States concerned also agreed to a regular reporting on the progress achieved. The current TEN-T Regulation only allows for the establishment of implementing decisions for major cross-border projects and the horizontal priorities, in line with Article 47(2). With the TEN-T revision (PO2 and PO3), it is planned to reinforce the use of implementing decisions and allow for its use also for single projects and/or for entire corridors. This follows up on certain recommendations made by the European Court of Auditors.
85 Directive (EU) 2021/1187

35
scenario covers the whole TEN-T (core network and comprehensive network); the risk of
not delivering on time concerns merely the core network since the deadline of 2050 for
the comprehensive network is still in too far future as to properly assess its timely
implementation.
In the Baseline scenario, EU transport activity is projected to grow post-2020, following
the recovery from the COVID pandemic. Road transport would maintain its dominant
role within the EU by 2050. Rail transport activity is projected to grow significantly
faster than for road, driven in particular by the completion of the TEN-T core network by
2030 and of the comprehensive network by 2050, supported by the CEF, Cohesion Fund
and ERDF funding, but also by the measures of the ‘‘Delivering the European Green
Deal’ package that increase the competitiveness of rail relative to road and air transport.
Passenger rail activity is projected to go up by 24% by 2030 relative to 2015 (62% for
2015-2050). High speed rail activity, in particular, would grow by 68% by 2030 relative
to 2015 (155% by 2050), missing however to deliver on the milestone of the SSMS of
doubling its traffic by 2030 and tripling it by 2050. Freight rail traffic would increase by
41% by 2030 relative to 2015 (91% for 2015-2050) also not delivering on the milestone
of the SSMS of increasing the traffic by 50% by 2030 and doubling it by 2050. Transport
activity of inland waterways and short sea shipping is projected to go up by 19% by 2030
and 44% by 2050. This however would also not be sufficient to deliver on the milestone
of the SSMS of increasing activity by 25% by 2030 and by 50% by 2050.
Congestion costs would increase by about 14% by 2030 and 30% by 2050, relative to
2015. Congestion on the inter-urban network would be the result of growing freight
transport activity along specific corridors, in particular where these corridors cross urban
areas with heavy local traffic.
CO2 emissions from transport including international aviation but excluding international
maritime, are projected to be 19% lower by 2030 compared to 2015, and 94% lower by
2050. Compared to 1990, this translates into 1% emission reduction by 2030 and around
90% reduction by 2050.86 The Baseline scenario shows that the emission reductions from
the transport sector would effectively contribute to the ambition of at least 55% emission
reductions by 2030 and climate neutrality by 2050, but this would rely to a significant
extent on technological solutions (i.e. the uptake of low- and zero-emission vehicles) and
carbon pricing. This would depart from the balanced approach of the MIX scenario
underpinning the impact assessments accompanying the ‘Delivering the European Green
Deal’ package, showing a combined approach of carbon pricing instruments and
regulatory-based measures to deliver on the increased climate ambition. This may also
result in higher carbon prices, in particular if the decrease in the costs of technology and
the uptake of low- and zero-emission vehicles would not take place at the projected
speed.
86 When accounting intra-EU aviation and maritime in the transport emissions, Baseline projections
show reductions of 21% by 2030 and 97% by 2050 relative to 2015. When all intra-EU and extra-EU aviation and maritime emissions are accounted in the transport emissions, the Baseline scenario results in 17% decrease in transport emissions by 2030 and 93% decrease by 2050 compared to 2015 levels.

36
NOx emissions are projected to go down by 56% between 2015 and 2030 (87% by
2050), mainly driven by the electrification of the road transport and in particular of the
light duty vehicles segment. The decline in particulate matter (PM2.5) would be slightly
lower by 2030 at 52% relative to 2015 (91% by 2050).
The number of fatalities is projected to be 22% lower in 2030 relative to 2015 and 27%
lower by 2050, being however far from the milestone of the SSMS of close to zero death
toll for all modes of transport in the EU by 2050. The number of serious and slight
injuries would go down at lower speed (18% for 2015-2030 and 22% for 2015-2050).
The assessment of the policy options in chapter 6 is presented against the Baseline
scenario. However, where relevant, the impacts of the policy options are also presented
against the REF2020. More detailed information on the Baseline scenario is presented in
Annex 4.
5.2 5.2 Description of the policy options and measures
In line with the elaborated intervention logic, i.e. building upon the identified problems
and problem drivers and the resulting general and specific objectives, three distinct
policy options have been defined. To define these options, numerous possible policy
measures were discussed on the basis of extensive consultations with stakeholders, expert
meetings, independent research and the Commission’s own analysis. Those possible
measures were then screened based on the likely effectiveness, efficiency and
proportionality of the proposed measures in relation to the given objectives as well as
their legal, political and technical feasibility. As a result, a set of policy measures has
been discarded (see chapter 5.2.3 and Annex 8) and the retained policy measures have
been grouped into three different policy options on which this impact assessment is
based. The relatively high number of almost 30 policy measures thereby underlines the
complexity of the TEN-T Regulation due to its multimodal nature. Figure 4 as well as
Annex 6 present the links of these retained policy measures with the specific objectives
(SO) and the policy options (PO).
All retained policy measures in the three POs are addressed to Member States since they
are in the first place responsible for transport infrastructure planning, and whenever
applicable also the regional and urban administrative level. For the implementation of the
measures, the infrastructure managers and operators of the respective transport mode as
implementing bodies as well as business and citizens as end users of the transport
infrastructure are very relevant in this regard too. All of the retained policy measures
were also consulted with the stakeholders (public consultation and targeted consultations)
and generally received a high degree of agreement (see Annex 2), with no particular
distinction amongst type of stakeholder groups.
On this basis, the three defined POs are of a successively increasing degree of ambition
and level of intervention linked to four aspects: 1) the introduction of new and/or more
ambitious TEN-T standards, 2) new/accelerated deadlines for network completion, 3)
increased network coverage and 4) governance (see Figure 3). The main difference
between PO2 and PO3 lies in the geographical scope on which measures are applied
(application of certain measures on the comprehensive network; identification of
additional urban nodes, etc.), the timing (e.g. application of the new standards on the core

37
network from 2040) and the governance of the network (e.g. coherence of the Core
Network Corridors with the Rail Freight Corridors).87
The measures as such are cumulative which means that all measures covered in PO1 are
included in PO2, and all measures of PO1 and PO2 are included in PO3, without
discarding any measure of the previous options. Indeed, as regards the individual
measures analysed in the three options, there was general consensus, also largely
supported throughout the different stakeholder groups in the public consultation, on the
need of each individual measure. Some measures were also promoted by stakeholders
already during the evaluation phase or are based on clear demands from the sector (e.g.
P400 rail freight standard). In addition, due to the multimodal nature of the TEN-T, it is
difficult to discard single measures since each measure is highly interdependent with
each other. For example, incentivising the use of rail for the transport of freight cannot be
done without appropriate measures to develop multimodal terminals and allow the
circulation of standard containers. Or in the case of passenger transport, users will not
shift to rail if there are no competitive travel times and reliable services (e.g. multimodal
access to stations).
87 The packaging of the measures is closely related to the nature of the TEN-T Regulation which aims at
promoting multimodality, which can only be achieved through a comprehensive set of measures
which are closely integrated and dependent of each other. For example, incentives to put freight on
rail (by deploying P400 and minimum 740 meters long trains) make sense only if terminals (rail-road
terminals as well as terminals in ports) are equipped to load/unload such trains. The same goes for
passenger transport where the improvement of line speeds (160 km/h) should go together with a
better planning of first mile/last mile connection in urban nodes (through the establishment of
Sustainable Urban Mobility Plans) and competitive travel times and reliable services (e.g. multimodal
access to stations). In order to comprehensively address all problems and objectives, all new measures
were therefore considered in PO2.

38
Figure 3: Overview of policy options in terms of ambition and level of intervention
Policy option description Degree
of
ambition
Level of
intervention
PO1 This policy option introduces a number of updates of existing TEN-T
infrastructure quality requirements and standards and provides for the
adequate infrastructural basis for the deployment of AFIR and ITS. In
addition, it includes measures to harmonise and streamline the existing
TEN-T monitoring and reporting tools. In terms of TEN-T network, it
also includes a review of the transport network and transport nodes.
+ +
PO2 This policy option represents a step change by introducing new and
more ambitious standards and requirements for all transport modes as
to contribute to the decarbonisation, pollution reduction, digitalisation,
resilience and safety of the transport infrastructure system. In addition,
a new focus on urban nodes policy is introduced. Finally, a boost of
TEN-T implementation will be given by better aligning national
(investment) planning with TEN-T priorities as well as with climate
and zero-emission strategies.
+++ +++
PO3 This policy option adds considerable ambition in terms of the
completion of the TEN-T by advancing the deadline of certain
standards and sections of the network to 2040 whilst keeping the
ambitious standards and requirements introduced through PO2. It also
goes further in terms of network alignment and adaptation, e.g. by
creating European Transport Corridors (replacing the existing Core
Network Corridors and Rail Freight Corridors).
++++ ++++
Policy Option 1 (PO1):
The objective of PO1 is to update existing infrastructure quality requirements in line with
the current TEN-T policy approach and to focus on an increased infrastructure quality.
This policy option is some sort of “ground layer” option with a basic level of intervention
and degree of ambition, aiming at optimising the current instruments with only limited
legislative changes to the existing framework (see Figure 3).
Under PO1, it is foreseen to update the TEN-T quality requirements as to respond to the
problem of insufficient and/or incomplete TEN-T infrastructure standards. In this
context, the revised TEN-T Regulation will make a close link with the revised Directives
on alternative fuels infrastructure (becoming a Regulation through its revision, i.e. AFIR)
and on intelligent transport systems (ITS) to ensure their deployment within a clear time
frame on the TEN-T (see measures 4 and 16 of Figure 4). The revised AFIR is expected
to define specific requirements for road transport, ports and airports as well as for urban
nodes. PO1 aims at completing a modern and efficient TEN-T and thereby contributes to
the objectives of AFIR and ITS. Similar to the approach analysed for AFIR standards, the
same approach shall be applied for the ITS Directive, by referencing the equipment of
roads with ITS in the TEN-T Regulation and thereby address the problem of network
capacity and safety issues.
Changes to the network design through an update of the transport nodes and a review of
the network are also included under PO1 (see measure 21 of Figure 4). The definition of
the TEN-T core and comprehensive transport nodes, i.e. maritime and inland ports,
airports, RRT, will be updated. The transport nodes are included in the TEN-T network
based on certain thresholds of transport volumes and in reference to an EU average over

39
a period of three years. These thresholds have been recalculated on the basis of the
reference years 2017, 2018 and 201988 and on the 2013 TEN-T methodology89. In
addition, it should be checked whether the current TEN-T needs updates with regard to
its coherence with national (investment) planning. It is indeed important that the new
Regulation is based on an adequate network basis, respecting the current transport flows.
This review of the network is particularly important for AFIR and ITS as the primary
condition for their successful deployment is to have the right infrastructure basis in place
(see above). The need for such adjustment to the TEN-T design has also been widely
confirmed by the OPC. Indeed, the vast majority (more than 85% of the respondents90)
agreed with the statement that the network design needs to be adjusted as to take into
account changing transport flows within the EU and with neighbouring/third countries
and to further strengthen the accessibility of all regions as well as cross-border mobility.
Finally, PO1 includes a harmonisation and streamlining of the existing TEN-T
monitoring and reporting tools (see measure 25 of Figure 4). For instance, the TEN-T
Regulation currently foresees the elaboration of one work plan by each European
Coordinator. In practice, this work plan has been updated on average every two years by
each Coordinator. Instead, it is proposed to do a formal update of the work plan including
the priorities for the respective corridor development only every three years, with a brief
annual progress report on the state of implementation of the CNC, MoS or ERTMS. This
would also replace the report that is requested every year for the European Parliament,
the Council and the Member States in line with Article 45.5 (e) of Regulation (EU)
1315/2013.
In terms of deadlines for completion of the network, the currently applicable deadlines
of 2030 for the core network and 2050 for the comprehensive network completion will
remain unchanged.
Policy Option 2 (PO2):
The objectives of the EGD and SSMS demand decisive action to shift more activity
towards more sustainable transport modes, which notably implies increasing the number
of passengers travelling by rail and commuting by public transport as well as shifting a
substantial amount of freight onto rail, inland waterways and short sea shipping. To this
end, and on top of the measures brought forward for an increased infrastructure quality
(PO1), the objective of PO2 is to upgrade the TEN-T by introducing new and more
ambitious standards as to better reflect the objectives of decarbonisation, pollution
reduction, digitalisation, resilience and safety of the transport sector. The following new
standards will be introduced under PO2 as to address the problem of insufficient and/or
incomplete TEN-T infrastructure standards:
88 The reference year 2020 has been discarded to exclude the heavy (temporary) impacts of Covid-19 on
transport volumes. 89 SWD(2013) 542 final 90 The vast majority – more than 85% - agreed that network design needed to be adjusted a) to take
account of changing transport flows within the EU and with neighbouring/third countries, and b) to further strengthen accessibility for all regions and cross border mobility. For most stakeholder types, the percentages were even higher, e.g. for industry (92% and 89%, respectively); Other (86% and 89%) and public authorities (87% and 93%). Only citizens (75% and 73%) were less in agreement.

40
As regards rail, the vision is to create a higher capacity and a more reliable rail freight as
well as passenger rail network across Europe. To this aim, an additional rail freight
standard is proposed: the requirement to enable the circulation of intermodal loading
units compliant with the P400 classification on standard wagons (see measure 1 of Figure
4). Under PO2, this standard would apply only to the core network and with a deadline
for completion by 2050. Allowing the circulation of intermodal loading units of the P
70/400 (or higher) classification is a minimum market requirement and thus essential to
ensure competitiveness of combined transport with road transport91.
Contrary to rail freight, the current Regulation does not include any requirement with
regard to line speed for passenger rail (see measure 2 of Figure 4). This is a gap that
needs to be addressed in view of reaching the overall vision of creating a competitive
(high-speed) rail network across Europe. In combination with the existing and new high-
speed rail projects of 240 km/h on parts of the core network, a minimum line speed of
160 km/h92 for all passenger core network lines by 2050 will be analysed. This shall in
return lead to network effects, a more coherent network and an increased number of
passengers travelling by rail. This measure was called upon by many of the respondents
to the OPC who called for a wider support of the promotion of a high-performance
passenger rail network (85 % agreed or somewhat agreed) and underlined its potential
benefits for decarbonising transport and emphasised the need to develop a coherent,
interoperable and interlinked European high speed rail network to link its capitals and
major cities.
As regards inland navigation, the current parameters for inland waterways set up in the
TEN-T Regulation do not guarantee a coherent performance for all waterway stretches,
as waterways in Europe are characterised by a heterogeneous hydro-morphology. In
addition, waterways, especially free flowing stretches, may be heavily impacted by
climate and weather conditions. In consequence, there is no ‘one size fits all’ solution;
hence, there is a need for TEN-T parameters which take into account the specific hydro-
morphology of each waterway (e.g. free-flowing or regulated rivers) as well as the
objectives of environmental policies (e.g. Water Framework Directive and Habitats and
Bird Directives). Such an approach should be considered at corridor or river basin level
(see measure 3 of Figure 4). In terms of minimum requirements, the following
parameters are being analysed under PO2: at least 2.50 m navigable channel depth for
rivers, canals, lakes and inland ports and 5.25 m minimum height under bridges at
defined reference water levels, which are exceeded at a defined number of days/year on
statistical average by corridor/river basin. Exceptions to these minimum requirements
would be possible, to take account of specific hydro-morphology of inland waterways as
well as for biodiversity considerations. This approach has been acknowledged by expert
91 http://www.cer.be/sites/default/files/publication/181008_Sector_Statement_Progress_Report.pdf 92 The boundary of 160 km/h was chosen for the following reasons:
- 160 km/h is the speed boundary between high-speed and conventional rail from an infrastructural perspective.
- From 160 km/h on, investments for upgrades rise significantly. - It translates roughly into a commercial speed of 90 km/h which was the standard envisaged
already at the time of establishment of the EuroCity network in 1987. - The choice of a minimum standard of 160 km/h, with an exemption system, does however not
exclude the viability of upgrades to faster speeds, such as for example 200 km/h or 220 km/h.

41
inland waterway stakeholders consulted for the evaluation of the TEN-T Regulation93.
The analysis will also include the “good navigation status” which defines additional and
specific corridor/river basin requirements for hard and soft components94 which are laid
down in corridor implementing decisions. These requirements will take into account the
hydro-morphological specificities of each waterway and will also integrate the objectives
of reaching good ecological status or potential as defined by the Water Framework
Directive.
As regards short sea shipping, a concrete definition, objectives and a coherent and
integrated concept for its development in Europe is envisaged to be incorporated in the
TEN-T Regulation and will mainly be fostered through reinforced requirements for the
last mile connections of ports and terminals (see measure 12 of Figure 4). In addition,
this measure foresees to further develop the current Motorways of the Sea concept into
the concept of a European Maritime Space with the aim to better connect and integrate
the maritime dimension with the landside network; in particular with the European
Transport Corridors through the upgrading of short-sea shipping routes and the
development of maritime ports and their hinterland connections to provide an efficient,
viable and sustainable integration with other modes of transport. It shall more clearly
define the maritime transport infrastructure to be implemented within the port area /
within ports of the core and comprehensive network and the wider benefit actions,
namely those that are not geographically linked to specific ports yet benefit the maritime
industry widely, such as support to activities ensuring year-round navigability
(icebreaking), ICT platforms and information systems including sea traffic management
and electronic reporting systems, hydrographic surveys.
In order to overcome capacity bottlenecks and an insufficient network connectivity
hampering multimodality along the TEN-T, a number of policy measures are included in
PO2 for urban nodes. In a first place, all TEN-T urban nodes95 should be required to
establish a Sustainable Urban Mobility Plan (SUMP), linked with existing air quality and
noise plans whenever appropriate, and to report on certain key urban mobility data such
as on GHG and air pollutant emissions, congestion, accidents/injuries, modal share and
access to mobility services. This would help the Commission to set up a coherent urban
policy and to support cities to evaluate the results of their mobility measures. As such,
this measure would directly contribute to the achievement of the milestone set out in the
Sustainable and Smart Mobility Strategy, i.e. to have a large number of carbon-neutral
cities by 2030 (see measure 8 of Figure 4). In addition, PO2 introduces an obligation to
develop multimodal passenger hubs for the facilitation of first and last mile connections
93 Evaluation of the TEN-T Regulation Case study 3: https://op.europa.eu/en/publication-detail/-
/publication/11f31ae6-4c1d-11ec-91ac-01aa75ed71a1/language-en/format-PDF/source-243059721 94 The good navigation status defines additional specific corridor/river basin requirements for hard and
soft components to be laid down in corridor implementing decisions: e.g. complementary parameters and target values for waterways, specific for free flowing stretches; specifications for related infrastructure, including its management; specifications for inland ports; appropriate mooring places and services for commercial users; resilience to climate change, natural and man-made disasters and disruptions; deployment of alternative energy infrastructure to ensure corridor-wide access to alternative clean fuels; requirements for digital applications and the digital transformation of the network.
95 A TEN-T urban node under PO2 refers to the 79 urban nodes of the current Regulation. A TEN-T urban node under PO3 refers to the existing and newly identified urban nodes (around 460).

42
(minimum 1 hub per urban node and in addition, for cities larger than 500.000
inhabitants, one additional hub per every 500.000 inhabitants) (see measure 9 of Figure
4). This measure aims to facilitate first and last mile connections from and to the TEN-T
network which has been identified in the TEN-T evaluation as one of the major obstacles
for passengers to shift to more sustainable forms of transport. In practice, it mainly
addresses already existing passenger stations. Next to it, each urban node shall also
ensure the availability of multimodal digital mobility services (including MaaS services),
allowing passengers to access information and book journeys, including for public
transport and active modes. Finally, PO2 also includes a measure focusing on the design
of transfer terminals, e.g. with regard to the accessibility for all users, provision of
information across modes (also covering first/last mile connections), and enabling of
innovative mobility services96 (see measure 13 of Figure 4). It needs to be underlined that
under PO2 all urban nodes’ measures apply to the 79 urban nodes referenced in the
current TEN-T Regulation.
For freight terminals, in order to ensure sufficient multimodal freight terminals serving
the TEN-T, the obligation to establish at least one terminal serving each urban node and
located in its proximity is analysed (see measure 14 of Figure 4). In practise this would
mean the obligation to have at least one multimodal freight terminal for all existing 79
urban nodes under PO2. Complementary to that, it is proposed to bring forward an
obligation for Member States to conduct market and prospective analysis aiming at
identifying the existing terminals serving transport flows on the TEN-T, in particular the
urban nodes as well as the need for new terminals. On the basis and as a result of such
analysis, Member States would be requested to submit to the Commission a list of new
terminals to be included in the TEN-T. The provision of terminals would go hand in hand
with the introduction of certain requirements, such as the possibility to handle all types of
intermodal loading units in the respective terminal, the availability of 740 m long tracks
under the crane, the avoidance of shunting operations (requires electrification) as well as
the digitalisation of terminals (see measure 15 of Figure 4). Last but not least, PO2
introduces a requirement for alternative fuel infrastructure in terminals – an aspect not
considered under AFIR (see measure 5 of Figure 4). Indeed, the requirements for
electrification are only applicable to the railway access of the terminal. The alternative
fuel infrastructure foreseen here would be targeted at the road and/or IWW parts of the
terminals thus helping to decarbonise also the first/last mile legs of freight transport
journeys.
The aim of PO2 is also to promote decarbonised multimodal, interoperable solutions
aiming at an optimal intermodal integration of the entire logistic chain. To this end,
certain standards of the core network need to be extended to the comprehensive
network in order to grasp full network benefits, to increase interoperability between
network types and to enable more activity by more sustainable forms of transport,
including through higher digitalisation and other technological solutions (see measure 11
of Figure 4). Therefore, PO2 foresees the application of the existing infrastructure
96 Besides pure in-vehicle travel time savings, the last-mile of a rail journey and the connectivity of rail
stations to the urban centres are important aspects for rail travellers. The location of a rail station and its integration in the urban and regional public transport networks are key for the attractiveness of a high speed rail service.

43
requirements of the core network also on the comprehensive network: 22.5 t axle load,
100 km/h line speed for freight and the possibility of running trains with a length of 740
m. The same should apply for the last mile connections by rail/IWW to maritime and
inland ports as well as to terminals. Even if somehow biased by individual responses
raising doubts for this measure (in terms of budgetary constraints, feasibility, etc.), this
measure was still widely supported by the OPC results. Indeed, over 80% of respondents
supported the extension of a set of requirements (notably the rail freight standards with
regard to electrification, train length and axle load).
In order to address the insufficient safety and reliability of the TEN-T infrastructure,
measures aiming at ensuring a high-quality road infrastructure not only for the purpose
of road safety but also for the roll-out and deployment of alternative fuels charging points
are introduced under PO2. To this aim, revised road standards are needed. In order to
overcome this issue, the obligation to ensure motorway97 standard as the only reference
road type across the TEN-T is analysed under PO2 (with possibilities for exemptions
based on traffic intensity) (see measure 17 of Figure 4). In addition, a minimum level of
safe and secure parkings every 100 km on the core network with the availability of
recharging points as well as rest areas every 60 km for the core and comprehensive
network are introduced.
Next to new road standards, there shall also be a binding deadline for new tunnels >500m
on TEN-T sections to comply with the provisions of Directive 2004/54 (“Tunnel
Directive”) (see measure 18 of Figure 4). This measure aims to clarify the scope of
application of the tunnel directive and the deadlines applicable to tunnels, in particular in
cases of tunnels which would be added to the TEN-T network through changes in the
maps.
Lack of maintenance can also be related to safety concerns as shown in Chapter 2. While
maintenance is and will remain the main responsibility of the Member States, it is
important that the TEN-T – once built – is properly maintained to ensure a high quality
of services. Therefore, the introduction of minimum quality standards for safety,
maintenance and project life cycle standards is proposed (see measure 19 of Figure 4).
In the same spirit, Member States should be called to screen third country investments
on the core and the comprehensive network to ensure that these investments comply with
the TEN-T standards and do not affect continuity of the TEN-T network, hence security
and public order (see measure 20 of Figure 4). The implementation of the standards of
the TEN-T Regulation are obviously binding both for the Member States and for the
promoters of projects on the territory of the EU. The problem however is that, in case of
non-compliance with EU standards, it is difficult and very expensive to correct a
situation a posteriori, when the investments have been made, for example by requiring
the removal of a non-compliant rail traffic control system and replacing it with ERTMS.
Hence the added-value of a mechanism of notification so that the Commission can
intervene a priori, that is to say before the investment is made.
97 A motorway means a road, specially designed and built for motor traffic meeting the following
criteria: (a) provided with separate carriageways for the two directions of traffic, separated from each other either by a dividing strip not intended for traffic or, exceptionally, by other means; (b) it does not cross at level with any road, rail or tramway track, bicycle or footpath.

44
In addition to the various standards introduced, PO2 also aims at assuring consistency of
infrastructure development (which is by default a long-term asset) with the climate
neutrality and other environmental objectives set out in the Green Deal, such as the “do
no significant harm” principle98 as well as plans and programmes required by existing
EU environmental acquis. By providing further incentives to develop sustainable forms
of transport (rail, inland waterways, short sea shipping) and with the implementation of
all (reinforced) standards and requirements to green transport infrastructure of the TEN-
T, including strategic and project level environmental assessments, it will be assured that
the realisation of the TEN-T is consistent with the “do no significant harm” principle
(DNSH). On top of that, any project on the TEN-T will have to comply with the quality
standards set in the TEN-T Regulation and their realisation will contribute to the
achievement of an EU-wide, multi-modal, smart and sustainable transport network (see
measure 7 of Figure 4).
Finally, to enable better governance of TEN-T, provisions to align national (investment)
planning with TEN-T priorities will be introduced (see measure 26 of Figure 4). To this
end, it is foreseen to introduce a clause in the revised Regulation that would oblige
Member States to take into account the TEN-T priorities when setting up the national
transport and investment plans, paying particular attention to identified priority sections
on each Corridor. This should also take into consideration national energy and climate
plans as well as national air pollution control programmes. 89% of the respondents99 of
the OPC also agreed to this measure of an improved alignment of planning and
implementation procedures. In addition, it is planned to make broader use of
implementing decisions (e.g. for single projects / horizontal priorities and/or for entire
corridors), even if the use of the instrument of implementing acts raised concerns for
some stakeholders (12% disagreement100).
In terms of deadlines for completion of the network, this policy option foresees the core
network completion by 2030 and the comprehensive network completion by 2050 as in
the current TEN-T Regulation, with a difference that newly introduced standards on the
core and comprehensive network as well as extended standards from the core to the
comprehensive network would only need to be complied with by 2050.
Policy Option 3 (PO3):
Building upon PO2, additional efforts are undertaken as to ensure a more seamless,
efficient and interoperable transport network earlier by accelerating the completion of the
TEN-T and by ensuring a broad and coherent development on the network. This third
policy option has the highest degree of ambition and intervention as it adds not only upon
the first two options, but on top accelerates and geographically extends many policy
measures (see Figure 3).
98 Regulation (EU) 2020/852 of the European Parliament and of the Council of 18 June 2020 on the
establishment of a framework to facilitate sustainable investment, and amending Regulation (EU) 2019/2088.
99 There is not much variation by stakeholder group: the responses vary from 85% (citizens) to 94% (other), with industry (90%) and public authorities (88%) in between.
100 In terms of stakeholder groups, the percentages of disagreement per group are very similar (10% to 14%), including for public authorities (14%). However, when looking more in depth at the public authorities who disagreed with this measure, 73% of them were national authorities.

45
A central objective of PO3 is to adjust the TEN-T in view of creating a greater coherence
between the different policies and related legal instruments. This translates into a much
more substantial review of the TEN-T than under PO1.
Firstly, it is aimed at integrating the eleven Rail Freight Corridors (which cover the
operational dimension of rail freight) and nine Core Network Corridors (which focus on
the implementation and upgrade of infrastructure according to defined TEN-T standards)
into ten so-called European Transport Corridors (ETC) (see measure 22 of Figure 4).
The objective is to integrate these two corridor concepts into one, in order to seek better
synergies and to ensure that the operational side goes hand in hand with the
infrastructural side. The merge of both sets of corridors has however impacts on the
TEN-T design since not all sections that are part of the RFC are already on the TEN-T.
To this end, an analysis has been undertaken to evaluate in how far the current RFC and
CNC networks overlap and how the network formed by both types of corridors can be
better aligned. Those sections of the RFCs which are not yet on the CNC but which are
evaluated as important for a well-functioning corridor (in particular principal routes and
critical diversionary routes) are proposed to be added to the newly created instrument of
ETCs. Such alignment between both types of corridors was also called upon by the
stakeholders through the OPC and is indicated as an objective in the SSMS.
Secondly and equally important is a better inclusion of the urban mobility policy in the
context of the TEN-T Regulation. The Regulation lists 79 core urban nodes which have
been used to define the core network overall. It is proposed under this policy option to
define a complete set of urban nodes (around 460) (see measure 23 of Figure 4). Indeed,
all cities above 100,000 inhabitants and the capitals of NUTS2 regions (for NUTS2
regions that do not have a city of at least 100,000 inhabitants) shall figure as TEN-T
urban nodes and thus fall under the obligations being analysed for urban nodes. The
importance of including more urban nodes on the network in order to improve the links
between long-distance and local travel was also underlined by the OPC with more than
80% of respondents fully agreeing.
Thirdly, the EU military transport network101 should be better aligned with the current
TEN-T (see measure 24 of Figure 4). 93% of the EU military transport network overlaps
with the current TEN-T. Some sections (roads, railways) of the remaining 7% not yet on
the TEN-T but which are considered of European added value and of strategic
importance not only for the military but in particular also for the civilian use are
proposed to be added to the TEN-T.
These adaptations of the network have important consequences for the geographical
scope of application of the standards newly introduced under PO2. Concretely, this
means that the new rail standards (i.e. the P400 loading gauge for rail freight and the 160
km/h passenger line speed) will apply under PO3 not only for the core network, but also
for the comprehensive network sections that are part of the ETC. Similarly, the obligation
to have at least one multimodal freight terminal as well as a multimodal passenger hub
for each urban node will mean under PO3 that 460 urban nodes have to comply with
101 Geographic data defined in tables 2.17-2.43 of the Military requirements for Military Mobility within
and beyond the EU, update (ST 10921/19), 4 July 2019, approved by the Council on 15 July and consolidated with the remaining part on 19 July (ST 11373/19) (not published in the Official Journal).

46
these requirements (instead of 79 urban nodes under PO2). As outlined in chapter 2, the
distance between rail/road terminals is well above 300 km in many regions which limits
the viability of multimodal transport in regions without terminals102. With the
requirement of one terminal at least serving each urban node, this problem would be
adequately addressed since all (but three) urban nodes under PO3 would be located at
less than 200 km distance from each other. In addition, a wider network of terminals
throughout the TEN-T would help better integrating the maritime links into the TEN-T
since they would be serving the entire logistic chain.
Another central objective of PO3 is to accelerate the TEN-T completion. Thus, PO3 goes
an important step by introducing a new intermediary deadline of 2040 (see measure 6 of
Figure 4). Thereby, progress on TEN-T will be advanced from 2050 to 2040 on sections
of the comprehensive network of highest EU added value (notably the parts of ETC).
This also means that all newly introduced standards under PO2 would not have to be
complied with by 2050 (PO2) but already by 2040 (PO3).
Apart from these aspects of network expansion and acceleration, PO3 also includes a few
additional measures. Most importantly, PO3 introduces a legally binding deadline for
decommissioning national (class B) systems and making ERTMS the only signalling
system used in Member States by 2040 for the core and comprehensive network (see
measure 10 of Figure 4). This means advancing the obligation to implement the ERTMS
standard for the comprehensive network to 2040 instead of 2050. This shall in return
alleviate capacity bottlenecks through the quicker deployment of ERTMS.
Finally, this option also includes a reinforcement of the TEN-T governance tools. PO3
reviews the role of the European Coordinators, by extending their mandate regarding
their responsibilities for operational issues (RFC) and to avoid duplication of certain
tasks (e.g. RFC/CNC transport market studies and investment planning analysis). The
presence of European Coordinators in cross-border entities shall also be institutionalised.
Finally, the scope of the mandate for topics related to urban nodes and cooperation with
neighbouring and third countries shall be widened (see measure 27 of Figure 4). Such
reinforcement of the Coordinators’ mandates also got wide support in the OPC.
In terms of deadlines for completion of the network, this policy option foresees the core
network completion (for existing standards under current Regulation) by 2030, the
compliance with newly introduced standards on the core network as well as on
comprehensive sections as part of the ETC by 2040, the ERTMS deployment obligation
on the comprehensive network by 2040, and the completion of the rest of the
comprehensive network by 2050.
5.2.1 5.2.1 Links between the problems, problem drivers and specific objectives in
relation to each policy option
Since the overall intervention logic and the links between the problems, problem drivers
and objectives is quite complex due to the very comprehensive and broad nature of the
102 If the road leg of multimodal transport on the first/last mile of intermodal services is too long, benefits
of rail on the long haul are not exploited making road-only transport more economic as transhipment costs are avoided.

47
TEN-T Regulation covering not only all transport modes, but also a variety of other
horizontal areas, the following sub-section summarizes the links between the problems,
problem drivers and specific objectives in relation to each policy option which are also
illustrated through Figure 4 and in further detail in Annex 6.
Policy Option 1 (PO1) particularly addresses the problem area 1 (lack of integration of
standards for the alternative fuels infrastructure) by making a link with the standards of
the AFIR in the TEN-T Regulation. The TEN-T provides the infrastructure basis for a
wide deployment of alternative fuels and thus clearly addresses the specific objective 1
(SO1). PO1 also addresses the problem of capacity bottlenecks by introducing the ITS
requirements for roads in the TEN-T Regulation. This in return helps bringing the
digitalisation of transport modes forward (SO3) and also improves the resilience of the
infrastructure (SO5). By updating a number of existing TEN-T infrastructure quality
requirements and standards, the initiative also ensures an improved network quality
(SO2) and reinforces the role of urban nodes (SO4). As regards problem area 4
(inadequate governance instruments and TEN-T network design), PO1 addresses SO6
through reviewing the transport nodes and through the inclusion of some measures to
harmonise and streamline the existing TEN-T monitoring and reporting tools.
Policy Option 2 (PO2) represents a substantial policy change compared to PO1 by
introducing new and more ambitious standards and requirements for all transport modes
as to contribute to the decarbonisation, digitalisation and resilience of the transport
infrastructure system. It thus substantially contributes to problem areas 1, 2 and 3. For
instance, by introducing new rail freight standards, it will incentivise rail freight traffic
(SO1) and an improved network quality will be ensured (SO2). Similarly, the new
passenger rail standard addresses not only SO1, i.e. giving a push for passenger rail
transport, but also SO3 by improving the safety and security of transport which will
benefit passengers. Capacity bottlenecks (problem area 2) are addressed mainly through
new obligations for urban nodes (SO4) and new terminal requirements. Congestion is
equally being addressed through the extension of various rail freight standards from the
core to the comprehensive network as to grasp benefits for the entire network (SO1 and
SO2). Safety issues (problem area 3) are mainly addressed through various new road
standards (thereby addressing SO1, SO3 and SO5). In response to problem area 4
(inadequate governance instruments), PO2 puts the focus on the streamlining and
alignment of national plans with the TEN-T priorities and thus specifically addresses
SO6.
Policy Option 3 (PO3) takes over all measures introduced under PO2 and covers thus
equally all problem areas, problem drivers and specific objectives. PO3 adds
considerable ambition in terms of the completion of the TEN-T by advancing the
deadline of certain standards and sections of the network to 2040 whilst keeping the
ambitious standards and requirements introduced in PO2. For instance, decommissioning
the class B systems and thus deploying ERTMS by 2040 on the entire network would be
a real breakthrough for solving the problems of congestion on the rail freight network.
Another added value of PO3 is the update of the TEN-T network (maps) which
particularly addresses the problem area 4 of an inadequate TEN-T network design and
also reinforces the role of the urban nodes (SO4) by a better definition and integration
into the network. It also goes further in terms of network alignment and adaptation

48
(SO6), e.g. by creating European Transport Corridors (replacing the existing Core
Network Corridors and Rail Freight Corridors).
In this context, it should also be underlined that numerous measures do not only address
one specific objective. It is thus not possible to draw single, linear links between
problems, drivers, objectives and measures. To give a precise example: the new
requirements established for urban nodes under PO2, such as the obligation to develop
multimodal hubs to facilitate first and last mile connections for urban nodes larger than
500,000 inhabitants, responds in a first place to the specific objective 4, i.e. to reinforce
the role of the urban nodes as to enable seamless passenger flows between the TEN-T
and local networks. Indeed, multimodal hubs are essential for fostering the connection
between local and interregional/international traffic systems. At the same time, such
measure also stimulates rail traffic (SO1) and an optimal intermodal integration (SO2).
This reflects also in the different problems and drivers that this single measure addresses.
More numerous multimodal passenger hubs throughout Europe help in a first place to
ensure a better network connectivity to all regions (problem 2) and thus also help to
better integrate urban nodes in the TEN-T (problem driver 2.3). At the same time, such
hubs definitely also respond to problem driver 1.1 of sustainable modes of transport (in
this case passenger rail) which is not efficient and fully attractive for users. This one
example shows how interconnected all the different measures, objectives and problems
are in the context of the TEN-T Regulation.
Figure 4: Overview of specific policy objectives, measures and policy options
Retained policy measure Specific
objective
Policy options
PO1 PO2 PO3
Problem area 1: Insufficient and/or incomplete TEN-T infrastructure standards and lack of
integration of standards for the alternative fuels infrastructure on the TEN-T that does not enable a
higher use of more sustainable forms of transport
1 Rail freight: possibility to run trains loaded with intermodal loading units classified as P400 on standard
pocket wagons (P400 loading gauge)
SO1, SO2
-
- on the TEN-T core network by 2050
- on the core network and on the comprehensive lines
that are part of the European Transport Corridors
(ETC) by 2040
2 Passenger rail: introduction of a minimum passenger line
speed of 160 km/h for the passenger core network
SO1, SO3 -
- by 2050
- by 2040
3 IWW:
Minimum requirements: at least 2.50 m navigable
channel depth for rivers, canals, lakes and inland ports
and 5.25 m minimum height under bridges at defined
reference water levels; Member States assure that locks
are operated and maintained in such a way that waiting
times are minimized.
Additional requirements: definition of good navigation
status with specific corridor/river basin requirements.
SO1, SO2,
SO5 -
- by 2050
- by 2040

49
Retained policy measure Specific
objective
Policy options
PO1 PO2 PO3
4 Introduction of AFIR references for inland and maritime
ports, airports, roads and urban nodes
SO1, SO2,
SO3, SO4
5 Development of alternative fuel infrastructure at
terminals (not defined in AFIR)
SO1, SO2,
SO3 -
- by 2050
- by 2040
6 Introduction of intermediary deadline of 2040 for:
newly introduced standards on core network
completion of comprehensive sections as part of
European Transport Corridors
ERTMS deployment obligation on comprehensive
network
SO1-6
- -
7 Assurance of consistency of TEN-T with the ‘Do Not
Significant Harm’ principle
SO1, SO2,
S05 -
Problem area 2: Capacity bottlenecks and insufficient network connectivity to all regions that
hamper multimodality
8 Obligation for all urban nodes to establish a SUMP and
to report on urban mobility data.
SO4 -
- for all 79 TEN-T urban nodes listed in the current
Regulation by 2030
- for all listed and newly identified core urban nodes by
2030 and for all newly identified comprehensive urban
nodes by 2040
9 For urban nodes on passenger transport:
Obligation to develop multimodal hubs to facilitate
first and last mile connections. 1 hub per urban
node. In addition, for cities larger than 500.000
inhabitants, one additional hub per 500.000
inhabitants.
Ensure availability of multimodal digital mobility
services (including MaaS services).
SO1, SO2,
SO4
-
- for all 79 existing TEN-T urban nodes by 2050
- for all listed and newly identified core urban nodes by
2030 and for all newly identified comprehensive urban
nodes by 2050
10 Introduction of a legally binding deadline for
decommissioning national (class B) systems and making
ERTMS the only signalling system used in Member
States by 2040 for core and comprehensive network and
thus to advance the ERTMS standard obligation for the
comprehensive network to 2040
SO1, SO2,
SO3, SO5
- -
11 Rail freight standards’ extension: application of the
existing infrastructure requirements of the core network
also on the comprehensive network (22,5 t axle load, 100
km/h line speed for freight and the possibility of running
trains with a length of 740 m)
SO1, SO2
-
- for comprehensive network by 2050
- for ETC comprehensive lines by 2040 and for rest of
comprehensive network by 2050
12 Maritime / inland ports / terminals: extension of the
TEN-T standards to the last mile connection by rail /
IWW
SO1, SO2,
SO3 -
- for all TEN-T ports and all terminals as identified in
2013 Regulation by 2050
- for all core ports and all core terminals resulting from

50
Retained policy measure Specific
objective
Policy options
PO1 PO2 PO3
terminal requirement (measure 14) by 2040 and for all
comprehensive ports and comprehensive terminals by
2050
13 Introduce new elements for passenger transport, such as
the design of transfer terminals, accessibility for all
users, information across modes (also covering first/last
mile connections), enabling of innovative mobility
services
SO1, SO3,
SO4
-
- for all terminals as listed in the current Regulation by
2050
- for all existing and newly identified terminals
(measure 14) by 2040
14 Freight terminals:
- at least one multimodal freight terminal serving each
urban node and in proximity of the urban node;
- requirements for terminals: all types of intermodal
loading units can be handled; 740m long tracks exist
under the crane; no shunting required (includes
electrification)
SO1, SO2,
SO3 -
- for all 79 TEN-T urban nodes listed in the current
Regulation by 2050
- for all listed and newly identified core urban nodes by
2040 and for all newly identified comprehensive urban
nodes by 2050
15 Digitalisation of passenger and freight terminals SO3, SO5 -
- by 2050
- by 2040
16 Introduction of ITS equipment requirements for roads SO3, SO5
Problem area 3: Insufficient safety and reliability of the TEN-T infrastructure
17 Road:
Obligation to ensure motorway standard on core and
comprehensive network (with exemption clause
based on traffic intensity).
SO1, SO3,
SO5 -
- for core and comprehensive road network by
2050
- for core network by 2040 and for
comprehensive network by 2050
minimum level of safe and secure parkings every
100 km on the core network with the availability of
recharging points for LDV and HDV
-
- on the core network by 2050
- on the core network by 2040
rest areas every 60 km -
- for the core and comprehensive network by
2050
- for core network by 2040 and for
comprehensive network by 2050
18 Binding deadline for new tunnels >500m on TEN-T
sections to comply with the provisions of Directive
2004/54 (“Tunnel Directive”)
SO1, SO3,
SO5 -
- For new tunnels on core and comprehensive network
by 2050

51
Retained policy measure Specific
objective
Policy options
PO1 PO2 PO3
- For new tunnels on core network by 2040 and for new
tunnels on comprehensive network by 2050
19 Introduction of minimum quality standards for
maintenance and project life cycle standards
SO5 -
20 Foreign Direct Investments: Fully fledged screening of
third country investments on the core and the
comprehensive network by Member States
SO5
-
Problem area 4: Inadequate TEN-T governance instruments and TEN-T network design
21 Update for the transport sections and nodes (ports,
airports, RRT) on the basis of the reference years 2017,
2018, 2019 with the same % thresholds of 2013
methodology
SO6
22 Update of the TEN-T maps – RFC alignment:
Creation of European Transport Corridors
integrating RFC and CNC leading to potentially 10
ETC (Corridors can comprise lines which are part of
the core and comprehensive network)
Integration of RFC sections outside the TEN-T in
the comprehensive network
SO5, SO6
- -
23 Update of the TEN-T maps – urban nodes:
Inclusion of all urban nodes above 100.000
inhabitants (if on core network, they become core
urban nodes; if on comprehensive network, they
become comprehensive nodes)
Inclusion of all capitals of NUTS2 regions as urban
nodes (core if on the core network, comprehensive if
on the comprehensive network). However, in the
case a capital is below 100.000 inhabitants and a
larger city of that region is already identified as an
urban node, then that capital should not be included.
SO4, SO6
- -
24 Update of the TEN-T maps – Military Mobility
alignment:
Most relevant parts of EU military transport network
(road, railways) that are also used for civilian
purposes are integrated into the TEN-T.
SO5, SO6
- -
25 Streamlining of existing reporting and monitoring
instruments
SO6
26 Alignment of national transport and investment plans
with TEN-T / work plan priorities
SO6 -
27 Review role of the Coordinators, in particular with
regard to RFC and cross-border projects
SO6 - -
5.2.2 5.2.2 Contribution of each policy option to the European Green Deal
The overarching goal of the TEN-T revision is to contribute to the achievement of the
European Green Deal goals. Each policy option thereby contributes to a different degree:
In PO1, the contribution to the European Green Deal challenges is mainly limited to the
inclusion of the AFIR requirements into the TEN-T by which an adequate geographical
scope of application will be enabled for the AFIR (notably thanks to the review of the
network (ports, airports, roads).

52
PO2 includes several measures contributing substantially to the European Green Deal
challenges, by setting new and/or more ambitious greening standards for the different
transport modes and by providing incentives for more sustainable modes of transport and
hence stimulating modal shift (e.g. new standards to promote rail freight transport;
minimum speed for passenger transport by rail, etc.).
PO3 includes all measures of PO1 and PO2, but on top accelerates the implementation of
parts of the TEN-T to 2040. This is crucial to ensure a timely implementation of the
European Green Deal objectives.
It goes without saying that the TEN-T Regulation alone does not fill the climate or
environmental gap addressed by the European Green Deal. Indeed, there are numerous
other instruments that all together address the problems which is also why a variety of
legal proposals (so called “Delivering the European Green Deal” package)103 has been
put forward to ensure that the transport sector effectively contributes to the revised EU
climate ambition for 2030. In addition, the EU Emission Trading Scheme (ETS) and the
Effort Sharing Regulation104 ensure by definition that the at least 55% emissions
reductions by 2030, relative to 1990, are met. For example, CO2 emissions are capped by
the Emissions Trading System. In particular, the new ETS for road transport and
buildings sets the impulse for the road transport sector that the required emissions
reductions are delivered according to the ETS cap – even if the infrastructure does not
deliver and thus it does not enable higher use of more sustainable transport modes and
means (e.g. electric vehicles). In this case the carbon price would be higher, driving a
reduction in the road traffic.
On the other hand, as laid down in the Smart and Sustainable Mobility Strategy, in order
to achieve the European Green Deal, “decisive action to shift more activity towards more
sustainable transport modes (notably increasing the number of passengers travelling by
rail and commuting by public transport and active modes, as well as shifting a substantial
amount of freight onto rail, inland waterways, and short sea shipping)” is needed. Such a
shift will only occur if the sustainable transport modes are (economically) more efficient.
Today, this is not yet the case, given also that the respective infrastructure is not fit for
purpose: freight trains cannot easily cross the Alps as there are no relevant base tunnels;
lack of adequate infrastructure makes that passenger services on rail are not attractive
enough in terms of travel time compared to other modes of transport; lack of reliability of
navigability (water levels, bridge clearance, etc.) prevents the more intensive use of
inland waterways. The TEN-T Regulation needs to ensure that the necessary
infrastructure is available to achieve the objectives set in the Sustainable and Smart
Mobility Strategy on the increased use of sustainable transport modes. The TEN-T
revision will hence provide further incentives to develop sustainable forms of transport
(rail, inland waterways, short sea shipping). Reinforced quality standards will contribute
to this objective by making sure that the necessary infrastructure is in place to allow for
efficient and sustainable transport services. Last but not least, it should be stressed in this
overall context that the realisation of the projects on the TEN-T network will have to
comply with the applicable EU and national legislation on the protection of environment
103 https://ec.europa.eu/info/sites/default/files/chapeau_communication.pdf 104 https://ec.europa.eu/clima/policies/effort/regulation_en

53
and biodiversity. No exception is granted to TEN-T projects. In addition, the high level
standards that will be imposed for the realisation of projects on the TEN-T network to
“green” transport will be consistent with the “do no significant harm” principle.
5.3 5.3 Discarded policy measures at an early stage
Following an initial screening based on findings from the evaluation and tested in the
open public consultation (OPC), a range of policy measures were discarded in the context
of this impact assessment, also because some of the aspects will be addressed through
other EU legislation or soft policy instruments. The key discarded measures, further
detailed in Annex 8, are the following:
Introduction of a minimum line speed of 200 km/h or above for the rail passenger
core network
Introducing a comprehensive network for inland waterways
More concrete provisions on innovations such as Hyperloop
Binding rules and obligations as well as standards on infrastructure maintenance
Inclusion of a (long-distance) cycling network into TEN-T
6 6 WHAT ARE THE IMPACTS OF THE POLICY OPTIONS?
This chapter summarizes the main expected economic, social and environmental impacts
of each PO across all transport modes at EU27 level105. Impacts are shown both at the
level of the TEN-T and for the entire transport network. In terms of time horizon, the
assessment has been undertaken up to 2050. For calculating the present value of
monetary costs a 4% discount rate has been used.
The policy measures that are part of the POs have different times of implementation (see
Figure 5): certain measures are to be implemented as of adoption of the new Regulation
(e.g. enhancement of the role of European Coordinators whilst other measures such as the
TEN-T standards are to be implemented depending on the geographical location (core /
ETC versus comprehensive network) by 2030, 2040 or 2050 (depending on the PO) (see
Figure 4 and Annex 6). In the model, the measures are phased-in up to 2030, 2040 and
2050 since investments are implemented gradually over time. Detailed explanations on
the inputs for modelling used for the quantification of the policy measures as well as the
related assumptions and additional results are provided in Annex 4 (section 3 and 4).
105 The quantification of impacts, where possible, has been undertaken with the ASTRA and TRUST
models. This has been complemented by input from stakeholders and desk research. References to the sources of specific information and explanations of assumptions underlying various cost and benefits results are further presented in Annex 4.

54
Figure 5: Deadlines for the completion of the network for each Policy Option
Policy Option 1
“updated TEN-T”
Policy Option 2
“upgraded TEN-T”
Policy Option 3
“accelerated and better
aligned TEN-T”
Deadlines for completion:
2030:
- core network
completion
2050:
- comprehensive network
completion
Deadlines for completion:
2030:
- core network completion
(with regard to 2013
TEN-T standards)
2050:
- extended core network
standards on
comprehensive network
- newly introduced
standards on both core
and comprehensive
network
- comprehensive network
completion
Deadlines for completion:
2030:
- core network
completion (with
regard to 2013 TEN-T
standards)
2040:
- newly introduced
standards on core
network
- completion of
comprehensive
sections as part of
European Transport
Corridors
- ERTMS deployment
obligation on
comprehensive
network
2050:
- Completion of rest of
comprehensive
network
It needs to be underlined that all POs are composed of measures of very different nature
and not all measures can be quantified. For example, the review of the network and of the
transport nodes is an essential part of the revision of the current Regulation as to ensure
that the network still matches the basic objectives of the Regulation (removing
bottlenecks, improving connectivity of all regions of the EU). This will lead for example
to removing certain ports and airports from the list of the transport nodes and the
identification of new ports and airports which are relevant for the completion of a
multimodal network. The net impact might appear very limited since the overall number
of transport nodes remains very similar106. However, the negative impact if such review
is not performed could be very high as the TEN-T would no longer match with the
objectives of the Regulation and the reality of the infrastructure development plans of
Member States. The possible negative impact of not updating the list of transport nodes
would thereby be in the first place of financial nature. For instance, in its report
“Maritime transport in the EU: in troubled waters — much ineffective and unsustainable
investment”, the Court of Auditors has criticised certain past investments in ports as
being not sufficiently effective and efficient, because they were not targeted at
infrastructures which have a potential to contribute to the TEN-T connectivity. There
would thus be a risk that for example financing decisions for alternative fuels would be
106 The analysis of the three-year statistical thresholds for the definition of the transport nodes results in
44 ports to be newly added to the TEN-T, whilst 42 to be removed. For airports, one new airport would be added, whilst 5 would be removed.

55
based on an outdated assessment that the port would be of European relevance because of
its presence in the TEN-T based on past traffic volumes. There would be also a political
risk of undermining the credibility of the EU approach applied to TEN-T ports if this was
applied to ports which are no longer relevant. The same holds for nodes which should be
included because they have increased in traffic flows and hence in importance.
As a result, policy option 1 has been considered as a valid option to be further assessed,
even if it addresses only a basic level of intervention (and thus limited impacts) aiming at
optimizing the current instruments with only limited legislative changes to the existing
framework. The assessment of the POs relative to the Baseline excludes the impacts of
the revision of the AFIR and ITS, which are assessed in separate impact assessments,
even though there is a direct link with the TEN-T Regulation.107 The TEN-T Regulation
will not only add references to the respective AFIR and ITS standards, but most
importantly guarantees that the correct and high-quality network basis for the deployment
of those standards is ensured. AFIR and ITS will deliver on their objectives only if the
TEN-T network, which is used as infrastructure basis for their deployment, is of high
quality (e.g. TEN-T motorways must be well maintained and equipped with high quality,
safe and accessible parkings to ensure a smooth deployment of AFIR charging points).
The impacts of the POs are assessed in the context of a policy environment achieving the
overall 55% emission reduction objective by 2030, which is embedded in the baseline
scenario. This means that the synergies between the ‘Delivering the European Green
Deal’ initiatives and the current initiative are taken into account. Where relevant, the
analysis below also provides a comparison with the Reference scenario 2020 (REF2020).
6.1 6.1 Economic impacts
Economic impacts have been assessed in terms of investment needs, impacts on GDP,
impacts on SMEs, administrative burden for public authorities and impacts on transport
activity.
6.1.1 6.1.1 Investment needs
In order to implement the current TEN-T Regulation (i.e. in the baseline), total
investment needs over the period 2021-2030 are estimated at about EUR 500 billion for
the TEN-T core network (EUR 50 billion per year on average), and at about EUR 1.5
trillion for the TEN-T comprehensive network and other transport investments up to
2050 (including the core network investments; EUR 50 billion per year on average)108.
The measures introduced through the revised TEN-T Regulation would add investment
needs of around EUR 15.1 billion per year for PO2 and EUR 16.4 billion per year for
PO3 for 2025-2050, relative to the baseline. This represents a 30% increase in the
average annual investments for PO2 relative to the baseline, and a 33% increase for PO3.
107 The revision of AFIR is included in the Baseline scenario. Thus, when comparing the impacts of the POs
to the Baseline, AFIR impacts are excluded. ITS impacts will be assessed in the impact assessment accompanying the revision of the ITS Directive.
108 Commission’s estimate based on the regular monitoring of the CNC project pipeline (CNC project list) as well as a Member States’ survey of August 2017: https://ec.europa.eu/transport/sites/default/files/delivering_ten_t.pdf

56
The additional investments needed for PO1 are negligible relative to the baseline (see
Table 1).
In this context, it should be stated upfront that the measures identified in this impact
assessment go far beyond the budgetary planning, both of the Member States and of the
European Union (e.g. the current EU financial perspective goes until the end of 2027).
Most of the new measures will have to be implemented by 2040 and then 2050. It is
therefore clear that the funding needed to implement these measures is not yet secured.
Nevertheless, the new TEN-T Regulation will act as a catalyst to mobilise the necessary
funds. For instance, as far as EU funding is concerned, the new TEN-T Regulation will
be used as a reference to prepare the proposal for the next Connecting Europe Facility
(CEF III, for the period after 2027). Similarly, the TEN-T Regulation is also used as a
reference for many other types of (private) investments. For example, the decisions of a
private bank to finance a port might depend on the fact that the port is identified as part
of the TEN-T network. The fact that the port is on the TEN-T will reassure the bank that
the Member State will develop multimodal access infrastructure to that port and will
ensure refuelling infrastructure, and that the port will thus be attractive for shipping
companies.
The investments for each PO, by type of measure and by Member State, are provided in
Annex 4 (section 4).109 With regard to the level of investments, two measures stand out in
particular: the introduction of a minimum passenger line speed of 160 km/h for the
passenger core network (34% of the additional investment costs in PO2 and 31% in PO3)
and the extension of certain standards from the core to the comprehensive network (22.5 t
axle load, 100 km/h line speed for freight and 740m trains) which represent around 50%
of the additional investment costs in PO2 and 47% in PO3. Together, these two measures
account for almost 84% of the total additional investments estimated for PO2 and 78%
for PO3.
The average annual investment needs at EU level for the period 2025-2030 amount to
EUR 15.1 billion in PO2 and to EUR 22.2 billion in PO3, which accounts for 0.1% and
0.2% of GDP, respectively. The relatively higher investment needs under PO3 up to 2030
result from the fact that this PO foresees the extension of the network (inclusion of RFC
and dual use infrastructures) which would trigger early investments for these newly
included infrastructures to meet some of the already existing TEN-T requirements. The
average annual investment needs for the period 2031-2050 amount to EUR 15.1 billion in
PO2 and to EUR 14.7 billion in PO3, which accounts for around 0.1% of the GDP in
both POs. The relatively lower investment needs under PO3 during 2031-2050 result
from the fact that, as already explained, some investments are anticipated to the period up
to 2030 and hence less investment is needed on those sections to meet TEN-T
requirements.
109 Detailed assumptions for calculating the investment needs by type of measure are provided in Annex
4 (section 3).

57
Table 1: Average annual investments for 2025-2030 and 2031-2050 in the EU27 [Mln. €2015],
expressed as difference to the baseline
Average annual investments by time period (difference to the
baseline, in million €2015) PO1 PO2 PO3
2025-2030 0 15,084 22,163
2031-2050 0 15,134 14,717
2025-2050 0 15,123 16,436
Source: M-Five
The investments by type of funding (see Table 2) are estimated drawing on similar
projects in the pipeline for the core and comprehensive TEN-T110. The largest part of
investments is estimated to originate from national public funding (around 55% of the
total additional investments). Another large part of funding (estimated at around 38%)
would be borne by EU funds. Private funds, EIB loans and toll revenues would only
constitute a smaller part for financing the policy measures. Overall, costs for public
authorities (i.e. national public funds, EU funds, EIB loans111) would amount to around
99% of the total investment needs.
Expressed as present value over 2021-2050, additional investments needs are estimated
at EUR 206.5 billion for PO2 and EUR 247.5 billion for PO3.
Table 2: Average annual investments for 2025-2050 per policy option and by type of funding in the
EU27 [Mln. €2015], expressed as difference to the baseline
Average annual investments by type of funding (difference to
the baseline, in million €2015)
Levels Share in total
PO2 PO3 PO2 PO3
National public funding 8,524 9,009 56.4% 54.8%
EU funds 5,747 6,310 38.0% 38.4% Private funds 85 98 0.6% 0.6%
EIB loans 648 901 4.3% 5.5% Toll revenues 118 118 0.8% 0.7%
Total 15,123 16,436 100% 100% Source: M-Five
6.1.2 6.1.2 Impacts on GDP
All policy options are expected to have a positive impact in terms of economic growth112.
Due to the fact that the impacts of the measures included in PO1 cannot be quantified (or
a quantification is not representative for the actual impact, e.g. the necessary review and
update of the TEN-T would lead to a quasi-neutral quantitative impact), there are no
110 Project Database from the study Schade et al., 2018, the impact of TEN-T completion on growth, jobs
and the environment. And CNC corridor studies (project list) and work plans. 111 EIB loans are not counted as private investments. 112 The results of the GDP and employment impacts have been cross-referenced with existing literature.
However, the literature specific to TEN-T infrastructure is rare and various reasons suggest that TEN-T projects generate higher economic impacts than other investments. Previous studies which consider other fiscal spending or sectors with a smaller potential to generate productivity are limited in their time horizon (i.e. they miss out some second-round effects) or focus on individual regions/ countries and deny network effects. The order of magnitude of reported impacts on GDP and employment in this impact assessment are consistent with those of earlier studies, e.g. the 2015 study on the “Cost of non-completion of the TEN-T” or the 2018 study on “The impact of TEN-T completion on growth, jobs and the environment”. The multiplier effects of investments, drawing on the ASTRA model results, have also been discussed in the past with EIB.

58
measurable impacts for PO1 to illustrate. However, this does not mean that PO1 does not
contribute to economic growth. PO1 aims at reinforcing the implementation of the
current TEN-T Regulation by an improved monitoring and governance as well as an
update of the TEN-T with the aim to ensure the completion of the TEN-T by the given
deadlines 2030/2050. PO1 thereby ensures that the development of the TEN-T is
correctly targeted and in line with the evolution of transport flows and infrastructure
planning since 2013. This in return guarantees that the GDP growth driven by the current
TEN-T can unfold without any delay.
In PO2 and PO3 the impacts on GDP are estimated at 0.3% and 0.4% in 2030,
respectively, relative to the Baseline. The impacts are estimated to be much higher by
2050 (1.8% in PO2 and 2.4% in PO3) (see Table 3). These impacts account for wider
effects than only the construction of projects, namely the indirect effects on other
economic sectors and the effects induced by increased productivity, improved conditions
for international trade and technological spill-overs. It also needs to be clearly underlined
that TEN-T investments have a greater multiplier effect on GDP the earlier they are made
(i.e. 2040 in PO3 versus 2050 in PO2).
Table 3: Impacts on EU27 GDP in the policy options relative to the Baseline
% change to
the Baseline
Baseline (billion €2015) PO1 PO2 PO3
2030 2040 2050 2030 2040 2050 2030 2040 2050 2030 2040 2050
Impacts on
GDP 14,539 16,967 19,698 0.0% 0.0% 0.0% 0.3% 0.9% 1.8% 0.4% 1.3% 2.4%
Source: Astra model
At country level, the impact depends on the size of TEN-T investments and on their
relation to national GDP and to total investments in a Member State (see Figure 4).
Productivity and demand impulses from TEN-T investments provide (on average)
stronger impacts in lower income Member States. Countries with higher productivity see
smaller changes from additional investments compared to those with lower productivity.
The economic gains also vary depending on the benefits in particular sectors in each
country as well as on the funding mechanism chosen for the investment.
Figure 6: Impacts on GDP in the policy options, by Member State, relative to the Baseline (PO2 –
left side; PO3 – right side)
Source: Astra model
0%
1%
2%
3%
4%
5%
6%
7%
8%
AT
BE
BG
CY
CZ
DE
DK
EE
EL
ES FI
FR
HR
HU IE IT LT
LU
LV
MT
NL
PL
PT
RO
SE SI
SK
% c
ha
ng
e in
GD
P
2030 2040 2050
0%
1%
2%
3%
4%
5%
6%
7%
8%
AT
BE
BG
CY
CZ
DE
DK
EE
EL
ES FI
FR
HR
HU IE IT LT
LU
LV
MT
NL
PL
PT
RO
SE SI
SK
% c
ha
ng
e in
GD
P
2030 2040 2050

59
6.1.3 6.1.3 Impact on SMEs
While most of the construction activities as well as the provision of digital technologies
(e.g. ERTMS) are expected to be provided by rather large companies, the upgrade of the
infrastructure for combined railway transport and of terminals will generate opportunities
to establish services for small- and medium sized companies even though in some
segments also large players exist. Main stakeholders concerned are the railway
undertakings in the freight market, the rail freight terminal operators, trucking companies
and operators at passenger terminals.
In particular, improving the rest areas and parking situation for regional and long-
distance trucking will benefit the large number of small driver-owned trucking
companies, which are actually among the smallest enterprises in the transport domain, as
they depend on a dense and quality network of parking areas. Therefore, PO2 and hence
PO3 will be the most beneficial for SMEs, while PO1 is not expected to generate such
benefits. However, it was not possible to quantify these impacts.
Moreover, the measures under PO2 and PO3 to better integrate urban developments into
TEN-T, in particular through the development of multi-modal (passenger and freight)
terminals, will also directly benefit SMEs which need such infrastructure to develop their
services in cities.
6.1.4 6.1.4 Administrative burden
The administrative burden for public authorities and private sector, expressed as
additional costs relative to the baseline, mainly stem from the requirements for Member
States to participate in the governance of an additional European Transport Corridor
(ETC), to put in place modified monitoring and governance systems for the TEN-T
implementation and to step up efforts for a better alignment of national plans with EU
priorities (PO3). The costs thus cover for instance the provision of information regarding
the status of the TEN-T network in the respective Member State (by national
administrations, project promoters, infrastructure managers) for its use in the TENtec
database and the corridor studies as well as the participation of representatives of
Member States, project promoters, infrastructure managers, regional representatives in
TEN-T Committees, corridor fora and workshops.
At the same time, the integration of the CNC and RFC into the ETC will lead to
synergies and thus to cost and time savings for public authorities (e.g. less costs for
related studies due to the reduction of overlaps). Similarly, costs for public authorities
will be reduced through the streamlining of reporting requirements already under PO1
which however could not be quantified.
In terms of timing, the costs would increase after the adoption of the revised TEN-T
Regulation in order to adjust to the new standards and requirements introduced in the
revised Regulation (both for Member States and EC / European Coordinators); however,
one should expect a reduction of the cost increases once the adaptations have been
integrated after the first four years of implementation. Overall, the additional
administrative costs relative to the baseline are moderate, especially compared with the
ambitious revision plans under PO2 and even more so under PO3.

60
In PO2, in the first four years after the adoption the Commission would have to spend on
average EUR 1.601 million per year relative to the baseline. In the following period, net
costs for the Commission are estimated at EUR 536,000 per year (i.e. EUR 715,000
additional costs and EUR 179,000 savings per year). Costs for Member States’ public
authorities are estimated to be lower, at EUR 931,000 per year in the first 4 years and
EUR 389,000 per year for the following years of the implementation of the revised TEN-
T Regulation. Private sector (such as operators on the infrastructure and hauliers,
transport associations etc.) would incur net costs of EUR 1.265 million per year in the
first 4 years and EUR 224,000 per year in the following period (i.e. EUR 1.375 million
costs per year and EUR 110,000 savings per year in the first 4 years; EUR 370,000 per
year additional costs in the first 4 years and EUR 146,000 savings per year for the
following period). Expressed as present value over 2021-2050, net costs for the public
authorities are estimated at EUR 17.6 million (i.e. EUR 10.6 million for the Commission
and EUR 7 million for Member States public authorities) and those for the private sector
at EUR 6.3 million.
In PO3, in the first four years after the adoption the Commission would have to spend on
average EUR 2.39 million per year relative to the baseline. In the following period, net
costs for the Commission are estimated at EUR 800,000 per year (i.e. EUR 1.067 million
additional costs and EUR 267,000 savings per year). Costs for Member States’ public
authorities are estimated to be lower, at EUR 1.275 million per year in the first 4 years
and EUR 533,000 per year for the following years of the implementation of the revised
TEN-T Regulation. Private sector (such as operators on the infrastructure and hauliers,
transport associations etc.) would incur net costs of EUR 1.733 million per year in the
first 4 years and EUR 306,000 per year in the following period (i.e. EUR 1.883 million
costs per year and EUR 150,000 savings per year in the first 4 years; EUR 506,000 per
year additional costs in the first 4 years and EUR 200,000 savings per year for the
following period). Expressed as present value over 2021-2050, net costs for the public
authorities are estimated at EUR 25.4 million (i.e. EUR 15.8 million for the Commission
and EUR 9.6 million for Member States public authorities) and those for the private
sector at EUR 8.6 million.
More details on the administrative costs, drawing on the impact assessment support
study, are included in Annex 4 (section 4).
6.1.5 6.1.5 Impacts on transport activity
An improved infrastructure basis for efficient transport is one of the primary goals of the
creation of the TEN-T. The transport impacts of the policy options have been assessed at
EU27 level, for the entire transport network and also for the TEN-T.113 Figures for the
comprehensive network include the core network.
113 The results cover all mobility segments (i.e. urban, short and long distance traffic, both domestic and
international) for road (excluding powered-two-wheelers), rail (including tram and metro), inland waterways, air (intra-EU traffic) and maritime (intra-EU traffic / Short Sea Shipping). The impacts are shown per type of transport activity (passenger transport, freight transport).

61
6.1.5.1 6.1.5.1 Passenger transport activity
The update of the transport sections and nodes under PO1 will lead to a better network
integration. Similarly, the enhancement of the TEN-T implementation will contribute to
the reinforcement of the sustainable modes of transport and thus have positive effects in
terms of passenger rail transport activity.
Passenger transport activity is particularly influenced by the introduction of the 160 km/h
line speed standard for passenger rail core network lines under PO2 by 2050 and
accelerated under PO3 by 2040, with related investments and realisation gradually
phasing in as of 2030 and fully operational by 2050/2040. The thereby increased
attractiveness of the TEN-T rail network is expected to induce a shift to rail.
Under PO2, this results in a reduction of 0.4% of activity by car by 2040 relative to the
baseline and 0.5% by 2050 and an increase of 2.1% of rail passenger transport activity by
2040 and of 3.5% by 2050 for all transport network. Under PO3, the introduction of the
new passenger rail standard is anticipated to 2040 which results in an increase of 3.4% of
activity by rail by that year and a slightly higher impact (3.5%) by 2050 at EU27 level.
Overall, by 2050, PO3 performs quite similar to PO2 with a reduction of 0.4% of activity
by car. Relative to the REF2020, the impacts on rail activity are however much more
significant, resulting in an increase of around 7% by 2050 in PO2 and PO3. As explained
before, the baseline scenario already takes into account the context of the policy
environment achieving the overall 55% emission reduction objective by 2030 and climate
neutrality by 2050. This is the reason for more limited impacts relative to the baseline.
Table 4: Impacts on EU27 total passenger transport activity in the policy options relative to the
Baseline for all transport network, core TEN-T and comprehensive network
% change to
Baseline
Baseline (Gpkm) PO1 PO2 PO3
2030 2040 2050 2030 2040 2050 2030 2040 2050 2030 2040 2050
All transport network
Car 4,532 4,932 5,258 0.0% 0.0% 0.0% -0.2% -0.4% -0.5% -0.2% -0.5% -0.4%
Bus 530 553 579 0.0% 0.0% 0.0% 1.6% 1.8% 1.7% 1.6% 1.7% 1.7%
Rail 591 685 771 0.0% 0.0% 0.0% 0.2% 2.1% 3.5% 0.2% 3.4% 3.5%
Air (intra EU) 602 715 813 0.0% 0.0% 0.0% 0.0% -0.2% -0.4% 0.0% -0.2% -0.3%
Total passenger
transport
6,255 6,885 7,420 0.0% 0.0% 0.0% 0.0% 0.1% 0.1% 0.0% 0.1% 0.1%
Core TEN-T network
Car 917 1,076 1,247 0.0% 0.0% 0.0% 0.0% -0.4% -0.9% 0.0% -0.7% -0.7%
Bus 43 48 51 0.0% 0.0% 0.0% 0.0% -0.3% -0.7% 0.0% -0.5% -0.7%
Rail 273 324 370 0.0% 0.0% 0.0% -0.2% 5.0% 8.4% -0.2% 8.4% 8.4%
Total 1,233 1,448 1,668 0.0% 0.0% 0.0% 0.0% 0.8% 1.1% 0.0% 1.3% 1.3%
Comprehensive TEN-T network
Car 1,424 1,673 1,926 0.0% 0.0% 0.0% 0.0% -0.4% -0.9% 0.5% -0.1% -0.2%
Bus 65 73 77 0.0% 0.0% 0.0% 0.0% -0.3% -0.2% 0.0% -0.3% -0.2%
Rail 380 450 513 0.0% 0.0% 0.0% 0.0% 2.4% 4.6% 1.1% 5.7% 5.7%
Total 1,869 2,195 2,516 0.0% 0.0% 0.0% 0.0% 0.2% 0.3% 0.6% 1.0% 1.0%
Source: ASTRA and TRUST models
Looking at the TEN-T network, PO2 results in an overall increase of 8.4% of rail
transport activity on the core network and of 4.6% on the comprehensive network in
2050 relative to the baseline. In PO3, the anticipated implementation of the passenger
speed measure is coupled with the extension of the TEN-T comprehensive network and
thus projected to increase rail transport activity on the core network by 8.4% and on the
comprehensive network by 5.7% relative to the baseline by 2050.

62
The impact on passenger modal split along the TEN-T shows that the improved
competitiveness of the TEN-T core rail network in both PO2 and PO3 is projected to
result in 1.6 percentage points (p.p.) increase in the rail share on the core network and in
a 0.9 p.p. increase on the comprehensive network by 2050 relative to the baseline. In PO3
however the increase in the rail modal share is higher by 2040 (1.6 p.p. increase for the
core network and 0.9 p.p. for the comprehensive network) relative to PO2 (0.9 p.p.
increase for the core network and 0.5 p.p. for the comprehensive network).
6.1.5.2 6.1.5.2 Freight transport activity
Similarly to the passenger transport, the update of the transport sections and nodes under
PO1 will lead to a better network integration. The enhancement of the TEN-T
implementation will contribute to the reinforcement of the sustainable modes of transport
and thus have positive effects in terms of rail freight transport activity.
Freight transport activity by rail is fostered by the introduction of the P400 loading gauge
measure (on core network sections by 2050 under PO2 and for core and ETC
comprehensive network sections by 2040 under PO3) as well as the extension of some
rail standards from the core to the comprehensive network (22.5 t axle load, 100 km/h
speed for rail freight lines, 740 m train length). In addition, measures with regard to the
last mile accessibility of freight terminals also enhance the operational aspect of rail
freight activity.
This results in an increase of rail freight activity at EU27 level for the entire transport
network by 1.1% by 2040 and by 2.4% by 2050 relative to the baseline under PO2. In
PO3, this results in a 1.6% increase by 2040 and a 3.5% increase of EU27 rail freight
activity by 2050. Relative to the REF2020, the impacts on rail activity are however much
more significant, resulting in an increase of 8.6% by 2050 in PO2 and 9.7% in PO3.
Focusing at the TEN-T only, the measures of PO2 result in an overall increase of 3.5%
on the comprehensive network and of 3.4% of activity on the core network by 2050
relative to the baseline. The extension of the TEN-T standards to the last mile connection
of maritime ports envisaged in PO2 and PO3 is also projected to result in a 0.1% increase
of transport activity at core ports, reflecting also some positive development for SSS. For
PO3, the evolution is as follows: a 5.3% increase of rail freight activity on the
comprehensive network by 2050 and a 3.2% increase of rail freight activity by 2050 on
the core network. The main difference between PO2 and PO3 here is however that the
increase in the rail freight transport activity under PO3 is much more important already
by 2040 than under PO2; hence generating higher leverage effects at a much earlier
stage.
In terms of modal split, the rail sector gains 0.8 p.p. relative to the baseline in PO2 versus
1.2 p.p. in PO3 on the TEN-T comprehensive network and 0.8 p.p. in PO2 and 0.9 p.p. in
PO3 on the core network by 2050 – in both cases to the detriment of the road sector. For
the entire transport network, the modal split of inland modes shows a gain of 0.5 p.p. for
rail and a decrease of 0.4 p.p. for the road sector in PO2 by 2050. In PO3 by 2050, this
leads to 0.6 p.p. increase of rail freight to the detriment of the road mode. The share of
IWW in inland modes remains stable in both POs relative to the baseline and thus does
not lose its competitiveness, despite the slight reduction of 0.2% in the transport activity
relative to the baseline in 2050. Conversely intra-EU maritime traffic which is a proxy

63
for the short sea shipping is projected to slightly increase by 0.1% in PO2 relative to the
baseline and to remain stable in PO3 by 2050. The baseline scenario shows sustained
growth in inland waterways and short sea shipping activity relative to 2015 (19% by
2030 and 44% by 2050), as explained in section 5.1, despite not delivering on the SSMS
milestone.
As regards IWW, it should be highlighted that the modelling of inland waterways is not
differentiated by seasons, thus different water levels and consequently different
navigation status is not explicitly considered in the model. Notwithstanding the
constraints on the developments of IWW traffic (hydrography, obstacles to develop
infrastructure on free flow rivers because of the impact on biodiversity), the
implementation of the good navigation status would lead to a more reliable infrastructure
for inland waterway transport, increasing its attractiveness and potential.
Table 5: Impacts on EU27 total freight transport activity in the policy options relative to the
Baseline for all transport network, core TEN-T and comprehensive network
% change to
Baseline
Baseline (Gtkm) PO1 PO2 PO3
2030 2040 2050 2030 2040 2050 2030 2040 2050 2030 2040 2050
All transport network
Road 2,156 2,293 2,498 0.0% 0.0% 0.0% 0.0% -0.1% -0.3% 0.0% -0.2% -0.4%
Rail 569 670 752 0.0% 0.0% 0.0% 0.0% 1.1% 2.4% 0.0% 1.6% 3.5%
IWW 172 186 201 0.0% 0.0% 0.0% 0.0% -0.2% -0.2% 0.0% -0.2% -0.2%
Maritime
(intra EU)
1,336 1,483 1,659 0.0% 0.0% 0.0% 0.0% 0.1% 0.1% 0.0% 0.1% 0.0%
Total freight
transport
4,234 4,632 5,111 0.0% 0.0% 0.0% 0.0% 0.1% 0.3% 0.0% 0.2% 0.3%
Core TEN-T network
Road 1,023 1,127 1,218 0.0% 0.0% 0.0% 0.0% -0.4% -0.8% 0.0% -0.7% -1.5%
Rail 370 430 475 0.0% 0.0% 0.0% 0.0% 1.1% 3.4% 0.0% 1.7% 3.2%
IWW 154 168 178 0.0% 0.0% 0.0% 0.0% -0.1% -0.1% 0.0% -0.1% -0.1%
Total 1,546 1,724 1,871 0.0% 0.0% 0.0% 0.0% 0.0% 0.3% 0.0% -0.1% -0.2%
Comprehensive TEN-T network
Road 1,435 1,561 1,674 0.0% 0.0% 0.0% 0.0% -0.5% -0.9% 0.3% -0.5% -1.3%
Rail 502 581 643 0.0% 0.0% 0.0% 0.0% 1.5% 3.5% 1.1% 3.5% 5.3%
IWW 154 168 178 0.0% 0.0% 0.0% 0.0% -0.1% -0.1% 0.0% -0.1% -0.1%
Total 2,090 2,309 2,495 0.0% 0.0% 0.0% 0.0% 0.0% 0.3% 0.5% 0.5% 0.5%
Source: ASTRA and TRUST models
6.1.5.3 6.1.5.3 Impacts on congestion
The reduction in the external costs of inter-urban road congestion for passenger cars and
freight HDVs is estimated at around EUR 2,185 million in PO2 and EUR 2,891 million
in PO3 relative to the baseline over the 2021-2050 period, expressed in present value.
This is mainly due to the shift of transport activity to more sustainable modes of transport
and the consequent reduction of road traffic.
6.2 6.2 Social impacts
The social impacts stemming from infrastructure policy are diverse in nature. For the
purpose of this impact assessment, the focus has been put on employment, road safety,
connectivity and cohesion, accessibility for all users and impacts on health.
6.2.1 6.2.1 Impacts on employment
Higher investments on the TEN-T affect both the economy’s short- and long-term growth
and create employment. Jobs are created directly during the construction phase of
infrastructure projects but also indirectly – induced through new opportunities generated

64
by improved connectivity and greater EU cohesion. TEN-T investments lead to an
increase in gross value added per sector of activity which is a positive driver for
employment. On the other hand, higher productivity driven by technological progress can
dampen employment. This however would not offset the positive effect on employment
stemming from higher gross value added. All policy options are expected to have a
positive impact in terms of employment relative to the baseline. The impacts in 2030 are
limited in both PO2 and PO3 (0.1% increase in employment relative to the baseline).
However, the impacts are projected to be higher by 2050, relative to the baseline (0.4%
increase in employment in PO2 and 0.5% increase in PO3). This is equivalent to 652,000
additional persons employed in PO2 in 2050 relative to the baseline and 840,000
additional persons employed in PO3. Hence, PO3 projections show the highest increase
in employment due to direct and indirect economic effects of investments made.
Table 6: Impacts on EU27 employment in the policy options relative to the Baseline
Employment Baseline (million persons) PO1 PO2 PO3
2030 2040 2050 2030 2040 2050 2030 2040 2050 2030 2040 2050
Employment (%
change to the
baseline)
186 183 179 0.0% 0.0% 0.0% 0.1% 0.2% 0.4% 0.1% 0.3% 0.5%
Employment
(diff. to
baseline, in
thousand
persons)
0 0 0 141 376 652 200 561 840
Source: ASTRA model
Similarly to the impact on GDP, the impacts on employment vary country by country.
Higher employment increase in absolute terms correspond to larger Member States such
as Italy, France, Spain, Poland and Germany (see Figure 5).
Figure 7: Impacts on employment in the policy options, by Member State, relative to the Baseline
(PO2 – left side; PO3 – right side)
Source: ASTRA model
6.2.2 6.2.2 Road Safety
Road safety is addressed by the TEN-T revision through the obligation to ensure
minimum road safety standards (i.e. motorway) on the core and comprehensive network,
the minimum level of safe and secure parkings every 100 km on the core network as well
as rest areas every 60 km. To be noted that adequate facilities are a condition to attract
more women as transport workers, and hence PO2 and PO3 would have positive impact
in this respect.
Concretely, this results in a decline of fatalities and injuries from road transport by 0.4%
and 0.5% by 2050 in PO2 and PO3, respectively, relative to the baseline for the entire
0
50,000
100,000
150,000
200,000
250,000
AT
BE
BG
CY
CZ
DE
DK
EE
EL
ES FI
FR
HR
HU IE IT LT
LU
LV
MT
NL
PL
PT
RO
SE SI
SK
ad
dit
ion
al e
mp
loym
en
t [P
ers
]
2030 2040 2050
0
50,000
100,000
150,000
200,000
250,000
AT
BE
BG
CY
CZ
DE
DK
EE
EL
ES FI
FR
HR
HU IE IT LT
LU
LV
MT
NL
PL
PT
RO
SE SI
SK
ad
dit
ion
al e
mp
loym
en
t [P
ers
]
2030 2040 2050

65
network. At core network level, the positive effect on the reduction of fatalities from road
transport is higher (0.8% in PO2 and 2.2% in PO3) and also on the reduction of injuries
(1.1% in PO2 and 2.2% in PO3) by 2050. As regards PO1, even if effects are not
quantifiable, PO1 is crucial for generating the impacts under PO2 and PO3. Indeed, it is
under PO1 that the reference to ITS standards, in particular to the provision of road-
safety related traffic information services, is introduced. As such, PO1 is the basis for
leveraging the effects of PO2 and PO3.
The reduction in the external costs of accidents is estimated at around EUR 3,660 million
in PO2 and EUR 3,930 million in PO3 relative to the baseline over the 2021-2050 period,
expressed as present value.
6.2.3 6.2.3 Connectivity and cohesion, including outermost regions
In order to enhance connectivity and cohesion across Europe, it needs to be ensured that
the TEN-T is defined properly and wide enough as to cover all European regions. The
network definition is indeed the essential basis for any action on the TEN-T and it needs
to be guaranteed that the right network is in place for fulfilling the various purposes of
TEN-T. For instance, the AFIR includes obligations on the deployment of alternative
fuels. The revised TEN-T will complement the AFIR by providing the appropriate spatial
coverage for its deployment across the entire TEN-T. PO1, with the adaptation of the
current TEN-T to future needs, is thus crucial for an improved connectivity and cohesion.
Similarly, further benefits can be reached if the entire network – i.e. not only core, but
also comprehensive network – reach the respective standards. In that sense, PO2 (and
hence PO3) with the planned extension of key TEN-T requirements and standards from
the core to the comprehensive network adds important value to the aspect of regional
cohesion. For instance, many freight activities start and end outside of the defined (rail
freight) corridors. Therefore, improving the conditions on the corridors is not enough to
improve the quality of service for the customers. In the same vein, all measures related to
freight terminals and multimodal passenger hubs under PO2 will contribute to an
improved connectivity.
Connectivity and cohesion of all regions can only be reached if the TEN-T are
completed. Even if single infrastructure projects increase the connectivity of parts of the
network, the entire network will only fully function and exploit its entire potential once
all missing links and bottlenecks are removed. In this regard, PO3, with the acceleration
of deadlines for the completion of the network, adds major benefits to the aspect of
connectivity. In addition, PO3 adds an important dimension to the cohesion objective of
TEN-T by better defining (and integrating) the urban nodes, which play a crucial role for
regional connectivity. It will ensure better coherence between long-distance traffic flows
and last mile deliveries. The current lack of coherence between these two dimensions
leads to bottlenecks in and around cities (leading to congestion and pollution).
As regards the outermost regions (OR), they face particular challenges in terms of
physical accessibility due to their remoteness. During the OPC, the importance of
improving the accessibility of the OR was underlined. In addition, stakeholders called
upon the Commission to ensure that EU transport infrastructure policy focuses on
completing the transport network in these regions. These requests derive from Article
349 of the TFEU that provides for specific EU measures tailored to the outermost

66
regions’ constraints and from the 2017 Commission Communication114 on a strategic
partnership with the OR which calls for their accessibility deficit to be reduced. Still, the
transport needs are different for each OR, resulting from differences in population size,
structure of the economy and geographical location. Overall, the OR rely on air and
maritime transport connections to access their mainland and other EU countries as well
as neighbouring countries. At the same time, their inner connectivity is equally important
and many of these regions still face huge challenges in this respect. PO1 is adding
positive impact to the connectivity of the OR by ensuring that the TEN-T includes the
necessary infrastructure (ports and airports) needed to ensure optimal connectivity of
these regions. In addition, the transport network of the OR is particularly affected by
extreme weather conditions (including hurricanes) and climate change. Therefore, all
measures to increase the resilience of the network under PO2 also contribute positively to
the needs of the OR (notably through the introduction of standards and specific
provisions for maintenance). Accessibility and connectivity of OR will also be enhanced
by reinforcing the short sea shipping dimension under PO2 and by expanding TEN-T
policy on urban nodes as foreseen under PO3115.
6.2.4 6.2.4 Accessibility for all users
As regards passenger transport, the taking up of public transport can be fostered by
improving the design of the transfer terminals. This includes measures to ensure the
accessibility for all users or the provision of information across modes (also covering
first/last mile connections). The design of terminals should encourage also the uptake of
innovative mobility services and of better accessibility to all users. An important role
plays for instance the location of a rail station and its integration in the urban and
regional public transport networks.
The review of the TEN-T under PO1 will ensure that infrastructure will be developed
where it is needed. For example the inclusion of an airport into the TEN-T should be an
important trigger to improve its connectivity to the respective urban node and the
local/regional (public) transport networks. PO2 introduces new elements for passenger
transport. This should contribute to the better (including gender/equality sensitive) design
of passenger terminals and has been simulated in the modelling by assuming a reduction
of the time needed to access public transport modes. Depending on the state of the node,
measures could include modernization and interior refurbishment of trading areas,
technical building equipment, new lighting as well as solutions for barrier-free
accessibility. However, in PO2, the measure is limited to the urban nodes currently listed
in the Regulation, with a time horizon of 2050. PO3 expands the scope of application to
the 460 nodes and advances the deadline to 2040, thereby leading to faster and more
important results.
114 Communication on ‘A stronger and renewed strategic partnership with the EU's outermost regions’,
COM(2017) 623 final. 115 As the outermost regions are at NUTS2 level, the approach taken in PO3 ensures that there will be at
least one urban node identified for each outermost region. See TEN-T evaluation (case study 1 on urban nodes: https://op.europa.eu/en/publication-detail/-/publication/42610a34-4c16-11ec-91ac-01aa75ed71a1/language-en/format-PDF/source-243059327)

67
6.2.5 6.2.5 Impacts on health
Enabling higher use of more sustainable transport modes would result in reduced air
pollutant emissions and subsequent positive impacts on public health. Savings in external
costs of air pollutants are estimated at 413 million EUR in PO2 and 420 million EUR in
PO3, expressed as present value over 2021-2050. A reduction of air pollutant emissions
would be particularly relevant in urban nodes. Here the extension of the concept of urban
nodes and the related increase in the use of SUMPs and active modes of transport in
almost 460 cities across the TEN-T network in PO3 is expected to have a positive
impact. In addition, some positive benefits from a reduction of noise impacts through the
anticipated electrification of rail can be expected under PO3.
6.3 6.3 Environmental impacts
The analysis of environmental impacts covers CO2 emissions and air pollutant emissions
and a qualitative analysis of the impacts on noise, biodiversity and water. The TRUST
and ASTRA models have been used to quantify the impacts of the POs on CO2 emissions
and air quality. They build on the baseline scenario which is already very ambitious in
terms of emission reductions and includes the ‘Delivering the European Green Deal’
initiatives. In addition, measures targeting efficiency improvements (and hence emission
reductions) of road transport through further digitalisation have not been quantified in the
context of this impact assessment but are part of the revision of the ITS Directive.
Impacts such as noise, biodiversity and resilience cannot be quantified at TEN-T level as
they are often project specific and depend on the local environmental and infrastructural
conditions. Thus they are assessed in a qualitative manner in the following chapter.
6.3.1 6.3.1 CO2 emission reduction
The reductions in CO2 and air pollutant emissions are mainly driven by measures
fostering modal shift to less polluting modes. PO1 ensures that the revised AFIR and ITS
Directives apply to the most updated TEN-T network, taking into account the change of
traffic flows. However, the quantitative impacts are taken up in the respective impact
assessments for the AFIR and ITS directive. Thus, no further impacts of PO1 on
emissions are reported relative to the baseline. It can be expected that through the
stimulus to foster electrification of road transport by the combination of TEN-T and
AFIR revisions, the Clean Air Policies on the TEN-T are fostered as well already in PO1.
The CO2 emissions for the entire transport network116 and for the TEN-T core and
comprehensive network, respectively, are provided in Table 17 (Annex 4, section 4).
The shift from road to less emitting modes enabled by the bundle of measures included in
PO2 and emission reductions in the road sector are projected to result in a decline by
0.2% of CO2 emissions from total transport by 2040 and by 2050 relative to the baseline.
PO3 projects broadly the same emission reductions for the entire transport network.
Relative to the REF2020, the impacts on CO2 emissions are however much more
significant, resulting in a decrease of around 7% in 2030, 57% in 2040 and 89% in 2050
for both PO2 and PO3. As explained before, the baseline scenario already takes into
116 Excluding P2W and maritime.

68
account the ‘Delivering the European Green Deal’ initiatives, achieving the overall 55%
emission reduction objective by 2030 and climate neutrality by 2050.
When looking more in-depth on the TEN-T, PO2 shows a reduction of CO2 emissions
from transport on the core network of 0.3% and on the comprehensive network of 0.4%
in 2040 and in 2050 relative to the baseline. It should be noted that TEN-T results for
PO3 are computed on an extended TEN-T comprehensive network compared to PO2 and
the baseline (inclusion of new sections due to integration of CNC and RFC and dual use
sections). Thus, the PO3 is not directly comparable with the baseline and PO2. This also
affects the PO3 results reported for the other air pollutant emissions. The changes in 2030
relative to the baseline are only derived from this extension and do not stem from
network improvements which take effect only in the following years. CO2 emissions on
the comprehensive network are projected to decrease by 0.1% in 2040 and by 0.3% in
2050 relative to the baseline. On the TEN-T core network, PO3 is projected to result in a
decrease of CO2 emissions of 0.4% in 2040 and in 2050 relative to the baseline.
Reductions are mainly driven by the reduction in road transport activity. Due to the full
electrification of the rail core network (already provided for in the current TEN-T
Regulation), no additional CO2 emissions from rail are assumed as of 2030 on the core
network. Savings in external costs of CO2 emissions relative to the baseline, expressed as
present value over 2021-2050 are estimated at 357 million EUR in PO2 and 387 million
in PO3.
6.3.2 6.3.2 Air Pollutant emissions reduction
CO emissions: The bundle of measures in PO2, aiming at shifting transport activity to
less polluting modes, leads to certain reductions in air pollutant emissions. On the entire
transport network, the CO emissions are projected to decline by 0.1% in 2030 and 2040
relative to the baseline and by 0.2% in 2050. CO emissions from road transport reduce by
0.2% in 2030 and 2040 relative to the baseline and only by 0.1% in 2050. This is mainly
due to the large scale deployment of low- and zero-emission vehicles fostered by the CO2
emission standards for vehicles and supported by the revision of AFIR that is already
assumed under the baseline scenario. Consequently, due to the low level of emissions
already projected in the baseline by 2050 the measures included in PO2 targeting at a
shift to less polluting modes only have a marginal effect on further emission reductions
especially in road transport. The picture for CO emissions in PO3 is broadly similar to
that in PO2.
NOx emissions: NOx emissions from transport on the entire transport network in PO2
are projected to decline by 0.1% in 2040 and 0.2% in 2050 relative to the baseline, while
NOx emissions from road transport are projected to reduce by 0.2% in 2040 and 2050.
The situation on the TEN-T network is relatively similar to the projections for the entire
transport network, although the impacts for the comprehensive network are slightly
higher (0.4% reduction in 2040 and 0.3% in 2050 relative to the baseline). The impacts
for the core network are the same as those for the comprehensive network.
NOx emission reductions for the entire transport network are the same between PO2 and
PO3 but differences occur when looking at the TEN-T network. Overall, NOx emissions
from the inland modes on the comprehensive network are projected to decrease by 0.3%
in 2040 and 0.4% in 2050 compared to the baseline. NOx emissions on the core network

69
are projected to decrease by 0.7% in 2040 and by 0.4% in 2050. The NOx emissions for
the entire transport network117 and for the TEN-T core and comprehensive network
respectively, are provided in Table 18 (Annex 4, section 4).
PM emissions: PM emissions from transport on the entire transport network in PO2 are
projected to slightly increase by nearly 0.5% in 2050 relative to the baseline. This
however is not linked to the energy/fuel use but can be explained by increased PM
emission from rail transport due to higher wear and tear118, as a consequence of increased
rail freight activity. PM emissions from road transport are projected to decline by 0.2% in
2050 relative to the baseline due to lower activity. In the case of inland waterways the
increased availability of clean fuels brought by the revision of the AFIR will have a
positive impact on air pollution. PM emission reductions are similar between PO2 and
PO3.
VOC emissions: VOC emissions from transport on the entire transport network in PO2
are projected to decline by 0.1% and those from road transport are projected to remain
stable in 2050 relative to the baseline. When looking at the TEN-T, VOC emissions are
projected to decrease by 0.1% relative to the baseline in 2050 on the core network and by
0.2% on the comprehensive network. No VOC emissions for rail are projected by 2050
on the comprehensive network and as of 2030 for the core network, due to the
electrification of rail. The results for PO3 are similar to those of PO2 for the entire
transport network and the comprehensive TEN-T network and slightly higher for the core
network by 2050 (0.2% reduction relative to the baseline).
6.3.3 6.3.3 Impacts on noise, biodiversity and water
Assessment of noise impacts strongly depends on the local (traffic) situation e.g. the
pavement of road, roadside buildings, the configuration of an inland waterway etc., thus
it is not possible to quantify local noise impacts in a European scale model. Apart from
this, noise emissions depend on the mode of transport, the vehicle fleet composition and
the travel speed.119 As the TEN-T revision aims at shifting more traffic to more
sustainable modes of transport the level of noise reduction is directly related to the
magnitude of the shift under each PO (i.e. increasing from PO1 to PO2 and from PO2 to
PO3). Further noise reductions may be achieved through the electrification of cars, vans
and trucks especially in urban areas which is outside the scope of the TEN-T revision.120
117 Excluding P2W and maritime. 118 Emission from wear and tear are currently not part of EMEP/EEA Guidebook, which does not consider
non-exhaust emissions of rail transport as a separate category, so reporting with respect to the emission inventory is not clear. However, it is included here for sake of completeness.
119 To solve the noise from transport, where the Environmental Noise Directive (2002/49/EC) impose action plans to be adopted by the infrastructure authorities, infrastructure solutions are the preferred option e.g. for roads the combination of road surface improvements and speed reduction, for railways the rail track requirements (e.g. railpad and rail grinding) and for airports flight routes around airports.
120 Noise in the majority of the real situations depends, for road vehicles, on tyres and road surface, for railway on quality of wheels and rails, and for aircrafts on engines and aircraft frame. Electric vehicles are sometimes associated with ‘no noise’ pollution which is however not the case. As a result, very little benefits are foreseen by a renewal of the fleet. By 2030 an increase of noise is foreseen for all modes relative to 2015 due to the increase of the number of vehicles. By 2050 the increased number of electric vehicles could lead, for road only, to a limited benefit in terms of noise reduction. The

70
However, by ensuring the equipment of terminals and parkings with charging
infrastructure, TEN-T will also contribute to this effect. On the other hand shifting traffic
from road to rail and inland waterways will lead to higher traffic, and thereby more noise,
along rail lines and waterways. In the case of rail this is addressed through equipping
further rail freight waggons with low noise brakes and through the positive effect of
electrification on noise levels of railway lines, the latter being a measure already foreseen
in the Regulation but which is going to be implemented more widely in PO3. In limited
cases, noise disturbances for biodiversity on inland waterways (e.g. at specific periods of
species cycles) will need to be taken into account when implementing specific
projects121.
Impacts on biodiversity loss and potential conflicts with the do no significant harm
principle (DNSH) emerging from the Taxonomy Regulation (Reg. EU 2020/852),
NATURA 2000 sites as well as the Water Framework Directive (WFD) are difficult to
assess and quantify considering that impacts are generally depending on the specific
location and characteristics of the infrastructures and that the good navigation status
standards will mostly be defined at corridor level. It is expected however that they will
remain minor as none of the POs foresees a major extension of the TEN-T by adding new
infrastructure sections and rather focus on improvements on the existing network122.
Positive effects can also be expected; for example the implementation of the “Good
Navigation Status” and specific navigability requirements depending on the corridor will
ensure a balance between the objective of improving navigability conditions (thus
increasing the capacity of IWW for freight) and biodiversity (no infrastructure
developments which could lead to a negative impact on biodiversity, even if such
development could potentially improve navigability). This new approach will enhance
predictability concerning the use of the IWW (guaranteed minimum navigability for a
certain period of the year).
Other measures included in this revision rather focus at a better use and efficiency of
existing infrastructure e.g. through higher speeds, higher axle loads or the extensions of
terminals and sidings. In case modifications or extensions of infrastructure are necessary,
they are likely to be located in close vicinity of existing infrastructures, thus limiting
adverse effects on biodiversity. Nevertheless, new 740 m sidings, extension of terminals,
upgraded last mile connections or additional parkings and rest areas along the road
network, as foreseen in PO2 and 3, all will require surface area and will thus contribute
to biodiversity loss and soil sealing. In the case of inland waterways the increased
availability of clean fuels and electrification brought by the revision of the AFIR will
likely have a positive impact on water pollution along the TEN-T which will to some
impacts are limited unless other specific measures are adopted that benefit the fleet renewal and at the same time target noise, as well as CO2 and air pollutant emissions reductions.
121 Here innovative pollution and noise monitoring systems (developed by EU funded projects) should also be part of the solution.
122 The alignment of the TEN-T comprehensive network with RFCs and military mobility will result in nearly 5.600 km of railways and nearly 2,000 km of roads to be added. These extensions represent 5% of the currently defined TEN-T rail network and 1.9% of the road network. Although the infrastructure is already largely existing, any plans for its further upgrade and any additional extensions would have to be assessed at project level in light of the requirements of Directive 2001/42/EC122 and other applicable EU legislation (in particular, Directive 92/43/EEC), to contribute also to the DNSH compliance.

71
extent compensate the adverse effects of increased transport activity. However, as long as
the exact location and size of an infrastructure is not known, the precise impact on loss of
biodiversity and soil sealing cannot be established. Thorough environmental impact
assessment (EIA) in accordance with Directive 2011/92/EU123 will thus remain key to
establish the risks and adequate mitigation measures (e.g. brownfield re-cultivation or
rehabilitation) at project level. In addition, any project that may affect water bodies, in
the sense of the WFD, should be subject to additional assessment in accordance with
article 4(7) of the WFD so as to ensure full compliance with the conditions and
mitigation measures required thereunder.
Overall, the implementation of the TEN-T Regulation will however assure that the
DNSH principle is being respected since all standards and requirements set in the TEN-T
Regulation are geared towards a sustainable development of transport networks.
6.4 6.4 Impacts on resilience of the transport infrastructure incl. maintenance
As described in chapter 2.2 resilience of transport networks is understood as the ability of
the transport system to withstand and mitigate disruptions as well as to recover readily
from or to adjust easily to disruptions so that major breakdowns are avoided. Resilient
engineering of transport systems can be fostered by distribution (e.g. de-central
warehousing), redundancy (e.g. alternative routes), adaptive technologies/organisations
(e.g. flexible supply chains) or flexible control (e.g. change from automatic to manual
vehicle control). Different types of disruptions are possible and have to be treated with
different instruments: natural events, in particular events driven by climate change;
human failures and technical failures and maintenance.
Natural events
The analysis looked more closely at the effects that natural events could have on the
smooth flow of passengers and goods on the TEN-T. Events such as extreme weather
conditions (e.g. flooding, heavy rain and snow fall, thunderstorms, extreme tidal events,
fires etc.) affected the transport system already in the past but are, due to climate change,
likely to occur more frequently and become more severe in the future. In addition, newer
effects of climate change like extreme temperatures in summer times and extended
periods of drought need to be taken account of. The effects of such disruptions are felt by
all actors of the transport system (e.g. infrastructure managers, operators, clients) and
affect all modes of transport.
There are currently no dedicated studies on the resilience of the TEN-T. Thus in the
impact assessment an attempt was made to showcase the vulnerability of the TEN-T with
regard to river flooding (see Annex 7). The analysis revealed that higher flooding levels
(of a flooding event occurring once every twenty years) of 1 to 5 meters and of above 5
meters can be expected in particular in Central Europe starting from the Netherlands, the
Northern part of Germany, the valley of the river Po in Northern Italy and Slovakia,
Austria, Slovenia, Hungary and Croatia. In some areas the expected water heights would
123 Directive 2011/92/EU on the assessment of the effects of certain public and private projects on the
environment (OJ L 26, 28.1.2011), as amended by Directive 2014/52/EU (OJ L 124, 25.4.2014).

72
reach more than 20 m above normal water levels. Overall, about 6% of the TEN-T rail
network is at risk by 1-in-20-year flooding events and about 4% of the TEN-T road
network. However, there are marked differences between individual Member States (see
tables Annex 7). Apart from the line infrastructures, ports are especially vulnerable to
flooding events; thus it is not surprising that the analysis revealed 21% of all TEN-T
ports being potentially affected by such a 1 in 20 year flooding event.
The three policy options differ in terms of their potential to address issues of climate
change and the adaptation to it. PO1 will contribute to increase the resilience of the
network as this objective is considered, for example by including alternative routes that
could be used in case of natural disaster to ensure continuity of traffic flow. The
inclusion of some cross-border missing links into the network will also substantially
enhance the resilience of the network (cfr the Rastatt accident124). It will also contribute
to better adapt the infrastructure to climate change through the update of existing
infrastructure quality requirements and standards already provided for in the current
Regulation in terms of resilience. PO2 includes the largest amount of investment into
infrastructures. The upgrades or building of new infrastructure will in future have to
consider the challenges of climate change; it can be expected that PO2 will lead to an
improved adaptation of the TEN-T to those challenges. For example, dedicated measures
for climate change adaptation will likely be taken simultaneously with investments to
increase rail line speeds to 160 km/h, to raise axle loads to minimum 22.5 t, to ensure the
inland navigation requirements and to improve the last mile connections to ports. As PO3
adds slightly more investment on selected network links and nodes compared to PO2 also
its contribution to better adaptation of TEN-T can be expected to be moderately higher.
Human failures
Human failures in most cases lead to relatively small disruptions of the transport system,
although the sum of failures cause high economic and social losses. Human failures
causing serious disruptions in waterway transport (e.g. collisions of barges with bridge
pillars) or rail transport (e.g. operating errors with signalling boxes; neglecting speed
limits) are rare events. PO1 would address the risk of human failures beyond the
requirements that are already foreseen in the current Regulation (digitalisation measures
in the different modes such as ERTMS, VTMIS etc.) through the focus on an increased
infrastructure quality and by ensuring that especially ITS requirements are adhered to.
The additional digital improvements and the new and more ambitious infrastructure
requirements and standards in PO2 and PO3 will further reduce the risks of human
failures. The acceleration of the completion of certain parts of the TEN-T and the
deadline for decommissioning national class-B systems in favour of ERTMS under PO3
would bring additional benefits in this regard.
Technical failures and maintenance
124 An appropriate alternative route was available on the French side of the upper Rhine valley. However,
different railway technology and unavailability of French locomotive drivers have prevented from using such alternatives such that the transport capacity on the Rhine-Alpine corridor dropped substantially for three months.

73
Technical failures with the transport infrastructure are often caused by insufficient
maintenance and replacement investments. In advanced EU economies the investment
needs for replacement is already higher than the needs for new investments125. Many
engineering structures (bridges, tunnels) have been designed decades ago for much lower
traffic and weight loads than they have to carry today.
Increasing maintenance expenditure and replacement investments can contribute to
develop better alternatives in case of incidents and to a better resilience of the transport
system. The prime goal of reducing renewal and maintenance backlogs is to improve the
reliability and availability of infrastructure and, consequently, the punctuality and
reliability of transport services. Furthermore, it is expected that the number of
contingencies can be reduced, and resilience increased. This is because in the course of
major renewal works usually also protect against land slide, widening of distance to
woods and wind shelters are installed. Alternative routes play an important role for use in
case of contingencies on main routes but need to be well prepared in advance and ideally
should have the same technical parameters as the main route. In addition, a resilient
transport system requires adequate possibilities to re-route traffic during disruptions. Due
to low density of the network, this is a particular challenge for rail transport. The
Handbook prepared by RNE and PRIME126 has been developed to support business
continuity following major disturbances, which contributes to a higher resilience of the
rail system. Such organisational measures presuppose the existence of adequate routes to
divert traffic. This underlines the importance to extend some of the infrastructure
parameters applicable to the core network to the comprehensive network in PO2 and
PO3.
PO1 would address the risk of technical failures in so far that it ensures an update of the
existing requirements and standards within the parameters of the current Regulation to
ensure a high quality infrastructure throughout the network. For example by clarifying
the provision on 740 m long trains additional capacity, especially on diversionary routes,
could be made available in cases of technical failures on the main line. In addition, it
would ensure complementarity with the upcoming ITS requirements. Furthermore,
through the improved reporting and monitoring foreseen under PO1, the impacts of the
lack of maintenance could possibly be detected if this leads to non-compliance with the
minimum standards (e.g. reduced maximum speed on certain sections which have not
been maintained).
The status of maintenance and infrastructure quality on average will be improving and
the occurrence of technical failures will be decreasing with higher investments in
upgrades of infrastructures (e.g. due to new or extended TEN-T standards) or in new
infrastructures. Thus, POs that foresee a higher amount of investment will perform better
than those involving less investment. The largest relative improvement to well
maintained and good quality infrastructure would come from PO2 as this option provides
for the highest additional investment. However, as PO3 builds on PO2, the absolute
improvements under this option would be even higher.
125 In Germany this accounts for more than two thirds of transport investments for road and rail. 126 European Rail Infrastructure Managers Handbook for International Contingency Management

74
Investments under PO2 will support the reduction of technical failures both emerging
from under-investment in maintenance as well as from applying outdated technologies
(e.g. signalling systems). PO3 in particular will improve on the latter as national class B
systems will be decommissioned and replaced by ERTMS on the core and
comprehensive network.
The introduction of minimum quality standards for maintenance and project life cycle
standards as foreseen under PO2 and PO3 will contribute to address in the longer run the
issue of maintenance, while fully respecting subsidiarity. For instance, digitalisation may
improve infrastructure quality when it supports and reduces cost of maintenance by
integrating intelligence (e.g. sensors that monitor infrastructure status) into the
infrastructure. In PO3, the alignment with RFC will allow to provide for alternative
routes in case of traffic disruptions on main railway lines. Including these alternative
routes into the TEN-T ensures that they will reach full interoperability, enhancing
thereby the resilience of the railway system. PO3 should also ensure higher coherence
between the (civilian) TEN-T and the EU military network. The network adaptation
(which will include new dual use sections on the network) will enhance the resilience of
the whole network.
Third countries’ foreign investments
In general, third countries’ foreign investments should be welcomed as they will
accelerate the realisation of the TEN-T. However such investments might jeopardize the
objectives of the TEN-T, for example if the new infrastructure does not meet the TEN-T
standards. This has been the case in certain Member States, with infrastructures which
are not interoperable or which do not meet the EU safety standards, which may affect
continuity of transport on the TEN-T, hence public order or security. PO2 and
consequently PO3 will address this failure, by calling for a fully-fledged screening
mechanism of foreign investments.127
7 7 HOW DO THE OPTIONS COMPARE?
The three policy options are compared below with regard to their effectiveness,
efficiency, coherence, proportionality and subsidiarity.
7.1 7.1 Effectiveness
The effectiveness of the three POs is assessed against the general and specific policy
objectives as described in chapter 4. The effectiveness of each policy option in achieving
the objectives is presented in Figure 6.
The three POs, with a gradually increasing degree of ambition, contribute to reach the set
objectives for the TEN-T revision. Indeed, they all contribute to make transport greener
by providing the infrastructure basis to increase activity by more sustainable forms of
transport, by optimising each mode of transport and by ensuring an improved network
quality across the TEN-T. The same applies for the second objective to make the
127 Regulation (EU) 2019/452 of the European Parliament and of the Council of 19 March 2019
establishing a framework for the screening of foreign direct investments into the Union

75
transport network more seamless and efficient, by digitalising the infrastructure and by
better integrating the urban nodes into the network.

76
Figure 8: Key Impacts expected Strongly negative negative O No or negligible impact positive Strongly positive Unclear
PO1 PO2 PO3
Rail transport
Increase competitiveness of Rail Freight transport:
P400
speed up the implementation of ERTMS
extend key core network parameters to the
comprehensive network
align CNCs and RFCs into ETCs
extension of last mile parameters to terminals
maritime/inland ports
digitalisation of freight terminals
one multimodal freight terminal serving each urban
node
additional requirements for terminals in terms of new
standards (all types of intermodal loading units can be
handled; 740m long tracks exist under the crane; no
shunting required (includes electrification))
Addresses SO1, SO2, S03, SO4 , SO5, SO6
Impacts of PO1 are not quantifiable
in this field of intervention. However
it is expected that the review of the
transport network and nodes has a
slightly positive impact.
Increase of rail freight activity at EU27
level of 1.1% by 2040 and 2.4% by 2050
relative to baseline. Modal share of rail
freight increases by 0.8 p.p. on the core
network and the comprehensive network
by 2050 relative to the baseline.
Anticipation of the extension of the core network
standards to the non-core sections of the ETC
corridors and of the full implementation of P400
standard on the core network in 2040 result in a
1.6% increase of EU27 rail freight activity by 2040
and of 3.5% by 2050 relative to baseline. Modal
share of rail freight increases by 0.9 p.p. on the core
network and 1.2 p.p. the comprehensive network by
2050 relative to the baseline. Alignment with RFC
will allow to provide for alternative routes thereby
enhancing the resilience of the railway system.
Increase competitiveness of Rail Passenger transport:
160km/h min speed
speed up the implementation of ERTMS
introduce new elements for passenger transport, such
as the design of transfer terminals, accessibility for all
users, information across modes (also covering
first/last mile connections), enabling of innovative
mobility services
digitalisation of passenger terminals
Addresses SO1, SO2, S03, SO4, SO5
Impacts of PO1 are not quantifiable
in this field of intervention. However
it is expected that the review of the
transport network and nodes has a
slightly positive impact.
Increase in rail passenger activity of
2.1% by 2040 and of 3.5% by 2050
relative to the baseline at EU27 level. On
the core network increase by 8.4% and on
the comprehensive by 4.6% by 2050
relative to the baseline. Modal share of
rail passenger increases by 1.6 p.p. on the
core network and by 0.9 p.p. on the
comprehensive network by 2050 relative
to the baseline (0.9 p.p. increase for the
core network and 0.5 p.p. for the
comprehensive network in 2040).
The introduction of the min. 160 km/h standard is
anticipated to 2040 which results in an increase of
3.4% of activity by rail by that year and a slightly
higher impact (3.5%) by 2050 at EU27 level. On the
core network activity increases by 8.4% and on the
comprehensive network by 5.7% relative to the
baseline in 2040 and 2050. Modal share of rail
passenger increases by 1.6 p.p. on the core network
and by 0.9 p.p. on the comprehensive network by
2050 relative to the baseline (1.6 p.p. increase for
the core network and 0.9 p.p. for the comprehensive
network in 2040).

77
Inland Waterway and Maritime Transport
Increase competitiveness of inland waterway transport:
requirements of at least 2.50 m navigable channel
depth for rivers, canals, lakes and inland ports and
5.25 m minimum height under bridges at defined
reference water levels
definition of good navigation status
extension of last mile rail parameters to maritime/
inland ports)
Addresses SO1, SO2, S03, SO5
Impacts of PO1 are not quantifiable
in this field of intervention. However
it is to be expected that the review of
the transport network and nodes has
a slightly positive impact.
Although the modal share of inland
waterway and maritime transport stays
broadly stable, the implementation of the
new standards allows the sector to absorb
the projected growth of EU27 traffic
volumes. Inland waterways and short sea
shipping activity increases by 19% by
2030 and 44% by 2050 relative to 2015.
Although the modal share of inland waterway and
maritime transport stays broadly stable, the
implementation of the new standards allows the
sector to absorb the projected growth of EU27 traffic
volumes. Inland waterways and short sea shipping
activity increases by 19% by 2030 and 44% by 2050
relative to 2015.
Urban Areas
Better integrate urban nodes into TEN-T and improve
conditions for sustainable urban freight and passenger
transport:
obligation for all urban nodes to establish a SUMP
and to report on urban mobility data
obligation to develop multimodal hubs to facilitate
first and last mile connections
one multimodal freight terminal serving each urban
node
Inclusion of all urban nodes above 100.000
inhabitants
Addresses SO1, SO2, SO3, SO4, SO6
Impacts of PO1 are not quantifiable
in this field of intervention. However
it is to be expected that the review of
the transport network and nodes has
a slightly positive impact e.g.
including an airport into the TEN-T
should be an important trigger to
improve its connectivity to the
respective urban node and the
local/regional (public) transport
networks.
Better air quality in TEN-T urban nodes
through SUMPS (not quantifiable).
Better connectivity and accessibility
especially for all users (especially PRMs)
through better design of transfer
terminals, information provisions across
modes and enabling of innovative
mobility services.
But limited to the 79 TEN-T nodes by
2050.
Better air quality in TEN-T urban nodes through
SUMPS (not quantifiable).
Better connectivity and accessibility for all users
(especially PRMs) through better design of transfer
terminals, information provisions across modes and
enabling of innovative mobility services.
Applies to all urban areas above 100,000 inhabitants
and certain capitals of NUTS 2 regions (ca. 460
nodes) by 2040.
Road Transport
Enhance safety and security on roads:
introduce motorway standard
introduce requirements on safe and secure parkings
and rest areas
ITS equipment requirements for roads
Addresses SO1, SO3, SO5
Impacts of PO1 are not quantifiable
in this field of intervention. However
it is to be expected that the
implementation of ITS equipment
requirements on the TEN-T network
(as reviewed) has a slightly positive
impact.
EU27 fatalities and injuries from road
transport are expected to decline
respectively of 0.4% and of 0.5% by
2050. Fatalities on the TEN-T network
decline by 0.8% on the core and on the
comprehensive network. Further positive
effects are to be expected on the working
conditions of HDV drivers and for the
deployment of alternative fuelled
charging stations.
EU27 fatalities and injuries from road transport are
expected to decline respectively of 0.4% and of
0.5% by 2050. Fatalities on the TEN-T network
decline by 1.2% on the comprehensive and by 2.2%
on the core network. Further positive effects are to
be expected on the working conditions of HDV
drivers and for the deployment of alternative fuelled
charging stations.

78
General network
Ensure the adequacy of the governance tools for
implementation of the TEN-T:
Streamlining of existing reporting and monitoring
instruments
Alignment of national transport and investment plans
with TEN-T priorities
Review role of the Coordinators, in particular with
regard to RFC and cross-border projects
Addresses SO6
The streamlining of the reporting and
monitoring is expected to lead to
time savings already under PO1.
In addition to PO1 the alignment of
national transport plans with TEN-T
objectives will help to ensure the timely
completion of the network.
In addition to PO1 and PO2, efficiency gains will be
achieved through the extension of the coordinators
mandates and the streamlining of reporting and
investment planning between RFCs and CNCs.
Ensure that the TEN-T network is well maintained and
resilient:
Introduction of minimum quality standards for
maintenance and project life cycle standards
Align CNCs and RFCs into ETCs
Update TEN-T maps – Military Mobility alignment
MS screen third country investments on the core and
the comprehensive network
Addresses SO5, SO6
Slightly positive impacts through
implementation of ITS requirements
on the TEN-T network and through
the improved reporting and
monitoring i.e. the impacts of the
lack of maintenance could possibly
be detected if this leads to non-
compliance with the minimum
standards.
Positive as maintenance issues are often
addressed when undertaking investments
on the network. Furthermore
digitalisation may improve infrastructure
quality when it supports and reduces cost
of maintenance by integrating
intelligence (e.g. sensors that monitor
infrastructure status) into the
infrastructure.
Positive as maintenance issues are often addressed
when undertaking investments on the network.
Furthermore digitalisation may improve
infrastructure quality when it supports and reduces
cost of maintenance by integrating intelligence (e.g.
sensors that monitor infrastructure status) into the
infrastructure. The network adaptation (which will
include new dual use sections on the network) will
enhance the resilience of the whole network.
Make all modes of transport cleaner and limit the impact
of transport on the Environment and Climate:
Implementation of AFID in all modes on the revised
TEN-T network
Development of alternative fuel infrastructure at
terminals – not covered by AFID)
Assurance of consistency of TEN-T with the ‘Do No
Significant Harm’ principle
Addresses SO1, SO2, SO3, SO4, SO5
Impacts of PO1 are not quantifiable
in this field of intervention. However
it is to be expected that the review of
the transport network and nodes has
a slightly positive impact; it ensures
that the AFIDAFIR requirements are
deployed on the most adequate
network.
CO2 emissions and air pollution (CO,
NOx, and VOC) emissions are declining
compared to the baseline although at a
limited extent. CO2 emissions decrease
by 0.1% in 2030 and by 0.2% by 2050
relative to the baseline. The equipment of
TEN-T terminals with alternative fuelling
stations will have a positive effect on the
deployment and uptake of the related
fuels. The impacts on noise emissions are
expected to remain limited depending on
the specific project situation. Biodiversity
loss will be limited as infrastructure
expansion remains limited. Introducing
GNS requirements will have a positive
effect with regard to IWW.
CO2 emissions and air pollution (CO, NOx, VOC)
emissions are declining compared to the baseline
although at a limited extent. CO2 emissions decrease
by 0.1% in 2030 and by 0.2% by 2050 relative to the
baseline. The equipment of TEN-T terminals with
alternative fuelling stations will have a positive
effect on the deployment and uptake of the related
fuels. The impacts on noise emissions are expected
to remain limited. Biodiversity loss will be limited
as infrastructure expansions remain limited.
Speeding up the electrification of the rail network
under this PO will however have positive impacts.
The introduction of the GNS requirements will have
a positive effect with regard to IWW.

79
However, each PO complies with these objectives at a different degree of ambition. PO1
will provide the right infrastructure basis for the roll-out of alternative fuels and ITS. It is
thus an essential option for decarbonisation and for reducing pollution, with however
limited ambitions and effects. PO2 instead goes the most ambitious steps, with regard to
the decarbonisation, pollution reduction and digitalisation objectives, since it introduces
new infrastructure standards for rail, IWW and terminals, which are key for an increased
multimodality and interoperability of the network. PO3 keeps that degree of ambition in
terms of nature of measures, but adds on it the dimension of an increased speed of
completing the network (i.e. 2040 instead of 2050 for the core and parts of the
comprehensive network) and a broader coverage of the network, which in return assures
that TEN-T contributes timely to the decarbonisation goals by 2050. PO3 is therefore the
most ambitious option.
As regards the third general objective of a more resilient network, PO2 and PO3 respond
to it through a multitude of measures that all aim at raising the quality of infrastructure
components, thereby taking into consideration aspects such as maintenance, nature-based
adaptation to climate change, as well as resilience in relation to potential negative
impacts of foreign direct investments on security and public order interests.
In terms of the fourth general objective of the revision, to improve the efficiency of the
governance tools of the TEN-T Regulation, again all three POs respond to this need, but
PO3 at a much higher level by reinforcing the role of European Coordinators, by
streamlining the corridor instruments CNC and RFC and ensuring coherence between
national investment plans and TEN-T objectives (in particular the corridor work plans).
7.2 7.2 Efficiency
Efficiency concerns the extent to which objectives can be achieved for a given level of
resources or at least cost. The combined measures under the three POs have economic,
social and environmental impacts. The major costs of the policy options come in the form
of investment needs for upgrading the network to reach the objectives of the revised
Regulation. Expressed as present value over 2021-2050, additional investments needs are
estimated at EUR 206.5 billion for PO2 and EUR 247.5 billion for PO3 (PO1 not
implying any hard investments). A high share of those investment costs can be attributed
to two measures (the extension of certain standards from the core to the comprehensive
network; 160 km/h passenger line speed) that in return bring important benefits in terms
of GDP growth, employment and modal shift as well as improved interoperability,
services for passengers etc. Overall, costs for public authorities (EU and national) would
amount to around 99% of the total investment needs.
Economic growth is fostered by all POs, even though no quantitative assessment could
be undertaken for PO1. PO3 has the greatest positive effects at EU27 level in terms of
GDP. Indeed, PO3 leads to a GDP increase of 0.4% in 2030 and 2.4% by 2050 relative to
the baseline. In terms of employment effects, again PO3 produces highest impacts with
200,000 additional persons employed in 2030 relative to the baseline (+0.1%) and
840,000 (+0.5%) by 2050, driven by an increase in labour demand brought by the higher
investments in the transport sector. It should also be noted that many of the effects on
GDP and employment would unfold beyond the time-horizon of 2050 and thus be even
larger than what is currently observed as impact for 2050. Given the advancement of the

80
completion of some standards/network sections to 2040 under PO3 and thus of a
considerable amount of investments, second round effects on demand, productivity and
consumption would also occur earlier.
Improvements of road safety are brought by the extension of the motorway standard and
the related safety features to all network sections above a certain daily traffic threshold
reducing the number of fatalities and injured persons. The reduction in the external costs
of accidents is estimated at around EUR 3,660 million in PO2 and EUR 3,930 million in
PO3 relative to the baseline over the 2021-2050 period, expressed as present value. The
reduction in the external costs of inter-urban road congestion is estimated at around EUR
2,185 million in PO2 and EUR 2,891 million in PO3 relative to the baseline over the
2021-2050 period, expressed in present value.
Regarding the impacts on the environment, PO3 performs quite similar to PO2. The
demand of the rail mode increases under both PO2 and PO3 while the road mode is
losing demand. The substantial investments in rail infrastructures to improve the
standards of the core and comprehensive network stimulate rail demand, both for
passengers and for freight. In return, this modal shift leads to a reduction of CO2 and air
pollutant emissions, despite the growth of freight transport stimulated by the increase of
GDP. In terms of CO2 emission reductions, PO2 and PO3 are relatively on equal footing
although PO3 achieves slightly higher emissions reductions relative to the baseline
earlier (by 2040). Savings in external costs of CO2 emissions relative to the baseline,
expressed as present value over 2021-2050 are estimated at 357 million EUR in PO2 and
387 million in PO3. The positive impacts on the reduction of NOx, CO and VOC
emissions is relatively similar between PO2 and PO3, although similarly to CO2
emissions PO3 achieves slightly higher air pollution emissions reductions earlier (by
2040). Savings in external costs of air pollutants are estimated at 413 million EUR in
PO2 and 420 million EUR in PO3, expressed as present value over 2021-2050.
In addition, all three POs make the TEN-T more resilient to natural events, technical or
human failures, with PO2 and PO3 responding more firmly to such needs. For instance,
PO2 and PO3 address the adaptation to climate change indirectly by investment measures
that upgrade the network to new standards. They also contribute to the objective of the
DNSH principle. Similarly, in terms of network effects, the risk of insufficient
maintenance is addressed indirectly via the upgrade of infrastructure but also through
new standards on maintenance and project life cycle considerations under PO2 and PO3
who perform equally well. In terms of a potential loss of biodiversity and soil sealing
PO1 does not have any effect while PO2 and PO3 would potentially have very limited
adverse effects on those aspects due to space requirements resulting from additional
infrastructure measures.
Administrative costs resulting from the implementation of the revised TEN-T Regulation
are relatively limited and considered justifiable for all three POs compared to the benefits
provided, in particular the economic and employment gains and the enabling of more
sustainable forms of transport. Expressed as present value over 2021-2050, net costs for
the public authorities are estimated at EUR 17.6 million (i.e. EUR 10.6 million for the
Commission and EUR 7 million for Member States public authorities) and those for the
private sector at EUR 6.3 million. In PO3, the net costs for the public authorities are
estimated at EUR 25.4 million (i.e. EUR 15.8 million for the Commission and EUR 9.6

81
million for Member States public authorities) and those for the private sector at EUR 8.6
million.
In terms of governance and monitoring, the POs will build on the already well
established reporting and monitoring instruments which shall be further streamlined
under PO1 (e.g. automated data input in TENtec system). This would allow for efficiency
gains in all three POs. In addition, PO3 foresees to strengthen the role of the European
Coordinators and their work plans – two tools which were judged very cost-effective
according to the results of the evaluation results. As the system is already in place, only
limited additional costs are expected to occur from this measure. Furthermore, by
aligning the CNC and RFC also in terms of reporting, monitoring and investment
planning, certain savings, mostly for MS, can be expected especially under PO3.
7.3 7.3 Coherence
In general terms, there are no issues as regards internal or external coherence. All three
POs are fully in line with the key policy objectives of the Union, in particular regarding
the long-term objective of achieving climate neutrality by 2050. They respond to the
policy ambition of the European Green Deal and the Sustainable and Smart Mobility
Strategy, even if each PO to a different degree of ambition.
PO1 precisely responds to the need to enhance coherence between legislative initiatives,
notably with the AFIR and ITS revisions by providing a quality infrastructure network
basis for the deployment measures developed under these policies. On top of this, PO2
adds several measures that assure coherence at “technical” level, by introducing new
standards and requirements (e.g. assurance of consistency of TEN-T with the DNSH
principle; obligation of all urban nodes to establish a SUMP, taking into account
environmental plans and programmes required by EU acquis). PO2 also adds an
important element of “internal” coherence between the comprehensive and the core
network by extending the core network requirements also to the comprehensive network.
PO3 includes several measures that assure coherence between different policy
instruments, notably through the integration of the two sets of corridors (RFC and CNC)
into one coherent set of ETC. Similarly, PO3 ensures greater coherence with the military
mobility actions by increasing the overlap between the military mobility and the TEN-T
network through the addition of dual-use sections with EU added value into the TEN-T.
Last but not least, PO3 assures that there is greater coherence with urban mobility policy
by integrating urban nodes in a more coherent and substantial way into the TEN-T.
7.4 7.4 Proportionality and subsidiarity
None of the policy options goes beyond what is necessary to reach the overall policy
objectives. The proposed intervention incentivises a shift of transport volumes to more
sustainable modes of transport necessary to deliver on the increased climate ambition for
2030 and the overall objective of reaching climate neutrality by 2050. The POs are
designed to create a coherent policy framework and a coherent, high standard transport
network as the basis for other sectoral policies, e.g. AFIR, ITS, RFCs, Urban Mobility, to
deliver on their objectives. They are designed to avoid disproportionate impacts on public
authorities, operators of infrastructure and mobility service providers, notably by
building on and further developing a well-established governance system. This has been
fully demonstrated in the evaluation of this Regulation and the baseline analysis

82
underpinning this impact assessment. Thus, they fully respect the principle of
proportionality.
Moreover, all three POs are in full respect with the subsidiarity principle. The proposed
level of intervention at EU level is also considered to deliver the highest impact: they aim
at enhancing a trans-European transport network which is by its very nature of EU added
value and would not be created without a harmonised intervention at EU level. This
relates in particular to the measures on urban nodes, included under PO2 and PO3; the
Regulation will include an obligation to establish a SUMP but fully leaves it the regional
and local level how to establish such SUMP; urban nodes will also be required to
develop terminals which are key to ensure efficient last mile connections between the
TEN-T and the urban nodes. As regards maintenance, Member States will retain the main
responsibility. New requirements are limited to an obligation to maintain the same level
of service over the life-time of the infrastructures.
Overall, the specific measures on urban nodes will have important impacts on the better
functioning of the network as a whole. The lack of coherent planning between long-
distance and local/regional transport is contributing to congestion problems and
bottlenecks. The lack of intermodal terminals hinders the increased use of sustainable
transport modes which rely on the use of such terminals which have to be available in a
sufficiently dense way across the EU territory. It is therefore proportionate to foresee
measures at the level of urban nodes, as they have a direct impact on the whole TEN-T
system.
7.5 7.5 Summary of the comparison of options, including stakeholder views
All POs meet the overall criteria in terms of effectiveness, efficiency, coherence and
proportionality/subsidiary. One could conclude their “performance” as follows: PO1 is
the least costly option, but with limited impacts. PO2 is an effective option with very
substantial effects on the TEN-T with regard to increased infrastructure quality, leading
to decarbonisation of the transport system. PO3 is the most effective and efficient option
due to the fact that the high standards of PO2 are implemented at a higher pace and on a
broader network. Even if PO3 is also the option with the highest investments, the
additional 31 billion EUR needed are fully proportional to the gains in economic impacts
unfolding over time. All three POs fully respect the principle of subsidiarity.
Stakeholders are very supportive of a revision of the TEN-T guidelines and the measures
brought forward under the different POs received high affirmation by the majority of
stakeholders that responded to the OPC survey. More importantly, the results from the
consultation activities show that a wide majority of stakeholders expressed a preference
for TEN-T to focus on a combination of measures aiming at decarbonisation,
digitalisation and “hard” infrastructure deployment, corresponding to the policy design of
PO3. Indeed, 34% of the respondents ranked this option as first preferred and an
additional 12% as second. Widest support was given by public authorities (44%),
businesses (35%) and citizens (17%) who ranked this option first.

83
8 8 PREFERRED OPTION
Based on the combined analysis of economic, social and environmental impacts,
acceptance by stakeholders and expected effectiveness, efficiency and proportionality,
the preferred option is PO3 (accelerated and better aligned TEN-T). This option strikes
the best balance between the achieved objectives and the overall implementation costs.
Although these are estimated to be higher compared to PO2 (247.4 billion EUR for PO3,
expressed as present value over 2021-2050, compared to 206.5 billion EUR), the
additional measures introduced under PO3 bring significant benefits in terms of
economic growth and employment between 2030 and 2050. Furthermore, PO3 performs
well in terms of shifting transport activity to more sustainable modes of transport in the
freight and passenger transport sectors on both network layers. Due to the advancement
of the implementation deadline for certain TEN-T standards in PO3 (2040) the positive
effects are also felt earlier. As regards improvements in road safety both policy options
show broadly similar impacts with PO3 slightly performing better.
Moreover, PO3 adds an important dimension to the cohesion objective of TEN-T by
better defining (and integrating) the urban nodes, which play a crucial role for regional
connectivity. At the same time this will allow to better align the objectives of urban
policy with those of TEN-T policy. In terms of CO2 and air pollutant emissions PO3
shows positive results. Only for particulate matter emissions a limited increase is
recorded which is due to emissions from wear and tear linked to higher rail activity.
When it comes to the resilience of the transport system PO3 is also in this area the
preferred option given that it foresees the highest dedicated investments, and climate
change adaptation of the TEN-T will mainly take place when upgrading existing
infrastructure. At the same time such upgrades will also lead to a reduction of technical
failures. PO3 shows good effects in addressing the issue of maintenance, which is
another aspect of resilience, by introducing minimum quality standards for maintenance
and project life cycle standards. PO3 would address the issue of resilience through the
alignment with the RFCs allowing to provide for alternative routes in case of traffic
disruptions on main railway lines and increased overlaps between the (civilian) TEN-T
and the EU military network.
PO3 constitutes a leap forward in terms of railway interoperability by obliging Member
States to decommission their national class B systems and replace them with ERTMS,
thereby ensuring more seamless transport.
The choice for PO3 is also supported by stakeholder views who expressed their
preference for TEN-T to focus on a combination of measures aiming at decarbonisation,
digitalisation and “hard” infrastructure deployment. Indeed, in the OPC the most popular
“focus area” pronounced by the stakeholders was a combination of all options which well
reflects the PO3 identified for this IA.

84
REFIT (simplification and improved efficiency)
This initiative is part of the Commission Work Programme 2021 under Annex I (new
initiatives) and is not part of Annex II (REFIT initiatives).
The preferred option improves the functioning of the TEN-T policy by increasing the
efficiency of the regulatory framework as a whole. On top of that, the revision gives the
opportunity to clarify certain requirements and concepts. For instance, the concept of
Motorways of the Sea as currently defined in the Regulation has been acknowledged by a
large number of experts and project promoters as overly complex. The evaluation of the
TEN-T Regulation confirms that it would benefit from simplification and integration in
an overarching and integrated concept of the TEN-T covering ports, shipping and all
other maritime infrastructure elements for the benefit of the entire ‘European Maritime
Space’. Another example is the alignment of the Rail Freight Corridors with the Core
Network Corridors which will allow optimising the instruments and avoid duplication,
for example the requirement to draw up investment plans under the Rail Freight Corridor
Regulation which should be simply removed as such investment plans overlap with the
work plans which are regularly prepared by the European TEN-T Coordinators.
Two further simplifications that will lead to potential cost savings have been identified:
automated data input into the TENtec system allowing an exchange directly from the
data source (Member State, infrastructure manager);
replacing the biannual work plans of the European Coordinators and the biannual
progress reporting on the implementation of the TEN-T by the Member States with a
formal update of the work plan including the priorities for the respective corridor
development only every three years, with a brief annual progress report on the state
of implementation of the Core Network Corridors, Motorways of the Seas (in future
European Maritime Space) and ERTMS.
While the preferred option increases the overall implementation costs for authorities, it
generates improvements, in particular economic and employment gains and enables more
sustainable forms of transport that more than offset the increase in regulatory costs.
9 9 HOW WILL ACTUAL IMPACTS BE MONITORED AND EVALUATED?
The Commission will follow the progress, the impacts and results of this initiative
through a set of governance instruments, based on the TEN-T governance, such as the
strengthened European Coordinators and their work plans. Monitoring will be even
further strengthened in the revised Regulation (with reference to the tools of the preferred
PO3). The European Coordinators have in this regard been instrumental as they act as
ambassadors of TEN-T policy and mediators for all relevant stakeholders that they gather
in so called Corridor Fora. This work will be further boosted through a reinforced role of
the European Coordinators. In addition, each European Transport Corridor and the two
horizontal priorities will be supported by dedicated studies which monitor the progress
made with regard to the fulfilment of standards, deadlines and priority setting. This is for
instance reflected in a very close monitoring of all projects planned or ongoing on the
TEN-T (so called “project pipeline” analysis and half-yearly “project implementation

85
reports”). Projects are thereby being assessed in terms of their financial maturity as well
as their status in terms of permitting and procurement, so that problems e.g. in terms of
delays can be easily spotted and interventions being planned by EC and/or European
Coordinators. The new Regulation will also include the possibility to build more than in
the past on implementing decisions. They will not only foster the priority setting at
national level, but also facilitate the monitoring of progress made on the TEN-T against
defined and agreed milestones in those implementing decisions. As such, they are also a
very solid basis for the monitoring of those projects since regular progress can be
checked per milestone and appropriate measures taken in case of delays. When adopting
these implementing decisions, the Member States concerned also agree to a regular
reporting on the progress achieved. In terms of monitoring, the progress of the TEN-T
will be monitored in terms of the technical completion of the TEN-T infrastructure with
the defined TEN-T standards and against the defined deadlines of 2030, 2040 and 2050.
The standards and requirements will thereby constitute the key performance indicators
(see Annex 9) against which the success of TEN-T will be monitored (e.g. percentage of
length of rail freight sections that are electrified, cater for 22.5 axle load and for 740 m
train length; number of maritime ports with a railway access etc.). The progress made
with regard to the fulfilment of these KPIs will be documented in biannual TEN-T
implementation reports which do not only cover the technical progress made but also the
financial investments done on the TEN-T by Member States and through EU funding and
financing instruments (ESIF, CEF, EIB instruments). Next to it, there is a constant
monitoring through the so-called TENtec database, a powerful information system which
will allow in future an automated exchange of data directly from the data source
(Member State, infrastructure manager) in a timely manner.128
128 In order to allow for a proper progress monitoring, it should be reminded that specific objectives 1-5
should be achieved according to the implementation deadlines set for the different layers of the TEN-T network, e.g. 2030 for the core network (existing requirements), 2040 for the core network (new requirements) and important parts of the comprehensive network and 2050 for the remaining part of the comprehensive network. In general for these five specific objectives achievement would be measured through the level of network completion in terms of the respective standards (as foreseen in the work plan and the bi-annual status reports of the network). For SO6, implementation of the national plan requirement would apply to the next upcoming plan of a given Member State. Achievement would be measured through the work plans and the corridor studies and European Rail Traffic Management System and Motorways of the Sea studies. The alignment between Core Network Corridors and Rail Freight Corridors would apply immediately upon entry into force of the new Regulation.

86
ANNEX 1: PROCEDURAL INFORMATION
Lead DG, DeCIDE PLANNING/CWP REFERENCES
The lead DG is Directorate General for Mobility and Transport (MOVE), Unit B1,
Transport Networks.
DECIDE reference number: PLAN/2020/8147
The development of this initiative was announced under item A 4 b) in Annex 1 to the
Commission Work Programme 2021129. The Inception Impact Assessment was published
on 20 November 2020130.
Organisation and timing
The Inter Service Steering Group (ISSG) for the evaluation of the TEN-T Regulation was
set up in September 2018 and included the following DGs and Services: SG, BUDG,
CLIMA, CNECT, DIGIT, ECFIN, , EEAS, EMPL, ENER, ENV, ESTAT, GROW, JRC,
MARE, NEAR, REGIO, RTD, SJ.
The ISSG was later extended to cover also the Impact Assessment of the Regulation. In
this context, the following services were added to the ISSG: DEFIS, ECHO, HOME,
SANTE, TRADE.
The ISSG approved the Impact Assessment roadmap, the Terms of Reference for the
External Support Study and the questionnaire for the Open Public Consultation and
discussed the main milestones in the process, in particular the different deliverables of
the support study. In total, 4 meetings of the ISSG were organised to discuss the impact
assessment (in addition to 3 meetings on the evaluation). These meetings took place on 8
September 2020, 24 March 2021, 9 June 2021 and 17 June 2021 (all virtual meetings).
Further consultations with the ISSG were carried out by e-mails. When necessary
bilateral discussions were also organised with the most concerned services.
Consultation of the RSB
The Regulatory Scrutiny Board received the draft version of the impact assessment report
on 23 June 2021. The Board meeting took place on 22 July 2021 upon which a positive
opinion with reservations was issued (see findings below).
Evidence, sources and quality
The impact assessment is based on research and analyses done by the Commission. The
Commission also contracted an external, independent consultants team (Ricardo
Nederland B.V. as leader of the group together with Ricardo-AEA Limited, TRT
Trasporti e Territorio srl (TRT) and M-Five GmbH Mobility, Futures, Innovation,
Economics (M-FIVE)) to support this impact assessment in specific tasks; i.e. the
assessment of the policy options, the comparison of the options, the assessment of the
administrative costs as well as the analysis of the open public consultation. The external
support study will be published alongside this report. In addition, the Baseline scenario
has been developed by E3Modelling with the PRIMES-TREMOVE model, drawing on
the MIX scenario underpinning the impact assessments of the ‘Delivering the European
Green Deal’ package. ASTRA and TRUST models have been calibrated on this Baseline
scenario by M-FIVE and TRT, respectively.
129 https://ec.europa.eu/info/publications/2021-commission-work-programme-key-documents_en 130 https://ec.europa.eu/info/law/better-regulation/have-your-say/initiatives/12532-Trans-European-
transport- network-TEN-T-revised-guidelines_en

87
Qualitative and quantitative data supporting this impact assessment has been collected
from Member States, regions, infrastructure managers, transport service providers and
operators, project promoters, commercial and private users of the TEN-T, expert
stakeholders and academics as well as other relevant public and private stakeholders. To
this end, an open public consultation has been organised from 10 February until 5 May
2021. 496 responses to the OPC questions, and in addition 118 position papers/additional
contributions, have been received through the OPC system. In addition, 9 qualitative
interviews were conducted by the consultants’ team, in order to gather additional
information with regard to expected investment and administrative costs.
Findings of the Regulatory Scrutiny Board
RSB main findings Modification of the IA report
(1) The report does not sufficiently
highlight the policy choices that policy-
makers will need to make.
The different policy choices have been
explained in further detail in Chapter 5.
(2) The funding mechanisms behind the
revised guidelines remain unclear in view
of the very significant resources required
for the initiative.
Chapter 1 on the legal and policy context
as well as Section 6.1.1 on the investment
needs have been amended to better explain
the funding mechanisms and the source of
funding and financing resources.
(3) The environmental value-added of the
revision of the TEN-T guidelines is not
sufficiently clear in view of the objective
to make transport greener.
Chapter 5 has been amended in order to
better outline the links of each policy
option with the European Green Deal
objectives. Similarly, chapter 5 explains
now more clearly the baseline scenario
which allows to better assess also the
environmental impacts of this initiative.
RSB adjustment requests Modification of the IA report
(1) The report should clarify the structure
and logic of the options. In this regard, it
should consider the usefulness of keeping
the minimalistic option 1 versus discarding
it upfront. With regard to option 2, the
report should clarify whether the long
catalogue of measures are all required. It
should discuss if any other policy choices
or measures should be highlighted and if
alternative investment priorities were
considered. Finally, it should substantiate
better the generalised support of EU
Member States for the respective options.
A new sub-section 5.2.1 has been added in
order to better explain the overall structure
and logic of the policy options. Additional
explanations have also been provided in
the introduction of chapter 6 with regard to
the relevance of keeping policy option 1 as
a valid option. Moreover, it has been
clarified more precisely in section 5.2 why
all measures are required in PO2 and more
generally also the support of the respective
options/measures from the stakeholders
and in particular from EU Member States.
Alternative investment priorities were
considered, but discarded (see section 5.3).
(2) The report should provide a better
overview of the funding mechanisms
supporting this initiative. It should clarify
Section 1.2 (legal and policy context) has
been amended by adding a specific sub-
section on the EU added value of TEN-T

88
how the considerable amounts of funding
that are required will be mobilised, taking
into account the limits of national public
finances and the limited involvement of
the private sector. The involvement of EU
funding sources should also be clarified.
investments and their funding and
financing instruments. In addition, section
6.1.1 (investment needs) has been
amended in order to better clarify the
sources of funding and financing for the
realisation of the policy options.
(3) The report should better explain the
functioning of the new screening
mechanism for foreign direct investment.
In particular, the existence of a potential
problem of unequal treatment between
domestic and foreign investment should be
clarified.
The problem description with regard to
this aspect (chapter 2) as well as the
description of the related measure no 20
(section 5.2) has been amended in order to
clarify this problem.
(4) While the size of the environmental
impacts is certainly influenced by the fact
that the baseline already accounts for the
‘Delivering the European Green Deal’
package, the value added of having the
revised TEN-T guidelines in addition to
the Green Deal should be better explained.
The report should clarify the
environmental contribution of TEN-T in
comparison with the existing and proposed
legislation. It should explain better how
TEN-T projects would systematically
avoid doing significant harm to the
environment, including to biodiversity and
through soil sealing.
A new sub-section 5.2.2 has been added in
order to outline more precisely the links of
each policy option with the European
Green Deal objectives. It also underlines
the respect of the do not significant harm
principle. In addition, the respective
measure no 7 (see Annex 6) has been
described in further detail in section 5.2.
(5) The intervention logic should be
further strengthened. In particular, the
report should clarify how the options relate
to the specific objectives and ultimately
how they tackle the problems and the
problem drivers. In this regard, it would be
useful to include some material from
Annex 6 in the main report.
A new sub-section 5.2.1 has been added
which specifically highlights the links
between problems, problem drivers,
specific objectives and policy options. This
section also incorporates the table of
Annex 6 in a condensed form. Annexes 6
and 7 have been merged into one common
Annex 6.
(6) The coherence between the narrative of
the evaluation findings and the information
provided in the impact assessment should
be ensured, in particular when it comes to
the delays in the implementation of the
TEN-T network and the possible
consequences. In this regard, the
incorporation of the full implementation of
the TEN-T regulation in the baseline
should be explained.
Section 5.1 has been amended as to better
explain the rationale behind the
assumption of a full completion of the core
network by 2030. Thereby, full coherence
with the evaluation results has been
ensured and clarified.
(7) The report should assess in more detail
the proportionality and subsidiarity of
More explanations are provided on the
issue of subsidiarity in sections 3.2 and

89
individual measures. In particular, it
should clarify why TEN-T needs to set
requirements on urban nodes for passenger
transport. Given their moderate ambition
level, it seems likely that local authorities
would develop these hubs where needed
without EU intervention.
3.3, on the specific measure for urban
nodes in section 5.2 (under policy option
2) as well as in section 7.4 (Proportionality
and subsidiarity).
(8) As this is a revision of existing
legislation, a REFIT section should be
included under the preferred option,
analysing the scope for simplification and
reduction of administrative burden.
A REFIT section has been added to
chapter 8.

90
ANNEX 2: STAKEHOLDER CONSULTATION
An on-line open public consultation was undertaken between 10 February and 5 May
2021 on the EU Survey website131. The consultation was divided into five sections,
starting with a general question on the Regulation, followed by questions on additional
measures that might be taken in, and the potential focus of, an amended Regulation. The
main issues covered were:
Measures enabling the decarbonisation and the reduction of air pollutant emissions in
the transport system;
Measures related to infrastructure quality and resilience;
Measures related to innovation, digitalisation and automation; and
Potential focus areas for the policy options.
The results of the public consultation are presented below for each of these elements.
Differences in responses by different types of stakeholder are presented, where these are
worth noting. For each closed question, graphs by the main stakeholder types (i.e.
business respondents, public authorities, citizens and others) were prepared and analysed.
Comments generally relate to the qualitative responses, i.e. the responses to the open
questions, as there were no significant differences between the responses of different
stakeholder groups to the closed questions. This is largely due to the fact that, overall,
there was broad agreement with most of the measures and statements within the
consultation. As a result, breaking down responses by stakeholder type revealed
differences in the level of agreement, rather than strong differences in the views of
different stakeholder types.
Distribution of the responses
The consultation received 496 responses in total (see Table 1), of which 27% (134) were
from public authorities and 19% (95) from EU and non-EU citizens (there was only one
of the latter). There were more responses from regional public authorities (43%, 58) than
from international, national or local public authorities. Industry respondents contributed
the next highest proportion of responses, with companies / business organisations
providing 18% (90) of responses and business associations a further 14% (69). In
addition, 9% (46) of responses were from NGOs and 2% from both environmental
organisations (11) and academics / research institutions (7). The remaining responses
came from trade unions (1%, 5), consumer organisations (0.4%, 2) and organisations that
classified themselves as ‘other’ (37, 8%).
When considering the responses to individual questions by stakeholder category,
‘industry respondents‘ refers to those representing ‘business associations’ and ‘company
/ business organisations’.
131 https://ec.europa.eu/info/law/better-regulation/have-your-say/initiatives/12532-Trans-European-
transport-network-TEN-T-revised-guidelines_en

91
Table 1: Distribution of responses to the consultation by category
Category Number of
respondents
Percentage of total number
of respondents
Public authority 134 27%
EU citizen 94 19%
Non-EU citizen 1 0.2%
Business association 69 14%
Company/business organisation 90 18%
Non-governmental organisation (NGO) 46 9%
Environmental organisation 11 2%
Academic/research institution 7 1%
Trade union 5 1%
Consumer organisation 2 0.4%
Other 37 7%
Source: TEPR analysis of OPC
The most well represented Member States were Italy (14%, 70), Belgium (12%, 59),
Czech Republic (11%, 56) and France (11%, 53), which together provided almost half of
the responses (48%). No responses were received from two Member States: Estonia and
Malta. There were also ten responses from Norway and Switzerland (2%, 6 and 4,
respectively), as well as responses from the United Kingdom (1%, 4), the United States
(0.4%, 2), and one each from the French overseas departments of Martinique and La
Réunion.
There appeared to be a number of sets of coordinated responses – around 10 – where
responses to some open questions were similar, if not identical, in some cases. However,
for many of these, responses to all of the questions were not the same, which suggests
coordination to communicate a particular message in response to some questions, rather
than a campaign. Having said that, many responses from Czech citizens and
environmental organisations raised concerns, some of which were similar, about the
TEN-T in their country. This suggests that, in Czech Republic at least, there was some
effort to encourage citizens to respond to the consultation. However, as the responses to
other questions – such as the closed questions – did not all follow the same pattern, these
responses have all been retained, although similar responses to the open questions have
been highlighted.
In addition, there were three other sets of coordinated responses of around the same size.
A set of around 10 responses, mainly from NGOs and some citizens, focused their open
responses on active mobility, particularly cycling, whereas another set of 10 companies,
citizens and an academic/research institution focused on the benefits of the TEN-T
supporting hyperloop. Another 10 or so responses from rail interests covered similar
themes on several, but by no means all, questions. In addition, there were smaller
coordinated responses – consisting of between three to seven responses – from separate
groups of Swedish, French, Dutch and Finnish public authorities, as well as from
separate groups of Italian and Austrian business associations.

92
General questions on Regulation (EU) 1315/2013
Stakeholders were asked to rank ten potential areas on which EU transport policy could
focus (including an ‘other’ option). The focus that was considered to be most important
was “enabling the decarbonisation of transport”, which received a ‘10’ more frequently
than other options (45%, 284, five ‘no opinion’s), and was also more commonly ranked /
rated as being important (i.e. receiving a rank of between ‘7’ and ‘10’; 93%, 461).
The statement on which opinion was most divided was the improvement of dual-use
(civilian and military) infrastructure, for which responses were almost equally distributed
across all ranks (only 9% (43) gave this a ‘10’ and 40% (196) a score of ‘7’ or more). All
of the other statements were important to the respondents, and there was little difference
in the level of importance of these, as all received at least a ‘7’ from between 78% and
85% of the respondents. Hence, there was support for “ensuring the reduction of
environmental costs related to transport”, “facilitating multimodal transport chains”,
“removing physical and other bottlenecks in the network”, “ensuring connectivity and
accessibility of all regions”, “establishing physical cross border infrastructures”,
“ensuring EU wide quality infrastructure standards” and “'facilitating the coherent and
continuous EU wide deployment of innovative transport solutions”.
Those stakeholders that identified an ‘other’ area on which the TEN-T should focus
proposed a number of areas, some of which could be seen as being part of one of the
other nine areas mentioned in the original question. The most common ‘other’ area that
was mentioned by industry respondents was the need for EU transport infrastructure
policy to ensure the deployment of the necessary recharging and refuelling infrastructure
for alternative fuels. Other common responses from industry respondents for other areas
included maintaining TEN-T infrastructure, more appropriate and coordinated funding of
transport infrastructure and for stronger connections between the TEN-T and urban
transport. There were also a number of more detailed areas relating to supporting the
EU’s railway network. From the perspective of citizens, other areas included more focus
on intermodality and for greater transparency and public participation.
Measures enabling the decarbonisation and the reduction of air pollutant emissions
in the transport system
There were five questions that focused on reducing emissions in the transport sector.
First, stakeholders were asked to state their level of agreement with two statements that
proposed potential reasons for making minor adjustments to the network. The vast
majority agreed with both statements, i.e. that the network design needed to be adjusted
to take account of changing transport flows within the EU and with neighbouring/third
countries (86%, 392, 40 ‘no opinion’s) and to further strengthen accessibility for all
regions and cross border mobility (87%, 407, 28 ‘no opinion’s).
Respondents were also asked which type of adjustment they deemed to be necessary.
Common responses from both industry respondents are citizens called for more focus on
multimodality and on developing the EU rail network, while another common response
from industry respondents was a better alignment between the TEN-T’s CNCs and the
Rail Freight Corridors (RFCs). There were also various responses that focused on
particular modes or which identified specific adjustments that they saw as being
necessary. A common response from public authorities was the importance of improving
the accessibility of all regions, with various mentions of specific regions in particular,
including peripheral maritime regions, remote areas, less populated areas, mountainous
and island areas, the EU’s Arctic regions and the EU’s Outermost Regions defined in Art
349 TFEU. There were also calls – particularly from French authorities on, or near, the
Atlantic Corridor, as well as Irish respondents – to adjust the network to reflect Brexit.

93
Second, stakeholders were asked to express their level of agreement with a number of
statements relating to the objective of decarbonising transport. At least two thirds fully or
somewhat agreed with all of the statements. There were five statements with which more
than 85% of respondents either fully or somewhat agreed:
“The TEN-T needs further enhancement to enable future decarbonisation and further
reductions of air pollutant emissions of EU transport” (93%, 450, 10 ‘no opinion’s);
“The provisions for urban/transport nodes should be strengthened to achieve better
multimodal services for passengers and freight and to facilitate last mile connections
including connections with active modes and other sustainable urban mobility
solutions” (92%, 413, 47 ‘no opinion’s);
“Synergies between energy and transport infrastructure policies need to be
strengthened to enable future decarbonisation and further reductions of air pollutants”
(91%, 431, 20 ‘no opinion’s);
“The coordination between TEN-T core network corridors and Rail Freight Corridors
should be further enhanced to increase service performance on the network” (89%,
368, 82 ‘no opinion’s); and
“'The TEN-T should promote a high performance rail passenger network to improve
service quality on the network” (87%, 379, 61 ‘no opinion’s).
There was also substantial support for “'binding requirements for recharging and
refuelling infrastructure for zero and low emission vehicles” (79%, 351, 51 ‘no
opinion’s), for “further requirements to strengthen short sea shipping” (76%, 291, 115
‘no opinion’s) and for “further requirements to strengthen inland waterway transport”
(70%, 267, 117 ‘no opinion’s). The statement with the least support related to the
introduction of new requirements for road safety, although this was still supported by
67% (255, 1167 ‘no opinion’s) of respondents.
Respondents were also asked which type of adjustment they deemed to be necessary.
While there were many responses to this question, few mentioned explicit specific
adjustments, as respondents tended to provide more detail on particular areas. Synergies
between the TEN-T and TEN-E were particularly highlighted by industry respondents
with respect to the smart charging of electric vehicles and the potential role of the latter
for energy storage, while the importance of consistency with the revised alternative fuels
infrastructure Regulation (AFIR) was underlined with respect to binding requirements for
alternative fuels. Some respondents underlined the importance of a technology-neutral
approach to alternative fuels in general, or in relation to specific modes, e.g. the maritime
and inland waterway sectors. A number of more specific suggestions were made in
relation to further requirements for railways, inland waterways, short sea shipping
(including in relation to Motorways of the Sea) and urban nodes, including an amended
definition of the latter to include its functional area. Areas in need of additional
requirements that were suggested included: allowing heavier vehicles to be used in
international travel; more support for public transport more generally; the provision of
the necessary digital infrastructure; and support for the transport of captured CO2 in
addition to its transport by pipeline, which was the only mode covered by the TEN-E).
Common themes raised by citizens included the importance of promoting rail, of actively
taking action to reduce the use of cars and trucks and of improving the infrastructure that
connected long-distance and urban transport. Some public authorities were concerned
about any new requirements being binding, as a result of the limited financial resources
available to them, although some called for increased financial support from the EU to
address this. In relation to urban areas, there was support amongst public authorities for a
larger number of urban areas to be included as nodes on the TEN-T, for an expanded
definition of an urban area and for more attention to be paid to the last mile in the context
of strengthening links between urban travel and long-distance transport routes.

94
Third, stakeholders were asked whether or not they agreed with the expansion of
specified requirements from the core network to the comprehensive network. Over 80%
of respondents supported such an extension in each case, i.e. in relation to requirements
for: transport and urban nodes (84%, 283, 159 no ‘opinion’s); road safety / quality (84%,
251, 197 no ‘opinion’s); alternative fuels (82%, 315, 114 no ‘opinion’s), rail
interoperability (82%, 249, 194 no ‘opinion’s); and intelligent and digital TEN-T
components (81%, 271, 160 no ‘opinion’s).
Respondents were also asked to specify other or particular core network requirements
that they believed should be expanded to the comprehensive network. From the
perspective of railway interests, it was suggested that extending the core requirements to
the comprehensive network needed to be carefully assessed, particularly with respect to
ERTMS, or that this would already be achieved under the Technical Specifications for
Interoperability (TSI) on infrastructure (TSI INF). It was also underlined that the core
network requirements should not be softened, although some of these needed to be
clarified. Finally, it was suggested that alternative fuel infrastructure (e.g. for battery-
electric and hydrogen trains) was more appropriate on the comprehensive network, as
this was where trains using alternative fuel infrastructure were more likely to operate.
In relation to maritime transport, it was suggested that whether a port was on the core or
comprehensive network was not necessarily the most important factor in determining
whether particular infrastructure was necessary. It was also suggested that requirements
for safe and secure truck parking areas be extended to the comprehensive network. The
most common theme mentioned by public authorities was that, while in principle
expanding the core network requirements to the comprehensive network could be useful,
in practice it was not possible as a result of budgetary constraints, or that it would need
more EU funding.
Fourth, stakeholders were asked to express their level of agreement in relation to the
reinforcement of specified current instruments. Over 70% of respondents either fully or
somewhat agreed that each instrument mentioned needed to be reinforced. The
instrument for which strengthening was most supported was the improved alignment of
planning and implementation procedures with which almost 90% (402, 46 no ‘opinion’s)
agreed. The instrument that received the least support for its strengthening was the
increased use of implementing acts, although 71% (285, 96 no ‘opinion’s) still agreed
with this. The strengthening of the other two instruments mentioned was supported by
similar proportions of respondents with 78% (330, 73 no ‘opinion’s) agreeing that the
reporting mechanisms on the status of the TEN-T needed strengthening, while 76% (330,
61 no ‘opinion’s) supported a strengthening of the role of the European Coordinators.
Respondents were also asked to specify other or specific adjustments that they deemed to
be necessary. With respect to the role of the European Coordinators, some industry
respondents and public authorities suggested that this was needed to speed up the
implementation of the TEN-T, and they were suggestions that this could be extended to
cover the RFCs, the deployment of alternative fuel infrastructure and the digitalisation of
the network. There were mixed views in relation to the role of the Coordinators in
relation to Member States, with some calling for the Coordinators to have a stronger role
with respect to Member States, with others suggesting that their work should not interfere
with that of Member States. Similarly, there were some calls for Member States’ plans to
be consistent with the corridor investment plans, whereas others called for the TEN-T to
be based on national plans. Some responses from citizens and NGOs also called for a
greater role of the EU, e.g. in ensuring that projects went ahead. Some NGOs also called
for a better alignment of the TEN-T with EU environmental legislation, while there were
various calls for greater consultation, e.g. with stakeholders and regions. With respect to

95
Member State reporting, some public authorities called for a common set of indicators
and for reporting to be more transparent.
Finally, stakeholders were asked to rank the importance of the TEN-T giving
consideration to different plans. The plans that were overwhelmingly ranked first more
than others were the National Energy and Climate Plans, which were ranked first by 59%
(292) of respondents and were ranked in the top three by 84% (418) of respondents. The
second most important plans in terms of its first (13%, 63) and its first and second
rankings (62%, 307), were the National Air Pollution Control Programmes / Air Quality
Plans, although overall, again, 84% of respondents ranked these plans. Fewer
respondents gave the same level of importance to either noise plans (48% (239) ranked
these) or River Basin Management Plans (25%, 125).
Respondents were also asked to mention other plans to which they believed the TEN-T
should give consideration. The most common other plans that were mentioned by
industry respondents were national plans for the development of electromobility and
national economic recovery plans, while the most common plans mentioned by citizens
were national transport plans. The importance of the TEN-T giving consideration to
biodiversity plans was the most common response raised by NGOs, while by far the most
common other plan mentioned by public authorities were national transport and
investment plans.
Measures related to infrastructure quality and resilience
Stakeholders were asked to indicate their level of agreement with improving the
resilience of infrastructure by introducing particular new quality parameters or
requirements in specified areas. At least 64% either fully or somewhat agreed with the
introduction of each of the proposed new quality parameters or requirements that were
mentioned. Climate adaptation was considered to be the most important area in which to
introduce new parameters or requirements, as this was supported by 88% (412, 27 ‘no
opinion’s) of respondents. This was closely followed by improving the quality of
structural infrastructure, e.g. bridges and tunnels, which was supported by 86% (392, 42
‘no opinion’s) of respondents, and new requirements for civil protection (80%, 338, 74
‘no opinion’s). The introduction of new parameters and requirements relating to security
or public order was the least popular option, although 64% (233, 131 ‘no opinion’s) still
supported this.
Respondents were also asked to mention other areas relating to infrastructure quality and
resilience that could be considered. There were few additional areas that were mentioned
in this respect. Other areas to which requirements might be considered, which were
mentioned by industry respondents, included requirements relating to: electric vehicle
recharging infrastructure; infrastructure for all alternative fuels more generally; the
cybersecurity of relevant digital infrastructure; or to the upgrading of the road
infrastructure on the CNCs to support heavier vehicles. The resilience of public transport
was also mentioned (also by citizens and public authorities), with the implied need to
support this, while a similar comment in relation to port infrastructure was made by other
respondents, e.g. NGOs and public authorities. Industry respondents and public
authorities also mentioned the importance of there being alternative diversionary routes,
particularly for important rail corridors, in order to improve the resilience of the network.
Respondents were also asked about how infrastructure quality and resilience could be
ensured. From the perspective of industry respondents, making the necessary funds
available was highlighted, as was the improved monitoring and reporting of
infrastructure quality. In relation to security, it was suggested that countries should retain
control over strategic infrastructure. Responses from environmental organisations
focused on the importance of working with the environment to improve the resilience of

96
the transport system. The development of infrastructure for inland waterway transport
was a particular concern of NGOs, which underlined that this should be integrated with
the needs of nature and local communities. The most common theme mentioned by
public authorities was the importance of identifying the infrastructure that was most at
risk from climate change and of prioritising its adaptation, and of identifying and
prioritising the infrastructure that needed upgrading for other reasons. The importance of
additional funding to improve the resilience of the network was also mentioned.
Measures related to innovation, digitalisation and automation
Stakeholders were asked to indicate their level of agreement with four statements relating
to digitalisation and innovation. At least eighty per cent of respondents either fully or
somewhat agreed with each statement. The most popular statement, with which 85%
(349, 86 ‘no opinion’s) of respondents agreed, was to adjust the requirements for
intelligent and digital TEN-T components. Further enhancing TEN-T infrastructure to
enable the future automation of transport was supported by 83% (364, 58 ‘no opinion’s)
of respondents, while 80% (356, 51 ‘no opinion’s and 343, 67 ‘no opinion’s,
respectively) supported both ensuring a forward-looking framework with flexibility to
integrate upcoming innovations and the better definition of the digital components of the
different modes of transport.
Potential focus areas for the policy options
Stakeholders were asked to rank the importance of the specified ‘Focus Areas’ for
achieving the objectives that had been set out. These covered:
Focus Area 1: Major emphasis on a “traditional” infrastructure development, along
with network design adjustments, the updating of essential infrastructure quality
requirements and the integration of binding requirements for recharging and
refuelling infrastructure for low and zero emission vehicles.
Focus Area 2: Strengthening the concept of infrastructure quality to enable more
efficient and sustainable transport services and a modal distribution in line with new
ambitions of transport policy overall and to ensure a more resilient TEN-T.
Focus Area 3: Boosting digitalisation and innovation in TEN-T policy.
Focus Areas 4: A combination of different elements of Focus Areas 1 to 3.
Focus Area 5: None of the above.
The most popular focus area was Focus Area 4, i.e. a combination of elements from the
first three focus areas, as this was ranked first by 169 respondents, while the least popular
was Focus Area 5, i.e. ‘none of the above’, which was ranked first only by 24
respondents. Focus Areas 1 and 2 were almost equally well supported by participants,
with similar numbers of respondents ranking each of these first (106 and 110,
respectively) and second (140 and 129). Focus Area 3 was less popular when considering
first (53) and second (102) rankings.
Where respondents selected Focus Area 4, they were asked to further specify their
preference. By far the most common combination mentioned in the context of Focus
Area 4 by industry respondents, NGOs, and public authorities was a combination of all
three of first three focus areas, whereas the most common response from citizens was a
combination of Focus Areas 2 and 3.
Similarly, where respondents selected Focus Area 5, they were asked to further specify
this. The most common responses here were: for the TEN-T guidelines to recognise the
role of, and integrate, active mobility, which was from the coordinated, NGO-led
response on this subject; for the TEN-T guidelines to be aligned with nature protection
and restoration from an NGO; for a greater focus on the environment, or on socio-

97
economic benefits, from citizens; and for a greater focus on strengthening workers’
rights, from a trade union representative.
Additional contributions
Many of the additional contributions reiterated, brought together or elaborated upon the
respondent’s responses to the specific questions. Hence, these covered many of the same
issues, many of the most important of which have been mentioned above in response to
earlier questions. Many responses from public authorities underlined the importance of
the needs to specific regions being taken account of within the TEN-T. In particular,
there was a call for a better integration of the EU’s Outermost Regions into the TEN-T to
open up access to funding and to improve connections of these regions with mainland
Europe and third countries in their geographical basin so as to reduce persistent
accessibility gaps.
A cycling NGO reiterated the comments that had been made in response to various
questions by the NGO-led coordinated response, which were that the European cycle
network, EuroVelo, should be integrated into the TEN-T, alongside other modal
networks, and that cycling infrastructure should be integrated into all TEN-T projects.
Finally, many additional contributions mentioned specific adjustments that they wanted
to see to the TEN-T, in terms of the nodes or sections of infrastructure that they would
like to see added, or in a small minority of cases, removed.

98
ANNEX 3: WHO IS AFFECTED AND HOW?
PRACTICAL IMPLICATIONS OF THE INITIATIVE
The revision of the TEN-T Regulation aims to ensure that the EU transport infrastructure
policy is updated and aligned with the policy objectives set in the European Green Deal
and the Sustainable and Smart Mobility Strategy (SSMS).
The preferred policy option identified in the context of this impact assessment, Policy
Option 3, consists of a package of measures to make transport greener, seamless and
efficient, resilient, while improving the governance tools. The measures include first the
adoption of new, reinforced or clarified standards for all transport modes, in order to
reach a fully interoperable and functioning EU wide network. There are also measures to
address bottlenecks and insufficient connectivity, notably by targeting urban nodes and
furthering the digitalisation of the infrastructure. Furthermore, there are measures to
increase the safety and resilience of the network. Finally, governance is improved by
streamlining the existing tools (including the integration of Core Network Corridors and
Rail Freight Corridors into European Transport Corridors).
The revision will have implications for different actors across modes of transport. The
following key target groups of this initiative have been identified:
- Public authorities at national, regional and local level
- Infrastructure managers for road, railways and inland waterways
- Ports, airports and rail-road terminals
- Transport service providers and users
- Industry (construction companies, providers of technologies and equipment, etc.)
The Regulation would require Member States, infrastructure managers as well as ports,
airports and rail-road terminals to plan and implement their parts of the TEN-T in line
with the standards and deadlines set in the Regulation. As this would be done in a
coordinated way, they would also benefit from the better connectivity at the European
scale and could time the investment in the best possible way to maximise the benefits.
They would be supported in this endeavour by the reinforced implementing tools, under
the leadership of the European Coordinators.
Transport service providers and users would benefit from an improved network, where
congestion is reduced through the removal of bottlenecks, where greater connectivity is
achieved by having a fully functional network reaching all regions in the EU and well
connected to the neighbouring countries and where the long-distance transport is better
connected to the local/regional transport. These benefits should balance out the
possibility of increased charges for the use of improved infrastructure.
As the implementation of the Regulation would require investments to build, upgrade
and digitalise the infrastructure, industry (including SMEs) would benefit as provider of
services and equipment. Industry at large as user of transport services would also benefit
from the completion of the TEN-T.
Society at large would gain from the reduction of the environmental impacts from
transport, while maintaining a high level of mobility.

99
SUMMARY OF COSTS AND BENEFITS
I. Overview of Benefits (total for all provisions) – Preferred Option – PO3 (expressed relative to the
baseline)
Description Amount Comments
Direct benefits
Consumer and business
benefits
The completion of the core and the
comprehensive network will benefit
the users of transport services, both
citizens and undertakings, as there
will be better connectivity, more
reliability, or faster connections. This
should lead to better or cheaper
services, in particular for the most
environmental friendly transport
modes.
Indirect benefits
Safety improvements –
reduction in external
costs related to
accidents relative to the
baseline (i.e. present
value over 2021-2050)
€3,930 million Indirect benefit to society at large.
Improvements of road safety are
brought by the extension of the
motorway standard and the related
safety features to all network
sections above a certain daily traffic
threshold reducing the number of
fatalities and injured persons. The
reduction in the external costs of
accidents is estimated at around
€3,930 million relative to the
baseline over the 2021-2050 period,
expressed as present value. Transport
users and society as a whole do
benefit.
Reduction in external
costs related to inter-
urban congestion
relative to the baseline
(i.e. present value over
2021 – 2050)
€2,891 million Indirect benefit to the society at
large. Improvements on the level of
interurban congestion are brought by
a shift of transport volumes to more
sustainable modes of transport
decongesting especially the road
mode and reducing delays. The
reduction in external costs related to
inter-urban congestion is estimated at
around €2,891 million relative to the
baseline over the 2021-2050 period,
expressed as present value. Transport
users and society as a whole do
benefit.

100
Reduction of external
costs related to CO2
emissions relative to the
baseline (i.e. present
value over 2021-2050)
€387 million Indirect benefit to society at large.
Savings of CO2 are an effect of
modal-shift to environmental
friendly modes and efficiency gains.
The reduction in the external costs of
CO2 emissions is estimated at around
€387 million relative to the baseline
over the 2021-2050 period,
expressed as present value.
Reduction of external
costs related to air
pollution emissions
relative to the baseline
(i.e. present value over
2021-2050)
€420 million Indirect benefit to society at large.
The reduction in air pollutant
emissions is driven by modal-shift to
environmental friendly modes and
efficiency gains. The reduction in the
external costs of air pollution is
estimated at around €420 million
relative to the baseline over the
2021-2050 period, expressed as
present value.
Positive impact on GDP
relative to the baseline
GDP increase of 0.4% in 2030, 1.3% in
2040 and 2.4% in 2050 relative to the
baseline. This translates into €57 billion
increase in GDP relative to the Baseline
in 2030, €229 billion in 2040 and €467
billion in 2040.
Indirect benefit to society at large.
These benefits are the result of large
scale investments, driven by the
measures of the policy option. These
impacts account for wider effects
than only the construction of
projects, namely the indirect effects
on other economic sectors and the
effects induced by increased
productivity, improved conditions
for international trade and
technological spill-overs. The whole
society benefits: citizens by higher
income, business by higher revenues,
government by higher tax revenues.
Positive impacts on
employment relative to
the baseline (additional
persons employed and
percentage change to
the baseline)
200,000 additional persons employed in
2030 (0.1% increase to the baseline),
561,000 additional persons employed in
2040 (0.3% increase to the baseline) and
840,000 additional persons employed in
2050 (0.5% increase to the baseline)
These benefits include direct jobs
created due to the construction of
projects and indirect jobs created
thanks to the positive impact on
GDP. EU employees and self-
employed do benefit.

101
II. Overview of costs – Preferred option – PO3 (expressed relative to the baseline)
Citizens/Consumers Businesses Administrations
One-off Recurrent One-off Recurrent One-off Recurrent
Investment
costs
Direct
costs
relative to
the
baseline
(i.e.
present
value over
2021-
2050)
€1,754
million
(linked to
road tolls to
fund
investments)
€1,350
million
€178 million
(linked to
multimodal
digital
mobility
services for
passenger
transport)
€242,584
million
(investme
nt
support)
€1,605
million
(linked to
multimodal
digital
mobility
services for
passenger
transport)
Administrat
ive costs
Direct
costs
relative to
the
baseline
(i.e.
present
value over
2021-
2050)
€8.6 million
(linked to
adjustments
for
compliance
with new
requirements
mainly rail/
road
businesses)
€25.4
million
(linked to
participatio
n in TEN-T
governance
processes):
€15.8
million for
the
Commissio
n and €9.6
million for
Member
States
public
authorities.

102
ANNEX 4: ANALYTICAL METHODS
1. Description of the modelling tool used
The analytical framework used for the purpose of this impact assessment builds on the
PRIMES-TREMOVE, ASTRA and TRUST models, complemented by the assessment of
the administrative costs, etc.132
The baseline scenario has been developed using the PRIMES-TREMOVE model by
E3Modelling. PRIMES-TREMOVE has a successful record of use in the Commission's
energy, transport and climate policy assessments. In particular, it has been used for the
impact assessments underpinning the ‘Delivering the European Green Deal’ package, the
impact assessments accompanying the 2030 Climate Target Plan133 and the Staff
Working Document accompanying the Sustainable and Smart Mobility Strategy134, the
Commission’s proposal for a Long Term Strategy135 as well as for the 2020 and 2030
EU’s climate and energy policy framework.
ASTRA and TRUST are the main models used to assess the policy options presented in
this impact assessment. The assessment has been undertaken by MFive and TRT. For the
baseline scenario they have been calibrated on the results of the PRIMES-TREMOVE
model.
PRIMES-TREMOVE model
The PRIMES-TREMOVE transport model projects the evolution of demand for
passengers and freight transport, by transport mode, and transport vehicle/technology,
following a formulation based on microeconomic foundation of decisions of multiple
actors. Operation, investment and emission costs, various policy measures, utility factors
and congestion are among the drivers that influence the projections of the model. The
projections of activity, equipment (fleet), usage of equipment, energy consumption and
emissions (and other externalities) constitute the set of model outputs.
The PRIMES-TREMOVE transport model can therefore provide the quantitative analysis
for the transport sector in the EU, candidate and neighbouring countries covering
activity, equipment, energy and emissions. The model accounts for each country
separately which means that the detailed long-term outlooks are available both for each
country and in aggregate forms (e.g. EU level).
In the transport field, PRIMES-TREMOVE is suitable for modelling soft measures (e.g.
eco-driving, labelling); economic measures (e.g. subsidies and taxes on fuels, vehicles,
emissions; ETS for transport when linked with PRIMES; pricing of congestion and other
externalities such as air pollution, accidents and noise; measures supporting R&D);
regulatory measures (e.g. CO2 emission performance standards for new light duty
vehicles and heavy duty vehicles; EURO standards on road transport vehicles;
technology standards for non-road transport technologies, deployment of Intelligent
Transport Systems) and infrastructure policies for alternative fuels (e.g. deployment of
132 MFive et al. (2021), Analysis accompanying the Impact Assessment for the revision of Regulation
(EU) N° 1315/2013 on Union Guidelines for the development of the trans-European transport network
133 SWD/2020/176 final. 134 https://eur-lex.europa.eu/legal-content/EN/TXT/?uri=CELEX%3A52020SC0331 135 Source:
https://ec.europa.eu/clima/sites/clima/files/docs/pages/com_2018_733_analysis_in_support_en_0.pdf

103
refuelling/recharging infrastructure for electricity, hydrogen, LNG, CNG). Used as a
module that contributes to the PRIMES model energy system model, PRIMES-
TREMOVE can show how policies and trends in the field of transport contribute to
economy-wide trends in energy use and emissions. Using data disaggregated per Member
State, the model can show differentiated trends across Member States.
The PRIMES-TREMOVE has been developed and is maintained by E3Modelling, based
on, but extending features of, the open source TREMOVE model developed by the
TREMOVE136 modelling community. Part of the model (e.g. the utility nested tree) was
built following the TREMOVE model.137 Other parts, like the component on fuel
consumption and emissions, follow the COPERT model.
Data inputs
The main data sources for inputs to the PRIMES-TREMOVE model, such as for activity
and energy consumption, comes from EUROSTAT database and from the Statistical
Pocketbook "EU transport in figures138. Excise taxes are derived from DG TAXUD
excise duty tables. Other data comes from different sources such as research projects
(e.g. TRACCS project) and reports.
In the context of this exercise, the PRIMES-TREMOVE transport model is calibrated to
2005, 2010 and 2015 historical data. Available data on 2020 market shares of different
powertrain types have also been taken into account.
ASTRA model
ASTRA is a strategic model based on the Systems Dynamics Modelling approach
simulating the transport system development in combination with the economy and the
environment until the year 2050.
ASTRA consists of different modules, each related to one specific aspect such as the
economy, transport demand or the vehicle fleet. The main modules cover the following
aspects:
Population and social structure (age cohorts and income groups)
Economy (e.g. GDP, input-output tables, employment, consumption and investment
both at aggregate and at sectoral level)
Foreign trade (inside EU and to partners from outside EU)
Transport (including demand estimation, modal split, transport cost and infrastructure
networks)
Vehicle fleet (passenger and freight road vehicles by segment and drivetrain)
Environment (including air pollutant emissions, CO2 emissions, energy consumption).
136 Source: https://www.tmleuven.be/en/navigation/TREMOVE 137 Several model enhancements were made compared to the standard TREMOVE model, as for
example: for the number of vintages (allowing representation of the choice of second-hand cars); for the technology categories which include vehicle types using electricity from the grid and fuel cells. The model also incorporates additional fuel types, such as biofuels (when they differ from standard fossil fuel technologies), LPG, LNG, hydrogen and e-fuels. In addition, representation of infrastructure for refuelling and recharging are among the model refinements, influencing fuel choices. A major model enhancement concerns the inclusion of heterogeneity in the distance of stylised trips; the model considers that the trip distances follow a distribution function with different distances and frequencies. The inclusion of heterogeneity was found to be of significant influence in the choice of vehicle-fuels especially for vehicles-fuels with range limitations.
138 Source: https://ec.europa.eu/transport/facts-fundings/statistics_en

104
The economy module simulates the main economic variables. Some of these variables
(e.g. GDP) are transferred to the transport generation module, which uses the input to
generate a distributed transport demand. In the transport module, demand is split by
mode of transport. The traffic performance by mode is associated with the composition
of the fleet (computed in the vehicle fleet module) and the emissions factors (defined in
the environmental module), in order to estimate total emissions.
Several feedback effects take place in the ASTRA model. For instance, the economy
module provides the level of income to the fleet module, in order to estimate vehicle
purchase. The economy module then receives information on the total number of
purchased vehicles from the fleet module to account for this item of transport
consumption and investment. Furthermore, changes in the economic system immediately
feed into changes of the transport behaviour and alter origins, destinations and volumes
of European transport flows.
The indicators that ASTRA can produce cover a wide range of impacts; in particular
transport system operation, economic, environmental and social indicators. The
environment module uses input from the transport module (in terms of vehicle-
kilometres-travelled per mode and geographical context) and from the vehicle fleet
module (in terms of the technical composition of vehicle fleets), in order to compute fuel
consumption, greenhouse gas emissions and air pollutant emissions from transport.
ASTRA also estimates the upstream emissions (well-to-tank) due to fuel production and
vehicles production. Therefore, well-to-wheel emissions can be provided as well.
Strategic assessment capabilities in ASTRA cover a wide range of transport measures
and investments with flexible timing and levels of implementation.
Geographically, ASTRA covers all EU Member States plus United Kingdom, Norway
and Switzerland. The model is built in Vensim software and is developed and maintained
by TRT, M-Five and ISI Fraunhofer.
Data inputs
ASTRA is calibrated on the EUROSTAT database and data from the Statistical
Pocketbook "EU transport in figures139. In the context of this exercise, ASTRA model is
calibrated on historical data for 2000-2015.
TRUST model
TRUST is a European scale transport network model developed and maintained by TRT
and simulating road, rail, inland waterways and maritime transport activity. TRUST
covers the whole Europe and its neighbouring countries and it allows for the assignment
of passenger and freight origin-destination (OD) matrices at NUTS3 level of detail (about
1600 zones) on the multimodal transport network140.
Road rail, inland waterways and maritime transport modes are covered in separate
modules, each with its own matrices that are then assigned simultaneously on the
multimodal transport network.
TRUST is built in PTV-VISUM software environment. The assignment algorithm used is
Equilibrium Assignment which distributes demand for each origin/destination pair
among available alternative routes, according to Wardrop first principle. This principle
assumes that each traveller is identical, non-cooperative and rational in selecting the
shortest route, and knows the exact travel time he/she will encounter. If all travellers
139 Source: https://ec.europa.eu/transport/facts-fundings/statistics_en 140 Further information on TRUST is available on http://www.trt.it/en/tools/trust/

105
select routes according to this principle the road network will be at equilibrium, such that
no one can reduce their travel times by unilaterally choosing another route of the same
OD pair. This principle has been extended to consider generalised travel cost instead of
travel time, where generalised travel cost can include the monetary cost of in-vehicle
travel time, tolls, parking charges and fuel consumption costs. The impedance function is
defined in terms of generalised time from an origin O to a destination D. Travel costs are
defined separately by link types using combinations of fixed, time-dependent and
distance-dependent parameters. Travel time is estimated endogenously by the model as
result of the assignment. Speed-flow functions are used to model the impact of traffic on
free-flow speeds, given links capacity. The model iterates until a pre-defined
convergence criterion for equilibrium is reached.
TRUST can be used in the context of impact assessments and for supporting policy
formulation and evaluation. It is particularly suitable for modelling road charging
schemes for cars and heavy goods vehicles as well as policies in the field of
infrastructure.
Data inputs
The main data sources for inputs to the TRUST model are the EUROSTAT database and
the Statistical Pocketbook "EU transport in figures141, TENtec Information system142 and
ETISplus database.
2. Baseline scenario
In order to reflect the fundamental socio-economic, technological and policy
developments, the Commission prepares periodically an EU Reference Scenario on
energy, transport and GHG emissions. The socio-economic and technological
developments used for developing the baseline scenario for this impact assessment build
on the latest “EU Reference 2020 scenario” (REF2020)143. The same assumptions have
been used in the MIX scenario underpinning the impact assessments accompanying the
‘Delivering the European Green Deal’ package.
Main assumptions of the Baseline scenario
The main assumptions related to economic development, international energy prices and
technologies are described below.
Economic assumptions
The modelling work is based on socio-economic assumptions describing the expected
evolution of the European society. Long-term projections on population dynamics and
economic activity form part of the input to the model and are used to estimate transport
activity.
Population projections from Eurostat144 are used to estimate the evolution of the
European population, which is expected to change little in total number in the coming
decades. The GDP growth projections are from the Ageing Report 2021145 by the
141 Source: https://ec.europa.eu/transport/facts-fundings/statistics_en 142 https://ec.europa.eu/transport/themes/infrastructure-ten-t-connecting-europe/tentec-information-
system_en 143 Link to publication once available 144 EUROPOP2019 population projections: https://ec.europa.eu/eurostat/web/population-
demography-migration-projections/population-projections-data 145 The 2021 Ageing Report : Underlying assumptions and projection methodologies
https://ec.europa.eu/info/publications/2021-ageing-report-underlying-assumptions-and-projection-methodologies_en

106
Directorate General for Economic and Financial Affairs, which are based on the same
population growth assumptions.

107
Table 1: Projected population and GDP growth per Member State
Population GDP growth
2020 2025 2030 2020-‘25 2026-‘30
EU27 447.7 449.3 449.1 0.9% 1.1%
Austria 8.90 9.03 9.15 0.9% 1.2%
Belgium 11.51 11.66 11.76 0.8% 0.8%
Bulgaria 6.95 6.69 6.45 0.7% 1.3%
Croatia 4.06 3.94 3.83 0.2% 0.6%
Cyprus 0.89 0.93 0.96 0.7% 1.7%
Czechia 10.69 10.79 10.76 1.6% 2.0%
Denmark 5.81 5.88 5.96 2.0% 1.7%
Estonia 1.33 1.32 1.31 2.2% 2.6%
Finland 5.53 5.54 5.52 0.6% 1.2%
France 67.20 68.04 68.75 0.7% 1.0%
Germany 83.14 83.48 83.45 0.8% 0.7%
Greece 10.70 10.51 10.30 0.7% 0.6%
Hungary 9.77 9.70 9.62 1.8% 2.6%
Ireland 4.97 5.27 5.50 2.0% 1.7%
Italy 60.29 60.09 59.94 0.3% 0.3%
Latvia 1.91 1.82 1.71 1.4% 1.9%
Lithuania 2.79 2.71 2.58 1.7% 1.5%
Luxembourg 0.63 0.66 0.69 1.7% 2.0%
Malta 0.51 0.56 0.59 2.7% 4.1%
Netherlands 17.40 17.75 17.97 0.7% 0.7%
Poland 37.94 37.57 37.02 2.1% 2.4%
Portugal 10.29 10.22 10.09 0.8% 0.8%
Romania 19.28 18.51 17.81 2.7% 3.0%
Slovakia 5.46 5.47 5.44 1.1% 1.7%
Slovenia 2.10 2.11 2.11 2.1% 2.4%
Spain 47.32 48.31 48.75 0.9% 1.6%
Sweden 10.32 10.75 11.10 1.4% 2.2%
Beyond the update of the population and growth assumptions, an update of the
projections on the sectoral composition of GDP was also carried out using the GEM-E3
computable general equilibrium model. These projections take into account the potential
medium- to long-term impacts of the COVID-19 crisis on the structure of the economy,
even though there are inherent uncertainties related to its eventual impacts. Overall,
conservative assumptions were made regarding the medium-term impacts of the
pandemic on the re-localisation of global value chains, teleworking and teleconferencing
and global tourism.
International energy prices assumptions
Alongside socio-economic projections, transport modelling requires projections of
international fuel prices. The 2020 values are estimated from information available by
mid-2020. The projections of the POLES-JRC model – elaborated by the Joint Research
Centre and derived from the Global Energy and Climate Outlook (GECO146) – are used
to obtain long-term estimates of the international fuel prices.
146 https://ec.europa.eu/jrc/en/geco

108
The COVID crisis has had a major impact on international fuel prices147. The lost
demand cause an oversupply leading to decreasing prices. The effect on prices compared
to pre-COVID estimates is expected to be still felt up to 2030. Actual development will
depend on the recovery of global oil demand as well as supply side policies148.
The table below shows the international fuel prices assumptions of the baseline and
policy options of this impact assessment.
Table 2: International fuel prices assumptions
Source: Derived from JRC, POLES-JRC model, Global Energy and Climate Outlook (GECO)
Technology assumptions
Modelling scenarios is highly dependent on the assumptions on the development of
technologies - both in terms of performance and costs. For the purpose of the impact
assessments related to the “Climate Target Plan” and the ‘Delivering the European Green
Deal’ policy package, these assumptions have been updated based on a rigorous literature
review carried out by external consultants in collaboration with the JRC149.
Continuing the approach adopted in the long-term strategy in 2018, the Commission
consulted on the technology assumption with stakeholders in 2019. In particular, the
technology database of the PRIMES-TREMOVE model (together with PRIMES,
GAINS, GLOBIOM, and CAPRI) benefited from a dedicated consultation workshop
held on 11th November 2019. EU Member States representatives also had the opportunity
to comment on the costs elements during a workshop held on 25th November 2019. The
updated technology assumptions are published together with the EU Reference Scenario
2020. The same assumptions have been used in the context of this impact assessment.
Policies in the Baseline scenario
The policies included in the Baseline scenario build on the MIX scenario framework
underpinning the impact assessments accompanying the ‘Delivering the European Green
Deal’ package, relying on a combined approach of carbon pricing instruments and
regulatory-based measures to deliver on the ambition of at least 55% emissions
reductions by 2030 and climate neutrality by 2050.
In the context of this impact assessment, the Baseline scenario excludes the revision of
the TEN-T Regulation and other policy initiatives supported by it (e.g. the forthcoming
revisions of the Intelligent Transport Systems Directive, Rail Freight Corridors Directive,
Combined Transport Directive)150.
147 IEA, Global Energy Review 2020, June 2020 148 IEA, Oil Market Report, June 2020 and US EIA, July 2020. 149 JRC118275 150 In the context of the MIX scenario the revision of the TEN-T Regulation, the revision of the Intelligent
Transport Systems Directive, the revision of the Rail Freight Corridors Regulation and of the Combined Transport Directive were represented in a stylised way, ahead of the adoption of the specific legislative proposals.
in $'15 per boe 2000 ‘05 ‘10 ‘15 ‘20 ‘25 ‘30 ‘35 ‘40 ‘45 ‘50
Oil 38.4 65.4 86.7 52.3 39.8 59.9 80.1 90.4 97.4 105.6 117.9
Gas (NCV) 26.5 35.8 45.8 43.7 20.1 30.5 40.9 44.9 52.6 57.0 57.8
in €'15 per boe 2000 2005 ‘10 ‘15 ‘20 ‘25 ‘30 ‘35 ‘40 ‘45 ‘50
Oil 34.6 58.9 78.2 47.2 35.8 54.0 72.2 81.5 87.8 95.2 106.3
Gas (NCV) 23.4 31.7 40.6 38.7 17.8 27.0 36.2 39.7 46.6 50.5 51.2

109
In terms of transport network, the Baseline scenario assumes the completion of the core
TEN-T by 2030 and of the comprehensive TEN-T by 2050 and no further EU level
intervention besides the existing TEN-T Regulation. It also assumes the full
electrification of the core TEN-T rail network by 2030 and of the comprehensive TEN-T
rail network by 2050, in line with the existing TEN-T Regulation.
The policy measures reflected in the MIX scenario, relevant for the transport sector, are
summarised below:
- Extension of the EU ETS to the maritime sector, as well as to the road transport and
buildings sectors;
- Revision of the Renewable Energy Directive;
- ReFuelEU aviation and FuelEU maritime initiatives;
- Revision of the Directive on alternative fuels infrastructure;
- Gradual internalisation of external costs (“smart” pricing);
- Incentives to improve the performance of air navigation service providers in terms of
efficiency and to improve the utilisation of air traffic management capacity;
- Further actions on clean airports and ports to drive reductions in energy use and
emissions;
- Measures to reduce emissions and air pollution in urban areas;
- Pricing measures such as in relation to energy taxation and infrastructure charging;
- Revision of roadworthiness checks;
- Other measures incentivising behavioural change;
- Medium intensification of the CO2 emission standards for cars, vans, trucks and buses
(as of 2030), supported by large scale roll-out of recharging and refuelling
infrastructure. This corresponds to a reduction in 2030 compared to the 2021 target of
around 50% for cars and around 40% for vans.
These policies come in addition to other EU level policies and the National Climate and
Energy Plans, included in the Reference scenario 2020 and also reflected in the MIX
scenario. The full list of policies included in the Reference scenario 2020 is provided in
the Reference scenario publication.
Baseline scenario results
EU transport activity would continue to grow in the Baseline scenario by 2030 and by
2050, albeit at a slower pace than in the past. This is despite the significat impact of
COVID pandemic on transport activity. Freight transport activity for inland modes
(expressed in tonne-kilometres) would increase by 30% between 2015 and 2030 (1.8%
per year) and 55% for 2015-2050 (1.3% per year). Passenger traffic (expressed in
passenger-kilometres) growth would be lower than for freight with a 15% increase by
2030 (1% per year) and 33% by 2050 (0.8% per year). The annual growth rates by mode,
for passenger and freight transport, are provided in Figure 1.

110
Figure 1: Passenger and freight transport activity in the Baseline scenario (average growth
rate per year)
Source: Baseline scenario, PRIMES-TREMOVE transport model (E3Modelling)
Note: For aviation, domestic and international intra-EU activity is reported, to maintain the comparability with
reported statistics.
Road transport would maintain its dominant role within the EU. The share of road
transport in inland freight would remain relatively stable by 2030 and slightly decrease
by 2 percentage points by 2050. For passenger transport, road modal share is projected to
decrease by 2 percentage points between 2015 and 2030 and by additional 2 percentage
points by 2050. Passenger cars would still contribute 71% of passenger traffic by 2030
and more than two thirds by 2050, despite growing at lower pace relative to other modes.
Rail transport activity is projected to grow significantly faster than for road, driven in
particular by the assumed completion of the TEN-T core network by 2030 and of the
comprehensive network by 2050, supported by the CEF, Cohesion Fund and ERDF
funding, but also by the measures of the ‘Delivering the European Green Deal’ package
that increase the competitiveness of rail relative to road transport and air transport.
Passenger rail activity is projected to go up by 24% by 2030 relative to 2015 (62% for
2015-2050). High speed rail activity would grow by 68% by 2030 relative to 2015 (155%
by 2050), missing however to deliver on the milestone of the Sustainable and Smart
Mobility Strategy of doubling the traffic by 2030 and triplying it by 2050. Freigh rail
traffic would increase by 41% by 2030 relative to 2015 (91% for 2015-2050) also
missing to deliver on the milestone of the Sustainable and Smart Mobility Strategy of
increasing the traffic by 50% by 2030 and doubling it by 2050.
Domestic and international intra-EU air transport would grow significantly (by 39%
during 2015-2030 and 82% by 2050) following the recovery from the COVID-19
pandemics, although at lower pace than projected in the past. The lower growth is also
driven by the measures of the ‘Delivering the European Green Deal’ package.
Transport activity of inland waterways and national maritime also benefits from the
completion of the TEN-T core and comprehensive network and would grow by 19%
during 2015-2030 and by 33% by 2050. When considering all short sea shipping,
waterborne transport activity (inland waterways and short sea shipping) would grow by
19% by 2030 and 44% by 2050 missing however to deliver on the milestone of the
Sustainable and Smart Mobility Strategy of increasing activity by 25% by 2030 and by
50% by 2050.
Total energy use in transport, including international aviation and international
maritime, is projected to decrease by 9% between 2015 and 2030 and by 42% by 2050,
which in the context of growing activity shows the projected progress in terms of energy
efficiency driven also by the measures of the ‘Delivering the European Green Deal’
0.0%
0.5%
1.0%
1.5%
2.0%
2.5%
3.0%
Totalpassegertransport
Road Rail Intra-EUaviation
IWW andnationalmaritime
An
nu
al g
row
th r
ates
in B
asel
ine
'95-'15
'15-'30
'30-'50
0.0%
0.5%
1.0%
1.5%
2.0%
2.5%
3.0%
Total freighttransport
Road Rail IWW andnationalmaritime
An
nu
al g
row
th r
ates
in B
asel
ine
'95-'15
'15-'30
'30-'50

111
package. These developments are mainly driven by the CO2 emission performance
standards for new light duty and heavy duty vehicles, supported by the roll-out of
recharging and refuelling infrastructure and also by the shift towards more energy
efficient modes such as rail and waterborne transport.
Alternative fuels151, including renewable and low carbon fuels, are projected to
represent over 15% of transport energy demand (including international aviation and
maritime transport) in the Baseline scenario by 2030 and around 89% by 2050.
Figure 2: Share of alternative fuels used in transport (including international aviation and
maritime) in the Baseline scenario
Source: Baseline scenario, PRIMES-TREMOVE transport model (E3Modelling)
Electricity use in transport would steadily increase over time as a result of uptake of zero
and low-emission powertrains in road transport and further electrification of rail. Its share
in the total energy use in transport would go up from around 1.2% in 2015 to close to 4%
in 2030 and 25% in 2050. The uptake of hydrogen would be facilitated by the uptake of
fuel-cell powertrains in road transport and the FuelEU initiative for the maritime
transport, supported by the increased availability of refuelling infrastructure, and is
projected to represent slightly over 18% of energy use in transport by 2050. Around 8%
of all transport fuels in 2030 would be of biological origin, going up to close to 27% by
2050. Finally, hydrogen-based fuels (e-liquids, e-gas, methanol and ammonia) would
provide another 18% for the transport fuel mix by 2050.
CO2 emissions from transport including international aviation but excluding
international maritime, are projected to be 19% lower by 2030 compared to 2015, and
94% lower by 2050. Compared to 1990, this translates into 1% emission reductions by
2030 and around 90% by 2050. When accounting the intra-EU aviation and intra-EU
maritime in the transport emissions, the Baseline projections show reductions of 21% by
2030 and 97% by 2050 relative to 2015. When all intra-EU and extra-EU aviation and
maritime emissions are accounted in the transport emissions, the Baseline scenario
results in 17% decrease in transport emissions by 2030 and 93% decrease by 2050
compared to 2015 levels.
151 According to the Directive 2014/94/EU, ‘alternative fuels’ refer to fuels or power sources which serve,
at least partly, as a substitute for fossil oil sources in the energy supply to transport and which have the potential to contribute to its decarbonisation and enhance the environmental performance of the transport sector. They include, inter alia: electricity, hydrogen, biofuels, synthetic and paraffinic fuels, natural gas, including bio-methane, in gaseous form (compressed natural gas (CNG)) and liquefied form (liquefied natural gas (LNG)), and liquefied petroleum gas (LPG).
0%
10%
20%
30%
40%
50%
60%
70%
80%
90%
100%
Baseline Baseline
2015 2030 2050
% a
lter
nat
ive
fuel
s in
tra
nsp
ort
methanol
ammonia
e-gas
e-liquids
liquid biofuel
natural gas
biomethane
hydrogen
electricity

112
Figure 3: CO2 emissions from transport (including international aviation but excluding
international maritime) in the Baseline scenario
Source: Baseline scenario, PRIMES-TREMOVE transport model (E3Modelling)
NOx emissions are projected to go down by 56% between 2015 and 2030 (87% by
2050), mainly driven by the electrification of the road transport and in particular of the
light duty vehicles segment. The decline in particulate matter (PM2.5) would be
slightly lower by 2030 at 52% relative to 2015 (91% by 2050).
As explained above, the Baseline scenario in the ASTRA and TRUST models are
calibrated to the results of the PRIMES-TREMOVE model.
3. Modelling assumptions for the policy options, per policy measure
The policy measures included in each policy option need to be translated into inputs for
modelling. This section presents the assumptions used in the transport modelling with the
TRUST model and the economic modelling performed with the ASTRA model, drawing
on the impact assessment support study152.
Transport modelling
Policy measure: Introduction of minimum passenger line speed of 160 km/h for the
passenger TEN-T core rail network
According to information available from the TENtec information system, the overall
length of the EU27 TEN-T core rail network (including planned new constructions) is
about 63,000 km. Out of this, nearly 47,600 km of network are available to passenger
transport153. Always according to the TENtec information system, in 2017 the length of
the existing rail passenger core network was about 40,000 km154. Out of this, 26,000 km
of the network had a maximum operating speed (real value) for passenger trains equal or
lower than 160 km/h155. This means that in 2017 about 65% of the core network did not
meet the requirement of a minimum passenger line speed of 160 km/h.
The introduction of the new standard on the core network however is planned to be fully
operational by 2050 in PO2 and by 2040 in PO3. As such the measure will apply to those
152 MOVE/B1/2020-252: Analysis accompanying the Impact Assessment for the revision of Regulation
(EU) 1315/2013 on Union Guidelines for the development of the trans-European transport network 153 Considering only the core network sections whose railway activity is for ‘Passenger’ or for ‘Passenger
and Freight’. 154 About 7,700 km of network is indicated as ‘Planned New Construction’. 155 This indicator does not consider the core network sections marked as “New constructions” and those
sections whose information on the Maximum Speed is not available (i.e. near 1,500 km)
0
100
200
300
400
500
600
700
800
900
1,000
Baseline Baseline
2015 2030 2050
Mt
of
CO
2
inland waterways andnational maritime
aviation
rail
other road transport
heavy goods vehicles
vans
cars

113
sections that in 20 or 30 years from now will not yet be compliant with such standard.
Therefore, TRUST model’s assumptions build upon the model’s network layer in 2030 to
take into account the expected development on the core network (which is already part of
the Baseline).
To simulate a gradual phasing in of the measure in PO2 assumptions entail the upgrade
of the minimum speed of the rail core network links to 140km/h in 2040 and to 160km/h
in 2050.
PO3 envisages the anticipation of the measure which is simulated by fully upgrading the
minimum line speed of the links in need of improvements to 160 km/h from 2040
onwards. The measure was applied on 56% of the length of the TRUST core passenger
rail network. Feedbacks on changes of network’s transport time due to the new speed set
in TRUST have been used as input for ASTRA simulations.
Policy measure: Possibility to run trains loaded with P400 units (P400 loading gauge)
for rail freight on the core network
According to information available from the TENtec information system, out of about
63,000 km of core rail network, nearly 49,500 km are available to freight transport156.
Always according to the TENtec information system, in 2017 the length of the existing
rail freight core network was about 46,000 km157. Out of this, about 33,000 km of the
network had a loading gauge not compliant with the P400 units. This means that in 2017
about 66% of the rail freight core network didn’t meet the requirement of allowing P400
units for semitrailers.
The modelling of this measure has entailed as a first step the identification of the sections
of the core network not compliant with this standard. As some information gaps occur in
the TENtec layer (especially for France, Spain, and Portugal) the data gaps have been
filled by using the information available from UIRR’s map of codified lines.158 As a
second step, all OD pairs transiting on the identified links have been identified. This
means identifying the OD pairs that are currently affected by the limitation of using P400
semi-trailers units and that will benefit from future improvements of the network loading
gauge. In a third step a reduction of operating cost and transport time have been applied
on the identified OD pairs of the unitized freight rail matrix. This assumption is grounded
on the consideration that the removal of the bottleneck on even a single section of the
whole route of an OD pair will improve the operation of the whole trip.
Assumptions for these reductions have been derived from the following main sources:
EU (2016) Project Move/B2/SER/2013/825 (SYSTRA) Measuring and upgrading
clearance gauge of railway lines. Market Study and Feasibility;
UIRR (2020): 2020 Report on Combined Transport in Europe;
UIRR (2021): UIRR Position Paper April 2021;
Tomlift159 for cost data retrofitting of semi-trailers.
PO2 considered a reduction of operating cost of 9.2% per tkm and of transport time of
7.3% by 2050 and half of these reductions by 2040, to simulate a gradual phasing in of
the measure.
156 Considering only the core network sections whose railway activity is for ‘Freight’ or for ‘Passenger and
Freight’. 157 About 3,500 km of network is indicated as ‘Planned New Construction’. 158 http://www.uirr.com/media-centre/leaflet-and-studies/mediacentre/66-map-of-the-railw 159 http://transport-innovation.com/en/tomlift.html

114
PO3 considered a reduction of operating cost of 9.2% per tkm and of transport time of
7.3% since 2040. Moreover, PO3 assumes in 2040 the possibility to run rail freight trains
loaded with P400 units also on the non-core sections of the European Transport
Corridors (ETC). This measure is modelled by adding to the list of the OD pairs
previously identified for the core network’s upgrade the additional OD pairs originated
from the inclusion of the new ETC sections on the non-core network. It is worth to
consider however that the number of additional OD pairs identified due to the new
sections is rather limited as most OD pairs were already included in the first selection
(i.e., stemming from the application of the new standard to the core network). Same
reductions of transport time and cost on the OD pairs transiting on the concerned links
are applied.
Feedbacks on changes of network’s transport time and costs set in TRUST have been
used as input for ASTRA simulations.
Policy measure: Extension of certain standards from the core to the comprehensive
network: application of the existing infrastructure requirements of the core network
also on the comprehensive network: 22.5 t axle load, 100 km/h line speed for freight
and the possibility of running trains with a length of 740 m
Other key components of POs are the measures aimed at enhancing the TEN-T rail
freight network and are related to the extension of certain standards (i.e. 22.5 t axle load,
100 km/h line speed and the possibility of running trains with a length of 740 m) from
the core to the comprehensive non-core network. These measures are planned to be fully
operational by 2050 in PO2 and in PO3. Moreover, PO3 assumes by 2040 the anticipated
extension of these standards to the comprehensive non-core ETC sections. The
identification of network links to be upgraded is based on TENtec information system.
For the modelling of the standard of 22.5 t axle load and of train length of length of 740
m all OD pairs transiting on the identified links have been identified. This means
identifying the OD pairs that are currently affected by the limitation of running trains of
22.5 t axle load or with a length of 740 m. In the following step time and cost reductions
have been applied on the identified OD pairs of the unitized freight rail matrix. This
assumption is grounded on the consideration that the removal of the bottleneck on even a
single section of the whole route of an OD pair will improve the operation of the whole
trip.
PO2 applied a time reduction of 7% and a cost reduction of 12% (per tkm) by 2050 and
half of these reductions by 2040 to simulate a gradual phasing in of the measure. In PO3
the measure is anticipated to 2040 to the comprehensive non-core ETC sections. A time
reduction of 7% and a cost reduction of 12% (per tkm) on the OD pairs of the unitized
freight rail matrix transiting on the identified links were identified. In 2050 time and cost
reductions are applied also on the rest of the comprehensive network in need of
upgrading.
For the modelling of the speed, we improved the speed of the links of TRUST model’s
rail freight network following the identification of links to be upgraded from the TENtec
information system. Feedbacks on changes of transport time and costs set in TRUST
have been used as input for ASTRA simulations.
Policy measure: Requirements for terminals
New requirements for terminals (with exemption system for specialised terminals and
terminals in spatially constrained locations) include:
- all types of intermodal loading units can be handled
- 740m long tracks exist under the crane

115
- no shunting required (includes electrification).
To take into account these improvements a 5% reduction of time and cost at intermodal
terminals was applied. Feedbacks on changes of transport time and costs set in TRUST
have been used as input for ASTRA simulations.
Policy measure: Maritime / inland ports / terminals: extension of the TEN-T standards
to the last mile connection by rail / IWW
Although, in case of extension of the TEN-T standards to the last mile connection by rail
/ IWW there is actually no need for lock change, most ports and terminals are run at least
partly by private companies and thus on network border, there will still probably be a
lock change for organizational reasons. However, the other requirements lead to decrease
of handling time and an increase in transportation speeds. Additionally, trains can be
longer and heavier. As a consequence, more goods can be transported to terminals. In
most cases terminal infrastructure with loading and handling of goods is the bottleneck.
More important is the increase in reliability due to more rail capacity on last mile
connections. As a consequence, only minor cost and time savings related to second order
effects of about 5% per tkm on concerned OD pairs were assumed. Feedbacks on
changes of transport time and costs set in TRUST have been used as input for ASTRA
simulations.
Policy measure: Introduce new elements for passenger transport, such as the design of
transfer terminals, accessibility for all users, information across modes (also covering
first/last mile connections), enabling of innovative mobility services
The enhancement due to digitalisation is coupled with the enhancement due to the better
design of passenger terminals and is simulated within the ASTRA model by assuming a
reduction of the time needed to access public transport modes. Based on expert estimates,
small time improvements for long-distance travel and commuting can be expected from
this measure (3%). In contrast, relative improvements for shorter distances are supposed
to be larger (5%). A reduction of 5 minutes per trip was assumed.
Policy measure: Digitalisation of passenger and freight terminals
The digitalization of passenger terminals offers new opportunities for customers along
the terminal service chain and optimizing personal travel operations. Digital services
include among others electronic ticketing, navigation through the terminal, and real-time
information and guidance in case of disturbances or delays. There are also overlaps with
other measures relating to the digitisation for passenger transport. An example is the one
“for urban nodes, including MaaS services allowing passengers to access information
and book their journeys, including for public transport and active modes.” For passenger
transport, digitalisation of terminals can lead to further cost and time savings of around
1%.
The enhancement due to digitalisation is coupled with the enhancement due to the better
design of passenger terminals and is simulated within ASTRA model by assuming a
reduction of the time needed to access public transport modes. A reduction of 5 minutes
per trip was assumed.
The digitalisation of freight terminals is modelled in TRUST. Further potential to
improve information flows and remove the main technical and administrative barriers can
be realised by replacing the still common paper-based communication, electronic billing,
etc. Consequently, a reduction of costs and time for freight handled at TEN-T intermodal
terminals of about 2% was assumed. Feedbacks on changes of transport time and costs
set in TRUST have been used as input for ASTRA simulations.

116
Policy measures: Obligation to ensure motorway standard on core road network AND
Obligation to ensure motorway standard for comprehensive network
Both PO2 and PO3 assume a reduced accident rate on the TEN-T road network due to
the newly introduced obligation to ensure motorway standard on the core and
comprehensive road network with exemption clause based on traffic intensity (10.000
vehicles / day in both directions). For non-motorway roads whose traffic is higher than
10.000 vehicles / day in both directions the same accident rates of motorways were
assumed.
Policy measure RFC alignment: Integration of RFC sections outside the TEN-T in the
comprehensive network
A cornerstone measure of PO3 is the creation of the European Transport Corridors
integrating Rail Freight Corridors (RFC) and Core Network Corridors (CNC). Following
this integration, several RFC sections currently outside the TEN-T will be included in the
comprehensive (non-core) network. Other sections will be added to the TEN-T
comprehensive network following (i) specific request of Member States, (ii) the inclusion
of new urban nodes, and (iii) the alignment of TEN-T with Military Mobility network.
Overall, the TEN-T comprehensive network will be extended by near 5,600 km of
railways and by near 2,000 km of roads. These extensions represent 5% of the currently
defined TEN-T rail network and 1.9% of the road network.160 These changes have been
modelled in TRUST by adding and removing links to the alignment of the modelled
TEN-T.
Policy measure: Introduction of a legally binding deadline for decommissioning
national (class B) systems and making ERTMS the only signalling system used in
Member States by 2040 for core and comprehensive network and thus to advance the
ERTMS standard obligation for the comprehensive network to 2040
The introduction of the ERTMS standard for the comprehensive network is simulated by
assuming a reduction of operational costs of rail by 9%. This assumption draws on the
study ‘The impact of TEN-T completion on growth, jobs and the environment’161.
Feedbacks on changes of transport costs set in TRUST have been used as input for
ASTRA simulations.
Economic modelling
Challenges with (investment) cost allocation
The investment estimates are strongly affected by the problem of cost allocation. That is
why this chapter is devoted to a general explanation of the problem as well as a specific
characterisation of the TEN-T measures especially with regard to the rail KPIs defined in
the policy options.
Rail KPI requirements defined in the TEN-T scenario options are:
(1) ERTMS control technology for passenger and freight trains
ERTMS requirements are widely independent of the other KPIs because they
need improvements of the communication technology in the locomotives and a
few instalments alongside the rail tracks (balises). Although the planning of new
160 The length of the EU 27 TEN-T comprehensive network under the current Regulation is 113,005 km of
railways, 106,650 km of roads and 15,732 km of inland waterways. 161 https://ec.europa.eu/transport/sites/default/files/studies/ten-t-growth-and-jobs-synthesis.pdf

117
projects often includes a list of the above options including ERTMS, the ERTMS-
related costs are widely separable from the other KPIs.
(2) Terminals appropriate for P400 and 740 m long trains.
P400 and 740 m for terminals are also planned in the context of comprehensive
projects including at least KPI (5). There may occur a few overlaps with KPI (5)
implementation (e.g. sidings on the last mile) while in general measures for KPI
(2) are independent and their costs separable.
(3) Min. design speed of 160 km/h for passenger trains.
Design speed of 160 km/h is standard for long-distance passenger trains on
double tracks. Sections not compliant with this standard are in mountainous areas
or in areas where the railway networks have not been sufficiently maintained and
renewed such that low-speed sections remain. If modernisation is planned, then it
will include speed increases for passenger and freight trains on sections with
mixed traffic. Therefore, KPI (3) is interdependent with KPI (7).
(4) Min. quality standards for maintenance and project cycle standards.
If major maintenance and replacement investments of network sections are
planned, these are often combined with upgrades and modernization. Therefore,
there is a close interdependency between KPI (4) with KPI (3), (5), (7) and (8).
The latter KPIs are then often calculated at incremental costs, using the argument
that the maintenance and replacement of depleted components would have to be
done anyway in certain cycles.
(5) P400 on the network.
P400 on the network is closely related to P400 in terminals (KPI (2)).
Furthermore, it requires in general an adjustment of clearing spaces in tunnels and
can be implemented in the context of major tunnel maintenance (KPI (4)).
(6) Min. freight train length of 740 m.
740 m train length on the network requires that the same requirement is fulfilled
for the relevant terminals (KPI (2)). This means that KPI (2) and (6) should be
planned in a coordinated way.
(7) Design speed of 100 km/h for freight trains.
A design speed of 100 km/h for freight trains is interdependent with the design
speed for passenger trains (KPI (3)) and can be provided in combination with
major maintenance and replacement work (KPI (4)).
(8) Max. axle load of 22.5 tons for freight train cars.
Providing 22.5 tons of axle load requires to strengthen the track layers
accordingly, which is also necessary for higher train speeds (KPI (7)). Cost
savings can be achieved if this KPI is implemented in the context of major
maintenance and replacement investments (KPI (4)). If this measure is planned on
sections, which include tunnels, then also the adjustment of tunnel clearance can
be done simultaneously (KPI (5)).
Figure 4 summarises the cost interdependencies between the KPIs. The costs of KPI (1),
ERTMS, are widely separable, therefore there is no link indicating a cost
interdependency with other KPIs. The 740 m KPIs (6) and (2) can be calculated widely
independent from the other KPIs. There is only a close interrelationship between 740 m
on the network and in the relevant terminals. The KPI with the highest interdependency
is KPI (4) which denotes maintenance and replacement investments. Many
modernization measures can be done in the context of regular major maintenance and
replacement work. Measures for increasing freight train speeds and axle loads (KPI 7 and

118
8) are interdependent, because higher speeds also require a higher strength of the track
design (and additionally further measures like reducing curvature).
Figure 4: Interdependencies between rail KPI costs
Source: M-Five
It follows from these cost interdependencies, that investment costs for the KPIs (3), (5),
(7) and (8) could be lower, if they are implemented at the time of periodical major
maintenance/replacement investment. However, such an investment policy would face
two caveats:
The presently best-maintained sections would come last in the maintenance
cycles. If these sections show high traffic volumes, then modernization benefits
on highly used tracks would be shifted to the long-term future.
Synchronising the above KPIs with the maintenance cycles would lead to a
patchwork of network improvements, i.e., train routes between OD pairs would
be left incomplete until the last section would be foreseen for maintenance work.
Again, the benefits would be shifted to a long-term future.
From this, it follows that an optimal investment strategy presupposes a comprehensive
network approach including all KPIs simultaneously. The costs to be allocated to the
single KPIs then can be derived from the optimal investment strategy, for example by
applying methods of infrastructure cost allocation as mentioned above.
Approach in this study
For estimating investment costs, identical data sources (were possible) were used to
ensure consistency of numbers and methodology. Cost data for the appropriate measures
can be found in the Project Database from the study on “The impact of TEN-T
completion on growth, jobs and the environment” (Schade et al., 2018, contract no.
MOVE/B1/2017-184)162, which in total includes 3,037 projects. When estimating the
investment costs, one is confronted with the general problem of the allocation of
common costs described above. As explained, a fair respectively efficient allocation of
162 The CNC project list is an extensive database of all projects planned along the core network corridors
(CNC) to complete the TEN-T core network. The final database contained 3,037 projects. These
projects have notably been identified in the framework of the corridor analysis carried out by external
consultants on behalf of the European Commission as well as in a study on ERTMS. Member States
and other stakeholders/ project promoters have been closely involved (in particular through the 'Core
Network Corridor Fora').

119
common costs or synergy gains is insoluble due to interdependencies. Hence, the costs
estimations derived from available data in the CNC project list are based on the
assumption that KPIs are implemented separately so that the single KPI cost items are
additive.
The second important data source are the TENtec shapefiles of the (rail) network
including the quality parameters of each section (e.g. complying with minimum speed
KPIs, enabling 740m trains, etc.). The shapefiles provide the length of sections not
complying with a KPI in km length. I.e. the information is provided on the length of the
section not on the length of tunnels on a section which need to be upgraded to P400 or on
the number of sidings to be upgraded or added to a section to comply with the 740m KPI.
The advantage of using TENtec is to apply a commonly agreed and consistent database.
The disadvantage is that average or benchmark figures at the level of sections need to be
applied for the cost estimation as the exact figures (e.g. metres of length of tunnel to be
upgraded to P400, metres of sidings and switches to be added to comply with KPI 740m,
etc.) are not available in the TENtec database.
This consistent approach results in relatively low investment costs per km for the KPI (6)
(740m train length) on the network part which is presently not compliant with this KPI.
A reason is that the measure requires only the extension of sidings but is based on the
length of a section not complying with that KPI. The costs for KPIs (7) (speed of
100km/h) and (8) (22.5 tons of axle load) are estimated much higher, because they
require major upgrades on the total km length of the non-compliant tracks. According to
the interdependency analysis (see above), cost savings can be achieved by a joint
realisation. As this could not be fully considered in the data source, one can follow that
the cost estimations for KPIs (7) and (8) are in the upper range of plausibility intervals.
This perception is supported by cross-checking estimations with other sources as well as
expert interviews. Both confirm the approach and show that the estimates can be
considered plausible. A detailed overview of the investment estimates and validation
procedures for each individual measure is presented in the following chapters.
To conclude, estimating isolated costs based on average values is a practical approach for
the TEN-T impact assessment. However, there are limits to this methodology. As
explained above, single KPIs are in practice implemented as a package and share
common costs. Therefore, a separate estimation of costs is subject of possible criticism
based on the problem of cost allocation. In addition, average cost estimates based on
available data were used. Actual costs of individual projects depend on topography (flat,
hilly, adverse terrain), settlement structure (rural, urban), geographic location etc. and the
costs vary widely between projects.
Policy measure for rail freight: Possibility to run trains loaded with P400 units (P400
loading gauge) for rail freight on the core network
First, the sections of the TEN-T core network, which are currently affected by the
limitation to operate P400 loading gauge, have been identified by using TENtec
shapefiles. The total length of the network sections, which are currently affected by the
limitation to operate P400 loading gauge, in all EU Member States (MS) is around
33,168 km. The length of the network affected in each MS was then quantified and
multiplied with the unit costs per km. These were taken from the case study on RFC2

120
Calais-Basel.163 Based on the study, unit costs were estimated at approximately 107,215
€2015 per km. Countries which need major upgrades of tunnels are France, Italy, Spain
and Portugal. For Spain and Portugal, half of the cost rate has been assumed, because the
Iberian gauge leads to lower conversion costs. Other than that, the unit costs were used
for all identified network sections without differentiating individual profiles of tunnels or
bridges (strength, max. axle loads etc.). P400 can be achieved by standard pocket wagons
(33 cm) and lower pocket wagons (27 cm). These estimations are based on standard
pocket wagons. Using lower pocket wagons could reduce investment requirements for
tunnels (394 cm instead of 400 cm clearance).
Investments include initial costs that occur, for example, for adjusting tunnel clearance.
Follow-up costs for maintenance are not considered. For EU27 the total investment
amounts to 3,556 Mln. €2015 (PO2 and PO3164). These investments are phased-in linearly
over the years starting in 2025 up to 2040 (in PO3) and up to 2050 (in PO2). In ASTRA,
investments are fully allocated to the sector Construction. Based on the impact
assessment support study, a share of 10% comes from EU funding. The rest is financed
by national public funding (90%).
Policy measure: Introduction of a minimum passenger line speed of 160 km/h for the
passenger core network
To model the introduction of a minimum passenger line speed of 160 km/h for the
passenger core network, first the sections of the TEN-T passenger rail core network
whose minimum speed by 2030 is below 160 km/h have been identified. For this
analysis, the TENtec railway lines are used. The TENtec shapefiles are filtered by core
network. Links which are only used in freight transport are left out. The lines were then
aggregated by MS and line speed. The speeds are further clustered into five different
speed classes. The following table shows railway line speeds identified in the data inputs
that have been aggregated into speed classed. The table also shows the estimated
additional unit costs (per km) per speed class relative to the Baseline.
163 EC (2016): Measuring and upgrading the clearance gauge of railway lines: Assessment of information
systems and procedures. Final Report with authorships from UIC and SYSTRA. November, 2016 Contract number – MOVE/B2/SER/2013-825. Ref. No. FR01T15B62/DCO/EU/34-16. Brussels. Available at https://ec.europa.eu/transport/sites/transport/files/2017-report-clearance-gauge-railway-lines.zip
164 Rail freight core network will not change.

121
Table 3: Speed classification and additional costs per kilometre relative to the Baseline
Speed
(km/h)
Speed classes
(km/h)
Mln. € per
km (€2015) 300
>=160 0 250
200
160
150 120-159 5.5 140
120
100 80-119 5.9
80
60
<80 6.2 50
40
30
0 unclassified 5.9
Source: M-Five analysis of CNC project list 2017
In order to determine the costs per km, the Project Database from the study on “The
impact of TEN-T completion on growth, jobs and the environment” (Schade et al., 2018,
contract no. MOVE/B1/2017-184) has been used. After filtering current projects for
upgrades, only fourteen projects met the criteria and where closely examined. Costs for
the speed class 120-159 km/h were estimated at 5.5 mill. €2015/km as average and used as
a base value. Following literature, a 13 percent cost increase has been attributed to the
lowest speed class (<80 km/h) resulting in 6.2 mill. €2015/km (EC, 2018, Contract
No2017CE16BAT002)165. The cost per km for the speed class 80-119 km/h is computed
using a linear interpolation. There are no additional investments as part of this measure
for sections whose line speed is already equal or over 160 km/h. The TENtec database
also provides some network sections without speed classification. For these parts, the
mean value (5.9 mill. €2015/km) of all speed classes under 160 is estimated to project
investments.
The last step is to multiply the upgrade costs per speed with the respective network
length in each MS. By assumption, investments are phased-in linearly into the ASTRA
model between the years 2025 and 2040 (in PO3) or 2050 (in PO2). For EU27, the total
investments amount to 134 bln. €2015 between 2025 and 2050 for PO2 and PO3. Rolling
stock costs were not considered, as it is assumed that the rolling stock does not require an
upgrade as on some links they were already enabled to drive at 160 km/h or above.
Investments are fully allocated to the sector Construction. Following the abovementioned
Project Database, the infrastructure investments are assumed to be funded by EU funds
(30%), by EIB loans (5%) and by national public funds (65%).
Policy measure: Extension of certain standards from the core to the comprehensive
network: application of the existing infrastructure requirements of the core network
also on the comprehensive network: 22.5 t axle load, 100 km/h line speed for freight
and the possibility of running trains with a length of 740 m
Calculations of investments are broken up into the three separate upgrades of:
- 22.5 t axle load,
- 100 km/h line speed and
- the possibility of running trains up to a length of 740m.
165 EC (2018): Assessment of unit costs (standard prices) of rail projects (CAPital EXpenditure). Final
report. Contract No2017CE16BAT002. Brussels.

122
For either one of these three actions, the length of the network that needs to be upgraded
is determined with data from TENtec shapefiles. The total length of the network sections
for all 27 MS is around 23,000km, 19,000 km and 34,000 km respectively for PO2. That
means a share of 23%, 19%, respectively 34%, of the total network.166 The unit cost per
kilometre stems from the Project Database on “The impact of TEN-T completion on
growth, jobs and the environment” (Schade et al., 2018, contract no. MOVE/B1/2017-
184). It is determined by using comparable projects, which only include an upgrade
regarding the specific measure. Average investments per km were calculated on the basis
of these projects identified. The resulting cost figures are shown in the following table.
Table 4: Rail network standards unit costs and total costs by type of standard
Standard Estimated Unit Costs EU27 investment
(PO2)
EU27 investment
(PO3) 22,5 t axle load 6.5 Mln. €2015 per kilometre 147 Bln. €2015 150 Bln. €2015 100 km/h line speed 2.5 Mln. €2015 per kilometre 47.7 Bln. €2015 48.9 Bln. €2015
740m trains 0.02 Mln. €2015 per kilometre 0.8 Bln. €2015 0.8 Bln. €2015
Source: M-Five analysis of CNC project list 2017
These costs are to be understood as additive if the same section has to be upgraded to
account for all three standards. For EU27 the total investment amounts to 195.4 Bln. €2015
(PO2), respectively 199.9 Bln. €2015 (PO3). These investments are phased-in linearly over
the years starting in 2025 up to 2050 (PO2). For PO3 the implementation period is 2025-
2040 for ETC comprehensive and 2025-2050 for the rest of the comprehensive network.
In ASTRA, investments are fully allocated to the sector Construction. We assume that
the infrastructure upgrade is funded by EU funds (45%), by EIB loans (5%) and by
national public funds (50%). These shares were derived in the light of similar projects in
abovementioned Database.
Due to the problem of cost allocation described above, the estimates are subject to
potential uncertainties and criticism. One could argue that the costs for the KPI of 740m
trains are on the lower bound, while the costs for the 22.5 t axle load might be estimated
at the higher end of costs. Therefore, a review of the cost estimates has been carried out.
To validate our estimations, they were cross-checked with further sources and projects
outside the CNC project database. The findings are summarized in Table 5 for 740m
trains and Table 6 for 22.5 t axle load.
Table 5: Costs from other sources for 740m trains
Country Area or
Line
Cost per
measure
(Mln.€)
Cost per km (in Mln.€ /
km) (as used in
methodology)
Source
Measures for whole countries
DE Whole
country
421 (5.6
Mln. € per
project)
0.524 Verkehrsinvestitionsbericht 2018
Bundesverkehrswegeplan 2030
PL Whole
country 2342* 5.1
Study on capacity improvement - SCI.
Analysis of 740m long trains. North
Sea-Baltic
AT Whole
country 240 **
Programm Herstellung Güterzuglänge
Überholgleise
Measures for single projects
Country Area or Line Mln. € Mln. €/km Source
DE Emmerich – 1.5 0.022 Study Long Trains (740m) Corridor
166 Due to network changes, the affected network in PO3 slightly increases to 23.500 km (23%), 20.000
km (19%), 35.000 km (34%).

123
Oberhausen Rotterdam-Genoa
DE Karlsruhe – Basel 6.2 0.032
IT Ceneri (Tunnel) 2.1 0.133
CH/IT Chiasso – Milano
(geographically
challenging terrain)
5 0.068
BE Antwerpen Haven -
Bundel B3 0.4 0.031 Study on capacity improvement - SCI.
Analysis of 740m long trains. North
Sea-Baltic BE Antwerpen Haven -
Bundel Oorderen 0.4 0.036
Average across all projects Ø 0.071 Mln.€ / km
Lines without geographically challenging
terrain and tunnels Ø 0.030 Mln.€ / km
* Improvements on the network is needed and included in costs. ** Further relevant infrastructure work is included (figures not considered sufficient to derive any ‘representative’ costs).
Source: Compilation by M-Five based on various sources
Costs relate to the creation of railways sidings and passing tracks. One can notice a high
variance in costs. The estimation for costs based on km used here is on the low end of
possible cost estimations. However, interviews with German and Austrian Ministries
have reconfirmed that it is difficult to separate the costs clearly from other measures in
the context of comprehensive modernisation projects. This implies that cost data
published on this matter refer to packages of modernisation measures and cannot be
allocated only to 740 m trains. Figures from Belgium underline that the measures
necessary for this KPI are in the first instance related to the adjustment of sidings and
therefore not cost intensive. This supports the cost estimates used.
A relevant argument for an increase of cost estimations could be that the use data base
refers to the past when the necessary construction works were easy to implement while
this might be more difficult in the future (e.g.: land acquisition, approval processes,
environmental regulations, mountainous areas). However, estimating such effects would
require more detailed country information.
Table 6: Costs from other sources for 22.5 t axle load
Country Line Cost per measure
(in M€)
Cost per km (in
Mln.€ / km)
(as used in
methodology)
Source
Measures for single projects
HU Rajaka s.b -
Hegyeshalom 62 4.96
Amber rail freight
corridor.
Implementation plan.
RFC 11 CID BOOK 6 HU Rákos - Felsőzsolca 672.6* 7.32*
CZ Praha Libeň - Praha
Malešice 51 9.44
Rail Freight Corridor
North Sea Baltic.
Corridor Information
Document.
Implementation Plan
Average Costs of Projects Ø 7.19
* includes ECTS
Source: Compilation by M-Five based on various sources
A major argument for a possibly lower cost estimation for 22.5 t axle load is that the
necessary construction works could be done in the context of major works for
maintenance and replacement investment. While there is no doubt that subtracting the
costs of regular maintenance and replacement from the total cost of upgrading to the 22.5

124
axle load limit will lead to significant reductions of the cost estimation (taking only the
incremental costs) this does not solve the following problems:
The costs of several other KPIs can also be reduced if the works are coordinated
with major maintenance and replacement investments (see Figure 4, in particular
the interdependency with speed-related improvements). The problem of allocating
cost savings of modernization packages to all interdependent KPIs is more
complex.
The two caveats described above must be considered. Synchronising
modernisation with maintenance cycles might cause delays for the usability of
complete OD-routes such that the beneficial use of the modernized tracks cannot
start before the last major maintenance work on a route is terminated.
Insofar calculating the costs of the 22.5 tons KPI at incremental costs would imply that
the cost savings are only allocated to this measure.
Life-cycle cost effects have to be considered: If investment costs are including not only
the present costs of modernisation measures but also the future costs of maintenance and
replacement, then further costs for the 22.5 t measure have to be added. The costs of
track depletion increase non-linearly with axle weight. These higher costs of increased
frequency of replacement needs are reflected in the German figures on rail freight track
charging. The magnitudes of charges which are derived from an infrastructure cost
allocation analysis are
3.05 EUR/train.km for standard freight trains
4.30 EUR/train.km for heavy freight trains (+41%)
From this, it follows that even if a part of cost savings from common investment would
be allocated to the 22.5 t KPI this would be widely compensated by additional costs of
major maintenance and replacement.
Policy measure: Requirements for terminals
Requirements for terminals (with the exception of the system for specialized terminals
and terminals in spatially constrained locations) include:
- all types of intermodal loading units can be handled
- 740m long tracks exist under the crane
- no shunting required (includes electrification)
In order to estimate the total investment required for this measure, several cost items
were considered. To ensure that all types of intermodal loading units can be handled,
there investments are necessary for:
- Vertical transhipment: Retrofitting of semi-trailers (e.g. system Tomlift), use of
Modalohr UIC pocket wagons, platforms for semi-trailers (e.g. system NiKraSa),
for swap bodies equipment of cranes and reach stackers with grappler arms

125
- Horizontal transhipment: Horizontal transhipment (e.g. systems Cargo-Beamer,
Modalohr horizontal)167, railrunner technology (swap bodies on rail bogies)
- Transhipment road-rail and rail-rail
Rail-road terminals are able to transship loading units from one mode to the other.
Usually this is done by gantry cranes and reach stackers in the case of vertical
transshipment.168 The number of tracks can be adjusted to the capacity demand; small
RRTs are equipped with one track, mega-hubs with up to six.
Rail-rail shipment requires at least two tracks for the trains such that the loading units
(LUs) can be moved between the trains. Efficient processes require at least two gantry
cranes (if trains are 740 m long). Additionally, a road is needed between the tracks and
storage areas on both sides. This technology may replace shunting processes on route,
because not the wagons are re-ordered rather than the LUs – comparable to passenger
transport. Additional requirements necessary are moving transport platforms for carrying
LUs on the parallel road between the rail tracks, plus control technology dependent on
digitalization.
These processes can be automated (e.g.: in the mega-hub of Lehrte/Hanover). A newly
built megahub with 6 rail tracks and storage areas for LUs using multiple innovations
required investment costs of 440,000 € (Lehrte). As not every terminal can be upgraded
to a mega-hub of this category, it has to be estimated how many terminals can be
upgraded to a higher quality level in the terminal hierarchy on the core and
comprehensive network.
The requirement of 740 m long tracks under the crane is not a matter of available
space for most terminals (see UIRR, 2020)169. Large terminals allow already train lengths
of 700 m and more (e.g.: 720 m for Mega Freight Centre Lehrte). However, the length of
tracks operated with transshipment technology is often shorter, as trains presently are
much shorter, on average. Therefore, for medium sized terminals additional costs for
extension of tracks can occur. This may be combined with the investment into an
additional gantry crane. Furthermore, storage areas have to be provided (in terminals
which did not operate semi-trailers and swap bodies before) and the last mile before the
terminal has to be upgraded (electrification, eventually sidings for waiting trains). In
addition, equipment for totally integrated electrical power has to be considered.
The requirement of no shunting required can be interpreted in two ways:
(1) No shunting required within the terminals, i.e. no shunter locomotive and driver are
required for moving the train access/egress sections or within the processing station. For
modern terminals this is a minor problem. Either they apply swing drive, i.e. entering the
terminal at a speed sufficient for pulling the wagons to the processing track and stopping
at the catenary on the other side. Or a train is pushed onto the processing track while the
locomotive keeps standing outside below the catenary. Also, other less expensive
methods for moving the train within a terminal can be applied (e.g.: cable winch), but at
low speed of the operations.
(2) No shunting on the route, in the sense that wagons have not to be decomposed and
blocked at marshalling yards. This would correspond to the rail-to-rail transshipment
167 For horizontal trans-shipment, about 10 systems are on the market or under development. The
analysis was reduced to 2 (CargoBeamer and Modalohr) as they are most advanced and already in operation for some ODs.
168 Rail-rail trans-shipment is also possible with horizontal technologies. But this is not considered here because the technology has not been applied until now.
169 UIRR (2020): 2020 Report on Combined Transport in Europe. Brussels.

126
discussed above. It has been assumed that there are no considerable additional costs for
the ‘no shunting’ requirement. For the estimation of investments, the analysis is restricted
to rail-road-terminals (RRT) and classify them following literature and publications of
logistic associations170 taking into account the requirement set for the TEN-T.
Table 7: Typology of rail-road terminals
Type Capacity LUs number
of tracks
electrical
p. supply
All type of
LUs
740 m track
length
Trans-ship
rail to rail medium 40-100,000 1-2 + + + -
large 100-150,000 2-4 + + + 75%
mega >150,000 >=4 + + + +
Source: M-Five analysis of CNC project list 2017 (+ means fully provided; - means not provided)
The requirements with respect to further facilities (road tracks for moving LUs, storage
areas, sidings, power supply) are implicitly considered. For further analysis, all small
terminals (below 40,000 LUs) are excluded. We further assume that mega-hubs are
limited in their performance to keep costs within reasonable limits. Mega-hubs can
provide a host of additional services which are outside the minimal performance
requirements defined here (e.g.: automation of processes, value added services, areas for
transport companies). It has been assumed that all mega-hubs for which the approval
processes have been started are finalised by 2030 (about 10 are allocated to the existing
core network). For the number of terminals, we follow Regulation (EU) 1315/2013171 for
the core and comprehensive networks.
Table 8: Number of terminals in the core and comprehensive network
Network Rail-road terminals EU27
Core 111
Non-core 101
Source: Regulation (EU) 1315/2013The following assumptions are set for deriving a
quantitative estimation of investment for the upgrades of terminals.
(1) Only the RRTs of Regulation (EU) 1315/2013 with the typology of Table 4 are
considered. Based on literature, it has been assumed that 50% of RRT are medium sized,
35% are large and 15% mega-hubs.172
(2) According to the data provided in the Fourth Workplans of the Coordinators, the
requirement of handling all LUs may be largely fulfilled by 2030 (more than 70%) while
the track length upgrades are lagging behind (less than 25% implemented). Also other
requirements like electricity equipment (about one third) are far from being achieved
according to the plan. Furthermore, several Coordinators report that in many cases also
access links (last mile) and sidings are outdated such that the access to the rail network is
far from the desired quality level. From this, it can be deducted that there are still
significant upgrading issues for terminals in the core network, which will need further
upgrading work after 2030.
170 FhG and TUHH (2017): Integrierte Maßnahmen zur Verlagerung von Straßengüterverkehren auf den
Kombinierte Verkehr und den Schienengüterverkehr. Integrated Measures for Diverting Road Freight Transport to Combined and Rail Freight Transport. Im Auftrag des BMVI. Dortmund.
171 https://eur-lex.europa.eu/legal-content/EN/TXT/?uri=celex%3A32013R1315" 172 UIRR (2020): Report on Combined Transport in Europe. Brussels. FhG and TUHH (2017): Integrierte Maßnahmen zur Verlagerung von Straßengüterverkehren auf den
Kombinierte Verkehr und den Schienengüterverkehr. Integrated Measures for Diverting Road Freight Transport to Combined and Rail Freight Transport. Im Auftrag des BMVI. Dortmund.

127
(3) For the existing conventional terminals only costs for removing terminal restrictions
are calculated. Vertical transhipment of craneable LUs (containers, semi-trailers, swap
bodies) will be feasible at all conventional terminals. Horizontal transhipment will be
provided at a few mega-hubs and new terminals which are added to the present list of
terminals. Further costs for innovations (e.g. automatic transshipment technologies,
packaging of services) are not considered.
(4) The following specification are considered in relation to the requirement for vertical
transhipment:
- Medium sized terminals between 40,000 and 100,000 LUs/a need 1 additional
gantry crane and additional reach stackers.
- Large sized terminals between 100,000 and 150,000 LUs/a need 2-3 gantry cranes
and additional reach stackers as well as a minimum of 2-3 processing tracks.
- Constructing a mega-hub is calculated at a fixed cost amount of 100 Mln. € on
average. This is lower than the cases reported above and based on the assumption
that most mega-hubs are not greenfield projects but rather developed from
existing facilities. The total number of mega-hubs would then sum up to about 30
in 2050 (15% of TEN-T RRT, 10 in the extended core and 20 in the
comprehensive network for both PO2 and PO3).
(5) Horizontal transhipment facilities will be offered in addition to the present list of
terminals. This technology will be primarily interesting for new terminal locations in
areas with low terminal density or for company terminals. They require different
facilities, additional space and partly special pocket wagons. Costs are substantially
higher compared with vertical transhipment so that the market share will be relatively
moderate. The market volume is estimated at about 15 % of existing terminals (= 30
terminals) in 2040. It is shared 50:50 by CargoBeamer (35 Mln. € per hub) and Modalohr
(30 Mln. € per hub, incl. access/egress, parking).
(6) Avoidance of shunting within terminals does not require costly facilities, contrasting
the avoidance of shunting on route. Rail freight transport without shunting on route
(change of wagons) requires a transhipment from rail to rail which is possible at large
hubs and mega-hubs. It has been assumed that mega-hubs are designed from scratch for
this option. The additional costs for upgrading large hubs which operate at least 3 tracks
are estimated 25 Mln. € per terminal (road, moving platforms, area for storage). This can
reduce the number of marshalling yards, nevertheless a minimum number of marshalling
yards is still necessary in a conventional rail freight logistics system if single wagon
transport will be performed in the future.
The following table summarizes the estimated unit costs.
Table 9: Unit costs for terminal requirements

128
Cost type Unit (current €) Additional Costs
(a) Additional costs for vertical transshipment
Mega-hubs Mln. € per mega-hub 100
Vertical transshipment technology in terminals Mln. € per terminal 15
Rail-to-rail transshipment (change of LUs at medium
and large terminal) Mln. € per terminal 25
(b) Additional costs for horizontal transshipment technology
CargoBeamer terminals with equipment, rolling stock Mln. € per terminal 35
Modalohr terminals with equipment, rolling stock Mln. € per terminal 30
(c) Cost of extension of tracks to 740 m length
Core network terminals Mln. € per terminal 15
Comprehensive network terminals Mln. € per terminal 20
Source: M-Five
Under these assumptions, the following cumulative investments at EU27 level have been
calculated for PO2 in the period 2025-2050.
Table 10: Cumulative costs for terminal requirements in PO2 (2025-2050)
Cost type Investment on core
network [Bln.
€2015]
Investment non-
core network [Bln.
€2015]
Total investment
[Bln. €2015] (a) Vertical transshipment
Add. cost mega-hubs - 2.02 2.02 Add. cost vertical transshipment 0.42 1.54 1.96
Add. cost rail-to-rail transshipment 1.94 1.79 3.73
(b) Horizontal transshipment 0.00 0.99 0.99
(c) 740 m length 1.18 2.02 3.21
Sum total 3.55 8.36 11.91
Source: M-Five
The additional costs for vertical transhipment at mega-hubs are on average 100 Mln
€current per mega-hub. It has been assumed that 20 mega-hubs meet all requirements
resulting in an investment of 2.02 Bln. €2015 (comprehensive network). As 25% of
terminals will not be equipped for operating all types of LUs in 2030, the additional costs
at terminals on the core network for vertical transhipment technology are 0.42 Bln. €2015.
Upgrading costs of 15 Mln. €current per terminal for 28 terminals on the core network have
been assumed. All 101 terminals of the comprehensive network will need upgrades for
operating all types of LUs (15 Mln. €current per terminal) resulting in an additional
investment of 1.54 Bln. €2015. Costs for rail-to-rail transhipment (change of LUs at
terminal) are calculated for medium and large terminals only. For medium and large
terminals (145 in total) core and comprehensive network investments will add up to 3.73
Bln. €2015 assuming unit costs per terminal of 25 Mln. €current (track, crane, road, area). On
top are the additional costs for horizontal transhipment technology. Fifteen additional
CargoBeamer terminals (with equipment, rolling stock) and unit costs of 35 Mln €current
have been assumed, as well as 15 additional Modalohr terminals at 30 Mln. €current per
terminal. These sum up to 0.99 Bln. €2015. Estimating the costs of extension of tracks to
740 m length, we assume that 78 terminals on the core network as well as all terminals
on the non-core network need to be upgraded (track length, crane, areas) at an average
cost of 15 Mln. €current per terminal. This results in investments of 1.18 Bln. €2015 (core)
plus 2.02 Bln. €2015 (non-core).

129
For the overall measure, we estimate total investments for EU27 of 11.9 Bln. €2015 (PO2),
which are linearly phased-in between 2025 and 2050. Due to a small number of
additional terminals in PO3, EU27 investments in PO3 are estimated at 12.3 Bln. €2015
from 2025 to 2040. In ASTRA, investments are attributed to the investment type
Terminal and allocated to the sectors Industrial Machines, Computers, Electronics,
Construction, and Other market services. Based on the impact assessment support study,
a share of 20% comes from EU funding. The rest is financed by national public funds
(80%).
Policy measure: Maritime / inland ports / terminals: extension of the TEN-T standards
to the last mile connection by rail / IWW
First, the TENtec ports and rail-road-terminals (RRT) based on current Regulation (EU)
1315/2013 are used. The ports and terminals where then aggregated by MS as shown in
the following table.
Table 11: Number of ports and terminals in each MS (PO2)
Ports RRT
Member
State
Number Comprehensive
Network
Core
Network
Number Comprehensive
Network
Core
Network
AT 4 2 2 7 4 3
BE 20 10 10 3 2 1
BG 8 5 3 6 2 4
CY 2 1 1 0 0 0
CZ 9 5 4 10 3 7
DE 103 80 23 41 20 21
DK 26 24 2 6 3 3
EE 8 7 1 1 1 0
EL 25 20 5 6 3 3
ES 38 25 13 27 17 10
FI 17 12 5 2 1 1
FR 43 28 15 18 6 12
HR 11 8 3 1 0 1
HU 8 6 2 5 4 1
IE 5 2 3 0 0 0
IT 45 29 16 27 12 15
LT 1 0 1 3 0 3
LU 1 0 1 1 0 1
LV 3 1 2 0 0 0
MT 4 2 2 0 0 0
NL 64 53 11 3 1 2
PL 5 1 4 19 9 10
PT 13 10 3 5 3 2
RO 18 12 6 7 4 3
SE 26 21 5 8 3 5
SI 1 0 1 2 1 1
SK 2 0 2 4 2 2
Total 510 364 146 212 101 111
Source: M-Five based on Regulation (EU) 1315/2013
It has been assumed that the costs of this measure are connected to the allocation of ports
and terminals to the comprehensive or core network. Extending TEN-T standards to last
mile connection for ports/terminals being part of the comprehensive network is costlier
than for ports/terminals being part of core network. This has been shown by the
assessment of similar projects as described in the following.
The unit costs per port/terminal stem from the Project Database on “The impact of TEN-
T completion on growth, jobs and the environment” (Schade et al., 2018, contract no.
MOVE/B1/2017-184). Fourteen comparable projects where closely examined. Projects
have a broad range of scope. Some works only address smaller upgrades, while others
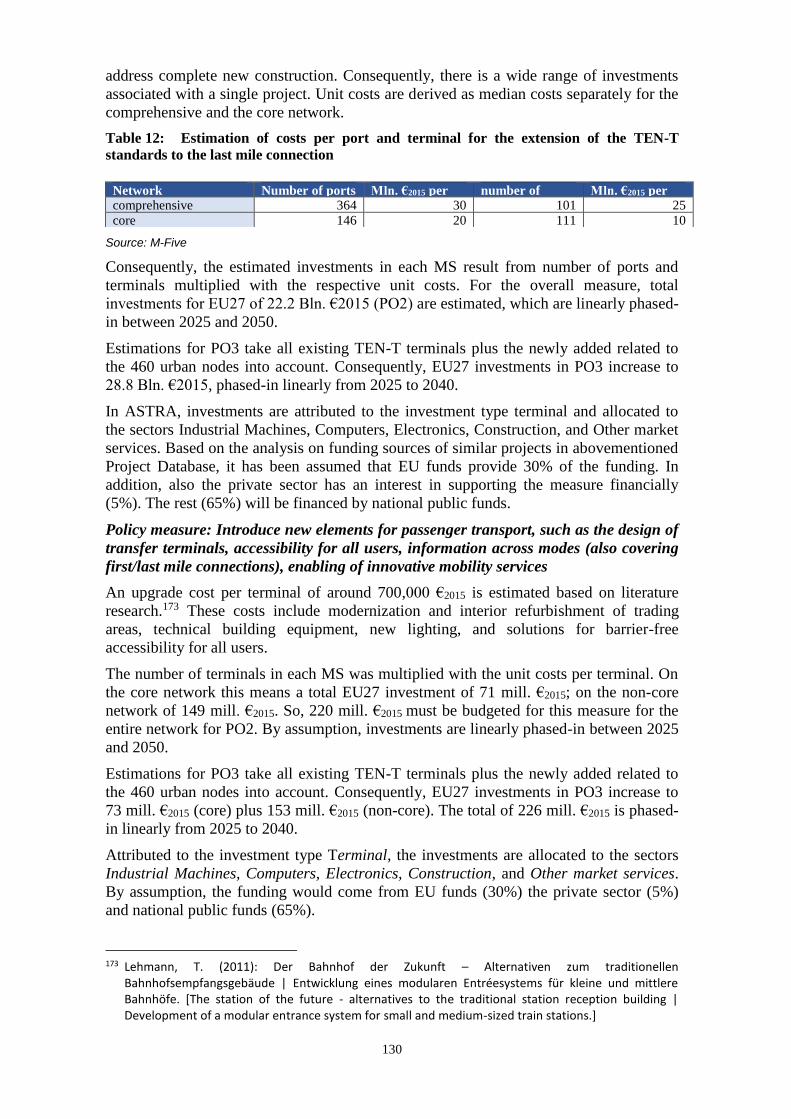
130
address complete new construction. Consequently, there is a wide range of investments
associated with a single project. Unit costs are derived as median costs separately for the
comprehensive and the core network.
Table 12: Estimation of costs per port and terminal for the extension of the TEN-T
standards to the last mile connection
Source: M-Five
Consequently, the estimated investments in each MS result from number of ports and
terminals multiplied with the respective unit costs. For the overall measure, total
investments for EU27 of 22.2 Bln. €2015 (PO2) are estimated, which are linearly phased-
in between 2025 and 2050.
Estimations for PO3 take all existing TEN-T terminals plus the newly added related to
the 460 urban nodes into account. Consequently, EU27 investments in PO3 increase to
28.8 Bln. €2015, phased-in linearly from 2025 to 2040.
In ASTRA, investments are attributed to the investment type terminal and allocated to
the sectors Industrial Machines, Computers, Electronics, Construction, and Other market
services. Based on the analysis on funding sources of similar projects in abovementioned
Project Database, it has been assumed that EU funds provide 30% of the funding. In
addition, also the private sector has an interest in supporting the measure financially
(5%). The rest (65%) will be financed by national public funds.
Policy measure: Introduce new elements for passenger transport, such as the design of
transfer terminals, accessibility for all users, information across modes (also covering
first/last mile connections), enabling of innovative mobility services
An upgrade cost per terminal of around 700,000 €2015 is estimated based on literature
research.173 These costs include modernization and interior refurbishment of trading
areas, technical building equipment, new lighting, and solutions for barrier-free
accessibility for all users.
The number of terminals in each MS was multiplied with the unit costs per terminal. On
the core network this means a total EU27 investment of 71 mill. €2015; on the non-core
network of 149 mill. €2015. So, 220 mill. €2015 must be budgeted for this measure for the
entire network for PO2. By assumption, investments are linearly phased-in between 2025
and 2050.
Estimations for PO3 take all existing TEN-T terminals plus the newly added related to
the 460 urban nodes into account. Consequently, EU27 investments in PO3 increase to
73 mill. €2015 (core) plus 153 mill. €2015 (non-core). The total of 226 mill. €2015 is phased-
in linearly from 2025 to 2040.
Attributed to the investment type Terminal, the investments are allocated to the sectors
Industrial Machines, Computers, Electronics, Construction, and Other market services.
By assumption, the funding would come from EU funds (30%) the private sector (5%)
and national public funds (65%).
173 Lehmann, T. (2011): Der Bahnhof der Zukunft – Alternativen zum traditionellen
Bahnhofsempfangsgebäude | Entwicklung eines modularen Entréesystems für kleine und mittlere Bahnhöfe. [The station of the future - alternatives to the traditional station reception building | Development of a modular entrance system for small and medium-sized train stations.]
Network Number of ports Mln. €2015 per
port
number of
terminals
Mln. €2015 per
terminal comprehensive 364 30 101 25
core 146 20 111 10

131
Policy measure: Development of alternative fuel infrastructure at terminals (not
defined in AFIR)
In order to estimate the costs for alternative fuel infrastructure at terminals, unit costs for
charging stations of 50kW, 150kW and 350kW were calculated first. By assumption,
charging stations of 750 kW are not integrated in terminals and are therefore not taken
into account in the investment estimates. Stakeholder discussions in Germany have
shown that, 750 kW charging stations are only perceived as necessary for long-distance
traffic on the motorways. At terminals they would not be appropriate as they are too
expensive. Further, it is not necessary for trucks to be fully charged at the terminal
because they mostly refer to regional traffic. The cost assumptions are based on
literature.174 For the development of costs per loading terminal, yearly cost reductions
due to economies of scale and learning effects have been assumed, depending on type
and time. The unit cost assumptions are provided in the following table.
Table 13: Costs for charging stations at terminals
Charging
station
Cost per charging
station acquired in
2020 [€2015]
Cost per charging
station acquired in
2030 [€2015]
Cost per charging
station acquired in
2040 [€2015]
Cost per charging
station acquired in
2050 [€2015] 50kW 42,785 38,739 36,843 35,042
150kW 80,917 71,611 64,764 60,369 350kW 227,578 182,062 148,759 131,842
Source: M-Five based on NPM [German National Platform Future of Mobility] (2020)
By assumption, in the initial phase only charging stations of 50kW and 150kW are
possible at the terminals. A mixture of all three types is assumed in the process of
charging stations ramp-up. The ramp-up is calculated depending on the development of
electric HDV stock in each MS. In 2020, no charging stations of 50+ kW are assumed to
exist at terminals. The reason is that there is no need for charging stations of 50+ kW due
to the very low number of heavy BEV trucks. Further, a total of 15 charging stations per
terminal has been assumed. The share of electric charging stations per terminal was
calculated based on the share of electric trucks in the fleet.
Taking the number of terminals in each MS into account, the total EU27 investments are
estimated at 50 Mln. €2015 between 2025 and 2050 for PO2. Estimations for PO3 take all
existing TEN-T terminals plus the newly added related to the 460 urban nodes into
account. Consequently, EU27 investments in PO3 increase to 57 Mln. €2015 from 2025 to
2040. Investments are attributed to the investment type Terminal. Drawing on the impact
assessment support study, 30% of the funding would come from EU funds, 5% from the
private sector and 65% from national public funds.
Policy measure: Digitalisation of passenger and freight terminals
This measure aims to:
- Multimodal freight terminals have the necessary equipment to move freight
between different transport modes and for the positioning and storage of freight.
- Infrastructure components are equipped for the provision of information flows
within this infrastructure and between the transport modes along the logistic
chain, in line with the provisions in Article 31.
174 Nationale Plattform Zukunft der Mobilität [German National Platform Future of Mobility] (2020):
WERKSTATTBERICHT ANTRIEBSWECHSEL NUTZFAHRZEUGE: WEGE ZUR DEKARBONISIERUNG SCHWERER LKW MIT FOKUS DER ELEKTRIFIZIERUNG. ARBEITSGRUPPE 1 KLIMASCHUTZ IM VERKEHR. Available at https://www.plattform-zukunft-mobilitaet.de/wp-content/uploads/2020/12/NPM_AG1_Werkstattbericht_Nfz.pdf

132
- Main technical and administrative barriers to multimodal transport are removed.
From the Project Database on “The impact of TEN-T completion on growth, jobs and the
environment” (Schade et al., 2018, contract no. MOVE/B1/2017-184), the TEN-T project
“DIGITMED-Digital Single Market in the Mediterranean” was identified to be in line
with the prerequisites of Article 31 ICT solutions. The project serves as a basis for
evaluating the costs of optimizing digital terminals. Accordingly, the cost of a terminal is
estimated at 8.86 Mln. €2015.
The estimation of investments is based on a number of uncertainties that are especially
high in the case of digitalisation. These depend on the digital status of the terminals,
location, freight volume, necessary equipment etc. In addition, the measure and the
extent of the digital transformations of a terminal can be interpreted in different ways.
This is accompanied by the fact that the digitisation of terminals has not yet been
implemented to this extent throughout Europe and therefore a cost analysis can only be
made in the light of similar logistics and digitisation projects and not on the basis of real
data. Therefore, the investments can be regarded as an estimate based on the current
knowledge. Costs can vary greatly in individual cases.
Together with the number of terminals in each MS, the total EU27 investments are
estimated at 1,878 Mln. €2015 between 2025 and 2050 for PO2, and at 1,931 Mln. €2015
between 2025 and 2040 for PO3. Investments for digitalisation are allocated across the
sector Electronics and the sector Other market services. Around 30% of investments
would be sourced from EU funds, 10% from EIB loans and 60% from national public
funds. These assumptions were derived from similar projects in the abovementioned
Project Database.
Policy measures: Obligation to ensure motorway standard on core road network AND
Obligation to ensure motorway standard for comprehensive network
To estimate costs for this measure, the lengths of motorways on the core and the
comprehensive network that needs to be upgraded need to be identified. For the total
TEN-T road length of all EU27 MS, information from CEDR reports 2017 and 2019175 is
combined with TRUST data. The TEN-T comprehensive motorway network is 61,894
km long (EU27), of which 27,563 km belong to the non-core network and 34,331 km to
the core network. Based on the estimations explained below, a length of 4,477 km,
accounting for 7.2 % of the comprehensive network needs to be upgraded. The length of
the core network which needs to be upgraded is 2,016 km accounting for 5.9% of the
core network. The length of the non-core network which needs to be upgraded is 2,461
km accounting for 8.9% of the non-core network.
The measure is aimed at improving road safety. Hence, the accident rate in the respective
countries is also taken into account. A database from the European Road Safety
Observatory is used for this purpose.176 Unfortunately, the accident rate/fatality rate is
not available for all countries (BG, CY, CZ, FR, HR, LV, PT, RO) in CDBR. In order to
estimate the safety development on highways for these countries as well, countries with
similar characteristics such as fatality rates/1000km or general accident rates are sought
on the basis of ERSO data.
Based on the impact assessment support study, 5% of motorway length should be
improved in low accident rate countries and 10% of motorway km in high accident rate
175 CEDR (2017): Trans-European Road network, TEN-T (Roads) 2017 Performance Report Available at:
https://www.cedr.eu/docs/view/60632734c6c05-en 176 European Road Safety Observatory (2018): Annual Accident Report 2018:
https://ec.europa.eu/transport/road_safety/sites/roadsafety/files/pdf/statistics/dacota/asr2018.pdf

133
countries. A high accident rate is defined by a fatal accident rate of at least 0.8 (fatal
accidents/vehicle-kilometre per section]. A low accident rate is defined by a fatal
accident rate that is below 0.8 (fatal accidents/vehicle-kilometre per section). These
values are based on the distribution of the data-based accident rates between MS.
In order to be able to estimate the unit costs per km motorway, several projects from the
Project Database of the study on “The impact of TEN-T completion on growth, jobs and
the environment” (Schade et al., 2018, contract no. MOVE/B1/2017-184) were examined
closely. The resulting average price for one kilometre of highway improvement is almost
4 mill. €2015.
With the costs per km and the network length that needs to be upgraded based on
accident rates, the costs for the respective country can be calculated. The total EU27
investments are estimated at 7,998 € mill. €2015 for the core network between 2025 and
2050. Additional EU27 investments to ensure motorway standards for the comprehensive
network are 9,760 mill. €2015 between 2025 and 2040. There is no difference between
PO2 and PO3 as the road network is assumed to be identical. Further, investments are
fully allocated to the sector Construction. Based on similar projects in the Project
Database, the funding sources are assumed to be: EU funds (55%), private sector (5%),
toll revenues (15%) and other national public funds (25%).
Policy measure: Minimum level of safe and secure parkings every 100 km on the core
network with the availability of recharging points for LDV and HDV
A fundamental aim to provide safe and secure parking areas is the prevention of threats
for both drivers and cargo. Considering the rating system for parking facilities, we see
different kinds of users, situations (cargo, locality etc.) and security levels needed. A
European-wide multi-level rating system (from low security to high security) is
introduced in the Study on Safe and Secure Parking Places for Trucks.177 In order to
comply with the measure, it is assumed that the parking site must:
- provide at least some level of technical security,
- offer a comfortable stay for drivers in accordance with Regulation (EC) No.
561/2006 on driving and resting time178,
- offer recharging points for LDV and HDV.
Investments for setting up and maintaining databases of parking facilities as well as
exchanging data is not included in the calculation here. They refer to the European
Commission’s Delegated Regulation (EU) No 885/2013179 that establishes requirements
for data collection related to safe and secure parking places for trucks. Furthermore, the
177 EC (2019): Study on Safe and Secure Parking Places for Trucks. Final Report for the European
Commission Directorate-General for Mobility and Transport. Available at https://ec.europa.eu/transport/sites/default/files/2019-study-on-safe-and-secure-parking-places-for-trucks.pdf
178 Regulation No 561/2006 of the European Parliament and of the Council of 15 March 2006 on the harmonisation of certain social legislation relating to road transport limits long-distance lorry trips in terms of driving and resting time requiring a maximum of 9 daily driving hours, a minimum of 11 hours daily rest, and at least a 45 minutes break after 4.5 hours driving (at the latest). Available at https://eur-lex.europa.eu/legal-content/EN/TXT/?uri=CELEX%3A32006R0561
179 European Commission’s Delegated Regulation (EU) No 885/2013 of 15 May 2013 supplementing ITS Directive 2010/40/EU of the European Parliament and of the Council with regard to the provision of information services for safe and secure parking places for trucks and commercial vehicles. Available at https://eur-lex.europa.eu/legal-content/EN/ALL/?uri=celex%3A32013R0885

134
Directive (2010/40 / EU)180 on the framework for the deployment of ITS in the field of
road transport contains two priority measures that concern the provision of information
and booking services for safe and secure parking spaces for lorries. Hence, information
and booking services are not included in the investments of this specific measure. We
only consider physical infrastructure investments.
The number of parking areas that has to be upgraded is based on literature research. The
minimum demand of parking sites on TEN-T core network is estimated by the
requirement of a maximum distance of 100km in combination with the core network
length. From these, existing spaces with some security (16%) and spaces with certified
level of security (2%) are deducted. By estimation, there are almost 380 parking sites that
have to be upgraded for EU27. Following the abovementioned study it is assumed that
they spread evenly across MS. The split up was carried out based on the network length
in each MS. The lengths of the core road network for all EU27 countries is based on
CEDR reports 2017 and 2019181 in combination with TRUST data.
The number of parking areas to be upgraded in each MS is then multiplied with unit costs
per parking site for the security upgrades and construction work to ensure the availability
of recharging points for trucks.
In order to be able to estimate the unit costs per parking site, a cost analysis was made in
the light of similar existing projects. For this reason, several projects from the Project
Database of the study on “The impact of TEN-T completion on growth, jobs and the
environment” (Schade et al., 2018, contract no. MOVE/B1/2017-184) were examined
closely. The resulting average upgrade costs for one parking site is around 4.5 mill. €2015.
This is the mean value as the individual projects differ greatly in terms of costs from 1.3
mill. €2015 to 10.8 mill. €2015.
A further literature research was carried out to check the average unit costs in terms of
plausibility. Results show that the assumed unit costs correspond well to other studies.
NEA estimated one-time investment costs per guarded site with 100 parking spaces and
150€/m2 at around 5 mill. €.182 Another case study by INEA (2019) calculated almost 3
mill. € of total initial costs.183 The latter includes planning/design, land purchase, adding
safety features to upgrade the parking facility such as camera systems and light towers,
plot preparation and utilities (sewage, wiring, electric cabin), pavement renovation and
new driveway, barriers and gates, the construction of new toilets, shower and washing
rooms, the construction of a control room, a catering facility/snack bar as well as
ensuring the availability of charging stations by means of suitable construction measures.
The security standard corresponds to the level “Silver” of the EU security rating system.
180 Directive 2010/40/EU of the European Parliament and of the Council of 7 July 2010 on the framework
for the deployment of Intelligent Transport Systems in the field of road transport and for interfaces with other modes of transport. Available at https://eur-lex.europa.eu/legal-content/EN/TXT/?uri=CELEX:32010L0040
181 CEDR (2017): Trans-European Road network, TEN-T (Roads) 2017 Performance Report. Available at https://www.cedr.eu/docs/view/60632734c6c05-en and CEDR (2019): Trans-European Road Network, TEN-T (Roads) 2019 Performance Report. Available at https://www.cedr.eu/download/Publications/2020/CEDR-Technical-Report-2020-01-TEN-T-2019-Performance-Report.pdf
182 NEA Transport research and training (2007): Study on the feasibility of organising a network of secured parking areas for road transport operators on the Trans European Road Network. Final Report for the European Commission Directorate-General Energy and Transport. Available at http://temis.documentation.developpement-durable.gouv.fr/docs/Temis/0062/Temis-0062010/17496.pdf
183 INEA (2019): CBA of a Safe and Secure Parking for trucks. CEF | Case Study. Available at https://ec.europa.eu/inea/sites/default/files/cef_case_study_-_safe_and_secure_parking.pdf

135
Following literature (INEA, 2019), the time horizon for the investment assessment is 30
years, whereby there is no further upgrade/ replacement modelled.
The total EU27 investments are estimated at 1,689 € mill. €2015 for the core network
between 2025 and 2050 (PO2) or between 2025 and 2040, respectively (PO3). There is
no difference in the size of investment between PO2 and PO3 as the road network is
assumed to be identical. Further, 90% of investments are allocated to the sector
Construction, whereas the rest corresponds to digitalization measures and is allocated to
the sector Electronics and the sector Other market services. This split is based on the
nature and costs of individual components of the upgrades. Based on the funding of
similar projects in the Project Database, 20% of investments would be provided based on
EU funds, 5% by the private sector, 10% based on toll revenues and the rest by other
national public funds.
Policy measure: Rest areas every 60 km for the core and comprehensive network
The number of additional rest areas per MS is based on literature research. The
calculations apply to both PO2 and PO3 as the road network is identical. First, the EU
wide demand of additional rest areas (around 1,670) is based on INEA (2019). The
information on the core and comprehensive network length (CEDR reports 2017 and
2019184 together with TRUST data) is then combined with literature based data on the
percentage shortfall of sites in each MS (NEA, 2007). This results in the number of
additional rest areas required in each MS on core and comprehensive network. The
number of rest areas in each MS is then multiplied with the average unit costs per rest
area.
In order to be able to estimate the unit costs per rest area, a cost analysis was made in the
light of similar existing projects. For this reason, several projects from the Project
Database of the study on “The impact of TEN-T completion on growth, jobs and the
environment” (Schade et al., 2018, contract no. MOVE/B1/2017-184) were examined
closely. The resulting average upgrade costs for one rest area is around 2.6 € mill. €2015.
This corresponds to the mean value of the individual projects. In terms of costs, the
projects do not differ greatly and range from 2.1 mill. €2015 to 3.0 mill. €2015. Further, they
correspond well to other literature such as a case study by the Texas Transportation
Institute (2011) with average unit costs of 2.7 mill. €2015 for the rest areas under
consideration.185
The total EU27 investments are estimated at 2,306 € mill. €2015 for the core and
comprehensive network. These cover the time period from 2025 to 2050 in PO2. In PO3,
investments occur between 2025 and 2040 for the core and between 2025 and 2050 for
the non-core network. They are fully attributed to the sector Construction. Based on the
funding of similar projects in the Project Database, it has been assumed that 20% of
investments would be provided based on EU funds, 5% by the private sector, 10% based
on toll revenues and the rest by other national public funds.
Policy measure for urban nodes on passenger transport: Obligation to develop
multimodal hubs to facilitate first and last mile connections. 1 hub per urban node. In
184 CEDR (2017): Trans-European Road network, TEN-T (Roads) 2017 Performance Report Available at:
https://www.cedr.eu/docs/view/60632734c6c05-en and CEDR (2019): Trans-European Road Network, TEN-T (Roads) 2019 Performance Report. Available at https://www.cedr.eu/download/Publications/2020/CEDR-Technical-Report-2020-01-TEN-T-2019-Performance-Report.pdf
185 Texas Transportation Institute (2011): Benefits of Public Roadside Safety Rest Areas in Texas. Technical Report. Available at https://static.tti.tamu.edu/tti.tamu.edu/documents/0-6267-2.pdf

136
addition, for cities larger than 500,000 inhabitants, one additional hub per 500,000
inhabitants.
To calculate the number of hubs, it is assumed that every urban node gets one
multimodal hub for first and last mile connections. If the node has more than 500,000
inhabitants one additional hub for every 500,000 inhabitants was considered. A total of
156 hubs (PO2), respectively 538 hubs (PO3), are required in the EU27.
In order to determine the necessary investments, assumptions were made about the
offerings at the hubs. As hubs connect different modes, it is assumed that a site has rail
and road access. Furthermore, facilities for bike sharing, car sharing, e-mobility and
private bicycles are assumed. For bike sharing this includes 50 bike-sharing bicycle, 10
bike-sharing cargo-bicycle and 10 bike-sharing electronic-bicycle. For private bicycles,
100 parking racks, 50 bicycle boxes and a service station are assumed. In addition, 10 car
sharing vehicles are assumed. Such a multimodal hub costs around 470,000 €2015, plus
investments for the fleet of sharing vehicles (assumed at around 320,000 €2015).186
Considering all 79 urban nodes in the 27 MS, the total EU27 investment is estimated at
123 mill. €2015 in PO2 for 2025-2050. For PO3, total investment at EU27-level increases
to 424 mill. €2015 as it refers to all 460 urban nodes. The investment in PO3 is split
between urban nodes on the core (2025-2030) and on the rest of the comprehensive
network (2025-2050).
Investments for the hubs themselves are fully allocated to the sector Construction,
whereas the car sharing vehicles are attributed to the sector Vehicles. Based on
literature187, it is assumed that a share of 50% each can be financed by EU funds and by
national public funds.
Policy measure for urban nodes on passenger transport: Ensure availability of
multimodal digital mobility services (including MaaS services), allowing passengers to
access information and book their journeys, including for public transport and active
modes
The estimation of investments necessary for multimodal digital mobility services is done
by consulting the “Impact Assessment Support Study for the revision of the Intelligent
Transport System Directive (2010/40/EU)” (Ref MOVE/B4/SER/2020-230).188
The present analysis distinguishes between upfront costs and (yearly) follow-up costs in
the usage phase. Initial costs cover National Access Points (NAP) as well as Traffic
Management Centre (TMC) installation, upgrade, and integration with RSI. Ongoing
costs include maintenance and data collection. The following table shows the
corresponding cost assumptions.
186 City of Wien (2018): Leitfaden Mobilitätsstationen: Die Umsetzung von Mobilitätsstationen in
Stadtentwicklungsgebieten am Beispiel Zielgebiet Donaufeld, Wien. [Guide to mobility stations: The implementation of mobility stations in urban development areas using the example of Donaufeld, Vienna] Available at
https://www.wien.gv.at/stadtentwicklung/studien/pdf/b008521.pdf 187 https://www.horizont-europa.de/de/Forderquoten-1926.html 188 The present cost assumptions are based on “draft final” estimates referring to the Bundle 1A of Policy
Option 3 in the “Impact Assessment Support Study for the revision of the Intelligent Transport System Directive (2010/40/EU)”. They might be subject to changes in the study concerned.

137
Table 14: Central ITS sub-systems costs
Component unit Costs [€]
Upfront
costs
NAP set up EUR per NAP per km 828
TMC installation EUR per TMC 1,000,000 TMC upgrade EUR per TMC 175,000
TMC integration with RSI EUR per TMC 1,500,000
Ongoing
costs
NAP Type A maintenance EUR per NAP per year 2,000,000
TMC maintenance EUR per TMC per year 100,000 Data collection EUR per NAP per year 600,000
Cost of integrating each provider on the NAP EUR per NAP per year 2,243
Source: Impact Assessment Support Study for the revision of the Intelligent Transport System Directive (2010/40/EU)
The initial investment is phased-in linearly from 2025 to 2030. Starting in 2031, yearly
ongoing costs will be due. By assumption, TMC upgrade is necessary every 5-10 years.
It is assumed one NAP per MS and one TMC for each urban node. Costs for the backend
system are included in NAP and the TMC costs.
Considering all 79 urban nodes in the 27 MS, the total EU27 investment is estimated at
1,818 mill. €2015 in PO2 (over the time period 2025-2050). For PO3, total investment at
EU27-level increases to 3,737 mill. €2015 as it refers to all 460 urban nodes. Investments
for digitalisation are allocated across the sector Electronics and the sector Other market
services. Drawing on the abovementioned Project Database, the following funding
sources have been assumed: EU funds (30%), EIB loans (10%) and national public funds
(60%).
Policy measure for rail freight: Possibility to run trains loaded with P400 units (P400
loading gauge) for rail freight also on the European Transport Corridor (ETC)
comprehensive lines
First, ETC comprehensive sections to be upgraded for P400 in each MS have been
identified by using TENtec shapefiles. At EU27 level the length sums up to 11,227 km
(11% of total network). The length of the network affected in each MS was then
multiplied with unit costs per km. In correspondence with the measure on the core
network, these were taken from the case study on RFC2 Calais-Basel (EC, 2016, for
Move/B2/SER/2013/825).189 Based on the study, the costs were estimated at
approximately 107,215 €2015 per km. Countries which need major upgrades in terms of
network length are France, Italy, Spain and Poland. For Spain and Portugal, half the cost
rate has been assumed, because the Iberian gauge leads to lower conversion costs. Other
than that, the unit costs were used for all identified network sections.
For EU27 the total investment is estimated at 1,204 Mln. €2015 between 2025 and 2040
for PO3. In ASTRA, investments are fully allocated to the sector Construction. The
following source of funding have been assumed: EU funding (10%) and national public
funding (90%).
Policy measure: Introduction of a legally binding deadline for decommissioning
national (class B) systems and making ERTMS the only signalling system used in
Member States by 2040 for core and comprehensive network and thus to advance the
ERTMS standard obligation for the comprehensive network to 2040
189 EC (2016): Measuring and upgrading the clearance gauge of railway lines: Assessment of information
systems and procedures. Final Report with authorships from UIC and SYSTRA. November, 2016 Contract number – MOVE/B2/SER/2013-825. Ref. No. FR01T15B62/DCO/EU/34-16. Brussels. Available at https://ec.europa.eu/transport/sites/transport/files/2017-report-clearance-gauge-railway-lines.zip

138
According to this measure, it is assumed that ERTMS will be installed by 2030 on the
core network and by 2040 on the comprehensive network.
The ERTMS system consists of two main subsystems, namely European Train Control
System (ETCS) and the Global System for Mobile Communication for Railways (GSM-
R). Most studies focus on trackside elements of ECTS, while on-board subsystems of
ECTS and GSM-R mostly are excluded. The ERTMS is characterised by three main
functional levels. Level 1 is the basic level for ERTMS, while Level 2 and Level 3 are
further improvements of the basic level. Level of automation increases while passing
from level 1 to level 3.
The EU MSs adopted different strategies for ERTMS deployment which depends on
technical and economical parameters. The various deployment strategies have different
impacts on signalling unit costs. A “whole network deployment” takes place typically in
countries with a small railway network or with an obsolete signalling system. It requires
higher capital expenditure, whilst marginal cost is reduced as result of economies of
scale. In contrast, “Prioritised deployment” means an ERTMS deployment only in
prioritised sections due to economical and/or technical difficulties to intervene on the
whole network. In particular, high speed lines of TEN-T CNC and interconnection lines
between corridors are considered of higher importance. Furthermore, there are countries
with limited deployment due to scarce interest. In addition, there are different migration
strategies: Dual trackside migration strategy (interoperability with trains equipped with
legacy system), Dual on-board strategy (interoperability with lines equipped with legacy
system) and a Mixed migration strategy. A strategy/ migration path matrix is displayed in
the following figure (EC, 2018)190.
Source: EC (2018; Annex 14, p.11)
Unit costs for trackside ERTMS deployment varies from 60 k€ to 370 k€ per double
track kilometre. The cost range depends on both the deployment strategies and ERTMS
functional levels. Moreover, unit costs for deployment of ERTMS level 2 is significantly
higher than deployment of level 1. For further elaboration we use unit costs from
literature (EC, 2018, Annex 14), by taking the average costs for level 2 implementation
of 0.17 mill. €/km.
The relevant sections of the TEN-T rail comprehensive network have been further
identified. For this analysis, the TENtec railway network for PO3 is used to include new
additions to the comprehensive rail freight network. In order to calculate the deployment
costs, the affected network lengths has been multiplied with the unit costs. At EU27-
level, the network length is 53,127 km (52% of total network).
The total EU27 investments are estimated at 9,032 € mill. €2015 between 2025 and 2040.
As in Schade et al. (2018), investments for ERTMS are allocated to the sectors
190 EC (2018): Case study on ERTMS. Assessment of unit costs of rail projects (CAPital Expenditure). Annex
14. Available at https://ec.europa.eu/regional_policy/en/information/publications/reports/2018/assessment-of-unit-costs-standard-prices-of-rail-projects-capital-expenditure

139
Electronics, Computers, Construction, and Vehicles. Following the Project Database, the
costs are assumed to be funded by EU funds (85%) and by national public funds (15%).
Policy measure RFC alignment: Integration of critical RFC sections outside the TEN-
T in the comprehensive network
A cost analysis was made in the light of similar TEN-T projects. The Project Database of
the study on “The impact of TEN-T completion on growth, jobs and the environment”
(Schade et al., 2018, contract no. MOVE/B1/2017-184) was taken as the data basis to
calculate unit costs per km. Several projects were closely examined that integrate rail
sections outside the TEN-T into the network and thereby raising the line characteristics to
meet TEN-T standards. Average costs of 1.8 mill. €2015 per km were calculated. This
cost rate can be applied to all MS. Unit costs are multiplied with the length of additions
to the comprehensive rail freight network per MS based on TENtec data for PO3. The
length at EU27-level is 5,578 km (accounting for 5% of the comprehensive network).
The total EU27 investments are estimated at 10,268 € mill. €2015 between 2025 and
2040 in PO3. They are fully allocated to the sector Construction.
4. Additional results for the assessment of the policy options
Investment needs by PO and type of policy measure
The average annual investments for each PO, by type of policy measure, are provided in
Table 13. Detailed assumptions for calculating the investment needs by type of measure
are provided in Annex 4 (section 3). With regard to the level of investments, two
measures stand out in particular: the introduction of a minimum passenger line speed of
160 km/h for the passenger core network (34% of the additional investment costs in PO2
and 31% in PO3) and the extension of certain standards from the core to the
comprehensive network (22.5 t axle load, 100 km/h line speed for freight and 740m
trains) which represent around 50% of the additional investment costs in PO2 and 47% in
PO3. Together, these two measures account for almost 84% of the total additional
investments estimated for PO2 and 78% for PO3.
Table 15: Average annual investments for 2025-2050 per policy option and by type of
policy measure in the EU27 [Mln. €2015], expressed as difference to the baseline
Policy Measure PO1 PO2 PO3
Rail freight: possibility to run trains loaded with P400 units for rail
freight on the core network 0 137 137
Introduction of a minimum passenger line speed of 160 km/h for the
passenger core network 0 5,165 5,165
Extension of certain standards from the core to the comprehensive
network: 22,5 t axle load, 100 km/h line speed for freight and the
possibility of running trains with a length of 740 m
0 7,515 7,688
Requirements for terminals (with exemption system for specialised
terminals and terminals in spatially constrained locations):
0 458 471 - all types of intermodal loading units can be handled
- 740m long tracks exist under the crane
- no shunting required (includes electrification)
Maritime / inland ports / terminals: extension of the TEN-T standards to
the last mile connection by rail / IWW 0 855 1,106
Introduce new elements for passenger transport, such as the design of
transfer terminals, accessibility for all users, information across modes
(also covering first/last mile connections), enabling of innovative
mobility services
0 8 9

140
Policy Measure PO1 PO2 PO3
Development of alternative fuel infrastructure at terminals (not defined
in AFIR) 0 2 2
Digitalisation of passenger and freight terminals 0 72 74
Obligation to ensure motorway standard on core road network (with
exemption clause based on traffic intensity). 0 308 308
Obligation to ensure motorway standard for comprehensive network
(with exemption clause based on traffic intensity) 0 375 375
Minimum level of safe and secure parkings every 100 km on the core
network with the availability of recharging points for LDV and HDV 0 65 65
Rest areas every 60 km for the core and comprehensive network 0 89 89
For 79 urban nodes on passenger transport under PO2 and 460 urban
nodes under PO3: Obligation to develop multimodal passenger hub per
urban node. In addition, for cities larger than 500.000 inhabitants, one
additional hub per 500.000 inhabitants.
0 4 14
For urban nodes on passenger transport: Ensure availability of
multimodal digital mobility services, including MaaS services 0 70 144
Rail freight: possibility to run trains loaded with P400 units for rail
freight also on the European Transport Corridor (ETC) comprehensive
lines
0 0 46
Introduction of a legally binding deadline for decommissioning national
(class B) systems and making ERTMS the only signalling system used
in Member States by 2040 for core and comprehensive network
0 0 347
Update of the TEN-T maps: RFC alignment: Integration of critical RFC
sections outside the TEN-T network in the comprehensive network 0 0 395
EU27 total 0 15,123 16,436
Source: M-Five
Investment needs by Member State
Based on the assumptions in section 3 above the investments needs for each PO, by EU
Member State, are provided in Table 14. The average annual investment needs at EU27
level for the period 2025-2050 amount to 15,123 Mln. EUR in PO2 and to 16,436 Mln.
EUR in PO3 which in both cases accounts for 0.1% of the annual EU27 GDP (see table
14 below). However, looking at individual Member States differences can be seen
between EU13 and EU14 countries. The relatively higher investment needs in terms of
achieving the infrastructure requirements of the TEN-T in EU13 countries paired with a
relatively lower GDP in this region leads to annual investment needs of up to 1% of GDP
in those Member States. This is for example the case for Bulgaria, Estonia, Croatia,
Hungary, Lithuania and Latvia. Other countries have (on average) a stronger economic
performance (GDP), so that (although they have higher levels of investments needs),
their Investment/GDP share is lower. Still others have a lower GDP relative to EU
average but also require very little investments due to their small TEN-T infrastructure
network (Malta, Cyprus etc.). The differences in annual investment needs per Member
State and their investment/GDP ratio between the POs are marginal although investments
needs are slightly higher in PO3.
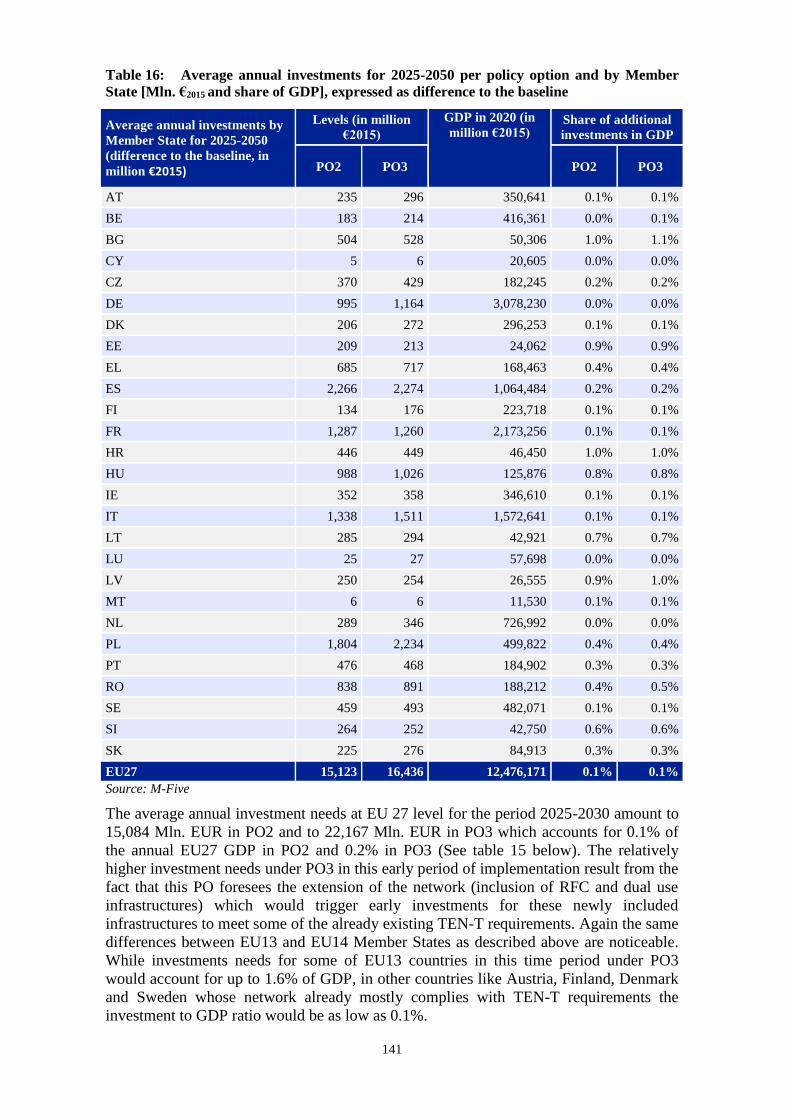
141
Table 16: Average annual investments for 2025-2050 per policy option and by Member
State [Mln. €2015 and share of GDP], expressed as difference to the baseline
Average annual investments by
Member State for 2025-2050
(difference to the baseline, in
million €2015)
Levels (in million
€2015)
GDP in 2020 (in
million €2015) Share of additional
investments in GDP
PO2 PO3 PO2 PO3
AT 235 296 350,641 0.1% 0.1%
BE 183 214 416,361 0.0% 0.1%
BG 504 528 50,306 1.0% 1.1%
CY 5 6 20,605 0.0% 0.0%
CZ 370 429 182,245 0.2% 0.2%
DE 995 1,164 3,078,230 0.0% 0.0%
DK 206 272 296,253 0.1% 0.1%
EE 209 213 24,062 0.9% 0.9%
EL 685 717 168,463 0.4% 0.4%
ES 2,266 2,274 1,064,484 0.2% 0.2%
FI 134 176 223,718 0.1% 0.1%
FR 1,287 1,260 2,173,256 0.1% 0.1%
HR 446 449 46,450 1.0% 1.0%
HU 988 1,026 125,876 0.8% 0.8%
IE 352 358 346,610 0.1% 0.1%
IT 1,338 1,511 1,572,641 0.1% 0.1%
LT 285 294 42,921 0.7% 0.7%
LU 25 27 57,698 0.0% 0.0%
LV 250 254 26,555 0.9% 1.0%
MT 6 6 11,530 0.1% 0.1%
NL 289 346 726,992 0.0% 0.0%
PL 1,804 2,234 499,822 0.4% 0.4%
PT 476 468 184,902 0.3% 0.3%
RO 838 891 188,212 0.4% 0.5%
SE 459 493 482,071 0.1% 0.1%
SI 264 252 42,750 0.6% 0.6%
SK 225 276 84,913 0.3% 0.3%
EU27 15,123 16,436 12,476,171 0.1% 0.1%
Source: M-Five
The average annual investment needs at EU 27 level for the period 2025-2030 amount to
15,084 Mln. EUR in PO2 and to 22,167 Mln. EUR in PO3 which accounts for 0.1% of
the annual EU27 GDP in PO2 and 0.2% in PO3 (See table 15 below). The relatively
higher investment needs under PO3 in this early period of implementation result from the
fact that this PO foresees the extension of the network (inclusion of RFC and dual use
infrastructures) which would trigger early investments for these newly included
infrastructures to meet some of the already existing TEN-T requirements. Again the same
differences between EU13 and EU14 Member States as described above are noticeable.
While investments needs for some of EU13 countries in this time period under PO3
would account for up to 1.6% of GDP, in other countries like Austria, Finland, Denmark
and Sweden whose network already mostly complies with TEN-T requirements the
investment to GDP ratio would be as low as 0.1%.

142
Table 17: Average annual investments for 2025-2030 per policy option and by Member
State [Mln. €2015 and share of GDP], expressed as difference to the baseline
Average annual investments by
Member State for 2025-2030
(difference to the baseline, in
million €2015)
Levels (in million
€2015)
GDP in 2020 (in
million €2015) Share of additional
investments in GDP
PO2 PO3 PO2 PO3
AT 233 427 350,641 0.1% 0.1%
BE 182 297 416,361 0.0% 0.1%
BG 502 808 50,306 1.0% 1.6%
CY 4 6 20,605 0.0% 0.0%
CZ 368 582 182,245 0.2% 0.3%
DE 995 1,665 3,078,230 0.0% 0.1%
DK 205 387 296,253 0.1% 0.1%
EE 207 289 24,062 0.9% 1.2%
EL 683 931 168,463 0.4% 0.6%
ES 2,266 2,955 1,064,484 0.2% 0.3%
FI 132 262 223,718 0.1% 0.1%
FR 1,287 1,875 2,173,256 0.1% 0.1%
HR 444 562 46,450 1.0% 1.2%
HU 986 1,261 125,876 0.8% 1.0%
IE 350 381 346,610 0.1% 0.1%
IT 1,337 2,101 1,572,641 0.1% 0.1%
LT 283 432 42,921 0.7% 1.0%
LU 24 41 57,698 0.0% 0.1%
LV 248 380 26,555 0.9% 1.4%
MT 4 7 11,530 0.0% 0.1%
NL 287 496 726,992 0.0% 0.1%
PL 1,804 2,908 499,822 0.4% 0.6%
PT 474 637 184,902 0.3% 0.3%
RO 837 1,029 188,212 0.4% 0.5%
SE 457 691 482,071 0.1% 0.1%
SI 262 354 42,750 0.6% 0.8%
SK 223 404 84,913 0.3% 0.5%
EU27 15,084 22,167 12,476,171 0.1% 0.2%
Source: M-Five
The average annual investment needs at EU27 level for the period 2031-2050 amount to
15,134 Mln. EUR in PO2 and to 14,716 Mln. EUR in PO3 which accounts for 0.1% of
the annual EU27 GDP in both POs (See table 16 below). The relatively lower investment
needs under PO3 in this later period of implementation result from the fact that, as
explained above, some investments are anticipated to the period up to 2030 and hence
less investment is needed on those sections to meet TEN-T requirements. Again the same
difference between EU13 and EU14 Member States as described above are noticeable
but are less pronounced. While investment needs for some of EU13 countries in this time
period under PO3 would account for up to 0.9% of GDP in other countries like Germany,
Belgium, Luxemburg and France the investment to GDP ratio would be below 0.1%.

143
Table 18: Average annual investments for 2031-2050 per policy option and by Member
State [Mln. €2015 and share of GDP], expressed as difference to the baseline
Average annual investments by
Member State for 2031-2050
(difference to the baseline, in
million €2015)
Levels (in million
€2015)
GDP in 2020 (in
million €2015) Share of additional
investments in GDP
PO2 PO3 PO2 PO3
AT 235 257 350,641 0.1% 0.1%
BE 184 190 416,361 0.0% 0.0%
BG 505 445 50,306 1.0% 0.9%
CY 6 5 20,605 0.0% 0.0%
CZ 370 383 182,245 0.2% 0.2%
DE 994 1,013 3,078,230 0.0% 0.0%
DK 207 237 296,253 0.1% 0.1%
EE 209 190 24,062 0.9% 0.8%
EL 685 652 168,463 0.4% 0.4%
ES 2,267 2,069 1,064,484 0.2% 0.2%
FI 135 151 223,718 0.1% 0.1%
FR 1,287 1,075 2,173,256 0.1% 0.0%
HR 447 416 46,450 1.0% 0.9%
HU 988 956 125,876 0.8% 0.8%
IE 352 351 346,610 0.1% 0.1%
IT 1,338 1,335 1,572,641 0.1% 0.1%
LT 285 253 42,921 0.7% 0.6%
LU 26 23 57,698 0.0% 0.0%
LV 250 217 26,555 0.9% 0.8%
MT 7 6 11,530 0.1% 0.1%
NL 289 301 726,992 0.0% 0.0%
PL 1,805 2,032 499,822 0.4% 0.4%
PT 476 418 184,902 0.3% 0.2%
RO 839 850 188,212 0.4% 0.5%
SE 459 433 482,071 0.1% 0.1%
SI 264 222 42,750 0.6% 0.5%
SK 225 238 84,913 0.3% 0.3%
EU27 15,134 14,716 12,476,171 0.1% 0.1%
Source: M-Five
CO2 emissions from transport
The CO2 emissions for the entire transport network (excluding P2W and maritime) and
for the TEN-T core and comprehensive network for each PO are provided in the table
below.

144
Table 19: Impacts on CO2 emissions (excluding P2W and maritime) in the policy options
relative to the Baseline
CO2 emissions Baseline (Mt of CO2) PO1 PO2 PO3
2030 2040 2050 2030 2040 2050 2030 2040 2050 2030 2040 2050
Total transport
(excluding P2W
and maritime)
718 272 61 0.0% 0.0% 0.0% -0.1% -0.2% -0.2% -0.1% -0.2% -0.2%
of which
on the TEN-T
core network 130 47 7 0.0% 0.0% 0.0% 0.0% -0.3% -0.3% 0.0% -0.4% -0.4%
on the TEN-T
comprehensive
network
193 68 7 0.0% 0.0% 0.0% 0.0% -0.4% -0.4% 0.5% -0.1% -0.3%
Source: ASTRA and TRUST models
NOx emissions from transport
The NOx emissions for the entire transport network (excluding P2W and maritime) and
for the TEN-T core and comprehensive network for each PO are provided in the table
below.
Table 20: Impacts on NOx emissions (excluding P2W and maritime) in the policy options
relative to the Baseline
NOx emissions Baseline (Mt) PO1 PO2 PO3
2030 2040 2050 2030 2040 2050 2030 2040 2050 2030 2040 2050
Total transport
(excluding P2W
and maritime)
1.9 1.0 0.6 0.0% 0.0% 0.0% 0.0% -0.1% -0.2% 0.0% -0.1% -0.2%
of which
on the TEN-T
core network 0.2 0.1 0.1 0.0% 0.0% 0.0% 0.0% -0.4% -0.3% 0.0% -0.7% -0.4%
on the TEN-T
comprehensive
network
0.3 0.1 0.1 0.0% 0.0% 0.0% 0.0% -0.4% -0.3% 0.5% -0.3% -0.4%
Source: ASTRA and TRUST models
Energy consumption from transport
The modal shift from road to more sustainable modes of transport enabled by the bundle
of measures included in PO2 is projected to result in a slight decrease in energy
consumption from transport relative to the baseline (-0.1% in 2030; -0.2% in 2040 and -
0.1% in 2050). Similar reductions are observed in PO3.
When looking in more detail at the TEN-T network level, in PO2 total energy
consumption from transport on the comprehensive network is projected to decline by
0.2% in 2040 and 0.4% in 2050 relative to the baseline. Main energy savings are coming
from the road sector (-0.5% in 2040 and -1.2% in 2050) while rail energy consumption
would increase relative to the baseline (+1.9% in 2040 and +3.9% in 2050) due to an
increase in railway activity. Energy consumption on the core network is projected to
remain stable relative to the baseline in 2030 and to decrease by 0.1% in 2040 and 0.2%
in 2050 compared with the baseline. Similar to the situation on the comprehensive
network while energy use in road transport is projected to slightly decrease (-0.4% in
2040 and -1.2% in 2050) rail energy consumption is projected to increase (+2.5% in 2040
and +5.3% in 2050).
In PO3 energy consumption from transport on the comprehensive network is projected to
increase by 0.5% in 2030, 0.2% in 2040 and to remain stable by 2050 relative to the
baseline. This increase is only shown because of the extension of the comprehensive
network in PO3 relative to the baseline and the fact that they are not directly comparable,

145
due to the different scope. If the same scope for the network would be maintained, it
would result in a slight decrease relative to the baseline – as shown by the results for the
entire transport network. On the core network, energy use in PO3 is projected to
decrease by 0.2% in 2040 and 0.3% in 2050 relative to the baseline.
Assessment of administrative costs
The assessment of administrative costs has been based on past expenditures (e.g. for
PSAs and European coordinators) as well as on estimations drawing on stakeholders
interviews and literature review. It is assumed that in the first four years after entry into
force of the Regulation i.e. as from 2025 costs would be slightly higher than in the phase
that follows. This assumption is based on the experience from the first 4 years after the
adoption of the TEN-T Regulation in 2013 which required additional corridor
coordination (e.g. stakeholder engagement and guidance).
As it can be seen from Table 19 under PO2 the Commission will have to spend an
additional EUR 1.6 Mln. per year compared to the baseline in the initial phase of 4 years.
After this phase administrative costs can be reduced significantly and would amount to
EUR 536,000 per year up to 2050. This reduction can be achieved in the first instance by
a streamlining of studies, reports and communication activities.
Under PO3 the Commission will have to spend an additional EUR 2.39 Mln. per year
compared to the baseline in the initial phase of 4 years. After this phase administrative
costs can be reduced significantly and would amount to EUR 800,000 per year up to
2050. This reduction can be achieved in the first instance by a streamlining of studies,
reports and communication activities.
Table 21: Additional administrative costs for the European Commission relative to the
baseline (thousand EUR), expressed as yearly averages
Cost type (thousand EUR per
year)
PO2 PO3
Initial phase - 4
years
Rest of the
period
Initial phase - 4
years
Rest of the
period
ETC operation 975 687 1,455 1025
EC studies, meetings 586 -179 875 -267
Additional PSAs 40 28 60 42
Total 1,601 536 2,390 800
Source: IA Support study
Table 20 reports on the additional administrative costs for other public authorities (i.e.
MS administration and SUMP in the table below) and private sector. The main cost types
relate for example to urban mobility planning (implementation of SUMPs), terminal
adjustments (to newly defined KPIs) and sector organisations (e.g.: road, rail,
adjustments to new requirements).
Under PO2 savings for the private sector of EUR 110,000 per year could be achieved
already in the first phase of four years through streamlining the corridor organisation. In
the following phase these savings would amount to EUR 146,000 annually relative to the
baseline (up to 2050). However net additional costs of EUR 1.265 Mln per year have
been estimated for the initial phase for the private sector. In the rest of the period (up to
2050) the net additional costs would be lower, estimated at EUR 224,000 annually. For
other public authorities, the additional costs are estimated at EUR 931,000 per year for
the initial phase of 4 years and at EUR 389,000 per year for the rest of the period.
Under PO3 savings for the private sector of EUR 150,000 per year could be achieved
already in the first phase of four years through streamlining the corridor organisation
(integrating the RFCs and the CNCs into ETCs). In the following phase these savings

146
would amount to EUR 200,000 annually relative to the baseline (up to 2050). However
net additional costs of EUR 1.733 Mln per year have been estimated for the initial phase
for the private sector. In the rest of the period (up to 2050) the net additional costs would
be lower, estimated at EUR 306,000 annually. For other public authorities, the additional
costs are estimated at EUR 1.275 Mln per year for the initial phase of 4 years and at EUR
533,000 per year for the rest of the period.
Table 22: Additional administrative costs for other public authorities and the private
sector relative to the baseline (thousand EUR), expressed as yearly averages
Cost type (thousand EUR per
year)
PO2 PO3
Initial phase - 4
years
Rest of the
period
Initial phase - 4
years
Rest of the
period
PSA own 44 26 60 35
Not PSA covered 131 79 180 108
Network organisation 110 73 150 100
Corridor organisation -110 -146 -150 -200
MS administration 456 183 625 250
SUMP 475 207 650 283
Terminals 219 73 300 100
Sector Cost 871 119 1,193 163
Total 2195 613 3,008 839
of which:
Public authorities
931
390
1,275
533

147
ANNEX 5: LINKS BETWEEN THE CONCLUSIONS OF THE TEN-T
EX-POST EVALUATION AND THE IMPACT ASSESSMENT
The evaluation of the TEN-T Regulation came to a number of key conclusions and
identified a number of shortcomings that shall be addressed with the revision (see table 1
below):
Lack of appropriate basis in terms of infrastructure for the achievement of the
challenging objectives of the transport system as a whole such as multimodality and
sustainability and of the European Green Deal overall.
Current provisions are inappropriate to ensure network-wide continuity of relevant
requirements in the fields of digitalisation, automation and other forms of innovation
which go hand in hand with infrastructure development and are vital enablers of
efficiency enhancements and the massive spreading of zero emission and low carbon
mobility. Step changes in the digital transition, entailing increasing integration of
infrastructure, vehicles and connected services across all modes are not duly reflected
in the TEN-T Regulation.
There are shortcomings in relation to the functioning of urban and transport nodes
such as insufficiencies in network integration, design of transfer hubs, accessibility
conditions for all users, last mile connections, smooth information services and the
complementarity between TEN-T and sustainable urban mobility planning, including
clean and innovative solutions.
Some specific quality requirements for rail, road and inland waterways as well as
requirements for the maritime dimension of TEN-T were found insufficient or
inappropriate. Such problems (for example, inability of terminals to accommodate
740 m long trains) may affect the continuity and sustainability of services, or social
conditions for transport workers (e.g. through a shortage of safe and secure parking
areas for heavy goods vehicles). Such problems also put the preparedness of TEN-T
infrastructure for extreme weather events, security threats or other unforeseen events
at risk.
With regards to the network implementation there remains a challenge to ensure full
alignment of national interests and responsibilities with TEN-T objectives, and in
particular the priorities identified in the corridor work plans, while respecting
subsidiarity. Factors such as complex preparatory procedures, remaining divergences
between agreed European objectives and national infrastructure and investment
planning or limited EU level governance tools compared with the challenges at stake
were identified as causes for delays.
In relation to the coordination between core network corridors and Rail Freight
Corridors the evaluation found that although this has led to efficiency gains, potential
synergies between the two instruments, e.g. to ensure better coherence between the
infrastructural side of the core network corridors and the operational side of the Rail
Freight Corridors, have not been sufficiently exploited. A better alignment of the two
instruments would be beneficial in terms of investment planning, project
identification and governance.

148
Table 1: Main conclusions of the ex-post evaluation and linkages with the IA
Main conclusions of the ex-post evaluation Impact Assessment
Conclusions on relevance
All four specific objectives of the TEN-T Regulation remain
relevant, are equally important and complementary to each
other.
The IA maintains and develops the specific
objectives of the regulation further
For the dual layer, trans-European transport network, the
design structure (in accordance with the existing network
planning methodology) as well as the completion deadlines of
2030 and 2050 have proven their appropriateness.
The IA broadly maintains the network
structure and the completion deadlines
However, for the specific objectives “efficiency of
infrastructure development to facilitate the internal market”
and “social, economic and territorial cohesion”, there is a
strong need to advance on requirements enhancing the quality
of the TEN-T infrastructure.
Policy measures are defined to increase the
quality of the TEN-T and ensure that this
quality is preserved over the lifetime of the
infrastructure. Further measures are
introduced to advance on interoperability and
accessibility of the network.
For the specific objective “sustainability”, the lack of
appropriateness to enable decarbonisation in line with the
objective of the European Green Deal needs to be overcome.
The reduction of transport emissions by 90% by 2050 cannot
be achieved without a proper TEN-T allowing for greener
transport.
Policy measures are defined to enlarge the
scope and reinforce requirements in line with
the needed contribution to the EGD objectives
for all transport modes.
For the specific objective “increasing user benefits”, the TEN-
T Regulation should be advanced to strengthen the
identification, combination and implementation of projects
from the perspective of integrated door-to-door user services.
This current lack of appropriateness seems to be particularly
evident in the passengers’ sector.
In the IA, policy measures are defined to
strengthen the service and user perspective of
the TEN-T especially in relation to passenger
transport.
Complementarity between core and comprehensive networks
could be strengthened to help overcoming remaining
accessibility and connectivity gaps and ensuring the broadest
possible and most effective coverage of new infrastructure
quality parameters.
The IA defines policy measures targeted at an
alignment of standards and requirements
between the two network layers in fields such
as railway infrastructure, alternative fuels or
urban nodes.
Conclusions on effectiveness
The TEN-T Regulation, overall, has been very effective in
identifying thousands of projects on the basis of a single
Europe-wide policy framework.
The framework for identifying projects on the
network will be maintained in the IA.
However there remain problems of delays for a number of
projects caused by complex preparatory procedures,
remaining divergences between agreed European objectives
and national infrastructure and investment planning or limited
EU level governance tools.
The IA defines measures to ensure alignment
of national interests and responsibilities with
TEN-T objectives, while respecting
subsidiarity.191
TEN-T implementation could be further enhanced –
especially in the light of the new challenges and objectives
(decarbonisation, digitalisation and increasing risks of
unforeseen crisis events)
The IA defines measures further strengthening
existing EU instruments (e.g. core network
corridors, work plans, delegated acts).
Furthermore it defines measures targeted at
addressing unforeseen events.
The instrument of the core network corridors, including the
European Coordinators, has found to be both highly relevant
The IA further develops and extends the
corridor concept and strengthens the role of
191 The question of complex and lengthy preparatory procedures is addressed through the future
Directive on streamlining measures for advancing the realisation of the trans-European transport network (TEN-T)

149
Main conclusions of the ex-post evaluation Impact Assessment
and effective. the European Coordinators
Conclusions on efficiency
In relation to the reporting and monitoring obligations set out
in the TEN-T Regulation there is some room for streamlining
and strengthening these tools.
The IA defines measures streamlining
monitoring instruments and facilitating
reporting.
The coordination between Core Network Corridors and Rail
Freight corridors has led to certain efficiency gains but there
is untapped potential in a better alignment between the two
instruments in terms of investment planning and project
identification.
The IA will ensure the geographical alignment
of both corridor instruments into European
Transport Corridors and further strengthen the
coordination aspects between the two
instruments.
Conclusions on coherence and coordination
Achieving the objectives of the European Green Deal would
require that the TEN-T infrastructure is fully aligned with the
provisions resulting from the other policy initiatives in the
fields of AFIR, FuelEU Maritime and the ReFuelEU
Aviation.
The IA ensures full alignment with other
policy initiatives on alternative fuels.
Need to enhance coherence with the challenges of the digital
transition and other new technologies
The IA ensures full alignment with other
policy initiatives on intelligent transport
systems.
Conclusions on EU added value
The added value of TEN-T policy overall has always been
strongly affirmed by Member States, regions, cities and
industrial stakeholders. TEN-T policy also attracts increasing
interest outside the EU, notably in neighbouring States but
also in other regions of the world, for example in relation to
the extension of land transport connections to Asia.
The approach to third and neighbouring
country involvement is maintained.
Ensuring a common and coherent EU-wide basis for the
identification of ‘projects of common interest’ and,
correspondingly, for the alignment of planning and
implementation efforts of a wide range of actors is a clear and
widely recognised and would not have been possible without
Regulation (EU) 1315/2013.
The TEN-T framework for a harmonised
planning and implementation of the network
will be maintained and further developed in
the IA.
Summary of the TEN-T evaluation
The evaluation of the Regulation (EU) N° 1315/2013 on Union Guidelines for the
development of a trans- European transport network has been adopted on 26 May 2021
(SWD(2021)117 final).
This evaluation was carried out almost at mid-term on the way between the last
substantial revision of the Regulation in 2013 and the first key milestone of TEN-T
policy – the completion of the core network in 2030. It assessed to what extent the
implementation efforts so far have led to the expected results and benefits and if
implementation is on the right track towards the 2030 and 2050 milestones. In addition, it
aimed to assess whether its objectives and related standards and requirements are still
relevant and coherent in view of the increased ambitions of the EU’s environmental and
climate change policies.
The overall evaluation of Regulation (EU) 1315/2013 led to the following conclusions in
terms of “lessons learnt”. Those are grouped in accordance with the five evaluation
criteria that have been applied:
Relevance

150
All four specific objectives of the TEN-T Regulation remain relevant. Especially for
the objectives “efficient infrastructure to facilitate the internal market” and
“territorial, economic and social cohesion”, the targets and measures substantiating
these objectives remain also widely relevant. The two objectives “sustainability” and
“increasing benefits for users”, on the other hand, require substantial reinforcement of
underlying targets and measures. It also needs to be underlined that all objectives
remain equally important since there are complementary to each other.
Nevertheless, with regard to the specific objectives “efficiency of infrastructure
development to facilitate the internal market” and “social, economic and territorial
cohesion”, there is a strong need to advance on requirements enhancing the quality of
the TEN-T infrastructure. This is essential to cope with future challenges, also in the
context of sustainability and improved user benefits. Some reinforcement may also be
needed in relation to the accessibility of peripheral, outermost and insular regions.
For the specific objective “sustainability”, the lack of appropriateness to enable
decarbonisation in line with the objective of the European Green Deal, to cope with
the digital transition and with challenges of natural and human-made disasters or
other unforeseen challenges needs to be overcome. This necessitates adjusted targets
and reinforced / extended requirements. The reduction of transport emissions by 90%
by 2050 cannot be achieved without a proper TEN-T network allowing for greener
transport.
For the specific objective “increasing user benefits”, the TEN-T Regulation could be
advanced to strengthen the identification, combination and implementation of
projects from the perspective of integrated door-to-door user services. This current
lack of appropriateness seems to be particularly evident in the passengers’ sector. In
addressing this relevance issue, digitalisation and other new technologies should play
a key role.
For the dual layer trans-European transport network, the design structure (in
accordance with the existing network planning methodology) as well as the
completion deadlines of 2030 and 2050 have proven their appropriateness.
To achieve the full and timely completion targets, notably for the core network, the
evaluation shows the need to reinforce implementation instruments at EU level and to
stimulate a stronger commitment of Member States.
Complementarity between core and comprehensive networks could be strengthened.
This could help overcoming some remaining accessibility and connectivity gaps. Not
least, it is expected to help ensuring the broadest possible and most effective
coverage of new infrastructure quality parameters, especially for zero and low
emission mobility or digitalisation, and it could facilitate a larger reach of innovative
user services. Where necessary, strengthened complementarity between core and
comprehensive networks could also be ensured through an alignment of standards
and requirements in fields such as railway infrastructure, rail safety or urban nodes.
Effectiveness
Effectiveness of TEN-T implementation – especially in the light of the new
challenges and objectives that could be correspondingly extended – could be further
enhanced through a strengthening of EU instruments (e.g. European Coordinators,
delegated acts, accountability of Member States).
Efficiency
The TENtec system works relatively well and is mostly appreciated by stakeholders.
In relation to the reporting and monitoring obligations set out in the TEN-T

151
Regulation more generally, the evaluation suggests that there is some room for
streamlining and strengthening these tools of TEN-T policy.
Coherence
Achieving the objectives of the European Green Deal would require that the TEN-T
infrastructure are fully aligned with the provisions resulting from the other policy
initiatives in the fields of AFIR, FuelEU Maritime and the ReFuelEU Aviation.
In an appropriate way (by taking account of their new qualities in relation to TEN-T
policy), there is a need to enhance coherence with the challenges of the digital
transition and other new technologies. This requires attention to be given to a proper
balance between fixed / long-term infrastructure requirements and fast progressing
developments building strongly on industrial innovation; between infrastructure
development objectives and changing user needs.
There is some need for enhancing the inner coherence between the provisions of the
TEN-T Regulations.
Synergies between trans-European network policies in transport, energy and
digitalisation are important for higher user benefits, efficiency and the strongest
possible contribution to transport decarbonisation.
To conclude: Both the work on core network corridors and the relevant procedures in
Member States show that the planning and decision making process on TEN-T has been
largely suitable to achieve the policy’s objectives, in spite of a need for specific
reinforcements.
When the 2013 revision of the TEN-T Regulation saw a shift from a largely priority
projects’ based approach to a full network approach, this did not disrupt the continuous
transport infrastructure development the EU had embarked on under preceding TEN-T
legislation. Key projects (notably the former priority projects, often in pivotal
geographical positions) remained vital elements of an overall European network. The
additional strong focus on the functional side of the network, through a wide range of
common standards and requirements, reinforced the link between infrastructure and
transport policy objectives as well as service quality. Member States reflect TEN-T
development objectives reasonably well in their transport infrastructure related
procedures. All this suggests that TEN-T policy, between 2013 and 2020, has well paved
its way as the infrastructural enabler for the achievement of transport policy objectives.
However, future challenges of the European transport system overall – with ambitious
climate change objectives, the digital transition or a significantly enhanced focus on user
expectations as embedded in the European Green Deal and more specifically in the Smart
and Sustainable Mobility Strategy – will place increasing demand on TEN-T policy
towards 2030 / 2050. In this regard, focusing only on a recalibration of certain standards
or requirements would not be sufficient to meet the overall objectives of greening,
digitalisation and modal shift; instead, an integrated network approach centred on
interoperability and efficiency increase and addressing all shortcomings and lessons
learnt identified above is needed.
A thorough assessment of the state of implementation of the projects, in particular the
projects located on the core network, which should be completed by 2030, is also needed.
Based on this assessment possible measures to ensure completion of the network on time
and according to the EU standards could be identified.

152
ANNEX 6: OVERVIEW OF SPECIFIC POLICY OBJECTIVES,
MEASURES AND POLICY OPTIONS
Retained policy measure Specific
objective
Policy options
PO1 PO2 PO3
Problem area 1: Insufficient and/or incomplete TEN-T infrastructure standards and lack of
integration of standards for the alternative fuels infrastructure on the TEN-T that does not enable a
higher use of more sustainable forms of transport
1 Rail freight: possibility to run trains loaded with intermodal loading units classified as P400 on standard
pocket wagons (P400 loading gauge)
SO1, SO2
-
- on the TEN-T core network by 2050
- on the core network and on the comprehensive lines
that are part of the European Transport Corridors
(ETC) by 2040
2 Passenger rail: introduction of a minimum passenger line
speed of 160 km/h for the passenger core network
SO1, SO3 -
- by 2050
- by 2040
3 IWW:
Minimum requirements:
- at least 2.50 m navigable channel depth for rivers,
canals, lakes and inland ports and 5.25 m minimum
height under bridges at defined reference water levels
which are exceeded at a defined number of days/year on
statistical average by corridor/river basin and which may
be altered by a delegated act according to Article 172
TFEU;
- Member States assure that locks are operated and
maintained in such a way that waiting times are
minimized.
Additional requirements:
- definition of good navigation status: additional and
specific corridor/river basin requirements for hard and
soft components which are laid down in implementing
decisions, such as:
(a) complementary parameters and target values for
waterways, specific for free flowing stretches;
(b) specifications for related infrastructure, including its
management;
(c) specifications for inland ports;
(d) appropriate mooring places and services for
commercial users
(e) resilience to climate change, natural and man-made
disasters and disruptions
(f) deployment of alternative energy infrastructure to
ensure corridor-wide access to alternative clean fuels
(g) requirements for digital applications and the digital
transformation of the network.
SO1, SO2,
SO5 -
- by 2050
- by 2040
4 Introduction of AFIR references for inland and maritime
ports, airports, roads and urban nodes
SO1, SO2,
SO3, SO4

153
Retained policy measure Specific
objective
Policy options
PO1 PO2 PO3
5 Development of alternative fuel infrastructure at
terminals (not defined in AFIR)
SO1, SO2,
SO3 -
- by 2050
- by 2040
6 Introduction of intermediary deadline of 2040 for:
newly introduced standards on core network
completion of comprehensive sections as part of
European Transport Corridors
ERTMS deployment obligation on comprehensive
network
SO1-6
- -
7 Assurance of consistency of TEN-T with the ‘Do Not
Significant Harm’ principle
SO1, SO2,
S05 -
Problem area 2: Capacity bottlenecks and insufficient network connectivity to all regions that
hamper multimodality
8 Obligation for all urban nodes to establish a SUMP and
to report on urban mobility data (at minimum on GHG
emissions, congestion, accidents/injuries, modal share
and access to mobility services) as to help the
Commission to set up a coherent urban policy, increase
the effectiveness of EU funding and its coherence with
EU goals and commitments, and to support cities to
evaluate the results of their mobility measures.
SO4 -
- for all 79 TEN-T urban nodes listed in the current
Regulation by 2030
- for all listed and newly identified core urban nodes by
2030 and for all newly identified comprehensive urban
nodes by 2040
9 For urban nodes on passenger transport:
Obligation to develop multimodal hubs to facilitate
first and last mile connections. 1 hub per urban
node. In addition, for cities larger than 500.000
inhabitants, one additional hub per 500.000
inhabitants.
Ensure availability of multimodal digital mobility
services (including MaaS services), allowing
passengers to access information and book their
journeys, including for public transport and active
modes.
SO1, SO2,
SO4
-
- for all 79 existing TEN-T urban nodes by 2050
- for all listed and newly identified core urban nodes by
2030 and for all newly identified comprehensive urban
nodes by 2050
10 Introduction of a legally binding deadline for
decommissioning national (class B) systems and making
ERTMS the only signalling system used in Member
States by 2040 for core and comprehensive network and
thus to advance the ERTMS standard obligation for the
comprehensive network to 2040
SO1, SO2,
SO3, SO5
- -
11 Rail freight standards’ extension: application of the
existing infrastructure requirements of the core network
also on the comprehensive network (22,5 t axle load, 100
km/h line speed for freight and the possibility of running
trains with a length of 740 m)
SO1, SO2
-
- for comprehensive network by 2050
- for ETC comprehensive lines by 2040 and for rest of
comprehensive network by 2050

154
Retained policy measure Specific
objective
Policy options
PO1 PO2 PO3
12 Maritime / inland ports / terminals: extension of the
TEN-T standards to the last mile connection by rail /
IWW
SO1, SO2,
SO3 -
- for all TEN-T ports and all terminals as identified in
2013 Regulation by 2050
- for all core ports and all core terminals resulting from
terminal requirement (measure 14) by 2040 and for all
comprehensive ports and comprehensive terminals by
2050
13 Introduce new elements for passenger transport, such as
the design of transfer terminals, accessibility for all
users, information across modes (also covering first/last
mile connections), enabling of innovative mobility
services
SO1, SO3,
SO4
-
- for all terminals as listed in the current Regulation by
2050
- for all existing and newly identified terminals
(measure 14) by 2040
14 Freight terminals:
- at least one multimodal freight terminal serving each
urban node and in proximity of the urban node, meeting
current and projected transport flows, in particular flows
serving urban nodes;
- obligation for MS to propose a refinement of the
current TEN-T terminal list, through 1) conducting a
market & prospective analysis aiming at identifying the
existing terminals serving transport flows on the TEN-T,
in particular the urban nodes as well as the need for new
terminals. MS shall at least examine current transport
flows as well as projected flows, in particular road
traffic; consult relevant stakeholders; assess how to
ensure adequate coverage of terminals to feed urban
nodes; 2) submitting to the Commission the list of new
terminals to be included in the TEN-T as a result
(Commission to update the list via delegated Act);
- requirements for terminals (with exemption system for
specialised terminals and terminals in spatially
constrained locations): all types of intermodal loading
units can be handled; 740m long tracks exist under the
crane; no shunting required (includes electrification)
SO1, SO2,
SO3 -
- for all 79 TEN-T urban nodes listed in the current
Regulation by 2050
- for all listed and newly identified core urban nodes by
2040 and for all newly identified comprehensive urban
nodes by 2050
15 Digitalisation of passenger and freight terminals SO3, SO5 -
- by 2050
- by 2040
16 Introduction of ITS equipment requirements for roads SO3, SO5
Problem area 3: Insufficient safety and reliability of the TEN-T infrastructure
17 Road: SO1, SO3, -

155
Retained policy measure Specific
objective
Policy options
PO1 PO2 PO3
Obligation to ensure motorway standard192 on core
and comprehensive network (with exemption clause
based on traffic intensity (10.000 vehicles/day in
both directions)).
SO5
- for core and comprehensive road network by
2050
- for core network by 2040 and for
comprehensive network by 2050
minimum level of safe and secure parkings every
100 km on the core network with the availability of
recharging points for LDV and HDV
-
- on the core network by 2050
- on the core network by 2040
rest areas every 60 km -
- for the core and comprehensive network by
2050
- for core network by 2040 and for
comprehensive network by 2050
18 Binding deadline for new tunnels >500m on TEN-T
sections to comply with the provisions of Directive
2004/54 (“Tunnel Directive”)
SO1, SO3,
SO5 -
- For new tunnels on core and comprehensive network
by 2050
- For new tunnels on core network by 2040 and for new
tunnels on comprehensive network by 2050
19 Introduction of minimum quality standards for
maintenance and project life cycle standards
SO5 -
20 Foreign Direct Investments: Fully fledged screening of
third country investments on the core and the
comprehensive network by Member States
SO5
-
Problem area 4: Inadequate TEN-T governance instruments and TEN-T network design
21 Update for the transport sections and nodes (ports,
airports, RRT) on the basis of the reference years 2017,
2018, 2019 with the same % thresholds of 2013
methodology
SO6
22 Update of the TEN-T maps – RFC alignment:
Creation of European Transport Corridors
integrating RFC and CNC leading to potentially 10
ETC (Corridors can comprise lines which are part of
the core and comprehensive network)
Integration of RFC sections outside the TEN-T in
the comprehensive network
SO5, SO6
- -
23 Update of the TEN-T maps – urban nodes: SO4, SO6 - -
192 Motorway means a road, specially designed and built for motor traffic, which does not serve
properties bordering on it and which meets the following criteria: (a) it is provided, except at special points or temporarily, with separate carriageways for the two directions of traffic, separated from each other either by a dividing strip not intended for traffic or, exceptionally, by other means; (b) it does not cross at level with any road, railway or tramway track, bicycle or footpath; (c) it is specifically designated as motorway.

156
Retained policy measure Specific
objective
Policy options
PO1 PO2 PO3
Inclusion of all urban nodes above 100.000
inhabitants (if on core network, they become core
urban nodes; if on comprehensive network, they
become comprehensive nodes)
Inclusion of all capitals of NUTS2 regions as urban
nodes (core if on the core network, comprehensive if
on the comprehensive network). However, in the
case a capital is below 100.000 inhabitants and a
larger city of that region is already identified as an
urban node, then that capital should not be included.
24 Update of the TEN-T maps – Military Mobility
alignment:
Most relevant parts of EU military transport network
(road, railways) that are also used for civilian
purposes are integrated into the TEN-T.
SO5, SO6
- -
25 Streamlining of existing reporting and monitoring
instruments:
- Adoption of the Coordinators’ work plans every three
years, with an annual progress report on the state of
implementation of the CNC/MoS/ERTMS.
- Removal of the Report Article 45.5 (e)
- More efficient data input from MS and automatic
exchange with TENtec database
SO6
26 Alignment of national transport and investment plans
with TEN-T / work plan priorities:
- Introduce a clause in the revised Regulation that would
oblige Member States to align the national transport and
investment plans with the TEN-T Regulation, including
particular attention to identified priority sections on each
Corridor. This should also take into consideration
national energy and climate plans as well as national air
pollution control programmes.
- Adoption of implementing decisions (for single
projects/ horizontal priorities and/or for entire corridors)
SO6
-
27 Review role of the Coordinators, in particular with
regard to RFC and cross-border projects:
- extend the mandate of Coordinators regarding their
responsibilities for operational issues (RFC) and to avoid
duplication of certain tasks (e.g. RFC/CNC transport
market studies and investment planning analysis)
- institutionalise the presence of European Coordinators
in cross-border entities
- widen the scope of the mandate for topics related to
urban nodes and cooperation with neighbouring and third
countries
SO6
- -


ANNEX 7: RESILIENCE CASE - POTENTIAL RISK OF FLOODING OF
EU27 TRANSPORT INFRASTRUCTURES
TENtec maps of railways, roads and ports were used and overlayed with a map of
flooding risks to identify TEN-T network sections that are in particular vulnerable to
flooding events. The results provide for a proxy of potential flooding risks of the TEN-T
infrastructure.
For the flood hazard analysis data from the study ‘A new dataset of river flood hazard
maps for Europe and the Mediterranean Basin region’ was used. The data is available
for six different flood return periods, from 1-in-10-years to 1-in-500-years. The maps
depict the areas prone to river flooding events with the considered return period. The
dataset is based on a JRC elaboration. For the calculation the researcher team used the
hydrological model LISFLOOD, and the 2D hydrodynamic model LISFLOOD-FP (see
Dottori et al. 2021).
The JRC data was validated using county specific, official hazard maps. Especially in the
flood probability maps below 1-in-100-year the data has limitations. In these return
periods, on average, two-thirds of the flood prone areas are identified. The model also
overestimates the expansion of floods in the same periods. In comparison with other
large-scale flood models the results however are comparable. For our analysis of flood
hazards to the TEN-T the 1-in-20-year dataset is used to depict the high-risk parts of the
TEN-T. Figure 1 shows the height of the water level that can be expected on average
every 20 years along European rivers. Higher flooding levels of 1 to 5 meters and of
above 5 meters can be expected in particular in Central Europe starting from the
Netherlands, the Northern part of Germany, the valley of the river Po in Northern Italy
and Slovakia, Hungary and Croatia. In some of the red areas the expected water heights
would reach more than 20m above normal water levels.
Source: M-Five presentation, based on JRC hazard maps
Figure 1: Map of 1-in-20-years river flooding risk in Europe showing different flooding levels

159
For the flood hazard analysis the TEN-T shapefiles of the road and the rail network have
been overlaid with the JRC dataset as shown in Figure . It highlights network sections
that cross an area that is potentially affected by a flooding event, which in its severity is
only occurring once per 20 years.
The network analysis does not consider any differentiation between infrastructure which
is on ground level (e.g. a normal road or rail section) and infrastructure that isn’t (e.g. a
bridge crossing a valley, which might be flooded). This means bridges are shown as
affected by flooding, which must not be the case, although it can be argued, that
supporting pillars of bridges based in the flooded valley could themselves be at risk of
scour in case of flooding.
The following maps show which parts of the network are at risk from the 1-in-20 year
flooding event. The first map is for the rail network only (Figure 2). The second map
shows only the road network (Figure 3). About 6% of the TEN-T rail network is at risk
by 1-in-20-year flooding events and about 4% of the TEN-T road network.
Corresponding with the flooding map, 18% of rail core network is affected in Slovakia.
This is the highest percentage for any MS. The second most affected MS is the
Netherlands with 13%. But also 11% of the Austrian, Czech and Slovenian core rail
network are at risk by such a 1-in-20-years flooding event. On the rail comprehensive
network again, Slovakian networks are most at-risk with 17% followed by the same
group as on the core network with between 13% and 10% of their networks at risk. The
group of MS with about one tenth of their rail non-core TEN-T at risk also includes
Luxemburg and Belgium.
Source: M-Five analysis and representation, based on TENtec and JRC hazard maps
Figure 2: Map of at-risk TEN-T rail network
In terms of road networks at risk the Netherlands are affected most with 20% of their
core road network (see Figure ). Slovakia with 18%, Croatia (11%) and Hungary (10%)
also belong to the MS revealing the largest shares of their road core network at risk of a

160
1-in-20-years flooding event. MS with most affected non-core TEN-T road networks
include Netherlands (12%), Croatia (11%) and Austria (10%).
Source: M-Five analysis and representation, based on TENtec and JRC hazard maps
Figure 3: Map of at-risk TEN-T road network
The following tables are presenting the length and shares of the network at risk for the
different Member States.
Table 1 presents the absolute length of networks at risk to flooding differentiated into
core network and that part of the comprehensive network that is not part of the core
network. The longest at-risk parts of networks are located in France (1 842 km of rail
links and 911 km of road links) and Germany (1 370 km of rail and 568 km of road
links). In terms of potentially affected TEN-T road length also Italian roads reveal a high
exposure with 902 km. This ranking can be expected because these belong to the largest
MS and at least Italy and Germany both reveal a substantial area of hot spots with
potentially very high flooding levels.

161
Table 1: Total length of TEN-T network in flood hazard area
MS Rail (in km) Road (in km)
Core Comprehensive (non-
core)
Core Comprehensive (non-
core)
AT 190.9 320.9 108.9 106.2
BE 94.4 154.2 50.2 62.8
BG 130.6 56.8 117.5 32.4
CZ 266.7 169.5 74.3 51.5
DE 709.6 660.9 311.0 257.5
DK 8.2 0.0 3.4 1.0
EE 11.8 4.3 21.3 16.6
EL 100.3 77.0 97.6 45.6
ES 546.0 200.7 147.1 153.4
FI 29.4 128.9 81.6 305.7
FR 1032.9 810.4 382.8 523.2
HR 87.7 111.4 177.6 68.9
HU 167.3 360.4 159.7 191.3
IE 7.0 44.2 7.9 40.0
IT 423.6 406.5 430.3 471.9
LT 16.3 23.8 14.7 51.8
LU 1.2 20.4 0.0 0.0
LV 58.5 11.0 82.4 49.4
NL 174.1 216.2 216.6 246.0
PL 181.8 241.0 277.0 135.4
PT 40.7 58.3 9.2 47.7
RO 364.2 384.2 230.2 164.2
SE 218.0 157.0 131.8 201.5
SI 84.4 25.0 50.1 6.6
SK 197.0 171.1 225.1 102.4
EU27 5142.5 4814.0 3408.3 3333.3
Source: M-Five analysis, based on TENtec and JRC hazard maps
To get a better idea of the dimension of the flood hazard the following Table shows the
percentage of the at-risk-network in comparison to the whole TEN-T network of a
Member State. As can be seen, 4 to 6 % of the network is located in a flood hazard area.
MS with a very high portion of at-risk network parts are Slovakia and the Netherlands.
Overall rail networks are slightly higher at risk in the comprehensive non-core network,
while road is more at risk on the core network.

162
Table 2: Percentage of whole TEN-T network at risk
MS Rail (in percentage) Road (in percentage)
Core Comprehensive (non-
core)
Core Comprehensive (non-
core)
AT 11% 12% 7% 10%
BE 5% 10% 4% 4%
BG 6% 8% 6% 2%
CZ 11% 8% 5% 3%
DE 5% 8% 3% 3%
DK 1% 0% 0% 0%
EE 1% 0% 2% 1%
EL 4% 5% 4% 1%
ES 5% 3% 2% 2%
FI 1% 3% 4% 3%
FR 7% 7% 5% 4%
HR 9% 9% 11% 11%
HU 7% 11% 10% 9%
IE 1% 2% 1% 1%
IT 5% 6% 7% 5%
LT 1% 2% 1% 2%
LU 1% 13% 0% 0%
LV 3% 1% 5% 3%
NL 13% 10% 20% 12%
PL 2% 5% 4% 2%
PT 2% 3% 1% 2%
RO 9% 11% 6% 5%
SE 3% 4% 2% 3%
SI 11% 6% 8% 2%
SK 18% 17% 18% 9%
EU27 5% 6% 5% 4%
Source: M-Five analysis, based on TENtec and JRC hazard maps
Table 3 presents the length of the total TEN-T network at risk by the 1-in-20-years river
flooding event. Overall nearly 10.000 km of rail network are at risk of such event and
6.700 km of road network. The summary confirms the MS having at risk the largest share
of TEN-T by river flooding events. Interestingly the Netherlands have developed both a
National Adaptation Strategy (NAS) and a National Adaptation Plan (NAP), while the
other most affected countries Croatia, Hungary and Slovakia did only elaborate a NAS,
while they have not adopted a NAP.193
193 See: https://climate-adapt.eea.europa.eu/countries-regions/countries

163
Table 3: TEN-T network at risk by MS – rail and road
MS TEN-T Rail network
TEN-T Road network
(in km) (in percent) (in km) (in percent)
AT 511.8 12% 215.1 8%
BE 248.6 7% 113.0 4%
BG 187.4 6% 149.9 4%
CZ 436.1 10% 125.8 4%
DE 1370.5 6% 568.5 3%
DK 8.2 0% 4.4 0%
EE 16.1 1% 37.8 1%
EL 177.3 5% 143.3 2%
ES 746.6 4% 300.5 2%
FI 158.3 2% 387.3 3%
FR 1843.4 7% 906.0 4%
HR 199.1 9% 246.5 11%
HU 527.6 9% 350.9 9%
IE 51.2 2% 47.9 1%
IT 830.1 6% 902.2 6%
LT 40.2 1% 66.5 2%
LU 21.6 6% 0.1 0%
LV 69.4 2% 131.9 4%
NL 390.3 11% 462.6 15%
PL 422.7 3% 412.4 3%
PT 99.0 3% 56.9 2%
RO 748.4 10% 394.4 6%
SE 375.0 3% 333.4 2%
SI 109.5 9% 56.7 6%
SK 368.1 18% 327.5 14%
EU27 9956.5 6% 6741.6 4%
Source: M-Five analysis, based on TENtec and JRC hazard maps
The link based analysis is completed by also looking at the ports as an important node
infrastructure of the TEN-T network. In analogy to the results shown for the rail and road
network, an analysis for the ports in the TEN-T network was carried out by overlaying
the map of TEN-T ports with the flooding risk map (Figure 1). The following map
(Figure 4) presents the at-risk-ports of MS. The share of potentially affected ports is
much larger than for rail and road infrastructure reaching 21% of all TEN-T ports. Of
course, such a result can be expected as naturally apart from some seaports all ports are
connected with a river.

164
Source: M-Five analysis and representation, based on TENtec and JRC hazard maps
Figure 4: Map of at-risk TEN-T ports
The following Table 4 shows the percentage of the at-risk-ports in every MS and the
percentage in comparison to total ports per MS. The analysis shows that on the whole
108 ports are at risk, this is 21% of all ports on the network. On the core network the
share is slightly higher with 23%. The 74 comprehensive at-risk-ports make up 20% of
all comprehensive ports. Germany reveals the highest total number of at-risk-ports of all
MS. Both in the Czech Republic and Luxembourg 100% of the ports are at-risk, which in
the case of Luxemburg can be easily explained by the fact that there exists only one port,
while in case of the Czech Republic ports play a larger role, but all nine TEN-T ports are
at risk by the 1-in-20 years flooding event.
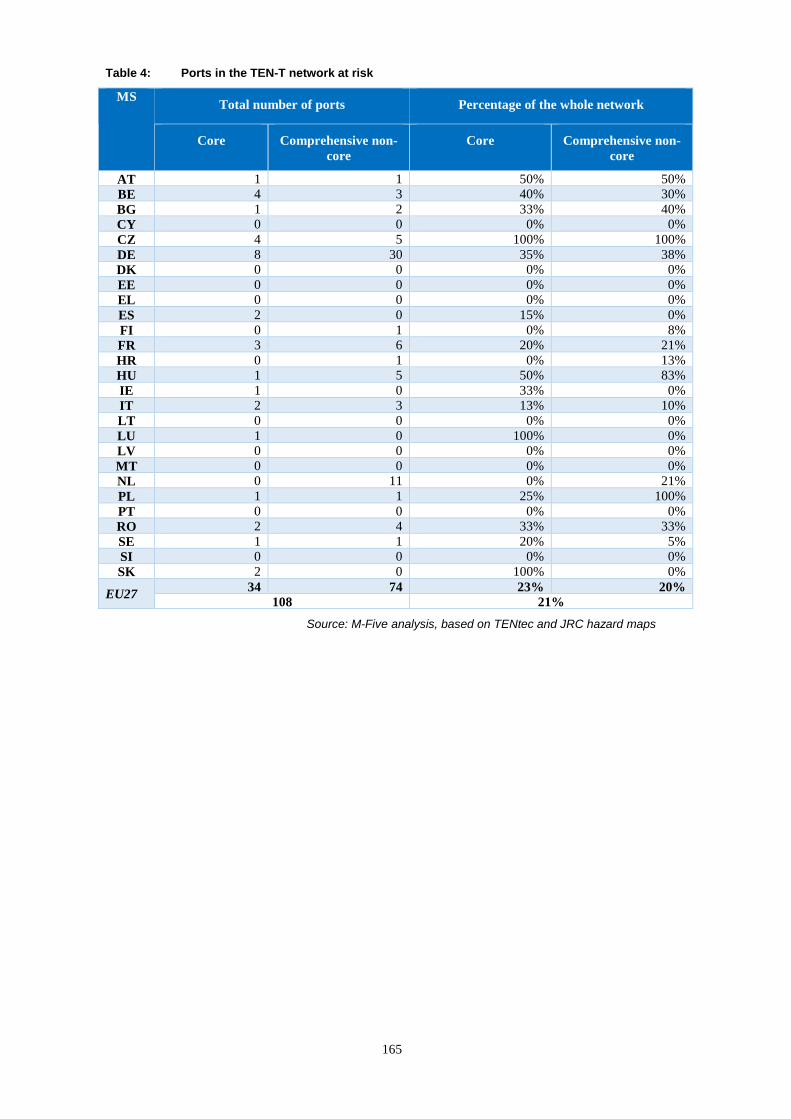
165
Table 4: Ports in the TEN-T network at risk
MS Total number of ports Percentage of the whole network
Core Comprehensive non-
core
Core Comprehensive non-
core
AT 1 1 50% 50%
BE 4 3 40% 30%
BG 1 2 33% 40%
CY 0 0 0% 0%
CZ 4 5 100% 100%
DE 8 30 35% 38%
DK 0 0 0% 0%
EE 0 0 0% 0%
EL 0 0 0% 0%
ES 2 0 15% 0%
FI 0 1 0% 8%
FR 3 6 20% 21%
HR 0 1 0% 13%
HU 1 5 50% 83%
IE 1 0 33% 0%
IT 2 3 13% 10%
LT 0 0 0% 0%
LU 1 0 100% 0%
LV 0 0 0% 0%
MT 0 0 0% 0%
NL 0 11 0% 21%
PL 1 1 25% 100%
PT 0 0 0% 0%
RO 2 4 33% 33%
SE 1 1 20% 5%
SI 0 0 0% 0%
SK 2 0 100% 0%
EU27 34 74 23% 20%
108 21%
Source: M-Five analysis, based on TENtec and JRC hazard maps

166
ANNEX 8: DISCARDED POLICY MEASURES
Introduction of a minimum line speed of 200 km/h or above for the rail passenger core
network
While literature194 shows that HSR can be profitable in the operational phase even if
demand is low, the costs related to its construction are by far the highest among all
transport modes. The construction costs for rail infrastructure tends to grow
exponentially with design speed195. Besides track-side infrastructures, the cost of HS-
rolling stock is higher than conventional railway rolling stock limited to 160 km/h, since
stricter safety regulations apply and the installed power in the power cars increases
exponentially with required speeds196. Other factors which change over-proportionately
with speed increases are related to HSR-operations, namely maintenance cost (due to
higher wear and tear of infrastructure and rolling stock) as well as energy costs197.
The case study on High Speed Rail undertaken in the framework of the evaluation has
shown that while the first HSR lines in Europe connected major centres which provided
high demand-levels, newer lines, tended to connect secondary metropolitan areas with
lower demand potentials. These lower demand levels have led these lines to
underperform, therefore sometimes leading to negative socio-economic outcomes. Since
future improvements in the European rail network will to a great extent encompass
network sections connecting secondary metropolitan regions, it is questionable whether
the expected demand potentials justify the high costs of very high-speed lines.
The case study concludes that from a traveller’s point of view the overall level of service
can be more valuable than travel time gains in the range of minutes. HSR-lines
connecting large and economically vibrant metropolitan areas connected within travel
times below 4 hours have a very high potential of socio-economic success. Rather than
aiming at maximum technically possible speeds, but at attractive journey times in the
margins of the boundary above is a promising strategy for increasing the social balance
between costs and benefits. Speed increases to speeds lower than the normative high-
speed threshold of 250 km/h or 200 km/h can therefore sometimes achieve very similar
levels of benefits at lower cost. Consequently the analysis in the Impact Assessment
focussed on the costs and benefits of introducing a minimum required line speed on core
network railway passenger lines of 160 km/h, which can be considered the lowest end of
the high-speed threshold from an infrastructure point of view but does not exclude
upgrading to higher speeds if circumstances warrant it.
194 Betancor, O. & G, Llobet (2017). Financial and social profitability of HSR in Spain. In: D. Albalate & G.
Bel (eds) Evaluating High-Speed Rail: Interdisciplinary Perspectives. Routledge, London. 195 Wu, J. (2013) The Financial and Economic Assessment of China’s High Speed Rail Investments: a
Preliminary Analysis. Discussion Paper, Inter-national Transport Forum, Paris: Alignments designed for higher speeds result in curves with bigger radiuses and smoother slopes. This
results in more earthworks as well as a higher proportion of tunnels and bridges needed to complete the final alignment. European HSR safety standards (Technical Specification for Interoperability – TSI, first issued in 2002) also require for example separate tunnel tubes for each track above a certain minimum length and do not allow for grade level crossings with road or other rail infrastructures. In urban areas, the need for sound barriers (or other means for reducing noise) is also a relevant cost factor.
196 Trains running at speeds above 160 km/h require cabin signalling systems as well as further track-side safety systems which increase the costs for signalling and communication equipment.
197 A speed increase from 160 km/h to 250 km/h (56 % increase) results in more than doubling of necessary installed power (144 % increase) based on increased aerodynamic resistance.

167
Introducing a comprehensive network for inland waterways
In the framework of the TEN-T evaluation some stakeholders suggested the broadening
of the scope of the TEN-T IWW network to incorporate CEMT class III waterways and
thus introducing a comprehensive network layer for IWW to the TEN-T network. While
indeed this could have benefits in terms of shifting more freight from road to IWW, the
adverse effects on the environment and biodiversity could be substantial in a sector that
is already heavily affected by climate change. Furthermore widening the scope of the
network would only apply to a limited number of Member States and rivers which does
not warrant creating an extra network layer. Consequently such a change would hardly
contribute to the cross-border and cohesion dimension of the network.
In light of the overall objectives of the TEN-T revision the analysis in this impact
assessment rather focussed on the costs and benefits of ensuring a good navigation status
through flexible approach for waterways of the already existing network.
Introduction of more concrete provisions on innovations such as Hyperloop
In the framework of the TEN-T evaluation some stakeholders suggested that the TEN-T
Regulation should incorporate provisions on innovative new transport solutions such as
the Hyperloop198. This was reaffirmed by ten respondents to the OPC on the impact
assessment. The evaluation took a closer look at this technology in the case study on
“TEN-T as an enabler of a future oriented mobility system”. It found that experts in the
field assume that commercial journeys are only likely to happen after 2040199.
Furthermore there are currently no standards on the Hyperloop technology. In addition to
the fact that the technology is not yet mature and requires substantial research, foreseen
under the SHIFT2RAIL initiative and its Horizon Europe follow-up, the concept would
also pose a challenge to the multimodal nature of the TEN-T by introducing new
interoperability barriers between the different modes of transport. Thus this measure was
not further analysed in the impact assessment.
Introducing binding rules and obligations as well as standards on infrastructure
maintenance
In the framework of the TEN-T evaluation (OPC, targeted surveys, Case studies) several
stakeholders suggested that the TEN-T Regulation should set binding rules and
obligations to ensure maintenance of its TEN-T infrastructure. Maintenance of
infrastructure is clearly a Member States and not an EU competence. Any form of direct
EU interference would thus be a breach of the subsidiarity principle. Furthermore, the
Commission does not have the necessary resources to enforce and monitor the
maintenance of the network on its own.
Additionally there are currently no EU-wide accepted and applied standards on
maintenance that could be referred to in the TEN-T Regulation. Eurocodes that were
suggested in the evaluation are technical specifications and not standards. As such, they
are not compulsory. While the majority of Member States have amended their national
legislation to make all or part of the Eurocodes compulsory, this is not the case
throughout the EU. As a consequence this measure was not further analysed in the impact
198 The Hyperloop concept, is embedded in airspace technology and uses especially built infrastructure,
deviating from existing high-speed rail design by eliminating the rails, enclosing the passenger pod in a vacuum tube and suspending it on air bearings. Application of this novel service is foreseen for both passengers and freight transport and several companies pursue real-life testing in the very near future.
199 https://ec.europa.eu/info/research-and-innovation/strategy/support-policy-making/support-eu-research-and-innovation-policy-making/foresight/activities/current/bohemia_en

168
assessment and the analysis rather focussed on the introduction of minimum
infrastructure quality standards and the application of the project-life cycle approach.
Inclusion of a (long-distance) cycling network into TEN-T
In the framework of the TEN-T evaluation (OPC, targeted surveys, Case studies) several
stakeholders suggested the inclusion of a pan-European cycling network into the TEN-T.
The main purpose of the TEN-T network is the facilitation of mainly long-distance
passenger and goods transport flows across Europe with a special focus on seamless
cross-border connectivity. While cycling indeed is gaining importance as a mode of
transport for passengers and freight this is mainly the case for trips in an urban
environment and on shorter inter-urban distances. While EUROVELO routes serve the
objective of enhanced multimodality and shifting activity to more sustainable transport
modes to some extent, long-distance cycling is mainly done for touristic purposes. Thus
it was considered that the inclusion of a large trans-European cycling network would be
out of scope of TEN-T policy. However, cycling (infrastructure) will remain a focus of
the TEN-T Regulation. Recital 9 of the current Regulation already states that:
“Where possible, synergies with other policies should be exploited, for instance with
tourism aspects by including, within civil engineering structures such as bridges or
tunnels, bicycle infrastructure for long-distance cycling paths like the EuroVelo routes.”
This in principle already offers some possibilities to include cycling infrastructure in the
scope of certain types of TEN-T projects and has been done in past projects but shall be
further clarified. Furthermore by strengthening the ties between TEN-T and urban policy
and by integrating multimodal passenger hubs cycling will benefit as well.

169
ANNEX 9: TEN-T KEY PERFORMANCE INDICATORS
Mode TEN-T Compliance Indicators Corresponding TENtec parameter
Railways
(1) Electrification Traction
(2) Track gauge Track gauge (mm)
(3) Line speed (freight trains) Max. operating speed for freight trains (km/h)
(4) Axle load (freight trains) Max. axle load (tonnes)
(5) Train length (freight trains) Max. train length (m)
(6) Intermodal gauge Combined transport profile for semi-trailers
(7) Structure gauge Structure gauge (EN 15273)
(8) ETCS status ETCS status
(9) ETCS baseline ETCS baseline
(10) ETCS level ETCS level
(11) GSM-R status GSM-R status
Inland
Waterways
(12) ECMT class CEMT class
(13) Draught Maximum draught of vessel/convoy
(14) Height Minimum bridge clearance
(15) RIS River Information Services
Roads (16) Express road/motorway Type
Airports (17) Connection to rail Connection with rail
Ports
(18) Connection to rail Connection with rail
(19) ECMT class IV waterway connection Waterway connection (CEMT Class)
(20) Facilities for ship generated waste Waste reception facilities
(21) Alternative Fuels Alternative Fuels