R to R Oil, Gas and Coal Technologies for the Energy Markets of the Future
272
R to R Oil, Gas and Coal Technologies for the Energy Markets of the Future esources eserves 2O13 Please note that this PDF is subject to specific restrictions that limit its use and distribution. The terms and conditions are available online at http://www.iea.org/ termsandconditionsuseandcopyright/
Transcript of R to R Oil, Gas and Coal Technologies for the Energy Markets of the Future

RtoR
Oil, Gas and Coal Technologies for the Energy Markets
of the Future
esources eserves
2O13
Please note that this PDF is subject to specific restrictions that limit its use and distribution. The terms and conditions are available online at http://www.iea.org/termsandconditionsuseandcopyright/
Resourcesto
ReservesOil, Gas and Coal Technologies
for the Energy Markets of the Future
The availability of oil and gas for future generations continues to provoke international debate. In 2005, the first edition of Resources to Reserves found that the known hydrocarbon resources were sufficient to sustain likely growth for the foreseeable future. Yet the book also predicted that developing oil and gas resources – and bringing them to market – would become more technically demanding.
Resources to Reserves 2013 – a comprehensive update to the 2005 edition – confirms these earlier findings and investigates whether oil and gas resources can be produced at a reasonable cost and in a timely manner, while also protecting environmentally sensitive areas. Released amid a boom in shale gas and oil development in North America that is transforming the global energy landscape, the book surveys the cutting-edge technologies needed to find, produce and bring these reserves to the market, and it reviews the challenges on greenhouse gas emissions associated with fossil fuel production. With renewed interest in coal as a potential source of liquid and gaseous fuels, it also looks at technology advances for this fossil fuel.
(61 2013 04 1 P1) ISBN 978-92-64-08354-7 €100
RtoR
Oil, Gas and Coal Technologiesfor the EnergyMarkets
of the Future
esourceseserves
2O13
INTERNATIONAL ENERGY AGENCY
The International Energy Agency (IEA), an autonomous agency, was established in November 1974.Its primary mandate was – and is – two-fold: to promote energy security amongst its membercountries through collective response to physical disruptions in oil supply, and provide authoritativeresearch and analysis on ways to ensure reliable, affordable and clean energy for its 28 membercountries and beyond. The IEA carries out a comprehensive programmeof energy co-operation amongitsmember countries, each ofwhich is obliged to hold oil stocks equivalent to 90 days of its net imports.The Agency’s aims include the following objectives:
! Secure member countries’ access to reliable and ample supplies of all forms of energy; in particular,through maintaining effective emergency response capabilities in case of oil supply disruptions.
! Promote sustainable energy policies that spur economic growth and environmental protectionin a global context – particularly in terms of reducing greenhouse-gas emissions that contributeto climate change.
! Improve transparency of international markets through collection and analysis ofenergy data.
! Support global collaboration on energy technology to secure future energy suppliesand mitigate their environmental impact, including through improved energy
efficiency and development and deployment of low-carbon technologies.
! Find solutions to global energy challenges through engagement anddialogue with non-member countries, industry, international
organisations and other stakeholders.IEA member countries:
AustraliaAustria
BelgiumCanada
Czech RepublicDenmark
FinlandFrance
GermanyGreece
HungaryIrelandItalyJapanKorea (Republic of)LuxembourgNetherlandsNew ZealandNorwayPolandPortugalSlovak RepublicSpainSwedenSwitzerlandTurkeyUnited KingdomUnited States
The European Commissionalso participates inthe work of the IEA.
Please note that this publicationis subject to specific restrictionsthat limit its use and distribution.
The terms and conditions are available online athttp://www.iea.org/termsandconditionsuseandcopyright/
© OECD/IEA, 2013International Energy Agency
9 rue de la Fédération75739 Paris Cedex 15, France
www.iea.org

FOREWORD 3
FOREWORD
Theworld’s largest economies, andmany of its smaller ones, remain heavily dependent on continuedaccess to fossil fuels. Around 45%more oil, gas and coal is used today than 20 years ago, and todaymore than 80% of the world’s primary energy supply comes from fossil fuels. Going forward, IEAprojections show that growth in energy demand will continue to be met overwhelmingly by fossilfuels.
Concern about climate change has led to a noticeable and welcome increase in low-carbonalternatives. Nevertheless, even if the world were to commit itself to a low-carbon energy futuretomorrow, our energy systemwould still require the use of large quantities of fossil fuels for decades.Heavy industry and transport are dependent on them, and coal-fired power generation is rising.Manyhave questioned whether the resources are there to handle this ever-growing demand.
The IEA has long argued that hydrocarbon resources around the world are sufficiently abundant tofuel the world through its transition to a sustainable energy future. In fact, we suggest the questionmight be more appropriately restated as: “are we running out of economically-accessible fossilfuels?” The answer lies in technology development. If capital investment in projects is sufficient,new hydrocarbon resources can be unlocked from unconventional resources, deepwater offshorelocations, or in countries where geopolitical factors have restricted investment. Technologydevelopment decreases costs and reduces the environmental risks associated with resourceextraction, providingmore attractive returns for investors. It enables new resources to be developedin a cost-effective manner and accelerates the implementation of new projects.
Continued access to fossil fuels is less likely to be constrained by an insufficient resource base, andmore by governmental policy and regulation. Fossil fuels are a major source of energy-related CO2emissions. The international community has announced its intention to reduce these emissions andpositive movement in this direction has been taken in upstream extractive industries. Terms suchas “social licence to operate” are more commonplace. Environmental responsibility has becomean inherent part of project planning. But there is still much more to be done if fossil fuels are tocontinue to play a longer-term role in a low-carbon world.
Resources to Reserves 2013 reviews current and future technology trends in the upstreamoil, gas andcoal industries, and provides an overview of technological innovations on the horizon. Projectionssuggest we have sufficient fossil fuels for decades to come.
Myhope is that this publicationwillmake a significant contribution tobroadening knowledgebehindthe petrol pumps, pipelines and power stations that make the headlines. Hydrocarbon resources areplentiful and, if accessed andused in a responsible and environmentally-sustainablemanner, can havea beneficial impact on energy security.
This Report is being published under my authority as Executive Director of the IEA.
Maria van der Hoeven

ACKNOWLEDGEMENTS 5
ACKNOWLEDGEMENTS
This publication was prepared by the International Energy Agency (IEA) Energy Technology PolicyDivision, under the leadership and guidance of Didier Houssin, Director of Sustainable Energy Policyand Technology, and Division Head, Jean-François Gagné.
Keith Burnard was the project manager and had overall responsibility for the implementation of thestudy. The completed manuscript, however, is a testimony to the dedication and expertise of manyindividuals, both from within the IEA and outside. Though many of these experts are recognisedbelow, given the wide-ranging nature of this study, the time period over which the publication wasprepared and the varied level of contribution, any attempt to cite all of the experts who providedinput and advice is bound to fail.
The main authors and analysts of this study comprise many current and former colleagues at theIEA. They include: Kamel Bennaceur (Schlumberger); Michael Cohen; John Corben (Schlumberger);Anselm Eisentraut; Carlos Fernández Alvarez; Capella Festa; David Fyfe (Gunvor Group); Steve Heinen;Antonio Pflüger (German Federal Ministry of Economics and Technology); Wolf Heidug; Uwe Remme;and Andreas Ulbig (Eidgenössische Technische Hochschule Zürich [ETH, Zurich]); with the valuablesupport of Chris Besson worthy of particular note.
Outside of the IEA, Willem Schulte (Schulte Oil & Gas International Consultancy [SOGIC]) had a majorinfluenceon the final document,while important contributions came fromMaggi Rademacher (E.ON) andSandroSchmidt (Bundesanstalt fürGeowissenschaftenundRohstoffe [BGR]). Theguidanceof thefollowingexperts is also gratefully acknowledged: Maurice Dusseault (University of Waterloo); Brian Heath (CoalIndustryAdvisoryBoard [CIAB]);GillesMercier (NaturalResourcesCanada); FrankMourits (NaturalResourcesCanada); Hans-Wilhelm Schiffer (Rheinisch-Westfälisches Elektrizitätswerk [RWE]); John Topper (IEA CleanCoal Centre); Ian Torrens (independent consultant); and, Paul Zakkour (CarbonCounts).
Jostein Dahl Karlsen, Chair of the IEA Working Party on Fossil Fuels, supported the project from theoutset, providing access to key data and contacts. Several members of the CIAB provided valuablecontent in relation to coal.
Special thanks to Rebecca Gaghen and Muriel Custodio, who were instrumental in bringing thismanuscript to publication. Diana Louis and Nina Dhumal provided general assistance and helpedto prepare the manuscript, which was skilfully edited by Viviane Consoli, Tracey D’Afters, CherylHaines, Angela Gosmann and Marilyn Smith. Bertrand Sadin expertly handled the difficult task ofpreparing themany figures and diagrams included within these pages. Astrid Dumondmanaged theproduction of this book.
This publication would not have been possible without the generous voluntary contribution fromNorway and in-kind support from Germany.
The individuals and organisations that contributed to this study are not responsible for anyopinions or judgements contained within this publication. Any errors and omissions are solely theresponsibility of the IEA.
Comments and questions are welcome and should be addressed to:Dr. Keith BurnardInternational Energy Agency9, Rue de la Fédération - 75739 Paris Cedex 15 - France

TABLE OF CONTENTS 7
TABLE OF CONTENTS
Executive Summary. . . . . . . . . . . . . . . . . . . . . . . . . . . . . . . . . . . . . . . . . . . . . . . . . 17
Chapter 1 Setting the scene . . . . . . . . . . . . . . . . . . . . . . . . . . . . . . . . . . . . . . 25Global energy demand 25
Implications of a low-carbon scenario 27
Classifying resources and reserves 28Oil and gas 29Coal 33
Resources and reserves 35Oil resources and reserves 35
Conventional oil resources 38Unconventional oil resources 38
Natural gas resources and reserves 39Conventional gas resources 40Unconventional gas resources 41
Coal resources and reserves 42
Recent trends 45The impact of declining oilfield production 45
Upstream oil and gas: volatility in oil price and impact on investments 47The impact of policies on oil forecast 47Growth of coal consumption in China 48The need to manage water production 50
Recent developments in technology 51Innovations in oil and gas exploration and production 51Developments in coal mining technology 52Gaps in clean energy RD&D funding 52
Chapter 2 Raising recovery efficiency from oilfields . . . . . . . . . . . . . . . . 55Lifecycle of a petroleum reservoir 55Exploration 57Appraisal, planning and construction 59Production 60Abandonment 61
Developing new reserves: getting the most for the lowest cost 61Making a plan using integrated reservoir modelling 61Drilling technology for new reserves and lower costs 63Going offshore: developments in subsea wells and facilities 65
Applying technologies for IOR 67IOR techniques and their potential 68Improvements in the North Sea and Norwegian Continental Shelf 68Experience with 4-D seismic 71Potential improvements in recovery in the Middle East 72
8 RESOURCES TO RESERVES
Using well technology to boost recovery from thin oil rims 73
Mature reserves: technologies for EOR 74The move towards EOR technologies 75CO2 injection for EOR 81
CO2-EOR for greenhouse gas mitigation: a future win-win situation? 82Storage aspects 83The Weyburn-Midale project 84Costs and carbon credits 89
Being smart with smart fields 90Smart field technologies 91Smart field collaboration 92The advantages of smart field 92
Importance of future technology RD&D 93
Chapter 3 The growing importance of natural gas. . . . . . . . . . . . . . . . . . . . 99Natural gas sources and lifecycle aspects 99
More natural gas developments 101
Key element: getting gas to markets 102
The LNG value chain 103Liquefaction 103
Cost of liquefaction 104Plans for major liquefaction plants 105
Shipping 106Cost of shipping 108
Regasification and storage 108
Going offshore: floating LNG systems 109Offshore liquefaction from concept to operation 110Offshore floating regasification and storage units 111
GTL: an alternative way to bring gas to market 111GTL conversion process 112Commercial developments 113
Compressed natural gas for smaller accumulations 114
Sour gas and contaminated gas resources 116Processing sour gas 117Sour gas and public safety 118
NGL: a key contributor to global oil production 119Impact on the lifecylce of a gas development 119Trends in global NGL production 119
Chapter 4 Trends and challenges of frontier oil and gas . . . . . . . . . . . . . 123Main challenges of frontier oil and gas exploration 123
Potential of deepwater reserves 124
Developing deepwater reserves: applying new technology 126
TABLE OF CONTENTS 9
Evolution of deepwater offshore production surface facilities 127Evolution of seabed facilities 129Subsea processing 129Increase in subsea flowlines 131Multiphase flow assurance 132Phasing a development and leveraging technology along the way 134
Technologies for meeting the Arctic challenge 135Trends in Arctic frontier exploration and production 137Technological challenges for the Arctic 138Technological challenges for ice-prone areas 138Long-range, multiphase transportation of Arctic wellstreams 142
Protecting the Arctic environme143 143Minimising the environmental footprint 144
The Endicott Field 144The Alpine Oilfield 144Challenges to risk and response capabilities 146Environmental impact assessment 146Approaches to EIA 147Going beyond standard practice 148Key references for Arctic EIAs 150Legal aspects 150
Future directions 151
Chapter 5 Making light of unconventional oil . . . . . . . . . . . . . . . . . . . . . . . 155
Heavy oil and oil-sands 155Upgrading viscous oil 157Mining oil-sands 158Technologies for in situ production of heavy oil and oil-sands 158Environmental issues associated with heavy oil and oil-sands production 162
Impact on the landscape 162Water usage 162Bitumen slurry 163Sulphur 163Greenhouse gases (GHGs) 163
Steam and hydrogen sources 164
The future of heavy oil and oil-sands 164
Kerogen oil 165
Light tight oil 166Extraction of LTO 167LTO production 168Environmental impact 169
10 RESOURCES TO RESERVES
Chapter 6 The unconventional gas revolution . . . . . . . . . . . . . . . . . . . . . . . 173The potential of unconventional gas resources 173
Tight gas 175Extraction of tight gas 176
Shale gas 176Extraction of shale gas 177Barnett Shales gas development 178Distinctive features of shale gas plays 180The economics of shale gas production 180
Coal-bed methane 182Production of CBM 183
The potential for methane hydrates 185
Environmental impact 189Tight gas and shale gas 190CBM 191Methane hydrates: impact on the environment and climate change 192
Technology development 193Tight gas, shale gas and coal-bed methane 194
Exploration 194Drilling and stimulation 194Gas compression 194
Methane hydrates: the need for technological innovation 195
Chapter 7 Coal in the 21st century. . . . . . . . . . . . . . . . . . . . . . . . . . . . . . . . . . . 201Types of coal 201Coal rank and content 201
Carbon content 202Calorific value (or heat content) 202Moisture content 202Ash content 202
Coal classifications 202
Demand for coal 203
Classification of traded hard coals 205Steam coals 205Coking coals 205PCI coals 205Anthracite 205
Calculating coal deposits 206Global surveys of coal deposits and associated difficulties 206
Coal extraction 207Surface mining 207Underground mining 208
Longwall mining 208Room-and-pillar mining 208
TABLE OF CONTENTS 11
Coal use 210Coal for electricity generation 211Efficiency of electricity generation 212
Coal-fired plants in China 213Coal-fired plants in India 213Coal-fired capacity in OECD countries 214
Technologies to improve efficiency of coal-fired plants 214PC combustion 214Fluidised bed combustion 215Integrated gasification combined cycle 215Co-generation 216
Coal-to-liquids 216Indirect liquefaction 217Direct liquefaction 217New technologies for CTL 218
Environmental impact 219
Chapter 8 Production costs of fossil fuels. . . . . . . . . . . . . . . . . . . . . . . . . . . . 225Factors influencing production costs 225
Production cost curve for oil 227
Production cost curve for gas 231
Production cost curve for coal 232
Chapter 9 Meeting the environmental challenges . . . . . . . . . . . . . . . . . . . 237Production-related GHG emissions from oil resources 237Factors influencing GHG emissions from oil production 238Competing fuels 239Options for mitigation 239
Upstream GHG emissions 243Comparison of fuel cycle GHG emissions from different liquid fuels 243Trends for the future 248
Impact of carbon pricing 249
Energy sector methane releases 253Anthropogenic hydrocarbon sources of methane emissions 254Reducing methane emissions in the oil and gas sectors 256Dealing with methane emissions: opportunities and constraints 257
List of abbrevations, acronyms and units of measure . . . . . . . . . . . . . . . . . . . . . 261Abbreviations and acronyms 261
Units of measure 266
References A list of references can be found at the end of each chapter

List of figures
Figure 1.1 Global demand for primary energy to 2035, by scenario 26
Figure 1.2 World primary energy demand by fuel in the New Policies Scenario, 2010 and 2035 26
Figure 1.3 Natural gas demand by selected region in the New Policies Scenario, 2010 and 203527
Figure 1.4 World energy-related CO2 emissions, by scenario 28
Figure 1.5 Resources classification system 31
Figure 1.6 Classifications for discovered fields, comparing this publication to the PRMS 33
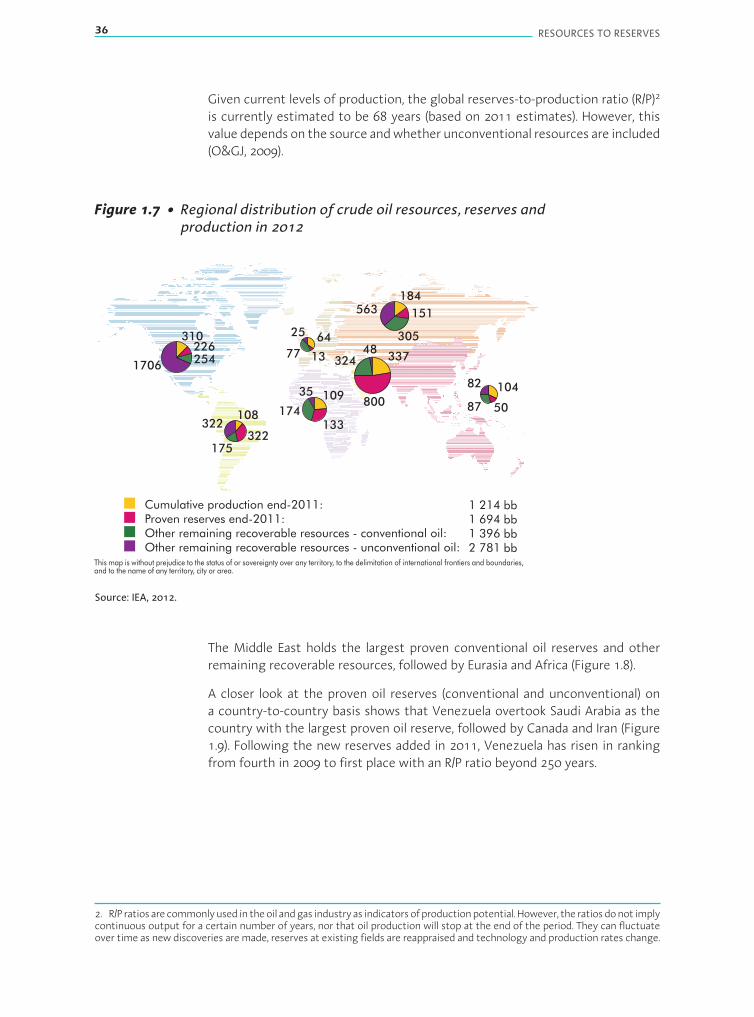
Figure 1.7 Regional distribution of crude oil resources, reserves and production in 2012 36
Figure 1.8 Ultimately recoverable resources of oil in the New Policies Scenario, by region 37
Figure 1.9 Proven oil (crude and natural gas liquids [NGL]) reserves in the top 15 countries,end-2011 37
Figure 1.10 Conventional and unconventional oil reserves and resources in 2011 39
Figure 1.11 Distribution of conventional natural gas in 2012 40
Figure 1.12 Cumulative production, proven reserves and resources for conventional natural gas,by region 41
Figure 1.13 Conventional and unconventional natural gas reserves and resources (end-2011) 42
Figure 1.14 Distribution of hard coal reserves, resources and production, by region 43
Figure 1.15 Global hard coal resources and reserves, by region 43
Figure 1.16 Distribution of lignite reserves, resources and production, by region 44
Figure 1.17 Share of global lignite resources and reserves, by region 44
Figure 1.18 World liquid supplies, by type, in the New Policies Scenario 45
Figure 1.19 Average observed decline in oilfield production versus first year of production 46
Figure 1.20 Annual coal production, by region 48
Figure 1.21 Comparison of coal consumption in China, Europe and the United States 49
Figure 1.22 Water use for primary energy production 51
Figure 2.1 Schematic representation of the lifecycle of a petroleum reservoir 55
Figure 2.2 Typical traps for oil or gas 56
Figure 2.3 Improvement in set-up of streamer configurations in marine seismic acquisition 58
Figure 2.4 Improvement in seismically derived image by wide azimuth data acquisition 59
Figure 2.5 Multi-layered carbonate integrated reservoir model 62
Figure 2.6 Results from Haradh field tests 64
Figure 2.7 Growth in subsea wells 65
Figure 2.8 Effects from subsea boosting and separation 66
Figure 2.9 Production trends for the Ekofisk, Varg, Oseberg and Ula fields 69
Figure 2.10 Application of 4-D seismic in the Gullfaks field 71
Figure 2.11 Change of drilling location based on 4-D seismic results 72
Figure 2.12 Evolution of recoverable oil reserves in the Troll field 74
Figure 2.13 Impact of EOR technology on oil production from the Weyburn field, Canada 75
Figure 2.14 Common EOR techniques currently in use 76
Figure 2.15 Effectiveness of different EOR methods 79
12 RESOURCES TO RESERVES
TABLE OF CONTENTS 13
Figure 2.16 Production from EOR in the WEO 2008 Reference Scenario, by country 80
Figure 2.17 Potential additional recoverable oil resources using CO2-EOR, by region 82
Figure 2.18 Density and volume occupied by supercritical CO2 at different injection depths 84
Figure 2.19 Weyburn-Midale CO2 pipeline 85
Figure 2.20 The Weyburn-Midale CO2-EOR storage project 86
Figure 2.21 CO2 trapped by different mechanisms 88
Figure 2.22 Smart fields focus on short-term production and longer-term reservoirmanagement 91
Figure 2.23 Distribution of oil resources and reserves in producing NCS fields 93
Figure 3.1 Sources of conventional gas 100
Figure 3.2 Quantity and distance regimes for LNG and pipeline gas transportation 102
Figure 3.3 LNG and pipeline cost inflation, 2004–07 104
Figure 3.4 Natural gas liquefaction capacity in operation and under construction 105
Figure 3.5 Membrane design LNG ship Puteri Intan 107
Figure 3.6 Moss design spherical containment LNG ship 107
Figure 3.7 Liquefaction and regasification capacity in operation,under construction and planned, 2011 109
Figure 3.8 The GTL process 112
Figure 3.9 The Shell middle distillate synthesis process plant at Bintulu, Malaysia 113
Figure 3.10 Pearl GTL plant product slate 114
Figure 3.11 CNG versus LNG capital expenditure and energy efficiency 116
Figure 4.1 Global offshore and deepwater oil production (2010–15) 124
Figure 4.2 Global deepwater oil discoveries to end-2006 versus exploration wells 125
Figure 4.3 Alternative evolving configurations of deepwater subsea oil and gas production 126
Figure 4.4 Key technological challenges for ultra-deepwater 127
Figure 4.5 Evolution of surface production facilities with increasing water depth 128
Figure 4.6 Increase in surface facilities for deepwater production, by type 128
Figure 4.7 Ormen Lange natural gas field and tieback to Nyhamna onshore facility 130
Figure 4.8 Current experience in hydrocarbon multiphase flow 131
Figure 4.9 Facets of the multiphase flow at Ormen Lange 132
Figure 4.10 Gas hydrates plug in flowline 133
Figure 4.11 Cold flow principle 133
Figure 4.12 View from the top 135
Figure 4.13 Distribution of undiscovered oil accumulations 136
Figure 4.14 Distribution of undiscovered natural gas resources 136
Figure 4.15 Ice coverage in the South Barents Sea 140
Figure 4.16 Ice hazards 140
Figure 4.17 A gravity-based structure to protect against the ice 141
Figure 4.18 Distances to shore for long-range transfer of wellstream 142
Figure 4.19 Layout of the Alpine Oilfield during winter operations and summer close down 145
14 RESOURCES TO RESERVES
Figure 4.20 Arctic field development of the future: zero-surface facilities 145
Figure 4.21 Examples of EIA approaches for requirements of EIAs 148
Figure 4.22 Subsea technology enables growth: Roadmap to the subsea factory 152
Figure 5.1 Past and projected production of oil-sands fromCanada, in theNewPolicies Scenario 156
Figure 5.2 In situmethods of viscous oil production 158
Figure 5.3 The SAGD process 160
Figure 5.4 Oil-sand mining region north of Fort McMurray, Alberta 162
Figure 5.5 Horizontal drilling and hydraulic fracturing 167
Figure 6.1 Annual actual and projected production of unconventional gasin the United States 175
Figure 6.2 Horizontal well with multiple hydraulic fractures 177
Figure 6.3 Barnett Shales’ gas wells completed and production 179
Figure 6.4 Production decline rates for Barnett Shales’ horizontal gas wells 179
Figure 6.5 Shale gas plays in the United States 182
Figure 6.6 Existence ofmethane hydrate as a function of geothermal gradient andphase boundary 186
Figure 6.7 Methane hydrates in Arctic and marine environments 187
Figure 6.8 Global volume distribution of methane hydrates 188
Figure 6.9 Methane hydrate resource pyramid 189
Figure 6.10 Schematic of methane displacement by CO2 192
Figure 7.1 Growth rate in primary energy supply, 2000–10 204
Figure 7.2 Typical drag-line surface mining operation 208
Figure 7.3 Typical underground longwall mining operation 209
Figure 7.4 Typical underground room-and-pillar mining operation 209
Figure 7.5 Coal use in different regions in 2010 210
Figure 7.6 Global incremental growth in power generation between 2000 and 2010 211
Figure 7.7 Electricity generation from non-fossil fuels, 1990 to 2010 212
Figure 7.8 Indirect coal liquefaction 217
Figure 7.9 Direct coal liquefaction 218
Figure 8.1 UICI and annual inflation rate 226
Figure 8.2 Upstream oil and gas investment and operating costs, by region 227
Figure 8.3 Oil production costs for various resource categories 228
Figure 8.4 Long-term gas supply cost curve 231
Figure 8.5 Estimated supply cost curve for global hard coal reserves 233
Figure 9.1 Underground storage options 241
Figure 9.2 Total WTT GHG emissions from various oil resource categories 244
Figure 9.3 Total WTW GHG emissions from various oil resource categories 245

TABLE OF CONTENTS 15
Figure 9.4 Upstream (WTR) GHG emissions per unit of production from industry survey 247Figure 9.5 Energy input in upstream production from industry survey 248Figure 9.6 Oil production (WTT) costs for a carbon price of USD 50/t CO2-eq 250Figure 9.7 Oil production (WTT) costs for a carbon price of USD 150/t CO2-eq 251Figure 9.8 Global anthropogenic methane emissions in 2010 253Figure 9.9 Global methane emissions from oil and natural gas in selected countries 255Figure 9.10 Methane emissions from coal mines in selected countries 256
List of boxes
Box 1.1 Unconventional oil 29Box 1.2 Unconventional gas 30Box 1.3 New SEC reporting rules for reserves 32Box 1.4 BGR classification of coal reserves and resources 34
Box 2.1 What exactly is a petroleum reservoir? 56Box 2.2 A step forward through wide azimuth seismic surveys 58Box 2.3 IOR and EOR 67Box 2.4 Technological breakthrough: water injection in the Ekofisk field 70Box 2.5 Landscape of EOR techniques 76Box 2.6 Remaining oil and chemical EOR 78Box 2.7 The power of market prices 80
Box 3.1 The technology behind GTL conversion 112
Box 4.1 Cold flow to prevent hydrate plugging: a potential solution 133Box 4.2 Arctic technologies: findings of the OG21 Project 139Box 4.3 Studies undertaken by operators on the Alaska North Slope to safeguard
the environment 143Box 4.4 IFC’s standards for lenders 148
Box 5.1 Technologies for in situ production of oil-sands 159Box 5.2 Steam-assisted gravity drainage 160
Box 6.1 Success factors in shale gas development 178Box 6.2 China: a major opportunity for CBM 183Box 6.3 CO2-enhanced CBM production 191Box 6.4 Inter-agency activity on gas hydrate research and development
in the United States 196
Box 9.1 Commercial CCS projects 241Box 9.2 Definitions used for the lifecycle assessment of oil production 243
16 RESOURCES TO RESERVES
List of tables
Table 1.1 Production overview, by resource type (mb/d) 48
Table 2.1 Expected ultimate percentage recovery from Statfjord and Gullfaks fields 70Table 2.2 Pre-screening criteria for EOR 77Table 2.3 Estimated incremental production from EOR projects (1 000 b/d), 2007 79Table 2.4 Weyburn and Midale CO2-EOR operating statistics 87
Table 4.1 Examples of EIA legislation in Arctic countries 147
Table 4.2 Issues for EIAs in Arctic regions 149
Table 4.3 Reference sources for Arctic EIAs 150
Table 6.1 Ultimately recoverable resources of natural gas in 2011 174
Table 7.1 Comparison of standard subdivisions and classifications of coal by coal rank 203
Table 9.1 Production-related WTT GHG emissions, and comparison with total WTWGHG emissions 246
Table 9.2 Impact of GHG emissions on production costs (for various carbon prices) 250
Table 9.3 Oil production, overview by resource type (million barrels per day) 252
EXECUTIVE SUMMARY 17
EXECUTIVE SUMMARY
Fossil fuels currently meet 80% of global energy demand. Even if current policycommitments andpledgesmadebycountries to tackle climatechangeandotherenergy-related challengeswere to be put in place, global energy demand in 2035is projected to rise by 40% – with fossil fuels still contributing 75%. Demandover the coming decades will stem mainly from energy needs of emergingmarkets such as China and India. The use of coal, gas and oil to fuel the power,industry, buildings and transport sectors is set to rise. Although environmentalconcerns have led to a significant increase in lower-carbon options, these arenot yet deployed widely enough to meet current or future demand for energy.Over the past two decades, the global share of power generation from non-fossil sources has decreased from 37% (in 1990) to 33% (in 2010); in contrast,the share of coal-fired power generation has risen from 37% to 42%. Fossil fuelswill continue to provide the majority of global energy needs for the foreseeablefuture, but are there sufficient resources to meet the demand?
Given the major fluctuations witnessed in energy markets in the past sevenyears – notably the global economic crisis – Resources to Reserves 2013 assessesthe availability of fossil fuels and surveys the cutting-edge technologies neededto find, produce and bring them to the market, while avoiding adverse impactson the environment to the greatest extent possible. This new edition alsohighlights the need for strategic approaches specific to each fuel type.
Availability of fossil fuels
Fossil fuels are abundant in many regions of the world and they are in sufficientquantities to meet expected increasing demands. However, most of them arestill classified as resources and not yet as reserves. This distinction is importantas it reflects the likelihood that the fossil fuels will be brought to the market.Resources are those volumes that have yet to be fully characterised, or thatpresent technical difficulties or are costly to extract, for example wheretechnologies that permit their extraction in an environmentally sound and cost-effective manner are still to be developed. Reserves are those volumes that areexpected to be produced economically using today’s technology; they are oftenassociated with a project that is already well-defined or ongoing. As the moreaccessible, conventional supplies are exhausted, so more technically demandingresources will need to be exploited.
Akeyrolefortheindustryistoconvertresourcesintoreserves.Thisreclassificationrelies heavily on the application of advanced technological solutions, which isstrongly linked to fuel prices. High fuel prices stimulate the development andtesting of more sophisticated solutions, and result in a growth of reserves.Exploring and extracting these reserves economically, and in an environmentallyresponsible manner, will require investment in new innovative solutions.
Fossil fuels, also collectively known as hydrocarbons, include oil, gas and coal.Any source of oil and gas that requires production technologies significantly
EXECUTIVE SUMMARY 17
18 RESOURCES TO RESERVES
different from those used to produce from conventional reservoirs is describedas unconventional. A quick summary of known hydrocarbon reserves andresources demonstrates the potential supply:
■ Proven reserves of conventional oil are estimated to be around 1.3 trillionbarrels, with remaining recoverable oil resources representing about 2.7 trillionbarrels. Globally, proven reserves have increased modestly since 1990, despitethe growth in consumption. The global reserves-to-production ratio, based oncurrent consumption levels, is in the range of 40 to 45 years. As resources aresuccessfully converted into reserves, this period will be extended.
■ Proven reserves of unconventional oil are around 400 billion barrels (bb), withestimated recoverable resources of 3.2 trillion barrels.
■ Proven reserves of conventional gas are estimated at around 220 trillion cubicmetres (tcm)– the equivalent of around1.4 trillionbarrels of oil –with remainingrecoverable resources of 460 tcm.
■ Proven reserves of unconventional gas, because of the heterogeneity of therock formations, are very difficult to assess. Remaining recoverable resources(excluding methane hydrates) are estimated at 330 tcm.
■ Reserves of coal are high, with proven reserves of hard coal estimated at730 gigatonnes (Gt) (approximately 3.6 trillion barrels of oil equivalent [boe])and proven reserves of lignite estimated at 280 Gt (approximately 0.7 trillionboe). Remaining recoverable resources of hard coal and lignite are estimated ataround 18 and 4 trillion tonnes, respectively.
Developing various fossil fuel reserves is highly complex. As a means ofassessing potential profitability, producers start by estimating the relativecost of development and the carbon intensity (the amount of carbon dioxide[CO2] emitted for each unit of energy produced) of the fuel to be produced.Conventional natural gas typically has the lowest cost per energy unit and thelowest carbon intensity. All unconventional gas developments generally havelow carbon intensity and divergemainly in the cost of development. By contrast,unconventional oil developments (such as frombitumen, coal gasification andoilshales) are more expensive to produce and have higher carbon intensities. Coalhas the highest carbon intensity of the fossil fuels.
As this edition of Resources to Reserves illustrates, the current increase in fossilfuel supply over recent years has been made possible thanks to impressiveadvances in technology. Future supply will require even more demandingtechnological innovations that can increase production in existing and newsourceswhile also respondingappropriately to relevantenvironmental challenges.
Using advanced technology to move from resourcesto reserves
Resources to Reserves 2013 provides an overview of the new technologicaldevelopments and discusses the potential next steps for each fuel type.
EXECUTIVE SUMMARY 19
Conventional oil and gasThere are various examples where technological developments have made itpossible to extend oil production from a field over a much longer time thanwas initially foreseen. Securing future oil production will require greater outputfrom brown fields (fields already in production) by employing improved andenhanced oil recovery (EOR) techniques. At the end of their anticipated lifecycle,most fields still contain significant volumes of oil. Technological advancementsmean that a larger fraction of these volumes could be brought to the surface. Forexample, on average about 50% of the original oil-in-place volumes in reservoirscould be recovered by using the latest cutting-edge technology.
Even a 1% increase in the average recovery factor could add more than 80 bb,or 6%, to global proven oil reserves. Over the last 20 years, the average recoveryfactor from the Norwegian Continental Shelf has seen a significant shift – from34% to around 46% today. This has largely been driven by technology withcontributions fromhorizontal/multilateral drilling, improved seismic acquisition,four-dimensional seismic techniques and improved subsea facilities. With therecent accelerated developments in smart fields (fields that use a whole rangeof technological solutions), even higher recovery rates could be achieved. If theshift seen in Norway were to be achieved in all the basins of the world, it woulddouble current proven reserves. A similar additional shift could be achieved byadopting EOR techniques on amuch wider scale. Currently, there is a significantincrease in the number of EOR pilot tests, especially those using chemicalmethods and CO2 injection. Examples may be found around the world, fromChina, Russia, the Middle East and North America to Argentina. In spite of theseefforts, the maturing of existing projects and the complexity of implementingEOR technologies will lead to decreased production levels in non-Organizationof the Petroleum Exporting countries (OPEC) countries, with a correspondingincrease in production of conventional oil from OPEC countries.
Natural gas is set to play an increasing role in meeting the global demand forenergy, especially in power generation and heating. Whereas a few decadesago gas was often stranded (too remote to be financially viable to transport tomarket) and an unwanted by-product of oil production, many such gas projectsare now being actively pursued. More often than not, the principal challenge inthe past was in bringing the gas to market. However, today, liquefied naturalgas (LNG) provides a cost-effective solution in many cases. Liquefying naturalgas, shipping it in ever larger carriers and using regasification at an increasingnumber of locations close to the end-user is making it more financially viableto transport gas to market. Qatar and Iran in the Middle East, in particular, haveseen a significant increase in capacity. Recent new technological developmentsare towards offshore floating LNG options (liquefaction on a boat), with the firstto be built in the sea north-west of Australia. In Qatar, the first large-scale gas-to-liquids plant is already under construction.
The frontier locations for conventional hydrocarbons are now in ultra-deepwaterand in the Arctic. Adding to the complexity of exploration and production inthese locations is the imperative to do no harm to the pristine and sensitiveenvironments. In these often remote locations, operations such as subsea

20 RESOURCES TO RESERVES
processing and compression are required to allow transfer by pipeline to distantfacilities. Important growth regions in deepwater exploration andproduction areBrazil andWest Africa. Many of the technologies developed for deepwater couldeventually be used in Arctic regions. Additional challenges in the Arctic includeprotecting facilities from ice-related dangers and extending the drilling season.In future, technologies that enable very long tie-backs from field to coastalcollection points could make it more viable for other developments to proceed.Technology is continuing to evolve at a rapid pace. Current developments,concentrated around the Barents Sea and the North Slope of Alaska, are outlinedin this edition.
Unconventional oil and gasThe global potential for unconventional oil is high. Though the resources andreserves base is similar to that for conventional oil, there are potentially moreresources awaiting technological solutions. Theworld’s extra-heavy andoil-sandsresources are largely concentrated in Canada and Venezuela. Mining operationsto develop the shallow reserves are seeing a significant increase. Many of thedeeper deposits are developed by using steam to reduce viscosity. Becauseof the energy intensity of these projects and the associated carbon footprint,many such developments now have to contain solutions for carbon capture andstorage (CCS), i.e. processes bywhich CO2 is captured at the emission source andthen, usually, injected into underground sites for long-term, geological storage.
Unconventional gas – tight gas, shale gas and coal-bed methane – has seensubstantial growth in theUnited States andCanada, drivenmainly by theneed tominimise reliance on imported fuel. Technology has been central to this growth.Driving vertical and horizontal wells, and creating hydraulically generatedfractures tomaximise and steer the flowof gas, has brought dividends. However,the financial viability of these developments remains very sensitive to the localgas price. Further cost reductions are possible through improved drilling andcompletion techniques, as well as enhanced understanding of the basic flowphenomena in stress-sensitive reservoirs. There is an enormous opportunity toexport the experience and learning gained to other parts of theworld where theexploration of such resources is still in its infancy.
With the increasing demand for natural gas, prospects are being exploredfor sour gas (gas contaminated with CO2 or hydrogen sulphide). Key to suchdevelopments is the ability to separate out the contaminants and dispose ofthem in an environmentally friendly manner. The Middle East, Kazakhstan andSouth-East Asia have substantial volumes of such resources under considerationfor development.
Methane hydrates offer a potentially enormous source of methane gas andare thought to be the most abundant source of hydrocarbon gas on earth.However, the technical challenges in accessing this resource in a cost-effectiveand environmentally acceptable manner are still being addressed. Significantproduction in the short to medium term is not anticipated and therefore globalforecasts do not generally include production of methane from this source.
EXECUTIVE SUMMARY 21
CoalCoal production has seen a steep increase in the last decade, with projectionspointing to a continued rise for the next decade. These increases are drivenmainly by economic growth in emerging economies, particularly in Chinaand India. Environmental imperatives demand that, in the longer term, CO2emissions from the use of fossil fuels must decline; this is particularly the casefor coal, themost carbon-intensive of the fossil fuels. If the environmental issuescan be resolved, there are sufficient coal resources to satisfy expected demandfor many more decades. Reducing emissions from coal could be achieved by:
■ developing technologies to improve the efficiency of coal use;
■ using CCS.
The greater the effectiveness of these two options, the less will be the emphasison switching to lower-carbon alternatives.
Moving towards ever thinner, deeper and less uniformcoal seamsposes a numberof challenges formining, all of which are likely to lead to an increase in the cost ofproduction. Alternatively, it may trigger a move to exploit the abundant reservesof shallower but lower-quality coal. Technology is constantly being improved,offering opportunities for those with state-of-the-art mining techniques toexport them to regions where such techniques have yet to be deployed.
Future improvements, for example, may come from the further development ofunderground coal gasification, inwhich coal is gasified in situ to generate power,or from generation using advanced technologies. Advanced ultra-supercriticalsteam cycles and integrated gasification combined cycle (IGCC) technologywith state-of-the-art gas turbines are currently being developed. Furtherdevelopment of more cost-effective, energy-efficient CCS technologies will beessential to the future use of coal.
Mitigating the environmental impact
The future use of all fossil fuels is increasingly determined by political debatesand governmental regulations reflecting concerns about local environmentsand greenhouse gas (GHG) emissions, particularly CO2. The year-on-year rise inanthropogenic GHG emissions is a matter of global concern. Reducing themcan only be achieved by switching to lower-carbon fuels, better management ofGHG emissions, and more efficient production and consumption of fossil fuels– all of which become more effective with the development and application ofimproved technology.
While much emphasis is placed on switching from fossil fuels to non-fossil orrenewable energy sources, as this edition of Resources to Reserves highlights,both technological improvements and fuel switching among fossil fuels alsohas significant potential to reduce GHG emissions. For example, while powergenerated fromcoal globally releasesmore than 1 000 grams of CO2 per kilowatthour (gCO2/kWh), a state-of-the-art coal-fired generation plant releases around
22 RESOURCES TO RESERVES
740 gCO2/kWh. So, there is much potential to reduce emissions simply bydeploying more efficient technology. If a coal-fired generation unit were to bereplaced by a state-of-the-art unit firing natural gas, emissions could be reducedeven further, to 370 gCO2/kWh. This potential to substantially reduce CO2emissions reflects both the higher heat content of gas and the higher efficiencyof the gas-fired power generation process. Though the choice of fuel is largelydetermined by resource availability and cost, environmental factors now play anincreasingly important role.
While the continued use of fossil fuels will inevitably produce CO2 emissions,new technologies make it possible to limit their release into the atmosphere.CCS is now being piloted and demonstrated in various parts of the world. Atpresent, saline aquifers, which are abundant in many parts of the world andpotentially offer large storage volumes, are considered as the storage sites likelyto dominate in the long term. Current technologies for storage in saline aquifersneed further improvement, especially for long-term monitoring, understandinggas flow in aquifers and for evaluating the potential for leakage throughoverlying rock and fault systems.
In the long term, incentives for emissions reduction, such as carbon pricingschemes, could provide an essential stimulus to encourage CO2 storage. Furtherefforts to resolve remaining issues associated with monitoring and long-termliability will also be needed. Carbon pricing will, of course, drive up the cost ofproducing fossil fuels. Some implications of carbon pricing assumptions areaddressed in this edition.
In the Weyburn oilfield (Canada), CO2 is being injected to enhance oil recoverywhile, at the same time, the oilfield is being monitored to assess the amountof CO2 stored. In oilfield operations, the more energy-intensive oil recoverymethods, e.g. steam injection for recovery of heavy oil and bitumen, may infuture need to incorporate CCS. Another option is to store CO2 in coal beds toprompt the release of methane. Some scientists suggest that such a processcould eventually be used to releasemethane frommethane hydrates, with someinitial, small-scale trials having been successfully completed.
As releasing methane into the atmosphere is potentially much more harmfulthan releasingCO2, methane released during exploration andproduction is oftenflared (methane is burnt on site to convert it to CO2), particularly at oil drillingsites. However, priority should be given during exploration and production tousing the gas rather than flaring it. For example, the gas may be reinjected backinto an oil reservoir to maintain pressure for subsequent oil recovery, used tosupplement local heat or power requirements, or transported for use elsewhere(if commercially viable). Such initiatives are underway inmanyparts of theworld.
Key conclusions and recommendations
Fossil fuels dominate world primary energy supply. Resources are in place forthis to continue well into the 21st century. Societal implications, particularly thedemand for an environmentally sustainable, low-carbon future, will be pivotal
EXECUTIVE SUMMARY 23
to their continued use. Advances in technology will be absolutely essential toensure that the use of fossil fuels remains affordable and clean.
In some regions, innovative technological solutions have led to a sizable increasein reserves. There is a significant opportunity to pursue a wider application ofthese state-of-the-art solutions by teaching others, learning from others anddemonstrating rigour in their deployment. Innovation can often be found byapplying existing technology to a new environment.
Flexibility in the use of fossil fuels can offset some of the environmentalchallenges. For example, switching from coal to gas for power generation orusing high-carbon fuels for situations in which decarbonisation and integrationwith renewable fuels is possible without losing efficiency.
Resourcesof fossil fuels are available tomeet the increasingenergydemand; thatmuch is clear. The emphasis now is on the technology, prices and policies thatwill ensure it is financially viable to develop the world’s resources into provenreserves. Technology has developed by leaps and bounds since the last editionof Resources to Reserves was published, but a concerted effort in research anddevelopment (R&D) is still needed to go forward. Large-scale investment overthe coming decades will be vital to this effort. Public policy will play a key rolein providing the measures and incentives for industry to make the necessaryinvestments.
RecommendationsRadical and co-ordinated policy action across all regions will be needed tosupport ongoing exploitation of fossil fuels, while addressing successfully theenvironmental, economic and technical challenges that arise. In particular, thecarbon intensity of supply chains and subsequent use of oil, gas and coal mustdecrease.
Strong governance, with policies and legislation directed at reducing GHGemissions from the exploration, production and transport of fossil fuels, willbe essential to guide the development of more complex technologies. This willbe particularly important to ensure that operations in pristine and sensitiveenvironments are completed without long-term environmental damage.
Continued use of fossil fuels will, of course, lead to emissions of GHGs. In thisregard, governmentsmust take steps to stimulate improvements inequipment inthe power and end-use sectors. Efforts can be directed, for example, to increasingthe fuel efficiency of vehicles, developing less carbon-intensive industrialprocesses, and improving the efficiency of power generation technologies. Policyalso plays an important role in supporting the spread of best practice.
For deep cuts in emissions from the industry and power sectors, CCS isessential (particularly at large point sources). Policy measures to accelerate thedevelopment of CCS, to reduce its capital and operating costs, and to createan enabling regulatory environment are all necessary. Desirable, predictableincentives must be provided if the widespread deployment of CCS is to becomea long-term reality.

CHAPTER 1 • SETTING THE SCENE 25
Chapter 1 • Setting the scene
Oil, gas and coal have fuelled economic development around the globe for over acentury. However, the extent of the world’s hydrocarbon resources and reserveshas sparked much public debate over the last decade. For example, there arewidespread concerns that the world’s oil resources will soon decline to a levelwhere supply will become limited and unable to keep pace with increasingdemand. In terms of quantities, the total amount of fossil fuels held in the Earth’ssubsurface is certainly finite.
Global energy demand
Studies on the future of world energy supplies point to the continuingdominance of fossil fuels well into this century. In the World Energy Outlook2012 (IEA, 2012), the International Energy Agency presented three scenarioswith energy projections to 2035: the Current Policies Scenario, the New PoliciesScenario and the 450 Scenario.
■ Current Policies Scenario assumes no change in government policies andmeasures, i.e. the “business-as-usual” scenario;
■ New Policies Scenario assumes new measures have been introduced toimplement broad policy commitments, including national pledges to reducegreenhouse gas emissions (GHGs) and, in some countries, plans to phase outfossil fuel energy subsidies;
■ 450 Scenario aimed at limiting the increase in the future global temperature to2 degrees Celsius (°C), which assumes that GHG concentrations can be stabilisedin the atmosphere at a level of 450 parts-per-million carbon dioxide-equivalent(ppm CO2-eq).
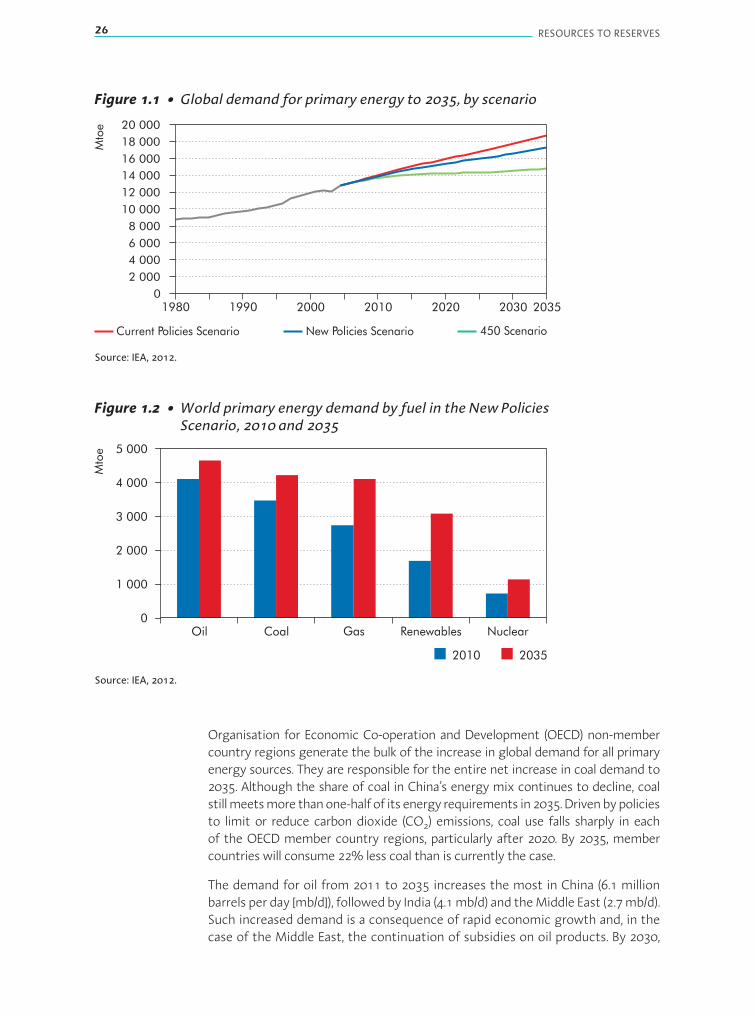
Global energy demand is projected to rise under all three scenarios to 2035(Figure 1.1) though, under the 450 Scenario, the demand for global primaryenergy would increase more slowly, reaching 14 870 million tonnes of oil-equivalent (Mtoe), which is only some 20% above the current level. Despite asharp drop in 2009, a direct result of the global economic crisis, demand forenergy will continue to increase, averaging a projected 1.76% in the CurrentPolicies Scenarios and 1.10% per year in the 450 Scenario from 2010-20.
Even in the New Policies Scenario, fossil fuels remain the dominant contributorto the growth in energy demand, providing approximately 59% of incrementaldemand during the period (Figure 1.2). However, their share of global energydemand diminishes slightly from81% to 75%.Oil remains the single largest fuel,though its share of the total falls from 32% to 27%. Gas shows the largest rise,increasing by about 50%.
CHAPTER 1 • SETTING THE SCENE 25
26 RESOURCES TO RESERVES
Figure 1.1 • Global demand for primary energy to 2035, by scenario
Current Policies Scenario New Policies Scenario 450 Scenario
1980 1990 2000 2010 2020 2030 2035
Mto
e
0
2 000
4 000
6 000
8 000
10 000
12 000
14 000
16 000
18 000
20 000
Source: IEA, 2012.
Figure 1.2 • World primary energy demand by fuel in the New PoliciesScenario, 2010 and 2035
5 000
4 000
3 000
2 000
1 000
0
Mto
e
Oil Coal Gas Renewables Nuclear
2010 2035
Source: IEA, 2012.
Organisation for Economic Co-operation and Development (OECD) non-membercountry regions generate the bulk of the increase in global demand for all primaryenergy sources. They are responsible for the entire net increase in coal demand to2035. Although the share of coal in China’s energy mix continues to decline, coalstillmeetsmore thanone-halfof itsenergy requirements in2035.Drivenbypoliciesto limit or reduce carbon dioxide (CO2) emissions, coal use falls sharply in eachof the OECD member country regions, particularly after 2020. By 2035, membercountries will consume 22% less coal than is currently the case.
The demand for oil from 2011 to 2035 increases the most in China (6.1 millionbarrels per day [mb/d]), followedby India (4.1mb/d) and theMiddle East (2.7mb/d).Such increased demand is a consequence of rapid economic growth and, in thecase of the Middle East, the continuation of subsidies on oil products. By 2030,

CHAPTER 1 • SETTING THE SCENE 27
China overtakes the United States to become the largest oil consumer in theworld. Having reached a peak of 46 mb/d in 2005, oil demand in OECD countriescontinues to decline dropping to 33mb/d in 2035. This decrease in oil demand islargely due to efficiency gains in the transport sector and continued switchingaway from oil in other sectors.
Unlikedemand for theother fossil fuels to2035, demand fornatural gas increasesinOECDcountries,where it remains the leading fuel for powergeneration and animportant fuel in the industrial, services and residential sectors. China and Indiaaccount for one-third of the incremental demand, as gas use increases rapidlyin the power sector and in industry. The Middle East, which holds a considerableshare of the world’s proven natural gas reserves, is responsible for one-sixth ofthe global increase in gas consumption (Figure 1.3).
Figure 1.3 • Natural gas demand by selected region in the New Policies Scenario,2010 and 2035
bcm
0
100
200
300
400
500
600
700
800
UnitedStates
MiddleEast
EuropeanUnion
Russia China India Japan
Demand growth 2021-35Demand growth 2010-202010
0.5%
% = compound averageannual growth rate 2010-352.1% 0.6%
0.7% 6.6%
4.2%0.7%
Note: bcm = billion cubic metres.
Source: IEA, 2012.
Implications of a low-carbon scenario
A degree of consensus is evident among climate experts that anthropogenicGHG emissions produced, for example, from the burning of fossil fuels, areprimarily responsible for global warming. As a response, global leaders haveindicated the desirability to limit the global temperature increase to 2°C. Toachieve this, the concentration of GHGs in the atmosphere would need to bestabilised at a level around 450 ppm CO2-eq. The World Energy Outlook 2012investigates how, despite increasing challenges, the objective for a maximum2°C temperature rise can be achieved in its 450 Scenario through radical andco-ordinated policy action across all regions.

28 RESOURCES TO RESERVES
Reducing CO2 concentrations in the atmosphere may be achieved in large partby reducing emissions of CO2. The New Policies Scenario predicts that globalCO2 emissions will rise to a level of 36 gigatonnes (Gt) per year by 2035.
In the 450 Scenario, total energy demand in 2035 is approximately 12% lowerthan that in the New Policies Scenario, but still above 2011 levels. Crude oildemand in 2035 is about 21% lower than in the New Policies Scenario and,compared to 2009, about 8% lower. Energy-related CO2 emissions in the 450Scenario peak at 32.7Gt just before 2020 anddecline thereafter to 23Gt by 2035,taking themsignificantly below the 2010 level of 29.4Gt. A 2°C scenario presentsan extremely demanding challenge (Figure 1.4).
The key steps to reducing the bulk of GHG emissions include: improvingend-use energy efficiency; decarbonising the power and transportationsectors through improved efficiency and fuel switching; using alternativesustainable energy sources; and by deploying on a large-scale carbon captureand storage.
Figure 1.4 • World energy-related CO2 emissions, by scenario
70%
30%
71%
29%
1990 2000 2010 2020 2030 2035
Gt 45
40
35
30
25
20
Current PoliciesScenario
450 Scenario
New PoliciesScenario
OECD Non-OECD
6 Gt
15 Gt
Source: IEA, 2012.
Classifying resources and reserves
Fossil fuels have had and continue to have a dominant role in fuelling theworld’s economy. But for howmuch longer? This has been a recurring questionin public debate over recent years. Remaining resources and reserves of fossilfuels are finite. Some resources have yet to be found. There is considerableuncertainty about the magnitude of “undiscovered resources”. Essential to thedebate on resources and reserves, of course, is a clear understanding of theterminology.

CHAPTER 1 • SETTING THE SCENE 29
Oil and gasBefore classifying resources and reserves, it is essential to understand thedifference between conventional and unconventional hydrocarbons (Box 1.1and Box 1.2). There is no universally agreed definition of what is meant byconventional oil or gas as opposed to unconventional hydrocarbons. Generallyspeaking, any source of hydrocarbons that requires production technologiessignificantly different from those used in currently exploited reservoirs isdescribed as unconventional. However, this is clearly an imprecise and time-dependent definition. In the longer term, unconventional oil and gas may wellbecome the norm rather than the exception.
Box 1.1 • Unconventional oil
Unconventional oil, as defined by the International Energy Agency (IEA), includes the followingcategories:
■ kerogen shale, also referred to as oil shale, generally refers to any sedimentary rock thatcontains kerogen, fromwhich oil (or kerogen oil) may be produced by heating the kerogen;
■ oil sands contain a dense and extremely viscous form of petroleum, technically referred toas bitumen;
■ light tight oil (LTO) refers to light crude oil trapped in low permeability, low porosity shale,limestone and sandstone formations;
■ oil derived from coal-to-liquids (CTL) technologies and oil derived from gas-to-liquids (GTL)technologies;
■ various technologiesmay be used to convert biomass-to-liquids.
Some experts, however, use a definition based on oil density, or API* gravity. For example, alloils with API gravity below 20°, i.e. density greater than 0.934 grams per cubic centimetre, areconsidered to be unconventional. This includes heavy oils, bitumen and tar deposits. Whilethis classification has the merit of precision, it does not always reflect technologies used forproduction. For example, some oils with 20°API gravity located in deep offshore reservoirs inBrazil are extracted by using entirely conventional techniques.
Other experts focus on the viscosity of the oil. They regard as conventional any oil thatcan flow at reservoir temperature and pressure without recourse to viscosity-reductiontechnology. But such oils may still need special processing at the surface if they are tooviscous to flow at surface conditions.
Another approach, used notably by the United States Geological Survey, is to describe oil orgas according to the geological setting of the reservoir. The hydrocarbon is conventional ifthe reservoir sits above water or water-bearing sediments and if it is relatively localised. Ifneither is the case, the hydrocarbon is unconventional. This type of definition has a soundgeological basis, but does not always connect with the technologies required for production,which are a point of interest in this study.
* API gravity (American Petroleum Institute) is a measure of the density of oil. The API gravity scale is calibrated suchthatmost crudeoils aswell as distillate fuelswill haveAPI gravities between10° and70°API gravity degrees. The lowerthe number, the heavier and themore viscous the oil is.
30 RESOURCES TO RESERVES
Box 1.2 • Unconventional gas
Definitions for “unconventional” are equally imprecise for gas as they are for oil. Generally,the industry classifies as unconventional the gas that is found in unusual types of reservoir.
The IEA divides unconventional gas into four broad categories:
■ tightgas is natural gas trapped in extremely low-permeable and low-porous rock, sandstoneor limestone formations. Such gasmay contain condensates;
■ shalegas is natural gas contained in organic-rich strata dominated by shale. Because of thetypes of reservoir, it is sometimes considered a sub-category of tight gas;
■ coal-bedmethane (CBM) is methane adsorbed on to the surface of coal within coal seams;
■ methane hydrates are made up of methane molecules trapped in a solid lattice of watermolecules under specific conditions of temperature and pressure.
CBM has an unambiguous definition and there is a continuum between conventional andtight reservoirs, without any sharp transition. While stimulation techniques are used inthe production of tight gas and shale gas, they are also frequently used for conventionalreservoirs.
The characteristics of methane hydrates are different from the other three and its potentiallies in a longer-term time horizon.
“Lean gas” and “sour gas” may also be described as unconventional, i.e. gas contained inconventional gas reservoirs, but with a high concentration of impurities (nitrogen and CO2for lean gas, hydrogen sulphide [H2S] for sour gas). The presence of such impurities negativelyimpacts the economics of production.
The definitions of resources and reserves often lend themselves to a degree ofconfusion. Different classification systems have existed in different parts of theworld. The amount of fossil hydrocarbon resources (or hydrocarbons in place) canbe categorised according to the degree of certainty that they exist and, in mostcases, by the likelihood that they can be extracted profitably. Some internationalefforts have been made to harmonise approaches to classifying reserves. A jointpublication of the Society of Petroleum Engineers (SPE), the World PetroleumCouncil, the American Association of Petroleum Geologists (AAPG) and theSociety of Petroleum Evaluation Engineers (SPEE), published in 2007, containedguidelines on the definition and classification of resources, called the PetroleumResources Management System (PRMS).1 This system is compatible with the2004 UN Framework Classification for Fossil Energy and Mineral Resources(UNFC), developed by the UN Economic Commission for Europe (UNECE). ThePRMS classifies resources and reserves according to the level of certainty aboutrecoverable volumes and the likelihood that they can be exploited profitably. Theclassification applies to both conventional and unconventional resources.
1. www.spe.org/spe-app/spe/industry/reserves/prms.htm
CHAPTER 1 • SETTING THE SCENE 31
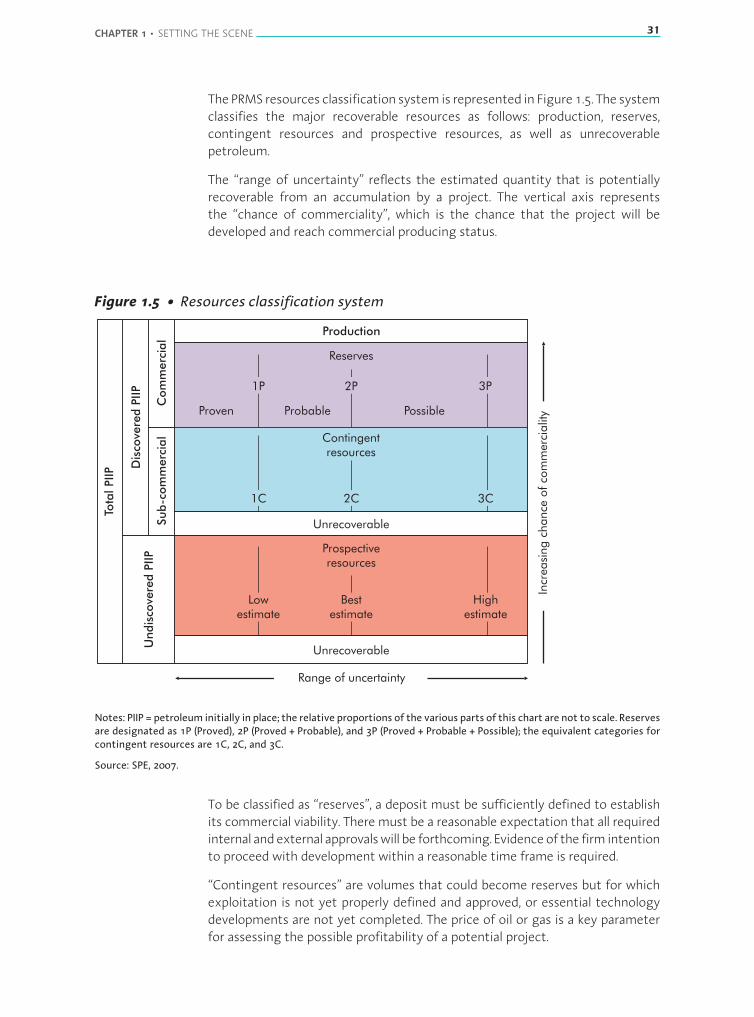
ThePRMS resources classification system is represented in Figure1.5. The systemclassifies the major recoverable resources as follows: production, reserves,contingent resources and prospective resources, as well as unrecoverablepetroleum.
The “range of uncertainty” reflects the estimated quantity that is potentiallyrecoverable from an accumulation by a project. The vertical axis representsthe “chance of commerciality”, which is the chance that the project will bedeveloped and reach commercial producing status.
Figure 1.5 • Resources classification system
Contingentresources
Prospectiveresources
Proven Probable Possible
Unrecoverable
Unrecoverable
Production
Tota
lPIIP D
isco
vere
dPIIP
Com
merc
ial
Sub-c
om
merc
ial
Undis
cove
red
PIIP
Incr
easi
ng
chance
ofco
mm
erc
ialit
y
Reserves
1P 2P 3P
Lowestimate
Bestestimate
Highestimate
Range of uncertainty
2C 3C1C
Notes: PIIP = petroleum initially in place; the relative proportions of the various parts of this chart are not to scale. Reservesare designated as 1P (Proved), 2P (Proved + Probable), and 3P (Proved + Probable + Possible); the equivalent categories forcontingent resources are 1C, 2C, and 3C.
Source: SPE, 2007.
To be classified as “reserves”, a deposit must be sufficiently defined to establishits commercial viability. Theremust be a reasonable expectation that all requiredinternal andexternal approvalswill be forthcoming. Evidenceof the firm intentionto proceed with development within a reasonable time frame is required.
“Contingent resources” are volumes that could become reserves but for whichexploitation is not yet properly defined and approved, or essential technologydevelopments are not yet completed. The price of oil or gas is a key parameterfor assessing the possible profitability of a potential project.
32 RESOURCES TO RESERVES
The US Securities and Exchange Commission (SEC), which imposes standardsfor reporting oil and natural gas reserves for companies quoted on US stockexchanges, adopted revisions to its rules (Box 1.3).
Box 1.3 • New SEC reporting rules for reserves
The revisions aligned and incorporated many of the definitions in the SPE PRMS (SEC, 2008).The revised rules came into effect on 1 January 2010.
While significant changes have taken place in the oil and gas industry since the originalreporting requirements were adopted more than 25 years ago, the SEC proposal now allowsfor the following:
■ The use of new technologies to determine which reserves may be classified as proven, ifthose technologieshavebeendemonstrated empirically to lead to reliable conclusionsaboutvolumes of the reserves.
■ Companies to disclose their probable and possible reserves to investors. Previous ruleslimited disclosure to proven reserves only.
■ Previously excluded resources, such as mineable oil-sands, to be classified as oil and gasreserves. Previously these resources were considered to bemining reserves.
The IEA uses a related set of definitions:
■ Reserves. They are generally defined as the portion of energy resources that canbe recovered economically by using current technologies and forwhich a projecthas been defined. The amount of reserves depends on two factors that arekey to defining a project: current hydrocarbon price and available technology.Reserves are further categorised as proven, probable or possible, depending onthe degree of certainty. For many years, the SEC only allowed the disclosure ofproven reserves (Box 1.3). However, new rules came into effect at the beginningof 2010 that give more credit to better information provided by technologicaldevelopments. Note that many operating companies already report provenreserves below the mean expected value (i.e. proven + probable, or 2P). ThePRMS promotes consistent reporting, including reports of SEC reserves as wellas reports from companies not listed on the US stock exchange, which is themajority of companies with resources.
Estimatesof reserves ineachcategorycanchangeas theunderlyingassumptionsaremodified or new information becomes available. For example, as the oil pricerises, some resources that were previously classified as non-commercial maybecome profitable and could bemoved into the possible, probable or proven (3P)reserves category upon definition of a suitable project.
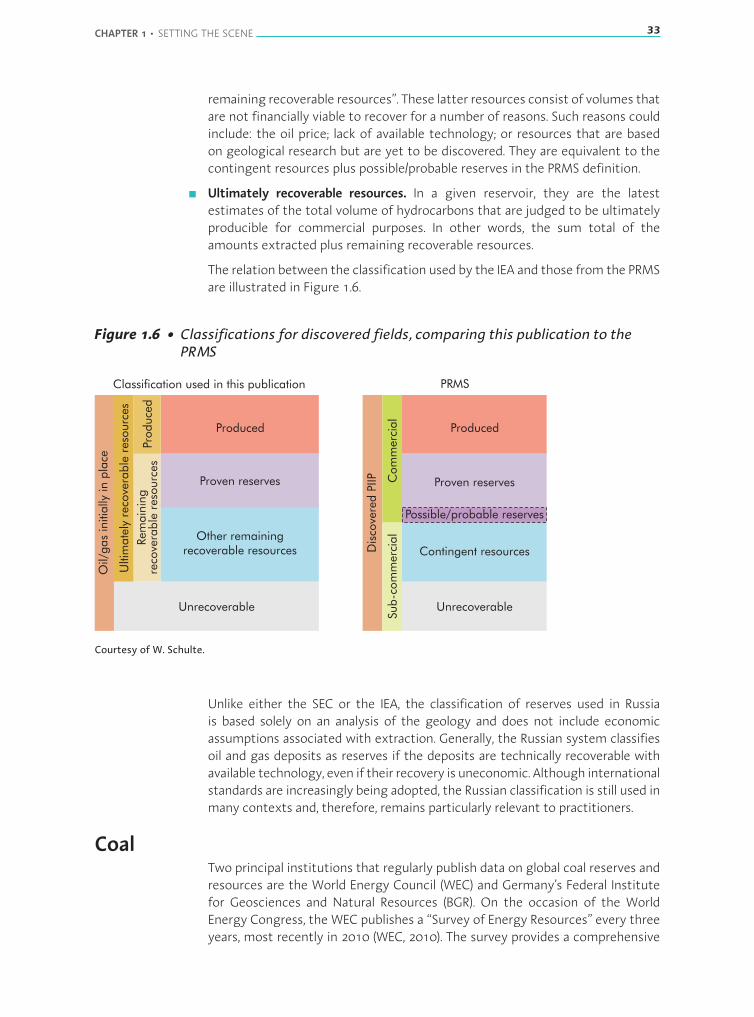
■ Remaining recoverable resources. Refers to the volume of remaininghydrocarbons that could still be produced. The part of remaining recoverableresources beyond volumes already identified as reserves are referred to as “other
CHAPTER 1 • SETTING THE SCENE 33
remaining recoverable resources”. These latter resources consist of volumes thatare not financially viable to recover for a number of reasons. Such reasons couldinclude: the oil price; lack of available technology; or resources that are basedon geological research but are yet to be discovered. They are equivalent to thecontingent resources plus possible/probable reserves in the PRMS definition.
■ Ultimately recoverable resources. In a given reservoir, they are the latestestimates of the total volume of hydrocarbons that are judged to be ultimatelyproducible for commercial purposes. In other words, the sum total of theamounts extracted plus remaining recoverable resources.
The relation between the classification used by the IEA and those from the PRMSare illustrated in Figure 1.6.
Figure 1.6 • Classifications for discovered fields, comparing this publication to thePRMS
Classification used in this publication PRMS
Produced
Produce
d
Produced
Other remainingrecoverable resources
Rem
ain
ing
reco
vera
ble
reso
urc
es
Ultim
ate
lyre
cove
rable
reso
urc
es
Contingent resources
Proven reserves
Possible/probable reserves
Oil/
gas
initia
llyin
pla
ce
Dis
cove
red
PIIP
Sub
-com
merc
ial
Com
merc
ial
Proven reserves
Unrecoverable Unrecoverable
Courtesy of W. Schulte.
Unlike either the SEC or the IEA, the classification of reserves used in Russiais based solely on an analysis of the geology and does not include economicassumptions associated with extraction. Generally, the Russian system classifiesoil and gas deposits as reserves if the deposits are technically recoverable withavailable technology, even if their recovery is uneconomic. Although internationalstandards are increasingly being adopted, the Russian classification is still used inmany contexts and, therefore, remains particularly relevant to practitioners.
CoalTwo principal institutions that regularly publish data on global coal reserves andresources are the World Energy Council (WEC) and Germany’s Federal Institutefor Geosciences and Natural Resources (BGR). On the occasion of the WorldEnergy Congress, the WEC publishes a “Survey of Energy Resources” every threeyears, most recently in 2010 (WEC, 2010). The survey provides a comprehensive

34 RESOURCES TO RESERVES
examination of energy resources, covering production, consumption as well asquantities available. The WEC obtains most of its data from its members. BGRpublishes annual studies on reserves, resources and the availability of energyraw materials worldwide (BGR, 2011). BGR also maintains country-specific dataon reserves, resources, production and consumption of non-renewable energysources (oil, gas, coal and nuclear fuels).
Other organisations, including the United States Energy InformationAdministration, the IEA, BP and the RWE Group tend to use either WEC or BGRsources as a basis for total hard coal and lignite reserves.
International surveys of global coal reserves and resources collate data byrequesting reserves and resources from various associations, geological services,ministries or coal producers. As almost every country has its own classificationsystem, cross-border comparisons of the quantities of reserves and resourcesare rarely possible.
The BGR classification is often usedwhen classifying coal reserves and resources(Box 1.4). However, there is no internationally recognised anduniformprocedurefor recording, classifying and designating coal deposits. Reasons for the lack ofuniformity are largely historic. In many regions, classification was introducedto provide an overview of potential deposits to inform the mining industry(Fettweis, Kelter and Nöstaller, 1999). In the West, though mining companieswere the major stakeholders, classification was also developed to informinvestors and banks involved in financing mining projects (Akin, 1997). Muchof Eastern Europe was consistent in the particular classification applied there.Attempts have been made over many years to resolve this lack of uniformity.The UNFC launched in 1997, and updated in 1999 during a discussion with theCouncil ofMining andMetallurgical Institutions, has been adopted in importantmining countries such as China (Bucci et al., 2006) and Indonesia (Ersoy, 2003).
Box 1.4 • BGR classification of coal reserves and resources
Coal can be subdivided into soft brown coals (lignite) and hard coals (bituminous andsub-bituminous coals). Hard coals are all coals with a heat content of >16.5 megajoulesper kilogram and are essentially those suitable for world trade. Soft brown coals are thosewith high moisture and lower energy content, which are usually converted into electricity atsource. There are differences in categorising coal, depending on the country, and thereforealso in differentiating between hard coals and lignites.
The following are definitions for coal reserves, resources and total resources, based on theBGR classification:
CHAPTER 1 • SETTING THE SCENE 35
■ Reserves. Refer to the amount of known or proven coal resources that can be recoveredeconomically by using available technology. The reserve figures depend on the price of coalaswell as on technological progress. The following expressions arewidely used as synonymsfor the term reserves: “recoverable reserves” and “proven recoverable reserves”.
■ Resources. Refer to the amount of coal resources in place that are either: i) proven but noteconomically recoverable; or ii) based on geological research but as yet not discovered.
Note that the reserves are not included in the resources. (TheWEC refers to these resources asthe estimated additional amount in place and does not include speculative amounts, leadingto substantially different values.)
■ Total resources. Refer to the sum total of reserves plus resources.
Resources are in situ remaining quantities that take no account of losses due to a lack ofmining technology needed to develop the resources.
Note that the definition of resources for coal is different from the definition of resources foroil and gas, which includes produced volumes and reserves substantiated by using furtherclassifications such as remaining recoverable and ultimately recoverable.
Resources and reserves
Estimates of the global total endowment of economically exploitable fossil fuelsand renewable energy resources indicate that they are more than sufficient tomeet the projected increase in consumption to 2035. There is, however, someuncertainty about whether energy projects will be developed quickly enough tobring these resources to market in a timely manner. Many factors could preventinvestment such as: uncertainty about the economic outlook; developmentsin climate change and other environmental policies; depletion policies in keyproducing regions; changes to legal, fiscal and regulatory regimes; and delays ininfrastructure and shipping capacity.
Oil resources and reservesVarious estimates of remaining economically recoverable reserves of globaloil do not vary greatly, despite differences in the way they are reported.Most estimates of current proven reserves of crude oil amounted to almost1 700 billion barrels (bb) at the end of 2011. Globally, proven reserves haveincreased steadily since 1990, despite increasing demand. One of the majorchanges in recent years has seen Venezuela become the leading country forprovenreserves,havingovertakenSaudiArabia in2010.Followingthemostrecentassessment of its Orinoco belt, Venezuela’s proven oil reserves jumped from99 bb to 291 bb. On a regional level, the largest conventional resources arelocated in the Middle East and Russia (Figure 1.7).
36 RESOURCES TO RESERVES
Given current levels of production, the global reserves-to-production ratio (R/P)2
is currently estimated to be 68 years (based on 2011 estimates). However, thisvalue depends on the source andwhether unconventional resources are included(O&GJ, 2009).
Figure 1.7 • Regional distribution of crude oil resources, reserves andproduction in 2012
This map is without prejudice to the status of or sovereignty over any territory, to the delimitation of international frontiers and boundaries,and to the name of any territory, city or area.
337
800
32448
184
151
305
563
109
133174
35
64
1377
25
104
5087
82
310226254
1706
108
322175
322
Cumulative production end-2011:Proven reserves end-2011:Other remaining recoverable resources - conventional oil:Other - unconventional oil:remaining recoverable resources
1 2141 6941 3962 781
bbbbbbbb
Source: IEA, 2012.
The Middle East holds the largest proven conventional oil reserves and otherremaining recoverable resources, followed by Eurasia and Africa (Figure 1.8).
A closer look at the proven oil reserves (conventional and unconventional) ona country-to-country basis shows that Venezuela overtook Saudi Arabia as thecountry with the largest proven oil reserve, followed by Canada and Iran (Figure1.9). Following the new reserves added in 2011, Venezuela has risen in rankingfrom fourth in 2009 to first place with an R/P ratio beyond 250 years.
2. R/P ratiosarecommonlyused intheoil andgas industryas indicatorsofproductionpotential.However, the ratiosdonot implycontinuous output for a certain number of years, nor that oil production will stop at the end of the period. They can fluctuateover time as new discoveries aremade, reserves at existing fields are reappraised and technology and production rates change.
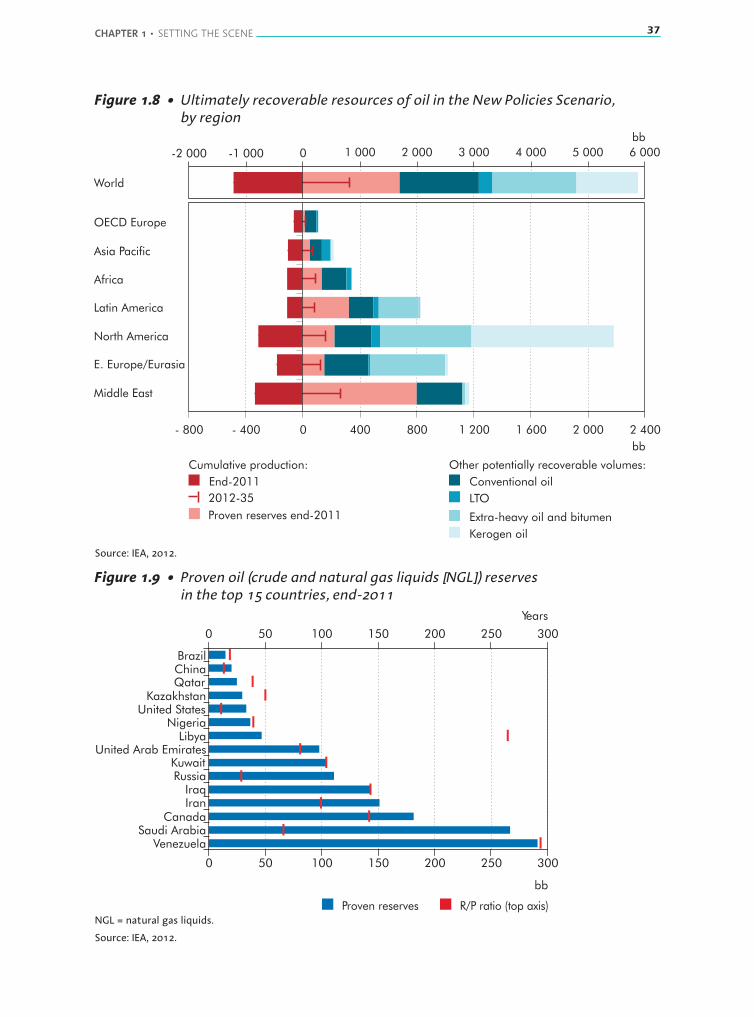
CHAPTER 1 • SETTING THE SCENE 37
Figure 1.8 • Ultimately recoverable resources of oil in the New Policies Scenario,by region
-2 000 -1 000 0 1 000 2 000 3 000 4 000 5 000 6 000
bb
Conventional oil
2012-35
Extra-heavy oil and bitumen
Kerogen oil
Cumulative production:
World
- 800 - 400 0 400 800 1 200 1 600 2 000 2 400
bb
End-2011
Proven reserves end-2011
Other potentially recoverable volumes:
OECD Europe
Asia Pacific
Africa
Latin America
North America
E. Europe/Eurasia
Middle East
LTO
Source: IEA, 2012.
Figure 1.9 • Proven oil (crude and natural gas liquids [NGL]) reservesin the top 15 countries, end-2011
Proven reserves R/P ratio (top axis)
bb
0 50 100 150 200 250 300
0 50 100 150 200 250 300
VenezuelaSaudi Arabia
CanadaIranIraq
RussiaKuwait
United Arab EmiratesLibya
NigeriaUnited States
KazakhstanQatarChinaBrazil
Years
NGL = natural gas liquids.
Source: IEA, 2012.
38 RESOURCES TO RESERVES
The volume of oil discovered every year has been higher, on average, since 2000than in the 1990s, thanks to increased exploration activity and improvementsin technology. However, despite some significant recent finds, such as in deepwater offshore Brazil, the volume of oil in new discoveries has fallen well belowthe volume of oil produced in recent years.
Discoveries dropped from an average of 56 billion barrels per year (bb/yr) in the1960s to 13 bb/yr in the 1990s. The number of discoveries peaked in the 1980s,but fell sharply in the 1990s. This sharp decline was largely the result of lessexploration in regions with the largest reserves where access by internationalcompanies is most difficult. A drop in the average size of discovered fields wasalso a contributing factor. The downward trend in the volume of oil discoveredreversed slightly in 2000-09, thanks to increased exploration activity (withhigher oil prices). Since 2000, an average 14 bb/yr has been discovered.
Conventional oil resources
Ultimately recoverable conventional oil resources are estimated at 3.1 trillionbarrels. This figure includes: initial, proven andprobable reserves fromdiscoveredfields; increases in reserves; and oil that has yet to be found. Until now, onlyone-third of this total, or 1.2 trillion barrels, has been produced. Undiscoveredresources account for about one-third of the remaining recoverable oil, thelargest volumes of which are believed to lie in the Middle East, Russia and theCaspian region.
Unconventional oil resources
Unconventional oil resources, which have been barely developed to date, are alsovery large. It could now be financially viable to recover between 1 trillion barrelsand 1.5 trillion barrels of oil sands and extra-heavy oil. These resources arelargely concentrated in Canada and Venezuela. In Canada, deposits of bitumenamounting to 0.8 trillion barrels of original oil in place have already beendiscovered. In Venezuela, there are about 0.5 trillion barrels of extra-heavyoil in place in the Orinoco belt. Global kerogen shale resources in place areconservatively estimated at 4.8 trillion barrels and currently largely undevelopedowing to the high cost. This resource estimate is conservative in view of thefact that the kerogen shale resources of some countries are not reported andother deposits have not been fully investigated (WEC, 2010). An unconventionalresource in the form of liquid oil, or LTO, that is trapped in low-permeabilityshales can also now be recovered by using current technology. Quantities couldbe considerable when global resource values are estimated. In 2010, estimatesof unproved technically recoverable resources of LTO in the United States alonestood at 33.2 bb (EIA, 2012).
Currently estimated recoverable resources for unconventionaloil are about the same as those for conventional oil (Figure 1.10). Thepotential total of long-term remaining recoverable oil resources, whichincludes: conventional oil volumes plus extra-heavy oil, oil sands, kerogenshale and undiscovered recoverable volumes is estimated to be almost
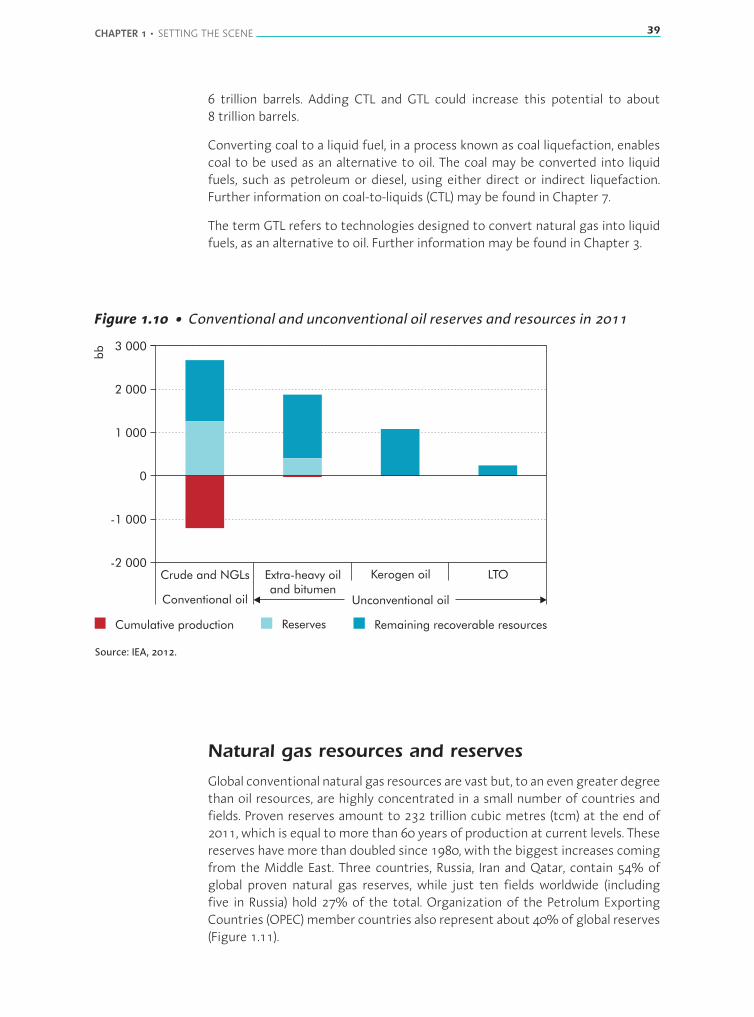
CHAPTER 1 • SETTING THE SCENE 39
6 trillion barrels. Adding CTL and GTL could increase this potential to about8 trillion barrels.
Converting coal to a liquid fuel, in a process known as coal liquefaction, enablescoal to be used as an alternative to oil. The coal may be converted into liquidfuels, such as petroleum or diesel, using either direct or indirect liquefaction.Further information on coal-to-liquids (CTL) may be found in Chapter 7.
The term GTL refers to technologies designed to convert natural gas into liquidfuels, as an alternative to oil. Further information may be found in Chapter 3.
Figure 1.10 • Conventional and unconventional oil reserves and resources in 2011
-2 000
-1 000
0
1 000
2 000
3 000
Crude and NGLs
Conventional oil
Extra-heavy oiland bitumen
Kerogen oil LTO
bb
Cumulative production Remaining recoverable resourcesReserves
Unconventional oil
Source: IEA, 2012.
Natural gas resources and reserves
Global conventional natural gas resources are vast but, to an even greater degreethan oil resources, are highly concentrated in a small number of countries andfields. Proven reserves amount to 232 trillion cubic metres (tcm) at the end of2011, which is equal tomore than 60 years of production at current levels. Thesereserves havemore than doubled since 1980, with the biggest increases comingfrom the Middle East. Three countries, Russia, Iran and Qatar, contain 54% ofglobal proven natural gas reserves, while just ten fields worldwide (includingfive in Russia) hold 27% of the total. Organization of the Petrolum ExportingCountries (OPEC)member countries also represent about 40%of global reserves(Figure 1.11).
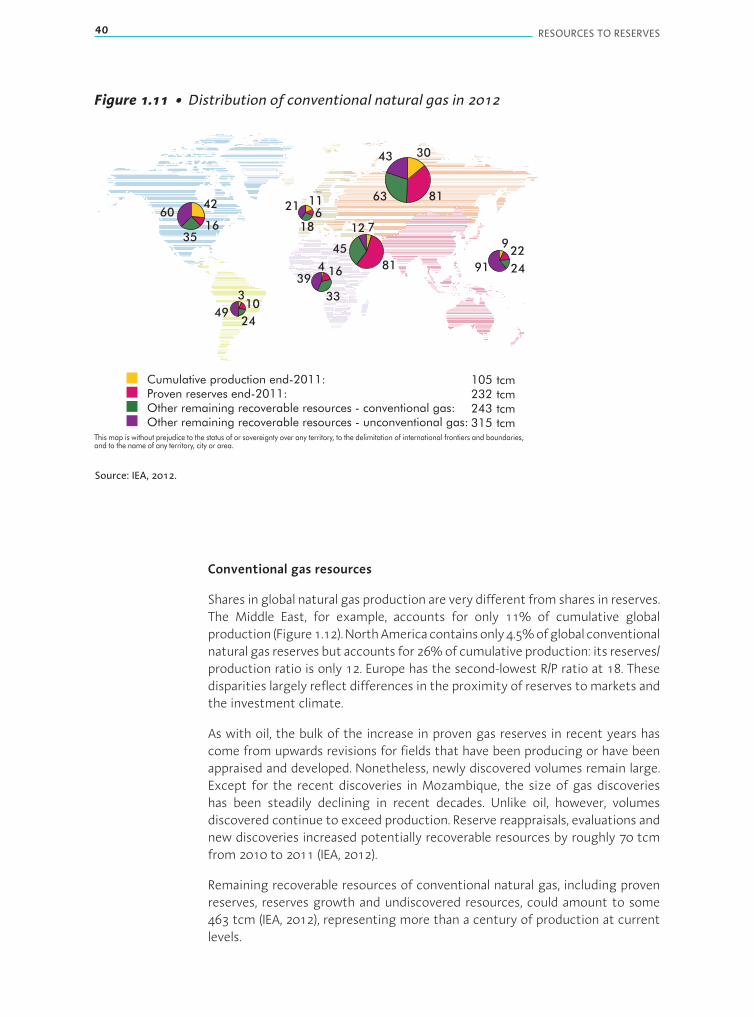
40 RESOURCES TO RESERVES
Figure 1.11 • Distribution of conventional natural gas in 2012
3043
8163
1635
91 24
4260
922
11
186
21
310
4924
62.567514
4 16
33
39
712
81
45
105232243315
tcmtcmtcmtcm
Cumulative production end-2011:Proven reserves end-2011:Other remaining recoverable resources - conventional gas:Other - unconventional gas:remaining recoverable resources
This map is without prejudice to the status of or sovereignty over any territory, to the delimitation of international frontiers and boundaries,and to the name of any territory, city or area.
Source: IEA, 2012.
Conventional gas resources
Shares in global natural gas production are very different from shares in reserves.The Middle East, for example, accounts for only 11% of cumulative globalproduction (Figure1.12).NorthAmericacontainsonly4.5%ofglobalconventionalnatural gas reserves but accounts for 26%of cumulative production: its reserves/production ratio is only 12. Europe has the second-lowest R/P ratio at 18. Thesedisparities largely reflect differences in the proximity of reserves tomarkets andthe investment climate.
As with oil, the bulk of the increase in proven gas reserves in recent years hascome from upwards revisions for fields that have been producing or have beenappraised and developed. Nonetheless, newly discovered volumes remain large.Except for the recent discoveries in Mozambique, the size of gas discoverieshas been steadily declining in recent decades. Unlike oil, however, volumesdiscovered continue to exceed production. Reserve reappraisals, evaluations andnew discoveries increased potentially recoverable resources by roughly 70 tcmfrom 2010 to 2011 (IEA, 2012).
Remaining recoverable resources of conventional natural gas, including provenreserves, reserves growth and undiscovered resources, could amount to some463 tcm (IEA, 2012), representing more than a century of production at currentlevels.
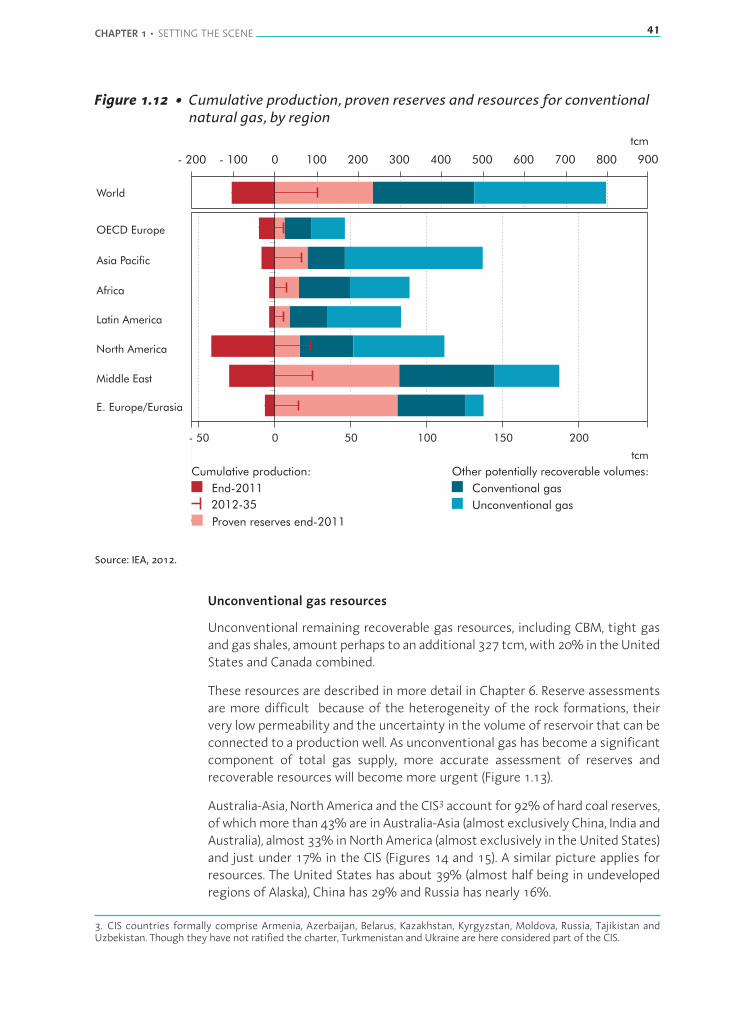
CHAPTER 1 • SETTING THE SCENE 41
Figure 1.12 • Cumulative production, proven reserves and resources for conventionalnatural gas, by region
Conventional gas
2012-35 Unconventional gas
Cumulative production:
End-2011
Proven reserves end-2011
Other potentially recoverable volumes:
- 50 0 50 100 150 200
tcm
E. Europe/Eurasia
Middle East
North America
Latin America
Africa
Asia Pacific
World
OECD Europe
- 200 - 100 0 100 200 300 400 500 600 700 800 900
tcm
Source: IEA, 2012.
Unconventional gas resources
Unconventional remaining recoverable gas resources, including CBM, tight gasandgas shales, amount perhaps to an additional 327 tcm,with 20% in theUnitedStates and Canada combined.
These resources are described in more detail in Chapter 6. Reserve assessmentsare more difficult because of the heterogeneity of the rock formations, theirvery low permeability and the uncertainty in the volume of reservoir that can beconnected to a production well. As unconventional gas has become a significantcomponent of total gas supply, more accurate assessment of reserves andrecoverable resources will becomemore urgent (Figure 1.13).
Australia-Asia, North America and the CIS3 account for 92%of hard coal reserves,of whichmore than 43%are in Australia-Asia (almost exclusively China, India andAustralia), almost 33% inNorth America (almost exclusively in theUnited States)and just under 17% in the CIS (Figures 14 and 15). A similar picture applies forresources. The United States has about 39% (almost half being in undevelopedregions of Alaska), China has 29% and Russia has nearly 16%.
3. CIS countries formally comprise Armenia, Azerbaijan, Belarus, Kazakhstan, Kyrgyzstan, Moldova, Russia, Tajikistan andUzbekistan. Though they have not ratified the charter, Turkmenistan and Ukraine are here considered part of the CIS.
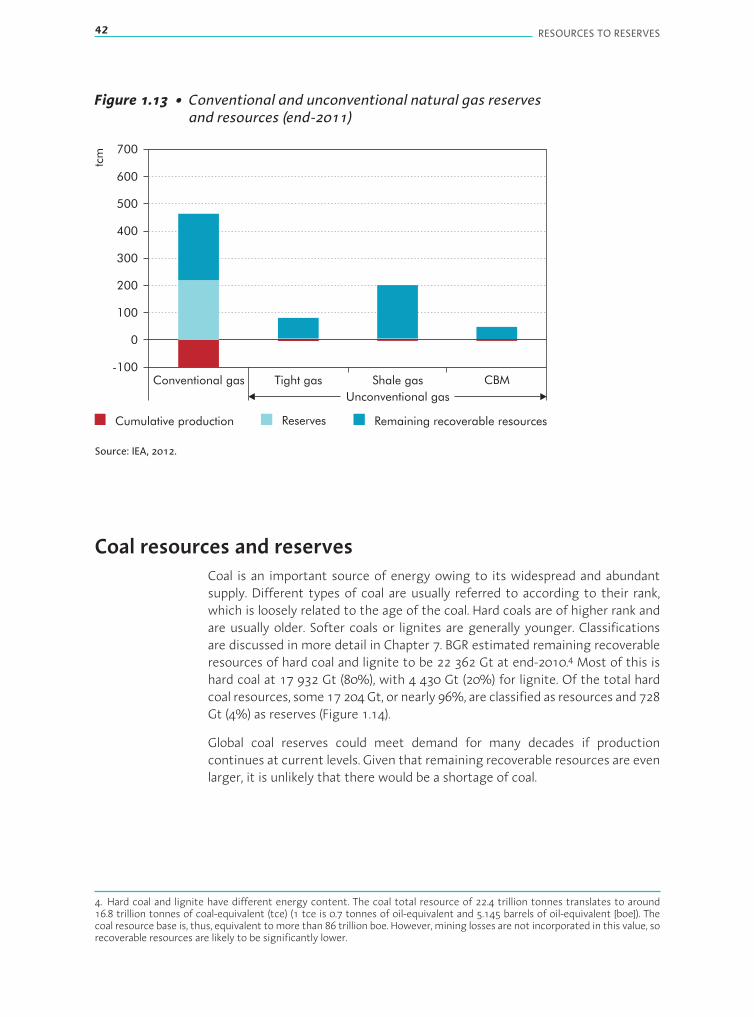
42 RESOURCES TO RESERVES
Figure 1.13 • Conventional and unconventional natural gas reservesand resources (end-2011)
-100
0
100
200
300
400
500
600
700
Conventional gas Tight gas
Unconventional gas
Shale gas CBM
tcm
Cumulative production Remaining recoverable resourcesReserves
Source: IEA, 2012.
Coal resources and reservesCoal is an important source of energy owing to its widespread and abundantsupply. Different types of coal are usually referred to according to their rank,which is loosely related to the age of the coal. Hard coals are of higher rank andare usually older. Softer coals or lignites are generally younger. Classificationsare discussed in more detail in Chapter 7. BGR estimated remaining recoverableresources of hard coal and lignite to be 22 362 Gt at end-2010.4 Most of this ishard coal at 17 932 Gt (80%), with 4 430 Gt (20%) for lignite. Of the total hardcoal resources, some 17 204Gt, or nearly 96%, are classified as resources and 728Gt (4%) as reserves (Figure 1.14).
Global coal reserves could meet demand for many decades if productioncontinues at current levels. Given that remaining recoverable resources are evenlarger, it is unlikely that there would be a shortage of coal.
4. Hard coal and lignite have different energy content. The coal total resource of 22.4 trillion tonnes translates to around16.8 trillion tonnes of coal-equivalent (tce) (1 tce is 0.7 tonnes of oil-equivalent and 5.145 barrels of oil-equivalent [boe]). Thecoal resource base is, thus, equivalent tomore than 86 trillion boe. However, mining losses are not incorporated in this value, sorecoverable resources are likely to be significantly lower.
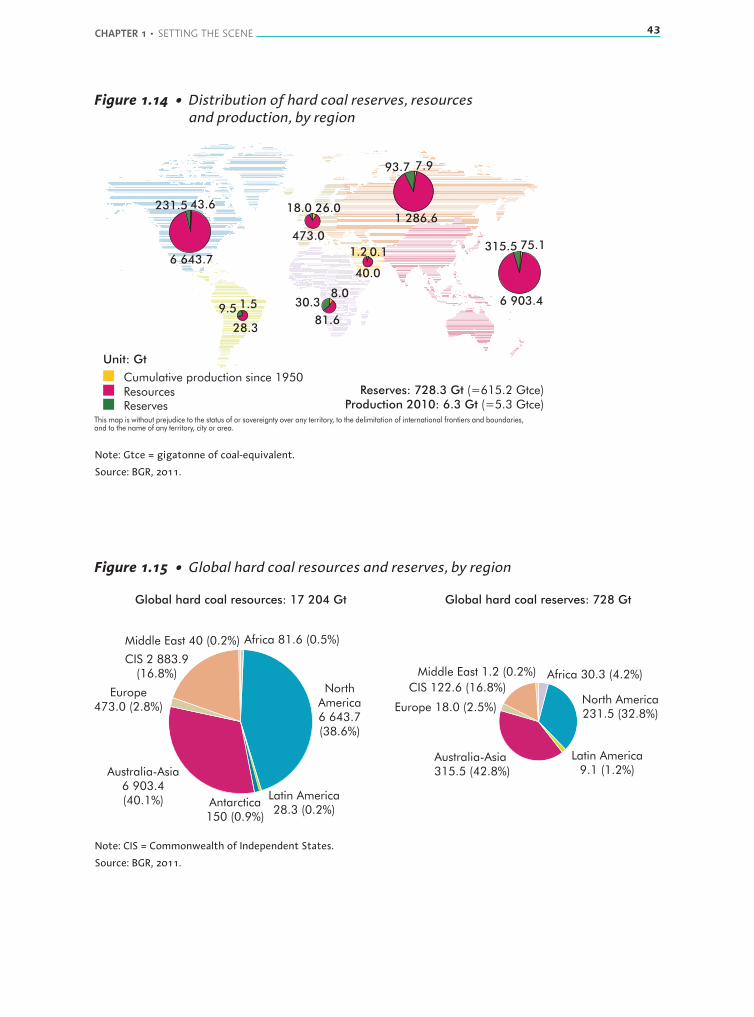
CHAPTER 1 • SETTING THE SCENE 43
Figure 1.14 • Distribution of hard coal reserves, resourcesand production, by region
(=615.2 Gtce)Reserves: 728.3 GtProduction 2010: 6.3 Gt (=5.3 Gtce)
7.9
75.1
93.7
315.5
1 286.6
6 903.4
Cumulative production since 1950ResourcesReserves
Unit: Gt
6 643.7
43.6231.5
1.5
28.3
9.5
473.0
81.6
40.0
26.0
8.0
0.1
18.0
30.3
1.2
This map is without prejudice to the status of or sovereignty over any territory, to the delimitation of international frontiers and boundaries,and to the name of any territory, city or area.
Note: Gtce = gigatonne of coal-equivalent.
Source: BGR, 2011.
Figure 1.15 • Global hard coal resources and reserves, by region
Latin America28.3 (0.2%)
Latin America9.1 (1.2%)
Antarctica150 (0.9%)
CIS 122.6 (16.8%)
CIS 2 883.9(16.8%)
Europe473.0 (2.8%) Europe 18.0 (2.5%)
Australia-Asia6 903.4(40.1%)
Australia-Asia315.5 (42.8%)
NorthAmerica6 643.7(38.6%)
North America231.5 (32.8%)
Africa 81.6 (0.5%)
Africa 30.3 (4.2%)
Middle East 40 (0.2%)
Middle East 1.2 (0.2%)
Global hard coal resources: 17 204 Gt Global hard coal reserves: 728 Gt
Note: CIS = Commonwealth of Independent States.
Source: BGR, 2011.
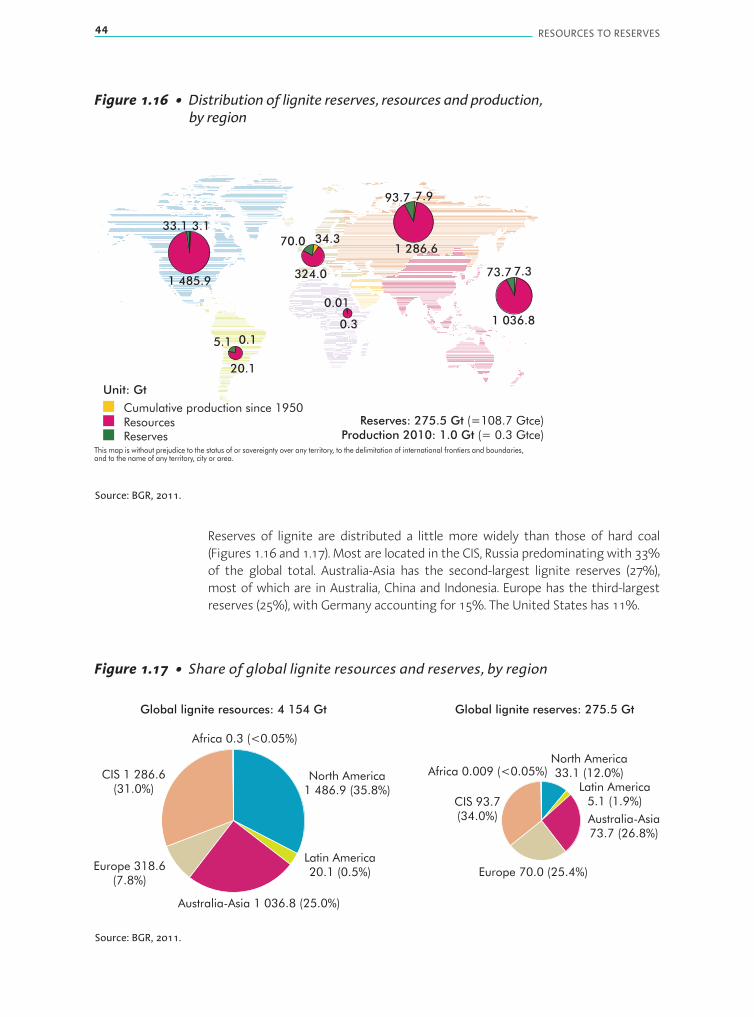
44 RESOURCES TO RESERVES
Figure 1.16 • Distribution of lignite reserves, resources and production,by region
(=108.7 Gtce)Reserves: 275.5 GtProduction 2010: 1.0 Gt (= 0.3 Gtce)
0.1
1 485.9324.0
3.134.3
7.9
7.3
93.7
73.7
0.01
1 286.6
1 036.80.3
33.1
70.0
Cumulative production since 1950ResourcesReserves
Unit: Gt
20.1
5.1
This map is without prejudice to the status of or sovereignty over any territory, to the delimitation of international frontiers and boundaries,and to the name of any territory, city or area.
Source: BGR, 2011.
Reserves of lignite are distributed a little more widely than those of hard coal(Figures 1.16 and 1.17). Most are located in the CIS, Russia predominatingwith 33%of the global total. Australia-Asia has the second-largest lignite reserves (27%),most of which are in Australia, China and Indonesia. Europe has the third-largestreserves (25%), with Germany accounting for 15%. The United States has 11%.
Figure 1.17 • Share of global lignite resources and reserves, by region
Latin America20.1 (0.5%)
Latin America5.1 (1.9%)CIS 93.7
(34.0%)
Europe 318.6(7.8%)
Europe 70.0 (25.4%)
Australia-Asia 1 036.8 (25.0%)
Australia-Asia73.7 (26.8%)
North America1 486.9 (35.8%)
North America33.1 (12.0%)
Africa 0.3 (<0.05%)
Africa 0.009 (<0.05%)
Global lignite resources: 4 154 Gt Global lignite reserves: 275.5 Gt
CIS 1 286.6(31.0%)
Source: BGR, 2011.
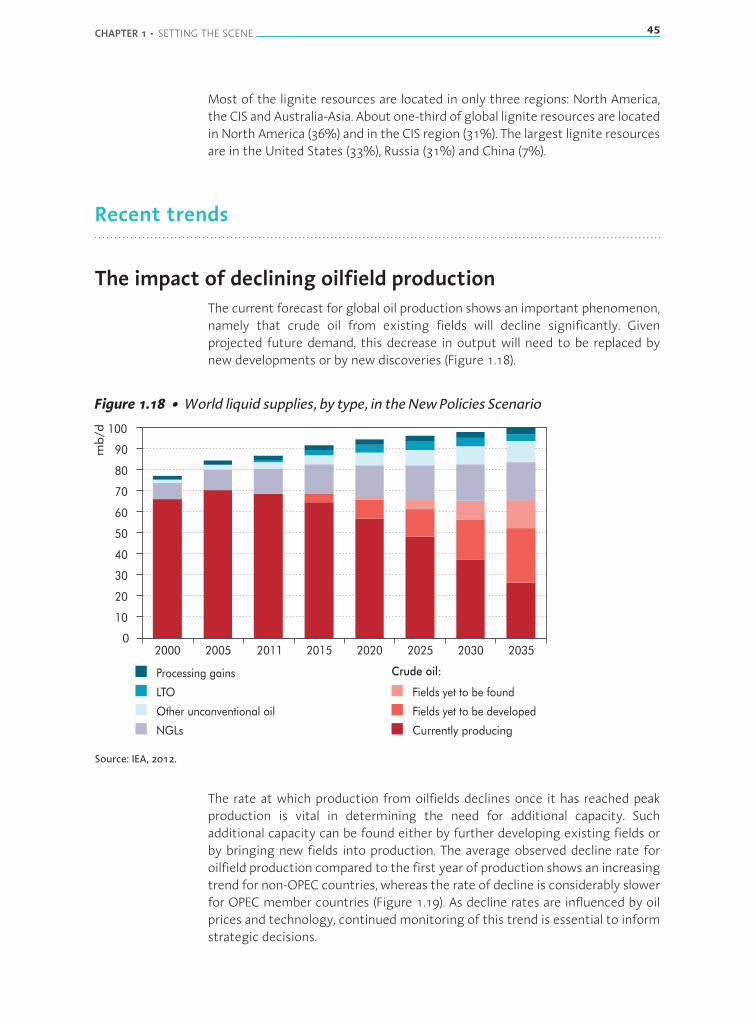
CHAPTER 1 • SETTING THE SCENE 45
Most of the lignite resources are located in only three regions: North America,the CIS and Australia-Asia. About one-third of global lignite resources are locatedin North America (36%) and in the CIS region (31%). The largest lignite resourcesare in the United States (33%), Russia (31%) and China (7%).
Recent trends
The impact of declining oilfield productionThe current forecast for global oil production shows an important phenomenon,namely that crude oil from existing fields will decline significantly. Givenprojected future demand, this decrease in output will need to be replaced bynew developments or by new discoveries (Figure 1.18).
Figure1.18 • World liquid supplies, by type, in theNew Policies Scenario
0
Currently producing
10
20
30
40
50
60
70
80
90
100
2000 2005 2011 2015 2020 2025 2030 2035
mb/d
Processing gains
LTO
Other unconventional oil
NGLs
Fields yet to be found
Fields yet to be developed
Crude oil:
Source: IEA, 2012.
The rate at which production from oilfields declines once it has reached peakproduction is vital in determining the need for additional capacity. Suchadditional capacity can be found either by further developing existing fields orby bringing new fields into production. The average observed decline rate foroilfield production compared to the first year of production shows an increasingtrend for non-OPEC countries, whereas the rate of decline is considerably slowerfor OPEC member countries (Figure 1.19). As decline rates are influenced by oilprices and technology, continuedmonitoring of this trend is essential to informstrategic decisions.
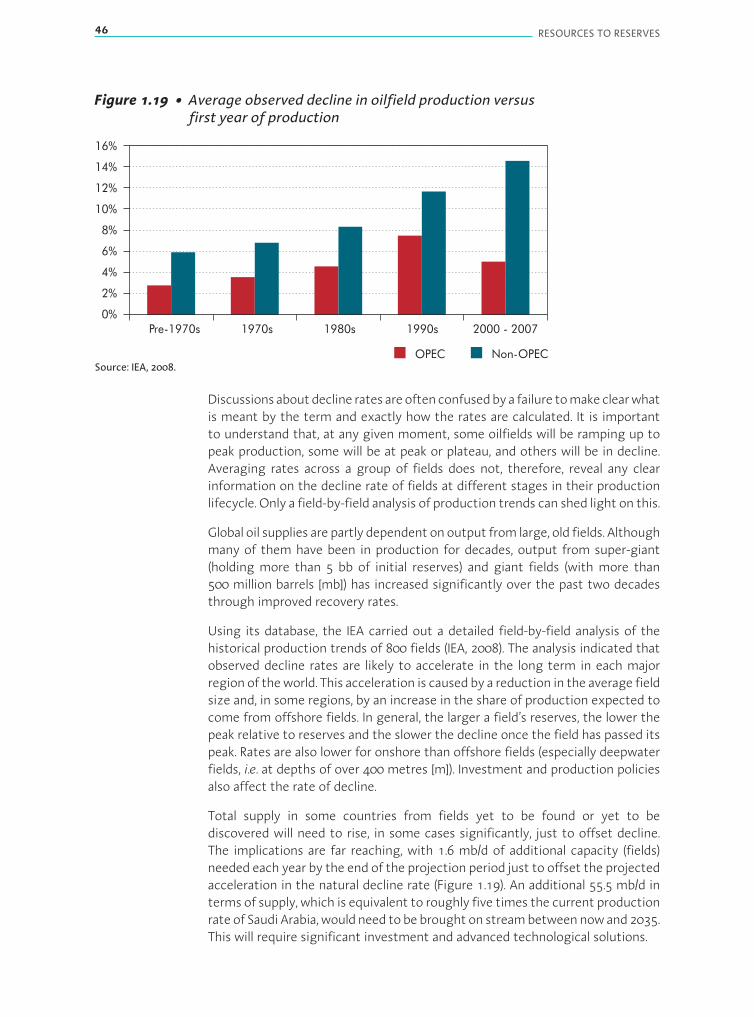
46 RESOURCES TO RESERVES
Figure 1.19 • Average observed decline in oilfield production versusfirst year of production
16%
14%
12%
10%
8%
6%
4%
2%
0%Pre-1970s 1970s 1980s 1990s 2000 - 2007
OPEC Non-OPECSource: IEA, 2008.
Discussionsaboutdecline ratesareoftenconfusedbya failure tomakeclearwhatis meant by the term and exactly how the rates are calculated. It is importantto understand that, at any given moment, some oilfields will be ramping up topeak production, some will be at peak or plateau, and others will be in decline.Averaging rates across a group of fields does not, therefore, reveal any clearinformation on the decline rate of fields at different stages in their productionlifecycle. Only a field-by-field analysis of production trends can shed light on this.
Global oil supplies are partly dependentonoutput from large, old fields. Althoughmany of them have been in production for decades, output from super-giant(holding more than 5 bb of initial reserves) and giant fields (with more than500 million barrels [mb]) has increased significantly over the past two decadesthrough improved recovery rates.
Using its database, the IEA carried out a detailed field-by-field analysis of thehistorical production trends of 800 fields (IEA, 2008). The analysis indicated thatobserved decline rates are likely to accelerate in the long term in each majorregionof theworld. This acceleration is causedby a reduction in the average fieldsize and, in some regions, by an increase in the share of production expected tocome from offshore fields. In general, the larger a field’s reserves, the lower thepeak relative to reserves and the slower the decline once the field has passed itspeak. Rates are also lower for onshore than offshore fields (especially deepwaterfields, i.e. at depths of over 400 metres [m]). Investment and production policiesalso affect the rate of decline.
Total supply in some countries from fields yet to be found or yet to bediscovered will need to rise, in some cases significantly, just to offset decline.The implications are far reaching, with 1.6 mb/d of additional capacity (fields)needed each year by the end of the projection period just to offset the projectedacceleration in the natural decline rate (Figure 1.19). An additional 55.5 mb/d interms of supply, which is equivalent to roughly five times the current productionrateof Saudi Arabia,wouldneed tobebroughton streambetweennowand2035.This will require significant investment and advanced technological solutions.
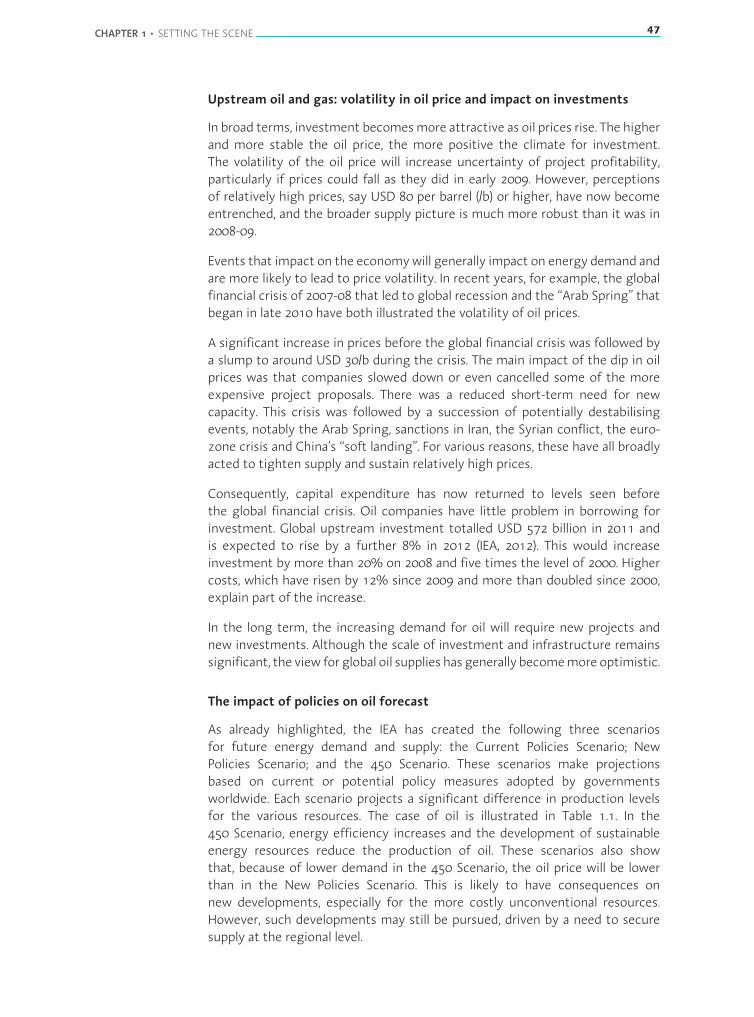
CHAPTER 1 • SETTING THE SCENE 47
Upstream oil and gas: volatility in oil price and impact on investments
In broad terms, investment becomesmore attractive as oil prices rise. The higherand more stable the oil price, the more positive the climate for investment.The volatility of the oil price will increase uncertainty of project profitability,particularly if prices could fall as they did in early 2009. However, perceptionsof relatively high prices, say USD 80 per barrel (/b) or higher, have now becomeentrenched, and the broader supply picture is much more robust than it was in2008-09.
Events that impact on the economywill generally impact on energy demand andare more likely to lead to price volatility. In recent years, for example, the globalfinancial crisis of 2007-08 that led to global recession and the “Arab Spring” thatbegan in late 2010 have both illustrated the volatility of oil prices.
A significant increase in prices before the global financial crisis was followed bya slump to around USD 30/b during the crisis. The main impact of the dip in oilprices was that companies slowed down or even cancelled some of the moreexpensive project proposals. There was a reduced short-term need for newcapacity. This crisis was followed by a succession of potentially destabilisingevents, notably the Arab Spring, sanctions in Iran, the Syrian conflict, the euro-zone crisis and China’s “soft landing”. For various reasons, these have all broadlyacted to tighten supply and sustain relatively high prices.
Consequently, capital expenditure has now returned to levels seen beforethe global financial crisis. Oil companies have little problem in borrowing forinvestment. Global upstream investment totalled USD 572 billion in 2011 andis expected to rise by a further 8% in 2012 (IEA, 2012). This would increaseinvestment by more than 20% on 2008 and five times the level of 2000. Highercosts, which have risen by 12% since 2009 and more than doubled since 2000,explain part of the increase.
In the long term, the increasing demand for oil will require new projects andnew investments. Although the scale of investment and infrastructure remainssignificant, the view for global oil supplies hasgenerally becomemoreoptimistic.
The impact of policies on oil forecast
As already highlighted, the IEA has created the following three scenariosfor future energy demand and supply: the Current Policies Scenario; NewPolicies Scenario; and the 450 Scenario. These scenarios make projectionsbased on current or potential policy measures adopted by governmentsworldwide. Each scenario projects a significant difference in production levelsfor the various resources. The case of oil is illustrated in Table 1.1. In the450 Scenario, energy efficiency increases and the development of sustainableenergy resources reduce the production of oil. These scenarios also showthat, because of lower demand in the 450 Scenario, the oil price will be lowerthan in the New Policies Scenario. This is likely to have consequences onnew developments, especially for the more costly unconventional resources.However, such developments may still be pursued, driven by a need to securesupply at the regional level.

48 RESOURCES TO RESERVES
Table 1.1 • Production overview, by resource type (mb/d)
Resource 2011 2035
New PoliciesScenario
Current PoliciesScenario
450 Scenario
Crude oil 68.5 65.4 70.8 51.5
NGLs 12 18.2 19.5 14.4
Unconventional 3.9 13.2 15 10.8
Biofuels 1.3 4.5 3.7 8.2
Processing gains 2.1 2.9 3.2 2.3
World total liquids supply 87.9 104.2 112.2 87.2
Note: biofuels are expressed as energy-equivalent volumes of gasoline and diesel.
Source: IEA, 2012.
Though demand-side policies are important, it is worth noting again that theupstream investment environment and its perceived stability are probably themore important determinants influencing long-term oil supply.
Growth of coal consumption in China
China’s dominant role in both the production and consumption of coal givesrise to some remarkable statistics. The period of sustained economic growth,particularly since its accession to theWorld TradeOrganization (WTO), has led toa rapid increase in energy demand, an increase that has until now been satisfiedlargely by coal (Figure 1.20).
Figure 1.20 • Annual coal production, by region
United States OECD Europe People's Republic of China
Mt
0
500
1 000
1 500
2 000
2 500
3 000
3 500
4 000
1971 1975 1979 1983 1987 1991 1995 1999 2003 2007 2011
Note: Mt = million tonnes.
Source: IEA statistics.
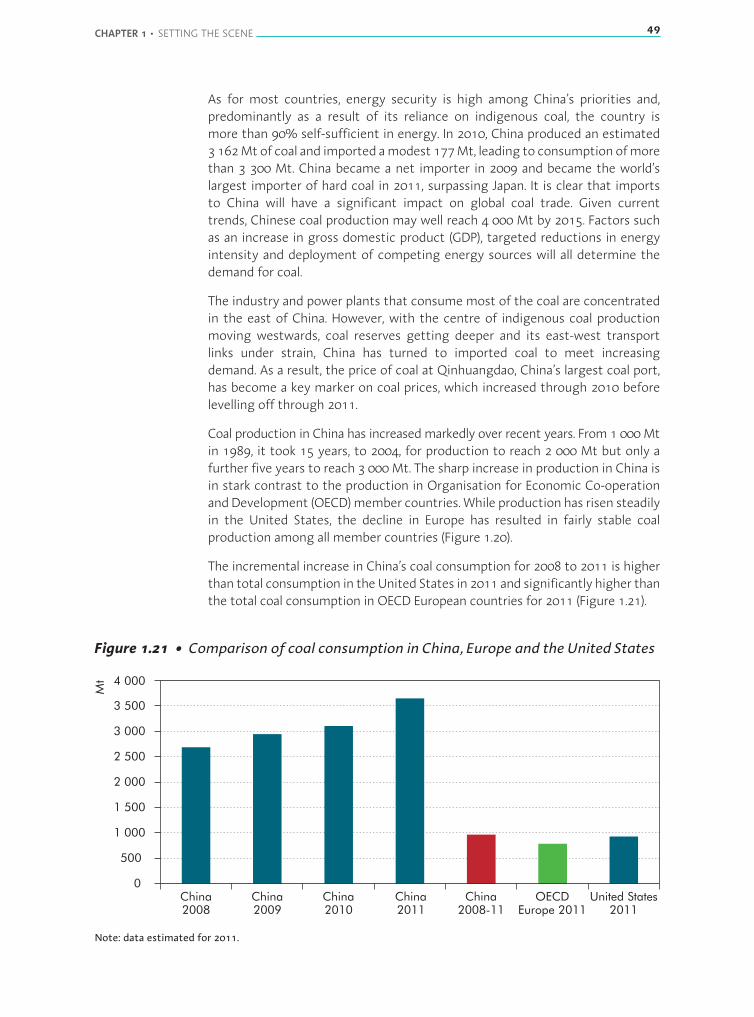
CHAPTER 1 • SETTING THE SCENE 49
As for most countries, energy security is high among China’s priorities and,predominantly as a result of its reliance on indigenous coal, the country ismore than 90% self-sufficient in energy. In 2010, China produced an estimated3 162Mtof coal and imported amodest 177Mt, leading to consumption ofmorethan 3 300 Mt. China became a net importer in 2009 and became the world’slargest importer of hard coal in 2011, surpassing Japan. It is clear that importsto China will have a significant impact on global coal trade. Given currenttrends, Chinese coal production may well reach 4 000 Mt by 2015. Factors suchas an increase in gross domestic product (GDP), targeted reductions in energyintensity and deployment of competing energy sources will all determine thedemand for coal.
The industry and power plants that consumemost of the coal are concentratedin the east of China. However, with the centre of indigenous coal productionmoving westwards, coal reserves getting deeper and its east-west transportlinks under strain, China has turned to imported coal to meet increasingdemand. As a result, the price of coal at Qinhuangdao, China’s largest coal port,has become a key marker on coal prices, which increased through 2010 beforelevelling off through 2011.
Coal production in China has increasedmarkedly over recent years. From 1 000Mtin 1989, it took 15 years, to 2004, for production to reach 2 000 Mt but only afurther five years to reach 3 000Mt. The sharp increase in production in China isin stark contrast to the production in Organisation for Economic Co-operationandDevelopment (OECD)member countries.While production has risen steadilyin the United States, the decline in Europe has resulted in fairly stable coalproduction among all member countries (Figure 1.20).
The incremental increase in China’s coal consumption for 2008 to 2011 is higherthan total consumption in theUnited States in 2011 and significantly higher thanthe total coal consumption in OECD European countries for 2011 (Figure 1.21).
Figure 1.21 • Comparison of coal consumption in China, Europe and the United States
0
500
1 000
1 500
2 000
2 500
3 000
3 500
4 000
China2008
China2009
China2010
China2011
China2008-11
OECDEurope 2011
United States2011
Mt
Note: data estimated for 2011.

50 RESOURCES TO RESERVES
The need to manage water production
Although the key focus of this book is the production of fossil fuels, wateris an inextricable part of the hydrocarbon recovery process, particularly inoil production operations. Some water is present naturally in the well andis displaced together with the oil. Though this water can be separated andreinjected, more water is required to sufficiently maintain well pressure. Water,either drawn from an aquifer or some other source, is often injected to push theoil towards the producing well.
As more and more water is injected, the percentage of water5 in the wellincreases while the percentage of petroleum product declines. Oil wells areoften only abandoned when the water content is above 98% of the wellstream.Global water production in 2007 was quoted to be around 250 mb/d comparedwith around 80 mb/d of oil, a water-to-oil ratio of around 3:1 (Dal Ferro andSmith, 2007). This situation will worsen as conventional oil reservoirs mature.The United States, a mature oil producer, produces on average around 8 barrelsof water for each barrel of oil (Clark and Veil, 2009).
The water produced is then either discharged or treated so that it can bereinjected. In offshore production, the water produced is mostly discharged inthe sea after proper treatment. In onshore production, the protection of potablewater supplies is a major issue. Most of the discharged water must be treatedbecause of contamination with traces of oil, heavy metals, boron and corrosivefluids such as H2S, CO2 and salt. Water treatment costs can be a substantial partof the total operating costs. Lack of adequate water discharge options can be a“show-stopper” for economic expansionof aproject. However, thegreatest valuecan come from reservoir management techniques that reduce produced waterwhile maximising incremental oil recovery. Reducing water use is one of the keydrivers for a substantial increase in smart field applications (see Chapter 2), inwhich measurement and control systems within the well (downhole) can shutoff water if needed.
Water also plays a major role in unconventional oil and gas resources. Heavy oilis mostly developed through steam injection, requiring large amounts of cleanwater. The mining of oil-sands requires more barrels of water in its separationprocess than is producedasoil. In tightgas and shalegasproduction, the creationof fractures requires substantial amounts of water, oftenwith additives to assistthe fracturing process. Not all of this water is discharged with the gas duringthe production process, but those volumes that are will require special attentionfor disposal or reuse. In CBM operations, large volumes of water are initiallyextracted to reduce pressure in the reservoir, which promotes desorption ofthe methane. Water production subsequently tails off and methane productionincreases.
Water needs for fossil fuel production vary widely across all fuels, but overall gasextraction is less water-consuming than coal and oil (Figure 1.22).
5. Water discharged from a producing oil well is termed “produced” water.

CHAPTER 1 • SETTING THE SCENE 51
Figure 1.22 • Water use for primary energy production
101
Refined oil (EOR)***
Coal-to-liquids
Gas-to-liquids
Refined oil (oil sands)**
Refined oil (conventional)*
Shale gas
Coal
Conventional gas
litres per toe
<1
Withdrawals Consumption
102
103
104
105
*The minimum is for primary recovery, the maximum is for secondary recovery. **The minimum is for in situ production,themaximum is for surfacemining. ***IncludesCO2 injection, steam injection and alkaline injection, and in situ combustion.Ranges shown are for “source-to-carrier” primary energy production, which includes withdrawals and consumption forextraction, processing and transport.
Note: toe = tonnes of oil-equivalent.
Source: IEA, 2012.
Recent developments in technology
Innovations in oil and gas exploration and productionOver the past decade, a few key developments have had a considerable impacton the availability and development costs of oil and gas. Advances in computingpower have led to a number of important developments. Four-dimensionalseismic techniques have vastly improved the subsurface imaging that isrequired for effective reservoir management. Reservoir simulation models cannow accommodate much more detailed geological data and contain complexproduction facilities, information essential to increasing their predictive power.Higher bandwidth communication, with real-time monitoring of drilling andproduction operations, has immensely improved field management.
Directional drilling, initially developed in the 1980s and 1990s, allows wells tofollow complex paths, with their direction guided from the surface. The abilityto drill multilateral wells, with side branches directed off the main borehole, hasled to significant improvements in recovery rates. Modern drill bits are equippedwith intelligent information technology that allows a thorough evaluation ofrock layers while drilling, so that the well path may be revised as it progresses.In fact, steerable drill bits can now reach reserves more than 10 kilometres

52 RESOURCES TO RESERVES
distant laterally, with an accuracy of some 2 m. This has substantially loweredthe cost of developing fields and increased the recovery potential. It also enablesnear-offshore hydrocarbon deposits to be produced by drilling from onshoreinstallations.
When oil or gas is trapped in low-permeability rock, hydraulic fracturing canstimulate the flow. Water containing high-viscosity fluid additives is injectedunder high pressure to open or create fractures in the rock. These fracturesallow the hydrocarbons to by-pass a large part of the low-permeability rock andto move freely from the rock pores to a production well and thus to the surface.In most cases, longer and more complex wells are drilled, fractured in numerousstages along their length. This lowers the unit production costs. The process hasrecently been very successful in producing from tight oil and gas deposits in theUnited States that were previously not financially viable.
Developments in coal mining technologyDramatic increases in equipment size and efficiency have significantly improvedproductivity at surface mines and reduced mining costs, despite more andmore challenging geology. Further increases in the size and efficiency ofsurface mining equipment are likely to prove difficult. In underground mines,the extended use of highly efficient mining systems has also led to gainsin productivity, improved yields and lower costs. These trends are currentlyoccurring in China, where labour-intensive mines are being replaced by highlymechanised operations.
Competition for mining equipment has intensified worldwide and the relativelyfew equipment suppliers have struggled to keep pace. Moreover, costs ofcommodities, particularly steel, are high. Often the next generation of miningprojects will be found in new mining countries like Mozambique and Mongoliaor in new basins in existing coal-producing countries like Australia and SouthAfrica. This leads to an increase in costs and new investments in infrastructure.
Gaps in clean energy RD&D fundingTechnology plays a crucial role in finding and accessing hydrocarbon resourcesand for dealing with the environmental consequences of their consumption. Asis typical for mature industries, the development of new technology is mainlydriven by private investment. Nonetheless, public research, development anddeployment (RD&D) investment is still important. While public expenditureson oil and gas RD&D have increased in recent years, largely as a result of highoil prices and of economic stimuli in many countries, expenditure on coal hascontinued to decline.

CHAPTER 1 • SETTING THE SCENE 53
References
Akin, H. (1997), “Zur Akzeptanz der Geostatistik als Grundlage der Vorrats-klassifikation” (On the Acceptance of Geostatistics as a Basis for Classificationof Resources), In: GDMB [ed.], Klassifikation von Lagerstättenvorräten – Stand derinternationalen Bemühungen (Classification of Resource Inventories – Status ofInternational Efforts), No. 79, Clausthal-Zellerfeld, Germany, pp. 9-20.
BGR (Bundesanstalt für Geowissennchaften und Rohstoffe) (2011), AnnualReport: Reserves, Resources and Availability of Energy Resources 2011,DERA Rohstoffinformationen, BGR, Hannover, published February 2012,www.bgr.bund.de/EN/Themen/Energie/Downloads/annual_report_2011_en.pdf?__blob=publicationFile&v=2.
Bucci, L.A., P.F. Hodkiewicz, P. Jankowski, D. Guibal and X. Song (2006), “JORC andtheChinese ResourceClassification Scheme–an SRKView”, TheAusIMMBulletin,No. 4, Carlton, Australia, pp. 24-27.
Clark, C.E. and J.A. Veil (2009), ProducedWaterVolumesandManagementPracticesin theUnited States, ArgonneNational Laboratory, prepared for theUnited StatesDepartment of Energy (USDOE), Argonne, Illinois.
Dal Ferro, B. andM.Smith (2007), “GlobalOnshoreandOffshoreWaterProduction,Exploration and Production”, Oil & Gas Review, Touch Briefings, London,www.touchbriefings.com/pdf/2590/Ferro.pdf, accessed 31 August 2012.
EIA (US Energy Information Administration) (2012), Annual Energy Outlook 2012,EIA/US Department of Energy (DOE), Washington.
Ersoy, M. (2003), “Worldwide Implementation of United Nations FrameworkClassification on Coal Deposits”, presentation at Regional Seminar onUNFC6 Application to Energy and Mineral Resources, Moscow, 24-25 April,www.unece.org/energy/se/pdfs/MoscowApr03/ersoy.pdf.
Fettweis, G.B.L., D. Kelter and R. Nöstaller (1999), “Zur Beurteilung und Klassifizier-ungvonLagerstättenvorräten–dieneueUN-Klassifikation“ (“For theAssessmentand Classification of Resource Inventories – the New UN Classification“), Bergund HüttenmännischeMonatshefte, No. 144, Vol. 2, Vienna, pp. 43-51.
IEA (International Energy Agency) (2008), World Energy Outlook 2008, OECD/IEA,Paris.
IEA (2012),World Energy Outlook 2012, OECD/IEA, Paris.
O&GJ (Oil & Gas Journal) (2009), “Worldwide Look at Reserves and Production”,Oil & Gas Journal, Vol. 107, N° 47, Houston, PennWell Corporation.
SEC (Securities and Exchange Commission) (2008),Modernization of Oil and GasReporting, RIN 3235-AK00, www.sec.gov/rules/final/2009/33-8995fr.pdf, accessed31 August 2012.
6. UN Framework Classification for Fossil Energy andMineral Resources.

54 RESOURCES TO RESERVES
SPE (Society of Petroleum Engineers) (2007), Petroleum Resources ManagementSystem, sponsored by SPE, American Association of PetroleumGeologists (AAPG),World Petroleum Council (WPC), Society of Petroleum Evaluation Engineers(SPEE), www.spe.org/industry/reserves/prms.php.
USEIA (Energy Information Administration) (2012), Annual Energy Outlook 2012,EIA/United States Department of Energy (USDOE), Washington DC.
WEC (World Energy Council) (2010), Survey of Energy Resources 2010,www.worldenergy.org/publications/3040.asp, accessed 31 August 2012.

CHAPTER 2 • RAISING RECOVERY EFFICIENCY FROM OILFIELDS 55
Chapter 2 • Raising recovery efficiency fromoilfields
In recent decades, oil demand could bemet by developing new fields, extendingthe development of existing fields or finding new fields in regions with knownpotential. However, mature fields still contain significant volumes of remainingoil and, as such, attention is shifting towards the challenge of achieving higheroil recovery and convertingmore remaining recoverable resources into reserves.In this chapter, the various phases of a field’s lifecycle are explained togetherwith the challenges they present and the technology applications neededto overcome such challenges.1 It should be noted that, although a particulartechnology may be highlighted for one phase of development, it often plays arole in all phases, such as the use of seismic technologies.
Lifecycle of a petroleum reservoir
The lifecycle of a petroleum reservoir covers the period from discoveryto abandonment. The phases of the lifecycle include: exploration; appraisal,planning and construction; primary recovery; secondary recovery; operation andredevelopment; tertiary recovery; and abandonment (Figure 2.1).
Figure 2.1 • Schematic representation of the lifecycle of a petroleum reservoir
Exploration(seismic, wells)
Appraisal,planning andconstruction
Operation
AbandonmentRedevelopment
Cost
Production
Primaryrecovery
Secondaryrecovery
Tertiaryrecovery (EOR)
Production
Note: EOR=enhancedoil recovery.Courtesy of W. Schulte.
The lifecycle starts with the discovery of the presence of a petroleum reservoir.The first challenge for the engineer is to find the reservoir by exploring thesubsurface. The exploration process begins with regional geological studies anddeep-earth remote-sensing techniques such as seismic reflection to identify orinfer the presence of the natural geological conditions that would be favourablefor the creation of a hydrocarbon accumulation (Box 2.1).
1. The descriptions are not an exhaustive overviewof technological progress in all areas (e.g. technologies specifically related tofield abandonment are not described), but pertain to most phases of the lifecycle to demonstrate general progress.
CHAPTER 2 • RAISING RECOVERY EFFICIENCY FROM OILFIELDS 55
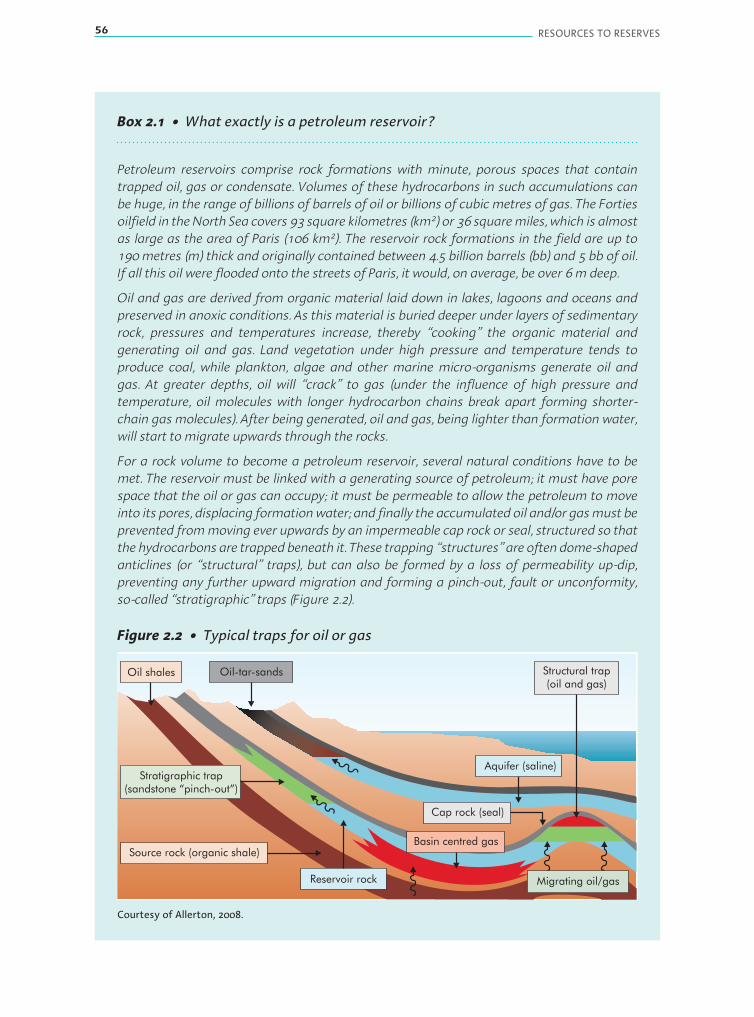
56 RESOURCES TO RESERVES
Box 2.1 • What exactly is a petroleum reservoir?
Petroleum reservoirs comprise rock formations with minute, porous spaces that containtrapped oil, gas or condensate. Volumes of these hydrocarbons in such accumulations canbe huge, in the range of billions of barrels of oil or billions of cubic metres of gas. The Fortiesoilfield in theNorth Sea covers 93 square kilometres (km2) or 36 squaremiles, which is almostas large as the area of Paris (106 km2). The reservoir rock formations in the field are up to190 metres (m) thick and originally contained between 4.5 billion barrels (bb) and 5 bb of oil.If all this oil were flooded onto the streets of Paris, it would, on average, be over 6 m deep.
Oil and gas are derived from organic material laid down in lakes, lagoons and oceans andpreserved in anoxic conditions. As this material is buried deeper under layers of sedimentaryrock, pressures and temperatures increase, thereby “cooking” the organic material andgenerating oil and gas. Land vegetation under high pressure and temperature tends toproduce coal, while plankton, algae and other marine micro-organisms generate oil andgas. At greater depths, oil will “crack” to gas (under the influence of high pressure andtemperature, oil molecules with longer hydrocarbon chains break apart forming shorter-chain gas molecules). After being generated, oil and gas, being lighter than formation water,will start to migrate upwards through the rocks.
For a rock volume to become a petroleum reservoir, several natural conditions have to bemet. The reservoir must be linked with a generating source of petroleum; it must have porespace that the oil or gas can occupy; it must be permeable to allow the petroleum to moveinto its pores, displacing formationwater; and finally the accumulated oil and/or gasmust beprevented frommoving ever upwards by an impermeable cap rock or seal, structured so thatthe hydrocarbons are trapped beneath it. These trapping “structures” are often dome-shapedanticlines (or “structural” traps), but can also be formed by a loss of permeability up-dip,preventing any further upward migration and forming a pinch-out, fault or unconformity,so-called “stratigraphic” traps (Figure 2.2).
Figure 2.2 • Typical traps for oil or gas
Source rock (organic shale)
Cap rock (seal)
Structural trap(oil and gas)
Stratigraphic trap(sandstone “pinch-out”)
Oil-tar-sandsOil shales
Reservoir rock
Aquifer (saline)
Basin centred gas
Migrating oil/gas
Courtesy of Allerton, 2008.
CHAPTER 2 • RAISING RECOVERY EFFICIENCY FROM OILFIELDS 57
In some cases, oil can seep all the way to the surface, becoming progressively degraded(through bacterial influence, hydrocarbon molecules can often get entangled and combineto form larger entities that make the oil more viscous) and heavier, forming massiveaccumulations of oil- or tar-sands, especially after biodegradation at shallow depth. Such oilseeps were already used bymankind in ancient times.
Oil and gas are inevitably found together with water, sometimes more than 60% of theavailable pore space being water-filled. Some of this water is produced along with the oiland gas.
Exploration
The key tool for exploration is seismic mapping of the subsurface. By creatingsound waves at the surface and listening with specialist equipment to theechoes that come back to the surface, a picture of the subsurface can be made.When a wave traverses one rock type to another, part of the wave energy isreflected back to the surface. The reflected waves are collected and analysedto indicate where the major changes occur. A three-dimensional (3-D) picturecan then be created that depicts the changes in geology, thus providing anindication of potential traps for oil and gas. The creation of this 3-D picture is acomplex operation and often requires computers with high processing power.Seismic technologies to detect reflected waves and construct the 3-D pictureshave improved significantly over recent years, providing much clearer picturesof the subsurface structures (Box 2.2).
Once it has been determined that the natural geological conditions areconsistent with those required of a petroleum reservoir, its prospects areassessed, i.e. the potential reservoir size and possible rate of oil productionare estimated, along with the uncertainties that apply to the assessment. Thecosts of further appraising the prospect by drilling an exploration well, togetherwith the cost of developing and operating the field are estimated, as are theanticipated revenues from the production expected over the lifetime of thereservoir. Whether or not the exploration company decides to drill will dependverymuchonthequalityof theunderlying information. If consideredworthwhile,an explorationwell will be drilled, which could then lead to a discovery or to a drywell (no hydrocarbons present).
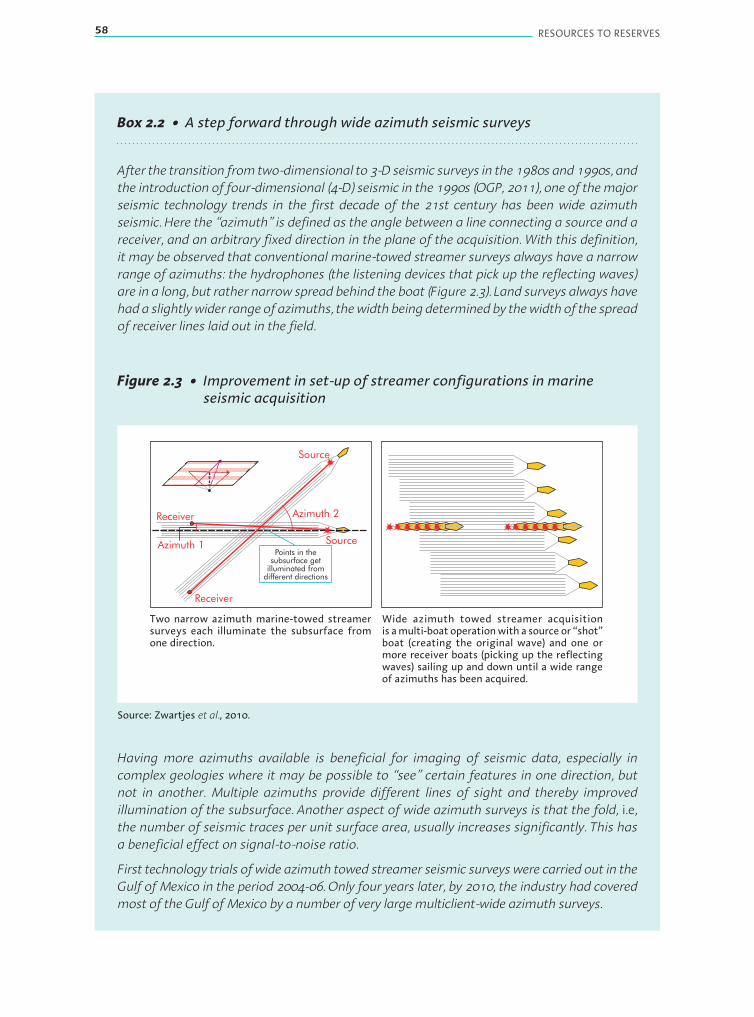
58 RESOURCES TO RESERVES
Box 2.2 • A step forward through wide azimuth seismic surveys
After the transition from two-dimensional to 3-D seismic surveys in the 1980s and 1990s, andthe introduction of four-dimensional (4-D) seismic in the 1990s (OGP, 2011), one of themajorseismic technology trends in the first decade of the 21st century has been wide azimuthseismic. Here the “azimuth” is defined as the angle between a line connecting a source and areceiver, and an arbitrary fixed direction in the plane of the acquisition. With this definition,it may be observed that conventional marine-towed streamer surveys always have a narrowrange of azimuths: the hydrophones (the listening devices that pick up the reflecting waves)are in a long, but rather narrow spread behind the boat (Figure 2.3). Land surveys always havehada slightlywider range of azimuths, thewidth being determinedby thewidth of the spreadof receiver lines laid out in the field.
Figure 2.3 • Improvement in set-up of streamer configurations in marineseismic acquisition
Azimuth 2
Azimuth 1
Receiver
Receiver
Source
Source
Points in thesubsurface get
illuminated fromdifferent directions
Source: Zwartjes et al., 2010.
Having more azimuths available is beneficial for imaging of seismic data, especially incomplex geologies where it may be possible to “see” certain features in one direction, butnot in another. Multiple azimuths provide different lines of sight and thereby improvedillumination of the subsurface. Another aspect of wide azimuth surveys is that the fold, i.e,the number of seismic traces per unit surface area, usually increases significantly. This hasa beneficial effect on signal-to-noise ratio.
First technology trials of wide azimuth towed streamer seismic surveys were carried out in theGulf of Mexico in the period 2004-06. Only four years later, by 2010, the industry had coveredmost of the Gulf of Mexico by a number of very largemulticlient-wide azimuth surveys.
Two narrow azimuth marine-towed streamersurveys each illuminate the subsurface fromone direction.
Wide azimuth towed streamer acquisitionis amulti-boat operationwith a source or “shot”boat (creating the original wave) and one ormore receiver boats (picking up the reflectingwaves) sailing up and down until a wide rangeof azimuths has been acquired.

CHAPTER 2 • RAISING RECOVERY EFFICIENCY FROM OILFIELDS 59
Wide azimuth seismic has led to dramatic improvements in image quality in complexgeological settings. This is illustrated for an onshore setting in Figure 2.4, which shows theuplift in image quality due towide azimuth seismic acquired in the SouthernOman salt basinin 2007.
Figure 2.4 • Improvement in seismically derived image by wide azimuthdata acquisition
Old top saltinterpretation
Stringers ?
Clean salt Salt ?
Salt ?
Courtesy of Petroleum Development Oman.
Appraisal, planning and constructionOnce discovered by one or more exploration wells, the reservoir is thenappraised by drilling more wells to confirm assumptions on the type of rockand the content of its pore space. The appraisal process is designed to reducethe risks and uncertainties present in the initial prospect stage; to define theextent and limits of the reservoir(s) in the field; to assess the oil (or gas)-in-placeand the likely production rates. After the appraisal process has confirmed thatdevelopment of the field may be financially viable, a field development plan(FDP) is drawn up that provides a summary description of the development,and the principles and objectives that will govern its management. The plantypically spans 25 years and specifies the expected range of production andrequired injection rates; the number and placement ofwells; the surface facilitiesrequired to separate the oil, gas and water; the various pipelines requirement;
Notes: the more modern wide azimuth data (right) provides much improved imaging of topsalt compared with that obtained using narrow azimuth data (left), potentially leading to adifferent interpretation.The much improved intra-salt signal/noise ratio is also highly relevant, as the reservoir is anintra-salt stringer play. (A stringer is a thin, discontinuous mineral vein or rock layer.)
60 RESOURCES TO RESERVES
and other transportation systems required to transport the products to market.The objective at this stage is to maximise the value of the development, givena whole range of assumptions about the long-term future – oil and gas prices,production rates over time, and costs. The predicted production profile over theeconomic life of the field defines its reserves.
Once the FDPhasbeenapprovedby theoil companyand the relevant authorities,field and reservoir development can proceed. The services identified in the FDPwill be defined inmore detail, contracts awarded to engineering companies, andfacilities constructed. This phase of the project can take several years and it isduring this phase when quality and cost control are of utmost importance. Thecause of unsuccessful projects can often be traced back to a low-quality FDP.
ProductionOnce production starts, the engineer will focus on achieving the predictedproduction rates and exploring ways to further improve oil recovery. Out ofthe approximately 70 000 fields currently producing globally, the bulk of theworld’s oil supply comes from only a small number of large oilfields. Theselarge fields are essential to global energy security. Improving productionfrom such fields was a major driver behind the growth in Organization ofthe Petroleum Exporting Countries (OPEC) non-member oil supply during the1990s. Incremental improvements in production from existing large fields inthe United Kingdom and the Norwegian sectors of the North Sea contributedroughly 50% of the surge in OPEC non-member production during thatdecade.
Oil andgasproduction ismadepossible by reducing thepressure in aproductionwell and allowing the pressure difference with the main reservoir to force theflow of hydrocarbons towards the well. In the early stages of production, underthe so-called primary recovery, the oil flows with no assistance towards thewell bore and up to the surface. For gas reservoirs, this stage is often enough toreach recovery factors (ratio of hydrocarbons produced to those hydrocarbonsinitially in place) of around 70% or higher. Gas, being much lighter than oil orwater, normally flows easily up the well bore, although pumps may be used inlater production stages to lift the column of accumulatedwater in thewell borethat comes with the gas. For oil reservoirs, pressure depletion alone is generallynot sufficient and yields low recovery factors, typically 5% to 15%. Additionalinjection of water or gas is required to stop the pressure from dropping belowa minimum level, below which oil can no longer be recovered. This processis referred to as secondary recovery. Depending on the geology, sufficientpressure can sometimes be provided by the flow of water from a connectingaquifer: when the pressure in the oil column drops, the aquifer water flowstowards the oil reservoir, supporting pressure and displacing oil. Recoveryfactors resulting from consecutive primary and secondary recovery are typicallybetween 15% and 40%.
If more sophisticated fluids such as chemicals or steam are injected, the processis referred to as tertiary recovery. Tertiary recovery may also be referred to asEOR.

CHAPTER 2 • RAISING RECOVERY EFFICIENCY FROM OILFIELDS 61
The global average recovery factor2 was estimated at 35%, based on IHS-CERAdata (Schulte, 2005). This implies that reservoirs are abandoned with, on average,two-thirds of their hydrocarbons still left in the ground. The recovery factor thatcan be achieved in an individual field is determined by the complexity of thereservoir and the method of extraction. A reservoir can be a sandstone reservoiror a carbonate reservoir. Sandstone reservoirs are formed from deposited sandgrains, while carbonate reservoirs are formed from skeletons of marine life,such as reefs or shells. Carbonate reservoirs are often more brittle, and are oftenbroken during their burial history, leading to faults and fractures that causeuneven flow through the reservoirs. Heavily fractured carbonate reservoirs oftenexhibit a low recovery factor, whereas homogeneous sandstone reservoirs underwater-flooding can reach recovery rates of 60% or higher.
EOR techniques arenot yetwidelyusedbecause in thepast theywereconsideredtoo expensive. Consequently, the application of EORwill be closely dependent onthe oil price. Recentlymore projects have been defined in which EOR techniquescould increase recovery rates.
AbandonmentOncehydrocarbons in the reservoir havebeendepleted toa level that isno longerfinancially viable for further extraction, the wells are sealed off and abandoned,the facilities removed and the environment returned to its pre-drilling state.
Developing new reserves: getting the most for the lowest cost
Making a plan using integrated reservoir modellingIn theory, a singlewell at the crest of an underground trapwould eventually drainall of the moveable hydrocarbons from a trap. However, doing so would takethousands of years and be financially unviable. Therefore, more wells are neededthat can be drilled in an optimum pattern designed to sweep the petroleumfrom the reservoir to the wellbores in the most cost-effective manner. Suchdesigns are currently made using complex and detailed 3-D computer modelsof the reservoir and its fluids, which are capable of predicting how the fluidswill move through the reservoir. Computer modelling or integrated reservoirmodelling (IRM) is used to define the optimumnumber and location of the wells,in order to maximise the value of the discovery.
As a result of ever increasing computer power, the last 20 years have seen adramatic increase in the use of numerical reservoir modelling to support fielddevelopment and management decisions. A multi-discipline methodology hasbeen developed that integrates the work performed by each technical disciplineand designs a computer model showing the potential assets for which the newdevelopment is being proposed.
2. The recoverable amount of original or residual oil in place in a reservoir, expressed as a percentage of total oil in place. Therecoverable amount includes produced oil plus the volume of proven reserves.
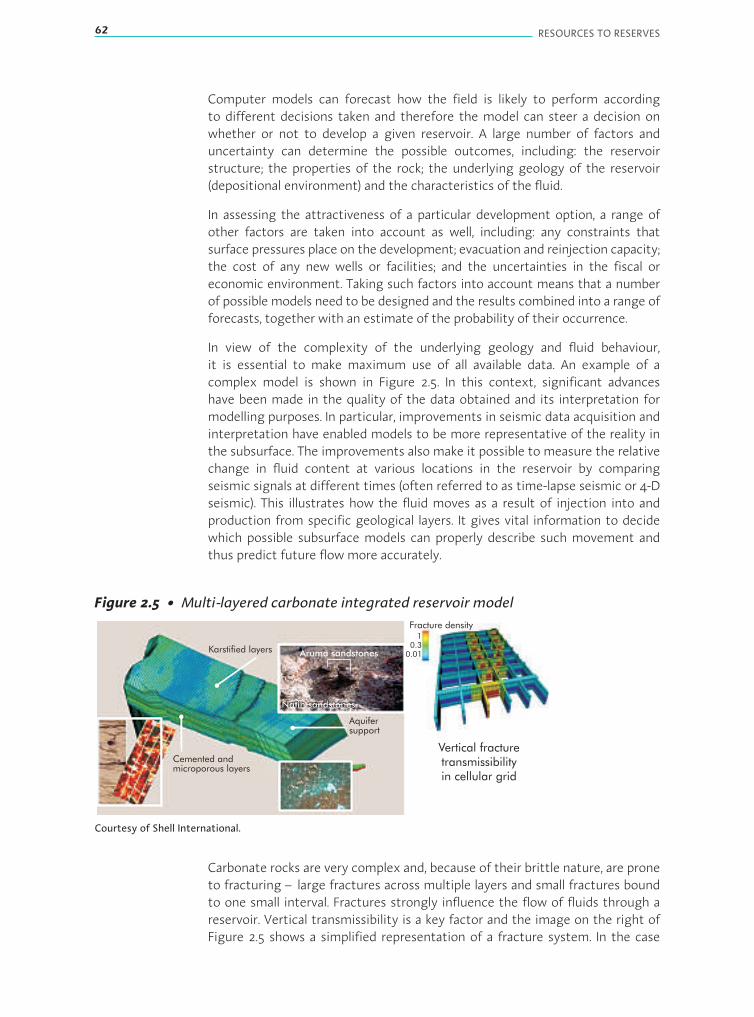
62 RESOURCES TO RESERVES
Computer models can forecast how the field is likely to perform accordingto different decisions taken and therefore the model can steer a decision onwhether or not to develop a given reservoir. A large number of factors anduncertainty can determine the possible outcomes, including: the reservoirstructure; the properties of the rock; the underlying geology of the reservoir(depositional environment) and the characteristics of the fluid.
In assessing the attractiveness of a particular development option, a range ofother factors are taken into account as well, including: any constraints thatsurface pressures place on the development; evacuation and reinjection capacity;the cost of any new wells or facilities; and the uncertainties in the fiscal oreconomic environment. Taking such factors into account means that a numberof possible models need to be designed and the results combined into a range offorecasts, together with an estimate of the probability of their occurrence.
In view of the complexity of the underlying geology and fluid behaviour,it is essential to make maximum use of all available data. An example of acomplex model is shown in Figure 2.5. In this context, significant advanceshave been made in the quality of the data obtained and its interpretation formodelling purposes. In particular, improvements in seismic data acquisition andinterpretation have enabled models to be more representative of the reality inthe subsurface. The improvements also make it possible to measure the relativechange in fluid content at various locations in the reservoir by comparingseismic signals at different times (often referred to as time-lapse seismic or 4-Dseismic). This illustrates how the fluid moves as a result of injection into andproduction from specific geological layers. It gives vital information to decidewhich possible subsurface models can properly describe such movement andthus predict future flowmore accurately.
Figure 2.5 • Multi-layered carbonate integrated reservoir model
Cemented andmicroporous layers
Karstified layers
Fracture density
Aquifersupport
10.3
0.01
Vertical fracturetransmissibilityin cellular grid
Aruma sandstones
Natih sandstones
Courtesy of Shell International.
Carbonate rocks are very complex and, because of their brittle nature, are proneto fracturing – large fractures across multiple layers and small fractures boundto one small interval. Fractures strongly influence the flow of fluids through areservoir. Vertical transmissibility is a key factor and the image on the right ofFigure 2.5 shows a simplified representation of a fracture system. In the case
CHAPTER 2 • RAISING RECOVERY EFFICIENCY FROM OILFIELDS 63
shown, the various layers are connected via the fracture system, particularly inthe middle. The complexity of carbonate rock stems from the influence on itscomposition and structure of themovement of water and the effect of pressure(changes due to chemical, physical or biological processes) during its burialhistory. These changes during its burial history are referred to as diagenesis.Part of the rock can dissolve in water and then be deposited elsewhere, fillingthe pore space. This process is known as cementation. One extreme process iskarstification, in which the rock fully dissolves, leaving large holes or caverns inthe subsurface.
The integration boundaries for IRM continue to expand and it is now becomingstandardprocedureto includeadetailedrepresentationofthesurfaceproductionsystem as part of themodelling exercise. Suchmodels then represent the entireproduction process from developing the reservoir to sales point, and describethe flow through the subsurface, wells and surface facilities. The model can nowpredict how production will change if any of the various elements in the overallproject change.
Because of the increasing complexity of many of today’s asset developments,together with the underlying subsurface uncertainties, full IRM is, and willremain, a complex and challenging task.
Drilling technology for new reserves and lower costsDrilling technology is subject to continuous development. The main aim isto enhance the drainage area,3 i.e. for each well to access more oil, at thelowest possible cost. Different designs of well currently in use include newmultilateral wells (wells withmultiple branches that can extend dramatically thedrainage area of a well); horizontal wells (which can extend the well laterally);and extended reach wells (those wells reaching a target far from the drillingplatform). Expandable tubulars, which expand to a larger diameter after beingplaced in the well bore, are being used more frequently in well construction.They reduce significantly the extent to which the diameter of a well becomesnarrower with depth. It is a particularly important innovation for deepwells. Oneof the latest developments in drilling technology is casing drilling, which cansignificantly reduce the time needed to create a well. In casing drilling, the drillbit sits at the end of the casing, such that when the bit is at its desired depththe full casing is already in place and only the drill bit itself is retrieved from thehole. This method prevents running different pipes in and out of the hole, thussaving valuable time.
A range of new technologies is also applied to the part of the well thatdirectly connects with the reservoir. Maximum reservoir contact (MRC) is oneconcept recently developed by Saudi Aramco (Badri, 2008). The MRC conceptis designed to address the challenges related to penetration of reservoirs withheterogeneous geology, which is often the case with carbonate reservoirs thatare widespread in Middle East regions.
3. The drainage area of a well is the area of the reservoir that is drained by that well.

64 RESOURCES TO RESERVES
Field tests in Saudi Arabia’s Haradh oilfield area showed a progressive game-changing effect on production from applying increasingly advanced drillingtechnology.Wells whereMRC technology has been used can deliver three timesthe production output of an initial vertical well and almost twice the productionrate of a horizontal well tested some years before the MRC demonstration(Figure 2.6).
Figure 2.6 • Results from Haradh field tests
Oil
pro
duct
ion
rate
(kb/d
)
1996 2003 20060
2 000
4 000
6 000
8 000
10 000
12 000
Verticalwell
Horizontalwell
MRC/smartwell
Note: kb/d = thousand barrels per day.
Courtesy of Saudi Aramco.
MRCwells can only have a limited number of laterally side-trackedwells comingfromthemainwell ormotherbore. This can cause aproblemaswater productionrises. In Oman, where multi-laterals were tried aggressively, premature waterbreakthrough was present in some fields (Al-Khodhori, 2003). To get aroundthis problem, Saudi Aramco conceived an intelligent completions4 technologyknown as extreme reservoir contact (ERC). The industry is developing a rangeof new technologies for intelligent completions that enable better sweepefficiency andmaximise recovery throughmonitoring and electrically activateddown-hole control valves. This type of down-hole flow control does not requireindividual control lines from the well-head to each lateral zone in order tomonitor and operate the well in real time. The control system associated withthesewells is quite complex andwould enable a theoretically unlimited numberof intelligent laterals per well.
Test results from the application of ERC technology in oilfields in theMiddle Eastare less well known. However, the improvement in reservoir drainage that can beexpected from this technology could increase production output compared toother drilling and down-hole concepts currently in operation, especially in thevery complex carbonate fields.
4. Well completionrefers totheset-upofequipmentat reservoirdepthtoenablesafeandefficientproductionfromanoilorgaswell.
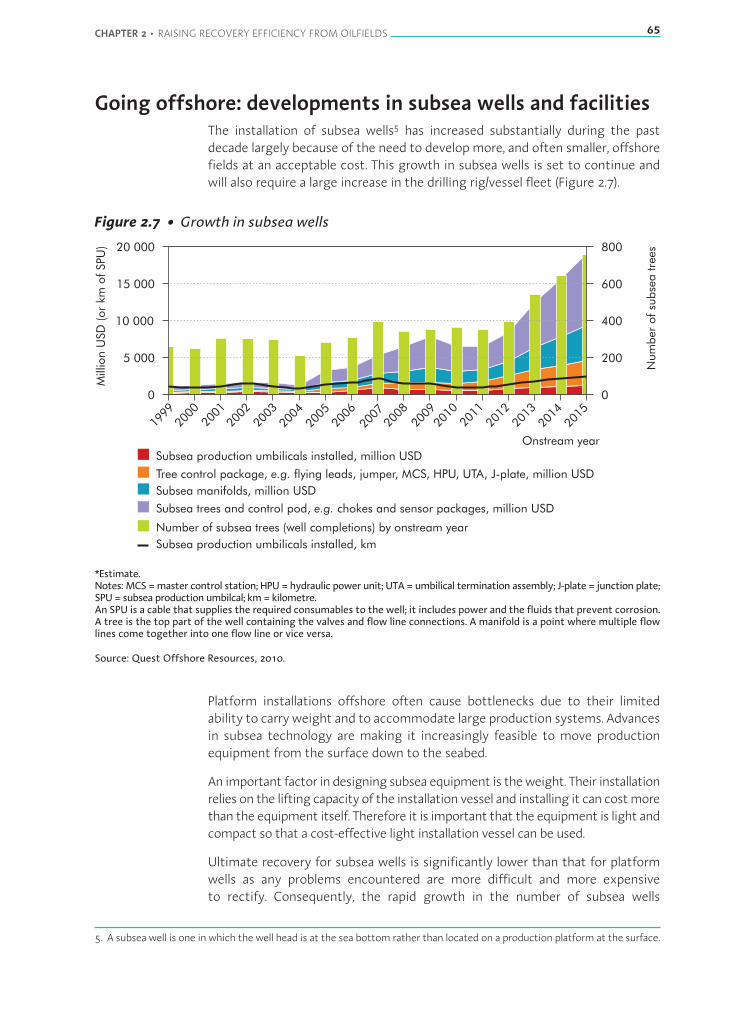
CHAPTER 2 • RAISING RECOVERY EFFICIENCY FROM OILFIELDS 65
Going offshore: developments in subsea wells and facilitiesThe installation of subsea wells5 has increased substantially during the pastdecade largely because of the need to developmore, and often smaller, offshorefields at an acceptable cost. This growth in subsea wells is set to continue andwill also require a large increase in the drilling rig/vessel fleet (Figure 2.7).
Figure 2.7 • Growth in subsea wells
20 000 800
15 000
10 000
600
5 000
400
200
0 0
Mill
ion
USD
(or
km
ofSPU
)
Num
ber
ofsu
bse
atr
ees
Onstream year
1999
2000
2001
2002
2003
2004
2005
2006
2007
2008
2009
2010
2011
2012
2013
2014
2015
Subsea production umbilicals installed, million USD
Subsea manifolds, million USD
Tree control package, flying leads, jumper, MCS, HPU, UTA, J-plate, million USDe.g.
Subsea trees and control pod, chokes and sensor packages, million USDe.g.
Number of subsea trees (well completions) by onstream year
Subsea production umbilicals installed, km
*Estimate.Notes: MCS =master control station; HPU = hydraulic power unit; UTA = umbilical termination assembly; J-plate = junction plate;SPU = subsea production umbilcal; km= kilometre.An SPU is a cable that supplies the required consumables to the well; it includes power and the fluids that prevent corrosion.A tree is the top part of the well containing the valves and flow line connections. A manifold is a point where multiple flowlines come together into one flow line or vice versa.
Source: Quest Offshore Resources, 2010.
Platform installations offshore often cause bottlenecks due to their limitedability to carry weight and to accommodate large production systems. Advancesin subsea technology are making it increasingly feasible to move productionequipment from the surface down to the seabed.
An important factor in designing subsea equipment is theweight. Their installationrelies on the lifting capacity of the installation vessel and installing it can costmorethan the equipment itself. Therefore it is important that the equipment is light andcompact so that a cost-effective light installation vessel can be used.
Ultimate recovery for subsea wells is significantly lower than that for platformwells as any problems encountered are more difficult and more expensiveto rectify. Consequently, the rapid growth in the number of subsea wells
5. A subsea well is one in which the well head is at the sea bottom rather than located on a production platform at the surface.

66 RESOURCES TO RESERVES
accentuates theneed to increase their recovery efficiency. Amajor technologicalchallenge is therefore to extend available improved oil recovery (IOR) capabilitiesto subsea fields. Platforms offer direct access to the production equipmentfor continuous operation, inspection, intervention and maintenance and aretherefore important for an optimum exploitation of the reservoir. The lowerphysical access to subsea wells creates gaps in applying the same range oftechnologies for subsea fields.
Step changes in communication technologyhave enablednewworkingmethodsin the industry, especially for subsea developments. By applying fibre optic-basedbroadband and digital infrastructure to integrated operations of subsea oil andgas fields, the facilities can be controlled remotely from onshore. Such advancedtechnology reduces the need tomaintain costly offshore functions aswell as therisk that such functions pose to offshore personnel.
The ability to remove water and sand from the wellstream on the seabed isalso an important measure to boost production later in the lifecycle of the field(Figure 2.8). When water separation is introduced subsea, it reduces the amountof water produced and, similarly, the back-pressure in the production line. Thisin turn improves recovery, as represented by the blue-green stippled segmentin the figure. Removal of water is also used in conjunction with subsea boostingof the wellstream pressure, as it lets more fluids through the production line.Subsea separation, boosting and multiphase separation are still the subject ofintense research, development and deployment (RD&D).
Figure 2.8 • Effects from subsea boosting and separation
Plateauproduction
Latephase
Product
ion
rate
Time
Start-upphase
Tail-endphase
Boosting to acceleratestart-up production
Boosting to “push”more fluid through flowline
Subsea separation toremove produced water
and reduce back-pressure
Courtesy of W. Schulte.
The cost of subsea wells is a major issue. Developing more cost-effectiveinstallation methods and intervention concepts for subsea wells will be a key tosuccessfully addressing the challenge of improving recovery. Currently, a numberof concepts are being developed for different types of subsea intervention,ranging from light vessels that can only execute simple measurements onwire-line (tools lowered into the well on an electric cable) through to heavyintervention installations and integrated drilling and completion concepts
CHAPTER 2 • RAISING RECOVERY EFFICIENCY FROM OILFIELDS 67
(pulling tubingoutof thewell, replacingpart of tubing anddown-hole equipment,drilling). After a period of technology qualification, a range of solutions for lightersubsea intervention vessels is now also commercially available. In addition,constant attention is given to the environmental aspects of subsea operationsbecause of the impact that subsea equipment may have on wildlife and the riskof leaks or spills.
Applying technologies for IOR
IOR and EOR measures are used to increase recovery factors from a reservoir(Box 2.3).
Box 2.3 • IOR and EOR
As there are no precise definitions of these terms, an understanding of them often dependson the context and on the user.
IOR
IOR refers to all measures that result in an increased oil recovery factor from a reservoir ascompared with the expected value at a particular point in time. In practice, the term is oftenused synonymously with optimisation of the secondary recovery operation. IOR comprisesboth conventional and emerging technologies.
EOR
EOR refers to advanced recovery techniques beyond those considered conventional. It focusesonly on the tertiary recovery operation. In theory, EOR is a sub-set of IOR.
In the secondary recovery phase, the pressure in the reservoir is maintainedby injecting water and/or gas behind the oil to drive it towards the productionwells. In this phase, often a lot of additional wells are drilled to reach untappedoil pockets and reduce the distance between injection and production wells.Facilities will have to be capable of handling large volumes of water both on theinjection and on the production sides. Often production wells are fitted withartificial lift6 systems to assist in lifting oil that contains increasing levels ofwater. In many mature fields significantly larger volumes of water than oil areproduced.
6. Any system that adds energy to the fluid column in a well-bore with the objective of initiating and improving productionfrom thewell. Artificial-lift systems use a range of operating principles, including rod pumping, gas lift and electric submersiblepump (Schlumberger, 2012).
68 RESOURCES TO RESERVES
IOR techniques and their potentialThe use ofmore advanced and efficient technologies in assessing and recoveringhydrocarbons in place has extended the lifecycle of many oilfields and,consequently, made an important contribution to securing long-term oil supply.Many of these fields have had their initial reserves revised upward. If reservegrowth in already discovered fields worldwide continues as in the past 70 years,as much as 1 trillion barrels of additional oil could be added to reserves in thesefields during the next seven decades. This represents an addition equivalent tothe total amount of oil produced to date.
The fraction of oil in place that can be produced by water alternating gas injection(WAG) (secondary recovery) depends on the reservoir and oil characteristics.Typically, primary recovery can extract between 5% and 15%, and secondaryrecovery can add a further 10 to 25 percentage points. This broad range in recoveryrates is due to the large variations in oilfield characteristics such as types of rock,fluid saturations, reservoir temperature and pressure. At the moment, primary andsecondary recovery operations typically leave behind two-thirds of original oil inplace.
A 2007 study by the National Petroleum Council in the United States listsadvances in technology that can improve oil recovery factors (NPC, 2007). Newwell architecture helps significantly. In the recent past, very long horizontalwells (wells with a large horizontal section inside the reservoir) have becomecommonplace. Further developments are currently shifting towards multi-laterals with in-well control valves. Repeat seismic is also used to make picturesof the subsurface at different moments in time. The differences between thesepictures can often show where oil is left behind because of the geologicalcomplexity of the reservoir and if new wells could help. In recent years, thefocus has been on well and reservoir management (WRM) and the installation ofmore equipment to measure and monitor an oilfield more intensely (reservoirsurveillance). From the large amount of data in combination with numericallysimulating the reservoir, the operator can learn how best to manage theinjection and production levels. If such measurements are combined withadditional valves in the wells and facilities, so that the inflow in sectors of thewells can be controlled remotely on a day-to-day basis, the field is often called asmart field or eField. This type of WRM could improve recovery by between 5%and 15% of oil initially in place.
Improvements in the North Sea and Norwegian ContinentalShelf
The efficiency of oil recovery in the Norwegian Continental Shelf (NCS),defined as the aggregate percentage of oil in place estimated to be ultimatelyrecoverable at the end ofNCS production history, increased from36% in 1992 to44% in 2000 and 46% in 2008 (NPD, 2009). Technology improvements over thatperiod led not only to an increase in recovery rate and consequent higher outputfromproducing fields, but also to a growth of estimates of the total in-placeNCSoil resources and of the estimated recoverable reserves.
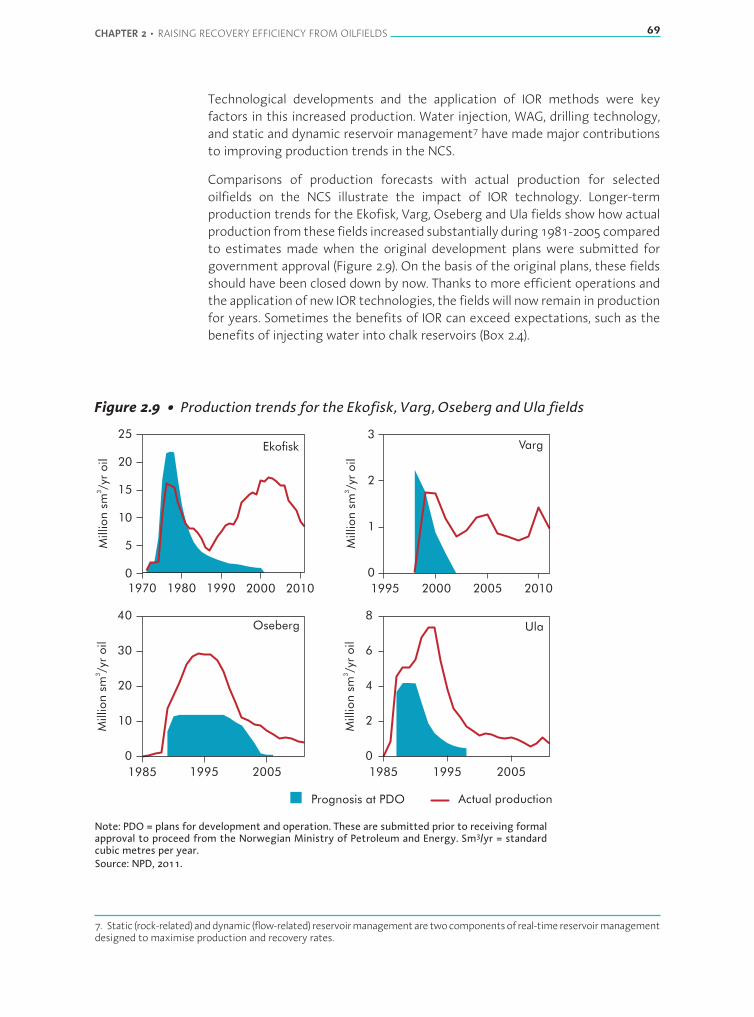
CHAPTER 2 • RAISING RECOVERY EFFICIENCY FROM OILFIELDS 69
Technological developments and the application of IOR methods were keyfactors in this increased production. Water injection, WAG, drilling technology,and static and dynamic reservoir management7 have made major contributionsto improving production trends in the NCS.
Comparisons of production forecasts with actual production for selectedoilfields on the NCS illustrate the impact of IOR technology. Longer-termproduction trends for the Ekofisk, Varg, Oseberg and Ula fields show how actualproduction fromthese fields increased substantially during1981-2005comparedto estimates made when the original development plans were submitted forgovernment approval (Figure 2.9). On the basis of the original plans, these fieldsshould have been closed down by now. Thanks to more efficient operations andthe application of new IOR technologies, the fieldswill now remain in productionfor years. Sometimes the benefits of IOR can exceed expectations, such as thebenefits of injecting water into chalk reservoirs (Box 2.4).
Figure 2.9 • Production trends for the Ekofisk, Varg, Oseberg and Ula fields
0
5
10
15
20
25
1970 1980 1990 2000 2010
Ekofisk Varg
Oseberg Ula
0
1
2
3
1995 2000 2005 2010
0
10
20
30
40
1985 1995 2005
0
2
4
6
8
1985 1995 2005
Million
sm/y
roil
3
Million
sm/y
roil
3
Million
sm/y
roil
3
Million
sm/y
roil
3
Prognosis at PDO Actual production
Note: PDO = plans for development and operation. These are submitted prior to receiving formalapproval to proceed from the Norwegian Ministry of Petroleum and Energy. Sm3/yr = standardcubic metres per year.Source: NPD, 2011.
7. Static (rock-related)anddynamic (flow-related) reservoirmanagementaretwocomponentsof real-timereservoirmanagementdesigned tomaximise production and recovery rates.
70 RESOURCES TO RESERVES
Actual production from the Ekofisk, Oseberg and Ula fields in 1995 was nearlytriple the production levels officially forecast ten years earlier. An assessment ofthe production history of the 18 largest oil-producing fields on the NCS in thesame period shows a similar aggregate production trend (NPD, 2009).
Box 2.4 • Technological breakthrough: water injection in the Ekofisk field
Major technological achievements resulting from ongoing research and development by theindustry and programmes supported by the Norwegian government became a key factorbehind the improved production trends experienced on the NCS. Water injection in theEkofisk field was successful in boosting oil production by enabling more oil to be recoveredfrom the field’s chalk reservoir. Injecting water into oil-bearing chalk formations was notnormal practice at the time. The breakthrough was achieved despite broad scepticism in theinternational community because of the perceived risk of seriously damaging the reservoirby the so-called “yoghurt effect” resulting from chalk mixing with water. As a result of thispioneering technology, the Ekofisk field is now the largest oil-producing field on the NCS.
The case of two of the larger North Sea oilfields, Statfjord and Gullfaks, bothwith already good levels of expected oil recovery, further illustrates how theapplication of a number of improved technologies significantly increasedrecovery levels. The most important technologies used included:
■ drilling and well technologies;
■ extended use of gas and water injection;
■ static and dynamic modelling aimed at predicting and controlling reservoirbehaviour.
The improved technology and increased knowledge of the reservoirs in theStatfjord andGullfaks fields from1986 to the present has had a significant impacton the percentage of total oil recovery over the lifespan of the fields (Table 2.1).
Table 2.1 • Expected ultimate percentage recovery from Statfjord and Gullfaks fields
1986 1996 2006 2008 2010 2011
Statfjord 49% 61% 66% 66% 66% 66%
Gullfaks 46% 49% 60% 60% 61% 61%
Courtesy of Norwegian Petroleum Directorate.
The technologies applied to increase production from the reservoirs alsoprovided improved information about the reservoir and better estimates of theamount of oil in the fields and the amount judged to be recoverable reserves.
More examples can be quoted from different parts of the world. In the largestoilfield in North America, the Prudhoe Bay field on Alaska’s North Slope,approximately 13 bb of oil are expected to be recoverable by using currenttechnology, compared to the 9.6 bb originally estimated.
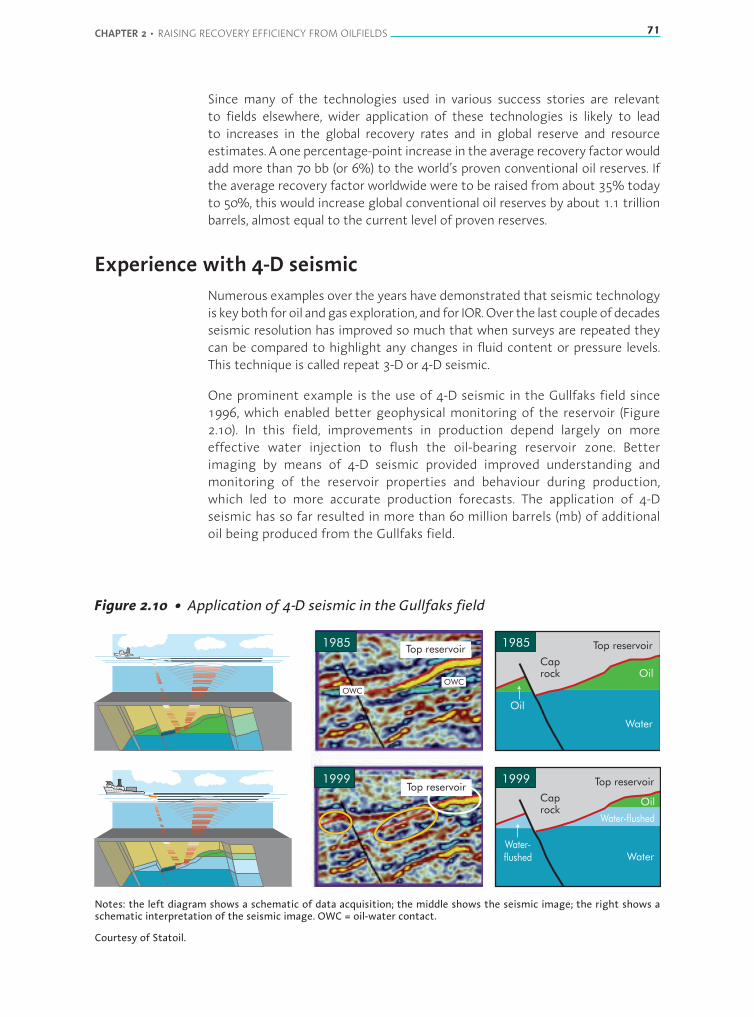
CHAPTER 2 • RAISING RECOVERY EFFICIENCY FROM OILFIELDS 71
Since many of the technologies used in various success stories are relevantto fields elsewhere, wider application of these technologies is likely to leadto increases in the global recovery rates and in global reserve and resourceestimates. A one percentage-point increase in the average recovery factorwouldadd more than 70 bb (or 6%) to the world’s proven conventional oil reserves. Ifthe average recovery factor worldwide were to be raised from about 35% todayto 50%, this would increase global conventional oil reserves by about 1.1 trillionbarrels, almost equal to the current level of proven reserves.
Experience with 4-D seismicNumerous examples over the years have demonstrated that seismic technologyis keyboth foroil andgasexploration, and for IOR.Over the last coupleofdecadesseismic resolution has improved so much that when surveys are repeated theycan be compared to highlight any changes in fluid content or pressure levels.This technique is called repeat 3-D or 4-D seismic.
One prominent example is the use of 4-D seismic in the Gullfaks field since1996, which enabled better geophysical monitoring of the reservoir (Figure2.10). In this field, improvements in production depend largely on moreeffective water injection to flush the oil-bearing reservoir zone. Betterimaging by means of 4-D seismic provided improved understanding andmonitoring of the reservoir properties and behaviour during production,which led to more accurate production forecasts. The application of 4-Dseismic has so far resulted in more than 60 million barrels (mb) of additionaloil being produced from the Gullfaks field.
Figure 2.10 • Application of 4-D seismic in the Gullfaks field
Oil
Oil
Water
Top reservoir
Caprock
19851985
1999
Water
Top reservoir
Caprock
1999
Oil
Water-flushed
Water-flushed
Top reservoir
OWCOWC
Top reservoir
Notes: the left diagram shows a schematic of data acquisition; the middle shows the seismic image; the right shows aschematic interpretation of the seismic image. OWC = oil-water contact.
Courtesy of Statoil.
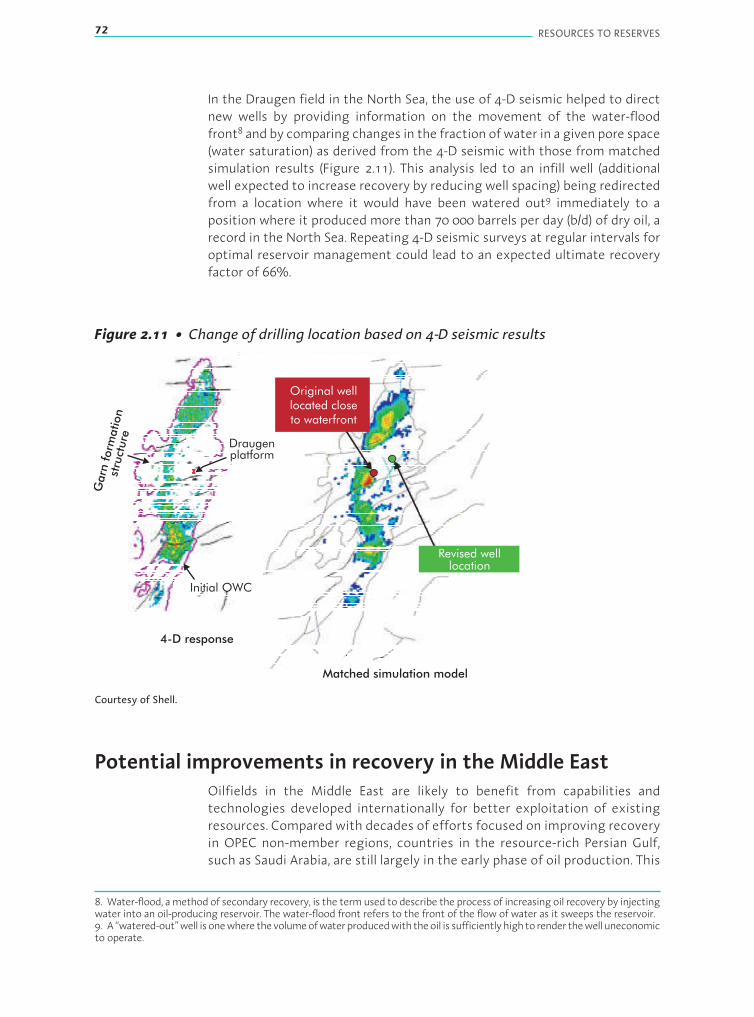
72 RESOURCES TO RESERVES
In the Draugen field in the North Sea, the use of 4-D seismic helped to directnew wells by providing information on the movement of the water-floodfront8 and by comparing changes in the fraction of water in a given pore space(water saturation) as derived from the 4-D seismic with those from matchedsimulation results (Figure 2.11). This analysis led to an infill well (additionalwell expected to increase recovery by reducing well spacing) being redirectedfrom a location where it would have been watered out9 immediately to aposition where it produced more than 70 000 barrels per day (b/d) of dry oil, arecord in the North Sea. Repeating 4-D seismic surveys at regular intervals foroptimal reservoir management could lead to an expected ultimate recoveryfactor of 66%.
Figure 2.11 • Change of drilling location based on 4-D seismic results
Revised welllocation
Original welllocated closeto waterfront
Draugenplatform
Initial OWC
4-D response
Matched simulation model
Garn
form
ation
stru
cture
Courtesy of Shell.
Potential improvements in recovery in the Middle EastOilfields in the Middle East are likely to benefit from capabilities andtechnologies developed internationally for better exploitation of existingresources. Compared with decades of efforts focused on improving recoveryin OPEC non-member regions, countries in the resource-rich Persian Gulf,such as Saudi Arabia, are still largely in the early phase of oil production. This
8. Water-flood, amethod of secondary recovery, is the termused to describe the process of increasing oil recovery by injectingwater into an oil-producing reservoir. The water-flood front refers to the front of the flow of water as it sweeps the reservoir.9. A “watered-out”well isonewherethevolumeofwaterproducedwiththeoil is sufficientlyhightorender thewelluneconomicto operate.
CHAPTER 2 • RAISING RECOVERY EFFICIENCY FROM OILFIELDS 73
means that less attention has been paid in the past to improving recoverymethods compared to more mature producing regions such as the UnitedStates and maturing parts of the North Sea. In some areas, such as in Oman,which has smaller resource volumes, dedicated improvements through IORand EOR are already well under way.
The Persian Gulf region is dominated by carbonate reservoirs. These areparticularly heterogeneous, with small features that are difficult to detect byusing seismic or other measurements and can sometimes dramatically affectthemovement of fluids. Often the presence of large faults and fracture systemsmake a classical water-flood not practical because water will flow through thefracture systemandwill by-pass the oil. In addition, the rocks tend to be “oil wet”,meaning that oil tends to stick to the rock better than water, which reducesrecovery from water injection.
Still, many oil developments concern huge fields where, for a long time,peripheral water injection involving large well spacing was sufficient. However,the proportion of water in the total liquids extracted from the producing wellsis increasing and therefore there are many new initiatives to improve recoveryin these complex fields. So far most of these developments concern drillinghorizontal and multilateral wells and applying 4-D seismic. Research and pilottesting on EOR methods is also ongoing. EOR methods are being used in Omanwhere, owing to an average smaller field size, development is moremature thanin other areas of the Middle East. In Abu Dhabi in the United Arab Emirates,gas injection has been piloted already for many years. Recently a pilot projectinvolving the use of carbon dioxide (CO2) was announced in AbuDhabi, and SaudiArabia is also planning a CO2 test. The officially reported recovery efficiencies ofthe larger resource holders have not changed in recent years as operators stillfeel that there is insufficient evidence towarrant a change. By using infill drilling(drilling extra wells in between existing wells) in existing fields, the productionlevels in the larger countries of the Middle East have steadily increased. Allactivities towards better wells, using more seismic technology; introducingsmart-field technology, and piloting EOR techniques, all point to a desire to raiserecovery levels significantly and secure years of plateau production.
Using well technology to boost recovery from thin oil rims
Thin oil rims describe reservoirs where the oil sits in a thin layer between alarge volume of gas above it and water below. Oil production from thin oilrims is typically difficult. A well placed in the rim will usually produce mainlylarge volumes of water and gas. A prominent example of technology enablingIOR from thin oil rims is the development and production of the thin oil rim inthe Troll field offshore Norway. For a long time, it was uncertain whether theresources in the 12 m to 14 m thin oil zone in the Troll Vest gas province wouldbe technically and commercially exploitable.

74 RESOURCES TO RESERVES
However, total estimated recoverable reserves have gradually increased from145 mb in 1986 to 2 100 mb in 2009 (Figure 2.12). The increase was the resultof advances in horizontal and multilateral drilling, which enabled wells to bedrilled with a tolerance of +/-1 m in relation to the water zone underneath theoil reservoir.
Figure 2.12 • Evolution of recoverable oil reserves in the Troll field
mb
2 000
2 500
1 500
1 000
500
0
1985 1990 1995 2000 2005 2010
Estimated recoverable
Courtesy of Norwegian Petroleum Directorate.
Horizontal drilling reduces interference from the nearby water and gas layers,which again increases the productivity of thewells. By 1998, almost all producingwells in Troll were horizontal, with wells reaching up to 3 100 m in horizontalrange. The growth of recoverable reserves realised during the subsequentlifetime of the field has been possible because of the use of increasingly longerwell paths, (up to about 12 000 m) combined with multi-branch wells that allowadditional reservoir drainage. To date, more than 1 bb of oil have been producedfrom the Troll field.
Mature reserves: technologies for EOR
In the later so-called “tertiary” stages of production, sophisticated methods toimprove the displacement process and reduce the remaining oil in the reservoircan be introduced, assuming they are profitable. These include CO2 injection,detergent injection and even the growth of micro-organisms that can enhanceoil production. Thermal methods, such as steam injection and pumping downoxygen to ignite the oil nearest the injector well, increase reservoir temperatureand so reduce oil viscosity.
The Weyburn and Midale fields in Saskatchewan, Canada, provide a goodexample of the various stages that can take place, leading to implementation

CHAPTER 2 • RAISING RECOVERY EFFICIENCY FROM OILFIELDS 75
of an EOR scheme. Production at the Weyburn field started in the mid-1950swith conventional vertical wells. Primary production, followed bywater-flooding,infill drilling of vertical wells in the mid-1980s and horizontal wells in the 1990s,recovered a total of 370 mb or approximately 26% of the 1.4 bb of original oilin place. In 2000, a carbon dioxide-enhanced oil recovery (CO2-EOR) scheme wasimplemented using CO2 piped from a coal-gasification plant in North Dakotain the United States, which added a further 155 mb taking total recoverablereserves to 525 mb. The contribution of EOR resulted in the oil production levelreaching a 35-year high in 2006 (Figure 2.13).
Figure 2.13 • Impact of EOR technology on oil production from the Weyburn field,Canada
0
5 000
10 000
15 000
20 000
25 000
30 000
35 000
40 000
45 000
50 000
Jan-
55
Jan-
60
Jan-
65
Jan-
70
Jan-
75
Jan-
80
Jan-
85
Jan-
90
Jan-
95
Jan-
00
Jan-
05
Jan-
10
b/d
(gro
ss)
Primary recovery and waterflood
HorizontalinfillsVertical
infills
CO -
EOR2
Notes: vertical infills = infill of vertical wells by water injection; horizontal infills = pre-CO2 infillof horizontal wells by water injection.
Courtesy of Cenovus Energy.
A later section on CO2-EOR for greenhouse gas mitigation discusses in greaterdetail the role of EOR, using CO2 as a solvent, at Weyburn-Midale and addressesthe issues involved. The section also describes the Weyburn-Midale CO2monitoring and storage project currently in progress.
The move towards EOR technologiesIn the late 1970s and early 1980s, operators in the United States were alreadyconsidering the use of EOR technologies. The sharp increase in oil price,a favourable tax regime and a decrease in outputs in the United Stateshad spurred interest. Technologies were developed and field applicationstriggered. EOR applications in California and West Texas are still ongoing. Inthe late 1980s and the 1990s the oil price had collapsed and many initiativesto develop EOR technologies were stopped. EOR was not the mainstreamgrowth activity of the exploration and production industry in that period,which explains why there was only moderate progress in establishing higher

76 RESOURCES TO RESERVES
global recovery factors. In recent years, increase in oil price and concerns overthe security of supply have led to a renewed interest for EOR technologies byboth national and international oil companies.
Box 2.5 • Landscape of EOR techniques
Inmost reservoirs, EORor tertiary recovery is needed to extract agreater proportionof the oil-in-place or in some cases it is the only means to produce oil. Figure 2.14 shows the commonEOR techniques in current use. The feasibility of the various methods depends largely on thetype of oil, type of reservoir and additional field-specific conditions.Most types of EOR involvethe application of techniques to reduce viscosity and improve flow, e.g. gas flooding, chemicalflooding and/or the application of heat.
Figure 2.14 • Common EOR techniques currently in use
Thermal Gas flooding(miscible/non-miscible)
Chemical flooding
Conventional Unconventional
• Cyclic steaminjectionSteam drive•
••••
Thermal conductionIn-situ combustionElectric heatingSteam foam
Hydrocarbon
CO2
Air/N2
ASPSurfactantflooding
Biological
Polymerflooding
Notes: conventional refers to methods that have been in use for many years, whereas unconventional refers tonovel or unproven technologies. ASP = alkaline-surfactant-polymer; N2 = nitrogen gas.
Courtesy of Shell (adapted).
In gas flooding, the gas reduces the viscosity of the oil, thereby making it flow more easily.“Associated natural gas”, or the gas produced naturally with oil, is often used for floodingespeciallywhen there is no significant localmarket for it.When the gas ismiscible (i.e. itmixesfully) with the oil at reservoir conditions, the gaswill also displace the residual oil.Miscible gasinjectionwill producemore oil than gas that is notmiscible. CO2 injection, oftenmiscible withthe oil, is increasingly popular in the United States and accounts for about 4% of domesticoil production.

CHAPTER 2 • RAISING RECOVERY EFFICIENCY FROM OILFIELDS 77
Chemical EOR mainly involves polymer injection to increase the viscosity of the displacingfluid and ASP flooding to mobilise residual oil. Polymer injection helps when the oil viscosityis high and/or the reservoir is very heterogeneous. ASP will reduce the interfacial tensionbetween the in-place crude oil and the injected water, mobilising residual oil. However,the cost of surfactants and polymers can be high and chemical EOR is a complex process(Box 2.6). In thermal EOR, heat is introduced into the reservoir to reduce oil viscosity. This isapplicable mostly to heavy or viscous crude oils.
In the future, nanoparticles may provide the solution. Currently, research and developmentis under way to explore the potential for nanoparticles to measure and to modify reservoirproperties. If particles can be developed to modify reservoir rock and fluid attributes, theymay be deployed to enhance recovery from the reservoir.
Whether or not EOR technologies are suitable depends on the characteristics ofthe oilfield and its state of depletion. Over the years, key criteria for assessingthe suitability of EOR technologies have been developed (Table 2.2). The crudeoil gravity (or API10) is generally the first parameter to be considered, as mostmiscible flooding techniqueswork only for lighter crudes. The second parameteris the amount of oil left in the field due to by-passing areas or a high residual oilsaturation (Box 2.6). Chemical EOR is an option, while CO2-EOR can be usedwhenmore than 20% of the oil is still recoverable. The oilfield temperature is the nextvariable, e.g. polymer flooding and ASP require more expensive chemicals whenthe temperature is over 95°C.
Table 2.2 • Pre-screening criteria for EOR
Technology API Remainingrecoverableresources
(% of initialreserves)
Formationtype
(carbonate/sandstone)
Depth(metres)
Permeability(md)
Temperature(°C)
Requiredadditionalrecovery
factor(%)
Nitrogen > 35 > 40 Carbonate > 2 000 190 – –
Hydrocarbon > 25 > 30 Carbonate > 1 350 – – 20-40
CO2 > 25 > 20 Carbonate > 700 – – 5-25
Polymer > 15 > 70 Sandstone < 3 000 > 10 < 95 5-30
Surfactant/micellar > 18 > 35 Sandstone < 3 000 > 10 < 95 5-30
Thermal/combustion > 10 > 50 Sandstone > 50 > 50 > 40 –
Thermal/stearm > 8 > 40 Sandstone < 1 500 > 200 – 10-60
Note: md refers to millidarcy, unit of permeability. Here it is used as a measure of the permeability of rock.
Source: IEA, 2008.
10. API (American Petroleum Institute) gravity is a measure of the density of oil. The API gravity scale is calibrated such thatmost crude oils, as well as distillate fuels, will have API gravities between 10° and 70° API. The lower the number, the heavierand themore viscous is the oil.
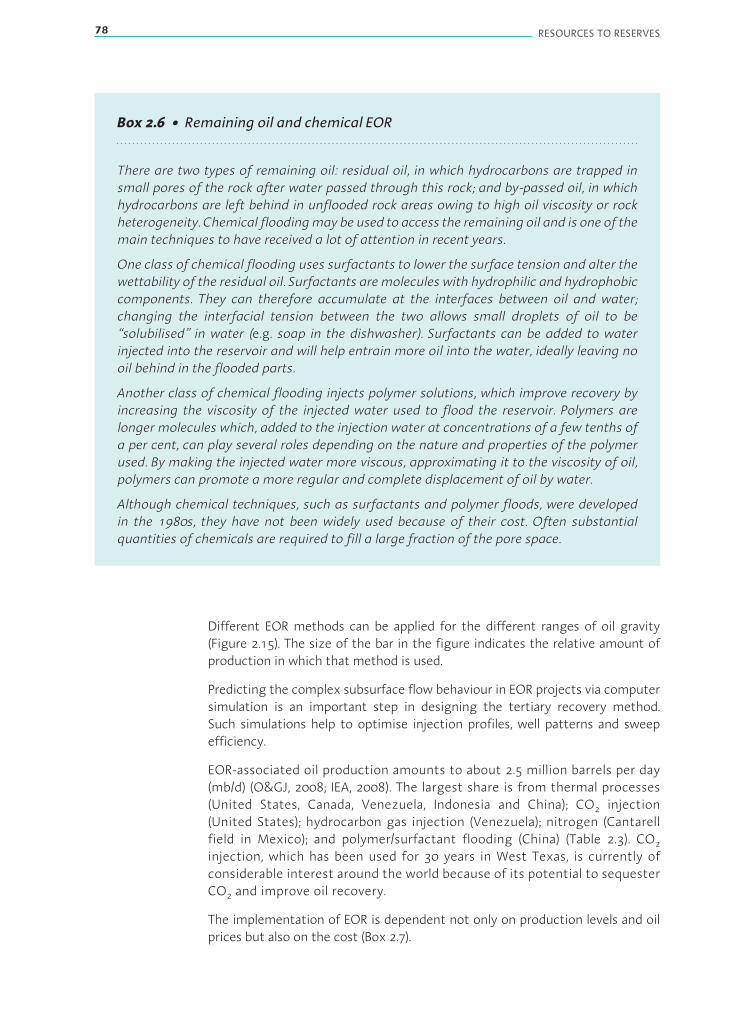
78 RESOURCES TO RESERVES
Box 2.6 • Remaining oil and chemical EOR
There are two types of remaining oil: residual oil, in which hydrocarbons are trapped insmall pores of the rock after water passed through this rock; and by-passed oil, in whichhydrocarbons are left behind in unflooded rock areas owing to high oil viscosity or rockheterogeneity. Chemical floodingmay be used to access the remaining oil and is one of themain techniques to have received a lot of attention in recent years.
One class of chemical flooding uses surfactants to lower the surface tension and alter thewettability of the residual oil. Surfactants are molecules with hydrophilic and hydrophobiccomponents. They can therefore accumulate at the interfaces between oil and water;changing the interfacial tension between the two allows small droplets of oil to be“solubilised” in water (e.g. soap in the dishwasher). Surfactants can be added to waterinjected into the reservoir and will help entrain more oil into the water, ideally leaving nooil behind in the flooded parts.
Another class of chemical flooding injects polymer solutions, which improve recovery byincreasing the viscosity of the injected water used to flood the reservoir. Polymers arelonger molecules which, added to the injection water at concentrations of a few tenths ofa per cent, can play several roles depending on the nature and properties of the polymerused. By making the injected water more viscous, approximating it to the viscosity of oil,polymers can promote a more regular and complete displacement of oil by water.
Although chemical techniques, such as surfactants and polymer floods, were developedin the 1980s, they have not been widely used because of their cost. Often substantialquantities of chemicals are required to fill a large fraction of the pore space.
Different EOR methods can be applied for the different ranges of oil gravity(Figure 2.15). The size of the bar in the figure indicates the relative amount ofproduction in which that method is used.
Predicting the complex subsurface flow behaviour in EOR projects via computersimulation is an important step in designing the tertiary recovery method.Such simulations help to optimise injection profiles, well patterns and sweepefficiency.
EOR-associated oil production amounts to about 2.5 million barrels per day(mb/d) (O&GJ, 2008; IEA, 2008). The largest share is from thermal processes(United States, Canada, Venezuela, Indonesia and China); CO2 injection(United States); hydrocarbon gas injection (Venezuela); nitrogen (Cantarellfield in Mexico); and polymer/surfactant flooding (China) (Table 2.3). CO2injection, which has been used for 30 years in West Texas, is currently ofconsiderable interest around the world because of its potential to sequesterCO2 and improve oil recovery.
The implementation of EOR is dependent not only on production levels and oilprices but also on the cost (Box 2.7).
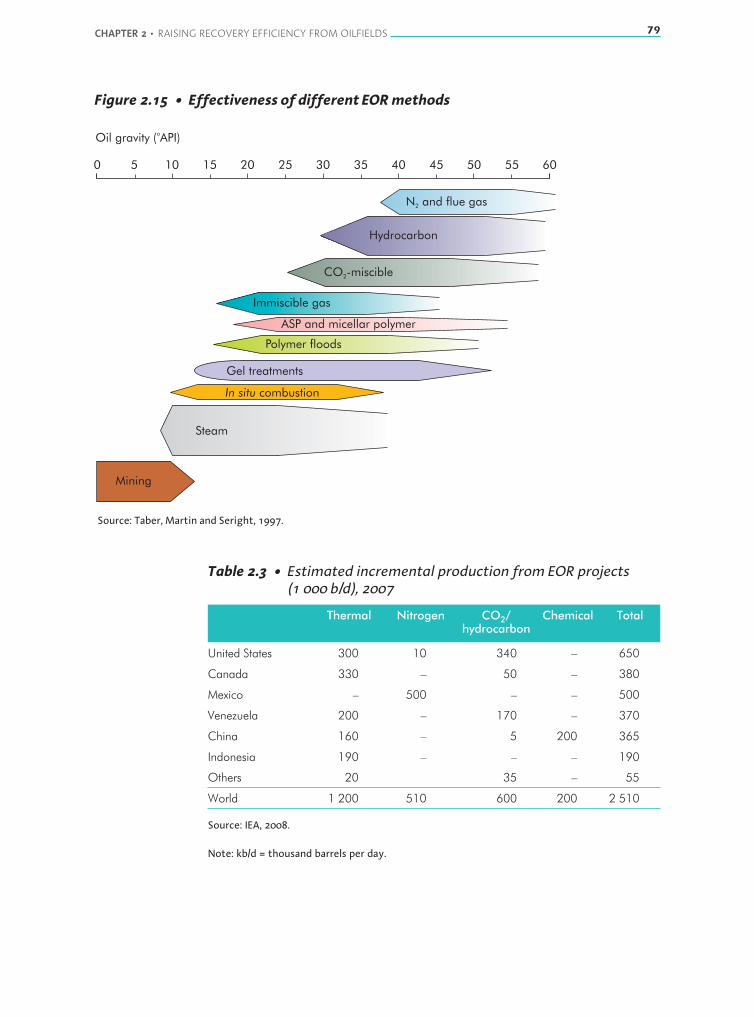
CHAPTER 2 • RAISING RECOVERY EFFICIENCY FROM OILFIELDS 79
Figure 2.15 • Effectiveness of different EORmethods
0 5 10 15 20 25 30 35 40 45 50 55 60
Oil gravity ( API)o
Mining
Steam
In situ combustion
Gel treatments
Polymer floods
ASP and micellar polymer
Immiscible gas
CO -miscible2
Hydrocarbon
N and flue gas2
Source: Taber, Martin and Seright, 1997.
Table 2.3 • Estimated incremental production from EOR projects(1 000 b/d), 2007
Thermal Nitrogen CO2/hydrocarbon
Chemical Total
United States 300 10 340 – 650
Canada 330 – 50 – 380
Mexico – 500 – – 500
Venezuela 200 – 170 – 370
China 160 – 5 200 365
Indonesia 190 – – – 190
Others 20 35 – 55
World 1 200 510 600 200 2 510
Source: IEA, 2008.
Note: kb/d = thousand barrels per day.

80 RESOURCES TO RESERVES
Box 2.7 • The power of market prices
The prospects for IOR and EOR have recently been boosted by higher oil prices. However,energy feedstock prices for thermal processes and hydrocarbon displacement, increaseddemand for CO2, and the impact of higher oil prices on surfactants and polymers have allled to a sharp rise in costs in recent years. Nonetheless, the cost of EOR is still acceptable andranges from just under USD 20 to USD 80 per incremental barrel of oil.
Hydrocarbon gas EOR can also be attractive when gas is available in the same, ornearby, fields. Indeed, if transport infrastructure to market does not exist, it isessentially a zero-value product, which is likely to be flared, producing significantCO2 emissions. Hydrocarbon gas injection EOR schemes are used inmany placesaround the world and have increased recovery between 5% and 10%. The EORschemes can be combined with water injection, either by alternatingWAG or bysimultaneous injection as a water/gas mixture or as foam.
EOR production is set to increase with time. In the Reference Scenario of the IEAWorld Energy Outlook 2008, additional production resulting from EOR (over andabove current EOR output) was projected to contribute an additional 6.4 mb/dto world oil supply by 2030, with most of the increase occurring after 2015(Figure 2.16) (IEA, 2008).
Figure 2.16 • Production from EOR in theWEO2008 Reference Scenario,by country
2015 2030
United States
Saudi Arabia
China
Kuwait
Canada
Russia
United Arab Emirates
Qatar
Algeria
Oman
mb
0 0.5 1.0 1.5 2.0 2.5
Source: IEA, 2008.

CHAPTER 2 • RAISING RECOVERY EFFICIENCY FROM OILFIELDS 81
Three-quarters of this increase comes from four countries: the United States,Saudi Arabia, Kuwait and China (in ranked order). Cumulative production in2007-30 amounts to 24 bb, out of an estimated potential of about 300 bb, ofwhich one-third is in Saudi Arabia.
Most of the new EOR projects implemented during the projection period2007-30 involve CO2 injection. In total, about 9.8 gigatonnes of CO2 are capturedand stored in CO2-EOR oil projects over the period. These projects are exclusivelyonshore, as the projection assumed that the technology for offshore CO2-EORwould not be sufficiently advanced for it to be deployed before the end of theprojection period.
CO2 injection for EOR
The attraction of CO2 injection is that it is miscible with oil at a much lowerpressure than natural gas and under reservoir conditions it has a similardensity to oil. CO2-EOR was initially deployed in the 1970s and is used mostlyonshore with a small inter-well distance. In addition to expanding the use ofthe technology to new onshore areas, recent work has suggested there mayindeed be considerable future potential for using it offshore (ARI, 2010a) and inlarger reservoirs (USDOE/NETL, 2010). Experience in Texas shows that in suitablereservoirs, oil recoverymay increase to between 5%and 15%of the oil initially inplace. An assessment of the potential in the United States shows that improvedCO2-EOR, in combination with 4-D seismic, advanced well monitoring andcontrol, and reservoir simulation could add 119 bb of technically recoverable oiland 66 bb of economically recoverable oil (ARI, 2010b) in the United States alone.
In Texas, it is estimated that there are about 48 billion additional barrels ofoil, primarily in the Permian Basin, eastern Texas and the Gulf Coast, that canonly be reached by using CO2-EOR together with advanced monitoring andcontrol (ARI, 2010b). Texas is working at full capacity of available CO2 supply(predominantly from natural sources) and uses about 30 million tonnes (Mt) ofCO2 annually.
The worldwide potential for CO2-EOR is between 200 bb and 300 bb, equalto between 10% and 15% of current remaining recoverable conventional oilresources using primary and secondary recovery techniques. The Middle Eastand North America are thought to hold the greatest potential (Figure 2.17).
The potential is greatest for newer fields with relatively low depletion levelsbecause the costs of installing the required equipment and facilities aresubstantial, particularly for offshore fields (Tzimas et al., 2005). Older facilitiesare also often not resistant to corrosion by CO2/water mixtures and thus incurlarge replacement costs. Incremental recovery rates with EOR from offshorefields are expected to be lower than from onshore fields because of differentwell configurations and complex facility issues.
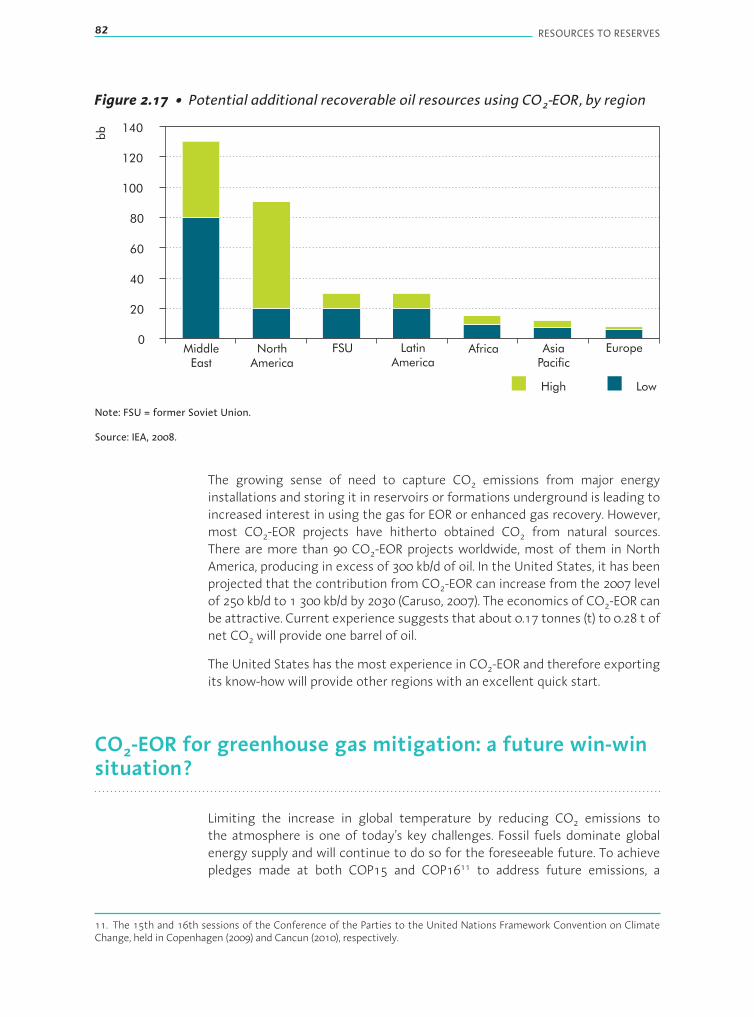
82 RESOURCES TO RESERVES
Figure 2.17 • Potential additional recoverable oil resources using CO2-EOR, by region
140
120
100
80
60
40
20
0Middle
EastNorth
AmericaFSU Latin
AmericaAfrica Asia
Pacific
Europe
High Low
bb
Note: FSU = former Soviet Union.
Source: IEA, 2008.
The growing sense of need to capture CO2 emissions from major energyinstallations and storing it in reservoirs or formations underground is leading toincreased interest in using the gas for EOR or enhanced gas recovery. However,most CO2-EOR projects have hitherto obtained CO2 from natural sources.There are more than 90 CO2-EOR projects worldwide, most of them in NorthAmerica, producing in excess of 300 kb/d of oil. In the United States, it has beenprojected that the contribution from CO2-EOR can increase from the 2007 levelof 250 kb/d to 1 300 kb/d by 2030 (Caruso, 2007). The economics of CO2-EOR canbe attractive. Current experience suggests that about 0.17 tonnes (t) to 0.28 t ofnet CO2 will provide one barrel of oil.
The United States has themost experience in CO2-EOR and therefore exportingits know-how will provide other regions with an excellent quick start.
CO2-EOR for greenhouse gas mitigation: a future win-winsituation?
Limiting the increase in global temperature by reducing CO2 emissions tothe atmosphere is one of today’s key challenges. Fossil fuels dominate globalenergy supply and will continue to do so for the foreseeable future. To achievepledges made at both COP15 and COP1611 to address future emissions, a
11. The 15th and 16th sessions of the Conference of the Parties to the United Nations Framework Convention on ClimateChange, held in Copenhagen (2009) and Cancun (2010), respectively.
CHAPTER 2 • RAISING RECOVERY EFFICIENCY FROM OILFIELDS 83
significant adoption of carbon capture and storage (CCS) is projected over thecoming decades (IEA, 2011). The CO2 captured must be permanently12 stored ingeological formations selected such that virtually all of the CO2 will be trappedin the subsurface. The types of formation chosen for geological storage includesaline aquifers (i.e. porous and permeable bodies of rock containing salty water),depleted oil and gas reservoirs, or oil reservoirs that still contain mobile oilthat may be displaced by injection of CO2 and then recovered. Saline aquifers,although the least well characterised at present, appear to offer the greatestpotential for storing CO2 in the long run. However, it has been proposed thatusing the CO2 captured from new power stations for CO2-EOR will not onlybe economically attractive and benefit the environment but could also lead toincreased energy security (ARI, 2010c).
In fact, a study on optimising CO2 storage in CO2-EOR projects predicts a muchlarger EOR target worldwide than suggested in Figure 2.17 and concludes thatcaptured anthropogenic CO2 should be seen as a long-term supply source foraffordable, reliable CO2 needed to mature these targets (ARI, 2010c). Currently,most CO2-EOR operators believe that the relatively low availability of CO2 islimiting the industry’s capacity to expand the application of CO2-EOR.
Storage aspectsIn geological storage, CO2 is injected under pressure into suitable geologicalstructures that contain natural trapping mechanisms like anticline-shapedimpermeable cap rocks. The gas is injected at sufficiently high pressures andtemperatures that it becomes a supercritical fluid that can still flow easilythrough the pore spaces but occupies much less space than gases. Highpressure at sufficient depths (over 800 m) maintains the supercritical fluidstate. Supercritical CO2 compresses further with depth, increasing the amountthat can be stored in the same volume (Figure 2.18). The blue numbers showthe volume occupied by CO2 at each depth compared to a reference volume of100 volumetric units as a gas at the surface.
Oil andgas reservoirs occur innatural traps thathavecontainedoil, gas andwaterformillionsof years. If thiswerenot the case, today’s predominantly hydrocarbonenergy economy would not exist. The geology of most oil and gas fields is wellunderstood. InjectingCO2 intohydrocarbon fields under developmentdoes incursome risk because these fields have experienced previous human intervention.The greatest risk of CO2 leakage is not from the injection well but from otherwells, such as abandoned productionwells, that penetrate the storage formationandmaybe improperly sealed (Ide, Friedmann andHerzog, 2006). Before decidingon CO2 injection into oil or gas reservoirs as a means of permanently containingthe CO2, prior drilling activity in the area needs to be investigated, e.g. againstinformation that has previously been recorded, and well conditions verified.The existence of older, poorly documented wells in the area being proposed forinjection could pose leakage risks.
12. In this context, “permanent” means that the injected CO2 will be stored safely and securely over geological time scales, i.e.very long periods of time by any humanmeasure (tens of thousands of years or longer).

84 RESOURCES TO RESERVES
Traditionally, most CO2-EOR projects have been designed to minimise theamount of CO2 injected per incremental barrel of oil produced. However, thereare opportunities to modify reservoir management strategies to optimise andincrease the capacity for CO2 storage in CO2-EOR fields. Such optimisation couldinclude reducing water injection and leaving the pore space filled with CO2 atfield abandonment. Another option would be to flood reservoir zones below theOWC to release any residual oil that could not be recovered under a water-flood.Such zones are known as residual oil zones.
Figure 2.18 • Density and volume occupied by supercritical CO2at different injection depths
CO as a gas2
Groundlevel
Critical depth(approx.)
CO2 as a
supercritical fluid
Density of CO (kg/m )2
3
Depth
(km
)
0.27
0.27
0.28
0.32
1.1
2
10
100
0 200 400 600 800 1 000
0
0.5
1
1.5
2
2.5
Note: kg/m3 = kilogram per cubic metre.
Source: CO2CRC, 2009.
CO2-EOR could be viewed as a component of CCS, where the revenues from EORcontribute to the overall cost of the CCS operation. Subsequent to the EOR phase,insteadofabandoningthefield,activitiescouldthenbeswitchedtofocusonCO2storage.
The Weyburn-Midale projectA key pilot project in which CCS and EOR are combined is the Weyburn-Midaleproject. In 2000 a CO2-EOR project began at the Weyburn oilfield. Production

CHAPTER 2 • RAISING RECOVERY EFFICIENCY FROM OILFIELDS 85
in the field, which is now operated by the Cenovus Corporation following asplit from Encana at the end of 2009, began more than a half century ago.Primary and water-flooding stages, augmented with vertical and horizontal-well infill drilling, had already been carried out on the oilfield before the startof the EOR project. In 2005, Apache Canada implemented a similar CO2 flood inits neighbouring Midale field and both projects are now managed as a singleproject.
The CO2 is produced and supplied by the Dakota Gasification Company lignitegasification plant in Beulah, North Dakota. The plant produces 13 000 tonnesper day (t/d) of CO2, although not all is captured. Approximately 8 000 t/d arecompressed to 15 megapascals (MPa) and transported as a supercritical fluidvia a 325 km pipeline to the oilfields in Saskatchewan, Canada (Figure 2.19).
Figure 2.19 • Weyburn-Midale CO2 pipeline
Weyburn
Beulah
Regina
Estevan
Bismarck
C A N A D A
U N I T E D S T A T E S
Montana North Dakota
Saskatchewan
Manitoba
This map is without prejudice to the status of or sovereignty over any territory, to the delimitation of international frontiers and boundaries,and to the name of any territory, city or area.
Source: IEA GHG,13 2006.
13. The “ImplementingAgreement for aCo-operative ProgrammeonTechnologies Relating toGreenhouseGasesDerived fromFossil Fuel Use” (or “IEA GHG”) is one of more than 40 Implementing Agreements that comprise the IEA energy technologynetwork. It is often referred to as the IEA Greenhouse Gas Research and Development Programme (IEA GHG). Further detailsmay be found on accessing its website (www.ieaghg.org).
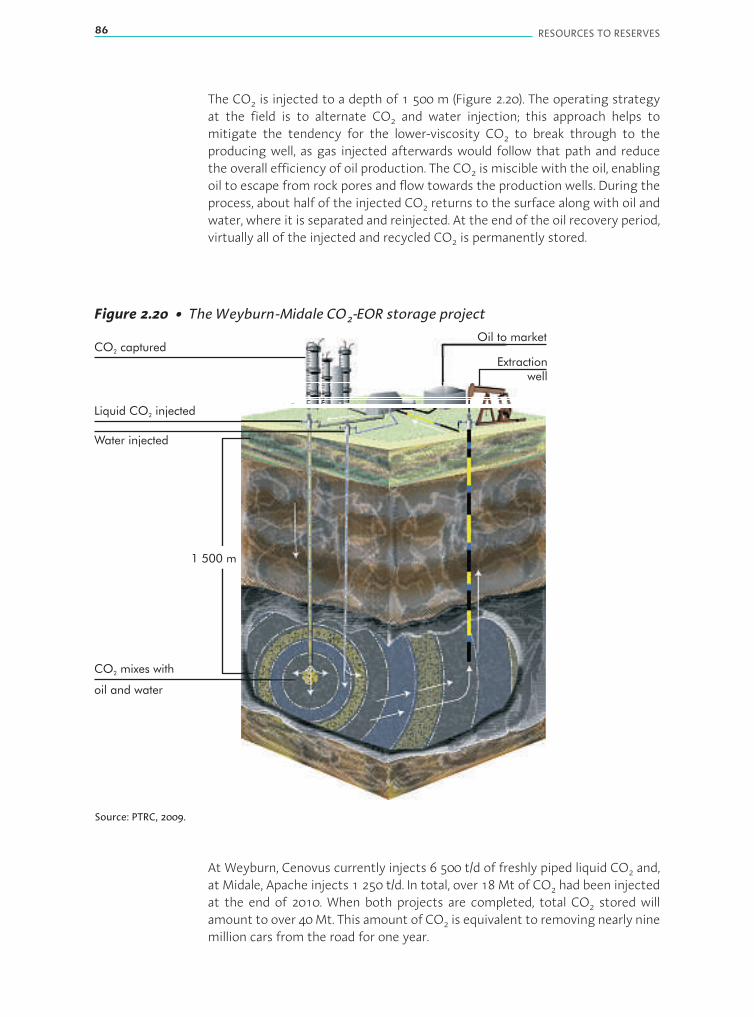
86 RESOURCES TO RESERVES
The CO2 is injected to a depth of 1 500 m (Figure 2.20). The operating strategyat the field is to alternate CO2 and water injection; this approach helps tomitigate the tendency for the lower-viscosity CO2 to break through to theproducing well, as gas injected afterwards would follow that path and reducethe overall efficiency of oil production. The CO2 is miscible with the oil, enablingoil to escape from rock pores and flow towards the production wells. During theprocess, about half of the injected CO2 returns to the surface along with oil andwater, where it is separated and reinjected. At the end of the oil recovery period,virtually all of the injected and recycled CO2 is permanently stored.
Figure 2.20 • The Weyburn-Midale CO2-EOR storage project
CO captured2
Liquid CO injected2
Water injected
CO mixes with
oil and water
2
Oil to market
Extractionwell
1 500 m
Source: PTRC, 2009.
At Weyburn, Cenovus currently injects 6 500 t/d of freshly piped liquid CO2 and,at Midale, Apache injects 1 250 t/d. In total, over 18 Mt of CO2 had been injectedat the end of 2010. When both projects are completed, total CO2 stored willamount to over 40Mt. This amount of CO2 is equivalent to removing nearly ninemillion cars from the road for one year.
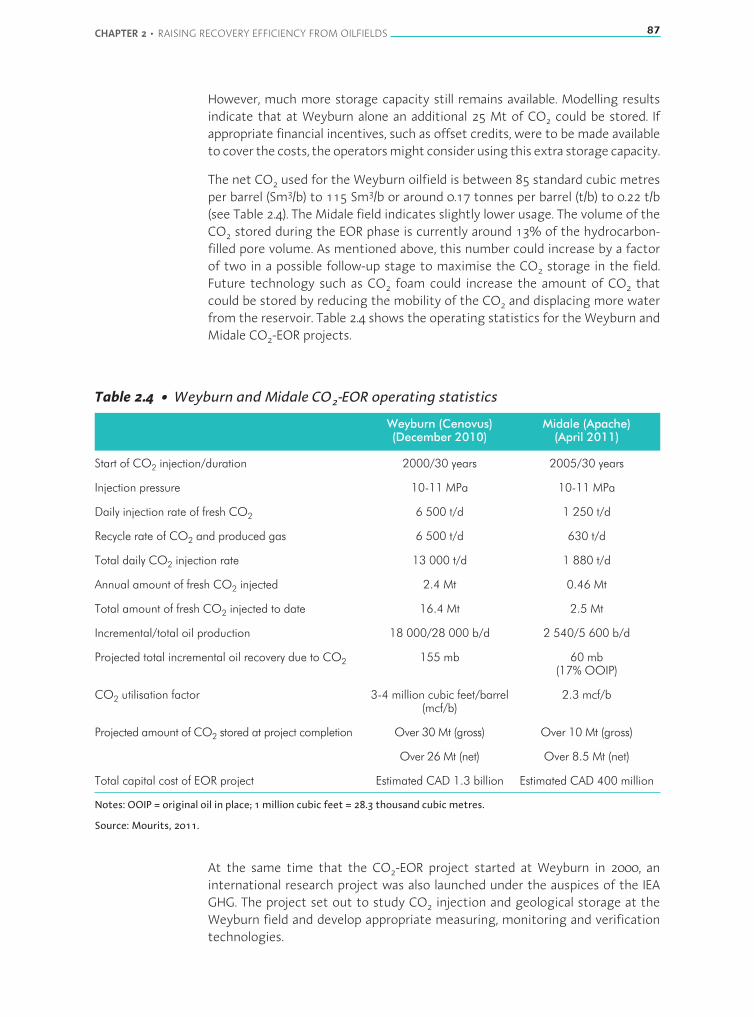
CHAPTER 2 • RAISING RECOVERY EFFICIENCY FROM OILFIELDS 87
However, much more storage capacity still remains available. Modelling resultsindicate that at Weyburn alone an additional 25 Mt of CO2 could be stored. Ifappropriate financial incentives, such as offset credits, were to bemade availableto cover the costs, theoperatorsmight consider using this extra storagecapacity.
The net CO2 used for the Weyburn oilfield is between 85 standard cubic metresper barrel (Sm3/b) to 115 Sm3/b or around 0.17 tonnes per barrel (t/b) to 0.22 t/b(see Table 2.4). The Midale field indicates slightly lower usage. The volume of theCO2 stored during the EOR phase is currently around 13% of the hydrocarbon-filled pore volume. As mentioned above, this number could increase by a factorof two in a possible follow-up stage to maximise the CO2 storage in the field.Future technology such as CO2 foam could increase the amount of CO2 thatcould be stored by reducing the mobility of the CO2 and displacing more waterfrom the reservoir. Table 2.4 shows the operating statistics for theWeyburn andMidale CO2-EOR projects.
Table 2.4 • Weyburn and Midale CO2-EOR operating statistics
Weyburn (Cenovus)(December 2010)
Midale (Apache)(April 2011)
Start of CO2 injection/duration 2000/30 years 2005/30 years
Injection pressure 10-11 MPa 10-11 MPa
Daily injection rate of fresh CO2 6 500 t/d 1 250 t/d
Recycle rate of CO2 and produced gas 6 500 t/d 630 t/d
Total daily CO2 injection rate 13 000 t/d 1 880 t/d
Annual amount of fresh CO2 injected 2.4 Mt 0.46 Mt
Total amount of fresh CO2 injected to date 16.4 Mt 2.5 Mt
Incremental/total oil production 18 000/28 000 b/d 2 540/5 600 b/d
Projected total incremental oil recovery due to CO2 155 mb 60 mb(17% OOIP)
CO2 utilisation factor 3-4 million cubic feet/barrel(mcf/b)
2.3 mcf/b
Projected amount of CO2 stored at project completion Over 30 Mt (gross) Over 10 Mt (gross)
Over 26 Mt (net) Over 8.5 Mt (net)
Total capital cost of EOR project Estimated CAD 1.3 billion Estimated CAD 400 million
Notes: OOIP = original oil in place; 1 million cubic feet = 28.3 thousand cubic metres.
Source: Mourits, 2011.
At the same time that the CO2-EOR project started at Weyburn in 2000, aninternational research project was also launched under the auspices of the IEAGHG. The project set out to study CO2 injection and geological storage at theWeyburn field and develop appropriate measuring, monitoring and verificationtechnologies.

88 RESOURCES TO RESERVES
Specifically, the objectives of the first phase of the study were to developmonitoring and modelling methods to address the long-term migration andfate of the injected CO2. A comprehensive analysis of various methodologiesalso set out to verify that oil reservoirs could contain CO2 securely andeconomically (IEA GHG, 2006; Mourits, 2008).
A key advantage of Weyburn and an important reason for starting theIEA GHG research project at the field was the availability of 50 yearsof production data, and the large number of wellbores with associatedgeological and geophysical logging data. In addition, the pre-existingwellbores also presented an environment suitable for testing the potentialfor CO2 leakage to the surface.
On the basis of the results from Phase I, the geological setting at Weyburn-Midale appeared to be highly suitable for the long-term geological storage ofCO2. The results included an estimation of the storage capacity of the field anda risk assessment of the injected CO2 over a period of 5 000 years.
Probability analyses and numerical simulations, based on geochemical fluidsampling and seismic surveys, indicated that after 5 000 years all but anegligible amountofCO2would remain in theWeyburn reservoir and adjoiningregions (IEA GHG, 2008). It was also found that, within the time period, almost75% of the CO2 would be trapped by dissolution in the reservoir fluids (brineand oil). All of the remainder would be trapped through mineralisation, henceprecluding any further upward movement of the CO2 (Figure 2.21). While theultimate goal is mineral trapping of CO2, storage of injected CO2 in the shortterm (over the next 50 years) is most likely to be accomplished by solubilitytrapping in water and ionic trapping of CO2 as bicarbonate ions.
Figure 2.21 • CO2 trapped by different mechanisms
0.3%
27.5%
44.2%
Dissolution in oil
Solubility trapping in water
Mineral trapping
Ionic trapping in water
28.0%
Source: Wilson and Monea, 2004.
CHAPTER 2 • RAISING RECOVERY EFFICIENCY FROM OILFIELDS 89
The final report from Phase I contains the most complete and comprehensivepeer-reviewed data for the geological storage of CO2 in the world. Phase I wascompleted in 2004.
A second phase, entitled the IEA GHG Weyburn-Midale CO2 Monitoring andStorageProject, started in2005andranuntil 2012. Projectparticipantscomprisedsix governments or government agencies, including Natural Resources Canada(NRCan), the provincial governments of Alberta and Saskatchewan, the UnitedStates Department of Energy (US DOE), the Japanese Research Institute ofInnovative Technology for the Earth and the IEAGHG, aswell as tenCanadian andinternational energy companies. The Petroleum Technology Research Centremanaged the technical components of the project, while NRCan managed thenon-technical components.
The technical and non-technical accomplishments of the second phase aredescribed in abest-practicesmanual (Hitchon, 2012) that contains both technicaland non-technical components. The technical components are intended to serveas protocols for the design, implementation, monitoring and verification ofEOR-type CO2 storage projects. The technical part also includes guidance ontopics such as site characterisation/selection; well-bore integrity; monitoringand verification; and risk assessment. The non-technical part of the manualaddresses measures to accelerate the development of appropriate regulationsfor CO2 storage; of effective public communication and outreach; and of publicpolicy that provides effective incentives to ensure the widespread deploymentof CCS in the long term. Many of the methodologies and findings of the projectare applicable to CO2 storage in other types of geological formations.
The Weyburn-Midale CO2-EOR operations demonstrate that the technologycould, given the right circumstances, provide a win-win approach for CCS as animportant contributor to global climate mitigation in the decades to come.
Costs and carbon creditsWhen considering the commercial viability of a CO2-EOR project involving thecapture of CO2 at a power-generating plant, several factors must be taken intoaccount. Clearly, energy costs are substantial for CO2 capture, transportationand injection, all of which emit CO2. The process adds infrastructure to a powerplant with associated capital costs, pipeline costs depending on the distancetransported, and infrastructure needed to inject the CO2 into the reservoir.Purity requirements for CO2 can lead to the added cost of separating the gasat the power plant. Monitoring, measuring and verification costs post-injectionwill be part of the regulatory compliance requirements. All of these added costsneed to be balanced against the value of the incremental crude oil producedplus the value of CO2 credits, if and when these are available. All of these factorsneed to be taken into account in order to assess the commercial viability of aCO2-EOR project.
In many cases, CO2-EOR is not considered financially viable because of the highprice of CO2 from power station capture. Therefore, a carbon credit or otherfinancial incentives are needed to cover the difference. So far, CCS projects are

90 RESOURCES TO RESERVES
not entitled to such credits. At the end of 2010 in Cancun, the United NationsFramework Convention on Climate Change (UNFCCC) decided that CCS couldqualify for credits from the Clean DevelopmentMechanism (CDM) provided thata number of issues are resolved. Issues included monitoring, site selection, riskassessment, definition of liability and others. However, given the low prices (lessthanUSD 5/t CO2) at which CDMcredits have been and are still being traded, it isunlikely that CDM credits will provide a strong stimulus for CCS projects, at leastfor some time to come. Therefore, CO2-EOR could be viewed as a way to offsetpart of the cost of CCS projects. In areas with multiple fields in close proximity,a CO2 pipeline infrastructure could help to improve economics, but the initialcosts of such systems are still a hurdle.
Being smart with smart fields
Since the end of the 1990s, a number of large oil companies, including Shell, BP,Saudi Aramco and Statoil, have been piloting so-called smart field technology.The concept of smart field is also known as “intelligent field”, “digital oilfield”,“integrated operations” or “field of the future”. These days, many national andinternational oil companies have integrated smart fields as part of their strategy.For example, in 2010 Kuwait Oil Company (KOC) started the Kuwait IntegratedDigital Field programme.
Smart field technology is not just a single technology but covers a whole rangeof new and advanced technologies. The technologies range from sophisticatedwells, to fast communication technology (e.g. fibre and wireless) to virtualcollaborative working environments. New information and communicationtechnology plays a key, central role in any implementation, which explains theadjectives intelligent and digital. An important aspect of a smart field is thatthese advanced technologies are used in an integratedmanner tomaximise theirpotential.
Smart fields are not only about technology but also about people and workprocesses. To exploit the opportunities of smart field technologies, workprocesses have to be adapted. Integration is also the key word here (integratedoperations). Companies, such as the KOC, position digital field projects ascompany-wide transformation projects that prepare the company for the future(field of the future).
The overall objective of smart fields is to optimise planning and operations,resultinginhighershareholdervalueandimprovedhealthandsafetyperformance.Hence, a smart field is one that can be in continuous use 24 hours a day, sevendays a week. The underlying philosophy is that the total value that can becreated from a field depends on: how precisely the hydrocarbons in the groundcan be determined; how efficiently those hydrocarbons can be recovered; howto optimise production and well facilities; and how to improve the overallfield performance throughout the field lifecycle on time scales ranging fromseconds to field life. Optimising the use of equipment for maximum efficiencyis achieved over differing time scales. For example, for gas lift, improvements

CHAPTER 2 • RAISING RECOVERY EFFICIENCY FROM OILFIELDS 91
can be seen in real time, for production or pipeline systems it could be days oreven weeks, and for water-flood management it can take months or even years(Figure 2.22). The concept is not to focus on portfolio management but, instead,to consider the complete system in a more holistic manner.
Figure 2.22 • Smart fields focus on short-term production and longer-term reservoirmanagement
Time
decadesyearsdays
Space
company
asset
field
well
Historic dataand forecast
Historic dataand forecast
Objectivesand constraints
Objectivesand constraints
Portfolio managementbusiness planning
Reservoir managementfield development planning
Production managementproduction planning
Courtesy of W. Schulte.
Smart field technologiesApplications of leading oil operators to create smart fields reveal five technologyenablers that are key to the successful implementation of smart fields. These are:
■ Measurement (sensors).Thebasis ofprovidinghigh-qualitydata lies inmeasuringtheprocesses that are vital to thebusiness of the company, particularly in drillingand production. Examples include the traditional measurement technologiesthat are deployed in the production process for wells (pressure, temperature,flow), for topside equipment such as compressors and separators (pressures,temperatures, revolutions per minute, densities) and for drilling (logging whiledrilling, measuring while drilling, wire-line logging). Recent years have seen theuptake of advanced technologies, as illustrated by Shell’s experience in BruneiChampion West and BP’s experience at Plutonia. These technologies involvedistributing sensor technologies in wells to acquire measurements along the(full) trajectory of a well during production. Such sensor technologies includefibre optic technology, down-hole pressure and temperature sensors, and (down-hole) multiphase flowmetering.
■ Communication. Communication technologies are used to transportmeasurement data to central data-acquisition servers in control rooms set upat the field. Typically this is real-time data, which is acquired every ten secondsby remote terminal units. Subsequently, these technologies are used to linkup control rooms and support centres and/or central offices. A range of well-established technologies is successfully used for this, such as wireless solutionsand fibre optics.

92 RESOURCES TO RESERVES
■ Database management systems (DBMS).Forstoringandretrieving largeamountsof real-time data and other data, information technology companies provide awhole host of existing solutions (relational and time-stamped DBMS). Thesegeneric DBMS are customised into solutions that are geared towards usage byoil companies.
■ User interface. Typically, data will be interfaced to three distinctly differenttypes of locations and users: operations (central control rooms for drilling andfor production), operations support in special support centres at offices typicallylocated far from field operations and field development teams.
■ Control (actuators). Once a decision has been taken on how to manage acertain process, remote-controlled actuators are required to change the controlparameters of that process intoone that is cost-effective, convenient and timely.For example, to change a choke setting, the personnel no longer have to go outto the well-head, which is labour-intensive, inconvenient and takes time beforechoke settings are changed. Other examples of processes that can be remotelycontrolled include separator trains, routine well testing, manifold valve settings,and subsurface well inflow. In an advanced smart field process, parametersmay be set automatically by dedicated software tools, such as the automaticshut-down of a well in case certain limits (e.g. water-cut levels) are violated. Ina very advanced smart field, processes may even be controlled automaticallyon a continuous basis by closed-loop, model-based optimisation programmes.An optimisation programme triggers changes in operational settings based oncalculated responses, reads the actual response of the field to these changedsettings and analyses how best to further improve the settings.
Smart field collaborationThebestexamplesof changedworkprocessesare the impressivecontrol roomswiththeir wall-covered monitors. Such facilities create a virtual, collaborative workingenvironment. It brings together petroleum engineers, well services, and offshoreoperations staff in virtual real-time decisionmaking. This embeds a completely newway of working in the organisation, based on the philosophy of how the field shouldbemanaged. It really means one operation based on one dataset, one plan and onecommonsetofpriorities.Thatdoesnotsound like rocketscience,but it isahugestepfor oil companies and leads to better, faster decisionmaking.
The advantages of smart fieldHaving the vision to use smart fields in practice is not one-size-fits-all, becauseevery field has unique features. Geological, environmental, economic and evenpolitical circumstances differ from case to case. Such circumstances change theway in which fields can be optimised and necessitate a customised solution forthe whole field operation.
When assessing the added value of implementing smart field technology andwork processes, it is worth considering that just as the smart field touches uponneeds on multiple levels of the organisation, the value created is also many-faceted. Some advantages are easy to quantify, such as increased production
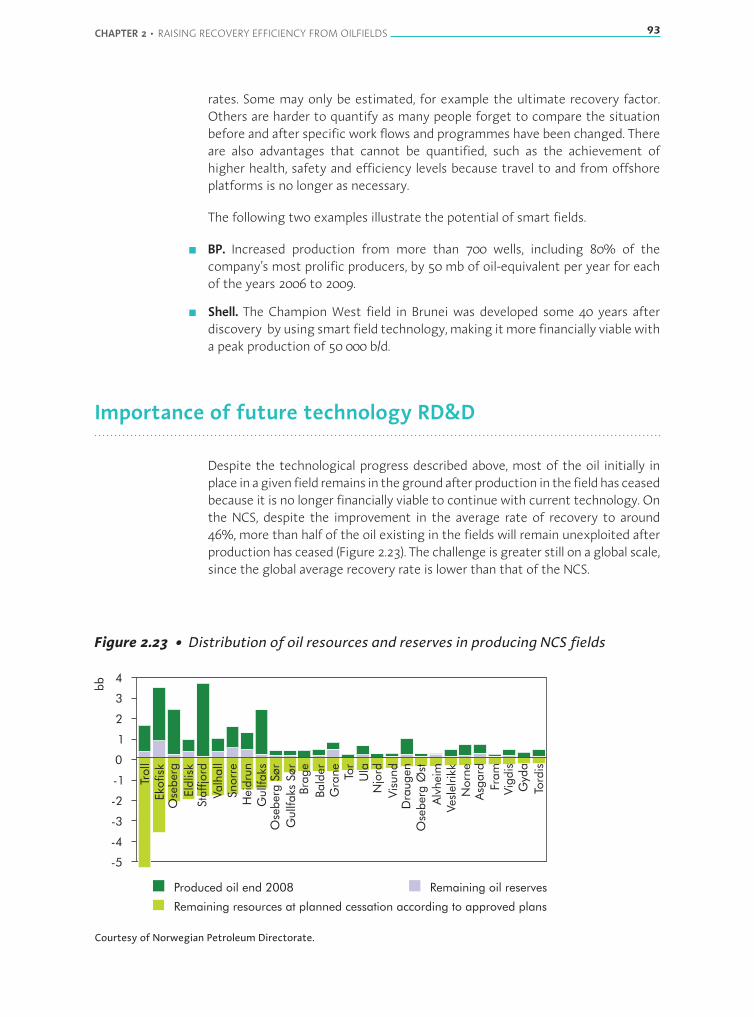
CHAPTER 2 • RAISING RECOVERY EFFICIENCY FROM OILFIELDS 93
rates. Some may only be estimated, for example the ultimate recovery factor.Others are harder to quantify as many people forget to compare the situationbefore and after specific work flows and programmes have been changed. Thereare also advantages that cannot be quantified, such as the achievement ofhigher health, safety and efficiency levels because travel to and from offshoreplatforms is no longer as necessary.
The following two examples illustrate the potential of smart fields.
■ BP. Increased production from more than 700 wells, including 80% of thecompany’s most prolific producers, by 50 mb of oil-equivalent per year for eachof the years 2006 to 2009.
■ Shell. The Champion West field in Brunei was developed some 40 years afterdiscovery by using smart field technology,making itmore financially viablewitha peak production of 50 000 b/d.
Importance of future technology RD&D
Despite the technological progress described above, most of the oil initially inplace inagiven field remains in thegroundafterproduction in the fieldhasceasedbecause it is no longer financially viable to continue with current technology. Onthe NCS, despite the improvement in the average rate of recovery to around46%, more than half of the oil existing in the fields will remain unexploited afterproduction has ceased (Figure 2.23). The challenge is greater still on a global scale,since the global average recovery rate is lower than that of the NCS.
Figure 2.23 • Distribution of oil resources and reserves in producing NCS fields
4
3
2
1
0
-1
-2
-3
-4
-5
bb
Troll
Ekofisk
Ose
berg
Eld
lisk
Sta
ffjo
rd
Valh
all
Snorr
e
Heid
run
Gullf
aks
Gullf
aks
Sør
Ose
berg
Sør
Ose
berg
Øst
Vesl
elr
ikk
Asg
ard
Vig
dis
Tord
is
Bra
ge
Bald
er
Gra
ne
Tor
Ula
Njo
rd
Vis
und
Dra
ugen
Alv
heim
Norn
e
Fram
Gyd
a
Produced oil end 2008 Remaining oil reserves
Remaining resources at planned cessation according to approved plans
Courtesy of Norwegian Petroleum Directorate.
94 RESOURCES TO RESERVES
In order to recover more of this remaining oil, the Norwegian PetroleumDirectorate has set an objective for NCS reserve growth of 5 bb of oil before2015. This amount is equivalent to the original oil in place in the Gullfaks field.This is seen as a stretch target for both the Norwegian government and theindustry. Its realisation requiresmoreefficient recovery fromfields inproduction,development of discoveries in the vicinity of existing infrastructure, proving anddeveloping new resources, and constantly operating fieldsmore cost-effectively.
The challenges are:
■ Time. The remaining time, as well as increasing cost in mature fields, posesa challenge. In a mature oil province, many fields incur increasing costsas production declines. In order for advanced technology to be deployedeconomically and efficiently, the deployment needs to be optimised withinthe economic lifecycle of the field. However, IOR/EOR projects applied at alater stage in the field’s lifecycle have a shorter available time-frame for theirimplementation. This time-frame is further limited by the production cut-offwhen the field is abandoned andwhen the potential for improving total recoveryis reduced. This stresses the urgent need to accelerate development of advancedoil recovery technologies. For example, the huge Brent oilfield in the North Seawill be abandoned in the coming few years with around 45% of its original oilstill in place. Technology for further oil extraction is currently too costly and thewindow for application of still-to-be-discovered solutions will be too late.
■ Available technology. The necessarymeasures for IOR/EOR projectsmay dependon more sophisticated or cheaper technology that is not available within theduration of the initially planned production. Implementation of IOR measuresthatextendproductioncanopenawindowfor implementingEORata later stage.Offshore CO2-EOR is an example. Large-scale application of CO2-EOR offshore isnot expected before 2020 (IEA, 2008). This maymake CO2-EOR less relevant for anumber of maturing offshore fields currently approaching their production cut-off, unless the development of the required technologies is accelerated or otherIOR measures are applied to extend the window of implementation.
■ Lifecycle view. A lifecycle view on field development, which early on makeschoices to enable later IOR/EOR or starts testing novel concepts in time. Thebest timing to prepare for EOR is when the first wells are drilled so that fluidsampling can be carried out and EOR pilot tests can be integrated into the earlydevelopment phase. A risk is that, in order to reduce the cost of the secondarydevelopment, choices aremade thatwill preclude later options. CO2-EOR is againan example. Choices of material for constructing the facilities may make laterrefurbishment towards CO2 in the production stream too expensive.
Therefore it remains a key task of government and industry to research,develop and deploy technologies that will reduce the cost of current optionsand develop novel ways to extract more oil from existing reservoirs. Thereare a lot of technologies that could be applied throughout the world if theircost were to be reduced. Also a number of technologies have shortcomings orcannot yet be applied to all fields. A few examples of technological challengesfor conventional oil that require significant RD&D and governmental supportinclude:
CHAPTER 2 • RAISING RECOVERY EFFICIENCY FROM OILFIELDS 95
■ permanent seismic acquisition on the surface or in wellbores;
■ new remote surveys using electro-magnetic fields;
■ cheap and reliable sensors along wellbore;
■ more accurate information on remaining oil (e.g. via nanotechnologies);
■ more stable CO2 displacement in high-permeability reservoirs (e.g. using foams);
■ availability of polymers for higher temperatures;
■ surfactant flooding using a lower concentration of chemicals;
■ accelerated thermal heavy oil production by using solvents or catalysts;
■ producing heavy oil economically by using cold methods (e.g. emulsions orpolymers);
■ cost reduction for offshore installations;
■ improved separation techniques for contaminated gas.
It will take hard work, finance and dedication to achieve the targets for IOR/EORoutlined in this chapter.
References
Al-Khodhori, S. (2003), “Smart Well Technologies Implementation in PDO forProduction&ReservoirManagement&Control”, proceedings from theMiddleEast Oil Show, Bahrain, 9-12 June, Society of Petroleum Engineers.
ARI (Advanced Resources International) (2010a), Storing CO2 and ProducingDomestic Crude Oil with Next Generation CO2 EOR Technology: An Update,prepared for USDOE/NETL (United States Department of Energy/NationalEnergy Technology Laboratory), Washington, DC, www.netl.doe.gov/energy-analyses/refshelf/PubDetails.aspx?Action=View&Source=Products&PubId=309.
ARI (2010b),USOil ProductionPotential fromAcceleratedDeploymentofCarbonCapture and Storage, prepared by ARI for the Natural Resources DefenseCouncil, ARI, Arlington, Virginia, www.adv-res.com/pdf/v4ARI%20CCS-CO2-EOR%20whitepaper%20FINAL%204-2-10.pdf.
ARI (2010c),Optimization of CO2Storage inCO2 EnhancedOil Recovery Projects,preparedbyARIandMelzerConsultingfortheUKDepartmentofEnergy&ClimateChange, ARI and Melzer Consulting, Arlington, Virginia, and Midland, Texas,www.decc.gov.uk/assets/decc/What%20we%20do/UK%20energy%20supply/Energy%20mix/Carbon%20capture%20and%20storage/1006-optimization-of-co2-storage-in-co2-enhanced-oil-re.pdf.
96 RESOURCES TO RESERVES
Badri, M. (2008), “Technological Challenges and Emerging Technologies inCarbonate Reservoirs”, presentation to the Mid-Project Workshop for theIEA publication Second Edition of Resources to Reserves, 7-8 April, Cambridge,United Kingdom.
Caruso G. (2007), “Annual Energy Outlook 2008”, presentation on EnergyMarkets Forecast, Energy Information Administration, 12 December,www.eia.doe.gov/neic/speeches/caruso121207.pdf.
CO2CRC (Co-operative Research Centre for Greenhouse Gas Technologies)(2009), Image Library – Storage, Canberra, www.co2crc.com.au/imagelibrary/.
Hitchon, B. (ed.) (2012), Best Practices for Validating CO2 Geological Storage:Observations andGuidance from the IEAGHGWeyburn-Midale CO2Monitoringand Storage Project, Geoscience Publishing, Edmonton.
Ide, T., S.J. Friedmann and H. Herzog (2006), “CO2 Leakage through ExistingWells: Current Technology andRegulations”, presented at the8th InternationalConference on Greenhouse Gas Control Technologies, Trondheim, Norway,19-22 June, http://sequestration.mit.edu/pdf/GHGT8_Ide.pdf.
IEA (International Energy Agency) (2008), World Energy Outlook 2008, OECD/IEA, Paris.
IEA (2011), World Energy Outlook 2011, OECD/IEA, Paris.
IEA GHG (International Energy Agency Greenhouse Gas R&D Programme)(2006), IEA GHG Weyburn CO2 Monitoring and Storage Project, IEA GHG R&DProgramme, Cheltenham, United Kingdom, www.ieaghg.org/docs/general_publications/weyburn.pdf.
IEAGHG(2008),GeologicalStorageofCarbonDioxide:StayingSafelyUnderground,IEA Greenhouse Gas R&D Programme, Cheltenham, United Kingdom, January,www.ieaghg.org/docs/general_publications/geostoragesafe-web.pdf.
Mourits, F. (2008),Overviewof the IEAGHGWeyburn-MidaleCO2MonitoringandStorage Project, presentation to the 3rd CSLF Workshop on Capacity Buildingfor Carbon Capture and Storage (CCS), Al-Khobar, Saudi Arabia, 26-30 January,www.cslforum.org/publications/documents/SaudiArabia/T1_2_CSLF_Capacity_Building_Wksp_Saudi_A_Jan08.pdf.
Mourits, F. (2011), personal communication, 17 May.
NPC (National PetroleumCouncil) (2007), Facing theHard Truths About Energy:A Comprehensive View to 2030 of Global Oil andNatural Gas, updated in 2008,NPC, Washington, DC.
NPD (Norwegian Petroleum Directorate) (2009), Resource Report 2009, www.npd.no/en/Publications/Resource-Reports/2009/Figures---Facts-2009.
NPD (2012), personal communication from Odd Magne Mathiassen, 16 April.
O&GJ (Oil & Gas Journal) (2008), “2008 Worldwide EOR Survey”, Oil & GasJournal, Vol. 106, No. 15, PennWell Corporation, Oklahoma City, pp. 47-59.
CHAPTER 2 • RAISING RECOVERY EFFICIENCY FROM OILFIELDS 97
OGP (International Association of Oil & Gas Producers) (2011) An Overview ofMarine Seismic Operations, No. 448, OGP, London.
PTRC (Petroleum Technology Research Centre) (2009), The IEAGHGWeyburn-MidaleCO2MonitoringandStorage Project, PTRC, Regina, Saskatchewan, http://ptrc.ca/projects/weyburn-midale.
Quest Offshore Resources (2010), “World Subsea Production 1999-2014”,Quest Subsea Database, www.subseazone.com/zones/subsea_home.aspx.
Schlumberger (2012), Schlumberger Oilfield Glossary, www.glossary.oilfield.slb.com.
Schulte,W. (2005),ChallengesandStrategy for IncreasedOil Recovery, presentedat the International Petroleum Technology Conference, Doha, Qatar, 21-23November.
Taber J.J., F.D. Martin and R. Seright (1997), “EOR Screening Criteria RevisitedPart 1: Introduction to Screening Criteria and Enhanced Recovery FieldProjects”, SPE Reservoir Engineering, Vol. 12, No. 3, Society of PetroleumEngineers, Richardson, Texas, pp. 189-198.
Tzimas, V., A. Georgakaki, G. Garcia Cortes and S. Peteves (2005), EnhancedOil Recovery Using CO2 in the European Energy System, European CommissionDirectorate-General Joint Research Centre/ Institute for Energy, Petten,Netherlands, http://science.uwaterloo.ca/~mauriced/earth691-duss/CO2_General%20CO2%20Sequestration%20materilas/CO2_EOR_Misciblein%20Europe21895EN.pdf.
USDOE/NETL (United States Department of Energy/National EnergyTechnology Laboratory) (2010), Carbon Dioxide Enhanced Oil Recovery:Untapped Domestic Energy Supply and Long Term Carbon Storage Solution,US DOE/NETL, Washington, DC.
Wilson, M. and M. Monea (eds.) (2004), IEA GHG Weyburn Monitoringand Storage Project Summary Report 2000-2004, proceedings of the 7thInternationalConferenceonGreenhouseGasControl Technologies, Vancouver,5-9 September.
Zwartjes, P., J. Al Riyami, T. van Dijk, R. Smith, C. Matheny, N. Benjamin, T. WahHong, A. McCarthy, M. Bulteau, H. Rynja, P. Milcik and J. Beishuizen (2010), TheFirst Land-Wide Azimuth Seismic for Sub-Salt Exploration in PDO, 2010 SEG(Society of Exploration Geophysicists) annual meeting, expanded abstracts,Denver, 17-22 October, pp. 106-110.

CHAPTER 3 • THE GROWING IMPORTANCE OF NATURAL GAS 99
Chapter 3 • The growing importance of natural gas
Natural gas is set to play a central role in meeting global energy requirements.It is a versatile and abundant energy source for the power, industry, buildingsand transport sectors. A few decades ago gas was still seen as an unwantedby-product of oil production because it could not be easily stored. Gas that wasproduced with oil was, therefore, either released directly to the atmospphere orflared – both operations producing greenhouse gases (GHGs). Over the years,however, gas collection systems have been built either to export the gas or toreinject it. More profitable ways now exist to transport gas over large distancesand natural gas fields far away from markets are being developed around theglobe, such as in Qatar andWestern Australia.
Natural gas is a clean burning fuel producing mainly carbon dioxide (CO2) andwater, and requires no post-combustion waste treatment. Its low carbon-to-hydrogen ratio makes it substantially less CO2 emitting, i.e. a less carbon-intensivefuel, than either oil or coal. For these reasons, it is becoming the fuel of choice inmany regions of the world. Over the next two or three decades, gas consumptionwill continue to rise as the world commits itself to a low-carbon scenario. Coaldemand is likely tobedisplacedbygasandother lower-carbonenergysources, suchas nuclear energy and renewable energy technologies, in the overall energy mix.However, gas is also a fossil fuel and, at some point in time, its continued unabatedusemay, too, become inconsistent withmeeting amore challenging scenario, onethat aims to limit atmospheric temperature rise by 2 degrees Celsius (°C).
After a short discussion on natural gas sources and lifecycle aspects, the chapter willfocus on the transportation of natural gas to global markets. This is a central issuefor any natural gas development because of its complexity and cost implications. Itis followedbya short discussionon the implicationsof sourgas and the contributionof components fromnatural gas to liquid production levels.
Natural gas sources and lifecycle aspects
Natural gas comes from various sources that may be categorised as:
■ associated gas: found in oilfields (Figure 3.1);
■ non-associated gas: found in natural gas fields (Figure 3.1);
■ unconventional gas: which includes gas sources such asmethane from tight gas,shale gas, coal beds and methane hydrates (Chapter 6).
Themajority of natural gas comes fromthe first two sources, but the importanceof unconventional gas is growing.Unconventional gas comes fromunusual typesor extremely low-permeability reservoirs, which require very special extractionmethods that are discussed separately in Chapter 6.
CHAPTER 3 • THE GROWING IMPORTANCE OF NATURAL GAS 99
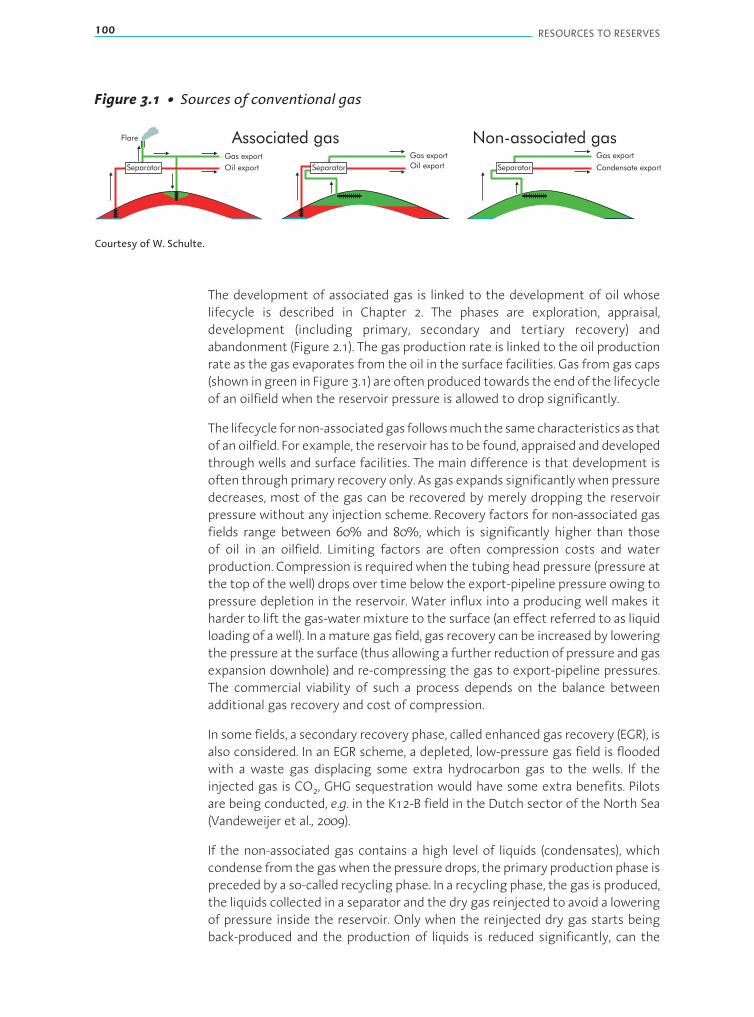
100 RESOURCES TO RESERVES
Figure 3.1 • Sources of conventional gas
Oil export
Gas export
Flare
Condensate export
Associated gas Non-associated gas
Separator Oil export
Gas export
Separator
Gas export
Separator
Courtesy of W. Schulte.
The development of associated gas is linked to the development of oil whoselifecycle is described in Chapter 2. The phases are exploration, appraisal,development (including primary, secondary and tertiary recovery) andabandonment (Figure 2.1). The gas production rate is linked to the oil productionrate as the gas evaporates from the oil in the surface facilities. Gas fromgas caps(shown in green in Figure 3.1) are often produced towards the endof the lifecycleof an oilfield when the reservoir pressure is allowed to drop significantly.
The lifecycle fornon-associatedgas followsmuchthesamecharacteristicsasthatof an oilfield. For example, the reservoir has to be found, appraised anddevelopedthrough wells and surface facilities. The main difference is that development isoften throughprimary recovery only. As gas expands significantlywhenpressuredecreases, most of the gas can be recovered by merely dropping the reservoirpressure without any injection scheme. Recovery factors for non-associated gasfields range between 60% and 80%, which is significantly higher than thoseof oil in an oilfield. Limiting factors are often compression costs and waterproduction. Compression is requiredwhen the tubing head pressure (pressure atthe top of thewell) drops over time below the export-pipeline pressure owing topressure depletion in the reservoir. Water influx into a producing well makes itharder to lift the gas-watermixture to the surface (an effect referred to as liquidloading of awell). In amature gas field, gas recovery can be increased by loweringthe pressure at the surface (thus allowing a further reduction of pressure and gasexpansion downhole) and re-compressing the gas to export-pipeline pressures.The commercial viability of such a process depends on the balance betweenadditional gas recovery and cost of compression.
In some fields, a secondary recovery phase, called enhanced gas recovery (EGR), isalso considered. In an EGR scheme, a depleted, low-pressure gas field is floodedwith a waste gas displacing some extra hydrocarbon gas to the wells. If theinjected gas is CO2, GHG sequestration would have some extra benefits. Pilotsare being conducted, e.g. in the K12-B field in the Dutch sector of the North Sea(Vandeweijer et al., 2009).
If the non-associated gas contains a high level of liquids (condensates), whichcondense fromthegaswhen thepressure drops, the primary productionphase ispreceded by a so-called recycling phase. In a recycling phase, the gas is produced,the liquids collected in a separator and the dry gas reinjected to avoid a loweringof pressure inside the reservoir. Only when the reinjected dry gas starts beingback-produced and the production of liquids is reduced significantly, can the
CHAPTER 3 • THE GROWING IMPORTANCE OF NATURAL GAS 101
process be switched to a primary phase with gas export allowing the reservoirpressure to drop. This recycling mode is also an option if no gas export route isavailable and recycling allows some early income from the development.
Gas may contain impurities like hydrogen sulphide (H2S) and CO2. When suchimpurities have a high concentration, field developments are hampered by thehigh cost of separating the contaminants out of the gas stream. Separationtechnology solutions are essential to field development, as will be discussed.
Abandonment operations for gas fields are much the same as those for oilfields.
More natural gas developments
In the 1960s and 1970s, natural gas developments were only considered whenproximity to markets allowed transport of gas directly to consumers (as therewere no storage options). The development of the Groningen gas field in theNetherlands triggered a national network of gas pipelines in the 1960s andnearly all Dutch households switched to heating and cooking on gas. Very earlyin the development of the North Sea oilfields, gas export pipelines were builtto export the associated gas to shore. On the other hand, gas produced on theAlaskaNorth Slope is still reinjected today because of the absence of such exportpipelines. In recent decades, some long-distance gas pipelines have allowed gasfields to be connected tomarkets, such as Russia andWestern Europe. A numberof very large gas fields have been developed over the last two decades becauseit became possible to export gas via liquefied natural gas (LNG) terminals, suchas in South-East Asia, Western Australia (USEIA, 2003) and, more recently, theMiddle East and Western Africa. Qatar has built large-scale gas-to-liquids (GTL)facilities, a new way to commercialise stranded natural gas resources.
Almost three-quarters of global natural gas reserves are located in the MiddleEast and Eurasia. Russia, Iran and Qatar together accounted for about 55% ofglobal natural gas reserves as of 1 January 2010.
Iran has the world’s second-largest reserves of natural gas, after Russia, and iscurrently the Middle East’s largest natural gas producer. Iran is also the MiddleEast’s largest user of reinjected natural gas for enhanced oil recovery (EOR)operations. In 2007, Iran reinjected more than 28 billion cubic metres (bcm) ofnatural gas, or 16% of its gross production. In 2009, Iran began EOR operationsat the Agha-Jari oilfield, where it plans to raise oil production by 60 000 barrelsper day (b/d) by injecting 37 bcmof natural gas annually (USEIA, 2010). The largestproduction increments in the next 25 years will be coming from theMiddle East(especially Iran and Qatar), Africa and Russia, and the other countries of non-Organisation of Economic Co-operation and Development (OECD) Europe andEurasia. A significant share of the increase is expected to come from a singleoffshore field, which is called North Field on the Qatari side and South Pars onthe Iranian side.

102 RESOURCES TO RESERVES
Despite significant growth innatural gas productionover thepast decade, severalcountries in the Middle East have experienced shortfalls in domestic supply,which have resulted from rapidly growing demand in the electric power andindustrial sectors. As a result, some of those countries have established policiesassigning priority to using natural gas domestically rather than for export.
Key element: getting gas to markets
Getting gas to global markets is the central issue asmajor conventional reservestend to be remote from demand centres and natural gas transportation, mainlybecause of the properties of natural gas, is more complex and more costly thanthat of crude oil or coal. The main choices for gas transportation are by pipelineor by converting it into a liquid, i.e. into LNG.
Depending on the quantities transported and the distance to market, it maybe more cost-effective to transport gas via pipeline than converting it to LNG(Figure 3.2). At short distance gas will be transported via pipeline, while forlarge gas fields, large distances can be covered through LNG. If the field is largeenough, intermediate long-distance pipelines can still be more cost-effectivethan LNG. In some instances, as illustrated in Figure 3.2, neither pipeline nor LNGis cost-effective, which leaves the gas resource “stranded”.
Figure 3.2 • Quantity and distance regimes for LNG and pipeline gas transportation
Pipeline preferred
Pipeline
0 1 000 2 000 3 000 4 000 5 000 6 000 7 000 8 000 9 000
0
5
10
15
20
25
Uneconomic (stranded gas)
Distance to market (km)
LNG preferred
LNG
Mill
ion
m/d
3
Note: m3/d = cubic metres per day; km = kilometre.
Source: adapted from Hanrahan, 2006.
Distance is not the only factor in choosing how to transport gas. Other factorsinclude: land versus sea; separation of source and market; water depth or landcontours; and political, right-of-way, or supply security issues along the route.
CHAPTER 3 • THE GROWING IMPORTANCE OF NATURAL GAS 103
For many years, LNG was unable to compete with more nearby sources broughtto market by pipeline because of the cost of processing and transportation.Therefore, for several decades it had a limited market, centred mainly on Japan.However, growing demand for gas, coupled with limited availability of pipelinesources, caused a rapid expansion of global interest in LNG. This increasedinterest brought with it a growth of investment in new projects worldwide andthe beginnings of a globalmarket for LNGduring the last decade. TheAsia/Pacificregion is expected to continue to dominate LNG trade. Most LNG already goesthere and the share is expected to increase over the period to 2035.
Total flows to and within non-OECD Asia are projected to rise from a net exportof 26 bcm to a net import of 112 bcm in 2020 and 335 bcm in 2035. Imports intoOECD Europe are not likely to rise asmuch, increasing from 265 bcm to 335 bcmin 2020 and 454 bcm in 2035, while OECD Americas1 changes from being a netimporter (of 29 trillion cubic metres [tcm]) to being a net exporter in 2035 (of34 bcm).
While the LNGvalue chain is discussed further later, an alternative to liquefactionis to convert gas into a true liquid at normal pressure and temperature,allowing more transportation and storage options. Though the global capacityremains low, large-scale GTL plants are gaining increasing attention in somegas exporting countries, such as South Africa, Qatar and Malaysia, and on allcontinents. A novel development to monetise small gas accumulations locateda long distance from markets is to transport them by compressing the gas atmoderately low temperatures.
The LNG value chain
The LNG value chain consists of natural gas production, liquefaction,transportation in specialised ships at a temperature of -161°C, and regasificationat the importation site. The largest component of the total cost of the LNGsupply chain is usually the liquefaction plant. Of the total cost of delivering gasto markets via LNG, production and processing at the producing gas field makeup about 15% to 20%; liquefaction about 30% to 45%; shipping some 10% to30%; and regasification and distribution about 15% to 25%. Improvements intechnology have reduced costs in all parts of the LNG value chain during the pastthree decades, though the trend has reversed more recently because of costoverruns created by a large number of new projects stretching the industry’ssupply chain.
LiquefactionBefore liquefaction,naturalgas istreatedtoremovesomeunwantedcomponentsand subsequently condensed into a liquid by cooling it to -161°C at nearatmospheric pressures, whereupon the volume of the gas is reduced 600-foldfor transportation.
1. Includes Canada, Chile, Mexico and the United States.

104 RESOURCES TO RESERVES
Cost of liquefaction
Early liquefaction trains in the 1960s produced some 350 000 tonnes per year ofLNG. The unit size has grown each decade, with new production trains reachingalmost 8million tonnes per year (Mt/yr) (11 bcm). This increase in scale accountsfor a substantial part of the cost reductions achieved in gas liquefaction.Furthermore, improved design and competition among manufacturers led to afall in capital costs for liquefaction plants from roughly USD 600 per tonne (/t) ofcapacity in the late1980s toaboutUSD200/t in2001. The trend indecliningcostsfor gas liquefaction was interrupted around 2004, owing to increased prices forraw material caused by global increase in demand, especially in Asia. During theperiod 2004-12 the global surge in demand for plant construction overwhelmedthe capabilities of plant construction firms and equipment suppliers, leadingto substantial inflation and project delays. The trend between 2004 and 2007has been estimated by Jensen (Figure 3.3). Costs of both LNG and pipelines rosesubstantially, but LNG costs are estimated to have increased by 100% to 125%over this three-year period, compared to some 50% for pipeline costs.
The LNG sector of the future’s largest LNG exporter, Australia, is challenged byslow construction times and large capital expenditure (BREE, 2012). Costs ofaround USD 3 000/t for the Gorgon and Wheatstone projects, and USD 4 000/tfor the Ichthys project, feature among the highest in the world, particularlywhen compared to the USD 1 700/tonne for the Angola LNG project and evenlower costs in the United States.
Figure 3.3 • LNG and pipeline cost inflation, 2004–07
Perc
enta
ge
change
2007
ove
r2004 125
100
75
50
25
0
Price increases Cost increases
LNG liquefaction and regasificationcosts have been especially badly affected
All costs except LNGtankers have risen more
than market prices
LNG regasificationLNG liquefication LNG tanker transport
Pipeline costsCalifornia border pricesAlberta hub prices
Source: Jensen, 2007.
Outside the inflationary period, advances in refrigerant compressors and heattransfer equipment, together with the use of highly efficient gas turbines asdrivers, have lowered unit costs. The search for more efficient technologies and
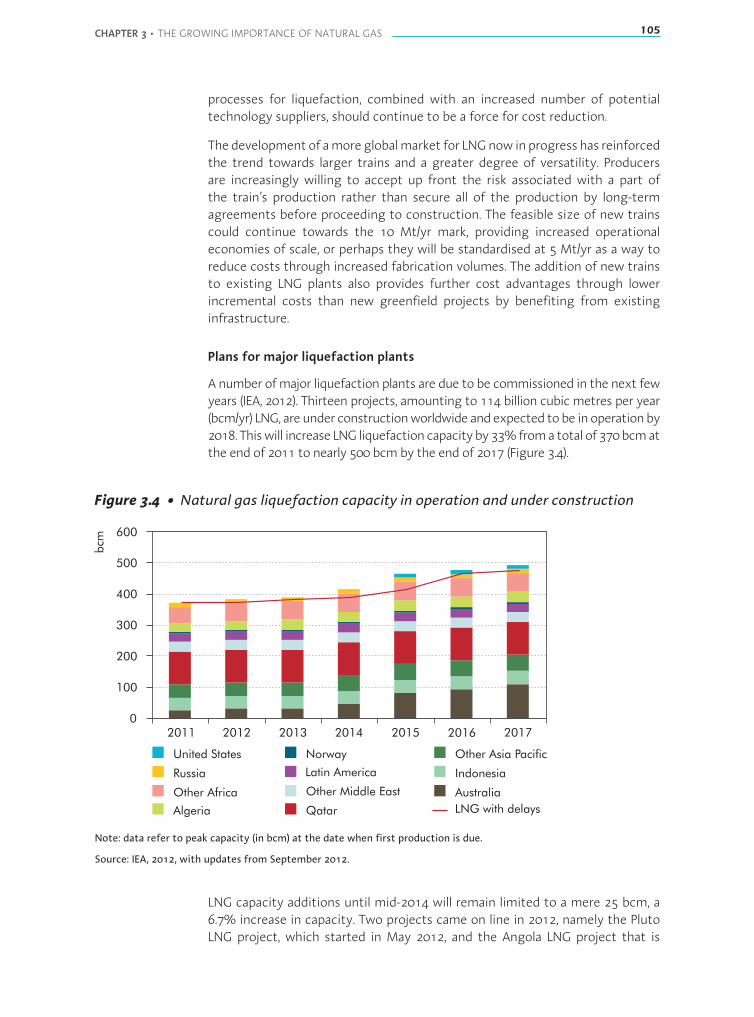
CHAPTER 3 • THE GROWING IMPORTANCE OF NATURAL GAS 105
processes for liquefaction, combined with an increased number of potentialtechnology suppliers, should continue to be a force for cost reduction.
Thedevelopmentof amoreglobalmarket for LNGnow inprogresshas reinforcedthe trend towards larger trains and a greater degree of versatility. Producersare increasingly willing to accept up front the risk associated with a part ofthe train’s production rather than secure all of the production by long-termagreements before proceeding to construction. The feasible size of new trainscould continue towards the 10 Mt/yr mark, providing increased operationaleconomies of scale, or perhaps they will be standardised at 5 Mt/yr as a way toreduce costs through increased fabrication volumes. The addition of new trainsto existing LNG plants also provides further cost advantages through lowerincremental costs than new greenfield projects by benefiting from existinginfrastructure.
Plans for major liquefaction plants
Anumber ofmajor liquefaction plants are due to be commissioned in the next fewyears (IEA, 2012). Thirteen projects, amounting to 114 billion cubic metres per year(bcm/yr) LNG, areunder constructionworldwideandexpected tobe inoperationby2018. Thiswill increase LNG liquefactioncapacityby33%fromatotal of 370bcmatthe end of 2011 to nearly 500 bcm by the end of 2017 (Figure 3.4).
Figure 3.4 • Natural gas liquefaction capacity in operation and under construction
0
100
200
300
400
500
600
2011 2012 2013 2014 2015 2016 2017
bcm
United States
Russia
Other Africa
Algeria
Norway
Latin America
Other Middle East
Qatar
Other Asia Pacific
Indonesia
Australia
LNG with delays
Note: data refer to peak capacity (in bcm) at the date when first production is due.
Source: IEA, 2012, with updates from September 2012.
LNG capacity additions until mid-2014 will remain limited to a mere 25 bcm, a6.7% increase in capacity. Two projects came on line in 2012, namely the PlutoLNG project, which started in May 2012, and the Angola LNG project that is

106 RESOURCES TO RESERVES
currentlybeingcommissioned.Algeria’s Skikdaproject is likely tobeginoperationin 2013, followed by a second Algerian project, Gassi Touil, due for operation in2014. A second wave of LNG exports will begin in late-2014, this time fromAustralia, which is expected to overtake Qatar as the largest LNG exporter by2020. Six LNGprojects have reached final investment decision (FID) since the endof 2010. In 2014, the first train of several LNG projects will be completed, withGorgon LNG, PNG LNG,QueenslandCurtis LNGandDonggi Senoro LNG togetheramounting to 20bcm/yr. Additional trains of these projectswill followduring theperiod 2015 to 2017, while further projects such as the Wheatstone project arecompleted. All these projects should be operational by 2018. However, given thedelays observed on many of the LNG plants commissioned over the past threeyears, there would be little surprise if some of these projects failed to enteroperation on schedule.
All projects entering operation after mid-2014 are Australian-based, exceptthe Donggi Senoro and PNG LNG projects, which are located in Indonesiaand Papua New Guinea, respectively. Most will be technically challengingand may incur delays resulting from either workforce shortages or capitalcosts overruns or infrastructure bottlenecks. They include four first-of-a-kindprojects – three coal-bed methane to LNG projects in Queensland (Gladstone,Queensland Curtis and Australia Pacific) and the Prelude LNG project.
ShippingLNG is transported in special ships where the LNG is carried in insulated tanks. In1959, the world’s first LNG tanker, the Methane Pioneer, carried LNG from LakeCharles, Louisiana, to Canvey Island, United Kingdom, initiating LNG shipping.In 1964, the British Gas Council began importing LNG from Algeria, making theUnited Kingdom the world’s first importer of contract LNG and Algeria its firstexporter (CEC, 2004; USDOE, 2005).
Modern LNG carriers are sophisticated double-hulled ships designed for the safeand efficient transportation of cryogenic liquid. The emphasis is on containmentof the cargo aswell as efficient thermal insulation. About half of the current LNGfleet is of the membrane design type (Figure 3.5), where the inner hull is fullyused to store the LNG.
The other half of the fleet has the spherical or Moss design (Figure 3.6),where the LNG containers are a series of spherical containers placed in a rowalong the ship axis. Since 2004, most new LNG ships under construction orplanned were of membrane design because of innovations in increased cargocapacity in a given hull size, reduced capital costs and overall constructiontime. Membrane design is, however, more sensitive to sloshing, which is fluidmotion inside the container at resonant conditions brought about by externalforces on the ship.
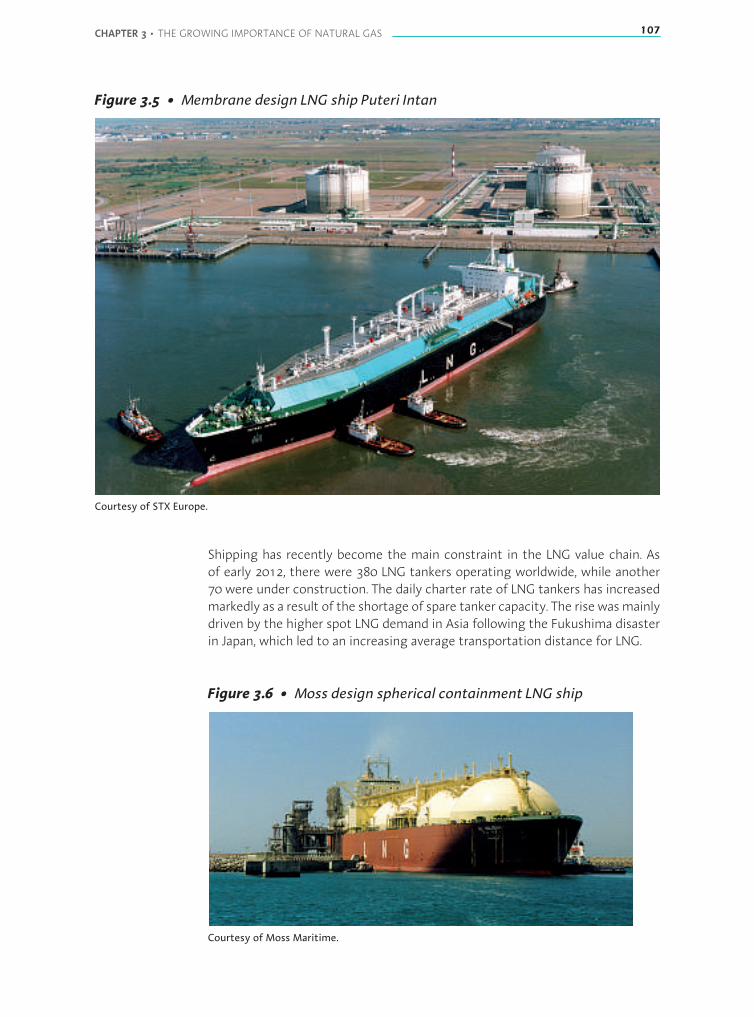
CHAPTER 3 • THE GROWING IMPORTANCE OF NATURAL GAS 107
Figure 3.5 • Membrane design LNG ship Puteri Intan
Courtesy of STX Europe.
Shipping has recently become the main constraint in the LNG value chain. Asof early 2012, there were 380 LNG tankers operating worldwide, while another70 were under construction. The daily charter rate of LNG tankers has increasedmarkedly as a result of the shortage of spare tanker capacity. The rise wasmainlydriven by the higher spot LNG demand in Asia following the Fukushima disasterin Japan, which led to an increasing average transportation distance for LNG.
Figure 3.6 • Moss design spherical containment LNG ship
Courtesy of Moss Maritime.
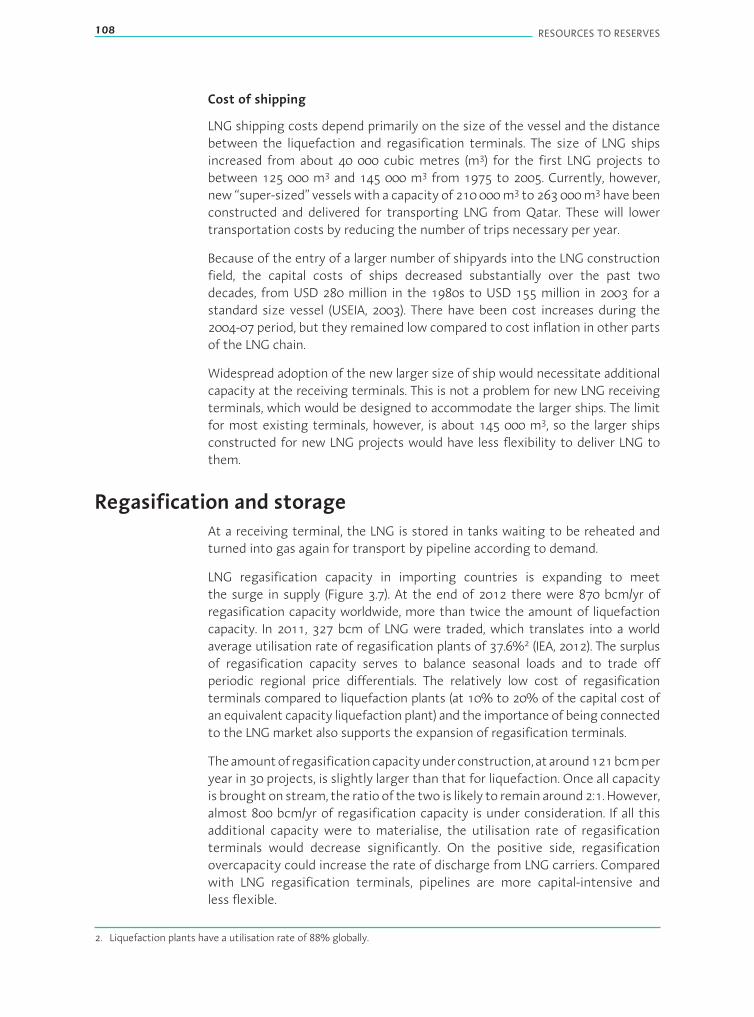
108 RESOURCES TO RESERVES
Cost of shipping
LNG shipping costs depend primarily on the size of the vessel and the distancebetween the liquefaction and regasification terminals. The size of LNG shipsincreased from about 40 000 cubic metres (m3) for the first LNG projects tobetween 125 000 m3 and 145 000 m3 from 1975 to 2005. Currently, however,new “super-sized” vesselswith a capacity of 210 000m3 to 263 000m3 have beenconstructed and delivered for transporting LNG from Qatar. These will lowertransportation costs by reducing the number of trips necessary per year.
Because of the entry of a larger number of shipyards into the LNG constructionfield, the capital costs of ships decreased substantially over the past twodecades, from USD 280 million in the 1980s to USD 155 million in 2003 for astandard size vessel (USEIA, 2003). There have been cost increases during the2004-07 period, but they remained low compared to cost inflation in other partsof the LNG chain.
Widespread adoption of the new larger size of ship would necessitate additionalcapacity at the receiving terminals. This is not a problem for new LNG receivingterminals, which would be designed to accommodate the larger ships. The limitfor most existing terminals, however, is about 145 000 m3, so the larger shipsconstructed for new LNG projects would have less flexibility to deliver LNG tothem.
Regasification and storageAt a receiving terminal, the LNG is stored in tanks waiting to be reheated andturned into gas again for transport by pipeline according to demand.
LNG regasification capacity in importing countries is expanding to meetthe surge in supply (Figure 3.7). At the end of 2012 there were 870 bcm/yr ofregasification capacity worldwide, more than twice the amount of liquefactioncapacity. In 2011, 327 bcm of LNG were traded, which translates into a worldaverage utilisation rate of regasification plants of 37.6%2 (IEA, 2012). The surplusof regasification capacity serves to balance seasonal loads and to trade offperiodic regional price differentials. The relatively low cost of regasificationterminals compared to liquefaction plants (at 10% to 20% of the capital cost ofan equivalent capacity liquefaction plant) and the importance of being connectedto the LNGmarket also supports the expansion of regasification terminals.
Theamountofregasificationcapacityunderconstruction,ataround121bcmperyear in 30 projects, is slightly larger than that for liquefaction. Once all capacityis broughton stream, the ratioof the two is likely to remain around2:1. However,almost 800 bcm/yr of regasification capacity is under consideration. If all thisadditional capacity were to materialise, the utilisation rate of regasificationterminals would decrease significantly. On the positive side, regasificationovercapacity could increase the rate of discharge from LNG carriers. Comparedwith LNG regasification terminals, pipelines are more capital-intensive andless flexible.
2. Liquefaction plants have a utilisation rate of 88% globally.
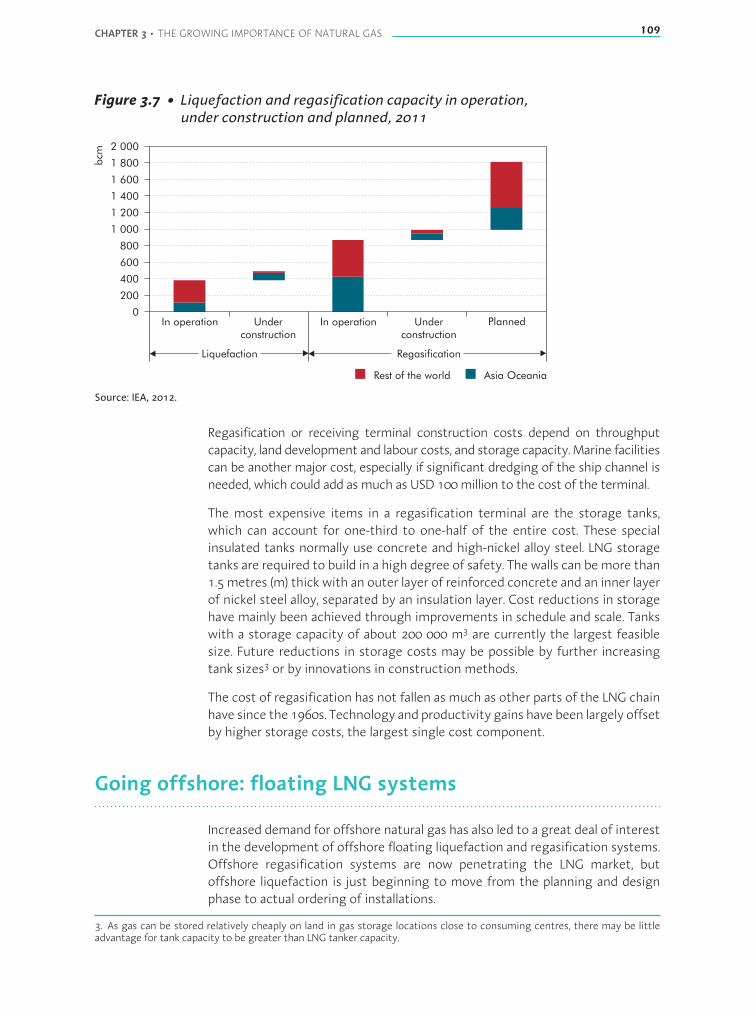
CHAPTER 3 • THE GROWING IMPORTANCE OF NATURAL GAS 109
Figure 3.7 • Liquefaction and regasification capacity in operation,under construction and planned, 2011
0
200
400
600
800
1 000
1 200
1 400
1 600
1 800
2 000
In operation Underconstruction
In operation
Regasification
Underconstruction
Planned
bcm
Rest of the world Asia Oceania
Liquefaction
Source: IEA, 2012.
Regasification or receiving terminal construction costs depend on throughputcapacity, land development and labour costs, and storage capacity.Marine facilitiescan be another major cost, especially if significant dredging of the ship channel isneeded, which could add asmuch as USD 100million to the cost of the terminal.
The most expensive items in a regasification terminal are the storage tanks,which can account for one-third to one-half of the entire cost. These specialinsulated tanks normally use concrete and high-nickel alloy steel. LNG storagetanks are required to build in a high degree of safety. The walls can bemore than1.5metres (m) thick with an outer layer of reinforced concrete and an inner layerof nickel steel alloy, separated by an insulation layer. Cost reductions in storagehave mainly been achieved through improvements in schedule and scale. Tankswith a storage capacity of about 200 000 m3 are currently the largest feasiblesize. Future reductions in storage costs may be possible by further increasingtank sizes3 or by innovations in construction methods.
The cost of regasification has not fallen as much as other parts of the LNG chainhave since the 1960s. Technology and productivity gains have been largely offsetby higher storage costs, the largest single cost component.
Going offshore: floating LNG systems
Increased demand for offshore natural gas has also led to a great deal of interestin the development of offshore floating liquefaction and regasification systems.Offshore regasification systems are now penetrating the LNG market, butoffshore liquefaction is just beginning to move from the planning and designphase to actual ordering of installations.
3. As gas can be stored relatively cheaply on land in gas storage locations close to consuming centres, there may be littleadvantage for tank capacity to be greater than LNG tanker capacity.
110 RESOURCES TO RESERVES
Many floating LNG (FLNG) schemes envisage subsea well completions, therebyeliminating the need for costly production platforms and large diametertransmission pipelines to transport the gas to shore. Other advantages of anoffshore facility include: eliminating site preparation; harbour or breakwaterdevelopments; continuous dredging generally required for a land-based plant;andreducingcostbyavoidingtheconstructionofnewpipelinesandcompressionfacilities that would otherwise be required. An FLNG project can be 20% to30% cheaper than a comparable size project with land-based facilities and theconstruction time can be 25% faster (Chiu, 2006).
FLNG could also be cost-effective in developing stranded gas fields, isolated,small in size or too remote from land and other infrastructure. These fields maybe primary or associated gas reserves.
Offshore liquefaction from concept to operation
Floating production-storage-offloading vessels (FPSOs), which are the floatingequivalent of fixed production platforms and which would facilitate the exportof LNG are still in the design phase and are not yet operational. However, theliquefaction unit of Statoil’s Snøhvit project (Statoil, 2010), though not strictlyspeaking an FLNG station, can be considered a transitional measure. In theSnøhvit project, the offshore gas field is developed through a subsea productionunit and the full well stream is transported over 143 km via amultiphase flowlineto onshore facilities at Melkøya, near Hammerfest (northern Norway), where thestream components are separated and the gas liquefied for export. Liquefactionis carried out on a barge that was constructed in Spain, transported to Norwayand installed in theMelkøya facility’s dock in 2005. The final investment decisionfor Shell’s Prelude FLNG, the world’s first FPSO project, was taken in 2011. Itwill be located in the Browse Basin, off the north-west coast of FLNG WesternAustralia. Several other projects have since been proposed, for example in theUnited States and Indonesia.
Offshore liquefaction has begun tomove from a concept and planning phase toa more operational mode with the recent contract between Shell and Technip-Samsung Heavy Engineering to design and construct multiple FLNG facilitiesover aperiodofup to15years (Shell, 2009). The first applicationwill be the recentPrelude and Concerto gas discoveries, located in the Browse Basin. Prelude wasdiscovered in January 2007 and Concerto in late March 2009. Production isexpected to start in 2016 at Prelude (Shell, 2010). The dimensions of the PreludeFLNG facility will be approximately 480mby 75m, with the capacity to producearound 3.5 Mt/yr of LNG, as well as condensate and liquefied petroleum gas.When fully ballasted, the facility will weigh some 600 000 tonnes (t). To putthe size into context, the vessel is much larger than an aircraft carrier. TheUS Navy’s new nuclear supercarrier reaches barely 100 000 t, while the world’slargest passenger ship reaches only 220 000 t. Such FLNG facilities would besuitable for the more distant offshore fields as they could remain in operation
CHAPTER 3 • THE GROWING IMPORTANCE OF NATURAL GAS 111
during harsh metocean4 conditions, such as cyclones, and would be capable ofprocessing a wide range of gas compositions.
Safety and operability are important issues when designing offshore FPSOsystems because of the proximity and complexity of all elements of the facility.In addition to the offloadingoperation, the tanker approach, connect, disconnectand departure phases all include operations that are weather-dependent thatmay impose restrictions on operability.
Offshore floating regasification and storage unitsAt the receiving end of the LNG chain, difficulties in finding suitable sites tobuild LNG regasification terminals have stimulated substantial interest in thepossibility of using offshore floating storage and regasification units (FSRUs),such as a barges or ships connected to the shore by pipeline. Offshore systemsreduce time-to-market compared to onshore development, and obtainingpermits is often easier.
An offshore LNG receiving facility would consist of an FSRU moored offshore,to which a conventional LNG ship can connect as it would to an onshoreregasification facility. The offshore facility would have its own LNG storagecapacity as well as regasification facility. The storage facility would allow LNG tobe unloaded as gas based on the regasification and pipeline transmission rate. Ata water depth of 25 m to 30m the FSRU would be able to accept LNG carriers inthe 125 000 m3 to 250 000 m3 capacity range.
GTL: an alternative way to bring gas to market
The challenge of how to bring natural gas resources, often located in remoteregions, to their markets in both industrialised and developing countries, wouldbe less of a barrier if the gas could be converted into a liquid that could thenbe stored and distributed at normal temperature and atmospheric pressure,as is the case with crude oil and oil products. This has led to efforts on and offduring the past century aimed at developing an effective and efficient means ofconverting gas to liquid fuels. GTL technology has reached the stage where it ispossible to produce clean liquid products from natural gas.
Whereas LNG will be converted back to gas at the receiver end and thus needsspecial pipeline transport, GTL converts natural gas directly into products likediesel-type fuel, kerosene, base oils for lubricants, paraffin for detergents andnaphtha as chemical feedstock, which are all stable at normal atmosphericconditions. Therefore, GTL gives natural gas a much broader market in liquidform as it can overcome transport problems that have limited the use ofnatural gas until now. The products can be transported through conventionalinfrastructure, such as tankers and pipelines, stored in existing facilities for liquidhydrocarbons and marketed through existing retail distribution systems.
4. Metocean is a contraction of the words “meteorology” and “oceanology”, referring to the weather conditions, the waves,winds and currents that affect offshore operations.
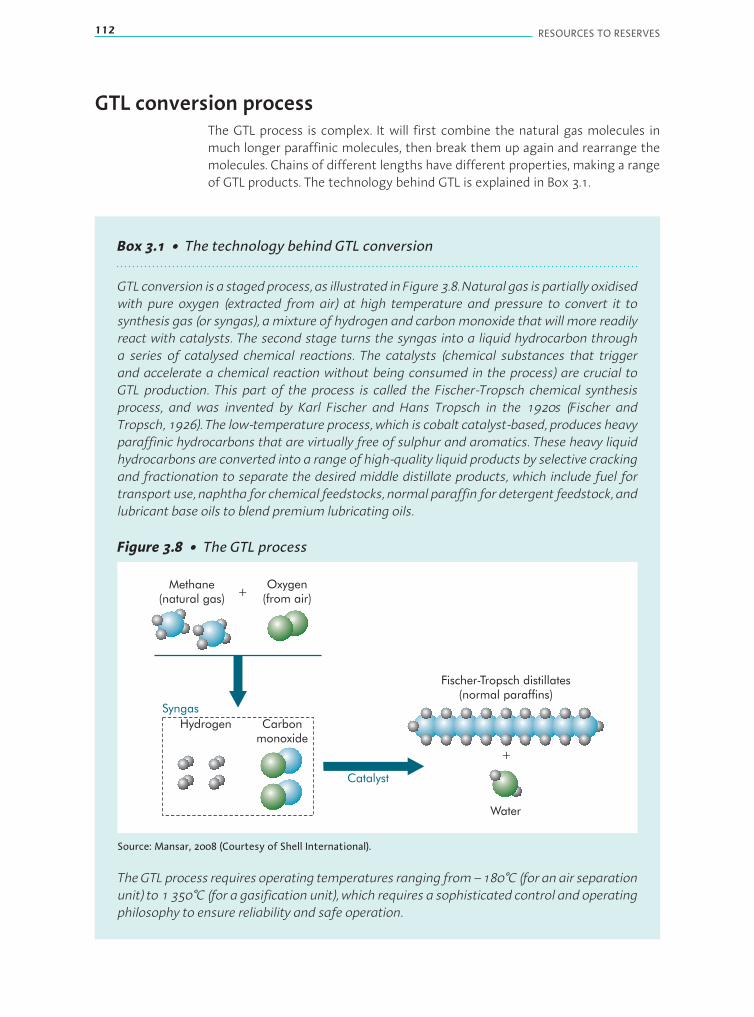
112 RESOURCES TO RESERVES
GTL conversion processThe GTL process is complex. It will first combine the natural gas molecules inmuch longer paraffinic molecules, then break them up again and rearrange themolecules. Chains of different lengths have different properties, making a rangeof GTL products. The technology behind GTL is explained in Box 3.1.
Box 3.1 • The technology behind GTL conversion
GTL conversion is a stagedprocess, as illustrated in Figure 3.8. Natural gas is partially oxidisedwith pure oxygen (extracted from air) at high temperature and pressure to convert it tosynthesis gas (or syngas), a mixture of hydrogen and carbonmonoxide that will more readilyreact with catalysts. The second stage turns the syngas into a liquid hydrocarbon througha series of catalysed chemical reactions. The catalysts (chemical substances that triggerand accelerate a chemical reaction without being consumed in the process) are crucial toGTL production. This part of the process is called the Fischer-Tropsch chemical synthesisprocess, and was invented by Karl Fischer and Hans Tropsch in the 1920s (Fischer andTropsch, 1926). The low-temperature process, which is cobalt catalyst-based, produces heavyparaffinic hydrocarbons that are virtually free of sulphur and aromatics. These heavy liquidhydrocarbons are converted into a range of high-quality liquid products by selective crackingand fractionation to separate the desired middle distillate products, which include fuel fortransport use, naphtha for chemical feedstocks, normal paraffin for detergent feedstock, andlubricant base oils to blend premium lubricating oils.
Figure 3.8 • The GTL process
Methane(natural gas)
Oxygen(from air)
+
+
Fischer-Tropsch distillates(normal paraffins)
Water
Hydrogen Carbonmonoxide
Syngas
Catalyst
Source: Mansar, 2008 (Courtesy of Shell International).
TheGTL process requires operating temperatures ranging from–180°C (for an air separationunit) to 1 350°C (for a gasification unit), which requires a sophisticated control and operatingphilosophy to ensure reliability and safe operation.
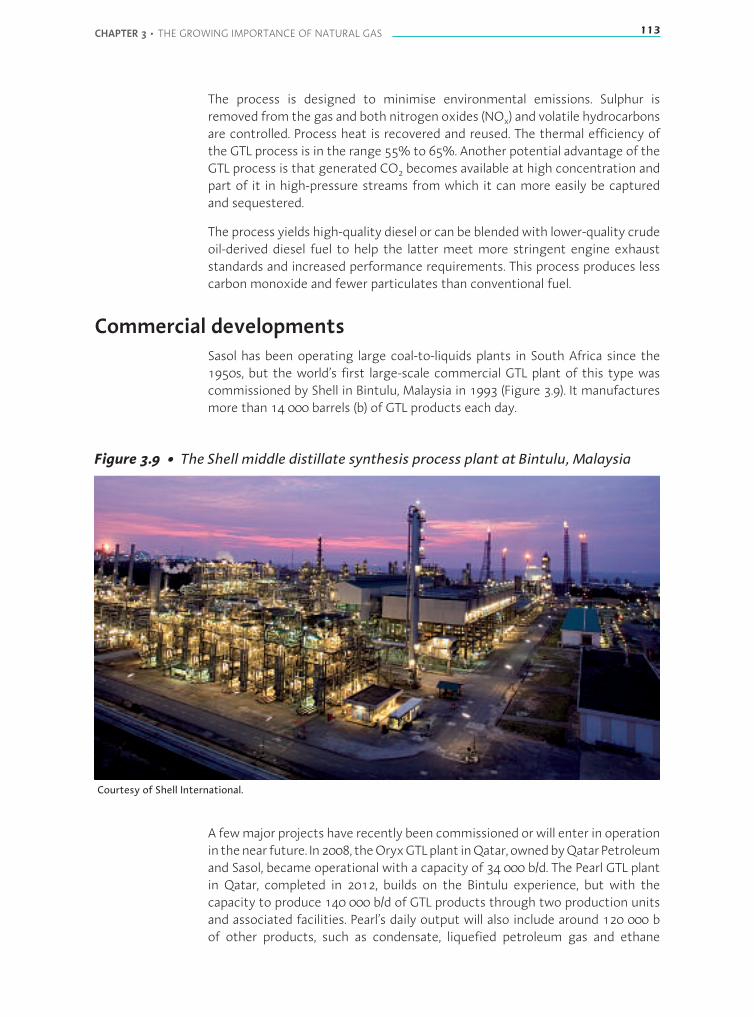
CHAPTER 3 • THE GROWING IMPORTANCE OF NATURAL GAS 113
The process is designed to minimise environmental emissions. Sulphur isremoved from the gas and both nitrogen oxides (NOx) and volatile hydrocarbonsare controlled. Process heat is recovered and reused. The thermal efficiency ofthe GTL process is in the range 55% to 65%. Another potential advantage of theGTL process is that generated CO2 becomes available at high concentration andpart of it in high-pressure streams from which it can more easily be capturedand sequestered.
The process yields high-quality diesel or can be blendedwith lower-quality crudeoil-derived diesel fuel to help the latter meet more stringent engine exhauststandards and increased performance requirements. This process produces lesscarbon monoxide and fewer particulates than conventional fuel.
Commercial developmentsSasol has been operating large coal-to-liquids plants in South Africa since the1950s, but the world’s first large-scale commercial GTL plant of this type wascommissioned by Shell in Bintulu, Malaysia in 1993 (Figure 3.9). It manufacturesmore than 14 000 barrels (b) of GTL products each day.
Figure 3.9 • The Shell middle distillate synthesis process plant at Bintulu, Malaysia
Courtesy of Shell International.
A fewmajor projects have recently been commissioned orwill enter in operationin thenear future. In2008, theOryxGTLplant inQatar, ownedbyQatarPetroleumand Sasol, became operational with a capacity of 34 000 b/d. The Pearl GTL plantin Qatar, completed in 2012, builds on the Bintulu experience, but with thecapacity to produce 140 000 b/d of GTL products through two production unitsand associated facilities. Pearl’s daily output will also include around 120 000 bof other products, such as condensate, liquefied petroleum gas and ethane

114 RESOURCES TO RESERVES
(Figure 3.10). Nigeria’s Escravos GTL is expected to begin operation in 2013 withan initial capacity of 34 000 b/d, followed by an expansion to 120 000 b/d overthe next ten years. In the United States, Sasol is currently investigating thefeasibility of a GTL facility with a capacity ranging from 40 000 b/d to 80 000 b/d.Other current projects include the Tinhert plant in Algeria, the Sasol project inUzbekistan, and the Sasol/Talisman proposal in Canada.
Figure 3.10 • Pearl GTL plant product slate
Upstreamproducts
(120 000 boe/d)
GTLproducts
(140 kb/d)
LPG
Ethane
Condensate
GTL naphtha
GTL normal paraffin
GTL kerosene
GTL gasoil
GTL base oils
Volumes for Pearl GTL
Note: kb/d = thousand barrels/day; boe/d = barrels of oil-equivalent/day.
Source: Mansar, 2008 (Courtesy of Shell International).
The GTL process is energy-intensive and, as a means to produce transportationfuel, may at first glance appear inefficient. However, a true comparison wouldconsider the full chain of processes from extraction of the gas to the energysupplied to the wheel (Chapter 9). Furthermore, on a well-to-wheel basis, GHGemissions for GTL are close to those for traditional oil.
Compressed natural gas for smaller accumulations
Instead of cooling gas to reduce the volume and facilitate the transportation ofnatural gas, as done for LNG, it is also possible to reduce the volume of a naturalgas stream by compressing the gas to between 200 bar and 275 bar, althoughenergy density is less than that for LNG. Storage tanks thus need to be able tohold such pressures.
The use of specialised ships to transport compressed natural gas (CNG) tomarkets is being seriously considered for some situations such as stranded gas
CHAPTER 3 • THE GROWING IMPORTANCE OF NATURAL GAS 115
resources that are too small for LNG and too remote for pipelines, includingreserves in some hostile climates, such as the Canadian Arctic Archipelago.About one-third to one-half of global natural gas reserves is considered stranded,and there are possibilities of exploiting a significant fraction of these by usingeither small-scale FLNG or CNG.
At the point of origin, most likely a small natural gas reservoir, the natural gasis produced through production facilities and subsequently compressed toapproximately 150 bar to 275 bar. This process produces an energy densityof about one-third that of LNG and sometimes the natural gas is chilled to atemperature in the range -20°C to -40°C.After transportby theCNGship, thegasmay be offloaded either to a land-based installation or to an offshore mooringbuoy connected by pipeline to land. The physical assets are technically simpleand much less extensive than LNG at either end. The major cost element is theCNG ship.
There are three basic approaches to storing the compressed gas on board theCNG ship:
■ coiled small diameter pipe wound into cylindrical storage containers known as“coselles”;
■ vertically or horizontally stacked cylinders made from light-weight composites;
■ cylindrical steel or fibre-reinforced plastic cylinders built to fit into a standardinter-modal shipping container.
The third of these approaches seeks to reduce the capital cost of the ship (whichcan be a retrofitted container ship), and the handling costs of the transfer tooverland transport. It can also make use of existing rail and road transportationequipment designed to handle containers.
The number of ships required for a CNG project depends on the distancetravelled and the time required for a round trip. A rule of thumb would be threeships for an 800 km route, adding a ship for every additional 800 km, so that a4 000 km route would need seven ships. Since the cost of the ships representssome 90% of the total project cost, this determines the break-even point withLNG projects, as LNG ships can carry a much greater amount of gas in terms ofthermal content.
CNG is more energy-efficient than LNG, requiring the consumption of some 5%to 8% of the gas compared to about 13% for LNG. Its flexibility is greater: some80% to 90% of its assets are flexible compared to 20% for LNG (Figure 3.11). It isalso more flexible with regard to market location, reservoir size and productionprofile.
Another advantage of CNG projects over LNG ones is the lead-time for gettingthe project up and operating. An LNG project might need five or more yearsfrom the planning stage to deployment and delivery of the first cargo. For a CNGproject the corresponding period is two and half to three years.

116 RESOURCES TO RESERVES
Figure 3.11 • CNG versus LNG capital expenditure and energy efficiency
8%
13%
LNG
LNG
CNG
CNG
LoadingLiquefaction
% energy consumption/energy input
DischargeRegasification
ShippingShipping
% capital expenditure
Shipping 8%
Regasification 10%
Liquefaction 82%
Discharge 6%
Shipping 88%
Loading 6% 14
12
10
8
6
4
2
0
Source: Siciliano, 2009.
In terms of cost, since shipping is a much larger part of the total CNG projectcost, the cost of delivering additional gas increases more rapidly than it does foran LNG project, though it starts from a lower base. The unit LNG cost is lower forlarger-volume projects, while CNG does not have the same economies of scale.So CNG ismore economical than LNG for shorter distances and lower volumes. Inapproximate terms (and situations where pipelines are not practical), CNG couldbe the choice for annual volumes up to 5 bcm and distances less than 2 000 km.
Several companies and consortia are developing variations on CNG sea andland transportation systems (Biopact, 2007). As yet, no CNG project has reachedcommitment to proceed.
Sour gas and contaminated gas resources
Sour gas is any natural gas containing large amounts of H2S. In some references,sour gas is definedmore narrowly as a natural gas containingmore than 1%H2S.The odour of H2S is detectable in the air at very low concentrations, as low as10 parts per billion.
Contaminated gas contains high levels of non-hydrocarbon molecules such asH2S and CO2, or other impurities such as water vapour, nitrogen and helium,which are removed from the natural gas at processing plants. Acid or sour gas5
could thus be considered a sub-class of contaminated gas. In the Middle Eastthere are high resource volumes of acid/sour gas that contain around 30% H2S,10% CO2, and the rest mainly methane. In Asia, there are huge gas reserveswith up to 70% CO2. Russia’s giant Astrakhan field contains 40% acid gases,comprising around 25% H2S and 15% CO2.
5. An acid gas can form acidic solutionswhenmixedwithwater. Themost common acid gases are H2S and CO2. The term sourgas is sometimes reserved for natural gas that contains significant quantities of H2S only. However, the terms acid gas and sourgas are often used synonymously.
CHAPTER 3 • THE GROWING IMPORTANCE OF NATURAL GAS 117
H2S can be formed from sulphur compounds during the anaerobic (withoutoxygen) decomposition of organicmaterials. This occurred during the formationof oil and gas millions of years ago. H2S is also produced by chemical reactionswithin some sedimentary rocks. At temperatures above 140°C, the calciumsulphate (CaSO4) in gypsum reacts with hydrocarbons to produce large volumesof H2S, up to 90% of the gas contained in some reservoirs, in deeply buriedsedimentary rocks such as those found in the foothills of the Canadian Rockies.Many petroleum-bearing rock formations also contain iron that bonds withsulphur. When there is ample iron present, the result is sweet gas containinglittle or no H2S.
About one-third of the natural gas produced in Canada’s Alberta and BritishColumbia provinces is sour. The average H2S content of sour gas produced inAlberta is 10%, although the concentration of H2S can range from trace amountstomore than 80%. In Asia and theMiddle East, there are huge reserves of sour orcontaminated gas, such as the Natuna gas field in Indonesia (more than 6 tcm)of gas in place with a 70%CO2 content). Of the gas reserves of Abu Dhabi, about6 tcm, a large fraction is sour with some fields having 30% of H2S plus 10% CO2.The huge Kashagan and Tengiz oilfields in Kazakhstan (together about 50 billionbarrels original oil in place) contain large volumes of sour associated gas. TheTengiz field was initially stockpiling the sulphur but now is also reinjecting thesour gas for EOR.
Processing sour gasSour gas-processing plants use physical and chemical processes, in the presenceof catalysts, to remove H2S and other by-products from the natural gas. The sourgas is run through a tower containing an amine solution; this has an affinity forsulphur, and absorbs itmuch like glycol absorbingwater. The twoprincipal aminesolutions used are monoethanolamine and diethanolamine. The effluent gas isvirtually free of sulphur compounds. The amine solution used can be regenerated(that is, the absorbed sulphur is removed), allowing it to be reused to treat moresour gas. Amine-based separation solutions are expensive. New technologydevelopment is aimed at using cryogenic, centrifuge and membrane solutionsto reduce the separation costs for high contaminant concentration and largeflow rates.
InWesternCanada,most of the elemental sulphur recovered is sold to customersand used mainly in the manufacture of phosphate fertilisers. When the sulphurproduction rate is higher than the demand, the elemental sulphur must bestored, usually in large blocks at the plant site. Canada accounts for more thanone-quarter of world sulphur production.
Flaring has been used primarily to dispose of sour gas in oilfields where thegas volumes are too small, or the sites too remote, to make pipelining andgas processing more cost-effective. Because of government and industrycommitments to reduce the amount of flaring, as well as the rising economicvalue of natural gas, more sour gas is now being pipelined to processing plants.FlaringH2Sproduceswater vapour and sulphurdioxide (SO2); as SO2 is a precursorof acid rain, many countries now have legislation controlling the flaring of sour
118 RESOURCES TO RESERVES
gas. At some facilities, flares have been replaced by more efficient incinerators.Previously, incineration had been used primarily at smaller gas-processing plantswhere the gas volumes or H2S concentrations were too low to make sulphurrecovery economic.
An increasing proportion of the formerly incinerated H2S, along with CO2 andsaltwater removed from the natural gas, is nowbeing injected into undergroundrock formations. This process is known as “acid gas injection” because H2S andCO2 are both gases that can form acids when combined with water. Acid gasinjection has been adopted at some 45 gas-processing plants in Alberta andBritish Columbia since 1990. It disposes of H2S safely, and also reduces CO2emissions. The gas mixture can be injected into either salt-water formations ordepleted oil and gas fields, or can be used in working oil reservoirs to enhanceproduction.
Sour gas and public safetyExplorationanddevelopmentofsourgas,becauseofitstoxicandcorrosivenature,give rise to concerns about public safety. These concerns are understandablysomewhat marked in Alberta, given the amounts of sour gas produced there.
To address these concerns, in 2000, the Energy Resources Conservation Board(ERCB)6 established an independent body, the Provincial Advisory Committee onPublic Safety and Sour Gas (PSSG), to review and assess the province’s regulatoryregime as it related to public health and safety, including the requirementsbeing applied to the approval, development, and operation of sour gas facilities.
At the end of 2000, the Advisory Committee provided the EUB with a reportcontaining 87 detailed recommendations directed towards four key areas:
■ providing a better understanding of sour gas;
■ improving the sour gas regulatory system;
■ reducing the impact of sour gas on public health and safety;
■ improving the consultation that takes placewith the public on all sour gasmatters.
The EUB worked with the Advisory Committee, the oil and gas industry, andother stakeholders, to address these recommendations, and a final report wasissued in March 2007 (EUB, 2007). The report groups the actions taken withrespect to the 87 recommendations into five categories:
■ health effects and sour gas research;
■ sour gas development planning and approval;
■ sour gas operations;
■ emergency preparedness;
■ information, communication and consultation.
The final report issued by ERCB and PSSG contains details of the specificactions taken to address each of the recommendations as they concern these
6. Until 1st January 2008, the ERCB was known as the Alberta Energy and Utilities Board (EUB).
CHAPTER 3 • THE GROWING IMPORTANCE OF NATURAL GAS 119
five categories. ERCB has several website pages targeted directly to the publicinterest, addressing health and safety, sour gas and the public interest, theenvironment, and emergency preparedness and response.
NGL: a key contributor to global oil production
Natural gas liquids (NGLs) are light hydrocarbons that are dispersed in associatedor non-associated natural gas in a hydrocarbon reservoir and are producedwithin a gas stream. They comprise propane and butane (collectively LPG), pluspentane, hexane, heptane and gas condensate. The condensate is recovered inthe field separatorswhile the remainingNGLs are extracted from the gas streamin gas treatment facilities. NGLs are often under-reported or misrepresented inglobal oil balances. The conditions for NGLs reporting are not always clear and insome areas the condensate is not reported separately but included in reportingof the crude stream (IEA, 2010).
NGLs contributed in 2009 close to 11 million barrels of oil per day, whichrepresents about 13% of world oil production and thus forms a very importantcontribution (Chapter 1). The level is related directly to the global natural gasproduction level and the liquid content of the gas being produced.
Impact on the lifecycle of a gas developmentAs already indicated NGLs can influence a gas development plan significantly,particularly as they are playing an increasing role in the economics of gasproduction. In the case of a natural gas well with a high NGL content (oftenreferred to as rich or wet gas), extracting the dry natural gas will result in adecrease in well pressure that may result in a significant portion of the NGLscondensing in the reservoir, i.e. the reservoir basically acts as a separator. Theseliquids will become trapped in the porous medium and be “lost”. To maximisethe recovery of NGLs, such reservoirs are often initially “recycled”; this is wherethe wet gas is produced (including the NGLs) and the NGLs extracted, withthe remaining dry gas reinjected to maintain the pressure in the reservoir.When much of the gas has been recycled and NGL production levels have fallensignificantly, the dry gas is then exported and the reservoir pressure is allowedto drop.
Even when there is no gas export route or gas demand is low, there may still besignificant value in recycling the gas and only producing NGLs.
Trends in global NGL productionThere are four trends that will have a significant impact on global NGLproduction. The first three trends drive increasing NGL supply, while the last hasa negative impact on production levels (IEA, 2010):
120 RESOURCES TO RESERVES
■ The increasing scale of natural gas developments, associated with thedevelopment of some large gas condensate fields and some big new LNGprojects.
■ Increased use of associated gas, owing to new gas infrastructures and the drivetowards reduced flaring and venting.
■ Wetter non-associated gas gradually replacing traditional dry non-associatedgas in some countries, among other reasons because of the development ofdeeper reservoirs with high pressure and temperature. Also unconventional gas,such as tight gas and shale gas can contain significant NGL volumes (in contrastto coal-bed methane and hydrate methane, which are pure methane streams).
■ The increasing replacement of wet associated gas by dry non-associated gas insome other countries in order to meet gas demand or because of significantgrowth in coal-bed methane production.
Production levels are all linked to the production of the prime gas source. Thereare some specific projects in which the aim is to export both the NGL and thegas, while maintaining reservoir pressure through reinjection of an inert gassuch as nitrogen. In these cases, the level of subsurface mixing of injectantswith the natural gas is an important fundamental question that determines howmuch condensate will be produced.
With the huge natural gas resources in the world and an increasing contributionof natural gas in the total energymix, the contribution of NGLs to the overall oilproduction level will likely remain high in the coming decades.
References
Biopact (2007), A Quick Look at CNG Ships, http://news.mongabay.com/bioenergy/2007/09/quick-look-at-cng-ships.html, accessed 26 July 2009.
BREE (Australian Bureau of Resources and Energy Economics) (2012), GasMarketReport July 2012, BREE, Canberra.
CEC (California Energy Commission) (2004), Significant Events in the History ofLNG, CEC, Sacramento, www.energy.ca.gov/lng/documents/significant_events_lng_history.pdf.
Chiu,C-H. (2006), “CommercialandTechnicalConsiderations intheDevelopmentsof Offshore Liquefaction Plant”, paper presented to the 23rd World GasConference, Amsterdam, 5-9 June www.igu.org/html/wgc2006/pdf/paper/add11306.pdf.

CHAPTER 3 • THE GROWING IMPORTANCE OF NATURAL GAS 121
EUB (Alberta Energy and Utilities Board) (2007), Public Safety and SourGas– FinalReport, EUB, Calgary, www.ercb.ca/reports/PSSG_FinalReport_2007-03.pdf.
Fischer, F. and H. Tropsch (1926), Brennstoff-Chemie, vol. 7, p. 97-104.
Hanrahan, M. (2006), Energy Futures Speaker Series, presentation to the NationalEnergy Board, Ottawa, 25 April.
IEA (International Energy Agency) (2010), Natural Gas Liquids Supply Outlook2008-2015, OECD/IEA, Paris.
IEA (2012),Medium-TermGasMarket Report 2012, OECD/IEA, Paris.
Jensen, J.T. (2007), LNG versus Pipelines: Technical and Economic Pros and Cons,paper presented to the Far North Oil and Gas Forum, Calgary, 26 November.
Mansar, S. (2008), Pearl GTL – The Project, the Plant and the Products, in Oil andGas Innovation for the EnergyMarkets of the Future, International Energy AgencyCommittee on Energy Research and Technology (IEACERT) AdvisoryGrouponOiland Gas Technology Workshop, Cambridge, United Kingdom, 7-8 April.
Shell (2009), Prelude LNG Development to Deploy Shell’s Floating LNG Technology,October, www.shell.com/global/aboutshell/media/news-and-media-releases/2009/prelude-lng-floating-technology-08102009.html.
Shell (2010), Floating a Natural Gas Giant, www.shell.com/global/future-energy/meeting-demand/natural-gas/flng/floating-natural-gas-giant.html.
Siciliano, L. (2009), ENI, Technologies and Scenarios for E&P Expansion in theNatural Gas Chain – the Case of the Mediterranean Hub, presentation at the IEAGlobal Dialogue on Oil and Gas Technology, Florence, 25-26 June.
Statoil (2010), Snøhvit, www.statoil.com/en/OurOperations/ExplorationProd/ncs/snoehvit/Pages/default.aspx, accessed March 2010.
USDOE (United States Department of Energy) (2005), Liquefied Natural Gas –Understanding the Basic Facts, USDOE, Washington, DC, www.fossil.energy.gov/programs/oilgas/publications/lng/LNG_primerupd.pdf.
USEIA (United States Energy Information Administration) (2003), The GlobalLiquefiedNaturalGasMarket: Status&Outlook, USEIA,Washington, DC, www.eia.doe.gov/oiaf/analysispaper/global/pdf/eia_0637.pdf.
USEIA (2010), International Energy Outlook 2010, USEIA, Washington, DC.
Vandeweijer, V.P., L.G.H. Van der Meer, C. Hofstee, D. D’Hoore and F. Mulders(2009), CO2 Storage and Enhanced Gas Recovery at K12-B, presented at the 71stEuropean Association of Geoscientists and Engineers Conference and Exhibition,Amsterdam, 8-11 June.


CHAPTER 4 • TRENDS AND CHALLENGES OF FRONTIER OIL AND GAS 123
Chapter 4 • Trends and challenges of frontier oiland gas
Over the past decade, deepwater offshore reserves in several regions of theworld and ice-prone areas of the Arctic have been considered the frontier areasfor exploring and producing conventional hydrocarbons. More than half of allconventional oil discovered since 2000was in deepwater offshore reservoirs (IEA,2010) and the Arctic is one of the world’s largest remaining prospective areasfor oil and gas. Developing resources in deepwater and ice-prone areas in theArctic can be considered the most complex and expensive challenges currentlyfacing the oil industry. This chapter provides an overview of the technologiesthat have been and are currently being developed to mitigate these challenges.Also covered are key technologies for deep water and Arctic regions, whilethe section on environmental issues provides more extensive information ondeveloping fields in the Arctic.
Main challenges of frontier oil and gas exploration
In previous chapters, the challenges for conventional resources have focusedmainly on improving the recovery of resources in a mature branch of activity.For deepwater and Arctic reserves, the focus is directed towards developingresources in a safe and cost-effective way, thus making the first step possiblein the lifecycle of a field (as discussed in Chapter 2). The cost of developingdeepwater and Arctic reserves can be a major obstacle.
The fundamental issue for deepwater exploration and production is that allactivities on or below the seabed must be handled remotely from the oceansurface, and even in some cases remotely from a distance ofmany kilometres. Inoffshore Arctic regions, the same issue often applies and is further complicatedby having to deal with icebergs or pack ice. The ongoing development ofdeepwater/subsea technology has led to solutions that can be applied to fielddevelopment in the Arctic.
In both deep water and Arctic frontiers, it is imperative to “do no harm” byensuring a high degree of protection for pristine and sensitive environments,in addition to the health and safety of those manning the surface facilities. As aconsequence, risk assessments, emergency preparedness and response planningare extremely important. At the end of the field lifecycle, care is neededwith thedecommissioning of facilities, especially in the Arctic as it takes a long time fornature to recover from any damage.
The offshore shallow-water Montara oil spill in the Timor Sea on 21 August 2009and the deepwater Macondo blow-out in the Gulf of Mexico on 20 April 2010illustrate the severe consequences of inadequate decisions and responses ina complex drilling operation, especially offshore. The Montara oil spill flowedfor over two months and the Macondo oil spill flowed for three months. The
CHAPTER 4 • TRENDS AND CHALLENGES OF FRONTIER OIL AND GAS 123
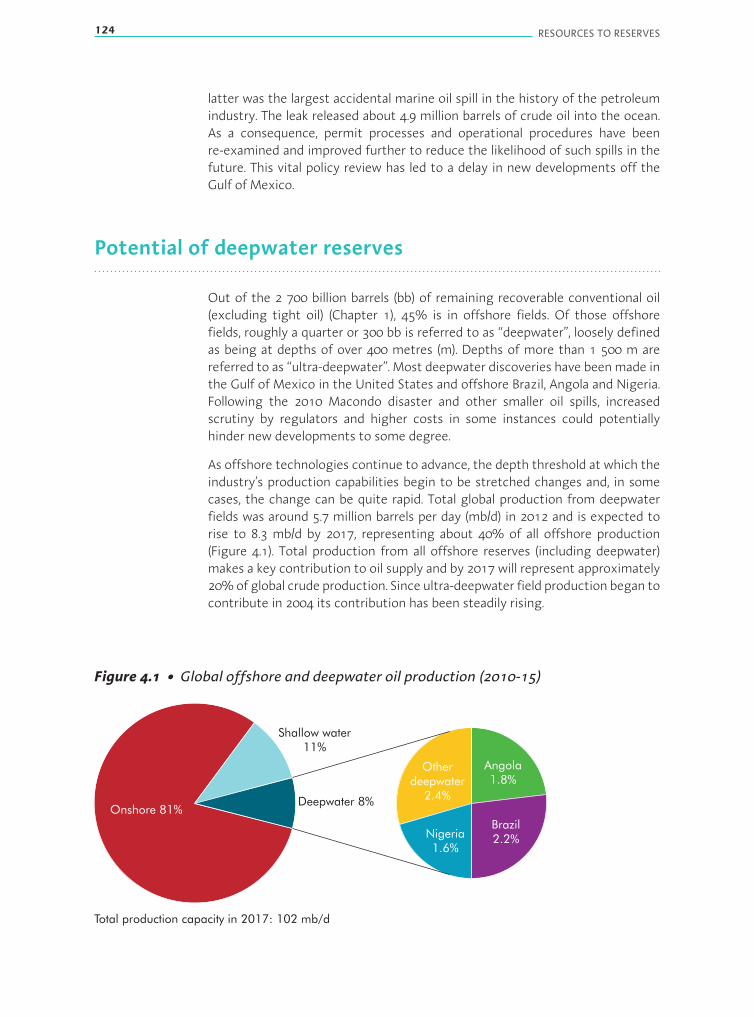
124 RESOURCES TO RESERVES
latter was the largest accidental marine oil spill in the history of the petroleumindustry. The leak released about 4.9 million barrels of crude oil into the ocean.As a consequence, permit processes and operational procedures have beenre-examined and improved further to reduce the likelihood of such spills in thefuture. This vital policy review has led to a delay in new developments off theGulf of Mexico.
Potential of deepwater reserves
Out of the 2 700 billion barrels (bb) of remaining recoverable conventional oil(excluding tight oil) (Chapter 1), 45% is in offshore fields. Of those offshorefields, roughly a quarter or 300 bb is referred to as “deepwater”, loosely definedas being at depths of over 400 metres (m). Depths of more than 1 500 m arereferred to as “ultra-deepwater”. Most deepwater discoveries have beenmade inthe Gulf of Mexico in the United States and offshore Brazil, Angola and Nigeria.Following the 2010 Macondo disaster and other smaller oil spills, increasedscrutiny by regulators and higher costs in some instances could potentiallyhinder new developments to some degree.
As offshore technologies continue to advance, the depth threshold at which theindustry’s production capabilities begin to be stretched changes and, in somecases, the change can be quite rapid. Total global production from deepwaterfields was around 5.7 million barrels per day (mb/d) in 2012 and is expected torise to 8.3 mb/d by 2017, representing about 40% of all offshore production(Figure 4.1). Total production from all offshore reserves (including deepwater)makes a key contribution to oil supply and by 2017 will represent approximately20%of global crude production. Since ultra-deepwater field production began tocontribute in 2004 its contribution has been steadily rising.
Figure 4.1 • Global offshore and deepwater oil production (2010-15)
Onshore 81%
Shallow water11%
Angola1.8%
Brazil2.2%Nigeria
1.6%
Deepwater 8%
Total production capacity in 2017: 102 mb/d
Otherdeepwater
2.4%
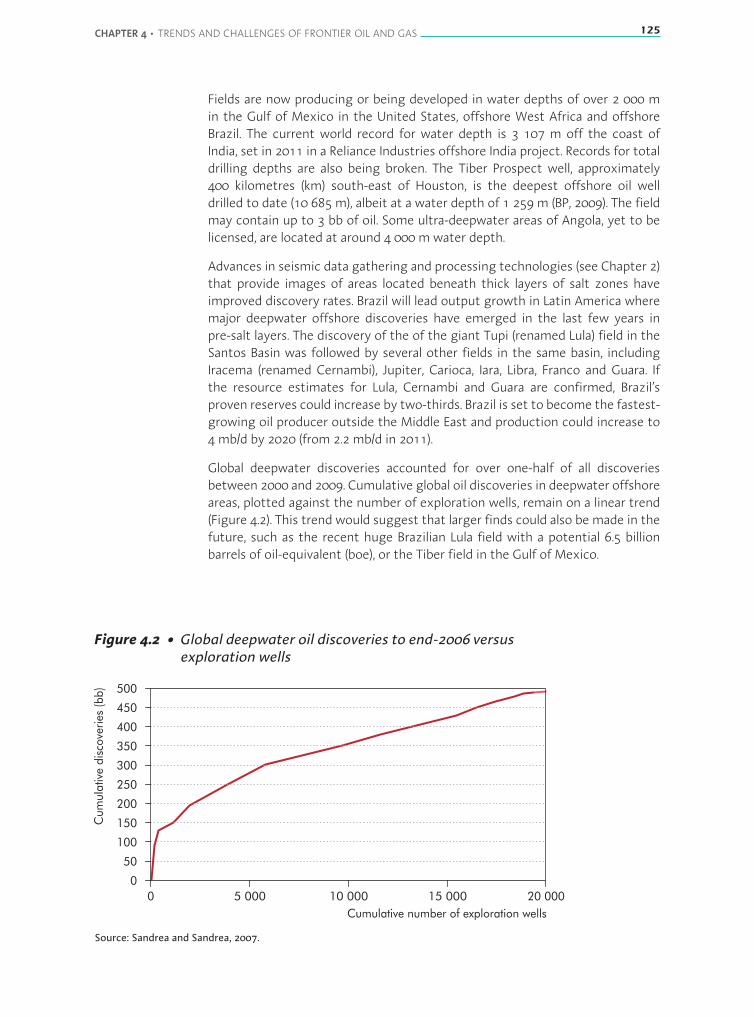
CHAPTER 4 • TRENDS AND CHALLENGES OF FRONTIER OIL AND GAS 125
Fields are now producing or being developed in water depths of over 2 000 min the Gulf of Mexico in the United States, offshore West Africa and offshoreBrazil. The current world record for water depth is 3 107 m off the coast ofIndia, set in 2011 in a Reliance Industries offshore India project. Records for totaldrilling depths are also being broken. The Tiber Prospect well, approximately400 kilometres (km) south-east of Houston, is the deepest offshore oil welldrilled to date (10 685 m), albeit at a water depth of 1 259 m (BP, 2009). The fieldmay contain up to 3 bb of oil. Some ultra-deepwater areas of Angola, yet to belicensed, are located at around 4 000 mwater depth.
Advances in seismic data gathering and processing technologies (see Chapter 2)that provide images of areas located beneath thick layers of salt zones haveimproved discovery rates. Brazil will lead output growth in Latin America wheremajor deepwater offshore discoveries have emerged in the last few years inpre-salt layers. The discovery of the of the giant Tupi (renamed Lula) field in theSantos Basin was followed by several other fields in the same basin, includingIracema (renamed Cernambi), Jupiter, Carioca, Iara, Libra, Franco and Guara. Ifthe resource estimates for Lula, Cernambi and Guara are confirmed, Brazil’sproven reserves could increase by two-thirds. Brazil is set to become the fastest-growing oil producer outside the Middle East and production could increase to4 mb/d by 2020 (from 2.2 mb/d in 2011).
Global deepwater discoveries accounted for over one-half of all discoveriesbetween 2000 and 2009. Cumulative global oil discoveries in deepwater offshoreareas, plotted against the number of exploration wells, remain on a linear trend(Figure 4.2). This trend would suggest that larger finds could also bemade in thefuture, such as the recent huge Brazilian Lula field with a potential 6.5 billionbarrels of oil-equivalent (boe), or the Tiber field in the Gulf of Mexico.
Figure 4.2 • Global deepwater oil discoveries to end-2006 versusexploration wells
0 20 000
Cumulative number of exploration wells
Cum
ula
tive
dis
cove
ries
(bb) 500
450
400
350
300
250
200
150
100
50
0
5 000 10 000 15 000
Source: Sandrea and Sandrea, 2007.
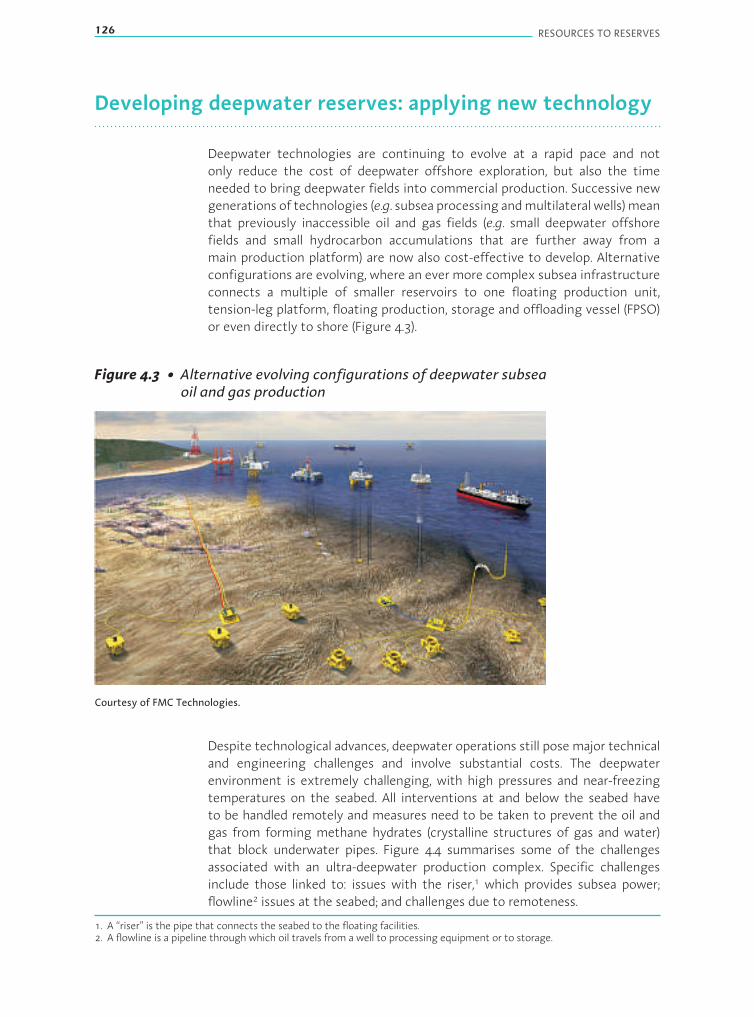
126 RESOURCES TO RESERVES
Developing deepwater reserves: applying new technology
Deepwater technologies are continuing to evolve at a rapid pace and notonly reduce the cost of deepwater offshore exploration, but also the timeneeded to bring deepwater fields into commercial production. Successive newgenerations of technologies (e.g. subsea processing andmultilateral wells)meanthat previously inaccessible oil and gas fields (e.g. small deepwater offshorefields and small hydrocarbon accumulations that are further away from amain production platform) are now also cost-effective to develop. Alternativeconfigurations are evolving, where an ever more complex subsea infrastructureconnects a multiple of smaller reservoirs to one floating production unit,tension-leg platform, floating production, storage and offloading vessel (FPSO)or even directly to shore (Figure 4.3).
Figure 4.3 • Alternative evolving configurations of deepwater subseaoil and gas production
Courtesy of FMC Technologies.
Despite technological advances, deepwater operations still posemajor technicaland engineering challenges and involve substantial costs. The deepwaterenvironment is extremely challenging, with high pressures and near-freezingtemperatures on the seabed. All interventions at and below the seabed haveto be handled remotely and measures need to be taken to prevent the oil andgas from forming methane hydrates (crystalline structures of gas and water)that block underwater pipes. Figure 4.4 summarises some of the challengesassociated with an ultra-deepwater production complex. Specific challengesinclude those linked to: issues with the riser,1 which provides subsea power;flowline2 issues at the seabed; and challenges due to remoteness.
1. A “riser” is the pipe that connects the seabed to the floating facilities.2. A flowline is a pipeline through which oil travels from a well to processing equipment or to storage.
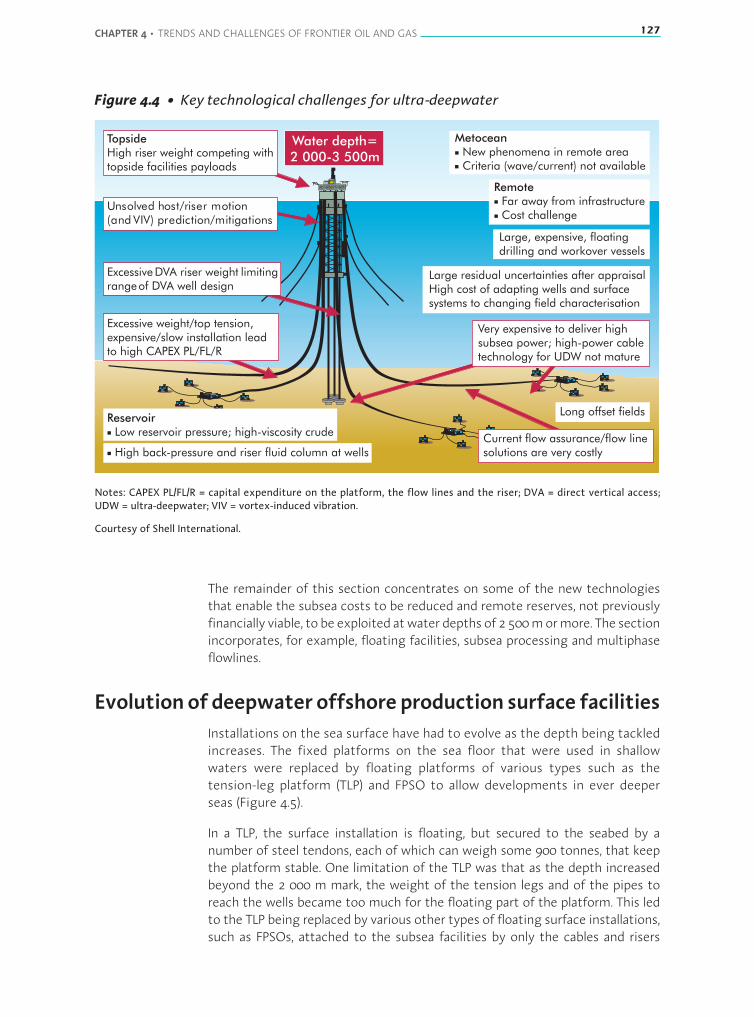
CHAPTER 4 • TRENDS AND CHALLENGES OF FRONTIER OIL AND GAS 127
Figure 4.4 • Key technological challenges for ultra-deepwater
TopsideHigh riser weight competing withtopside facilities payloads
Excessive weight/top tension,expensive/slow installation leadto high CAPEX PL/FL/R
Reservoir- Low reservoir pressure; high-viscosity crude
- High back-pressure and riser fluid column at wells
Excessive DVA riser weight limitingrangeof DVA well design
Metocean- New phenomena in remote area- Criteria (wave/current) not available
Remote- Far away from infrastructure- Cost challenge
Large, expensive, floatingdrilling and workover vessels
Large residual uncertainties after appraisalHigh cost of adapting wells and surfacesystems to changing field characterisation
Long offset fields
Current flow assurance/flow linesolutions are very costly
Unsolved host/riser motion(and VIV) prediction/mitigations
Very expensive to deliver highsubsea power; high-power cabletechnology for UDW not mature
Water depth=2 000-3 500m
Notes: CAPEX PL/FL/R = capital expenditure on the platform, the flow lines and the riser; DVA = direct vertical access;UDW = ultra-deepwater; VIV = vortex-induced vibration.
Courtesy of Shell International.
The remainder of this section concentrates on some of the new technologiesthat enable the subsea costs to be reduced and remote reserves, not previouslyfinancially viable, to be exploited atwater depths of 2 500mormore. The sectionincorporates, for example, floating facilities, subsea processing and multiphaseflowlines.
Evolution of deepwater offshore production surface facilitiesInstallations on the sea surface have had to evolve as the depth being tackledincreases. The fixed platforms on the sea floor that were used in shallowwaters were replaced by floating platforms of various types such as thetension-leg platform (TLP) and FPSO to allow developments in ever deeperseas (Figure 4.5).
In a TLP, the surface installation is floating, but secured to the seabed by anumber of steel tendons, each of which can weigh some 900 tonnes, that keepthe platform stable. One limitation of the TLP was that as the depth increasedbeyond the 2 000 m mark, the weight of the tension legs and of the pipes toreach the wells became too much for the floating part of the platform. This ledto the TLP being replaced by various other types of floating surface installations,such as FPSOs, attached to the subsea facilities by only the cables and risers
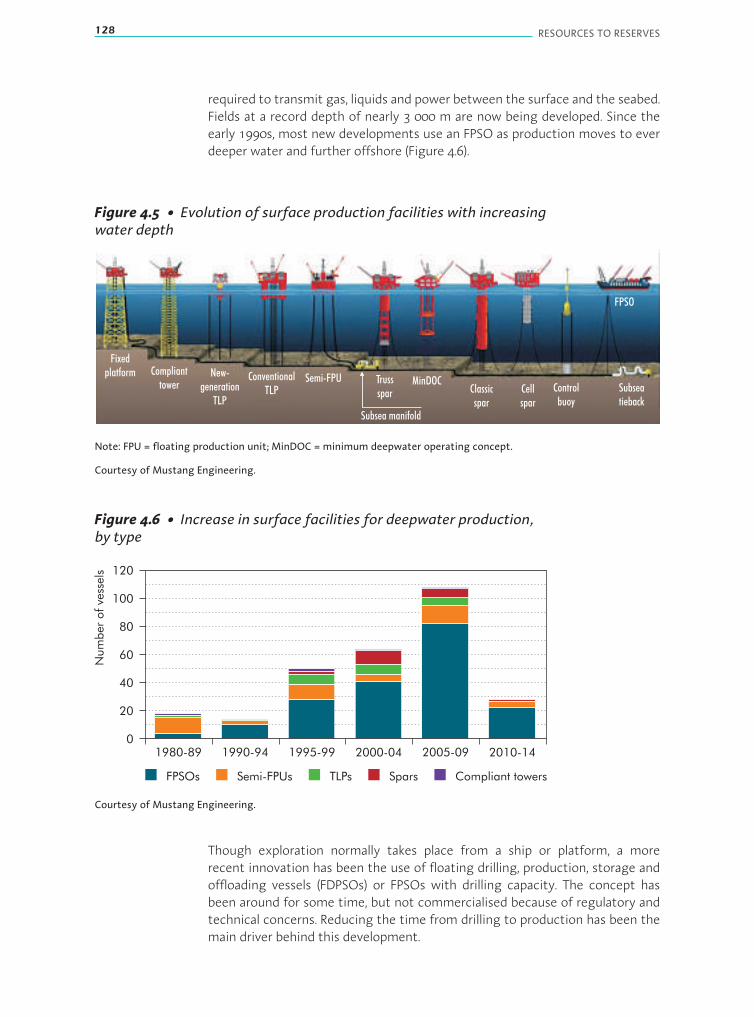
128 RESOURCES TO RESERVES
required to transmit gas, liquids and power between the surface and the seabed.Fields at a record depth of nearly 3 000 m are now being developed. Since theearly 1990s, most new developments use an FPSO as production moves to everdeeper water and further offshore (Figure 4.6).
Figure 4.5 • Evolution of surface production facilities with increasingwater depth
Subsea manifold
Fixedplatform Compliant
towerNew-
generationTLP
ConventionalTLP
Semi-FPU Trussspar
MinDOCClassicspar
Cellspar
Controlbuoy
Subseatieback
FPSO
Note: FPU = floating production unit; MinDOC = minimum deepwater operating concept.
Courtesy of Mustang Engineering.
Figure 4.6 • Increase in surface facilities for deepwater production,by type
120
100
80
60
40
20
0
Num
ber
ofve
ssels
1980-89 1990-94 1995-99 2000-04 2005-09 2010-14
FPSOs Semi-FPUs TLPs Spars Compliant towers
Courtesy of Mustang Engineering.
Though exploration normally takes place from a ship or platform, a morerecent innovation has been the use of floating drilling, production, storage andoffloading vessels (FDPSOs) or FPSOs with drilling capacity. The concept hasbeen around for some time, but not commercialised because of regulatory andtechnical concerns. Reducing the time from drilling to production has been themain driver behind this development.
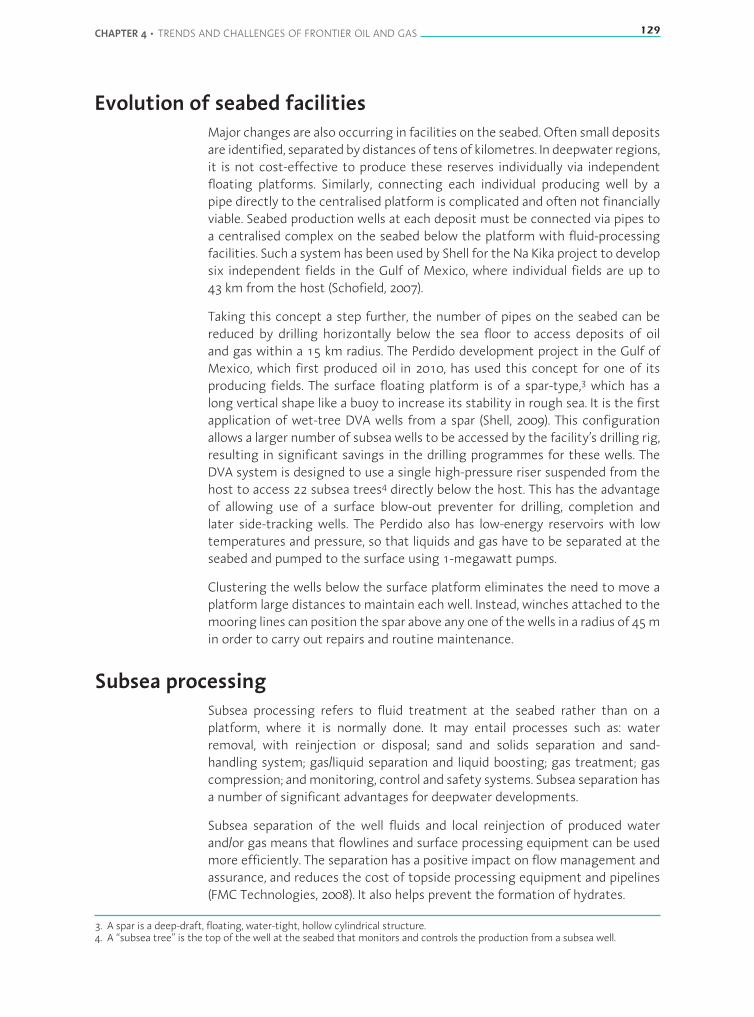
CHAPTER 4 • TRENDS AND CHALLENGES OF FRONTIER OIL AND GAS 129
Evolution of seabed facilitiesMajor changes are also occurring in facilities on the seabed. Often small depositsare identified, separated by distances of tens of kilometres. In deepwater regions,it is not cost-effective to produce these reserves individually via independentfloating platforms. Similarly, connecting each individual producing well by apipe directly to the centralised platform is complicated and often not financiallyviable. Seabed production wells at each deposit must be connected via pipes toa centralised complex on the seabed below the platform with fluid-processingfacilities. Such a systemhas been used by Shell for theNa Kika project to developsix independent fields in the Gulf of Mexico, where individual fields are up to43 km from the host (Schofield, 2007).
Taking this concept a step further, the number of pipes on the seabed can bereduced by drilling horizontally below the sea floor to access deposits of oiland gas within a 15 km radius. The Perdido development project in the Gulf ofMexico, which first produced oil in 2010, has used this concept for one of itsproducing fields. The surface floating platform is of a spar-type,3 which has along vertical shape like a buoy to increase its stability in rough sea. It is the firstapplication of wet-tree DVA wells from a spar (Shell, 2009). This configurationallows a larger number of subsea wells to be accessed by the facility’s drilling rig,resulting in significant savings in the drilling programmes for these wells. TheDVA system is designed to use a single high-pressure riser suspended from thehost to access 22 subsea trees4 directly below the host. This has the advantageof allowing use of a surface blow-out preventer for drilling, completion andlater side-tracking wells. The Perdido also has low-energy reservoirs with lowtemperatures and pressure, so that liquids and gas have to be separated at theseabed and pumped to the surface using 1-megawatt pumps.
Clustering the wells below the surface platform eliminates the need to move aplatform large distances to maintain each well. Instead, winches attached to themooring lines can position the spar above any one of thewells in a radius of 45min order to carry out repairs and routine maintenance.
Subsea processingSubsea processing refers to fluid treatment at the seabed rather than on aplatform, where it is normally done. It may entail processes such as: waterremoval, with reinjection or disposal; sand and solids separation and sand-handling system; gas/liquid separation and liquid boosting; gas treatment; gascompression; andmonitoring, control and safety systems. Subsea separation hasa number of significant advantages for deepwater developments.
Subsea separation of the well fluids and local reinjection of produced waterand/or gas means that flowlines and surface processing equipment can be usedmore efficiently. The separation has a positive impact on flowmanagement andassurance, and reduces the cost of topside processing equipment and pipelines(FMC Technologies, 2008). It also helps prevent the formation of hydrates.
3. A spar is a deep-draft, floating, water-tight, hollow cylindrical structure.4. A “subsea tree” is the top of the well at the seabed that monitors and controls the production from a subsea well.
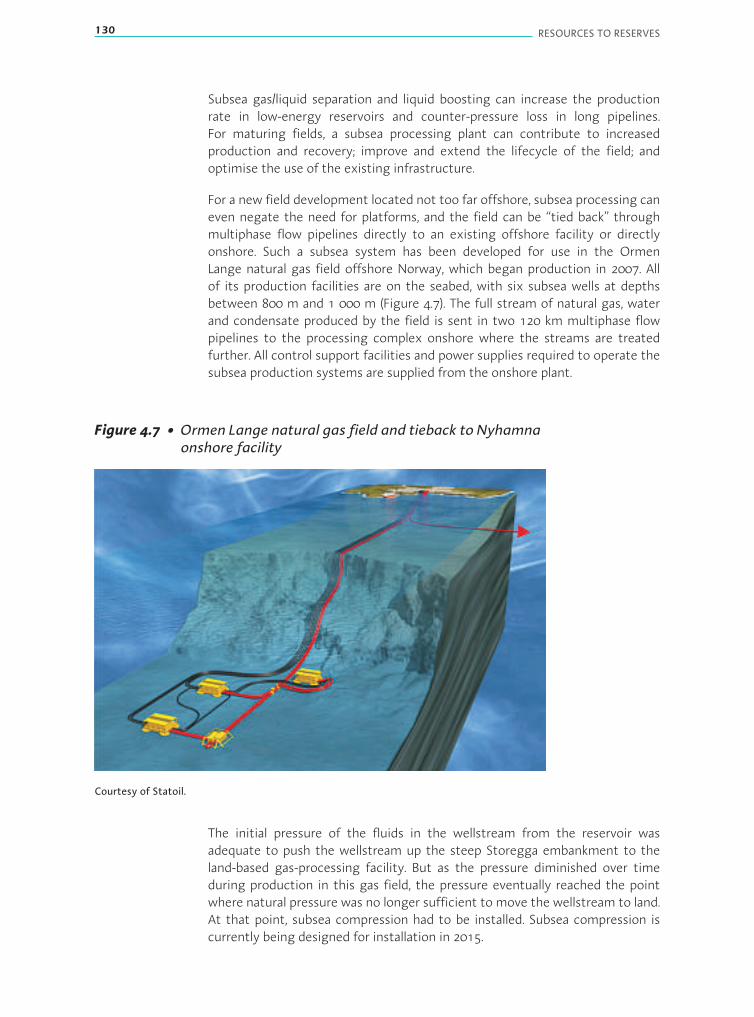
130 RESOURCES TO RESERVES
Subsea gas/liquid separation and liquid boosting can increase the productionrate in low-energy reservoirs and counter-pressure loss in long pipelines.For maturing fields, a subsea processing plant can contribute to increasedproduction and recovery; improve and extend the lifecycle of the field; andoptimise the use of the existing infrastructure.
For a new field development located not too far offshore, subsea processing caneven negate the need for platforms, and the field can be “tied back” throughmultiphase flow pipelines directly to an existing offshore facility or directlyonshore. Such a subsea system has been developed for use in the OrmenLange natural gas field offshore Norway, which began production in 2007. Allof its production facilities are on the seabed, with six subsea wells at depthsbetween 800 m and 1 000 m (Figure 4.7). The full stream of natural gas, waterand condensate produced by the field is sent in two 120 km multiphase flowpipelines to the processing complex onshore where the streams are treatedfurther. All control support facilities and power supplies required to operate thesubsea production systems are supplied from the onshore plant.
Figure 4.7 • Ormen Lange natural gas field and tieback to Nyhamnaonshore facility
Courtesy of Statoil.
The initial pressure of the fluids in the wellstream from the reservoir wasadequate to push the wellstream up the steep Storegga embankment to theland-based gas-processing facility. But as the pressure diminished over timeduring production in this gas field, the pressure eventually reached the pointwhere natural pressure was no longer sufficient to move the wellstream to land.At that point, subsea compression had to be installed. Subsea compression iscurrently being designed for installation in 2015.
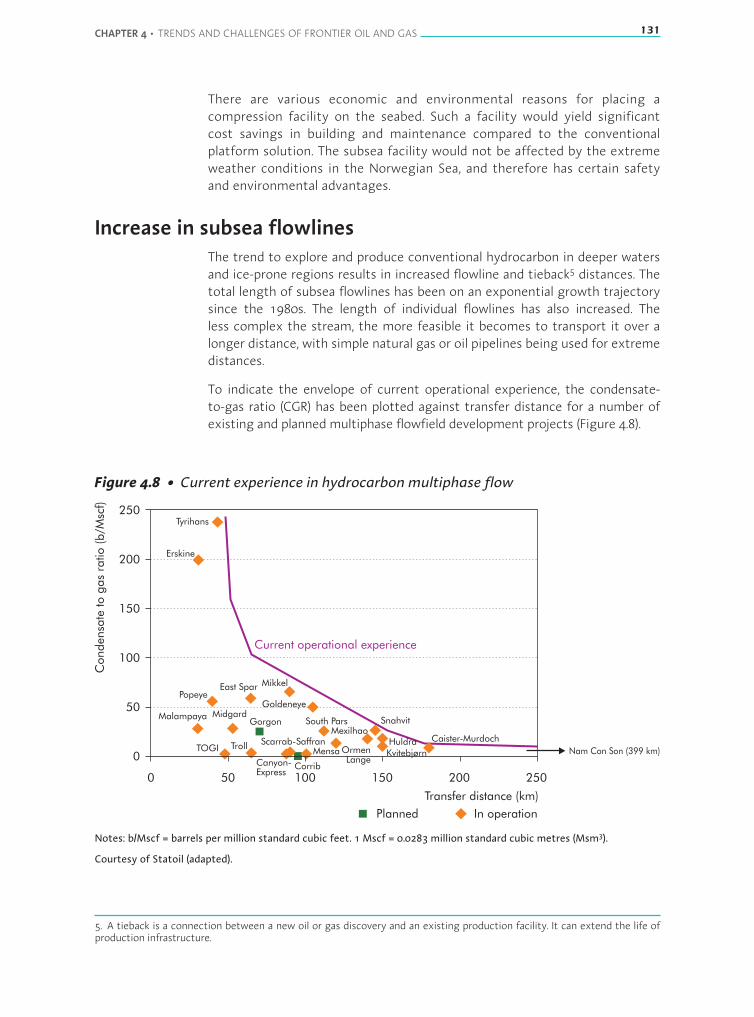
CHAPTER 4 • TRENDS AND CHALLENGES OF FRONTIER OIL AND GAS 131
There are various economic and environmental reasons for placing acompression facility on the seabed. Such a facility would yield significantcost savings in building and maintenance compared to the conventionalplatform solution. The subsea facility would not be affected by the extremeweather conditions in the Norwegian Sea, and therefore has certain safetyand environmental advantages.
Increase in subsea flowlinesThe trend to explore and produce conventional hydrocarbon in deeper watersand ice-prone regions results in increased flowline and tieback5 distances. Thetotal length of subsea flowlines has been on an exponential growth trajectorysince the 1980s. The length of individual flowlines has also increased. Theless complex the stream, the more feasible it becomes to transport it over alonger distance, with simple natural gas or oil pipelines being used for extremedistances.
To indicate the envelope of current operational experience, the condensate-to-gas ratio (CGR) has been plotted against transfer distance for a number ofexisting and planned multiphase flowfield development projects (Figure 4.8).
Figure 4.8 • Current experience in hydrocarbon multiphase flow
Current operational experience
Transfer distance (km)
Con
dens
ate
toga
sra
tio(b
/Msc
f)
0
0
50
50
100
100
150
150
200
200
250
250
Planned In operation
Tyrihans
Erskine
Popeye
Malampaya
East Spar
TOGI
MidgardGorgon
Troll
Mikkel
Goldeneye
Snahvit
Caister-MurdochNam Con Son (399 km)Mensa
CorribCanyon-Express
Scarrab-SaffranMexilhao
South Pars
KvitebjørnHuldra
OrmenLange
Notes: b/Mscf = barrels per million standard cubic feet. 1 Mscf = 0.0283 million standard cubic metres (Msm3).
Courtesy of Statoil (adapted).
5. A tieback is a connection between a new oil or gas discovery and an existing production facility. It can extend the life ofproduction infrastructure.

132 RESOURCES TO RESERVES
Rich gas developments with a high condensate-to-gas ratio clearly cannot yetbe transported over long distances. Integration with subsea processing andcompression solutions may be one of the answers to enhance the operatingenvelope.
Multiphase flow assuranceWellstreams are complex and often consist of liquid, gaseous and solidcomponents. Their properties and flowdynamics are affectedby the surroundingenvironmental conditions, particularly temperatureandpressure. Akeychallengeis “multiphase flow assurance”, which implies taking the necessary measures toensure that the stream reaches its destination safely and uninterrupted.
Again, taking the Ormen Lange natural gas field as an example, its developmentprovides a good illustration of the many-faceted and technically demandingproblems ofmultiphase transport, and how theymay be handled (Figure 4.9). Thesubsea production templates are attached to two 30-inch pipes that transportthe untreated multiphase flow wellstream (condensate, water and natural gas)to the onshore facility.
Figure 4.9 • Facets of the multiphase flow at Ormen Lange
Onshore facilitiesSlug catchers (2x1 500 m )
3
Gas backflow and circulationPipeline monitoring and liquidhold-up management systemMEG injection control andmonitoring system
Manifolds with dual headersWells may be routed to eitherof the two manifolds
2x6 MEG injection linesRedundancyRemote control
2x30 multiphase production pipelinesImproved turndown and swing flexibility
Enable production through only one lineat low turndownsEnable dynamic pigging for liquid-holdup managementEnable gas circulation to improve liquid-holdup management
Reduced slug volumes during transientoperations, reduced slug catcher sizeIncreased production availability in case ofhydrates blockage or failure in one line
i.e.
Subsea chokesBalance/control well productionControl slug catcher pressureRemote control
Note: m3 = cubicmetres. MEG =monoethylene glycol, which prevents hydrates from plugging; Pigging refers to amethodfor cleaning the interior walls of a pipe. A slug catcher refers to equipment installed to catch an unwanted accumulation(slug) of liquid in a pipeline.
Courtesy of Statoil (Kjaernes, 2008).
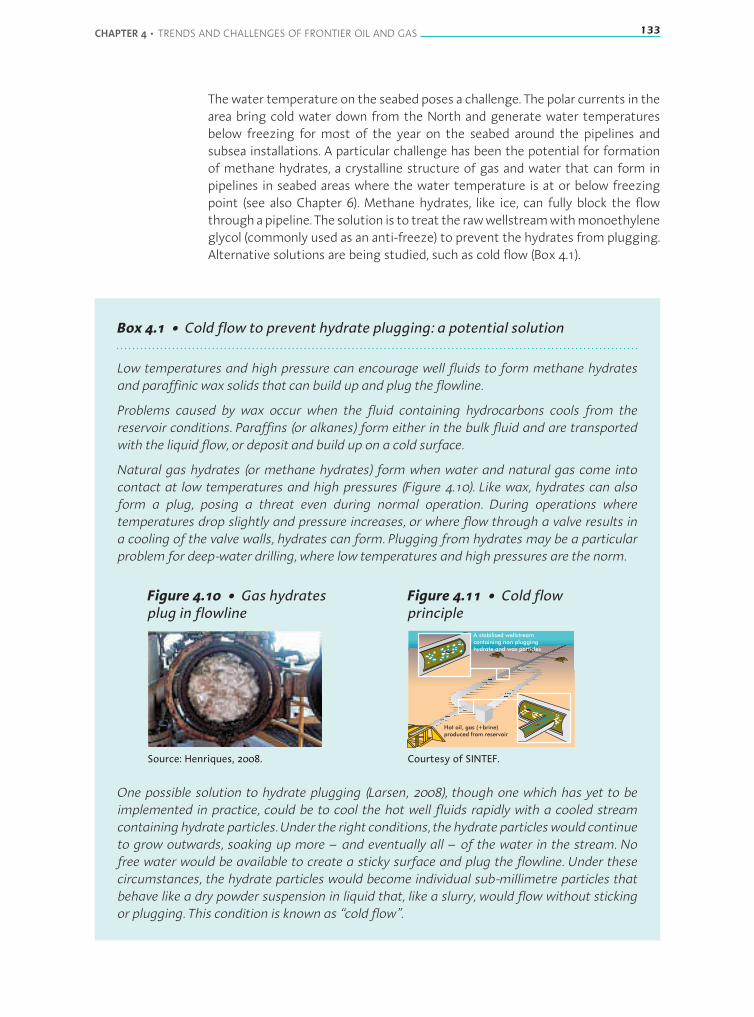
CHAPTER 4 • TRENDS AND CHALLENGES OF FRONTIER OIL AND GAS 133
Thewater temperature on the seabed poses a challenge. The polar currents in thearea bring cold water down from the North and generate water temperaturesbelow freezing for most of the year on the seabed around the pipelines andsubsea installations. A particular challenge has been the potential for formationof methane hydrates, a crystalline structure of gas and water that can form inpipelines in seabed areas where the water temperature is at or below freezingpoint (see also Chapter 6). Methane hydrates, like ice, can fully block the flowthroughapipeline. The solution is to treat the rawwellstreamwithmonoethyleneglycol (commonly used as an anti-freeze) to prevent the hydrates from plugging.Alternative solutions are being studied, such as cold flow (Box 4.1).
Box 4.1 • Cold flow to prevent hydrate plugging: a potential solution
Low temperatures and high pressure can encourage well fluids to form methane hydratesand paraffinic wax solids that can build up and plug the flowline.
Problems caused by wax occur when the fluid containing hydrocarbons cools from thereservoir conditions. Paraffins (or alkanes) form either in the bulk fluid and are transportedwith the liquid flow, or deposit and build up on a cold surface.
Natural gas hydrates (or methane hydrates) form when water and natural gas come intocontact at low temperatures and high pressures (Figure 4.10). Like wax, hydrates can alsoform a plug, posing a threat even during normal operation. During operations wheretemperatures drop slightly and pressure increases, or where flow through a valve results ina cooling of the valve walls, hydrates can form. Plugging from hydrates may be a particularproblem for deep-water drilling, where low temperatures and high pressures are the norm.
Figure 4.10 • Gas hydratesplug in flowline
Source: Henriques, 2008.
Figure 4.11 • Cold flowprinciple
Hot oil, gas (+brine)produced from reservoir
A stabilised wellstreamcontaining non plugginghydrate and wax particles
Courtesy of SINTEF.
One possible solution to hydrate plugging (Larsen, 2008), though one which has yet to beimplemented in practice, could be to cool the hot well fluids rapidly with a cooled streamcontaining hydrate particles. Under the right conditions, the hydrate particleswould continueto grow outwards, soaking up more – and eventually all – of the water in the stream. Nofree water would be available to create a sticky surface and plug the flowline. Under thesecircumstances, the hydrate particles would become individual sub-millimetre particles thatbehave like a dry powder suspension in liquid that, like a slurry, would flow without stickingor plugging. This condition is known as “cold flow”.
134 RESOURCES TO RESERVES
In practice, the rapid cooling from about 80°C (degrees Celsius) to around 4°C near thewell-head can be done by recycling an already cold stream of stabilised dry hydrate slurry,taken from a point on the pipeline several kilometres downstream from the subsea well, andreturning it to a point near the well-head where it is mixed with warm fluids (Figure 4.11).This acts as a seed to induce further dry hydrate growth. When the slurry reaches the hostplatform, it is converted back to free water and gas.
Phasing a development and leveraging technologyalong the way
In many cases, companies acquire ultra-deepwater permits before thetechnology necessary to develop these reserves aremature. Resolving this issuepushes the boundaries of technology even further, opening up new frontiersfor ultra-deepwater oil and gas developments. Moving to subsea separationand subsea compression, as discussed in the previous section, is one of manyexamples.
For offshore developments in Brazil, a single system will be used to develop anumber of reservoirs with quite different crude properties (e.g. light or heavycrude). An example is the Parque das Conchas development where crude oilin various reservoirs ranges from light oil (41°API6) to heavy oil (16°API). Thedevelopment first targets the light- to medium-gravity crude, moving on thelearning curve and providing an income, before focusing on the more difficultdevelopment of the heavy crude. Subsea booster pumps, which increase thepressure of the liquid stream, have recently been switched because the pressurein the reservoir was no longer sufficient to transport the fluids to the productionvessel. The experience with booster pumps is essential for designing additionalboosting when the heavier crude reservoirs are added to the system.
The Parque das Conchas development is further complicated by the challengingnature of drilling horizontal wells in the shallow reservoirs just below the seabed.These reservoirs consist of unconsolidated sands that require special drilling andcontrol techniques. Experience will be especially relevant when developing theheavy crude reservoirs as the challenges of unconsolidated reservoirs are larger.
Thus, the complex set of reservoirs requires a lifecycle approach in which initialdesign recognises the various phases of development and the technologyrequired so that enhancements can be incorporated throughout the entireprocess. It will be important to incorporate the technology developed andused in Parque das Conchas to overcome specific challenges in future designspecifications.
6. API (American Petroleum Institute) gravity is a measure of the density of oil. The API gravity scale is calibrated so that mostcrude oils, as well as distillate fuels, will have API gravities between 10° and 70°API. The lower the number, the heavier and themore viscous is the oil.

CHAPTER 4 • TRENDS AND CHALLENGES OF FRONTIER OIL AND GAS 135
Technologies for meeting the Arctic challenge
The Arctic continental shelves constitute some of the world’s largest remainingprospective areas of oil and gas (Figure 4.12). Because of remoteness andtechnological challenges, coupled with abundant low-cost petroleum availableelsewhere, less exploration for oil and gas has traditionally occurred in the Arctic.In the late 1970s, oil production on Alaska’s North Slope (ANS) and natural gasproduction in West Siberia were the first developments to lead the way. Today,the exploration and production of Arctic oil and gas extend further to include anumber of offshore and onshore locations in Canadian, Norwegian, Russian andUS territory, and offshore Greenland.
The growing global demand forhydrocarbons and the fact that theArctic may contain almost one-quarter of the world’s undiscoveredreserves, provide powerful incentivesfor governments and industry todevelop the necessary technology tofurther explore and develop reservesin the Arctic.
Aggregated United States GeologicalSurvey (USGS) figures for oil and gasprospects in the Arctic indicate apolar region more prone to naturalgas than oil, with most hydrocarbonslocated in offshore geologicalbasins (USGS, 2000; Bird et al., 2008).According to one USGS assessment(Gautier et al., 2009), geological basinsnorth of the Arctic Circle may containapproximately 30% of the world’sglobal undiscovered natural gasvolumes. The assessment suggeststhere could be as much as 90 bbof oil, 44 billion boe of natural gasliquids (NGLs) and 47 trillion cubic
metres (1 670 trillion cubic feet or 290 boe) of natural gas. This would meanthat natural gas and NGLs represent approximately three-quarters of fossil fuelresources in the Arctic. In terms of recoverable volumes, this ratio could be evenhigher. Though the Arctic could provide fossil fuels comparable to those foundin today’s major petroleum basins (Bishop et al., 2010), the extent to which theresources will in fact be exploited will depend a great deal on future energy andenvironmental policies.
Figures 4.13 and 4.14 describe the distribution of Arctic oil and gas resources.The darker the coloured segments, the higher the probability of finding oil orgas in the depicted areas.
Figure 4.12 • View from the top
m
This map is without prejudice to the status of or sovereignty over any territory, to the delimitation of internationalfrontiers and boundaries, and to the name of any territory, city or area.
Source: Rekacewicz, 2005.

136 RESOURCES TO RESERVES
Figure 4.13 • Distribution of undiscovered oil accumulations
NW Greenland~4.9 bb
S. Danmarkshavn ~4.3 bbN. Danmarkshavn ~3.3 bb
South Barents~9.4 bb
Canning-Mackenzie~6.4 bb
Undiscovered oil (bb)
Area not quantitatively assessed
Area of low petroleum potential
<0.1
0.1-1
1-10
>10
Yenisey-Khatanga~5.3 bb
Alaska Platform~28 bb
This map is without prejudice to the status of or sovereignty over any territory, to the delimitation of international frontiers and boundaries, and to the name of any territory, city or area.
Source: Bird et al., 2008.
Figure 4.14 • Distribution of undiscovered natural gas resources
South Kara~18 400 bcm
South Barents~9 000 bcm
North Barents~6 300 bcm
Undiscovered gas (bcm)
Area not quantitatively assessed
Area of low petroleum potential
<30
30-200
200-3 000
>3 000
Alaska Platform~3 500 bcm
This map is without prejudice to the status of or sovereignty over any territory, to the delimitation of international frontiers and boundaries, and to the name of any territory, city or area.
Note: bcm = billion cubic metres.
Source: Bird et al., 2008.
CHAPTER 4 • TRENDS AND CHALLENGES OF FRONTIER OIL AND GAS 137
Two-thirds of the undiscovered natural gas resource in the Arctic is located injust four areas: South Kara Sea, South Barents Sea Basin, North Barents Sea Basinand the Alaska Platform. The South Kara Sea, the offshore part of the northernWest Siberian Basin, contains almost 39% of undiscovered gas and is the mostprospective hydrocarbon province in the Arctic (Bird et al., 2008). The largestaccumulations of oil are also expected to be found in the same basins, with themost prospective areas assessed located in offshore Alaska and Greenland, aswell as in areas within and adjacent to the South Barents Sea.
Trends in Arctic frontier exploration and productionArctic hydrocarbon exploitation began in the 1960s to 1970s with explorationin the Canadian Arctic and Beaufort Sea. First production from the ANS came in1977 from the Prudhoe Bay Complex, the largest oilfield in the United States. Acomplete infrastructure had to be installed before the Prudhoe Bay Unit of oil-producing fields could be developed. The first delivery of oil to domesticmarketscame some ten years after its discovery (Thomas et al., 1991). A 1 300 km-longpipeline, known as the Trans-Alaska Pipeline System (TAPS), carries ANS oil totidewater,where it is transferredtotankers for transporttodownstreammarkets.Because of the long distance tomarkets, and the lack of an export pipeline, gas isused only in field operations, leading to some interesting enhanced oil recoveryprojects by injecting gas. Conversion of NGLs for transport in TAPS has also beenconsidered but not implemented.
Nearly all producing fields in the Russian Arctic are located onshore, includingthe giant Yamburg oil and gas condensate field, which is also the third-largestgas field in the world. There are also some very large hydrocarbon recoveriesoffshore not yet in production. The Prirazlomnoye field in the Pechora Seas isexpected to begin production in 2013.
Offshore exploration involves constructing artificial islands in shallow waters(<10 m) and caissons systems7 out to around 25 m in order to allow year-rounddrilling. In deeper waters (up to 200 m), drilling ships with strengthened hulls orice-resistant floating drilling units have lengthened the drilling season by one ortwo months, with icebreakers used when needed.
Inthenextfewdecades,explorationandproductionactivity intheoffshoreArcticis likely to increase, particularly in the Barents Sea and adjacent areas, and in ANSoffshore basins. In the South Barents Sea, investment in newproduction capacityis likely to involve the development of the Goliat field offshore the northern tipof the Norwegian mainland (with expected first production in 2013) and theShtokman field in the Russian sector (development decision postponed). In theKara Sea, major fields discovered provide opportunities for next-generation fielddevelopments. In April 2012, Rosneft and Exxon announced a partnership toworktogether to develop offshore untapped reserves in the Kara Sea. Permits havealso recently been awarded to Shell for exploratory drilling offshore Alaska in theBeaufort Sea and the Chukchi Sea in the Arctic Ocean. First oil discoveries off thewest coast of Greenland in 2010 seemed too low for commercial exploitation
7. Caissons systems are iron structures built around a drilling ship or platform to protect it against ice. They serve a similarpurpose to the structures used to build the pillars of a bridge or make a dry dock.

138 RESOURCES TO RESERVES
but the country has expanded the exploration area by announcing a biddinground for hydrocarbon licences off the north-eastern coast in 2012-13.
Realising the potential of Arctic resources will depend not only on marketsuccess and conditions in finding them, but also on technological innovationand the ability to exploit these resources in a safe and environmentally soundmanner. The cost of bringing Arctic resources to markets is substantial, soprojects will require a high market price and more cost-effective technology toattract investment.
The TAPS oil export pipeline has been important for the development of oil in theregion. However, there is no such export option for gas, partly as it would requireliquefied natural gas (LNG) transport from south Alaska or a longer export lineto the border with the United States. As a consequence, produced hydrocarbongas is largely reinjected in the oil reservoirs, for example in the gas cap of fieldssuch as Prudhoe Bay, or middle gas components such as miscible gas are addedin the oil rim. Prudhoe Bay has themost extensivemiscible gas injection projectsin the world. If a gas export route can be established, a large volume of gaseoushydrocarbons would become available for export.
Technological challenges for the ArcticTechnological advances for the Arctic can build on the solutions used todevelop the current offshore reserves, which are well adapted for normal watertemperatures and suitable for ice-free Arctic regions. Experience from recentfielddevelopmentsoperatedbyStatoil, suchas theSnøhvit field in theNorwegiansector of the Barents Sea and the Ormen Lange and Åsgard fields offshore mid-Norway, will benefit the next generation of field developments in offshore Arctic.
However, exploring and producing oil and gas resources in the Arctic pose anumber of challenges that go beyond current technological capabilities. Thespecific objectives of any developments in Arctic technology are to extend thedrilling season; protect surface drilling, production facilities and their inhabitantsfrom ice-related dangers; improve subsea exploitation technologies; and alsoincrease the distance for transporting produced hydrocarbons to onshoreprocessing facilities. The Arctic-related findings of the task force on Oil and Gasin the 21st Century (OG21) established by the Norwegian Ministry of Petroleumand Energy are summarised in Box 4.2.
Technological challenges for ice-prone areasIce poses a particular challenge for offshore Arctic field development and it needsto be managed or completely avoided. The conditions that prevail in differentgeographical zones depend on the extent of ice coverage. In the Barents Sea, forinstance, there are typically several differing conditions of ice coverage (Figure 4.15):
■ waters with ice cover during parts of the year;
■ waters with a permanent ice cap;
■ shallow waters (< 50mwater depth) near shore, with permanent or part-year icecoverage.

CHAPTER 4 • TRENDS AND CHALLENGES OF FRONTIER OIL AND GAS 139
Box 4.2 • Arctic technologies: findings of the OG21 Project
The Norwegian OG21 Task Force identified a number of research and development (R&D)priorities for developing technology specifically for: Arctic exploration and production;remote offshore development; and environmental protection.
■ Arctic exploration and production: technologies to be developed to deal with ice, ice loads,icebergs, pack ice or floes, and pressurised ice regions. Different aspects of ice propertiesand ice loads need to be addressed, and remedies sought to manage all installations andpipelines, whether floating, fixed, above sea or subsea.
■ Remote offshore development: technologies to be developed to deal with long flowlinesand tiebacks, involving multiphase flows over extreme distances and a cold environment.Included in this, solutions to be sought for operational safety aspects, burial, ice challenges,permafrost and shore approach solutions. Integrated operations and human factors wereimportant issues for remote developments.
■ Environmental protection: technologies to be developed to deal with operations in sensitiveareas, particularly those exposed to harsh climatic conditions. Issues addressed wouldinclude the effects of emissions to air and discharges to water, impact assessment andmonitoring, newmethods and related technology to prevent emissions and discharges.
More specifically for Arctic development in ice-prone regions, the OG21 project identified thefollowing requirements:
■ More detailed and reliable information on ice characteristics and icebergmovements.
■ A better understanding of the effects of ice loadings on platforms of varying types, aimed atdesigning the best platforms for different ice regimes.
■ A clearer picture of the depth requirements for pipelines in different regimes tomanage therisks of ice gouging (narrow ditches in the seafloor created bymoving ice).
■ Development of floating systems for drilling and production in an Arctic environment thatcan remain in the area all year-round rather than having to dismantle the structures duringwinter and return to operations in the following summer.
■ Development of an Arctic floating platform with minimum facilities to support a subseadevelopment, including power generation, controls, well intervention and chemicals storage.
■ Further development of floating systems with disconnect capability, thereby enablingdisconnection and sail-away of a system in an emergency, such as an approaching iceberg.This solution would normally be combinedwith an iceberg (and ice) management system.
■ Adaptation of existing subsea solutions for operation in an Arctic environment, includingdrilling subsea wells in ice-prone conditions, well intervention, protection of subsea systemsfrom ice gouging and transportation of well fluids fromwell-head to host.
■ Development of Arctic offloading systems for moving oil or gas liquids to a tanker froman offshore storage unit, e.g. from an FPSO platform, operating in an Arctic environment,including offloading unit design, weather vaning*, icemanagement and an ice classificationsystem to define ice conditions.
■ Development of floating systems with a liquefaction plant (LNG plant or similar) to enabletransportation of gas to remotemarkets.
*Weather vaning is used tomaintain stability of the floating structure under exposure to harsh climatic conditions.
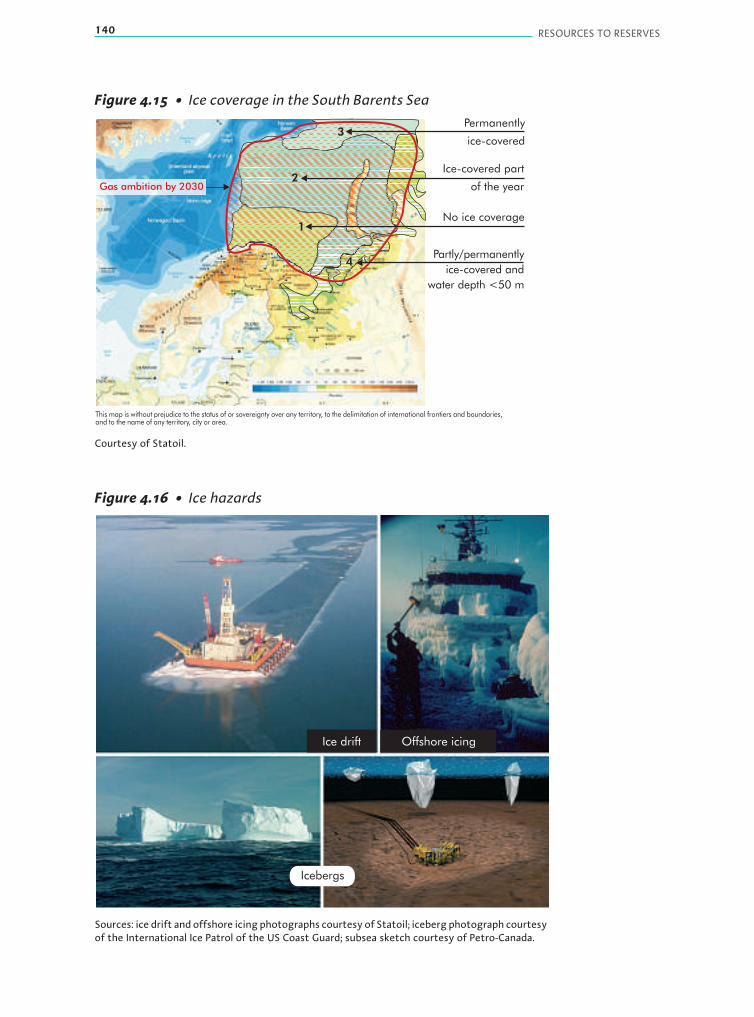
140 RESOURCES TO RESERVES
Figure 4.15 • Ice coverage in the South Barents Sea
No ice coverage
Ice-covered part
of the year
Permanently
ice-covered
4
3
2
1
Partly/permanently
ice-covered and
water depth <50 m
Gas ambition by 2030
This map is without prejudice to the status of or sovereignty over any territory, to the delimitation of international frontiers and boundaries,and to the name of any territory, city or area.
Courtesy of Statoil.
Figure 4.16 • Ice hazards
Ice drift
Icebergs
Offshore icing
Sources: ice drift and offshore icing photographs courtesy of Statoil; iceberg photograph courtesyof the International Ice Patrol of the US Coast Guard; subsea sketch courtesy of Petro-Canada.
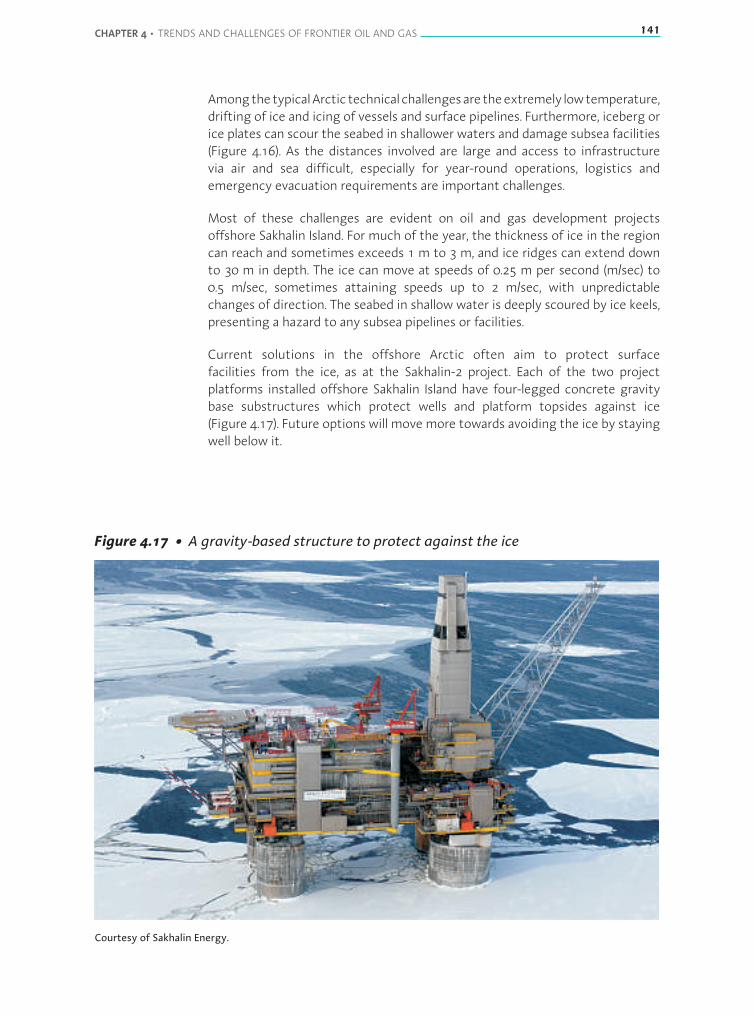
CHAPTER 4 • TRENDS AND CHALLENGES OF FRONTIER OIL AND GAS 141
AmongthetypicalArctictechnicalchallengesaretheextremely lowtemperature,drifting of ice and icing of vessels and surface pipelines. Furthermore, iceberg orice plates can scour the seabed in shallower waters and damage subsea facilities(Figure 4.16). As the distances involved are large and access to infrastructurevia air and sea difficult, especially for year-round operations, logistics andemergency evacuation requirements are important challenges.
Most of these challenges are evident on oil and gas development projectsoffshore Sakhalin Island. For much of the year, the thickness of ice in the regioncan reach and sometimes exceeds 1 m to 3 m, and ice ridges can extend downto 30 m in depth. The ice can move at speeds of 0.25 m per second (m/sec) to0.5 m/sec, sometimes attaining speeds up to 2 m/sec, with unpredictablechanges of direction. The seabed in shallow water is deeply scoured by ice keels,presenting a hazard to any subsea pipelines or facilities.
Current solutions in the offshore Arctic often aim to protect surfacefacilities from the ice, as at the Sakhalin-2 project. Each of the two projectplatforms installed offshore Sakhalin Island have four-legged concrete gravitybase substructures which protect wells and platform topsides against ice(Figure 4.17). Future options will movemore towards avoiding the ice by stayingwell below it.
Figure 4.17 • A gravity-based structure to protect against the ice
Courtesy of Sakhalin Energy.

142 RESOURCES TO RESERVES
Long-range, multiphase transportation of Arctic wellstreamsThe long-term goal for offshore, ice-prone regions would be wholly subseadevelopments, in which the produced hydrocarbons were piped to onshorefacilities, as is the case in the Snøhvit and Ormen Lange gas fields. These fields,however, do not have to deal with the added problem of surface ice cover, whichwould further complicate the development and operation of subsea facilities.When ice extends to the shore, an additional problem will be the potential fordamage to flowlines and tie-backs resulting from ice scouring in the shallowerwaters near the shore.
To exploit the huge potential resources in the Arctic over the longer term,it will be necessary to assess fields that are further offshore than thosecurrently developed. Existing infrastructure lacks the capabilities to processthe wellstream from fields in such remote locations. Extending the distance forwellstream multiphase transport from the current 120 km to 150 km distanceof the Ormen Lange and Snøhvit fields to 600 km would enable coverage ofmost of the prospective offshore basins in the circumpolar region (Figure 4.18).
Figure 4.18 • Distances to shore for long-range transfer of wellstream
Coastline
200 km
600 km
This map is without prejudice to the status of or sovereignty over any territory, to the delimitation of international frontiers and boundaries,and to the name of any territory, city or area.
Courtesy of Statoil.
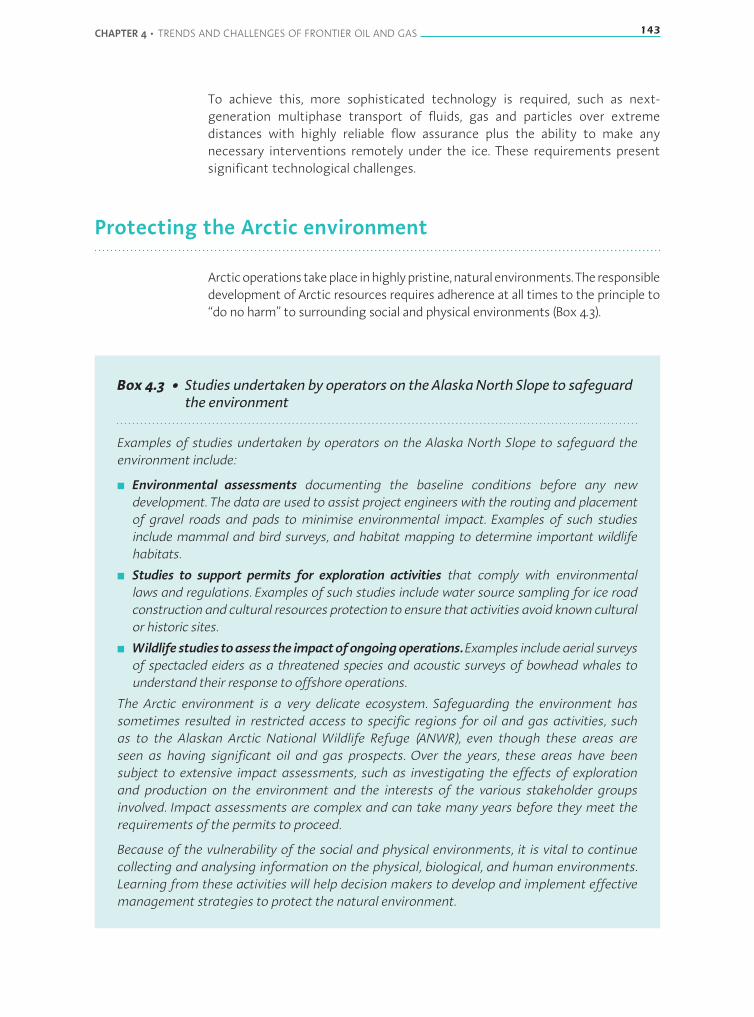
CHAPTER 4 • TRENDS AND CHALLENGES OF FRONTIER OIL AND GAS 143
To achieve this, more sophisticated technology is required, such as next-generation multiphase transport of fluids, gas and particles over extremedistances with highly reliable flow assurance plus the ability to make anynecessary interventions remotely under the ice. These requirements presentsignificant technological challenges.
Protecting the Arctic environment
Arcticoperationstakeplaceinhighlypristine,naturalenvironments.Theresponsibledevelopment of Arctic resources requires adherence at all times to the principle to“do no harm” to surrounding social and physical environments (Box 4.3).
Box 4.3 • Studies undertaken by operators on the AlaskaNorth Slope to safeguardthe environment
Examples of studies undertaken by operators on the Alaska North Slope to safeguard theenvironment include:
■ Environmental assessments documenting the baseline conditions before any newdevelopment. The data are used to assist project engineers with the routing and placementof gravel roads and pads to minimise environmental impact. Examples of such studiesinclude mammal and bird surveys, and habitat mapping to determine important wildlifehabitats.
■ Studies to support permits for exploration activities that comply with environmentallaws and regulations. Examples of such studies include water source sampling for ice roadconstruction and cultural resources protection to ensure that activities avoid known culturalor historic sites.
■ Wildlife studies toassess the impactofongoingoperations. Examples include aerial surveysof spectacled eiders as a threatened species and acoustic surveys of bowhead whales tounderstand their response to offshore operations.
The Arctic environment is a very delicate ecosystem. Safeguarding the environment hassometimes resulted in restricted access to specific regions for oil and gas activities, suchas to the Alaskan Arctic National Wildlife Refuge (ANWR), even though these areas areseen as having significant oil and gas prospects. Over the years, these areas have beensubject to extensive impact assessments, such as investigating the effects of explorationand production on the environment and the interests of the various stakeholder groupsinvolved. Impact assessments are complex and can take many years before they meet therequirements of the permits to proceed.
Because of the vulnerability of the social and physical environments, it is vital to continuecollecting and analysing information on the physical, biological, and human environments.Learning from these activities will help decision makers to develop and implement effectivemanagement strategies to protect the natural environment.

144 RESOURCES TO RESERVES
Minimising the environmental footprint
Forty years of Arctic technological advancements, including the use of extendedreach and horizontal drilling, have dramatically reduced the environmentalfootprint of operations, and made it possible to access more of the subsurfacearea from a limited surface space.
Somebestpracticeshavebeendeveloped fromvaluable international experienceaccumulated during the development and operation of a growing number ofonshore and offshore oil and gas fields in the Arctic, withminimal environmentalfootprint. Governments and industry are increasingly moving towards theprinciple of zero harmful effects to the environment in Arctic exploration andproduction. The evolution of environmental practices over the past few decadesmay be illustrated by two examples from the ANS, i.e. the Endicott and Alpineoilfields.
The Endicott Field
The Endicott Field, located about 15 km north-east of Prudhoe Bay, is the firstcontinuously producing offshore field in the Arctic. It originally held 1 bb of oil inplace. Discovered in 1978, the Endicott Field began production in October 1987and by mid-1992 was producing about 120 000 barrels per day (b/d). The fieldincludes 100 wells and development costs were slightly more than USD 1 billion.The Endicott Field was the first example of a greatly reduced environmentalfootprint – 70% less than the traditional size. The field was developed withdeviated wells drilled from two artificial islands in 5 m of water, connectedby an 8 km man-made gravel causeway. The 18 hectare (ha) main productionisland contains the operations centre and processing facilities. Processed oil istransported through a 38 km pipeline to the TAPS.
The Alpine Oilfield
More recently, the AlpineOilfield, also located close to Prudhoe Bay and declaredcommercial in 1996, began production in late 2000. The average annual grossproduction at Alpine is approximately 125 000 b/d. From the outset, the Alpinedevelopment incorporated the use of water alternating with miscible gasinjection (generated from the existing gas in the field) to sweep oil towardswells and achieve a high recovery efficiency of the oil. The Alpine Oilfield is anear zero-discharge facility designed to minimise the environmental footprintfrom the physical layout of the field. The waste generated is reused, recycled orproperly disposed of. There is no permanent road to the field and, in the winter,ice roads are constructed for transportation of materials to and from the site.These roads thaw in summer, avoiding permanent damage to the tundra (Figure4.19). Aircraft provide service to the field year-round, and are the main meansof field support when ice roads are melted. During the summer, operations onthe Alpine Oilfield are closed down and the drilling installation is removed. Theoriginal 16 000 ha oilfield was developed from two drill sites on just 40 ha or0.25% of the field area.

CHAPTER 4 • TRENDS AND CHALLENGES OF FRONTIER OIL AND GAS 145
Figure 4.19 • Layout of the Alpine Oilfield during winter operations and summerclose down
Summer Winter
Courtesy of ConocoPhillips Alaska.
Offshore Arctic field developments of the future may not require surfacefacilities in the vicinity of the field (Figure 4.20). The development of long-distance multiphase flow technologies, exemplified by the Snøhvit and OrmenLangegas fields, points theway to future exploration anddevelopment of oil andgas deposits in regions where ice is present some or all of the time. The aim willbe zero-surface facility developments.
Figure 4.20 • Arctic field development of the future: zero-surface facilities
Monitoringsystem
Controlsystem
Separation
High-voltage power supply
BoostingWax and hydrate control
Inspectionand
maintenance
Courtesy of Statoil.
Development of zero-surface facilities requires extending the scope of subseaequipment,with a strong focus onmonitoring remote operations and increasingrecovery by applying smart field technologies (seeChapter 2). Bringing theArctic

146 RESOURCES TO RESERVES
hydrocarbon resources successfully to shore, while assuring the protection ofthe pristine Arctic environment, will require a continued and strengthened focuson research, development, demonstration and deployment. This can only bedone with a high degree of international co-operation, facilitating convergenceof technology development and best practice.
Challenges to risk and response capabilities
Following the Deepwater Horizon drilling accident in the Gulf of Mexico, theindustry is faced with key questions related to the risk of and response to majoraccidents while drilling offshore. The Arctic is of particular concern as it is aneven more fragile ecosystem. Given this and the icy conditions, several aspectsrequire additional attention, such as:
■ theability to respond rapidly toanaccident (noting there is limited infrastructurein the Arctic);
■ sufficient resources to respond rapidly (e.g. staff, equipment, accommodationand number of ships);
■ complications with the flow of spills caused by the presence of ice (the spill maybe trapped under ice);
■ the suitability of current responsemethods (oil collection andoil burning ismorecomplicated in Arctic conditions than inwarmer, openwater, and chemicalsmayhave a larger impact on the environment);
■ slow regeneration (Arctic ecosystemsdonot regenerate as quickly as elsewhere).
All of these aspects require special attention and assurances must be providedas part of any field development proposal. A development optionmay need to beselected that provides the best response to large accidents.
Non-governmental organisations are putting these aspects at the forefront ofdebate and argue that a large gap between risk and present capabilities stillremains (WWF, 2010). Thoughmuch is being done to address the environmentalchallenges of hydrocarbon exploration in vulnerable and sensitive ecosystems,as illustrated in the next subsection, it is important that learning continues andthat the lessons learned are used to inform policy and practice.
Environmental impact assessment
Developing oil and gas reserves in the Arctic region will, in all cases, require acareful review of the potential impacts on the environment. The industry willtypically prepare an extensive environmental impact assessment (EIA8), a well-established tool used during the planning phase of major projects, to highlightany potential threats that development could pose to flora, fauna and thephysical environment. The EIA also identifies potentialmitigationmeasures.Mostjurisdictions around the world have established EIA regulations and procedures,including in some cases specific requirements for oil and gas, and offshoreactivities. All jurisdictions with interests in the Arctic region have national andprovincial regulatory regimes, including EIA requirements (Table 4.1).
8. Not to be confused with the US DOE’s Energy Information Administration (EIA).
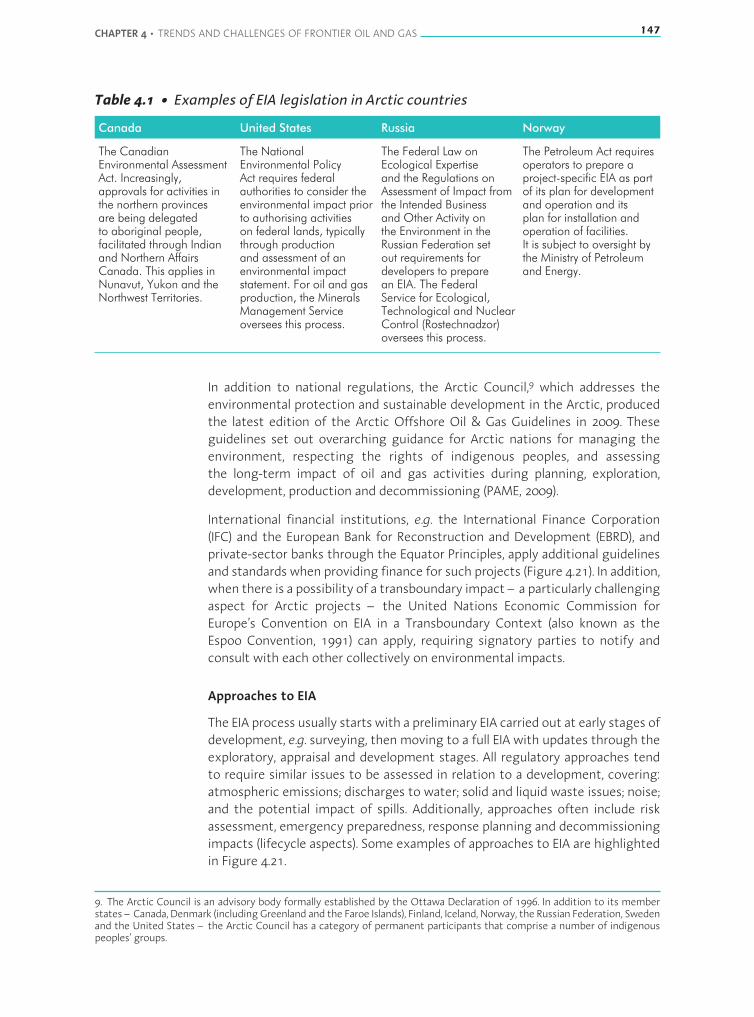
CHAPTER 4 • TRENDS AND CHALLENGES OF FRONTIER OIL AND GAS 147
Table 4.1 • Examples of EIA legislation in Arctic countries
Canada United States Russia Norway
The CanadianEnvironmental AssessmentAct. Increasingly,approvals for activities inthe northern provincesare being delegatedto aboriginal people,facilitated through Indianand Northern AffairsCanada. This applies inNunavut, Yukon and theNorthwest Territories.
The NationalEnvironmental PolicyAct requires federalauthorities to consider theenvironmental impact priorto authorising activitieson federal lands, typicallythrough productionand assessment of anenvironmental impactstatement. For oil and gasproduction, the MineralsManagement Serviceoversees this process.
The Federal Law onEcological Expertiseand the Regulations onAssessment of Impact fromthe Intended Businessand Other Activity onthe Environment in theRussian Federation setout requirements fordevelopers to preparean EIA. The FederalService for Ecological,Technological and NuclearControl (Rostechnadzor)oversees this process.
The Petroleum Act requiresoperators to prepare aproject-specific EIA as partof its plan for developmentand operation and itsplan for installation andoperation of facilities.It is subject to oversight bythe Ministry of Petroleumand Energy.
In addition to national regulations, the Arctic Council,9 which addresses theenvironmental protection and sustainable development in the Arctic, producedthe latest edition of the Arctic Offshore Oil & Gas Guidelines in 2009. Theseguidelines set out overarching guidance for Arctic nations for managing theenvironment, respecting the rights of indigenous peoples, and assessingthe long-term impact of oil and gas activities during planning, exploration,development, production and decommissioning (PAME, 2009).
International financial institutions, e.g. the International Finance Corporation(IFC) and the European Bank for Reconstruction and Development (EBRD), andprivate-sector banks through the Equator Principles, apply additional guidelinesand standards when providing finance for such projects (Figure 4.21). In addition,when there is a possibility of a transboundary impact – a particularly challengingaspect for Arctic projects – the United Nations Economic Commission forEurope’s Convention on EIA in a Transboundary Context (also known as theEspoo Convention, 1991) can apply, requiring signatory parties to notify andconsult with each other collectively on environmental impacts.
Approaches to EIA
The EIA process usually starts with a preliminary EIA carried out at early stages ofdevelopment, e.g. surveying, then moving to a full EIA with updates through theexploratory, appraisal and development stages. All regulatory approaches tendto require similar issues to be assessed in relation to a development, covering:atmospheric emissions; discharges to water; solid and liquid waste issues; noise;and the potential impact of spills. Additionally, approaches often include riskassessment, emergency preparedness, response planning and decommissioningimpacts (lifecycle aspects). Some examples of approaches to EIA are highlightedin Figure 4.21.
9. The Arctic Council is an advisory body formally established by the Ottawa Declaration of 1996. In addition to its memberstates – Canada, Denmark (includingGreenland and the Faroe Islands), Finland, Iceland, Norway, the Russian Federation, Swedenand the United States – the Arctic Council has a category of permanent participants that comprise a number of indigenouspeoples’ groups.
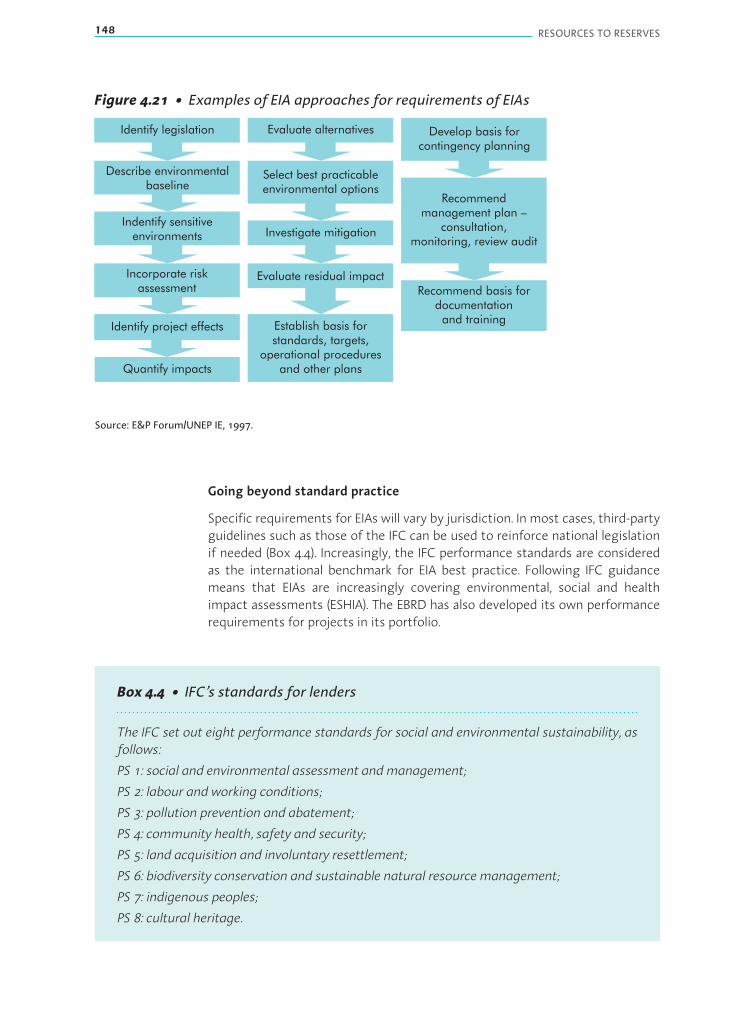
148 RESOURCES TO RESERVES
Figure 4.21 • Examples of EIA approaches for requirements of EIAs
Identify legislation
Describe environmentalbaseline
Indentify sensitiveenvironments
Incorporate riskassessment
Identify project effects
Quantify impacts
Evaluate alternatives
Select best practicableenvironmental options
Investigate mitigation
Evaluate residual impact
Establish basis forstandards, targets,
operational proceduresand other plans
Develop basis forcontingency planning
Recommendmanagement plan –
consultation,monitoring, review audit
Recommend basis fordocumentationand training
Source: E&P Forum/UNEP IE, 1997.
Going beyond standard practice
Specific requirements for EIAs will vary by jurisdiction. In most cases, third-partyguidelines such as those of the IFC can be used to reinforce national legislationif needed (Box 4.4). Increasingly, the IFC performance standards are consideredas the international benchmark for EIA best practice. Following IFC guidancemeans that EIAs are increasingly covering environmental, social and healthimpact assessments (ESHIA). The EBRD has also developed its own performancerequirements for projects in its portfolio.
Box 4.4 • IFC’s standards for lenders
The IFC set out eight performance standards for social and environmental sustainability, asfollows:
PS 1: social and environmental assessment andmanagement;
PS 2: labour and working conditions;
PS 3: pollution prevention and abatement;
PS 4: community health, safety and security;
PS 5: land acquisition and involuntary resettlement;
PS 6: biodiversity conservation and sustainable natural resource management;
PS 7: indigenous peoples;
PS 8: cultural heritage.
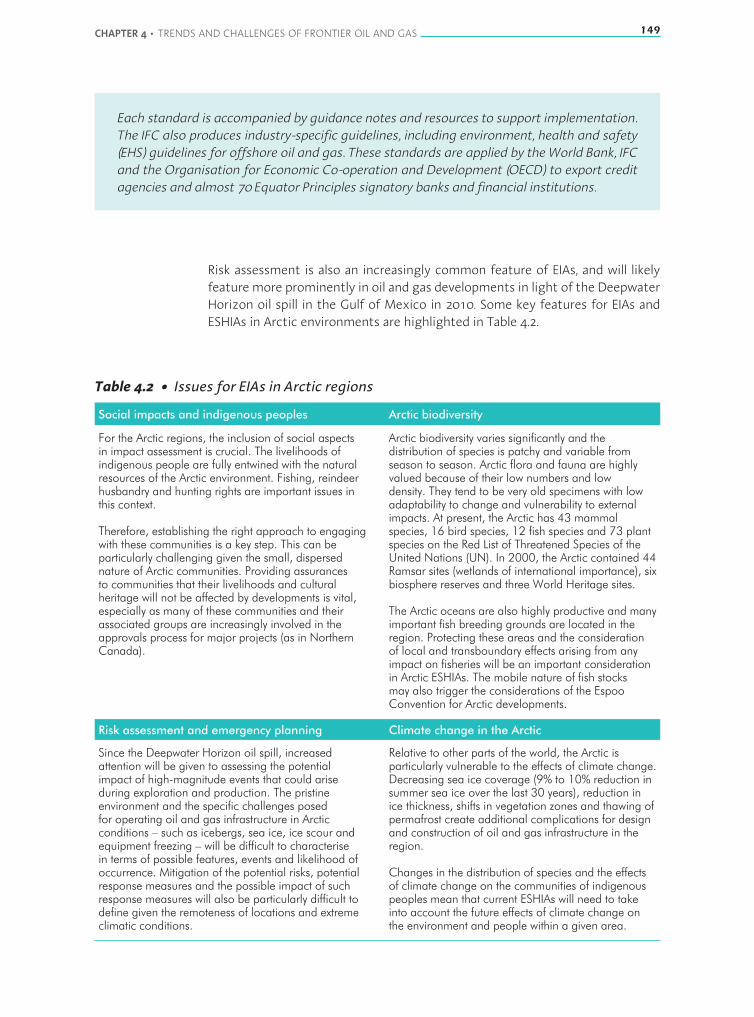
CHAPTER 4 • TRENDS AND CHALLENGES OF FRONTIER OIL AND GAS 149
Each standard is accompanied by guidance notes and resources to support implementation.The IFC also produces industry-specific guidelines, including environment, health and safety(EHS) guidelines for offshore oil and gas. These standards are applied by the World Bank, IFCand the Organisation for Economic Co-operation and Development (OECD) to export creditagencies and almost 70 Equator Principles signatory banks and financial institutions.
Risk assessment is also an increasingly common feature of EIAs, and will likelyfeaturemore prominently in oil and gas developments in light of the DeepwaterHorizon oil spill in the Gulf of Mexico in 2010. Some key features for EIAs andESHIAs in Arctic environments are highlighted in Table 4.2.
Table 4.2 • Issues for EIAs in Arctic regions
Social impacts and indigenous peoples Arctic biodiversity
For the Arctic regions, the inclusion of social aspectsin impact assessment is crucial. The livelihoods ofindigenous people are fully entwined with the naturalresources of the Arctic environment. Fishing, reindeerhusbandry and hunting rights are important issues inthis context.
Therefore, establishing the right approach to engagingwith these communities is a key step. This can beparticularly challenging given the small, dispersednature of Arctic communities. Providing assurancesto communities that their livelihoods and culturalheritage will not be affected by developments is vital,especially as many of these communities and theirassociated groups are increasingly involved in theapprovals process for major projects (as in NorthernCanada).
Arctic biodiversity varies significantly and thedistribution of species is patchy and variable fromseason to season. Arctic flora and fauna are highlyvalued because of their low numbers and lowdensity. They tend to be very old specimens with lowadaptability to change and vulnerability to externalimpacts. At present, the Arctic has 43 mammalspecies, 16 bird species, 12 fish species and 73 plantspecies on the Red List of Threatened Species of theUnited Nations (UN). In 2000, the Arctic contained 44Ramsar sites (wetlands of international importance), sixbiosphere reserves and three World Heritage sites.
The Arctic oceans are also highly productive and manyimportant fish breeding grounds are located in theregion. Protecting these areas and the considerationof local and transboundary effects arising from anyimpact on fisheries will be an important considerationin Arctic ESHIAs. The mobile nature of fish stocksmay also trigger the considerations of the EspooConvention for Arctic developments.
Risk assessment and emergency planning Climate change in the Arctic
Since the Deepwater Horizon oil spill, increasedattention will be given to assessing the potentialimpact of high-magnitude events that could ariseduring exploration and production. The pristineenvironment and the specific challenges posedfor operating oil and gas infrastructure in Arcticconditions – such as icebergs, sea ice, ice scour andequipment freezing – will be difficult to characterisein terms of possible features, events and likelihood ofoccurrence. Mitigation of the potential risks, potentialresponse measures and the possible impact of suchresponse measures will also be particularly difficult todefine given the remoteness of locations and extremeclimatic conditions.
Relative to other parts of the world, the Arctic isparticularly vulnerable to the effects of climate change.Decreasing sea ice coverage (9% to 10% reduction insummer sea ice over the last 30 years), reduction inice thickness, shifts in vegetation zones and thawing ofpermafrost create additional complications for designand construction of oil and gas infrastructure in theregion.
Changes in the distribution of species and the effectsof climate change on the communities of indigenouspeoples mean that current ESHIAs will need to takeinto account the future effects of climate change onthe environment and people within a given area.

150 RESOURCES TO RESERVES
Key references for Arctic EIAs
Several references include information about Arctic environments, its peoplesand the threats and the impact they face from infrastructure development andclimate change. These should all be reviewed and considered when preparingESHIAs for Arctic projects. Examples of sources are given in Table 4.3.
Table 4.3 • Reference sources for Arctic EIAs
Sources of further information on Arctic environmental issues
Arctic CouncilWorld Wildlife Fund (WWF) Arctic ProgrammeUnited Nations Environment Programme(UNEP) GRID-ArendalArctic Institute of North AmericaInternational Polar FoundationUS Department of Environment, ArcticEnergy Office
www.arctic-council.org/http://wwf.panda.org/what_we_do/where_we_work/arctic/
www.grida.no/www.arctic.ucalgary.ca/index.phpwww.polarfoundation.org/www.netl.doe.gov/technologies/oil-gas/AEO/main.html
Further information on Arctic communities
Arctic Council Indigenous Peoples SecretariatInuit Circumpolar Council (Canada)Aluet International AssociationRAIPONGwich’IN Council International
www.arcticpeoples.org/abouthttp://inuitcircumpolar.com/www.aleut-international.org/www.raipon.org/www.gwichin.org/
General guidelines on EIA and approvals
IFC Performance Standards
Equator PrinciplesUnited Nations Environment ProgrammeIndustry and Environment (UNEP IE) TechnicalReport 37Indian and Northern Affairs Canada(oil & gas section)The Alaska Outer Continental Shelf (OCS)Bureau of Ocean Energy Management,Regulation and EnforcementNorway Ministry of Petroleum
www.ifc.org/ifcext/sustainability.nsf/Content/PerformanceStandardswww.equator-principles.com/www.ogp.org.uk/pubs/254.pdf
www.ainc-inac.gc.ca/
http://alaska.boemre.gov/
www.regjeringen.no/en/dep/oed.html
Legal aspects
Several international legal instruments may be relevant to offshore oil and gasactivities conducted in the Arctic, such as the United Nations Convention on theLaw of the Sea (UN, 1982) and the International Convention for the Prevention ofPollution fromShips –MARPOL 73/78 (IMO, 1973). However, there is currently nocomprehensive, dedicated international legal regime relevant to these activitiesin place for the Arctic.10 The Arctic is governed by a “soft law” regime with the
10. This is in contrast to the Antarctic, where the Antarctic Treaty System provides a legal framework for the governance ofthe region. The Antarctic is preserved for peaceful purposes and scientific endeavours under the treaty system, precluding oiland gas activities in the region.
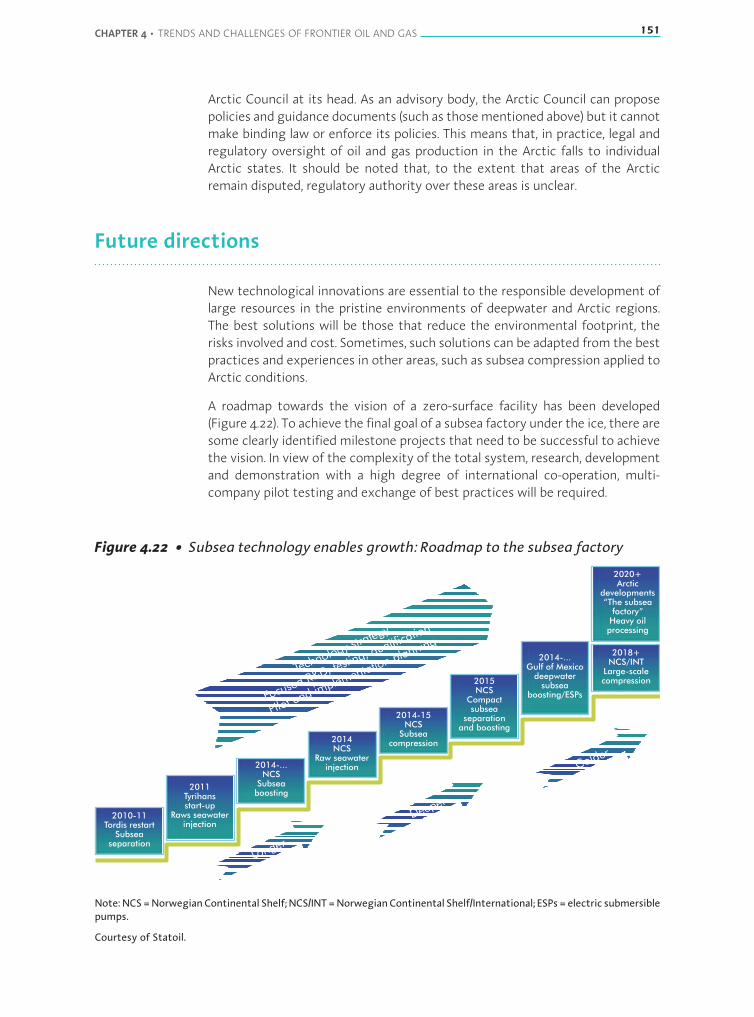
CHAPTER 4 • TRENDS AND CHALLENGES OF FRONTIER OIL AND GAS 151
Arctic Council at its head. As an advisory body, the Arctic Council can proposepolicies and guidance documents (such as thosementioned above) but it cannotmake binding law or enforce its policies. This means that, in practice, legal andregulatory oversight of oil and gas production in the Arctic falls to individualArctic states. It should be noted that, to the extent that areas of the Arcticremain disputed, regulatory authority over these areas is unclear.
Future directions
New technological innovations are essential to the responsible development oflarge resources in the pristine environments of deepwater and Arctic regions.The best solutions will be those that reduce the environmental footprint, therisks involved and cost. Sometimes, such solutions can be adapted from the bestpractices and experiences in other areas, such as subsea compression applied toArctic conditions.
A roadmap towards the vision of a zero-surface facility has been developed(Figure 4.22). To achieve the final goal of a subsea factory under the ice, there aresome clearly identified milestone projects that need to be successful to achievethe vision. In view of the complexity of the total system, research, developmentand demonstration with a high degree of international co-operation, multi-company pilot testing and exchange of best practices will be required.
Figure 4.22 • Subsea technology enables growth: Roadmap to the subsea factory
2020+Arctic
developments“The subsea
factory”Heavy oilprocessing
2010-11Tordis restart
Subseaseparation
2011Tyrihansstart-up
Raws seawaterinjection
2014-...NCS
Subseaboosting
2014NCS
Raw seawaterinjection
2014-15NCS
Subseacompression
2014-...Gulf of Mexico
deepwatersubsea
boosting/ESPs
2018+NCS/INT
Large-scalecompression2015
NCSCompactsubsea
separationand boosting
Technology strategy
Focused R&D, testing, qualific
ation
Pilot and implementation planning
Longer
Deeper
Colder
Note:NCS=NorwegianContinental Shelf; NCS/INT=NorwegianContinental Shelf/International; ESPs = electric submersiblepumps.
Courtesy of Statoil.
152 RESOURCES TO RESERVES
References
Bird, K.J., R.R. Charpentier, D.L. Gautier, D.W. Houseknecht, T.R. Klett, J.K. Pitman,T.E. Moore, C.J. Schenk, M.E. Tennyson and C.J. Wandrey (2008), Circum-ArcticResource Appraisal: Estimates of Undiscovered Oil and Gas North of the ArcticCircle, US Geological Survey, Washington, DC, http://pubs.usgs.gov/fs/2008/3049/.
Bishop, A., C. Bremner, A.L.C. Strobbia, P. Parno and G. Utskot (2010), “PetroleumPotential of the Arctic: Challenges and Solutions”, Oilfield Review, Vol. 22, No. 4,Schlumberger.
BP (2009), BP Announces Giant Oil Discovery In the Gulf of Mexico, BP, London,www.bp.com/genericarticle.do?categoryId=2012968&contentId=7055818.
E&P Forum (Oil Industry International Exploration and Production Forum)/UNEPIE (United Nations Environment Programme Industry and Environment Centre)(1997), Environmental Management in Oil and Gas Exploration and Production,E&P Forum/UNEP, London/Paris.
FMC Technologies) (2008), Subsea Processing, FMC, Houston, www.fmctechnologies.com/~/media/Subsea/Technologies/AdvancedTechnologies/Processing/WHATSubsea%20Processing_LOW%20RES.ashx?force=1&track=1.
Gautier, D.L., K.J. Bird, R.R. Charpentier, A. Grantz, D.W. Houseknecht, T.R. Klett, T.E.Moore, J.K. Pitman,C.J. Schenk, J.H. Schuenemeyer, K. Sørensen,M.E. Tennyson, Z.C.Valin and C.J. Wandrey (2009), “Assessment of Undiscovered Oil and Gas in theArctic”, Science, Vol. 324, No. 5931, American Association for the Advancement ofScience, Washington, DC, pp. 1175-1179.
Henriques, C.C. (2008), “Deepwater Technologies and Challenges in Brazil”,presentation to the Resources to Reserves 2009 Mid-Project Workshop,Cambridge, United Kingdom, 8 April.
IEA (International Energy Agency) (2010), World Energy Outlook 2010, OECD/IEA,Paris.
IMO (International Maritime Organization) (1973), International Conventionfor the Prevention of Pollution from Ships, www.imo.org/about/conventions/listofconventions/pages/international-convention-for-the-prevention-of-pollution-from-ships-(marpol).aspx.
Kjaernes, P.A. (2008), “The Ormen Lange Gas Field, Norway Field Development,from Exploration to Production”, presentation to the Society of PetroleumEngineers (SPE) Moscow Section, Moscow, 11 March, www.spe-moscow.org/upload_data/53_Ormen%20Lange%20dev., SPEMoscow11.03.08.pdf.
Larsen, R., A. Lund, C. Argo andT.Makogon (2007), Cold Flow–ASimpleMultiphaseTransport Solution forHarshEnvironments, 18th InternationalOil Field ChemistrySymposium, 25-28 March, Geilo, Norway.

CHAPTER 4 • TRENDS AND CHALLENGES OF FRONTIER OIL AND GAS 153
PAME(Protectionof theArcticMarineEnvironmentWorkingGroup) (2009),ArcticOffshore Oil and Gas Guidelines, Arctic Council’s PAME, Nordurslod, Iceland,www.pame.is/oilandgasreports2/77-arctic-offshore-oil-and-gas-guidelines-2009.
Rekacewicz, P. (2005), Arctic, Topography and Bathymetry, UNEP/GRID-Arendal,Arendal, Norway, http://maps.grida.no/go/graphic/arctic-topography-and-bathymetry.
Sandrea, I. and R. Sandrea (2007), “Exploration Trends Show Continued Promise inWorld’s Offshore Basins”,Oil &Gas Journal, Vol. 105, No. 9, Oklahoma City, www.ogj.com/articles/print/volume-105/issue-9/exploration-development/global-offshore-oil-1-exploration-trends-show-continued-promise-in-worldrsquos-offshore-basins.html.
Schofield, J. (2007), “Delving Deeper: Unlocking Offshore Energy”, Shell World UKMagazine, 7 September, Shell International, The Hague.
Shell (2009), Perdido Development Project, www.shell.us/aboutshell/projects-locations/perdido.html.
Thomas, C.P., T.C. Doughty, D.D. Faulder, W.E. Harrison, J.S. Irving, H.C. Jamison andG.J. White (1991), Alaska Oil and Gas: Energy Wealth or Vanishing Opportunity?,Office of Fossil Energy, United States Department of Energy, Washington, DC.
UN (United Nations) (1982), United Nations Convention on the Law of the Sea,www.un.org/Depts/los/convention_agreements/convention_overview_convention.htm.
USGS (United States Geological Survey) (2000), World Petroleum Assessment2000, USGS, Washington, DC, http://pubs.usgs.gov/fs/fs-062-03/FS-062-03.pdf.
WWF (WorldWildlife Fund) (2010),Drilling forOil in theArctic: Too Soon, Too Risky,WWF, Washington, DC.


CHAPTER 5 • MAKING LIGHT OF UNCONVENTIONAL OIL 155
Chapter 5 • Making light of unconventional oil
A largeshareof theworld’s remainingoil resources isclassifiedasunconventional.As there is no universally agreed definition of conventional or unconventional oil,several definitions are in current use to differentiate between them (Box 1.1in Chapter 1). Roughly speaking, any source of hydrocarbons that requiresproduction technologies significantlydifferent fromthemainstream incurrentlyexploited reservoirs is described as unconventional. However, this is obviously animprecise and time-dependent definition; advances in technology, changes inthe economics, new environmental requirements or energy policy incentives,can shift the demarcation line between conventional and unconventionalresources. In the long term, unconventional heavy oils may well become thenorm rather than the exception.
Unconventional oil is generally accepted as having a high viscosity or is complexto extract; it usually includes kerogen shale, oil-sands (and natural bitumen), lighttight oil (LTO), and oil derived from coal, gas and biomass. Natural gas liquids1
(NGLs) are occasionally included within this category, though more often asconventional. Although it is often more costly to produce, unconventional oilwill almost certainly make an increasing contribution to future oil production.
Heavy oil and oil-sands
There are three different types of heavy oils: heavy oil that is able to flow in thereservoir; near-solid bitumen in shallowoil-sands that canbemined; andbitumenin deeper reservoirs, beyond 75 metres (m), which needs significant stimulationfor recovery. Oil-sands are unconsolidated sands that contain bitumen.
The world’s extra-heavy oil and oil-sands resources are largely concentratedin Canada (mainly in Alberta) and Venezuela (in the Orinoco belt). Canadahas proven reserves of 175 billion barrels (bb), while Venezuela has provenreserves of 220 bb. The total remaining recoverable resources2 will likely be amultiple of these numbers (IEA, 2012). The exact amount of other remainingrecoverable resources depends on several factors, including the price of crudeoil; the development of new technology; the demand for energy; and solutionsfor reducing the impact on the environment. As these factors are successfullyaddressed, the volume of reserves is likely to increase.
The two main challenges are extracting the viscous oil or bitumen from porousrock, and diluting or “upgrading” the extracted oil so that it can be transportedby pipeline to a refinery. To cope with these challenges, very large volumes ofwater, steam, light hydrocarbons and hydrogen are used.
1. Natural gas liquids or field condensates are components of natural gas that are liquid at the surface in field facilities. Theyinclude propane, butane, pentane, hexane and heptane.2. Definitions of resources and reserves can be found in Chapter 1.
CHAPTER 5 • MAKING LIGHT OF UNCONVENTIONAL OIL 155
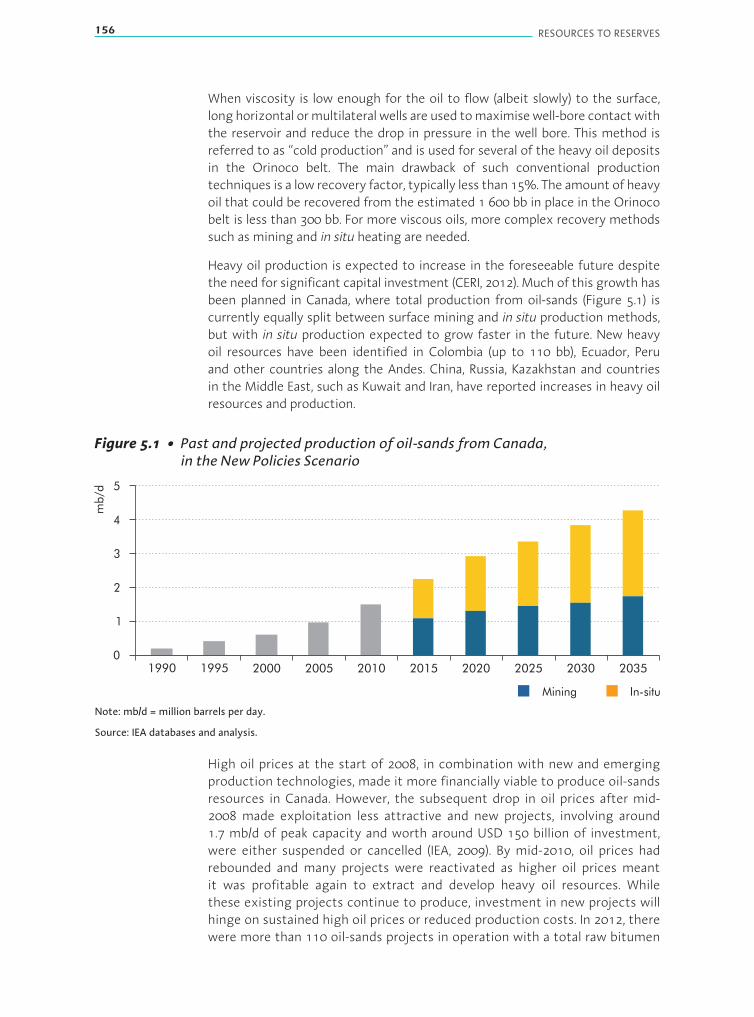
156 RESOURCES TO RESERVES
When viscosity is low enough for the oil to flow (albeit slowly) to the surface,long horizontal ormultilateral wells are used tomaximisewell-bore contactwiththe reservoir and reduce the drop in pressure in the well bore. This method isreferred to as “cold production” and is used for several of the heavy oil depositsin the Orinoco belt. The main drawback of such conventional productiontechniques is a low recovery factor, typically less than 15%. The amount of heavyoil that could be recovered from the estimated 1 600 bb in place in the Orinocobelt is less than 300 bb. For more viscous oils, more complex recovery methodssuch as mining and in situ heating are needed.
Heavy oil production is expected to increase in the foreseeable future despitethe need for significant capital investment (CERI, 2012). Much of this growth hasbeen planned in Canada, where total production from oil-sands (Figure 5.1) iscurrently equally split between surface mining and in situ production methods,but with in situ production expected to grow faster in the future. New heavyoil resources have been identified in Colombia (up to 110 bb), Ecuador, Peruand other countries along the Andes. China, Russia, Kazakhstan and countriesin the Middle East, such as Kuwait and Iran, have reported increases in heavy oilresources and production.
Figure 5.1 • Past and projected production of oil-sands from Canada,in the New Policies Scenario
0
1
2
3
4
5
In-situMining
mb/d
1990 1995 2000 2005 2010 2015 2020 2025 2030 2035
Note: mb/d = million barrels per day.
Source: IEA databases and analysis.
High oil prices at the start of 2008, in combination with new and emergingproduction technologies, made it more financially viable to produce oil-sandsresources in Canada. However, the subsequent drop in oil prices after mid-2008 made exploitation less attractive and new projects, involving around1.7 mb/d of peak capacity and worth around USD 150 billion of investment,were either suspended or cancelled (IEA, 2009). By mid-2010, oil prices hadrebounded and many projects were reactivated as higher oil prices meantit was profitable again to extract and develop heavy oil resources. Whilethese existing projects continue to produce, investment in new projects willhinge on sustained high oil prices or reduced production costs. In 2012, therewere more than 110 oil-sands projects in operation with a total raw bitumen
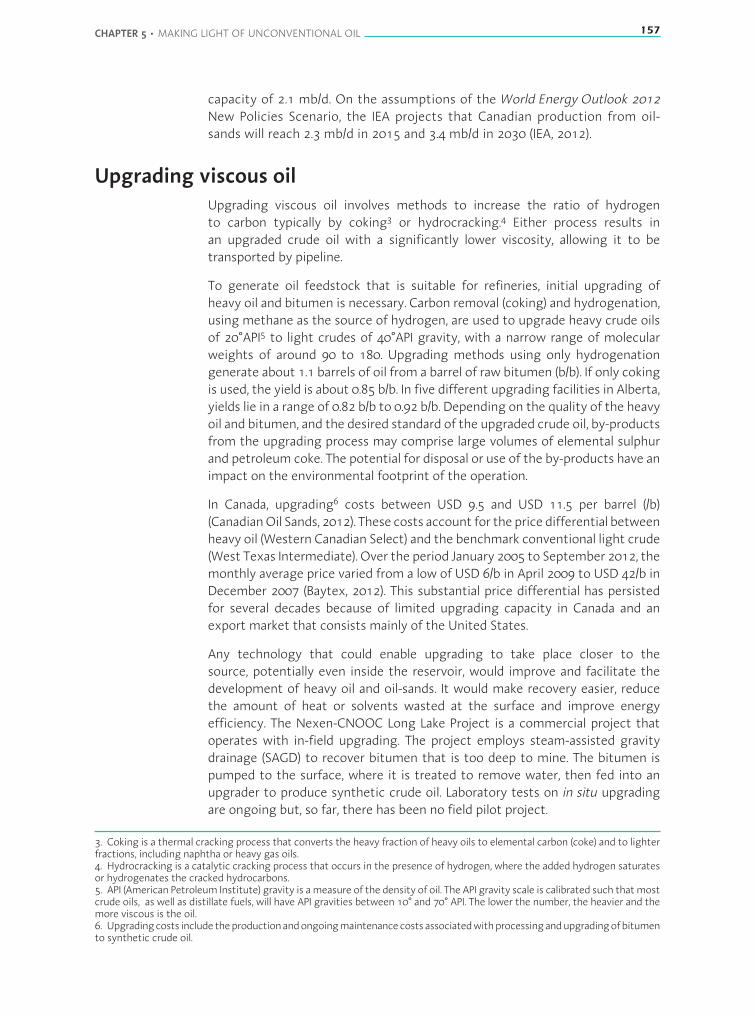
CHAPTER 5 • MAKING LIGHT OF UNCONVENTIONAL OIL 157
capacity of 2.1 mb/d. On the assumptions of the World Energy Outlook 2012New Policies Scenario, the IEA projects that Canadian production from oil-sands will reach 2.3 mb/d in 2015 and 3.4 mb/d in 2030 (IEA, 2012).
Upgrading viscous oilUpgrading viscous oil involves methods to increase the ratio of hydrogento carbon typically by coking3 or hydrocracking.4 Either process results inan upgraded crude oil with a significantly lower viscosity, allowing it to betransported by pipeline.
To generate oil feedstock that is suitable for refineries, initial upgrading ofheavy oil and bitumen is necessary. Carbon removal (coking) and hydrogenation,using methane as the source of hydrogen, are used to upgrade heavy crude oilsof 20°API5 to light crudes of 40°API gravity, with a narrow range of molecularweights of around 90 to 180. Upgrading methods using only hydrogenationgenerate about 1.1 barrels of oil from a barrel of raw bitumen (b/b). If only cokingis used, the yield is about 0.85 b/b. In five different upgrading facilities in Alberta,yields lie in a range of 0.82 b/b to 0.92 b/b. Depending on the quality of the heavyoil and bitumen, and the desired standard of the upgraded crude oil, by-productsfrom the upgrading process may comprise large volumes of elemental sulphurand petroleum coke. The potential for disposal or use of the by-products have animpact on the environmental footprint of the operation.
In Canada, upgrading6 costs between USD 9.5 and USD 11.5 per barrel (/b)(CanadianOil Sands, 2012). These costs account for thepricedifferential betweenheavy oil (Western Canadian Select) and the benchmark conventional light crude(West Texas Intermediate). Over the period January 2005 to September 2012, themonthly average price varied from a low of USD 6/b in April 2009 to USD 42/b inDecember 2007 (Baytex, 2012). This substantial price differential has persistedfor several decades because of limited upgrading capacity in Canada and anexport market that consists mainly of the United States.
Any technology that could enable upgrading to take place closer to thesource, potentially even inside the reservoir, would improve and facilitate thedevelopment of heavy oil and oil-sands. It would make recovery easier, reducethe amount of heat or solvents wasted at the surface and improve energyefficiency. The Nexen-CNOOC Long Lake Project is a commercial project thatoperates with in-field upgrading. The project employs steam-assisted gravitydrainage (SAGD) to recover bitumen that is too deep to mine. The bitumen ispumped to the surface, where it is treated to remove water, then fed into anupgrader to produce synthetic crude oil. Laboratory tests on in situ upgradingare ongoing but, so far, there has been no field pilot project.
3. Coking is a thermal cracking process that converts the heavy fraction of heavy oils to elemental carbon (coke) and to lighterfractions, including naphtha or heavy gas oils.4. Hydrocracking is a catalytic cracking process that occurs in the presence of hydrogen, where the added hydrogen saturatesor hydrogenates the cracked hydrocarbons.5. API (American Petroleum Institute) gravity is ameasure of the density of oil. The API gravity scale is calibrated such thatmostcrude oils, as well as distillate fuels, will have API gravities between 10° and 70° API. The lower the number, the heavier and themore viscous is the oil.6. Upgradingcosts includetheproductionandongoingmaintenancecostsassociatedwithprocessingandupgradingofbitumento synthetic crude oil.
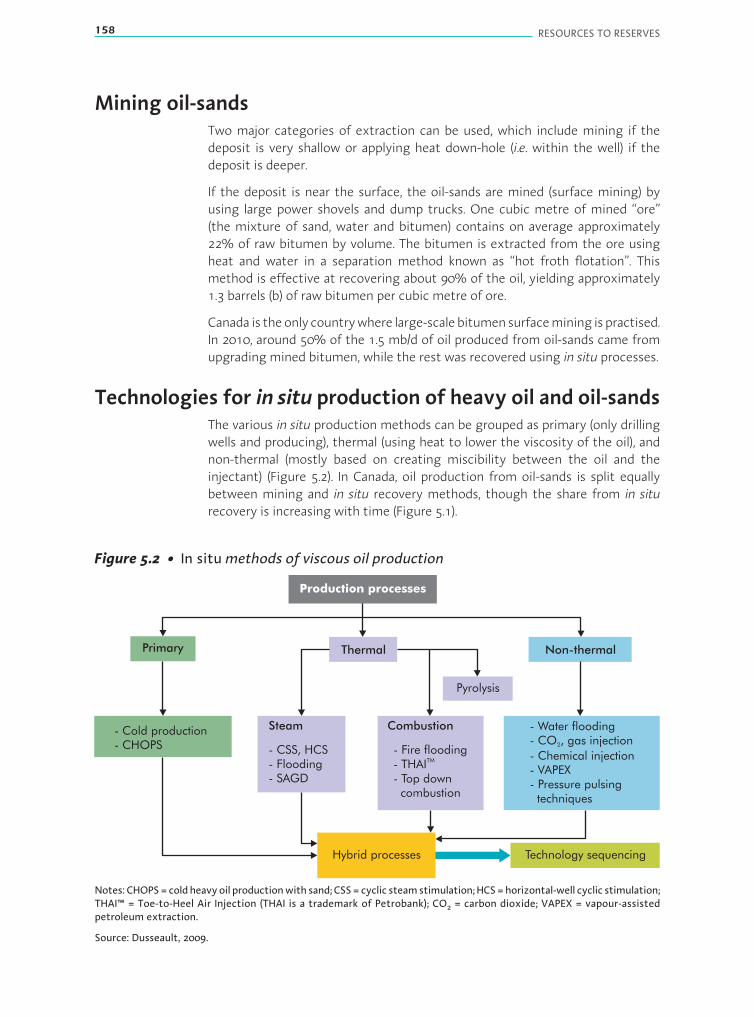
158 RESOURCES TO RESERVES
Mining oil-sandsTwo major categories of extraction can be used, which include mining if thedeposit is very shallow or applying heat down-hole (i.e. within the well) if thedeposit is deeper.
If the deposit is near the surface, the oil-sands are mined (surface mining) byusing large power shovels and dump trucks. One cubic metre of mined “ore”(the mixture of sand, water and bitumen) contains on average approximately22% of raw bitumen by volume. The bitumen is extracted from the ore usingheat and water in a separation method known as “hot froth flotation”. Thismethod is effective at recovering about 90% of the oil, yielding approximately1.3 barrels (b) of raw bitumen per cubic metre of ore.
Canada is theonlycountrywhere large-scalebitumensurfacemining ispractised.In 2010, around 50% of the 1.5 mb/d of oil produced from oil-sands came fromupgrading mined bitumen, while the rest was recovered using in situ processes.
Technologies for in situ production of heavy oil and oil-sandsThe various in situ production methods can be grouped as primary (only drillingwells and producing), thermal (using heat to lower the viscosity of the oil), andnon-thermal (mostly based on creating miscibility between the oil and theinjectant) (Figure 5.2). In Canada, oil production from oil-sands is split equallybetween mining and in situ recovery methods, though the share from in siturecovery is increasing with time (Figure 5.1).
Figure 5.2 • In situmethods of viscous oil production
Hybrid processes Technology sequencing
- Water flooding- CO , gas injection
- Chemical injection- VAPEX- Pressure pulsingtechniques
2- Fire flooding- THAI- Top downcombustion
TM
- CSS, HCS- Flooding- SAGD
- Cold production- CHOPS
CombustionSteam
Pyrolysis
Non-thermalThermalPrimary
Production processes
Notes: CHOPS=cold heavyoil productionwith sand; CSS= cyclic steamstimulation; HCS=horizontal-well cyclic stimulation;THAI™ = Toe-to-Heel Air Injection (THAI is a trademark of Petrobank); CO2 = carbon dioxide; VAPEX = vapour-assistedpetroleum extraction.
Source: Dusseault, 2009.

CHAPTER 5 • MAKING LIGHT OF UNCONVENTIONAL OIL 159
Box 5.1 • Technologies for in situ production of oil-sands
Primary
■ Cold production is a process in which bitumen is produced by long, often multi-branched,horizontal wells. Recovery factors are low, less than 15%.
■ CHOPS allows sand to be produced along with the oil. It simplifies downhole well designsand increases the productivity of a well. It has been highly successful in Canada since 1985,especially for extracting oil from thin zones.
Thermal
■ In CSS a small amount of steam is injected into the producer well, after which it is closedin for some time before reopening it for the production of heated oil. Several Canadianoperators have applied it to horizontal wells, a process known as HCS.
■ SAGD marks an important advance in heavy oil production. Oil flows along the walls ofa steam chamber down to a producing well (see Box 5.2).
■ THAI™ is a technique based on either injecting air into a vertical injection well locatedwithin close proximity to the toe of a horizontal producing well or injecting it directlyfrom the toe. The injected air promotes partial combustion of the bitumen. Though stillvery much experimental, the technique has been undergoing preliminary field tests.Commercial projects based on THAI™ are perhaps five to eight years away, if tests provesuccessful.
Non-thermal
■ Gas injection is being developed as a post-steam recoverymethod in Canada, helping torecover more of the heated oil while reducing the need for steam.
■ Pressure pulsing techniques are based on the discovery that large-amplitude, low-frequency pulsing wave energy enhances flow rates in porous media (Veil and Quinn,2008). They involve applying sharp pressure impulses to the liquid at the bottom of awell. The impulses generate displacement waves that facilitate oil production. Thoughthe technology has not gained wide acceptance, it is starting to be used in cold heavyoil production.
■ VAPEX is similar to SAGD, but injects a diluent rather than steam to reduce viscosity. Asdilution and gravity drainage using solvents yield slow production rates, this techniquewill likely be limited to heavy oils of lower viscosity or as an aid to SAGD methods.
The twomost widely used in situ productionmethods for heavy oil and bitumenrecovery are CSS and SAGD.
In CSS, the heavy oil is heated by injecting steam into the well for a period ofseveral weeks, before production of the heated oil. This process is repeatedseveral times until it becomes too difficult to reach the oil far from the well.The overall field recovery rate for such a process is low at between 20% and35%. However, CSS is an effective stimulation technique for producers andis applied in combination with other methods that can drive oil towards thewell.

160 RESOURCES TO RESERVES
The SAGDmethod is the most important technological development in viscousoil extraction since the advent of CSS (Box 5.2). SAGD concepts evolved in 1970to 1985. Theoretical recovery factors of 50% to 70% are predicted for SAGD inthick and homogeneous reservoirs, using a similar amount of steam per barrelproduced as is the case for CSS.
Box 5.2 • Steam-assisted gravity drainage
In highly viscous oils, i.e. those with viscosities higher than 100 000 centipoise, SAGD is basedon parallel horizontal well pairs, 800metres (m) to 1 000m-long, located at the base of the oilzone (Figure 5.3); well pairs are spaced laterally at about four times the zone thickness. Steamis introduced through the upper wells, where it rises because of its low density, subsequentlycondenses and gives up latent and sensible heat to the viscous oil. The hot oil and condensedwater flow downward to the production well below the injector.
Figure 5.3 • The SAGD process
Steam chamber
Steam injector
SAGD facility
Oil producer
Steam flow
Oil flow
SAGD ProjectEASTAEG
Slots
Oil-sandsformation
Courtesy of Encana Corporation.
The advantages of SAGD are the improved recovery factors achieved (by over 70%) andthe somewhat lower steam-to-oil ratios compared to other steam methods. High recoveryfactors can be attributed to the stability of a gravity-dominated drainage regime basedon gas-liquid phase segregation. Wells are operated at the same pressure to avoid short-circuiting or generation of pressure-induced flow instabilities. The injection rate is controlledso that pressure in the steam chamber remains constant over time.

CHAPTER 5 • MAKING LIGHT OF UNCONVENTIONAL OIL 161
An ideal SAGD reservoir will have more than 20 m of oil-saturated sand with good verticalpermeability (>1 000 millidarcy) and no basal water. Shales of 2 m to 3 m thick can bebreached, though they slow down the process. However, fine-grained siltstones without clayare more serious flow barriers because of capillary blockage of gravity flow (such riverbedsseverely hampered SAGD in the Shell Peace River Project). If operated carefully, SAGD can becarried out in the presence of active basal water or a gas cap, but not both.
Another reasonwhy SAGD is effective is the extensive, thermally induced shearing that breaksdown thin flow barriers and leads to dilation, improving reservoir porosity and permeability.The 30 centimetres (cm) to 50 cm of surface uplift above SAGD operations is proof of benefitachieved from the shear-dilation effect.
Various improvements to basic SAGD concepts are being pursued, for example:
■ where theviscosityofoilmaybeslightly lower, different injectionwell configurations (verticalor offset horizontal wells) may be used;
■ before SAGD, several cyclesofhigh-pressure steam injectionmayhelpbreakdownbarriers tovertical gravitational flow, which would otherwise significantly reduce production;
■ viscosity may be reduced further by injecting condensing solvents, possibly alternating withsteam injection, to raise oil production rates;
■ post-SAGD, injecting inert gas can potentially distribute the heat already in the reservoirmore effectively;
■ improved monitoring of pressures, deformations and temperatures can result in betterprocess control and enhanced thermal efficiency;
■ as generating steam is a costly process, different heat sources for steam are being pursued.
In the 1980s, the government of Alberta was the first to field test SAGD and wasfollowed by several private companies in the 1990s. It was not until 2001 thatit was used by the Encana Corporation in the first SAGD commercial project toexceed 10 000 b/d – the Foster Creek project in eastern Alberta, north of ColdLake. In March 2012, there were 18 commercial projects in various deposits inAlberta (Government of Alberta, 2012) and a smaller number in Saskatchewan,while there are further SAGDprojects in China, Venezuela and Russia. Total SAGDproduction in Canada passed 1.05 mb/d in 2011 with projections of 1.9 mb/d by2016 (Rystad, 2012).
Non-thermalmethods are currently being pursued, especially in thinner depositsin which there can be high energy costs and a high fraction of heat lost to thesurrounding rocks. A commonly applied non-thermal technique is polymerinjection. In this method, water is made more viscous by adding polymersthat enable the heavy oil to be displaced more efficiently. The disadvantageof polymer injection is the low injectivity7 and the consequent increase in thenumber of wells required.
7. Injectivity is the volumeper day that can be injected as a function of the injection pressure. Aswaterwith dissolved polymersis more viscous than steam, it is more difficult to inject into the reservoir. Furthermore, this difficulty is compounded wheninjecting into very heavy oil, where the oil itself inhibits the injectivity.
162 RESOURCES TO RESERVES
Currently, the industry is investigating the application of “hybrid processes”,where more than one of these techniques can be applied in sequence to furtherimprove recovery and production efficiency.
Environmental issues associated with heavy oiland oil-sands production
Bothmining and in situ viscous oil productiongenerally require greater attentionto environmental management than conventional production. Large volumes ofgaseous, aqueous and solid wastes are generated, including emulsions and oilymixtures, such as tank bottoms.8 In addition, large volumes of coke and sulphurmust be stockpiled when demand for these by-products is low.
Impact on the landscape
In situ viscous oil production and, in particular, mining change the landscape andaffect the existing forest ecosystem (Figure 5.4). Remediation of the land maybe necessary. For example, the government of Alberta requires companies torestore the land.
Figure 5.4 • Oil-sand mining region north of Fort McMurray, Alberta
High-qualitylower oil-sands
Underlyinglimestone
Low-quality upperoil-sands
Note: figure shows 55 m to 65 m high oil-sands slope in a mining region north of Fort McMurray,Alberta, Canada.
Source: Dusseault, 2009.
Water usage
Large volumes of water are required to extract bitumen from oil-sands. Forexample, between 3 and 4 b of water are required to produce 1 b of syntheticcrude oil (NRCAN, 2011). Although 95% of water used to generate steam is
8. Tankbottomsare residuesthataccumulate inthebottomofstoragetanks. Theyusuallycomprisesediment,dirt, oil emulsifiedwithwaterandfreewater, andmayalsobereferredtoastanksettlingsor tanksludge.Tankbottomsaregenerallyeitherdisposedof or treated by chemicals to recover additional hydrocarbons.
CHAPTER 5 • MAKING LIGHT OF UNCONVENTIONAL OIL 163
recycled, that still leaves0.2barrels ofwater consumed for eachbarrel of bitumenproduced. The availability of water, for example from Canada’s Athabasca River,presents a potential bottleneck for some projects under development in thatregion, especially during winter. To reduce the use of potable water for some insitu operations, some producers are using brackish water (with salinity betweenthat of fresh water and seawater) instead.
Bitumen slurry
Water-basedextractiongenerates largevolumesofbitumenslurries (wastewateror fluid tailings) and a wet, oily, clay-like sludge. In 2009, the Energy ResourcesConservation Board of Alberta approved a directive to ensure that operatorsreduce fluid tailings and dispose of them responsibly in dedicated disposalareas or face penalties for non-compliance (ERCB, 2009). Beginning in July 2010,the directive was phased into practice, with a 20% reduction in fluid tailingsrequired by July 2011, 30% by July 2012 and rising to a 50% reduction by June2013, with further reductions to be imposed annually thereafter. The directiveaims to stop the accumulation of tailings from oil-sands in Alberta.
Sulphur
Sulphur is a by-product of oil-sands production; it can either be exported foruse or consigned to a long-term storage/disposal strategy that is socially andenvironmentally acceptable. In the last 20 years, newwastedisposal technologieshave emerged. The most common disposal technique is deep slurry injection, inwhich solid wastes, such as sulphur, are mixed with liquid and pumped intoa sealed reservoir. This method of disposal is now used in several locations inthe world. For example, since 2002 a large injection facility in Duri, Indonesiahas disposed of over 2 million cubic metres (Mm3) of waste products, includingproduced water, drill cuttings, waste emulsions, sulphur and other solids. Thesematerials are injected into a shale-sealed sandstone reservoir at 400 m depth.
Greenhouse gases (GHGs)
Given growing concerns about climate change, emissions of atmosphericpollutants and GHGs associated with the exploitation of oil-sands must beaddressed. Emissions include substantial volumes of CO2, small amounts ofsulphurous gases and fine particulatematter. During themining, production andupgrading processes, between 95 kilograms (kg) and 125 kg CO2/b of upgradedcrude oil are generated. If SAGD is applied, this rises to between 125 kg and150 kg CO2/b. For cyclic steam injection technologies, CO2 emissions will behigher than for SAGDby about 40 kg to 60 kg of CO2/b asmore steam is required.Transportation and additional refining add a further 80 kg to 90 kg of CO2/b. Intotal, for all processes, CO2 emissions can vary from 175 kg to 300 kg CO2/b.
Methods of mitigating emissions from fossil fuels include carbon capture andstorage (CCS), in which CO2 is captured at source and injected into suitableaquifers or oil reservoirs for storage (see also Chapter 2 andChapter 9). In Alberta,all new fossil fuel plants must be designed and constructed for possible futuremandated CCS.

164 RESOURCES TO RESERVES
Steam and hydrogen sources
The oil-sands industry uses about 4% of the natural gas produced from theWestern Canada Sedimentary Basin. However, though the cost of the natural gasused to generate steam, electricity and hydrogen for the production of heavyoil and oil-sands is high, there is a net benefit. According to Canada’s NationalEnergyBoard, around34m3ofnatural gas are required toproduce1bofbitumen;and 1 b of bitumen has an energy-equivalent of 170m3 natural gas. Nonetheless,as natural gas reserves are diminishing, operators need to look more closely atother sources for energy requirements. One project that has sought to put sucha process into practice is the Nexen-CNOOC Long Lake Project.
The Nexen-CNOOC Long Lake Project began production in the Athabasca oil-sands region of Alberta in 2009. All steam and electricity required to operatethe project is generated from combustion of the asphaltene fraction of theSAGD-produced bitumen. Though this reduced the need for natural gas, it hasled to higher net CO2 emissions. To address this, the possibility of retrofittingCCS in the future has been considered, though it would involve a number ofmodifications to the process.
Potential for the clean combustion of coal, coke or residuals (asphaltenes) usingpure oxygen to generate heat (steam), electricity and hydrogen also heraldspotential for reducing consumption of natural gas. This process would generatenearly pure CO2, which could be either transported for direct geological storageor used for enhanced recovery of conventional oil.
The possibility of reduced access to sufficient levels of natural gas in Albertain the future, coupled with increasing environmental pressures to reduceCO2 emissions, present strong incentives to develop and implement othermeans of fuelling mining, production and upgrading processes. Reducing theenvironmental impact of heavy oil development is important, but the means toachieve it still remain to be implemented at full scale.
The future of heavy oil and oil-sands
Non-thermal production methods such as cold production and CHOPS havelower capital and operating costs than mining and thermal steam methods.They are not suitable for high-viscosity reservoirs and suffer from otherdeficiencies, such as sand management requirements, low recovery factors andlow production rates. However, their lower costs make them attractive and theycould still be deployed as the first technology in a sequence of primary, non-thermal and thermal methods designed to increase recovery factors.
In Canada, for a mining project that includes upgrading, an investment of aboutUSD 73 000 is needed to generate 1 b of oil per day. The capital investment issomewhat less for SAGD projects, but the need for heat means that operatingcosts, including upgrading, would be similar to or greater than for mining. The
CHAPTER 5 • MAKING LIGHT OF UNCONVENTIONAL OIL 165
costs for SAGD and upgrading in Venezuela would be lower than in Canadabecause of the milder climate and lower transportation costs.
Depending on how oil demand and prices develop, global heavy oil and bitumenproduction could increase from 2.2 mb/d in 2010 to 6.7 mb/d in 2035 (IEA, 2012).Canadian oil-sands alone could increase rapidly from 1.6 mb/d to 4.3 mb/d overthe same period. The other large contributor is heavy oil production from theOrinoco belt (Venezuela) that is expected to reach 2.1 mb/d in 2035, from0.6 mb/d today. In Canada, in situ production will overtake mining productionover the next decadewith SAGD production expected to increasemarkedly overthe same period.
Major issues in viscous oil development include CO2 emissions; wastemanagement; energy sources for steam; water use; hydrogen sources forhydrogenation; and transportation issues, including the transport of diluentand new pipeline routes. Recent technical advances suggest that significantimprovements could take place in each of these areas, reducing the barriers tolarge-scale heavy oil productionwhile alsomitigating the environmental impact.
Kerogen oil
Kerogen shale, often referred to as oil shale, is found at shallow depths, fromsurface outcrops to 1 000 m deep. It is a very low-permeability sedimentaryrock that contains a large proportion of kerogen, a mixture of solid organiccompounds. In kerogen shale reservoirs, conversion of the kerogen into liquidoil (or kerogen oil) has not taken place because the high temperatures requiredhave not been experienced.
Historically, kerogen shale has been mined not only for conversion into oil, butalso for power generation, cement production and for use in the chemicalsindustry. Mining of kerogen shale dates back to the 1830s and peaked in 1980at 46 million tonnes per year (Mt/yr), falling to 16 Mt/yr in 2004. Around 80% ofcommercial kerogen shale is mined in Estonia, where it is used predominantlyfor power generation.
By heating kerogen at temperatures up to 500 degrees Celsius for an extendedperiod of time, it is possible to produce kerogen oil and other hydrocarbons,including methane. Currently, global production of kerogen oil lies at around20 000 barrels per day (b/d). While much exploratory work remains to be done,resources in place are estimated at around 4.8 trillion barrels of oil (WEC, 2010)and remaining recoverable resources at around 1.1 trillion barrels (IEA, 2012). TheUnited States has the world’s largest share of resources in place, withmore than77%, followed by China and Russia. Kerogen shale is currently being exploited inBrazil, China, Estonia, Germany, Israel and Jordan.
Kerogen shale that outcrops the surface can be mined; the mined rock isheated in a process called “retorting”, which pyrolyses (or thermochemicallydecomposes) the kerogen into oil. Deeper deposits require the use of techniquesto enhance productivity from the formation (such as hydraulic fracturing) and
166 RESOURCES TO RESERVES
an in situ mobility enhancement technology. The processes required are veryenergy-intensive. Retorting alone requires almost 30% of the energy value of theoil produced. The process also generates CO2 emissions, ranging from 180 kg to250 kgCO2-equivalent per barrel of oil produced. In the absence of a carbon pricingregime, production costs have been estimated to make commercial exploitation(in theUnited States) possible at an oil price of aroundUSD60per barrel (IEA, 2010).
The main kerogen shale reserves in the United States can be found in the GreenRiver Formation. Early experiments in the 1980swere halted because of the costsinvolved and poor operational performance. Shell has assessed the technical andfinancial viability of an in situ conversion process, using down-hole heaters, attheMahogany Ridge project. The oil produced has an API gravity of between 30°and 40°, which is significantly less viscous than oil produced by surface retort.The process has the advantage of reducing the environmental impact on thesurrounding land compared to mining, assuming that wells can be drilled aslittle as 12 m apart. However, the process requires the use of both water and asufficient amount of energy to heat and cool the relevant areas. A 100 000 b/dunit would require 1.2 gigawatts (GW) of power. Shell expects gas output fromthe produced fluid to yield most of this energy. Preliminary energy balancesindicate, on a lifecycle assessment basis, a ratio of between three and four to oneof energy generated to energy used. Further technical developments to protectgroundwater are required before moving to a larger-scale demonstrationphase. Shell is not expected to decide on whether or not to commercialise itstechnology for another five years at least. Other large companies involved todayin kerogen shale projects in the United States are Exxon, Petrobras and Total.
Light tight oil
Shalesareoften foundtobesource rocks foroil andgas fields.As shalesareburieddeeper over geological timescales, the organic matter they contain matures,under high pressure and high temperatures, into oil or gas. Subsequently, afraction of the hydrocarbons formed escapes from the shale and migratesupwards where it is trapped in oil and gas fields. However, a potentially largefraction of the oil or gas may have had no chance to escape from the shale ormay have migrated into a neighbouring low-permeability rock formation. Shale,therefore, or neighbouring low-permeability formations, may still contain largevolumes of hydrocarbons. These are known as LTO in the case of oil, or shale gasin the case of gas. As fluids cannot move easily through low-permeability rockformations, the production of commercial volumes of hydrocarbons requiresthe use of advanced technologies. Innovations in well technology have meantthat shale gas development has increased significantly over the last ten years.Application of these developments to a new resource category has now led tothe unlocking of previously uneconomic resources of LTO.
Geologically, LTO is an analogue of shale gas. This is why LTO is often referredto as shale oil. Unfortunately, the term shale oil is also often used to refer to oilproduced by industrial heat treatment of shale, which is rich in certain types ofkerogen. To avoid confusion, the latter is referred to as kerogen oil.

CHAPTER 5 • MAKING LIGHT OF UNCONVENTIONAL OIL 167
Extraction of LTOOil has a much higher viscosity and a much lower compressibility than gas,whichmakes extraction of LTO from low-permeability rock formations a greaterchallenge. Conventional techniques, involving the drilling of vertical wells,produces insufficient flows andwould not be economic. Extracting LTO requiresdrilling more wells, making extensive use of horizontal drilling and multi-stagehydraulic fracturing to improve the flowof oil from the reservoir to thewell bore(Figure 5.5). These are the same principal technologies that have enabled large-scale, unconventional tight gas and shale gas production (see Chapter 6).
Figure 5.5 • Horizontal drilling and hydraulic fracturing
Hydraulicfracturing
Cemented casing
Aquifers
Horizontal drilling
Injection of finesand to keep thefractures open
Note: unless otherwise indicated, all material in figures and tables derives from IEA data and analysis.
While horizontal drilling increases reservoir contact, hydraulic fracturing createsfractures in the rock that further maximises reservoir contact, particularlywith naturally occurring pre-existing fractures in the shale, and allows the oilto flow more easily into the well bores. Fracturing is achieved by pumpinglarge quantities of water-based fluids under high pressure, mixed with specificchemical additives and proppants. Proppants are small solid particles, usuallyfine sand or ceramic beads, injected to prevent the cracks from closing afterthe pressure is released. Together with advanced seismic techniques to detectsweet spots and to indicate the best drilling locations, horizontal drilling andhydraulic fracturing have enhanced yields of LTO to commercially attractivelevels. Oil production in the United States has been on a steep upward trendsince 2005, in large part thanks to the deployment of these technologies.
In targeting more difficult resources, such as LTO, higher investment andtechnology development is necessary. LTO requires manymore wells per unit ofproductionvolumethanconventional resourcesasoutputperwell is significantlylower. Like shale gas, production from LTO wells declines rapidly. However,
168 RESOURCES TO RESERVES
initial production rates vary widely, depending on geology, well lengths andthe number of hydraulic fracturing stages carried out. Averaged over the firstmonth, Bakken wells (see next subsection) produce between 300 b/d and morethan 1 000 b/d, butwithin five years the greatmajority ofwells produce less than50 b/d. Over their lifetime they typically recover between 300 thousand barrels(kb) and 700 kb. Given the steep declines in production, newwells are constantlyneeded to maintain output; hence, constant drilling activity is essential toproduction growth. During 2010, 700 new wells were drilled in Bakken with arig fleet averaging 126 units while, during 2012, twice the number of wells weredrilled with just 60%more rigs (NDSG, 2010 and 2012).
Trends are towards drilling more wells and to drilling greater lengths (or“footage”) per rig per year. Better design of drilling rigs contributes by reducingoperational cycle times and costs. For example, rigsmust be capable of operatingmore effectively in winter.
Better fracturing and completion techniques will allow operators to drill longerhorizontally and reduce the number of wells required. However, operation of thedrilling rig is no guarantee of a successful outcome. Reducing the number ofunderperforming wells drilled is important. Exploration using knowledge gainedfrom advanced seismic and other smart field techniques (Chapter 2) adds morecertainty to drilling in tight formations. Such techniques also aid the detectionof sweet spots, where permeability and porosity are significantly higher than theaverage values in the reservoir (Chapter 6). Drilling into such areas can greatlyenhance production.
As primary recovery of LTO is often low, producing only 5% to 10% of originaloil in place, the potential to apply secondary recovery is being investigated andtertiary recovery is gaining interest.
LTO productionInterest in LTO startedwith the Bakken shale, a large formation underlyingNorthDakota and extending into Saskatchewan, Manitoba and Montana. Thoughproduction from the Bakken formation began on a small scale in the early 1950s;it increased significantly in the early 2000s, after operators began drilling andfracturing horizontal wells. After 2005, production increased more rapidly,reaching a high of 669 thousand barrels per day (kb/d) in November 2012 (NDSG,2012).
The combination of success in the Bakken shale and the widening of thedifferential between oil and gas prices prompted interest in developing LTOthroughout North America (IEA, 2011). Shale gas producers trying to improveinvestment returnsbegantargetingplayswithahigher liquidcontent, increasingtheir production of NGLs, while some progressed further to oil-containing low-permeability formations, like the Bakken. Drilling activity is also shifting fromgas to oil in the Eagle Ford play in Texas, in the Niobrara play in Colorado, Utahand Wyoming, in various plays in California (including the Monterey play) and inthe Cardium and Exshaw plays in Canada. Other recently identified plays are alsolikely to be developed.

CHAPTER 5 • MAKING LIGHT OF UNCONVENTIONAL OIL 169
High oil prices have clearly been a key driver of this growth, given that thebreak-even oil price for a typical LTO development is around USD 60/b (includingroyalty payments). The consequent surge in production in the United States hasoutpaced infrastructure developments, with oil pipelines becoming congested.Estimated production could exceed 3.0 mb/d by 2020 (IEA, 2012), contributingto a significant reduction in US imports. Resources outside North America havenot been quantified but, as with shale gas, it is likely that LTO is present inmanylocations worldwide. Examples include the Paris basin in France, which couldhold several billion barrels of recoverable resources, and the Neuquen basin inArgentina, where testing is currently under way.
The Bakken formation provides the most prominent example of the rapidgrowth in LTO production. In 2008, the US Geological Survey estimated theamount of technically recoverable LTO from the Bakken formation by usingtechnology readily available at the end of 2007 at around 3.5 bb (USGS, 2008a).This is 25 times more than an assessment made in 1995 (USGS, 2008b), whilerecent unconfirmed industry estimates place the figure as high as 18 bb, andthe North Dakota Department of Mineral Resources evaluates it at 10 bb inNorth Dakota alone. This considerable increase is due largely to technologicaldevelopments and successes achieved with actual demonstration in the field. ByNovember 2012, LTO production from Bakken had exceeded 660 kb/d. With therecognised potential for LTO to improve energy security and reduce oil imports,many such opportunities in theUnited States are being pursued. LTOproductionin the United States increased from 11 000 b/d in 2005 to 840 000 b/d in 2011(IEA, 2012).
The size of LTO resources and the quantities that can be technically andeconomically extracted are still poorly known. Unconventional resourceestimates are less reliable than those of conventional resources. They havegenerally been less thoroughly explored and studied, and there is less experienceof exploiting them. Inmanycases, the technical, environmental, political and costchallenges that will have to be overcome for them to be produced commerciallyshould not be underestimated. Appraisal and production is most advanced inNorth America, which largely explains why that region is currently assessed tohold the largest estimated unconventional resources. Other regions that havereceived less attention because of their large conventional resources, includingthe Middle East and Africa, may also hold large volumes of unconventional oil.
Environmental impactAs is the case for shale gas, environmental concerns or regulatory constraintscould hinder developments, but the potential economic and energy securitybenefits could result in significantly higher growth of LTO production.
Rapid expansion of LTO production is projected to continue. However, theimplications for water resources, land use and disruption to local communitiesmust be addressed. Estimates of water consumption during hydraulic fracturingvary from0.2 b to 4 b ofwater for each barrel of oil recovered (with consumptionat Bakken towards the low side of these estimates). Up to 20 000 m3 water per
170 RESOURCES TO RESERVES
well may be used for drilling and fracturing. Once the fracturing process iscomplete, 30% to 70% of the water injected flows out of the well, dependingon the characteristics of the reservoirs. The return water must be treatedfor disposal or reuse. Such a level of water consumption can put a heavystrain on local water sources and, if projections of LTO production are to bemet, technology development to reduce consumption will be necessary. Theproportion of water reused must be increased. Techniques that require less orno water must be developed.
Other environmental concerns include potential contamination of watercourses. Apart from water, which makes up 99.5% of the volume, the fluidsused in hydraulic fracturing contain chemical additives to improve the fluid’sperformance; the additives can include acid, friction reducer, surfactant, gellingagent and scale inhibitor (API, 2010). The composition of the fracturing fluid istailored to differing geologies and reservoir characteristics in order to addressparticular challenges, including scale build-up, bacteria growth and proppanttransport. The application of modern, best-practice techniques for drilling andhydraulic fracturing should minimise contamination of water courses, and it isessential that these are employed.
An important challenge for the industry is the treatment, recycling, reuse andultimate disposal of the flowback and produced water, which often containsresidual fracturing fluid and may also contain substances found in the reservoirformations, such as trace elements of heavy metals and naturally occurringradioactive elements.
Impacts on land and air must also be minimised. Production wells require roadsto connect drilling pads; pipelines or trucks to transport oil or waste water;storage sites; and water treatment facilities. With many hundreds of truck tripsper well site, accidents due to the intensive truck traffic must be consideredand, indeed, can be amajor source of surface spills of chemicals. Pipeline use canminimise surface disturbance and reduce these risks. Infrastructure needs addto the surface impact andmust also be evaluated beforehand from a large-scale,regionally cumulative perspective. Local air emissions also arise from on-sitepower sources.
References
API (American Petroleum Institute) (2010), Water Management Associated withHydraulic Fracturing, API Guidance Document Hf2, API, Washington, DC.
Baytex (2012), BenchmarkHeavyOil Prices, HistoricalWCS Pricing, Baytex EnergyCorporation, website accessed November 2012, www.baytex.ab.ca/operations/marketing/benchmark-heavy-oil-prices.cfm.
CanadianOil Sands (2012),ThirdQuarter2012Report, CanadianOil Sands, Calgary.
CHAPTER 5 • MAKING LIGHT OF UNCONVENTIONAL OIL 171
CERI (Canadian Energy Research Institute) (2012), Canadian Oil Sands SupplyCosts and Development Projects (2011-2045), Study No. 128, CERI, Calgary.
Dusseault, M.B. (2009), personal communication.
ERCB (Alberta Energy Resources Conservation Board) (2009), Directive 074:Tailings Performance Criteria and Requirements for Oil Sands Mining Schemes,ERCB, Calgary.
Government of Alberta (2012), Alberta Oil Sands Industry: Quarterly Update,Government of Alberta, Calgary.
IEA (International Energy Agency) (2007), World Energy Outlook 2007, OECD/IEA,Paris.
IEA (2009),World Energy Outlook 2009, OECD/IEA, Paris.
IEA (2010),World Energy Outlook 2010, OECD/IEA, Paris.
IEA (2011),Medium-TermOil & GasMarkets Report 2011, OECD/IEA, Paris.
IEA (2012),World Energy Outlook 2012, OECD/IEA, Paris.
NDSG (North Dakota State Government) (2010), 2010Monthly Statistical Update,Industrial Commission of North Dakota Oil & Gas Division, Bismarck, NorthDakota, www.dmr.nd.gov/oilgas/stats/2010monthlystats.pdf.
NDSG (2012), 2012 Monthly Statistical Update, Industrial Commission of NorthDakota Oil & Gas Division, Bismarck, North Dakota, www.dmr.nd.gov/oilgas/stats/2012monthlystats.pdf.
NRCAN (2011),Oil Sands–WaterManagement, Report issued byNatural ResourcesCanada, August, www.nrcan.gc.ca/energy/sites/www.nrcan.gc.ca.energy/files/files/OilSands-WaterManagement_e.pdf.
Rystad (2012), Rystad Energy, Global Databases, Oslo, www.rystadenergy.com/databases.
USGS (United States Geological Survey) (2008a), Assessment of UndiscoveredOil Resources in the Devonian-Mississippian Bakken Formation, Williston BasinProvince, Montana andNorth Dakota, 2008, USGS, Washington, DC.
USGS (2008b), 3 to 4.3 Billion Barrels of Technically Recoverable Oil Assessed inNorth Dakota and Montana’s Bakken Formation – 25 Times More than 1995Estimate, USGS, Washington, DC, www.usgs.gov/newsroom/article.asp?ID=1911.
Veil, J. and J. Quinn (2008), Water Issues Associated With Heavy Oil Production,Argonne National Laboratory for the US Department of Energy/National EnergyTechnology Laboratory, Lemont, Illinois.
WEC (World Energy Council) (2010), Survey of Energy Resources 2010, WEC,London.

CHAPTER 6 • THE UNCONVENTIONAL GAS REVOLUTION 173
Chapter 6 • The unconventional gas revolution
Unconventional gas is generally defined as natural gas that cannot be producedeconomically by using conventional technology.
The three common types of unconventional gas are tight gas, shale gas andcoal-bed methane (CBM), though methane hydrates are often included. Tightgas refers to natural gas trapped in sandstone or limestone formations thatexhibit very low permeability and low porosity; such formations may alsocontain condensate. Shale gas refers to natural gas trapped in organic-rich rocks,dominated by shale. CBM refers to natural gas adsorbed onto the matrix of thecoal in coal seams.
Although there are no commercial developments as yet, methane hydratesremain of interest because of their potential as a source of natural gas in thefuture. Methane hydrates comprisemethanemolecules trapped in a solid latticeof water molecules under specific conditions of temperature and pressure.
The lifecycle for the extraction of unconventional gas is similar to that forconventional gas (as described inChapter 2), i.e.exploration, appraisal, productionand abandonment. Challenges relating to the production of unconventionalgas are often related to the difficulty of extraction (e.g. tight gas, shale gas)and/or of the source of the gas (e.g. CBM, methane hydrates). Though thelocation of unconventional gas formations is largely well known, there is oftena lack of information on the local geology, which is required if the potential ofthese formations is to be accurately evaluated and the best locations for earlydevelopment identified. Where source rocks exhibit low permeability, artificialstimulation is required to enhance gas flow rates, which raises the costs ofproduction. Production of unconventional gas is thus quite dependent on theextant (or future) price of natural gas.
The United States has invested heavily in activities aimed at understanding anddeveloping its unconventional gas reserves, and particularly its considerableshale gas reserves, in order to reduce its dependence on conventional naturalgas imports. Inmany parts of theworld, growing concerns about energy securityare providing incentives to explore potential shale gas resources. This is to a verylarge extent a result of the success of shale gas developments in the UnitedStates.
The potential of unconventional gas resources
Determining the amount of gas in place in unconventional reservoirs is complexbecause of the heterogeneous structure of the reservoirs. Moreover, assessingproductivity is dependent on a detailed investigation of the characteristics ofthe reservoir, which can vary horizontally and vertically in any given reservoir.Ultimately recoverable unconventional gas resources, excluding methane
CHAPTER 6 • THE UNCONVENTIONAL GAS REVOLUTION 173
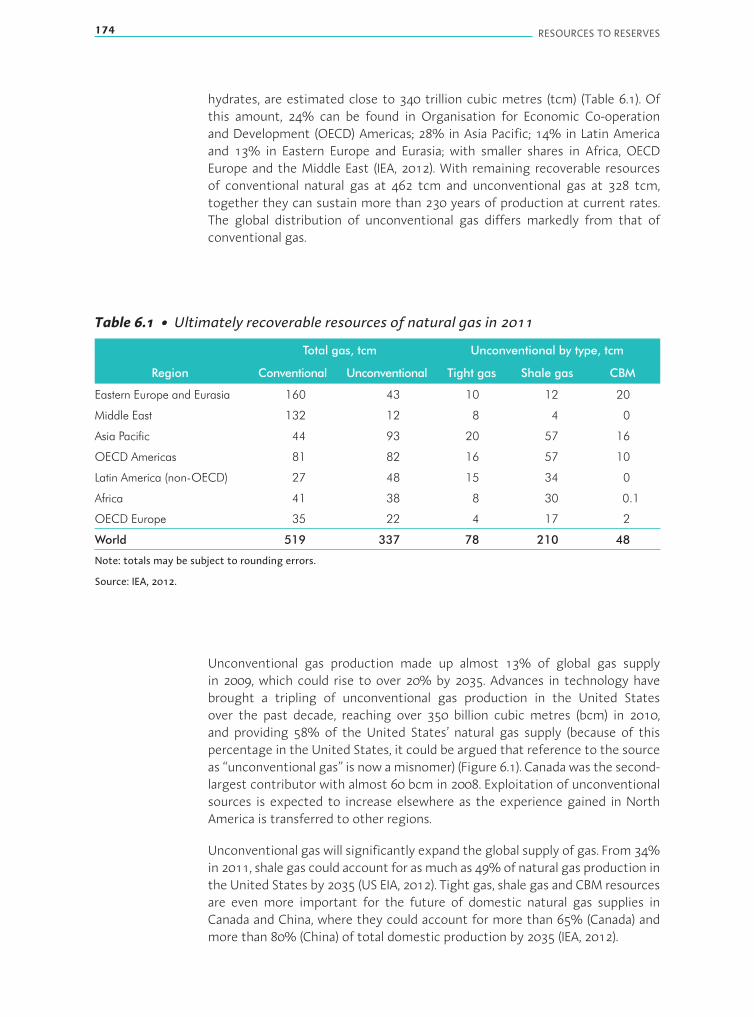
174 RESOURCES TO RESERVES
hydrates, are estimated close to 340 trillion cubic metres (tcm) (Table 6.1). Ofthis amount, 24% can be found in Organisation for Economic Co-operationand Development (OECD) Americas; 28% in Asia Pacific; 14% in Latin Americaand 13% in Eastern Europe and Eurasia; with smaller shares in Africa, OECDEurope and the Middle East (IEA, 2012). With remaining recoverable resourcesof conventional natural gas at 462 tcm and unconventional gas at 328 tcm,together they can sustain more than 230 years of production at current rates.The global distribution of unconventional gas differs markedly from that ofconventional gas.
Table 6.1 • Ultimately recoverable resources of natural gas in 2011
Total gas, tcm Unconventional by type, tcm
Region Conventional Unconventional Tight gas Shale gas CBM
Eastern Europe and Eurasia 160 43 10 12 20
Middle East 132 12 8 4 0
Asia Pacific 44 93 20 57 16
OECD Americas 81 82 16 57 10
Latin America (non-OECD) 27 48 15 34 0
Africa 41 38 8 30 0.1
OECD Europe 35 22 4 17 2
World 519 337 78 210 48
Note: totals may be subject to rounding errors.
Source: IEA, 2012.
Unconventional gas production made up almost 13% of global gas supplyin 2009, which could rise to over 20% by 2035. Advances in technology havebrought a tripling of unconventional gas production in the United Statesover the past decade, reaching over 350 billion cubic metres (bcm) in 2010,and providing 58% of the United States’ natural gas supply (because of thispercentage in the United States, it could be argued that reference to the sourceas “unconventional gas” is now amisnomer) (Figure 6.1). Canadawas the second-largest contributor with almost 60 bcm in 2008. Exploitation of unconventionalsources is expected to increase elsewhere as the experience gained in NorthAmerica is transferred to other regions.
Unconventional gas will significantly expand the global supply of gas. From 34%in 2011, shale gas could account for asmuch as 49%of natural gas production inthe United States by 2035 (US EIA, 2012). Tight gas, shale gas and CBM resourcesare even more important for the future of domestic natural gas supplies inCanada and China, where they could account for more than 65% (Canada) andmore than 80% (China) of total domestic production by 2035 (IEA, 2012).

CHAPTER 6 • THE UNCONVENTIONAL GAS REVOLUTION 175
Figure 6.1 • Annual actual and projected production of unconventional gasin the United States
0
100
200
300
400
500
600
700
800
900
1990 1995 2000 2005 2010 2015 2020 2025 2030 2035
bcm
Shale gas CBMTight gas
Offshore conventionalAssociated with oilOnshore conventionalAlaska
49%
7%
21%
Source: EIA, 2012.
For tight gas, shale gas and CBM, economies of scale have enabled theirproduction to be achieved at costs broadly similar to those for production ofconventional gas.
Tight gas
Tight gas is natural gas, mainly methane, trapped in geological sandstone orlimestone formations. Though there is no formal definition to differentiatebetween conventional gas and tight gas, if the permeability of the reservoiris below 0.1 millidarcy,1 the gas is often referred to as tight gas. A workingdefinition of tight gas could be natural gas from a reservoir that cannot bedeveloped profitably with conventional vertical wells, because of low flow rates.
As much as 15% of Canada’s current gas production is from readily accessedtight gas resources, which may be referred to by some as conventional gasreservoirs. They include, for example, shallow gas in Alberta and Saskatchewan,some deep-basin plays in the tight sandstones of Alberta and British Columbia,and limestones in north-eastern British Columbia. Estimates for the UnitedStates put tight gas reserves atmore than 20%of remaining recoverable naturalgas.
1. The millidarcy (md) is the customary unit of measurement of permeability, where 1 m = 9.87x10⁻¹⁶ m2.
176 RESOURCES TO RESERVES
Extraction of tight gasTight gas has been produced for decades, especially, for example, in the southernpart of the North Sea. Success in producing gas from these reservoirs relies onwells that are in contact with a large volume of reservoir, reducing the distancethe gas flows through the extremely low-permeability rock. The best way to dothis is by hydraulic fracturing, which involves creating cracks in the rock throughwhich the gas can flow to the wells. Significant reservoir contact can be createdby combining a dense pattern of deviated or horizontal drilling with placementofmultiple fractures along the hole. This approachmakes it possible to tap a verythick stack of many thinner reservoirs. Such wells have been instrumental in thesurge of tight gas developments in the United States.
The key technologies for tight gas production enable:
■ numerous long horizontal wells to be drilled efficiently from a single surfacelocation;
■ large surface areas of rock to be opened by hydraulic fracturing along horizontal,lateral sections;
■ “sweet spots” to be found in a large reservoir.
The rock is fractured hydraulically by injecting specially engineered, water-basedfluids at high rates and pressures. Proppant, often fine sand or ceramic beads, isadded to the fracture fluid to stop the fractures from closing when the well isin production. While water and proppant make up 99.5% of the volume of thefracturing fluid, the remainder comprises chemical additives, such as acid, frictionreducer, surfactant, gelling agent and scale inhibitor (API, 2010). Technologicaldevelopments are focused on finding techniques to improve the fracturingprocess, as well as techniques to clean the well and fracture system of thefracturing fluids, which could otherwise block the inflow of gas into the fracture.
Sweet spots are areas where permeability and porosity are significantly higherthan the average values in the reservoir. Higher permeability may often resultfrom open natural fractures, formed in the reservoir by natural stresses, creatingadensepatternof fractures. Such fracturesmayhave reclosed, filled inwithothermaterials or may still be open. A well that can be connected through hydraulicfracturing to open natural fracture systems can have a significant flow potential.Sweet spots are often located empirically in combination with geomechanicalassessments by using, for example, advanced seismic techniques. Drilling wellsand hydraulic fracturing are costly processes, but improvements in procedureshave brought significant cost reductions.
Shale gas
Shale gas is a natural gas contained within predominantly organic-rich, fine-grained rocks and silts dominated by shale. Shale itself is a very fine-grainedsedimentary rock that can easily be broken into thin, parallel layers. However,

CHAPTER 6 • THE UNCONVENTIONAL GAS REVOLUTION 177
it is the organic material that is important; when buried sufficiently deepunderground, and the conditions of pressure and temperature are appropriate,gas is formed. Where the gas has not been able to escape the source rock andremains trapped within its structure, it is referred to as shale gas. Significantvolumes of natural gas may be contained in layers of shale rock, often hundredsof metres thick. Shale gas is often considered a sub-category of tight gas.
Extraction of shale gasIn the past, shale gas was usually discovered when drilling for oil and gas atdeeper levels. Until recently, however, producing the gas from shale formationswas not profitable because of the lowpermeability of the rock and the lowyields.While often found in regions with conventional oil and gas resources, shale gascan also occur in areaswith no conventional oil and gas resources. As explorationin those areas has been minimal, resources of shale gas may be significantlyhigher than previously predicted.
Key technologies for shale gas production are the same as those required fortight gas. Adapting these basic techniques to meet the characteristics of aspecific resource area or play is a vital step towards optimising project costs.In most cases, the longer, more complex and more expensive wells, which arefractured at multiple stages along their length, tend to be more cost-effectiveby reducing the unit production costs (Figure 6.2).
Figure 6.2 • Horizontal well with multiple hydraulic fractures
Groundwater aquifers
Conductor casing
Surface casing
Intermediate casing
Production casing
Vertical wellHorizontal well
Vertical fracturesin vertical well
Vertical fractures in horizontal well
Producing formation150 mradius
Notes: m = metres. Unless otherwise indicated, all material in figures and tables derives from IEA data and analysis.
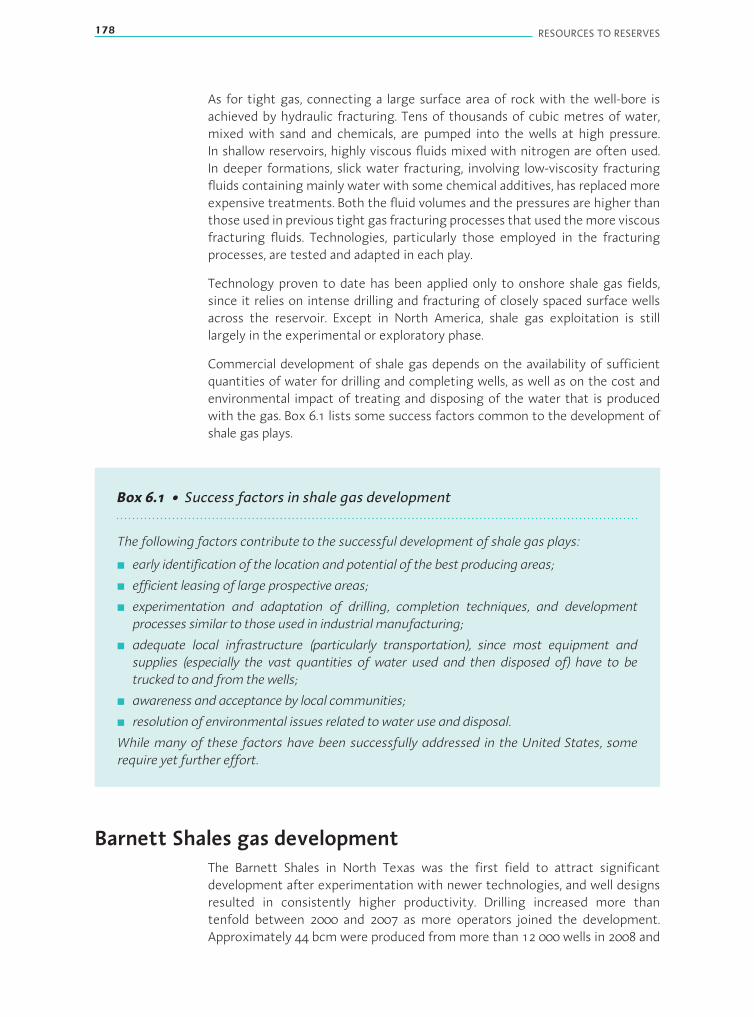
178 RESOURCES TO RESERVES
As for tight gas, connecting a large surface area of rock with the well-bore isachieved by hydraulic fracturing. Tens of thousands of cubic metres of water,mixed with sand and chemicals, are pumped into the wells at high pressure.In shallow reservoirs, highly viscous fluids mixed with nitrogen are often used.In deeper formations, slick water fracturing, involving low-viscosity fracturingfluids containingmainly water with some chemical additives, has replacedmoreexpensive treatments. Both the fluid volumes and the pressures are higher thanthose used in previous tight gas fracturing processes that used themore viscousfracturing fluids. Technologies, particularly those employed in the fracturingprocesses, are tested and adapted in each play.
Technology proven to date has been applied only to onshore shale gas fields,since it relies on intense drilling and fracturing of closely spaced surface wellsacross the reservoir. Except in North America, shale gas exploitation is stilllargely in the experimental or exploratory phase.
Commercial development of shale gas depends on the availability of sufficientquantities of water for drilling and completing wells, as well as on the cost andenvironmental impact of treating and disposing of the water that is producedwith the gas. Box 6.1 lists some success factors common to the development ofshale gas plays.
Box 6.1 • Success factors in shale gas development
The following factors contribute to the successful development of shale gas plays:
■ early identification of the location and potential of the best producing areas;
■ efficient leasing of large prospective areas;
■ experimentation and adaptation of drilling, completion techniques, and developmentprocesses similar to those used in industrial manufacturing;
■ adequate local infrastructure (particularly transportation), since most equipment andsupplies (especially the vast quantities of water used and then disposed of) have to betrucked to and from thewells;
■ awareness and acceptance by local communities;
■ resolution of environmental issues related to water use and disposal.
While many of these factors have been successfully addressed in the United States, somerequire yet further effort.
Barnett Shales gas developmentThe Barnett Shales in North Texas was the first field to attract significantdevelopment after experimentation with newer technologies, and well designsresulted in consistently higher productivity. Drilling increased more thantenfold between 2000 and 2007 as more operators joined the development.Approximately 44 bcmwere produced frommore than 12 000 wells in 2008 and

CHAPTER 6 • THE UNCONVENTIONAL GAS REVOLUTION 179
almost 3 000 more wells were drilled during that year. When activity peaked in2008, there were more than 180 drilling rigs, which represented nearly 10% ofactive rigs in the country and 5% of all rigs worldwide.2
The number of wells completed in the Barnett Shales grew rapidly between 1992and 2008 (Figure 6.3); the significance of horizontalwells and their relation to gasproduction were clearly recognised during the course of the last decade.
Figure 6.3 • Barnett Shales’ gas wells completed and production
0
500
1 000
1 500
2 000
2 500
3 000
0
10
20
30
40
50
60
Num
ber
ofw
ells
Horizontal wells Vertical wells Gas production (right axis)
bcm
1992 1994 1996 1998 2000 2002 2004 2006 2008
Source: IEA, 2009.
Barnett wells (both horizontal and vertical) have tended to exhibit an earlyproductionpeak followedbya rapiddecline.Onaverage,weightedbyproduction,horizontal Barnett wells have declined by 39% from the first to second year ofproduction and by 50% from the first to third year (Figure 6.4).
Figure 6.4 • Production decline rates for Barnett Shales’ horizontal gas wells
0%
39%50%
57%66%
75%83%
88% 92% 95% 96% 98% 98% 99%0
0.2
0.4
0.6
0.8
1.0
1.2
1.4
Gas
pro
duct
ion
(mcm
)
Years of production
Monthly production Average monthly production and decline rate from first year
1 2 3 4 5 6 7 8 9 10 11 12 13 14
Note: mcm = million cubic metres.
Source: IEA, 2009.
2. According to the Baker Hughes rig count, a leadingmeasure of drilling activity: www.bakerhughesdirect.com.
180 RESOURCES TO RESERVES
Average production and estimated recovery rates per well in Barnett Shaleshave not improved significantly since the widespread adoption of horizontalwells in 2005. The reason for this is mainly because the play includes manyless productive areas and involves a large number of companies attracted byinitially high gas demand and prices. The key to improving financial viabilitylies in reducing production costs by experimenting with different well designsand completion processes in a given area. Particular focus should be given tothe length of the horizontal section drilled per well and the number of fracturestages, together with their size, spacing and execution. By quickly identifyingthe designs and techniques that improve results in a specific area, by applyingthem in subsequentwells and by continually updating standard practices used intrials, operators have been able to improve their production and recovery rates.
Although the Barnett Shales is the best known and currently themost developedof shale gas plays in the United States, it is neither the most productive nor themost financially viable to develop.
Distinctive features of shale gas playsThe Barnett Shales has been a prime mover, but the focus of shale gasdevelopment has shifted to other plays in the United States such as theHaynesville (on the Texas-Louisiana border), Fayetteville (in Arkansas) andMarcellus shale (in the north-eastern United States), and the Horn River Basinshale (in British Columbia, Canada). The physical and geophysical properties varysignificantly both among and within shale gas plays. A common characteristicis the relatively low concentration of resources, with gas in place ranging from0.2 bcm to 3.2 bcm per square kilometre (bcm/km2). Add this to the low recoveryfactors (up to 20% estimated to date) and the yield of recoverable resourcesamounts to between 0.04 bcm and 0.6 bcm/km2. This compares to recoverableresources from the world’s largest conventional gas fields, which produce onaverage 2 bcm/km2 and in some cases exceed 5 bcm/km2.
Not only do shale plays cover much larger areas, but they also require that morewells are drilled more closely together than those of conventional resources.Thismeans that amuch larger surface area is affected by drilling and productionoperations. Some areas have been drilled with wells every 6 hectares (ha) to 8 haequivalent to some 16 wells/km2. At present, 20 to 30 wells are often drilledfrom a single surface location and long-reach horizontal well-bores of up to2 kilometres (km) to 3 km reduce the impact on the surface. Future technologicalbreakthroughs that further reduce the surface environmental impact wouldfacilitate the development of more plays, especially in the more denselypopulated or environmentally sensitive areas. This will be a key factor inWesternEuropean developments.
The economics of shale gas productionThe cost of developing andproducing shale gas varies according to the particularreservoir or play. The IEA estimates that the threshold gas development andproduction costs at the well-head for the main plays being developed in the
CHAPTER 6 • THE UNCONVENTIONAL GAS REVOLUTION 181
United States and Canada ranges between USD 3 and USD 7 per million Britishthermal units (MBtu).
Current estimates of gas recovery factors vary from less than 8% to 30%of gas in place, which is significantly lower than the 60% to 80% recoveryfactor for conventional gas reserves. The use of horizontal wells, fractured atmultiple intervals, has brought an improvement in recovery factors. Operatorsare actively engaged in identifying measures that can further improvematters by, for example, experimenting with horizontal wells of differentlengths, varying the spacing and number of fractures, as well as altering thespacing between wells. Testing several well designs has enabled companies toimprove the ratio of cost to initial production rate, sometimes by up to 40%.Encana Corporation more than doubled well production by increasing thewell length and the number of intervals fractured, while reducing the cost perinterval (IEA, 2009). Making full use of experience gained is important. It tookmore than 20 years for the annual production capacity of Barnett Shales toreach 5 bcm, but this was accomplished in just four years at the Fayettevilleshale gas play.
The relationship between investment, production and cash flow is quitedifferent forashalegasplay fromthat foraconventionalgas fielddevelopment.To reach and sustain a production plateau for shale gas usually takesseveral years and requires continuous drilling. When drilling is discontinued,production falls by half in something like three years. Another feature ofshale plays is that most of the capital costs are recovered within the first fewyears. This means that greenfield developments tend to be less influenced bymedium-term instability in terms of both cost and price. As a result, shale gascould play a role as a swing producer, with production moving up and downrapidly in response to market signals.
Over the last decade, shale gas production has expanded throughout the UnitedStates (Figure 6.5). It reached nearly 141 bcm or over 23% of total natural gasoutput in 2010 and technically recoverable reserves increased to about 14 tcmin 2011. Until now, shale gas production has only put downward pressure ondomestic gas prices in the United States because of segregated global gasmarkets. This could change as companies are looking to export some of the gasas liquefied natural gas (LNG). Questions remain as to what extent gas produceddomestically will be exported and to what extent this phenomenon will impacton global gas prices, supply and demand.
Outside North America, shale gas production is still negligible. However,the North American experience is stimulating interest elsewhere and shalegas formations are known to be widespread. The first phase of a Europeanassessment, due for completion in 2012-2013, will provide a database ofEuropean black shale formations, volumes of gas in place and feasibility ofproducing it economically (Schultz et al., 2010). Several companies throughoutEurope are investigating shale gas prospects, for example in Austria, Poland,Sweden and the United Kingdom. In South America, prospects in Chile andArgentina are being reviewed and provisional assessments have been madein India and China.

182 RESOURCES TO RESERVES
Figure 6.5 • Shale gas plays in the United States
Shale gas plays
Basins
Paradox basin
SanJuanbasin
Ratonbasin
Palo Durobasin
Permianbasin
BarnettFt. WorthbasinMarta basin
Rio Grandeembayment
MaverickSub-basin
Piceancebasin
Ardmorebasin
Anadarkobasin
Williston basin
GreaterGreen
River basin
Uinta basin
Mancos
Lewis
Bend
Barnett
WoodfordPerasall
Eagle Ford Eagle Ford
Hermosa
MontanaThrust Belt
Cody
PierreExcello-
Mulky
Fayetteville
Woodford-Caney
Woodford
Floyd
Neal
Haynesville
NewAlbany
Conasauga
Chattanooga
Valley andRidge Province
AntrimMichigan
basinAppalachian
basin
Devonian (Ohio)(shallowest)MarcellusUtica (deepest)
Illinoisbasin
Cherokeeplatform
Arkoma basin
BlackWarriorbasin
ForestCity
basin
Gammon
HilliardBaxterMancos
Texas andLouisiana-Mississippi salt basins
This map is without prejudice to the status of or sovereignty over any territory, to the delimitation of international frontiers and boundaries,and to the name of any territory, city or area.
Source: IEA, 2009.
CBM
CBM is a generic term for the methane found in most coal seams. As the coalforms, large quantities of methane-rich gas are produced and subsequentlyadsorbed onto the coal matrix. Because of its many natural cracks and fissures,as well as its porous nature, coal has a large internal surface area and can storemuchmore gas than a conventional natural gas reservoir of similar rock volume.
If a seam is disturbed, either during mining or by drilling into it before mining,methane is released from the surface of the coal. This methane, known as coal-mine methane (CMM), then leaks into any open spaces, such as fractures in theseam (known as cleats). In these cleats, the CMMmixeswith nitrogen and carbondioxide (CO2). Boreholes or wells can be drilled into the seams to recover theCMM. Large amounts of coal are found at shallow depths, where wells to recoverthe gas are easy to drill at a relatively low cost. At greater depths, increasedpressure may have closed the cleats, or minerals may have filled them overtime, lowering permeability and making it more difficult for the gas to movethrough the coal seam. CMM has been a hazard since mining began. To reduceany danger to coal miners, most effort is addressed at minimising the presenceof CMM in the mine, predominantly by venting it to the atmosphere. Onlyduring the past two decades has significant effort been devoted to recoveringthe methane as an energy resource. Another source of methane from a workingmine is the methane mixed with ventilation air, the so-called ventilation airmethane (VAM). In the mine, ventilation air is circulated in sufficient quantity todilute the methane to low concentrations for safety reasons. VAM is often toolow in concentration to be of commercial value.

CHAPTER 6 • THE UNCONVENTIONAL GAS REVOLUTION 183
Although, strictly speaking, CMM is the fraction of CBM that is released during themining operation, in practice, the terms CBM and CMM usually refer to differentsources of gas. Whereas CMM is used to refer to gas released from working coalmines, CBM is most often used to refer to the gas held in coal seams that areconsidered uneconomic to mine. Reasons why a seam may be uneconomic tomine may be related to its depth, its thickness or, perhaps, the poor quality of itscoal. The gas from these seams can be extracted by using technologies that aresimilar to those used to produce conventional gas, i.e. usingwell-bores. Complexityarises from the fact that the formations are generally of low permeability; hence,technologies such as horizontal and multilateral drilling with hydraulic fracturingare sometimes used to create longer, more open channels that enhance wellproductivity. Water present in the seam, either naturally occurring or introducedduring the fracturing operation, is usually removed to reduce the pressuresufficiently to allow the gas to be released, which leads to additional operationalrequirements, increased investment and environmental concerns.
Production of CBMCBM is a potential source of energy and is recovered as a natural gas resource.Commercial production from CBM began in the United States in the late 1980s,spurred by tax incentives and accelerated by new technologies and expansionsto new basins.
Advances in basin modelling, seismic techniques, horizontal-well drilling andhydraulic fracturing have helped reduce uncertainties related to reservesassessment, and have improved both recovery rates and the potential forcommercial exploitation of CBM fields. Production is now advanced in theUnited States, Canada and Australia, with activities also under way in China(Box 6.2), India, Russia and Indonesia.
Box 6.2 • China: a major opportunity for CBM
Chinahasextensive coaldepositsand isheavilydependentoncoalasaprimaryenergy source.Itsmining activities release large quantities ofmethane gas, which contribute significantly toatmospheric GHG emissions. The naturally gaseous nature of coal mines in Chinamean thatmuch of themined coal comes fromgassy undergroundworkings. It is amajor factor leadingto the loss of many lives in Chinese coal mines each year, resulting predominantly from gasexplosions.
Estimates of methane emissions by venting from Chinese coal mines are in the order of12 bcm annually, representing around half of all global CMM released. In 2000, 0.92 bcm/yrof methane-equivalent was captured from 185 coal mines, and only 0.4 bcm/yr from 60 coalmines was actually used (mainly for domestic cooking), with the remainder released to theatmosphere (Weitang, 2003). In 2010, about 7.4 bcm CMM was captured by various means,with only around 2.5 bcm utilised as a source of energy (Huang, 2010).

184 RESOURCES TO RESERVES
Although drilling for CBM began in the early 1980s, there was little success until 1996when the North China Bureau of Petroleum developed a field in Shanxi Province.The lack of pipeline infrastructure has limited new CBM projects. Several players arenow active, resulting in a cumulative production of 8.6 bcm by 2010. In 2010, output was3.1 bcm, rising to 5.3 bcm in 2011 and was set to reach 8 bcm in 2012. There is a policy todivert new natural gas pipelines through areas where CBM potential has been identified.Most projects are funded by international organisations, with the Clean DevelopmentMechanism (CDM) under the Kyoto Protocol providing an important incentive for exploringinvestment opportunities. The West-East gas pipeline between Tarim and Shanghaiincreased the supply of natural gas to the population and industry around the Shanghairegion. The gas in this pipeline is supplemented with CBM. Although there is a long-termplan to pipe natural gas to north-eastern China from eastern Siberia, the immediateneed for gas in the area has necessitated the development of local CBM projects. Evenif additional natural gas becomes available from Siberia, once established, CBM will stillbe competitive given projected gas demand. China’s 12th Five-Year Plan aims to reachbetween 20 bcm and 30 bcm annual production by 2015. Implementing best practices andusing new technologies in Chinese projects will be essential to achieving this target.
The urgent need to reduce urban air pollution is an important stimulus to natural gasdevelopment in China. Urban areas, in particular, require access to gas to displace demandfor coal. This will also serve to further encourage CBM development.
Existing CBM schemes primarily serve the domestic sector and suffer from seasonalvariability in demand. There would be environmental advantages in increasing the use ofCBM in cities for district heating, cogeneration schemes and as a clean fuel for industry.Industrial users could provide a more consistent consumer base than domestic users.Increased local use by industrial plants with a steady gas requirement or conversion toelectricity could increase gas use, reduce the volumes of CBM vented and reduce the needto construct costly pipelines.
In the United States, aside from the original San Juan Basin, expansionhas included several new basins in Colorado, New Mexico and Wyoming,bringing current US production to around 56 bcm per year (bcm/yr), or 7%of domestic gas production, in 2010 (EIA, 2012). Technically recoverable CBMin the United States is currently estimated at around 5% of the total naturalgas resource base.
The major CBM resources in Canada are located in the Mannville, Ardley andHorseshoe Canyon basins. Following the drilling of over 10 500 CBM wellsby early 2007, Canada’s production exceeded 9 bcm in 2010 (8% of Canada’stotal gas production).
Commercial production in Queensland, Australia began in 1998 and in2008 CBM supplied 3.5 bcm, or 14% of the country’s total domestic gasproduction. Since then, through continued growth, unconventional gas,which is mainly CBM, now represents 21% of Australian domestic gas. CBM
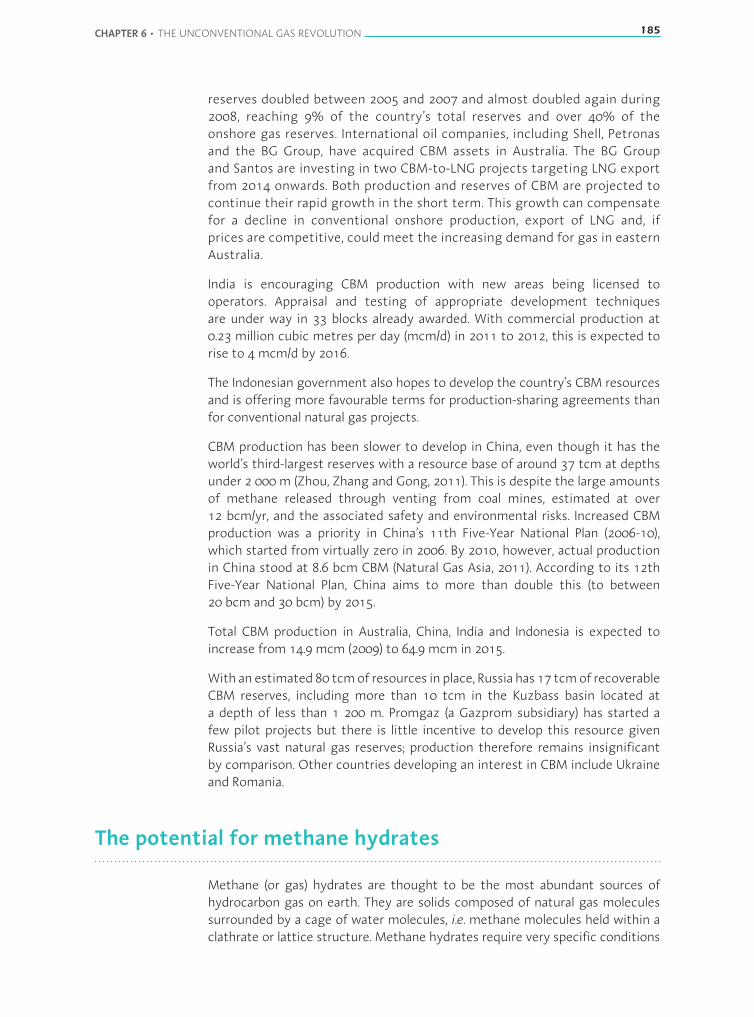
CHAPTER 6 • THE UNCONVENTIONAL GAS REVOLUTION 185
reserves doubled between 2005 and 2007 and almost doubled again during2008, reaching 9% of the country’s total reserves and over 40% of theonshore gas reserves. International oil companies, including Shell, Petronasand the BG Group, have acquired CBM assets in Australia. The BG Groupand Santos are investing in two CBM-to-LNG projects targeting LNG exportfrom 2014 onwards. Both production and reserves of CBM are projected tocontinue their rapid growth in the short term. This growth can compensatefor a decline in conventional onshore production, export of LNG and, ifprices are competitive, could meet the increasing demand for gas in easternAustralia.
India is encouraging CBM production with new areas being licensed tooperators. Appraisal and testing of appropriate development techniquesare under way in 33 blocks already awarded. With commercial production at0.23 million cubic metres per day (mcm/d) in 2011 to 2012, this is expected torise to 4 mcm/d by 2016.
The Indonesian government also hopes to develop the country’s CBM resourcesand is offering more favourable terms for production-sharing agreements thanfor conventional natural gas projects.
CBM production has been slower to develop in China, even though it has theworld’s third-largest reserves with a resource base of around 37 tcm at depthsunder 2 000 m (Zhou, Zhang and Gong, 2011). This is despite the large amountsof methane released through venting from coal mines, estimated at over12 bcm/yr, and the associated safety and environmental risks. Increased CBMproduction was a priority in China’s 11th Five-Year National Plan (2006-10),which started from virtually zero in 2006. By 2010, however, actual productionin China stood at 8.6 bcm CBM (Natural Gas Asia, 2011). According to its 12thFive-Year National Plan, China aims to more than double this (to between20 bcm and 30 bcm) by 2015.
Total CBM production in Australia, China, India and Indonesia is expected toincrease from 14.9 mcm (2009) to 64.9 mcm in 2015.
With an estimated 80 tcmof resources in place, Russia has 17 tcmof recoverableCBM reserves, including more than 10 tcm in the Kuzbass basin located ata depth of less than 1 200 m. Promgaz (a Gazprom subsidiary) has started afew pilot projects but there is little incentive to develop this resource givenRussia’s vast natural gas reserves; production therefore remains insignificantby comparison. Other countries developing an interest in CBM include Ukraineand Romania.
The potential for methane hydrates
Methane (or gas) hydrates are thought to be the most abundant sources ofhydrocarbon gas on earth. They are solids composed of natural gas moleculessurrounded by a cage of water molecules, i.e. methane molecules held within aclathrate or lattice structure. Methane hydrates require very specific conditions
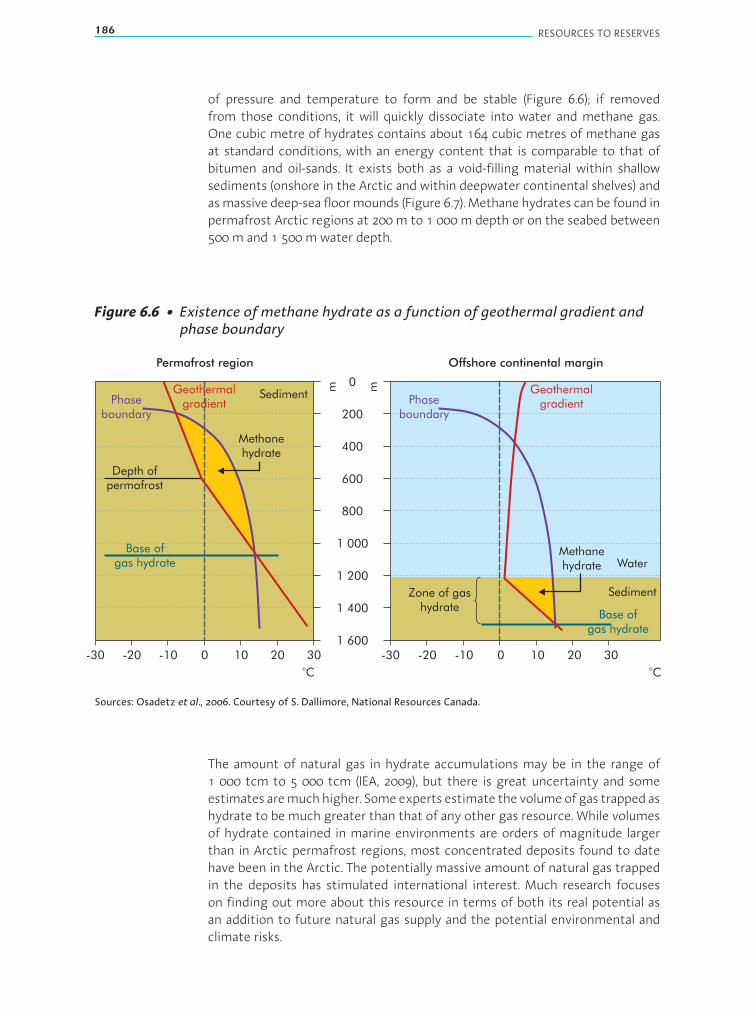
186 RESOURCES TO RESERVES
of pressure and temperature to form and be stable (Figure 6.6); if removedfrom those conditions, it will quickly dissociate into water and methane gas.One cubic metre of hydrates contains about 164 cubic metres of methane gasat standard conditions, with an energy content that is comparable to that ofbitumen and oil-sands. It exists both as a void-filling material within shallowsediments (onshore in the Arctic and within deepwater continental shelves) andasmassive deep-sea floormounds (Figure 6.7). Methane hydrates can be found inpermafrost Arctic regions at 200 m to 1 000 m depth or on the seabed between500 m and 1 500 mwater depth.
Figure 6.6 • Existence of methane hydrate as a function of geothermal gradient andphase boundary
m m
oC
oC
Offshore continental marginPermafrost region
Methanehydrate
Methanehydrate
Phaseboundary
Phaseboundary
Depth ofpermafrost
Base ofgas hydrate
Base ofgas hydrate
Zone of gashydrate
0
200
400
600
800
1 000
1 200
1 400
1 600-20-30 -20-30-10 -100 010 1020 2030 30
Water
Sediment
SedimentGeothermalgradient
Geothermalgradient
Sources: Osadetz et al., 2006. Courtesy of S. Dallimore, National Resources Canada.
The amount of natural gas in hydrate accumulations may be in the range of1 000 tcm to 5 000 tcm (IEA, 2009), but there is great uncertainty and someestimates aremuchhigher. Someexperts estimate the volumeofgas trapped ashydrate to bemuch greater than that of any other gas resource. While volumesof hydrate contained in marine environments are orders of magnitude largerthan in Arctic permafrost regions, most concentrated deposits found to datehave been in the Arctic. The potentially massive amount of natural gas trappedin the deposits has stimulated international interest. Much research focuseson finding out more about this resource in terms of both its real potential asan addition to future natural gas supply and the potential environmental andclimate risks.
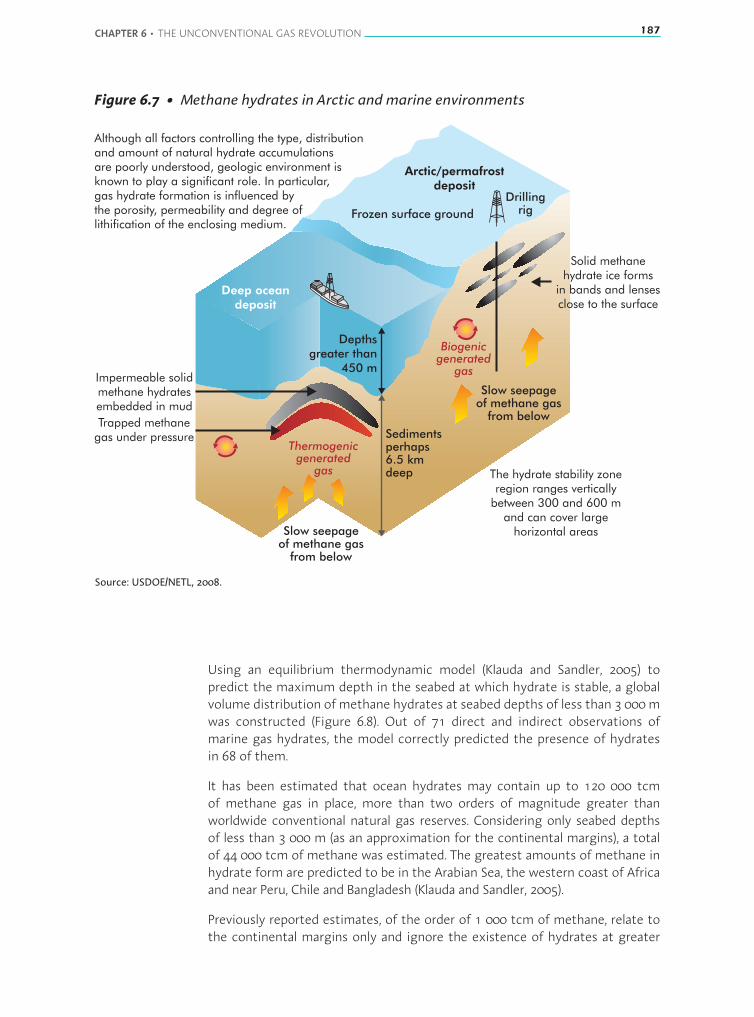
CHAPTER 6 • THE UNCONVENTIONAL GAS REVOLUTION 187
Figure 6.7 • Methane hydrates in Arctic and marine environments
Biogenicgenerated
gas
Thermogenicgenerated
gas
Slow seepageof methane gas
from below
Slow seepageof methane gas
from below
DrillingrigFrozen surface ground
Arctic/permafrostdeposit
Trapped methanegas under pressure
Impermeable solidmethane hydratesembedded in mud
Solid methanehydrate ice forms
in bands and lensesclose to the surface
Depthsgreater than
450 m
Sedimentsperhaps6.5 kmdeep The hydrate stability zone
region ranges verticallybetween 300 and 600 m
and can cover largehorizontal areas
Although all factors controlling the type, distributionand amount of natural hydrate accumulationsare poorly understood, geologic environment isknown to play a significant role. In particular,gas hydrate formation is influenced bythe porosity, permeability and degree oflithification of the enclosing medium.
Deep oceandeposit
Source: USDOE/NETL, 2008.
Using an equilibrium thermodynamic model (Klauda and Sandler, 2005) topredict the maximum depth in the seabed at which hydrate is stable, a globalvolume distribution of methane hydrates at seabed depths of less than 3 000mwas constructed (Figure 6.8). Out of 71 direct and indirect observations ofmarine gas hydrates, the model correctly predicted the presence of hydratesin 68 of them.
It has been estimated that ocean hydrates may contain up to 120 000 tcmof methane gas in place, more than two orders of magnitude greater thanworldwide conventional natural gas reserves. Considering only seabed depthsof less than 3 000 m (as an approximation for the continental margins), a totalof 44 000 tcm of methane was estimated. The greatest amounts of methane inhydrate form are predicted to be in the Arabian Sea, the western coast of Africaand near Peru, Chile and Bangladesh (Klauda and Sandler, 2005).
Previously reported estimates, of the order of 1 000 tcm of methane, relate tothe continental margins only and ignore the existence of hydrates at greater
188 RESOURCES TO RESERVES
depths and in inland seas. However, total volumes ofmethane hydrates remain asubject of debate. Other estimates give a volume of gas trapped in the range of2 500 tcm to 20 000 tcm (Klauda and Sandler, 2005; NPC, 2007).
Figure 6.8 • Global volume distribution of methane hydrates
Note: triangles denote observed hydrates at seabed depths of less than 3 000m.
Source: Klauda and Sandler, 2005.
The possible magnitudes of the resource and types of deposit are illustrated inFigure 6.9 (Boswell and Collett, 2006), where volumes of hydrates are comparedwith the natural gas resource. The peak of the pyramid includes hydrates knownto exist with high pore space saturations within reservoirs under existing Arcticinfrastructure, such as the Eileen trend of Alaska’s North Slope (ANS) or theMallik gas hydrate field in the Mackenzie Delta. Next come less well-definedaccumulations that exist in similar geological settings (discretely trapped, high-saturation occurrences within high-quality sandstone reservoirs) on the NorthSlope, but away from existing infrastructure. A recent US Geological Surveyassessment estimated that there are 2.4 tcm of technically recoverable naturalgas from hydrate deposits on the Alaskan North Slope (Collett et al., 2008).
BelowtheArticresourcesaremethanehydratesofamoderate-to-highconcentrationwithin quality sandstone reservoirs in the marine environment. As the costof extracting these resources from very deep water would be high, the mostfavourable accumulations are found in the Gulf of Mexico in the vicinity of oil andgas production infrastructure. The scale of this resource is not well known, but isthe subject of an ongoing assessment by the USMinerals Management Service.
0
0.00
9
0.01
8
0.02
7
0.03
6
0.04
5
0.05
6 0.06-0.18
Volume (x10 m )15 3
This map is without prejudice to the status of or sovereignty over any territory, to the delimitation of international frontiers and boundaries, and to the name of any territory, city or area.

CHAPTER 6 • THE UNCONVENTIONAL GAS REVOLUTION 189
Figure 6.9 • Methane hydrate resource pyramid
Arctic sandstones under existing infrastructure (100s bcm in place)
Arctic sandstones away from infrastructure (~1 000s bcm in place)
Deepwater sandstones (-10 000s bcm in place)
Reserves (5 tcm)
Reserves growth andundiscovered (50 tcm recoverable)
Remaining undiscoverable(unknown)
Non-sandstone marine reservoirs with permeability (unknown)
Marine reservoirs with limited permeability (1 000s tcm in place)
Massive surficial and shallow nodular hydrate (unknown)
Source: adapted from Boswell and Collett, 2006.
At the base of the resource pyramid are finely disseminated accumulations,typified by the Blake Ridge accumulation offshore the Carolinas, in which largevolumes of methane hydrates are relatively evenly distributed through vastvolumes of fine-grained and relatively undeformed sediment at low saturation(about 10%or less). The prospects for economic recovery of natural gas from thishighly disseminated resource are very poor with current technologies.
Seabed stability in areas prone to natural deposits of methane hydrates is anissue when it comes to the safe exploration and production of deepwaterhydrocarbons. Methane hydrate reservoirs can cause problems if wells have tobe drilled through them to reach deeper deposits of conventional oil and gas.
Environmental impact
Environmental concerns have an important role in steering technologicaladvances for unconventional gas (NPC, 2003; IEA, 2012). Though they cannotreduce them to zero, the application of best-practice or state-of-the-arttechniques to production of unconventional gas can address effectively manywidely held environmental concerns.
If wells are of sound construction and are located effectively, then fewer of themare required and, consequently, the environmental impact is reduced. Moreover,smaller, modular rigs will reduce the footprint while reducing down-time for rigmoves.
Water is often co-produced with the gas and needs to be treated anddisposed of effectively. Improving the efficiency and cost-effectiveness ofwater treatment technologies is an important challenge for ensuring that theexploitation of unconventional gas resources is environmentally acceptable.
190 RESOURCES TO RESERVES
Fluid discharge requirements in sensitive areas stimulate the development anduse of environmentally compatible drilling and completion fluids.
A key concern that has received significant attention by operators is the dangerof contaminatinggroundwater resources. Fluids used inwell fracturingmayhaveleaked into shallower potable aquifers. Best-practice selection and execution ofdrilling technologies can mitigate such concerns.
With significant opposition to the development of unconventional gasprojects in many countries, constructive engagement with all stakeholdersduring all phases of a development is crucial. Operators must be able toexplain openly and honestly their production practices, the environmental,safety and health risks and how they are addressed. The public needs to gain aclear understanding of the challenges, risks and benefits associated with thedevelopment.
Tight gas and shale gasGiven the important role that unconventional gas is projected to play in thefuture provision of energy, and particularly following the impact that shale gashas had in the United States, many countries are now beginning to look closelyat their own gas prospects. However, while the impact of shale gas productionin the United States has hadmany positive results, increasing its energy securityfor example, concerns have been raised about the environmental issues thathave arisen from its exploration and production.
Addressing environmental concerns relating to the provision of unconventionalgas in a thorough and responsible manner will play a major part in determiningthe extent to which projections on future production will be met. In the UnitedStates, some of the greatest concerns have touched on land use before, duringand after the shale gas production phase; on the high volumes of water used;and on pollution of water and air. It will be crucial that the management ofenvironmental impacts is factored inwhenplanning and evaluating programmesfor exploration and production.
In the case of both tight gas and shale gas, concerns over landscape relate to thevery densepatterns of surfacewells drilled; it is likely that such concernswill limitapplications in densely populated areas, such as the Netherlands. Disposal of thefracturing fluids is also a concern as there is a risk that hydraulic fracturing couldopen up routes to connect with potable aquifers. Indeed, just such concernshave led France and Bulgaria to ban hydraulic fracturing techniques on theirterritories. Poland, in its early exploratory stage for shale gas, ranks attentionto environmental risk assessment, monitoring, management and mitigation ashigh priority tasks.
In 2012, the International Energy Agency released its Golden Rules for a GoldenAge of Gas (IEA, 2012). The “Golden Rules” address legitimate concerns on theenvironmental and social hazards relating to exploration and extraction ofunconventionalgas.Theyprovideguidingprinciples forpolicy-makers, regulators,operators and other stakeholders to manage their concerns in an effective andresponsible manner. In the United States, the Shale Gas Subcommittee of the
CHAPTER 6 • THE UNCONVENTIONAL GAS REVOLUTION 191
US Secretary of Energy Advisory Board has published two reports and offered aseries of recommendations for immediate steps to reduce the environmentalimpacts of shale gas production.
Coal-bed methaneAccessing and producing both CMM and CBM has environmental implications.Removing CMM from the coal seam, for example, reduces the risk of gas release inthe mine. In turn, this can reduce the potential for methane explosions, which area constant threat inmany coal mining operations. Furthermore, instead of ventingthe methane to the atmosphere, which is the normal procedure to reduce therisk of explosion, CMMmay be utilised, e.g. for power generation. In this case, CO2would subsequently be emitted, which has a lower global warming potential thanmethane. If the CMM displaced coal or oil as fuel to generate power, it would leadto lower specific emissions of CO2: CMM has a higher heat content per unit massthan both oil and coal, and gas-fired power generation ismore efficient.
There are notable differences between production of CBM and production fromoil or gas reservoirs. In the latter, as gas is normally found above oil, which in turnis found above water, the hydrocarbons can be extracted without producingmuchwater. In coal seams, however, water penetrates the permeablematrix andtraps themethane. To produce CBM from coal seams, a series of wells are drilledto pump groundwater to the surface, in order to reduce pressure and permitCBM to flow towards the production well. This water, which is commonly salinebut in someareas canbepotable,must beeither put tobeneficial useor disposedof in an environmentally acceptablemanner (USDOE, 2003; ALL Consulting, 2003;WGA, 2006). In the early stages of development of a CBM project, the volume ofproduced water is high, but reduces substantially as gas production increaseslater in the life of the well.
There are various options for the beneficial use of CBM-produced water,depending on its quality and on the effectiveness of the treatment optionsthat can be applied to improve its quality. Even with treatment, however, it isunlikely that all of the water produced could be used, and disposal of some of itwould still be necessary. Disposal methods for CBM-produced water, other thandeep-well injection, include discharging it directly onto the land surface or inreservoirs for evaporation.
Injecting CO2 to displace CBMmay offer advantages for the environment (Box 6.3).
Box 6.3 • CO2-enhanced CBM production
Coal contains significant volumes of adsorbed methane. When CO2 is injected into the coalseam, themethanemolecules released are replaced by CO2molecules (Figure 6.10). The processbywhich CO2 is injected into a coal seamand is preferentially adsorbed onto the coal, displacingmethane, is termedCO2-enhancedcoal-bedmethane recovery. Asa ruleof thumb, twomoleculesof injected CO2are trapped in the coal seam for everymolecule ofmethane released.
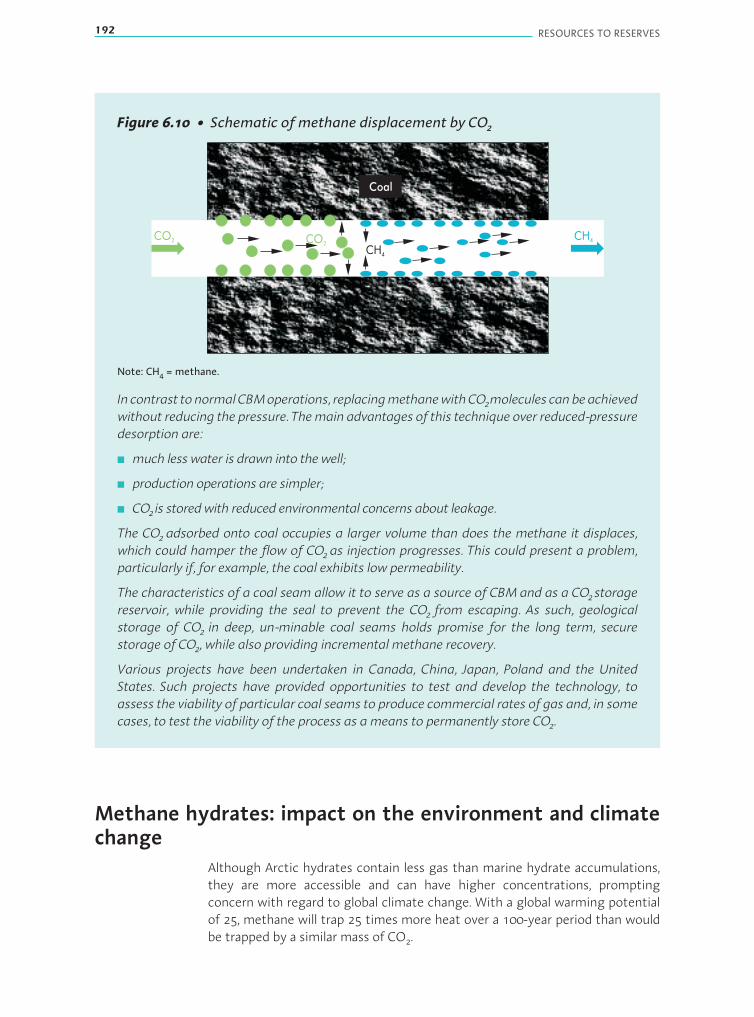
192 RESOURCES TO RESERVES
Figure 6.10 • Schematic of methane displacement by CO2
CO2
CH4
CH4CO2
Coal
Note: CH4 = methane.
In contrast tonormalCBMoperations, replacingmethanewithCO2molecules canbeachievedwithout reducing the pressure. Themain advantages of this technique over reduced-pressuredesorption are:
■ much less water is drawn into the well;
■ production operations are simpler;
■ CO2 is stored with reduced environmental concerns about leakage.
The CO2 adsorbed onto coal occupies a larger volume than does the methane it displaces,which could hamper the flow of CO2 as injection progresses. This could present a problem,particularly if, for example, the coal exhibits low permeability.
The characteristics of a coal seam allow it to serve as a source of CBM and as a CO2storagereservoir, while providing the seal to prevent the CO2 from escaping. As such, geologicalstorage of CO2 in deep, un-minable coal seams holds promise for the long term, securestorage of CO2, while also providing incremental methane recovery.
Various projects have been undertaken in Canada, China, Japan, Poland and the UnitedStates. Such projects have provided opportunities to test and develop the technology, toassess the viability of particular coal seams to produce commercial rates of gas and, in somecases, to test the viability of the process as ameans to permanently store CO2.
Methane hydrates: impact on the environment and climatechange
Although Arctic hydrates contain less gas than marine hydrate accumulations,they are more accessible and can have higher concentrations, promptingconcern with regard to global climate change. With a global warming potentialof 25, methane will trap 25 times more heat over a 100-year period than wouldbe trapped by a similar mass of CO2.
CHAPTER 6 • THE UNCONVENTIONAL GAS REVOLUTION 193
At present, if the increase in atmospheric methane continues, methane wouldbe the dominant greenhouse gas by the second half of this century. Thedegassing of natural gas hydrates may contribute to the increase in emissions.The release of large amounts of methane into the atmosphere from naturalhydrate dissociation has been linked to the extreme climate changes of the latePaleocene thermal maximum period over 55.8 million years ago (Dickens et al.,1995). Natural hydrate dissociation could also be related to the end of glacialperiods. These arguments are persuasive but have only circumstantial evidenceto support them. It is not yet known how such quantities of methane werereleased norwhether themethane camemainly from theArctic land and shallowsea hydrate, which is most susceptible to atmospheric temperature change,or from the larger deep-sea hydrate at lower latitudes, which is probably lesssusceptible to atmospheric temperature change (Hyndman andDallimore, 2001).The possibility of such phenomena occurring provides some justification forresearch into the effects of gas hydrate on global climate change and vice versa.
The potential existence of huge volumes of methane in hydrate form closeto the sea floor not only raises important questions about the influence ofhydrates on global climate change but also on the stability of the sea floor, underdeep shelves and upon slopes. More needs to be known about the propertiesof hydrates before they can be reliably factored into the modelling of carbonbalance in the equilibrium between oceans and atmosphere.
To address these questions, the United States Department of Energy’s (US DOE’s)Inter-agency programme (Box 6.4) suggests that data should be collected in boththe marine and Arctic environments, and aimed towards:
■ developing predictive models of methane generation, oxidation and migration,as well as natural hydrate formation and dissociation;
■ measuring and interpreting the timing, magnitude, distribution and ultimatefate of past methane releases;
■ determining background fluxes of gases between sediments on the sea floor,hydrate, the water column and the atmosphere;
■ numerical modelling of the impact among hydrate-related phenomena, globalcarbon cycling and climate change;
■ an improved understanding of the exploration and production-related impactto ecosystems associated with gas hydrate and identification of methods thatminimise the impact;
■ studying the role of hydrates in the development and stability of continentalshelves and slopes.
Technology development
Technologies to improve exploration and production of tight gas, shale gas andCBM are discussed together, while those for methane hydrates are addressedseparately. Compared with other unconventional gases, commercial extractionof methane hydrates is considered unlikely for some years, and development isat a relatively early stage.

194 RESOURCES TO RESERVES
Tight gas, shale gas and CBM
Exploration
The goal for exploring unconventional gas resources is to find out wherethe most promising reservoir rock areas are likely to be located. Much of thecharacterisation and modelling techniques for conventional gas reservoirs canbe used, adapted and extended to unconventional resources. The large amountof existing data (e.g. existing seismic data, rock cuttings, core samples, mud andgeophysical logs)provideabasis for re-evaluatingopportunities inunconventionalgas zones. But it is necessary to obtain a better understanding of themechanicaland chemical properties of the reservoir rock, and refine reservoir modelling forthe tighter rock structures associated with unconventional gas. Developmentof seismic techniques and the analysis of well cores and cuttings contribute toimproved detection and visualisation of fractures. Increased use of techniquessuch as microseismic monitoring of fracturing operations (breaking rock tocreate small seismic signals) help to understand the geometry and effectivenessof the fracture systems created. This information allows better reservoir modelsto be constructed, which can be used to define development strategies.
Drilling and stimulation
Directional drilling with real-time imaging plays an increasingly importantrole in confirming the model validity and locating the natural fractures thatpromise good well productivity, while reducing the environmental footprintof drilling. Real-time sensors installed near the drill bit can send information tothe geologists who can integrate these data with mud-logging (examining therock samples that are brought to the surface by the drilling fluid) and seismicinformation of the area being drilled. Based on such information, a decision toalter the drilling direction may be taken to maximise the quality and quantityof gas produced from the reservoir. Higher well productivity will also reduce thenumber of wells needed to develop a reservoir.
Stimulation methods are used to exploit and expand natural fractures.Substantial efforts are in progress to adapt and refine stimulation technologyfor unconventional gas. Creating high-performance proppant has proven to be akey development for shale gas.
Gas compression
Unconventional gas reservoirs, because the economics of drilling often favoursrelatively shallow reservoirs, generally have lower well-head pressures thanconventional reservoirs, necessitating above-ground compression and down-hole lifting devices for gas recovery. These are important components forreducing the cost of producing unconventional gas.
Researchgoals for the future include investigating thepossibilityof compressionat the bottom of the well, as well as devices to separate out production fluids(such as water) within the well (downhole) and reinject these fluids immediatelyin lower, appropriate disposal zones.
CHAPTER 6 • THE UNCONVENTIONAL GAS REVOLUTION 195
Methane hydrates: the need for technological innovation
The development of methane hydrates still remains in the research phasewith the focus on characterising hydrates to learn more about their naturalproperties, to measure and monitor their production behaviour and to assesstechniques for their production. Dedicated wells for such studies have beendrilled in ANS, the Andaman Sea, offshore Japan and in the Gulf ofMexico (USGS,2010). In 2008, Canadian and Japanese researchers produced a constant streamof natural gas from a pilot project at theMallik gas hydrate field by lowering thehydrate pressure (Yamamoto and Dallimore, 2008; Thomas, 2008).
Technological innovation will be required for hydrates to be commerciallyexploited with minimum environmental impact. A good understanding of theprocess of hydrate deposition, technologies to identify accumulations and ananalysis of the interaction between their production and the rock structure areall necessary. The local distribution of hydrates is more difficult to predict thanthe distribution of gas in conventional gas reservoirs, where migrating gas iscollected in permeable formations. It is a challenge to develop remote-sensingtools that can map well the concentrations within a hydrate accumulation andthus locate the sweet spots most suitable for early development.
Furthermore, gas hydrates are mostly not overlain by impermeable layers as areconventional gas or oil reservoirs. After dissociation into gas and water, the gasis often able to escape into the atmosphere. A key challenge is to capture thegas rather than allow it to escape. Drilling andwell design for hydrate productionwill need to take into account these particular characteristics of hydratedevelopment.
To date, there has been no commercial production ofmethane hydrates directly.Some gas reservoirs in the Arctic produce conventional gas from rocks directlyunderlying hydrate deposits. In some cases, it is possible that the overlyinghydrates dissociate and recharge the conventional reservoirs, as gas productionleads to a pressure drop in the reservoir. This is believed to be the case in boththeBarrowGas Fields inAlaska and theMessoyakha Field in Siberia (Grover, 2008).
Conventional methods to release methane from the hydrate structure includepressure reduction and thermal stimulation. While these methods are welldemonstrated in the laboratory, application would need to consider the largerscale and the standard reservoir engineering aspects of well designs, developmentstrategies, recovery factors, energy balance, and safety and environmental aspects.
More innovative methods are under investigation. Chemicals may be added todestabilise the hydrate. CO2 may be injected to displace themethanemoleculesin the structure, liberating the methane while keeping the hydrate intact. Thislatter concept has certain similarities with the injection of CO2 to release CBM.
Research to date indicates that methane hydrates could eventually be producedcommercially. The magnitude of the potential resource has stimulatedco-operation in global research; Canada, India, Japan and the United Stateshave joint research programmes addressing methane hydrates as both a bio-hazard and a potential energy source. Pilot projects in the Arctic and in deepwater
196 RESOURCES TO RESERVES
offshore areaswill provide a better understandingofwhat is involved in developingcommercial projects. In2006, theUS Inter-agencyprogramme (described inBox6.4)suggested a roadmap formethane hydrate research and development.
Box 6.4 • Inter-agency activity on gas hydrate research and developmentin the United States
In 2006, the USDOE publishedAn Inter-agency Roadmap for Methane Hydrate Research andDevelopment (USDOE,2006;NRC,2004).This roadmapwastheresultof jointefforts involving:theDepartmentof the Interior; theUSGeological Survey; theUSMineralManagement Service;the Bureau of LandManagement; theDepartment of DefenseNaval Research Laboratory; theDepartment of Commerce; the National Oceanic and Atmospheric Administration; and theNational Science Foundation. This roadmap is essentially an action plan to determine thepotential of methane hydrates as a source of energy supply. It sets out to clarify importantquestions in hydrate research, such as seabed stability, drilling safety and the environmentalissues associated with naturally occurringmethane hydrates.
According to the roadmap, significant challenges for research are to:
■ assess the scale of the potentially recoverable share of the resource in place, particularly inthemarine environment;
■ identify a provenmeans of remotely detecting and appraisingmarine accumulations;
■ conduct a long-term test of a proposed hydrate production technology;
■ understand the role that methane hydrates play in the global carbon cycle, in the evolutionof the sea floor or in global climatemore generally.
The inter-agency publication outlines a programme designed to develop a comprehensiveknowledge base and suite of tools/technologies that will, by 2015:
■ demonstrate viable technologies toassessandmitigate the environmental impact related tohydrate destabilisation that results from ongoing conventional oil and gas exploration andproduction activities;
■ document the risks and demonstrate viable mitigation strategies related to safe drilling inhydrate-bearing areas;
■ demonstrate the technical and financial viability of methane recovery from Arctic hydrateformations.
By 2025, the objectives of the programme are to:
■ demonstrate the technical and financial viability ofmethane recovery fromdomesticmarinehydrate;
■ document the potential for, and impact of, natural hydrate degassing (dissociation into gasandwater by natural changes in pressure/temperature) on the environment;
■ assess the potential to further extend marine hydrate recoverability beyond the initialproducible areas.
The United States National Academy of Sciences administers an academic researchprogramme to support efforts to meet the challenges set out in the roadmap.
CHAPTER 6 • THE UNCONVENTIONAL GAS REVOLUTION 197
References
ALL Consulting (2003), Handbook on Coal Bed Methane Produce Water:Management and Beneficial Use Alternatives, ALL Consulting, Tulsa, Oklahoma,www.all-llc.com/publicdownloads/CBM_BU_Screen.pdf.
API (American Petroleum Institute) (2010), Water Management Associated withHydraulic Fracturing, API Guidance Document HF2, API, Washington, DC.
Boswell, R. and T. Collett (2006), “The Gas Hydrates Resource Pyramid”, Fire inthe Ice, Vol. 6, No. 3, US Department of Energy/National Energy TechnologyLaboratory, Washington DC, pp. 5-7.
Collett, T.S., W.F. Agena, M.W. Lee, M.V. Zyrianova, K.J. Bird, T.C. Charpentier, T.Cook,D.W.Houseknect, T.R. Klett, R.M. Pollastro andC.J. Schenk (2008),Assessmentof Gas Hydrate Resources on the North Slope, Alaska, 2008, US Geological SurveyFact Sheet 2008-3073, Washington, DC.
Dickens, G.R., J.R. O’Neil, D.K. Rea and R.M. Owen (1995), “Dissociation of OceanicMethane Hydrate as a Cause of the Carbon Isotope Excursion at the End of thePaleocene”,Paleoceanography,Vol.10,No.6,AmericanGeophysicalUnion,Washington,DC, pp. 965-971, http://shadow.eas.gatech.edu/~jean/paleo/Dickens_1995.pdf.
Grover, T. (2008), “Analysis of Reservoir Performance of the Messoyakha GasHydrate Reservoir”, paper presented at the Society of Petroleum EngineersAnnual Technical Conference and Exhibition, Denver, 21-24 September.
Huang, S.C. (2010), Great Potential for CBM/CMM Recovery and Utilization andPreferential Policies, presentation at Methane to Markets Partnership Expo,New Delhi, 2-5 March, www.globalmethane.org/expo_docs/india10/postexpo/coal_shengchu.pdf.
Hyndman, R.D. and S.R. Dallimore (2001), “Natural Gas Hydrate Studies in Canada”,CSEG Recorder, Vol. 26, No. 5, Canadian Society of Exploration Geophysicists,Calgary, pp. 11-20, May, http://209.91.124.56/publications/recorder/2001/05may/may01-natural-gas.pdf.
IEA (International Energy Agency) (2009), World Energy Outlook 2009, OECD/IEA,Paris.
IEA (2012), Golden Rules for a Golden Age of Gas, OECD/IEA, Paris.
Klauda, J.B and S.I. Sandler (2005), “Global Distribution of Methane Hydrate inOcean Sediment”, Energy & Fuels, Vol. 19, No. 2, American Chemical Society,Washington, DC, pp. 459-470.
Koperna, G.J., A.Y. Oudinot, G.R.McColpin, N. Liu, J.E. Heath, A.Wells andG.B. Young(2009), “CO2-ECBM/Storage Activities at the San Juan Basin’s Pump Canyon TestSite”, paper presented at the Society of Petroleum Engineers Annual TechnicalConference and Exhibition, New Orleans, 4-7 October.
198 RESOURCES TO RESERVES
Natural Gas Asia (2011), China to Double CBM Production, www.naturalgasasia.com/china-double-cbm-production.
NPC (National Petroleum Council) (2003), Balancing Natural Gas Policy: Fuelingthe Demands of a Growing Economy, Volume IV, Figure S5-7, NPC, Washington,DC, www.npc.org/reports/ng.html.
NPC (2007), Facing theHard Truths about Energy–AComprehensive View to 2030of Global Oil and Natural Gas, NPC, Washington, DC, www.npchardtruthsreport.org.
NRC (National Research Council) (2004), Charting the Future of Methane HydrateResearch in the United States, NRC, Washington, DC, www.nap.edu/catalog.php?record_id=11094#orgs.
Osadetz K.G., S. Dallimore, R. Hyndman, D. Mosher, F. Wright, M. Riedel, S.Hancock, T. Okazawa, (2006), Gas Hydrates – Fuel of the Future: Characteristics,Occurrences, Significance and Resource Potential, Natural Resources Canada,Ottawa, www.neb-one.gc.ca/clf-nsi/rnrgynfmtn/nrgyrprt/nrgyftr/cnslttnrnd1/prsnttn/kirk_osadetz.pdf.
Schulz, H.-M., B. Horsfield and R.F. Sachsenhofer (2010), Gas shales in Europe:A regional overview and current research activities, Proceedings of the 7thPetroleum Geology Conference, Geological Society, London, pp. 1079-1085.
Thomas, B. (2008), “Researchers Extract Methane Gas from Under Permafrost”,Northern News Services Online, Northern News Services Limited, Yellowknife,Canada,www.nnsl.com/northern-news-services/stories/papers/mar31_08ma.html.
USDOE (United States Department of Energy) (2003), “Coalbed Natural GasResources and Produced Water Management Issues”, in Eye on Environment,Vol. 8, No. 2, Office of Fossil Energy, United States Department of Energy,Washington, DC.
USDOE (2006), An Interagency Roadmap for Methane Hydrate Research andDevelopment, Office of Fossil Energy, United State Department of Energy,Washington DC, www.fe.doe.gov/programs/oilgas/publications/methane_hydrates/mh_interagency_plan.pdf.
USDOE/NETL (2008), The National Methane Hydrates R&D Program, Office ofFossil Energy, US Department of Energy,www.netl.doe.gov/technologies/oil-gas/futuresupply/methanehydrates/maincontent.htm.
USEIA (United States Energy Information Agency) (2012), Annual Energy Outlook2012, EIA, Washington, DC.
USGS (United States Geological Survey) (2010), Overview, US Geological Survey,Washington, DC, http://energy.usgs.gov/other/gashydrates/.
Weitang, F. (2003), Outlook for China’s Coal Mine Methane Reduction Mitigation,Proceedings of the 3rd International Methane and Nitrous Oxide MitigationConference, Kunlun Hotel, Beijing, 17-21 November.

CHAPTER 6 • THE UNCONVENTIONAL GAS REVOLUTION 199
WGA (Western Governors’ Association) (2006), Coal Bed Methane: BestManagement Practices – A Handbook, WGA, Denver, www.blm.gov/pgdata/etc/medialib/blm/wo/MINERALS__REALTY__AND_RESOURCE_PROTECTION_/energy/oil_and_gas.Par.1132.File.dat/CoalBedMethane_WGA_2006.pdf.
Yamamoto K. and S. Dallimore (2008), “Aurora-JOGMEC-NRCan Mallik 2006-2008Gas Hydrate Research Project Progress”, Fire in the Ice, Vol. 8, No. 3, United StatesDepartment of Energy/National Energy Technology Laboratory, Washington, DC,www.netl.doe.gov/technologies/oil-gas/publications/Hydrates/Newsletter/HMNewsSummer08.pdf#Page=1.
Zhou F., Zhang B.S. and Gong X.M. (2011), “China Existing Coal Bed MethanePower Generation Technologies and Its Development Trend,” paper presented atthe International Conference onMaterials for Renewable Energy & Environment,Shanghai, 20-22 May, http://ieeexplore.ieee.org/stamp/stamp.jsp?tp=&arnumber=5930674&isnumber=5930519.

CHAPTER 7 • COAL IN THE 21ST CENTURY 201
Chapter 7 • Coal in the 21st century
Coal has long been an essential source of energy worldwide. Though its usedeclined in the developed world over the previous century, in large part becauseof the emergence of oil, coal still provided 27%of total primary energy supply in2010, behind the contribution from oil (32%), but ahead of gas (22%).
Coals are solid, combustible, fossil sediments. They originate predominantlyfrom dead organic plant material that was deposited in a layer of water,protected from biodegradation and oxidation and covered by other sediments.While buried deeper and deeper, organic material is converted to coal byan enrichment of carbon (Pohl, 1992). Though the many shallow seas of theCarboniferous period provided excellent conditions to form thick and extendedcoal layers, coal was formed over nearly all time periods. Essentially, coals arefossil residues of dead biomass.
Types of coal
The various types of coal are usually classified by their rank, volatile matter,energy content, and the composition of their solids and moisture content. Coalrank varies according to the degree of transformation from the original plantsource and may loosely be considered a measure of a coal’s age.
In increasing order of transformation, from low to high rank, there is lignite (orbrown coal), sub-bituminous coal, bituminous coal and anthracite. Coal starts offas peat, often considered to be a precursor of coal. After being subjected for anextensive period of time to temperature and pressure, it is transformed frompeat to lignite. As time passes, lignite increases inmaturity, becomes darker andharder, and is classified as sub-bituminous coal. As this process of transformationcontinues, more chemical and physical changes occur until the coal is classifiedas bituminous coal. Anthracite, a very hard and glossy black coal, is the final stagein this transformation.
The properties of a coal vary with its rank. As its rank increases, so do itsreflectivity, hardness, carbon content and heating value. On the other hand,its oxygen content, moisture content and volatile matter content fall withincreasing rank. Its sulphur, nitrogen and ash content are independent of rank.
Coal rank and contentAmong geoscientists, the classification of coals in terms of vitrinite reflectance1
is standard practice. Vitrinites, along with exinites and inertinites, are the threemain organic components of coals, which, taken together, are referred to asmacerals. Macerals are the organic counterpart to minerals and vary in their
1. The reflectance of individual grains of vitrinite, as measured under a microscope, remains the most definitive measure ofcoal rank.
CHAPTER 7 • COAL IN THE 21ST CENTURY 201

202 RESOURCES TO RESERVES
optical properties (under themicroscope), in hardness and in shape. The vitrinitegroup is glossy, and is the purest andmost consistent component of coal, whichiswhy vitrinite reflectance–or,more precisely, randomvitrinite reflectance – isused as a measure of coal rank.
Carbon content
The carbon content, on a water- and ash-free basis, is between 60% and 70% insoft brown coals. That of anthracite can be as high as 97%. If the carbon contentis higher, it becomes non-combustible graphite, which may be used as cruciblematerial or lubricant.
Calorific value (or heat content)
The calorific value of coals is a measure of the amount of heat released when aunitmass of the solid fuel is burnt completely. Dependingon the country-specificclassification, this measurement is made by using coal that is ash-free, or water-and ash-free. Volatilematter is the gaseous decomposition product of the water-and ash-free substance escaping when heated. It typically includes methane,ethane and carbon dioxide (CO2), and, more rarely, hydrogen (H2) and helium.
Moisture content
Themoisture content of coals plays a role mainly in the classification of lignites.In coals, a distinction is made between surface water, water held by capillaryaction, water held within decomposed organic compounds, and water boundwithin the crystal structure of clays and other minerals.
Ash content
Theashcontent is ameasureof themineral contentof thecoal. Thecompositionmainly depends on the associated rock,2 which mostly consists of sandstones,claystones or carbonates. The ash may also stem from mineral substances(clays and sands) synergetically washed into the peat bogs or from a very lowbiogenic mineral share in some plants (Pohl, 1992; Ruhrkohlen-Handbuch, 1984;and Taylor et al., 1998).
In addition to the parameters discussed above, there is a further subdivisionof coals that relates to their coking properties. Investigations into the cokingproperties are undertaken to provide information about the potential of coalsto produce coke.
Coal classifications
Lignites are generally distinguished by their moisture content and associatedfirmness, as well as by their colour. By contrast, hard coals are classified mainlyby the amount of volatile matter, vitrinite reflectance and energy content, andby their coking properties (Pohl, 1992).
2. Associated rock is the non-combustible main component of the fuel that is referred to in its totality as ash. It occurs bothabove, below and within the coal seams.

CHAPTER 7 • COAL IN THE 21ST CENTURY 203
An overview of common terminologies used for coal classifications and coalrank is presented in Table 7.1. Often the English designations are used at theinternational level, yet small differences in terminology and classification canbe found. For example in Germany, brown coals, which are almost entirelysoft brown coals, may be referred to as “lignite” and domestic hard coals andanthracites as “hard coal”. However, there are no precise international limitvalues to define the demarcation of these two coal groups. This iswhy, in surveysof coal deposits, problems are often encountered on the classification of hardcoals and soft brown coals.
Table 7.1 • Comparison of standard subdivisions and classifications of coal by coal rank
Subdivisionsandclassifications
Increasing coal rank
Internationalconventionalclassification
lignite hard coal
Germany andcountries tothe east
brown coal hard coal anthracite
English-speakingareas lignite sub-bituminous coal bituminous coal anthracite
InternationalClassificationof In-Seam Coals(UNECE, 1998)
lignite sub-bituminous coal bituminous coal anthracite
Commercialclassificationaccording tointended use
steam coal steam coal
coking coal anthracite
PCI coal PCI coal
Note: PCI = pulverised coal injection. PCI coal is used in steel production.
Source: BGR, 2009.
Demand for coal
Coal is by far the most abundant fossil fuel resource worldwide. Recoverablereserves may be found in an estimated 70 countries, with the largest reservesin a small number of them, notably the United States, Russia, China, India andAustralia. In 2010, coal satisfied more than one-quarter of the world’s primaryenergy supply, second only to oil. In the same year, the world was dependent oncoal for more than 40% of its electricity.
Over the past decade, the contribution of coal to total primary energy supplyhas risen faster than any other fuel to meet increasing energy requirements(Figure 7.1).
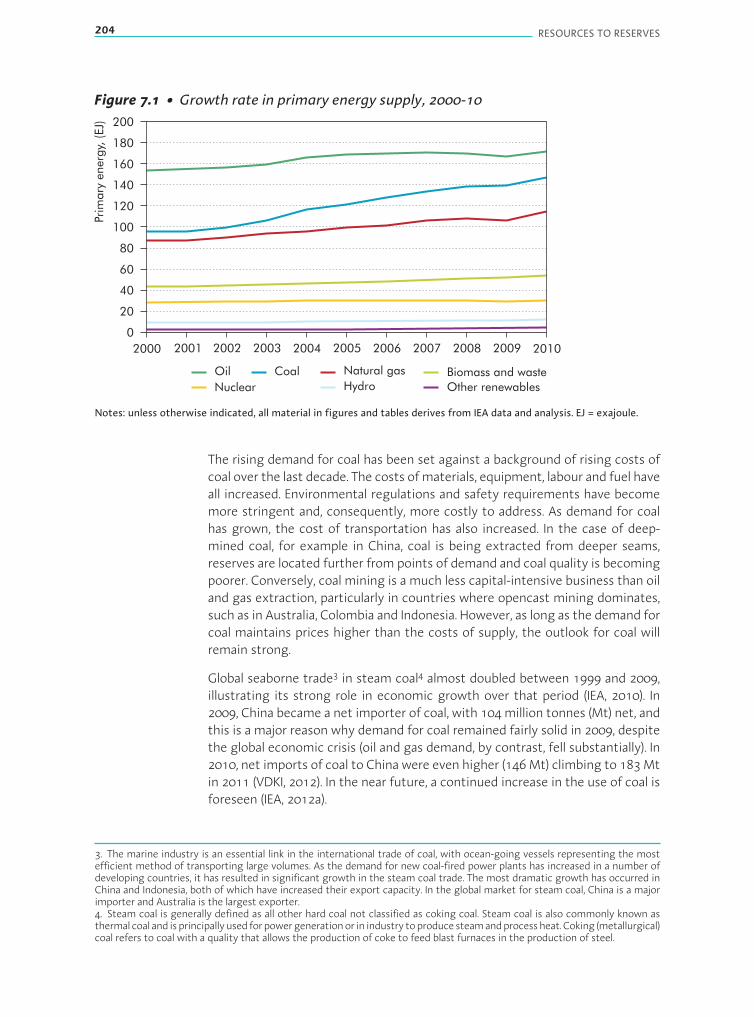
204 RESOURCES TO RESERVES
Figure 7.1 • Growth rate in primary energy supply, 2000-10
0
20
40
60
80
100
120
140
160
180
200
2000 2001 2002 2003 2004 2005 2006 2007 2008 2009 2010
Prim
ary
energ
y,(E
J)
Oil Coal Natural gas Biomass and waste
Nuclear Hydro Other renewables
Notes: unless otherwise indicated, all material in figures and tables derives from IEA data and analysis. EJ = exajoule.
The rising demand for coal has been set against a background of rising costs ofcoal over the last decade. The costs ofmaterials, equipment, labour and fuel haveall increased. Environmental regulations and safety requirements have becomemore stringent and, consequently, more costly to address. As demand for coalhas grown, the cost of transportation has also increased. In the case of deep-mined coal, for example in China, coal is being extracted from deeper seams,reserves are located further from points of demand and coal quality is becomingpoorer. Conversely, coal mining is a much less capital-intensive business than oiland gas extraction, particularly in countries where opencast mining dominates,such as in Australia, Colombia and Indonesia. However, as long as the demand forcoal maintains prices higher than the costs of supply, the outlook for coal willremain strong.
Global seaborne trade3 in steam coal4 almost doubled between 1999 and 2009,illustrating its strong role in economic growth over that period (IEA, 2010). In2009, China became a net importer of coal, with 104million tonnes (Mt) net, andthis is a major reason why demand for coal remained fairly solid in 2009, despitethe global economic crisis (oil and gas demand, by contrast, fell substantially). In2010, net imports of coal to China were even higher (146Mt) climbing to 183Mtin 2011 (VDKI, 2012). In the near future, a continued increase in the use of coal isforeseen (IEA, 2012a).
3. The marine industry is an essential link in the international trade of coal, with ocean-going vessels representing the mostefficient method of transporting large volumes. As the demand for new coal-fired power plants has increased in a number ofdeveloping countries, it has resulted in significant growth in the steam coal trade. The most dramatic growth has occurred inChina and Indonesia, both of which have increased their export capacity. In the global market for steam coal, China is a majorimporter and Australia is the largest exporter.4. Steam coal is generally defined as all other hard coal not classified as coking coal. Steam coal is also commonly known asthermalcoal and isprincipallyused forpowergenerationor in industry toproducesteamandprocessheat.Coking (metallurgical)coal refers to coal with a quality that allows the production of coke to feed blast furnaces in the production of steel.
CHAPTER 7 • COAL IN THE 21ST CENTURY 205
However, the scenarios addressed in the IEA Energy Technology Perspectives2012 demonstrate the critical influence of government policies, especially thoserelated to climate change, on coal demand to 2050 (IEA, 2012b). Demand couldmore than double in a “business as usual” scenario or be reduced by 40% ifsustainable energy solutions were pursued with increased vigour.
Classification of traded hard coals
Trade in hard coals usually distinguishes between steam coals, coking coals andPCI coals. Anthracites are only rarely listed separately and are mostly containedin the statistics for steam coals.
Steam coalsThe dominant quality parameter for steam coals is calorific value. Imported coalsthat are used in power plantsmust, dependingon their provenance,meet variousminimum requirements for calorific value, usually at least 5 750 kilocalories perkilogram or 24.07 megajoules per kilogram. Their volatile matter mostly rangesbetween 10% and 40%, while maximum ash and total moisture contentsmust not exceed 15%. A further very important parameter is sulphur content,especially for power plants without flue-gas desulphurisation systems. Here, therequirement is a maximum of 1% sulphur.
Coking coalsUnlike steam coals, coking coals must meet much higher-quality requirements.The hard-coking coals used in coke ovensmust be both low-ash and low-sulphur.For the production of metallurgical coke, coal mixtures with an ash content ofmaximum 8%, and of maximum 1% sulphur, are used (Ritschel and Schiffer,2005). The share of volatile matter is usually 20% to 30%. In addition, the coalsmust have strong caking properties.
PCI coalsPCIcoalsare increasinglybeingusedasasubstitute forheavyoil andmetallurgicalcoke for pig-iron production in blast furnaces. Suitable PCI coals include alllow-sulphur and low-ash anthracites, but also highly volatile steam and semi-soft coking coals. An ash content usually below 7% air-dried (ad) is required,together with a total moisture content of less than 10% ad, and a low alkali andphosphorus content (Ritschel and Schiffer, 2005).
AnthraciteAnthracite is employed mainly as a high-quality fuel in power generation, butalso in the cement industry, in metallurgy (as sintering coal) and as a PCI coal.Very low-ash anthracites are used in the manufacture of electrodes.
206 RESOURCES TO RESERVES
Calculating coal deposits
Compared with other raw materials, coal deposits (resources and reserves)can be calculated with relative ease thanks to the simple structure of seamdeposits or stratum of coal to be mined. To make the calculation, it isnecessary to know the area across which coal seams extend, seam thicknessand coal density.
The two most important parameters for establishing the quantity of coalin a deposit are the seam thicknesses and the specific maximum depths ofthe seams. Most countries and most companies have different minimumrequirements5 according to particular mining technology and economicrequirements. Mining technology requirements change much more slowlythan economic requirements. In many European countries, seam thicknessesupwards of 30 centimetres (cm) were included in deposit calculations wellinto the middle of the 20th century and beyond. This is largely because suchthin seams were mineable manually in underground operations. With growingmechanisation underground, seam thickness requirements were extended to60 cm or more and this is reflected in most current deposit calculations. Themaximum depths included in the deposit calculations of coal-rich countriessuch as Russia, Ukraine and the United States are 1 800 m, with most othercountries including only coals at shallower depths in their calculations.
Global surveys of coal deposits and associated difficultiesIn practice, global evaluations of coal reserves and resources often contain gapsor are outdated. The view that coal reserves are sufficient to meet demand formany years, the discovery of large unconventional gas sources and a focus onnatural gas as a substitute for coal in European industrialised countries, havereduced interest in new surveys of coal resources and reserves in the last 10 to15 years.
Data on resources and reserves are usually collated from submissions madeby various associations, geological services, ministries or coal producers. Sincevirtually every country has its own historically developed classifications ofresources, reserves and coal itself, direct cross-border comparability of resourceand reserve quantities is rarely possible. Country- or basin-specific explorationrequirements and differences in valuation parameters with differing limit values(for example as regards the included minimum seam/coal thicknesses andmaximum depths) play a key role in the assessment of resources and reserves.Institutions also tend to use data from other sources without sufficientlyquestioning the basis on which they were prepared.
As far back as 1976 (Fettweis, 1976), it was noted that “There is no internationallyrecognised and uniform procedure for recording, classifying and designatingcoal deposits. Instead, we have a plethora of different definitions and methods
5. Ukraine, for example, includes seams of bituminous coals upward of a thickness of 0.5 metres (m) to 0.6 m and down to adepth of 1 800m. In Poland, hard-coal seamsmust be a minimum of 1m thick andmay not be deeper than 1 000m.

CHAPTER 7 • COAL IN THE 21ST CENTURY 207
varying not only from country to country but often even within a nationalsetting and there is confusion to match.” At present, there are more than 150different classifications worldwide, making any correlation of data on resourcesand reserves complicated, if not impossible (Ersoy, 2003). It is important to notethese factors when comparing different estimates of global coal reserves.
Coal extraction
After centuries of mineral exploration, the location, size and characteristics ofthe coal resources of most countries are quite well known. What tends to varymuch more than the assessed level of coal resources, however, is the provenrecoverable reserves that are economically extractable with today’s technology.
As for oil and gas, coal reserves are discovered through exploration activities. Todevelop an accurate picture of the area, processes are undertaken that, again,broadly mirror those undertaken for oil and gas. A geological map of the area iscreated, geochemical and geophysical surveys are carried out, and exploratoryboreholes are drilled. The coal will be mined if there is enough of it and ofsufficient quality to make it economically recoverable.
The geological characteristics of coal reserves largely determine whether theyare to be extracted by mining. The two primary methods of mining coal aresurface mining and underground mining.
Surface mining
Surfacemining involves removing overburden (earth and rock covering the coal)withheavyearth-movingequipment,suchasdrag-lines,powershovels,excavatorsand loaders. Once exposed, the coal is drilled, fractured and systematicallytransported, using haul trucks or conveyors, to a preparation plant or load-outfacility. Disturbed areas are reclaimed as part of normal mining activities. Afterfinal coal removal, the remaining pits are back-filled with overburden removedat the beginning of the process. When good practice is observed, topsoil isreplaced, vegetation replanted and other improvements made that bring localcommunity and environmental benefits. Figure 7.2 illustrates a typical drag-linesurface mining operation.
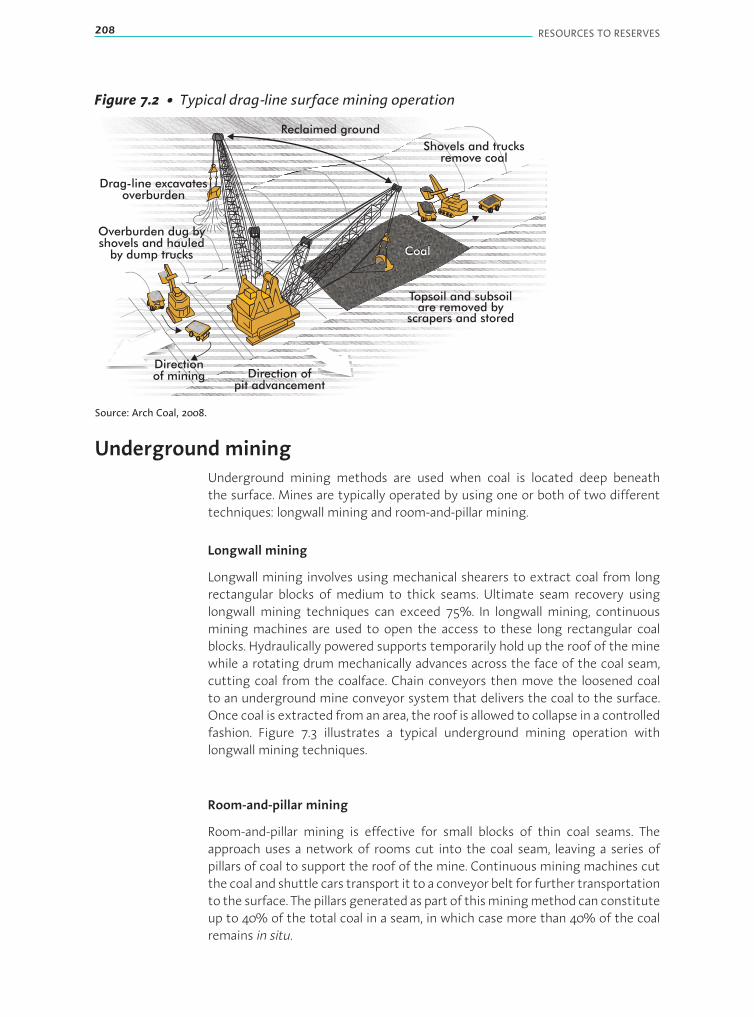
208 RESOURCES TO RESERVES
Figure 7.2 • Typical drag-line surface mining operation
Coal
Directionof mining
Shovels and trucksremove coal
Drag-line excavatesoverburden
Overburden dug byshovels and hauled
by dump trucks
Direction ofpit advancement
Topsoil and subsoilare removed by
scrapers and stored
Reclaimed ground
Source: Arch Coal, 2008.
Underground miningUnderground mining methods are used when coal is located deep beneaththe surface. Mines are typically operated by using one or both of two differenttechniques: longwall mining and room-and-pillar mining.
Longwall mining
Longwall mining involves using mechanical shearers to extract coal from longrectangular blocks of medium to thick seams. Ultimate seam recovery usinglongwall mining techniques can exceed 75%. In longwall mining, continuousmining machines are used to open the access to these long rectangular coalblocks. Hydraulically powered supports temporarily hold up the roof of theminewhile a rotating drum mechanically advances across the face of the coal seam,cutting coal from the coalface. Chain conveyors then move the loosened coalto an underground mine conveyor system that delivers the coal to the surface.Once coal is extracted froman area, the roof is allowed to collapse in a controlledfashion. Figure 7.3 illustrates a typical underground mining operation withlongwall mining techniques.
Room-and-pillar mining
Room-and-pillar mining is effective for small blocks of thin coal seams. Theapproach uses a network of rooms cut into the coal seam, leaving a series ofpillars of coal to support the roof of the mine. Continuous mining machines cutthe coal and shuttle cars transport it to a conveyor belt for further transportationto the surface. Thepillars generated as part of thisminingmethodcan constituteup to 40% of the total coal in a seam, in which case more than 40% of the coalremains in situ.

CHAPTER 7 • COAL IN THE 21ST CENTURY 209
Figure 7.3 • Typical underground longwall mining operation
Coal
Crusher
Pillars support roof
Pillars support roofHydraulic roof
supports
Collapsed roofmaterial
Conveyorbelts
Directionof mining
Source: Arch Coal, 2008.
Higher seam recovery rates can be achieved by using retreat mining, where coalis mined from the pillars as workers retreat. As retreat mining occurs, the roof isallowed to collapse in a controlled fashion. Oncemining in an area is finished, thearea is abandoned and sealed from the rest of the mine. Figure 7.4 illustrates atypical underground mining operation with room-and-pillar mining techniques.
Figure 7.4 • Typical underground room-and-pillar mining operation
Coalpillar
Directionof mining
Roofbolter
Coal
Shuttlecars
Feeder
Conveyor belt
Continuous minerremoves coal, leaving“pillars” that support
the roof
Source: Arch Coal, 2008.
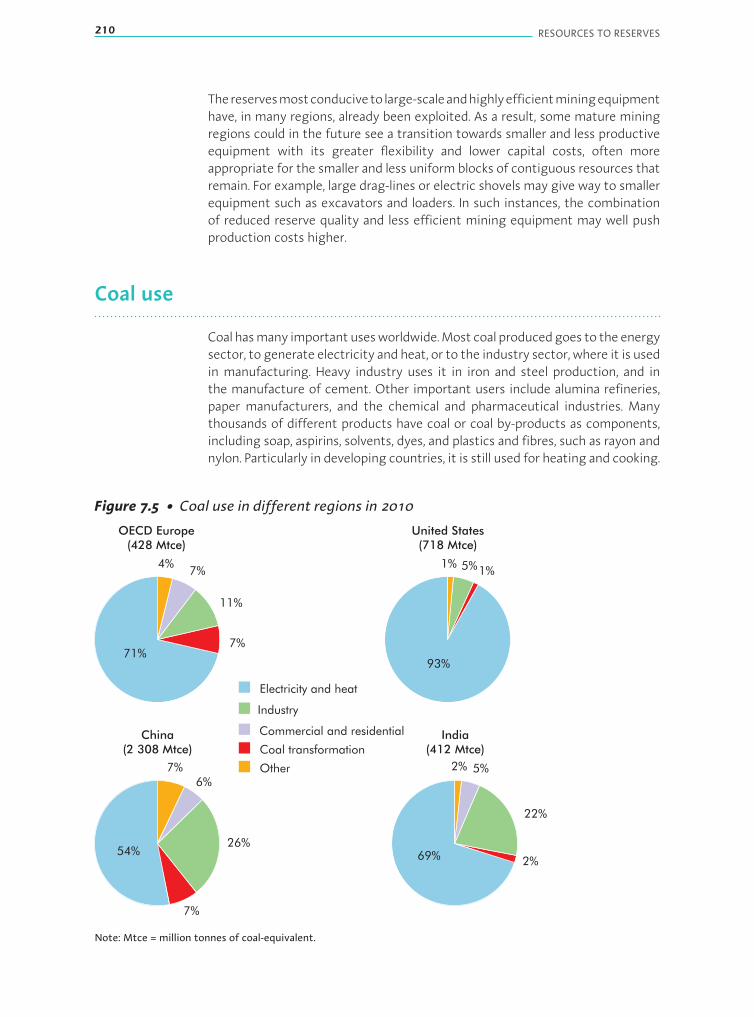
210 RESOURCES TO RESERVES
Thereservesmostconducivetolarge-scaleandhighlyefficientminingequipmenthave, in many regions, already been exploited. As a result, some mature miningregions could in the future see a transition towards smaller and less productiveequipment with its greater flexibility and lower capital costs, often moreappropriate for the smaller and less uniform blocks of contiguous resources thatremain. For example, large drag-lines or electric shovels may give way to smallerequipment such as excavators and loaders. In such instances, the combinationof reduced reserve quality and less efficient mining equipment may well pushproduction costs higher.
Coal use
Coal hasmany importantusesworldwide.Most coal producedgoes to theenergysector, to generate electricity and heat, or to the industry sector, where it is usedin manufacturing. Heavy industry uses it in iron and steel production, and inthe manufacture of cement. Other important users include alumina refineries,paper manufacturers, and the chemical and pharmaceutical industries. Manythousands of different products have coal or coal by-products as components,including soap, aspirins, solvents, dyes, and plastics and fibres, such as rayon andnylon. Particularly in developing countries, it is still used for heating and cooking.
Figure 7.5 • Coal use in different regions in 2010
OECD Europe(428 Mtce)
4%
United States(718 Mtce)
5%1%
China(2 308 Mtce)
7%
India(412 Mtce)
2%
22%
5%2%
1%
Industry
Coal transformation
Commercial and residential
Other
69%
Electricity and heat
93%71%
11%
7%
7%
54%26%
6%
7%
Note: Mtce = million tonnes of coal-equivalent.
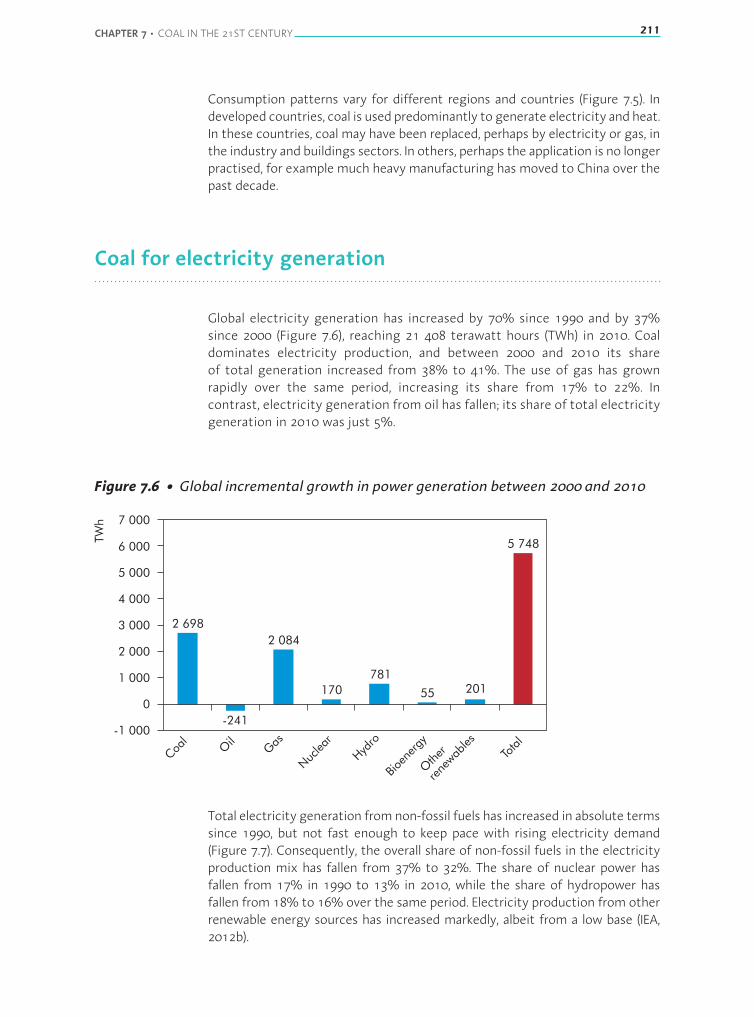
CHAPTER 7 • COAL IN THE 21ST CENTURY 211
Consumption patterns vary for different regions and countries (Figure 7.5). Indeveloped countries, coal is used predominantly to generate electricity and heat.In these countries, coal may have been replaced, perhaps by electricity or gas, inthe industry and buildings sectors. In others, perhaps the application is no longerpractised, for example much heavy manufacturing has moved to China over thepast decade.
Coal for electricity generation
Global electricity generation has increased by 70% since 1990 and by 37%since 2000 (Figure 7.6), reaching 21 408 terawatt hours (TWh) in 2010. Coaldominates electricity production, and between 2000 and 2010 its shareof total generation increased from 38% to 41%. The use of gas has grownrapidly over the same period, increasing its share from 17% to 22%. Incontrast, electricity generation from oil has fallen; its share of total electricitygeneration in 2010 was just 5%.
Figure 7.6 • Global incremental growth in power generation between 2000 and 2010
2 698
-241
2 084
170
781
55 201
5 748
-1 000
0
1 000
2 000
3 000
4 000
5 000
6 000
7 000
Coa
lO
ilGas
Nuc
lear
Hyd
ro
Bioe
nerg
y
Other
rene
wables
Total
TW
h
Total electricity generation fromnon-fossil fuels has increased in absolute termssince 1990, but not fast enough to keep pace with rising electricity demand(Figure 7.7). Consequently, the overall share of non-fossil fuels in the electricityproduction mix has fallen from 37% to 32%. The share of nuclear power hasfallen from 17% in 1990 to 13% in 2010, while the share of hydropower hasfallen from 18% to 16% over the same period. Electricity production from otherrenewable energy sources has increased markedly, albeit from a low base (IEA,2012b).
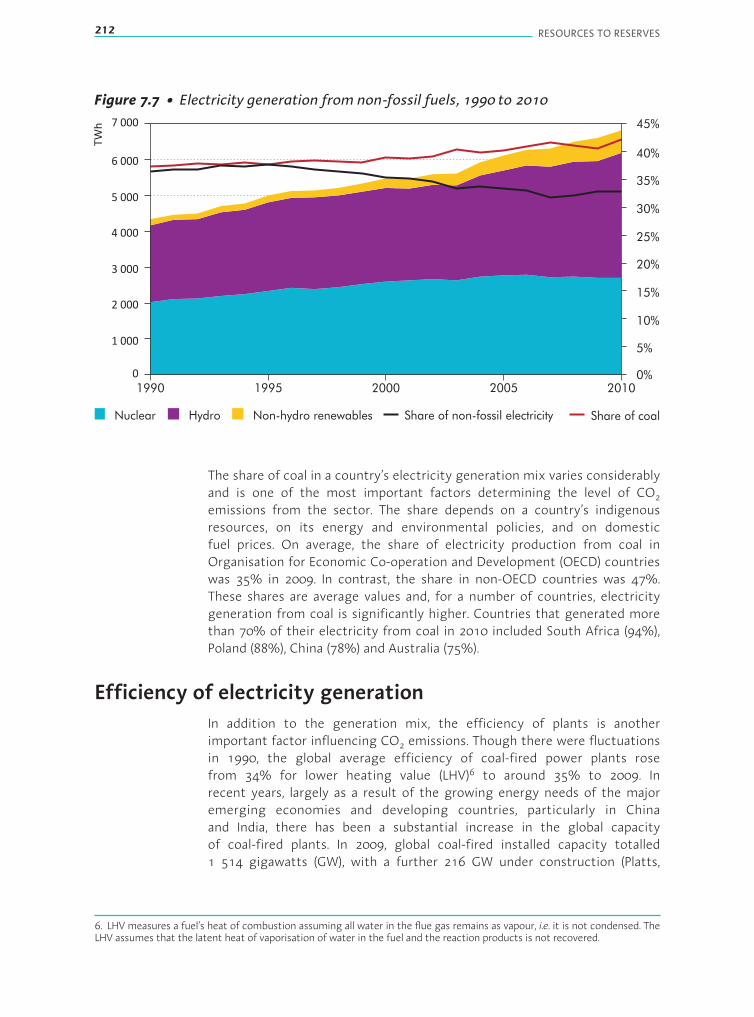
212 RESOURCES TO RESERVES
Figure 7.7 • Electricity generation from non-fossil fuels, 1990 to 2010
0
1 000
2 000
3 000
4 000
5 000
6 000
7 000
1990 1995 2000 2005 2010
TW
h
0%
5%
10%
15%
20%
25%
30%
35%
40%
45%
Non-hydro renewablesHydroNuclear Share of coalShare of non-fossil electricity
The share of coal in a country’s electricity generation mix varies considerablyand is one of the most important factors determining the level of CO2emissions from the sector. The share depends on a country’s indigenousresources, on its energy and environmental policies, and on domesticfuel prices. On average, the share of electricity production from coal inOrganisation for Economic Co-operation and Development (OECD) countrieswas 35% in 2009. In contrast, the share in non-OECD countries was 47%.These shares are average values and, for a number of countries, electricitygeneration from coal is significantly higher. Countries that generated morethan 70% of their electricity from coal in 2010 included South Africa (94%),Poland (88%), China (78%) and Australia (75%).
Efficiency of electricity generationIn addition to the generation mix, the efficiency of plants is anotherimportant factor influencing CO2 emissions. Though there were fluctuationsin 1990, the global average efficiency of coal-fired power plants rosefrom 34% for lower heating value (LHV)6 to around 35% to 2009. Inrecent years, largely as a result of the growing energy needs of the majoremerging economies and developing countries, particularly in Chinaand India, there has been a substantial increase in the global capacityof coal-fired plants. In 2009, global coal-fired installed capacity totalled1 514 gigawatts (GW), with a further 216 GW under construction (Platts,
6. LHV measures a fuel’s heat of combustion assuming all water in the flue gas remains as vapour, i.e. it is not condensed. TheLHV assumes that the latent heat of vaporisation of water in the fuel and the reaction products is not recovered.

CHAPTER 7 • COAL IN THE 21ST CENTURY 213
2010). Increasingly, newly constructed plants will be based on the latest, mostefficient technology, with more than 80% located in non-OECD countries andover half of them in China. However, construction of small, less efficient units of300 megawatts-electrical (MWe) or less continues; generation from these lessefficient units must reduce dramatically over the next two or three decades ifCO2 emissions are to be effectively addressed (IEA, 2012c).
Coal-fired plants in China
In the last decade there was a move towards more efficient and cleaner coalplants worldwide. New plants consist largely of supercritical (SC) and ultra-supercritical (USC) pulverised coal (PC) technology. The oldest, least efficientplants are being phased out of operation, and remaining inefficient plantsare being systematically upgraded, with ageing components replaced andmore effective operational practices introduced. The majority of coal-firedpower generation capacity in China is less than ten years old, while in theUnited States and Europe, most of the fleet is between 30 and 40 years old.China has been systematically closing down old, inefficient coal-fired plants(with less than 200 GW-electrical capacity) and replacing them with modern,efficient technology. In 2010, for example, more than 16.7 GW small plantswere taken out of operation (Ding, 2011). The introduction of SC and USCunits in the last decade has brought about a rapid modernisation of theChinese coal-fired fleet. In 2010, CO2 emissions from coal-fired generationplants in China (1 076 grams per kilowatt hour [g/kWh]) were higher thanthose in the United States (913 g/kWh) and OECD Europe (1 009 g/kWh).With continued deployment of high-efficiency units, however, the averageefficiency of Chinese coal-fired plants is now likely to outstrip the currentaverage efficiency of plants in many OECD countries.
Coal-fired plants in India
With average CO2 emissions of 1 188 g/kWh, coal-fired power generationplants in India are not particularly efficient. Coal provides almost 70% of India’spower. And, like China, India also has plans to reduce the carbon intensity of itscoal-fired power plants. India has a total coal-fired capacity of 92 GW (2009),over half of which is more than 20 years old. Poor efficiency is blamed on avariety of technical and institutional factors, including: poor quality of coal;poor grid conditions; low plant load factor; degradation due to age; lack ofproper operation and maintenance at plants; ineffective regulations; and lackof incentives to improve efficiency (Chikkatur, 2008). According to Chikkatur,there is ample scope to improve the efficiency of existing power plants by atleast 1 to 2 percentage points. The retrofit of plants built during the last 30years is considered a cost-effective measure to improve operational efficiencyand provide additional capacity (Remme et al., 2011). In its 11th Five-Year Plan(2007-12), India planned to renovate and modernise 26 GW of coal plants anda further 17 GW in its 12th Five-Year Plan (2012-17). In addition, 1.1 GW ofold, inefficient plants has already been retired, with closure of a further 8 GWanticipated over the next ten years (Mathur, 2010).

214 RESOURCES TO RESERVES
Coal-fired capacity in OECD countries
It is expected that, because of ageing plants and higher costs, significant coal-fired capacity will be retired over the next few years in OECD countries. Therelatively stable population and modest economic growth projected for thesecountries suggest a modest growth in demand for electricity. The shortfallresulting from the consequent decrease in coal consumption will be replaced bygas-fired generation, renewable energy and nuclear (IEA, 2012b).
Technologies to improve efficiency of coal-fired plantsThe efficiency of coal-fired plants depends on a range of factors, including thetechnology employed, the type and quality of coal used, and the operatingconditions and practices. Denmark, for example, has some of the most efficientcoal-fired power plants in the world, averaging almost 43% LHV, including a newgeneration of PC combustion SC plants that were introduced in the 1990s.
PC combustion
PC combustion is currently the predominant technology used to generateelectricity from coal. It accounts for more than 97% of the world’s coal-firedcapacity. Most existing plants operate under subcritical7 steam conditions, withthe best examples reaching 39%efficiency. In recent years, a substantial numberof plants employing SC steam conditions have been constructed, which arecapable of reaching significantly higher efficiencies. This has beenmade possiblelargely through progress in materials development. Sufficient confidence inmechanical performance means that plants can now accommodate the higherpressures and temperatures characteristic of SC steam conditions. SC plantsoperate with steam pressures of over 22.1 megapascals (MPa). They are oftensubdivided into two categories, SC and USC depending on the temperatureregime. Though there is no agreed definition, manufacturers usually refer toplants operating with steam temperatures in excess of 600°C (degrees Celsius)as USC. The efficiencies of SC andUSC plants installed in recent years range from42% to 47%, depending on the actual steam values, the quality of the coal andthe ambient conditions.
Further developments in materials are under way, such as in the Europeanpower industry’s COMPTES700 development programme, also supported bythe European Commission. The ambition of the development programme is toraise the main steam temperature and pressure to 700°C and up to 37.5 MPa,with a reheat temperature of 720°C. Another programme, the United StatesDepartment of Energy (US DOE)-led “Advanced Materials for Ultra-SupercriticalBoiler Systems”, aims to raise the main steam temperature to 760°C andpressure up to 37.5 MPa. This requires the use of nickel-based super alloys thatwould offer the potential to raise net efficiencies to 50% and beyond. Thesedevelopments have paved the way for increasing unit capacities, with single
7. The efficiency of a steam cycle is influenced by, among other factors, the pressure and superheat and reheat temperaturesof the steam. SC is a thermodynamic expression where there is no distinction between the liquid and gaseous phases. Water/steam reaches this state at about 22.1 MPa (221 bar) pressure. Above this operating pressure of the steam, the cycle is SC andbelow it, the cycle is sub-critical.
CHAPTER 7 • COAL IN THE 21ST CENTURY 215
units of 1 000 megawatts (MW) now in commercial operation. However, thepotential cost savings arising from the simpler design and reduced fuel usageof supercritical plants are offset by the greater expense of materials, the morecomplex boiler fabrication and the more precise control systems required.
Technologies have been developed to reduce emissions of particulates, sulphurdioxide (SO2) and nitrogen oxides (NOx) from PC combustion plants below themost stringent levels demanded anywhere in the world. These technologies aremature, with a competitivemarket. The levels of emissions in countries aremoreoften a function of the extant legislation and compliance with regulation ratherthan the capabilities of modern pollution control technology.
Fluidised bed combustion
Fluidised bed combustion (FBC) offers an alternative combustion technologyfor generating electricity from coal, albeit more often employed for particularor niche applications. It is a flexible technology that uses effectively low-gradecoals, biomass and general waste. Several hundred FBC plants are in operationworldwide. With the burning coal suspended in an upward flow of combustionair, there are two main technology variants: bubbling fluidised bed combustion(BFBC) and circulating fluidised bed combustion (CFBC), with the latter distinctlymore common for power generation. Both BFBC and CFBC offer the potentialfor integrated in-bed sulphur reduction and, as a result of the lower operatingtemperatures, lower NOx emissions.
Plant sizes are more restricted compared with PC combustion, thoughdevelopments have meant that there are many plants with capacities rangingfrom 250 MWe to 300 MWe in existence. For FBC, plants with a greater unit sizeand with supercritical steam cycles are natural developments. In late 2009, a460-MWe CFBC plant at Lagisza (southern Poland) began commercial operation.In the future, manufacturers hope to scale up designs to offer units within therange 500MWe to 800MWe. China is in the process of building a 600-MWe CFBCboiler as a demonstration project at its Baima power plant in Sichuan Province.
Integrated gasification combined cycle
Integrated gasification combined cycle (IGCC) has inherently lower emissionsof some pollutants than PC combustion, with the potential for high efficiencymirroring that of PC combustion plants. A fuel gas (mainly comprising carbonmonoxide and hydrogen) is generated by partially combusting coal in airor oxygen at elevated pressure. Following cooling, the fuel gas is treated toreduce the concentration of particulates, sulphur and nitrogen compoundsto extremely low levels before it is burnt in the combustion chamber of a gasturbine. Electricity is produced via the combined cycle of gas and steam turbines.Designs offering efficiencies in excess of 50% are achievable.
The 1970s and 1980s saw a surge of interest in the development of IGCC plantsfor power generation, particularly in Europe, Japan and the United States. Ofthe large-scale, coal-based plants that were commissioned in the 1990s, only ahandful continue to operate on a commercial basis, two in Europe two in the

216 RESOURCES TO RESERVES
United States and one in Japan. The net capacity of each is between 250 MWeand 350 MWe, with net efficiencies between 40% and 43%. The lack of uptakeof this technology in the last 15 to 20 years is mostly attributed to its highergeneration costs. Apart from cost, the “cultural” difference between the twotechnologies is also regarded as a factor in its failure to compete with PCcombustion, with IGCCmore closely resembling a chemical plant.
More recently, however, there has been a resurgence of interest in thetechnology. Significant developments are currently under way, notably in China,but also in the United States, Japan and Europe. This is a positive trend given thepotential for the power generation efficiency of an IGCC plant to exceed 50%,its low emissions of some pollutants, the prospect for capture of CO2 emissionsand its flexibility to be used to synthesise substitute transport fuels or a range ofother chemicals. The small number of reference plants, however, underlines theprogress that will need to be made if IGCC is to becomemore widely deployed.
Co-generation
Co-generation, also often referred to as combined heat and power, is thecombined production of heat and power from a single fuel source. Almost anyfuel is suitable, although natural gas and coal currently predominate. By makinguse of both heat and power, co-generation plants generally convert 75% to80% of the fuel source into useful energy, while the most modern plants haveefficiencies of 90% or more. Co-generation is often carried out at an industrialsite, where the heat output may be used for space heating or as process heat.Power requirements are less dependent on grid connection and distribution.
The amount of electricity produced globally from co-generation has beengradually increasing and is now around 2 000 TWhper year or 10%of total globalelectricity production. The amount of heat co-generated is not exactly known,but it is in the range of 5 EJ to 15 EJ per year, which represents an importantshare of industrial, commercial and residential heat supply.
Coal-to-liquids
Converting coal to a liquid fuel in a process referred to as coal liquefaction allowscoal to beused as an alternative to oil. The extent of the activity on coal conversiontechnologies is closely linked to the price of oil. For example, the dramatic increasein the price of crude oil in 2007 and 2008 spurred renewed interest in coal-to-liquids (CTL) technologies. Depending on the geographical location of CTL projects,estimates suggest that CTL plants can operate profitably when oil prices lie in therangeofUSD60 toUSD100per barrel (IEA, 2010). China and theUnited States bothexpress interest in converting CTL as a means of reducing their dependence onimported oil and thereby increasing their energy security. China, in particular, hasbeen active in constructing large-scale CTL plants.
Plants are commercially operating in South Africa and China (World CTLAssociation, 2012). Further projects are planned in Australia, Botswana, China,India, Mongolia, Russia and the United States.

CHAPTER 7 • COAL IN THE 21ST CENTURY 217
There has been extensive developmentwork by the Japanese in the use of Fischer-Tropsch synthesis as part of their effort to stabilise the cost and security of energysupplies, as well as technical advances in South Africa. To convert coal to a liquidfuel, there are twodifferent processes: indirect liquefaction and direct liquefaction.
Indirect liquefactionIndirect liquefaction involves a two-step process. First, the coal is gasified toproduce synthetic gas or “syngas”, a mix of H2 and CO. The synthetic gas, oncecleaned of pollutants, is then converted by Fischer-Tropsch synthesis, usingan iron or cobalt catalyst, to produce liquid hydrocarbon fuels. This two-stepprocess, which was first developed on an industrial scale by Germany duringWorld War II, is used by South Africa’s Sasol to convert domestic coal into morethan 150 000 barrels of oil-equivalent per day of saleable products (Figure 7.8).The current Sasol plants were built with government support in the 1970sand 1980s. Besides conversion to liquid and gaseous fuels, Sasol also produceshigher-value products that include fertilisers, detergents, waxes and plastics.
Figure 7.8 • Indirect coal liquefaction
Catalyst
F-T productseparation and
upgrading
Ultra-cleanliquid fuel
and chemicalfeedstocks
H O2 and
oxygenates
Steam Tail gas
C H
and wax
X YH +CO
syngas
2
O /
steam2
Coal,petcoke,biomass
etc.
S,CO
and ash2
Steam
Electricity
Gasification andgas cleaning
F-T synthesis
Electric powergeneration
Note: F-T = Fischer-Tropsch; CXHY = hydrocarbon products; O2 = oxygen; S = sulphur; H2O = water.
Source: IEA CIAB, 2006.
Direct liquefactionLiquid fuels may also be produced by direct liquefaction (Figure 7.9), in whichcoal reacts directly with H2 in the presence of a catalyst. China is one of a fewcountries pursuing direct liquefaction. The process was adopted by China’sShenhua Group for its CTL plant in the Ordos Basin, located at Erdos (InnerMongolia). Trial operations commenced in 2008 (Shenhua, 2013). The plant

218 RESOURCES TO RESERVES
was designed to produce one Mt of fuel annually. Early in 2009, the companyannounced that, subject to approval from China’s highest economic planningbody, the National Development and ReformCommission (NDRC), it would triplethe capacity of its direct CTL project by 2015, once its technology had testedsound in trial operations.
Figure 7.9 • Direct coal liquefaction
Hydro-treating
unit
Gas recoverytreatment
Refining
GasifierDe-ashed oil
Ash reject
Heavy vacuumgas oil
Diesel fuel
Gasoline
LPG
CH , C H4 2 6
H S, NH ,
CO2 3
2, CO
Make-upH2
RecycledH2
Slurry
Slurry
H-donor
Coal +catalyst
Fractionation
Unconverted coal
Coalconversion
Solventde-ashing
Note: H2S = hydrogen sulphide; NH3 = ammonia; CH4 = methane; C2H6 = ethane; LPG = liquefied petroleum gas.
Source: IEA CIAB, 2006.
At the end of 2008, theNDRC decided to suspend approvals for newCTL projectswith few exceptions until the technology and business procedures were moremature. In March 2011, having passed the environmental impact assessment,approval was received from the Chinese Ministry of Environmental Protectionfor Shenhua to build a second plant, operating at 94 000 barrels per day, togetherwith Sasol in the Ningxia Hui autonomous region, whichwould convert coal intomotor fuel. Construction of the plant, however, will be subject toNDRC approval.
New technologies for CTL
Carbon capture and storage (CCS) is considered important to the future of CTL.The Shenhua Group is developing China’s first CCS project at its Erdos plant.The company has completed a storage trial, having injected 100 tonnes (t) ofCO2 into a saline aquifer 2 000 m below the ground. Significant scaling-up ofits storage operations has been under way (MIT, 2012). With a relatively shortdistance of 17 km between plant and storage location, transport of the CO2 isundertaken by truck.
CHAPTER 7 • COAL IN THE 21ST CENTURY 219
Additional energy and environmental benefits will be obtained if the CO2captured were to be used for enhanced oil recovery (EOR) (see Chapter 2). UsingEOR to store CO2 is considered an attractive CO2 mitigation strategy for use byChina, the United States and other countries in future CTL facilities.
Environmental impact
Reasons for replacing coal as a fuel or for moving manufacturing to a new placeare complex, but one of the major drivers is environmental regulation. The majorchallenges facing coal relate to its environmental impact. Coal contains manyelements bound up within its complex structure, which are released in oneform or another, e.g. during coal combustion. Over many years, highly effectivetechnologies have been developed to tackle the release of pollutants such as SO2,NOX, particulates and trace elements, such asmercury.Many of these technologiesare mature, with a competitive market. The levels of emissions of these pollutantsare more often a function of existing legislation and compliance with regulationrather than the capabilities ofmodern pollution control technology.
Given that its carbon content varies between 60% in lignites to more than 97%in anthracite, coal is a major source of CO2. More than 40% of anthropogenicCO2 emissions result from coal and these emissions are rising. Coal producesalmost three-quarters of the 30% of CO2 that comes from the generation ofelectricity. The reduction of CO2 emissions from electricity generating plantswould have a significant impact on global emissions and, therefore, on climatechange. As large point sources of CO2, coal-fired units are considered to offerhigh potential for CO2 reduction.
From 1990 to 2009, CO2 emissions from global electricity production increasedby 57%. Most of this rise was driven by the increasing use of coal for electricitygeneration. In 2009, coal-firedpowerplants accounted for 73%of total emissionsfrom the power generation sector, up from a share of 66% in 1990. There arevarious means to reduce emissions of CO2 from coal-fired power plants. Apartfrom improved demand-side energy efficiency, which reduces the amount ofelectricity needed, the main options are to:
■ switch to renewable energy technologies or to lower-carbon fuels, such asnatural gas and biomass;
■ use more efficient technology, modernise existing plants, close the mostinefficient ones and continue to develop higher-efficiency conversion processes;
■ use CCS.
CCS from power production has been demonstrated to be technically viable.However, as yet, none of the fully integrated, commercial-scale CCS projects inoperation (described in Chapter 9, Box 9.1) involve captured CO2 from powergeneration.
CTL processes and projects pose significant environmental challenges. The fuelproducts are virtually sulphur-free and emit substantially lower amounts of NOX,
220 RESOURCES TO RESERVES
particulates and CO2. However, when the energy needs for the conversion andrefining processes of CTL are taken into account, CO2 emissions of the CTL fuelcycle are at least double those of conventional petroleum-based fuels (Farrell andBrandt, 2006). The plant-level CO2, which accounts for almost half the emissions,can be offset by usingCCS. The ShenhuaGroup has proven this is technologicallyfeasible in a 100 000 t per year CCS demonstration project (Yi, 2012).
Water consumption is another factor of major environmental importance. Fromcoal extraction to coal conversion, in power generation and emissions reduction,water is an essential component. Ensuring application of good practice andrecycling water where possible is important in all cases.
For coal extraction, depending on whether underground or surface miningis being practised, water is used for coal cutting, coal washing and for dustsuppression. The amount of water consumed in these operations depends ona range of factors, including the mine location, the geology, and the type andcomposition of the coal. As these factors can vary markedly, estimates in theliterature forwater consumption inmining operations and coal washing can alsovary greatly.
The primary issue in coal extraction, however, is water contamination ratherthan consumption. Drainage from mines and mining waste can become acidicand dissolve heavy metals that may be present in the rock and soil. As thesecompounds are carried in the water, in the absence of operational best practicethey can subsequently be absorbed and enter the food chain.
The process of electricity generation from coal is also water-intensive. Between40% and 50% of all water abstracted and used in developed countries is used inthe generation of electricity. Thus, a reliable, abundant and predictable source ofraw water supply to a fossil-fired power plant is a critical factor in site selection.Water is required for various operations, including:
■ boiler make-up water to the water/steam circuit;
■ cooling water for steam turbine condensers;
■ auxiliary plant cooling water;
■ make-up water to flue-gas desulphurisation plant;
■ ash handling and disposal.
As a guide, one megawatt hour (MWh) of electricity generated from coal uses20 litres (l) to 270 l of water at the coal mining stage and an additional 1 200 lto 2 000 l when the energy in the coal is converted to electricity (WEF, 2009).Substantially reducing water consumption in power generation usually leads toan energy penalty, significantly reducing the net efficiency of the plant.
If CCS is applied to the power generation plant, water consumption increasessubstantially. Depending on the technology and themode of CO2 capture, waterconsumption can double.
The amount of water required to operate a coal liquefaction plant is a functionof a number of variables, including the design of the unit, the type of gasifier,

CHAPTER 7 • COAL IN THE 21ST CENTURY 221
the coal properties and the local ambient conditions. For indirect liquefaction,between 5 l and 7 l of water are consumed for each litre of liquid fuel produced(USDOE, 2006). For direct liquefaction, consumption is of the same order. Waterused for cooling that is lost through evaporation tends to be the largest sourceof consumption; use of air cooling instead of water cooling can potentiallyreduce water requirements to less than 1 barrel of water per barrel of Fischer-Tropsch product. Management of water supplies, reuse of effluent, technologiesfor reuse of water and water-loss prevention all play an important part inreducing water demand.
References
Arch Coal (2008), Form 10-K: Annual Report Pursuant to Section 13 or 15(d) ofthe Securities Exchange Act of 1934, US Securities and Exchange Commission,Washington, DC.
BGR (Bundesanstalt für Geowissenschaften und Rohstoffe) (2009), EnergyResources 2009, BGR, Hannover, www.bgr.bund.de/EN/Themen/Energie/Produkte/energyresources_2009.html.
Chikkatur, A. (2008), “A Resource and Technology Assessment of Coal Utilizationin India”, Coal Initiative ReportsWhite Paper Series, Pew Center for Global ClimateChange, Arlington, Virginia.
Ding, Z. (2011), “China’s Energy Policies & Regulations and ImplementationEffect”, presentation at the seminar on Low-Carbon EconomyChallenges and theEurope-China Energy Centre, Brussels, 12 April, http://ec2.rec.org/.
Ersoy, M. (2003), “Worldwide Implementation of United Nations FrameworkClassification onCoal Deposits”, talkwithin the scope of the Regional Seminar onUNFC Application to Energy and Mineral Resources, Moscow, 24-25 April, www.unece.org/energy/se/pdfs/MoscowApr03/ersoy.pdf.
Farrell, A.E. and A.R. Brandt (2006), “Risks of Oil Transition”, EnvironmentalResearch Letters, Vol. 1, No. 1, IOP Publishing, Bristol, United Kingdom.
Fettweis,G.B.L. (1976), “Weltkohlenvorräte” (“WorldCoalReserves”), inDorstewitz,G., M. Liebrucks, H. Reintges, E. Schubert and K. Schwantag (eds.), Bergbau –Rohstoffe– Energie (Mining–Resources–Energy), Vol. 12, Verlag Glückauf, Essen.
IEA (International Energy Agency) (2010), World Energy Outlook 2010, OECD/IEA,Paris.
IEA (2012a),Medium-TermCoalMarket Report, IEA/OECD, Paris.

222 RESOURCES TO RESERVES
IEA (2012b), Energy Technology Perspectives, IEA/OECD, Paris.
IEA (2012c), Technology Roadmap: High-Efficiency, Low-Emissions Coal-FiredPower Generation, OECD/IEA, Paris.
IEA CIAB (IEA Coal Industry Advisory Board) (2006), Coal-to-Liquids: An AlternativeOil Supply?, report from IEA CIABworkshop, Paris, 2 November, www.iea.org/ciab/papers/workshop.report-nov06.pdf.
Mathur, N. (2010), “Overview of Indian Power Sector”, presentation at a joint IEA-India Workshop on Industrial Energy Efficiency, New Delhi, 27 January.
MIT (Massachusetts Institute of Technology) (2012), Ordos Fact Sheet: CarbonDioxide Capture and Storage Project, http://sequestration.mit.edu/tools/projects/ordos.html, accessed 29 January 2013.
Platts (2010),World Electric Power Plants Database, Platts, New York, www.platts.com/Products/worldelectricpowerplantsdatabase, accessed 16 September 2010.
Pohl, W. (1992), “Eine Einführung in die Wissenschaft von den mineralischenBodenschätzen” (“An Introduction to the Science of Mineral Resources”), W. &W. E. Petrascheck´s Lagerstättenlehre (Economic Geology), E. Schweitzerbart´scheVerlagsbuchhandlung, Stuttgart.
Remme, U., N. Trudeau, D. Graczyk and P. Taylor (2011), Technology DevelopmentProspects for the Indian Power Sector, Information Paper, IEA/OECD, Paris.
Ritschel, W. and H.-W. Schiffer (2005),WorldMarket forHardCoal. RWE, Essen andCologne.
Ruhrkohlen-Handbuch (1984), 6th ed. Ruhrkohle AG., Verlag Glückauf, Essen.
Shenhua (China Shenhua Coal to Liquid and Chemical Company Limited) (2013),CTL Plant, Ordos Basin, Erdos, InnerMongolia, www.csclc.com.cn/ens/index.shtml,accessed 29 January 2013.
Taylor, G.H., M. Teichmuller, A. Davis, C.F.K. Diessel, R. Littke, P. Robert (1998),Organic Petrology, Gebruder Borntraeger, Berlin.
UNECE (United Nations Economic Commission for Europe) (1998), “InternationalClassification of in-Seam Coals”, Energy, Vol 19, Geneva, www.unece.org/fileadmin/DAM/energy/se/pdfs/inseamcoal.pdf.
USDOE (United States Department of Energy) (2006), Energy Demands onWaterResources, Report to Congress on the Interdependency of Energy and Water,Washington DC, December, pp. 80, www.sandia.gov/energy-water/docs/121-RptToCongress-EWwEIAcomments-FINAL.pdf.
VDKI (Verein der Kohlenimporteure) (2012), Annual Report of the German CoalImporters Association, Verein der Kohlenimporteure, Hamburg.
World CTL Association (2012), “Coal to Liquid Fuels”, World CTL Association, Paris,http://world-ctl.com/documentation/coal-to-liquid-fuels.

CHAPTER 7 • COAL IN THE 21ST CENTURY 223
WEF (World Economic Forum) (2009), Thirsty Energy:Water and Energy in the 21stCentury, Energy Vision Update 2009, Geneva, pp. 56, www.weforum.org/reports/WEF_WaterAndEnergy21stCentury_Report.pdf.
Yi, X.Y. (2012), Wu Xiuzhang, Director of the Board Attends the Fifth World CTLConference, China Shenhua Coal to Liquid and Chemical Company Ltd., Beijing,www.csclc.com.cn/ens/xwygg/gsxw/2012-05-30/978.shtml.


CHAPTER 8 • PRODUCTION COSTS OF FOSSIL FUELS 225
Chapter 8 • Production costs of fossil fuels
Converting resources to reserves is closely linked to the cost of productionrelative to the market price. Increases in market price while production costsremain constant will lead to proposals for new projects (greenfield projects) orto newdevelopments, and expansions at sites of existing production (brownfieldprojects) and, therefore, to an increase in reserves. Ifmargins are supportive, thennovel methodologies of extraction will be tested and implemented. As a resultof increasing oil prices over the last eight years, enhanced oil recovery (EOR)projects are being pursued. However, some new projects have been difficult toimplement because of the sharp increase in material costs that have followedgrowing demand. Then, in 2008 and 2009, as a result of the global economiccrisis, many of these projects were delayed, postponed or cancelled as oil pricesdropped. In 2010, economic activity improved, leading once again to a rise inthe price of oil. The investment cycle for coal mines followed a similar pattern.Investments in new projects and expansions boomed as global coal prices rose,only for investment to fall as equipment costs and other capital costs increasedand global coal prices fell, as in late-2011 and 2012.
Fossil fuel prices are difficult to predict and depend on the particular energyscenario adopted. To gain insight into which resource categories may beproduced in the future, this chapter will focus on the cost factor. Examples ofresource categories include coal, conventional oil, light tight oil, conventionalgas and shale gas, among others. The cost factor provides an insight intowhich resource categories need technological advances for production to beviable under various price scenarios. The three energy scenarios used in theInternational Energy Agency (IEA)World EnergyOutlook project different futuresfor extraction and use of oil, gas and coal. For example, in the 450 Scenario(Chapter 1), projections for a low-carbon future mean a reduced demand forfossil fuels, which leads to a lower price and, hence, less investment in newtechnologies and methods for extraction.
The cost of production will have a direct influence on the amount of oil, gas andcoal that may be accessed at any particular time. The impact of carbon pricingwill be greater for coal than for oil and gas, and greater for oil than for gas.Depending on the carbon price, the relative energy mix in the future may beinfluenced; this is further discussed in Chapter 9.
Factors influencing production costs
The different factors influencing production costs are:
■ the resourcecategory tobeexploited,whichdefines thenecessary infrastructureand production processes, e.g. large conventional oilfields (Chapter 2), deepwaterdevelopments (Chapter 4), energy-intensive steam-assisted gravity drainageprocesses for in situoil-sands production (Chapter 5), the highwell costs for tightgas (Chapter 6), the depth and thickness of coal seams or coal-to-liquids (CTL)conversion (Chapter 7);
CHAPTER 8 • PRODUCTION COSTS OF FOSSIL FUELS 225

226 RESOURCES TO RESERVES
■ location of the reservoir, e.g. onshore or near-shore reservoirs versus ultra-deepwater offshore or Arctic fields (Chapter 4) and distance of coal reserves tothe power station or the export terminal (Chapter 7);
■ the evolution of capital costs for upstream and downstream production stages.
To monitor trends in oil prices and costs, the IEA has published annually, since2000, its crude oil import price index and its upstream investment cost index(UICI). Furthermore, a comprehensive assessment of how the capital cost for oilproduction has evolved in recent years is provided by the IHS CERA cost indices(IHS CERA, 2012). The costs for all areas of production, including aggregatedupstream and downstream capital costs, as well as upstream operating costs,almost doubled between 2000 and 2008 because of the high demand for steel,factory space and manpower (Figure 8.1).
Figure 8.1 • UICI and annual inflation rate
0
100
200
300
400
500
600
700
2000 2001 2003 2005 2007 2009 20112002 2004 2006 2008 2010 2012*
Bill
ion
dolla
rs
0
50
100
150
200
250
300
350
Index
(2000=
100)
Upstream investment cost
In nominal terms
Adjusted for upstream cost inflation (USD 2011)
Investment:
IEA crude oil import price
Index (right axis):
* Budgeted spend
Note: the IEA UICI, set at 100 in 2000, measures the change in underlying capital costs for exploration and production. It usesweighted averages to remove the effects of spending on different types and locations of upstream projects.
Source: IEA, 2012.
Exploration (finding), development and operating (lifting) costs depend on thespecific challenges of a particular resource category, and the region and reservesto be developed (Figure 8.2). The future trajectory of these costs will be affectedby two opposing factors:
■ the development and use of new technologies to facilitate access to moreresources and help reduce unit costs;
■ the depletion of basins that increases the effort and expense needed to extractadditional resources.
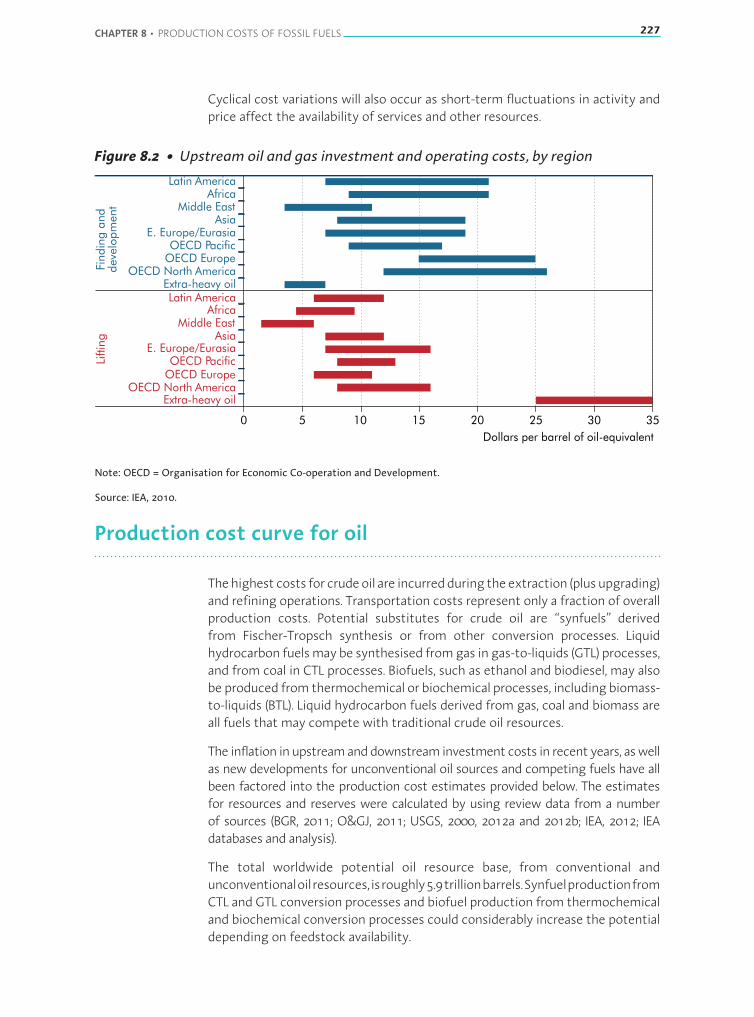
CHAPTER 8 • PRODUCTION COSTS OF FOSSIL FUELS 227
Cyclical cost variations will also occur as short-term fluctuations in activity andprice affect the availability of services and other resources.
Figure 8.2 • Upstream oil and gas investment and operating costs, by region
0 5 10 15 20 25 30 35
Extra-heavy oilOECD North America
OECD EuropeOECD Pacific
E. Europe/EurasiaAsia
Middle EastAfrica
Latin America
Dollars per barrel of oil-equivalent
OECD North AmericaExtra-heavy oil
OECD EuropeOECD Pacific
E. Europe/EurasiaAsia
Middle EastAfrica
Latin America
Find
ing
and
deve
lopm
ent
Lifti
ng
Note: OECD = Organisation for Economic Co-operation and Development.
Source: IEA, 2010.
Production cost curve for oil
Thehighest costs for crudeoil are incurredduring theextraction (plusupgrading)and refining operations. Transportation costs represent only a fraction of overallproduction costs. Potential substitutes for crude oil are “synfuels” derivedfrom Fischer-Tropsch synthesis or from other conversion processes. Liquidhydrocarbon fuelsmay be synthesised fromgas in gas-to-liquids (GTL) processes,and from coal in CTL processes. Biofuels, such as ethanol and biodiesel, may alsobe produced from thermochemical or biochemical processes, including biomass-to-liquids (BTL). Liquid hydrocarbon fuels derived from gas, coal and biomass areall fuels that may compete with traditional crude oil resources.
The inflation inupstreamanddownstream investment costs in recent years, aswellas new developments for unconventional oil sources and competing fuels have allbeen factored into the production cost estimates provided below. The estimatesfor resources and reserves were calculated by using review data from a numberof sources (BGR, 2011; O&GJ, 2011; USGS, 2000, 2012a and 2012b; IEA, 2012; IEAdatabases and analysis).
The total worldwide potential oil resource base, from conventional andunconventionaloilresources,isroughly5.9trillionbarrels.SynfuelproductionfromCTL and GTL conversion processes and biofuel production from thermochemicaland biochemical conversion processes could considerably increase the potentialdepending on feedstock availability.

228 RESOURCES TO RESERVES
Some 1.2 trillion barrels of conventional oil have already been produced, mostlyat a cost of up toUSD30 per barrel (/b). For the remaining technically recoverableresource categories, a number of assumptions were made to estimate thequantity of the resource and the production costs. The resulting estimates forresource quantities and potential production costs are given in Figure 8.3.
Figure 8.3 • Oil production costs for various resource categories
0 0
20 20
40 40
60 60
80 80
100 100
120 120
140 140
0 1 000-1 000 2 000-2 000 3 000 4 000 5 000 6 000
Remaining technically recoverable oil resources (bb)
Pro
duct
ion
cost
(USD
/b)
CTLGTL
Kerogenoil
Ultra-deepwater
LTO
Arctic
Non-CO -EOR2
CO -EOR2
MENAconv. oil
160 160
Otherconventional
oilAlready
produced
BiofuelsSynfuels
Extra-heavy oiland bitumen
Etha
nol-
conv
entio
nal
Etha
nol-
cellu
losi
c
Biodie
sel-
conv
entio
nal
Biodie
sel-
adva
nced
Notes: unless otherwise indicated, allmaterial in figures and tables derives from IEAdata and analysis. CO2= carbondioxide;MENA = Middle East and North Africa. “Other conventional oil” includes deepwater. No carbon pricing included. Synfuelresources are difficult to assess due to competition with other natural gas and coal uses. Biofuels are renewable and, intheory, not resource constrained. Biofuels production costs have been credited with a “refiner’s margin”, using the ratioof gasoline and diesel spot prices in the United States compared to theWest Texas Intermediate crude oil price. The ratiowas, on average, 1.3 for gasoline and 1.35 for diesel between 2007 and 2012.
The horizontal axis shows the cumulative resource quantity of the givenresource category for the production of liquid hydrocarbon final fuel. Note thatfor the competing fuel sources, such cumulative quantities cannot be evaluated;coal and natural gas resources are in plentiful supply and in significant demand,therefore only a fractionwill likely ever be used for CTL, GTL or similar conversionprocesses. Estimates for ethanol and biodiesel are also provided. These last tworesources are replenished after every harvest season and, therefore, the questionis rather how much synfuel can be produced annually without affecting foodproduction and the environment.
The vertical axis shows the range of the potential cost in US dollars per barrelof oil (USD/b) of producing liquid hydrocarbon final fuel from each resourcecategory. At this stage, no additional costs for carbon emissions are considered.
The assumptions for each category that were used to calculate the costs inFigure 8.3 are as follows:
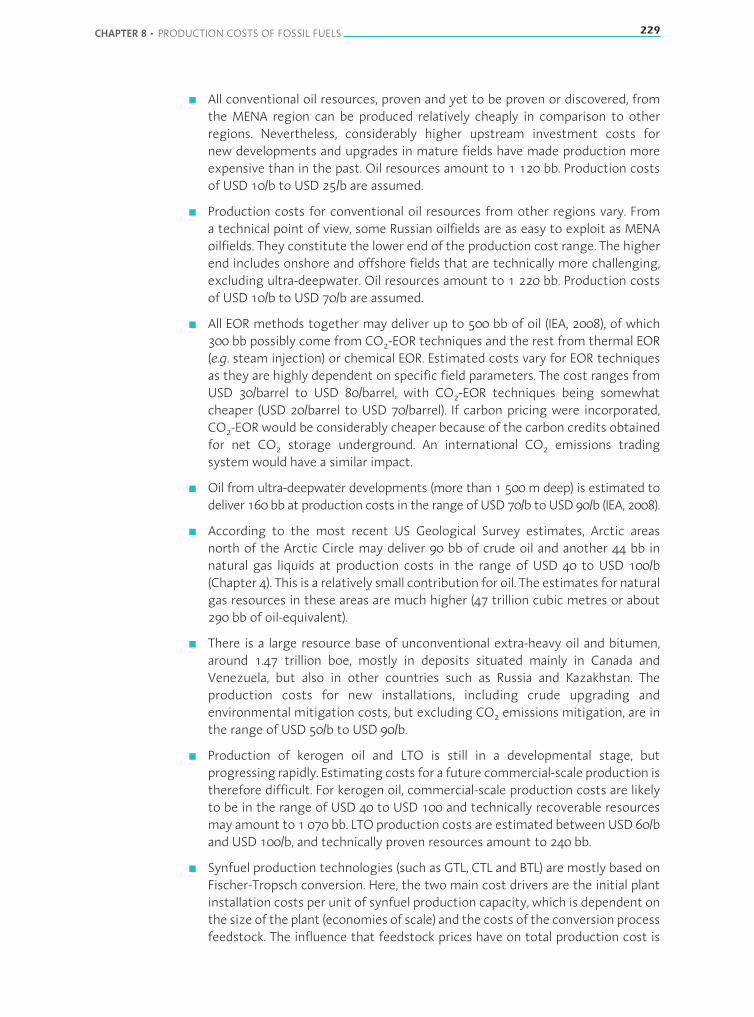
CHAPTER 8 • PRODUCTION COSTS OF FOSSIL FUELS 229
■ All conventional oil resources, proven and yet to be proven or discovered, fromthe MENA region can be produced relatively cheaply in comparison to otherregions. Nevertheless, considerably higher upstream investment costs fornew developments and upgrades in mature fields have made production moreexpensive than in the past. Oil resources amount to 1 120 bb. Production costsof USD 10/b to USD 25/b are assumed.
■ Production costs for conventional oil resources from other regions vary. Froma technical point of view, some Russian oilfields are as easy to exploit as MENAoilfields. They constitute the lower end of the production cost range. The higherend includes onshore and offshore fields that are technically more challenging,excluding ultra-deepwater. Oil resources amount to 1 220 bb. Production costsof USD 10/b to USD 70/b are assumed.
■ All EOR methods together may deliver up to 500 bb of oil (IEA, 2008), of which300 bb possibly come from CO2-EOR techniques and the rest from thermal EOR(e.g. steam injection) or chemical EOR. Estimated costs vary for EOR techniquesas they are highly dependent on specific field parameters. The cost ranges fromUSD 30/barrel to USD 80/barrel, with CO2-EOR techniques being somewhatcheaper (USD 20/barrel to USD 70/barrel). If carbon pricing were incorporated,CO2-EOR would be considerably cheaper because of the carbon credits obtainedfor net CO2 storage underground. An international CO2 emissions tradingsystem would have a similar impact.
■ Oil from ultra-deepwater developments (more than 1 500m deep) is estimated todeliver 160 bb at production costs in the range of USD 70/b toUSD 90/b (IEA, 2008).
■ According to the most recent US Geological Survey estimates, Arctic areasnorth of the Arctic Circle may deliver 90 bb of crude oil and another 44 bb innatural gas liquids at production costs in the range of USD 40 to USD 100/b(Chapter 4). This is a relatively small contribution for oil. The estimates for naturalgas resources in these areas are much higher (47 trillion cubic metres or about290 bb of oil-equivalent).
■ There is a large resource base of unconventional extra-heavy oil and bitumen,around 1.47 trillion boe, mostly in deposits situated mainly in Canada andVenezuela, but also in other countries such as Russia and Kazakhstan. Theproduction costs for new installations, including crude upgrading andenvironmental mitigation costs, but excluding CO2 emissions mitigation, are inthe range of USD 50/b to USD 90/b.
■ Production of kerogen oil and LTO is still in a developmental stage, butprogressing rapidly. Estimating costs for a future commercial-scale production istherefore difficult. For kerogen oil, commercial-scale production costs are likelyto be in the range of USD 40 to USD 100 and technically recoverable resourcesmay amount to 1 070 bb. LTO production costs are estimated betweenUSD 60/band USD 100/b, and technically proven resources amount to 240 bb.
■ Synfuel production technologies (such as GTL, CTL and BTL) are mostly based onFischer-Tropsch conversion. Here, the two main cost drivers are the initial plantinstallation costs per unit of synfuel production capacity, which is dependent onthe size of the plant (economies of scale) and the costs of the conversion processfeedstock. The influence that feedstock prices have on total production cost is

230 RESOURCES TO RESERVES
determined by the plant efficiency, i.e. how much feedstock mass is needed fora unit of synfuel output. Note that synfuel products coming from the Fischer-Tropsch conversion processes are already high-quality final fuels, whereas crudeoil still needs to undergo refining, which incurs further costs. As such, theanalysis should be considered aswell on a source-to-energy basis. The availabilityof the resource for liquid fuel production is constrained not only by the amountof proven resources but especially by the competitionwith other energy sectors,especially the power sector, that may use the gaseous or solid fuel directly. Theresources represented in the supply curve are therefore only representative,even though resource estimates are discussed in the following paragraphs.
■ GTL plant installation costs have increased in line with a general increase inupstream investment from around USD 30 000 per barrel per day (/b/d) ofproduction capacity in 2005 to an estimatedUSD80 000/b/d by 2010. In addition,there has been a sharp increase in the prices of natural gas over the past fewyears. These trends have been responsible for a significant increase in the cost ofGTL production. The total production cost for GTL can varywidely. The feedstockmay be stranded gas for which there are no financially viable options fortransportation to markets, and the gas value is roughly equal to its productioncost. Or the feedstock has to be bought on the regular gas market for a muchhigher price. For new plants, GTL costs range from USD 60/boe of synfuel forstranded gas to USD 105/boe for natural gas at market price. Up to 1 700 billionboe of final fuel could come from GTL if about 20% of the global natural gasresources were used as feedstock.
■ CTL plant installation costs have also increased, and are now USD 85 000/b/d fora 50 000 b/d CTL plant. Coal prices increased sharply during 2007 and early 2008.Again, these trends were responsible for a sharp increase in CTL productioncosts. The total CTL production cost can vary widely as the feedstock could becheap stranded coal (e.g. where there is no other market for the coal and henceits value is the same as the extraction cost) or, conversely, the coal could bepurchased at a much higher global market price. It is estimated that CTL costsare in the range of USD 45/boe of synfuel for stranded coal to USD 105/boe forcoal at amarket price of USD 135 per tonne (/t) of hard coal. Up to 4.5 trillion boeof final fuel could come from CTL if about 10% of global hard coal and ligniteresources were used as feedstock.
■ The other categories, i.e. biofuels, ethanol and biodiesel, are included forcomparison. These renewable and, therefore, “infinite” resources are technicallyonly limited by land availability and climate conditions. Unlike oil-based fuels,biofuels are final fuels that do not need further refining. To aid comparison withproduction fromoil resources, these costswere creditedwith a “refiner’smargin”,based on the average ratio of gasoline and diesel spot prices to the West TexasIntermediate crude oil price in the United States between 2007 and 2012.
The lower value of the cost range for many of the more complex sources isquite similar. This suggests that, at an oil price that would allow a productioncost of about USD 50/b to USD 60/b, the most profitable projects of almostall the unconventional resources become feasible. This is important becausesuch developments help to identify areas where costs can be reduced, which iscurrently the case.
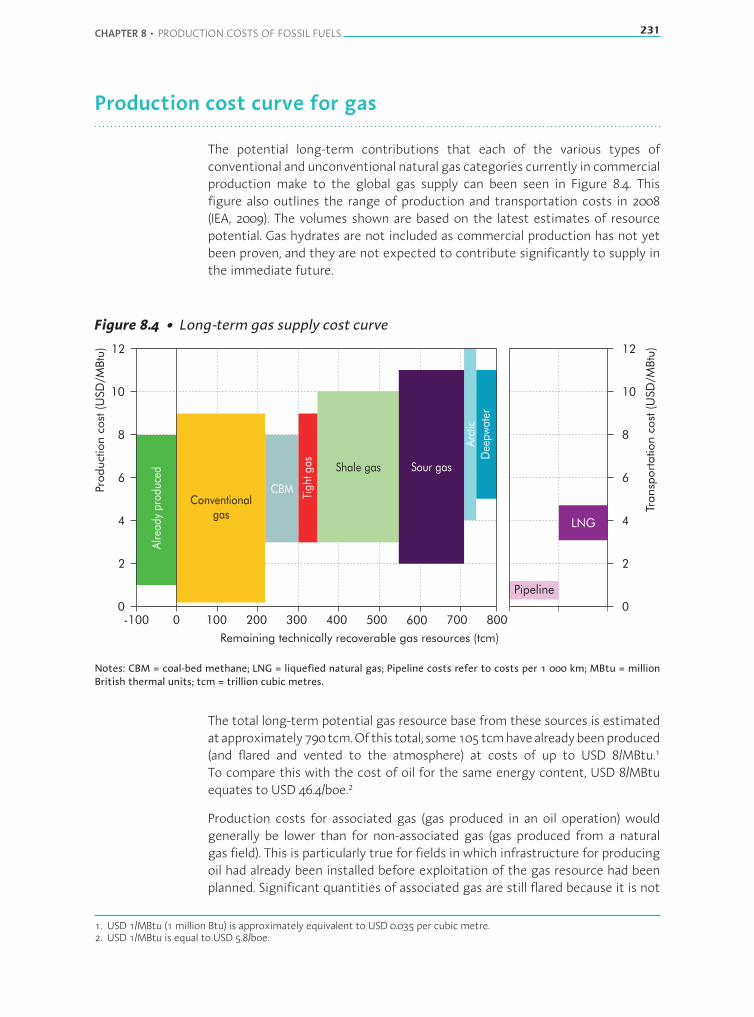
CHAPTER 8 • PRODUCTION COSTS OF FOSSIL FUELS 231
Production cost curve for gas
The potential long-term contributions that each of the various types ofconventional and unconventional natural gas categories currently in commercialproduction make to the global gas supply can been seen in Figure 8.4. Thisfigure also outlines the range of production and transportation costs in 2008(IEA, 2009). The volumes shown are based on the latest estimates of resourcepotential. Gas hydrates are not included as commercial production has not yetbeen proven, and they are not expected to contribute significantly to supply inthe immediate future.
Figure 8.4 • Long-term gas supply cost curve
Remaining technically recoverable gas resources (tcm)
0 0
2 2
4 4
6 6
8 8
10 10
12 12
0 100-100 200 300 400 500 600 700 800
Pro
duct
ion
cost
(USD
/MBtu
)
Dee
pw
ate
r
Arc
ticSour gasShale gas
CBM
Tight
gas
Conventionalgas
Alr
eady
pro
duc
ed
Transp
ort
ation
cost
(USD
/MBtu
)
Pipeline
LNG
Notes: CBM = coal-bed methane; LNG = liquefied natural gas; Pipeline costs refer to costs per 1 000 km; MBtu = millionBritish thermal units; tcm = trillion cubic metres.
The total long-term potential gas resource base from these sources is estimatedatapproximately790tcm.Ofthis total, some105tcmhavealreadybeenproduced(and flared and vented to the atmosphere) at costs of up to USD 8/MBtu.1
To compare this with the cost of oil for the same energy content, USD 8/MBtuequates to USD 46.4/boe.2
Production costs for associated gas (gas produced in an oil operation) wouldgenerally be lower than for non-associated gas (gas produced from a naturalgas field). This is particularly true for fields in which infrastructure for producingoil had already been installed before exploitation of the gas resource had beenplanned. Significant quantities of associated gas are still flared because it is not
1. USD 1/MBtu (1 million Btu) is approximately equivalent to USD 0.035 per cubic metre.2. USD 1/MBtu is equal to USD 5.8/boe.

232 RESOURCES TO RESERVES
currently worth treating and transporting the gas to market. More than 1.5 tcmhas been flared worldwide in the last decade alone, equal to more than 5% ofmarketed production.
Themost easily accessible part of the remaining conventional resources amountsto about 220 tcm, with typical production costs between USD 0.20/MBtu andUSD 9/MBtu. Other conventional resources include sour gas and gas producedfromtheArctic or fromdeepwater. Sour gas resources,withhigh concentrationsof hydrogen sulphide (H2S) or CO2 total some 160 tcm and could be producedat costs between USD 2/MBtu and USD 11/MBtu. Resources in the Arctic Circlecould amount to 30 tcm, at costs between USD 4/MBtu and USD 12/MBtu, whiledeepwater resources of 50 tcm could be produced at costs ranging from USD5/MBtu to USD 11/MBtu. Unconventional resources totalling 330 tcm (including80 tcm tight gas, 200 tcm shale gas and 50 tcmCBM) could be produced at costsbetween USD 3/MBtu and USD 10/MBtu.
An essential cost factor for gas is transportation. For pipelines, the transportationcostsareUSD0.30/MBtutoUSD1.20/MBtuper1000kilometresofpipeline, varyingfor onshore and offshore segments and according to pipe capacity and age ofinstallation. For LNG, total costs for liquefaction, transportation and regasificationvary fromUSD3.10/MBtu toUSD4.70/MBtu, dependingon the installation size andthe transportation distances involved. So the production and transportation costsshould be added to the total cost at themarket location (Figure 8.4).
Production cost curve for coal
The quality and frequency of collecting data on coal reserves vary widely fromcountry to country. Estimated costs for coal reserves where extraction isfinancially viable are often not tracked or researched, or are unavailable, partly asa consequence of commercial confidentiality.
There is currently no complete study that includes a supply-based cost curve ofproduction costs for global hard coal reserves. Extensive research for Australianand South African reserves was carried out by Schulz and published in twoarticles almost 30 years ago (Schulz, 1984). This author examined the productioncost curve for export-oriented thermal coal on an FOB (free-on-board) basis.This source is one of the few estimates and still most appropriate basis forestimating a supply cost curve for all hard coal reserves and includes estimatesfor production costs as well as capital costs.
The shape and slope of the supply cost curve shows a large volume range forglobal reserves with a relatively flat slope for global average estimated supplycosts and a sharp increase in costs of the last 10% of reserves (Figure 8.5). Thecurve in Figure 8.5 is extrapolated from Schulz’s supply curve up to the 2011estimate of 728 gigatonnes (Gt) of global hard coal reserves (BGR, 2011). Theintercept and scaling of costs are based on the estimated average country levelof production costs and reported project-based investment costswhen availableas observed from 2009 to 2011. This cost information is also used as an estimate
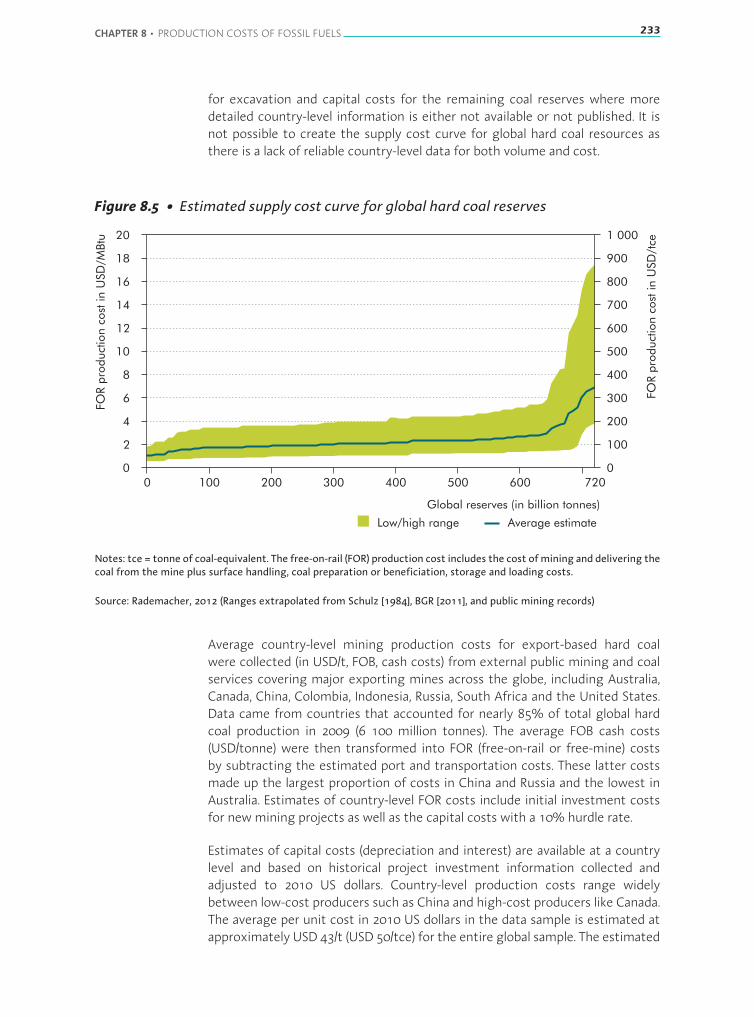
CHAPTER 8 • PRODUCTION COSTS OF FOSSIL FUELS 233
for excavation and capital costs for the remaining coal reserves where moredetailed country-level information is either not available or not published. It isnot possible to create the supply cost curve for global hard coal resources asthere is a lack of reliable country-level data for both volume and cost.
Figure 8.5 • Estimated supply cost curve for global hard coal reserves
FOR
prod
uctio
nco
stin
USD
/MBt
u
FOR
prod
uctio
nco
stin
USD
/tce
Low/high range Average estimate
0 100 200 300 400 500 600 7200
2
4
6
8
10
12
14
16
18
20
Global reserves (in billion tonnes)
0
100
200
300
400
500
600
700
800
900
1 000
Notes: tce = tonne of coal-equivalent. The free-on-rail (FOR) production cost includes the cost ofmining and delivering thecoal from the mine plus surface handling, coal preparation or beneficiation, storage and loading costs.
Source: Rademacher, 2012 (Ranges extrapolated from Schulz [1984], BGR [2011], and public mining records)
Average country-level mining production costs for export-based hard coalwere collected (in USD/t, FOB, cash costs) from external public mining and coalservices covering major exporting mines across the globe, including Australia,Canada, China, Colombia, Indonesia, Russia, South Africa and the United States.Data came from countries that accounted for nearly 85% of total global hardcoal production in 2009 (6 100 million tonnes). The average FOB cash costs(USD/tonne) were then transformed into FOR (free-on-rail or free-mine) costsby subtracting the estimated port and transportation costs. These latter costsmade up the largest proportion of costs in China and Russia and the lowest inAustralia. Estimates of country-level FOR costs include initial investment costsfor newmining projects as well as the capital costs with a 10% hurdle rate.
Estimates of capital costs (depreciation and interest) are available at a countrylevel and based on historical project investment information collected andadjusted to 2010 US dollars. Country-level production costs range widelybetween low-cost producers such as China and high-cost producers like Canada.The average per unit cost in 2010 US dollars in the data sample is estimated atapproximately USD 43/t (USD 50/tce) for the entire global sample. The estimated

234 RESOURCES TO RESERVES
global cost-adjusted supply curve for hard coal reserves results, with the rangedetermined by low-/high-cost producers, are represented in Figure 8.5.
The cost to develop and produce coal from the first 100Gt of global coal reservesis low and estimated in the range of USD 42 to USD 170/tce FOR, equivalent toUSD 0.84/MBtu to USD 3.45/MBtu. Given a current global hard coal productionof 6.0 Gt, this low-cost reserve basis is adequate to cover global demand foralmost 17 years. The expected production costs for the next 500 Gt of reserves,sufficient to cover an additional 83 years at current coal mining levels, risemarginally from USD 71/tce to USD 272/tce FOR (USD 1.42 to USD 5.44/MBtu).Production cost estimates for the last 128 Gt of known hard coal reserves, themost difficult to assess andmost uncertain, rise sharply to a range of USD 71 tceto USD 800+/tce (USD 1.41/MBtu to USD 15+/MBtu). Given the current globalhard coal production, this section of reserves would first be needed in 120+years. The mining and investment cost estimates would be highly subjectiveand dependent on developments in technology, global demand and furthergeological assessments of reserves.
The cost of inland infrastructure for many new undeveloped coal basins andprojects is not included, and this can easily more than double production costsin terms of USD/t FOB depending on location. For example, transportation costscurrentlymakeupover 50%of total cost for someexport coal inChina andRussia.
References
BGR (2011),AnnualReport: Reserves, ResourcesandAvailabilityofEnergyResources2011, DERA Rohstoffinformationen, BGR, Hannover, published February 2012,www.bgr.bund.de/EN/Themen/Energie/Downloads/annual_report_2011_en.pdf?__blob=publicationFile&v=2.
IEA (International Energy Agency) (2008), World Energy Outlook 2008, OECD/IEA,Paris.
IEA (2009),World Energy Outlook 2009, OECD/IEA, Paris.
IEA (2010),World Energy Outlook 2010, OECD/IEA, Paris.
IEA (2012),World Energy Outlook 2012, OECD/IEA, Paris.
IHS CERA (2012),Oil Production Cost Indices, IHS Cera, Englewood, Colorado,www.ihsindexes.com, accessed 9 June.
O&GJ (Oil & Gas Journal) (2011), “Worldwide Look at Reserves and Production”,Oil & Gas Journal, Vol. 109, No. 49, PennWell Corporation, Oklahoma City.
Rademacher M. (2012), personal communication, “R2R - Chapter 8 and UpdatedProduction Cost Curve”, 1 August.

CHAPTER 8 • PRODUCTION COSTS OF FOSSIL FUELS 235
Schulz, W. (1984),”Die langfristige Kostenentwicklung für Steinkohle amWeltmarkt” (“The long-term cost development of hard coal in the globalmarket“), Zeitschrift für Energiewirtschaft, Issues 1 and 2, Springer, Cologne.
USGS (United States Geological Survey) (2000), World Petroleum Assessment2000, USGS, Washington, DC, http://pubs.usgs.gov/fs/fs-062-03/FS-062-03.pdf.
USGS (2012a),VariabilityofDistributionsofWell-ScaleEstimatedUltimateRecoveryfor Continuous (Unconventional) Oil andGas Resources in theUnited States, USGSOil and Gas Assessment Team, Boulder.
USGS (2012b), AnEstimateofUndiscoveredConventionalOil andGasResources oftheWorld, USGS, Boulder.


CHAPTER 9 • MEETING THE ENVIRONMENTAL CHALLENGES 237
Chapter 9 • Meeting the environmental challenges
Though they may bring economic benefits, the production, transportation anduse of oil, gas and coal can have negative impacts on the environment at boththe local and global levels. At the local or regional level, the challenge to theenvironment comes from pollution and potential hazards at the production site.For oil and gas, these may manifest themselves, for example, as crude oil spillsor from accidents with local or regional transportation. Another example is thedamage that can result from coal mining operations, including sometimes thedespoiling of the countryside or the pollution of local water courses due to theleaching of heavy metals from coal spoil heaps.
On a global scale, the challenge to the environment comes from direct andindirect damage caused by the production, transportation and use of fossilfuels. The main concern in virtually all cases comes in the form of emissions ofgreenhouse gases (GHGs), predominantly methane and carbon dioxide (CO2).During the extraction of oil, gas and coal, for example, methane is released,and CO2 emissions occur at oil and natural gas well-heads. Methane leaks fromlong-distance, natural gas pipelines and CO2 is emitted wherever electricity isgenerated from the combustion of coal, gas and oil.
Global increases in the concentrations of CO2 and other GHGs are due primarilyto fossil fuel use, with land-use change (LUC) providing another significant butsmaller contribution. This chapter focuses on the emissions produced by the oil,gas and coal industries, and the cost implications that arise.
Production-related GHG emissions from oil resources
A fraction of total emissions from the use of fossil fuels arises directly fromcrude oil production and the subsequent refining processes needed to turncrude into final fuel products.
An industry survey from the International Association of Oil & Gas Producers(OGP, 2012)1 indicates that around 1.1 gigatonnes (Gt) of CO2 emissions per year(3.5% of total energy-related CO2 emissions worldwide) come from oil and gasproduction and fugitive emissions at the well-head. As the majority of crude oilis still produced from conventional resources, emissions from upgrading crude,which is necessary for unconventional resources such as oil-sands and extra-heavy oil production, currently represent only a small fraction of total emissions.However, if more unconventional resources requiring upgradingwere extracted,the average production of GHG emissions per barrel of oil-equivalent (boe) offinal fuel would increase.
Oil-refining processes accounted for around 728 million tonnes (Mt) of CO2 in2010, which equated to around 2.4% of total energy-related CO2 emissions.
1. The survey includes 32%ofworld oil and gas production (2 221Mt of hydrocarbon production) andwas expanded to a globallevel by assuming that the CO2-equivalent (CO2-eq) emissions from all countries globally were similar.
CHAPTER 9 • MEETING THE ENVIRONMENTAL CHALLENGES 237
238 RESOURCES TO RESERVES
Factors influencing GHG emissions from oil productionThe amount of GHG emissions released during upstream and downstream oilproduction depends primarily on the following factors:
■ energy input from fossil fuels used for oil extraction at the production site;
■ flaring and venting of fugitive GHG emissions at the well-head, where theamount of the well-head fugitive emissions depends on individual reservoircharacteristics;
■ flaring of associated gas at the well-head;
■ emissions from crude oil upgrading (if necessary) and refining, which aredependent on the quality of the recovered crude oil or crude oil substitute,expressed as American Petroleum Institute (API2) gravity.
Conventional crude oil can usually be extracted without substantial energyinput. The technological challenges can nevertheless be high. This is the casefor ultra-deepwater and Arctic oil resources for which more capital- and energy-intensive infrastructure is needed (Chapter 4).
For high-quality crude oil, additional upgrading before the refinery stage isnot necessary. However, significant emissions of CO2 and methane may stemdirectly from the multiphase flow at the well-head. The methane may either be:vented (released as methane to the atmosphere) with the CO2; or flared (burntat the top of flare stack); or, preferably, it may be used to power the energyrequirements of the oil extraction operation.
Comparatively low-quality oil shale and viscous extra-heavy oil and bitumenresources are either mined and processed or heated underground (in situ) tocreate a liquid crude product that can then be extracted from the reservoir. Inaddition, energy-intensive upgrading of extra-heavy oil and bitumen to producea so-called “syncrude” is required. The syncrude is used as a substitute forconventional crude oil in refineries.
The energy intensity of the refining process depends directly on the crude oilquality. Deep conversion processes that are needed for heavy oil (with an APIgravity less than 22.3°) are, for example, considerably more energy-intensive thanconventional distillation processes for light oil (with an API gravity greater than31.1°).
The combined amount of GHG emissions from upstream stages varies widely,depending on the reservoir characteristics, the extraction methods used,i.e. the energy input needed for crude oil extraction, and the treatment offugitive emissions at the well-head. Downstream emissions will hinge on theenergy intensity of the subsequent refining processes and on the need for apossible additional upgrading stage, depending directly on the quality of thecrude oil.
2. API (American Petroleum Institute) gravity is ameasure of the density of oil. The API gravity scale is calibrated such thatmostcrude oils, as well as distillate fuels, will have API gravities between 10° and 70° API. The lower the number, the heavier and themore viscous is the oil.
CHAPTER 9 • MEETING THE ENVIRONMENTAL CHALLENGES 239
Competing fuelsIn recent years, crude oil substitutes from various types of feedstock sourceshave received growing attention. Such fuels, referred to here as competing fuels,can be split into two subgroups: synfuels and biofuels.
Synfuels are derived from Fischer-Tropsch synthesis (see Chapter 3, Box 3.1) orother conversion processes. Feedstocks for the process may be coal, naturalgas, biomass or a mixture of these. Such conversion processes are very energy-intensive and the consequent CO2 emissions are high. The GHG emissions perbarrel of oil-equivalent depend on the process, the process feedstock and theconversion efficiency.
In themost commonly used coal-to-liquids (CTL) technology, coal is first gasifiedto produce synthesis gas (or syngas), which is then catalytically treated in aFischer-Tropsch process to produce liquid fuels (or synfuels). CTL synfuels,therefore, have the highest CO2 emissions because of the higher carbonintensity of coal compared with the other feedstocks and the need to gasify thecoal before Fischer-Tropsch conversion; the overall energy conversion efficiencyis around 50%. Gas-to-liquids (GTL) synfuel production has lower CO2 emissionsowing to a more favourable carbon/hydrogen ratio of natural gas and has asignificantly better conversion efficiency of around 58%.
Biofuels, such as ethanol and biodiesel, are derived from a variety of possiblefeedstocks. It would be expected that, in theory, biofuels are carbon-neutral.However, the fossil fuels needed for crop harvest, transportation, natural gas-based fertilisers for crop growing and conversion processes can be significant.In some cases, almost as much energy may be needed in the form of fossil fuelsduring theproductionchain asenergyeventually delivered in the formofbiofuels.
Nevertheless, therearepromisingexamplesofbiofuels, suchasethanolproducedfrom sugar cane and biodiesel produced from palm oil. Both have a high energy-output to energy-input ratio, or energy return on energy investment. However,it is crucial that environmentally sustainable growing methods be used for alltypes of biomass plantations. In terms of the lifecycle GHG balance of biofuels,it is important to avoid emissions stemming from the conversion of land withhigh-carbon stocks (e.g. tropical peat forest) into biofuel production. Such LUCcan result in initial CO2 emissions that would take decades to be compensatedby the use of biofuels.
Options for mitigationImportantmitigationmeasures to reduce GHG emissions are increasing energyefficiency in thesupplyanddemandsectors, andpreferential useof, or switchingto, lower-carbon footprint sources such as natural gas, renewable energy andnuclear. Such measures would make a major contribution to cost-effective CO2emissions reductions as illustrated in Energy Technology Perspectives 2012 (IEA,2012a), where the low-carbon scenario based on stabilising CO2 atmosphericconcentrations at 450 parts per million (ppm) offers an 80% probability oflimiting the rise in atmospheric temperature to 2°C. Projections show that
240 RESOURCES TO RESERVES
carbon capture and storage (CCS) will also bring an essential contribution to alow-carbon future, contributing around one-fifth of total reductions in energy-related CO2 emissions by 2050 compared to the business-as-usual case.
Carbon capture from gas streams with high concentrations of CO2 and at highpressures, typical of a number of industrial applications, could be achieved atcomparatively low cost. CCS from industrial applications, for example liquefiednatural gas (LNG) production facilities, is expected to cost on average betweenUSD 10 per tonne (/t) to USD 20/t (UNIDO, 2010). In some instances, costs couldbe even less than USD 10/t or even result in net cost benefits. If CCS is combinedwith enhanced oil recovery (EOR), the value of the additional oil extracted maypartially offset the additional costs of CCS.
CCS remains an emerging technology in the power sector, where it has notyet been demonstrated at commercial scale. As a consequence, information oncurrent costs and performance of CCS from power generation is still uncertainand limited to estimates from engineering studies or pilot projects. The costof carbon capture from power generation is estimated to be around USD 60/tin recent studies (Folger, 2010; Finkenrath, 2011). Additional costs for thetransportation and storage of CO2 are more difficult to model, as they dependon site-specific considerations and on the availability of storage space. Typically,however, costs related to the carbon capture step, which includes compressionof the CO2 for transport (if required), are expected to account for themajority ofCCS costs. Technology for capturing CO2 is still evolving and novel solutions arebeing tested such as improved membrane or cryogenic cyclone technologies.Membranes are being developed such that, when a gas stream is passed overthem, only CO2molecules will pass through, thus separating the CO2 from othercontaminating gases present in the stream. In cryogenic cyclones, the gas iscooled down by rapid expansion, after which contaminants condense into smalldroplets that are then separated by centrifugal action.
In the oil industry, energy efficiencymeasures are part of current project design.Choices include using solar energy for steamgeneration, applying co-generationfor steam and power, and using wind energy on offshore platform installations.In the future, projects with a large carbon footprint will need to consider CCS.Such projects will likely include underground storage as the preferred option.Within oil companies, there is already significant expertise in many aspects ofunderground CO2 storage, but there are also unresolved issues, such as long-term storage security. This expertise is also being applied to the capture of CO2from fossil-fuelled power generation plants.
There are fourmain options (Figure 9.1) considered for storing CO2 undergroundfor long periods of time:
■ injection and eventual dissolution and precipitation as carbonate in salineaquifers;
■ injection into depleted oil and gas reservoirs;
■ enhanced recovery techniques to displace oil or gas from reservoirs;
■ injection into coal seams for enhanced coal-bed methane recovery.

CHAPTER 9 • MEETING THE ENVIRONMENTAL CHALLENGES 241
In addition, there are a number of other possibilities that are less likely to offersignificant potential for storage in the short to medium term.
Figure 9.1 • Underground storage options
Saline aquifer
Coal seam injectionto displace methane
CO2
CO2
CO2
CO2
Methane
Oil(or gas)
Oil(or gas)
Oil (or gas)reservoir
Not to scale
Large point source of CO2
with carbon capture plant
To refinery
To power plantor industrial
complex
Note: unless otherwise indicated, all material in figures and tables derives from IEA data and analysis.
Themain options listed above are already viable, proven or being demonstrated.For example, large volumes of CO2 separated from natural gas extracted fromthe Norwegian offshore fields of Sleipner and Snøhvit are being injected andstored in deep saline aquifers every year. Until recently, this was also the casefor CO2 separated at the Algerian In Salah field. Similarly, large volumes havebeen injected to enhance oil recovery from the Canadian Weyburn-Midaleoilfields while, at the same time, providing a means of storage. For all theseoptions, long-term containment of CO2 is still a key issue and will requireappropriate site selection and resolution of themonitoring strategies supportedby an appropriate legal framework. Four fully integrated, commercial-scale CCSprojects that are or were recently in operation are described in Box 9.1.
Box 9.1 • Commercial CCS projects
Three of the four fully integrated, large-scale CCS projects described below are in commercialoperation today. All four projects contribute to the knowledge base needed for widespreadCCS use.

242 RESOURCES TO RESERVES
Sleipner
The Sleipner project began in 1996whenNorway’s Statoil started to injectmore than 1Mt peryear of CO2 under the North Sea. This CO2 was extracted with natural gas from the offshoreSleipner gas field. In order to avoid a government-imposed carbon tax equivalent to aboutUSD 55/t, Statoil built a special offshore platform to separate CO2 from other gases. TheCO2 is reinjected about 1 000metres (m) below the sea floor into the Utsira saline formationlocated near the natural gas field. The formation is estimated to have a capacity of about600 Gt of CO2 and is expected to continue receiving CO2 long after natural gas extraction atSleipner has ended.
Snøhvit
Europe’s first LNG plant also captures CO2 for injection and storage. Statoil extracts naturalgas and CO2 from the offshore Snøhvit gas field in the Barents Sea. It pipes the mixture160 kilometres (km) to shore for processing at its LNG plant near Hammerfest, Europe’snorthernmost town. Separating the CO2 is necessary to produce LNG and the Snøhvit projectcaptures about 700 000 t of CO2 per year. Starting in 2008, the captured CO2 is piped back tothe offshore platform and injected in the Tubåsen sandstone formation 2 600 m under theseabed and below the geologic formation fromwhich natural gas is produced.
Weyburn-Midale
About 2.8 Mt CO2 per year is captured at the Great Plains Synfuels Plant in North Dakota,United States, which is a coal-gasification plant that produces synthetic gas and variouschemicals. The CO2 is transported by pipeline 320 km (200 miles) across the internationalborder into Saskatchewan, Canada and is injected into depleting oilfields where it is usedfor EOR. Although it is a commercial project, researchers from around the world have beenmonitoring the injected CO2 to ensure its long-term containment. The Weyburn-MidaleCO2 monitoring and storage project, which is part of the IEA Greenhouse Gas Research andDevelopment Programme, has been the first project to scientifically study and monitor theunderground behaviour of CO2. Canada’s Petroleum Technologies Research Centre hasmanaged the monitoring effort. A manual of best practices for carbon injection and storagehas been published (IEA GHG, 2012).
In Salah
In August 2004, Sonatrach, the Algerian national oil and gas company, with its partners BPand Statoil, began injecting about 1 Mt CO2 per year into the Krechba geologic formationnear their natural gas extraction site in the Sahara desert. The Krechba formation is adjacentto the gas-producing reservoir and lies 1 800m below ground. It has an estimated 17Mt CO2total storage lifetime. Injection of CO2 was suspended in June 2011, though monitoring ofthe site continues.
Source: IEA, 2010 (adapted).
For these four projects, the sources of the CO2 are from contaminated gassources and an industrial plant but, as yet, there are no large-scale, integratedCCS projects on a coal- or gas-fired power generation plant.

CHAPTER 9 • MEETING THE ENVIRONMENTAL CHALLENGES 243
Upstream GHG emissions
Results from an extensive survey of upstream and downstream GHG emissions inthe oil sector (Brandt and Farrell, 2007; Brandt, 2008; Brandt, 2009; IFEU, 2008; NETL,2008; Charpentier, Bergerson and MacLean, 2009; Mui, Tonachel and Shope, 2010;NRCan, 2012; ANL, 2012; Jacobs Consultancy, 2012) and the biofuels sector (IEA,2011a) are summarised below.Metrics used in the survey are defined in Box 9.2.
Box 9.2 • Definitions used for the lifecycle assessment of oil production
Well-to-refinery (WTR): the phase in which crude oil (or oil-sands) is extracted from the welland brought to a refinery. For oil-sands and heavy oil, it usually includes upgrading the low-quality crude to syncrude. This phase incorporates all emissions of the following stages:
■ recovery/extraction;
■ upgrading;
■ transport to refinery and supply-chain emissions;
■ venting and flaring, as well as fugitive emissions from leaks and tailing ponds.
Refinery-to-tank (RTT): the phase in which the crude oil or syncrude is refined to final fuel (inthis case gasoline). This phase incorporates all emissions from the following stages:
■ refining;
■ distribution/storage/dispensing;
■ supply chain emissions.
Well-to-tank (WTT): the phase includes production-related GHG emissions fromall upstreamand downstream stages. It is the sum of the previous two phases, WTR and RTT: WTT =WTR + RTT. For gasoline, this is around 120 kilograms of CO2 per boe (kg CO2/boe).
Tank-to-wheel (TTW): this phase includes all GHG emissions from the combustion of the finalfuel. For gasoline, this is around 425 kg CO2/boe (using the lower heating value for gasoline,which equals 44.4 megajoules per kilogram [MJ/kg]).
Well-to-wheel (WTW): this measure represents total GHG emissions. All production-relatedGHG emissions and GHG emissions from final fuel combustion are accounted for (from oilwell to car wheel). It is the sum of the previous phases: WTW =WTT + TTW.
Comparison of fuel cycle GHG emissions from differentliquid fuels
In the analysis, the GHG emissions that occur during oil extraction, fromupgrading heavy oils and bitumen, and from refineries during processing tothe final fuel gasoline are addressed. The combustion of regular gasoline alonecreates around 425 kgCO2/boe of final fuel and is used here as a comparisonwithupstream GHG emissions.
■ • transport to refinery and supply-chain emissions;
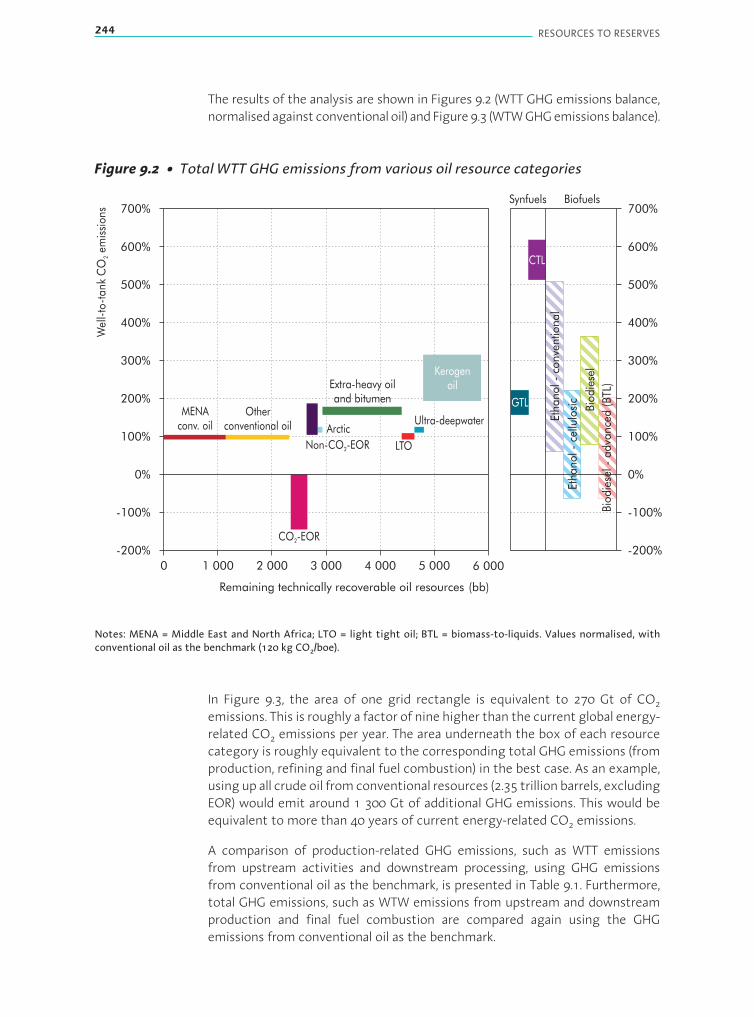
244 RESOURCES TO RESERVES
The results of the analysis are shown in Figures 9.2 (WTT GHG emissions balance,normalisedagainst conventional oil) andFigure9.3 (WTWGHGemissionsbalance).
Figure 9.2 • Total WTT GHG emissions from various oil resource categories
0 1 000 2 000 3 000 4 000 5 000 6 000
Remaining technically recoverable oil resources (bb)
Wel
l-to
-tank
CO
emis
sions
2
-200% -200%
-100% -100%
0% 0%
100% 100%
200% 200%
300% 300%
400% 400%
500% 500%
600% 600%
700% 700%
Bio
die
sel-
adva
nce
d(B
TL)
Bio
die
sel
Eth
anol-
cellu
losi
c
Eth
anol-
conve
ntio
nal
BiofuelsSynfuels
CTL
GTL
Ultra-deepwater
LTO
Arctic
Non-CO -EOR2
MENAconv. oil
Otherconventional oil
CO -EOR2
Extra-heavy oiland bitumen
Kerogenoil
Notes: MENA = Middle East and North Africa; LTO = light tight oil; BTL = biomass-to-liquids. Values normalised, withconventional oil as the benchmark (120 kg CO2/boe).
In Figure 9.3, the area of one grid rectangle is equivalent to 270 Gt of CO2emissions. This is roughly a factor of nine higher than the current global energy-related CO2 emissions per year. The area underneath the box of each resourcecategory is roughly equivalent to the corresponding total GHG emissions (fromproduction, refining and final fuel combustion) in the best case. As an example,using up all crude oil fromconventional resources (2.35 trillion barrels, excludingEOR) would emit around 1 300 Gt of additional GHG emissions. This would beequivalent to more than 40 years of current energy-related CO2 emissions.
A comparison of production-related GHG emissions, such as WTT emissionsfrom upstream activities and downstream processing, using GHG emissionsfrom conventional oil as the benchmark, is presented in Table 9.1. Furthermore,total GHG emissions, such as WTW emissions from upstream and downstreamproduction and final fuel combustion are compared again using the GHGemissions from conventional oil as the benchmark.

CHAPTER 9 • MEETING THE ENVIRONMENTAL CHALLENGES 245
Figure 9.3 • Total WTW GHG emissions from various oil resource categories
0%
50% 50%
50% -50%
100% 100%
150% 150%
200% 200%
250% 250%
Remaining technically recoverable oil resources (bb)
0 1 000 2 000 3 000 4 000 5 000 6 000
Ultra-deepwater
LTO
Arctic
Non-CO -EOR2
MENAconv. oil
Otherconventional oil
CO -EOR2
Extra-heavy oiland bitumen
CTL
Bio
die
sel-
adva
nce
d(B
TL)
Bio
die
sel
Eth
anol-
cellu
losi
c
Eth
anol-
conve
ntio
nal
GTL
Wel
l-to
-whee
lCO
emis
sions
2
Kerogenoil
0%≈1 300 Gt CO2
BiofuelsSynfuels
Note: values normalised, with conventional oil as the benchmark (545 kg CO2/boe).
Greenhouse gas emissions of biofuel and BTL synfuel combustion are assumedhere to be carbon-neutral. All GHG emissions actually occurring are alreadyaccounted for in the fuel production and conversion stages.
From Table 9.1, and Figures 9.2 and 9.3, it can be seen that:
■ Biofuels have the best WTW GHG emissions balance. In fact, the lowestemissions are from cellulosic ethanol and BTL biodiesel (-20% to 50% of GHGemissions when compared to the conventional oil benchmark). Conventionalbiofuels have higher emissions (10% to 120%). WTT GHG emissions arenot necessarily lower than the benchmark (-91% to 545%), but the fuelcombustion afterwards is by definition carbon-neutral. Hence, total biofuelWTW GHG emissions are in many cases lower than those of the gasolinereference. However, emissions from direct and indirect LUC can in some casessignificantly reduce the WTW GHG emissions balance of biofuels, and shouldtherefore be avoided.
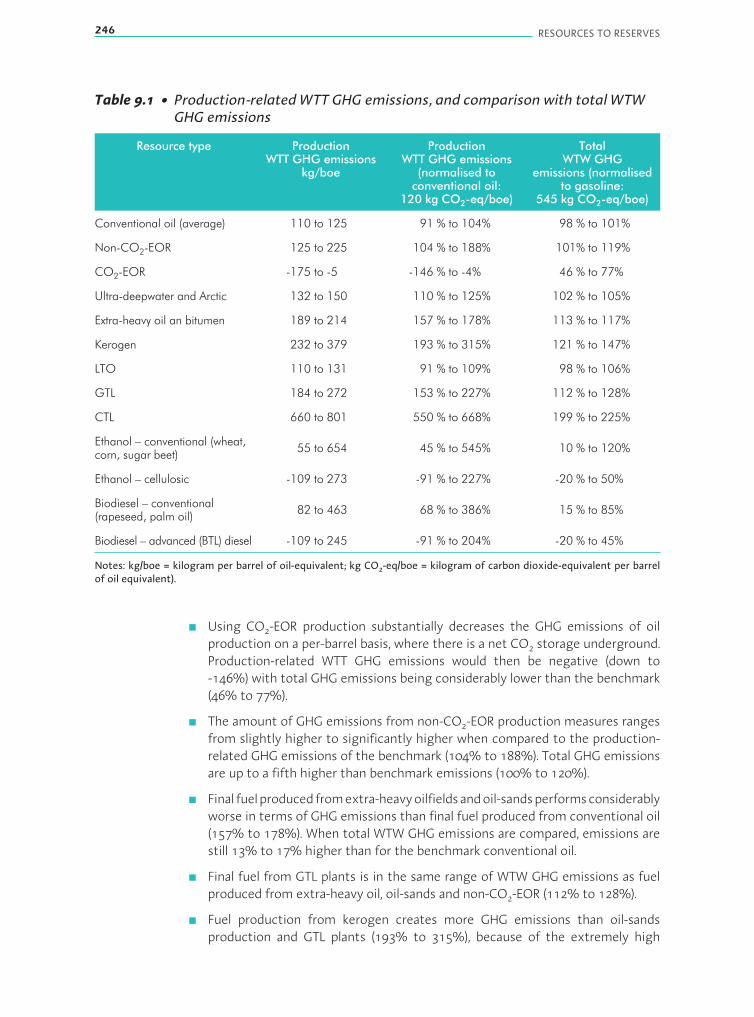
246 RESOURCES TO RESERVES
Table 9.1 • Production-related WTT GHG emissions, and comparison with total WTWGHG emissions
Resource type ProductionWTT GHG emissions
kg/boe
ProductionWTT GHG emissions
(normalised toconventional oil:
120 kg CO2-eq/boe)
TotalWTW GHG
emissions (normalisedto gasoline:
545 kg CO2-eq/boe)
Conventional oil (average) 110 to 125 91 % to 104% 98 % to 101%
Non-CO2-EOR 125 to 225 104 % to 188% 101% to 119%
CO2-EOR -175 to -511 -146 % to -4%11 46 % to 77%1
Ultra-deepwater and Arctic 132 to 150 110 % to 125% 102 % to 105%
Extra-heavy oil an bitumen 189 to 214 157 % to 178% 113 % to 117%
Kerogen 232 to 379 193 % to 315% 121 % to 147%
LTO 110 to 131 91 % to 109% 98 % to 106%
GTL 184 to 272 153 % to 227% 112 % to 128%
CTL 660 to 801 550 % to 668% 199 % to 225%
Ethanol – conventional (wheat,corn, sugar beet) 55 to 654 45 % to 545% 10 % to 120%
Ethanol – cellulosic -109 to 273 -91 % to 227% -20 % to 50%1
Biodiesel – conventional(rapeseed, palm oil) 82 to 463 68 % to 386% 15 % to 85%1
Biodiesel – advanced (BTL) diesel -109 to 245 -91 % to 204% -20 % to 45%1
Notes: kg/boe = kilogram per barrel of oil-equivalent; kg CO2-eq/boe = kilogram of carbon dioxide-equivalent per barrelof oil equivalent).
■ Using CO2-EOR production substantially decreases the GHG emissions of oilproduction on a per-barrel basis, where there is a net CO2 storage underground.Production-related WTT GHG emissions would then be negative (down to-146%) with total GHG emissions being considerably lower than the benchmark(46% to 77%).
■ The amount of GHG emissions from non-CO2-EOR production measures rangesfrom slightly higher to significantly higher when compared to the production-related GHG emissions of the benchmark (104% to 188%). Total GHG emissionsare up to a fifth higher than benchmark emissions (100% to 120%).
■ Final fuelproducedfromextra-heavyoilfieldsandoil-sandsperformsconsiderablyworse in terms of GHG emissions than final fuel produced from conventional oil(157% to 178%). When total WTW GHG emissions are compared, emissions arestill 13% to 17% higher than for the benchmark conventional oil.
■ Final fuel from GTL plants is in the same range of WTW GHG emissions as fuelproduced from extra-heavy oil, oil-sands and non-CO2-EOR (112% to 128%).
■ Fuel production from kerogen creates more GHG emissions than oil-sandsproduction and GTL plants (193% to 315%), because of the extremely high
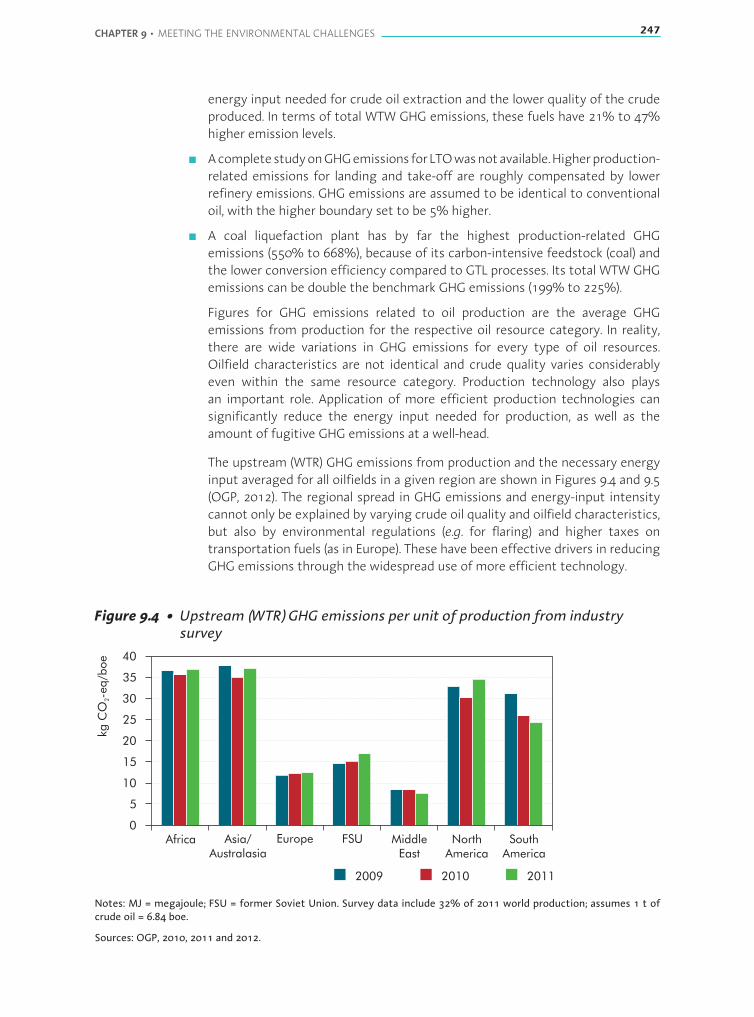
CHAPTER 9 • MEETING THE ENVIRONMENTAL CHALLENGES 247
energy input needed for crude oil extraction and the lower quality of the crudeproduced. In terms of total WTW GHG emissions, these fuels have 21% to 47%higher emission levels.
■ AcompletestudyonGHGemissionsforLTOwasnotavailable.Higherproduction-related emissions for landing and take-off are roughly compensated by lowerrefinery emissions. GHG emissions are assumed to be identical to conventionaloil, with the higher boundary set to be 5% higher.
■ A coal liquefaction plant has by far the highest production-related GHGemissions (550% to 668%), because of its carbon-intensive feedstock (coal) andthe lower conversion efficiency compared to GTL processes. Its total WTW GHGemissions can be double the benchmark GHG emissions (199% to 225%).
Figures for GHG emissions related to oil production are the average GHGemissions from production for the respective oil resource category. In reality,there are wide variations in GHG emissions for every type of oil resources.Oilfield characteristics are not identical and crude quality varies considerablyeven within the same resource category. Production technology also playsan important role. Application of more efficient production technologies cansignificantly reduce the energy input needed for production, as well as theamount of fugitive GHG emissions at a well-head.
The upstream (WTR) GHG emissions from production and the necessary energyinput averaged for all oilfields in a given region are shown in Figures 9.4 and 9.5(OGP, 2012). The regional spread in GHG emissions and energy-input intensitycannot only be explained by varying crude oil quality and oilfield characteristics,but also by environmental regulations (e.g. for flaring) and higher taxes ontransportation fuels (as in Europe). These have been effective drivers in reducingGHG emissions through the widespread use of more efficient technology.
Figure 9.4 • Upstream (WTR) GHG emissions per unit of production from industrysurvey
Africa Asia/Australasia
Europe FSU MiddleEast
NorthAmerica
SouthAmerica
0
5
10
15
20
25
30
35
40
kg
CO
-eq/b
oe
2
2009 2010 2011
Notes: MJ = megajoule; FSU = former Soviet Union. Survey data include 32% of 2011 world production; assumes 1 t ofcrude oil = 6.84 boe.
Sources: OGP, 2010, 2011 and 2012.

248 RESOURCES TO RESERVES
Figure 9.5 • Energy input in upstream production from industry survey
Africa Asia/Australasia
Europe FSU MiddleEast
NorthAmerica
SouthAmerica
0
50
100
150
200
250
300
350
400
450
500
MJ/
boe
2009 2010 2011
Note: Survey data include 32%of 2011world production; assumes 1 tonne crude oil = 6.84 boe; FSU = former Soviet Union.
Sources: OGP, 2010, 2011 and 2012.
Trends for the futureA shift away from the production of conventional towards unconventional oilwould increase GHG emissions in both the upstream and downstream stages.The reason for this is largely because unconventional sources such as oil-sands,heavy oil, CTLs and GTLs, are generally more energy-intensive to produce andrefine. On the other hand, improvements in vehicle efficiency could potentiallyreduce emissions. Recently, there has been a trend towards replacing gasolineand diesel with biofuels in the transport sector. However, future trends in thisdirection are uncertain, especially for biofuels from agricultural crops and fromcrops grown in cleared tropical forest areas.
A continuing shift from conventional crude oil production to petroleumsubstitutes could increase global GHG emissions up to 2030 and hence becomean additional driver for climate change (Brandt and Farrell, 2007).
For oil-sands and heavy oil, the higher average upstream GHG emissions fromunconventional oil are expected to be accompanied by a decrease in the qualityof crude oil. These two effects would raise GHG emissions from oil productionby several million tonnes to 1 Gt per year in the long term unless effectivemitigation measures are put in place. The mitigation of GHG emissions from oilproduction is crucial for both the conventional and unconventional oil sectors.
TherearemultiplewaystoreduceGHGemissionsbyusingtechnology.Forexample:
■ Improving thehighly energy- andemissions-intensive in situ extractionmethodsused for heavy oil and bitumen aswell as oil shalewould have a positive effect onthe GHG emissions balance of these oil resource types.
■ There are good opportunities for implementing CCS in CTL and GTL plants,because the CO2 stream, unlike that from pulverised coal-fired power plants,
CHAPTER 9 • MEETING THE ENVIRONMENTAL CHALLENGES 249
is already sufficiently pure for direct sequestration. CCS would, of course, addto the cost. However, further costly processing steps that reduce overall plantefficiency, as in the case for power plants, would not be necessary. Increasing theefficiency of CTL and GTL plants would obviously reduce additional CCS costs byreducing CO2 emissions per barrel of final synfuels.
■ Putting associated natural gas fromoil production into better use in a gas turbineat thewell site, insteadofventingor flaring it,wouldsaveenergyandprobablyalsocosts, especially if carbon pricing were introduced. Also, fugitive CO2 emissionsat the well-head could be used for CO2-EOR in favourable oilfield settings, whichwould in turn considerably increase the oil recovery factor there and, if the oilfieldcharacteristics permit, provide a net storage of CO2 underground.
As regards the future role of biofuels and BTL synfuel, it is crucial to shift towardshigh energy-yield biomass feedstocks such as sugar cane for ethanol production,so as to better exploit the potential of waste biomass such as bagasse and wastewood for BTL processes and tomake BTL plantsmore energy-efficient. Moreover,for the long-term credibility and environmental sustainability of biofuels, it isessential to ensure internationally aligned standards for sustainable biomasscultivation to avoid negative environmental, economic and social impacts.
Impact of carbon pricing
This section provides an in-depth quantitative assessment of the additionalproduction costs for one barrel of crude oil or 1 barrel of oil-equivalent (boe) if acarbon tax (or price per emissions) were to be introduced in the oil sector. Theassessment takes into accountWTT emissions but excludes TTW emissions. Theobjective of a carbon tax would be to internalise the external costs occurringas a consequence of climate change. Depending on its magnitude, this wouldprovide an economic incentive to reduce GHG emissions. However, this analysiscannot be used to judge the impact of different hydrocarbons and biofuels onclimate change.
Theassessmentmainly focusesontheassumptionthatthepriceofcarbonemissionswould be USD 50 per tonne of CO2-equivalent (/t CO2-eq) or USD 150/t CO2-eqemissions, depending on the commitment tomitigate climate change.
The negative impact of a carbon price on liquid fuel production costs wouldbe substantial for some resource types and less for others, depending on thespecific GHG emissions from the production of fuel in each resource category.
Table 9.2 provides an overview of the average specific WTT GHG emissions fromupstream and downstream oil production and the related cost increases forliquid fuels if various levels of carbon price were put in place.
The quantitative effects on the oil production cost curve are shown inFigure9.6 (USD50/tCO2-eq) andFigure9.7 (USD150/tCO2-eq). Thesegraphs shouldbe compared to Figure 8.3 (Chapter 8) where carbon pricingwas not included.

250 RESOURCES TO RESERVES
Table 9.2 • Impact of GHG emissions on production costs (for various carbon prices)
Resource type Production GHGemissions (WTT)
(kg/boe final fuel)
Additional costs (USD)at carbon price:
USD 50/t CO2-eqGHG emissions
Additional costs (USD)at carbon price:
USD 150/t CO2-eqGHG emissions
Conventional oil (average) 110 to 125 5 to 61 16 to 19
Non-CO2-EOR 125 to 225 6 to 11 19 to 34
CO2-EOR -175 to -5 1 -9 to 01 -26 to -11
Ultra-deepwater and Arctic 132 to 150 6 to 71 20 to 22
Extra-heavy oil and bitumen 189 to 214 6 to 17 17 to 30
Kerogen 232 to 379 12 to 19 35 to 57
LTO 110 to 131 5 to 71 16 to 20
GTL 184 to 272 9 to 14 28 to 41
CTL 660 to 801 33 to 40 99 to 120
Ethanol - conventional 55 to 654 3 to 33 8 to 98
Ethanol - cellulosic -109 to 273 -5 to 14 -16 to 41
Biodiesel - conventional 82 to 463 4 to 23 12 to 69
Biodiesel - advanced -109 to 245 -5 to 12 -16 to 37
Figure 9.6 • Oil production (WTT) costs for a carbon price of USD 50/t CO2-eq
0 1 000-1 000-2 000 2 000 3 000 4 000 5 000 6 000
Remaining technically recoverable oil resources (bb)
Product
ion
cost
(USD
/b)
CTL
GTL
Ultra-deepwater
Arctic
Otherconventional
oil LTO
Non-CO -EOR2
CO -EOR2
MENAconv. oilAlready
produced
Extra-heavy oiland bitumen
20 20
40 40
60 60
80 80
100 100
120 120
140 140
160 160
180 180
0 0
Etha
nol-
conv
entio
nal
Etha
nol-
cellu
losi
c
Biodie
sel-
conv
entio
nal
Biodie
sel-
adva
nced
BiofuelsSynfuels
Kerogenoil

CHAPTER 9 • MEETING THE ENVIRONMENTAL CHALLENGES 251
Figure 9.7 • Oil production (WTT) costs for a carbon price of USD 150/t CO2-eq
0 0
100 100
120 120
20 20
140 140
40 40
160 160
60 60
180 180
80 80
200 200
220 220
0 1 000-1 000 2 000-2 000 3 000 4 000 5 000 6 000
Remaining technically recoverable oil resources (bb)
Product
ion
cost
(USD
/b) 240 240
Kerogenoil
Ultra-deepwater
Arctic
Otherconventional
oil LTO
Non-CO -EOR2
CO -EOR2
MENAconv. oilAlready
produced
Extra-heavy oiland bitumen
CTL
GTL
Etha
nol-
conv
entio
nal
Etha
nol-
cellu
losi
c
Biodie
sel-
conv
entio
nal
Biodie
sel-
adva
nced
BiofuelsSynfuels
A carbon price of USD 50/t CO2-eq would drive up the costs for conventionaloil and LTO by around USD 6 per barrel (/b). The costs of syncrude production,extra-heavy oil, bitumen and kerogen resources as well as synfuel productionfrom CTL processes would increase significantly (higher than USD 10/boe) atUSD 50/t CO2-eq. The costs of kerogen would increase by USD 12/b to USD 19/band those of extra-heavy oil and bitumen by USD 6/b to USD 17/b. The costsof CTL synfuel would increase very substantially by USD 33/boe to USD 40/boe.GTL synfuel would be less affected (plus USD 9/boe to USD 14/boe) because ofthe more favourable carbon/hydrogen ratio of natural gas and a more efficientprocess. Given this prospect, investments in these oil resource categories wouldbe discouraged from a pure financial viewpoint. If, however, supply security wereto play a stronger role in the future, resources such as Canadian oil-sands inAlberta could still be exploited despite the increased production costs.
EOR, deepwater and ultra-deepwater oil resources improve their cost-competiveness compared to unconventional oil resources (Table 9.2). Theseresources experience cost increases of less than USD 10/boe or even costreductions in the case of EOR.
EOR technologies by CO2 injection are an interesting exception to the generalcost increase under carbon pricing. This production technique could in effecthelp toconvert conventional oilfields into significantcarbonsinks.Oil production

252 RESOURCES TO RESERVES
from CO2-EOR would become significantly less expensive, with the costbeing reduced by between USD 9 (for a carbon price of USD 50/t CO2-eq) andUSD 26 (for a carbon price of USD 150/t CO2-eq) per barrel of additional oilproduced, if a lastingnet carbon storage effect could be achieved. This estimatedreduction in costs is derived when looking at the net balance of sequesteredCO2 and emissions from upstream production and downstream refining. Such areduction would make production more financially viable. A carbon price couldincentivise additional use of EOR and increase the CO2-EOR resource estimates.
Such a strong financial incentive would dramatically change the outlook for oilproduction capacity. It could effectively alter business-as-usual projections for2035, the year by which higher CO2-emitting unconventional oil resources areprojected to amount to more than 12% of total oil production (Table 9.3), fromless than 5% in 2011.
Table 9.3 • Oil production, overview by resource type (million barrels per day)
Resource 2011 2035
New PoliciesScenario
Current PoliciesScenario
450 Scenario
Crude oil 68.5 65.4 70.8 51.5
Natural gas liquids 12.0 18.2 19.5 14.4
Unconventional oil 3.9 13.2 15.0 10.8
Biofuels 1.3 4.5 3.7 8.2
Processing gains 2.1 2.9 3.2 2.3
World total liquids supply 87.9 104.2 112.2 87.2
Note: biofuels are expressed as energy-equivalent volumes of gasoline and diesel.
Source: IEA, 2012b.
In favouring low-carbon oil resources over more polluting, high-carbon resourcesthat are environment-unfriendly in terms of GHG emissions, carbon pricingclearly offers benefits. Nevertheless oil production from almost all resourcecategories remains economically feasible. For oil prices around USD 80/b, even acarbon price of USD 50/t CO2-eq brings most resource categories into play.
To eliminate high CO2-emitting oil resources and oil substitutes, a muchstronger economic incentive would be needed; for example, raising the carbontax even higher. At a carbon price of USD 150/t, oil prices would need to beUSD 100/boe to make the exploitation of most unconventional oil resourcesfinancially feasible (Figure 9.7).
The introductionofcarbonpricingwouldalsopenalisemostbiofuelswith respectto conventional oil, if considered on a WTT basis. However, this does not reflectthe beneficial impact that biofuels can have on climate change. Combustion ofbiofuels is in fact carbon neutral, since the feedstock absorbed carbon from theatmosphere during its creation phase. The combustion emissions of oil-basedfuels could monetise into an additional cost of USD 20/boe and USD 60/boe at acarbon price of USD 50/t CO2-eq and USD 150/t CO2-eq, and thus favour the useof biofuels.
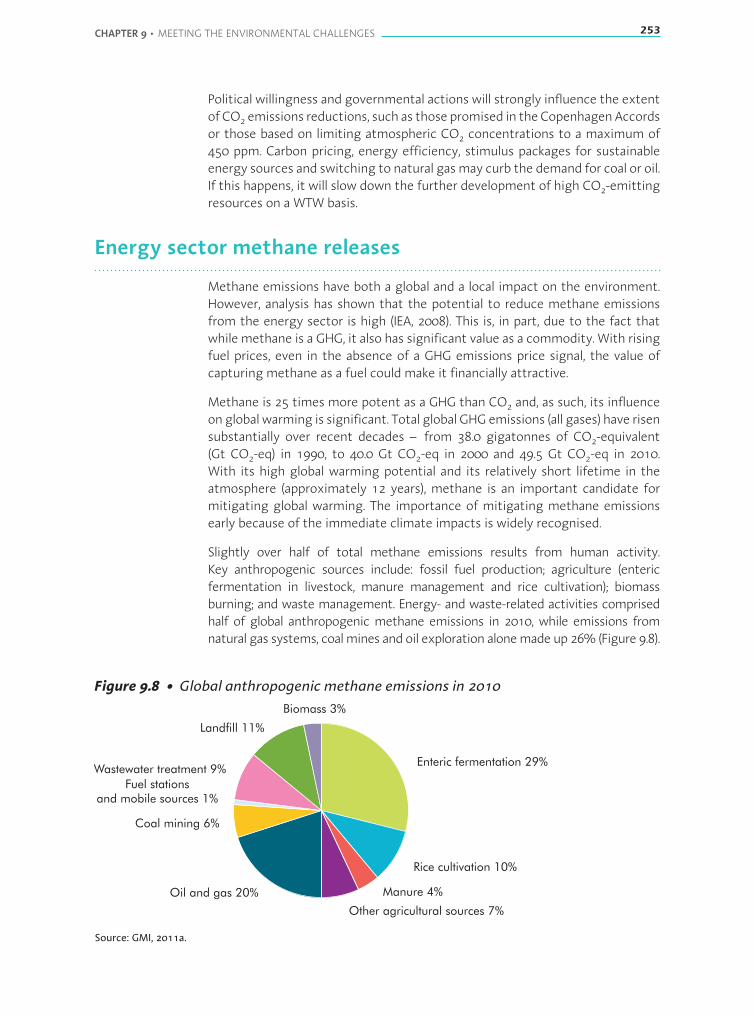
CHAPTER 9 • MEETING THE ENVIRONMENTAL CHALLENGES 253
Political willingness and governmental actions will strongly influence the extentofCO2 emissions reductions, such as thosepromised in theCopenhagenAccordsor those based on limiting atmospheric CO2 concentrations to a maximum of450 ppm. Carbon pricing, energy efficiency, stimulus packages for sustainableenergy sources and switching to natural gasmay curb the demand for coal or oil.If this happens, it will slow down the further development of high CO2-emittingresources on a WTW basis.
Energy sector methane releases
Methane emissions have both a global and a local impact on the environment.However, analysis has shown that the potential to reduce methane emissionsfrom the energy sector is high (IEA, 2008). This is, in part, due to the fact thatwhilemethane is a GHG, it also has significant value as a commodity. With risingfuel prices, even in the absence of a GHG emissions price signal, the value ofcapturing methane as a fuel could make it financially attractive.
Methane is 25 times more potent as a GHG than CO2 and, as such, its influenceonglobalwarming is significant. Total global GHGemissions (all gases) have risensubstantially over recent decades – from 38.0 gigatonnes of CO2-equivalent(Gt CO2-eq) in 1990, to 40.0 Gt CO2-eq in 2000 and 49.5 Gt CO2-eq in 2010.With its high global warming potential and its relatively short lifetime in theatmosphere (approximately 12 years), methane is an important candidate formitigating global warming. The importance of mitigating methane emissionsearly because of the immediate climate impacts is widely recognised.
Slightly over half of total methane emissions results from human activity.Key anthropogenic sources include: fossil fuel production; agriculture (entericfermentation in livestock, manure management and rice cultivation); biomassburning; and waste management. Energy- and waste-related activities comprisedhalf of global anthropogenic methane emissions in 2010, while emissions fromnatural gas systems, coalmines and oil exploration alonemade up 26% (Figure 9.8).
Figure 9.8 • Global anthropogenic methane emissions in 2010
Enteric fermentation 29%
Rice cultivation 10%
Manure 4%Oil and gas 20%
Coal mining 6%
Fuel stationsand mobile sources 1%
Landfill 11%
Biomass 3%
Other agricultural sources 7%
Wastewater treatment 9%
Source: GMI, 2011a.
254 RESOURCES TO RESERVES
From around 700 parts per billion (ppb) at the start of the industrial revolution inthemid-1700s, global average atmospheric concentrationsofmethanehave risenby more than 150%. Though the overall growth rate has slowed more recentlythanks to mitigation efforts, the concentration currently lies between 1 750 ppband 1 871 ppb, depending on themeasurement location (Blasing, 2012).
Anthropogenic hydrocarbon sources of methane emissionsNatural gas and oil operations accounted for around 20% of the estimated6.9 Gt CO2-eq global anthropogenic methane emissions in 2010, with Russia,the United States and Ukraine the largest emitters. Natural gas operationsinclude the production, processing, transportation and storage, as well as thedistribution of natural gas. Methane emissions mainly occur as the result ofequipment/pipeline leaks and routine process or maintenance venting activities.As the gas moves through components under high pressure, methane canescape to the atmosphere throughworn valves, flanges, pump seals, compressorseals and joints or connections in pipelines. At production sites, emissions occurat the well-head, during dehydration and when the gas is compressed to betransported from the well-head site to a processing plant.
In oil operations, methane may escape during production, transportationand refining operations. The main source of methane emissions is duringproduction, withmethane released as fugitive emissions, emissions arising fromoperational difficulties and emissions from the incomplete flaring of methane.During production, methane may be released into the atmosphere via venting,accidental leaks and incomplete fuel combustion (flaring). Equipment leaks andvessel blow-downs during routine maintenance can also be large contributorsto emissions.
Over the two decades to 2010, methane emissions from oil and natural gasoperations increased by 37% to 1.6 Gt CO2-eq (GMI, 2011b). With the growthin production of oil and gas projected to continue over the next two decades,methane emissions are expected to rise by a further 23%by 2030 (US EPA, 2011).
While conventional gas productionwill provide the bulk of global gas productionto 2030, the share of unconventional gas will continue to rise. Gas production inOrganisation for Economic Co-Operation and Development (OECD) countries isprojected to rise by around 10% to 2030, with highest production in the UnitedStates, followedbyCanada, Australia andNorway; highest growthwill come fromAustralia. In contrast, production in non-OECD countries is projected to rise byclose to 70% over the next two decades (IEA, 2011b), with high growth in manycountries, including Azerbaijan, Brazil, China, India, Iraq, Libya, Nigeria, Qatar,Turkmenistan and Venezuela. Within the OECD, the share of unconventional gasproduction will increase, though in Europe its rise will be insufficient to offsetthe decline in total gas production.
Global oil production is projected to rise by around 14% over the period to2030, with increases coming chiefly from the Organization of the PetroleumExporting Countries (OPEC) economies of Iraq, Saudi Arabia and Venezuela.Non-OPEC countries projected to increase their production are Brazil, Canada

CHAPTER 9 • MEETING THE ENVIRONMENTAL CHALLENGES 255
(unconventional oil) and Kazakhstan. In addition to the increased production,significant new production capacity will be required simply to offset the declinein production from currently producing fields.
Though increases inoil andgasproductionareprojected, this doesnotnecessarilytranslate into a similarly increased share in themagnitude ofmethane emissions.Estimated emissions from oil and natural gas are shown for selected countries inFigure9.9. In recentyears, increasedattentionhasbeendrawnto theconcernoveremissions of GHGs. This has led to increased awareness and stricter legislationto mitigate the rise in emissions, both of which have led to developments andimprovements in technology for exploration, production and use. The rise inshale gas production in the United States over the past five to ten years has beenmade possible through technology development, mainly horizontal drilling andhydraulic fracturing. The successful deployment of these technologies has ledto a surge of interest from other countries, many of them now characterisingtheir own shale gas potential. The level of specific emissions from this nascentsource of gas has reduced extensively as technologies and practices have beenimproved, and are likely to improve still further as many interested countries areplacing an important emphasis on environmental protection.
Figure 9.9 • Global methane emissions from oil and natural gas in selected countries
MtC
O-e
q2
0
50
100
150
200
250
300
350
Russia
United
States
Can
ada
Indo
nesia
Mex
ico
Niger
ia
Ukr
aine
India
Thailand
Arge
ntina
Ger
man
y
Kaza
khsta
n
Austr
alia
China
Poland
United
King
dom
Braz
il
Source: GMI, 2011b.
Coal mines contributed about 6% of total global anthropogenic methaneemissions in 2010 (GMI, 2011c), with the largest emissions by far emanatingfrom China, the United States, Russia, Ukraine, Australia and India (Figure 9.10).More than 90% of fugitive methane emissions from the coal sector come fromunderground coalmining. Abandoned (closed) underground coalmines also emitmethane, depending on the extent to which the mine has been sealed or theextent to which it has been flooded.
Methane emissions from coal mines have grown over many years, with thisgrowth projected to continue as greater volumes of coal are extracted andas improvements to technology enable extraction from increasingly greater
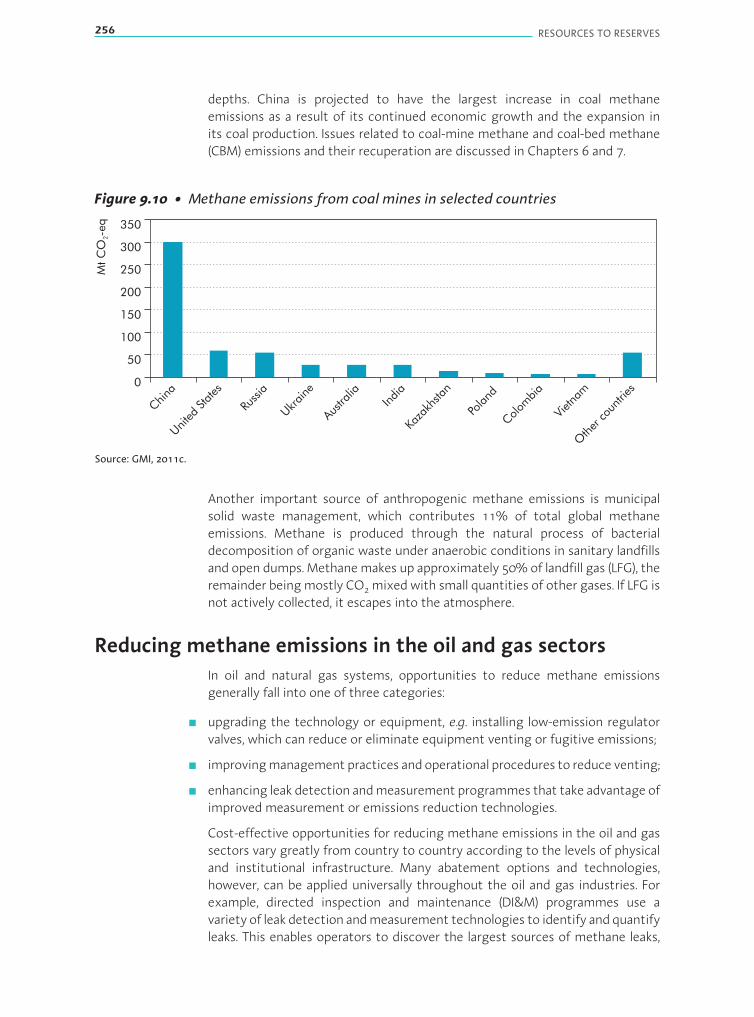
256 RESOURCES TO RESERVES
depths. China is projected to have the largest increase in coal methaneemissions as a result of its continued economic growth and the expansion inits coal production. Issues related to coal-mine methane and coal-bed methane(CBM) emissions and their recuperation are discussed in Chapters 6 and 7.
Figure 9.10 • Methane emissions from coal mines in selected countries
MtC
O-e
q2
0
50
100
150
200
250
300
350
China
United
States
Russia
Ukr
aine
Austr
alia
India
Kaza
khsta
n
Poland
Colom
bia
Vietna
m
Other
coun
tries
Source: GMI, 2011c.
Another important source of anthropogenic methane emissions is municipalsolid waste management, which contributes 11% of total global methaneemissions. Methane is produced through the natural process of bacterialdecomposition of organic waste under anaerobic conditions in sanitary landfillsand open dumps. Methanemakes up approximately 50%of landfill gas (LFG), theremainder beingmostly CO2mixedwith small quantities of other gases. If LFG isnot actively collected, it escapes into the atmosphere.
Reducing methane emissions in the oil and gas sectorsIn oil and natural gas systems, opportunities to reduce methane emissionsgenerally fall into one of three categories:
■ upgrading the technology or equipment, e.g. installing low-emission regulatorvalves, which can reduce or eliminate equipment venting or fugitive emissions;
■ improvingmanagementpractices andoperational procedures to reduce venting;
■ enhancing leak detection andmeasurement programmes that take advantage ofimproved measurement or emissions reduction technologies.
Cost-effective opportunities for reducing methane emissions in the oil and gassectors vary greatly from country to country according to the levels of physicaland institutional infrastructure. Many abatement options and technologies,however, can be applied universally throughout the oil and gas industries. Forexample, directed inspection and maintenance (DI&M) programmes use avariety of leak detection andmeasurement technologies to identify andquantifyleaks. This enables operators to discover the largest sources of methane leaks,

CHAPTER 9 • MEETING THE ENVIRONMENTAL CHALLENGES 257
leading to more accurate, efficient and cost-effective leak repairs. Such DI&Mprogrammes can be applied to gas production, processing, transmission anddistribution operations wherever they take place. In countries with large oil andgas infrastructures, such as Russia and the United States, the wider applicationof these programmes has the potential to yield both substantial reductions inmethane emissions and gas savings.
Although flaring of natural gas during oil production contributes less to globalwarming than if thegaswere vented, andwhile increasing amounts of previouslyflared gas are being captured for later use, the amount of flaring worldwideremains substantial. Any international agreement on mitigating global climatechange would be needed to address this issue.
Dealing with methane emissions: opportunitiesand constraints
There is substantial potential for reducing anthropogenic methane emissions,in particular from the oil and gas sectors, from coal mining and from waste.Much progress has been made. Technology to reduce emissions is improvingcontinually across each of these sectors. Unless further measures are taken,however, methane emissions will continue to grow as a result of the increasedneed for energy, mainly from the natural gas and coal mining sectors.
There are a number of challenges hindering the use of methane mitigationtechnologies. One of them is knowledge– thewidespread lack of understandingof existing methane emissions, the impact of those emissions on globaltemperatures and the value of the lost fuel. This is particularly the case incountries such as China, India, Russia and Ukraine, with rapidly growingenergy and waste sectors. Legal and regulatory barriers also exist relating to:ascertainingmethane ownership at coal mines and landfills; reducing gas flaringand promoting the use of associated gas; and obtaining access to the electricitygrid to sell back power that is generated at landfills or coal mines. There areefforts under way that attempt to address these barriers.
Shale gas and tight gas have higher production-relatedmethane emissions thanconventional gas. With the rapid rise in unconventional gas production in recentyears, there has been a strong emphasis on technology development to improvematters, with remaining emissions largely associated with more ventingor flaring during well completion. In the case of flaring, total well-to-burneremissions are estimated to be 3.5% higher than for conventional gas, whichrises to 12% in the case of venting. Eliminating venting, minimising flaring andrecovering and selling the methane produced during flow-back would reduceemissions below 3.5% (IEA, 2011b). Though technology improvements haveled to significant reductions in methane emissions per unit of gas produced,absolute emissions continue to rise as the volumes of gas produced continueto increase.
Many countries have started to regulate gas flaring in the oil and gas sectors,with some success. Initiatives such as the World Bank’s Global Gas FlaringReduction (GGFR) public-private partnership play an important role. Launched in
258 RESOURCES TO RESERVES
2002, theGGFRbrings together representatives of governmentsof oil-producingcountries, state-owned companies and major international oil companiesso that, together, they can overcome the barriers to reducing gas flaring bysharing global best practices and implementing country-specific programmes. Itfacilitates and supports national efforts to use flared gas by promoting effectiveregulatory frameworks and tackling constraints on gas utilisation.
Several methane projects relating to coal mines in China have been negotiatedunder the auspices of the United Nations Framework Convention on ClimateChange (UNFCCC) and its Clean Development Mechanism (CDM). Furthermore,China also has a number of projects that address LFG and, as regulations stipulatethat LFG cannot simply be flared to qualify for CDM project certification, theseprojectsmust deploy energy recovery. As a result of China’s success in attractinginvestors in GHG mitigation, other developing countries have also begun toexplore possibilities to reduce methane emissions.
In 2010, 38 governments, the European Commission, the Asian DevelopmentBank and the Inter-American Development Bank launched the Global MethaneInitiative (GMI). The GMI builds on the achievements of the Methane to MarketsPartnership, while expanding its scope and pursuing co-ordinated action plansto encourage new financial commitments from developing countries. The GMIurges stronger international action to mitigate climate change from methaneemissions. Its goal is to help reduce global methane emissions by partneringwith the private sector to identify and finance projects around the world, aswell as to suggest appropriate public policies to address key barriers. In the past,the Methane to Markets Partnership was an effective international instrumentin reducing GHG emissions. The 38 member countries of the GMI generateapproximately 70% of global methane emissions. More than 1 000 public- andprivate-sector organisations are members of the project network and havehelped the programme leverage substantial investment from private companiesand financial institutions.
References
ANL (Argonne National Laboratory) (2012), GREET (Greenhouse Gases, RegulatedEmissions and Energy Use in Transportation) Model 2012_1, Argonne NationalLaboratory, Chicago.
Blasing, T.J. (2012), Recent Greenhouse Gas Concentrations, Carbon DioxideInformation Analysis Center, Oak Ridge National Laboratory, Oak Ridge,Tennessee, http://cdiac.ornl.gov/pns/current_ghg.html.

CHAPTER 9 • MEETING THE ENVIRONMENTAL CHALLENGES 259
Brandt, A.R. (2008), “Converting Oil Shale to Liquid Fuels: Energy Inputs andGreenhouseGas Emissions of the Shell in SituConversion Process”, EnvironmentalScience&Technology, Vol. 42,No. 19, AmericanChemical Society,Washington,DC.
Brandt, A.R. (2009), “Converting Oil Shale to Liquid Fuels with the Alberta TaciukProcessor: Energy Inputs and Greenhouse Gas Emissions”, Energy& Fuels, Vol. 23,No. 12, American Chemical Society, Washington, DC.
Brandt, A.R. andA.E. Farrell (2007), “Scraping theBottomof the Barrel: GreenhouseGas Emission Consequences of a Transition to Low-Quality and SyntheticPetroleum Resources”, Climatic Change, Vol. 84, No. 3/4, Springer, pp.241-263.
Charpentier, A.D., J.A. Bergerson and H.L. MacLean (2009), “Understandingthe Canadian Oil Sands Industry’s Greenhouse Gas Emissions”, EnvironmentalResearch Letters, Vol. 4, No. 1, IOP Publishing, Bristol, United Kingdom.
Finkenrath, M. (2011), Cost and Performance of Carbon Dioxide Capture fromPower Generation, IEA Working Paper, OECD/IEA, Paris.
Folger, Peter (2010), “Carbon Capture: A Technology Assessment”, CRS(Congressional Research Service) Reports, No. 19, CRS, Washington, DC, http://digitalcommons.unl.edu/crsdocs/19/.
GMI (GlobalMethane Initiative) (2011a),GlobalMethaneEmissionsandMitigationOpportunities, GMI, Washington, DC, www.globalmethane.org/documents/analysis_fs_en.pdf.
GMI (2011b), Coal Mine Methane: Reducing Emissions, Advancing Recovery andUse Opportunities, GMI, Washington, DC, www.globalmethane.org/documents/coal_fs_eng.pdf.
GMI (2011c), Oil and Gas Systems Methane: Reducing Emissions, AdvancingRecovery and Use, GMI, Washington, DC, www.globalmethane.org/documents/oil-gas_fs_eng.pdf.
IEA (International Energy Agency) (2008), Energy Technology Perspectives, OECD/IEA, Paris.
IEA (2010), “Carbon Capture and Storage: Progress and Next Steps”, IEA/CSLF(Carbon Sequestration Leadership Forum) Report to the Muskoka 2010 G8Summit, Muskoka, Ontario, 25-26 June.
IEA (2011a), Technology Roadmap: Biofuels for Transport, OECD/IEA, Paris.
IEA (2011b),World Energy Outlook 2011, OECD/IEA, Paris.
IEA (2012a), Energy Technology Perspectives, OECD/IEA, Paris.
IEA (2012b),World Energy Outlook 2012, OECD/IEA, Paris.
IEA GHG (IEA Greenhouse Gas R&D Programme) (2012), Best Practices forValidatingCO2Geological Storage–Observations andGuidance from the IEAGHGWeyburn-Midale CO2 Monitoring and Storage Project, B. Hitchon, GeosciencePublishing, Edmonton.
260 RESOURCES TO RESERVES
IFEU (Institut für Energie- und Umweltforschung Heidelberg) (2008), Evaluationof Studies Assessing the Environmental Impact of the Use of Palm Oil as aBioenergy Carrier, 53rd Meeting of the IEA Renewable Energy Working Party, 2April, OECD/IEA, Paris.
Jacobs Consultancy (2012), EU Pathway Study: Life Cycle Assessment of CrudeOilsin a European Context, Jacobs Consultancy, Calgary.
Mui, S., L. Tonachel, B. McEnaney and E. Shope (2010), GHG Emission Factors forHigh Carbon Intensity Crude Oils, NRDC (Natural Resources Defense Council),New York.
NETL (National Energy Technology Laboratory) (2008), Development of BaselineData and Analysis of Life Cycle Greenhouse Gas Emissions of Petroleum-BasedFuels, United States Department of Energy/NETL, Washington, DC.
NRCan (Natural Resources Canada) (2012), GHGenius Version 4.02 – A Model forLifecycle Assessment of Transportation Fuels, Ottawa, www.ghgenius.ca/news.php.
OGP (International Association of Oil & Gas Producers) (2010), EnvironmentalPerformance in the E&P Industry, 2009 Data, Report No. 442, OGP, London.
OGP (2011), Environmental Performance in the E&P Industry, 2010 Data, ReportNo. 466, OGP, London.
OGP (2012), Environmental Performance in the E&P Industry, 2011 Data, ReportNo. 2011e, OGP, London.
UNIDO (United National Industrial Development Organisation) (2010), CarbonCapture and Storage in Industrial Applications: Technology Synthesis Report,UNIDO Working Paper, UNIDO, Vienna, www.unido.org/fileadmin/user_media/Services/Energy_and_Climate_Change/Energy_Efficiency/CCS/synthesis_final.pdf.
US EPA (United States Environmental Protection Agency) (2011), Draft: GlobalAnthropogenic Emissions of Non-CO2 Greenhouse Gases: 1990–2030, USEPA,Washington, DC, www.epa.gov/climatechange/Downloads/EPAactivities/EPA_NonCO2_Projections_2011_draft.pdf.

LIST OF ABBREVIATIONS, ACRONYMS AND UNITS OF MEASURE 261
List of abbreviations, acronyms and units of measure
Abbreviations and acronyms
3-D three-dimensional
4-D four-dimensional
ad air-dried
ANS Alaska’s North Slope
API American Petroleum Institute
ASP alkaline-surfactant polymer
BFBC bubbling fluidised bed combustion
BGR Federal Institute for Geosciences and Natural Resources (Germany)
BTL biomass-to-liquids
CAPEX capital expenditure
CaSO4 calcium sulphate
CBM coal-bed methane
CCS carbon capture and storage
CDM Clean Development Mechanism (under the Kyoto Protocol)
CERA Cambridge Energy Research Associates
CFBC circulating fluidised bed combustion
CGR condensate-to-gas ratio
CH4 methane
CHOPS cold heavy oil production with sand
CIS Commonwealth of Independent States
CMM coal-mine methane
CNG compressed natural gas
CO carbon monoxide
CO2 carbon dioxide
CO2-EOR carbon dioxide-enhanced oil recovery
CO2-eq carbon dioxide-equivalent
LIST OF ABBREVIATIONS, ACRONYMS AND UNITS OF MEASURE 261

262 RESOURCES TO RESERVES
CP cold production
CSS cyclic steam stimulations
CTL coal-to-liquids
CXHY hydrocarbon products
DBMS database management systems
DEA diethanolamine
DI&M directed inspection and maintenance
DOE United States Department of Energy
DVA direct vertical access
E&P exploration and production
EBRD European Bank for Reconstruction and Development
EGR enhanced gas recovery
EIA environmental impact assessment
EIA United States Energy Information Administration
EOR enhanced oil recovery
EPS electric submersible pump
ERC extreme reservoir contact
ERCB Energy Resources Conservation Board (Alberta, Canada)
ESHIA environmental, social and health impact assessments
EUB Energy and Utilities Board (Alberta, Canada)
FBC fluidised bed combustion
FDP field development plan
FDPSO floating drilling, production, storage and offloading (vessels)
FID final investment decision
FLNG floating LNG systems
FOB free-on-board
FOR free-on-rail
FPSO floating production, storage and offloading
FPU floating production unit
LIST OF ABBREVIATIONS, ACRONYMS AND UNITS OF MEASURE 263
FSRU floating storage and regasification unit
FSU former Soviet Union
F-T Fischer-Tropsch
GDP gross domestic product
GGFR Global Gas Flaring Reduction public-private partnership (World Bank)
GHG greenhouse gas
GMI Global Methane Initiative
GTL gas-to-liquids
H2 hydrogen
H2S hydrogen sulphide
HCS horizontal-well cyclic stimulation
HPU hydraulic power unit
IEA GHG IEA Greenhouse Gas Research and Development Programme
IEA International Energy Agency
IFC International Finance Corporation
IGCC integrated gasification combined cycle
IHS CERA Information Handling Services – Cambridge Energy Research Associates
IOR improved oil recovery
IRM integrated reservoir modelling
KOC Kuwait Oil Company
LFG landfill gas
LHV lower heating value
LNG liquefied natural gas
LPG liquefied petroleum gas
LTO light tight oil
LUC land-use change
MCS master control station
264 RESOURCES TO RESERVES
MEA monoethanolamine
MENA Middle East and North Africa
MinDOC minimum deepwater operating concept
MMS Minerals Management Service (United States)
MRC maximum reservoir contact
N2 nitrogen gas
NCS Norwegian Continental Shelf
NCS-INT Norwegian Continental Shelf-International
NDRC National Development and Reform Commission (China)
NGL natural gas liquid
NH3 ammonia
NOx nitrogen oxides
NRCan Natural Resources Canada
OECD Organisation for Economic Co-operation and Development
OG21 Oil and Gas in the 21st Century (Norway)
OPEC Organization of the Petroleum Exporting Countries
OWC oil-water contact
PC pulverised coal
PCC pulverised coal combustion
PCI pulverised coal injection
PDO plan for development and operation
PIIP petroleum initially in place
PRMS Petroleum Resources Management System
PSSG Provincial Advisory Committee on Public Safety and Sour Gas (Canada)
R&D research and development
R/P reserves-to-production ratio
RD&D research, development and deployment
RF radio frequency
LIST OF ABBREVIATIONS, ACRONYMS AND UNITS OF MEASURE 265
RTT refinery-to-tank
SAGD steam-assisted gravity drainage
SC supercritical
SEC Securities and Exchange Commission (United States)
SO2 sulphur dioxide
SPE Society of Petroleum Engineers
SPU subsea production umbilical
TAPS Trans-Alaska Pipeline System
THAITM Toe-to-Heel Air Injection
TLP tension-leg platform
TTW tank-to-wheel
UAE United Arab Emirates
UDW ultra-deepwater
UICI upstream investment cost index
UN United Nations
UNEP IE United Nations Environment Programme Industry and Environment
UNEP United Nations Environment Programme
UNFC United Nations Framework Classification for Fossil Energy andMineral Resources
UNFCCC United Nations Framework Convention on Climate Change
USC ultra-supercritical
USGS United States Geological Survey
UTA umbilical termination assembly
VAM ventilation air methane
VAPEX vapour-assisted petroleum extraction
VIV vortex-induced vibration
WAG water alternating gas injection
WEC World Energy Council
WRM well and reservoir management

266 RESOURCES TO RESERVES
WTO World Trade Organization
WTR well-to-refinery
WTT well-to-tank
WTW well-to-wheel
WWF World Wildlife Fund
Units of measure
°C degree Celsius
b barrel
b/b barrels of oil from a barrel of raw bitumen
b/d barrels per day
b/Mscf barrel per million standard cubic feet
bb billion barrels
bb/yr billion barrels per year
bcm billion cubic metres
bcm/km2 billion cubic metres per square kilometre
bcm/yr billion cubic metres per year
boe barrel of oil-equivalent
boe/d barrels of oil-equivalent per day
cm centimetres
EJ exajoule
g CO2/kWh grams of carbon dioxide per kilowatt hour
g/cm3 grams per cubic centimetre
g/kWh grams per kilowatt hour
GJ gigajoule
Gt gigatonne
LIST OF ABBREVIATIONS, ACRONYMS AND UNITS OF MEASURE 267
Gtce gigatonne of coal-equivalent
GW gigawatt
ha hectare
kb thousand barrels
kb/d thousand barrels per day
kg CO2/boe kilograms of carbon dioxide per barrel of oil-equivalent
kg CO2-eq/boe kilograms of carbon dioxide-equivalent per barrel of oil-equivalent
kg kilogram
kg/m3 kilogram per cubic metre
kj/kg kilojoules per kilogram
km kilometre
km2 square kilometre
l litre
m metre
m3 cubic metre
m3/d cubic metre per day
mb million barrels
mb/d million barrels per day
MBtu million British thermal units
mcm million cubic metres
mcm/d million cubic metres per day
md millidarcy (unit of permeability)
MJ megajoule
MJ/kg megajoules per kilogram
MPa megapascal (unit of pressure)
Msm3 million standard cubic metres
Mt million tonnes
Mt/yr million tonnes per year
268 RESOURCES TO RESERVES
Mtce million tonnes of coal-equivalent
Mtoe million tonnes of oil-equivalent
MW megawatt
MWe megawatt-electrical
ppb parts-per-billion
ppm CO2-eq parts-per-million carbon dioxide-equivalent
ppm parts-per-million
sm3/yr standard cubic metres per year
t CO2-eq tonne of carbon dioxide-equivalent
t tonne
t/b tonne per barrel
t/d tonnes per day
t/yr tonnes per year
tce tonne of coal-equivalent
tcm trillion cubic metres
toe tonne of oil-equivalent
TWh terawatt hour
USD/boe US dollars per barrels of oil-equivalent
USD/t US dollars per tonne

InternationalEnergyAgency
!9rue
delaFédération ! 75739 Paris Cedex 15, France
Buy IEA publicationsonline:
www.iea.org/books
PDF versions availableat 20% discount
A number of books printed before January 2012
are now available free of charge in pdf format
on our website
Onlinebookshop
Tel: +33 (0)1 40 57 66 90
E-mail:[email protected]

This publication reflects the views of the IEA Secretariat but does not necessarily reflect those of individualIEA member countries. The IEA makes no representation or warranty, express or implied, in respect of the
publication’s contents (including its completeness or accuracy) and shall not be responsible for any use of, orreliance on, the publication. For further information, please contact: [email protected]
This document and any map included herein are without prejudice to the status of or sovereigntyover any territory, to the delimitation of international frontiers and boundaries
and to the name of any territory, city or area.
The paper used for this document and the forest from which it comes have receivedFSC certification for meeting a set of strict environmental and social standards.
The FSC is an international, membership-based, non-profitorganisation that supports environmentally appropriate, socially beneficial,
and economically viable management of the world‘s forests.
IEA PUBLICATIONS, 9 rue de la Fédération, 75739 PARIS CEDEX 15Layout and Printed in France by Soregraph, May 2013
(612012081P1) ISBN: 9789264083547Photo credits: Photodisc