R Millennium development health metrics: where do Africa's children and women of childbearing age...
11
RESEARCH Open Access Millennium development health metrics: where do Africa’ s children and women of childbearing age live? Andrew J Tatem 1,2* , Andres J Garcia 3,4 , Robert W Snow 5,6 , Abdisalan M Noor 5,6 , Andrea E Gaughan 3,4 , Marius Gilbert 7,8 and Catherine Linard 7,8 Abstract The Millennium Development Goals (MDGs) have prompted an expansion in approaches to deriving health metrics to measure progress toward their achievement. Accurate measurements should take into account the high degrees of spatial heterogeneity in health risks across countries, and this has prompted the development of sophisticated cartographic techniques for mapping and modeling risks. Conversion of these risks to relevant population-based metrics requires equally detailed information on the spatial distribution and attributes of the denominator populations. However, spatial information on age and sex composition over large areas is lacking, prompting many influential studies that have rigorously accounted for health risk heterogeneities to overlook the substantial demographic variations that exist subnationally and merely apply national-level adjustments. Here we outline the development of high resolution age- and sex-structured spatial population datasets for Africa in 2000-2015 built from over a million measurements from more than 20,000 subnational units, increasing input data detail from previous studies by over 400-fold. We analyze the large spatial variations seen within countries and across the continent for key MDG indicator groups, focusing on children under 5 and women of childbearing age, and find that substantial differences in health and development indicators can result through using only national level statistics, compared to accounting for subnational variation. Progress toward meeting the MDGs will be measured through national-level indicators that mask substantial inequalities and heterogeneities across nations. Cartographic approaches are providing opportunities for quantitative assessments of these inequalities and the targeting of interventions, but demographic spatial datasets to support such efforts remain reliant on coarse and outdated input data for accurately locating risk groups. We have shown here that sufficient data exist to map the distribution of key vulnerable groups, and that doing so has substantial impacts on derived metrics through accounting for spatial demographic heterogeneities that exist within nations across Africa. Keywords: Population, Demography, Mapping, Millenium development goals Introduction The Millennium Development Goals (MDGs) were initi- ated to encourage development by improving social and economic conditions in the world’ s poorest countries [1]. In order to achieve this on a 15-year timeline, targets and indicators for poverty reduction and health improvement were set. There are eight goals with 21 targets, and a series of measurable indicators for each target, many of which are focused on health in specific target demographic groups, mainly children and pregnant women [1]. The ini- tiation of these indicators, as well as a general growth in the number of health metric studies, has prompted sub- stantial growth in approaches to measure them, with in- creasingly sophisticated methods that attempt to capture spatial heterogeneities in health conditions being devel- oped (e.g. [2-10]). An improved understanding of the geographic variation in health status and risks and access to services and care * Correspondence: [email protected] 1 Department of Geography and Environment, University of Southampton, Highfield, Southampton, UK 2 Fogarty International Center, National Institutes of Health, Bethesda, MD 20892, USA Full list of author information is available at the end of the article © 2013 Tatem et al.; licensee BioMed Central Ltd. This is an Open Access article distributed under the terms of the Creative Commons Attribution License (http://creativecommons.org/licenses/by/2.0), which permits unrestricted use, distribution, and reproduction in any medium, provided the original work is properly cited. Tatem et al. Population Health Metrics 2013, 11:11 http://www.pophealthmetrics.com/content/11/1/11
Transcript of R Millennium development health metrics: where do Africa's children and women of childbearing age...

Tatem et al. Population Health Metrics 2013, 11:11http://www.pophealthmetrics.com/content/11/1/11
RESEARCH Open Access
Millennium development health metrics: wheredo Africa’s children and women of childbearingage live?Andrew J Tatem1,2*, Andres J Garcia3,4, Robert W Snow5,6, Abdisalan M Noor5,6, Andrea E Gaughan3,4,Marius Gilbert7,8 and Catherine Linard7,8
Abstract
The Millennium Development Goals (MDGs) have prompted an expansion in approaches to deriving health metrics tomeasure progress toward their achievement. Accurate measurements should take into account the high degrees ofspatial heterogeneity in health risks across countries, and this has prompted the development of sophisticatedcartographic techniques for mapping and modeling risks. Conversion of these risks to relevant population-basedmetrics requires equally detailed information on the spatial distribution and attributes of the denominator populations.However, spatial information on age and sex composition over large areas is lacking, prompting many influentialstudies that have rigorously accounted for health risk heterogeneities to overlook the substantial demographicvariations that exist subnationally and merely apply national-level adjustments.Here we outline the development of high resolution age- and sex-structured spatial population datasets for Africa in2000-2015 built from over a million measurements from more than 20,000 subnational units, increasing input datadetail from previous studies by over 400-fold. We analyze the large spatial variations seen within countries and acrossthe continent for key MDG indicator groups, focusing on children under 5 and women of childbearing age, and findthat substantial differences in health and development indicators can result through using only national level statistics,compared to accounting for subnational variation.Progress toward meeting the MDGs will be measured through national-level indicators that mask substantialinequalities and heterogeneities across nations. Cartographic approaches are providing opportunities for quantitativeassessments of these inequalities and the targeting of interventions, but demographic spatial datasets to support suchefforts remain reliant on coarse and outdated input data for accurately locating risk groups. We have shown here thatsufficient data exist to map the distribution of key vulnerable groups, and that doing so has substantial impacts onderived metrics through accounting for spatial demographic heterogeneities that exist within nations across Africa.
Keywords: Population, Demography, Mapping, Millenium development goals
IntroductionThe Millennium Development Goals (MDGs) were initi-ated to encourage development by improving social andeconomic conditions in the world’s poorest countries [1].In order to achieve this on a 15-year timeline, targets andindicators for poverty reduction and health improvement
* Correspondence: [email protected] of Geography and Environment, University of Southampton,Highfield, Southampton, UK2Fogarty International Center, National Institutes of Health, Bethesda, MD20892, USAFull list of author information is available at the end of the article
© 2013 Tatem et al.; licensee BioMed CentralCommons Attribution License (http://creativecreproduction in any medium, provided the or
were set. There are eight goals with 21 targets, and a seriesof measurable indicators for each target, many of whichare focused on health in specific target demographicgroups, mainly children and pregnant women [1]. The ini-tiation of these indicators, as well as a general growth inthe number of health metric studies, has prompted sub-stantial growth in approaches to measure them, with in-creasingly sophisticated methods that attempt to capturespatial heterogeneities in health conditions being devel-oped (e.g. [2-10]).An improved understanding of the geographic variation
in health status and risks and access to services and care
Ltd. This is an Open Access article distributed under the terms of the Creativeommons.org/licenses/by/2.0), which permits unrestricted use, distribution, andiginal work is properly cited.

Tatem et al. Population Health Metrics 2013, 11:11 Page 2 of 11http://www.pophealthmetrics.com/content/11/1/11
within countries is increasingly being recognized as centralto meeting health and development goals and deliveringequity in interventions and impacts [11-13]. For instance,approaches based on local epidemiological and coveragedata have been identified as vital to achieving high impactsin reducing childhood mortality for MDGs 4 and 5 [14],while the subnational heterogeneity in HIV [15,16] andmalaria [5,17] prevalences mean that effective targeting ofinterventions remains vital in achieving MDG 6 [1]. Indi-cators assessed at national scales can often conceal im-portant inequities, with the rural poor often least wellrepresented [12,18]. Moreover, as international fundingfor health and development comes under pressure, theability to target limited resources to underserved groupsbecomes crucial. Substantial demographic variations existacross countries and between urban and rural areas [19].With MDG health indicators tied to specific vulnerablegroups, there is a need to know where these vulnerablegroups are and the number of individuals at risk that existin order to accurately characterize denominators.Health metrics continue to be collected, analyzed, and
reported at national scales (e.g.[20-22]); however, datasetscollected at subnational levels are increasingly available,and approaches that attempt to capture the spatial hetero-geneity that often exists subnationally are being developed.The importance of geography is being recognized in devel-opment [23], mortality [24], and disease risks [19,25], withmethods for mapping these factors at fine subnationalscales becoming increasingly sophisticated and commonin large-scale health metric studies [25]. While such pro-jects are utilizing contemporary and fine resolutiondatasets to build the most spatially accurate evidencebases for MDG progress tracking, each are generally com-bined with spatial population datasets that contain nosubnational information on target demographic groups toobtain denominators [19]. This lack of spatial data toquantify age groups by sex has meant that the increasingnumber of studies that are mapping indicators and riskssubnationally continue to rely on simple national adjust-ments of spatial population data to provide denominators.For example, to estimate the number of children under 5years old living at risk of P. falciparummalaria in Tanzania,previous work [5] has involved the development of a de-tailed map of prevalence from hundreds of communityprevalence surveys, then overlaying this onto a detailedgridded population distribution dataset [26] to estimatetotal populations at risk, but then simply using the UnitedNations national-level estimate [27] of the proportion ofthe population that is under 5 (17.9%) to convert this to anestimate of under-5s at risk, despite clear evidence of largesubnational differences in the proportions of residentialpopulations that are under 5 [19]. Further examples wheresimilar national-level adjustments have been made includethe estimation of numbers of pediatric fevers associated
with malaria [28], numbers of preschool children at risk ofanemia [10], schistosomiasis prevalence in children andunder-20-year-olds [9,29], numbers of children residing inareas suitable for seasonal malaria chemoprevention [30],and global malaria mortality [6]. Moreover, in each of thesecases, and for many other cartography-based health metricprojects, the spatial demographic data used has been ad-justed to a year of interest using national-level growthrates, ignoring the fact that the population distribution of acountry changes heterogeneously over time [19].Here we assess the importance of accounting for
subnational demographic variations in deriving health met-rics. We present the development of ~100 m spatial reso-lution age- and sex-structured spatial population datasetsfor Africa built from satellite imagery and over a millionmeasurements derived from more than 20,000 subnationaladministrative units and originating from a variety ofpublicly available sources that include census data and na-tional household surveys. The effects of accounting forsubnational demographic heterogeneity on estimates of thenumbers of women of childbearing age and children under5 years old impacted by long travel times to services andrisks of malaria transmission, respectively, are then quanti-fied to provide illustrative analyses.
MethodsConstructing a detailed and contemporary populationdistribution datasetThe AfriPop project (www.afripop.org) has recently com-pleted construction of 2010 and 2015 estimates of popula-tion distribution for continental Africa and Madagascar atapproximately 100 m spatial resolution. Full details areprovided in Linard et al. [31] and on the project website(www.afripop.org). Briefly, a GIS-linked database of censusand official population estimate data was constructed,targeting the most recent and spatially detailed datasetsavailable, given their importance in producing accuratemapping [31-33]. Detailed maps of settlement extentswere derived from Landsat satellite imagery through eithersemi-automated classification approaches [33,34] or expertopinion-based analyses [31]. These settlement maps werethen used to refine land cover data, while local census datamapped at fine resolution enumeration area level fromsample countries across the continent were exploited toidentify typical regional per-land cover class populationdensities, which were then applied to redistribute censuscounts to map human population distributions at 100 mspatial resolution continent-wide [31,33,35]. Where avail-able, additional country-specific datasets providing valu-able data on population distributions not captured bycensuses, such as internally displaced people or detailednational surveys, were incorporated into the mappingprocess [36].

Tatem et al. Population Health Metrics 2013, 11:11 Page 3 of 11http://www.pophealthmetrics.com/content/11/1/11
Compiling national estimates of age and sex structuresIn order to examine the effects of utilizing subnationaldata on age and sex structures of populations, 2010national-level data were first obtained to provide a base-line for comparison. These were obtained from theUnited Nations Population Division’s World PopulationProspects 2010 publication [27] and are derived fromnational-level demographic models built upon censusdata. These national-level proportions were then used toadjust the gridded population dataset described above toproduce separate five-year age group gridded datasets bysex, following approaches used in many previous studiesthat assume demographic homogeneity across countries(e.g. [6,9,10,28,30,37]).
Compiling subnational estimates of age and sexstructuresData on subnational population compositions from thelast 20 years were obtained from a variety of sourcesfor all mainland African countries, plus Madagascar(Additional file 1: Protocol S1). Contemporary census-based counts broken down at a fine resolution adminis-trative unit level generally provide the most reliablesource for population composition mapping, due to thelarge sample sizes providing reliable information summa-rized for small areas. Where age and sex data reported atsubnational levels were available for censuses undertakenwithin the last two decades, these were obtained forthis study (Additional file 1: Protocol S1). An additionto the aggregated full census data are large samples ofhousehold-level records derived from censuses (censusmicrodata) that provide age and sex structure, reportedgenerally by administrative level 1 (e.g., province) or 2(e.g., district). Census microdata on subnational age andsex proportions by subnational regions for African coun-tries within the last twenty years were obtained whereavailable (Additional file 1: Protocol S1). While census dataare often readily available for high-income countries, forAfrican countries census data with subnational reportingof age and sex structure can often be either unavailable orsubstantially more than a decade old. Alternative nationalhousehold survey data sources were therefore exploitedto provide the most contemporary and spatially de-tailed estimates as possible of age and sex proportions,given the constraints of their sampling frameworks.Here, national household survey data on populationage and sex compositions were obtained from the mostrecent Demographic and Health Survey (DHS), MalariaIndicator Survey (MIS), or AIDS Indicator Survey(AIS) [38], or from Multiple Indicator Cluster Surveys(MICS) [39], for all countries where such surveys havebeen undertaken.Summaries of subnational population structure by sex
and five-year age groupings from either full national
census summaries, census microdata, or household sur-veys were obtained for 47 of the 50 countries in main-land Africa, plus Madagascar. Where multiple datasetsfrom similar time periods were available, the census orcensus microdata were given priority for use, due to thelarger sample sizes. For four countries (Libya, Eritrea,Western Sahara, and Equatorial Guinea), no subnationalestimates of age and sex structures were found, and forthese countries the UN national estimates and projec-tions for the 2000-2015 period [27] were obtained andused in the mapping. The relatively small sample sizesfor household survey data and census microdata com-pared to those from full census data mean that age andsex proportions derived from them are more uncertain.To ensure that age proportions derived from thesedatasets were representative of those derived from cen-sus data, instances where (i) national household surveyswere undertaken in the same year or within one year ofa national census and (ii) census microdata samples andthe full census that each was derived from were collatedand statistical comparisons undertaken, which showedconsistent and strong correlations (Additional file 1:Protocol S1).Once datasets on numbers and proportions of individ-
uals by age and sex had been collated for as manysubnational units as available within the last two decades,using sample weights where applicable to household sur-veys, these were matched to corresponding GIS datasetsshowing the boundaries of each unit. Africa-wide GIS-linked data on proportions of individuals by age and sexand by administrative unit were created for as close to2010 as was available (Figure 1, further datasets are pro-vided in Additional file 1: Protocol S1).
Subnational and urban growth rates, projections, andadjustmentsThe production of spatial population datasets for Africahas previously relied on simple interpolation betweencensus-derived timepoints where available or, more com-monly, the application of UN Population Divisionnational-level growth rate estimates [27]. For 45 of the 50countries in mainland Africa plus Madagascar, subnationalgrowth rates derived from either censuses or official na-tional estimates were obtained (see Additional file 1:Protocol S1 for details). Additionally, separate growthrates for urban and rural areas nationally were obtainedfor those countries and time periods for which subnationalgrowth rate data were not available [40]. Finally, estimatedpopulation sizes for named African cities [40], and theurban extents dataset used in the construction of the Glo-bal Rural Urban Mapping Project (GRUMP) [26] wereobtained. The urban extents matching those African citiesfor which individual population totals are estimated in the

Figure 1 Spatial demographic datasets for mainland Africa and Madagascar. (a) The estimated proportion of children under 5 years oldsubnationally; (b) the estimated proportion of women of childbearing age subnationally; (c) the Africa-wide 1km spatial resolution griddeddataset of numbers of children under 5 years old in 2010, with close-ups showing 100m spatial resolution detail for southern Ghana andLuanda, Angola.
Tatem et al. Population Health Metrics 2013, 11:11 Page 4 of 11http://www.pophealthmetrics.com/content/11/1/11
UN World Urbanization Prospects [40] were identified,and the totals for 2000-2015 matched up.
Gridded population dataset productionThe GIS unit-linked age and sex subnational proportionsdataset described above was used to adjust the existingAfriPop 2010 spatial population datasets [31], to pro-duce estimates of the distributions of populations by sexand five-year age group across Africa in 2010. The
datasets were then adjusted to ensure that national popu-lation totals by age group, specific city totals and urban/rural totals matched those reported by the UN [27,40]. Forthe analyses outlined in the remainder of this paper, thesummation of the datasets representing males and femalesin the 0-5 year age group was undertaken to produce a2010 distribution dataset of children under 5 years old,and the summation of datasets representing females in the15-49 year age groups was undertaken to produce a 2010

Tatem et al. Population Health Metrics 2013, 11:11 Page 5 of 11http://www.pophealthmetrics.com/content/11/1/11
dataset of women of childbearing age. The application ofsubnational growth rates to produce 2000, 2005, and 2015datasets is described in Additional file 1: Protocol S1.
Quantifying effects of spatial population dataset onhealth metricsTo examine the effects on health and development indi-cators through use of the new subnational characteriza-tions of children under 5 and women of childbearing agecompared to undertaking national-level age adjustmentsusing the UN data [27], two sets of illustrative analyseswere undertaken. Firstly, Africa-wide estimates of thenumber of children under 5 years old residing in differentPlasmodium falciparum malaria prevalence classes werecalculated, and secondly, estimates of the number ofwomen of childbearing age residing at different travel timesfrom the nearest major settlement (population >50,000)across Africa and nearest health facility for countrieswith open access geolocated datasets of facilities wereestimated. In each case the focus was on the size of thechange in output metrics through accounting for demo-graphic spatial heterogeneity, rather than the estimatesproduced and their fidelity.One component of MDG 6 is an aim to halt and begin
to reverse the incidence of malaria [1], with targets focusedon those under 5 years of age, upon whom the greatestburden from the disease falls. To assess achievement ofthese targets, and the derivation of malaria metrics in gen-eral, maps of malaria prevalence are increasingly beingused in combination with spatial population datasets to es-timate numbers at risk and burdens (e.g.[5,6,41,42]). TheMalaria Atlas Project (www.map.ox.ac.uk) has recentlypublished a mapped distribution of the intensity of P. fal-ciparum transmission in 2010 based upon infection preva-lence among children aged 2 to 10 years (PfPR2-10) [5].Here, the estimated distribution of prevalence by classesthat have been proposed in the selection of suites of inter-ventions at scale to reach control targets at different timeperiods [43,44] (Figure 2a) was used to extract estimatednumbers of children under 5 years old per country residingin these different prevalence classes from (i) the AfriPop2010 population dataset [31] adjusted to represent childrenunder 5 using UN national proportion estimates [27] as de-scribed above, and (ii) the dataset of the 2010 populationunder 5 constructed from subnational data describedabove. For both datasets, national population totals wereadjusted to match UN reported numbers [27] to ensurethat any differences seen in numbers at risk were due solelyto the addition of subnational information on under-5 pro-portions. Further details are provided in Additional file 2:Protocol S2.Improving access to and for remote populations is an
important priority for many of the MDG targets, such asthose focused on eradicating extreme poverty, achieving
universal primary education, and developing a globalpartnership for development [1]. Moreover, each health-related goal is dependent upon accessing populations toprovide interventions, principally delivered throughhealth facilities, and the difficulty in traveling to these fa-cilities has been consistently highlighted as a barrier totreatment in rural populations, particularly in maternalhealth [45,46]. The measurement of accessibility or “re-moteness” of populations is therefore of importance inmeasuring progress toward achieving these goals, andincreasingly, approaches based on GIS-derived traveltimes are being applied [45-51]. A recently developedcontinent-wide travel time dataset [52,53] was used hereto map those regions estimated to be greater than fivehours from the nearest settlement of population sizegreater than 50,000. This dataset was used as an illustra-tive proxy for health system access, since reliablecontinent-wide datasets on health facility locations donot currently exist. To demonstrate the size of the varia-tions achieved when using actual health facility data, foreight countries with open-access datasets of health facil-ity locations (Additional file 2: Protocol S2), mapsrepresenting estimated travel times to the nearest facil-ities were constructed following previous approaches[50-55] (Additional file 2: Protocol S2). The accessibilitydatasets were used to extract estimated numbers ofwomen of childbearing age per country residing in dif-ferent travel time classes from (i) the AfriPop 2010population dataset [31] adjusted to represent women ofchildbearing age using UN national proportion estimates[27] as described above and (ii) the 2010 distributiondataset of women of childbearing age constructed fromsubnational data described above.
ResultsData assembly and risk group distributionsOver a million individual data records were collectedand matched to 20,381 administrative units across thecontinent (Figure 1a, Additional file 1: Protocol S1). Thesubnational proportions (Figures 1a, 1b) and growthrates (Additional file 1: Protocol S1) were combined withexisting spatial population datasets [31] and UN countrytotal estimates [27] as described above to produce high-resolution age-and sex-structured Africa-wide spatialpopulation datasets for 2000, 2005, 2010, and 2015(Figure 1c, Additional file 1: Protocol S1). For compari-son of the effects of the inclusion of subnational age andsex structure data on health metrics, the same spatialpopulation count dataset [31] was combined with UNPopulation Prospects national-level data on age and sexproportions [27], as described above, to produce alterna-tive high-resolution Africa-wide spatial populationdatasets that assumed homogeneity in age and sex struc-tures across countries.
Tatem et al. Population Health Metrics 2013, 11:11 Page 6 of 11http://www.pophealthmetrics.com/content/11/1/11
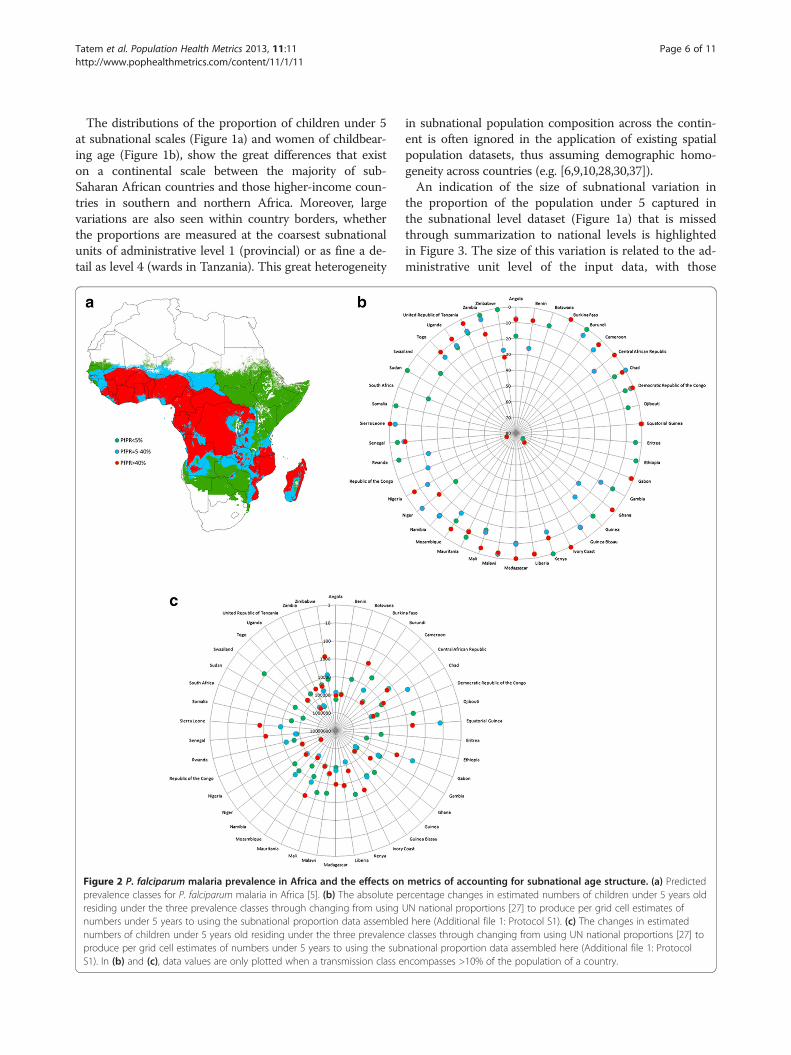
The distributions of the proportion of children under 5at subnational scales (Figure 1a) and women of childbear-ing age (Figure 1b), show the great differences that existon a continental scale between the majority of sub-Saharan African countries and those higher-income coun-tries in southern and northern Africa. Moreover, largevariations are also seen within country borders, whetherthe proportions are measured at the coarsest subnationalunits of administrative level 1 (provincial) or as fine a de-tail as level 4 (wards in Tanzania). This great heterogeneity
Figure 2 P. falciparum malaria prevalence in Africa and the effects onprevalence classes for P. falciparum malaria in Africa [5]. (b) The absolute presiding under the three prevalence classes through changing from usingnumbers under 5 years to using the subnational proportion data assemblenumbers of children under 5 years old residing under the three prevalenceproduce per grid cell estimates of numbers under 5 years to using the subS1). In (b) and (c), data values are only plotted when a transmission class e
in subnational population composition across the contin-ent is often ignored in the application of existing spatialpopulation datasets, thus assuming demographic homo-geneity across countries (e.g. [6,9,10,28,30,37]).An indication of the size of subnational variation in
the proportion of the population under 5 captured inthe subnational level dataset (Figure 1a) that is missedthrough summarization to national levels is highlightedin Figure 3. The size of this variation is related to the ad-ministrative unit level of the input data, with those
metrics of accounting for subnational age structure. (a) Predictedercentage changes in estimated numbers of children under 5 years oldUN national proportions [27] to produce per grid cell estimates ofd here (Additional file 1: Protocol S1). (c) The changes in estimatedclasses through changing from using UN national proportions [27] tonational proportion data assembled here (Additional file 1: Protocolncompasses >10% of the population of a country.

Figure 3 Differences between national and subnational summaries of population proportions under 5 years old for African countries.Comparison of UN national estimates [27] of proportions of the population under 5 years old in 2010 (red dots) against the range of proportionsmeasured by the subnational datasets collated here (Additional file 1: Protocol S1) shown as boxplots. The solid center line of the boxplot showsthe median values, the box width represents the interquartile range, and the whiskers extend to 1.5 times the interquartile range from the box(values further away than this are shown as open circles). The administrative unit level of the subnational data used here is shown as a prefix tothe country name on the x-axis.
Tatem et al. Population Health Metrics 2013, 11:11 Page 7 of 11http://www.pophealthmetrics.com/content/11/1/11
countries for which the most spatially detailed age struc-ture data were available (Tanzania and South Africa)showing the largest differences between minimum andmaximum estimates of per-unit proportions of residentsunder 5. Nevertheless, even for those countries wheresubnational data were only available at administrativeunit level 1, differences of +/- 5% from the UN nationalestimates are common. Moreover, national estimates areoften reflective of proportions in urban areas, where themajority of people reside, hiding the extremes that existin rural areas, and this is evidenced by the UN estimatesfalling outside of the interquartile range of the boxplotsin many cases (Figure 3).
Effects on health metricsIn terms of using cartographic approaches to estimatingthe numbers of people in specific age groups either im-pacted by disease or able to access large settlements andhealth facilities, it is clear that the use of subnationaldata on age structures can result in substantial differ-ences in output indicators over simply using national-level proportions. Figure 2 shows these differences foreach country in estimates of the number of childrenunder 5 residing under different P. falciparum malariaprevalence classes. The simple use of national level agestructure adjustments for estimates of numbers withindifferent age groups at risk of P. falciparum malaria, asundertaken in many recent studies, can result in some
estimates being nearly 100% different from those obtainedusing more detailed data that capture subnational demo-graphic variations, with close to half of countries exhibitingabsolute differences greater than 10% (Figure 2b). For smallcountries, such as Guinea-Bissau, this translates to esti-mates changing by only a few thousand people, whereasfor more populous countries, such as Nigeria, this resultsin many millions of children changing classes (Figure 2c).Such trends are also seen when quantifying travel times tomajor settlements and health facilities for women of child-bearing age (Figure 4). At a continental scale, estimates ofnumbers residing more than five hours from a large settle-ment are greater than 10% different for half of the coun-tries if an assumption of age structure homogeneity acrossthe country is applied, compared to accounting for thesubnational variations that exist (Figure 4a). Further, simi-lar findings are evident when estimating numbers ofwomen of childbearing age residing at different travel timesfrom health facilities (Figure 4b), emphasizing the impactthat spatial demographic heterogeneity has upon the meas-urement of health facility access for vulnerable popula-tions. For six of the eight countries examined, if theproportion of the population that women of childbearingage make up is assumed to match national estimates [27]across the country, then the numbers residing at traveltimes of more than an hour from the nearest health facilitywill be consistently underestimated (Figure 4b) due tosubnational variations in age and sex structures. For
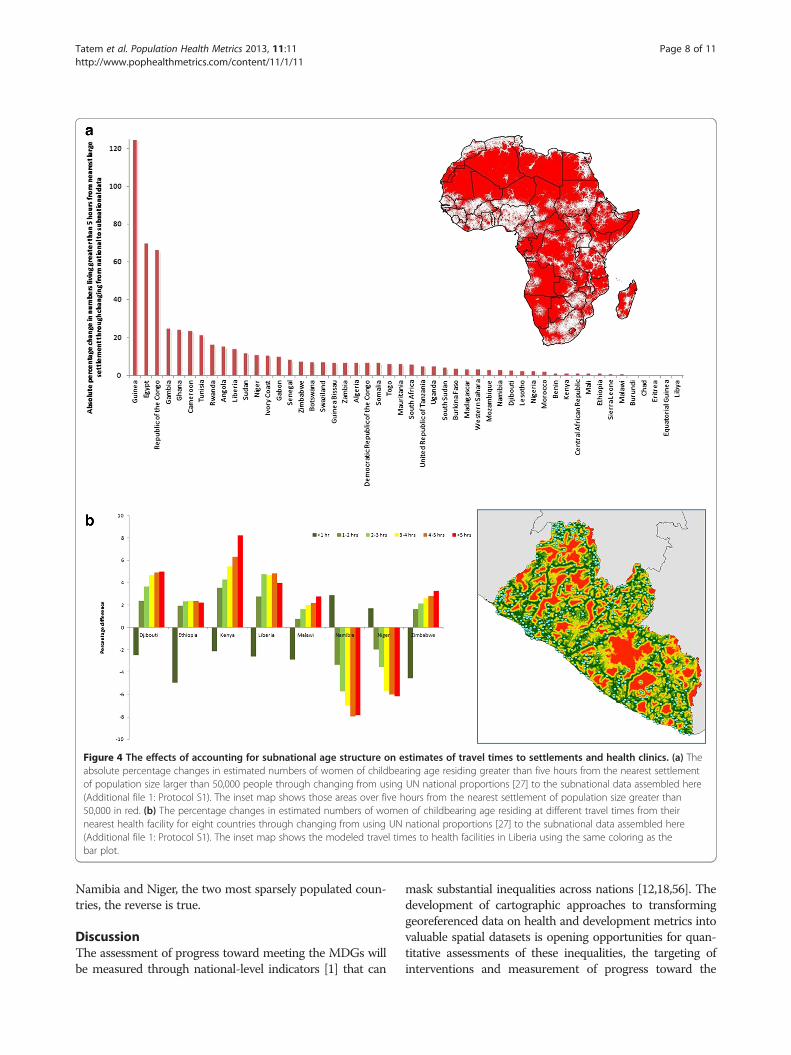
Figure 4 The effects of accounting for subnational age structure on estimates of travel times to settlements and health clinics. (a) Theabsolute percentage changes in estimated numbers of women of childbearing age residing greater than five hours from the nearest settlementof population size larger than 50,000 people through changing from using UN national proportions [27] to the subnational data assembled here(Additional file 1: Protocol S1). The inset map shows those areas over five hours from the nearest settlement of population size greater than50,000 in red. (b) The percentage changes in estimated numbers of women of childbearing age residing at different travel times from theirnearest health facility for eight countries through changing from using UN national proportions [27] to the subnational data assembled here(Additional file 1: Protocol S1). The inset map shows the modeled travel times to health facilities in Liberia using the same coloring as thebar plot.
Tatem et al. Population Health Metrics 2013, 11:11 Page 8 of 11http://www.pophealthmetrics.com/content/11/1/11
Namibia and Niger, the two most sparsely populated coun-tries, the reverse is true.
DiscussionThe assessment of progress toward meeting the MDGs willbe measured through national-level indicators [1] that can
mask substantial inequalities across nations [12,18,56]. Thedevelopment of cartographic approaches to transforminggeoreferenced data on health and development metrics intovaluable spatial datasets is opening opportunities for quan-titative assessments of these inequalities, the targeting ofinterventions and measurement of progress toward the

Tatem et al. Population Health Metrics 2013, 11:11 Page 9 of 11http://www.pophealthmetrics.com/content/11/1/11
MDGs, but demographic spatial datasets to support suchefforts remain reliant on coarse and outdated input data foraccurately locating risk groups.While high-resolution spatial data on population distri-
butions in resource poor areas are now becoming available(e.g., www.afripop.org, www.asiapop.org, www.census.gov/population/international/data/mapping/demobase.html),comprehensive and contemporary subnational informa-tion on the demographic attributes of these populationsremain scattered across national statistics office reportsand household surveys [19]. Here approaches to combin-ing these publicly available disparate datasets arepresented, enabling the production of Africa-wide datasetsdepicting age and sex compositions at subnational scales.The datasets and analyses highlight the importance of ac-counting for subnational demographic variations in deriv-ing health and developments metrics. Both the largesubnational variations in age and sex population structuresthat are evident (Figures 1 and 3), and the resulting impactsthat these have on metric derivation (Figures 2 and 4)underline the need to obtain and utilize the most spatiallyrefined data available.The ranges of proportions of the population that is
under 5 years old seen when comparing the subnationalversus national-level estimates (Figure 3) highlight theneed for more spatially detailed demographic data tobetter capture these variations. Differences of +/-5% inthe proportions are common, and the spatial configur-ation of those areas that are substantially greater or lessthan the UN estimates in relation to the spatial distribu-tion of disease risks or access, as seen in Figures 2 and4, can have major implications on the derivation of indi-cators. Whilst the distributions of predicted malaria riskor travel times are mapped as continuous variables at1km spatial resolution, if the population distributiondata used to derive numbers at risk is based upon an as-sumption of age and sex structure homogeneity throughnational-level estimates, it is clear that this can result insome significant inaccuracies that consistently remainunacknowledged. Clear urban and rural differences(Additional file 1: Protocol S1) also highlight the needfor accounting for such variations, and when indicatorssuch as malaria risk or access to health facilities thatvary substantially by urban-rural divides are being esti-mated, the large effects of this are evident (Figures 2 and4). For example, in Kenya some of the most rural areashave the highest malaria transmission, the largest traveltimes to health facilities, and the highest proportions ofchildren under 5/lowest proportions of women of child-bearing age. Thus, accounting for all three of these fac-tors subnationally compared to assuming a homogenousdemographic structure results in substantial differencesin outcome metrics (Figures 2 and 4). As funding forhealth and poverty-related mapping and the number of
new cartography projects (e.g. [57-60]) continues togrow, the need for accurate spatial population distribu-tion data will also grow if denominator-reliant metricsare required.While accounting for subnational heterogeneity in
population attributes likely results in significant improve-ments in the accuracy of health metrics, it is clear thatmany sources of uncertainty and error remain. All of thecensus and survey-based data used here are subject tovarious sources of error and bias, many of which havebeen well documented [61]. Indigenous groups, informalsettlements, places experiencing civil unrest, and refugeesare often entirely unsampled, either because of politicalbiases, missing sampling frames, or prohibitive difficultiesin carrying out a survey. Uncertainties also arise over com-parisons being made between primarily census-based na-tional estimates of age/sex proportions from the UNPopulation Prospects [27] and the household survey-derived subnational age/sex proportions used here forsome countries. Differences between the way these pro-portions were measured contributes to uncertainties incomparisons between outcome health metrics, thoughstrong correlations between the household survey-derivedage structures and those derived from census data suggestthat such differences may be small (Additional file 1:Protocol S1). Further, the underlying AfriPop populationdatasets contain uncertainties [31], while for some coun-tries, the input data used here remains outdated andcoarse (Figure 1, Additional file 1: Protocol S1). Like mostother population parameters reported for administrativepolygons, the age and sex proportions are also subject tothe modifiable areal unit problem [62]. Discretising (bygridding) a phenomenon that is continuous (or in thiscase, varying at a far higher resolution) is an arbitraryprocess. In the case of the datasets presented here, whilstthe precision with which heterogeneities in vulnerablepopulation distributions are mapped is improved oversimple national adjustments, we are still faced with adataset containing one set of values for Libya and thou-sands for Tanzania. There is therefore a need to morerigorously quantify the uncertainties inherent in spatialdemographic datasets. The advancement of theory, in-creasing availability of computation, and growing recogni-tion of the importance of robust handling of uncertaintyhave all contributed to the emergence in recent years ofnew, sophisticated Bayesian approaches to the large-scalemodeling and mapping of disease [4,7,25], but suchmethods have yet to cross over to the spatial demographicdatabases with which such maps are used. The regularavailability of new national household surveys means thatmore contemporary data is continually becoming availableto aid in updating and improving the accuracy of thedatasets presented here, potentially through automatedsystems that can rapidly adapt to new incoming data and
Tatem et al. Population Health Metrics 2013, 11:11 Page 10 of 11http://www.pophealthmetrics.com/content/11/1/11
integrate them into the output spatial datasets, alongsiderobust methods to account for temporal differences [63].The international focus on health-related goals coupled
with a growing trend in research and funding for carto-graphic approaches to deriving metrics are increasing needsfor spatial demographic data of similar scope for use in esti-mating denominator sizes and characteristics of popula-tions at risk. The importance of accounting for subnationaldemographic variations in deriving health metrics is clearand the size of the differences that exist between ignoringsubnational variations in age and sex structures, comparedto accounting for them, is large enough to make the differ-ence between success and failure in meeting a MDG. Herewe have shown that sufficient data exists to produce acontinent-wide subnational picture of demographic attri-butes and the mapping of key risk group distributions.Gridded age-structured datasets for 2000, 2005, 2010, and2015 are freely available to download from the AfriPop pro-ject website (www.afripop.org) and will be regularlyupdated as new data become available. Similar datasets forAsia and Latin America will soon be made availablethrough the AsiaPop (www.asiapop.org) and AmeriPop(www.ameripop.org) projects.
Additional files
Additional file 1: Protocol S1. Constructing spatial demographicdatasets for Africa.
Additional file 2: Protocol S2. Calculating cartographically-derivedhealth metrics.
Competing interestsThe authors have declared that no competing interests exist.
Authors’ contributionsAJT conceived the study, undertook data assembly and analyses, and wrotethe paper. AJG, AEG, MG, and CL aided with data analyses and writing thepaper. PWS and AMN aided with data collection, processing, and writing thepaper. All authors read and approved the final manuscript.
AcknowledgmentsThe authors thank Sakshi Tikya, Peng Jia, Nick Campiz, Viola Kurui, VictorAlegana, and Betsy Makena for help with data assembly and Drs Simon Hayand Peter Gething for providing the global P. falciparum dataset. This paperforms part of the output of the AfriPop population mapping project (www.afripop.org), and a full list of acknowledgements of those who provided datacan be found on the website. AJT acknowledges funding support from theRAPIDD program of the Science and Technology Directorate, Department ofHomeland Security, and the Fogarty International Center, National Institutesof Health, and is also supported by grants from NIH/NIAID (U19AI089674)and the Bill & Melinda Gates Foundation (#49446 and #1032350), whichsupport AEG. RWS is supported by the Wellcome Trust as Principal ResearchFellow (#079080). AMN is supported by a Wellcome Trust IntermediateResearch Fellowship (##095127). Both RWS and AMN are also supported byWellcome Trust Major Overseas Programme grant to the KEMRI/WellcomeTrust Research Programme (#092654). AJG is partially supported by theNational Science Foundation (Grant #0801544) in the Quantitative SpatialEcology, Evolution and Environment Program at the University of Florida. CLis supported by a fellowship from the Fonds National de la RechercheScientifique (FRS/FNRS), Belgium. The funders had no role in study design,data collection and analysis, decision to publish, or preparation of themanuscript.
Author details1Department of Geography and Environment, University of Southampton,Highfield, Southampton, UK. 2Fogarty International Center, National Institutesof Health, Bethesda, MD 20892, USA. 3Department of Geography, Universityof Florida, Gainesville, Florida, USA. 4Emerging Pathogens Institute, Universityof Florida, Gainesville, Florida, USA. 5Malaria Public Health and EpidemiologyGroup, Centre for Geographic Medicine, KEMRI - Univ. Oxford - WellcomeTrust Collaborative Programme, Nairobi, Kenya. 6Centre for Tropical Medicine,Nuffield Department of Clinical Medicine, University of Oxford, CCVTM,Oxford, UK. 7Biological Control and Spatial Ecology, Université Libre deBruxelles, Brussels, Belgium. 8Fonds National de la Recherche Scientifique(F.R.S./FNRS), Brussels, Belgium.
Received: 24 October 2012 Accepted: 11 July 2013Published: 23 July 2013
References1. United Nations Millenium Declaration. http://www.un.org/millennium/
declaration/ares552e.pdf.2. Brooker S: Spatial epidemiology of human schistosomiasis in Africa: risk
models, transmission dynamics and control. Trans R Soc Trop Med Hyg2007, 101:1–8.
3. Brooker S, Hotez PJ, Bundy DA: The global atlas of helminth infection:mapping the way forward in neglected tropical disease control.PLoS Negl Trop Dis 2010, 4:e779.
4. Gething PW, Patil AP, Hay SI: Quantifying aggregated uncertainty inPlasmodium falciparum malaria prevalence and populations at risk viaefficient space-time geostatistical joint simulation. PLoS Com Biol 2010,6:e1000724.
5. Gething PW, Patil AP, Smith DL, Guerra CA, Elyazar IR, Johnston GL, TatemAJ, Hay SI: A new world malaria map: Plasmodium falciparum endemicityin 2010. Malar J 2011, 10:378.
6. Murray CJ, Rosenfeld LC, Lim SS, Andrews KG, Foreman KJ, Haring D,Fullman N, Naghavi M, Lozano R, Lopez AD: Global malaria mortalitybetween 1980 and 2010: a systematic analysis. Lancet 2012, 379:413–431.
7. Patil AP, Gething PW, Piel FB, Hay SI: Bayesian geostatistics in healthcartography: the perspective of malaria. Trends Parasitol 2011, 27:246–253.
8. Riedel N, Vounatsou P, Miller JM, Gosoniu L, Chizema-Kawesha E, MukonkaV, Steketee RW: Geographical patterns and predictors of malaria risk inZambia: Bayesian geostatistical modelling of the 2006 Zambia nationalmalaria indicator survey (ZMIS). Malar J 2010, 9:37.
9. Schur N, Hurlimann E, Garba A, Traore MS, Ndir O, Ratard RC, Tchuente LT,Kristensen TK, Utzinger J, Vounatsou P: Geostatistical model-basedestimates of schistosomiasis prevalence among individuals aged <20years in West Africa. PLoS Negl Trop Dis 2011, 5:e1194.
10. Soares Magalhaes RJ, Clements ACA: Mapping the risk of anaemia inpreschool-age children: the contribution of malnutrition, malaria andhelminth infections in West Africa. PLoS Med 2011, 8:e1000438.
11. Global forum on local development: Localizing the MDGs. Kampala, Uganda:Global forum on local development; 2010.
12. Reidpath DD, Morel CM, Mecaskey JW, Allotey P: The MillenniumDevelopment Goals fail poor children: the case for equity-adjustedmeasures. PLoS Med 2009, 6:e1000062.
13. Stuckler D, Basu S, McKee M: Drivers of inequality in MillenniumDevelopment Goal progress: a statistical analysis. PLoS Med 2010,7:e1000241.
14. Kinney MV, Kerber KJ, Black RE, Cohen B, Nkrumah F, Coovadia H, NampalaPM, Lawn JE, Axelson H, Bergh AM, et al: Sub-Saharan Africa’s mothers,newborns, and children: where and why do they die? PLoS Med 2010,7:e1000294.
15. Kleinschmidt I, Pettifor A, Morris N, MacPhail C, Rees H: Geographicdistribution of human immunodeficiency virus in South Africa. AmJTropMed Hyg 2007, 77:1163–1169.
16. UNAIDS: Global Report: UNAIDS report on the global AIDS epidemic. Geneva,Switzerland: UNAIDS; 2010.
17. Snow RW, Amratia P, Kabaria CW, Noor AM, Marsh K: The changing limitsand incidence of malaria in Africa: 1939-2009. Adv Parasitol 2012,78:169–262.
18. Gwatkin DR: How much would poor people gain from faster progresstowards the Millennium Development Goals for health? Lancet 2005,365:813–817.
Tatem et al. Population Health Metrics 2013, 11:11 Page 11 of 11http://www.pophealthmetrics.com/content/11/1/11
19. Tatem AJ, Adamo S, Bharti N, Burgert CR, Castro M, Dorelien A, Fink G,Linard C, Mendelsohn J, Montana L, et al: Mapping populations at risk:Improving spatial demographic data for infectious disease modeling andmetric derivation. Pop Health Metrics 2012, 10:8.
20. World Health Organization: World Health Statistics. Geneva: WHO; 2011.21. Lopez AD, Mathers CD, Ezzati M, Jamison DT, Murray CJ: Global Burden of
Disease and Risk Factors. New York: The World Bank and Oxford UniversityPress; 2006.
22. UNICEF: The State of the World’s Children 2012: Children in an Urban World.New York: UNICEF; 2012.
23. The World Bank: World Development Report 2009: Reshaping EconomicGeography. Washington DC: The International Bank for Reconstruction andDevelopment / The World Bank; 2009.
24. Storeygard A, Balk D, Levy M, Deane G: The global distribution of infantmortality: A subnational spatial view. Pop Space Place 2008, 14:209–229.
25. Linard C, Tatem AJ: Large-scale spatial population databases in infectiousdisease research. Int J Health Geogr 2012, 11:7.
26. Balk DL, Deichmann U, Yetman G, Pozzi F, Hay SI, Nelson A: Determiningglobal population distribution: methods, applications and data.Adv Parasitol 2006, 62:119–156.
27. United Nations Population Division: World population prospects, 2010revision. New York: United Nations; 2010.
28. Gething PW, Kirui VC, Alegana VA, Okiro EA, Noor AM, Snow RW: Estimatingthe number of paediatric fevers associated with malaria infectionpresenting to Africa’s public health sector in 2007. PLoS Med 2010,7:e1000301.
29. Schur N, Vounatsou P, Utzinger J: Determining treatment needs atdifferent spatial scales using geostatistical model-based risk estimates ofschistosomiasis. PLoS Negl Trop Dis 2012, 6:e1773.
30. Cairns M, Roca-Feltrer A, Garske T, Wilson AL, Diallo D, Milligan PJ, Ghani AC,Greenwood BM: Estimating the potential public health impact ofseasonal malaria chemoprevention in African children. Nat Commun2012, 3:881.
31. Linard C, Gilbert M, Snow RW, Noor AM, Tatem AJ: Population distribution,settlement patterns and accessibility across Africa in 2010. PLoS One2012, 7:e31743.
32. Hay SI, Guerra CA, Tatem AJ, Atkinson PM, Snow RW: Urbanization, malariatransmission and disease burden in Africa. Nat Rev Microbiol 2005, 3:81–90.
33. Tatem AJ, Noor AM, von Hagen C, di Gregorio A, Hay SI: High resolutionpopulation maps for low income nations: combining land cover andcensus in East Africa. PLoS One 2007, 2:e1298.
34. Tatem AJ, Noor AM, Hay SI: Defining approaches to settlement mappingfor public health management in Kenya using medium spatial resolutionsatellite imagery. Rem Sens Env 2004, 93:42–52.
35. Linard C, Gilbert M, Tatem AJ: Assessing the use of global land cover datafor guiding large area population distribution modelling. GeoJournal2010, 76:525–538.
36. Linard C, Alegana VA, Noor AM, Snow RW, Tatem AJ: A high resolutionspatial population database of Somalia for disease risk mapping. Int JHealth Geogr 2010, 9:45.
37. Noor AM, Mutheu JJ, Tatem AJ, Hay SI, Snow RW: Insecticide-treated netcoverage in Africa: mapping progress in 2000-07. Lancet 2008, 373:58–67.
38. Demographic and Health Surveys. http://www.measuredhs.com/.39. Multiple Indicator Cluster Survey (MICS). http://www.unicef.org/statistics/
index_24302.html.40. United Nations Population Division: World urbanization prospects, 2011
revision. New York: United Nations; 2011.41. Hay SI, Okiro EA, Gething PW, Patil AP, Tatem AJ, Guerra CA, Snow RW:
Estimating the global clinical burden of Plasmodium falciparum malariain 2007. PLoS Med 2010, 7:e100029.
42. World Health Organization: The World Malaria Report. Geneva, Switzerland:World Health Organization; 2011.
43. Hay SI, Smith DL, Snow RW: Measuring malaria endemicity from intenseto interrupted transmission. Lancet Infect Dis 2008, 8:369–378.
44. Smith DL, Hay SI: Endemicity response timelines for Plasmodiumfalciparum elimination. Malar J 2009, 8:87.
45. Gabrysch S, Cousens S, Cox J, Campbell OM: The influence of distance andlevel of care on delivery place in rural Zambia: a study of linked nationaldata in a geographic information system. PLoS Med 2011, 8:e1000394.
46. Gething PW, Johnson FA, Frempong-Ainguah F, Nyarko P, Baschieri A,Aboagye P, Falkingham J, Matthews Z, Atkinson PM: Geographical access to
care at birth in Ghana: a barrier to safe motherhood. Southampton, UK:Centre for Population Change; 2012.
47. Apparicio P, Abdelmajid M, Riva M, Shearmur R: Comparing alternativeapproaches to measuring the geographical accessibility of urban healthservices: Distance types and aggregation-error issues. Int J Health Geogr2008, 7:7.
48. Guagliardo MF: Spatial accessibility of primary care: concepts, methodsand challenges. Int J Health Geogr 2004, 3:3.
49. Noor AM, Amin AA, Gething PW, Atkinson PM, Hay SI, Snow RW: Modellingdistances travelled to government health services in Kenya. Trop Med IntHealth 2006, 11:188–196.
50. Munoz UH, Kallestal C: Geographical accessibility and spatial coveragemodeling of the primary health care network in the Western Province ofRwanda. Int J Health Geogr 2012, 11:40.
51. Modelling physical accessibility to health care and geographic coverage(AccessMod). http://www.who.int/kms/initiatives/accessmod/en/index.html.
52. Nelson A: Estimated travel time to the nearest city of 50,000 or more people inyear 2000. Ispra, Italy: Global Environment Monitoring Unit, Joint ResearchCentre; 2008.
53. Uchida H, Nelson A: Agglomeration index: towards a new measure ofurban concentration. In World Development Report 2009. New York: WorldBank; 2009.
54. Alegana VA, Wright JA, Pentrina U, Noor AM, Snow RW, Atkinson PM:Spatial modelling of healthcare utilisation for treatment of fever inNamibia. Int J Health Geogr 2012, 11:6.
55. Blanford JI, Kumar S, Luo W, Maceachren AM: It’s a long, long walk:accessibility to hospitals, maternity and integrated health centers inNiger. Int J Health Geogr 2012, 11:24.
56. Rossouw S, Webber DJ: Millenium development goals: a concern oversub-national variations. Int Bus Econ Res J 2011, 10:127–135.
57. Smith JL, Haddad D, Polack S, Harding-Esch EM, Hooper PJ, Mabey DC,Solomon AW, Brooker S: Mapping the global distribution of trachoma:why an updated atlas is needed. PLoS Negl Trop Dis 2011, 5:e973.
58. Brady OJ, Gething PW, Bhatt S, Messina JP, Brownstein JS, Hoen AG, MoyesCL, Farlow AW, Scott TW, Hay SI: Refining the global spatial limits ofdengue virus transmission by evidence-based consensus. PLoS Negl TropDis 2012, 6:e1760.
59. Huang Z, Das A, Qiu Y, Tatem AJ: Web-based GIS: the vector-bornedisease airline importation risk (VBD-AIR) tool. Int J Health Geogr 2012,11:33.
60. Brooker S, Kabatereine NB, Smith JL, Mupfasoni D, Mwanje MT,Ndayishimiye O, Lwambo NJ, Mbotha D, Karanja P, Mwandawiro C, et al: Anupdated atlas of human helminth infections: the example of East Africa.Int J Health Geogr 2009, 8:42.
61. Hobcraft J, McDonald J, Rutstein SO: Socioeconomic factors in infant andchild mortality: a cross-national perspective. Pop Studies 1984, 38:193–223.
62. Openshaw S: The Modifiable Areal Unit Problem. Norwich: Geo Books; 1984.63. Raftery AE, Li N, Sevcikova H: Gerland P. Heilig GK: Bayesian probabilistic
population projections for all countries. Proc Natl Acad Sci USA; 2012.
doi:10.1186/1478-7954-11-11Cite this article as: Tatem et al.: Millennium development healthmetrics: where do Africa’s children and women of childbearing agelive?. Population Health Metrics 2013 11:11.
Submit your next manuscript to BioMed Centraland take full advantage of:
• Convenient online submission
• Thorough peer review
• No space constraints or color figure charges
• Immediate publication on acceptance
• Inclusion in PubMed, CAS, Scopus and Google Scholar
• Research which is freely available for redistribution
Submit your manuscript at www.biomedcentral.com/submit