
Quick method of measuring the furrows distribution on skin surface replicas
11
1 Introduction THE DISTRIBUTION of the furrows can be measured with two main techniques described as follows. 1.1 Profilometers A two-dimensional profilometer will give numerical values of the depth of all the furrows, and the width separating them (COOK, 1980; COOK et al., 1982). More recently, three-dimensional profilometers have been created (THOMAS, 1975), allowing numerical analysis of the distribution both in the mean plane of the replica (MIGNOT et al., 1985) and in its perpendicular direction. The sensor is the tip of a diamond pyramid (radius of 2 #m curvature). The use of a replica is neceSsary because of the pressure between the tip of the detector and the surface which could alter the skin contours. 1.2 Image analysis The replica technique is used in image analysis to enhance the contrast over the skin furrows, this contrast being very low when a direct image of the skin surface is analysed. The imprint of the surface is carried out using silicone rubber. Image analysis, using a video camera and a specific hardware system, leads to an approximate height distribu- tion of furrows through the study of shadows. This method was developed by CORCUFF et al. (1982; 1984) using a quantimeter 900 (Cambridge Instrument Co.). The three-dimensional profilometer technique is extremely time-consuming and shadow analysis is very Correspondence should be addressed to Dr Mignot. First received 15th July 1987 and in final form 14th April 1988 IFMBE: 1989 Medical & Biological Engineering & Computing expensive. To complement these two methods, it has been possible to develop a system which does not require sophisticated hardware and can be used for several differ- ent applications. Modern personal computers give the opportunity of measuring the horizontal distribution of furrows in real time. The fast quantisation of the charac- teristic elements of the skin surface is realised through an image analysis software written to detect, localise, enhance, count and characterise specific areas of the skin surface such as furrows and plateaus. Numerous methods of image analysis have been devel- oped and can be used for furrow detection. Nevertheless, the skin is essentially a flat surface, where furrows show up poorly in contrast due to the low variation of the local relief around them. A quantitative analysis of the furrow distribution therefore needs the development of specific operators. A software package has been developed which suits a great number of microcomputers (the whole range of 8086 microprocessors). As most operations are written in machine language the system is very fast. 2 Experimental method The camera can be either a video or a CCD one. The image is obtained after magnification through an objective lens in order to realise a 1-30 times enlargement of the image, which can vary continuously with a zoom lens. The distance between the replica and the nearest lens is about 10cm (Wild-Leitz Makroskop M420). This value gives the possibility--in the case of a negative replica observation--of using an annular optical fibre (light source B in Fig. 1) to light the replica. Such a device, using a white light source, allows a reduction in the formation of shadows in preferential directions. For this purpose, posi- tive (and translucent) replicas are more interesting because of the absence of shadows when using a transmission light- July 1989 379
Transcript of Quick method of measuring the furrows distribution on skin surface replicas
1 I n t r o d u c t i o n THE DISTRIBUTION of the furrows can be measured with two main techniques described as follows.
1.1 Profilometers A two-dimensional profilometer will give numerical
values of the depth of all the furrows, and the width separating them (COOK, 1980; COOK et al., 1982). More recently, three-dimensional profilometers have been created (THOMAS, 1975), allowing numerical analysis of the distribution both in the mean plane of the replica (MIGNOT et al., 1985) and in its perpendicular direction.
The sensor is the tip of a diamond pyramid (radius of 2 #m curvature). The use of a replica is neceSsary because of the pressure between the tip of the detector and the surface which could alter the skin contours.
1.2 Image analysis The replica technique is used in image analysis to
enhance the contrast over the skin furrows, this contrast being very low when a direct image of the skin surface is analysed. The imprint of the surface is carried out using silicone rubber.
Image analysis, using a video camera and a specific hardware system, leads to an approximate height distribu- tion of furrows through the study of shadows. This method was developed by CORCUFF et al. (1982; 1984) using a quantimeter 900 (Cambridge Instrument Co.).
The three-dimensional profilometer technique is extremely time-consuming and shadow analysis is very
Correspondence should be addressed to Dr Mignot.
First received 15th July 1987 and in final form 14th Apri l 1988
�9 IFMBE: 1989
Medical & Biological Engineering & Computing
expensive. To complement these two methods, it has been possible to develop a system which does not require sophisticated hardware and can be used for several differ- ent applications. Modern personal computers give the opportunity of measuring the horizontal distribution of furrows in real time. The fast quantisation of the charac- teristic elements of the skin surface is realised through an image analysis software written to detect, localise, enhance, count and characterise specific areas of the skin surface such as furrows and plateaus.
Numerous methods of image analysis have been devel- oped and can be used for furrow detection. Nevertheless, the skin is essentially a flat surface, where furrows show up poorly in contrast due to the low variation of the local relief around them. A quantitative analysis of the furrow distribution therefore needs the development of specific operators.
A software package has been developed which suits a great number of microcomputers (the whole range of 8086 microprocessors). As most operations are written in machine language the system is very fast.
2 Experimental m e t h o d The camera can be either a video or a CCD one. The
image is obtained after magnification through an objective lens in order to realise a 1-30 times enlargement of the image, which can vary continuously with a zoom lens.
The distance between the replica and the nearest lens is about 10cm (Wild-Leitz Makroskop M420). This value gives the possibility--in the case of a negative replica observation--of using an annular optical fibre (light source B in Fig. 1) to light the replica. Such a device, using a white light source, allows a reduction in the formation of shadows in preferential directions. For this purpose, posi- tive (and translucent) replicas are more interesting because of the absence of shadows when using a transmission light-
July 1989 379

I I l TV ] monitor camera
I I
annutar light source B
~ e p l i c a 'tll l i g h t s o u r c e A
Fig. 1 Principle of the measurement system
I a nalogue-to-digitat convertor
I lcom u erl I
printer
ing system (source A in Fig. 1). The light source intensity can be varied by the operator.
The quality of the image is controlled using a monitor. The area to be studied is scanned in a 256 x 256 matrix, each pixel (picture element) having one level out of a pos- sible 64 (6 bits). The values of the lighting conditions (intensity, homogeneity) can be changed from one replica to another without affecting the result because the soft- ware takes into account the real distribution of the grey levels of all the points of the image and not a fixed arbi- trary value.
The purpose of all the operations developed here is to transform the initial image into another and thereby allow the quantisation of the distribution of furrows. To obtain these results, the initial image must be modified by the following successive operations (Fig. 2):
(a) elimination of noise and enhancement of furrows (b) detection of all the furrows (c) selection of the main furrows (d) closing of the plateau contours (e) elimination of isolated groups of points (f) skeletonising of the furrows (g) quantisation.
[ image formGtion .E J 64 levels u
8< CI.
a, I sm~176 and ] enhancement cl
horizontal scanning J vertical scanning c analysis operator [ analysis operator o
1 3
8 image of furrows
I , two levels
l skeleton
m < I segments
I quantisation
+ Fig. 2 Flowchart of the successive operations
380
3 Smooth ing of the image and enhancement of the fur rows The initial images primarily need a treatment which
eliminates noises and makes the background uniform. This treatment enhances the contrast and gives better results in the next stages.
Usually, the image is smoothed with the mean value of the image intensity calculated inside a symmetrical mask applied to each pixel of the image (RoSENFELD and KAK, 1982; PAVLIDIS, 1982a). Such a method has the defect of decreasing the contrast and making the detection of the furrows more difficult, especially the secondary furrows (Fig. 4b). Other methods are available, such as those of NAGAO and MATSUVAMA (1979). These methods replace the I(i, j) value of the intensity at any point of the image by the value obtained by statistical analysis over several neighbouring areas. The well known operator is Nagao's (Fig. 3).
N O N I N 2
N 3 N 4 N 5
N 6 N 7 N 8
Fig. 3 Masks for smoothing by Nagao's method
Nine masks M k a r e defined by Nagao. The smoothing is realised as follows.
For each point (i, j) and for each mask Mk, one can calculate the mean Value mk(i, j) of the intensity I(i, j) over the mask area and the corresponding variance Vk(i, j). Thus, the value of the intensity l(i, j) is replaced by an m(i, j) value defined by
m(i, j) = mko(i, j)
if
VkO(i , j) = min {/)k(i, j) k = 1 . . . . 9}
Such a method permits the smoothing of the image, while preserving the edges. Applied to the skin surface, this operator eliminates isolated points and enhances the con- trast of the furrows. Unfortunately, this operation also eliminates furrows of low thickness (Fig. 4c). To solve this problem, a new method was developed, based on the use of eight new masks, more adapted to the furrow distribution (AwAJAN et al., 1987) (Fig. 5). As in Nagao's method, the value I(i, j) for each pixel is replaced by the mean value given by the mask Mko which has shown the minimum variance (Vk(i, j)). The masks are unit width segments; one of the extremities is located on the current point (i, j).
Medical & Biological Engineering & Computing July 1989

c d
Fig. 4 Filtering of an abdomen replica of a 25-year-old man. (a) Initial image; (b) smoothing; (c) Nagao'sfilter; (d) adapted method
I l l I I I I I I I I I I 1 I I l l i I I I I I I I I I I I I I I I I l i l
I ] I I I l i l l
1 1 1 1 1 1 1 1 1 1 I l l l l l l l l l I I I I I I I I I I I I I I I 1 1 1 1 1 I I I 1 1 1 1 1 1 1 I I I I I I I I I ] I I I I I I I I I I
T I T 2
I I I I I I I 1 1 1 I I I I I I I 1 1 1 I I l l l l l l l ] I ] ] l l ] l l l ] I l r l l l l l l l l l l l l l l l l l ~ I 1 11 I I I I I I
J i l l I l l l l J ~ I | 1 1 i l I I I I ~ 1 1 1 1 1 1 1 1
T s T 6
Fig. 5 New filtering operator
I I I l i I I l l i n / I I I I I f I [ l l l i f l l l I R i I I I l I l / I I ; I i i i i i , , . , . , , . . ; ; Y - ' l i l t I
Jl I I [ l J J I I i l l i
T a T 4
l i i I I i i I
I I )) I ' ' ' , , , i I I e l
I 1 i I I I I I I i I I I i I I i I I I l l i
I I I I I I I I =
T 7 T 8
These masks give a filtered image, without altering the furrows, even in the case of a very small thickness (1 or 2 pixels). After application of such operators, the initial image of Fig. 4a is transformed into that of Fig. 4d.
4 Detect ion of the fur rows The purpose of this present study is to extract from the
initial image the-points (i, j) which belong to lines (furrows). This is realised by transformation of the initial 64-level image into a binary image where one of the two levels (value 1) gives all the pixels characteristic of the furrows and the other (value 0) all the other points of the image (plateaus).
4.1 Classical methods Numerous methods are available to extract edges or
linear forms of an image; however, none is well adapted to the determination of furrows. These methods can be classi- fied into three groups:
Medical & Biological Engineering & Computing July 1989
(i) Methods which operate from the analysis of the grey- level histogram of the whole image. These methods detect not only the furrows but also all the other forms. The threshold required here and deduced from the histogram is difficult to choose (RosENrELD and KAK, 1982) Figs. 6a and 6b).
(ii) Methods which detect the contours. They are based on the search for areas showing the highest gradient. In an indirect way, they permit the determination of lines by their frontiers (RosENFELD and KAK, 1982; DAVIS, 1975). These operators, sensitive to great varia- tions of the gradient, are also not well adapted to the detection of low-contrast lines such as secondary furrows. These operators are very sensitive to noise. The applications of the contour-detection operators given by Sobel and Prewitt are shown in Figs. 6c and 6d.
(iii) Local methods of detection. These methods are well adapted to line detection. They operate locally by template matching (RoSENFELD et al., 1972; VANDER- BRUG, 1975; PATON, 1979).
Such methods can be divided into three stages:
(a) Definition of the templates. Each template gives a segment of a given width and direction 19.
(b) For each point of the image, the resemblance between each template and the surrounding area is measured.
(c) A line of width L and of direction 19 is detected if the resemblance with the template (L, 19) is maximum and if the measure is greater than a given threshold.
To increase the angular precision of the detection of the lines of different width (furrows of different kinds) it is necessary to use a significant number of templates,
381

Fig. 6
o b
C
- . ~ / l t - ~ _ "t .d 7 .;,:.- ! ":,---~".~/..~ :,t
r I -1 . . , . . , . _ - , / . , . ="7 .-:, l I - 7 ~ ~ , 1 ~ " / I " .%_r _-~ , . \ ...~ ,.- . . ~
2 " " ~ " ~ ~ t �9 . 4 ' - / 1,,,, k , , _
�9 "-t- .----.-.-.-.-.-.-.~-...~, . , / ,~--r-- . . . . - . , , , ~ -"" "'"4~ 1 . , , I " - - " q , " 7"q , '~ ' ' : ' ' ' -
"~.P ~ ' / " ~. - ~ - - - ~ " " l i
% - " l ~ - - - . : , ~ - " ~ " ' ' ~ " " ~ ' ' "
11". 1,4"-. I .- '? '~. . , -" ~ , ~ -" - - - - "
e
cl
Features detection by classical methods. (a) Detection by thresholding (level = 20) ; (b) the same (level = 30) ; (c) edge detection by Sobel operator; (d) edge detection by Premitt operator; (e) line detection by Vanderbrug Operator; (f) line detection by Paton operator
4.3 Prof i le analys is operator
The profile analysis opera to r me thod analyses successive profiles ob ta ined by scanning the image in determined directions (GROCH, 1982).
If Y(/) is a profile of the image, for each point i of the profile, i s {0, N} is associated with a code (two digits): L (left), R (right) giving, respectively, the var ia t ions to the left and to the right of the current point. This code is thus defined by: if e and v are two integers:
which increases the t ime of calculation. In addition, this me thod is based on the resemblance with seg- ments. New detect ion p rob lems can occur, such as discontinuities, changes of direction, corners. One example of appl icat ion of these methods is give by Fig. 6e (VANDERBRUG, 1975) and Fig. 6f(PATON, 1979).
4.2 N e w method adapted to f u r r o w detect ion
Although local me thods give interesting results, they create new difficulties such as discontinuities or edges. The new method , also based on local detection, considers a furrow as a shaped line object.
The line is defined as follows:
(a) in a given direct ion | the var ia t ion of the grey levels shows a m o n o t o n e decrease followed by a m o n o t o n e increase.
(b) in the perpendicular direction (O + n/2) the var ia t ions are very low.
L(i) = 1 if_ YO') > Y(i) - v
Vj e [i - e, i] and 3jo �9 [i - e, i]
Y(j) >~ Y(i) + v Vj �9 [i - e, Jo]
else L(/) = 0
R(i) = 1 if_ Y(j) >~ Y(e) -- v
V j e [i, i + e]
Medica l & Biological Engineering & Comput ing 382 July 1989

a n d 3 j o e r i , i + e ] , Y(j) >I Y(i) + v
Vj ~ [#o, i + e]
R(i) = 0
else
e = the width of the analysis area
v = the sensitivity of the operator
The code C(i) at each point can take the following values: 00, 01, 10, 11, where
00 hands for a uniform area 01 a regular increase of the grey level 10 a regular decrease 11 a point susceptible to belong to a line of width ~< 2e.
4.4 Line scanning The detection of the furrows is carried out in several
steps according to the flowchart of Fig. 2. Scanning line after line in a horizontal direction allows the extraction of a profile for each line and the application of the preceding operator (Fig. 7a). The points which can belong to a furrow are coded (11). The image thus obtained is a binary one, shown in Fig. 8a.
- , 1 / 1 / 1 i / I . . . . I I I I I1: II ! I . . . . . . . . .
7 '1;7 ii a b
Fig. 7 Scanning the image: (a) horizontal; (bj vertical
If the point j of the i m line has a code I 1, Ih(i , j) = 1 Ih( i , j) = 0 else. This operator is able to detect all the verti- cal lines, pariially the oblique lines, the horizontal lines remaining undetected.
A vertical line scanning is operated, extracting all the horizontal lines of the image (Fig. 7b): by using the points of code (11): Iv(i, j ) = 1, all the horizontal lines are detected, and partially the oblique lines. Vertical lines are not detected by this operator (Fig. 8b).
The final image is obtained by application of the or operator between the two images Ih( i , j ) and Iv(i, j). For the values e = 5 and v = 3, the resulting image is shown in Fig. 8c.
The application of the operators above studied creates some noise which can be eliminated by the study of the surrounding area of each current point: all the points of the furrows located inside a 5 • 5 window should be elimi- nated if none of them extends into a 7 • 7 window. This method eliminates noise and small isolated parts of furrows.
5 C o d i n g a n d c o m p a c t i n g t h e i m a g e After all the previous treatments, the image is translated
into a 256 x 256-point matrix I,,(i, j), which uses a 64 k byte memory. To reduce the size of this matrix to a value less than 6 k bytes, a transformation into a vector Iv(k ) is operated. This algorithm (GRANT and READ, 1981) scans the image line after line and the resulting vecto( has the following components:
(a) Iv(0): the number of the first line of the image matrix Ira(i) which contains a T value, i.e. the beginning of a
Medical & Biological Engineering & Computing July 1
characteristic element (here a furrow) Iv(0)= 2 in the example shown. The '1' values of the current neigh- bouring pixels which belong to a furrow are collected into segments of variable length (1-256 because the width of an image has this size). Each segment should be described in the vector representation of the image by three numbers:
(b) Iv(i), giving the J co-ordinate of the beginning of the segment
(c) Iv(i + 1) giving the j co-ordinate of the end of the same segment
(d) Iv(i + 2) giving the number of the element (plateau or furrow) to which this segment belongs. For example E l , F2, F3. . .
So, the first segment detected in Fig. 9, beginning at the sixth pixel, is stored into the vector as follows: 67F~. The transition from one line to the next is marked by the number zero. So, if a part of a matrix (Fig. 9) contains a plateau (values = 1), the corresponding vector has the form: I v = (267F 1 023F 2 68F1 023F2 67F1 0.. .)
6 Ske le ton of the image After application of the preceding operators, the image
is a binary one where the 1 values correspond to image pixels which belong to furrows.
Such furrows have no constant width but the study of their distribution requires a constant weight to be attrib- uted to every furrow. Such an operation is achieved by replacing the actual furrow with its skeleton showing a unit width. This operation gives an easier evaluation of the geometrical characteristics of the furrows such as length and direction.
Numerous studies are based on the skeleton research of binary images (PAVLIDIS, 1982b; SHAPIRO et al., 1981; LO and WANG, 1985; HOLT et al., 1987). The choice of the more appropriate algorithm is often linked to the desired properties of the skeleton. The purpose of our method is to obtain a skeleton of only one pixel width without any damage to the connexity of the image.
If Po, P1, ---, P7 are the neighbouring pixels to the cur- rent point Fig. 10, one can define two values A(P) and B(P) such that
7
A(P) = E Pi 0
B(P) is the numer of 01 patterns in the ordered set Po . . . . . PT, for example:
A(P) = 6 and B(P) = 1 for the set 0 1 1 0 1 1 1 1 1
A(P) = 6 and B(P) = 2 for the set 0 1 0 1 1 1 1 1 1
If F is the set of all the pixels of value 1 and C the set of all the pixels with A(P)~< 7, the algorithm proceeds by iter- ation on the set F. Each iteration includes two stages: determination of all the points of the contour of the set F, i.e. the set C (contour); and thinning of the set F by sup- pression o f all the pixels of C for which the following conditions are verified:
(i) 2 < A ( P ) < ~ 5 (ii) B(P)= 1
The method is described in the flowchart of Fig. I 1. This algorithm allows the elimination of the pixels of
values 1 around the current pixel, for which one can find
989 383

, , . / ' v v ' : '
I~ " , " - ", �9 - , ~ / . ~ " / ~ , ' ~ , 1 " " , l . J / . . . x , , . .
a b
' �9 :.! ' ":-" - _ '..I .," --'- ,. I -.,_--. ::. ~.~---:1, ,I :-e:
_ , i ~ - - . ' ,~ - - -' - '. - " "1 �9
L _ i ' . : , ~ ' ) : : - - , - ~ - . : ' - " - _ . " _ , . ' : - ~ - . . . . . . . - - L - , C . . . . . . . ~ . . . . . . - - _ . . . . .
, , i i . " 7 ' - - : . . . . ' - - '. - ' ~ -
. �9 i - - ,~ - - r~ ~' "1" . . 4 g , _ _ i : - " - - . ~ _ -
" ] - - . . . . . - - ~ ' - ! - - - ~ ' ~L u ' " '
. . . . . . . . . f , , . . . . . . t . I .. , . . . . . . . . . .
, - ~ _ L . . * -:.' . - . _ _ _ } . l q I " ~ : - ~ " - ~
. . . . . ' 7> .- :%. i . . . . . . . r - -_ ' ....... . r _ L ; : ~ : , - - - ~ "Tr': :~ , " �9 �9 . . " ~ - " - , 2 . : - - . ' - " ~' " " : ~ "
Fig. 8
4
5
6
7
8
Fig. 9 Tram
one of the
" - ' 7 ' ' ' --. , . " ,-- I. - - , ~ - - I .L-- . . . . . - , - - t . . . . . . . . . . . . . . . . q ,-..xt " 1
~ _ i , . a '~ --," ~ - , -". - " - - - - L l
:] - i . , " , " - - " / f - . - " - , - _ g
. ' i , . , , ,, , _ , _ _ , { _ 2 . . . . . . . . . . - - ' ~ ' - - i ' , ! , . . . . ~' ,L--- : 7 .... ~ ....... ---[-7 ~- ", / ~ f - " " h " " ' - - ' " i - - ' 'L " ) - " - - -
�9 - - 1 _ I , - , i ,' ' - - 1 . ~ - - ~ - :
] - - _ . - . - > _ ~ [ - r i - ,
I -~ ~ _ ' ' , ' ~ - , ' ' Z - : : ~ _ : , - - ' - _ - _ _ , . ~ ,._ . . . . t I . , - - . , - .
, , , - - - - . - ' ~ - '. _ - - ~ , , . - t--
.... .._--. . . . . : - ' r - - - " - ~ _-- - '~ZL!- ," .T .t . . . . . . , �9 . ? . _ . ' - - - ~ _. . . . . . [ . - - - - '
Image analysis: steps of the treatment. (a) Horizontal analysis (H ) : (b ) vertical analysis (V ) : (c I H and V : (d) skeletonising; (e) isolated part of furrow elimination; (f) segment detection
1 2 3 4 5 6 7 8
IP 1 - - 1
1 - -1 - - I I I - - 1
I I 1 - - 1
I I 1
formation of an (8 x 8) matrix into a vector I v
configurations in Fig. 12a. Convergence is assured when no pixel is eliminated during an iteration.
The final skeleton does not always have a width of unity.
Fig. 10
P5 P6 P 7
Pz, P Po
1:'3 P2 P1
Pixel neighbouring
A thinning algorithm is needed, based on the elimination of all the pixels for which
(i) [ P o + P 6 + P 7 = 0 or P2 + P 4 + P3 = 0 ]
and
[(Po + P6 + 3Pv) - (P,~ + P2 + 3P3) = 2]
(ii) (Po 4- P2 + PO = 0 or (P4 + Ps + P6) = 0
and
M e d i c a l & B i o l o g i c a l E n g i n e e r i n g & C o m p u t i n g 3 8 4 J u l y 1 9 8 9

I F z ~ ( i , j ) / I ( i , j ) : l ~ ]
-I L skeleton : F ]
c 0
I ,.-1 I
I i:, J
yes I
I c :c (("J)} I
i=
n o
I J= n o
+1 I
yes
yes
Fig. 11
[ J--1 I =I
_1
I l
no
Flowchart of skeleton production
(Po + P2 q- 3P0 -- (P4 + 3P5 + P6) = 2
These conditions permit the elimination of all the skeleton points which have a configuration like those shown in Fig. 12b. Skeletons obtained by this method are shown in Fig. 8d.
7 M e a s u r e m e n t of f u r r o w density and direct ion The algorithm to skeletonise the image described above
leads to a unit width for all the lines. With this whole set of operators it is possible to quantify the local distribution of the furrows orientation (AwAJAN e t al., 1987). Each line is divided into segments of constant length (five pixels) each of them belonging to one of the eight principal directions: 0; 22.5; 45; 67.5; 90; 112.5; 135; 157.5 ~ The zero direction
Medical & Biological Engineering & Computing
1 1 1 �9 1 1 0 �9 1
�9 1 �9 0 1 1 0 1 1
0 0 0 0 0 �9 0 �9 1
IIiI InN l n l
0 0 0 �9 0 0 I �9 0 I I �9
�9 I �9 I I 0 I I 0 I I 0
I I I I I �9 I �9 0 �9 0 0
0 0 0 0 0 I I 0
0 I I I I 0 I I 0 0 I I
I 0 0 I 0 0 0 0
Fig. 12 Masks used for the skeletonisin9 algorithm
corresponds to a particular axis (body or forearm axis), Each direction is associated (Fig. 13) with a mask
Sk(k = 1, 2 . . . . . 8). In each of these masks, the sum of the coefficients of the pixels which belong to a furrow is equal to 16. Inside one of these masks, each pixel is linked to a coefficient Pk which gives the probability of obtaining a segment of direction defined by Sk, centred at the pixel (i, j), i.e.
k (1 . . . . . 8)
1 Pk -- 16 ~ ~ Sk(p' q)I(i + p -- 3, j + q -- 3)
p=l q=l
with I(i, j) the intensity of the pixel (i, j) The segment of direction D L is associated with the pixel
(i, j) if
PL = max {p(k), k = 1 . . . . , 8}
and
PL > PLO
where PLO is a threshold chosen by the operator. In this way, each segment is defined by its centre (i, j)
and its direction D L. An example of such a decomposition of the image skeleton (Fig. 8e) into segments is given in Fig. 8f.
The decomposition of all the furrows into segments five pixels long allows one to obtain both the total density of furrows and the distribution in function of the direction. The total density is defined as the ratio of the total length of all the furrows and the total area of the image, i.e.
D(cm cm -2) oc 5 N / S
where N is the total number of segments and S the total number of pixels of the image. The distribution of all the furrows into the eight analysed directions is given by
nl di(%) = ~ x 100
where nl is the number of segments in the i direction.
8 Experimental examples Two examples are selected to show the validity of the
method. The first is related to ageing of the skin, where a
July 1989 385

l U U U l l lnlDll 1111111111111
S 1
2 1 2 1 1 2 1 1 2 1
2
S 5
Fig. 13
0-5
2 5 1 2 ! 1 2 1'
0.5
52
0,.. 2 0.5 2 1 1 2 1
1 2 )-5 2 3.5
S 6
05 2 1 2 0 x .
1 2 1 3-52 1 2 3.5
$3
2 0.-. 3.52 1
1 2 1 1 20 .5
0._ = 2
S 7
Configurations for segment detection
!2 0-. = 2
O. = 2 2
04 1
3 '52 05 1 2 2 1 1
3"5
$4
1 2 1 0 5 1 2 2
0"5
S 8
complete study required a great number of skin replicas for each class of age. The purpose of this study was not to measure the ageing of the skin but only to show that such an image analysis method could be used for this measure- ment.
Ageing of the skin is a well known subject of investiga- tion: usually, ageing is studied with a profilometer to obtain measurements of the depth of the furrows and the spacing between them. Through image analysis the dis- tribution of the furrows can be measured by the shadows (CoRCtYFF et al., 1982; 1983; CORCUFF, 1986) obtained from negative replicas lit by a parallel incident beam.
Another interesting application is the measurement of the variations of the furrow distributions due to a deforma- tion given by a tensile machine. A given deformation is applied to the skin surface in a well known direction and limited to low values to show the sensitivity of the skin relief to variations due to external stress.
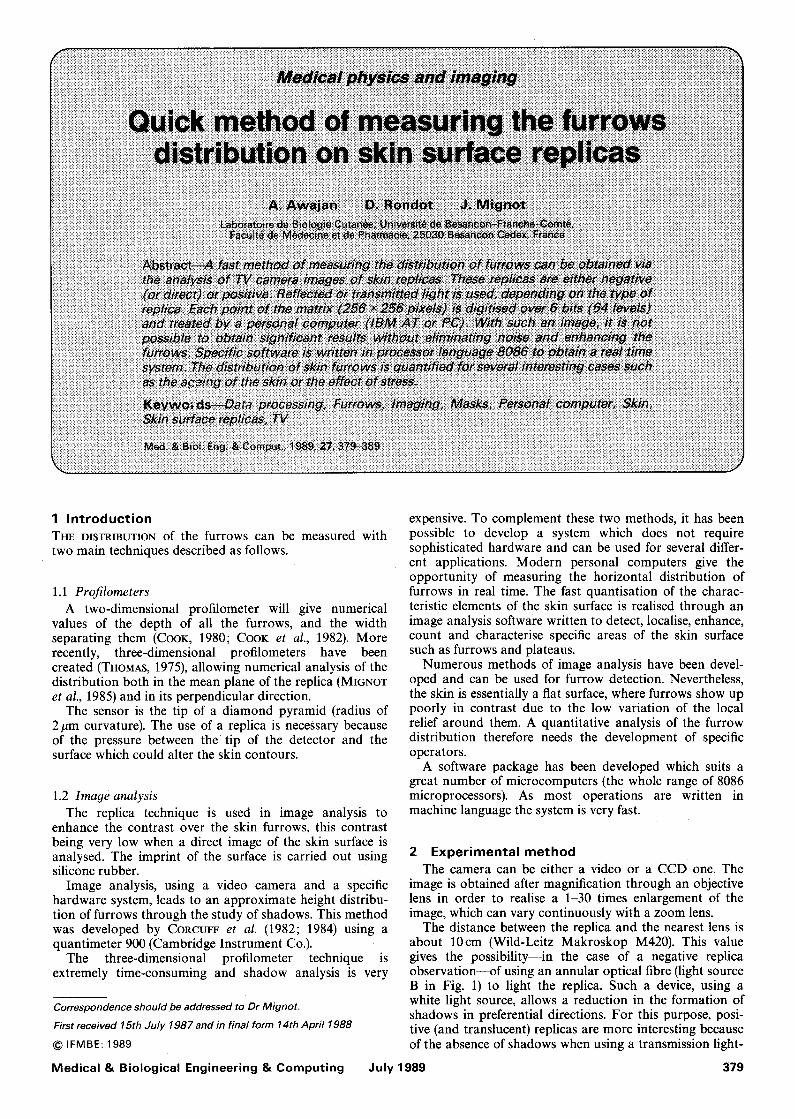
8.1 Ageing of the skin and distribution of the furrows In the present example, abdomen skin replicas of 5, 25,
55 and 75-year-old male subjects are studied. In each of these four classes, results are obtained from the study of five subjects. Corresponding numerical values are sum- marised in Table 1, which gives the density of furrows (in per cent) in each of the eight directions (the D s direction corresponds to the body axis) and the total density.
One can see an increase of the density in directions neighbouring the axis of the body for the oldest subjects and a decrease of the density in all the directions near the perpendicular of the preceding ones (67.5 to 157~ Another result shows that the values are approximately the same in the two younger groups (5 and 25). An observation of
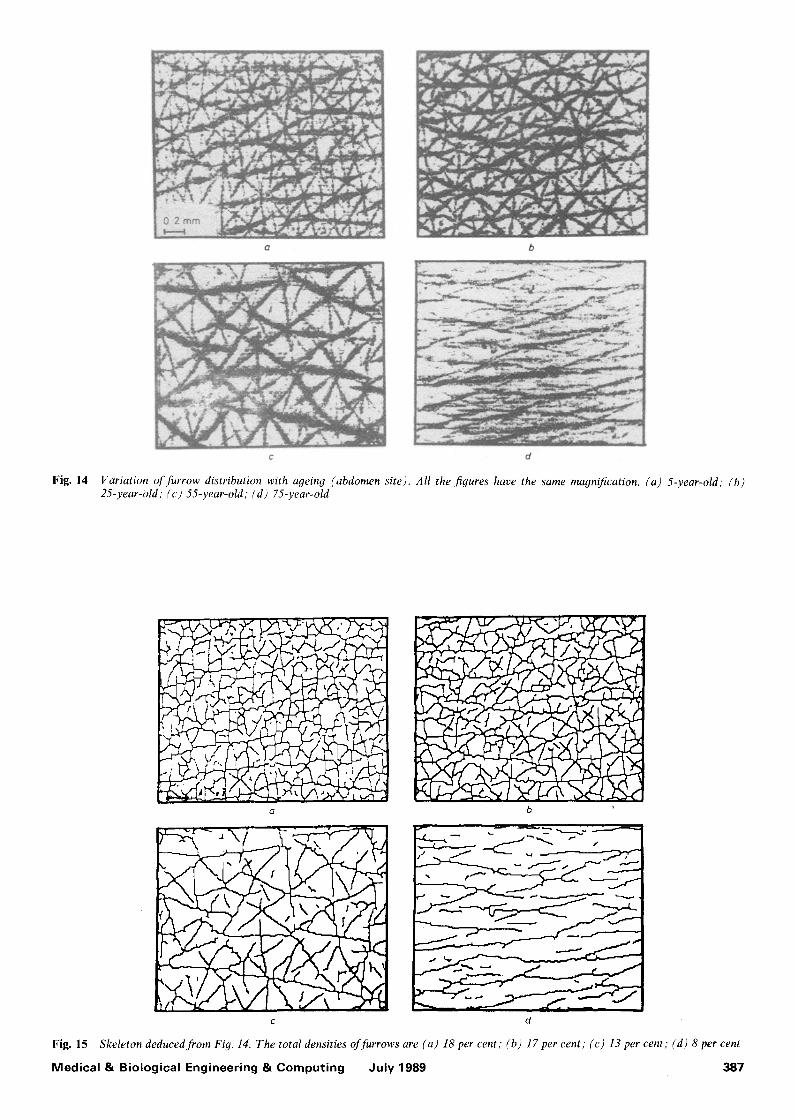
typical images in Fig. 14 (initial images) and Fig. 15 (skele- tons of the previous images) confirms such a conclusion. The total density of all the furrows decreases with ageing. This decrease is due to the arrangement of the secondary furrows showing a decrease of their number but an increase of their mean depth.
8.2 Effects of tensile stresses Only two values of deformation are used here (2 and 5
per cent) which are compared with the initial state (0 per cent). The aim of this choice is to show that even in the case of a very light deformation, the skin surface modifi- cations are sufficient to be detected by the present method. The deformation given by the translation of two skids stuck on the skin surface is applied by a tensile micro- machine.
The total density of furrows is measured as well as its value in each of the eight previous directions. The zero direction corresponds to the tensile axis. The same area is used for image analysis at different stages of the deforma- tion. Fig. 16 shows the modifications of the area: points A, B, C and D refer to similar zones at different levels of the deformation.
The numerical values given in Tables 2 and 3 are obtained from the mean value of five measurements taken on the same subject on four different areas. An overall decrease of furrow density is seen, as well as an increase of the density in the vicinity of the tensile axis and a decrease in other directions.
Such a method can be applied to the study of the defor- mation of the skin in vivo to understand the spreading out of the skin in the first stage of a tensile test (toe region).
9 C o n c l u s i o n s The human skin surface is difficult to treat by image
analysis because of the continuous variations of the grey levels between plateaus and furrows. A very fast method to measure the furrow distribution on a skin replica has been developed by using a very low cost microcomputer associ- ated with a TV camera.
Specific software has been developed to give significant results in real time. Several operators are created to detect, enhance, skeletonise, count and classify the furrows. Such a system makes it possible to study the variations of the skin relief due to external or internal parameters such as drugs, cosmetics, ageing, UV radiation, mechanical stresses etc.
Table 1 Variations of furrow distribution according to ageing (number of segments and density)
Age, years Direction angle, ~ 5 25 55 75
D 1 22'5 1480 2010 1200 2155 22"9 per cent 31.5 per cent 28 per cent 73.2 per cent
D 2 45 1122 1326 822 492 17-3 per cent 20-8 per cent 19.2 per cent 16.7 per cent
D 3 67.5 532 413 287 28 8.2 per cent 6-7 per cent 6.7 per cent 0.9 per cent
D 4 90 972 768 498 12 15.1 per cent 12.1 per cent 11.6 per cent 0-5 per cent
D 5 112-5 815 335 280 10 12-6 per cent 5.3 per cent 6-5 per cent 0.4 per cent
D 6 135 936 864 744 30 14.5 per cent 13.6 per cent 17.4 per cent 1 per cent
D 7 157.5 161 182 84 0 2.5 per cent 2.9 per cent 1.0 per cent 0 per cent
D 8 180 450 474 372 216 6.9 per cent 7-4 per cent 8.7 per cent 7.3 per cent
Density 15.96 per cent 15-77 per cent 10.75 per cent 7.08 per cent
3 8 6 M e d i c a l & B i o l o g i c a l E n g i n e e r i n g & C o m p u t i n g J u l y 1 9 8 9
a b
Fig. 14
c d
Variation of furrow distribution with ageing (abdomen site). All the figures have the same magnification. (a) 5-year-old; (b) 25-year-old; ( c ) 55-year-old; ( d ) 75-year-old
Q
C
Fig. 15
Medical & Biological Engineering & Computing
b
~ " 2 . 2 . . _ . . ~ _,-~:_ _"2-"-. . t
Skeleton deduced from Fig. 14. The total densities offurrows are (a) 18 per cent; (b) 17 per cent; (c) 13 per cent; (d) 8 per cent
July 1989 387

Fig. 16 (a) Initial image; (b) corresponding skeleton; (c) same area after 2 per cent elongation; (d) skeleton; (e) after 5 per cent elongation; (f) skeleton
Table 2 Variations of furrow density (per cent) according to the direction (zero direction corresponds to the tensile axis) (areas 1 and 2)
Area 1 Area 2
Angle, ~ 0 per cent 2 per cent 5 per cent Variation 0 per cent 2 per cent 5 per cent Variation
90 28' 1 23.8 23.5 26.9 24.1 20-6 67-5 8"0 9.5 6.9 0 8.2 7-7 8-1 0 45 21 "3 24-4 16-4 0 18.5 17.7 25'8 + 22.5 6-2 7.0 7.8 + + 6.1 6.5 7"5 + +
0 14"5 17.9 18.0 + + 15.4 17.0 16.8 + + -22 .5 4.2 5.1 8.4 + + 5.0 5-1 6"2 + + - 4 5 13:6 8.7 13.1 0 14.5 16.8 11.4 0 --67-5 4.1 3.9 5-7 + 5"5 5'3 3"6
Density of furrows 7-6 7.4 7.5 9"0 9.1 7.6
388 Medical & Biological Engineering & Computing July 1989

Table 3 Variations of the furrow density (per cent) according to the direction (zero direction corresponds to the tensile axis) (areas 3 and 4)
Area 3 Area 4
Angle, ~ 0 per cent 2 per cent 5 per cent Variation 0 per cent 2 per cent 5 per cent Variation
90 21.4 20.5 20.0 29.5 23.6 22-1 - - 67.5 9-3 6.6 12.4 0 9-1 6"5 8.7 0 45 19.2 18-2 26.4 + 15'9 18.7 23.2 + 22.5 6.7 7-5 8-3 + + 5.8 6.3 7.5 + +
0 16-0 17.7 20.3 + + 15.4 17.5 18.2 + + -22-5 5.7 6.4 5.7 + 5.4 5.5 7"3 + + - 4 5 17.8 20.0 7.6 13-2 16.4 12.0 0 -67.5 6-7 6.1 3.9 5-7 5.5 3.2
Density of furrows 10-1 9-8 8"3 8"71 8.7 7.2
References AWAJAN, A., MIGNOT, J., RONDOT, D. and STAMON, G. (1987) The
detection and analysis of the linear forms of an image. Derma- tological application. Proc. Mari 87/Cognitiva 87, Paris, France, 18th-22nd May 1987, 2, 320-325.
COOK, T. H. (1980) Profilometry of skin. A useful tool for the substantiation of cosmetic efficacy. J. Soc. Costa. Chem., 31, 339-359.
COOK, T. H., CRAFT, T. J., BRUNELL, R. L., NORRIS, F. and GRIFFIN, W. (1982) Quantification of the skin's topography by skin profilometry. Int. J. Cosmet. Sci., 4, 195-205.
CORCLrFF, P., DE RIGAL, J. and LEVEQLrE, J. L. (1982) Image analysis of the cutaneous microrelief. Bioeng. Skin, 4, 16-31.
CORCUFF, P., DE RIGAL, J., LEVEQUE, J. L., MAKKI, S. and AGACHE, P. (1983) Skin relief and ageing. J. Soc. Cosmet. Chem., 34, 177-190.
CORCUFF, P., CHA~NAY, F. and LEVEQUE, J. L. (1984) A fully automated system to study skin surface patterns. Int. J. Cosmet. Sci., 6, 167-176.
CORCtrFF, P. (1986) Stereology of the skin surface: a comparison between ageing and U.V. induced injury. Cosmet. Dermatol., 1, 157-163.
DAVIS, L. S. (1975) A survey of edge-detection techniques. Comput. Graph. Im. Proc., 4, 248-270.
GRANT, G. and READ, A. F. (1981) An efficient algorithm for boundary tracing and feature extraction. Ibid., 17, 225-237.
GROCH, W. D. (1982) Extraction of line shaped objects from aerial images using a special operator to analyse the profiles of functions. Ibid., 18, 347-358.
HOLT, C. M., SINART, A., CUNT, M. and PFROTT, R. H. (1987) An improved parallel thinning algorithm. ACM, 30, 156-160.
LO, H. E. and WANG, P. S. P. (1985) An improved fast parallel thinning algorithm for digital pattern. IEEE Computer Soc. Conf. on Computer Vision and Pattern Recognition, 364-367.
MIGNOT, J., CHUARD, M., ZAHOUANI, H. and AGACHE, P. (1985) Microtopographical analysis of the human skin surface. Bioeng. Skin, 1, 101-110.
NAGAO, M. and MATSUYAMA, T. (1979) Edge preserving smooth- ing. Comput. Graph. Ira. Proc., 9, 394-407.
PATON, K. (1979) Line detection by local methods. Ibid., 9, 316- 332.
PAVLIDIS, T. (1982a) Algorithms for graphics and image processing. Computer Science Press.
PAVLIDIS, T. (1982b) An asynchronous thinning algorithm. Comput. Graph. Ira. Proc., 20, 133-157.
ROSENFELD, A., THURSTON, M. and LEE, Y. H. (1972) Edge and curve detection: further experiments. IEEE Trans., C-21, 677- 714.
ROSENFELD, A. and KAK, A. C. (1982) Digital picture processing (1 and 2). Academic Press, New York, USA.
SHAPIRO, B., PISA, J. and SKLANSKY, J. (1981) Skeleton generation from x, y boundary sequences. Comput. Graph. Ira. Proc., 15, 136-153.
THOMAS, T. R. (1975) Recent advances in the measurement and analysis of surface microgeometry. Wear, 33, 205-233.
VANDERBRUG, G. J. (1975) Semi-linear line detectors. Comput. Graph. Im. Proc., 4, 287-293.
Authors" biographies Arafat Awajan received the masters degree in Electronics & Automatics in 1983 from the University of Orl6ans, France, and the 'Diplome d'Etudes Appronfondies en Sciences Informatiques' from the University of Franche-Comt6, France, and the Doctorate degree in Computing Science in 1988 also from the University of Franche-Comt6. His research interests include biomedical image
analysis and linear features extraction.
Daniel Rondot is University Professor in Metallurgy & Physical Mechanics at the Uni- versity of Franche-Comt6. He gained a masters there in Physics in 1968, a 3rd cycle doctorate thesis in 1970 and a doctorate thesis in Physical Science in 1977. His research inter- ests include metallurgy crystallography, X-ray diffraction and electronic microscopy. Cur- rently surface microanalysis, infra-red ther-
mography and the treatment and analysis of images are his field of study.
Jean Mignot is Professor at the University of Franche-Comt6, France. He received the masters degree in Physics in 1967, a 3rd cycle doctorate thesis in Mechanics in 1969 and a doctorate thesis 'es Sciences Physiques' in 1975, in the same University~ From 1967, his research interests have evolved in the follow- ing successive directions: X-ray analysis of crystallographical structures, stress analysis by
X-ray diffraction, measurement of the surface defects and micro- topography, and image analysis of surfaces.
Medical & Biological Engineering & Computing July 1989 389


![Menschenhaut [Human skin]](https://static.fdokumen.com/doc/165x107/6326d24f24adacd7250b1364/menschenhaut-human-skin.jpg)