Timing and mechanisms of North Atlantic Cenozoic uplift : Evidence for mantle upwelling

Quaternary International 101–102 (2003) 239–251
Quaternary uplift vs tectonic loading: a case study from the LucanianApennine, southern Italy
Marcello Schiattarellaa,*, Paola Di Leob, Paolo Beneducea, Salvatore Ivo Gianoc
aDepartment of Geological Sciences, Basilicata University, I-851000, Potenza, Italyb IMAA-CNR, I- 85050 Tito Scalo (PZ), Italy
cDiSGG, Basilicata University, I-85100 Potenza, Italy
Abstract
Uplift rates have been calculated for a large sector of the Lucanian Apennine (‘‘axial zone’’ of the southern Apennines, Italy),
using both geomorphological observations (elevation values, ages and arrangement of depositional and erosional landsurfaces and
other morpho-tectonic indicators) and stratigraphical and structural data (sea-level-related facies, fault kinematics and offset
estimations). These data have been compared with those derived from clay mineralogy of Mesozoic pelagic successions (Lagonegro
units), outcropping in the same sector of the chain, which gave information on tectonic loading.
The values of the Quaternary uplift rates of the southern Apennines axial zone vary from a minimum of 0:2 mm=yr to a maximumof about 1:2 mm=yr: Intermediate values (0.5–0:7 mm=yr) have been calculated for the other studied areas. Using geomorphologicalfeatures and late Pliocene to Pleistocene successions involved in the genesis of erosional and depositional landsurfaces, the same
rates (B0:6 mm=yr) have been obtained for a large time span (about 2 Ma) in the Melandro basin and adjacent Maddalena Mts.Therefore, during the last 2 Ma; the total uplift amount of the axial zone of the Lucanian Apennine is about 1.2–1:3 km; with localpeaks of 1:5 km: On the other hand, the Mesozoic pelagic units experienced a tectonic loading of 4–5 km; as estimated by means ofillite crystallinity (in the range 0.6–1:1 D12y), percentage of illitic layers in illite/smectite mixed layers (60–90%) and white mica
polytypes (in the range of 10–35%).
The Quaternary uplift and the related erosion rates of the southern Apennines are unquestionably due to strike-slip faulting and,
above all, due to extensional tectonics coupled with thermal/isostatic regional raising. The gap of several kilometres derived from the
comparison between uplift rates and tectonic loading values may be explained only by different exhumation modalities starting from
late Miocene time.
r 2002 Elsevier Science Ltd and INQUA. All rights reserved.
1. Introduction
In many young chains of the Alpine orogenic cycle,Quaternary tectonics and regional uplift are tradition-ally considered strictly correlated and almost synonyms.Actually, few data are available for precise calculationsof uplift rates for different Mediterranean regions,although such quantitative studies are needed to definethe relationships between local faulting and large-scaleuplift due to thermal raising or isostatic compensation,lithosphere delamination or lithospheric thinning andnecking, lithospheric flexure, footwall uplift, crustaldoubling or sub-crustal accretion, slab detachment andconsequent rebound of the subduction hinge. In
addition, data about burial depths of sediments ortectonic loading suffered by sedimentary and low-grademetamorphic rocks are also welcome for comparisonswith the uplift rates obtained in the same areas. Suchcomparisons between quite different data sourcesimprove the comprehension and choice of the mostreliable mechanism responsible for the regional uplift.In this paper, uplift and/or erosion rates have been
calculated for a large sector of the Lucanian Apennine(southern Apennines, Italy), using geomorphological(elevation values, ages and arrangement of depositionaland erosional gently dipping landsurfaces and othermorphotectonic indicators), stratigraphical (sea-level-related facies and marker beds), and structural (faultkinematics and offset estimations) data. The sectorinvestigated covers the ‘‘axial zone’’ of the chain(Ortolani et al., 1992) and includes the Agri River highvalley, the Melandro River basin and surrounding
*Corresponding author. Tel.: +390-971-206-177; fax: +390-971-
206-077.
E-mail address: [email protected] (M. Schiattarella).
1040-6182/02/$ - see front matter r 2002 Elsevier Science Ltd and INQUA. All rights reserved.
PII: S 1 0 4 0 - 6 1 8 2 ( 0 2 ) 0 0 1 2 6 - X

elevated areas, the Pignola Quaternary basin, the Mt LiFoi area and Tito-Picerno basin, and the PotenzaPliocene piggy-back basin.These data have been compared with those derived
from analysis of Mesozoic pelagic successions (Lagone-
gro units), which gave information on tectonic loadingby means of geothermometers based on clay minerals.Triassic to Cretaceous successions outcropping in theLucanian Apennines were analysed. The Monte Facito,Calcari con selce, Scisti silicei and Galestri formationswere chosen because of their regional extent and thehigh frequency in these successions of pelitic layers richin clay minerals. Analysis of this composite dataset allowed inferences concerning geomorphologicaland geodynamic suggestions about the maximumQuaternary uplift and the exhumation age of thesuccessions outcropping along the south-Apenninesaxial zone.
2. Geological and geomorphological setting
The southern Apennines are a northeast-verging fold-and-thrust belt (Fig. 1), built on the western border ofthe Apulian plate from late Oligocene–early Miocenetimes (Pescatore et al., 1999). The belt is mainlycomposed of shallow-water and deep-sea sedimentarycovers, derived from Meso-Cenozoic circum-Tethiandomains and from the Neogene–Pleistocene foredeepdeposits. The Apulian palaeomargin included theLagonegro basin, which was generated by middleTriassic continental rifting (Scandone, 1975). FromLanghian–Tortonian times, the thrust front moved
progressively toward the east, as documented by theage and meaning of syntectonic deposits (Pescatore et al.,1999). Contractional tectonics continued until earlymiddle Pleistocene in the external zone, as indicated insome frontal sectors of the chain (Pieri et al., 1997). Aconservative shortening up to 200 km has been calcu-lated for the orogenic wedge (Schiattarella et al., 1997)and the average uplift rate of the entire chain duringQuaternary times can be estimated at 1 mm=yr:From a geomorphological point of view, the southern
Apennines are characterised by an asymmetric topo-graphic profile. The summit line of the mountain belt ismarkedly shifted toward the inner (i.e. Tyrrhenian)margin, and does not correspond to the regional water-divide. Consequently, the outer flank of the chain has agreater length and a lower mean gradient than theopposite one (Amato et al., 1995). The highest summitsare about 2000 m a.s.l., whereas the mean elevation ofthe whole belt is about 650 m a.s.l. (Amato and Cinque,1999).The mountain belt tops are often characterised by a
gentle topography mainly represented by relics of anancient erosional landsurface, which unconformablycuts lithological contacts, high-angle faults and othertectonic structures (Brancaccio et al., 1991; Russo andSchiattarella, 1992; Amato and Cinque, 1999; Ascioneand Romano, 1999, among others). The regional upliftsuspended the ancient erosional base level to which thisgentle palaeo-landscape was related, triggering a newmorphogenetic stage. The erosional landsurfaces arearranged along the entire orogenic belt in severalsuperimposed generations. In fact, they are located atdifferent elevations both around the top of the
MATERA
POTENZA
Brienza
Tito
SALERNO
NAPLES
Adriatic Sea
Tyrrhenian Sea
Vulture Mount
Somma-Vesuvius
high angle faults
transfer zones
thrusts
thrust front of the chain
volcanoes 0 30 km
NBRADANO FOREDEEP
SOU
TH-APEN
NIN
ES
CH
A IN
A P U L I A NF O R E L A N D
Grumento Nova
a
bc
Fig. 1. Tectonic sketch map of the southern Apennines. The study areas are reported in the frames (from north to south): (a) Tito-Picerno Valley and
Pignola basin; (b) Pergola–Melandro valley; (c) high Agri valley.
M. Schiattarella et al. / Quaternary International 101–102 (2003) 239–251240

mountains and along the flanks of the valleys. Theselandsurfaces are formed of many relics isolated byfluvial dissection and faulting, reaching a maximum sizeof some tens of square kilometres, and are elevated500–1500 m above the valley floors from the Tyrrhenianflank of the chain to the foredeep (Amato and Cinque,1999).In the axial zone of the chain, in which all the study
areas are included (Fig. 1), both Mesozoic to Tertiaryshallow-water carbonates and coeval pelagic successionscrop out. The platform limestone and dolomite mainlyconstitute the western flanks of the Melandro and Agrivalleys, whereas the deep-sea carbonate and siliceoussuccessions (Lagonegro units) form the eastern slopes.The Tito–Picerno area and Potenza basin are locatedinside the outcrop area of the Lagonegro units,unconformably covered by Pliocene marine and Pleis-tocene continental clastics. In all these areas theerosional landsurfaces are significantly present. Theaxial zone was affected by strike-slip faulting during latePliocene–early Pleistocene times, followed by exten-sional tectonics from middle Pleistocene to Present(Schiattarella, 1998; Giano et al., 2000). The represen-tative Lagonegro-type succession analysed in this workto estimate tectonic loading crops out in the LucanianApennine, between Potenza town and Sellata mountainpass (Pignola–Abriola facies, after Scandone, 1972).
3. Morphostructural analysis
The arrangement of erosional and depositional land-surfaces at different heights along the axial zone of theLucanian Apennine has been detected on the bases ofboth field survey and map analysis. The investigationshave been focused along two transects with differentorientations (Fig. 2), which cross, respectively, thevalleys of Pergola–Melandro and Tito–Picerno streamsand the high valley of the Agri River, because of thecapability of this kind of intermontane basins to recordchanges in the erosion base level during the last 2 Ma:Other geological and geomorphological observationshave been carried out in the adjoining areas, such as thePotenza piggy-back basin, where the erosional land-surfaces cut prevalently Pliocene clastics, and thePignola endoreic basins, where the surfaces analysedfor rates calculations represent also the depositional topof Quaternary lacustrine deposits. These surfaces havebeen used as chronological markers to retrace tectonicand morphogenetic events starting from late Plioceneand to calculate regional and local uplift rates of theaxial zone of the chain.The uplift rates have been calculated using the
difference in height between the absolute (i.e. sea level)or local (i.e. present-day thalweg) erosion base levels andthe several generations of landsurfaces. In some cases,
vertical erosion (i.e. incision) rates have been alsocalculated and converted in local uplift rates assumingthat eustatic changes did not produce relevant effects inthis sector of the orogen.The aliquots related to the local uplift often indicate
the amount of uplift due to faulting. Therefore, it ispossible to separate the uplift due to the regional raisingfrom the effects of local tectonics. Two detailedmorphometric profiles have been drawn interceptingNW–SE trending basin-border faults of the Melandroand Agri valleys (Fig. 3). The estimation of the totaloffsets produced by faulting allowed calculation of theslip rates along the fault planes and the comparison ofthese data with the local uplift rates. The last kinematicsof the analysed faults is expressed by normal slipresponsible for major Quaternary dislocations and basinopening during middle to late Pleistocene times (Gianoet al., 2000). Former neotectonic deformational stagesaffected the study areas (Giano et al., 1997) and thewhole south-Apennines chain (Schiattarella, 1998)starting from the late Pliocene, but their strike-slipkinematics with horizontal offsets of few kilometres didnot favour the relief growth and the creation of largeintermontane basins like those generated duringmiddle–late Pleistocene times. This is also documentedby low values of fault activity during late Pliocene–earlyPleistocene time (Fig. 4).
3.1. Tito–Picerno valley
The valley of the Tito–Picerno stream is a NW–SEtrending morphological depression (Fig. 1) mainly cut-ting Pliocene to Pleistocene clastic successions ascribedto the homonymous sedimentary basin. Four orders ofpolygenic landsurfaces, relics of which are well pre-served along the water divides and suspended on thepresent valley floor, are recognizable (S1–S4, A–A0
profile in Fig. 2). Three of them are erosional (S1–S3)whereas the lowest (S4) is depositional (Table 1).According to previous regional interpretations (Bran-caccio et al., 1991; Santangelo, 1991; Amato andCinque, 1999), the ages of these landsurfaces areincluded in a time span ranging from 1.8 to 0:125 Ma:Uplift rates calculation (Table 1) indicates an increase
of the regional raising in a time span from 1.2 to0.8–0:7 Ma (Fig. 4) and a constant rate of the localuplift. Therefore, the total amount of uplift can beconfidently ascribed to the raising of the entire chain.
3.2. Pergola–Melandro valley
The valley of Pergola and Melandro rivers is aNW–SE trending extensional basin (Fig. 1), locallyexhibiting 80–150 m thick Pleistocene continental clasticsuccessions (Santangelo, 1991). Similarly to the Tito–Picerno basin, three erosional landsurfaces were also
M. Schiattarella et al. / Quaternary International 101–102 (2003) 239–251 241

1200
1000 800
600
400
m
a.s
.l.
1400
040
080
0 m
AA
’M
t Sar
cone
La C
onca
Tr
J
P
J
M
M
J G
Mel
andr
o R
iver Q
SS
S1
S2
S3
S2
Mt L
a S
erra
G
Tr
G
SS
SS
SS
S2
SS
SS
SS
S3
S1
P
Tito
Riv
erM
t Car
uso
Mt L
i Foi
GG
M
M
S1
G
S2
S2
S4
Tr
TrTr
SW
NE
Coz
zo C
roce
vie
Tem
pa d
i Con
oC
avol
o R
iver
Ser
ra d
i Mez
zoM
onta
gnon
e
KS
S
G
TrK
K Tr
K
K
LL
SS
CS
MF
Tr
K
CS
SS
br
S2
S3
S3
K
Tr
DD
’
SS
S3
S1
S1
CS
CS
S2
S2
SS
SS
SE
NW
200
400
m0
1000
1200
1400
800
600
a
.s.l.
a
a: br: Q:
P:
M:
Hol
ocen
e al
luvi
al d
epos
its
Plio
cene
con
glom
erat
e
Mio
cene
sili
cicl
astic
uni
ts
Ple
isto
cene
allu
vial
dep
osits
Ple
isto
cene
slo
pe d
epos
its
CL
AS
TIC
S D
EP
OS
ITS
Thr
ust
Nor
mal
faul
t
Str
atig
raph
ic b
ound
ary
Oph
iolit
ic u
nits
(Cre
tace
ous
- Olig
ocen
e)L
:LIG
UR
IAN
BA
SIN
S
late
Plio
cene
- e
arly
Ple
isto
cene
S1:
early
Ple
isto
cene
S2:
mid
dle
Ple
isto
cene
S3:
mid
dle-
late
Ple
isto
cene
S4:
LA
ND
SU
RFA
CE
S
K: J: Tr:
Tria
ssic
dol
omite
Jura
ssic
sha
llow
-wat
er li
mes
tone
Cre
tace
ous
shal
low
-wat
er li
mes
tone
CA
RB
ON
ATE
PL
ATF
OR
M
Gal
estr
i Fm
(C
reta
ceou
s)G
:
Sci
sti S
ilice
i Fm
(Ju
rass
ic)
SS
:
Cal
cari
con
selc
e F
m (
uppe
r T
riass
ic )
CS
:
Mon
te F
acito
Fm
(lo
wer
-mid
dle
Tria
ssic
)M
F:L
AG
ON
EG
RO
BA
SIN
Lege
nd
Tras
curr
ent f
ault
Fig.2.Morphostratigraphicsections(verticalexaggeration¼2x)fromtheaxialzoneoftheLucanianApennine(seeFig.7forlocation).
M. Schiattarella et al. / Quaternary International 101–102 (2003) 239–251242

identified in the Pergola–Melandro basin (S1–S3, A–A0
profile in Fig. 2). From a morpho-chronological point ofview, these gently dipping surfaces can be confidentlycorrelated to those from the basin previously described.The formation of the S1 landsurface can be ascribed tothe late Pliocene–early Pleistocene, as inferred by thepresence of lower–middle Pliocene clastic deposits in LaConca site (Fig. 2) which were involved in the planationof the 1200 m a.s.l. palaeosurface (S1). Adopting acounting-from-the-top criterion and regional-scale basincorrelations, the S2 and S3 landsurfaces ages can beestimated respectively at 1.2 and 0.8–0:7 Ma:The strong analogies between the Pergola–Melandro
and Tito–Picerno basins suggest a similar morphotec-tonic evolution. The B–B0 morphometric profile crossesthe basin-border fault system responsible for thecreation of the accommodation space for the Quatern-ary sediments (Fig. 3). Data about fault system activityshow an increment from 0.3 to 0:5 mm=yr in the timespan of 1.8–1:2 Ma (Fig. 4) and suggest that this system
realised a small offset, compatible with strike-slipfaulting acting in the axial zone of the chain duringearly Pleistocene (Schiattarella, 1998).
3.3. The high Agri valley
The high valley of the Agri River (Fig. 1) is a NW–SEtrending intermontane basin filled up with middle–upperPleistocene continental clastic deposits (Di Niro et al.,1992). Tectonics has strongly controlled geomorpholo-gical and sedimentary evolution of the basin up to thepresent (Di Niro and Giano, 1995; Giano et al., 1997,2000; Cello et al., 2000). The genesis and the earlyPleistocene evolution of the Agri basin were controlledby left-lateral strike-slip N1201-trending master faults,reactivated as normal faults since middle Pleistocenetimes, as observed on a regional scale (Schiattarella,1998).Three erosional landsurfaces (S1–S3) can be identified
in the D–D0 morphometric profile (Fig. 2) across the
Legend
260 m
200 m
140 m
Slip Rate = 0.5 - 0.8 mm/y
1300
1100
900
700
500 m a.s.l.
1000 m0 500
SW NE
Timpa Scodella
Serra Mare
K
TrK
TrK
LM
H
H
br
a
Q
S2
S2
S2
S4S3
C C’
br : Ancient slope deposits (lower Pleistocene)
L : Ophiolitic units (Cretaceous - Oligocene)
SS : Scisti Silicei Fm (Jurassic)
G : Galestri Fm (Cretaceous)
Tr : Triassic dolomite
K : Cretaceous shallow-water limestone
Q : Pleistocene alluvial deposits
H : Holocene colluvial deposits
a : Holocene alluvial deposits
dt : Slope deposits (upper Pleistocene - Holocene)
M : Miocene siliciclastic deposits
Thrust
High-angle fault
Stratigraphic boundary
175 m
250 m
140 m
SW NE
Slip Rate = 0.3 - 0.5 mm/y
1300
1100
900
700
500 m a.s.l.
1000 m0 500
B B’
aQ
K
M K
dtSS
G
Mt Gualacchio
S3
S2
S1
S2
La Serra
M
S3
Melandro River
M
G
Tr
Fig. 3. Detailed morphostratigraphic cross-section (vertical exaggeration ¼ 2x) from Melandro (B–B0) and Agri (C–C0) valleys, adopted for slip rate
calculation (see Fig. 7 for location). Note that the slip rates refer to different time spans (from 1.8 to 1:2 Ma and from 1.2 to 0.8–0:7 Ma for B–B0 and
C–C0 profiles, respectively).
M. Schiattarella et al. / Quaternary International 101–102 (2003) 239–251 243

southwestern side of the valley (Maddalena Mts). Theselandsurfaces are coeval with those surveyed in the basinspreviously described (Table 1), as evidenced by theirelevation and morphological characteristics. An addi-tional both depositional and erosional landsurface (S4),forming the depositional top of middle Pleistoceneconglomerates and cutting Miocene siliciclastic deposits,
is localised at 580–650 m a.s.l., and can be dated at0:125 Ma:Regional and local uplift rates calculated for these
landsurfaces range from 0.44 to 1:16 mm=yr (Table 1),thus showing the highest values in the investigated area.The regional uplift rate shows a constant increasewhereas the local uplift rate is fluctuating (Fig. 4). Slip
S1
S2
200
400
600
800
1000
1200
1400
0.2 0.4 0.6 0.8 1.0 1.2 1.4 1.6 1.8
Age (Ma)
Ele
vatio
n a.
s.l.
(m)
S3
HIGH AGRI VALLEY
S4
0.2
0.4
0.6
0.8
1.0
1.2
1.4
0
S1
0.2 0.4 0.6 0.8 1.0 1.2 1.4 1.6 1.8
Time (Ma)
Upl
ift R
ate
(mm
/y)
Slip
Rat
e
S2
S2
S3
0.8 mm/y
S3
S4
HIGH AGRI VALLEY
Regional Uplift rate
Local Uplift Rate
Slip
Rat
e
0.1 mm/y
Slip Rate
S1
0.5 mm/y
S1
S2
200
400
600
800
1000
1200
1400
0.2 0.4 0.6 0.8 1.0 1.2 1.4 1.6 1.8
Age (Ma)
Ele
vatio
n a.
s.l.
(m)
S3
MELANDRO-LI FOI
S4
0.2
0.4
0.6
0.8
1.0
1.2
1.4
0
S1
0.2 0.4 0.6 0.8 1.0 1.2 1.4 1.6 1.8
Time (Ma)
Upl
ift R
ate
(mm
/y)
MELANDRO-LI FOI
S1
S2
S3
S3
Regional Uplift rate
Local Uplift Rate
0.3 mm/y
Slip
Rat
e
0.5 mm/y
S2
Slip
Rat
e
S4
Fig. 4. Diagrams showing the relationships between elevation and age of the landsurfaces from the study areas and the variation of the related
regional and local uplift rates during Quaternary.
Table 1
Landsurfaces-related morphometric parameters, ages and uplift rates
Erosional and Elevation Mean Age (Ma) Local Regional
depositional range (m) elevation uplift rate uplift rate
landsurfaces a.s.l. (m) (mm/yr) (mm/yr)
Tito–Picerno basin and Pergola–Melandro valley
S1 1250–1150 1200 1.8 0.40 0.66
S2 1025–750 900 1.2 0.35 0.75
S3 750–710 720 0.73 0.34 0.99
S4 575–610 590 0.125 0.52
High Agri valley
S1 > 1300 1400 1.8 0.48 0.78
S2 1250–1000 1200 1.2 0.56 1.0
S3 950–750 850 0.73 0.44 1.16
S4 650–580 620 0.125 0.72
M. Schiattarella et al. / Quaternary International 101–102 (2003) 239–251244

rates calculated on the SW valley flank fault system varyfrom 0.5 to 0:8 mm=yr in the time span from 1.2 to0.8–0:7 Ma (Fig. 3), reaching or exceeding the values ofthe local uplift rates and therefore accounting for themajor part of the total uplift gained during middlePleistocene times. It is worthy to note that in the last30; 000 yr the same fault system was characterised by aslip rate strongly decreased up to 0:1 mm=yr (data fromGiano et al., 2000).
4. Tectonic loading
When sedimentary basins fill and subside, clayminerals undergo diagenetic and very low-grade meta-morphic reactions. Such reactions are equivalent tothose of organic materials that also undergo a series ofirreversible reactions in response to burial and/ortectonic loading. Reactions in both clay minerals andorganic material are irreversible under normal diage-netic and anchizonal conditions, so that upliftedsequences generally retain indices and fabrics indicativeof maximum maturity and burial. Systematic correlationbetween mineral and organic maturity indicators repre-sents a useful tool for integrating the basin maturitystudies of the mineralogists and the petroleum geolo-gists. Since clay minerals are almost invariably presentin basinal sediments, the most common approach is themineralogical one. Rough estimation of temperaturesand determination of diagenetic–metamorphic degree inclay-rich sediments using clay minerals is a well-knownand widely used approach for determining the exhuma-tion history of mountain chains. However, data frommany sources (Essene and Peacor, 1995; Frey andRobinson, 1999; Di Leo, 2001, for a review) suggest thatphyllosilicates in diagenetic and very low-grade meta-morphic conditions do not reflect thermodynamicequilibria and consequently the percentage of illiticlayers in illite/smectite (I/S) mixed layers, illite andchlorite ‘‘crystallinity’’, clay polytypism are mainlyqualitative indicators of the stages the investigatedphyllosilicates have reached through a series of meta-stable mineral reactions (Merriman and Peacor, 1999).Despite this, the illite ‘‘crystallinity’’ and percentage ofillitic layers in I/S mixed layers as well as white micapolytypism are useful indicators of burial depth indifferent geotectonic environments.
4.1. Materials and methods
Fifty-eight clay-rich and shale samples were collectedfrom the entire Pignola–Abriola succession. Threesamples came from the Monte Facito Formation, 18samples came from the Calcari con selce Formation, 31samples came from the Scisti silicei Formation, and sixsamples came from the Galestri Formation.
The mineralogy of the bulk samples and of theo2 mm grain-size fraction was obtained by XRDanalysis (Siemens D5000, CuKa radiation, graphitesecondary monochromator, sample spinner) and thesemi-quantitative distribution of the mineralogicalcomponents (Fig. 5), has been evaluated followingLaviano (1986). Petrographic and textural observationsshowed that all the samples have not suffered severedeformation and are free of veins.In order to determine the degree of post-sedimentary
processes affecting the samples analysed in the presentstudy and the range of temperature they experienced,the most widely XRD-based illite ‘‘crystallinity’’ tech-nique (Merriman and Peacor, 1999, and referencestherein) were used. The illite ‘‘crystallinity’’ techniquemeasures changes in the shape of the first basal reflec-tion (approximately 10 (A) of dioctahedral illite–musco-vite. The most widely adopted method for measuring the10- (A peak profile is still the one first used by K .ubler(1967), which measured the width of the 10- (A peak athalf-height above the background (FWHM). Althoughthis method proved to be an easy-to-use measure ofgrade of diagenesis and incipient metamorphism ofclastic rocks, it is not a direct measure of the ‘‘crystal-linity’’. This is why, hereafter, the term illite ‘‘crystal-linity’’ will be substituted by the term K .ubler Index(KI), where KI values are expressed in D12y:KI values in the clay-rich levels from the Pignola–
Abriola succession were measured on the o2 mm sizefraction XRD patterns from oriented mounts. The samepatterns were also used to estimate the percentage ofillite in the mixed layers I/S, as another indicator ofdiagenesis and low-grade metamorphism (cf. Velde,1992; Pollastro, 1993; Essene and Peacor, 1995), whichallows measurement of the smectite-to-illite-reactionprogress. The oriented mounts were prepared as follows.The material was crushed in a hand mortar and thentransferred to a plastic container for ultrasonic treat-ment for 2–3 min: After settling, the suspension contain-ing the o2 mm grain-size fraction was decanted,pipetted and dried at room temperature on glass slidesto produce a thin layer, highly oriented aggregate with aparticle density of at least 3 mg=cm2: The KI wasmeasured on both air-dried and ethylene-glycol solvatedslides following analytical technique and grain-sizefractions recommendations as specified by Kisch(1991). A good agreement was observed between air-driedand ethylene-glycol measurements of illite crystallinityðR2 ¼ 0:907Þ:The results were calibrated using interlaboratory
standards (Warr and Rice, 1994). The approachedproposed by Warr and Rice (1994) attempted to remedysome of the problems relative to KI measurements witha set of four interlaboratory standards (CrystallinityIndex Standard, CIS) representing metapelites from latediagenetic zone to the epizone, plus a muscovite flake.
M. Schiattarella et al. / Quaternary International 101–102 (2003) 239–251 245

These were prepared following the same procedureadopted for the samples and analysed using the samemachine conditions used to collect the XRD patterns ofsamples. By comparing the observed KI values withthose reported by Warr and Rice (1994) for the fivestandards a regression was derived, which allowedcalibration of KI values (Di Leo, 2001).The percentage of 2M1 polytype of white mica was
measured using a Nonius PDS X-ray diffractometer.XRD patterns of randomly oriented o2mm fractionside-packed mounts were analysed following the quan-tification methods used at the Mineralogy Departmentof the Natural History Museum in London (Cressey andSchofield, 1996; Batchelder and Cressey, 1998) and theLINKFIT program.
4.2. Estimate of tectonic loading
The mineralogy of clay-rich beds from Lagonegrounits is mainly composed of illite and quartz (Fig. 5).
Calcite is observed in the lower part of the Pignola–Abriola succession, i.e. in the Monte Facito and Calcari
con selce formations, and plagioclases are only observedin the pelitic and cherty members from Scisti silicei
Formation (for member definition see Di Leo et al.,2002) and in the Galestri Formation. Clay minerals arenot homogeneously distributed along the succession(Fig. 5). In the Monte Facito and Calcari con selce
Formations illite prevails, in the Scisti silicei FormationI/S mixed layers are dominant, and in the Galestri
Formation kaolinite as well as I/S mixed layers areabundant.Illite ‘‘crystallinity’’ (expressed as KI values), % of
illitic layers in I/S mixed layers, and percentage of 2M1
polytype were measured in the above-mentioned forma-tions as indicators of diagenesis and low-grade meta-morphism and to estimate tectonic loading experiencedby the Mesozoic pelagic successions (Lagonegro units).Starting from the stratigraphically lower Monte Facito
Formation to the upper Galestri Formation (Fig. 6),
Fig. 5. Variation of the bulk and less than 2-mm mineralogy of pelitic layers in the Pignola–Abriola section.
M. Schiattarella et al. / Quaternary International 101–102 (2003) 239–251246

KI values show a clear increasing trend with valuesranging between 0.6 and 1:1 D12y ðmode ¼ 0:88 D12yÞ:Small amounts of coarse-grained illite (Gharrabi andVelde, 1995) with KI values o0:4 D12y were alsofound in some samples from the upper part of thePignola–Abriola succession, i.e. in the cherty-member ofScisti silicei and in the Galestri formations (Fig. 6).The stratigraphic position of the samples where thecoarse-grained illite was observed—samples containingillite with KI values typical of anchizone were foundin a stratigraphically higher position with respect tothose containing illite with KI typical of diageneticzone—suggests this mineralogical phase is mainlydetrital. This illite was not taken into account in definingmaximum temperatures and tectonic loading. The KIvalues observed all along the Pignola–Abriola successionsuggest temperatures in the range of 100–1801C:Relationships between temperatures and KI values
have been defined by many authors in differentgeotectonic settings (e.g. Jaboyedoff and Th!elin, 1996;see also Frey and Robinson, 1999, for a review).However, the basin maturity chart showing correlationof reaction progress in the smectite–I/S–illite serieswith temperature and maturation stages and someorganic maturity indices proposed by Merriman andFrey (1999) seems to be, so far, the most exhaus-tive, since it was defined on data sets from a widenumber of geological settings where clay minerals havebeen used to define temperature and infer tectonicloading.The percentage of illitic layers in I/S mixed layers,
estimated following Moore and Reynolds (1997) sugges-tions, is in the range of 75–90% (R ¼ 1 and 3 ordering,Reickeweite number) for the Scisti silicei Formation anddecreases to 60–70% (R ¼ 0:5–1 ordering) upsection, i.e.in the samples from the Galestri Formation (Fig. 6). The
Fig. 6. Variation of the KI and of the percentage illite content of the I/S mixed layers, as index of the smectite-to-illite reaction progress, through the
Pignola–Abriola succession. Depth-related sample clusters are represented as mean values with error bars.
M. Schiattarella et al. / Quaternary International 101–102 (2003) 239–251 247
reaction in which smectite is a reactant and illite aproduct, recognised to occur over a predictable range ofdepth in mudstones, is here used as another comparative‘‘geothermometer’’ jointly with the K .ubler (1967) Index.Usually, the smectite-to-illite reaction concerns the
diagenetic range, whereas the KI improvement and themica polytype 2M1 percentage variation mainly appliesto the early stages of metamorphism, i.e. very low(anchizone) and low (epizone) grades (Chamley, 1995).Many papers have attempted to relate temperature to %of illitic layers in I/S mixed layers. The classic paper byHower et al. (1976) emphasised that the depth-relatedtransformation occurred over the temperature range ofapproximately 60–901C: Weaver and Broekstra (1984)proposed to divide the clay diagenetic evolution intothree stages based on the I/S ratio in the o2 mm sizefraction: (i) ‘‘early diagenesis’’, where a regular mixed-layer I/S is, or should be, present (approximately 60%illite layers; 90–1401C); (ii) ‘‘middle diagenesis’’, whichranges from the first development of a regular mixed-layer phase to the disappearance of a discrete glycolatedpeak for the mixed-layer phase (illite layers > 90%; maxtemperature 2001C); (iii) ‘‘late diagenesis’’, where theglycolated mixed-layer phase appears as an integral partof the illite peak (o10% smectite layers B250–2801C).On the other hand, Jaboyedoff and Th!elin (1996)proposed relationships between the evolution of I/Smixed-layer phase, KI and mica polytypes and tempera-ture and burial depth/tectonic loading, defined in acollisional setting, where the range of temperatures forthe diagenetic zone 100=1301C–200=2501C correspondto a range 60/80–96/98% of illitic layers in I/S mixedlayers and to a range 1–0:39 D12y of KI. Further,Merriman and Frey (1999), based on data from a widernumber of geological settings, referred a maximumtemperature of 1801C to % of I in I/S mixed layers in therange 60–90%. Similarly to the KI, to estimatetemperatures from clay minerals evolution in thePignola–Abriola succession, the relationships betweentemperature and % of I in I/S mixed layers proposed byMerriman and Frey (1999) were adopted, since theyrefer to a large variety of geological settings and aretherefore more representative of the evolution of suchminerals through time. By integrating data relative tothe percentage of illitic layers in I/S mixed layers with KIvalues, the temperatures experienced by the Lagonegrounits can be estimated in the range 100–1801C:Another indicator of diagenesis and low-grade
metamorphism, commonly used in studies dealing withreconstruction of geological processes, is based on thedefinition of the white mica polytypes, although poly-typic sequence should not be used other than asindicator of reaction progress since accurate correlationwith temperature is not possible (Merriman and Peacor,1999). The existence of an apparent prograde sequenceof polytypism for white micas from 1Md to 1M to 2M1
has been well demonstrated (cf. Velde and Hower, 1963;Hoffman and Hower, 1979). The abundances ofwhite mica polytype 2M1 (in the range of 10–35%)estimated in the Monte Facito, Calcari con selce andScisti silicei Formations are consistent with tempera-tures in the range 100–1801C: Starting from thetemperature estimates by clay minerals-based geothermo-meters and considering an average geothermal gradientof 20–301C=km (Mongelli et al., 1996), a diagenetic/tectonic evolution corresponding to about 4–5 kmtectonic loading can be hypothesised for the Pignola–Abriola succession.
5. Discussion and conclusions
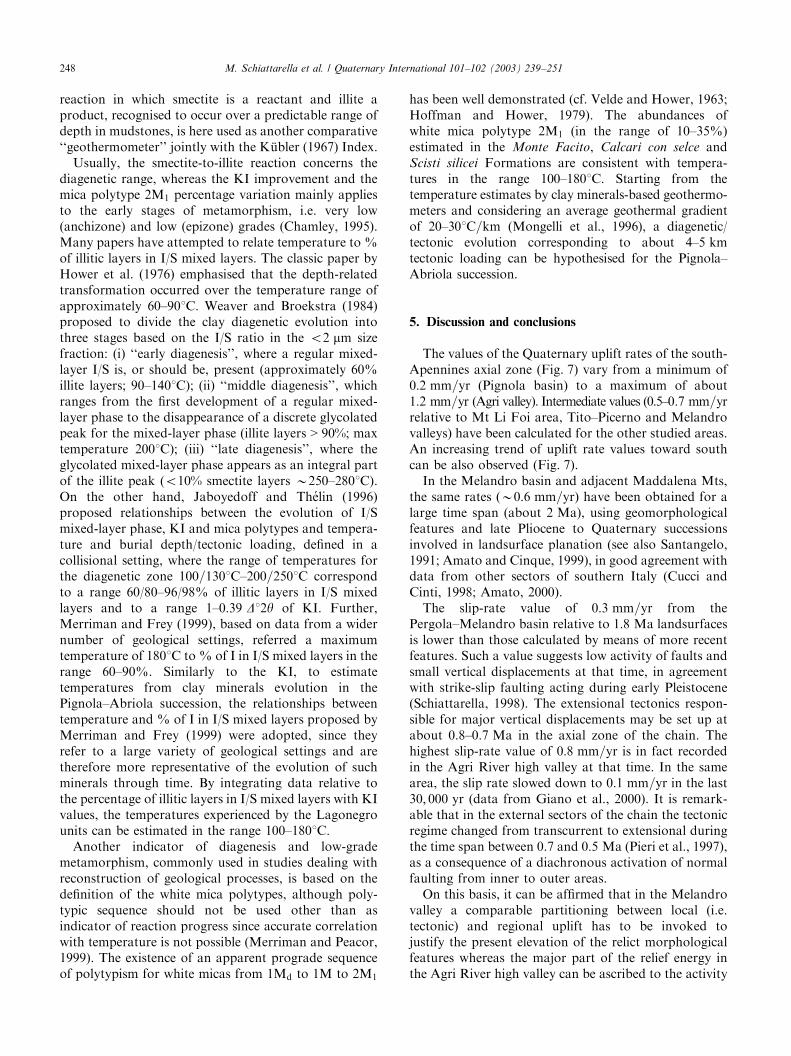
The values of the Quaternary uplift rates of the south-Apennines axial zone (Fig. 7) vary from a minimum of0:2 mm=yr (Pignola basin) to a maximum of about1:2 mm=yr (Agri valley). Intermediate values (0.5–0:7 mm=yrrelative to Mt Li Foi area, Tito–Picerno and Melandrovalleys) have been calculated for the other studied areas.An increasing trend of uplift rate values toward southcan be also observed (Fig. 7).In the Melandro basin and adjacent Maddalena Mts,
the same rates ðB0:6 mm=yrÞ have been obtained for alarge time span (about 2 Ma), using geomorphologicalfeatures and late Pliocene to Quaternary successionsinvolved in landsurface planation (see also Santangelo,1991; Amato and Cinque, 1999), in good agreement withdata from other sectors of southern Italy (Cucci andCinti, 1998; Amato, 2000).The slip-rate value of 0:3 mm=yr from the
Pergola–Melandro basin relative to 1:8 Ma landsurfacesis lower than those calculated by means of more recentfeatures. Such a value suggests low activity of faults andsmall vertical displacements at that time, in agreementwith strike-slip faulting acting during early Pleistocene(Schiattarella, 1998). The extensional tectonics respon-sible for major vertical displacements may be set up atabout 0.8–0:7 Ma in the axial zone of the chain. Thehighest slip-rate value of 0:8 mm=yr is in fact recordedin the Agri River high valley at that time. In the samearea, the slip rate slowed down to 0:1 mm=yr in the last30; 000 yr (data from Giano et al., 2000). It is remark-able that in the external sectors of the chain the tectonicregime changed from transcurrent to extensional duringthe time span between 0.7 and 0:5 Ma (Pieri et al., 1997),as a consequence of a diachronous activation of normalfaulting from inner to outer areas.On this basis, it can be affirmed that in the Melandro
valley a comparable partitioning between local (i.e.tectonic) and regional uplift has to be invoked tojustify the present elevation of the relict morphologicalfeatures whereas the major part of the relief energy inthe Agri River high valley can be ascribed to the activity
M. Schiattarella et al. / Quaternary International 101–102 (2003) 239–251248
of basin-border faults. Yet, also in this area the localmorphostructural offsets have to be coupled withregional uplift of the orogen to reach the total
amount of Quaternary uplift. The southward increas-ing uplift rate trend may be related to the higherfaulting activity in the southernmost part of the
Fig. 7. Arrangement of the uplift rate values along the axial zone of the Lucanian Apennine. Legend of the sketch maps: 1. Plio-Quaternary clastics
and Quaternary volcanics; 2. Miocene syntectonic deposits; 3. Cretaceous to Oligocene ophiolite-bearing internal units (Ligurian units); 4. Meso-
Cenozoic shallow-water carbonates of the Campania–Lucania platform; 5. Lower-middle Triassic to Miocene shallow-water and deep-sea
successions of the Lagonegro, Numidian, and Irpinian basins; 6. Volcano; 7. Thrust front of the chain; 8. Traces of the morphometric profiles shown
in Figs. 2 and 3.
M. Schiattarella et al. / Quaternary International 101–102 (2003) 239–251 249

investigated area. In any case, during the last 2 Ma; thetotal uplift of the axial zone of the Lucanian Apennine isof about 1.2–1:3 km; with local peaks of 1:5 km:On the other hand, in the pelitic beds from Lagonegro
units the mineral assemblage of the o2mm fraction,mainly composed of illite and I/S mixed layers, thepercentage of illitic layers in I/S mixed layers (60–90%,R ordering in the range of 0.5–3), the illite crystallinity(KI mode ¼ 0:88 D12y) as well as the percentage ofwhite mica polytype 2M1 (in the range of 10–35%), areconsistent with a diagenetic/tectonic evolution corre-sponding to 4–5 km burial depth.The Quaternary uplift and the related erosion rates of
the southern Apennines are unquestionably due toextensional tectonics coupled with thermal/isostaticregional raising and, in a minor extent, due to strike-slip faulting acting in the earlier deformational stage ofthe south-Apennines chain. The gap of several kmderiving from the comparison between uplift rates andtectonic loading values may be explained only withdifferent exhumation modalities starting from lateMiocene times. This age can be obtained assuming afixed rate of 0:6 mm=yr; which represents the best long-term estimate for the axial zone of the chain. Goingback in time using such a conservative rate to get adenudation value of about 4–5 km; Tortonian age isreached. At that time, contractional tectonics wasstill active in this sector of the southern Apennines.Tectonic erosion (Mancktelow, 2000, and referencestherein) may be taken into account for a reliableexplanation of the discrepancy between the differentdata sources.
Acknowledgements
This study was financially supported by grants toProfessor M. Schiattarella (MIUR Cofin 2000) andDr. P. Di Leo (CNR Agenzia 2000). ProfessorC. Bartolini is kindly acknowledged for helpful com-ments. We are also grateful to Professor M. Fran-ceschelli and to an anonymous referee for their accuraterevision of the manuscript. We wish to thank theMineralogy Department of the Natural History Mu-seum of London for the use of Nonius PDS 120 X-raypowder diffraction system, Dr. Javier Cuadros for hishelp in the estimation of mica polytypes andDr. John S. Loring for his permission to use theLINKFIT program.
References
Amato, A., 2000. Estimating Pleistocene tectonic uplift rates in the
Southeastern Apennines (Italy) from erosional land surfaces and
marine terraces. In: Slaymaker, O. (Ed.), Geomorphology, Human
Activity and Global Environmental Change. Wiley, New York,
pp. 67–87.
Amato, A., Cinque, A., 1999. Erosional landsurfaces of the Campano–
Lucano Apennines (S. Italy): genesis, evolution, and tectonic
implication. Tectonophysics 315, 251–267.
Amato, A., Cinque, A., Santangelo, N., 1995. Il controllo della
struttura e della tettonica plio-quaternaria sull’evoluzione del
reticolo idrografico dell’Appennino meridionale. Studi Geologici
Camerti (Special Volume) (2) 1995, 23–30.
Ascione, A., Romano, P., 1999. Vertical movements on the eastern
margin of the Tyrrhenian extensional basin. New data from
Mt. Bulgheria (Southern Apennines, Italy). Tectonophysics 315,
337–356.
Batchelder, J., Cressey, G., 1998. Rapid, accurate phase quantification
of clay-bearing samples using a position-sensitive X-ray detector.
Clays and Clay Minerals 46, 183–194.
Brancaccio, L., Cinque, A., Romano, P., Rosskopf, C., Russo, F.,
Santangelo, N., Santo, A., 1991. Geomorphology and neotectonic
evolution of a sector of the Tyrrhenian flank of the southern
Apennines (Region of Naples, Italy). Zeitschrift f .ur Geomorpho-
logie (Suppl.) 82, 47–58.
Cello, G., Gambini, R., Mazzoli, S., Read, A., Tondi, E., Zucconi, V.,
2000. Fault zone characteristics and scaling properties of the Val
d’Agri Fault System (Southern Apennines, Italy). Journal of
Geodynamics 29, 293–307.
Chamley, H., 1995. Clay Sedimentology. Springer, Berlin, 620 pp.
Cressey, G., Schofield, P., 1996. Rapid whole-pattern profile-stripping
methods for the quantification of multiphase samples. Powder
Diffraction 11, 35–39.
Cucci, L., Cinti, F.R., 1998. Regional uplift and local tectonic
deformation recorded by the Quaternary marine terraces on the
Ionian coast of the northern Calabria (southern Italy). Tectono-
physics 292, 67–83.
Di Leo, P., 2001. Phase equilibria and geothermobarometry in very
low-grade metapelites. Plinius 26, 168–186.
Di Leo, P., Dinelli, E., Mongelli, G., Schiattarella, M., 2002. Geology
and geochemistry of Jurassic pelagic sediments, Scisti silicei
Formation, southern Apennines, Italy. Sedimentary Geology 150,
229–246.
Di Niro, A., Giano, S.I., 1995. Evoluzione geomorfologica del bordo
orientale dell’Alta Val d’Agri (Basilicata). Studi Geologici Camerti
(Special Volume) (2) 1995, 207–218.
Di Niro, A., Giano, S.I., Santangelo, N., 1992. Primi dati sull’evolu-
zione geomorfologia e sedimentaria del bacino dell’alta Val d’Agri
(Basilicata). Studi Geologici Camerti (Special Volume) (1) 1992,
257–263.
Essene, E.J., Peacor, D.R., 1995. Clay mineral thermometry—a critical
perspective. Clays and Clay Minerals 43, 540–553.
Frey, M., Robinson, D., 1999. Low-grade Metamorphism. Blackwell
Science, Oxford, 313pp.
Gharrabi, M., Velde, B., 1995. Clay mineral evolution in the Illinois
Basin and its causes. Clay Minerals 30, 353–364.
Giano, S.I., Lapenna, V., Piscitelli, S., Schiattarella, M., 1997. Nuovi
dati geologici e geofisici sull’assetto strutturale dei depositi
continentali quaternari dell’alta Val d’Agri (Basilicata). Il Quater-
nario 10, 591–596.
Giano, S.I., Maschio, L., Alessio, M., Ferranti, L., Improta, S.,
Schiattarella, M., 2000. Radiocarbon dating of active faulting in
the Agri high valley, southern Italy. Journal of Geodynamics 29,
371–386.
Hoffman, J., Hower, J., 1979. Clay mineral assemblages as low grade
metamorphic geothermometers: application to the thrust faulted
Disturbed Belt of Montana, U.S.A. Society of Economic Paleon-
tologists and Mineralogists, Special Publication 26, 55–79.
Hower, J., Eslinger, E.V., Hower, M.E., Perry, E.A., 1976. Mechanism
of burial metamorphism of argillaceous sediment: mineralogical
M. Schiattarella et al. / Quaternary International 101–102 (2003) 239–251250

and chemical evidence. Geological Society of America Bulletin 87,
725–737.
Jaboyedoff, M., Th!elin, P., 1996. New data on low-grade metamorph-
ism in the Brian-connais domain of the prealps, Western Switzer-
land. European Journal of Mineralogy 8, 577–592.
Kisch, H.J., 1991. Illite crystallinity: recommendations on samples
preparation, X-ray diffraction settings, and interlaboratory sam-
ples. Journal of Metamorphic Geology 9, 665–670.
K .ubler, B., 1967. La cristallinit!e de l’illite et les zones tout "a fait
sup!erieurs du m!etamorphisme. In: K .ubler, B. (Ed.), Etages
tectoniques, Colloques de Neuch#atel. Universit!e Neuch#atel "a la
Baconni"ere. Neuch#atel, Switzerland, pp. 105–121.
Laviano, R., 1986. Analisi granulometrica di argille: esame dei
principali metodi. In: Procedure di analisi di materiali argillosi,
Proceedings of the Workshop. ENEA S.Teresa, Lerici, La Spezia,
pp. 111–132.
Mancktelow, N., 2000. Exhumation of high-pressure rocks. In:
Ranalli, G., Ricci, C.A., Trommsdorff, V. (Eds.), Crust–Mantle
Interactions. Proceedings of the International School Earth and
Planetary Sciences, Siena, 2000, pp. 41–52.
Merriman, R.J., Frey, M., 1999. Very low-grade metapelites: miner-
alogy, microfabric and measuring reaction progress. In: Frey, M.,
Robinson, D. (Eds.), Low-grade Metamorphism. Blackwell
Science, Oxford, pp. 61–107.
Merriman, R.J., Peacor, D.R., 1999. Very low-grade metapelites:
mineralogy, microfabric and measuring reaction progress. In: Frey,
M., Robinson, D. (Eds.), Low-grade Metamorphism. Blackwell
Science, Oxford, pp. 10–58.
Mongelli, F., Harabaglia, P., Martinelli, G., Squarci, P., Zito, G.,
1996. Nuove misure di flusso geotermico in Italia meridionale:
possibili implicazioni sismotettoniche. Proceedings of the 14th
GNGTS, Rome, October 23–25, 1995.
Moore, D.M., Reynolds, R.C., 1997. X-ray Diffraction and Identifica-
tion of Clay Minerals. Oxford University Press, Oxford, 373pp.
Ortolani, F., Pagliuca, S., Pepe, E., Schiattarella, M., Toccaceli, R.M.,
1992. Active tectonics in the Southern Apennines: relationships
between cover geometries and basement structure. A hypothesis for
a geodynamic model. International Geological Correlation Project
No. 276, Newsletter 5, 413–419.
Pescatore, T., Renda, P., Schiattarella, M., Tramutoli, M., 1999.
Stratigraphic and structural relationships between Meso-Cenozoic
Lagonegro basin and coeval carbonate platforms in southern
Apennines, Italy. Tectonophysics 315, 269–286.
Pieri, P., Vitale, G., Beneduce, P., Doglioni, C., Gallicchio, S.,
Giano, S.I., Loizzo, R., Moretti, M., Prosser, G., Sabato, L.,
Schiattarella, M., Tramutoli, M., Tropeano, M., 1997. Tetto-
nica quaternaria nell’area bradanico-ionica. Il Quaternario 10,
535–542.
Pollastro, R.M., 1993. Consideration of the illite–smectite geotherm-
ometer in hydrocarbon-bearing rocks of Miocene to Mississippian
age. Clays and Clay Minerals 41, 119–133.
Russo, F., Schiattarella, M., 1992. Osservazioni preliminari sull’evo-
luzione morfostrutturale del bacino di Castrovillari (Calabria
settentrionale). Studi Geologici Camerti (Special Volume) (1)
1992, 271–278.
Santangelo, N., 1991. Evoluzione stratigrafica, geomorfologica e
neotettonica di alcuni bacini lacustri del confine campano lucano
(Italia meridionale). Unpublished Ph.D. Thesis. University of
Naples ‘‘Federico II’’, 109 pp.
Scandone, P., 1972. Studi di geologia lucana: Carta dei terreni della
serie calcareo-silico-marnosa e note illustrative. Bollettino della
Societ"a dei Naturalisti in Napoli 81, 225–300.
Scandone, P., 1975. The preorogenic history of the Lagonegro basin
(southern Apennines). In: Squyres, C. (Ed.), Geology of Italy.
The Earth Sciences Society of the Libyan Arabian Republic,
pp. 305–315.
Schiattarella, M., 1998. Quaternary tectonics of the Pollino Ridge,
Calabria–Lucania boundary, southern Italy. In: Holdsworth, R.E.,
Strachan, R.A., Dewey, J.F. (Eds.), Continental Transpressional
and Transtensional Tectonics. Geological Society of London,
Special Publication 135, 341–354.
Schiattarella, M., Doglioni, C., Prosser, G., Tramutoli, M., 1997.
Large-scale geometry and kinematics of the Southern Apennines.
Terra Nova 9 (Abstract Suppl. 1), 109.
Velde, B., 1992. The stability of clays. In: Price, G.D., Ross, N.L.
(Eds.), The Stability of Minerals. Chapman & Hall, London, New
York, pp. 329–335.
Velde, B., Hower, J., 1963. Petrological significance of illite polytypism
in Paleocene sedimentary rocks. American Mineralogist 48,
1239–1254.
Warr, L.N., Rice, A.H.N., 1994. Interlaboratory standardization and
calibration of clay mineral crystallinity and crystal size data.
Journal of Metamorphic Geology 12, 141–152.
Weaver, C.E., Broekstra, B.R., 1984. Illite-mica. In: Weaver, C.E.
(Ed.), Shale–Slate Metamorphism in the Southern Appalachians.
Developments in Petrology 10, 67–97.
M. Schiattarella et al. / Quaternary International 101–102 (2003) 239–251 251
Copyright © 2022 FDOKUMEN