Quasi harmonic lattice dynamics: the phase diagram of benzene
11
Chemical Physics ELSEVIER Chemical Physics 202 (1996) 231-241 Quasi harmonic lattice dynamics: the phase diagram of benzene Raffaele Guido Della Valle, Elisabetta Venuti, Aldo Brillante Dipartimento di Chimica Fisica e lnorganica, Universitd di Bologna, Viale Risorgimento 4, 1-40136 Bologna, Italy Received22 June 1995 Abstract We present a quasi harmonic lattice dynamics calculation for the crystal structure and the phonon frequencies of or- thorhombic and monoclinic benzene as a function of pressure and temperature. We employ a site-site potential model including Coulombic interactions, which were found necessary to obtain the correct low pressure phase. The calculations agree with the measurements in both phases and reproduce very well the experimental phase diagram. When applicable, quasi harmonic lattice dynamics is an accurate and extremely efficient method, which promises to outperform molecular dynamics and Monte Carlo simulations. 1. Introduction The prediction of the thermodynamical behavior of a material starting from a model of the intermolecular potential is a problem of great theoretical and prac- tical importance. The most common line of attack to this problem is through molecular dynamics (MD) or Monte Carlo (MC) simulations. MD and MC are ver- satile and well tested [ 1] statistical methods which are capable of describing both ordered and disordered systems. The main limitations of these methods are their restriction to purely classical mechanics and the huge computational effort which they require even for simple problems. For ordered crystals, where quantum effects are im- portant but all complications due to disorder are ab- sent, an alternative approach may be followed, namely quasi harmonic (QH) lattice dynamics [2-5]. Lattice dynamics (LD) is based on the observation that in a crystal the molecules perform small oscillations about their average positions. Therefore the potential energy may be expanded in power series of the molecular dis- placements. If the series is truncated at the second or- der (the QH approximation), the quantum-mechanical Hamiltonian of the system may be solved analytically [ 6]. All thermodynamical functions, and in particular the Gibbs free energy G, are then directly computable. The crystal structure at thermodynamical equilibrium corresponds to the minimum of G, and may be easily determined by minimizing G numerically. In this paper we present a QH LD calculation for solid benzene. This work is part of a systematic effort [ 7-9 ] to explore the capabilities of lattice dynamics in modeling molecular crystals as a function of pressure and temperature. The initial motivation of this project was the spectroscopic observation of pressure-induced phase transitions in anthracene derivatives [9-11]. These phase transitions and the approximate behavior of the spectra were successfully reproduced by pack- ing energy minimization calculations under pressure [7,9]. Zero-point and entropic effects, neglected in these first calculations, were investigated in a later pa- per [ 8], dedicated to a QH LD calculation of the struc- ture and the phonon frequencies of crystalline naphtha- 0301-0104/96/$15.00 (~) 1996 ElsevierScienceB.V. All fights reserved SSDI 0301-0104(95)00366-5
-
Upload
independent -
Category
Documents
-
view
0 -
download
0
Transcript of Quasi harmonic lattice dynamics: the phase diagram of benzene
Chemical Physics
E L S E V I E R Chemical Physics 202 (1996) 231-241
Quasi harmonic lattice dynamics: the phase diagram of benzene Raf fae l e G u i d o De l l a Valle, E l i sabe t ta Venuti , A l d o Br i l l an te
Dipartimento di Chimica Fisica e lnorganica, Universitd di Bologna, Viale Risorgimento 4, 1-40136 Bologna, Italy
Received 22 June 1995
Abstract
We present a quasi harmonic lattice dynamics calculation for the crystal structure and the phonon frequencies of or- thorhombic and monoclinic benzene as a function of pressure and temperature. We employ a site-site potential model including Coulombic interactions, which were found necessary to obtain the correct low pressure phase. The calculations agree with the measurements in both phases and reproduce very well the experimental phase diagram. When applicable, quasi harmonic lattice dynamics is an accurate and extremely efficient method, which promises to outperform molecular dynamics and Monte Carlo simulations.
1. Introduction
The prediction of the thermodynamical behavior of a material starting from a model of the intermolecular potential is a problem of great theoretical and prac- tical importance. The most common line of attack to this problem is through molecular dynamics (MD) or Monte Carlo (MC) simulations. MD and MC are ver- satile and well tested [ 1 ] statistical methods which are capable of describing both ordered and disordered systems. The main limitations of these methods are their restriction to purely classical mechanics and the huge computational effort which they require even for simple problems.
For ordered crystals, where quantum effects are im- portant but all complications due to disorder are ab- sent, an alternative approach may be followed, namely quasi harmonic (QH) lattice dynamics [2-5]. Lattice dynamics (LD) is based on the observation that in a crystal the molecules perform small oscillations about their average positions. Therefore the potential energy may be expanded in power series of the molecular dis-
placements. If the series is truncated at the second or- der (the QH approximation), the quantum-mechanical Hamiltonian of the system may be solved analytically [ 6]. All thermodynamical functions, and in particular the Gibbs free energy G, are then directly computable. The crystal structure at thermodynamical equilibrium corresponds to the minimum of G, and may be easily determined by minimizing G numerically.
In this paper we present a QH LD calculation for solid benzene. This work is part of a systematic effort [ 7-9 ] to explore the capabilities of lattice dynamics in modeling molecular crystals as a function of pressure and temperature. The initial motivation of this project was the spectroscopic observation of pressure-induced phase transitions in anthracene derivatives [9-11]. These phase transitions and the approximate behavior of the spectra were successfully reproduced by pack- ing energy minimization calculations under pressure [7,9]. Zero-point and entropic effects, neglected in these first calculations, were investigated in a later pa- per [ 8], dedicated to a QH LD calculation of the struc- ture and the phonon frequencies of crystalline naphtha-
0301-0104/96/$15.00 (~) 1996 Elsevier Science B.V. All fights reserved SSDI 0301-0104(95)00366-5

232 R.G. Della Valle et al./Chemical Physics 202 (1996) 231-241
lene. The QH LD results agreed well with the experi- ments as a function of pressure and temperature, and were actually better than the MD results [ 12] in the region ( <50 K) where quantum effects are important. No transition is reported for naphthalene, which was chosen precisely to test the effectiveness of QH LD without the complications due to phase changes. For the anthracene derivatives, since the structure of the high pressure phases was not experimentally known, it was not possible to verify the correctness of the com- puted structures at high pressure.
Benzene, in which a well studied transition between an orthorhombic and a monoclinic phase takes place [ 13-22], is therefore chosen as a model system to test the ability of QH LD in predicting pressure induced phase transitions. We shall mainly discuss the results that may be obtained by using the QH LD method, and investigate how far the method may be stretched before failing completely. The effects of neglecting vibrational anharmonicity and intramolecular degrees of freedom, as is done here without discussion, are commented in the previous paper on naphthalene [ 8], where an analysis of the role of the potential model and the molecular geometry also appears.
2. Methods
2.1. Potential model and molecular geometry
Several attempts have been made to model solid benzene using molecular dynamics (MD), Monte Carlo (MC) [1] and energy minimization [5] meth- ods. These works are based on site-site potential models, with or without electrostatic interactions. As discussed in Refs. [23-29], electrostatic interac- tions play a crucial role in determining the energetic and structural properties of the condensed phases of C6H6 . In fact, for all potentials that we have tested [28,30,31 ], and for all cases in which detailed calcu- lations are available [5,26-37], the models without electrostatic interactions consistently fail to reproduce the correct low pressure phase [5,27-29,32-35] or the proper pressure-volume behavior [ 26,35,37 ].
At low temperatures and pressures benzene is or- thorhombic, rather than monoclinic [ 16,21]. There- fore acceptable potential models should yield a static lattice energy in the orthorhombic structure smaller
than in the monoclinic structure and thus predict the correct equilibrium phase at zero temperature and pressure. Potentials that fail to do so give the wrong ordering of the phases. As far as we know, the only models for which the correct ordering of the or- thorhombic and monoclinic phases has been demon- strated are those of Claessens et al. [33] (six sites with Lennard-Jones interactions, plus a quadrupole in the center of the C6H6 ring), Yashonath et al. [27] (six sites with Buckingham and quadrupolar interac- tions), Hall and Williams (HW) [28] (twelve sites with Buckingham and charge-charge interactions) and Williams and Starr [36,38] (similar to the HW model).
Because of its physical and computational simplic- ity, we have chosen the HW model. This is a pair- wise additive site-site potential of the form ~/'0 = ½ ~-~ij [qiqj/rij + aij exp(-Bi j r i j ) - Cij/r6ij], where the sum is extended to all distances rij between pairs i,j of carbon and hydrogen sites belonging to differ- ent molecules. The charges qi and the Buckingham parameters Aij, Bij and Cij are given in Ref. [28]. The carbon sites reside on the nuclei, while the hy- drogen interaction sites are located on the centers of the electronic charge distribution (a foreshortened C- H bond length of 1.027/~) rather than at the nuclei (C-H bond length of ,~1.090 A [39] ).
It has been found that the effects on the energy of small differences in the molecular geometry is sur- prisingly large [8,38], so that, for our purposes, the assumed geometry is an integral part of the potential model. Our calculations are for rigid C6H6 with the ideal planar D6h symmetry, with the C-H bond length used by HW [28], and with a C-C bond length of 1.394 ~, the average experimental length at 123 K [39].
2.2. Quasi-harmonic free energy
In this work the vibrational contribution to the free energy is computed in the quasi-harmonic (QH) ap- proximation [2-4], i.e. the phonon frequencies b' i are obtained by diagonalizing the dynamical matrix given by the second derivatives of the potential energy of the crystal with respect to molecular displacements. In the QH approximation, the Gibbs free energy of the crystal is written as the free energy of a system of harmonic oscillators (i.e. phonons):
R.G. Della Valle et al./Chemical Physics 202 (1996) 231-241 2 3 3
hpi O(p, r) = + pV + - 7
i
+kBT Z l n 1 - e x p \ kBT]]" (1) i
Here, ~0 is the total potential energy of the crystal in its average structure, pV is the pressure-volume term, ~_, h~i/2 is the zero-point energy, and the last term is the entropic contribution. The sums are extended to all phonon modes i. As q~0, V and the harmonic fre- quencies l.~i depend directly or indirectly on the crystal structure, so does G. The average crystal structure at thermodynamical equilibrium, which corresponds to the minimum of G, is found by systematically chang- ing the structural parameters (i.e. the unit cell axes and angles, and the position and orientation of the C6H6 molecules) until G stops decreasing.
3. Experimental background
The solid phases of benzene have been object of several investigations [ 13-22 ]. Nevertheless, the com- plete phase diagram is far from being completely un- derstood. At atmospheric pressure, benzene freezes at 278.5 K [ 19] into an orthorhombic D{~ phase with four molecules per unit cell [ 16]. The same phase is also formed at room temperature upon compres- sion above 0.07 GPa [ 19,22]. A second crystal struc- ture has been identified by X-ray studies. This is a monoclinic C~h phase [21] with two molecules per unit cell, stable above 1.4 GPa. The behavior of crys- talline benzene under pressure has been well estab- lished [ 18,20], since the early observations of Bridg- man [ 13,14]. Three phases, indicated as I, II and III, have been observed, originating from two pressure in- duced phase transitions at room temperature. These observations were subsequently confirmed by Thiery et al. [ 18], who hypothesized a new phase, IV, above 9 GPa. A following paper from the same authors [ 19] indicates a possible new phase at low T below 1 GPa, indicated as I', whose exact structure is not yet known, though indications are given that the crystal remains orthorhombic. In the same paper the possibility that the monoclinic structure identified by X-ray could be due to benzene III, rather than benzene II, was advanced.
The difficulties encountered in clarifying the ex- perimental phase diagram of benzene appear to arise
from a combination of factors. The solid-solid phase transitions observed in benzene are very sluggish, and is actually possible to keep the orthorhombic phase in a metastable state up to nearly 4 GPa [ 19], well beyond the orthorhombic-monoclinic boundary at 1.4 GPa. Varying temperature and annealing of the sample was moreover a critical factor in keeping metastable phases [ 19]. Finally, since solid benzene samples are usually obtained by compression without any trans- mitting fluid, pressure induced solid-solid transforma- tions are observed in non-hydrostatic conditions.
In view of this situation, given the controversies on the transition between the two monoclinic phases (II and III), and even between the two orthorhombic phases (I and I ~) [ 17-20], we have decided to re- strict the calculations to the two known structures: or- thorhombic D~ [16] (hereafter referred to as phase O) and monoclinic CSh [21] (phase M). With this choice we mean to represent with phase O both or- thorhombic and with phase M both monoclinic phases. The experimental phase diagram to which refer should anyway be unchanged, as the only additional feature, in the pressure range considered up to ~ 4 GPa, is the possible existence of the unknown phase I ~ [19].
4. Calculations
We have computed the structure and phonon fre- quencies for orthorhombic (O-C6H6) and monoclinic (M-C6H6) benzene as a function of pressure and tem- perature by minimizing the QH Gibbs free energy G(p, T) of Eq. ( 1 ) with respect to the structural pa- rameters. To minimize G, we use the crystal energy minimization program WMIN [40]. A lattice dynam- ics program [41 ] is used as a subroutine which com- putes the phonon frequencies and then adds the vibra- tional energy Fvib to q~0 + pV.
The Coulombic interactions (which have an infinite range) are evaluated with Ewald's method [6,41,42] to ensure complete convergence. The Buckingham in- teractions are summed directly up to distances suffi- cient to include at least 2 unit cells in each direction (between 15 and 19/~ depending on the system den- sity). The contribution from longer distances is ap- proximated in the usual way by an integral over a con- tinuum [ 1 ].
To avoid the time consuming sampling over

234
wavevectors k implicit in the sums over phonon modes of Eq. ( 1 ), we follow Refs. [ 8,43,44] by adopting the Debye approximation for the three acoustic branches, and the Einstein approximation for all other branches [ 3,6]. The Debye frequency VD is estimated from the phonon frequencies Pki a t a single k ~ 0, namely k = (¼, ¼, ¼). This is a Chadi-Cohen point optimal for the cubic system [45], which in practice works quite well also for other crystallographic systems [8,45,46]. The average frequency of the acoustic branches is extrapolated with a sin(zrk) law to the Brillouin zone boundary to obtain V D ---- V/-2(1/ki)acousfic . The frequencies of the optical branches are identified with the Einstein frequencies. Further details of this approximation strategy appear elsewhere [ 8].
The error due to the restriction to a single wavevec- tor, which we have estimated by repeating some cal- culations with 10000 wavevectors in the full Brillouin zone to obtain an essentially exact result, is very small. At 293 K, 1.4 GPa, a point on the orthorhombic- monoclinic phase boundary where the accuracy of G matters most, the error on G is less than 0.5% for both O-C6H6 and M-C6H6.
R.G. Della Valle et al./Chemical Physics 202 (1996) 231-241
Table 1 Equilibrium structure of orthorhombic C6H6 at zero pressure
5. Results
5.1. Or thorhombic benzene at ambien t pressure
The HW model [28] was apparently obtained by fitting the equilibrium structure of O-C6H6 to the X- ray structure at 138 K and ambient pressure [ 16]. Therefore, as a first test of the model, we present in Table 1 the crystal structures which yield the mini- mum potential energy (minimum ¢~0) and the min- imum Gibbs free energy (minimum G) at 0 K and at 140 K for O-C6H 6. As expected, the minimum ¢~0 structure (which is a 0 K equilibrium result where all zero-point and entropic effects are neglected) is close to the X-ray data. The RMS deviation with respect to the experimental unit cell axes at 138 K is 0.33 ]k. The RMS deviations grows to 0.49/~, if the zero-point effects are included (minimum G structure at 0 K) and to 1.48 ,~ if also the entropy is considered (min- imum G structure at 140 K). This behavior was ex- pected. Because the axes and the molar volume are already reproduced almost perfectly in the "minimum ~0 conditions", originally used to develop the poten-
Structure Expt. Minimum 40 Minimum G
138 K 0 K 140 K
a (]k) 7.39 7.59 7.68 7.39 b (A) 9.42 8.93 8.74 7.74 c (A) 6.81 7.03 7.23 8.75 V (cm3/mol) 71.37 71.72 73.10 75.32 4'0 (kcai/mol) -12.47 -12.45 -12.34 G (kcal/mol) -10.7 -11.76 -12.91
The structure of orthorhombic C6H6 is computed at the minimum potential energy ¢~o and at the minimum Gibbs free energy G for 0 and 140 K. Calculated cell axes a, b, c and molar volume V are compared to the X-ray data at 138 K [16], while G is compared to the sublimation energy [48]. The potential energy 40 is not directly observable.
tial model, the lattice expansion due to the zero-point and entropic effects necessarily spoils the results.
Fitting a zero temperature calculation to non zero temperature measurements is clearly an inconsistent procedure, which is widely adopted only for its con- venience. Since the equilibrium results for the HW model are comparable to those of other similar cal- culations [5,30,47], and since the free energy at the minima (Table 1) is close to the experimental subli- mation energy [48 ] we consider the spurious increase of the volume in the calculations at non zero temper- atures as a tolerable compromise.
As a further test of the HW model, and to assess the importance of the inconsistency between the ori- gin of the potential and the way it is used, we have computed the frequencies of the k - 0 lattice phonons. We find that the experimental frequencies at 140 K [49,50] are close to those calculated at the corre- sponding miminum G structure (i.e. the 140 K, 0 GPa structure of Table 1). The R.M.S. frequency differ- ence is 10 cm -1 . The distributions of experimental and computed frequencies are statistically very close: the former has a mean of 83 cm - l with a standard de- viation of 23 c m - l, the latter has a mean of 80 c m - l with a standard deviation of 20 c m - 1.
Since the entropic term of Eq. ( 1 ) depends only on the statistical properties of the frequency distribution, and since these appear to be very well modeled, we should obtain a very good description o f the thermal expansion. This is indeed the case, as is shown by Fig. 1, where the molar volumes computed as a function of
R.G. Della Valle et al./Chemical Physics 202 (1996) 231-241 235
80
o
~75
70
65
o •
o 0
I L I
0 I00 200 300 T (K)
65
~"-. 6o
55
50
. ~ ~ r t h o r h o m b i c
ic
o ~
I I L I I 2 4 6 8 10 12
p (GPa)
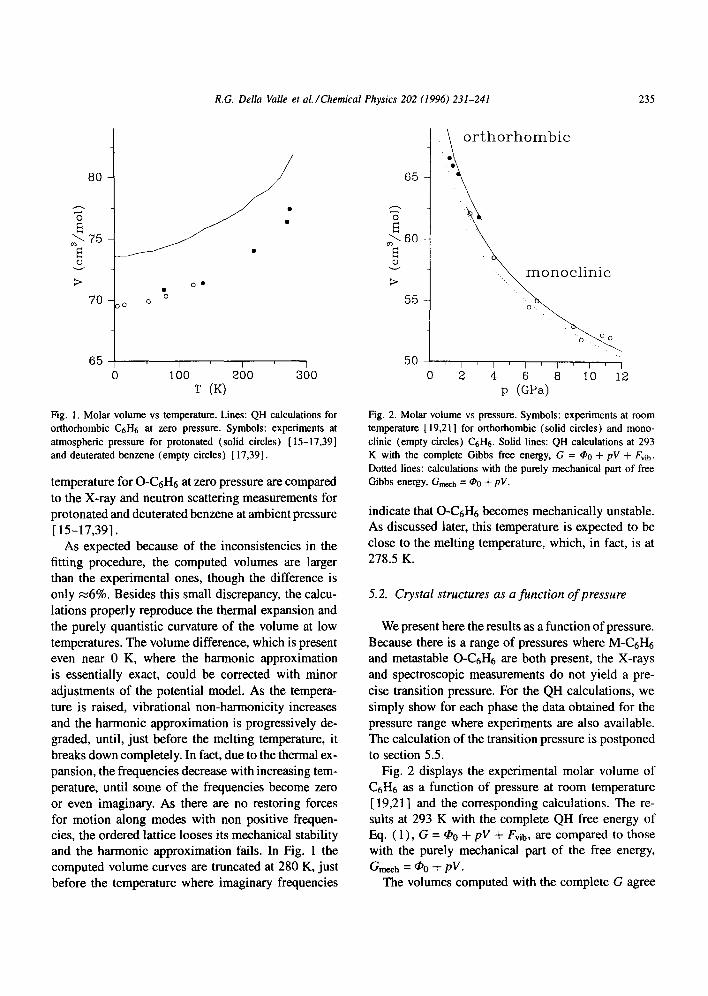
Fig. 1. Molar volume vs temperature. Lines: QH calculations for orthorhombic C6H6 at zero pressure. Symbols: experiments at atmospheric pressure for protonated (solid circles) [15-17,39] and deuterated benzene (empty circles) [17,39].
temperature for O - C 6 H 6 at zero pressure are compared to the X-ray and neutron scattering measurements for protonated and deuterated benzene at ambient pressure [15-17,39].
As expected because of the inconsistencies in the fitting procedure, the computed volumes are larger than the experimental ones, though the difference is only ~6%. Besides this small discrepancy, the calcu- lations properly reproduce the thermal expansion and the purely quantistic curvature of the volume at low temperatures. The volume difference, which is present even near 0 K, where the harmonic approximation is essentially exact, could be corrected with minor adjustments of the potential model. As the tempera- ture is raised, vibrational non-harmonicity increases and the harmonic approximation is progressively de- graded, until, just before the melting temperature, it breaks down completely. In fact, due to the thermal ex- pansion, the frequencies decrease with increasing tem- perature, until some of the frequencies become zero or even imaginary. As there are no restoring forces for motion along modes with non positive frequen- cies, the ordered lattice looses its mechanical stability and the harmonic approximation fails. In Fig. 1 the computed volume curves are truncated at 280 K, just before the temperature where imaginary frequencies
Fig. 2. Molar volume vs pressure. Symbols: experiments at room temperature [ 19,21] for orthorhombic (solid circles) and mono- clinic (empty circles) C6H6. Solid lines: QH calculations at 293 K with the complete Gibbs free energy, G = ~o + pV + Fvib. Dotted lines: calculations with the purely mechanical part of free Gibbs energy, Gmech = @0 -t- pV.
indicate that O-C 6H6 becomes mechanically unstable. As discussed later, this temperature is expected to be close to the melting temperature, which, in fact, is at 278.5 K.
5.2. Crystal structures as a function of pressure
We present here the results as a function of pressure. Because there is a range of pressures where M-C6H6 and metastable O - C 6 H 6 a re both present, the X-rays and spectroscopic measurements do not yield a pre- cise transition pressure. For the QH calculations, we simply show for each phase the data obtained for the pressure range where experiments are also available. The calculation of the transition pressure is postponed to section 5.5.
Fig. 2 displays the experimental molar volume of C6H6 as a function of pressure at room temperature [ 19,21 ] and the corresponding calculations. The re- sults at 293 K with the complete QH free energy of Eq. ( 1 ), G = @0 + pV + Fvib, a re compared to those with the purely mechanical part of the free energy, Gmech = ~0 + pV.
The volumes computed with the complete G agree

236 R.G. Della Valle et al./Chemical Physics 202 (1996) 231-241
very well with the experiments in both the orthorhom- bic and the monoclinic phases. The volume difference between the two structures, which must be attributed to differences in the packing efficiency of the phases and which drives the pressure induced phase transi- tion, is also well reproduced. We have found that the molar volume of M-C6H6 is always smaller than that of O-C6H6, by ~2% on the average.
As shown by Fig. 2, the calculations with the me- chanical free energy Gmech, although not as good as those with the complete G, are still close to the exper- iments. The contraction in volume which arises from neglecting the vibrational contribution is indeed small (~2%) , and the effect on the volume difference is even smaller. In view of these results, it appears quite clear that nothing essential for the physics of the pres- sure induced orthorhombic-monoclinic transition in C6H6 is lost by the restriction to Gmech. The calcula- tion of Gmech, where the vibrational free energy Fvib is neglected, avoids the determination of the phonon frequencies and is therefore less time consuming than the complete calculation.
The unit cell axes a, b and c computed at 293 K as a function of pressure are compared to the room temperature experiments [ 19,21 ] in Fig. 3. The overall trend with pressure and the characteristic behavior of the axes in each phase are both reproduced very well. The good results obtained for the monoclinic phase are particularly significant because no data on M-C6H6 was apparently used in building up the HW potential model [ 28 ].
Possibly due to large experimental errors, the mon- oclinic angle measured at room temperature [ 19,21] seems to oscillate randomly between 111 ° and 109.4 ° in the range of reported pressures, whereas the angle computed at 293 K decreases smoothly and continu- ously from 107.2 ° to 105.4 ° over the pressure range 1.4 to 12 GPa. Computed and experimental angles are quite close, and both change very little with pressure. Due to the problems with the experiments, we have not reported the angle data, and we cannot comment on the detailed behavior as a function of pressure.
5.3. Phonon frequencies as a function of pressure
Benzene, in both its orthorhombic [ 16] and mono- clinic [2l ] phases, is centrosymmetric, and thus ex- hibits mutually exclusive Raman or infrared activity.
9
o< v ~7
~o
°C
I I I I I ' I
2 4 6 8 i0 12 p (GPa)
Fig. 3. Unit cell axes vs pressure. Symbols: experiments at room temperature [ 19,21 ] for orthorhombic (solid circles) and mono- clinic (empty circles) CrH6. Curves: calculations. Axes a, b, c are as indicated near the data.
Since infrared measurements under pressure are very scarce [ 51 ], we focus only on the Raman data. The factor group analysis of the k = 0 lattice modes pre- dicts twelve Raman active modes for O-C6H6 and six for M-CrH6.
The frequencies of the k = 0 Raman active modes, computed at 293 K as a function of pressure are com- pared in Fig. 4 to the available room temperature ex- periments [ 19,51,52]. The range of metastability of O-C6H6 and the transition between the orthorhombic and monoclinic phases are very evident in the experi- mental spectra around 2 GPa. No change in the num- ber of observable bands, and no sudden discontinu- ity or change in the slope of the frequency vs pres- sure curves is noticeable in the region where C6H6
is monoclinic. Therefore, the transition between the two monoclinic phases of C6H6, if genuine, must be a very mild one. Changes in the number of molecules per unit cell, and drastic structural rearrangements are not likely to occur. These observations provide further justification for the adoption of a single monoclinic structure to represent both monoclinic phases.
A detailed comparison between experiments and
R.G. Della Valle et aL/Chemical Physics 202 (1996) 231-241 237
350300t " o °~ °°°
t ~ .... o , , 250 o o°° o °~°°
• o o
0 [ o ° . o f~ .a..oo. ° o o°
200 I ~ ~ I 0 I o
I o0 O o • , o o
ooO.°°-- ]//,4;v.x.,~--", o Oo o o loo i ~f~'o% ~ °
. . . . . . . . . . . .
0 1 2 3 4 5 6 7 8 9 i 0 i i
p (GPa)
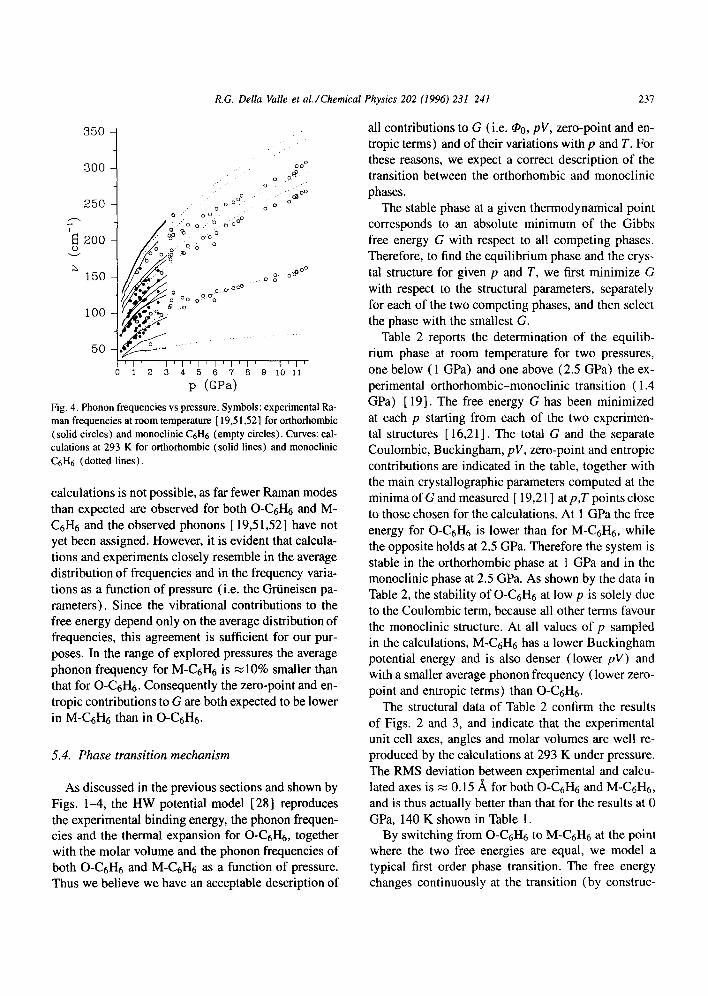
Fig. 4. Phonon frequencies vs pressure. Symbols: experimental Ra- man frequencies at room temperature [ 19,51,52] for orthorhombic (solid circles) and monoclinic C6H6 (empty circles). Curves: cal- culations at 293 K for orthorhombic (solid lines) and monoclinic C6H6 (dotted lines).
calculations is not possible, as far fewer Raman modes than expected are observed for both O-C6H6 and M- C6H6 and the observed phonons [19,51,52] have not yet been assigned. However, it is evident that calcula- tions and experiments closely resemble in the average distribution of frequencies and in the frequency varia- tions as a function of pressure (i.e. the Griineisen pa- rameters). Since the vibrational contributions to the free energy depend only on the average distribution of frequencies, this agreement is sufficient for our pur- poses. In the range of explored pressures the average phonon frequency for M-C6H6 is ~10% smaller than that for O-C6H6. Consequently the zero-point and en- tropic contributions to G are both expected to be lower in M-C6H6 than in O-C6H6.
5.4. Phase transition mechanism
As discussed in the previous sections and shown by Figs. 1-4, the HW potential model [28] reproduces the experimental binding energy, the phonon frequen- cies and the thermal expansion for O-C6H6, together with the molar volume and the phonon frequencies of both O-C6H 6 and M-C6H6 as a function of pressure. Thus we believe we have an acceptable description of
all contributions to G (i.e. q~0, pV, zero-point and en- tropic terms) and of their variations with p and T. For these reasons, we expect a correct description of the transition between the orthorhombic and monoclinic phases.
The stable phase at a given thermodynamical point corresponds to an absolute minimum of the Gibbs free energy G with respect to all competing phases. Therefore, to find the equilibrium phase and the crys- tal structure for given p and T, we first minimize G with respect to the structural parameters, separately for each of the two competing phases, and then select the phase with the smallest G.
Table 2 reports the determination of the equilib- rium phase at room temperature for two pressures, one below ( 1 GPa) and one above (2.5 GPa) the ex- perimental orthorhombic-monoclinic transition (1.4 GPa) [19]. The free energy G has been minimized at each p starting from each of the two experimen- tal structures [ 16,21]. The total G and the separate Coulombic, Buckingham, pV, zero-point and entropic contributions are indicated in the table, together with the main crystallographic parameters computed at the minima of G and measured [ 19,21 ] atp,T points close to those chosen for the calculations. At 1 GPa the free energy for O-C6H6 is lower than for M-C6H6, while the opposite holds at 2.5 GPa. Therefore the system is stable in the orthorhombic phase at 1 GPa and in the monoclinic phase at 2.5 GPa. As shown by the data in Table 2, the stability of O-C6H6 at low p is solely due to the Coulombic term, because all other terms favour the monoclinic structure. At all values of p sampled in the calculations, M-C6H6 has a lower Buckingham potential energy and is also denser (lower pV) and with a smaller average phonon frequency (lower zero- point and entropic terms) than O-C6H6.
The structural data of Table 2 confirm the results of Figs. 2 and 3, and indicate that the experimental unit cell axes, angles and molar volumes are well re- produced by the calculations at 293 K under pressure. The RMS deviation between experimental and calcu- lated axes is ..~ 0.15/~ for both O-C6H6 and M-C6H6, and is thus actually better than that for the results at 0 GPa, 140 K shown in Table 1.
By switching from O-C6H6 to M-C6H6 at the point where the two free energies are equal, we model a typical first order phase transition. The free energy changes continuously at the transition (by construc-

238 R.G. Della Valle et al./Chemical Physics 202 (1996) 231-241
Table 2 Free energy and crystal structure of C6H 6 under pressure
Calculated at 293 K
p = 1.0 GPa p = 2.5 GPa
O M O M
Expt. at 300 K
p ~< 1.2 GPa
O
p = 2.5 GPa
M
Gibbs free energy G total G (kcal/mol) 1.17 1.28 24.76 24.43 Coulombic (kcal/mol) -3.61 -2.46 -3.98 -2.71 Buckingham (kcal/mol) -8.70 -9.25 -6.98 -7.71 pV (kcal/mol) 16.52 16.23 37.83 37.06 zero-point (kcal/mol) 0.80 0.76 1.03 1.01 entropic (kcal/mol) -3.84 -4.00 -3.14 -3.22
Structural parameters a (A.) 7.23 5.37 6.93 5.27 7.17 5.417 b (/~) 9.21 5.43 9.10 5.31 9.28 5.376 c (/~) 6.90 8.09 6.66 7.70 6.65 7.532 /3 (degrees) 107.1 106.9 110 V (cm3/mol) 69.14 67.91 63.32 62.02 66.6 62.1
The total Gibbs free energy G and its Coulombic, Buckingham, pV, zero-point and entropic contributions are given for the orthorhombic (O) and monoclinic (M) structures at 1 and at 2.5 GPa. Computed unit cell axes a, b, c, monoclinic angle/3 and molar volume V for the more stable phase should be compared to the experiments at the closest conditions. The measurements for monoclinic C6H6 are at 2.5 GPa [21]. The pressure for orthorhombic C6H6 is not well determined, but cannot exceed 1.2 GPa [ 19,21 ].
t ion) , while its first derivatives, i.e. the volume V = (OG/ap)r and the entropy S = -(aG/OT)p, change discontinuously from the value for O-C6H6 to that for
M-C6H6. As p increases, the pV term progressively reduces
the relative stability o f the orthorhombic structure with respect to the denser monoclinic structure, until the transition pressures where two free energies become equal is reached. Above the transition O-C6H6 be- comes unstable with respect to M-C6H6. The obser- vation of a pressure range where O-C6H6 coexists metastably with M-C6H6 indicates that a rather large free energy barrier separates the two phases. In the cal- culations we could never obtain a spontaneous sym- metry breaking o f the orthorhombic phase, a finding which is consistent with the existence of a barrier. We like to mention that for fl-9,10-dichloroanthracene [7] , where the experiments suggest a very low bar- rier, the calculations gave a spectacular spontaneous transition under pressure.
Because the entropy difference between O-C6H 6 and M-C6H6 is so small, the transition pressure should change very litt le with temperature. The average phonon frequency is smaller in M-C6H6, so that the
M-C6H6 phase has the larger entropy. Therefore the monoclinic phase becomes more stable at higher T, and the transition pressure should actually decrease slightly with increasing T.
5.5. Phase diagram
We have drawn the phase diagram shown in Fig. 5 by systematically exploring the p,T plane. As previ- ously discussed, for given p,T the system is in phase O if Go(p, T) < GM (p, T), and in phase M if the op- posite holds. Because the structural optimization re- quired to minimize Go and GM is quite t ime con- suming, it is desiderable to reduce the number o f p ,T points to be sampled.
To locate the O - M phase boundary, we have searched a range of temperatures. For a given T, we know that a transition occurs between pressures p and p + Ap if the system is in phase O at p and in phase M at p + Ap. If both points belong to phase O (the low pressure phase) we increase p, whereas if both belong to phase M, we decrease p. Once the transition has been bracketed, the transition pressure at which Go = GM is approximately determined by

800
700
600
5OO
v 400
300
200
100
0
R.G. Della Valle et al./Chemical Physics 202 (1996) 231-241
o
liquid o
2
orthorhornbie / monoel inie
' I ' I I I
0 1 2 3 4 p (GPa)
Fig. 5. Phase diagram of C6H6. Curves: calculated phase bound- aries. Symbols: experiments [19,20,22]. The triangle is the ex- perimental triple point [19]. A precise calculation for the triple point has not been attempted.
239
linear interpolation between p and p + Ap. A similar scheme is used to find the largest tem-
perature at which the system is mechanically stable in the quasi-harmonic approximation, i.e. the approx- imate solid-liquid phase boundary. We recall that an harmonic system is stable only if all vibrational fre- quencies are positive. If, for given p, the system is stable at both T and T + AT, we increase T; if it is un- stable at both points, we decrease T; if it is stable at T and unstable at T + AT, we have finally bracketed the approximate melting temperature. As a function of pressure, we show in the diagram (Fig. 5) the high- est temperature that has been sampled and where the system is still mechanically stable.
The criterion of identifying loss of local mechanical stability with melting is not fully satisfactory as, for in- stance, a super-heated solid, though still mechanically stable, is thermodynamically unstable. Besides, some molecular systems exhibit plastic or disordered phases (which may be mechanically unstable) just below the melting line. Despite these problems, we think that the stability criterion is still practically usable: loss of mechanical stability, although not necessarily exactly coincident with melting, cannot be too distant from it.
As shown by Fig. 5, the calculated phase diagram agrees surprisingly well with the experiments. The
experimental orthorhombic-monoclinic boundary is reproduced almost perfectly, and even the melt- ing line is followed quite closely. As expected, the orthorhombic-monoclinic transition pressure changes very little with temperature, a fact which confirms that entropic effects are not very important and that provides further support for the concept that only the mechanical free energy is of fundamental importance in the orthorhombic-monoclinic transition. The tran- sition pressure computed using only the mechanical part of the free energy, Gmech = tP 0 -+- pV, is at 1.85 GPa. This value should be compared to those obtained with the complete G at 0 and 293 K, that are 1.78 and 1.40 GPa, respectively. The difference with the result at 0 K is solely due to the zero-point energy, whereas also the entropic effects contribute at higher temperature.
6. Conclusions
We have found that the QH LD calculations with the HW potential model [28] agree well with the mea- surements on the structure and phonon frequencies of C6H6 as a function of p and T and reproduce the ex- perimental phase diagram. We were quite surprised by the excellent agreement with the experiments at room temperature and even close the melting line, where anharmonic effects should be important and we ex- pected large discrepancies. For this reason, and be- cause the structural results at 293 K under pressure (Figs. 2 and 3, Table 2) are actually better than those at 140 K, 0 GPa (Fig. 1, Table 1 ), we suspect that the good results at high temperatures are partly due to a fortuitous compensation of errors between the poten- tial and the harmonic approximation rather than to a genuine consequence of the HW potential. Perturba- tive calculations of the anharmonic corrections to the free energy [4] or, more directly, MC or MD simula- tions for the volume-pressure relation and the phase diagram, should be able to clarify the issue.
It must be stressed that in order to calculate the boundary between two phases, we need to know in ad- vance the crystallographic symmetry and the molecu- lar arrangement of the phases. This dependence on the a priori knowledge of the set of possible structures of a material is certainly the most severe limitation of the QH LD method, although, in principle, one could use

240 R.G. Della Valle et al./Chemical Physics 202 (1996) 231-241
a database of typical structures to predict an unfore- casted transition. A prediction of the crystal structure of benzene was attempted by Dzyabchenko [36] by using the potential model of Williams and Starr [38] (which includes Coulombic interactions) as the only input to the calculation. A thorough scanning of the configuration space for several crystallographic space groups produced a variety of potential energy minima. The experimental orthorhombic structure was found to be close to the deepest minimum.
QH LD is a fully quantistic method, which, when applicable, is computationally much more efficient than MD and MC. In fact, if properly implemented, the numerical minimization of the free energy G in QH LD usually requires the evaluation of potential en- ergy and phonon frequencies for a few hundreds con- figurations along the minimization path. By contrast, MD and MC typically need 104 or even 106 different configurations to equilibrate the system and then to obtain satisfactory statistics [ 1 ], Although the calcu- lation of the energy in MC and of the forces in MD are less time consuming than the calculation of the phonon frequencies in LD, the saving is not enough to compensate for the large difference in the number of configurations to be sampled.
Our experience with benzene confirms that of the previous calculations for naphthalene [ 8] and for the anthracene derivatives [7,9], and indicates that the identification of the essential ingredients for a potential capable of modeling an observed thermodynamical be- havior is a very difficult problem. For the specific case of benzene, it is clear that electrostatic interactions are definitely required to reproduce the correct orthorhom- bic structure at low pressures. In fact, as discussed by Williams and coworkers [24,28], the characteris- tic "herring bone" structure of O - C 6 n 6 results from positively charged hydrogens on the edge of the c 6 n 6
molecules, which, being attracted to the negatively charged ring carbons of adjacent molecules, favour an edge-plane orientation of the molecular planes. In ab- sence of electrostatic interactions, isotropic site-site potentials would favour a compact stacked arrange- ment, characterized by coplanar molecular packing, rather than the more loosely packed herring bone struc- ture [ 27 ].
The pressure induced transition between O-C6H 6
and M-CtH6 is driven by the volume difference be- tween the two phases. Entropy differences are not very
important, and their main effect is a small reduction of the transition pressure with increasing temperature. In these conditions a calculation with Gmech = tP0 "q- p V ,
i.e. a very economic energy minimization under pres- sure [7,9,28], reproduces correctly the main features of the phase transition. Not very much is gained by including the vibrational effects. In our opinion the most convenient strategy for modeling pressure in- duced phase transition is to avoid, at least initially, the extra effort for the calculation of the zero-point and entropic effects. These effects may be included later, if an investigation at several temperatures is desired, or when an entropy driven transition is suspected. In presence of disorder, or if the anharmonicity is very large, it may become necessary to switch to MC or MD simulations. However, QH LD may still be use- ful even in this case, because it supplies a very con- venient starting point for computing, through thermo- dynamic integration [ 1,53 ], the absolute free energy of any crystalline phase.
Acknowledgements
This work was supported by Italian CNR and MURST. We thank Claudio Zannoni for helpful sug- gestions.
References
[ 1 ] M.P. Allen and D.J. Tildesley, Computer simulation of liquids (Clarendon Press, Oxford, 1987).
[2] W. Ludwig, Recent developements in lattice theory, Springer Tracts in Modem Physics, Vol. 43 (Springer, Berlin, 1967).
[3] V.N. Zharkov and V.A. Kalinin, Equations of state for solids at high pressure and temperature (Consultants Bureau, New York, 1971).
[4] T.H.K. Barron and M.L. Klein, in: Dynamical properties of solids, eds. G.K. Horton and A.A. Maradudin (North- Holland, Amsterdam, 1974).
[5] A.J. Pertsin and A.I. Kitaigorodsky, The atom-atom potential method (Springer, Berlin, 1987).
[6l M. Born and K. Huang, Dynamical theory of crystal lattices (Oxford Univ. Press, Oxford, 1954).
[7] R.G. Della VaUe and A. Brillante, J. Chem. Phys. 100 (1994) 7640.
[8] R.G. Della Valle, E. Venuti and A. Brillante, Chem. Phys. 198 (1995) 78.
[9] A. Brillante, R.G. Della Valle, R. Farina and E. Venuti, Chem. Phys. 190 (1995) 177.

R.G. Della Valle et al./Chemical Physics 202 (1996) 231-241 241
[10l A. Brillante, K. Reimann and K. Syassen, Chem. Phys. Letters 151 (1988) 243.
[ I I I A. Brillante, R.G. Della Valle and K. Syassen, J. Chem. Phys. 89 (1988) 3163.
[ 12[ R.G. Della Valle and G.S. Pawley, Acta Cryst. A 40 (1984) 297.
[13] EW. Bridgman, Phys. Rev. 3 (1914) 153. [ 14] EW. Bridgman, J. Chem. Phys. 9 (1941) 794. [ 15] E.G. Cox, D.W.J. Cruickshank and J.A.S. Smith, Proc. Roy.
Soc. A 247 (1958) I. [16] G.E. Bacon, N.A. Curry and S.A. Wilson, Proc. Roy. Soc.
A 279 (1964) 98. [ 17] M.M. Thi6ry, J.M. Besson and J.L. Bribes, J. Chem. Phys.
96 (1992) 2633. [18] M.M. Thi6ry, K. Kobashi and I.L. Spain, Solid State
Commun. 54 (1985) 95. [191 M.M. Thi6ry and J.M. L6ger, J. Chem. Phys. 89 (1988)
4255. [20] J. Akella and G.C. Kennedy, J. Chem. Phys. 55 (1971) 793. [21] G.J. Piermarini, A.D. Mighell, C.E. Weir and S. Block,
Science 165 (1969) 1250. [221 P. Figuiere, A.H. Fuchs, M. Ghelfenstein and H. Szwarc, J.
Phys. Chem. Solids 39 (1978) 19. [23] D.E. Williams, Acta Cryst. A 30 (1974) 71. 1241 D.E. Williams and Y. Xiao, Acta Cryst. A 49 (1993) I. [25] D.J. Willock, S.L. Price, M. Leslie and C.R.A. Catlow, J.
Comput. Chem. 16 (1995) 628. [261 I". Tominaga and S. Yip, J. Chem. Phys. 100 (1994) 3747. [27] S. Yashonath, S.L. Price and I.R. McDonald, Mol. Phys. 64
(1988) 361. 1281 D. Hall and D.E. Williams, Acta Cryst. A 31 (1975) 56. [29] D. Hall, T.L. Starr, D.E. Williams and M.K. Wood, Acta
Cryst. A 36 (1980) 494. 130] D.E. Williams, J. Chem. Phys. 47 (1967) 4680. [31] G. Filippini and A. Gavezzotti, Acta Cryst. B 49 (1993)
868.
[32] K.V. Mirskaya, I.E. Kozlova and V.E Bereznitskaya, Phys. Stat. Sol. (b) 62 (1974) 291.
[33] M. Claessens, M. Ferrario and J.E Ryckaert, Mol. Phys. 50 (1983) 217.
[34] M. Ferrario and J.P. Ryckaert, Mol. Phys. 54 (1985) 587. [35] D.J. Evans and R.O. Watts, Mol. Phys. 32 (1976) 93. [361 A.V. Dzyabchenko, Zh. Strukt. Khim. 25 (1984) 85. [37] P. Linse, J. Am. Chem. Soc. 106 (1984) 5425. [38] T.L. Starr and D.E. Williams, Acta Cryst. A 33 (1977) 771. 139] G.A. Jeffrey, J.R. Ruble, R.K. McMullan and J.A. Pople,
Proc. Roy. Soc. A 414 (1987) 47. [40] W.R. Busing and M. Matsui, Acta Cryst. A 40 (1984) 532. [41] G.E Signorini, R. Righini and V. Schettino, Chem. Phys.
154 (1991) 245. [42] P.P. Ewald, Ann. Physik 64 (1921) 253. [431 A. Zunger and E. Huler, J. Chem. Phys. 62 (1975) 3010. [44] H. Bonadeo, E. D'Alessio, E. Halac and E. Burgos, J. Chem.
Phys. 68 (1978) 4714. [45] D.J. Chadi and M.L. Cohen, Phys. Rev. B 8 (1973) 5747. [46] R.A. Evarestov and V.P. Smirnov, Phys. Stat. Sol. (b) 119
(1983) 9. [47] P. Pavlides and C.R.A. Catlow, Mol. Phys. 79 (1993) 1025. [48] S. Califano, R. Righini and S.H. Walmsley, Chem. Phys.
Letters 64 (1979) 491. [49] 1. Harada and T. Shimanouchi, J. Chem. Phys. 46 (1967)
2708. [50] H. Bonadeo, M.E Marzocchi, E. Castellucci and S. Califano,
J. Chem. Phys. 57 (1972) 4299. [51 ] D.M. Adams and R. Appleby, J. Chem. Soc. Faraday Trans.
II 73 (1977) 1896. [52] W.D. Ellenson and M. Nicol, J. Chem. Phys. 61 (1974)
1380. [53] D. Frenkel and A.J.C. Lad& J. Chem. Phys. 81 (1984) 3188.