quarterly review june 2018 - Central Bank of Eswatini
84
QUARTERLY REVIEW JUNE 2018 CENTRAL BANK OF ESWATINI
-
Upload
khangminh22 -
Category
Documents
-
view
2 -
download
0
Transcript of quarterly review june 2018 - Central Bank of Eswatini

aCentral Bank of Eswatini Quarterly Review - June 2018
QUARTERLY REVIEWJUNE 2018
CENTRAL BANKOF ESWATINI

b Central Bank of Eswatini Quarterly Review - June 2018

1Central Bank of Eswatini Quarterly Review - June 2018
CENTRAL BANK OF
ESWATINI
QUARTERLY REVIEWJUNE 2018
The Quarterly Review is prepared by the Research Department of the Central Bank of Eswatini
Enquiries concerning the Review should be addressed to:-
GM, Economic Policy, Research and Statistics Central Bank of Eswatini P.O. Box 546 MBABANE, Eswatini Tel: 2408-2243 e-mail: [email protected]
General NotesThe following symbols and conventions are used throughout this review.n.a.: not available -: nil or less than half of the final digit shown
Users should also note that:Owing to the rounding of figures, the sum of separate items will sometimes differ in the final digit from the total shown; and data in the tables are subject to revision from time to time as more current information becomes available.

2 Central Bank of Eswatini Quarterly Review - June 2018
TABLE OF CONTENTS
1. OVERVIEW OF GLOBAL ECONOMIC DEVELOPMENTS .............................................. 7
2. RECENT ECONOMIC DEVELOPMENTS FOR SELECTED ECONOMIES .............................. 8
3. ECONOMIC DEVELOPMENTS IN SOUTH AFRICA .................................................... 12
4. DOMESTIC ECONOMIC DEVELOPMENTS............................................................. 144.1 GENERAL OVERVIEW ........................................................................... 14 4.1.1 Headline Inflation ................................................................... 14 4.1.2 Electricity Consumption ............................................................ 15 4.1.3 Water Consumption ................................................................. 15 4.1.4 Fuel Imports ......................................................................... 15 4.1.5 Exchange Rate/Real Effective Exchange Rate .................................. 15
4.2 MONETARY SECTOR ............................................................................ 18 4.2.1 Net Foreign Assets .................................................................. 18 4.2.2 Gross Official Reserves ............................................................. 19 4.2.3 Credit Extension ..................................................................... 20 4.2.4 Money Supply ........................................................................ 22 4.2.5 Domestic Liquid Assets ............................................................. 22 4.2.6 Interest Rates ........................................................................ 23
4.3 PUBLIC DOMESTIC DEBT ...................................................................... 25 4.3.1 Eswatini Government Treasury Bills .............................................. 26 4.3.2 Eswatini Government Bonds ....................................................... 27 4.3.2.1 Bond Issuances ........................................................... 28 4.3.2.2 Coupon Payments ........................................................ 29 4.3.3 Central Bank Advance to Government ........................................... 30 4.3.4 Promissory Notes .................................................................... 30
4.4 PUBLIC EXTERNAL DEBT ...................................................................... 30 4.4.1 Debt Stock ............................................................................ 30 4.4.2 Disbursements ....................................................................... 31 4.4.3 Debt Service ......................................................................... 31 4.4.4 New Loans/Loan Maturity .......................................................... 31
4.5 BALANCE OF PAYMENTS ....................................................................... 31 4.5.1 Overview ............................................................................. 31 4.5.2 Current Account ..................................................................... 31 4.5.3 Trade Account ....................................................................... 32 4.5.4 Services Account .................................................................... 33 4.5.5 Primary Income ...................................................................... 33 4.5.6 Secondary Income ................................................................... 34 4.5.7 Financial Account ................................................................... 34
5. STATEMENTS OF MONETARY POLICY CONSULTATIVE COMMITTEE ............................... 365.1 Monetary Policy Statement - May 2018..................................................... 36

3Central Bank of Eswatini Quarterly Review - June 2018
LIST OF FIGURES
Figure 1: Gold and Oil Prices (US Dollars) .............................................................. 12Figure 2: South Africa GDP ............................................................................... 13Figure 3: South Africa PPI and CPI ....................................................................... 14Figure 4: Inflation Trends and Components ............................................................ 15Figure 5: Monthly Lilangeni’s NEER/REER Indices ..................................................... 17Figure 6: Cross Atlantic Currency Rates ................................................................ 18Figure 7: Basket Currency Rates ......................................................................... 18Figure 8: Net Foreign Assets .............................................................................. 19Figure 9: Gross Official Reserves and Import Cover .................................................. 19Figure 10: Private Sector Credit ........................................................................... 20Figure 11: Private Sector Credit Composition ........................................................... 21Figure 12: Net Government Balances with Banking Sector ........................................... 21Figure 13: Money Supply.................................................................................... 22Figure 14: Domestic Liquid Assets and Liquidity Ratio................................................. 23Figure 15: Monetary Base, Deposits and Loans ......................................................... 23Figure 16: Interest Rates ................................................................................... 24Figure 17: Treasury Bills and the Average Discount Rate .............................................. 27Figure 18: Treasury Bills and Bonds ....................................................................... 30Figure 19: Current Account ................................................................................ 33Figure 20: Financial Account ............................................................................... 35
LIST OF TABLES
Table 1: Major Economic Indicators .................................................................... 6Table 2: Eswatini Comparative Interest Rates ........................................................ 24Table 3: Savings Deposit Rates for Banks .............................................................. 25Table 4: Public Domestic Debt Portfolio ............................................................... 25Table 5: Public Debt Portfolio By Proportion ......................................................... 26Table 6: Holding of Eswatini Government Treasury Bills ............................................ 26Table 7: Holding of Eswatini Government Bonds ..................................................... 27Table 8: Eswatini Government Bonds listed on Eswatini Stock Exchange ........................ 28Table 9: Second Quarter Coupon Payments ........................................................... 29Table 10: Private Placements ............................................................................. 30Table 11: Standard Critical Value of Debt Ratios ...................................................... 31
4 Central Bank of Eswatini Quarterly Review - June 2018
STATISTICAL TABLES
Central Bank
S 1.1 Central Bank of Eswatini, Assets ..................................................................38S 1.2 Central Bank of Eswatini, Liabilities .............................................................39S 1.3 Denominations of Eswatini Currency Issued by the Central Bank of Eswatini .............40
Money
S 2.1 Depository Corporations Survey ..................................................................41 S 2.1.1 Central Bank of Eswatini Survey .......................................................42 S 2.1.2 Other Depository Corporations Survey ................................................43 S 2.1.3 Depository Corporations Survey ........................................................44S 2.2 Other Depository Corporations and Monetary Ratios ..........................................45S 2.3 Money Supply ........................................................................................46
Commercial Banks
S 3.1 Bank Liquidity Requirements ......................................................................47S 3.2 Bank Reserve Requirements .......................................................................47S 3.3 Bank Liquidity Position ............................................................................48S 3.4 Reserve Requirement Position of the Banks ....................................................49S 3.5 Assets of Other Depository Corporations (Banks and Building Society) .....................50S 3.6 Liabilities of Other Depository Corporations (Banks and Building Society) ................51S 3.7 Total Other Depository Corporations Loans and Advances by Category of Borrowers ..........................................................................52S 3.8 Total Bank Loans and Advances by Type of Industry (Other Non-Financial Corporations) ..............................................................53S 3.9 Ownership of Other Depository Corporations Deposits (Deposits in Foreign Currency Included) ........................................................54S 3.9 Ownership of Other Depository Corporations Deposits (Deposits in Foreign Currency Included) (cont’d) ..............................................55S 3.10 Classification of Selected Other Depository Corporations Deposits .........................56
Money Market
S 4.1 Interest Rates Paid on Deposits in Eswatini (%) .................................................57S 4.2 Comparative Interest Rates: Eswatini and South Africa .......................................58
Government Debt
S 5.1 Outstanding Issues of Eswatini Government Stocks and Stocks Guaranteed by Government .........................................................................................59
S 5.2 Ownership of Eswatini Government Stocks and Bills ..........................................60S 5.3 Maturity Distribution of Eswatini Government Securities ....................................61S 5.4 Government of Eswatini Treasury Bills ...........................................................62

5Central Bank of Eswatini Quarterly Review - June 2018
Budget
S 6.1 Summary of Central Government Operations ...................................................63S 6.2 Eswatini Government Current Revenue ..........................................................64 Balance of Payments
S 7.1 Eswatini’s Summary Balance of Payments .......................................................65S 7.2 Balance of Payments - Financial Account ........................................................66S 7.3 International Investment Position (IIP) ..........................................................67S 7.4 Export of Goods by Commodity Section .........................................................68S 7.5 Import of Goods by Commodity Section .........................................................69S 7.6 Total Public External Debt Stock ..................................................................70S 7.7 Eswatini’s Official Reserves .......................................................................71S 7.8 Eswatini’s Foreign Assets ..........................................................................72S 7.9 Selected Foreign Exchange Rates .................................................................73
Prices
S 8.1 CMA Comparative Price Indices ...................................................................74S 8.2 Eswatini Consumer Inflation .......................................................................75
Real Economy
S 9.1 Mineral Production ..................................................................................76S 9.2 Electricity Consumption ............................................................................77S 9.3 Treated Water Consumption .......................................................................78S 9.4 Construction .........................................................................................79

6 Central Bank of Eswatini Quarterly Review - June 2018
TABLE 1MAJOR ECONOMIC INDICATORS; 2011 - 2017Table 1
MAJOR ECONOMIC INDICATORS
2011 2012 2013 2014 2015 2016 2017REAL SECTOR #Nominal GDP E' Million/1 35,002.13 39,604.66 44,034.14 47,505.46 51,294.29 54,731.75 58,782.83Real GDP (factor cost) - E' Million/1 35,002.13 36,654.59 39,007.04 39,760.27 39,916.79 40,462.11 41,271.61 Real growth rate/1 2.20 4.30 6.40 1.90 0.40 1.40 1.90GDP/Capita/1 32,399.27 33,530.00 35,262.55 35,520.06 35,240.84 35,308.18 36,014.56Agric./GDP (%) - market price/1 9.72 10.38 10.34 9.46 9.59 9.46 8.90Manuf./GDP (%) - markey price/1 31.69 31.39 29.81 30.79 31.78 31.42 30.40Govt./GDP (%) - market price/1 5.96 5.54 6.21 6.38 6.62 7.39 7.67Population ('000)/1 1,067.77 1,080.34 1,093.16 1,106.19 1,119.38 1,132.66 1,145.97Average inflation 6.10 8.95 5.63 5.67 4.96 7.83 6.24
BALANCE OF PAYMENTS - (E' Million)***Merchandise exports 11,637.16 13,807.96 18,646.87 21,743.45 23,121.81 23,358.69 23,951.10
Merchandise imports 11,946.91 13,063.34 14,568.15 16,244.46 15,770.32 20,176.30 20,893.20
Trade balance (309.75) 744.62 4,078.71 5,498.99 7,351.49 3,182.39 3,057.90
Services exports 2,723.01 1,104.72 638.88 1,151.67 1,518.72 875.19 1,634.01
Services imports 7,864.13 2,737.63 3,683.51 4,918.39 4,285.08 2,890.97 4,778.30
Primary income (225.61) (197.96) 416.32 113.60 506.82 (151.38) 537.00
Secondary Income 2,754.74 6,229.46 7,240.89 8,029.65 8,003.16 6,780.66 8,009.31
Current account 456.90 4,985.73 8,256.73 10,101.43 13,379.81 7,795.88 7,386.20
Direct investment (net) (771.27) (320.60) (860.35) (271.21) (538.42) (419.48) 1,661.19
Portfolio investment (net) 305.69 29.72 1,761.59 947.78 315.29 (290.38) 81.50
Other investment (net) (451.63) 2,479.30 2,789.84 6,786.56 11,042.42 9,307.03 6,704.80
Overall balance (660.63) 1,297.66 1,814.02 (214.25) (288.96) (355.78) (733.72)
Exchange rate* (E/US Dollar) 7.26 8.21 9.62 10.85 12.75 14.72 13.32
MONEY AND BANKINGNarrow money growth (%) 13.30 19.30 28.60 (3.50) 11.76 26.76 (5.65)Quasi money growth (%) (1.37) 5.51 9.00 8.76 14.62 26.19 9.12Broad money growth (%) 3.00 10.00 15.90 3.94 13.58 26.39 3.80Domestic credit (net) - E' Million 7,658.88 6,470.29 6,748.70 7,903.91 8,683.43 12,203.66 14,138.18 Government (618.89) (1,589.80) (3,008.44) (2,965.02) (2,737.66) (832.78) (62.55) Private sector 8,277.77 8,060.09 9,757.14 10,868.93 11,421.09 13,037.31 14,200.73Interest rates (% p.a) Prime lending 9.00 8.50 8.50 8.75 9.25 10.50 10.75 Discount rate 5.50 5.00 5.00 5.25 5.75 7.00 7.25 Deposit rate - 31 days 2.43 1.81 1.81 1.94 2.31 3.45 3.44 - 12 months 3.18 2.97 2.97 3.24 3.78 4.89 5.03 - T. bill rate 6.79 6.52 6.29 6.59 6.44 7.95 7.86Ratios
Liquidity ratio (required = 25%) 25.90 26.20 27.08 27.55 26.63 28.70 27.50 Loans/deposits ratio 95.90 85.60 89.85 92.48 84.05 75.10 76.05
Net foreign assets (E) 4,102.96 6,317.16 7,920.29 7,731.61 9,109.54 8,831.28 7,909.50Gross official foreign reserves (end of period) (E) 4,179.40 5,579.67 7,911.01 7,916.08 8,484.84 7,723.04 6,932.60In months of imports of goods and services 2.30 2.90 3.90 3.59 3.80 3.60 3.50
PUBLIC FINANCE [E'Million] Total revenue and grants 7,184.15 12,034.70 13,106.18 14,731.13 14,452.32 14,351.53 16,845.78Total expenditure and net lending (9,132.33) (10,567.40) (12,889.82) (15,304.43) (16,998.65) (21,193.88) (21,779.35)Overall surplus/deficit (1,948.18) 1,467.30 216.36 (573.31) (2,546.33) (6,842.35) (4,933.58) As a % of GDP (5.40) 3.70 0.50 (1.20) (4.80) (12.30) (8.20)External financing (net) (135.94) (146,043.00) 38,642.00 33.07 528.12 (1,208.95) 1,652.42Domestic financing (net) 2,084.12 (1,321,254.00) (255,006.00) 540.24 2,018.20 5,633.41 3,281.16Total external debt** [E' million] 2,772.87 2,715.21 3,400.41 3,567.85 4,427.05 4,919.38 5,453.62 As a % of GDP 7.70 6.79 7.64 7.32 8.42 9.36 9.95 As a % of exports of goods and services 17.32 15.25 16.55 14.97 18.58 20.65 22.89Debt service (E' million) 388.06 359.87 349.13 322.24 383.17 526.25 334.72 As a % of GDP 1.08 0.90 0.78 0.66 0.73 0.96 1.01 As a % of exports of goods and services 2.42 2.02 1.70 1.35 1.50 2.11 1.34
Source: Central Bank, Ministry of Finance and Economic Planning & Development
Note: N/A = Not available
* Exchange rate quoted at average period as at December 2017.
/1 Revised
# GDP figures are based on CSO provisional data and rebased to the new base year 2011.
**Total external debt stock excludes private sector debt from 2010.*** 2014-2017 are now in the new BPM6 format and still subject to further revisions.

7Central Bank of Eswatini Quarterly Review - June 2018
1. OVERVIEW OF GLOBAL ECONOMIC DEVELOPMENTS
According to the IMF World Economic Outlook released in July 2018, global growth expanded by 3.7 per cent in 2017 and is projected at 3.9 per cent in 2018 and 2019 respectively. While headline numbers suggest a broadly unchanged global outlook relative to the April 2018 WEO, underlying revisions point to differing prospects across economies. The baseline forecast assumes gradually tightening but still favourable financial conditions, with localized pressures based on differences in fundamentals. Monetary policy normalization in advanced economies is assumed to proceed in a well-communicated, steady manner. Domestic demand growth (notably investment, which has been an important part of the global recovery) is expected to continue at a strong pace, even as overall output growth slows in some cases where it has been above trend for several quarters.
In the baseline forecast, the direct contractionary effects of recently announced and anticipated trade measures are expected to be small, as these measures affect only a very small share of global trade so far. The baseline forecast also assumes limited spillovers to market sentiment, even if escalating trade tensions are an important downside risk. Advanced economy growth is expected to remain above trend at 2.4 per cent in 2018, similar to 2017 before easing to 2.2 per cent in 2019. The forecast for 2018 is lower by 0.1 percentage point compared to the April 2018 WEO, largely reflecting greater-than-expected growth moderations in the euro area and Japan after several quarters of above-potential growth (IMF WEO, 20 July 2018).
Emerging market and developing economies have experienced powerful crosswinds in recent months: rising oil prices, higher yields in the United States, dollar appreciation, trade tensions, and geopolitical conflict. The outlook for regions and individual economies thus varies depending on how these global forces interact with domestic idiosyncratic factors. Financial conditions remain generally
supportive of growth, though there has been differentiation across countries based on economic fundamentals and political uncertainty. With the updraft on oil exporters from higher oil prices largely offset by the combined drag on other economies from the forces described above, the group’s overall 2018 and 2019 growth forecasts remain unchanged from the April WEO at 4.9 and 5.1 per cent, respectively.
The World Trade Organization’s World Trade Outlook Indicator (WTOI) points to still strong, but slower, expansion of trade volumes in the second quarter of 2018. Worryingly, gauges of export orders and airfreight moderated as global trade tensions hurt confidence. However, the WTOI still points to merchandise trade volumes expanding by 4.4 per cent in 2018 from 4.7 per cent in 2017. The Bank for International Settlements highlights rising protectionist measures, a sudden rise of bond yields, higher borrowing costs for governments and a spike in investor risk aversion as the key risks to the current upturn (WTO, 20 June 2018).
Heightened trade tensions are threatening to disrupt the positive global trend. The Trump administration’s extension of additional import tariffs of 25 per cent and 10 per cent on steel and aluminium products respectively has triggered retaliatory measures by the US’s key trading partners. The European Union has slapped tariffs of between 10 per cent and 50 per cent on a wide range of US goods from agricultural products to textiles and motor vehicles. China is charging tariffs on items spanning agricultural goods, motor vehicles and aircraft worth US$50 billion per year. Canada is levying higher tariffs on US$13 billion of goods, while Japan plans similar measures on US goods totalling US$400 million per year. In Mexico, the victory of the leftists in recent elections will harden attitudes towards the US, and negotiations on the North American Free Trade Area (NAFTA) are likely to collapse (vox.com, 10 July 2018).
The Trump administration has threatened to escalate the punitive measures as these

8 Central Bank of Eswatini Quarterly Review - June 2018
countries reciprocate, and to extend the high tariffs to countries such as Australia, South Korea, Argentina and Brazil if bilateral trade talks with these countries do not yield results favourable to the US. The tit-for-tat measures and the escalating rhetoric could derail the positive momentum of production and investment in the major economic blocs. European carmakers, in particular, face a double whammy of higher tariffs on their products shipped to the US and their shipments to China manufactured in the US. This situation is prompting companies to find ways of mitigating the effects on their bottom line. For instance, US motorcycle maker Harley-Davidson intends to move some of its production from the US to Europe – its second-biggest market after the US – where 16 per cent of its sales are generated. A widespread trade war would hurt developing economies whose production activity is closely linked to industries in the large economies. South Africa is particularly exposed to the car manufacturing supply chain, and the domestic industry would be hurt by lower motor vehicle production in Europe, Japan and the US.
2. RECENT ECONOMIC DEVELOPMENTS FOR SELECTED ECONOMIES
The United States: In the near-term momentum the economy is expected to strengthen temporarily in line with the April WEO forecast, with growth projected at 2.9 per cent in 2018 and 2.7 per cent in 2019. The economy expanded an annualised 2 per cent quarter-on-quarter in the first quarter of 2018, below 2.2 per cent in the second estimate and market expectations. It is the lowest growth rate in a year as business inventories and personal consumption were revised down, the final estimate showed (US Bureau of Economic Analysis, 28 June 2018).
Substantial fiscal stimulus together with already-robust private final demand will lift output further above potential and lower the unemployment rate below levels last registered 50 years ago, creating additional inflationary pressures. Imports are set to pick up with stronger domestic demand, increasing
the US current account deficit and widening excess global imbalances.
However following the protectionist policy narrative adopted by the US Government in recent months, America’s low-income consumers (households) have the most to lose. The protective trade tariffs, border taxes in other barriers will have the effect of reducing spending on consumers and tapping off of overall demand as the trade war persists. The Federal Reserve raised the target range for the federal funds rate by a quarter of a percentage point to a range of between 1.75 per cent and 2 per cent during its June meeting, saying that the labour market has continued to strengthen and that economic activity has been rising at a solid rate. Policymakers projected two additional rate hikes by the end of this year, compared to one previously estimated (US Federal Reserve, 5 July 2018).
The inflation rate in the US edged up to 2.9 per cent in June 2018 from 2.8 per cent in May, matching market expectations. It is the highest rate since February 2012 when inflation was also at 2.9 per cent, due to rising prices for oil and gasoline. The last time inflation was above 2.9 per cent was in December of 2011 when it reached 3 per cent (US Bureau of Labour Statistics, 12 June 2018).
The US unemployment rate rose to 4 per cent in June from 3.8 per cent in the previous month, which was the lowest since April 2000. The number came above market expectations of 3.8 per cent as more entered the labour force (US Bureau of Labour Statistics, 6 July 2018). In the Eurozone: The economy is projected to slow gradually from 2.4 per cent in 2017 to 2.2 per cent in 2018 and to 1.9 per cent in 2019 (a downward revision of 0.2 percentage point for 2018 and 0.1 percentage point for 2019 compared with the April WEO). The economy grew 0.4 per cent quarter-on-quarter in the first three months of 2018, in line with market expectations and following a 0.7 per cent advance in the last quarter of 2017. Forecasts for 2018 growth have been revised down for

9Central Bank of Eswatini Quarterly Review - June 2018
Germany and France after activity softened more than expected in the first quarter, and in Italy, where wider sovereign spreads and tighter financial conditions in the wake of recent political uncertainty are expected to weigh on domestic demand (Eurostat, 7 June 2018).
The European Central Bank (ECB) held its benchmark refinancing rate at 0 per cent on 14 June and said the monthly pace of the net asset purchases will be reduced to €15 billion from September to December 2018, and will then end. The central bank also said it expects key interest rates to remain unchanged at least through the summer of 2019, and in any case for as long as necessary to ensure that the evolution of inflation remains aligned with the current expectations of a sustained adjustment path (European Central Bank, 14 June 2018).
The inflation rate in the Eurozone edged up to 2 per cent year-on-year in June from the previous month’s 1.9 per cent, and in line with market expectations. It is the highest rate since February 2017, mainly boosted by higher prices of energy and food. Annual core inflation, which excludes volatile prices of energy and unprocessed food and tobacco and at which the ECB looks in its policy decisions, is expected to slow to 1 per cent in June from 1.1 per cent in May, also in line with market consensus (Eurostat, 29 June 2018).
The unemployment rate in the Eurozone stood at 8.4 per cent in May, unchanged from the previous month’s revised figure and below 9.2 per cent a year earlier. The jobless rate remained at its lowest level since December 2008, as the number of unemployed continued to fall (Eurostat, 2 July 2018).
The United Kingdom: The economy grew by 0.2 per cent quarter-on-quarter in the three months to March 2018, slightly above the second estimate of 0.1 per cent following a 0.4 per cent expansion in the previous period. Net trade contribution to GDP growth was revised higher. On the production side of the accounts, construction output fell less than initially
thought (UK Office for National Statistics, 29 June 2018). The IMF projects that the UK economy will grow by 1.4 per cent and 1.5 per cent in 2018 and 2018 respectively.
The Bank of England left its key Bank Rate on hold at 0.5 per cent on 21 June 2018, in line with market expectations. However, 3 out of 9 policymakers including the BoE Chief Economist, voted for a rate hike compared with only 2 votes in the previous meeting. The Committee voted unanimously to maintain the stock of UK government bond purchases, financed by the issuance of central bank reserves, at GBP 435 billion. However, the MPC now intends not to reduce the stock of purchased assets until the rate reaches around 1.5 per cent, compared to the previous guidance of around 2 per cent (Bank of England, 21 June 2018).
Consumer price inflation in the UK stood at an annual rate of 2.4 per cent in June, unchanged from the previous month and below market expectations of 2.6 per cent. June’s rate remained at the lowest level since March 2017. Prices of both transport and housing & utilities rose at a faster pace while inflation slowed for recreation & culture and food & non-alcoholic beverages (UK Office for National Statistics, 18 July 2018).
The jobless rate in the UK stood at 4.2 per cent in the three months to May, it’s joint-lowest since 1975. The number of unemployed declined by 12,000 from the December to February period while 137,000 jobs were created, bringing the employment rate to a record high of 75.7 per cent. Still, wage growth eased to a six-month low (UK Office for National Statistics, 17 July 2018). Japan: The GDP growth forecast has been marked down to 1.0 per cent for 2018, a 0.2 percentage point below the April WEO projection following a contraction in the first quarter, owing to weak private consumption and investment. The economy contracted by 0.2 per cent quarter-on-quarter in the quarter to March 2018, unchanged from a preliminary figure and after an upwardly revised 0.3 per cent growth in the previous period. It is the

10 Central Bank of Eswatini Quarterly Review - June 2018
first contraction since the quarter to December 2015, as an unexpected decline in household consumption offset a rise in business spending. On an annualised basis, the economy shrank 0.6 per cent, the same as the preliminary estimate but worse than market consensus of a 0.4 per cent contraction and following an upwardly revised 1 per cent expansion in the preceding quarter (Cabinet Office Japan, 8 June 2018). According to the IMF, the economy is expected to strengthen over the remainder of the year and into 2019, aided by stronger private consumption, external demand, and investment.
The Bank of Japan left its key short-term interest rate unchanged at -0.1 per cent at its June 2018 meeting, as widely expected. Policymakers also kept its 10-year government bond yield target around zero per cent but lowered their assessment on inflation to be in a range of 0.5 to 1 per cent for 2018 fiscal year. Previously in April, the central bank said inflation was moving around 1 per cent (Bank of Japan, 15 June 2018).
Japan’s consumer price inflation stood at 0.7 per cent year-on-year in June 2018, unchanged from the previous month and below market consensus of 0.8 per cent. Food inflation hit its lowest since a deflation in last November while cost of transport rose at a faster pace and cost of housing continued to fall (Statistics Japan, 20 July 2018).
Emerging Markets
Brazil: The economy expanded by 0.4 per cent quarter-on-quarter in the first three months of 2018, following an upwardly revised 0.2 per cent expansion in the previous quarter and in line with market expectations. It marks the fifth straight quarter of growth after a 2-year recession in 2015 and 2016. Household spending rose slightly faster while investment slowed and public expenditure shrank (Trading Economics, 30 May 2018).
The Central Bank of Brazil kept its key Selic rate unchanged at 6.50 per cent on 20 June 2018 following stance taken on 16 May 2018.
The hold, unanimously voted, matched market expectations and was the second hold after eleven straight cuts, keeping borrowing costs at the lowest in modern history amid below-target inflation and a gradually improving economy, albeit recent mixed data. Policymakers highlighted that the temporary halt in the transportation sector in May made it more difficult to assess the recent evolution of economic activity. They also underscored a challenging and volatile global outlook (Trading Economics, 20 June 2018).
Brazil’s annual inflation rate jumped to 4.39 per cent in June 2018 from 2.86 per cent in the previous month. The rate came in slightly below market expectations of 4.42 per cent, still hitting the highest level since March 2017 on the back of persistent currency weakness. On a monthly basis, consumer prices jumped 1.26 per cent in June, following a 0.4 per cent gain in May and almost matching market consensus of 1.28 per cent. It was the highest monthly inflation since January 2016, driven by higher cost for food and beverages (Trading Economics, 6 July 2018).
The unemployment rate in Brazil rose to 12.7 per cent in the three months to May 2018, compared to 12.6 per cent in the December - February 2018 period and market consensus of 12.6 per cent (Trading Economics, 29 June 2018).
Russia: Real GDP growth contracted by 0.38 per cent in the fourth quarter of 2017 following a 0.85 per cent expansion in the third quarter. (Russia Federal State Statistics Service, 17 May 2018).
The Bank of Russia held its benchmark one-week repo rate at 7.25 per cent on 15 June, as widely expected, after revising the inflation forecast upwards due to a planned increase of the value added tax in 2019. The Bank of Russia forecasts annual inflation to be between 3.5–4 per cent in late 2018 and increase for a short-term period to be between 4–4.5 per cent in 2019. The consumer price inflation rate will return to 4 per cent in early 2020 (Central Bank of Russia, 21 June 2018).

11Central Bank of Eswatini Quarterly Review - June 2018
Russia’s annual inflation rate edged down to 2.3 per cent in June from 2.4 per cent in the previous month, still above market expectations of 2.2 per cent. Food prices fell from a year earlier while cost of both non-food products and services rose at a faster pace. Russian unemployment rate came in at 4.7 per cent in June 2018, unchanged from the previous month’s record low and below last year’s 5.1 per cent, as the number of unemployed continued to fall (Federal State Statistics Service of Russia, 18 July 2018).
India: Real GDP expanded by 1.9 per cent in the first quarter of 2018 compared to a 1.8 per cent expansion in the last quarter of 2017. India’s economy expanded at its fastest pace since demonetisation as government spending continues to drive the recovery (bloombergquint.com, 21 June 2018).
The Reserve Bank of India raised its benchmark policy repo rate by 25 basis points to 6.25 per cent on 6 June 2018 while markets expected no changes. It is the first hike in borrowing costs since January of 2014, mentioning upside risks to inflation that include higher oil prices and uncertainty in global financial markets. Policymakers said the decision is consistent with a neutral monetary policy stance and is in line with achieving the inflation target of 4 per cent while supporting growth. The reverse repo rate was also adjusted to 6 per cent from 5.75 per cent and the marginal standing facility rate2 and the Bank Rate to 6.5 per cent from 6.25 per cent (Reserve Bank of India, 6 June 2018).
The inflation rate in India edged up to 5 per cent in June 2018 from 4.87 per cent in May, below market expectations of 5.3 per cent. It is the highest rate since January and marks
the eighth straight month in which inflation is above the central bank medium-term target of 4 per cent. Unemployment Rate in India increased to 3.52 per cent in 2017 from 3.51 per cent in 2016 (Trading Economics, 21 June 2018).
China: The economy grew by 1.8 per cent quarter-on-quarter in the three months to June 2018, compared to a 1.4 per cent expansion in the previous period and beating market estimates of a 1.6 per cent growth. It was the fastest quarterly expansion since the quarter to September 2017. Year-on-year, the economy advanced 6.7 per cent year-on-year in the quarter to June 2018, after a 6.8 per cent growth in the previous three quarters and matching market expectations. It was the weakest pace of expansion since the third quarter of 2016 (China National Bureau of Statistics, 16 July 2018). On 14 June 2018, the People’s Bank of China unexpectedly left interest rates for open market operations unchanged even after the Federal Reserve’s decision to tighten monetary policy earlier in the same month. The rate for 7-day reverse repurchase agreements remained at 2.55 per cent (Trading Economics, 14 June 2018).
China’s consumer price inflation edged up to 1.9 per cent year-on-year in June from 1.8 per cent in the previous month and matching market consensus. It is the highest rate since March, as prices of food went up at a faster pace and cost of non-food continued to increase. Unemployment Rate in China decreased to 3.89 per cent in the first quarter of 2018 from 3.90 per cent in the fourth quarter of 2017 (China Statistics Office, 11 July 2018).
1 Reverse repo rate is the rate at which the central bank borrows money from banks.2Marginal Standing Facility (MSF) rate refers to the rate at which the scheduled banks can borrow funds overnight from a central bank against government securities. MSF is a very short term borrowing scheme for scheduled commercial banks.

12 Central Bank of Eswatini Quarterly Review - June 2018
FIGURE 1: GOLD & OIL PRICES (US DOLLARS); JUNE 2017 - JUNE 2018
Oil
($)
Gol
d ($
)
Gold Oil
0
10
20
30
40
50
60
70
80
90
1180
1200
1220
1240
1260
1280
1300
1320
1340
1360
Jun-
17
Jul-1
7
Aug
-17
Sep-
17
Oct
-17
Nov
-17
Dec
-17
Jan-
18
Feb-
18
Mar
-18
Apr
-18
May
-18
Jun-
18
Oil
($)
Gol
d ($
)
GOLD OIL
1320
1340
1360
Jun-
17
Jul-
17
Aug-
17
Sep-
17
Oct
-17
Nov
-17
Dec
-17
Apr-
18
Jan-
18
May
-18
Feb-
18
Jun-
18
Mar
-18
60
70
80
90
50
40
30
20
10
0
1300
1280
1260
1240
1220
1200
1180
Source: indexmundi.com
The South African economy contracted by a seasonally adjusted and annualised 2.2 per cent quarter-on-quarter in the first three months of 2018, reversing from a 3.1 per cent growth in the previous period, which was the highest in 1-1/2 years. It compares with market expectations of a 0.5 per cent decline. It is the biggest contraction since the first quarter of 2009 as production declined mostly for mining, manufacturing and agriculture. The mining sector went down by 9.9 per cent, extending the 4.4 per cent drop in the fourth quarter of
2017 mainly due to lower production of gold and ‘other’ metal ores, mainly platinum group metals and iron ore. Manufacturing decreased by 6.4 per cent, the biggest drop since the second quarter of 2015 and reversing from a 4.3 per cent gain in the last quarter of 2017. Six of the ten manufacturing divisions shrank, with the largest downward contributions coming from basic iron and steel, non-ferrous metal products, metal products and machinery, petroleum, chemical products, rubber and plastic products (Statistics South Africa, 5 June 2018).
3. ECONOMIC DEVELOPMENTS IN SOUTH AFRICA

13Central Bank of Eswatini Quarterly Review - June 2018
FIGURE 2: SOUTH AFRICA GDP; MARCH 2016 - MARCH 2018
-3.0
-2.0
-1.0
0.0
1.0
2.0
3.0
4.0
q-o-
q %
cha
nge
q-o-
q %
cha
nge
4.0
3.0
2.0
1.0
0.0
-1.0
-2.0
-3.0
Mar
-16
Mar
-18
Jun-
16
Sep-
16
Dec
-16
Mar
-17
Jun-
17
Sep-
17
Dec
-17
Source: Statistics South Africa
The South African Reserve Bank kept its benchmark repo rate steady at 6.5 per cent on 19th July as widely expected. Policymakers said the decision is appropriate and accommodative given the current state of the economy. The Committee noted a deterioration in the inflation outlook due to supply-side factors. Policymakers added that they will continue to monitor and will act if the inflation deviates from the target range.
Despite remaining within the target band throughout the forecast period, the SARB’s model projects an increase in headline inflation, peaking at levels closer to the upper end of the target range. Thus far, the impact of the value-added tax (VAT) increase appears to have been less than anticipated. However, the weaker rand exchange rate and the higher oil price assumptions resulted in a more elevated inflation trajectory. Headline inflation is now expected to average 4.8 per cent in 2018 (down from 4.9%) before increasing to 5.6 per cent in 2019 and decreasing again to 5.4 per cent in 2020 (up from 5.2% in both years). Headline CPI inflation is expected to peak at around 5.7 per cent in the first and second quarters of 2019 before declining to 5.3 per cent at the end of 2020. The forecast for core inflation
is 4.6 per cent in 2018 (up from 4.5%), 5.5 per cent in 2019 and 5.3 per cent in 2020 (up from 5.1% in both years). Since the previous meeting of the MPC. The Bank noted that the rand has depreciated by 7.2 per cent against the US dollar and by 6.2 per cent against the euro (South Africa Reserve Bank, 19 July 2018). Following the broad-based GDP contraction of 2.2 per cent in the first quarter and early indications of modest growth in the second quarter, the SARB’s forecast now indicates a growth rate of 1.2 per cent for 2018 compared with 1.7 per cent previously. The forecast for 2019 is at 1.9 per cent, marginally higher than the previous forecast of 1.7 per cent, while the forecast for 2020 is unchanged at 2.0 per cent. At these growth rates, the negative output gap is wider in the near term but is still expected to close in 2020. The continued increase in the composite leading business cycle indicator confirms the upward momentum in the economy (South African Reserve Bank, 19 July 2018).
The annual inflation rate in South Africa increased to 4.6 per cent in June 2018 from 4.4 per cent in the previous month and below market expectations of 4.8 per cent. It was the

14 Central Bank of Eswatini Quarterly Review - June 2018
highest inflation rate since December last year, mainly due to higher prices of transport. Year-on year, cost advanced faster for transport (7.3 per cent compared to 5.0 per cent in May), namely fuel (16.3 per cent compared to 9.4 per cent) and household equipment (2.7 per cent compared to 2.4 per cent. Annual core inflation rate, which excludes cost of food, non-alcoholic beverages, petrol and energy, slowed to 4.2 per cent in June from 4.4 per cent in May, down from market consensus of 4.4 per cent. Compared to May, core consumer prices went up 0.2 per cent, after increasing 0.6 per cent in the prior month. On a monthly basis, consumer prices rose 0.4 per cent,
following a 0.2 per cent in May and slightly lower than forecasts of 0.5 per cent (Statistics South Africa, 18 July 2018).
South Africa’s unemployment rate came in at 26.7 per cent in the first quarter of 2018, unchanged from the previous period. The number of unemployed increased by 100 000 to 5.98 million and the number of employed rose by 207 000 to 16.38 million. The number of unemployed persons jumped by 100 000 to 5.98 million from 5.88 million in the fourth quarter of 2017 (Statistics South Africa, 11 July 2018).
FIGURE 3: SOUTH AFRICA PPI AND CPI; JUNE 2017 - JUNE 2018
3.0
3.5
4.0
4.5
5.0
5.5
6.0
6.5
Jun-
17
Jul-1
7
Aug
-17
Sep-
17
Oct
-17
Nov
-17
Dec
-17
Jan-
18
Feb-
18
Mar
-18
Apr
-18
May
-18
Jun-
18
year
-on-
year
% c
hang
e
PPI CPI
Year
-on-
year
% c
hang
e
6.0
6.5
5.5
5.0
4.5
4.0
3.5
3.0
PPI CPI
Aug
-17
Sep-
17
Oct
-17
Nov
-17
Dec
-17
Jan-
18
Mar
-18
May
-18
Feb-
18
Apr
-18
Jun-
18
Jun-
17
Jul-
17
Source: Statistics South Africa
4. DOMESTIC ECONOMIC DEVELOPMENTS
4.1 General Overview
4.1.1 HeadlineInflationAccording to data from the Central Statistics Office, inflationary pressures were modestly on the upside in the second quarter of 2018 mainly attributed to upward adjustments in administered prices. Following a favourable start to the year, which was mainly boosted by a continuous moderation in food prices and a relatively stronger Lilangeni/Rand exchange
rate, the overall consumer inflation increased to average 4.8 per cent in the quarter ended June 2018 compared to an average of 4.2 per cent in the previous quarter. The index for ‘housing and utilities’ grew by an average of 13.7 per cent in the quarter under review compared to 8.1 per cent in the first quarter of 2018. The increase was a result of a 15 per cent year-on-year increase in the prices for ‘actual rentals’ effected in April 2018 and a 13 .7 per cent increase in water tariffs effected in May 2018. Of note also, is that electricity tariffs increased by 15 per cent in April 2018 as part of the two-year- multi-tariff approved by the

15Central Bank of Eswatini Quarterly Review - June 2018
energy regulator in 2017. However, since the tariff rate increase was of similar magnitude to that of the previous year, the electricity tariff increase only had a ‘price effect’ and no ‘acceleration effect’ on the inflation outcome. Additional upward inflationary pressures were observed in the index for ‘furnishing and household equipment’ which grew at a rate of 3.3 per cent in the quarter under review compared to 2.3 per cent in the previous quarter.
The above increases were partially counteracted by decreases in the indices for ‘food and non-alcoholic beverages’, ‘alcoholic beverages and tobacco’, ‘transport’ and ‘communication’. Food inflation recorded a deflation of 1.0 per cent in the quarter under review, compared to a growth of 1.5 per cent in the first quarter of 2018, supported by decreases in prices of ‘oils and fats’ and ‘sugar and sugar products’ as well as slower increases in the prices of ‘meat’ and ‘vegetables’ products. In addition, prices for ‘alcoholic beverages and tobacco’ slowed to 3.4 per cent in the quarter ended June 2018 from 6.1 per
cent in the previous quarter. A moderation in transport inflation was also observed in the quarter under review, declining to 3.5 per cent from 4.7 per cent in the previous quarter, and this is despite a 40 cents/ litre increase fuel prices which was effected in the month of May. Furthermore, increased competition in the communications sector which has led to a downward adjustment in prices resulted in a further deflation of 2.3 per cent in communication prices in the quarter under review from a deflation of 1.3 per cent in the previous quarter.
Core inflation which is CPI excluding food and non-alcoholic beverages, fuel and energy increased to 7.2 per cent in the quarter ended June 2018 from 5.2 per cent in the first quarter of 2018, depicting an upturn in underlying inflationary pressures. In line with increases in administered prices, the ‘CPI for administered prices’ (which includes regulated prices such as bread, fuel, public transport, energy and water) increased to 3.9 per cent in the quarter under review compared to 3.7 per cent in the previous quarter.
FIGURE 4: INFLATION TRENDS AND COMPONENTS; JUNE 2017 - JUNE 2018
-2.0
0.0
2.0
4.0
6.0
8.0
10.0
Ye
ar-
on
-Ye
ar
% C
ha
nge
Food Transport Other Headline Inflation
Year
-on-
Year
gro
wth
(%
)
HeadlineInflationOther
-2.0
0.0
2.0
4.0
6.0
8.0
10.0
Jun-
17
Jul-
17
Aug
-17
Sep-
17
Oct
-17
Jan-
18
Nov
-17
Feb-
18
Dec
-17
Mar
-18
Apr
-18
May
-18
Jun-
18
FoodInflation Transport
Source: Central Statistics Office

16 Central Bank of Eswatini Quarterly Review - June 2018
The outlook for consumer inflation is slightly on the upside largely on account of the upward adjustments in the administered prices and the 1 percentage point increase in Value Added Tax (VAT) to 15 per cent effective 1 August 2018. The Lilangeni/Rand exchange rate also depreciated in the second quarter of 2018 mainly driven by global developments particularly trade tariff retaliations between the US and China which have weighed heavily on all emerging countries’ currencies including the Rand. The weaker Lilangeni/Rand coupled with rising international oil prices have resulted in continuous increase in domestic fuel prices, adding more pressures to the inflation outlook. Overall consumer inflation is expected to average 5.4 per cent in 2018 before rising to 6.1 and 6.4 per cent in 2019 and 2020, respectively.
4.1.2 Electricity ConsumptionFigures sourced from the Eswatini Electricity Company (EEC) indicate that, total electricity consumption declined by 9.0 per cent to 272.7 GWh during the quarter ended June 2018 from 299.8 GWh in the quarter ended March 2018. Electricity sales from the domestic category decelerated by 2.1 per cent to 97.3 GWh, while commercial sales declined by 3.6 per cent recording 27.7 GWh between the two quarters under review. ‘Irrigation power and bulk’ electricity sales which are more than 50 per cent of total sales, significantly declined by 14.0 per cent to 147.8 GWh in the second quarter of 2018 from 171.8 GWh in the first quarter of 2018. It is important to note, however, that the total number of customers remained on the uptrend rising by 2.2 per cent to 207,990 in the quarter ended June 2018 from 203,584 in the previous quarter. All the categories recorded positive growth during the quarter under review.
4.1.3 Water ConsumptionAccording to data sourced from the Eswatini Water Corporation Services (EWSC), total treated water consumption grew by 6.0 per cent to 3.195 million kilolitres during the quarter ended June 2018 from 3.015 million kilolitres in the quarter ended March 2018. This growth was mainly driven by a 13.1 per
cent increase in commercial sales volumes, which recorded 1.553 million kilolitres in the quarter ended June 2018 from 1.373 million kilolitres in the previous quarter. Treated water volumes from the residential category, on the other hand, recorded flat growth during the second quarter of 2018 at 1.642 million kilolitres, same as it was in the first quarter. This growth in volumes was also evident in the total number of treated water connections which grew by 2.5 per cent to 44, 092 in the quarter ended June 2018 from 42, 997 in the quarter ended March 2018. Both residential and commercial connections increased by 2.4 and 4.1 per cent, respectively, during the period under review.
4.1.4 Fuel ImportsTotal fuel imports volumes (sourced from the Ministry of Natural Resources and Energy) accelerated by 7.2 per cent to 84,608 kilolitres in the quarter ended June 2018 from 78, 953 kilolitres in the quarter ended March 2018. Reflecting an improvement in economic activity in the transportation sector, all the different fuel categories recorded positive growth during the quarter under review. Petrol import volumes grew by 4.7 per cent to 41, 548 kilolitres in the quarter ended June 2018 from 39, 678 kilolitres in the previous quarter. In the same line, diesel import volumes increased by 9.6 per cent to 41, 740 kilolitres from 38, 092 kilolitres, between the two quarters under review. Following a significant increase in the previous quarter, paraffin imports volumes continued on an upward trend increasing by 11.5 per cent to 1, 320 kilolitres during the second quarter of 2018 from 1, 183 kilolitres in the previous quarter.
4.1.5 Exchange Rate/Real Effective Exchange Rate
During the second quarter of 2018, the external value of the Lilangeni/Rand weakened against the world’s major currencies. Compared to the previous quarter, the local unit weakened by 5.8 per cent against the US Dollar, 3.2 per cent against Pound Sterling and 2.5 per cent against the Euro. The general depreciation was influenced by both South African and global factors which were more pronounced towards

17Central Bank of Eswatini Quarterly Review - June 2018
the end of the quarter. The Lilangeni therefore closed the period at weaker levels of E12.65 to the US Dollar, E17.20 to the Pound Sterling and E15.07 to the Euro compared to the opening levels.
The domestic currency weakened as South Africa recorded a weak economic growth and a worse than expected current account deficit, which prompted a large Rand sell-off. The widening of the US bond yields compared to those of emerging markets and the trade debacle prompted by the US, which was extended to restrict imports of steel and aluminium from other developed economies other than China, further put pressure on
emerging market currencies including the Rand. These developments coupled with a more favourable positive growth outlook in the developed economies encouraged capital outflow particularly from emerging market economies. The continuous tightening cycle by the US Federal Reserve Bank which is likely to prompt other developed economies to follow suit and the expected discussions by the European Central Bank to phase out the quantitative easing program remain major risk on the performance of the Lilangeni/Rand exchange rate. The local unit ended the quarter under review at E13.70 to the US Dollar, E17.96 to the Pound Sterling and E15.94 to the Euro.
FIGURE 5: MONTHLY LILANGENI’S NEER/REER INDICES; JUNE 2017 - JUNE 2018
98
100
102
104
106
108
110
112
Jun-
17
Jul-1
7
Aug
-17
Sep-
17
Oct
-17
Nov
-17
Dec
-17
Jan-
18
Feb-
18
Mar
-18
Apr
-18
May
-18
Jun-
18
Inde
x (2
010=
100)
NEER REER
Jun-
17
Jul-
17
Aug
-17
Sep-
17
Oct
-17
Nov
-17
Dec
-17
Jan-
18
Feb-
18
Mar
-18
Apr
-18
May
-18
Jun-
18
Inde
x (2
010=
100)
98
100102104106
108110112
REERNEER
Source: Central Bank of Eswatini
Expressed against a basket of trading partners’ currencies, the value of the domestic currency as measured by the Nominal Effective Exchange Rate (NEER) depreciated by an average of 0.68 per cent in the quarter ended in June 2018 following an appreciation of 3.79 per cent in the quarter ended March 2018. Though domestic inflation rate was fairly stable throughout the quarter, relative to its trading partners, domestic inflation trended at a higher pace. As a result, the inflation adjusted effective exchange rate value of the currency
as measured by the Real Effective Exchange Rate (REER) appreciated by an average of 0.68 per cent in the quarter under review after recording an appreciation of 3.56 per cent in the quarter ended March 2018.
The appreciation in the REER implies that Eswatini’s export products especially those destined for markets outside the Common Monetary Area became expensive compared to those of the trading partners, implying a loss of competitiveness in the international market.

18 Central Bank of Eswatini Quarterly Review - June 2018
FIGURE 6: CROSS ATLANTIC CURRENCY RATES; JUNE 2017 - JUNE 2018
10
12
14
16
18
20
Jun-17
Jul-17
Aug-17
Sep-17
Oct-17
Nov-17
Dec-17
Jan-18
Feb-18
Mar-18
Apr-18
May-18
Jun-18
Emal
ange
ni
E/USD E/GBP
Emal
ange
ni
20
18
16
14
12
10
Jul-
17
Sep-
17
Nov
-17
Jan-
18
Mar
-18
Apr
-18
May
-18
Jun-
18
Jun-
17
Aug
-17
Oct
-17
Dec
-17
Feb-
18
E/GBPE/USD
Source: Central Bank of Eswatini
FIGURE 7: BASKET CURRENCY RATES; JUNE 2017 - JUNE 2018
10
12
14
16
18
20
22
Jun-17
Jul-17
Aug-17
Sep-17
Oct-17
Nov-17
Dec-17
Jan-18
Feb-18
Mar-18
Apr-18
May-18
Jun-18
Emal
ange
ni
E/EURO E/SDR
Jun-
17
Jul-
17
Aug
-17
Sep-
17
Oct
-17
Nov
-17
Dec
-17
Jan-
18
Feb-
18
Mar
-18
Apr
-18
May
-18
Jun-
18
Emal
ange
ni
22
20
18
16
14
12
10
E/EURO E/SDR
Source: Central Bank of Eswatini
4.2 MONETARY SECTOR
4.2.1 Net Foreign AssetsDuring the quarter ended June 2018, net foreign assets continued to fall by 10.3 per cent, following a decline of 3.0 per cent observed in the previous quarter. At this level, the net foreign assets amounted to E6.9 billion at the end of June 2018. The decline was discernible in net foreign assets of the official sector as well other depository corporations. Net official assets therefore declined by 8.7 per cent quarter-on-quarter to reach E5.1 billion, following a fall of 4.4 per
cent registered in the previous quarter. Net foreign assets of other depository corporations declined by 14.8 per cent to reach E1.7 billion at the end of June 2018, contrary to the rise of 1.0 per cent recorded in the previous quarter. Valued in Special Drawing Rights (SDR), net foreign assets however, declined by a higher 20.2 per cent to SDR354.3 million in line with the notable depreciation of the Lilangeni/Rand exchange rate over the quarter under review. Compared year-on-year, net foreign assets declined by 18.6 per cent in Emalangeni terms and by 23.4 per cent in SDR terms.
19Central Bank of Eswatini Quarterly Review - June 2018
FIGURE 8: NET FOREIGN ASSETS; JUNE 2016 - JUNE 2018
Jun
10.0 510.0
480.0
450.0
420.0
390.0
360.0
330.0
300.0
9.0
8.0
7.0
6.0
5.0
4.0
3.0
Sep
E SDR
2017 20182016
Dec
E’Bi
llion
SDR’
Mill
ion
Mar
Jun
Sep
Dec Mar
Jun
Source: Central Bank of Eswatini and Other Depository Corporations
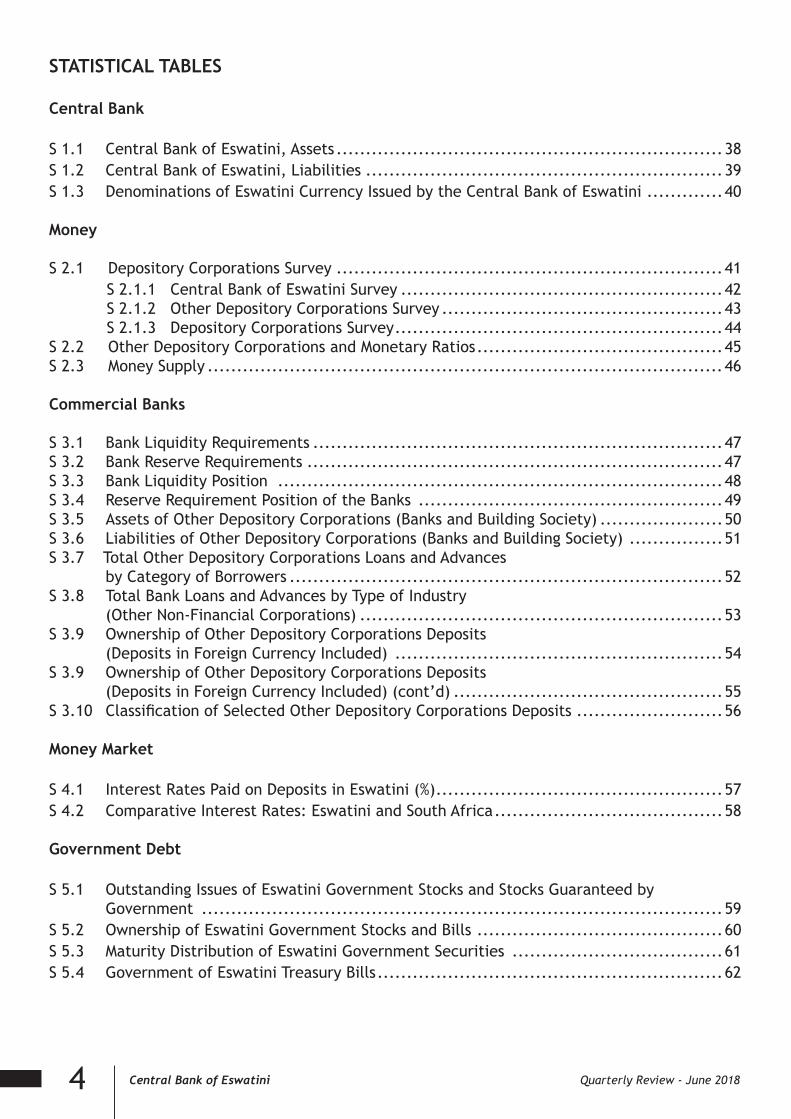
4.2.2GrossOfficialReservesGross official reserves reflected a quarter-on-quarter contraction of 8.1 per cent at the end of June 2018 to reach E6.1 billion. The fall was comparatively higher than that of 4.3 per cent recorded in the previous quarter. The Reserves were enough to cover an estimated 2.8 months of imports of goods and services,
lower than the 3.2 months covered in the previous quarter. The value of the reserves in SDRs amounted to SDR313.7 million at the end of June 2018, lower than the SDR383.7 million recorded in the previous quarter. Compared year-on-year, reserves declined by 11.5 per cent in Emalangeni terms and by 16.8 per cent in SDR terms.
FIGURE 9: GROSS OFFICIAL RESERVES & IMPORT COVER; JUNE 2016 - JUNE 2018
9.0 4.5
4.0
3.5
3.0
2.5
2.0
1.5
8.0
7.0
6.0
5.0
4.0
3.0
E’Bi
llion
s
Impo
rt C
over
in M
onth
s
2016 2017 2018
Sep
Dec Mar
Jun
Sep
Dec Mar
Jun
Jun
GrossOfficialReserves Import Cover
Source: Central Bank of Eswatini and Other Depository Corporations

20 Central Bank of Eswatini Quarterly Review - June 2018
4.2.3 Credit ExtensionOver the three months ended June 2018, private sector credit extension grew by 4.7 per cent to E 14.5 billion, reflecting an improvement from the 2.5 per cent fall recorded in the previous quarter. The rise in private sector credit was attributed to increased demand for credit to the Business and Other sectors over the quarter under review. Credit to the household sector, however, decelerated.
Credit extended to businesses increased by 8.9 per cent over the quarter under review to reach E6.4 billion contrary to the 5.9 per cent per cent fall recorded in the preceding quarter. The rise in credit to businesses was mainly registered in the Mining and Quarrying (20.3 per cent), Community Social and Personal Services (12.7 per cent), Real Estate (8.8 per cent), Distribution & Tourism (7.1 per cent), as well as the Construction (7.0 per cent) sectors.
Credit extended to Other sectors increased by 7.9 per cent to settle at E2.2 billion at the end of the June 2018. The quarterly growth was on account of credit to local government (48 per cent), public nonfinancial corporations (13.3 per cent) and other financial corporations (4.2 per cent).
Credit extended to household sector declined by 0.6 per cent to E5.9 billion at the end of June 2018 the same fall reflected in the preceding quarter. The fall in credit to households emanated from housing and other personal loans over the quarter under review. Consequently, credit extended for motor vehicle finance fell by 18.8 per cent to E0.9 billion and credit for housing finance by 0.1 per cent to E3.2 billion. Other personal loans, however increased by 9.7 per cent to E1.9 billion.
FIGURE 10: PRIVATE SECTOR CREDIT; JUNE 2016 – JUNE 2018
Tota
l, B
usin
esse
s, H
ouse
hold
s (E
’Bill
ion )
Oth
er (
E’Bi
llion
)
Jun
15.0
2.5
3.0
3.5
2.0
1.5
1.0
0.5
0.0
13.0
11.0
9.0
7.0
5.0
3.0
2016 2017 2018
DecSep
Mar
Jun
Sep
Dec Mar
Jun
Credit to Businesses Credit to HouseholdsTotal Private Sector Credit Credit to Other Sectors
Source: Central Bank of Eswatini and Other Depository Corporations
A considerable portion of private sector credit continued to be absorbed by both businesses and households over the quarter under review. The business sector which forms the largest proportion of total private sector credit accounted for 44.4 per cent of total private sector credit compared to 42.6 per cent in the
previous quarter. The share of the household sector which is the second largest, constituted a lower 40.7 per cent of private sector credit, less than the share of 42.6 per cent observed in the previous quarter. Other sectors accounted for the remaining 14.9 per cent of total private sector credit, slightly higher than the 14.4 per cent share reflected in the previous quarter.

21Central Bank of Eswatini Quarterly Review - June 2018
FIGURE 11: PRIVATE SECTOR CREDIT COMPOSITION; JUNE 2016 – JUNE 2018
100.0
90.0
80.0
70.0
60.0
50.0
40.0
30.0
20.0
10.0
0.0
Per
cent
2016 2017 2018
Jun Sep Dec Mar Jun Sep Dec Mar Jun
Households Businesses Other Sectors
Source: Central Bank of Eswatini and Other Depository Corporations
Net government balances with the banking sector fell during the second quarter of 2018. The reduction in net government balances was due to a fall in government deposits with the banking sector which more than offset a
decline in the banking sector’s claims on the government. Government deposits contracted by 16.7 per cent to reach E2.5 billion and claims on government went down by 2.6 per cent over the review quarter to reach E4.0 billion at the end of the review quarter.
FIGURE 12: NET GOVERNMENT BALANCES WITH THE BANKING SECTOR; JUNE 2016 - JUNE 2018
Jun
0.0
1.0
2.0
3.0
4.0
5.0
Claims on Central Government Government Deposits
Sep
Dec
DecMar
Mar
Jun
20172016 2018
E’Bi
llion
Jun
Sep
Source: Central Bank of Eswatini and Other Depository Corporations

22 Central Bank of Eswatini Quarterly Review - June 2018
4.2.4 Money SupplyOwing to the rise in credit extended to the private sector, broad money supply (M2) grew by 3.4 per cent to E17.0 billion at the end of the June 2018. This compares to a decline of 5.1 per cent registered in March 2018. The rise in M2 was reflected in both narrow money supply (M1) and quasi money supply.
Narrow money supply went up by 5.2 per cent to E6.0 billion at the end of June 2018. The quarter-on-quarter increase in M1 was underpinned by higher emalangeni in circulation and transferable deposits.
Accordingly, emalangeni in circulation increased by 28.5 per cent to E685.4 million at the end of June 2018. Transferable deposits rose by 2.8 per cent to E5.3 billion during the quarter under review.
Quasi money supply grew by 2.4 per cent over the review quarter to E11.1 billion from E10.8 billion registered in the previous quarter. Contributing to the rise in quasi money supply were both savings and time deposits which increased by 0.8 per cent and 2.7 per cent respectively.
FIGURE 13: MONEY SUPPLY; JUNE 2016 - JUNE 2018
Jun
E’Bi
llion
2016 2017 2018
18.0
20.0
16.0
14.0
12.0
10.0
8.0
6.0
4.0
2.0
0.0
Sep
Dec Mar
Jun
Sep
Dec Mar
Jun
Narrow Money Quasi Money Broad Money
Source: Central Bank of Eswatini and Other Depository Corporations
4.2.5 Domestic Liquid AssetsBanks’ liquid assets grew by 1.2 per cent over the review quarter to reach E4.4 billion. The rise in liquid assets was depicted in banks’ holdings at the Central Bank. Therefore, the
liquidity ratio increased from 28.1 per cent in March 2018 to close at 28.3 per cent at the end of June 2018. Compared year-on-year, the banks’ liquid assets grew by 20.2 per cent.

23Central Bank of Eswatini Quarterly Review - June 2018
FIGURE 14: DOMESTIC LIQUID ASSETS AND LIQUIDITY RATIO; JUNE 2016 – JUNE 2018
Jun
Jun
Jun
Sep
Sep
Dec
DecMar
Mar
Liquidity RatioDomestic Liquid Assets
4.50
5.00
3.50
2.50
2.00
4.00
3.00
1.50
30.029.028.027.026.025.024.023.022.021.020.0
Dom
esti
c Li
quid
Ass
ets
(E’B
illio
n)
Liqu
idit
y Ra
tio
(Per
cen
t)
2016 2017 2018
Source: Central Bank of Eswatini and Other Depository Corporations
FIGURE 15: MONETARY BASE, DEPOSITS & LOANS; JUNE 2016 - JUNE 2018
Jun
18.0
16.0
12.0
8.0
4.0
14.0
10.0
6.0
2.0
0.0
E’Bi
llion
2016 2017 2018
Sep
Dec Mar
Jun
Sep
Dec Mar
Jun
Deposits Monetary BaseLoans
Source: Central Bank of Eswatini and Depository Corporations
4.2.6 Interest RatesInterest rates remained unchanged during the quarter ended June 2018 following the Bank’s pursuit of a steady monetary policy stance as inflationary pressures continued to subside.
Subsequently, the discount rate remained at 6.75 per cent in June 2018. The prime lending rate was at 10.25 per cent at the end of June 2018.

24 Central Bank of Eswatini Quarterly Review - June 2018
FIGURE 16: INTEREST RATES; JUNE 2016 - JUNE 2018
Jun
Sep
Dec Mar
Jun
Sep
Dec Mar
Jun
5.5
10.511.5
4.5
9.5
3.5
8.5
2.5
7.5
1.5
6.5
Discount Rate Prime Rate
Per
cent
2016 2017 2018
Source: Central Bank of Eswatini and Other Depository Corporations Survey
TABLE 2: ESWATINI COMPARATIVE INTEREST RATES AS AT END-JUNE 2018
NEDBANK SWAZI BANK STANDARD BANK
FNB BUILDING SOCIETY
Call* 4.40 3.65 - 6.10 3.00 Up to 3.35 Special. Savings 2.75
31 days* 1.45 3.15 2.55 Up to 4.95 Gold a/c 3.00 - 4.81
88 days* 4.10 3.40 2.55 Up to 5.25 Subs shares 2.75 - 3.50
6 months* 4.30 3.70 2.83 Up to 6.55 6 months 5.00
12 months* 5.80 3.95 2.93 Up to 6.95 12 months 5.15
Savings (See table 3 below)
Prime Lending 10.25 10.25 10.25 10.25 Residential: 9.00
Commercial: 10.75
Source: Commercial Banks & Building Society*Higher rates may be quoted on application for large amounts and subject to negotiation with individual customers

25Central Bank of Eswatini Quarterly Review - June 2018
TABLE 3: SAVINGS DEPOSIT RATES FOR BANKS & BUILDING SOCIETY
RANGE RATE (%) RANGE RATE (%)
Standard: E 100 - E 999 0.00 - 0.34 Nedbank: E 500 - E 19,999 1.25
E 1,000 - E 4,999 0.00 - 0.39 E 20,000 - E 49,000 1.85
E 5,000 - E 9,999 0.00 - 0.44 E 50,000 - E 99,000 3.60
E 10,000 - E 99,999 0.00 - 0.59 E100,000 & Above 4.40
E 100,000 - E 149,999 0.20 - 0.79
E 150,000 - E 249,999 0.00 - 0.79
E 250,000 & Above 0.00 - 1.44 Swazi Bank E 5,000 - E 50,000 3.40
E 50,001 - E100,000 3.45
E100,001 - E500,000 3.60
E500,001 & Above 3.85
FNBANK : E 500 - E 999 0.00 - 0.50 Building Society: Ordinary Savings 2.25
E 1,000 - E 4,999 0.00 - 0.50
E 5,000 - E 14,999 0.00 - 0.50
E 15,000 - E 19,999 0.00 - 0.50
E 20,000 - E 24,999 0.00 - 0.50
E 25,000 - E 49,999 0.00 - 0.50
E 50,000 - E 74,999 0.00 - 0.75
E 75,000 - E 99,999 0.00 - 0.75
E 100,000 - E 149,999 0.00 - 1.00
E 150,000 - E 249,999 0.00 - 1.00
E250,000 & Above 0.00 - 1.00
Source: Commercial Banks & Eswatini Building Society
4.3 PUBLIC DOMESTIC DEBT Total outstanding government domestic debt portfolio at the end of June 2018 stood at E7.702 billion, showing a 0.02 per cent decrease from E7.704 billion recorded the previous quarter. Over the year, government domestic debt increased by 26.6 per cent from the E6.081 billion recorded in June 2017. The outstanding amount was equivalent to 12.3 per cent of the country’s Gross Domestic Product (GDP), up by about 2.0 per cent from the 10.3
per cent recorded in June 2017. This was a result of improved uptake of government short, medium to long term paper. The amount outstanding for Treasury Bills and Bonds accounted for about 96.3 per cent of the total outstanding government domestic debt during the quarter under review. This significant increase was mainly due to the securitisation of the CBE Advance to Government, meaning that the advance was converted into government bonds, thereby increasing the Bond Portfolio.
TABLE 4: PUBLIC DOMESTIC DEBT PORTFOLIO (E’MILLION)
Type of debt Dec’17 Mar’18 Jun’18Treasury Bonds 3,616.81 49.87% 3,695.86 47.97% 5,074.36 65.88%Treasury Bills 2,154.56 29.71% 2,364.04 30.69% 2,345.86 30.46%CBE Advance 1,292.55 17.82% 1,292.55 16.78% 0.00 0.00%Promissory Notes 188.73 2.60% 351.57 4.56% 281.91 3.66%Total Domestic Debt 7,252.65 100% 7,704.02 100% 7,702.13 100% As % GDP 12.3 12.3 12.3
Source: Central Bank of Eswatini

26 Central Bank of Eswatini Quarterly Review - June 2018
At the end of June 2018, total public debt stood at 20.8 per cent of GDP, up from 20.1 per cent recorded in the previous quarter ending March 2018. Compared year-on-year, total public debt went up by 1.3 per cent
from 19.5 per cent recorded in June 2017. The proportion between domestic and external debt is currently at 60 per cent to 40 per cent, respectively.
TABLE 5: PUBLIC DEBT PORTFOLIO BY PROPORTION (E’BILLION)
Category Jun’17 Sep’17 Dec’17 Mar’18 Jun’18Domestic 6.1 6.7 7.3 7.7 7.7External 5.4 5.6 5.5 4.8 5.2Total 11.5 12.3 12.8 12.5 12.9Total Public Debt % to GDP 19.5% 20.8% 21.6% 20.1% 20.8%Total Domestic Debt % to GDP 10.3% 11.4% 12.3% 12.3% 12.3%ProportionDomestic 53% 54% 57% 61% 60%External 47% 46% 43% 39% 40%
Source: Central Bank of Eswatini
4.3.1 Government Treasury BillsTotal outstanding Treasury Bills decreased by 0.77 per cent during the review quarter from E2.364 billion recorded in March 2018 to E2.346 billion at end of June 2018. Holdings for local banks marginally decreased by 4.62 per cent from E1, 574.06 million recorded last quarter to reach E1, 501.33 million in June 2018. Non-Bank Financial Institutions’ holdings increased by E53.73 million showing an 8 per cent increase from previous quarter. The holdings represented 30.9 per cent of total treasury bills
outstanding at the end of the quarter under review. The Central Bank of Eswatini holdings decreased by E0.67 million from E2.40 million to E3.07 million. Holdings by Other Participants which includes individuals, savings and co-ops, private companies among others, increased slightly by E0.15 million from E115.93 million in March 2018 to E116.08 million in June 2018. The increase was mainly attributed to growth in appetite for the government paper by the retail sector.
TABLE 6: HOLDINGS OF ESWATINI GOVERNMENT TREASURY BILLS (E’MILLION)
Dec’ 2017 Mar’ 2018 Jun’ 2018Total 2,154.59 2,364.04 2,345.86Of which: Local Commercial Banks and Building Society 1,547.17 1,547.06 1,501.33Foreign Banks - - -Non-Bank Financial Institutions 500.15 671.65 725.38Central Bank of SWD (OMO) 3.12 2.40 3.07Other 104.15 115.93 116.08Average Discount (%) 7.86 7.83 7.68Average Yield (%) 8.19 8.16 8.00% of Total Government Domestic Debt 37.33 31.08 30.46
Source: Central Bank of Eswatini

27Central Bank of Eswatini Quarterly Review - June 2018
FIGURE 17: TREASURY BILLS & THE AVERAGE DISCOUNT RATE; JUNE 2017 – JUNE 2018
6.4%
6.8%
7.2%
7.6%
8.0%
8.4%
0
500
1,000
1,500
2,000
2,500
Jun'17 Sep'17 Dec'17 Mar'18 Jun'18
E' M
illion
T-Bills Average Discount
2,500.00 8.4
8.0
7.2
7.6
6.8
6.4
Per
cent
E’M
illio
n
2,000.00
1,500.00
1,000.00
500.00
0.00
Jun-
17
Sep-
17
Dec
-17
Mar
-18
Jun-
18
Average DiscountT-Bills
Source: Central Bank of Eswatini
4.3.2 Eswatini Government BondsTotal Government bonds outstanding at the end of June 2018 increased by 37.3 per cent from E3.695 billion recorded in the previous quarter to E5.074 billion. The significant increase was largely due to the conversion of the CBE Advance to securities (securitisation) whereby E300 million was in the form of a re-opening of SG018, E592.548 million being SG027 re-opening and E400 million being a re-opening of SG031. There was also an issuance of Infrastructure bond SGIFB005 whereby E111.820 million was allotted from a nominal amount of E150 million. Three additional plain vanilla bonds namely SG033, SG034 and SG035 were issued during the quarter under review, with E95.15 million, E18.00 million and E16.69 million, respectively. There was also a maturity of E125.71 million for SG021 during the same period.
Non-Bank Financial Institutions (NBFI) continued to be the major participants in this quarter and they continued to dominate holdings for Treasury Bonds as their holdings represent 55.6 per cent of total bonds outstanding at the end of June 2018. NBFI total holdings increased by 6.8 per cent from E2.643 billion last quarter to E2.823 billion at the end of June 2018. Local Commercial Bank’s holdings decreased by E95.07 million representing an 11.1 per cent fall from the previous quarter. Therefore, local banks accounted for 15.01 per cent of total bonds outstanding. Other participants and individuals’ holdings stood at E195.85 million, representing 3.86 per cent of total bonds outstanding. CBE holdings increased by about E1.292 billion from last quarter’s E0.92 million to E1.293 billion at the end of June 2018. The significant increase was due to the securitisation of the CBE Advance to Government where CBE was fully allotted.
TABLE 7: HOLDINGS OF ESWATINI GOVERNMENT BONDS (E’ MILLION)
Dec’ 2017 Mar’ 2018 Jun’ 2018Total 3, 616.79 3, 695.86 5, 074.35Banks and Building Society 866.83 856.80 761.73Non-Bank Financial Institutions 2, 605.10 2, 643.33 2, 823.33Other 143.96 194.81 195.85Central Bank (OMO) 0.90 0.92 1,293.44Foreign Banks 0 0 0(%) of Total Government Domestic Debt 62.67 47.98 65.88
Source: Central Bank of Eswatini

28 Central Bank of Eswatini Quarterly Review - June 2018
TABLE 8: ESWATINI GOVERNMENT BONDS LISTED ON SSX
Bond Coupon Redemption Date Nominal Value (Emalangeni)SG016 8.25% 31/08/2018 150,000,000.00SG017 8.50% 31/10/2020 251,100,000.00SG018 9.25% 31/01/2024 223,441,000.00SG020 8.25% 20/10/2019 82,200,000.00SG021 8.25% 30/07/2018 125,710,000.00SG022 8.75% 25/09/2022 96,035,000.00SG023 8.75% 30/11/2020 250,000,100.00SG023 8.75% 30/11/2020 76,390,000.00SG024 9.50% 31/05/2019 200,000,600.00SG025 10.00% 20/06/2021 178,050,000.00SG026 (Prime-150bps) 9.00% 31/08/2023 178,650,000.00SG027 10.75% 31/10/2026 171,650,000.00SG025 (Reopening) 10.00% 20/06/2021 169,240,000.00SG029 10.50% 28/02/2022 129,260,000.00SG030 10.25% 30/06/2024 134,495,000.00SGIFB001 9.75% 31/07/2022 42,320,000.00SG027 (Reopening) 10.75% 31/10/2026 100,500,000.00SGIFB002 10.00% 31/10/2025 222,020,000.00SGIFB003 10.25% 29/12/2026 54,402,000.00SG031 10.00% 31/01/2025 150,000,200.00SGIFB004 (Prime-50bps) 10.25% 29/03/2028 130,400,000.00SG018_REOPENING 9.25% 29/06/2024 300,000,000.00SG027_REOPENING 10.75% 29/06/2026 592,548,000.00SG031_REOPENING 2 10.00% 29/06/2025 400,000,000.00SGIFB005 9.75% 29/06/2026 111,820,000.00SG033 9.25% 29/06/2023 95,150,000.00SG034 9.75% 29/06/2025 18,000.000.00SG035 10.25% 29/06/2028 16,690,000.00TOTAL 3,847,741,300.00
Source: Central Bank of Eswatini
4.3.2.1 Bond IssuancesThree bonds were issued during the period under review and these were a plain vanilla re-openings, an infrastructure bond and a new plain vanilla issuances. The plain vanilla bond re-openings namely SG018, SG027 and SG031 were issued at the end of April 2018 with coupon rates of 9.25 per cent, 10.75 per cent and 10.00 per cent, maturing on 31 January 2024, 31 March 2026 and 31 January 2025, respectively. The amount on offer was E1.292 billion which was in respect to the
securitisation. The Infrastructure Bond which was the fifth issuance from the Infrastructure Bond Programme took place at the end of May 2018 where an 8-year fixed rate bond at 9.75 per cent was issued. An amount of E150 billion was on offer with a green shoe option of 50 per cent of the amount on offer. A total of E139 million competitive bids and E0.82 million non-competitive bids were received. Out of the bids received a total of E111.82 million bids were allotted comprising

29Central Bank of Eswatini Quarterly Review - June 2018
of E111.00 million competitive bids and E0.82 million non-competitive bids at a weighted average yield of 10.573 per cent. The final bond issuance for the first quarter involved three securities namely SG033, SG034 and SG035, with E95.15 million, E18.00 million and E16.69 million allotted paying coupon rates of 9.25 per cent, 9.75 per cent and 10.25 per cent, respectively. The total amount for the multiple bond issuance was E150 million. The following bonds were issued; SG033, SG034 and SG035 maturing on 29 June 2023, 29 June 2025 and 29 June 2028 respectively. The amount on offer for SG033 was E40 million, of which E138 million competitive bids were received, with E95 million being allotted and
E0.15 million non-competitive bids being fully allotted. SG034 had the same amount on offer of E40 million, with E28 million competitive bids received and only E18 million was allotted and there were no non-competitive bids received. Finally, SG035 had E70 million on offer with E34 million received competitively and E16 million allotted competitively. E0.69 million was allotted non-competitively. A total of E129.84 million was allotted for the multiple bond auction. Yields for the three securities were 9.521 per cent, 11.000 per cent and 11.500 per cent, respectively. In the same quarter, the government paid a total of E101.596 million on coupons for both Treasury Bonds and Suppliers Bonds.
4.3.2.2 Coupon Payments
TABLE 9: SECOND QUARTER COUPON PAYMENTS
Name Coupon Rate %
Tenor Payment Date
Nominal Amount
Coupon Amount
SG017 8.250 7 Years Bond 30-Apr-18 251,100,000.00 10,584,036.97 SG020 8.250 5 Years Bond 20-Apr-18 82,200,000.00 3,381,460.28 SG021 8.250 3 Years Bond 30-Jun-18 125,710,000.00 5,142,916.65 SG023 8.750 5 Years Bond 31-May-18 250,000,000.00 14,240,444.79 SG024 9.500 3 Years Bond 20-Jun-18 200,000,600.00 9,474,001.04 SG025 10.000 5 Years Bond 2-Jun-18 178,050,000.00 17,316,926.01 SG24MTMSBS 9.500 2 Years Bond 2-Jun-18 30,000,000.00 1,458,493.15 SG18MTMSBS 9.250 1.5 Years Bond 2-Jun-18 20,000,000.00 947,397.26SG36MTMSBS 10.500 2 Years Bond 5-Jun-18 50,000,000.00 2,680,136.99 SG18MTNNED 8.850 3 Years Bond 16-Jun-18 100,000,000.00 4,537,534.25 SG028 9.500 2 Years Bond 22-Jun-18 60,000,000.00 2,842,191.78 SG18MTNSTD 9.500 1.5 Years Bond 22-Jun-18 20,000,000.00 972,328.77SG24MTNSTD 9.750 2 Years Bond 22-Jun-18 15,000,000.00 747,945.21SG36MTNSTD 10.000 3 Years Bond 23-Jun-18 15,000,000.00 766,643.84SG18MTNFNB 9.500 1.5 Years Bond 29-Jun-18 20,000,000.00 972,328.77SG18MTNMVA 9.500 1.5 Years Bond 24-May-18 20,000,000.00 972,328.77SG36MTNOMS 9.645 3 Years Bond 4-Apr-18 10,000,000.00 230,302.74SG24MTNSBS2 10.250 2 Years Bond 30-Jun-18 40,000,000.00 2,044,383.56 SG030 10.250 7 Years Bond 30-Apr-18 134,495,000.00 6,836,215.02 SGIFB002 10.000 8 Years Bond 30-Jun-18 222,020,000.00 11,009,758.90 SGIFB003 10.250 9 Years Bond 29-Jun-18 54,402,000.00 2,780,463.88 SG12MTNSBSMMF1 8.500 1 Years Bond 20-May-18 80,000,000.00 1,658,082.19 TOTAL 1,977,977,700.00 101,596,320.82
Source: Central Bank of Eswatini

30 Central Bank of Eswatini Quarterly Review - June 2018
The table below shows private placements that were issued up to June 2018.
TABLE 10: PRIVATE PLACEMENTS
Security Tenor Maturity Date Rate Amount IssuedSG06MTNBNK03MMF (Prime-240 bps) 0.5 Year Bond 11-Dec-18 7.850% 70,000,000.00
SGMTM24BNK05(Prime-100 bps) 2 Year Bond 2-Dec-18 9.500% 30,000,000.00
SGMTM36BNK02(Prime) 3 Year Bond 2-Dec-19 10.500% 50,000,000.00
SG03MTNBNK03MMF (Fixed) 0.25 Year Bond 18-Sep-18 7.850% 30,000,000.00
SG36MTNBNK031(Prime-100 bps) 3 Year Bond 22-Dec-19 10.000% 15,000,000.00
SG24MTNBNK03(Prime-75 bps) 2 Year Bond 22-Dec-18 9.750% 15,000,000.00
SG24MTNBNK053 (Prime-125 bps) 2 Year Bond 11-Jun-20 9.000% 20,000,000.00
SG024MTNBNK03MF (Fixed Per Annum) 2 Year Bond 18-Jun-20 8.250% 30,000,000.00
SG36MTNBNK04(Prime-75 bps) 3 Year Bond 23-Dec-19 10.500% 20,000,000.00
SG36MTNOMS(3 Month JIBAR+232 bps) 3 Year Bond 24-Feb-20 9.645% 10,000,000.00
SG60MTNNB01(Prime) 5 Year Bond 10-Feb-22 10.750% 30,000,000.00
SG24MTNBNK052(Prime-50 bps) 2 Year Bond 4-Apr-19 10.250% 40,000,000.00
SG12MTNBNK05MMF1(Prime-200 bps) 1 Year Bond 20-Feb-19 8.500% 80,000,000.00
TOTAL 440,000,000.00Source: Central Bank of Eswatini
FIGURE 18: TREASURY BILLS & BONDS; APRIL 2018 – JUNE 2018
0
1,000
2,000
3,000
4,000
5,000
6,000
Apr'18 May'18 Jun'18
E' M
illio
n
T-Bills T-Bonds
Apr’ 2018
E’M
illio
n
May’ 2018 Jun’ 2018
5,000.00
6,000.00
4,000.00
3,000.00
2,000.00
1,000.00
0.00
T-Bills T-Bonds
Source: Central Bank of Eswatini
4.3.3 Central Bank Advance to GovernmentAn amount of E1.3 billion advanced to the government by the Bank during the fiscal year ending March 2018 was converted into government bonds thus the advance was zero at the end of June 2018.
4.3.4 Promissory NotesPromissory notes outstanding decreased from
E351.6 million at the end of March 2018 to reach E281.9 million at the end of June 2018.
4.4 PUBLIC EXTERNAL DEBT
4.4.1 Debt StockPreliminary figures for the quarter ending June 2018 indicate that public sector external debt increased in nominal terms. The increase

31Central Bank of Eswatini Quarterly Review - June 2018
has mainly been as a result of drawdowns made on disbursing project loans as well as the weakening of the Lilangeni against international currencies in which the country’s liabilities are denominated in the quarter under review.
As at end of June 2018, total public external debt (including public and publicly guaranteed debt) stood at E5.3 billion, an equivalent of 8.6 per cent of GDP. This reflects an increase of 10.4 per cent from the revised figure E4.8 billion recorded in March 2018. Central government debt increased from E4.6 billion to E4.9 billion in June 2018.
4.4.2 DisbursementsDisbursements for the quarter ending June 2018 amounted to E77.9 million. Drawdowns were made from the following project loans:• Kuwait Fund for Development for Manzini-
Mbadlane Highway;• OPEC Fund for International Development
(OFID) for Manzini- Mbadlane Highway;• Abu Dhabi Fund for Development for
Manzini – Mbadlane Highway;• African Development Bank for Ezulwini
Water Supply Project;• OPEC Fund for International Development
(OFID) for Lower Usuthu Potable Water Supply Project; and
• African Development Bank for Lower Usuthu Phase II Project.
4.4.3 Debt ServiceFor the quarter ending June 2018, total debt service amounted to E153.3 million. Of this amount E113.2 million went towards principal repayments, E40.1 million accounted for interest payments while the remaining E0.4 million accounted for commitment fees.
Eswatini’s debt ratios have remained reasonably low compared to other African countries based on debt critical ratios for Low Income Countries established by the Brettonwoods Institutions (IMF & World Bank). The country’s debt position for the period ending June 2018 is summarised in the table below:
TABLE 11: STANDARD CRITICAL VALUE OF DEBT RATIOS AS AT END-JUNE 2018
Ratio Critical Ratio (%)
Eswatini’s Ratio (%)
Public External Debt Stock to Exports of goods and services 100-200 19.88Public External Debt Stock to GDP 30-50 8.6Public Domestic Debt Stock to GDP 20-25 12.4Public External Debt Service to exports of goods and services 15-25 1.04
Source: The World Bank, World Debt Tables: 1989-91 & Central Bank of Eswatini
4.4.4 New Loans / Loan MaturityFor the quarter ending June 2018, no new loans were signed and no loans reached maturity.
4.5 BALANCE OF PAYMENTS (AS AT QUARTER ENDING MARCH 2018)
4.5.1 OverviewEswatini’s overall balance of payments shows a continued net depletion of the country’s reserve assets recording a E397.0 million deficit in the first quarter of 2018 following a deficit of E88.7 million in the last quarter of 2017. The drawdowns in the country’s reserve
assets is explained by a E472.3 million drop in the value of external assets classified within the securities markets. 4.5.2 Current AccountExternal sector activity, in the first quarter of 2018, resulted in a E2.287 billion current account surplus up from the E1.912 billion surplus reported in the last quarter of 2017. The widening of the surplus, during the quarter is largely attributable to a consistently positive trade account coupled with huge net inflows in the secondary income account mainly consisting of SACU receipts. The surplus
32 Central Bank of Eswatini Quarterly Review - June 2018
was also supported by a notable decline in the net outflows recorded in the primary income account. The surplus in the first quarter of 2018 was equivalent to 3.9 per cent of GDP from 3.2 per cent in the fourth quarter of 2017.
4.5.3 Trade AccountThe trade account continues to capture persistent surpluses, recording a E915.9 billion surplus in the first quarter of 2018, however declining by a quarterly 20.7 per cent when compared with the last quarter of 2017. Exports reversed the 12.1 per cent gains in receipts made in the fourth quarter, contracting by 12.2 per cent to E6.203 billion in the first quarter of 2018. From the same period last year, data shows a 15 per cent year-on-year decline in export earnings due to a combination of a stronger lilangeni against major world currencies and subdued economic activity.
Export earnings declined largely due to a 32.2 per cent quarter-on-quarter contraction in receipts from the export of products of chemical industries, which include edible preparations, to E2.733 billion in the quarter ending March 2018. A yearly comparison, however, shows a meagre 0.8 per cent increase in earnings from the export of products of chemical industries. Receipts from the export of sugar and sugar confectionary also dipped by 15.8 per cent quarter-on-quarter to E913.6 million in the first
quarter. This contraction is also highlighted in a 27.9 per cent year-on-year drop in export receipts when compared with the same period in 2017. In that same vein, textiles registered a decline in export earnings, from E843.7 million in the quarter ending December 2017 to E652.7 million in the first quarter of 2018. On a positive note, wood and wood products recorded gains, with export earnings increasing by 1.8 per cent quarter-on-quarter and 4.3 per cent year-on-year to E328.4 million in the first quarter of 2018. South Africa remains the major destination for exports of wood and wood products. Also contributing to the contraction in the positive trade balance were merchandise import payments which fell by 10.2 per cent quarter-on-quarter to E5.287 billion in the quarter ending March 2018. An annual comparison shows that import payments, however, increased by 12.3 per cent on account of import volume increases during the period. Vehicles, parts and accessories imports took a tumble during the first quarter, falling by 16.1 per cent quarter-on-quarter and 32 per cent year-on-year to E351.9 million. Fuel and oil imports followed the same pattern, posting a 10.7 per cent quarter-on-quarter drop in payments, with a year-on-year comparison showing a notable 25.2 per cent reduction in fuel import payments to E605.5 million in the first quarter of 2018.

33Central Bank of Eswatini Quarterly Review - June 2018
FIGURE 19: CURRENT ACCOUNT; MARCH 2017 – MARCH 2018Figure 19 Current Account
Figure 20 Financial Account
-2,000
-1,000
0
1,000
2,000
3,000
4,000
5,000
6,000
7,000
8,000
E' M
illio
ns
Export of Goods and Services Import of Goods and Services
Current account Trade Balance
-3,000.0
-2,000.0
-1,000.0
1,000.0
2,000.0
3,000.0
4,000.0
5,000.0
E' M
illio
ns
Financial Account Assets Liabilities
-2,000.0-1,000.0
0.0
1,000.0
2,000.0
3,000.04,000.0
5,000.0
6,000.0
7,000.0
8,000.0
E’M
illio
n
Export of Goods & Services Import of Goods & Services
Trade BalanceCurrent Account Balance
2017Q1 2017Q2 2017Q3 2017Q4 2018Q1
Source: Central Bank of Eswatini
4.5.4 Services AccountIn the first quarter of 2018, the services account deficit widened by E537.1 to E962 million from E440.1 billion in the final quarter of 2017 on account of a significant fall in both services inflows and outflows. Services inflows took a downturn in the quarter ending March 2018, to record E178.6 million. Outflows during the quarter amounted to E1.156 billion, an insignificant quarter-on-quarter decrease.
Net outflows of E138.8 million were recorded in the transport services account in the quarter ending March 2018, a decrease of 11.9 per cent from the preceding period. The transport services account registered outflows of E139.4 million, a quarterly decline of 15.1 per cent compared to the final quarter of 2017.
Travel services, in the first quarter of the year, registered a narrower deficit of E66.5 million compared to the E137.7 million deficit in the prior quarter. Eswatini remains a net importer of travel services, notwithstanding the 44.7 per cent quarterly contraction in net travel services owing to a decline in the demand for business and personal travel services. Travel services inflows declined marginally to E52.8 million with outflows plunging by 37.4 per cent quarter-on-quarter to E119.3 million.
4.5.5 Primary IncomeThe primary income account recorded a surplus of E323.9 million in the first quarter of 2018, a positive turnaround from the deficit of E859.0 billion observed in the previous quarter. Compensation of employees surplus declined to E67.9 million, while the other primary income deficit also contracted slightly from E355.3 to E331.6 million. Investment income largely influenced the overall primary income account posting a surplus of E587.7 million from a deficit of E604.4 billion.
During the first quarter of the year compensation of employees inflows amounted to E101.5 million from a higher E134.5 million, while outflows in the same sub account recorded a decline of 0.6 per cent quarter-on-quarter to E33.6 million. Transactions in the investment account resulted in the surplus of the primary income account, from outflows of E1.011 billion to a negative outflow of E281 million. This is as a result of reinvested earnings that were drawn down by E405.3 million as well as a decline in outflows of dividends, that reduced from E623.6 million to E76.3 million in the quarter ending December 2017 and March 2018 respectively. Investment income inflows amounted to E306.6 million in the first quarter

34 Central Bank of Eswatini Quarterly Review - June 2018
from E407.0 million in the previous quarter.
In the quarter ending March 2018, other primary income inflows decreased by E88.5 million to E47.5 million. Outflows in the same period were E379.2 million, 22.8 per cent lower than the E491.3 million recorded in the previous quarter. Transactions in this sub account are majorly influenced by taxes on products and production.
4.5.6 Secondary IncomeThe secondary income account recorded a continued surplus of E2.025 billion, 1.6 per cent lower than the previous quarter. Year-on-year however, it increased by 21.2 per cent.
SACU receipts continue to be the main driver of the secondary income surplus, with inflows amounting to E1.777 billion in the first quarter, higher than the E1.313 billion recorded in the same quarter of the previous year. Other inflows included personal transfers as well as inflows from nonfinancial corporations amounting to E372.7 million and E226.3 million respectively. However, these inflows were 11.6 per cent and 30.1 per cent lower than the inflows posted in the preceding quarter. Secondary income outflows totalled E125.5 million in the quarter ending March consisting of social contributions, insurance and other miscellaneous transfers from E141.4 million in the previous quarter.
4.5.7 Financial AccountThe financial account, in the first quarter of 2018, acquired net foreign assets amounting to E3.155 billion, a 0.3 per cent increase in foreign asset acquisitions from the previous quarter. Contributing to the improvement in asset acquisitions was an upsurge in net acquisitions of foreign assets in the ‘other investment’ and direct investment accounts.Direct investment posted a net E391.0 million in outflows during the first quarter largely on account of a reduction in the country’s direct investment liabilities, after a net E188.7 million worth of foreign asset acquisitions
in the previous quarter. Direct investment asset acquisitions grew by E13.8 million in the quarter ending March 2018 after a E931.3 million increase in foreign asset acquisitions in the preceding quarter. Direct investment liabilities incurred, on the other hand, were reduced by E377.2 million from an increase of E742.6 million in foreign liabilities incurred in the last quarter of 2017. This is explained by a E405.3 million decline in reinvested earnings as profits dropped during the period due to slow economic activity.
Portfolio investment foreign assets acquired shrunk by E93.3 million in the first quarter of 2018, after posting a E25.7 million drop in portfolio assets acquired in the last quarter of 2017. The contraction in portfolio assets acquired is in lieu of a E114.1 million decrease in long term debt security assets by ‘other sectors’.
The ‘other Investment’ account acquired a net E3.210 billion in foreign assets in the first quarter, after a net acquisition of E2.993 billion assets in the preceding period. Assets increased by a lower E2.466 billion in the first quarter, down from a E3.305 billion increase in assets in the previous quarter. The deceleration in the other investments assets acquisitions is explained by a slower increase in currency and deposits denominated in foreign currency coupled with a slower increase in trade credits and advances. Furthermore, a E743.9 million reduction in other investment liabilities incurred is posted against the previous period’s E311.7 million increase in liabilities. The reduction in liabilities is largely attributable to a E447.7 million outflow related to the Eswatini government servicing its foreign loans.

35Central Bank of Eswatini Quarterly Review - June 2018
FIGURE 20: FINANCIAL ACCOUNT; MARCH 2017 - MARCH 2018
Figure 19 Current Account
Figure 20 Financial Account
-2,000
-1,000
0
1,000
2,000
3,000
4,000
5,000
6,000
7,000
8,000
E' M
illio
ns
Export of Goods and Services Import of Goods and Services
Current account Trade Balance
-3,000.0
-2,000.0
-1,000.0
1,000.0
2,000.0
3,000.0
4,000.0
5,000.0
E' M
illio
ns
Financial Account Assets Liabilities
3,000.0
5,000.0
4,000.0
-1,000.0
2,000.0
Financial Account Assets Liabilities
E’M
illio
n
2017Q1 2017Q2 2017Q3 2018Q12017Q4
-2,000.0
-3,000.0
1,000.0
0
Source: Central Bank of Eswatini

36 Central Bank of Eswatini Quarterly Review - June 2018
5.1 Monetary Policy Statement – May 2018
On the 25th May 2018, the Central Bank of Eswatini (Bank), together with the Monetary Policy Consultative Committee (MPCC) held a meeting to consider the appropriate monetary policy stance for the Bank for the upcoming two months.
The appropriate monetary stance was taken after considering international, regional and domestic economic conditions, which the Bank envisaged would have an effect on its price and financial stability mandate.
The Bank decided to keep the discount rate unchanged at 6.75 per cent. The underlying reasons for maintaining the discount rate are enumerated below:
The MPCC noted that global growth continued to improve owing to an increased momentum in trade and investment, supported by favourable financial conditions. Inflation in most advanced economies is moderating but remains on an upward trajectory, especially in the USA. The rising oil and food prices pose an upside risk to global inflation.
Under regional developments, growth in South Africa firmed up from 2.3 per cent in the third quarter of 2017 to 3.1 per cent in the last quarter of 2017. Consumer inflation increased to 4.5 per cent in April 2018 from 3.8 per cent in March 2018, as the impact of VAT increase and other levies became evident. Whilst the inflation forecast for South Africa remains unchanged at 4.9 per cent for 2018 and 5.2 per cent for 2019, the South African Reserve Bank noted that rising oil prices and a weak Rand could result in higher inflation over the medium term.
In Eswatini, headline inflation had an upswing in the month of April 2018, increasing to 4.8 per cent from 4.0 per cent in March 2018. The
rise in overall inflation was as a result of a higher increase in the price index for ‘Housing and Utilities’, which jumped by 13.3 per cent in April 2018 from an increase of 8.1 per cent in March 2018. This was mainly due to a 15 per cent year-on-year increase in the prices for ‘actual rentals’. Of note also is that electricity tariffs increased by an average of 15 per cent in April 2018 as part of the two-year-multi-tariff approved by the energy regulator in 2017. Inflation averaged 4.3 per cent in the first quarter of 2018. The Bank’s inflation forecasts for the second and third quarter of 2018 remain unchanged at 5.26 per cent and 5.66 per cent, respectively. The proposed increase in Value Added Tax (VAT) and rising oil prices will result in inflation rising over the period of the forecast.
Growth in credit extended to the private sector has shown marginal slowdown. Year-on-year credit extension to the private sector grew by 11.2 per cent in March 2018 compared to a 12.7 per cent growth recorded in January 2018. This was in spite of the accommodative monetary policy stance pursued by the Bank since January 2018. The reduction in demand for credit was observed in Community, Social Services & Personal Services, Real Estate, Mining & Quarrying and Manufacturing.
As at 18 May 2018, the country’s reserves were at E6.5 billion, enough to cover an estimated 3.2 months of imports of goods and services. The country’s reserves have remained above the internationally recommended 3 months of imports of goods and services, even though next month might be challenging.
The Bank will continue to monitor developments that will influence the movements of inflation and reassures the public that it will act appropriately if there are significant changes to the inflation outlook. The Bank further reassures the public that the Bank’s monetary policy stance remains supportive to economic growth.
5. STATEMENT OF THE MONETARY POLICY COMMITTEE

37Central Bank of Eswatini Quarterly Review - June 2018
STATISTICAL APPENDIX

38 Central Bank of Eswatini Quarterly Review - June 2018
Table S 1.1CENTRAL BANK OF ESWATINI, ASSETS
(E’000)Table S 1.1CENTRAL BANK OF SWAZILAND, ASSETS
(E'000)--------------------------- ----------------------------- ----------------------------- ----------------------------- ----------------------------- ------------------------------------------------------------ ----------------------------- ----------------------------- -----------------------------
Claims on Non-residents Claims On----------------------------- ----------------------------- ----------------------------- ----------------------------- ------------------------------------------------------------ -----------------------------
Cash and Other Claims Other Other Fixed andPeriod Bals with on Non- Total Depository Resident Other TotalEnded Banks residents Claims Govt. Corporations Sectors Total Assets Assets
--------------------------- ----------------------------- ----------------------------- ----------------------------- ----------------------------- ------------------------------------------------------------ ----------------------------- ----------------------------- -----------------------------2005 1,435,653 102,097 1,537,750 100,571 707 5,525 106,803 212,823 1,857,3762006 2,430,467 138,658 2,569,125 55,122 21,843 4,933 81,898 191,370 2,842,3932007 3,699,049 734,728 4,433,777 14,740 1,848 4,992 21,580 128,662 4,584,0202008 6,402,898 1,270,634 7,673,532 0 1,852 7,867 9,719 133,277 7,816,5292009 5,124,761 1,828,896 6,953,658 777 1,840 11,693 14,310 269,902 7,237,8702010 3,518,448 1,391,673 4,910,121 841 1,838 16,415 19,094 217,438 5,146,6522011 3,299,197 1,429,701 4,728,898 746,256 1,836 18,841 766,933 238,607 5,734,4382012 4,621,317 1,536,164 6,157,481 58,420 660 19,544 78,624 285,085 6,521,1902013 6,767,427 1,861,104 8,628,531 60,363 665 18,868 79,896 348,084 9,056,5112014 6,705,672 1,949,836 8,655,509 2,613 1,835 20,100 24,549 442,774 9,122,8312015 7,064,323 2,371,703 9,436,027 1,390 667 22,250 24,307 418,433 9,878,7672016 6,442,447 2,608,819 9,051,266 1,124,106 25,670 25,534 1,175,309 431,236 10,657,8112017 5,270,440 2,928,619 8,199,060 1,323,157 667 30,151 1,353,976 1,876,709 11,429,7452010March 4,806,200 1,714,386 6,520,586 1,035 1,850 12,829 15,714 196,240 6,732,540June 3,800,540 1,676,419 5,476,959 542 1,839 15,545 17,925 186,732 5,681,616September 3,918,002 1,416,595 5,334,597 957 1,845 15,967 18,769 197,082 5,550,449December 3,518,448 1,391,673 4,910,121 841 1,838 16,415 19,094 217,438 5,146,6522011March 3,143,617 1,331,802 4,475,419 551,001 36,840 16,919 604,761 207,766 5,287,946June 2,834,743 1,383,599 4,218,342 748,943 1,836 17,257 768,036 217,429 5,203,807September 3,100,528 1,415,627 4,516,155 756,422 1,840 18,583 776,845 239,139 5,532,140December 3,299,197 1,429,701 4,728,898 746,256 1,836 18,841 766,933 238,607 5,734,4382012March 2,992,210 1,303,657 4,295,867 755,747 1,840 20,198 777,784 248,416 5,322,067June 3,504,561 1,389,246 4,893,807 766,679 1,836 21,037 789,552 266,603 5,949,962September 3,948,823 1,457,222 5,406,045 58,906 3,830 19,471 82,207 267,914 5,756,165December 4,621,317 1,536,164 6,157,481 58,420 660 19,544 78,624 285,085 6,521,1902013March 5,291,828 1,515,571 6,807,399 58,157 46,839 20,794 125,790 312,797 7,245,986June 6,010,954 1,669,506 7,680,459 58,111 8,835 21,182 88,128 310,638 8,079,225September 6,068,198 1,748,689 7,816,887 58,430 91,707 21,630 171,768 323,352 8,312,007December 6,767,427 1,861,104 8,628,531 60,363 665 18,868 79,896 348,084 9,056,5112014January 7,924,392 2,019,474 9,943,866 59,541 46,839 18,514 124,894 372,288 10,441,047February 7,447,494 1,953,583 9,401,077 59,162 1,842 19,412 80,415 355,374 9,836,867March 6,946,042 1,836,419 8,782,462 1,265 31,837 18,821 51,923 389,156 9,223,542April 7,595,695 1,836,892 9,432,587 1,512 11,841 19,490 32,843 402,669 9,868,099May 6,816,064 1,811,564 8,627,628 1,484 41,845 19,459 62,788 415,114 9,105,530June 6,319,253 1,877,745 8,196,999 1,979 60,534 19,607 82,120 407,460 8,686,578July 7,309,823 1,876,398 9,186,221 1,483 1,688 19,810 22,981 402,549 9,611,752August 6,494,854 1,836,278 8,331,132 26,299 1,841 19,961 48,102 401,660 8,780,894September 6,017,772 1,906,962 7,924,734 1,485 1,837 20,279 23,602 411,181 8,359,517October 7,194,348 1,855,269 9,049,618 2,122 31,841 20,343 54,306 430,836 9,534,760November 6,879,234 1,858,082 8,737,316 2,282 1,844 20,519 24,645 413,433 9,175,394December 6,705,672 1,949,836 8,655,509 2,613 1,835 20,100 24,549 442,799 9,122,8562015January 7,549,111 1,911,355 9,460,466 3,174 110,839 17,861 131,874 428,445 10,020,785February 7,279,749 1,898,124 9,177,873 2,699 1,842 17,956 22,497 408,023 9,608,393March 7,034,808 1,816,562 8,851,370 2,797 1,838 16,798 21,433 410,963 9,283,766April 7,545,316 1,809,615 9,354,932 3,233 1,841 16,526 21,601 417,827 9,794,360May 6,994,168 1,831,569 8,825,737 3,866 1,845 17,113 22,823 421,146 9,269,706June 6,680,158 1,901,142 8,581,299 5,053 665 17,740 23,457 420,801 9,025,557July 7,377,592 1,956,426 9,334,018 3,876 1,839 20,545 26,259 428,490 9,788,767August 6,967,674 2,050,869 9,018,542 3,066 1,842 21,772 26,681 425,931 9,471,154September 6,767,440 2,106,107 8,873,547 2,744 1,708 22,061 26,514 435,242 9,335,304October 7,716,726 2,094,988 9,811,714 2,543 1,843 21,170 25,555 439,530 10,276,800November 7,577,937 2,146,153 9,724,089 2,517 1,847 21,859 26,224 433,751 10,184,064December 7,064,323 2,371,703 9,436,027 1,390 667 22,250 24,307 418,433 9,878,7672016January 8,243,452 2,408,241 10,651,693 1,534 1,842 23,127 26,503 444,179 11,122,375February 7,305,424 3,040,283 10,345,708 1,904 1,846 23,593 27,344 429,852 10,802,903March 7,229,579 2,749,755 9,979,334 3,278 1,310 24,124 28,712 445,577 10,453,623April 7,931,115 2,666,976 10,598,091 2,955 121,844 23,765 148,564 445,749 11,192,404May 7,141,454 2,965,992 10,107,446 555,307 1,849 24,142 581,298 453,256 11,142,000June 6,974,735 2,786,320 9,761,055 558,355 669 24,344 583,367 443,698 10,788,119July 7,149,037 2,671,100 9,820,137 560,424 1,844 24,912 587,180 478,760 10,886,077August 6,531,188 2,809,493 9,340,681 1,116,425 1,850 24,884 1,143,159 432,842 10,916,682September 6,192,950 2,650,465 8,843,416 1,122,620 1,313 24,509 1,148,441 433,118 10,424,975October 6,929,372 2,575,693 9,505,065 1,128,235 36,847 24,458 1,189,541 463,259 11,157,864November 6,438,055 2,647,347 9,085,402 1,117,149 1,853 24,998 1,144,000 442,285 10,671,687December 6,442,447 2,608,819 9,051,266 1,124,106 25,670 25,534 1,175,309 431,236 10,657,8112017January 6,992,505 2,568,507 9,561,012 1,130,052 2,925 26,458 1,159,436 428,550 11,148,997February 6,250,315 2,544,957 8,795,272 1,116,653 2,017 26,799 1,145,469 430,395 10,371,136March 5,811,930 2,816,526 8,628,457 1,123,211 2,010 26,603 1,151,824 439,953 10,220,233April 6,663,774 2,831,032 9,494,806 1,129,384 1,349 27,088 1,157,821 416,303 11,068,929May 5,895,010 2,837,166 8,732,176 1,117,274 2,017 27,802 1,147,093 443,781 10,323,050June 5,310,912 2,887,843 8,198,756 1,124,211 45,667 27,595 1,197,473 468,754 9,864,983July 6,577,789 2,947,543 9,525,332 1,130,028 1,981 28,798 1,160,808 443,212 11,129,351August 5,720,422 2,938,286 8,658,708 1,116,945 2,015 29,081 1,148,041 447,209 10,253,958September 5,509,845 3,043,445 8,553,290 1,298,403 2,065 29,090 1,329,558 436,303 10,319,151October 6,757,971 3,145,449 9,903,420 1,306,471 2,055 29,095 1,337,621 1,876,435 13,117,477November 6,143,897 3,124,697 9,268,594 1,314,683 2,061 30,042 1,346,785 1,866,435 12,481,815December 5,270,440 2,928,619 8,199,060 1,323,157 667 30,151 1,353,976 1,876,709 11,429,7452018January 5,963,730 2,885,718 8,849,448 1,329,766 2,056 31,590 1,363,413 1,873,940 12,086,800February 5,397,316 2,885,058 8,282,373 1,337,137 2,066 30,263 1,369,465 1,842,627 11,494,466March 4,962,556 2,881,580 7,844,137 1,336,677 2,038 30,861 1,369,576 534,440 9,748,153April 5,484,931 2,788,579 8,273,509 1,295,402 2,038 30,801 1,328,241 2,179,737 11,781,488May 5,061,333 2,834,116 7,895,449 1,350,854 2,079 30,825 1,383,758 1,772,297 11,051,504June 4,432,594 3,059,011 7,491,605 1,322,329 2,088 30,832 1,355,249 506,734 9,353,588ChangeOver 12 Months (878,318) 171,168 (707,150) 198,118 (43,579) 3,237 157,776 37,979 (511,395)--------------------------- ----------------------------- ----------------------------- ----------------------------- ----------------------------- ------------------------------------------------------------ ----------------------------- ----------------------------- -----------------------------
CLAIMS ON GOVERNMENT - Includes Eswatini Government Securities and Loans with the CBE.CLAIMS ON OTHER DEPOSITORY CORPORATIONS - Includes CBE claims on Banks and the Building Society including accrued interest.CLAIMS ON OTHER RESIDENT SECTORS - Includes CBE claims on other sectors such as staff and other financial corporations.FIXED AND OTHER ASSETS - Includes fixed and other assets plus revaluation deficit payable by Government.
EXTERNAL RESERVES - These are holdings by the Central Bank of Eswatini with external banks, Rand notes, foreign treasury bills and acceptances, the reserve position in IMF and SDR holdings.
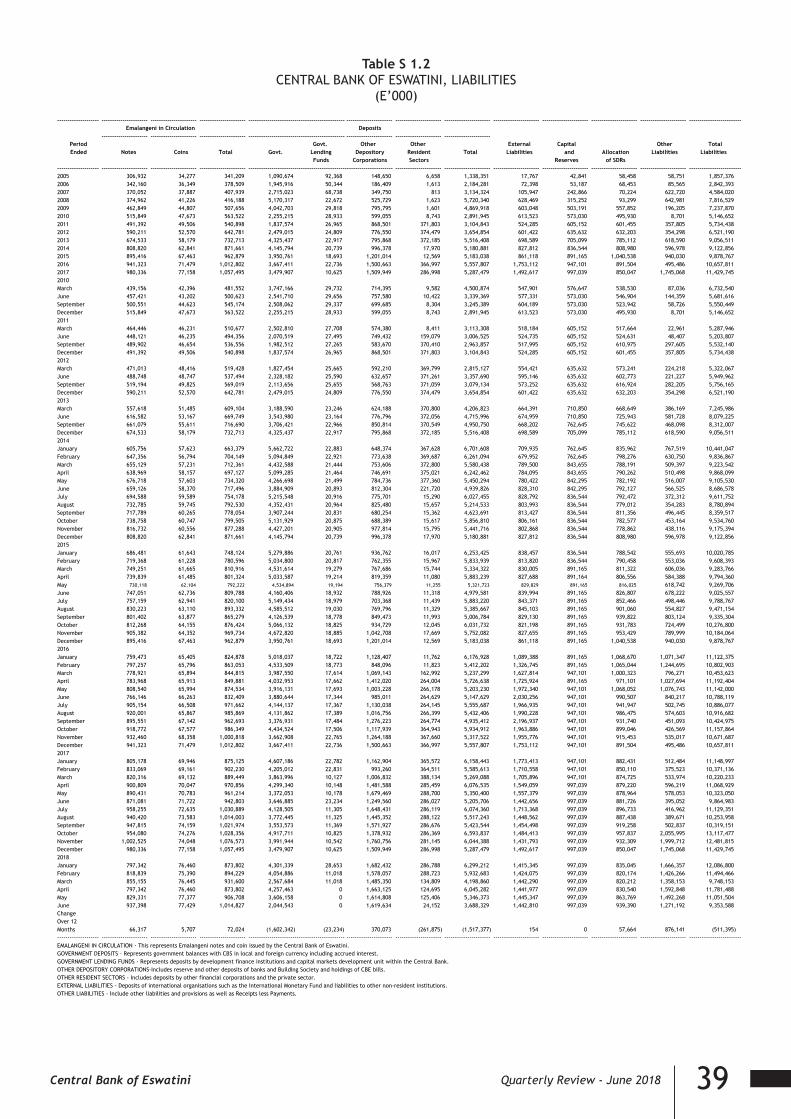
39Central Bank of Eswatini Quarterly Review - June 2018
Table S 1.2CENTRAL BANK OF ESWATINI, LIABILITIES
(E’000)Table S 1.2CENTRAL BANK OF SWAZILAND, LIABILITIES
(E'000)-------------------- ---------------------- ---------------------- ---------------------- ---------------------------------------------- ---------------------- ---------------------- ---------------------- ---------------------- ---------------------- ---------------------- ---------------------- --------------------------------
Emalangeni in Circulation Deposits---------------------- ---------------------- ---------------------- ---------------------------------------------- ---------------------- ---------------------- ----------------------
Period Govt. Other Other External Capital Other TotalEnded Notes Coins Total Govt. Lending Depository Resident Total Liabilities and Allocation Liabilities Liabilities
Funds Corporations Sectors Reserves of SDRs-------------------- ---------------------- ---------------------- ---------------------- --------------------------------------------------------------------- ---------------------- ---------------------- ---------------------- ---------------------- ---------------------- ---------------------- --------------------------------2005 306,932 34,277 341,209 1,090,674 92,368 148,650 6,658 1,338,351 17,767 42,841 58,458 58,751 1,857,3762006 342,160 36,349 378,509 1,945,916 50,344 186,409 1,613 2,184,281 72,398 53,187 68,453 85,565 2,842,3932007 370,052 37,887 407,939 2,715,023 68,738 349,750 813 3,134,324 105,947 242,866 70,224 622,720 4,584,0202008 374,962 41,226 416,188 5,170,317 22,672 525,729 1,623 5,720,340 628,469 315,252 93,299 642,981 7,816,5292009 462,849 44,807 507,656 4,042,703 29,818 795,795 1,601 4,869,918 603,048 503,191 557,852 196,205 7,237,8702010 515,849 47,673 563,522 2,255,215 28,933 599,055 8,743 2,891,945 613,523 573,030 495,930 8,701 5,146,6522011 491,392 49,506 540,898 1,837,574 26,965 868,501 371,803 3,104,843 524,285 605,152 601,455 357,805 5,734,4382012 590,211 52,570 642,781 2,479,015 24,809 776,550 374,479 3,654,854 601,422 635,632 632,203 354,298 6,521,1902013 674,533 58,179 732,713 4,325,437 22,917 795,868 372,185 5,516,408 698,589 705,099 785,112 618,590 9,056,5112014 808,820 62,841 871,661 4,145,794 20,739 996,378 17,970 5,180,881 827,812 836,544 808,980 596,978 9,122,8562015 895,416 67,463 962,879 3,950,761 18,693 1,201,014 12,569 5,183,038 861,118 891,165 1,040,538 940,030 9,878,7672016 941,323 71,479 1,012,802 3,667,411 22,736 1,500,663 366,997 5,557,807 1,753,112 947,101 891,504 495,486 10,657,8112017 980,336 77,158 1,057,495 3,479,907 10,625 1,509,949 286,998 5,287,479 1,492,617 997,039 850,047 1,745,068 11,429,7452010March 439,156 42,396 481,552 3,747,166 29,732 714,395 9,582 4,500,874 547,901 576,647 538,530 87,036 6,732,540June 457,421 43,202 500,623 2,541,710 29,656 757,580 10,422 3,339,369 577,331 573,030 546,904 144,359 5,681,616September 500,551 44,623 545,174 2,508,062 29,337 699,685 8,304 3,245,389 604,189 573,030 523,942 58,726 5,550,449December 515,849 47,673 563,522 2,255,215 28,933 599,055 8,743 2,891,945 613,523 573,030 495,930 8,701 5,146,6522011March 464,446 46,231 510,677 2,502,810 27,708 574,380 8,411 3,113,308 518,184 605,152 517,664 22,961 5,287,946June 448,121 46,235 494,356 2,070,519 27,495 749,432 159,079 3,006,525 524,735 605,152 524,631 48,407 5,203,807September 489,902 46,654 536,556 1,982,512 27,265 583,670 370,410 2,963,857 517,995 605,152 610,975 297,605 5,532,140December 491,392 49,506 540,898 1,837,574 26,965 868,501 371,803 3,104,843 524,285 605,152 601,455 357,805 5,734,4382012March 471,013 48,416 519,428 1,827,454 25,665 592,210 369,799 2,815,127 554,421 635,632 573,241 224,218 5,322,067June 488,748 48,747 537,494 2,328,182 25,590 632,657 371,261 3,357,690 595,146 635,632 602,773 221,227 5,949,962September 519,194 49,825 569,019 2,113,656 25,655 568,763 371,059 3,079,134 573,252 635,632 616,924 282,205 5,756,165December 590,211 52,570 642,781 2,479,015 24,809 776,550 374,479 3,654,854 601,422 635,632 632,203 354,298 6,521,1902013March 557,618 51,485 609,104 3,188,590 23,246 624,188 370,800 4,206,823 664,391 710,850 668,649 386,169 7,245,986June 616,582 53,167 669,749 3,543,980 23,164 776,796 372,056 4,715,996 674,959 710,850 725,943 581,728 8,079,225September 661,079 55,611 716,690 3,706,421 22,966 850,814 370,549 4,950,750 668,202 762,645 745,622 468,098 8,312,007December 674,533 58,179 732,713 4,325,437 22,917 795,868 372,185 5,516,408 698,589 705,099 785,112 618,590 9,056,5112014January 605,756 57,623 663,379 5,662,722 22,883 648,374 367,628 6,701,608 709,935 762,645 835,962 767,519 10,441,047February 647,356 56,794 704,149 5,094,849 22,921 773,638 369,687 6,261,094 679,952 762,645 798,276 630,750 9,836,867March 655,129 57,231 712,361 4,432,588 21,444 753,606 372,800 5,580,438 789,500 843,655 788,191 509,397 9,223,542April 638,969 58,157 697,127 5,099,285 21,464 746,691 375,021 6,242,462 784,095 843,655 790,262 510,498 9,868,099May 676,718 57,603 734,320 4,266,698 21,499 784,736 377,360 5,450,294 780,422 842,295 782,192 516,007 9,105,530June 659,126 58,370 717,496 3,884,909 20,893 812,304 221,720 4,939,826 828,310 842,295 792,127 566,525 8,686,578July 694,588 59,589 754,178 5,215,548 20,916 775,701 15,290 6,027,455 828,792 836,544 792,472 372,312 9,611,752August 732,785 59,745 792,530 4,352,431 20,964 825,480 15,657 5,214,533 803,993 836,544 779,012 354,283 8,780,894September 717,789 60,265 778,054 3,907,244 20,831 680,254 15,362 4,623,691 813,427 836,544 811,356 496,445 8,359,517October 738,758 60,747 799,505 5,131,929 20,875 688,389 15,617 5,856,810 806,161 836,544 782,577 453,164 9,534,760November 816,732 60,556 877,288 4,427,201 20,905 977,814 15,795 5,441,716 802,868 836,544 778,862 438,116 9,175,394December 808,820 62,841 871,661 4,145,794 20,739 996,378 17,970 5,180,881 827,812 836,544 808,980 596,978 9,122,8562015January 686,481 61,643 748,124 5,279,886 20,761 936,762 16,017 6,253,425 838,457 836,544 788,542 555,693 10,020,785February 719,368 61,228 780,596 5,034,800 20,817 762,355 15,967 5,833,939 813,820 836,544 790,458 553,036 9,608,393March 749,251 61,665 810,916 4,531,614 19,279 767,686 15,744 5,334,322 830,005 891,165 811,322 606,036 9,283,766April 739,839 61,485 801,324 5,033,587 19,214 819,359 11,080 5,883,239 827,688 891,164 806,556 584,388 9,794,360May 730,118 62,104 792,222 4,534,894 19,194 756,379 11,255 5,321,723 829,829 891,165 816,025 618,742 9,269,706June 747,051 62,736 809,788 4,160,406 18,932 788,926 11,318 4,979,581 839,994 891,165 826,807 678,222 9,025,557July 757,159 62,941 820,100 5,149,434 18,979 703,368 11,439 5,883,220 843,371 891,165 852,466 498,446 9,788,767August 830,223 63,110 893,332 4,585,512 19,030 769,796 11,329 5,385,667 845,103 891,165 901,060 554,827 9,471,154September 801,402 63,877 865,279 4,126,539 18,778 849,473 11,993 5,006,784 829,130 891,165 939,822 803,124 9,335,304October 812,268 64,155 876,424 5,066,132 18,825 934,729 12,045 6,031,732 821,198 891,165 931,783 724,499 10,276,800November 905,382 64,352 969,734 4,672,820 18,885 1,042,708 17,669 5,752,082 827,655 891,165 953,429 789,999 10,184,064December 895,416 67,463 962,879 3,950,761 18,693 1,201,014 12,569 5,183,038 861,118 891,165 1,040,538 940,030 9,878,7672016January 759,473 65,405 824,878 5,018,037 18,722 1,128,407 11,762 6,176,928 1,089,388 891,165 1,068,670 1,071,347 11,122,375February 797,257 65,796 863,053 4,533,509 18,773 848,096 11,823 5,412,202 1,326,745 891,165 1,065,044 1,244,695 10,802,903March 778,921 65,894 844,815 3,987,550 17,614 1,069,143 162,992 5,237,299 1,627,814 947,101 1,000,323 796,271 10,453,623April 783,968 65,913 849,881 4,032,953 17,662 1,412,020 264,004 5,726,638 1,725,924 891,165 971,101 1,027,694 11,192,404May 808,540 65,994 874,534 3,916,131 17,693 1,003,228 266,178 5,203,230 1,972,340 947,101 1,068,052 1,076,743 11,142,000June 766,146 66,263 832,409 3,880,644 17,344 985,011 264,629 5,147,629 2,030,256 947,101 990,507 840,217 10,788,119July 905,154 66,508 971,662 4,144,137 17,367 1,130,038 264,145 5,555,687 1,966,935 947,101 941,947 502,745 10,886,077August 920,001 65,867 985,869 4,131,862 17,389 1,016,756 266,399 5,432,406 1,990,228 947,101 986,475 574,603 10,916,682September 895,551 67,142 962,693 3,376,931 17,484 1,276,223 264,774 4,935,412 2,196,937 947,101 931,740 451,093 10,424,975October 918,772 67,577 986,349 4,434,524 17,506 1,117,939 364,943 5,934,912 1,963,886 947,101 899,046 426,569 11,157,864November 932,460 68,358 1,000,818 3,662,908 22,765 1,264,188 367,660 5,317,522 1,955,776 947,101 915,453 535,017 10,671,687December 941,323 71,479 1,012,802 3,667,411 22,736 1,500,663 366,997 5,557,807 1,753,112 947,101 891,504 495,486 10,657,8112017January 805,178 69,946 875,125 4,607,186 22,782 1,162,904 365,572 6,158,443 1,773,413 947,101 882,431 512,484 11,148,997February 833,069 69,161 902,230 4,205,012 22,831 993,260 364,511 5,585,613 1,710,558 947,101 850,110 375,523 10,371,136March 820,316 69,132 889,449 3,863,996 10,127 1,006,832 388,134 5,269,088 1,705,896 947,101 874,725 533,974 10,220,233April 900,809 70,047 970,856 4,299,340 10,148 1,481,588 285,459 6,076,535 1,549,059 997,039 879,220 596,219 11,068,929May 890,431 70,783 961,214 3,372,053 10,178 1,679,469 288,700 5,350,400 1,557,379 997,039 878,964 578,053 10,323,050June 871,081 71,722 942,803 3,646,885 23,234 1,249,560 286,027 5,205,706 1,442,656 997,039 881,726 395,052 9,864,983July 958,255 72,635 1,030,889 4,128,505 11,305 1,648,431 286,119 6,074,360 1,713,368 997,039 896,733 416,962 11,129,351August 940,420 73,583 1,014,003 3,772,445 11,325 1,445,352 288,122 5,517,243 1,448,562 997,039 887,438 389,671 10,253,958September 947,815 74,159 1,021,974 3,553,573 11,369 1,571,927 286,676 5,423,544 1,454,498 997,039 919,258 502,837 10,319,151October 954,080 74,276 1,028,356 4,917,711 10,825 1,378,932 286,369 6,593,837 1,484,413 997,039 957,837 2,055,995 13,117,477November 1,002,525 74,048 1,076,573 3,991,944 10,542 1,760,756 281,145 6,044,388 1,431,793 997,039 932,309 1,999,712 12,481,815December 980,336 77,158 1,057,495 3,479,907 10,625 1,509,949 286,998 5,287,479 1,492,617 997,039 850,047 1,745,068 11,429,7452018January 797,342 76,460 873,802 4,301,339 28,653 1,682,432 286,788 6,299,212 1,415,345 997,039 835,045 1,666,357 12,086,800February 818,839 75,390 894,229 4,054,886 11,018 1,578,057 288,723 5,932,683 1,424,075 997,039 820,174 1,426,266 11,494,466March 855,155 76,445 931,600 2,567,684 11,018 1,485,350 134,809 4,198,860 1,442,290 997,039 820,212 1,358,153 9,748,153April 797,342 76,460 873,802 4,257,463 0 1,663,125 124,695 6,045,282 1,441,977 997,039 830,540 1,592,848 11,781,488May 829,331 77,377 906,708 3,606,158 0 1,614,808 125,406 5,346,373 1,445,347 997,039 863,769 1,492,268 11,051,504June 937,398 77,429 1,014,827 2,044,543 0 1,619,634 24,152 3,688,329 1,442,810 997,039 939,390 1,271,192 9,353,588ChangeOver 12 Months 66,317 5,707 72,024 (1,602,342) (23,234) 370,073 (261,875) (1,517,377) 154 0 57,664 876,141 (511,395)-------------------- ---------------------- ---------------------- ---------------------- ---------------------------------------------- ---------------------- ---------------------- ---------------------- ---------------------- ---------------------- ---------------------- ---------------------- --------------------------------
OTHER DEPOSITORY CORPORATIONS-Includes reserve and other deposits of banks and Building Society and holdings of CBE bills.
EMALANGENI IN CIRCULATION - This represents Emalangeni notes and coin issued by the Central Bank of Eswatini.GOVERNMENT DEPOSITS - Represents government balances with CBS in local and foreign currency including accrued interest.GOVERNMENT LENDING FUNDS - Represents deposits by development finance institutions and capital markets development unit within the Central Bank.
EXTERNAL LIABILITIES - Deposits of international organisations such as the International Monetary Fund and liabilities to other non-resident institutions.OTHER LIABILITIES - Include other liabilities and provisions as well as Receipts less Payments.
OTHER RESIDENT SECTORS - Includes deposits by other financial corporations and the private sector.

40 Central Bank of Eswatini Quarterly Review - June 2018
Table S 1.3DENOMINATIONS OF ESWATINI CURRENCY ISSUED BY THE CENTRAL BANK OF ESWATINI
(E’000)Table S 1.3
DENOMINATIONS OF SWAZILAND CURRENCY ISSUED BY THE CENTRAL BANK OF SWAZILAND (E'000)
--------------------- -------------- ------------------ -------------------- --------------------- --------------------- ---------------------- --- -------------- ------------- ----------------- ------------- ------------- ------------- ---------------- -------------- --------------- Notes Coins NOTES and ------------------ -------------------- --------------------- --------------------- ---------------------- --- -------------- ------------- ----------------- ------------- ------------- ------------- ---------------- -------------- ---------------
Period Coins E5+ E2 E1 Other Total E1 E2 E5 E10 E20 E50* E100@ E200# Total--------------------- -------------- ------------------ -------------------- --------------------- --------------------- ---------------------- --- -------------- ------------- ----------------- ------------- ------------- ------------- ---------------- -------------- ---------------2005 341,209 8,773 6,424 7,729 11,351 34,277 342 1,192 1,276 14,144 20,919 113,964 119,488 35,607 306,9322006 378,509 9,426 7,150 8,012 11,759 36,347 342 1,191 1,273 17,236 27,230 124,144 136,815 33,931 342,1622007 407,939 9,715 7,732 8,260 12,179 37,886 342 1,188 1,264 16,877 26,238 122,462 173,488 28,194 370,0532008 416,188 10,728 8,656 8,827 13,015 41,226 342 1,187 1,260 19,882 29,472 60,817 241,364 20,638 374,9622009 507,656 11,601 9,945 9,467 13,794 44,807 342 1,186 1,256 20,199 25,643 60,302 203,101 150,820 462,8492010 563,520 12,428 10,822 9,953 14,469 47,672 342 1,185 1,256 21,284 29,777 56,175 176,635 229,194 515,8482011 540,898 12,953 11,087 10,372 15,095 49,506 342 1,185 1,255 19,668 27,208 52,683 149,685 239,365 491,3922012 642,781 13,596 12,067 10,962 15,946 52,570 342 1,185 1,252 22,697 30,233 60,498 161,803 312,202 590,2112013 732,713 15,574 13,317 12,075 17,214 58,179 342 1,184 1,251 24,918 34,223 66,205 145,835 400,576 674,5332014 871,661 16,725 14,629 12,775 18,712 62,841 342 1,184 1,250 23,715 45,573 87,090 138,525 511,142 808,8202015 962,879 18,696 15,319 13,872 19,575 67,463 342 1,184 1,249 25,676 49,898 91,966 114,527 610,574 895,4172016 1,012,802 20,344 18,222 13,893 19,020 71,479 342 1,184 1,249 25,056 50,292 91,052 102,382 669,768 941,3232017 1,057,495 20,758 18,725 15,691 21,985 77,158 342 1,184 1,249 26,591 51,514 80,866 86,594 731,997 980,3362010March 481,551 10,594 9,338 8,945 13,518 42,395 342 1,186 1,256 17,962 23,306 50,250 185,102 159,752 439,156June 500,623 10,813 9,503 9,178 13,707 43,201 342 1,186 1,256 17,930 23,680 49,679 177,725 185,624 457,422September 545,174 11,469 9,789 9,464 13,901 44,623 342 1,185 1,256 18,233 24,773 52,386 181,326 221,050 500,551December 563,520 12,428 10,822 9,953 14,469 47,672 342 1,185 1,256 21,284 29,777 56,175 176,635 229,194 515,8482011March 510,677 11,845 10,169 9,870 14,347 46,231 342 1,185 1,255 19,775 26,079 51,109 158,362 206,338 464,446June 494,356 11,802 10,080 9,906 14,448 46,235 342 1,185 1,255 18,216 24,429 49,486 142,526 210,682 448,121September 536,556 11,827 10,418 9,861 14,547 46,654 342 1,185 1,255 18,917 26,628 55,387 158,167 228,022 489,902December 540,898 12,953 11,087 10,372 15,095 49,506 342 1,185 1,255 19,668 27,208 52,683 149,685 239,365 491,3922012March 519,428 12,500 10,721 10,200 14,995 48,416 342 1,185 1,255 20,082 26,398 50,816 156,783 214,152 471,013June 537,494 12,448 10,954 10,193 15,152 48,747 342 1,185 1,255 20,131 27,236 54,964 147,960 235,675 488,748September 569,019 12,636 11,272 10,399 15,517 49,825 342 1,185 1,252 20,686 28,136 55,181 149,435 262,978 519,194December 642,781 13,596 12,067 10,962 15,946 52,570 342 1,185 1,252 22,697 30,233 60,498 161,803 312,202 590,2112013March 609,104 13,098 11,531 10,840 16,016 51,485 342 1,185 1,251 21,697 28,408 57,412 150,082 297,242 557,618June 669,749 13,730 11,923 11,245 16,268 53,167 342 1,185 1,251 21,178 30,202 56,727 176,876 328,822 616,582September 716,690 14,587 12,552 11,809 16,663 55,611 342 1,185 1,251 22,726 31,265 63,370 146,632 394,308 661,079December 732,713 15,574 13,317 12,075 17,214 58,179 342 1,184 1,251 24,918 34,223 66,205 145,835 400,576 674,5332014January 663,379 15,123 13,159 12,041 17,300 57,623 342 1,184 1,251 24,093 31,636 62,684 121,852 362,715 605,756February 704,149 14,530 12,901 12,092 17,271 56,794 342 1,184 1,250 22,321 31,976 62,609 137,805 389,868 647,356March 712,361 14,719 13,068 12,012 17,432 57,231 342 1,184 1,250 22,069 32,006 64,965 135,165 398,147 655,129April 697,127 15,054 13,235 12,216 17,651 58,157 342 1,184 1,250 22,212 31,334 61,590 121,507 399,549 638,969May 734,320 14,693 13,180 12,050 17,679 57,603 342 1,184 1,250 22,590 32,561 66,110 123,711 428,969 676,718June 717,496 15,058 13,297 12,132 17,882 58,370 342 1,184 1,250 23,260 34,490 68,227 120,504 409,870 659,126July 754,178 15,392 13,843 12,279 18,075 59,589 342 1,184 1,250 24,107 35,868 69,598 130,716 431,522 694,588August 792,530 15,591 13,672 12,368 18,114 59,745 342 1,184 1,250 24,753 37,600 71,613 126,603 469,440 732,785September 778,054 15,753 13,768 12,418 18,326 60,265 342 1,184 1,250 23,854 35,059 68,842 121,559 465,699 717,789October 799,505 16,008 14,047 12,382 18,309 60,747 342 1,184 1,250 23,956 35,712 70,982 122,560 482,772 738,758November 877,288 15,860 14,075 12,311 18,310 60,556 342 1,184 1,250 23,482 36,416 68,607 162,002 523,448 816,732December 871,661 16,725 14,629 12,775 18,712 62,841 342 1,184 1,250 23,715 45,573 87,090 138,525 511,142 808,8202015January 748,124 16,085 14,195 12,692 18,671 61,643 342 1,184 1,250 21,429 39,272 72,415 111,529 439,060 686,481February 780,596 15,827 14,063 12,614 18,724 61,228 342 1,184 1,250 21,223 39,665 68,438 123,982 463,285 719,368March 810,916 16,018 14,107 12,691 18,849 61,665 342 1,184 1,250 21,351 40,725 72,842 117,983 493,574 749,251April 801,324 15,954 13,985 12,640 18,907 61,485 342 1,184 1,250 20,984 41,162 72,624 104,612 497,681 739,839May 792,222 16,256 14,044 12,775 19,029 62,104 342 1,184 1,250 22,062 39,186 72,644 98,774 494,678 730,118June 809,788 16,373 14,379 12,861 19,123 62,736 342 1,184 1,250 22,306 41,400 73,434 102,207 504,930 747,051July 820,100 16,707 14,225 12,765 19,244 62,941 342 1,184 1,249 23,387 41,006 74,928 98,474 516,589 757,159August 893,332 16,618 14,339 12,842 19,311 63,110 342 1,184 1,249 22,984 45,457 75,773 145,310 537,924 830,223September 865,279 17,033 14,476 13,057 19,311 63,877 342 1,184 1,249 24,775 42,465 77,072 109,887 544,428 801,402October 876,424 17,076 14,539 13,066 19,475 64,155 342 1,184 1,249 22,660 44,058 76,483 103,196 563,096 812,268November 969,734 17,172 14,635 13,039 19,505 64,352 342 1,184 1,249 22,916 45,181 78,136 132,701 623,673 905,382December 962,879 18,696 15,319 13,872 19,575 67,463 342 1,184 1,249 25,676 49,898 91,966 114,527 610,574 895,4172016January 824,878 18,196 14,761 13,203 19,244 65,405 342 1,184 1,249 24,076 42,998 79,966 100,484 509,174 759,473February 863,053 17,335 15,053 13,700 19,708 65,796 342 1,184 1,249 23,518 40,157 72,963 102,964 554,880 797,257March 844,815 17,447 14,996 13,654 19,797 65,894 342 1,184 1,249 22,739 41,670 75,854 97,113 538,771 778,921April 849,881 17,564 14,892 13,650 19,806 65,913 342 1,184 1,249 23,052 41,844 72,633 84,915 558,750 783,968May 874,534 17,475 14,848 13,793 19,878 65,994 342 1,184 1,249 24,304 41,185 73,241 83,054 583,982 808,540June 832,409 17,755 14,795 13,775 19,938 66,263 342 1,184 1,249 23,868 42,199 70,991 78,053 548,259 766,146July 971,662 17,654 15,092 13,818 19,943 66,508 342 1,184 1,249 23,976 44,203 77,857 113,870 642,474 905,154August 985,869 16,966 15,390 13,621 19,890 65,867 342 1,184 1,249 24,390 45,750 81,817 105,752 659,518 920,001September 962,693 17,970 14,879 14,480 19,813 67,142 342 1,184 1,249 26,115 50,107 78,710 92,740 645,106 895,551October 986,349 18,109 15,252 14,457 19,760 67,577 342 1,184 1,249 24,180 46,434 81,823 92,772 670,788 918,772November 1,000,818 18,117 15,845 14,456 19,940 68,358 342 1,184 1,249 24,239 44,719 82,654 92,172 685,902 932,460December 1,012,802 20,344 18,222 13,893 19,020 71,479 342 1,184 1,249 25,056 50,292 91,052 102,382 669,768 941,3232017January 875,125 18,427 16,608 14,644 20,268 69,946 342 1,184 1,249 23,600 44,437 72,613 85,561 576,193 805,178February 902,230 18,012 16,414 14,530 20,205 69,161 342 1,184 1,249 23,355 42,227 73,145 83,458 608,111 833,069March 889,449 17,950 16,382 14,523 20,277 69,132 342 1,184 1,249 23,650 46,217 76,947 80,922 589,807 820,316April 970,856 18,287 16,582 14,725 20,453 70,047 342 1,184 1,249 25,578 52,094 87,965 86,528 645,870 900,809May 961,214 18,657 16,820 14,779 20,527 70,783 342 1,184 1,249 26,570 53,336 92,315 88,343 627,094 890,431June 942,803 19,026 17,068 14,889 20,740 71,722 342 1,184 1,249 25,999 44,531 88,840 85,555 623,382 871,081July 1,030,889 19,388 17,497 14,948 20,802 72,635 342 1,184 1,249 24,492 46,998 86,703 85,288 712,000 958,255August 1,014,003 19,664 17,716 15,113 21,090 73,583 342 1,184 1,249 24,453 48,939 77,278 79,365 707,612 940,420September 1,021,974 19,874 17,904 15,222 21,159 74,159 342 1,184 1,249 24,994 48,213 78,009 73,231 720,594 947,815October 1,028,356 19,901 17,832 15,184 21,360 74,276 342 1,184 1,249 26,017 46,851 80,899 77,835 719,703 954,080November 1,076,573 19,716 17,616 15,226 21,491 74,048 342 1,184 1,249 25,530 48,591 78,379 71,012 776,239 1,002,525December 1,057,495 20,758 18,725 15,691 21,985 77,158 342 1,184 1,249 26,591 51,514 80,866 86,594 731,997 980,3362018January 873,802 20,354 18,331 15,787 21,988 76,460 342 1,184 1,249 25,146 47,764 70,105 59,990 591,564 797,342February 894,229 19,917 17,964 15,542 21,967 75,390 342 1,184 1,249 24,727 46,180 71,505 61,726 611,928 818,839March 931,600 20,399 18,190 15,761 22,095 76,445 342 1,184 1,249 28,657 48,061 72,872 62,210 640,581 855,155April 873,802 20,354 18,331 15,787 21,988 76,460 342 1,184 1,249 25,146 47,764 70,105 59,990 591,564 797,342May 906,708 20,631 18,547 15,907 22,290 77,377 342 1,184 1,249 24,992 47,405 75,242 62,778 616,141 829,331June 1,014,827 21,027 18,618 15,840 22,293 77,778 342 1,184 1,249 26,729 50,533 82,980 79,802 694,231 937,049--------------------- -------------- ------------------ -------------------- --------------------- --------------------- -------------------------- -------------- ------------- ----------------- ------------- ------------- ------------- ---------------- -------------- ---------------
+ The E5 coin was first issued to the public on 17th April 1996.@ The E100 note was first issued to the public on 5th September 1996. # The E200 note was first issued to the public on 4th September 1998.
* The E50 note was first issued to the public on 15th June,1990.

41Central Bank of Eswatini Quarterly Review - June 2018
Table S 2.1 DEPOSITORY CORPORATIONS SURVEY
(E’000) DEPOSITORY CORPORATIONS SURVEY
(E'000)---------------------------- ------------------------ ------------------------ ------------------------ ------------------------ ------------------------ ------------------------ ------------------------ ------------------------ ------------------------ ------------------------ ------------------------ ------------------------
Domestic Claims (Net) Money Supply (M1) Quasi Money/Other Deposits Other Accounts------------------------ ------------------------ ------------------------ ------------------------ ------------------------ ------------------------ ------------------------ ------------------------ ------------------------ ------------------------ ------------------------
Net Net Claims Claims on TransferablePeriod Foreign on Other (E) in (Demand) Savings Time Interbank CapitalEnded Assets Government Sectors Total Circulation Deposits Total Deposits Deposits Total Uncleared & Other---------------------------- ------------------------ ------------------------ ------------------------ ------------------------ ------------------------ ------------------------ ------------------------ ------------------------ ------------------------ ------------------------ ------------------------ ------------------------2005 1,893,790 (791,421) 4,134,235 3,342,814 236,452 1,046,029 1,282,481 962,221 1,712,968 2,675,189 84,223 1,194,7122006 3,294,699 (1,677,428) 4,341,996 2,664,567 250,514 1,106,013 1,356,527 1,012,992 1,970,779 2,983,771 148,543 1,470,4252007 5,757,144 (3,884,353) 5,271,735 1,387,382 248,639 1,417,329 1,665,968 1,033,187 2,572,807 3,605,994 (74,720) 1,947,2842008 8,156,088 (5,094,232) 5,747,929 653,698 279,820 1,690,707 1,970,527 1,165,768 3,148,668 4,314,436 (132,173) 2,656,9962009 7,762,796 (3,984,324) 6,509,762 2,525,438 327,634 2,007,753 2,335,387 1,212,770 4,418,587 5,631,357 (99,265) 2,420,7542010 5,629,886 (2,031,173) 6,891,021 4,859,849 349,347 2,180,953 2,530,300 1,277,592 4,715,138 5,992,730 (469,676) 2,436,3822011 4,102,961 (618,886) 8,277,770 7,658,884 357,012 2,510,681 2,867,693 1,294,907 4,615,808 5,910,715 100,821 2,882,6152012 6,317,157 (1,589,801) 8,060,090 6,470,288 409,343 3,012,281 3,421,624 1,364,853 4,871,361 6,236,214 4,372 3,125,2352013 7,920,289 (3,008,441) 9,757,136 6,748,695 499,167 3,900,034 4,399,201 1,543,024 5,254,708 6,797,732 (261,156) 3,733,2082014 7,731,615 (2,965,024) 10,868,934 7,903,910 529,671 3,715,706 4,245,377 1,624,575 5,768,697 7,393,272 (254,613) 4,251,4892015 9,109,542 (2,737,663) 11,421,094 8,683,431 554,715 4,189,828 4,744,543 1,626,986 6,847,551 8,474,537 (488,899) 5,062,7912016 8,831,275 (833,650) 13,037,309 12,203,659 609,116 5,404,949 6,014,065 1,808,210 8,885,805 10,694,015 (816,264) 5,143,1192017 7,909,497 (62,553) 14,200,734 14,138,182 607,901 5,066,108 5,674,010 1,680,668 9,988,361 11,669,029 (2,061,439) 6,766,0792010March 8,239,691 (3,761,507) 6,141,978 2,380,472 341,541 1,843,725 2,185,266 1,169,106 4,757,520 5,926,626 137,730 2,370,541June 6,810,025 (2,517,649) 6,677,016 4,159,367 357,981 2,025,256 2,383,237 1,220,765 4,981,382 6,202,147 (104,221) 2,488,229September 6,506,625 (2,358,014) 6,850,032 4,492,018 407,339 1,928,744 2,336,083 1,242,304 5,082,753 6,325,057 (105,526) 2,443,030December 5,629,886 (2,031,173) 6,891,021 4,859,849 349,347 2,180,953 2,530,300 1,277,592 4,715,138 5,992,730 (469,676) 2,436,3822011March 5,247,811 (1,507,085) 6,924,879 5,417,795 356,799 1,892,421 2,249,220 1,231,959 4,910,240 6,142,199 (133,326) 2,407,511June 4,445,539 (782,729) 7,438,002 6,655,274 354,717 2,064,170 2,418,887 1,259,579 4,951,895 6,211,474 (51,321) 2,521,773September 4,166,357 (654,927) 8,222,510 7,567,583 389,858 2,518,458 2,908,315 1,271,291 4,640,735 5,912,026 97,460 2,816,139December 4,102,961 (618,886) 8,277,770 7,658,884 357,012 2,510,681 2,867,693 1,294,907 4,615,808 5,910,715 100,821 2,882,6152012March 3,687,750 (473,132) 8,233,252 7,760,120 380,995 2,379,734 2,760,729 1,265,370 4,648,472 5,913,842 (99,409) 2,872,708June 4,943,615 (900,825) 7,794,539 6,893,715 386,416 2,511,091 2,897,507 1,333,224 4,631,486 5,964,710 (38,462) 3,013,574September 5,022,174 (1,155,864) 8,340,831 7,184,967 410,907 2,944,989 3,355,896 1,339,851 4,608,898 5,948,749 (100,288) 3,002,783December 6,317,157 (1,589,801) 8,060,090 6,470,288 409,343 3,012,281 3,421,624 1,364,853 4,871,361 6,236,214 4,372 3,125,2352013March 7,122,808 (1,897,759) 8,145,654 6,247,895 442,123 3,117,731 3,559,854 1,352,615 5,233,383 6,585,998 (130,277) 3,355,128June 6,844,641 (2,111,774) 8,544,049 6,432,275 495,290 2,908,160 3,403,450 1,435,107 5,041,588 6,476,695 (40,823) 3,437,594September 6,860,838 (2,205,451) 9,326,321 7,120,871 515,985 3,307,988 3,823,973 1,463,545 5,386,935 6,850,480 (244,860) 3,552,117December 7,920,289 (3,008,441) 9,757,136 6,748,695 499,167 3,900,034 4,399,201 1,543,024 5,254,708 6,797,732 (261,156) 3,733,2082014January 9,108,396 (4,326,307) 9,623,551 5,297,244 467,623 3,178,178 3,645,801 1,503,587 5,468,446 6,972,033 (185,194) 3,973,000February 8,736,254 (3,848,546) 9,568,057 5,719,511 508,878 3,117,740 3,626,618 1,485,048 5,591,496 7,076,544 (153,819) 3,906,422March 8,092,746 (3,342,979) 9,774,055 6,431,077 482,046 3,357,616 3,839,662 1,496,565 5,486,864 6,983,429 (202,559) 3,903,292April 9,000,381 (4,062,943) 9,738,974 5,676,031 478,221 3,533,493 4,011,714 1,557,516 5,330,705 6,888,221 (166,073) 3,942,550May 7,998,077 (3,187,525) 10,121,374 6,933,849 490,521 3,259,367 3,749,888 1,539,183 5,810,983 7,350,166 42,817 3,789,055June 7,837,281 (2,926,111) 10,079,667 7,153,556 472,428 3,453,478 3,925,906 1,530,421 5,893,702 7,424,123 (216,458) 3,857,266July 8,116,612 (4,235,460) 10,465,403 6,229,944 503,396 3,296,778 3,800,174 1,557,240 5,479,345 7,036,585 (436,810) 3,946,607August 7,371,096 (3,557,075) 10,611,625 7,054,551 567,687 3,438,105 4,005,792 1,577,036 5,422,674 6,999,710 (662,223) 4,082,367September 7,305,313 (3,059,762) 10,597,423 7,537,662 549,008 3,556,710 4,105,718 1,569,674 5,423,959 6,993,633 (410,136) 4,153,760October 8,534,045 (4,031,562) 10,503,538 6,471,976 559,346 3,278,860 3,838,206 1,596,487 5,838,574 7,435,061 (316,764) 4,049,518November 8,175,847 (3,345,050) 10,734,488 7,389,437 632,677 3,607,890 4,240,567 1,572,695 5,893,595 7,466,290 (244,426) 4,102,853December 7,731,615 (2,965,024) 10,868,934 7,903,910 529,671 3,715,706 4,245,377 1,624,575 5,768,697 7,393,272 (254,613) 4,251,4892015January 8,938,255 (4,147,167) 10,766,680 6,619,513 525,690 3,568,489 4,094,179 1,549,388 5,867,797 7,417,185 (229,045) 4,275,449February 8,441,715 (3,823,221) 10,891,994 7,068,773 575,328 3,557,557 4,132,885 1,566,973 5,668,062 7,235,035 (190,055) 4,332,624March 8,179,355 (3,534,743) 10,652,477 7,117,734 504,967 3,608,807 4,113,774 1,568,398 5,330,733 6,899,131 (204,232) 4,488,416April 9,363,883 (4,077,687) 10,642,806 6,565,119 526,710 3,855,113 4,381,823 1,622,995 5,710,050 7,333,045 (292,660) 4,506,794May 8,429,258 (3,541,424) 10,903,196 7,361,772 542,757 3,693,988 4,236,745 1,617,617 5,599,667 7,217,284 (135,872) 4,472,873June 7,660,895 (3,130,914) 11,328,191 8,197,277 527,678 3,765,536 4,293,214 1,609,538 5,764,812 7,374,350 (164,523) 4,355,131July 8,726,084 (4,146,538) 11,340,057 7,193,519 570,529 3,618,587 4,189,116 1,672,644 5,893,712 7,566,356 (318,063) 4,482,194August 9,064,818 (3,710,690) 11,272,536 7,561,847 633,856 4,041,486 4,675,342 1,619,132 6,115,466 7,734,598 (428,540) 4,645,264September 9,634,528 (3,117,249) 11,197,506 8,080,257 586,066 4,000,063 4,586,129 1,644,045 6,854,419 8,498,464 (203,404) 4,833,596October 9,547,021 (3,915,106) 11,490,069 7,574,963 642,663 3,847,452 4,490,115 1,638,377 6,573,440 8,211,817 (401,775) 4,821,827November 9,182,904 (3,363,879) 11,443,647 8,079,768 670,715 3,861,805 4,532,521 1,638,807 6,550,000 8,188,807 (296,508) 4,837,852December 9,109,542 (2,737,663) 11,421,094 8,683,431 554,715 4,189,828 4,744,543 1,626,986 6,847,551 8,474,537 (488,899) 5,062,7912016January 10,423,293 (3,894,692) 11,585,021 7,690,329 561,197 4,063,259 4,624,456 1,561,597 7,155,026 8,716,623 (398,029) 5,170,571February 9,547,584 (3,352,836) 11,632,295 8,279,460 564,513 3,840,639 4,405,152 1,572,091 7,002,053 8,574,144 (543,433) 5,391,180March 8,719,323 (2,802,891) 11,641,860 8,838,969 530,454 3,557,774 4,088,228 1,580,395 7,072,986 8,653,381 100,278 4,716,405April 9,357,508 (2,746,710) 11,708,648 8,961,939 562,389 3,943,957 4,506,346 1,614,973 7,280,794 8,895,767 (326,665) 5,243,999May 8,380,423 (1,993,162) 11,995,630 10,002,467 528,733 4,046,579 4,575,312 1,670,664 7,409,987 9,080,650 (333,011) 5,059,939June 7,786,765 (1,811,453) 11,889,435 10,077,982 505,936 3,670,406 4,176,342 1,703,833 7,709,187 9,413,020 (636,725) 4,912,109July 8,290,741 (2,110,404) 12,410,621 10,300,217 657,550 3,830,023 4,487,572 1,749,099 8,025,908 9,775,007 (575,310) 4,903,688August 8,499,554 (1,238,296) 12,337,239 11,098,944 580,149 4,298,156 4,878,305 1,791,916 8,398,880 10,190,796 (544,902) 5,074,298September 7,051,208 (455,833) 12,416,607 11,960,774 620,687 4,177,192 4,797,878 1,798,748 7,913,626 9,712,374 (492,162) 4,993,891October 7,689,404 (1,592,049) 12,779,469 11,187,419 693,107 4,267,160 4,960,267 1,799,792 8,028,192 9,827,984 (934,335) 5,022,907November 8,254,726 (913,819) 13,221,476 12,307,656 666,580 4,440,943 5,107,523 1,792,961 9,128,949 10,921,910 (624,048) 5,156,997December 8,831,275 (833,650) 13,037,309 12,203,659 609,116 5,404,949 6,014,065 1,808,210 8,885,805 10,694,015 (816,264) 5,143,1192017January 8,445,520 (1,621,974) 12,441,124 10,819,150 573,559 4,454,891 5,028,450 1,739,081 8,368,237 10,107,318 (1,029,959) 5,158,862February 8,082,286 (1,192,323) 12,585,339 11,393,016 586,108 4,449,483 5,035,591 1,722,152 8,339,467 10,061,618 (670,753) 5,048,846March 7,073,602 (798,749) 12,455,914 11,657,165 594,520 4,125,647 4,720,167 1,758,805 7,891,256 9,650,061 (837,883) 5,187,025April 8,219,033 (1,361,317) 12,622,485 11,261,168 593,859 4,487,141 5,081,000 1,726,536 7,855,871 9,582,407 (208,897) 5,025,691May 7,966,300 (484,890) 12,777,421 12,292,531 557,786 4,564,818 5,122,603 1,770,130 8,521,353 10,291,483 (290,546) 5,135,291June 8,446,334 (757,184) 13,096,480 12,339,296 633,077 5,004,361 5,637,439 1,731,976 9,093,194 10,825,169 (747,458) 5,070,480July 9,217,137 (1,330,657) 13,174,960 11,844,304 668,377 4,665,514 5,333,891 1,595,782 9,577,606 11,173,388 (605,801) 5,159,963August 8,977,785 (602,870) 13,004,414 12,401,543 629,718 4,568,938 5,198,655 1,572,493 10,006,512 11,579,005 (595,273) 5,196,942September 8,299,308 2,749 13,758,777 13,761,527 698,082 4,901,685 5,599,767 1,601,944 9,929,674 11,531,617 (440,796) 5,370,246October 9,681,711 (1,248,956) 13,532,454 12,283,498 669,737 4,778,394 5,448,131 1,616,488 10,046,534 11,663,021 (2,118,074) 6,972,131November 9,577,028 (541,141) 13,861,260 13,320,119 769,983 4,904,106 5,674,089 1,719,058 10,514,761 12,233,820 (1,987,839) 6,977,078December 7,909,497 (62,553) 14,200,734 14,138,182 607,901 5,066,108 5,674,010 1,680,668 9,988,361 11,669,029 (2,061,439) 6,766,0792018January 9,134,666 (897,907) 14,022,985 13,125,079 550,735 5,261,136 5,811,871 1,641,373 10,041,875 11,683,248 (1,991,444) 6,756,071February 8,432,635 (448,250) 13,967,089 13,518,839 565,173 5,161,904 5,727,077 1,636,833 10,051,888 11,688,721 (1,879,074) 6,414,749March 7,655,912 1,135,704 13,845,330 14,981,034 533,284 5,125,962 5,659,246 1,622,253 9,194,837 10,817,090 (336,201) 6,496,810April 8,640,115 (838,289) 14,109,654 13,271,365 633,962 5,648,851 6,282,813 1,611,161 9,521,386 11,132,547 (1,977,073) 6,443,333May 7,410,777 103,942 14,176,777 14,280,719 583,770 5,024,269 5,608,038 1,621,982 9,601,172 11,223,154 (1,716,265) 6,548,018June 6,879,064 1,530,696 14,491,535 16,022,230 685,399 5,270,324 5,955,723 1,635,572 9,428,649 11,064,221 (581,238) 6,462,589ChangeOver 12 Months (1,567,270) 2,287,879 1,395,055 3,682,935 52,322 265,962 318,284 (96,404) 335,455 239,051 166,221 1,392,108---------------------------- ------------------------ ------------------------ ------------------------ ------------------------ ------------------------ ------------------------ ------------------------ ------------------------ ------------------------ ------------------------ ------------------------ ------------------------
and the Building Society. Since September 2004, the Governemnt sector includes central government and governmental public enterprises. Government foreign asset holdings
and public non-financial Enterprises,households and non-profit institutions serving households plus other domestic financial investments.The sharp jump since August 2004 was a result of re-classification to include provision for baddebts, accrued interest and suspended interest which were previously netted out.
OTHER ACCOUNTS:Shares and Other equity and Other items(net) - Includes capital, reserve provisions and other liabilities less fixed and other non-monetary assets.
NET FOREIGN ASSETS - Includes Net Official Reserves(CBS and Government) as well as Banks and Building Society's Net Foreign Holdings.
DOMESTIC CREDIT (NET) to PRIVATE SECTOR - Includes credit from CBE, Banks and Building Society to resident businesses, local government, Public financial
DOMESTIC CREDIT (NET) to GOVERNMENT - Includes total treasury bills, stocks and other claims on Government less Government deposits with CBE, Banks
Table S 2.1
DEPOSITORY CORPORATIONS SURVEY - Includes figures of Central Bank, the four banks and the Building Society operating in Eswatini.
are treated as Central Bank holdings with matching deposits which then reduces net credit to Government. This item also includes the Capital Investment Fund (CIF) which was managed by CBS separately from 1991-Nov.2005. From Dec.2005 CIF is within the Balance sheet of CBE.
DEMAND, SAVINGS and TIME DEPOSITS - Includes private sector only, Government and interbank deposits excluded.

42 Central Bank of Eswatini Quarterly Review - June 2018
Tab
le S
2.1
.1Ce
ntra
l Ban
k of
Esw
atin
i Sur
vey
Ta
ble
S 2.
1.1
Cent
ral B
ank
of E
swat
ini S
urve
y
Tho
usan
ds o
f Em
alan
geni
Jun-
17Ju
l-17
Aug
-17
Sep-
17O
ct-1
7N
ov-1
7D
ec-1
7Ja
n-18
Feb-
18M
ar-1
8A
pr-1
8M
ay-1
8Ju
n-18
Net
For
eign
Ass
ets
5,87
4,37
36,
908,
766
6,32
2,70
76,
179,
534
7,46
1,17
06,
904,
492
5,85
6,39
66,
599,
058
6,03
8,12
55,
598,
408
6,00
0,99
25,
580,
856
5,10
7,06
2Cl
aim
s on
non
resi
dent
s8,
198,
756
9,52
5,33
28,
658,
708
8,55
3,29
09,
903,
420
9,26
8,59
48,
199,
060
8,84
9,44
88,
282,
373
7,87
5,24
58,
273,
509
7,89
5,44
97,
491,
605
Mon
etar
y G
old
and
SDRs
889,
818
904,
967
895,
669
927,
787
966,
858
941,
094
858,
174
843,
072
828,
064
842,
536
828,
064
872,
440
948,
383
Fore
ign
Exch
ange
Res
erve
s3,
984,
026
5,24
4,53
94,
398,
241
4,13
8,10
65,
319,
445
4,76
1,84
44,
023,
002
4,76
2,72
24,
208,
723
3,63
1,51
64,
284,
413
3,85
1,20
73,
253,
081
Fore
ign
held
sec
urit
ies
1,77
0,22
61,
776,
543
1,76
0,42
71,
811,
095
1,87
8,09
31,
827,
737
1,69
3,50
51,
643,
602
1,62
9,31
41,
761,
613
1,64
6,18
01,
654,
365
1,62
7,13
1O
ther
non
resi
dent
1,55
4,68
61,
599,
283
1,60
4,37
11,
676,
303
1,73
9,02
41,
737,
920
1,62
4,37
91,
600,
052
1,61
6,27
31,
639,
580
1,51
4,85
21,
517,
438
1,66
3,00
9Le
ss:
Liab
iliti
es t
o no
nres
iden
ts2,
324,
383
2,61
6,56
62,
336,
001
2,37
3,75
62,
442,
250
2,36
4,10
22,
342,
664
2,25
0,39
02,
244,
249
2,27
6,83
72,
272,
517
2,31
4,59
32,
384,
543
Dep
osit
s1,
442,
656
1,71
3,36
81,
448,
562
1,45
4,49
81,
484,
413
1,43
1,79
31,
492,
617
1,41
5,34
51,
424,
075
1,44
2,29
01,
441,
977
1,44
5,34
71,
442,
810
Loan
s0
6,46
50
00
00
00
00
5,47
82,
342
Secu
riti
es o
ther
tha
n sh
ares
00
00
00
00
00
00
0Fi
nanc
ial D
eriv
ativ
es0
00
00
00
00
00
00
SD
R al
loca
tion
s88
1,72
689
6,73
388
7,43
891
9,25
895
7,83
793
2,30
985
0,04
783
5,04
582
0,17
483
4,54
783
0,54
086
3,76
993
9,39
0D
omes
tic
Clai
ms
(2,4
72,6
45)
(2
,979
,003
)
(2
,635
,729
)
(2
,235
,383
)(3
,590
,915
)(2
,655
,701
)(2
,136
,556
)(2
,966
,580
)(2
,696
,439
)(1
,209
,842
)(2
,929
,221
)(2
,222
,400
)(6
89,2
94)
Clai
ms
on o
ther
dep
osit
ory
corp
orat
ions
45,6
67
1,98
1
2,
015
2,06
52,
055
2,06
166
72,
056
2,06
639
,038
2,03
82,
079
2,08
8N
et c
laim
s on
cen
tral
gov
ernm
ent
(2,5
45,9
08)
(3
,009
,782
)
(2
,666
,825
)
(2
,266
,538
)(3
,622
,065
)(2
,687
,803
)(2
,167
,375
)(3
,000
,226
)(2
,728
,767
)(1
,279
,578
)(2
,962
,061
)(2
,255
,304
)(7
22,2
14)
Clai
ms
on C
entr
al G
over
nmen
t1,
124,
211
1,
130,
028
1,11
6,94
5
1,
298,
403
1,30
6,47
11,
314,
683
1,32
3,15
71,
329,
766
1,33
7,13
71,
298,
566
1,29
5,40
21,
350,
854
1,32
2,32
9Se
curi
ties
oth
er t
han
shar
es3,
891
2,93
5
2,85
2
3,03
13,
140
3,64
94,
165
3,58
63,
767
3,29
11,
295,
402
1,35
0,85
41,
322,
329
Oth
er c
laim
s1,
120,
320
1,
127,
093
1,11
4,09
3
1,
295,
372
1,30
3,33
11,
311,
033
1,31
8,99
21,
326,
181
1,33
3,36
91,
295,
275
00
0Le
ss:
Liab
iliti
es t
o ce
ntra
l gov
ernm
ent
3,67
0,11
9
4,13
9,81
0
3,
783,
770
3,56
4,94
14,
928,
536
4,00
2,48
63,
490,
532
4,32
9,99
24,
065,
904
2,57
8,14
54,
257,
463
3,60
6,15
82,
044,
543
Dep
osit
s3,
646,
885
4,
128,
505
3,77
2,44
5
3,
553,
573
4,91
7,71
13,
991,
944
3,47
9,90
74,
301,
339
4,05
4,88
62,
578,
145
4,25
7,46
33,
606,
158
2,04
4,54
3G
ovt
Lend
ing
Fund
s(Lo
an G
uara
ntee
s)23
,234
11
,305
11,3
25
11
,369
10,8
2510
,542
10,6
2528
,653
11,0
180
00
0Cl
aim
s on
oth
er s
ecto
rs27
,595
28
,798
29,0
81
29
,090
29,0
9530
,042
30,1
5131
,590
30,2
6330
,698
30,8
0130
,825
30,8
32O
ther
fin
anci
al c
orpo
rati
ons
4,28
1
4,
659
4,
857
5,
065
5,27
45,
482
5,69
05,
898
6,10
06,
100
6,10
06,
100
6,10
0St
ate
and
loca
l gov
ernm
ent
00
00
00
00
00
00
0Pu
blic
non
fina
ncia
l cor
pora
tion
s0
00
00
00
00
00
00
Oth
er n
onfi
nanc
ial c
orpo
rati
ons
00
00
00
00
00
00
0O
ther
res
iden
t se
ctor
s23
,314
24
,139
24,2
24
24
,024
23,8
2224
,560
24,4
6225
,692
24,1
6324
,598
24,7
0124
,725
24,7
32M
onet
ary
Base
2,47
8,39
1
2,96
5,43
9
2,
747,
476
2,88
0,57
72,
693,
656
3,11
8,47
52,
854,
442
2,84
3,02
22,
761,
009
2,49
2,34
32,
771,
584
2,64
6,92
32,
658,
612
Curr
ency
in c
ircu
lati
on94
2,80
3
1,
030,
889
1,01
4,00
3
1,
021,
974
1,02
8,35
61,
076,
573
1,05
7,49
587
3,80
289
4,22
993
1,60
098
3,76
490
6,70
81,
014,
827
Liab
iliti
es t
o ot
her
depo
sito
ry c
orpo
rati
ons
1,24
9,56
0
1,64
8,43
1
1,
445,
352
1,57
1,92
71,
378,
932
1,76
0,75
61,
509,
949
1,68
2,43
21,
578,
057
1,43
6,75
61,
663,
125
1,61
4,80
81,
619,
634
Rese
rve
Dep
osit
s11,
249,
560
1,
648,
431
1,44
5,35
2
1,
571,
927
1,37
8,93
21,
760,
756
1,50
9,94
91,
682,
432
1,57
8,05
71,
436,
756
1,66
3,12
51,
614,
808
1,61
9,63
4O
ther
liab
iliti
es2
00
00
00
00
00
00
0O
ther
dep
osit
s in
clud
ed in
bro
ad m
oney
286,
027
286,
119
28
8,12
2
286,
676
286,
369
281,
145
286,
998
286,
788
288,
723
123,
988
124,
695
125,
406
24,1
52O
ther
fin
anci
al c
orpo
rati
ons
273,
462
273,
327
27
5,36
9
273,
557
273,
381
275,
330
273,
597
273,
311
275,
142
102,
610
103,
304
104,
009
782
Stat
e an
d lo
cal g
over
nmen
t0
00
00
00
00
00
00
Publ
ic n
onfi
nanc
ial c
orpo
rati
ons
00
00
00
00
00
00
0O
ther
non
fina
ncia
l cor
pora
tion
s0
00
00
00
00
00
00
Oth
er r
esid
ent
sect
ors
12,5
65
12,7
92
12
,752
13,1
1912
,987
5,81
513
,400
13,4
7713
,581
21,3
7721
,390
21,3
9723
,369
Secu
riti
es e
xcl.
fro
m b
ase
mon
ey,
incl
. in
bro
ad m
oney
Oth
er li
abili
ties
exc
l. f
rom
bro
ad m
oney
Shar
es a
nd o
ther
equ
ity
1,32
9,47
9
1,36
9,46
9
1,
353,
013
1,46
3,87
23,
010,
422
2,96
7,66
12,
702,
915
2,62
2,34
42,
392,
109
2,29
8,22
02,
217,
622
2,32
2,83
62,
222,
969
Fund
s co
ntri
bute
d by
ow
ners
237,
563
237,
563
23
7,56
3
237,
563
237,
563
237,
563
237,
563
237,
563
237,
563
185,
768
185,
768
185,
768
185,
768
Curr
ent
year
res
ults
48,6
55
66,4
36
86
,607
101,
972
95,4
5613
3,99
314
3,61
214
1,55
817
2,57
70
14,1
8648
,511
(44,
134)
Gen
eral
res
erve
759,
476
759,
476
75
9,47
6
759,
476
759,
476
759,
476
759,
476
759,
476
759,
476
811,
271
811,
271
811,
271
811,
271
Valu
atio
n ad
just
men
t28
3,78
5
30
5,99
4
269,
366
36
4,86
11,
917,
927
1,83
6,62
91,
562,
264
1,48
3,74
71,
222,
493
1,30
1,18
11,
206,
397
1,27
7,28
61,
270,
064
IMF
acco
unts
bal
anci
ng it
em0
00
00
00
00
00
00
Oth
er it
ems
(net
)(4
06,1
43)
(405
,145
)
(413
,511
)
(400
,299
)(1
,833
,823
)(1
,837
,344
)(1
,837
,518
)(1
,832
,888
)(1
,811
,431
)(4
01,9
97)
(1,9
17,4
35)
(1,6
11,3
04)
(463
,813
)O
ther
liab
iliti
es
62,6
12
38,0
67
33
,698
36,0
0442
,612
29,0
9039
,192
41,0
5231
,196
132,
443
232,
443
132,
443
42,9
20Le
ss:
othe
r as
sets
(468
,754
)
(4
43,2
12)
(447
,209
)
(4
36,3
03)
(1,8
76,4
35)
(1,8
66,4
35)
(1,8
76,7
09)
(1,8
73,9
40)
(1,8
42,6
27)
(534
,440
)(2
,149
,879
)(1
,743
,746
)(5
06,7
34)
1. In
clud
es d
epos
its
of t
he E
swat
ini B
uild
ing
Soci
ety.
2. In
clud
es C
entr
al B
ank
of E
swat
ini b
ills.
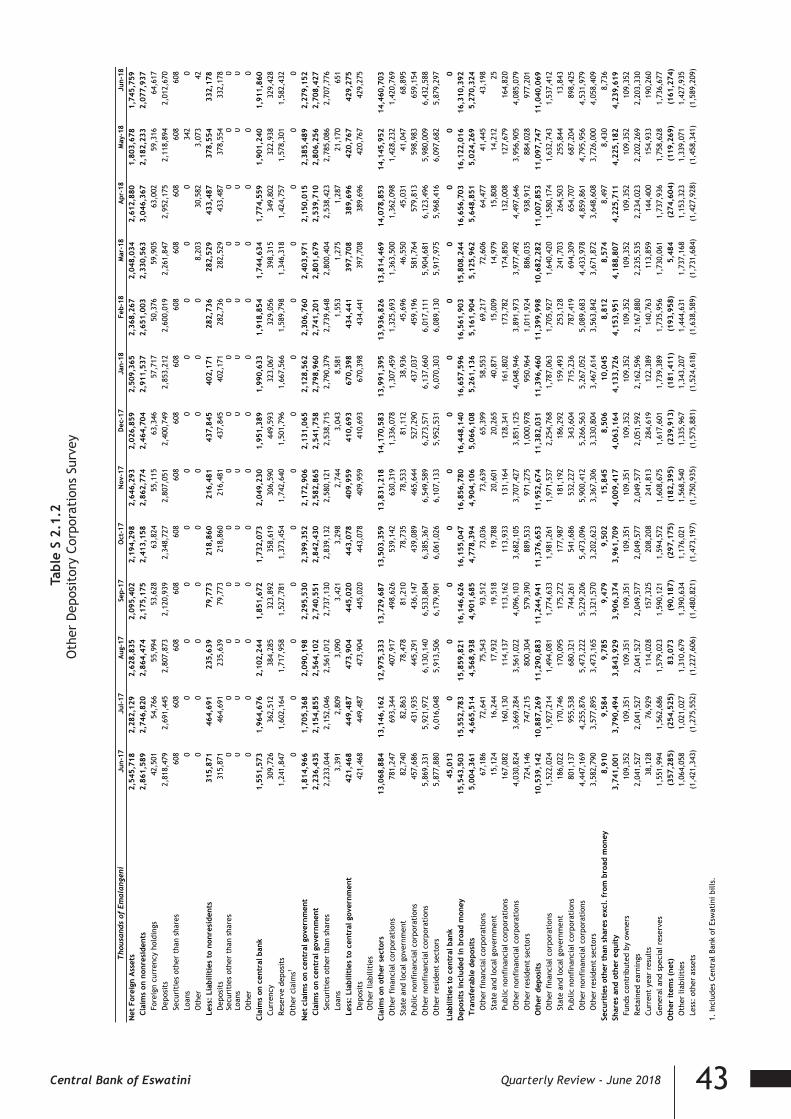
43Central Bank of Eswatini Quarterly Review - June 2018
Tab
le S
2.1
.2O
ther
Dep
osit
ory
Corp
orat
ions
Sur
vey
Ta
ble
S 2.
1.2
Oth
er D
epos
itor
y Co
rpor
atio
ns S
urve
y
Tho
usan
ds o
f Em
alan
geni
Jun-
17Ju
l-17
Aug-
17Se
p-17
Oct
-17
Nov
-17
Dec
-17
Jan-
18Fe
b-18
Mar
-18
Apr
-18
May
-18
Jun-
18
Net
For
eign
Ass
ets
2,54
5,71
82,
282,
129
2,62
8,83
52,
095,
402
2,19
4,29
82,
646,
293
2,02
6,85
92,
509,
365
2,36
8,26
72,
048,
034
2,61
2,88
01,
803,
678
1,74
5,75
9Cl
aim
s on
non
resi
dent
s2,
861,
589
2,74
6,82
02,
864,
474
2,17
5,17
52,
413,
158
2,86
2,77
42,
464,
704
2,91
1,53
72,
651,
003
2,33
0,56
33,
046,
367
2,18
2,23
32,
077,
937
Fore
ign
curr
ency
hol
ding
s42
,501
54,7
6655
,994
53,6
2863
,824
55,1
1563
,346
57,7
1750
,376
59,9
0563
,002
59,3
1664
,617
Dep
osit
s2,
818,
479
2,69
1,44
52,
807,
873
2,12
0,93
92,
348,
727
2,80
7,05
12,
400,
749
2,85
3,21
22,
600,
019
2,26
1,84
72,
952,
175
2,11
8,89
42,
012,
670
Secu
riti
es o
ther
tha
n sh
ares
608
608
608
608
608
608
608
608
608
608
608
608
608
Loan
s0
00
00
00
00
00
342
0O
ther
00
00
00
00
08,
203
30,5
823,
073
42Le
ss:
Liab
iliti
es t
o no
nres
iden
ts31
5,87
146
4,69
123
5,63
979
,773
218,
860
216,
481
437,
845
402,
171
282,
736
282,
529
433,
487
378,
554
332,
178
Dep
osit
s31
5,87
146
4,69
123
5,63
979
,773
218,
860
216,
481
437,
845
402,
171
282,
736
282,
529
433,
487
378,
554
332,
178
Secu
riti
es o
ther
tha
n sh
ares
00
00
00
00
00
00
0Lo
ans
00
00
00
00
00
00
0O
ther
00
00
00
00
00
00
0Cl
aim
s on
cen
tral
ban
k1,
551,
573
1,96
4,67
62,
102,
244
1,85
1,67
21,
732,
073
2,04
9,23
01,
951,
389
1,99
0,63
31,
918,
854
1,74
4,63
41,
774,
559
1,90
1,24
01,
911,
860
Curr
ency
309,
726
362,
512
384,
285
323,
892
358,
619
306,
590
449,
593
323,
067
329,
056
398,
315
349,
802
322,
938
329,
428
Rese
rve
depo
sits
1,24
1,84
71,
602,
164
1,71
7,95
81,
527,
781
1,37
3,45
41,
742,
640
1,50
1,79
61,
667,
566
1,58
9,79
81,
346,
318
1,42
4,75
71,
578,
301
1,58
2,43
2O
ther
cla
ims1
00
00
00
00
00
00
0N
et c
laim
s on
cen
tral
gov
ernm
ent
1,81
4,96
61,
705,
368
2,09
0,19
82,
295,
530
2,39
9,35
22,
172,
906
2,13
1,06
52,
128,
562
2,30
6,76
02,
403,
971
2,15
0,01
52,
385,
489
2,27
9,15
2Cl
aim
s on
cen
tral
gov
ernm
ent
2,23
6,43
52,
154,
855
2,56
4,10
22,
740,
551
2,84
2,43
02,
582,
865
2,54
1,75
82,
798,
960
2,74
1,20
12,
801,
679
2,53
9,71
02,
806,
256
2,70
8,42
7Se
curi
ties
oth
er t
han
shar
es2,
233,
044
2,15
2,04
62,
561,
012
2,73
7,13
02,
839,
132
2,58
0,12
12,
538,
715
2,79
0,37
92,
739,
648
2,80
0,40
42,
538,
423
2,78
5,08
62,
707,
776
Loan
s3,
391
2,80
93,
090
3,42
13,
298
2,74
43,
043
8,58
11,
553
1,27
51,
287
21,1
7065
1Le
ss:
Liab
iliti
es t
o ce
ntra
l gov
ernm
ent
421,
468
449,
487
473,
904
445,
020
443,
078
409,
959
410,
693
670,
398
434,
441
397,
708
389,
696
420,
767
429,
275
Dep
osit
s42
1,46
844
9,48
747
3,90
444
5,02
044
3,07
840
9,95
941
0,69
367
0,39
843
4,44
139
7,70
838
9,69
642
0,76
742
9,27
5O
ther
liab
iliti
esCl
aim
s on
oth
er s
ecto
rs13
,068
,884
13,1
46,1
6212
,975
,333
13,7
29,6
8713
,503
,359
13,8
31,2
1814
,170
,583
13,9
91,3
9513
,936
,826
13,8
14,4
6914
,078
,853
14,1
45,9
5214
,460
,703
Oth
er f
inan
cial
cor
pora
tion
s78
1,24
769
3,34
440
7,91
749
8,62
653
9,14
263
0,31
91,
336,
078
1,30
7,45
91,
325,
693
1,36
3,50
01,
362,
098
1,42
8,23
21,
420,
769
Stat
e an
d lo
cal g
over
nmen
t82
,740
82,8
6378
,478
81,2
1078
,735
78,5
3381
,112
38,9
3645
,696
46,5
5045
,031
41,0
4768
,895
Publ
ic n
onfi
nanc
ial c
orpo
rati
ons
457,
686
431,
935
445,
291
436,
147
439,
089
465,
644
527,
290
437,
037
459,
196
581,
764
579,
813
598,
983
659,
154
Oth
er n
onfi
nanc
ial c
orpo
rati
ons
5,86
9,33
15,
921,
972
6,13
0,14
06,
533,
804
6,38
5,36
76,
549,
589
6,27
3,57
16,
137,
660
6,01
7,11
15,
904,
681
6,12
3,49
65,
980,
009
6,43
2,58
8O
ther
res
iden
t se
ctor
s5,
877,
880
6,01
6,04
85,
913,
506
6,17
9,90
16,
061,
026
6,10
7,13
35,
952,
531
6,07
0,30
36,
089,
130
5,91
7,97
55,
968,
416
6,09
7,68
25,
879,
297
Liab
iliti
es t
o ce
ntra
l ban
k45
,013
00
00
00
00
00
00
Dep
osit
s in
clud
ed in
bro
ad m
oney
15,5
43,5
0315
,552
,783
15,8
59,8
2116
,146
,626
16,1
55,0
4716
,856
,780
16,4
48,1
4016
,657
,596
16,5
61,9
0315
,808
,244
16,6
56,7
0316
,122
,016
16,3
10,3
92Tr
ansf
erab
le d
epos
its
5,00
4,36
14,
665,
514
4,56
8,93
84,
901,
685
4,77
8,39
44,
904,
106
5,06
6,10
85,
261,
136
5,16
1,90
45,
125,
962
5,64
8,85
15,
024,
269
5,27
0,32
4O
ther
fin
anci
al c
orpo
rati
ons
67,1
8672
,641
75,5
4393
,512
73,0
3673
,639
65,3
9958
,553
69,2
1772
,606
64,4
7741
,445
43,1
98St
ate
and
loca
l gov
ernm
ent
15,1
2416
,244
17,9
3219
,518
19,7
8820
,601
20,2
6540
,871
15,0
0914
,979
15,8
0814
,212
25Pu
blic
non
fina
ncia
l cor
pora
tion
s16
7,08
216
0,13
011
4,13
711
3,16
211
3,93
313
1,16
412
8,34
116
1,80
217
3,78
217
4,85
013
2,00
812
7,67
916
4,82
0O
ther
non
fina
ncia
l cor
pora
tion
s4,
030,
824
3,66
9,28
43,
561,
022
4,09
6,10
33,
682,
105
3,70
7,42
73,
851,
125
4,04
8,94
63,
891,
973
3,97
7,49
24,
497,
646
3,95
6,90
54,
085,
079
Oth
er r
esid
ent
sect
ors
724,
146
747,
215
800,
304
579,
390
889,
533
971,
275
1,00
0,97
895
0,96
41,
011,
924
886,
035
938,
912
884,
028
977,
201
Oth
er d
epos
its
10,5
39,1
4210
,887
,269
11,2
90,8
8311
,244
,941
11,3
76,6
5311
,952
,674
11,3
82,0
3111
,396
,460
11,3
99,9
9810
,682
,282
11,0
07,8
5311
,097
,747
11,0
40,0
69O
ther
fin
anci
al c
orpo
rati
ons
1,52
2,02
41,
927,
214
1,49
4,08
11,
774,
633
1,98
1,26
11,
971,
537
2,25
4,76
81,
787,
063
1,70
5,92
71,
640,
420
1,58
0,17
41,
632,
743
1,53
7,41
2St
ate
and
loca
l gov
ernm
ent
186,
022
170,
746
170,
095
175,
272
177,
987
181,
192
186,
292
159,
493
253,
128
241,
703
264,
503
255,
844
13,8
43Pu
blic
non
fina
ncia
l cor
pora
tion
s80
1,13
795
5,53
868
0,32
174
4,26
154
1,68
653
2,22
734
3,60
471
5,23
678
7,41
969
4,30
965
4,70
768
7,20
489
8,42
5O
ther
non
fina
ncia
l cor
pora
tion
s4,
447,
169
4,25
5,87
65,
473,
222
5,22
9,20
65,
473,
096
5,90
0,41
25,
266,
563
5,26
7,05
25,
089,
683
4,43
3,97
84,
859,
861
4,79
5,95
64,
531,
979
Oth
er r
esid
ent
sect
ors
3,58
2,79
03,
577,
895
3,47
3,16
53,
321,
570
3,20
2,62
33,
367,
306
3,33
0,80
43,
467,
614
3,56
3,84
23,
671,
872
3,64
8,60
83,
726,
000
4,05
8,40
9Se
curi
ties
oth
er t
han
shar
es e
xcl.
fro
m b
road
mon
ey8,
910
9,58
49,
785
9,47
99,
502
15,8
458,
506
10,0
458,
812
8,57
48,
497
8,43
08,
736
Shar
es a
nd o
ther
equ
ity
3,74
1,00
13,
790,
494
3,84
3,92
93,
906,
374
3,96
1,70
94,
009,
417
4,06
3,16
44,
133,
726
4,15
3,95
14,
188,
807
4,22
5,71
14,
225,
182
4,23
9,61
9Fu
nds
cont
ribu
ted
by o
wne
rs10
9,35
210
9,35
110
9,35
110
9,35
110
9,35
110
9,35
110
9,35
210
9,35
210
9,35
210
9,35
210
9,35
210
9,35
210
9,35
2Re
tain
ed e
arni
ngs
2,04
1,52
72,
041,
527
2,04
1,52
72,
049,
577
2,04
9,57
72,
049,
577
2,05
1,59
22,
162,
596
2,16
7,88
02,
235,
535
2,23
4,02
32,
202,
269
2,20
3,33
0Cu
rren
t ye
ar r
esul
ts38
,128
76,9
2911
4,02
815
7,32
520
8,20
824
1,81
328
4,61
912
2,38
914
0,76
311
3,85
914
4,40
015
4,93
319
0,26
0G
ener
al a
nd s
peci
al r
eser
ves
1,55
1,99
41,
562,
686
1,57
9,02
31,
590,
121
1,59
4,57
21,
608,
675
1,61
7,60
11,
739,
389
1,73
5,95
61,
730,
061
1,73
7,93
61,
758,
628
1,73
6,67
7O
ther
item
s (n
et)
(357
,285
)(2
54,5
25)
83,0
73(9
0,18
7)(2
97,1
75)
(182
,395
)(2
39,9
13)
(181
,411
)(1
93,9
58)
5,48
4(2
74,6
04)
(119
,269
)(1
61,2
74)
Oth
er li
abili
ties
1,06
4,05
81,
021,
027
1,31
0,67
91,
390,
634
1,17
6,02
11,
568,
540
1,33
5,96
71,
343,
207
1,44
4,63
11,
737,
168
1,15
3,32
31,
339,
071
1,42
7,93
5Le
ss:
othe
r as
sets
(1,4
21,3
43)
(1,2
75,5
52)
(1,2
27,6
06)
(1,4
80,8
21)
(1,4
73,1
97)
(1,7
50,9
35)
(1,5
75,8
81)
(1,5
24,6
18)
(1,6
38,5
89)
(1,7
31,6
84)
(1,4
27,9
28)
(1,4
58,3
41)
(1,5
89,2
09)
1. In
clud
es C
entr
al B
ank
of E
swat
ini b
ills.
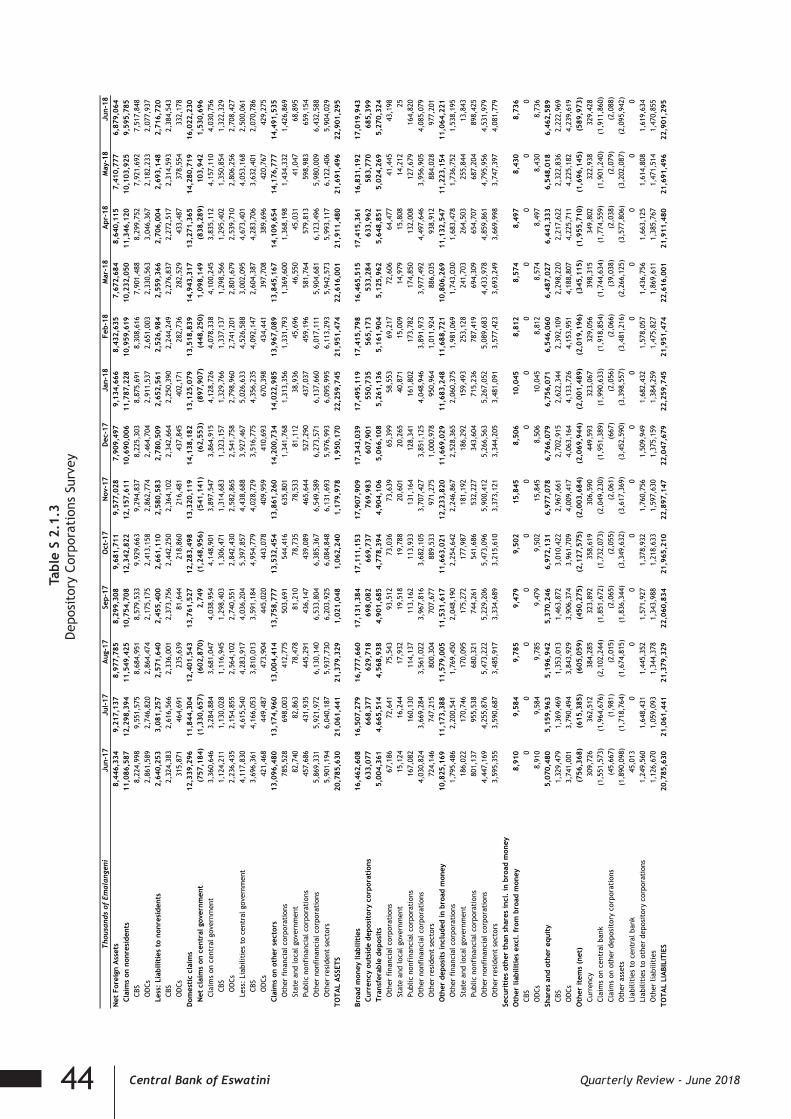
44 Central Bank of Eswatini Quarterly Review - June 2018
Tab
le S
2.1
.3D
epos
itor
y Co
rpor
atio
ns S
urve
y
Tabl
e S
2.1.
3D
epos
itor
y Co
rpor
atio
ns S
urve
y
Tho
usan
ds o
f Em
alan
geni
Jun-
17Ju
l-17
Aug
-17
Sep-
17O
ct-1
7N
ov-1
7D
ec-1
7Ja
n-18
Feb-
18M
ar-1
8A
pr-1
8M
ay-1
8Ju
n-18
Net
For
eign
Ass
ets
8,44
6,33
49,
217,
137
8,97
7,78
58,
299,
308
9,68
1,71
19,
577,
028
7,90
9,49
79,
134,
666
8,43
2,63
57,
672,
684
8,64
0,11
57,
410,
777
6,87
9,06
4Cl
aim
s on
non
resi
dent
s11
,086
,587
12,2
98,3
9411
,549
,425
10,7
54,7
0812
,342
,822
12,1
57,6
1110
,690
,006
11,7
87,2
2810
,959
,619
10,2
32,0
5011
,346
,120
10,1
03,9
259,
595,
785
CBS
8,22
4,99
89,
551,
575
8,68
4,95
18,
579,
533
9,92
9,66
39,
294,
837
8,22
5,30
38,
875,
691
8,30
8,61
67,
901,
488
8,29
9,75
27,
921,
692
7,51
7,84
8O
DCs
2,86
1,58
92,
746,
820
2,86
4,47
42,
175,
175
2,41
3,15
82,
862,
774
2,46
4,70
42,
911,
537
2,65
1,00
32,
330,
563
3,04
6,36
72,
182,
233
2,07
7,93
7Le
ss:
Liab
iliti
es t
o no
nres
iden
ts2,
640,
253
3,08
1,25
72,
571,
640
2,45
5,40
02,
661,
110
2,58
0,58
32,
780,
509
2,65
2,56
12,
526,
984
2,55
9,36
62,
706,
004
2,69
3,14
82,
716,
720
CBS
2,32
4,38
32,
616,
566
2,33
6,00
12,
373,
756
2,44
2,25
02,
364,
102
2,34
2,66
42,
250,
390
2,24
4,24
92,
276,
837
2,27
2,51
72,
314,
593
2,38
4,54
3O
DCs
315,
871
464,
691
235,
639
81,6
4421
8,86
021
6,48
143
7,84
540
2,17
128
2,73
628
2,52
943
3,48
737
8,55
433
2,17
8D
omes
tic
clai
ms
12,3
39,2
9611
,844
,304
12,4
01,5
4313
,761
,527
12,2
83,4
9813
,320
,119
14,1
38,1
8213
,125
,079
13,5
18,8
3914
,943
,317
13,2
71,3
6514
,280
,719
16,0
22,2
30N
et c
laim
s on
cen
tral
gov
ernm
ent
(757
,184
)(1
,330
,657
)(6
02,8
70)
2,74
9(1
,248
,956
)(5
41,1
41)
(62,
553)
(897
,907
)(4
48,2
50)
1,09
8,14
9(8
38,2
89)
103,
942
1,53
0,69
6Cl
aim
s on
cen
tral
gov
ernm
ent
3,36
0,64
63,
284,
884
3,68
1,04
74,
038,
954
4,14
8,90
13,
897,
547
3,86
4,91
54,
128,
726
4,07
8,33
84,
100,
245
3,83
5,11
24,
157,
110
4,03
0,75
6CB
S1,
124,
211
1,13
0,02
81,
116,
945
1,29
8,40
31,
306,
471
1,31
4,68
31,
323,
157
1,32
9,76
61,
337,
137
1,29
8,56
61,
295,
402
1,35
0,85
41,
322,
329
OD
Cs2,
236,
435
2,15
4,85
52,
564,
102
2,74
0,55
12,
842,
430
2,58
2,86
52,
541,
758
2,79
8,96
02,
741,
201
2,80
1,67
92,
539,
710
2,80
6,25
62,
708,
427
Less
: Li
abili
ties
to
cent
ral g
over
nmen
t4,
117,
830
4,61
5,54
04,
283,
917
4,03
6,20
45,
397,
857
4,43
8,68
83,
927,
467
5,02
6,63
34,
526,
588
3,00
2,09
54,
673,
401
4,05
3,16
82,
500,
061
CBS
3,69
6,36
14,
166,
053
3,81
0,01
33,
591,
184
4,95
4,77
94,
028,
729
3,51
6,77
54,
356,
235
4,09
2,14
72,
604,
387
4,28
3,70
63,
632,
401
2,07
0,78
6O
DCs
421,
468
449,
487
473,
904
445,
020
443,
078
409,
959
410,
693
670,
398
434,
441
397,
708
389,
696
420,
767
429,
275
Clai
ms
on o
ther
sec
tors
13,0
96,4
8013
,174
,960
13,0
04,4
1413
,758
,777
13,5
32,4
5413
,861
,260
14,2
00,7
3414
,022
,985
13,9
67,0
8913
,845
,167
14,1
09,6
5414
,176
,777
14,4
91,5
35O
ther
fin
anci
al c
orpo
rati
ons
785,
528
698,
003
412,
775
503,
691
544,
416
635,
801
1,34
1,76
81,
313,
356
1,33
1,79
31,
369,
600
1,36
8,19
81,
434,
332
1,42
6,86
9St
ate
and
loca
l gov
ernm
ent
82,7
4082
,863
78,4
7881
,210
78,7
3578
,533
81,1
1238
,936
45,6
9646
,550
45,0
3141
,047
68,8
95Pu
blic
non
fina
ncia
l cor
pora
tion
s45
7,68
643
1,93
544
5,29
143
6,14
743
9,08
946
5,64
452
7,29
043
7,03
745
9,19
658
1,76
457
9,81
359
8,98
365
9,15
4O
ther
non
fina
ncia
l cor
pora
tion
s5,
869,
331
5,92
1,97
26,
130,
140
6,53
3,80
46,
385,
367
6,54
9,58
96,
273,
571
6,13
7,66
06,
017,
111
5,90
4,68
16,
123,
496
5,98
0,00
96,
432,
588
Oth
er r
esid
ent
sect
ors
5,90
1,19
46,
040,
187
5,93
7,73
06,
203,
925
6,08
4,84
86,
131,
693
5,97
6,99
36,
095,
995
6,11
3,29
35,
942,
573
5,99
3,11
76,
122,
406
5,90
4,02
9TO
TAL
ASS
ETS
20,7
85,6
3021
,061
,441
21,3
79,3
291,
021,
048
1,06
2,24
01,
179,
978
1,95
0,17
022
,259
,745
21,9
51,4
7422
,616
,001
21,9
11,4
8021
,691
,496
22,9
01,2
95
Broa
d m
oney
liab
iliti
es16
,462
,608
16,5
07,2
7916
,777
,660
17,1
31,3
8417
,111
,153
17,9
07,9
0917
,343
,039
17,4
95,1
1917
,415
,798
16,4
65,5
1517
,415
,361
16,8
31,1
9217
,019
,943
Curr
ency
out
side
dep
osit
ory
corp
orat
ions
633,
077
668,
377
629,
718
698,
082
669,
737
769,
983
607,
901
550,
735
565,
173
533,
284
633,
962
583,
770
685,
399
Tran
sfer
able
dep
osit
s5,
004,
361
4,66
5,51
44,
568,
938
4,90
1,68
54,
778,
394
4,90
4,10
65,
066,
108
5,26
1,13
65,
161,
904
5,12
5,96
25,
648,
851
5,02
4,26
95,
270,
324
Oth
er f
inan
cial
cor
pora
tion
s67
,186
72,6
4175
,543
93,5
1273
,036
73,6
3965
,399
58,5
5369
,217
72,6
0664
,477
41,4
4543
,198
Stat
e an
d lo
cal g
over
nmen
t15
,124
16,2
4417
,932
19,5
1819
,788
20,6
0120
,265
40,8
7115
,009
14,9
7915
,808
14,2
1225
Publ
ic n
onfi
nanc
ial c
orpo
rati
ons
167,
082
160,
130
114,
137
113,
162
113,
933
131,
164
128,
341
161,
802
173,
782
174,
850
132,
008
127,
679
164,
820
Oth
er n
onfi
nanc
ial c
orpo
rati
ons
4,03
0,82
43,
669,
284
3,56
1,02
23,
967,
816
3,68
2,10
53,
707,
427
3,85
1,12
54,
048,
946
3,89
1,97
33,
977,
492
4,49
7,64
63,
956,
905
4,08
5,07
9O
ther
res
iden
t se
ctor
s72
4,14
674
7,21
580
0,30
470
7,67
788
9,53
397
1,27
51,
000,
978
950,
964
1,01
1,92
488
6,03
593
8,91
288
4,02
897
7,20
1O
ther
dep
osit
s in
clud
ed in
bro
ad m
oney
10,8
25,1
6911
,173
,388
11,5
79,0
0511
,531
,617
11,6
63,0
2112
,233
,820
11,6
69,0
2911
,683
,248
11,6
88,7
2110
,806
,269
11,1
32,5
4711
,223
,154
11,0
64,2
21O
ther
fin
anci
al c
orpo
rati
ons
1,79
5,48
62,
200,
541
1,76
9,45
02,
048,
190
2,25
4,64
22,
246,
867
2,52
8,36
52,
060,
375
1,98
1,06
91,
743,
030
1,68
3,47
81,
736,
752
1,53
8,19
5St
ate
and
loca
l gov
ernm
ent
186,
022
170,
746
170,
095
175,
272
177,
987
181,
192
186,
292
159,
493
253,
128
241,
703
264,
503
255,
844
13,8
43Pu
blic
non
fina
ncia
l cor
pora
tion
s80
1,13
795
5,53
868
0,32
174
4,26
154
1,68
653
2,22
734
3,60
471
5,23
678
7,41
969
4,30
965
4,70
768
7,20
489
8,42
5O
ther
non
fina
ncia
l cor
pora
tion
s4,
447,
169
4,25
5,87
65,
473,
222
5,22
9,20
65,
473,
096
5,90
0,41
25,
266,
563
5,26
7,05
25,
089,
683
4,43
3,97
84,
859,
861
4,79
5,95
64,
531,
979
Oth
er r
esid
ent
sect
ors
3,59
5,35
53,
590,
687
3,48
5,91
73,
334,
689
3,21
5,61
03,
373,
121
3,34
4,20
53,
481,
091
3,57
7,42
33,
693,
249
3,66
9,99
83,
747,
397
4,08
1,77
9Se
curi
ties
oth
er t
han
shar
es in
cl.
in b
road
mon
eyO
ther
liab
iliti
es e
xcl.
fro
m b
road
mon
ey8,
910
9,58
49,
785
9,47
99,
502
15,8
458,
506
10,0
458,
812
8,57
48,
497
8,43
08,
736
CBS
00
00
00
00
00
00
0O
DCs
8,91
09,
584
9,78
59,
479
9,50
215
,845
8,50
610
,045
8,81
28,
574
8,49
78,
430
8,73
6Sh
ares
and
oth
er e
quit
y5,
070,
480
5,15
9,96
35,
196,
942
5,37
0,24
66,
972,
131
6,97
7,07
86,
766,
079
6,75
6,07
16,
546,
060
6,48
7,02
76,
443,
333
6,54
8,01
86,
462,
589
CBS
1,32
9,47
91,
369,
469
1,35
3,01
31,
463,
872
3,01
0,42
22,
967,
661
2,70
2,91
52,
622,
344
2,39
2,10
92,
298,
220
2,21
7,62
22,
322,
836
2,22
2,96
9O
DCs
3,74
1,00
13,
790,
494
3,84
3,92
93,
906,
374
3,96
1,70
94,
009,
417
4,06
3,16
44,
133,
726
4,15
3,95
14,
188,
807
4,22
5,71
14,
225,
182
4,23
9,61
9O
ther
item
s (n
et)
(756
,368
)(6
15,3
85)
(605
,059
)(4
50,2
75)
(2,1
27,5
75)
(2,0
03,6
84)
(2,0
69,9
44)
(2,0
01,4
89)
(2,0
19,1
96)
(345
,115
)(1
,955
,710
)(1
,696
,145
)(5
89,9
73)
Curr
ency
30
9,72
636
2,51
238
4,28
532
3,89
235
8,61
930
6,59
044
9,59
332
3,06
732
9,05
639
8,31
534
9,80
232
2,93
832
9,42
8Cl
aim
s on
cen
tral
ban
k(1
,551
,573
)(1
,964
,676
)(2
,102
,244
)(1
,851
,672
)(1
,732
,073
)(2
,049
,230
)(1
,951
,389
)(1
,990
,633
)(1
,918
,854
)(1
,744
,634
)(1
,774
,559
)(1
,901
,240
)(1
,911
,860
)Cl
aim
s on
oth
er d
epos
itor
y co
rpor
atio
ns(4
5,66
7)(1
,981
)(2
,015
)(2
,065
)(2
,055
)(2
,061
)(6
67)
(2,0
56)
(2,0
66)
(39,
038)
(2,0
38)
(2,0
79)
(2,0
88)
Oth
er a
sset
s(1
,890
,098
)(1
,718
,764
)(1
,674
,815
)(1
,836
,344
)(3
,349
,632
)(3
,617
,369
)(3
,452
,590
)(3
,398
,557
)(3
,481
,216
)(2
,266
,125
)(3
,577
,806
)(3
,202
,087
)(2
,095
,942
)Li
abili
ties
to
cent
ral b
ank
45,0
130
00
00
00
00
00
0Li
abili
ties
to
othe
r de
posi
tory
cor
pora
tion
s1,
249,
560
1,64
8,43
11,
445,
352
1,57
1,92
71,
378,
932
1,76
0,75
61,
509,
949
1,68
2,43
21,
578,
057
1,43
6,75
61,
663,
125
1,61
4,80
81,
619,
634
Oth
er li
abili
ties
1,12
6,67
01,
059,
093
1,34
4,37
81,
343,
988
1,21
8,63
31,
597,
630
1,37
5,15
91,
384,
259
1,47
5,82
71,
869,
611
1,38
5,76
71,
471,
514
1,47
0,85
5TO
TAL
LIA
BILI
TIES
20,7
85,6
3021
,061
,441
21,3
79,3
2922
,060
,834
21,9
65,2
1022
,897
,147
22,0
47,6
7922
,259
,745
21,9
51,4
7422
,616
,001
21,9
11,4
8021
,691
,496
22,9
01,2
95
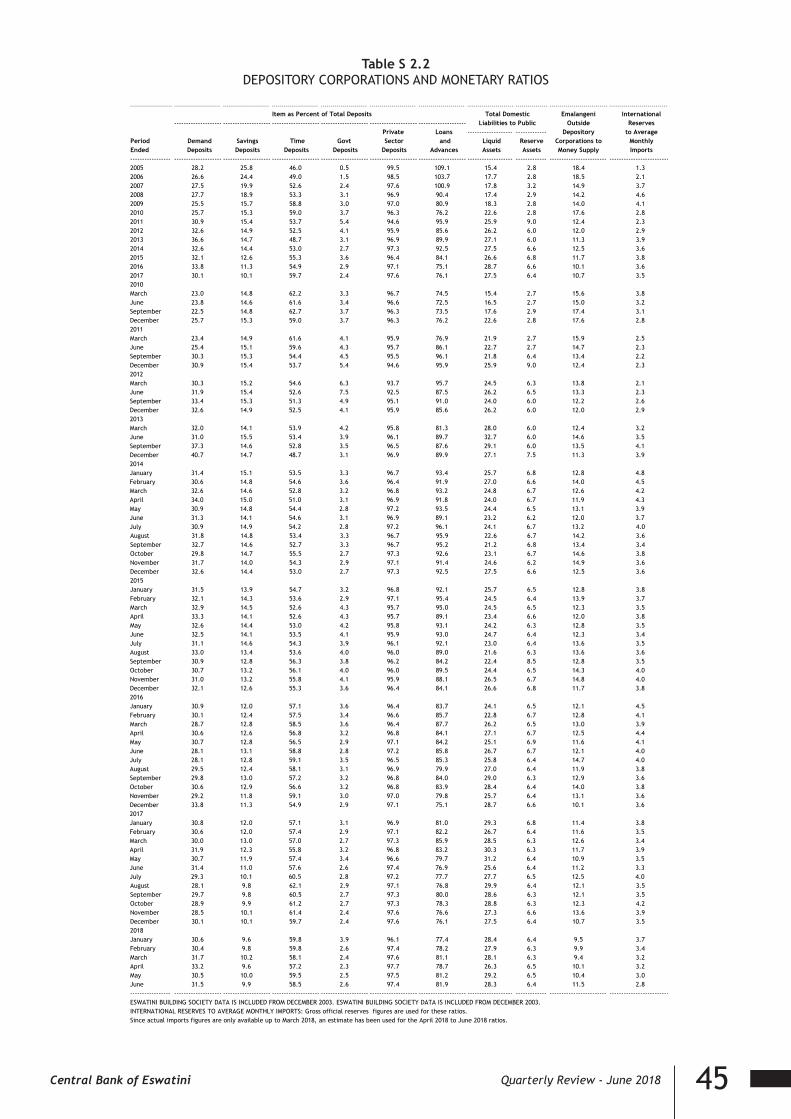
45Central Bank of Eswatini Quarterly Review - June 2018
Table S 2.2DEPOSITORY CORPORATIONS AND MONETARY RATIOS
Table S 2.2 DEPOSITORY CORPORATIONS AND MONETARY RATIOS
--------------------- ----------------------- ----------------------- ----------------------- ----------------------- ----------------------- ----------------------- ----------------------- ---------------- ----------------------------- -------------------------------
Item as Percent of Total Deposits Emalangeni International-------------------- -------------------- -------------------- -------------------- -------------------- -------------------- Outside Reserves
Private Loans ------------------- ------------- Depository to AveragePeriod Demand Savings Time Govt Sector and Liquid Reserve Corporations to MonthlyEnded Deposits Deposits Deposits Deposits Deposits Advances Assets Assets Money Supply Imports----------------- -------------------- -------------------- -------------------- -------------------- -------------------- -------------------- ------------------- ------------- ------------------------ --------------------------2005 28.2 25.8 46.0 0.5 99.5 109.1 15.4 2.8 18.4 1.32006 26.6 24.4 49.0 1.5 98.5 103.7 17.7 2.8 18.5 2.12007 27.5 19.9 52.6 2.4 97.6 100.9 17.8 3.2 14.9 3.72008 27.7 18.9 53.3 3.1 96.9 90.4 17.4 2.9 14.2 4.62009 25.5 15.7 58.8 3.0 97.0 80.9 18.3 2.8 14.0 4.12010 25.7 15.3 59.0 3.7 96.3 76.2 22.6 2.8 17.6 2.82011 30.9 15.4 53.7 5.4 94.6 95.9 25.9 9.0 12.4 2.32012 32.6 14.9 52.5 4.1 95.9 85.6 26.2 6.0 12.0 2.92013 36.6 14.7 48.7 3.1 96.9 89.9 27.1 6.0 11.3 3.92014 32.6 14.4 53.0 2.7 97.3 92.5 27.5 6.6 12.5 3.62015 32.1 12.6 55.3 3.6 96.4 84.1 26.6 6.8 11.7 3.82016 33.8 11.3 54.9 2.9 97.1 75.1 28.7 6.6 10.1 3.62017 30.1 10.1 59.7 2.4 97.6 76.1 27.5 6.4 10.7 3.52010March 23.0 14.8 62.2 3.3 96.7 74.5 15.4 2.7 15.6 3.8June 23.8 14.6 61.6 3.4 96.6 72.5 16.5 2.7 15.0 3.2September 22.5 14.8 62.7 3.7 96.3 73.5 17.6 2.9 17.4 3.1December 25.7 15.3 59.0 3.7 96.3 76.2 22.6 2.8 17.6 2.82011March 23.4 14.9 61.6 4.1 95.9 76.9 21.9 2.7 15.9 2.5June 25.4 15.1 59.6 4.3 95.7 86.1 22.7 2.7 14.7 2.3September 30.3 15.3 54.4 4.5 95.5 96.1 21.8 6.4 13.4 2.2December 30.9 15.4 53.7 5.4 94.6 95.9 25.9 9.0 12.4 2.32012March 30.3 15.2 54.6 6.3 93.7 95.7 24.5 6.3 13.8 2.1June 31.9 15.4 52.6 7.5 92.5 87.5 26.2 6.5 13.3 2.3September 33.4 15.3 51.3 4.9 95.1 91.0 24.0 6.0 12.2 2.6December 32.6 14.9 52.5 4.1 95.9 85.6 26.2 6.0 12.0 2.92013March 32.0 14.1 53.9 4.2 95.8 81.3 28.0 6.0 12.4 3.2June 31.0 15.5 53.4 3.9 96.1 89.7 32.7 6.0 14.6 3.5September 37.3 14.6 52.8 3.5 96.5 87.6 29.1 6.0 13.5 4.1December 40.7 14.7 48.7 3.1 96.9 89.9 27.1 7.5 11.3 3.92014January 31.4 15.1 53.5 3.3 96.7 93.4 25.7 6.8 12.8 4.8February 30.6 14.8 54.6 3.6 96.4 91.9 27.0 6.6 14.0 4.5March 32.6 14.6 52.8 3.2 96.8 93.2 24.8 6.7 12.6 4.2April 34.0 15.0 51.0 3.1 96.9 91.8 24.0 6.7 11.9 4.3May 30.9 14.8 54.4 2.8 97.2 93.5 24.4 6.5 13.1 3.9June 31.3 14.1 54.6 3.1 96.9 89.1 23.2 6.2 12.0 3.7July 30.9 14.9 54.2 2.8 97.2 96.1 24.1 6.7 13.2 4.0August 31.8 14.8 53.4 3.3 96.7 95.9 22.6 6.7 14.2 3.6September 32.7 14.6 52.7 3.3 96.7 95.2 21.2 6.8 13.4 3.4October 29.8 14.7 55.5 2.7 97.3 92.6 23.1 6.7 14.6 3.8November 31.7 14.0 54.3 2.9 97.1 91.4 24.6 6.2 14.9 3.6December 32.6 14.4 53.0 2.7 97.3 92.5 27.5 6.6 12.5 3.62015January 31.5 13.9 54.7 3.2 96.8 92.1 25.7 6.5 12.8 3.8February 32.1 14.3 53.6 2.9 97.1 95.4 24.5 6.4 13.9 3.7March 32.9 14.5 52.6 4.3 95.7 95.0 24.5 6.5 12.3 3.5April 33.3 14.1 52.6 4.3 95.7 89.1 23.4 6.6 12.0 3.8May 32.6 14.4 53.0 4.2 95.8 93.1 24.2 6.3 12.8 3.5June 32.5 14.1 53.5 4.1 95.9 93.0 24.7 6.4 12.3 3.4July 31.1 14.6 54.3 3.9 96.1 92.1 23.0 6.4 13.6 3.5August 33.0 13.4 53.6 4.0 96.0 89.0 21.6 6.3 13.6 3.6September 30.9 12.8 56.3 3.8 96.2 84.2 22.4 8.5 12.8 3.5October 30.7 13.2 56.1 4.0 96.0 89.5 24.4 6.5 14.3 4.0November 31.0 13.2 55.8 4.1 95.9 88.1 26.5 6.7 14.8 4.0December 32.1 12.6 55.3 3.6 96.4 84.1 26.6 6.8 11.7 3.82016January 30.9 12.0 57.1 3.6 96.4 83.7 24.1 6.5 12.1 4.5February 30.1 12.4 57.5 3.4 96.6 85.7 22.8 6.7 12.8 4.1March 28.7 12.8 58.5 3.6 96.4 87.7 26.2 6.5 13.0 3.9April 30.6 12.6 56.8 3.2 96.8 84.1 27.1 6.7 12.5 4.4May 30.7 12.8 56.5 2.9 97.1 84.2 25.1 6.9 11.6 4.1June 28.1 13.1 58.8 2.8 97.2 85.8 26.7 6.7 12.1 4.0July 28.1 12.8 59.1 3.5 96.5 85.3 25.8 6.4 14.7 4.0August 29.5 12.4 58.1 3.1 96.9 79.9 27.0 6.4 11.9 3.8September 29.8 13.0 57.2 3.2 96.8 84.0 29.0 6.3 12.9 3.6October 30.6 12.9 56.6 3.2 96.8 83.9 28.4 6.4 14.0 3.8November 29.2 11.8 59.1 3.0 97.0 79.8 25.7 6.4 13.1 3.6December 33.8 11.3 54.9 2.9 97.1 75.1 28.7 6.6 10.1 3.62017January 30.8 12.0 57.1 3.1 96.9 81.0 29.3 6.8 11.4 3.8February 30.6 12.0 57.4 2.9 97.1 82.2 26.7 6.4 11.6 3.5March 30.0 13.0 57.0 2.7 97.3 85.9 28.5 6.3 12.6 3.4April 31.9 12.3 55.8 3.2 96.8 83.2 30.3 6.3 11.7 3.9May 30.7 11.9 57.4 3.4 96.6 79.7 31.2 6.4 10.9 3.5June 31.4 11.0 57.6 2.6 97.4 76.9 25.6 6.4 11.2 3.3July 29.3 10.1 60.5 2.8 97.2 77.7 27.7 6.5 12.5 4.0August 28.1 9.8 62.1 2.9 97.1 76.8 29.9 6.4 12.1 3.5September 29.7 9.8 60.5 2.7 97.3 80.0 28.6 6.3 12.1 3.5October 28.9 9.9 61.2 2.7 97.3 78.3 28.8 6.3 12.3 4.2November 28.5 10.1 61.4 2.4 97.6 76.6 27.3 6.6 13.6 3.9December 30.1 10.1 59.7 2.4 97.6 76.1 27.5 6.4 10.7 3.52018January 30.6 9.6 59.8 3.9 96.1 77.4 28.4 6.4 9.5 3.7February 30.4 9.8 59.8 2.6 97.4 78.2 27.9 6.3 9.9 3.4March 31.7 10.2 58.1 2.4 97.6 81.1 28.1 6.3 9.4 3.2April 33.2 9.6 57.2 2.3 97.7 78.7 26.3 6.5 10.1 3.2May 30.5 10.0 59.5 2.5 97.5 81.2 29.2 6.5 10.4 3.0June 31.5 9.9 58.5 2.6 97.4 81.9 28.3 6.4 11.5 2.8----------------- -------------------- -------------------- -------------------- -------------------- -------------------- -------------------- ------------------- ------------- ------------------------ --------------------------ESWATINI BUILDING SOCIETY DATA IS INCLUDED FROM DECEMBER 2003. ESWATINI BUILDING SOCIETY DATA IS INCLUDED FROM DECEMBER 2003. INTERNATIONAL RESERVES TO AVERAGE MONTHLY IMPORTS: Gross official reserves figures are used for these ratios.Since actual imports figures are only available up to March 2018, an estimate has been used for the April 2018 to June 2018 ratios.
Liabilities to PublicTotal Domestic
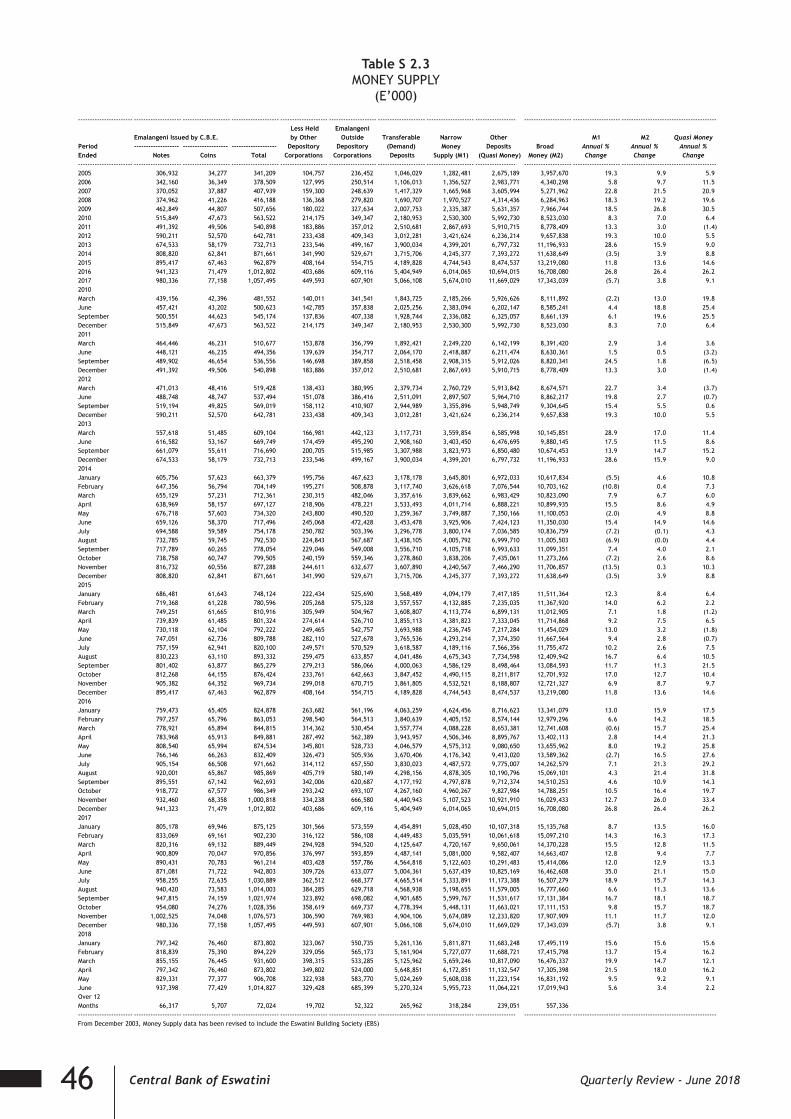
46 Central Bank of Eswatini Quarterly Review - June 2018
Table S 2.3MONEY SUPPLY
(E’000) Table S 2.3 MONEY SUPPLY (E'000)
----------------------- -------------------- -------------------- -------------------- -------------------- -------------------- -------------------- -------------------- ----------------- ----------------------------------------- ---------------------------------------- Less Held Emalangeni
Emalangeni Issued by C.B.E. by Other Outside Transferable Narrow Other M1 M2 Quasi MoneyPeriod ------------------- ------------------- ------------------- Depository Depository (Demand) Money Deposits Broad Annual % Annual % Annual %Ended Notes Coins Total Corporations Corporations Deposits Supply (M1) (Quasi Money) Money (M2) Change Change Change----------------------- -------------------- -------------------- -------------------- -------------------- -------------------- -------------------- -------------------- ----------------- ----------------------------------------- ----------------------------------------2005 306,932 34,277 341,209 104,757 236,452 1,046,029 1,282,481 2,675,189 3,957,670 19.3 9.9 5.92006 342,160 36,349 378,509 127,995 250,514 1,106,013 1,356,527 2,983,771 4,340,298 5.8 9.7 11.52007 370,052 37,887 407,939 159,300 248,639 1,417,329 1,665,968 3,605,994 5,271,962 22.8 21.5 20.92008 374,962 41,226 416,188 136,368 279,820 1,690,707 1,970,527 4,314,436 6,284,963 18.3 19.2 19.62009 462,849 44,807 507,656 180,022 327,634 2,007,753 2,335,387 5,631,357 7,966,744 18.5 26.8 30.52010 515,849 47,673 563,522 214,175 349,347 2,180,953 2,530,300 5,992,730 8,523,030 8.3 7.0 6.42011 491,392 49,506 540,898 183,886 357,012 2,510,681 2,867,693 5,910,715 8,778,409 13.3 3.0 (1.4)2012 590,211 52,570 642,781 233,438 409,343 3,012,281 3,421,624 6,236,214 9,657,838 19.3 10.0 5.52013 674,533 58,179 732,713 233,546 499,167 3,900,034 4,399,201 6,797,732 11,196,933 28.6 15.9 9.02014 808,820 62,841 871,661 341,990 529,671 3,715,706 4,245,377 7,393,272 11,638,649 (3.5) 3.9 8.82015 895,417 67,463 962,879 408,164 554,715 4,189,828 4,744,543 8,474,537 13,219,080 11.8 13.6 14.62016 941,323 71,479 1,012,802 403,686 609,116 5,404,949 6,014,065 10,694,015 16,708,080 26.8 26.4 26.22017 980,336 77,158 1,057,495 449,593 607,901 5,066,108 5,674,010 11,669,029 17,343,039 (5.7) 3.8 9.12010March 439,156 42,396 481,552 140,011 341,541 1,843,725 2,185,266 5,926,626 8,111,892 (2.2) 13.0 19.8June 457,421 43,202 500,623 142,785 357,838 2,025,256 2,383,094 6,202,147 8,585,241 4.4 18.8 25.4September 500,551 44,623 545,174 137,836 407,338 1,928,744 2,336,082 6,325,057 8,661,139 6.1 19.6 25.5December 515,849 47,673 563,522 214,175 349,347 2,180,953 2,530,300 5,992,730 8,523,030 8.3 7.0 6.42011March 464,446 46,231 510,677 153,878 356,799 1,892,421 2,249,220 6,142,199 8,391,420 2.9 3.4 3.6June 448,121 46,235 494,356 139,639 354,717 2,064,170 2,418,887 6,211,474 8,630,361 1.5 0.5 (3.2)September 489,902 46,654 536,556 146,698 389,858 2,518,458 2,908,315 5,912,026 8,820,341 24.5 1.8 (6.5)December 491,392 49,506 540,898 183,886 357,012 2,510,681 2,867,693 5,910,715 8,778,409 13.3 3.0 (1.4)2012March 471,013 48,416 519,428 138,433 380,995 2,379,734 2,760,729 5,913,842 8,674,571 22.7 3.4 (3.7)June 488,748 48,747 537,494 151,078 386,416 2,511,091 2,897,507 5,964,710 8,862,217 19.8 2.7 (0.7)September 519,194 49,825 569,019 158,112 410,907 2,944,989 3,355,896 5,948,749 9,304,645 15.4 5.5 0.6December 590,211 52,570 642,781 233,438 409,343 3,012,281 3,421,624 6,236,214 9,657,838 19.3 10.0 5.52013March 557,618 51,485 609,104 166,981 442,123 3,117,731 3,559,854 6,585,998 10,145,851 28.9 17.0 11.4June 616,582 53,167 669,749 174,459 495,290 2,908,160 3,403,450 6,476,695 9,880,145 17.5 11.5 8.6September 661,079 55,611 716,690 200,705 515,985 3,307,988 3,823,973 6,850,480 10,674,453 13.9 14.7 15.2December 674,533 58,179 732,713 233,546 499,167 3,900,034 4,399,201 6,797,732 11,196,933 28.6 15.9 9.02014January 605,756 57,623 663,379 195,756 467,623 3,178,178 3,645,801 6,972,033 10,617,834 (5.5) 4.6 10.8February 647,356 56,794 704,149 195,271 508,878 3,117,740 3,626,618 7,076,544 10,703,162 (10.8) 0.4 7.3March 655,129 57,231 712,361 230,315 482,046 3,357,616 3,839,662 6,983,429 10,823,090 7.9 6.7 6.0April 638,969 58,157 697,127 218,906 478,221 3,533,493 4,011,714 6,888,221 10,899,935 15.5 8.6 4.9May 676,718 57,603 734,320 243,800 490,520 3,259,367 3,749,887 7,350,166 11,100,053 (2.0) 4.9 8.8June 659,126 58,370 717,496 245,068 472,428 3,453,478 3,925,906 7,424,123 11,350,030 15.4 14.9 14.6July 694,588 59,589 754,178 250,782 503,396 3,296,778 3,800,174 7,036,585 10,836,759 (7.2) (0.1) 4.3August 732,785 59,745 792,530 224,843 567,687 3,438,105 4,005,792 6,999,710 11,005,503 (6.9) (0.0) 4.4September 717,789 60,265 778,054 229,046 549,008 3,556,710 4,105,718 6,993,633 11,099,351 7.4 4.0 2.1October 738,758 60,747 799,505 240,159 559,346 3,278,860 3,838,206 7,435,061 11,273,266 (7.2) 2.6 8.6November 816,732 60,556 877,288 244,611 632,677 3,607,890 4,240,567 7,466,290 11,706,857 (13.5) 0.3 10.3December 808,820 62,841 871,661 341,990 529,671 3,715,706 4,245,377 7,393,272 11,638,649 (3.5) 3.9 8.82015January 686,481 61,643 748,124 222,434 525,690 3,568,489 4,094,179 7,417,185 11,511,364 12.3 8.4 6.4February 719,368 61,228 780,596 205,268 575,328 3,557,557 4,132,885 7,235,035 11,367,920 14.0 6.2 2.2March 749,251 61,665 810,916 305,949 504,967 3,608,807 4,113,774 6,899,131 11,012,905 7.1 1.8 (1.2)April 739,839 61,485 801,324 274,614 526,710 3,855,113 4,381,823 7,333,045 11,714,868 9.2 7.5 6.5May 730,118 62,104 792,222 249,465 542,757 3,693,988 4,236,745 7,217,284 11,454,029 13.0 3.2 (1.8)June 747,051 62,736 809,788 282,110 527,678 3,765,536 4,293,214 7,374,350 11,667,564 9.4 2.8 (0.7)July 757,159 62,941 820,100 249,571 570,529 3,618,587 4,189,116 7,566,356 11,755,472 10.2 2.6 7.5August 830,223 63,110 893,332 259,475 633,857 4,041,486 4,675,343 7,734,598 12,409,942 16.7 6.4 10.5September 801,402 63,877 865,279 279,213 586,066 4,000,063 4,586,129 8,498,464 13,084,593 11.7 11.3 21.5October 812,268 64,155 876,424 233,761 642,663 3,847,452 4,490,115 8,211,817 12,701,932 17.0 12.7 10.4November 905,382 64,352 969,734 299,018 670,715 3,861,805 4,532,521 8,188,807 12,721,327 6.9 8.7 9.7December 895,417 67,463 962,879 408,164 554,715 4,189,828 4,744,543 8,474,537 13,219,080 11.8 13.6 14.62016January 759,473 65,405 824,878 263,682 561,196 4,063,259 4,624,456 8,716,623 13,341,079 13.0 15.9 17.5February 797,257 65,796 863,053 298,540 564,513 3,840,639 4,405,152 8,574,144 12,979,296 6.6 14.2 18.5March 778,921 65,894 844,815 314,362 530,454 3,557,774 4,088,228 8,653,381 12,741,608 (0.6) 15.7 25.4April 783,968 65,913 849,881 287,492 562,389 3,943,957 4,506,346 8,895,767 13,402,113 2.8 14.4 21.3May 808,540 65,994 874,534 345,801 528,733 4,046,579 4,575,312 9,080,650 13,655,962 8.0 19.2 25.8June 766,146 66,263 832,409 326,473 505,936 3,670,406 4,176,342 9,413,020 13,589,362 (2.7) 16.5 27.6July 905,154 66,508 971,662 314,112 657,550 3,830,023 4,487,572 9,775,007 14,262,579 7.1 21.3 29.2August 920,001 65,867 985,869 405,719 580,149 4,298,156 4,878,305 10,190,796 15,069,101 4.3 21.4 31.8September 895,551 67,142 962,693 342,006 620,687 4,177,192 4,797,878 9,712,374 14,510,253 4.6 10.9 14.3October 918,772 67,577 986,349 293,242 693,107 4,267,160 4,960,267 9,827,984 14,788,251 10.5 16.4 19.7November 932,460 68,358 1,000,818 334,238 666,580 4,440,943 5,107,523 10,921,910 16,029,433 12.7 26.0 33.4December 941,323 71,479 1,012,802 403,686 609,116 5,404,949 6,014,065 10,694,015 16,708,080 26.8 26.4 26.22017January 805,178 69,946 875,125 301,566 573,559 4,454,891 5,028,450 10,107,318 15,135,768 8.7 13.5 16.0February 833,069 69,161 902,230 316,122 586,108 4,449,483 5,035,591 10,061,618 15,097,210 14.3 16.3 17.3March 820,316 69,132 889,449 294,928 594,520 4,125,647 4,720,167 9,650,061 14,370,228 15.5 12.8 11.5April 900,809 70,047 970,856 376,997 593,859 4,487,141 5,081,000 9,582,407 14,663,407 12.8 9.4 7.7May 890,431 70,783 961,214 403,428 557,786 4,564,818 5,122,603 10,291,483 15,414,086 12.0 12.9 13.3June 871,081 71,722 942,803 309,726 633,077 5,004,361 5,637,439 10,825,169 16,462,608 35.0 21.1 15.0July 958,255 72,635 1,030,889 362,512 668,377 4,665,514 5,333,891 11,173,388 16,507,279 18.9 15.7 14.3August 940,420 73,583 1,014,003 384,285 629,718 4,568,938 5,198,655 11,579,005 16,777,660 6.6 11.3 13.6September 947,815 74,159 1,021,974 323,892 698,082 4,901,685 5,599,767 11,531,617 17,131,384 16.7 18.1 18.7October 954,080 74,276 1,028,356 358,619 669,737 4,778,394 5,448,131 11,663,021 17,111,153 9.8 15.7 18.7November 1,002,525 74,048 1,076,573 306,590 769,983 4,904,106 5,674,089 12,233,820 17,907,909 11.1 11.7 12.0December 980,336 77,158 1,057,495 449,593 607,901 5,066,108 5,674,010 11,669,029 17,343,039 (5.7) 3.8 9.12018January 797,342 76,460 873,802 323,067 550,735 5,261,136 5,811,871 11,683,248 17,495,119 15.6 15.6 15.6February 818,839 75,390 894,229 329,056 565,173 5,161,904 5,727,077 11,688,721 17,415,798 13.7 15.4 16.2March 855,155 76,445 931,600 398,315 533,285 5,125,962 5,659,246 10,817,090 16,476,337 19.9 14.7 12.1April 797,342 76,460 873,802 349,802 524,000 5,648,851 6,172,851 11,132,547 17,305,398 21.5 18.0 16.2May 829,331 77,377 906,708 322,938 583,770 5,024,269 5,608,038 11,223,154 16,831,192 9.5 9.2 9.1June 937,398 77,429 1,014,827 329,428 685,399 5,270,324 5,955,723 11,064,221 17,019,943 5.6 3.4 2.2Over 12 Months 66,317 5,707 72,024 19,702 52,322 265,962 318,284 239,051 557,336----------------------- -------------------- -------------------- -------------------- -------------------- -------------------- -------------------- -------------------- ----------------- ----------------------------------------- ----------------------------------------From December 2003, Money Supply data has been revised to include the Eswatini Building Society (EBS)
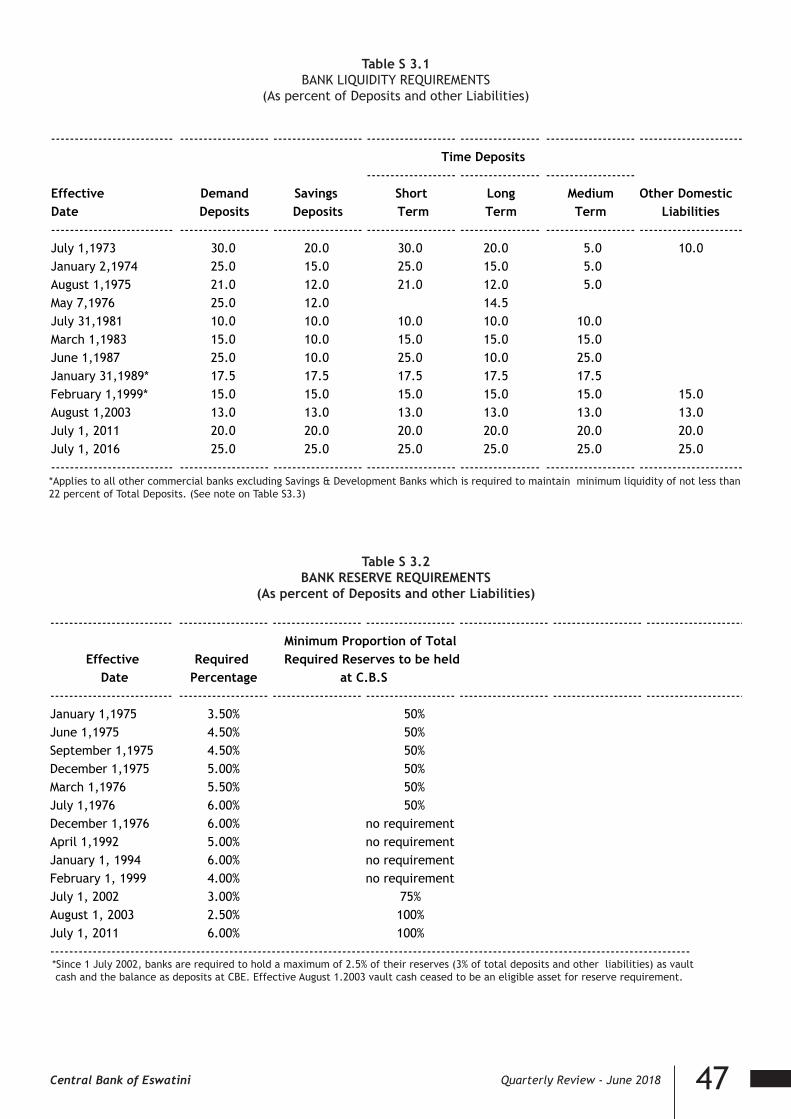
47Central Bank of Eswatini Quarterly Review - June 2018
Table S 3.1BANK LIQUIDITY REQUIREMENTS
(As percent of Deposits and other Liabilities)Table S 3.1
BANK LIQUIDITY REQUIREMENTS(As percent of Deposits and other Liabilities)
-------------------------- ------------------- ------------------- ------------------- ----------------- ------------------- ---------------------- Time Deposits------------------- ----------------- -------------------
Effective Demand Savings Short Long Medium Other DomesticDate Deposits Deposits Term Term Term Liabilities-------------------------- ------------------- ------------------- ------------------- ----------------- ------------------- ----------------------July 1,1973 30.0 20.0 30.0 20.0 5.0 10.0January 2,1974 25.0 15.0 25.0 15.0 5.0August 1,1975 21.0 12.0 21.0 12.0 5.0May 7,1976 25.0 12.0 14.5July 31,1981 10.0 10.0 10.0 10.0 10.0March 1,1983 15.0 10.0 15.0 15.0 15.0June 1,1987 25.0 10.0 25.0 10.0 25.0January 31,1989* 17.5 17.5 17.5 17.5 17.5February 1,1999* 15.0 15.0 15.0 15.0 15.0 15.0August 1,2003 13.0 13.0 13.0 13.0 13.0 13.0July 1, 2011 20.0 20.0 20.0 20.0 20.0 20.0July 1, 2016 25.0 25.0 25.0 25.0 25.0 25.0-------------------------- ------------------- ------------------- ------------------- ----------------- ------------------- ----------------------*Applies to all other commercial banks excluding Savings & Development Banks which is required to maintain minimum liquidity of not
less than 22 percent of Total Deposits. (See note on Table S3.3)
*Applies to all other commercial banks excluding Savings & Development Banks which is required to maintain minimum liquidity of not less than 22 percent of Total Deposits. (See note on Table S3.3)
Table S 3.2BANK RESERVE REQUIREMENTS
(As percent of Deposits and other Liabilities)
Table S 3.2BANK RESERVE REQUIREMENTS(As percent of Deposits and other Liabilities)
-------------------------- ------------------- ------------------- ------------------- ------------------- ------------------- ---------------------- Minimum Proportion of Total
Effective Required Required Reserves to be held Date Percentage
-------------------------- ------------------- ------------------- ------------------- ------------------- ------------------- ----------------------January 1,1975 3.50% 50%June 1,1975 4.50% 50%September 1,1975 4.50% 50%December 1,1975 5.00% 50%March 1,1976 5.50% 50%July 1,1976 6.00% 50%December 1,1976 6.00% no requirementApril 1,1992 5.00% no requirementJanuary 1, 1994 6.00% no requirementFebruary 1, 1999 4.00% no requirementJuly 1, 2002 3.00% 75%August 1, 2003 2.50% 100%July 1, 2011 6.00% 100%----------------------------------------------------------------------------------------------------------------------------------------
Since 1 July 2011, banks are equired to hold 6% of total deposits and other liabilities
*Since 1 July 2002, banks are required to hold a maximum of 2.5% of their reserves (3% of total deposits and other liabilities)
as vault cash and the balance as deposits at CBS. Effective August 1.2003 vault cash ceased to be an eligible asset for reserve requirement.
at C.B.S
*Since 1 July 2002, banks are required to hold a maximum of 2.5% of their reserves (3% of total deposits and other liabilities) as vault cash and the balance as deposits at CBE. Effective August 1.2003 vault cash ceased to be an eligible asset for reserve requirement.

48 Central Bank of Eswatini Quarterly Review - June 2018
Table S 3.3 BANK LIQUIDITY POSITION
(E’000)Table S 3.3 BANK LIQUIDITY POSITION
(E'000)------------------------- ------------------------- ------------------------- ------------------------- ------------------------- ------------------------- ------------------------- ------------------------- ------------------------- ------------------------- ------------------------- ------------------------- ------------------------- -------------------------
Domestic Liquid Assets Liquidity Surplus------------------------- ------------------------- ------------------------- ------------------------- ------------------------- ------------------------- ------------------------- ------------------------- or Deficiency (-)
Eswatini Government Balances With ------------------------- ------------------------- -------------------------------------------------- ------------------------- ------------------------- ------------------------- Net Due
Total Emalangeni Rand Notes Central Other Other Total From BanksPeriod Covered Notes & Coin and Coins Treasury Eligible Bank of Banks Liquid Liquid Required OutsideEnded Liabilities in Tills in Tills Bills Stock Eswatini (Net) Assets Assets Liquidity Domestic Eswatini Total------------------------- ------------------------- ------------------------- ------------------------- ------------------------- ------------------------- ------------------------- ------------------------- ------------------------- ------------------------- ------------------------- ------------------------- ------------------------- -------------------------2005 3,555,705 99,134 28,777 267,706 41,663 111,414 0 0 548,694 446,329 102,365 290,782 393,1472006 4,182,775 122,533 31,025 331,957 31,001 224,549 0 0 741,065 529,267 211,798 714,998 926,7962007 4,815,093 151,735 28,534 308,173 29,921 282,430 0 56,009 856,802 608,822 247,980 663,091 911,0712008 5,543,244 125,939 51,564 289,423 30,491 320,858 0 144,417 962,692 694,576 268,116 1,216,856 1,484,9722009 7,075,861 167,193 37,953 332,058 28,858 437,259 0 291,355 1,294,676 892,346 402,330 2,142,004 2,544,3342010 7,506,168 201,834 27,574 296,680 250,666 394,901 0 522,480 1,694,135 942,692 751,443 2,001,331 2,752,7742011 7,616,967 169,099 41,244 608,350 324,390 809,053 0 21,667 1,973,803 1,488,872 484,931 597,481 1,082,4122012 8,364,314 209,004 32,679 870,413 316,953 766,229 0 0 2,195,278 1,637,883 557,395 1,447,460 2,004,8552013 9,362,074 204,464 46,575 1,228,780 240,698 815,031 0 0 2,535,548 1,833,982 701,566 789,276 1,490,8422014 10,064,454 303,810 54,368 1,115,425 345,749 953,221 0 0 2,772,573 1,971,729 800,844 655,683 1,456,5272015 12,103,101 368,635 60,768 1,173,436 424,175 1,195,984 0 0 3,222,998 2,381,711 841,287 1,509,980 2,351,2672016 14,612,819 354,239 75,802 1,334,320 725,495 1,638,546 60,499 0 4,188,900 3,606,916 581,984 2,343,966 2,925,9502017 15,608,699 385,313 55,065 1,583,692 766,849 1,501,431 0 0 4,292,350 3,850,172 442,178 2,000,615 2,442,7932010March 7,604,981 130,125 18,340 290,695 27,684 269,504 0 432,993 1,169,341 960,332 209,009 3,011,972 3,220,981June 7,749,147 130,000 16,886 355,011 28,230 302,692 0 447,868 1,280,687 977,889 302,798 2,666,449 2,969,247September 7,769,079 129,229 18,812 368,888 168,423 350,914 0 333,852 1,370,118 978,346 391,772 2,496,815 2,888,587December 7,506,168 201,834 27,574 296,680 250,666 394,901 0 522,480 1,694,135 942,692 751,443 2,001,331 2,752,7742011March 7,428,060 143,138 26,008 509,405 277,457 274,582 0 395,146 1,625,736 933,050 692,686 1,998,758 2,691,444June 7,665,786 128,650 20,729 586,489 281,264 674,846 0 44,661 1,736,639 962,408 774,231 1,431,801 2,206,032September 7,591,473 132,413 26,092 628,883 323,200 546,693 0 0 1,657,281 1,484,039 173,242 913,992 1,087,234December 7,616,967 169,099 41,244 608,350 324,390 809,053 0 21,667 1,973,803 1,488,872 484,931 597,481 1,082,4122012March 7,488,149 128,977 15,647 831,898 324,106 532,514 0 0 1,833,142 1,464,631 368,511 608,950 977,461June 8,041,331 136,248 15,943 993,935 336,312 627,132 0 0 2,109,570 1,574,239 535,331 1,344,715 1,880,046September 8,245,404 142,484 16,046 975,742 335,620 509,261 0 0 1,979,153 1,613,851 365,302 900,673 1,265,975December 8,364,314 209,004 32,679 870,413 316,953 766,229 0 0 2,195,278 1,637,883 557,395 1,447,460 2,004,8552013March 8,439,308 150,395 29,446 1,254,987 318,533 611,889 0 0 2,365,251 1,651,034 714,217 1,710,116 2,424,333June 8,044,249 156,108 32,345 1,342,638 322,234 773,986 0 0 2,627,311 1,572,258 1,055,053 609,863 1,664,916September 9,230,904 175,831 34,821 1,491,681 221,191 760,960 0 0 2,684,484 1,808,701 875,783 499,112 1,374,895December 9,362,074 204,464 46,575 1,228,780 240,698 815,031 0 0 2,535,548 1,833,982 701,566 789,276 1,490,8422014January 9,081,744 174,524 34,413 1,233,569 247,158 646,339 0 0 2,336,003 1,778,487 557,516 731,064 1,288,580February 8,871,833 171,602 31,104 1,192,658 246,826 751,363 0 0 2,393,553 1,737,598 655,955 825,820 1,481,775March 9,265,810 204,223 30,989 1,067,818 232,701 763,854 0 0 2,299,585 1,816,590 482,995 902,223 1,385,218April 9,264,902 194,451 37,477 1,019,322 233,231 740,788 0 0 2,225,269 1,815,023 410,246 1,186,352 1,596,598May 9,352,695 223,560 36,102 1,073,320 215,932 733,814 0 0 2,282,728 1,833,603 449,125 977,253 1,426,378June 9,784,339 226,748 34,999 1,005,655 215,571 783,442 0 0 2,266,415 1,920,227 346,188 1,293,302 1,639,490July 9,318,065 227,268 36,262 988,936 216,323 779,069 0 0 2,247,858 1,826,484 421,374 581,870 1,003,244August 9,362,952 204,193 33,613 843,178 215,918 821,593 0 0 2,118,495 1,835,158 283,337 643,752 927,089September 9,806,571 202,483 41,531 932,022 220,079 679,710 0 0 2,075,825 1,920,859 154,966 987,251 1,142,217October 9,862,376 215,711 36,917 1,046,107 296,551 686,081 0 0 2,281,367 1,932,399 348,968 1,064,233 1,413,201November 10,662,972 222,787 30,868 1,051,044 345,640 974,290 0 0 2,624,629 2,091,876 532,753 1,011,733 1,544,486December 10,064,454 303,810 54,368 1,115,425 345,749 953,221 0 0 2,772,573 1,971,729 800,844 655,683 1,456,5272015January 10,205,949 199,201 47,955 1,082,825 368,076 926,294 0 0 2,624,351 2,000,667 623,684 1,046,330 1,670,014February 9,938,466 179,611 34,831 1,089,609 367,862 760,622 0 0 2,432,535 1,947,849 484,686 811,248 1,295,934March 9,824,033 281,251 37,212 1,002,324 370,156 711,043 0 0 2,401,986 1,925,947 476,039 911,673 1,387,712April 10,287,422 243,148 34,330 1,004,392 366,574 756,397 0 0 2,404,841 2,017,956 386,885 1,580,863 1,967,748May 10,096,036 223,087 30,647 1,084,714 361,121 739,438 0 0 2,439,007 1,979,698 459,309 1,190,940 1,650,249June 10,133,503 256,852 33,145 1,036,649 406,203 774,940 0 0 2,507,789 1,986,708 521,081 678,866 1,199,947July 10,257,708 222,099 34,091 993,978 407,562 699,634 0 0 2,357,364 2,010,419 346,945 1,017,548 1,364,493August 10,923,569 238,346 35,425 909,910 416,207 759,451 0 0 2,359,339 2,143,333 216,006 1,710,506 1,926,512September 11,924,469 256,085 37,950 1,012,068 447,465 914,098 0 0 2,667,666 2,344,148 323,518 2,444,726 2,768,244October 11,212,789 216,341 41,710 1,077,953 479,406 918,682 0 0 2,734,092 2,203,465 530,627 1,454,990 1,985,617November 11,304,178 272,326 39,889 1,200,080 526,291 954,820 0 0 2,993,406 2,220,387 773,019 1,197,559 1,970,578December 12,103,101 368,635 60,768 1,173,436 424,175 1,195,984 0 0 3,222,998 2,381,711 841,287 1,509,980 2,351,2672016January 12,183,703 239,568 43,626 1,098,767 429,543 1,125,241 0 0 2,936,744 2,398,443 538,301 1,879,624 2,417,925February 11,935,620 274,114 37,611 1,060,240 498,797 849,462 0 0 2,720,224 2,349,095 371,129 1,545,854 1,916,983March 11,270,574 285,897 43,789 1,066,653 499,249 1,059,993 0 0 2,955,580 2,216,467 739,113 1,318,110 2,057,223April 12,153,052 261,456 43,299 1,124,456 496,264 1,373,683 0 0 3,299,158 2,393,089 906,069 1,411,334 2,317,402May 11,906,055 313,982 36,806 1,166,506 490,062 978,481 0 0 2,985,836 2,343,582 642,254 1,273,655 1,915,909June 11,851,891 293,876 86,332 1,297,490 515,248 966,813 0 0 3,159,759 2,333,011 826,748 944,000 1,770,748July 12,360,913 286,205 45,740 1,368,984 517,241 971,061 0 0 3,189,231 3,049,136 140,095 1,318,551 1,458,646August 13,340,736 369,696 41,437 1,602,541 560,212 1,024,897 0 0 3,598,784 3,293,537 305,247 2,081,692 2,386,939September 12,933,822 310,368 46,289 1,601,331 567,602 1,224,309 0 0 3,749,899 3,189,665 560,233 1,285,134 1,845,367October 12,849,152 262,976 44,475 1,487,513 585,700 1,205,160 60,178 0 3,646,001 3,164,491 481,510 996,897 1,478,407November 13,978,797 290,489 45,332 1,448,935 582,233 1,171,081 60,565 (0) 3,598,636 3,445,227 153,409 1,987,428 2,140,837December 14,612,819 354,239 75,802 1,334,320 725,495 1,638,546 60,499 0 4,188,900 3,606,916 581,984 2,343,966 2,925,9502017January 12,917,661 260,169 48,219 1,396,993 729,104 1,304,012 41,018 0 3,779,515 3,186,045 593,470 1,488,596 2,082,066February 12,930,049 271,301 36,833 1,404,136 733,988 968,330 41,474 0 3,456,062 3,187,888 268,174 1,810,592 2,078,766March 12,154,255 267,681 46,970 1,388,420 735,207 987,190 41,474 0 3,466,942 2,993,825 473,117 999,063 1,472,180April 13,106,805 337,816 57,578 1,377,001 734,897 1,439,686 22,023 0 3,969,001 3,231,313 737,689 1,096,703 1,834,392May 13,707,620 355,859 45,854 1,400,562 729,598 1,620,039 121,932 0 4,273,843 3,374,583 899,260 1,624,823 2,524,083June 14,301,014 271,826 38,385 1,329,615 723,692 1,241,425 52,497 0 3,657,439 3,522,704 134,736 2,535,959 2,670,695July 14,388,938 323,801 45,260 1,212,595 759,714 1,586,307 52,890 0 3,980,568 3,544,218 436,349 2,262,473 2,698,823August 15,183,564 345,140 46,106 1,628,547 762,310 1,710,538 53,834 0 4,546,476 3,743,920 802,555 2,607,642 3,410,197September 15,437,372 275,555 45,287 1,798,110 764,425 1,523,295 14,004 0 4,420,676 3,808,201 612,475 2,078,387 2,690,862October 15,182,286 301,895 52,975 1,880,153 770,597 1,370,321 0 0 4,375,941 3,742,502 633,438 2,166,976 2,800,414November 16,196,048 249,738 43,548 1,621,573 770,375 1,735,310 0 0 4,420,544 3,996,752 423,792 2,627,873 3,051,665December 15,608,699 385,313 55,065 1,583,692 766,849 1,501,431 0 0 4,292,350 3,850,172 442,178 2,000,615 2,442,7932018January 16,162,491 271,826 48,565 1,844,424 757,782 1,667,459 0 0 4,590,057 3,990,118 599,939 2,489,027 3,088,966February 15,933,871 286,271 43,712 1,767,457 769,601 1,580,664 0 0 4,447,705 3,931,673 516,032 2,355,998 2,872,030March 15,440,579 354,101 51,511 1,829,759 768,055 1,340,136 0 0 4,343,562 3,809,260 534,302 2,016,206 2,550,507April 15,628,034 307,816 51,525 1,567,668 768,165 1,417,045 0 0 4,112,219 3,855,654 256,565 2,557,195 2,813,759May 15,353,130 287,193 50,123 1,799,421 783,066 1,569,662 0 0 4,489,465 3,785,696 703,769 1,780,863 2,484,632June 15,565,103 279,711 48,542 1,721,023 774,171 1,574,311 0 0 4,397,759 3,838,332 559,427 1,750,373 2,309,800ChangeOver 12 Months 1,264,089 7,885 10,158 391,408 50,480 332,886 (52,497) 0 740,319 315,628 424,691 (785,586) (360,895)------------------------- ------------------------- ------------------------- ------------------------- ------------------------- ------------------------- ------------------------- ------------------------- ------------------------- ------------------------- ------------------------- ------------------------- ------------------------- -------------------------Total Covered Liabilities- include Domestic Liabilities less deposits pledged as security for loans. Effective November 1997, CBS broadened the liquid assets base to unclude rand currency held by banks.
Effective July 2016, the three banks were required to maintain liquid assets amounting to 25% of domestic liabilities to the public whilst the Swazi Bank maintains 22%
Prior to March 1999,the liability for which liquidity is required only constituted domestic deposits, however, effective March 1999, it was broadened to also included other domestic liabilities.Effective August 2003, the three banks were required to maintain liquid assets amounting to 13% of domestic liabilities to the public whilst the Swazi Bank maintains 10%Effective July 2011, the three banks were required to maintain liquid assets amounting to 20% of domestic liabilities to the public whilst the Swazi Bank maintains 17%

49Central Bank of Eswatini Quarterly Review - June 2018
Table S 3.4RESERVE REQUIREMENT POSITION OF THE BANKS
(E’000)Table S 3.4RESERVE REQUIREMENT POSITION OF THE BANKS
(E'000)------------------------------ ------------------------------ ------------------------------ ------------------------------ ------------------------------ ------------------------------ ------------------------------
Actual Reserve Assets Total Domestic ------------------------------ ------------------------------ ------------------------------
Period Liabilities Average Cash Deposits Total Required Surplus orEnded to Public Holdings at C.B.S. Reserves Reserves Deficiency (-)------------------------------ ------------------------------ ------------------------------ ------------------------------ ------------------------------ ------------------------------ ------------------------------2005 3,315,424 0 92,473 92,473 82,886 9,5872006 4,629,626 0 131,047 131,047 115,741 15,3062007 4,896,788 0 158,601 158,601 124,981 33,6202008 5,574,356 0 161,419 161,419 140,630 20,7892009 6,736,671 0 188,835 188,835 168,417 20,4182010 6,938,618 0 196,813 196,813 173,465 23,3482011 6,400,278 0 576,841 576,841 384,017 192,8242012 8,364,474 0 569,098 569,098 499,217 69,8812013 8,692,899 0 648,100 648,100 521,574 126,5262014 9,999,394 0 662,055 662,055 599,964 62,0912015 11,503,964 0 785,825 785,825 690,237 95,5882016 12,326,035 0 816,655 816,655 734,042 82,6132017 15,104,289 0 961,265 961,265 904,402 56,8632010March 6,104,915 0 192,322 192,322 152,623 39,699June 7,512,922 0 205,074 205,074 187,823 17,251September 7,102,552 0 203,262 203,262 177,564 25,698December 6,938,618 0 196,813 196,813 173,465 23,3482011March 6,527,847 0 173,950 173,950 163,196 10,754June 6,884,136 0 185,090 185,090 172,103 12,987September 7,369,907 0 475,028 475,028 442,194 32,834December 6,400,278 0 576,841 576,841 384,017 192,8242012March 7,552,749 0 477,201 477,201 453,165 24,036June 7,617,369 0 495,771 495,771 457,042 38,729September 7,626,529 0 495,190 495,190 457,592 37,597December 8,364,474 0 569,098 569,098 501,868 69,8812013March 8,537,596 0 574,766 574,766 512,256 62,510June 8,441,240 0 692,406 692,406 506,474 185,932September 9,484,929 0 733,392 733,392 569,096 164,296December 8,692,899 0 648,100 648,100 521,574 126,5262014January 8,469,486 0 578,723 578,723 508,169 70,554February 8,839,738 0 582,537 582,537 530,384 52,153March 8,883,940 0 591,874 591,874 533,036 58,838April 9,011,093 0 600,428 600,428 540,666 59,762May 9,120,832 0 594,495 594,495 547,250 47,245June 9,789,628 0 610,631 610,631 587,378 23,253July 9,165,390 0 612,787 612,787 549,923 62,864August 9,021,640 0 600,126 600,126 541,298 58,828September 9,257,855 0 625,087 625,087 555,471 69,616October 9,338,102 0 626,913 626,913 560,286 66,627November 9,502,497 0 588,334 588,334 570,150 18,184December 9,999,394 0 662,055 662,055 599,964 62,0912015January 9,745,606 0 635,765 635,765 584,736 51,029February 9,569,369 0 614,093 614,093 574,162 39,931March 9,705,661 0 626,142 626,142 582,340 43,802April 9,710,624 0 640,187 640,187 582,637 57,550May 10,030,548 0 634,909 634,909 601,833 33,076June 9,959,977 0 639,426 639,426 597,599 41,827July 10,068,723 0 639,830 639,830 604,123 35,707August 10,143,418 0 638,006 638,006 608,605 29,401September 10,958,719 0 695,261 695,261 657,523 37,738October 11,269,361 0 728,589 728,589 676,162 52,427November 11,054,340 0 740,485 740,485 663,260 77,225December 11,503,964 0 785,825 785,825 690,237 95,5882016January 11,957,694 0 772,890 772,890 710,224 62,666February 11,877,275 0 800,578 800,578 751,789 48,789March 11,344,727 0 734,086 734,086 680,683 53,403April 11,513,117 0 771,423 771,423 685,345 86,078May 11,510,720 0 795,174 795,174 683,717 111,457June 11,365,773 0 763,975 763,975 687,750 76,225July 11,397,549 0 730,878 730,878 681,563 49,315August 11,674,413 0 748,216 748,216 697,115 51,101September 13,528,714 0 853,224 853,224 804,640 48,584October 11,945,245 0 763,868 763,868 713,143 50,725November 11,856,793 0 758,053 758,053 704,684 53,369December 12,326,035 0 816,655 816,655 734,042 82,6132017January 12,993,128 0 880,504 880,504 779,588 100,916February 11,984,453 0 766,141 766,141 713,533 52,608March 12,093,872 0 760,268 760,268 721,332 38,936April 12,113,047 0 768,455 768,455 723,063 45,392May 12,511,605 0 799,519 799,519 744,902 54,617June 13,414,969 0 854,191 854,191 799,615 54,576July 13,463,154 0 879,660 879,660 802,795 76,865August 13,916,844 0 884,913 884,913 831,189 53,724September 14,021,079 0 879,301 879,301 837,330 41,971October 14,236,118 0 900,113 900,113 852,014 48,099November 14,863,941 0 980,642 980,642 889,382 91,260December 15,104,289 0 961,265 961,265 904,402 56,8632018January 15,104,289 0 961,265 961,265 904,402 56,863February 14,624,126 0 928,029 928,029 875,586 52,443March 14,120,646 0 921,283 921,283 844,945 76,338April 14,120,646 0 921,283 921,283 844,945 76,338May 14,464,561 0 941,594 941,594 865,406 76,188June 14,192,324 0 901,637 901,637 849,082 52,555ChangeOver 12 Months 777,355 0 47,446 47,446 49,467 (2,021)------------------------------ ------------------------------ ------------------------------ ------------------------------ ------------------------------ ------------------------------ ------------------------------Banks were required to hold reserves totalling 6% of their liabilities to the public. The requirement has since been changed to 5% beginning 1st of April 1992.
Effective July 2011, the Reserve Requirement was revised up to 6%
reduced to 3 % of total domestic liabilities on July 1,2002. In August 1, 2003, the reserve requirement was revised down to 2.5 % of total domestic liabilities and average cash holdings ceased to be an eligible asset for reserve requirement.
The reserves consist of cash holdings plus deposits with the Central Bank of Eswatini at call on the reserve account. The requirement has been changed back to 6% effective 1st January 1994. Effective February 1,1999, the reserve requirement was revised down to 4% and further

50 Central Bank of Eswatini Quarterly Review - June 2018
Table S 3.5ASSETS OF OTHER DEPOSITORY CORPORATIONS (BANKS AND BUILDING SOCIETY)
(E’000)Table S 3.5ASSETS OF OTHER DEPOSITORY CORPORATIONS (BANKS AND BUILDING SOCIETY)
(E'000)------------------- ------------------------ ------------------------ ------------------------ ------------------------ ------------------------ ------------------------ ------------------------ ------------------------ ------------------------ ------------------------ ------------------------ ------------------------
Balance Held With------------------------ ------------------------ ------------------------
Central Other Banks Other FixedPeriod Notes & Bank of Banks in Outside Loans & Govt. Financial C.B.S. Bills Uncleared & other TotalEnded Coins Eswatini Eswatini Eswatini Advances Securities Investment Bills* Receivable Effects Assets Assets------------------- ------------------------ ------------------------ ------------------------ ------------------------ ------------------------ ------------------------ ------------------------ ------------------------ ------------------------ ------------------------ ------------------------ ------------------------2005 135,058 112,480 74,423 352,439 4,083,130 309,369 104,766 0 62 82,053 202,426 5,456,2062006 160,292 225,615 97,907 830,766 4,316,124 362,958 39,488 0 0 100,179 276,132 6,409,4612007 190,486 283,664 91,297 721,041 5,251,883 338,094 17,158 56,009 0 75,953 271,305 7,296,8902008 192,680 328,265 58,119 1,414,604 5,629,665 319,914 112,691 144,417 0 90,154 364,616 8,655,1252009 220,282 441,541 98,459 2,159,782 6,389,756 360,916 109,737 291,355 0 58,853 410,104 10,540,7852010 244,059 397,020 45,513 2,160,391 6,486,030 606,368 391,603 522,480 0 33,526 390,178 11,277,1682011 228,519 817,654 21,632 1,570,204 8,175,432 1,001,858 91,287 21,667 0 55,198 360,333 12,343,7842012 281,127 766,229 59,319 2,052,036 7,943,270 1,296,165 99,400 0 0 60,289 418,698 12,976,5332013 282,610 822,523 42,645 1,797,388 9,606,602 1,679,810 132,449 0 0 21,669 612,861 14,998,5572014 402,905 953,221 112,471 1,359,579 10,580,089 1,582,884 277,585 0 0 64,747 571,850 15,905,3312015 482,275 1,200,332 122,343 2,163,072 11,067,200 1,735,490 343,756 0 0 11,173 843,490 17,969,1312016 491,429 1,641,901 148,413 2,805,236 12,187,920 2,222,099 827,687 0 0 8,941 1,059,342 21,392,9662017 512,940 1,501,796 74,337 2,400,749 12,850,448 2,538,715 1,323,786 0 0 9,568 1,574,455 22,786,7932010March 160,311 272,627 74,897 3,136,791 5,998,946 318,379 131,931 432,993 0 45,623 434,232 11,006,730June 160,958 304,948 64,782 2,772,862 6,188,224 383,241 474,890 447,868 0 45,992 379,959 11,223,724September 158,511 359,164 83,334 2,684,598 6,311,149 537,311 524,912 333,852 0 35,231 372,109 11,400,171December 244,059 397,020 45,513 2,160,391 6,486,030 606,368 391,603 522,480 0 33,526 390,178 11,277,1682011March 181,848 280,548 50,403 2,107,557 6,454,927 850,414 460,929 395,146 0 45,119 385,708 11,212,599June 162,337 685,781 88,733 2,334,196 7,325,516 966,422 100,852 44,661 0 40,824 455,317 12,204,639September 175,437 548,421 19,880 1,682,898 8,132,817 1,021,201 77,067 0 0 46,684 336,849 12,041,254December 228,519 817,654 21,632 1,570,204 8,175,432 1,001,858 91,287 21,667 0 55,198 360,333 12,343,7842012March 166,371 536,963 28,576 1,412,256 8,124,892 1,225,122 92,178 0 0 142,339 407,009 12,135,706June 177,338 631,349 58,572 1,797,005 7,688,167 1,399,602 87,959 0 0 172,346 454,777 12,467,115September 185,070 513,733 47,224 1,407,109 8,178,252 1,420,091 144,230 0 0 260,816 528,133 12,684,658December 281,127 766,229 59,319 2,052,036 7,943,270 1,296,165 99,400 0 0 60,289 418,698 12,976,5332013March 199,429 618,380 45,574 2,091,038 7,942,909 1,730,005 182,859 0 0 81,114 532,069 13,423,377June 210,673 779,754 59,562 1,491,231 8,435,439 1,825,946 88,288 0 0 155,223 546,216 13,592,332September 238,836 767,369 48,228 1,228,519 8,926,042 1,891,097 379,460 0 0 118,890 569,632 14,168,073December 282,610 822,523 42,645 1,797,388 9,606,602 1,679,810 132,449 0 0 21,669 612,861 14,998,5572014January 233,770 651,628 30,717 1,399,119 9,485,290 1,697,578 130,793 0 0 37,904 604,354 14,271,153February 232,657 754,968 33,145 1,441,231 9,398,145 1,645,274 151,270 0 0 31,624 554,182 14,242,496March 265,612 763,898 49,258 1,323,693 9,625,573 1,495,827 141,778 0 0 53,065 562,011 14,280,715April 258,684 743,893 61,192 1,689,052 9,578,032 1,448,351 142,310 0 0 29,153 582,466 14,533,133May 283,943 737,462 47,135 1,459,757 9,908,981 1,462,066 198,070 0 0 94,470 594,657 14,786,541June 283,952 783,442 84,074 1,654,439 9,857,924 1,389,311 202,934 0 0 84,735 727,900 15,068,711July 292,531 791,438 41,756 1,196,125 10,270,954 1,373,347 175,475 0 0 22,328 784,680 14,948,634August 265,265 825,013 42,065 1,509,689 10,400,355 1,220,896 192,132 0 0 57,072 883,930 15,396,417September 278,129 681,179 77,335 1,884,204 10,407,311 1,299,124 172,970 0 0 32,154 853,268 15,685,674October 280,176 686,950 79,074 2,169,585 10,225,520 1,484,655 268,695 0 0 65,397 747,617 16,007,669November 279,509 974,290 106,303 1,685,809 10,444,164 1,503,604 274,736 0 0 281,524 785,961 16,335,900December 402,905 953,221 112,471 1,359,579 10,580,089 1,582,884 277,585 0 0 64,747 571,850 15,905,3312015January 278,377 934,079 81,698 1,565,200 10,469,902 1,581,171 293,619 0 0 76,321 603,665 15,884,032February 246,383 765,716 66,425 1,322,531 10,622,413 1,594,604 294,273 0 0 56,690 590,502 15,559,537March 353,121 717,996 149,274 1,237,968 10,444,998 1,504,499 254,827 0 0 79,272 571,066 15,313,021April 319,026 759,617 155,161 2,106,193 10,438,319 1,502,997 252,105 0 0 80,610 591,055 16,205,083May 287,889 743,262 135,364 1,788,464 10,629,420 1,577,878 258,157 0 0 118,297 628,843 16,167,574June 323,607 780,961 180,153 1,294,398 10,824,121 1,595,315 499,846 0 0 25,201 640,597 16,164,199July 292,347 700,374 139,579 1,770,449 10,747,359 1,553,964 585,666 0 0 58,060 606,648 16,454,446August 301,181 759,667 119,212 2,250,453 10,941,560 1,464,026 323,247 0 0 39,590 705,004 16,903,940September 325,965 915,997 118,972 2,592,356 10,963,210 1,597,454 226,259 0 0 88,542 810,234 17,638,989October 284,567 923,824 128,643 1,889,704 11,258,999 1,695,293 215,901 0 0 25,143 724,542 17,146,616November 342,852 959,028 135,396 1,746,992 11,087,836 1,864,244 352,834 0 0 (1,044) 802,332 17,290,470December 482,275 1,200,332 122,343 2,163,072 11,067,200 1,735,490 343,756 0 0 11,173 843,490 17,969,1312016January 316,784 1,127,460 126,778 2,223,400 11,110,391 1,642,966 463,764 0 0 10,766 790,411 17,812,719February 348,412 849,598 114,039 2,005,684 11,037,623 1,658,930 592,556 0 0 43,027 1,040,818 17,690,687March 366,210 1,064,609 56,838 2,338,668 10,995,884 1,665,801 643,901 0 0 10,216 700,381 17,842,507April 339,454 1,380,909 37,136 2,886,223 10,955,307 1,727,415 752,526 0 0 9,828 1,149,342 19,238,139May 397,661 979,899 45,918 2,159,513 11,188,607 1,792,530 796,509 0 0 0 1,162,581 18,523,218June 425,111 974,056 30,373 1,982,904 11,346,235 1,917,085 531,341 0 0 251 1,523,037 18,730,393July 372,109 972,412 69,773 1,986,417 11,819,545 1,993,507 580,185 0 0 32,081 1,151,656 18,977,683August 456,643 1,029,592 85,471 2,470,768 11,750,114 2,270,143 576,430 0 0 2,618 1,130,753 19,772,532September 394,641 1,227,863 70,733 1,686,176 11,845,773 2,276,325 563,906 0 0 251 1,309,268 19,374,935October 346,465 1,214,317 124,085 1,719,746 11,916,654 2,195,321 852,088 0 0 737 1,441,040 19,810,453November 390,039 1,176,167 132,768 2,419,634 12,362,643 2,143,453 845,189 0 0 2,019 1,250,901 20,722,812December 491,429 1,641,901 148,413 2,805,236 12,187,920 2,222,099 827,687 0 0 8,941 1,059,342 21,392,9662017January 357,205 1,304,012 99,450 2,067,716 11,888,772 2,288,384 591,733 0 0 10,619 1,210,396 19,818,287February 357,148 975,478 113,117 1,953,355 12,002,523 2,300,411 626,375 0 0 14,403 1,149,664 19,492,474March 348,427 993,617 107,750 1,239,339 11,874,596 2,285,914 625,977 0 0 19,463 1,262,080 18,757,163April 438,003 1,450,069 99,692 1,485,772 11,876,159 2,301,095 724,672 0 0 11,429 1,380,757 19,767,647May 452,267 1,626,660 253,431 2,082,726 12,041,271 2,319,893 713,607 0 0 59,642 1,278,167 20,827,664June 352,227 1,241,847 169,856 2,818,479 12,301,098 2,233,044 771,785 0 0 6,387 1,374,275 21,268,999July 417,279 1,602,164 165,595 2,691,445 12,459,607 2,152,046 689,972 0 0 244 1,230,627 21,408,979August 440,279 1,717,958 163,014 2,807,873 12,575,062 2,561,012 403,969 0 0 18,796 1,124,899 21,812,862September 377,520 1,527,781 85,880 2,120,939 13,299,742 2,737,130 433,974 0 0 126,385 1,308,780 22,018,131October 422,442 1,373,454 88,030 2,348,727 13,022,120 2,839,132 485,145 0 0 14,573 1,417,378 22,011,000November 361,705 1,742,640 76,926 2,807,051 13,257,744 2,580,121 576,826 0 0 178,703 1,577,458 23,159,173December 512,940 1,501,796 74,337 2,400,749 12,850,448 2,538,715 1,323,786 0 0 9,568 1,574,455 22,786,7932018January 380,784 1,667,566 52,336 2,853,212 13,434,360 2,790,379 566,225 0 0 105,498 1,422,582 23,272,941February 379,432 1,589,798 35,050 2,600,019 13,325,958 2,739,648 613,030 0 0 0 1,650,463 22,933,397March 458,220 1,346,318 28,483 2,261,847 13,174,961 2,800,404 641,392 0 0 151,906 1,593,397 22,456,927April 412,804 1,424,757 46,884 2,952,175 13,441,798 2,538,423 638,950 0 0 32,908 1,429,179 22,917,878May 382,255 1,578,301 41,764 2,118,894 13,461,795 2,785,086 706,278 0 0 3,272 1,466,216 22,543,859June 394,045 1,582,432 56,103 2,012,670 13,766,352 2,707,776 695,611 0 0 1,566 1,593,059 22,809,612ChangeOver 12 Months 41,817 340,585 (113,753) (805,810) 1,465,253 474,732 (76,175) 0 0 (4,821) 218,785 1,540,614------------------- ------------------------ ------------------------ ------------------------ ------------------------ ------------------------ ------------------------ ------------------------ ------------------------ ------------------------ ------------------------ ------------------------ ------------------------ASSETS OF BANKS AND THE BUILDING SOCIETY(SBS) IN ESWATINI: EBS DATA IS INCLUDED FROM DECEMBER 2003.NOTES AND COINS - Include emalangeni and rand cash holdings as well as other (foreign) currency.GOVERNMENT SECURITIES - Treasury bills, stocks and bonds issued by the Government of Eswatini.OTHER FINANCIAL INVESTMENT - Includes banks' financial investments in other securities and money market funds locally and abroad as they emerge from time to time. Includes shares, debentures, bonds, unit trusts, liquidity absorption certificates etc .BILLS RECEIVABLE - Include the aggregate of notes, acceptances and domestic or foreign bills of exchange purchased or discounted for customers.

51Central Bank of Eswatini Quarterly Review - June 2018
Table S 3.6LIABILITIES OF OTHER DEPOSITORY CORPORATIONS (BANKS AND BUILDING SOCIETY)
(E’000)Table S 3.6LIABILITIES OF OTHER DEPOSITORY CORPORATIONS (BANKS AND BUILDING SOCIETY)
(E'000)------------------------- --------------------------- --------------------------- --------------------------- --------------------------- --------------------------- --------------------------- --------------------------- --------------------------- --------------------------- --------------------------- --------------------------- --------------------------- ---------------------------
Balance due toResident Deposits Non- ---------------------- ---------------------- ---------------------- Capital
Period ---------------------- ---------------------- ---------------------- ---------------------- Resident Banks in Foreign Bills and Other Total ContraEnded Demand Savings Time Total Deposits C.B.S# Eswatini Banks Payable Reserves Liabilities Liabilities Accounts--------------------- ---------------------- ---------------------- ---------------------- ---------------------- ---------------------- ---------------------- ---------------------- ---------------------- ---------------------- ---------------------- ---------------------- ---------------------- ----------------------2005 1,051,614 962,439 1,718,350 3,732,403 8,987 0 29,533 61,657 15,256 1,209,652 398,718 5,456,206 805,5572006 1,107,350 1,013,246 2,031,392 4,151,988 8,421 20,000 100,856 115,768 28,642 1,386,823 596,963 6,409,461 775,2022007 1,426,353 1,033,766 2,737,004 5,197,123 10,077 0 95,803 57,950 20,146 1,562,933 352,858 7,296,890 1,056,8392008 1,718,456 1,166,246 3,314,549 6,199,251 27,864 0 61,366 197,748 13,559 1,705,373 449,964 8,655,125 2,257,1302009 2,009,977 1,226,354 4,639,330 7,875,661 26,850 0 102,191 17,778 15,572 1,852,151 650,582 10,540,785 1,513,6412010 2,182,511 1,292,201 5,006,500 8,481,212 27,003 0 49,658 159,060 16,546 1,911,486 632,203 11,277,168 2,168,2952011 2,629,031 1,309,909 4,566,983 8,505,923 20,252 0 30,828 972,723 13,079 2,058,560 742,419 12,343,784 2,679,3572012 3,014,463 1,381,173 4,860,413 9,256,049 25,129 1,417 51,075 604,576 9,527 2,167,280 847,495 12,962,548 2,840,7352013 3,903,033 1,560,284 5,194,149 10,657,466 34,211 0 20,769 1,008,112 8,798 2,454,557 780,278 14,964,191 3,621,9772014 3,718,486 1,642,804 6,044,209 11,405,499 34,577 0 127,191 703,896 7,400 2,866,480 760,288 15,905,331 3,317,7232015 4,223,591 1,646,382 7,260,352 13,130,325 36,340 0 129,654 653,092 4,828 3,155,614 859,278 17,969,131 4,228,0862016 5,472,842 1,829,318 8,894,413 16,196,572 36,018 0 53,354 461,270 5,338 3,732,724 907,691 21,392,966 3,098,3272017 5,079,193 1,704,293 10,075,346 16,858,832 37,711 0 82,479 400,134 8,506 4,063,164 1,335,967 22,786,793 3,244,7962010March 1,845,906 1,182,951 4,999,649 8,028,506 26,835 0 79,531 124,819 18,618 1,737,218 991,203 11,006,730 1,960,138June 2,026,055 1,234,880 5,247,877 8,508,812 27,845 0 67,452 106,413 23,342 1,789,266 700,594 11,223,724 2,029,216September 1,930,226 1,256,672 5,377,980 8,564,878 26,079 0 83,821 187,783 11,998 1,851,930 673,682 11,400,171 2,758,365December 2,182,511 1,292,201 5,006,500 8,481,212 27,003 0 49,658 159,060 16,546 1,911,486 632,203 11,277,168 2,168,2952011March 1,960,342 1,246,763 5,162,546 8,369,651 24,692 35,005 69,352 108,799 15,820 1,876,177 713,103 11,212,599 2,863,809June 2,149,271 1,274,592 5,055,202 8,479,065 24,223 0 58,503 902,395 15,187 1,956,069 769,197 12,204,639 2,988,723September 2,557,146 1,286,043 4,595,377 8,438,566 22,229 0 26,361 768,906 10,672 2,003,368 771,152 12,041,254 3,285,750December 2,629,031 1,309,909 4,566,983 8,505,923 20,252 0 30,828 972,723 13,079 2,058,560 742,419 12,343,784 2,679,3572012March 2,561,672 1,280,620 4,618,760 8,461,052 25,365 4,286 34,946 803,306 15,141 2,110,992 680,618 12,135,706 2,524,691June 2,799,632 1,348,723 4,614,481 8,762,836 25,139 0 64,709 452,290 8,778 2,181,029 972,334 12,467,115 3,092,701September 2,995,411 1,369,018 4,596,708 8,961,137 29,610 2,001 73,708 506,436 7,606 2,112,670 991,490 12,684,658 2,749,659December 3,014,463 1,381,173 4,860,413 9,256,049 25,129 1,417 65,060 604,576 9,527 2,167,280 847,495 12,976,533 2,840,7352013March 3,119,668 1,368,720 5,258,479 9,746,867 28,118 45,024 47,964 380,922 8,211 2,283,767 882,505 13,423,377 4,576,114June 2,913,550 1,451,883 5,013,666 9,379,099 29,451 8,133 63,945 881,368 8,987 2,293,101 928,248 13,592,332 5,485,852September 3,311,290 1,480,579 5,356,289 10,148,158 37,299 0 45,264 729,407 8,574 2,345,308 854,064 14,168,073 6,234,029December 3,903,033 1,560,284 5,194,149 10,657,466 34,211 0 55,135 1,008,112 8,798 2,454,557 780,278 14,998,557 3,621,9772014January 3,181,092 1,520,920 5,418,413 10,120,425 32,464 45,000 42,036 668,055 11,170 2,495,287 856,716 14,271,153 4,810,512February 3,122,391 1,502,442 5,564,540 10,189,373 33,511 0 37,392 615,411 9,106 2,530,845 826,858 14,242,496 4,731,776March 3,359,397 1,497,465 5,438,114 10,294,976 33,511 0 83,437 421,470 7,386 2,575,200 864,735 14,280,715 4,270,638April 3,536,276 1,558,442 5,271,182 10,365,900 70,198 10,001 66,909 502,700 9,293 2,614,586 893,546 14,533,133 3,927,569May 3,261,812 1,556,802 5,707,928 10,526,542 70,487 40,000 66,911 482,504 8,557 2,674,899 916,641 14,786,541 2,422,379June 3,454,194 1,548,101 5,991,365 10,993,660 71,098 74,827 91,518 361,137 6,974 2,681,330 788,167 15,068,711 3,771,521July 3,298,203 1,575,001 5,743,793 10,616,997 72,703 0 49,145 614,255 8,802 2,755,642 831,090 14,948,634 3,781,222August 3,440,019 1,594,849 5,743,238 10,778,106 70,032 0 26,304 865,937 5,760 2,910,923 739,355 15,396,417 3,606,659September 3,568,775 1,587,620 5,737,366 10,893,761 40,958 0 46,848 896,953 5,156 2,840,233 961,765 15,685,674 3,822,366October 3,283,125 1,614,524 6,100,132 10,997,781 41,475 30,000 46,099 1,105,352 6,205 2,795,032 985,725 16,007,669 2,626,186November 3,611,503 1,590,819 6,186,936 11,389,258 36,590 1,649 65,294 674,076 8,651 2,846,944 1,313,438 16,335,900 3,633,424December 3,718,486 1,642,804 6,044,209 11,405,499 34,577 0 127,191 703,896 7,400 2,866,480 760,288 15,905,331 3,317,7232015January 3,570,879 1,567,703 6,195,870 11,334,452 34,212 109,000 90,222 518,870 9,233 2,917,149 870,894 15,884,032 3,458,916February 3,561,192 1,585,348 5,955,409 11,101,949 33,066 0 74,044 511,283 15,732 2,959,364 864,099 15,559,537 2,697,939March 3,612,395 1,586,866 5,764,803 10,964,064 33,940 0 111,998 326,295 8,210 3,014,048 854,466 15,313,021 3,743,684April 3,892,638 1,641,552 6,152,306 11,686,496 32,162 0 141,928 525,330 13,846 3,054,754 750,567 16,205,083 3,460,485May 3,707,861 1,636,297 6,039,897 11,384,055 31,476 0 145,333 597,524 13,931 3,078,715 916,540 16,167,574 4,259,523June 3,768,250 1,628,316 6,209,675 11,606,241 34,508 0 136,848 615,532 10,841 3,044,735 715,494 16,164,199 4,210,153July 3,621,301 1,691,524 6,320,885 11,633,710 37,085 0 143,568 752,901 15,613 3,109,649 761,920 16,454,446 4,410,090August 4,044,200 1,638,119 6,579,117 12,261,436 34,896 0 96,408 539,947 16,982 3,159,759 794,512 16,903,940 4,454,413September 4,002,777 1,663,134 7,317,367 12,983,278 34,442 0 96,436 147,630 16,308 3,214,960 1,145,935 17,638,989 3,977,749October 3,850,166 1,657,546 7,037,819 12,545,531 34,232 0 132,607 434,714 13,211 3,204,230 782,091 17,146,616 4,080,914November 3,890,159 1,658,079 7,006,184 12,554,422 35,744 0 152,233 549,433 0 3,148,536 843,110 17,283,479 4,080,914December 4,223,591 1,646,382 7,260,352 13,130,325 36,340 0 129,654 653,092 4,828 3,155,614 859,278 17,969,131 4,228,0862016January 4,093,470 1,581,108 7,569,800 13,244,378 35,115 0 134,989 343,776 8,905 3,196,657 848,901 17,812,719 3,586,078February 3,867,423 1,591,779 7,385,461 12,844,664 34,921 0 140,175 459,829 10,368 3,268,569 932,161 17,690,687 4,053,452March 3,584,322 1,600,200 7,312,995 12,497,516 34,061 0 111,346 1,020,558 5,054 3,313,212 860,760 17,842,507 4,407,978April 3,974,120 1,634,917 7,377,226 12,986,262 38,166 0 45,387 1,474,889 5,723 3,357,484 1,330,228 19,238,139 3,973,379May 4,068,855 1,691,248 7,483,718 13,243,821 37,680 0 61,267 885,858 9,871 3,400,490 884,231 18,523,218 3,389,074June 3,701,928 1,724,042 7,761,654 13,187,624 28,727 0 35,556 1,038,904 6,784 3,446,110 986,688 18,730,393 3,562,466July 3,882,830 1,769,448 8,174,863 13,827,142 27,655 0 74,454 667,865 6,264 3,526,374 847,929 18,977,683 3,540,820August 4,332,376 1,812,409 8,535,814 14,680,599 28,794 0 94,328 389,076 4,229 3,580,381 995,124 19,772,532 3,888,157September 4,195,990 1,819,387 8,055,605 14,070,983 33,054 0 41,713 401,042 4,371 3,627,313 1,196,460 19,374,935 3,702,675October 4,335,010 1,820,578 8,024,566 14,180,154 30,203 35,011 73,546 722,849 6,669 3,680,579 1,081,442 19,810,453 2,984,461November 4,511,003 1,813,893 9,141,464 15,466,360 31,612 0 82,023 432,206 5,314 3,710,420 994,880 20,722,814 3,114,765December 5,472,842 1,829,318 8,894,413 16,196,572 36,018 0 53,354 461,270 5,338 3,732,724 907,691 21,392,966 3,098,3272017January 4,512,028 1,760,333 8,372,373 14,644,734 32,067 914 89,494 579,120 3,528 3,780,767 687,663 19,818,287 3,445,246February 4,453,824 1,743,565 8,374,253 14,571,642 30,786 0 73,347 142,763 6,663 3,748,587 918,686 19,492,474 3,285,955March 4,128,894 1,780,385 7,856,458 13,765,737 53,647 0 70,834 240,276 18,059 3,748,594 860,017 18,757,163 3,155,353April 4,549,681 1,748,285 7,947,012 14,244,978 32,054 0 83,317 389,069 10,606 3,714,583 1,293,040 19,767,647 3,347,037May 4,635,504 1,792,051 8,658,280 15,085,836 30,045 0 136,038 457,903 10,055 3,842,131 1,265,656 20,827,664 3,354,289June 5,015,763 1,754,104 9,195,105 15,964,971 33,351 45,013 129,174 282,520 8,910 3,741,001 1,064,058 21,268,999 3,239,561July 4,697,152 1,618,091 9,687,027 16,002,271 35,718 0 120,914 428,972 9,584 3,790,494 1,021,027 21,408,979 3,115,936August 4,593,398 1,594,938 10,145,389 16,333,725 35,408 0 79,103 200,231 9,785 3,843,929 1,310,679 21,812,862 3,211,111September 4,930,970 1,624,562 10,036,115 16,591,646 37,221 0 40,224 42,553 9,479 3,906,374 1,390,634 22,018,131 3,409,522October 4,797,930 1,639,262 10,160,933 16,598,125 37,109 0 46,784 181,751 9,502 3,961,709 1,176,021 22,011,000 2,856,190November 4,923,783 1,742,190 10,600,766 17,266,739 37,303 0 82,152 179,178 15,845 4,009,417 1,568,540 23,159,173 3,098,240December 5,079,193 1,704,293 10,075,346 16,858,832 37,711 0 82,479 400,134 8,506 4,063,164 1,335,967 22,786,793 3,244,7962018January 5,294,400 1,664,800 10,368,793 17,327,993 37,987 0 55,798 364,185 10,045 4,133,726 1,343,207 23,272,941 3,566,247February 5,175,855 1,660,384 10,160,105 16,996,344 38,715 0 46,924 244,021 8,812 4,153,951 1,444,631 22,933,397 3,670,972March 5,136,772 1,646,045 9,423,134 16,205,951 36,888 0 33,899 245,641 8,574 4,188,807 1,737,168 22,456,927 3,023,496April 5,656,515 1,635,141 9,754,742 17,046,399 38,507 0 50,461 394,980 8,497 4,225,711 1,153,323 22,917,878 2,320,635May 5,045,335 1,647,197 9,850,251 16,542,782 40,524 0 49,838 338,031 8,430 4,225,182 1,339,071 22,543,859 2,862,140June 5,282,904 1,660,972 9,795,791 16,739,667 69,881 0 61,478 262,296 8,736 4,239,619 1,427,935 22,809,612 3,307,314ChangeOver 12 Months 267,141 (93,132) 600,686 774,695 36,531 (45,013) (67,697) (20,224) (174) 498,618 363,877 1,540,614 67,753--------------------- ---------------------- ---------------------- ---------------------- ---------------------- ---------------------- ---------------------- ---------------------- ---------------------- ---------------------- ---------------------- ---------------------- ---------------------- ----------------------LIABILITIES OF BANKS AND THE BUILDING SOCIETY (SBS) IN ESWATINI SBS DATA IS INCLUDED FROM DECEMBER 2003.RESIDENT DEPOSITS- Deposits by corporations including and indiduals who reside and whose centre of economic interest is within Eswatini.
Includes government,local governement, public enterprises, business and personal deposits and excludes interbank and Central Bank deposits.BILLS PAYABLE- These represent amounts due to creditors as evidenced by a paper issued by the bank but not yet presented.CONTRA ACCOUNTS- Includes customers liabilities in respect of acceptances, guarantees, documentary credit, etc.These contigent claims have an exact contra amount which could be shown on the asset side.NON-RESIDENT DEPOSITS- Deposits by businesses and individuals whose centre of economic interest is outside Eswatini.#BALANCES DUE TO CBS- Also includes bills rediscounted with the Central Bank whose contra is shown under fixed and other assets on Table 3.5

52 Central Bank of Eswatini Quarterly Review - June 2018
Table S 3.7TOTAL OTHER DEPOSITORY CORPORATIONS LOANS AND ADVANCES BY CATEGORY OF BORROWERS
(E’000)Table S 3.7TOTAL OTHER DEPOSITORY CORPORATIONS LOANS AND ADVANCES BY CATEGORY OF BORROWERS
(E'000)----------------------------- ------------------------ ------------------------ ------------------------ ------------------------ ------------------------ ------------------------ ------------------------
State and Public Private Other Non- Other Period Central Local Enterprises Financial Financial ResidentEnded Government Govt. (PNF&PF) Corporations Corporations Sectors Total----------------------------- ------------------------ ------------------------ ------------------------ ------------------------ ------------------------ ------------------------ ------------------------2005 0 5,582 81,884 11,175 2,562,536 1,421,953 4,083,1302006 0 6,397 60,742 16,324 2,490,402 1,742,259 4,316,1242007 800 4,770 51,844 17,001 2,967,153 2,210,315 5,251,8832008 765 10,419 68,293 32,476 3,053,353 2,464,359 5,629,6652009 0 14,385 186,338 114,016 3,359,426 2,715,591 6,389,7562010 1,439 13,153 161,337 114,973 3,249,811 2,945,317 6,486,0302011 5,421 22,205 194,380 134,117 4,443,276 3,376,033 8,175,4322012 48 21,512 141,073 97,337 4,280,303 3,402,997 7,943,2702013 3 51,142 210,920 104,101 5,124,180 4,116,256 9,606,6022014 8,129 24,924 273,240 132,190 5,784,250 4,357,356 10,580,0892015 10,852 69,337 276,924 144,138 5,412,632 5,153,317 11,067,2002016 3,224 75,710 319,087 2,462 5,868,783 5,918,654 12,187,9202017 3,043 81,112 527,290 12,900 6,273,571 5,952,531 12,850,4482010March 0 19,510 176,835 115,639 2,789,522 2,897,440 5,998,946June 0 18,821 177,451 113,521 3,069,761 2,808,670 6,188,224September 392 14,171 206,612 112,452 3,169,045 2,808,477 6,311,149December 1,439 13,153 161,337 114,973 3,249,811 2,945,317 6,486,0302011March 6,336 8,290 208,131 122,151 3,086,865 3,023,154 6,454,927June 3,918 21,409 152,532 123,903 3,821,152 3,202,602 7,325,516September 4,285 24,363 190,904 123,025 4,407,205 3,383,036 8,132,817December 5,421 22,205 194,380 134,117 4,443,276 3,376,033 8,175,4322012March 1,663 24,603 214,474 126,131 4,409,866 3,348,155 8,124,892June 352 15,472 212,868 120,194 3,982,094 3,357,187 7,688,167September 188 20,263 196,705 116,171 4,560,067 3,284,858 8,178,252December 48 21,512 141,073 97,337 4,280,303 3,402,997 7,943,2702013March 2 17,063 126,734 110,146 4,264,400 3,424,564 7,942,909June 0 17,024 150,995 105,849 4,507,437 3,654,134 8,435,439September 0 31,871 162,856 104,240 4,879,822 3,747,253 8,926,042December 3 51,142 210,920 104,101 5,310,149 3,930,287 9,606,6022014January 10,269 39,538 246,176 107,857 5,083,459 3,997,991 9,485,290February 2 25,445 232,289 106,175 5,013,530 4,020,704 9,398,145March 11,358 25,809 240,845 109,078 5,226,697 4,011,786 9,625,573April 102 25,751 240,653 111,551 5,166,117 4,033,858 9,578,032May 4,387 24,353 249,499 110,479 5,457,637 4,062,626 9,908,981June 60 22,696 233,484 106,109 5,362,343 4,133,232 9,857,924July 107 26,199 245,323 108,197 5,731,801 4,159,327 10,270,954August 98 24,325 251,392 110,874 5,816,665 4,197,001 10,400,355September 2,415 19,251 268,228 89,509 5,777,429 4,250,479 10,407,311
October 10,304 25,977 258,517 98,103 5,530,907 4,301,712 10,225,520
November 4,218 20,937 284,206 116,463 5,642,481 4,375,859 10,444,164
December 8,129 24,924 273,240 132,190 5,784,250 4,357,356 10,580,089
2015
January 13,995 22,989 287,048 126,000 5,640,207 4,379,663 10,469,902
February 41,939 24,039 291,820 129,086 5,663,342 4,472,187 10,622,413
March 63,293 20,277 249,894 137,695 5,438,047 4,535,792 10,444,998
April 63,293 19,447 254,633 153,764 5,379,792 4,567,390 10,438,319
May 646 17,723 255,307 151,794 5,571,298 4,632,652 10,629,420
June 12,667 17,735 320,908 151,784 5,652,676 4,668,351 10,824,121
July 12,667 18,457 259,140 151,067 5,582,047 4,723,981 10,747,359
August 13,205 19,275 276,014 152,768 5,754,834 4,725,464 10,941,560
September 13,189 17,357 241,063 151,386 5,605,192 4,935,023 10,963,210
October 4,719 18,056 296,311 145,772 5,857,376 4,936,765 11,258,999
November 17,617 52,583 294,673 144,795 5,632,346 4,945,822 11,087,836
December 10,852 69,337 276,924 144,138 5,412,632 5,153,317 11,067,200
2016
January 11,015 70,800 297,863 117,314 5,318,685 5,294,715 11,110,391
February 16,232 64,817 344,093 150,156 5,114,728 5,347,597 11,037,623
March 16,813 79,832 285,972 147,628 5,005,480 5,460,159 10,995,884
April 17,735 70,579 290,255 147,539 5,001,678 5,427,521 10,955,307
May 13,020 72,192 280,305 116,824 5,071,405 5,634,861 11,188,607
June 11,877 75,711 263,222 3,238 5,420,754 5,571,432 11,346,235
July 13,413 75,573 288,773 3,283 5,740,485 5,698,017 11,819,545
August 13,580 76,852 283,180 2,249 5,623,671 5,750,582 11,750,114
September 16,973 80,557 305,878 9,296 5,589,979 5,843,090 11,845,773
October 13,123 78,035 325,590 2,649 5,839,948 5,657,310 11,916,654
November 10,745 78,578 350,772 2,974 5,881,393 6,038,181 12,362,643
December 3,224 75,710 319,087 2,462 5,868,783 5,918,654 12,187,920
2017
January 65,231 77,832 343,894 5,590 5,643,840 5,752,385 11,888,772
February 69,750 79,728 366,211 2,699 5,730,516 5,753,619 12,002,523
March 70,654 67,135 307,273 3,350 5,716,412 5,709,771 11,874,596
April 4,825 77,533 376,475 2,767 5,674,835 5,739,724 11,876,159
May 4,651 58,469 374,437 2,541 5,750,626 5,850,547 12,041,271
June 3,391 82,740 457,686 10,070 5,869,331 5,877,880 12,301,098
July 2,809 82,863 431,935 3,980 5,921,972 6,016,048 12,459,607
August 3,090 78,478 445,291 4,556 6,130,140 5,913,506 12,575,062
September 3,421 81,210 490,478 10,929 6,533,804 6,179,901 13,299,742
October 3,298 78,735 483,879 9,815 6,385,367 6,061,026 13,022,120
November 2,744 78,533 510,142 9,603 6,549,589 6,107,133 13,257,744
December 3,043 81,112 527,290 12,900 6,273,571 5,952,531 12,850,448
2018
January 8,581 38,936 437,037 741,842 6,137,660 6,070,303 13,434,360
February 1,553 45,696 459,196 713,271 6,017,111 6,089,130 13,325,958
March 1,275 46,550 581,764 722,716 5,904,681 5,917,975 13,174,961
April 1,287 45,031 579,813 723,756 6,123,496 5,968,416 13,441,798
May 21,170 41,047 598,983 722,562 5,980,009 6,098,024 13,461,795
June 651 68,895 659,154 725,766 6,432,588 5,879,297 13,766,352
Change
Over 12
Months (2,740) (13,845) 201,468 715,696 563,257 1,417 1,465,253
----------------------------- ------------------------ ------------------------ ------------------------ ------------------------ ------------------------ ------------------------ ------------------------
ESWATINI BUILDING SOCIETY DATA IS INCLUDED FROM DECEMBER 2003.
LOANS AND ADVANCES INCLUDE RESIDENTS AND NON-RESIDENTS.
CENTRAL GOVT.-Includes Central government and governmental public enterprises.
STATE AND LOCAL GOVT.-Includes municipal authorities such as city,town councils and town boards.
PUBLIC ENTERPRISES -Includes Public Nonfinancial and Public Financial enterprises.
PRIVATE FINANCIAL CORPORATIONS-Exludes depository corporations & public financial corporations.
OTHER NON-FINANCIAL CORPORATIONS-Includes private sector non-financial businesses.
OTHER RESIDENT SECTORS-Includes Households and Nonprofit Institutions Serving Households.

53Central Bank of Eswatini Quarterly Review - June 2018
Table S 3.8TOTAL BANK LOANS AND ADVANCES BY TYPE OF INDUSTRY (OTHER NON-FINANCIAL CORPORATIONS)
(E’000)Table S 3.8TOTAL BANK LOANS AND ADVANCES BY TYPE OF INDUSTRY(OTHER NON-FINANCIAL CORPORATIONS)
(E'000)--------------- ----------------------------- ----------------------------- ----------------------------- ----------------------------- ----------------------------- ----------------------------- ---------------------------------------------------------- ----------------------------- -----------------------------
Agriculture Mining Community,Period and and Distribution Transport and Social andEnded Forestry Quarrying Manufacturing Construction and Tourism Communication Personal Servs Real Estate Other Total--------------- ----------------------------- ----------------------------- ----------------------------- ----------------------------- ----------------------------- ----------------------------- ---------------------------------------------------------- ----------------------------- -----------------------------2005 598,382 392 393,172 201,349 379,633 205,155 140,101 644,352 2,562,5362006 273,273 441 290,959 251,552 456,625 177,461 139,790 900,301 2,490,4022007 398,942 843 316,932 140,140 627,772 247,049 143,889 1,091,586 2,967,1532008 283,535 1,561 298,985 97,566 372,559 246,326 227,343 293,115 1,232,363 3,053,3532009 471,866 450 769,481 199,277 457,369 286,624 139,934 351,426 682,999 3,359,4262010 543,623 1,547 484,247 347,185 403,171 277,254 142,306 518,190 532,288 3,249,8112011 805,112 78,292 959,386 338,725 471,467 300,299 215,357 871,914 402,724 4,443,2762012 550,421 84,344 858,202 298,767 511,090 410,440 236,058 792,446 538,535 4,280,3032013 964,579 115,815 1,014,272 461,783 502,310 469,579 308,422 834,051 639,338 5,310,1492014 846,390 112,437 1,241,768 627,748 697,804 514,152 394,787 893,999 455,165 5,784,2502015 621,979 67,781 807,439 520,137 895,656 468,156 471,279 1,165,856 394,349 5,412,6322016 697,781 63,317 463,852 382,154 1,120,112 490,836 746,888 1,453,199 450,644 5,868,7832017 704,515 112,386 264,402 378,535 1,889,443 634,045 885,552 1,019,705 384,988 6,273,5712010March 492,237 359 354,884 179,246 376,655 274,404 124,922 374,010 612,805 2,789,522June 505,874 311 520,118 209,504 402,130 294,455 143,795 352,055 641,519 3,069,761September 450,533 1,477 520,346 285,796 490,806 270,732 196,056 456,778 496,521 3,169,045December 543,623 1,547 484,247 347,185 403,171 277,254 142,306 518,190 532,288 3,249,8112011March 574,939 77,535 335,338 409,008 499,133 295,195 218,428 353,953 323,336 3,086,865June 546,581 77,845 887,454 391,205 417,410 303,609 200,434 598,442 398,172 3,821,152September 844,981 78,189 1,025,201 368,242 468,120 313,026 243,063 641,207 425,176 4,407,205December 805,112 78,292 959,386 338,725 471,467 300,299 215,357 871,914 402,724 4,443,2762012March 674,398 81,938 929,575 305,846 495,157 240,288 285,206 1,012,090 385,368 4,409,866June 688,985 80,251 514,166 297,220 486,987 234,163 339,175 971,145 370,002 3,982,094September 741,607 94,649 918,421 311,812 622,326 394,243 183,471 744,157 549,381 4,560,067December 550,421 84,344 858,202 298,767 511,090 410,440 236,058 792,446 538,535 4,280,3032013March 627,769 90,361 520,766 335,554 581,461 431,285 278,393 790,257 608,554 4,264,400June 642,931 90,632 742,240 375,163 479,912 450,729 288,020 803,590 634,221 4,507,437September 791,683 84,634 932,294 404,763 464,606 428,171 264,882 816,014 692,775 4,879,822December 964,579 115,815 1,014,272 461,783 502,310 469,579 308,422 834,051 639,338 5,310,1492014January 823,226 107,999 785,444 448,220 635,682 441,687 315,257 828,656 697,288 5,083,459February 677,008 109,589 827,113 461,360 610,613 469,883 475,871 849,187 532,906 5,013,530March 670,765 121,561 827,151 465,445 669,058 451,723 519,404 843,529 658,061 5,226,697April 732,494 119,010 718,750 462,255 663,188 453,847 506,657 829,780 680,136 5,166,117May 924,288 131,504 760,389 476,387 606,084 456,565 489,714 846,570 766,136 5,457,637June 842,059 124,468 827,301 470,329 629,771 398,769 509,667 846,820 713,159 5,362,343July 1,106,323 135,108 872,752 500,782 684,051 455,104 515,826 851,837 610,018 5,731,801August 1,209,061 144,285 876,299 517,931 714,682 476,291 522,162 871,583 484,371 5,816,665September 1,107,309 110,560 1,028,740 501,742 687,763 455,189 502,470 845,850 537,806 5,777,429October 883,290 125,490 1,008,122 477,337 702,335 471,069 493,360 844,362 525,542 5,530,907November 856,862 133,885 1,092,220 486,102 726,210 529,205 498,983 837,689 481,325 5,642,481December 846,390 112,437 1,241,768 627,748 697,804 514,152 394,787 893,999 455,165 5,784,2502015January 910,355 124,735 890,854 571,038 767,180 581,247 389,358 957,303 448,137 5,640,207February 866,153 126,088 919,706 567,071 767,404 577,735 389,172 960,857 489,156 5,663,342March 899,518 121,469 723,325 561,854 768,543 563,460 380,493 975,386 443,999 5,438,047April 944,614 111,897 678,559 533,642 740,080 378,941 561,962 989,913 440,184 5,379,792May 885,973 113,359 895,393 556,055 723,441 504,047 467,697 977,096 448,237 5,571,298June 774,064 97,850 966,507 442,425 698,339 464,156 772,600 988,191 448,544 5,652,676July 771,783 97,606 889,608 431,840 753,010 456,099 761,245 987,823 433,033 5,582,047August 638,448 98,541 953,483 444,941 751,270 450,544 939,746 1,033,069 444,792 5,754,834September 675,269 98,427 899,974 463,717 871,741 472,960 679,803 1,037,759 405,542 5,605,192October 808,207 101,655 1,109,905 465,747 872,930 491,936 591,496 1,031,990 383,510 5,857,376November 675,971 61,590 867,381 496,083 944,972 469,658 459,721 1,279,276 377,692 5,632,346December 621,979 67,781 807,439 520,137 895,656 468,156 471,279 1,165,856 394,349 5,412,6322016January 626,959 66,566 737,815 524,951 904,371 470,777 484,356 1,174,352 328,538 5,318,685February 637,907 63,731 559,617 507,410 930,804 508,612 467,101 1,128,851 310,697 5,114,728March 648,250 63,859 531,831 370,874 837,206 464,716 516,213 1,210,449 362,082 5,005,480April 673,909 63,772 366,883 379,920 914,276 466,904 520,151 1,274,891 340,972 5,001,678May 669,776 67,664 379,451 385,114 931,884 480,038 556,972 1,218,024 382,481 5,071,405June 624,670 70,545 529,448 408,964 950,868 485,958 582,885 1,316,995 450,421 5,420,754July 689,314 71,499 375,334 392,681 1,387,999 482,510 566,824 1,339,025 435,299 5,740,485August 693,661 69,896 396,532 411,019 1,264,857 485,646 548,203 1,346,467 407,388 5,623,671September 678,768 72,353 410,283 404,190 1,065,703 507,114 744,280 1,246,569 460,719 5,589,979October 620,982 72,123 368,680 407,256 1,404,685 486,098 746,669 1,174,700 558,755 5,839,948November 651,450 72,532 358,997 403,608 1,342,727 472,595 738,623 1,303,727 537,135 5,881,393December 697,781 63,317 463,852 382,154 1,120,112 490,836 746,888 1,453,199 450,644 5,868,7832017January 761,799 62,283 301,764 391,725 1,086,844 484,622 738,789 1,336,758 479,256 5,643,840February 787,889 60,907 298,564 423,073 1,182,544 479,868 728,950 1,315,803 452,919 5,730,516March 809,339 61,767 297,071 420,088 1,204,063 484,614 635,117 1,317,090 487,262 5,716,412April 803,595 61,807 298,509 435,526 1,025,010 497,032 741,672 1,293,250 518,435 5,674,835May 818,713 62,018 297,507 401,745 1,050,498 488,248 723,943 1,335,252 572,703 5,750,626June 829,377 61,837 291,786 390,069 1,349,210 474,880 692,333 1,240,113 539,726 5,869,331July 790,426 52,601 366,517 371,509 1,487,886 488,201 572,720 1,165,521 626,592 5,921,972August 1,056,176 70,317 350,420 392,988 1,260,754 518,568 799,536 1,118,315 563,065 6,130,140September 1,211,144 120,620 379,472 424,974 1,642,216 537,469 778,004 1,094,144 345,761 6,533,804October 1,134,846 122,127 251,151 415,188 1,680,359 697,570 646,262 1,093,491 344,373 6,385,367November 1,131,277 119,326 273,867 389,451 1,751,622 604,824 654,411 1,129,312 495,498 6,549,589December 704,515 112,386 264,402 378,535 1,889,443 634,045 885,552 1,019,705 384,988 6,273,5712018January 712,246 123,625 284,642 332,159 1,697,871 632,815 767,550 1,157,990 428,762 6,137,660February 714,278 108,351 279,604 350,138 1,608,838 605,150 751,052 1,151,342 448,358 6,017,111March 760,674 102,603 265,415 357,383 1,681,721 626,072 671,407 1,031,090 408,315 5,904,681April 760,140 119,892 263,537 370,320 1,702,400 633,552 652,953 1,095,594 525,108 6,123,496May 770,188 114,480 228,670 360,590 1,624,349 620,635 662,445 1,087,283 511,369 5,980,009June 802,439 123,478 280,894 382,308 1,801,712 629,385 756,941 1,122,319 533,113 6,432,588ChangeOver 12 Months (26,938) 61,640 (10,892) (7,761) 452,502 154,505 64,608 (117,794) (6,613) 563,257--------------- ----------------------------- ----------------------------- ----------------------------- ----------------------------- ----------------------------- ----------------------------- ---------------------------------------------------------- ----------------------------- -----------------------------Eswatini Building Society (EBS) loans to Industry data is included from December 2003.

54 Central Bank of Eswatini Quarterly Review - June 2018
Table S 3.9OWNERSHIP OF OTHER DEPOSITORY CORPORATIONS DEPOSITS (DEPOSITS IN FOREIGN CURRENCY INCL)
(E’000)OWNERSHIP OF OTHER DEPOSITORY CORPORATIONS DEPOSITS (DEPOSITS IN FOREIGN CURRENCY INCL)
----------------- ---------------------------- ---------------------------- ---------------------------- ---------------------------- ---------------------------- ---------------------------- ---------------------------- ---------------------------- ---------------------------- ----------------------------Local Govt., Local Govt.,
Public Enterprs. Other Other Public Enterprs. Other OtherPeriod Central and Private Resident Non-Financial Central and Private Resident Non-FinancialEnded Govt. Financial Corps Sectors Corporations Total Govt. Financial Corps Sectors Corporations Total----------------- ---------------------------- ---------------------------- ---------------------------- ---------------------------- ---------------------------- ---------------------------- ---------------------------- ---------------------------- ---------------------------- ----------------------------
----------------- ---------------------------- ---------------------------- ---------------------------- ---------------------------- ---------------------------- ---------------------------- ---------------------------- ---------------------------- ---------------------------- ----------------------------2005 5,585 63,298 235,344 750,787 1,055,014 218 24,367 897,413 44,084 966,0822006 1,337 36,873 171,888 899,882 1,109,980 254 8,969 740,515 267,033 1,016,7712007 9,024 57,175 264,725 1,098,841 1,429,765 579 28,825 811,015 197,334 1,037,7532008 27,749 112,991 351,379 1,234,897 1,727,016 478 41,390 1,038,119 99,491 1,179,4782009 2,224 217,478 387,215 1,407,755 2,014,672 13,584 39,974 1,073,101 113,351 1,240,0102010 1,558 144,597 401,785 1,640,353 2,188,293 14,609 42,452 1,150,420 96,288 1,303,7692011 118,350 150,985 382,351 1,982,482 2,634,168 15,002 33,610 1,143,505 123,559 1,315,6762012 2,182 152,334 458,851 2,408,352 3,021,719 16,320 37,710 1,185,384 147,798 1,387,2122013 2,999 130,398 568,288 3,209,577 3,911,262 17,260 46,318 1,357,275 148,835 1,569,6882014 2,780 172,950 561,590 2,988,325 3,725,645 18,229 49,697 1,413,046 169,183 1,650,1552015 33,763 278,137 721,251 3,199,207 4,232,358 19,396 38,638 1,405,911 194,031 1,657,9762016 67,893 225,663 666,822 4,523,834 5,484,212 21,108 49,064 1,596,940 172,414 1,839,5262017 13,085 214,005 1,011,608 3,851,688 5,090,387 23,625 51,575 1,317,886 319,037 1,712,1232010March 2,181 92,624 408,025 1,349,557 1,852,387 13,845 35,998 1,048,866 96,132 1,194,841June 799 126,421 449,092 1,456,381 2,032,693 14,115 36,060 1,085,417 111,131 1,246,723September 1,482 149,590 436,635 1,347,309 1,935,016 14,368 40,475 1,121,710 91,421 1,267,974December 1,558 144,597 401,785 1,640,353 2,188,293 14,609 42,452 1,150,420 96,288 1,303,7692011March 67,921 107,350 431,905 1,358,980 1,966,156 14,804 39,273 1,103,420 97,363 1,254,860June 85,101 127,289 416,108 1,528,508 2,157,006 15,013 37,764 1,121,062 107,046 1,280,885September 38,688 140,440 358,356 2,025,493 2,562,978 14,752 42,529 1,108,469 126,211 1,291,961December 118,350 150,985 382,351 1,982,482 2,634,168 15,002 33,610 1,143,505 123,559 1,315,6762012March 181,938 112,730 394,435 1,880,042 2,569,145 15,250 33,452 1,122,077 115,307 1,286,086June 288,541 98,458 394,710 2,024,588 2,806,297 15,499 37,945 1,148,887 152,729 1,355,060September 50,422 131,486 449,623 2,374,399 3,005,930 29,167 39,629 1,149,199 157,297 1,375,292December 2,182 152,334 458,851 2,408,352 3,021,719 16,320 37,710 1,185,384 147,798 1,387,2122013March 1,937 155,402 448,356 2,522,543 3,128,238 16,105 42,197 1,142,673 175,193 1,376,168June 5,390 166,254 508,753 2,240,947 2,921,344 16,776 46,073 1,243,656 153,720 1,460,225September 3,302 155,537 532,452 2,630,369 3,321,660 17,034 42,563 1,273,971 155,435 1,489,003December 2,999 130,398 568,288 3,209,577 3,911,262 17,260 46,318 1,357,275 148,835 1,569,6882014January 2,914 125,101 574,883 2,484,766 3,187,664 17,333 47,102 1,308,572 157,216 1,530,223February 4,651 142,416 573,262 2,410,072 3,130,401 17,394 46,761 1,304,614 142,731 1,511,500March 1,781 192,437 630,926 2,541,981 3,367,125 900 30,638 1,353,563 121,341 1,506,442April 2,783 200,276 799,081 2,543,502 3,545,642 926 33,460 1,400,070 133,029 1,567,485May 2,445 159,830 577,052 2,531,758 3,271,085 17,619 35,038 1,384,742 128,782 1,566,181June 716 189,086 587,152 2,687,162 3,464,116 17,680 39,277 1,369,945 131,001 1,557,903July 1,425 176,332 643,042 2,485,431 3,306,230 17,761 42,393 1,395,264 132,819 1,588,237August 1,914 228,423 619,294 2,597,436 3,447,067 17,813 39,570 1,401,664 145,540 1,604,587September 12,065 253,156 598,486 2,714,245 3,577,952 17,946 41,032 1,400,214 137,875 1,597,067October 4,265 180,017 587,766 2,520,119 3,292,167 18,037 43,435 1,415,872 147,008 1,624,352November 3,613 213,323 590,418 2,813,120 3,620,474 18,124 36,291 1,407,165 136,821 1,598,401
December 2,780 172,950 561,590 2,988,325 3,725,645 18,229 49,697 1,413,046 169,183 1,650,155
2015
January 2,390 174,494 564,483 2,836,329 3,577,696 18,315 54,352 1,326,623 175,743 1,575,033
February 3,635 177,353 611,950 2,776,645 3,569,583 18,375 51,984 1,374,014 147,505 1,591,878
March 3,588 186,633 481,215 2,949,804 3,621,240 18,468 52,771 1,377,644 144,877 1,593,760
April 37,525 221,441 638,534 3,004,402 3,901,902 18,557 52,499 1,438,321 140,337 1,649,714
May 13,873 229,753 591,754 2,880,732 3,716,112 18,680 56,815 1,424,383 144,814 1,644,692
June 2,714 230,185 688,484 2,856,850 3,778,233 18,778 56,058 1,419,298 143,759 1,637,893
July 2,714 200,133 626,961 2,802,280 3,632,088 18,880 60,872 1,472,588 150,254 1,702,594
August 2,714 237,803 694,412 3,118,581 4,053,510 18,987 42,647 1,440,088 146,658 1,648,380
September 2,714 228,051 721,751 3,070,966 4,023,482 19,089 47,848 1,452,598 150,531 1,670,066
October 2,714 259,439 680,978 2,915,046 3,858,177 19,169 45,182 1,433,297 167,171 1,664,819
November 28,354 272,071 633,935 2,964,527 3,898,887 19,272 40,057 1,412,466 194,889 1,666,684
December 33,763 278,137 721,251 3,199,207 4,232,358 19,396 38,638 1,405,911 194,031 1,657,976
2016
January 30,211 262,238 666,159 3,142,916 4,101,523 19,511 39,220 1,342,143 191,262 1,592,136
February 26,785 276,317 639,221 2,936,201 3,878,523 19,688 37,931 1,350,530 193,166 1,601,315
March 26,548 261,172 613,955 2,693,841 3,595,516 19,805 37,413 1,399,321 152,741 1,609,281
April 30,163 336,848 762,057 2,855,332 3,984,401 19,944 38,751 1,447,038 140,228 1,645,961
May 22,276 448,128 712,688 2,896,636 4,079,728 20,584 44,573 1,484,340 150,445 1,699,943
June 31,522 266,771 616,336 2,795,608 3,710,238 20,209 48,000 1,494,896 167,014 1,730,119
July 52,808 263,208 668,987 2,904,795 3,889,797 20,349 47,625 1,530,010 177,861 1,775,845
August 34,220 259,999 607,121 3,438,691 4,340,032 20,493 52,760 1,581,386 164,534 1,819,173
September 18,799 247,997 807,455 3,130,937 4,205,187 20,639 51,044 1,587,271 168,528 1,827,482
October 67,850 260,234 678,659 3,337,240 4,343,984 20,786 48,301 1,588,756 171,267 1,829,109
November 70,060 264,004 790,472 3,396,008 4,520,544 20,932 42,770 1,582,122 177,213 1,823,037
December 67,893 225,663 666,822 4,523,834 5,484,212 21,108 49,064 1,596,940 172,414 1,839,526
2017
January 57,137 234,554 755,033 3,475,571 4,522,295 21,252 50,397 1,513,651 182,392 1,767,692
February 4,341 256,538 760,606 3,441,514 4,463,000 21,413 51,331 1,488,333 189,622 1,750,699
March 3,247 215,994 986,518 2,940,009 4,145,768 21,580 44,264 1,514,857 211,182 1,791,884
April 62,540 261,165 808,297 3,426,213 4,558,215 21,749 51,932 1,498,058 185,211 1,756,950
May 70,686 199,013 750,868 3,622,012 4,642,579 21,921 45,609 1,474,870 257,510 1,799,910
June 11,402 249,392 732,415 4,031,218 5,024,427 22,128 48,445 1,435,317 257,598 1,763,487
July 31,638 249,015 755,916 3,669,704 4,706,274 22,309 48,765 1,279,522 276,977 1,627,573
August 24,460 207,612 809,109 3,561,308 4,602,489 22,445 49,881 1,261,587 270,041 1,603,953
September 29,285 226,192 588,456 4,096,545 4,940,478 22,618 52,768 1,300,731 258,459 1,634,576
October 19,536 206,757 899,205 3,682,484 4,807,982 22,774 51,372 1,281,655 292,596 1,648,397
November 19,677 225,404 981,725 3,707,854 4,934,660 23,132 51,249 1,411,246 265,028 1,750,654
December 13,085 214,005 1,011,608 3,851,688 5,090,387 23,625 51,575 1,317,886 319,037 1,712,123
2018
January 33,264 261,226 961,649 4,049,324 5,305,464 23,427 51,638 1,324,252 273,370 1,672,687
February 13,950 258,008 1,022,545 3,892,420 5,186,923 23,551 49,231 1,316,215 279,520 1,668,518
March 10,810 262,435 895,492 3,978,012 5,146,749 23,792 48,491 1,345,433 236,583 1,654,299
April 7,665 212,293 949,952 4,498,212 5,668,122 23,980 48,197 1,349,381 221,738 1,643,296
May 21,066 183,336 895,680 3,957,472 5,057,554 25,215 49,019 1,359,567 222,517 1,656,317
June 12,581 208,043 995,742 4,085,161 5,301,527 25,399 51,192 1,314,156 281,326 1,672,073
Change
Over 12
Months 1,179 (41,349) 263,327 53,943 277,100 3,271 2,747 (121,161) 23,728 (91,414)----------------- ---------------------------- ---------------------------- ---------------------------- ---------------------------- ---------------------------- ---------------------------- ---------------------------- ---------------------------- ---------------------------- ----------------------------ESWATINI BUILDING SOCIETY DATA IS INCLUDED FROM DECEMBER 2003.DEPOSITS INCLUDE RESIDENTS AND NON-RESIDENTS
CENTRAL GOVT.DEPOSITS - Includes Central government and governmental public enterprises.
PUBLIC ENTERPRISE DEPOSITS - Includes Public Nonfinancial and Public Financial enterprises.
OTHER RESIDENT SECTORS - Includes Households and Nonprofit Institutions Serving Households.
OTHER NON-FINANCIAL CORPORATIONS - Includes private sector non-financial businesses.
TRANSFERABLE/DEMAND DEPOSITS SAVINGS DEPOSITS

55Central Bank of Eswatini Quarterly Review - June 2018
Table S 3.9 (Cont)OWNERSHIP OF OTHER DEPOSITORY CORPORATIONS DEPOSITS (DEPOSITS IN FOREIGN CURRENCY INCL)
(E’000)Table S 3.9 (Cont)OWNERSHIP OF OTHER DEPOSITORY CORPORATIONS DEPOSITS (DEPOSITS IN FOREIGN CURRENCY INCL)
(E'000)----------------------------- ----------------------------- ----------------------------- ----------------------------- ----------------------------- ----------------------------- ----------------------------- ----------------------------- ----------------------------- ----------------------------- -----------------------------
Local Govt., Local Govt.,Period Public Enterprs. Other Other Public Enterprs. Other OtherEnded Central and Private Resident Non-Financial Total Central and Private Resident Non-Financial Total
Govt. Financial Corps Sectors Corporations Govt. Financial Corps Sectors Corporations----------------------------- ----------------------------- ----------------------------- ----------------------------- ----------------------------- ----------------------------- ----------------------------- ----------------------------- ----------------------------- ----------------------------- -----------------------------
TIME DEPOSITS TOTAL DEPOSITS----------------------------- ----------------------------- ----------------------------- ----------------------------- ----------------------------- ----------------------------- ----------------------------- ----------------------------- ----------------------------- ----------------------------- -----------------------------2005 12,040 371,735 424,827 911,692 1,720,294 17,843 459,400 1,557,584 1,706,563 3,741,3902006 62,225 227,794 371,301 1,372,338 2,033,658 63,816 273,636 1,283,704 2,539,253 4,160,4092007 114,394 331,425 478,397 1,815,416 2,739,632 123,997 417,475 1,554,137 3,111,591 5,207,2002008 167,504 586,869 593,968 1,972,280 3,320,621 195,731 741,250 1,983,466 3,306,668 6,227,1152009 222,344 1,587,938 706,382 2,131,165 4,647,829 238,152 1,845,390 2,166,698 3,652,271 7,902,5112010 300,105 1,319,678 748,320 2,447,754 4,815,857 316,272 1,707,023 2,300,525 4,184,395 8,508,2152011 322,978 1,256,503 694,972 2,301,878 4,576,331 456,330 1,441,098 2,220,828 4,407,919 8,526,1752012 363,531 1,244,003 726,985 2,088,862 4,423,381 382,033 1,882,913 2,371,220 4,645,012 9,281,1782013 311,626 1,754,953 888,262 2,255,886 4,590,037 331,885 1,931,669 2,813,825 5,614,298 10,691,6772014 293,482 1,856,067 1,193,429 2,721,298 6,064,276 314,491 2,078,714 3,168,065 5,878,806 11,440,0762015 425,370 2,339,652 1,353,284 3,158,025 7,276,331 478,529 2,656,427 3,480,446 6,551,263 13,166,6652016 375,604 2,853,023 1,996,823 3,683,402 8,908,853 464,605 3,127,751 4,260,585 8,379,650 16,232,5902017 373,983 2,733,089 2,034,568 4,952,394 10,094,034 410,693 2,998,669 4,364,062 9,123,120 16,896,5432010March 251,711 2,127,860 711,768 1,916,774 5,008,113 267,737 2,256,482 2,168,659 3,362,463 8,055,341June 276,917 2,265,342 705,986 2,008,996 5,257,241 291,831 2,427,823 2,240,495 3,576,508 8,536,657September 303,531 2,060,643 720,221 2,303,572 5,387,967 319,381 2,250,708 2,278,566 3,742,302 8,590,957December 300,105 1,319,678 748,320 2,447,754 4,815,857 316,272 1,707,023 2,300,525 4,184,395 8,508,2152011March 260,717 1,428,503 687,484 2,796,623 5,173,327 343,442 1,575,126 2,222,809 4,252,966 8,394,343June 262,386 1,397,186 673,394 2,527,171 4,860,137 362,500 1,767,499 2,210,564 4,162,725 8,503,288September 325,052 1,477,073 797,952 2,005,779 4,605,856 378,493 1,660,042 2,264,777 4,157,483 8,460,795December 322,978 1,256,503 694,972 2,301,878 4,576,331 456,330 1,441,098 2,220,828 4,407,919 8,526,1752012March 340,087 1,223,814 643,215 2,424,070 4,631,186 537,275 1,369,996 2,159,727 4,419,419 8,486,417June 354,256 1,411,406 705,589 2,155,367 4,626,618 658,296 1,547,809 2,249,186 4,332,684 8,787,975September 358,869 1,410,829 693,483 2,146,344 4,184,435 438,458 1,581,944 2,292,305 4,678,040 8,990,747December 363,531 1,692,869 726,985 2,088,862 4,423,381 382,033 1,882,913 2,371,220 4,645,012 9,281,1782013March 395,896 2,064,362 793,481 2,016,840 5,270,579 413,938 2,261,961 2,384,510 4,714,576 9,774,985June 344,134 1,728,797 842,180 2,111,870 5,026,981 366,300 1,941,124 2,594,589 4,506,537 9,408,550September 339,903 1,783,864 880,990 2,370,037 5,374,793 360,239 1,981,964 2,687,413 5,155,841 10,185,456December 311,626 1,754,953 888,262 2,255,886 5,210,727 331,885 1,931,669 2,813,825 5,614,298 10,691,6772014January 317,595 1,638,496 1,050,501 2,428,410 5,435,002 337,842 1,810,699 2,933,956 5,070,392 10,152,889February 342,731 1,773,888 1,054,747 2,409,617 5,580,983 364,776 1,963,065 2,932,623 4,962,420 10,222,884March 324,050 1,950,032 1,035,038 2,145,800 5,454,920 326,731 2,173,107 3,019,527 4,809,122 10,328,487April 315,498 1,760,617 978,231 2,268,625 5,322,971 319,207 1,994,353 3,177,382 4,945,156 10,436,098May 274,305 1,963,799 1,011,208 2,510,451 5,759,763 294,369 2,158,667 2,973,002 5,170,991 10,597,029June 319,383 1,838,159 1,079,837 2,805,360 6,042,739 337,779 2,066,522 3,036,934 5,623,523 11,064,758July 279,738 1,848,672 1,135,279 2,531,544 5,795,233 298,924 2,067,397 3,173,585 5,149,794 10,689,700August 336,221 1,803,794 1,181,249 2,475,220 5,796,484 355,948 2,071,787 3,202,207 5,218,196 10,848,138September 328,769 1,750,523 1,201,210 2,479,198 5,759,700 358,780 2,044,711 3,199,910 5,331,318 10,934,719October 277,175 1,862,830 1,231,409 2,751,323 6,122,737 299,477 2,086,282 3,235,047 5,418,450 11,039,256November 309,136 1,840,831 1,169,536 2,887,470 6,206,973 330,873 2,090,445 3,167,119 5,837,411 11,425,848December 293,482 1,856,067 1,193,429 2,721,298 6,064,276 314,491 2,078,714 3,168,065 5,878,806 11,440,0762015January 344,090 1,909,704 1,155,930 2,806,211 6,215,935 364,795 2,138,550 3,047,036 5,818,283 11,368,664February 303,314 1,848,463 1,137,916 2,683,861 5,973,554 325,324 2,077,800 3,123,880 5,608,011 11,135,015March 449,814 1,816,164 1,158,377 2,358,649 5,783,004 471,870 2,055,568 3,017,236 5,453,330 10,998,004April 453,336 1,921,295 1,266,231 2,526,180 6,167,042 509,418 2,195,235 3,343,086 5,670,919 11,718,658May 451,485 1,895,267 1,225,834 2,482,141 6,054,727 484,038 2,181,835 3,241,971 5,507,687 11,415,531June 456,181 1,967,536 1,198,471 2,602,435 6,224,623 477,673 2,253,779 3,306,253 5,603,044 11,640,749July 438,612 1,834,500 1,253,906 2,809,095 6,336,113 460,206 2,095,505 3,353,455 5,761,629 11,670,795August 474,980 1,823,673 1,238,891 3,056,898 6,594,442 496,681 2,104,123 3,373,391 6,322,137 12,296,332September 474,941 1,852,564 1,291,752 3,704,915 7,324,172 496,744 2,128,463 3,466,101 6,926,412 13,017,720October 476,424 1,812,847 1,317,287 3,450,209 7,056,767 498,307 2,117,468 3,431,562 6,532,426 12,579,763November 473,853 1,786,963 1,323,187 3,440,592 7,024,595 521,479 2,099,091 3,369,588 6,600,008 12,590,166December 425,370 2,339,652 1,353,284 3,158,025 7,276,331 478,529 2,656,427 3,480,446 6,551,263 13,166,6652016January 426,536 2,058,003 1,381,672 3,719,623 7,585,834 476,257 2,359,461 3,389,974 7,053,800 13,279,493February 395,232 2,131,879 1,303,829 3,568,807 7,399,747 441,705 2,446,126 3,293,580 6,698,174 12,879,585March 403,001 2,045,451 1,390,528 3,487,801 7,326,781 449,353 2,344,037 3,403,804 6,334,384 12,531,577April 360,435 2,175,022 1,341,329 3,517,281 7,394,067 410,542 2,550,620 3,550,425 6,512,841 13,024,428May 339,909 2,165,054 1,442,358 3,554,509 7,501,831 382,769 2,657,756 3,639,387 6,601,590 13,281,501June 317,097 2,185,047 1,891,655 3,382,195 7,775,994 368,828 2,499,818 4,002,887 6,344,817 13,216,351July 413,101 2,387,543 1,893,002 3,495,509 8,189,155 486,257 2,698,376 4,092,000 6,578,164 13,854,798August 403,333 2,068,153 1,701,263 4,377,439 8,550,189 458,046 2,380,912 3,889,770 7,980,665 14,709,394September 406,753 2,601,359 1,716,437 3,346,818 8,071,367 446,190 2,900,400 4,111,162 6,646,284 14,104,036October 361,317 2,565,999 1,838,617 3,271,331 8,037,264 449,954 2,874,534 4,106,032 6,779,838 14,210,357November 380,175 2,544,976 2,083,766 4,145,473 9,154,390 471,167 2,851,750 4,456,360 7,718,694 15,497,971December 375,604 2,853,023 1,996,823 3,683,402 8,908,853 464,605 3,127,751 4,260,585 8,379,650 16,232,5902017January 369,707 2,705,167 1,985,007 3,326,933 8,386,814 448,096 2,990,118 4,253,691 6,984,896 14,676,801February 399,297 2,774,787 2,041,903 3,172,743 8,388,730 425,051 3,082,657 4,290,841 6,803,879 14,602,428March 353,336 2,447,430 2,401,304 2,679,661 7,881,731 378,162 2,707,689 4,902,679 5,830,853 13,819,383April 376,601 2,250,675 1,937,296 3,397,298 7,961,870 460,890 2,563,773 4,243,651 7,008,722 14,277,035May 425,627 2,585,365 2,070,967 3,591,433 8,673,393 518,235 2,829,987 4,296,704 7,470,954 15,115,881June 387,938 2,460,739 2,167,489 4,194,242 9,210,408 421,468 2,758,575 4,335,221 8,483,058 15,998,322July 395,540 3,004,733 2,320,217 3,983,653 9,704,142 449,487 3,302,513 4,355,655 7,930,334 16,037,989August 426,999 2,294,616 2,233,046 5,208,031 10,162,691 473,904 2,552,109 4,303,741 9,039,379 16,369,134September 393,117 2,641,398 2,043,668 4,975,631 10,053,813 445,020 2,920,358 3,932,854 9,330,635 16,628,867October 400,768 2,649,562 1,943,109 5,185,416 10,178,855 443,078 2,907,691 4,123,969 9,160,496 16,635,235November 367,150 2,633,707 1,977,628 5,640,243 10,618,728 409,959 2,910,360 4,370,598 9,613,125 17,304,043December 373,983 2,733,089 2,034,568 4,952,394 10,094,034 410,693 2,998,669 4,364,062 9,123,120 16,896,5432018January 613,707 2,610,155 2,165,291 4,998,676 10,387,829 670,398 2,923,019 4,451,192 9,321,371 17,365,980February 396,940 2,697,242 2,270,264 4,815,172 10,179,617 434,441 3,004,481 4,609,024 8,987,112 17,035,058March 363,105 2,527,941 2,348,339 4,202,406 9,441,791 397,708 2,838,867 4,589,263 8,417,001 16,242,839April 358,051 2,451,186 2,321,077 4,643,175 9,773,488 389,696 2,711,676 4,620,410 9,363,124 17,084,906May 374,485 2,526,772 2,388,336 4,579,842 9,869,435 420,767 2,759,126 4,643,582 8,759,831 16,583,306June 391,294 2,398,489 2,788,998 4,257,167 9,835,948 429,275 2,657,724 5,098,895 8,623,654 16,809,548ChangeOver 12Months 3,356 (62,250) 621,509 62,925 625,540 7,806 (100,851) 763,675 140,596 811,226----------------------------- ----------------------------- ----------------------------- ----------------------------- ----------------------------- ----------------------------- ----------------------------- ----------------------------- ----------------------------- ----------------------------- -----------------------------

56 Central Bank of Eswatini Quarterly Review - June 2018
Table S 3.10CLASSIFICATION OF SELECTED OTHER DEPOSITORY CORPORATIONS DEPOSITS
(E’000)(E'000)
------------------------------- ------------------------- ------------------------- ------------------------- ------------------------- ------------------------- ------------------------- ------------------------- -------------------------Non-Government Deposits Analysis
------------------------- ------------------------- ------------------------- ------------------------- ------------------------- Total Deposits Time
------------------------- ------------------------- ------------------------- ------------------------- ------------------------- -------------------------Period Other Sectors TranferableEnded Total Government (Private) (Demand) Savings Short-Term Medium-Term Long-Term------------------------------- ------------------------- ------------------------- ------------------------- ------------------------- ------------------------- ------------------------- ------------------------- -------------------------2005 3,741,390 17,843 3,723,547 1,049,429 965,864 1,329,853 75,166 303,2352006 4,160,409 63,816 4,096,593 1,108,643 1,016,517 1,522,820 95,587 353,0262007 5,257,816 174,613 5,083,203 1,420,791 1,037,174 1,963,035 217,442 444,7612008 6,227,115 195,731 6,031,384 1,699,267 1,179,000 2,324,157 386,398 442,5622009 7,902,511 238,152 7,664,359 2,012,448 1,226,426 3,037,124 400,893 987,4682010 8,508,215 316,272 8,191,943 2,186,735 1,289,160 3,256,061 157,669 1,302,3182011 8,526,175 456,330 8,069,845 2,515,818 1,300,674 3,384,096 137,972 731,2852012 9,281,178 382,033 8,899,145 3,019,537 1,370,892 3,261,992 418,749 827,9752013 10,691,677 331,885 10,359,792 3,908,263 1,552,428 3,595,785 443,579 859,7372014 11,440,076 314,491 11,125,585 3,722,865 1,631,926 4,448,749 360,167 961,8782015 13,166,665 478,529 12,688,136 4,198,595 1,638,580 5,279,047 374,426 1,197,4882016 16,232,590 464,605 15,767,985 5,416,319 1,818,418 6,068,299 409,585 2,055,3642017 16,896,543 410,693 16,485,850 5,077,302 1,688,498 7,144,276 381,903 2,193,8722010March 8,055,341 267,737 7,787,604 1,850,206 1,180,996 2,897,067 171,408 1,687,927June 8,536,657 291,831 8,244,826 2,031,894 1,232,608 3,153,961 150,514 1,675,849September 8,590,957 319,381 8,271,576 1,933,534 1,253,606 3,457,788 161,250 1,465,398December 8,508,215 316,272 8,191,943 2,186,735 1,289,160 3,256,061 157,669 1,302,3182011March 8,394,343 343,442 8,050,901 1,898,235 1,240,056 3,836,028 356,193 720,389June 8,503,288 362,500 8,140,788 2,071,905 1,265,872 3,938,280 157,737 706,994September 8,460,795 378,493 8,082,302 2,524,290 1,277,209 3,337,175 149,792 793,837December 8,526,175 456,330 8,069,845 2,515,818 1,300,674 3,384,096 137,972 731,2852012March 8,486,417 537,275 7,949,142 2,387,207 1,270,836 3,059,184 412,635 819,280June 8,787,975 658,296 8,129,679 2,517,756 1,339,561 3,075,479 401,884 794,999September 8,990,747 438,458 8,552,289 2,955,508 1,346,125 2,983,103 425,879 841,674December 9,281,178 382,033 8,899,145 3,019,537 1,370,892 3,261,992 418,749 827,9752013March 9,774,985 413,938 9,361,047 3,126,301 1,360,063 3,476,081 450,305 948,297June 9,408,550 366,300 9,042,250 2,915,954 1,443,449 3,150,096 582,186 950,565September 10,185,456 360,239 9,825,217 3,318,358 1,471,969 3,541,340 553,569 939,981December 10,691,677 331,885 10,359,792 3,908,263 1,552,428 3,595,785 443,579 859,7372014January 10,152,889 337,842 9,815,047 3,184,750 1,512,890 3,758,849 498,995 859,563February 10,222,884 364,776 9,858,108 3,125,750 1,494,106 3,883,662 499,652 854,938March 10,328,487 326,731 10,001,756 3,365,344 1,505,542 3,730,800 484,575 915,495April 10,436,098 319,207 10,116,891 3,542,859 1,566,559 3,656,642 462,485 888,346May 10,597,029 294,369 10,302,660 3,268,640 1,548,562 4,070,874 483,125 931,459June 11,064,758 337,779 10,726,979 3,463,400 1,540,223 4,287,032 486,711 949,613July 10,689,700 298,924 10,390,776 3,304,805 1,570,476 4,092,474 489,348 933,673August 10,848,138 355,948 10,492,190 3,445,153 1,586,774 3,949,927 569,371 940,965September 10,934,719 358,780 10,575,939 3,565,887 1,579,121 3,843,274 648,705 938,952October 11,039,256 299,477 10,739,779 3,287,902 1,606,315 4,263,225 650,924 931,413November 11,425,848 330,873 11,094,975 3,616,861 1,580,277 4,437,586 535,031 925,220December 11,440,076 314,491 11,125,585 3,722,865 1,631,926 4,448,749 360,167 961,8782015January 11,368,664 364,795 11,003,869 3,575,306 1,556,718 4,405,523 552,011 914,311February 11,135,015 325,324 10,809,691 3,565,948 1,573,503 4,193,858 547,286 929,096March 10,998,004 471,870 10,526,134 3,617,652 1,575,292 3,803,843 443,532 1,085,815April 11,718,658 509,418 11,209,240 3,864,377 1,631,157 4,131,902 558,894 1,022,910May 11,415,531 484,038 10,931,493 3,702,239 1,626,012 4,015,725 528,322 1,059,195June 11,640,749 477,673 11,163,076 3,775,519 1,619,115 4,164,978 508,258 1,095,206July 11,670,795 460,206 11,210,589 3,629,374 1,683,714 4,289,280 515,386 1,092,835August 13,016,269 496,681 12,519,588 4,050,796 1,629,393 5,255,793 409,181 1,174,425September 13,017,720 496,744 12,520,976 4,020,768 1,650,977 5,255,793 409,181 1,184,257October 12,579,763 498,307 12,081,456 3,855,463 1,645,650 5,002,218 390,950 1,187,175November 12,590,166 521,479 12,068,687 3,870,533 1,647,412 4,975,544 451,808 1,123,390December 13,166,665 478,529 12,688,136 4,198,595 1,638,580 5,279,047 374,426 1,197,4882016January 13,279,493 476,257 12,803,236 4,071,312 1,572,625 5,644,402 322,976 1,191,921February 12,879,585 441,705 12,437,880 3,851,739 1,581,627 5,603,671 270,040 1,130,803March 12,531,577 449,353 12,082,224 3,568,968 1,589,476 5,469,251 233,889 1,220,641April 13,024,428 410,542 12,613,886 3,954,238 1,626,017 5,532,840 241,408 1,259,384May 13,281,501 382,769 12,898,732 4,057,452 1,679,359 5,234,266 509,988 1,417,667June 13,216,351 368,828 12,847,523 3,678,716 1,709,910 4,795,324 927,043 1,736,530July 13,854,798 486,257 13,368,540 3,836,990 1,755,496 5,135,247 953,093 1,687,714August 14,709,394 458,046 14,251,347 4,305,812 1,798,680 5,595,866 889,382 1,661,607September 14,104,036 446,190 13,657,846 4,186,389 1,806,843 5,398,083 684,592 1,581,939October 14,210,357 449,954 13,760,403 4,276,133 1,808,323 5,188,525 643,588 1,843,834November 15,497,971 471,167 15,026,804 4,450,484 1,802,105 6,337,452 376,101 2,060,663December 16,232,590 464,605 15,767,985 5,416,319 1,818,418 6,068,299 409,585 2,055,3642017January 14,676,801 448,096 14,228,705 4,465,158 1,746,440 5,570,393 404,457 2,042,257February 14,602,428 425,051 14,177,377 4,458,659 1,729,286 5,522,716 438,856 2,027,861March 13,819,383 378,162 13,441,221 4,142,521 1,770,304 4,995,274 471,172 2,061,949April 14,277,035 460,890 13,816,145 4,495,675 1,735,201 5,375,576 402,201 1,807,492May 15,115,881 518,235 14,597,646 4,571,892 1,777,989 6,125,949 388,391 1,733,425June 15,998,322 421,468 15,576,854 5,013,025 1,741,359 6,342,361 599,862 1,880,246July 16,037,989 449,487 15,588,502 4,674,636 1,605,264 6,638,519 608,627 2,061,456August 16,369,134 473,904 15,895,229 4,578,029 1,581,508 6,712,566 825,634 2,197,491September 16,628,867 445,020 16,183,847 4,911,193 1,611,958 6,678,934 737,333 2,244,430October 16,635,235 443,078 16,192,157 4,788,446 1,625,623 7,025,781 595,135 2,157,171November 17,304,043 409,959 16,894,084 4,914,983 1,727,522 7,549,751 595,870 2,105,957December 16,896,543 410,693 16,485,850 5,077,302 1,688,498 7,144,276 381,903 2,193,8722018January 17,365,980 670,398 16,695,582 5,272,200 1,649,260 6,670,419 1,039,700 2,064,004February 17,035,058 434,441 16,600,617 5,172,972 1,644,967 6,947,625 607,454 2,227,599March 16,242,839 397,708 15,845,132 5,135,939 1,630,507 6,409,055 469,551 2,200,080April 17,084,906 389,696 16,695,210 5,660,457 1,619,316 6,884,197 591,049 1,940,191May 16,583,306 420,767 16,162,540 5,036,488 1,631,102 6,693,160 764,346 2,037,444June 16,809,548 429,275 16,380,274 5,288,946 1,646,674 6,492,234 779,581 2,172,839ChangeOver 12Months 811,226 7,806 803,420 275,921 (94,685) 149,873 179,719 292,593------------------------------- ------------------------- ------------------------- ------------------------- ------------------------- ------------------------- ------------------------- ------------------------- -------------------------ESWATINI BUILDING SOCIETY DATA IS INCLUDED FROM DECEMBER 2003.Time deposits are classified into Short-term (1-90 days maturity), medium-term(91-365 days maturity) and Long-term(over 365 days maturity).
Table S 3.10CLASSIFICATION OF SELECTED OTHER DEPOSITORY CORPORATIONS DEPOSITS
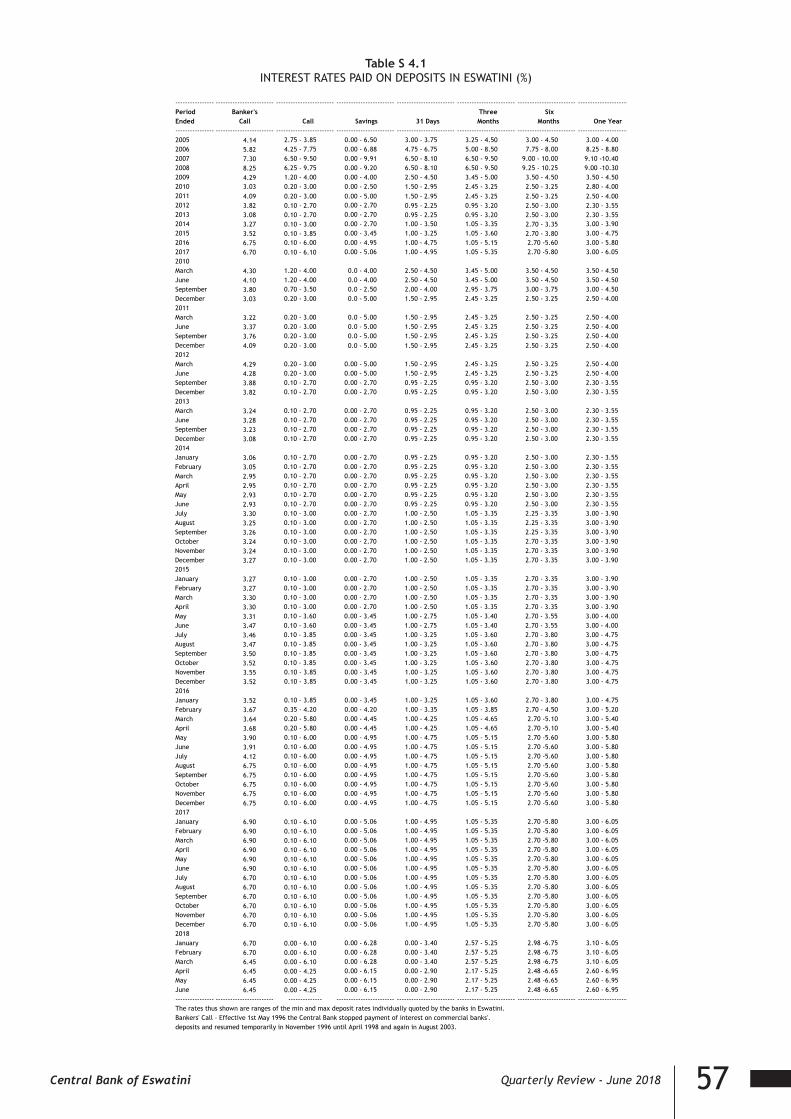
57Central Bank of Eswatini Quarterly Review - June 2018
Table S 4.1INTEREST RATES PAID ON DEPOSITS IN ESWATINI (%)
Table S.4.1INTEREST RATES PAID ON DEPOSITS IN SWAZILAND(%)
---------------- ------------------------ ------------------------ ------------------------ ------------------------ ------------------------ ------------------------ ------------------------Period Banker's Three SixEnded Call Call Savings 31 Days Months Months One Year---------------- ------------------------ ------------------------ ------------------------ ------------------------ ------------------------ ------------------------ ------------------------2005 4.14 2.75 - 3.85 0.00 - 6.50 3.00 - 3.75 3.25 - 4.50 3.00 - 4.50 3.00 - 4.002006 5.82 4.25 - 7.75 0.00 - 6.88 4.75 - 6.75 5.00 - 8.50 7.75 - 8.00 8.25 - 8.802007 7.30 6.50 - 9.50 0.00 - 9.91 6.50 - 8.10 6.50 - 9.50 9.00 - 10.00 9.10 -10.402008 8.25 6.25 - 9.75 0.00 - 9.20 6.50 - 8.10 6.50 - 9.50 9.25 - 10.25 9.00 -10.302009 4.29 1.20 - 4.00 0.00 - 4.00 2.50 - 4.50 3.45 - 5.00 3.50 - 4.50 3.50 - 4.502010 3.03 0.20 - 3.00 0.00 - 2.50 1.50 - 2.95 2.45 - 3.25 2.50 - 3.25 2.80 - 4.002011 4.09 0.20 - 3.00 0.00 - 5.00 1.50 - 2.95 2.45 - 3.25 2.50 - 3.25 2.50 - 4.002012 3.82 0.10 - 2.70 0.00 - 2.70 0.95 - 2.25 0.95 - 3.20 2.50 - 3.00 2.30 - 3.552013 3.08 0.10 - 2.70 0.00 - 2.70 0.95 - 2.25 0.95 - 3.20 2.50 - 3.00 2.30 - 3.552014 3.27 0.10 - 3.00 0.00 - 2.70 1.00 - 3.50 1.05 - 3.35 2.70 - 3.35 3.00 - 3.902015 3.52 0.10 - 3.85 0.00 - 3.45 1.00 - 3.25 1.05 - 3.60 2.70 - 3.80 3.00 - 4.752016 6.75 0.10 - 6.00 0.00 - 4.95 1.00 - 4.75 1.05 - 5.15 2.70 -5.60 3.00 - 5.802017 6.70 0.10 - 6.10 0.00 - 5.06 1.00 - 4.95 1.05 - 5.35 2.70 -5.80 3.00 - 6.052010March 4.30 1.20 - 4.00 0.0 - 4.00 2.50 - 4.50 3.45 - 5.00 3.50 - 4.50 3.50 - 4.50June 4.10 1.20 - 4.00 0.0 - 4.00 2.50 - 4.50 3.45 - 5.00 3.50 - 4.50 3.50 - 4.50September 3.80 0.70 - 3.50 0.0 - 2.50 2.00 - 4.00 2.95 - 3.75 3.00 - 3.75 3.00 - 4.50December 3.03 0.20 - 3.00 0.0 - 5.00 1.50 - 2.95 2.45 - 3.25 2.50 - 3.25 2.50 - 4.002011March 3.22 0.20 - 3.00 0.0 - 5.00 1.50 - 2.95 2.45 - 3.25 2.50 - 3.25 2.50 - 4.00June 3.37 0.20 - 3.00 0.0 - 5.00 1.50 - 2.95 2.45 - 3.25 2.50 - 3.25 2.50 - 4.00September 3.76 0.20 - 3.00 0.0 - 5.00 1.50 - 2.95 2.45 - 3.25 2.50 - 3.25 2.50 - 4.00December 4.09 0.20 - 3.00 0.0 - 5.00 1.50 - 2.95 2.45 - 3.25 2.50 - 3.25 2.50 - 4.002012March 4.29 0.20 - 3.00 0.00 - 5.00 1.50 - 2.95 2.45 - 3.25 2.50 - 3.25 2.50 - 4.00June 4.28 0.20 - 3.00 0.00 - 5.00 1.50 - 2.95 2.45 - 3.25 2.50 - 3.25 2.50 - 4.00September 3.88 0.10 - 2.70 0.00 - 2.70 0.95 - 2.25 0.95 - 3.20 2.50 - 3.00 2.30 - 3.55December 3.82 0.10 - 2.70 0.00 - 2.70 0.95 - 2.25 0.95 - 3.20 2.50 - 3.00 2.30 - 3.552013March 3.24 0.10 - 2.70 0.00 - 2.70 0.95 - 2.25 0.95 - 3.20 2.50 - 3.00 2.30 - 3.55June 3.28 0.10 - 2.70 0.00 - 2.70 0.95 - 2.25 0.95 - 3.20 2.50 - 3.00 2.30 - 3.55September 3.23 0.10 - 2.70 0.00 - 2.70 0.95 - 2.25 0.95 - 3.20 2.50 - 3.00 2.30 - 3.55December 3.08 0.10 - 2.70 0.00 - 2.70 0.95 - 2.25 0.95 - 3.20 2.50 - 3.00 2.30 - 3.552014January 3.06 0.10 - 2.70 0.00 - 2.70 0.95 - 2.25 0.95 - 3.20 2.50 - 3.00 2.30 - 3.55February 3.05 0.10 - 2.70 0.00 - 2.70 0.95 - 2.25 0.95 - 3.20 2.50 - 3.00 2.30 - 3.55March 2.95 0.10 - 2.70 0.00 - 2.70 0.95 - 2.25 0.95 - 3.20 2.50 - 3.00 2.30 - 3.55April 2.95 0.10 - 2.70 0.00 - 2.70 0.95 - 2.25 0.95 - 3.20 2.50 - 3.00 2.30 - 3.55May 2.93 0.10 - 2.70 0.00 - 2.70 0.95 - 2.25 0.95 - 3.20 2.50 - 3.00 2.30 - 3.55June 2.93 0.10 - 2.70 0.00 - 2.70 0.95 - 2.25 0.95 - 3.20 2.50 - 3.00 2.30 - 3.55July 3.30 0.10 - 3.00 0.00 - 2.70 1.00 - 2.50 1.05 - 3.35 2.25 - 3.35 3.00 - 3.90August 3.25 0.10 - 3.00 0.00 - 2.70 1.00 - 2.50 1.05 - 3.35 2.25 - 3.35 3.00 - 3.90September 3.26 0.10 - 3.00 0.00 - 2.70 1.00 - 2.50 1.05 - 3.35 2.25 - 3.35 3.00 - 3.90October 3.24 0.10 - 3.00 0.00 - 2.70 1.00 - 2.50 1.05 - 3.35 2.70 - 3.35 3.00 - 3.90November 3.24 0.10 - 3.00 0.00 - 2.70 1.00 - 2.50 1.05 - 3.35 2.70 - 3.35 3.00 - 3.90December 3.27 0.10 - 3.00 0.00 - 2.70 1.00 - 2.50 1.05 - 3.35 2.70 - 3.35 3.00 - 3.902015January 3.27 0.10 - 3.00 0.00 - 2.70 1.00 - 2.50 1.05 - 3.35 2.70 - 3.35 3.00 - 3.90February 3.27 0.10 - 3.00 0.00 - 2.70 1.00 - 2.50 1.05 - 3.35 2.70 - 3.35 3.00 - 3.90March 3.30 0.10 - 3.00 0.00 - 2.70 1.00 - 2.50 1.05 - 3.35 2.70 - 3.35 3.00 - 3.90April 3.30 0.10 - 3.00 0.00 - 2.70 1.00 - 2.50 1.05 - 3.35 2.70 - 3.35 3.00 - 3.90May 3.31 0.10 - 3.60 0.00 - 3.45 1.00 - 2.75 1.05 - 3.40 2.70 - 3.55 3.00 - 4.00June 3.47 0.10 - 3.60 0.00 - 3.45 1.00 - 2.75 1.05 - 3.40 2.70 - 3.55 3.00 - 4.00July 3.46 0.10 - 3.85 0.00 - 3.45 1.00 - 3.25 1.05 - 3.60 2.70 - 3.80 3.00 - 4.75August 3.47 0.10 - 3.85 0.00 - 3.45 1.00 - 3.25 1.05 - 3.60 2.70 - 3.80 3.00 - 4.75September 3.50 0.10 - 3.85 0.00 - 3.45 1.00 - 3.25 1.05 - 3.60 2.70 - 3.80 3.00 - 4.75October 3.52 0.10 - 3.85 0.00 - 3.45 1.00 - 3.25 1.05 - 3.60 2.70 - 3.80 3.00 - 4.75November 3.55 0.10 - 3.85 0.00 - 3.45 1.00 - 3.25 1.05 - 3.60 2.70 - 3.80 3.00 - 4.75December 3.52 0.10 - 3.85 0.00 - 3.45 1.00 - 3.25 1.05 - 3.60 2.70 - 3.80 3.00 - 4.752016January 3.52 0.10 - 3.85 0.00 - 3.45 1.00 - 3.25 1.05 - 3.60 2.70 - 3.80 3.00 - 4.75February 3.67 0.35 - 4.20 0.00 - 4.20 1.00 - 3.35 1.05 - 3.85 2.70 - 4.50 3.00 - 5.20March 3.64 0.20 - 5.80 0.00 - 4.45 1.00 - 4.25 1.05 - 4.65 2.70 -5.10 3.00 - 5.40April 3.68 0.20 - 5.80 0.00 - 4.45 1.00 - 4.25 1.05 - 4.65 2.70 -5.10 3.00 - 5.40May 3.90 0.10 - 6.00 0.00 - 4.95 1.00 - 4.75 1.05 - 5.15 2.70 -5.60 3.00 - 5.80June 3.91 0.10 - 6.00 0.00 - 4.95 1.00 - 4.75 1.05 - 5.15 2.70 -5.60 3.00 - 5.80July 4.12 0.10 - 6.00 0.00 - 4.95 1.00 - 4.75 1.05 - 5.15 2.70 -5.60 3.00 - 5.80August 6.75 0.10 - 6.00 0.00 - 4.95 1.00 - 4.75 1.05 - 5.15 2.70 -5.60 3.00 - 5.80September 6.75 0.10 - 6.00 0.00 - 4.95 1.00 - 4.75 1.05 - 5.15 2.70 -5.60 3.00 - 5.80October 6.75 0.10 - 6.00 0.00 - 4.95 1.00 - 4.75 1.05 - 5.15 2.70 -5.60 3.00 - 5.80November 6.75 0.10 - 6.00 0.00 - 4.95 1.00 - 4.75 1.05 - 5.15 2.70 -5.60 3.00 - 5.80December 6.75 0.10 - 6.00 0.00 - 4.95 1.00 - 4.75 1.05 - 5.15 2.70 -5.60 3.00 - 5.802017January 6.90 0.10 - 6.10 0.00 - 5.06 1.00 - 4.95 1.05 - 5.35 2.70 -5.80 3.00 - 6.05February 6.90 0.10 - 6.10 0.00 - 5.06 1.00 - 4.95 1.05 - 5.35 2.70 -5.80 3.00 - 6.05March 6.90 0.10 - 6.10 0.00 - 5.06 1.00 - 4.95 1.05 - 5.35 2.70 -5.80 3.00 - 6.05April 6.90 0.10 - 6.10 0.00 - 5.06 1.00 - 4.95 1.05 - 5.35 2.70 -5.80 3.00 - 6.05May 6.90 0.10 - 6.10 0.00 - 5.06 1.00 - 4.95 1.05 - 5.35 2.70 -5.80 3.00 - 6.05June 6.90 0.10 - 6.10 0.00 - 5.06 1.00 - 4.95 1.05 - 5.35 2.70 -5.80 3.00 - 6.05July 6.70 0.10 - 6.10 0.00 - 5.06 1.00 - 4.95 1.05 - 5.35 2.70 -5.80 3.00 - 6.05August 6.70 0.10 - 6.10 0.00 - 5.06 1.00 - 4.95 1.05 - 5.35 2.70 -5.80 3.00 - 6.05September 6.70 0.10 - 6.10 0.00 - 5.06 1.00 - 4.95 1.05 - 5.35 2.70 -5.80 3.00 - 6.05October 6.70 0.10 - 6.10 0.00 - 5.06 1.00 - 4.95 1.05 - 5.35 2.70 -5.80 3.00 - 6.05November 6.70 0.10 - 6.10 0.00 - 5.06 1.00 - 4.95 1.05 - 5.35 2.70 -5.80 3.00 - 6.05December 6.70 0.10 - 6.10 0.00 - 5.06 1.00 - 4.95 1.05 - 5.35 2.70 -5.80 3.00 - 6.052018January 6.70 0.00 - 6.10 0.00 - 6.28 0.00 - 3.40 2.57 - 5.25 2.98 -6.75 3.10 - 6.05February 6.70 0.00 - 6.10 0.00 - 6.28 0.00 - 3.40 2.57 - 5.25 2.98 -6.75 3.10 - 6.05March 6.45 0.00 - 6.10 0.00 - 6.28 0.00 - 3.40 2.57 - 5.25 2.98 -6.75 3.10 - 6.05April 6.45 0.00 - 4.25 0.00 - 6.15 0.00 - 2.90 2.17 - 5.25 2.48 -6.65 2.60 - 6.95May 6.45 0.00 - 4.25 0.00 - 6.15 0.00 - 2.90 2.17 - 5.25 2.48 -6.65 2.60 - 6.95June 6.45 0.00 - 4.25 0.00 - 6.15 0.00 - 2.90 2.17 - 5.25 2.48 -6.65 2.60 - 6.95---------------- ------------------------ -------------- ------------------------ ------------------------ ------------------------ ------------------------ ------------------------The rates thus shown are ranges of the min and max deposit rates individually quoted by the banks in Eswatini.Bankers' Call - Effective 1st May 1996 the Central Bank stopped payment of interest on commercial banks'.deposits and resumed temporarily in November 1996 until April 1998 and again in August 2003.

58 Central Bank of Eswatini Quarterly Review - June 2018
Table S 4.2COMPARATIVE INTEREST RATES: ESWATINI AND SOUTH AFRICA
TABLE S 4.2COMPARATIVE INTEREST RATES: Eswatini AND SOUTH AFRICA(%)
---------------------- ----------------------- ----------------------- -------------------- ----------------------- ----------------------- ----------------------- ----------------------- ----------------------- ----------------------- ----------------------- ----------------------- Bank Deposits
----------------------- ----------------------- ----------------------- ----------------------- 31 days 12 months
---------------------- ----------------------- ----------------------- ------------------- ----------------------- ----------------------- ----------------------- ----------------------- ----------------------- ----------------------- ----------------------- ----------------------- Central *S.A. S.A.R.B.
Period Bank of Reserve Marginal Lending South South South SouthEnded Eswatini Bank Facility Eswatini Africa Eswatini Africa Eswatini Africa Eswatini Africa---------------------- ----------------------- ----------------------- ------------------- ----------------------- ----------------------- ----------------------- ----------------------- ----------------------- ----------------------- ----------------------- -----------------------2005 7.00 7.00 12.00 6.88 6.78 10.50 10.50 3.41 6.82 3.46 7.282006 9.00 9.00 14.00 8.49 8.49 12.50 12.50 5.41 8.94 8.51 9.552007 11.00 11.00 16.00 9.96 10.00 14.50 14.50 7.30 10.94 10.00 11.812008 11.00 11.50 16.00 10.95 10.79 14.50 15.00 7.30 11.37 9.81 9.902009 6.50 7.00 11.50 6.98 7.14 10.00 10.50 3.71 6.85 4.02 7.772010 5.50 5.50 10.50 5.73 5.60 9.00 9.00 2.43 5.42 3.18 5.732011 5.50 5.50 10.50 6.79 5.52 9.00 9.00 2.43 5.78 3.18 6.072012 5.00 5.00 10.00 6.52 5.07 8.50 8.50 1.81 4.98 2.97 5.392013 5.00 5.00 10.00 5.95 5.29 8.50 8.50 1.81 5.11 2.97 5.922014 5.25 5.75 10.75 6.57 5.83 8.75 9.25 1.94 5.85 3.24 6.692015 5.75 6.25 11.25 6.44 6.85 9.25 9.75 3.00 6.53 3.78 8.142016 7.00 7.00 12.00 7.97 7.66 10.50 10.50 3.45 7.22 4.89 8.432017 7.25 6.75 11.75 7.86 7.47 10.75 10.25 3.44 6.95 5.03 7.652010March 6.50 6.50 11.50 6.98 6.59 10.00 10.00 3.71 6.47 4.02 7.09June 6.50 6.50 11.50 6.80 6.54 10.00 10.00 3.71 6.39 4.02 7.13September 6.00 6.00 11.00 6.80 6.03 9.50 9.50 3.10 5.94 3.76 6.36December 5.50 5.50 10.50 5.72 5.60 9.00 9.00 2.43 5.42 3.18 5.732011March 5.50 5.50 10.50 5.91 5.54 9.00 9.00 2.43 5.39 3.18 5.88June 5.50 5.50 10.50 6.28 5.55 9.00 9.00 2.43 5.28 3.18 6.03September 5.50 5.50 10.50 6.42 5.41 9.00 9.00 2.43 5.51 3.18 5.72December 5.50 5.50 10.50 6.79 5.52 9.00 9.00 2.43 5.78 3.18 6.072012March 5.50 5.50 10.50 6.99 5.47 9.00 9.00 2.43 5.40 3.18 6.23June 5.50 5.50 10.50 7.49 5.50 9.00 9.00 2.43 5.44 3.18 5.85September 5.00 5.00 10.00 7.21 4.92 8.50 8.50 1.81 4.91 2.97 5.30December 5.00 5.00 10.00 6.52 5.07 8.50 8.50 1.81 4.98 2.97 5.392013March 5.00 5.00 10.00 6.80 5.08 8.50 8.50 1.81 4.97 2.97 5.42June 5.00 5.00 10.00 6.41 5.15 8.50 8.50 1.81 5.08 2.97 5.70September 5.00 5.00 10.00 6.40 5.13 8.50 8.50 1.81 5.11 2.97 5.97December 5.00 5.00 10.00 6.29 5.29 8.50 8.50 1.81 5.11 2.97 5.922014January 5.00 5.50 10.00 6.34 5.66 8.50 9.00 1.81 5.47 2.97 7.15February 5.00 5.50 10.50 6.18 5.97 8.50 9.00 1.81 5.49 2.97 7.05March 5.00 5.50 10.50 6.41 5.69 8.50 9.00 1.81 5.54 2.97 6.90April 5.00 5.50 10.50 6.86 5.76 8.50 9.00 1.81 5.58 2.97 6.95May 5.00 5.50 10.50 6.37 5.71 8.50 9.00 1.81 5.70 2.97 6.83June 5.00 5.50 10.50 7.00 5.81 8.50 9.00 1.81 5.72 2.97 6.97July 5.25 5.75 10.75 6.20 5.87 8.75 9.25 1.94 5.79 3.24 6.96August 5.25 5.75 10.75 6.34 5.95 8.75 9.25 1.94 5.84 3.24 7.03September 5.25 5.75 10.75 6.27 6.00 8.75 9.25 1.94 5.97 3.24 7.18October 5.25 5.75 10.75 6.56 5.84 8.75 9.25 1.94 5.96 3.24 7.05November 5.25 5.75 10.75 6.57 5.92 8.75 9.25 1.94 5.83 3.24 6.91December 5.25 5.75 10.75 6.57 5.83 8.75 9.25 1.94 5.85 3.24 6.692015January 5.25 5.75 10.75 6.38 5.83 8.75 9.25 1.94 5.85 3.24 6.69February 5.25 5.75 10.75 6.38 5.85 8.75 9.25 1.94 5.90 3.24 6.92March 5.25 5.75 10.75 6.39 5.78 8.75 9.25 1.94 5.94 3.24 7.14April 5.25 5.75 10.75 6.36 5.81 8.75 9.25 1.94 5.96 3.24 7.22May 5.50 5.75 10.75 6.39 5.79 9.00 9.25 2.30 6.00 3.41 7.26June 5.50 5.75 10.75 6.44 6.09 9.00 9.25 2.30 6.08 3.41 7.34July 5.75 6.00 11.00 6.48 6.20 9.25 9.50 3.00 6.23 3.78 7.29August 5.75 6.00 11.00 6.51 6.25 9.25 9.50 3.00 6.21 3.78 7.43September 5.75 6.00 11.00 6.51 6.19 9.25 9.50 3.00 6.22 3.78 7.30October 5.75 6.00 11.00 6.50 6.31 9.25 9.50 3.00 6.22 3.78 7.33November 5.75 6.25 11.25 6.49 6.61 9.25 9.75 3.00 6.27 3.78 7.58December 5.75 6.25 11.25 6.44 6.85 9.25 9.75 3.00 6.53 3.78 8.142016January 5.75 6.75 11.75 6.49 6.91 9.25 10.25 2.31 6.92 3.78 8.32February 6.25 6.75 11.75 7.01 7.01 9.75 10.25 2.69 6.98 4.29 8.65March 6.50 7.00 12.00 6.65 7.14 10.00 10.50 3.06 7.30 4.48 8.62April 6.50 7.00 12.00 6.85 7.31 10.00 10.50 3.06 7.32 4.48 8.63May 7.00 7.00 12.00 7.00 7.19 10.50 10.50 3.45 7.29 4.89 8.64June 7.00 7.00 12.00 7.17 7.22 10.50 10.50 3.45 7.36 4.89 8.66July 7.00 7.00 12.00 7.19 7.20 10.50 10.50 3.45 7.30 4.89 8.55August 7.00 7.00 12.00 7.22 7.32 10.50 10.50 3.45 7.28 4.89 8.55September 7.00 7.00 12.00 7.35 7.32 10.50 10.50 3.45 7.16 4.89 8.44October 7.00 7.00 12.00 7.68 7.31 10.50 10.50 3.45 7.31 4.89 8.51November 7.00 7.00 12.00 7.84 7.53 10.50 10.50 3.45 7.36 4.89 8.54December 7.00 7.00 12.00 7.97 7.66 10.50 10.50 3.45 7.22 4.89 8.432017January 7.25 7.00 12.00 8.05 7.36 10.75 10.50 3.44 7.00 5.03 8.37February 7.25 7.00 12.00 8.11 7.23 10.75 10.50 3.44 7.00 5.03 8.18March 7.25 7.00 12.00 8.19 7.17 10.75 10.50 3.44 6.98 5.03 8.06April 7.25 7.00 12.00 8.31 7.28 10.75 10.50 3.44 7.09 5.03 8.00May 7.25 7.00 12.00 8.36 7.21 10.75 10.50 3.44 7.17 5.03 7.90June 7.25 7.00 12.00 8.26 7.17 10.75 10.50 3.44 7.15 5.03 7.91July 7.25 6.75 11.75 8.15 6.98 10.75 10.25 3.44 6.97 5.03 7.55August 7.25 6.75 11.75 8.08 6.94 10.75 10.25 3.44 6.88 5.03 7.38September 7.25 6.75 11.75 7.96 6.96 10.75 10.25 3.44 6.96 5.03 7.59October 7.25 6.75 11.75 7.86 7.27 10.75 10.25 3.44 6.99 5.03 7.85November 7.25 6.75 11.75 7.81 7.37 10.75 10.25 3.44 6.94 5.03 8.04December 7.25 6.75 11.75 7.86 7.47 10.75 10.25 3.44 6.95 5.03 7.652018January 7.00 6.75 11.75 7.88 7.22 10.50 10.25 2.53 6.79 4.92 7.69February 7.00 6.75 11.75 7.82 7.01 10.50 10.25 2.53 6.90 4.92 7.72March 6.75 6.50 11.50 7.79 6.90 10.50 10.00 2.53 6.85 4.92 7.66April 6.75 6.50 11.50 7.77 7.00 10.25 10.00 2.24 6.76 4.59 7.61May 6.75 6.50 11.50 7.67 7.07 10.25 10.00 2.24 6.74 4.59 7.80June 6.75 6.50 11.50 7.61 7.19 10.25 10.00 2.24 6.74 4.59 7.95---------------------- ----------------------- ----------------------- --------------------- ---------------------------------------------- ----------------------- ---------------------------------------------- ----------------------- ----------------------- -----------------------
*Effective 9th March 1998, the South African Reserve Bank introduced a new accomodation policy for banks on the basis of repurchase agreements (repos) replacing the discount rate facility.
There is also the marginal lending facility which is currently higher than the repo rate.
Rates on large-scale interbank deposits as well as other money rates often diverge widely from the deposit rates offered to the general public. Since July, 1985 deposit rates are average based on rates quoted by the banks to the public in Eswatini.
Discount Rate Treasury Bills Prime Lending
The latest South African prime lending and bank deposit rates are obtained from the weekly publications, the FINANCE WEEK and the FINANCIAL MAIL. The quartely Bulletin of the South African Reserve Bank is source for other South African rates .
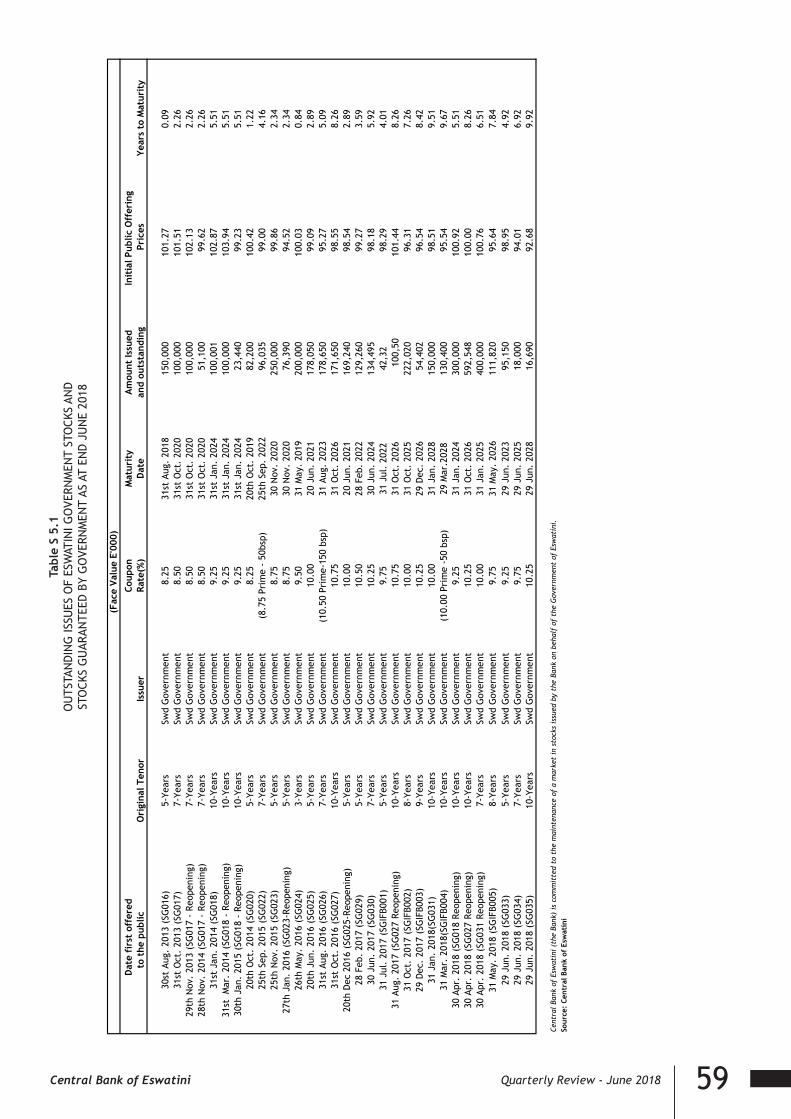
59Central Bank of Eswatini Quarterly Review - June 2018
Tabl
e S
5.1
OU
TSTA
ND
ING
ISSU
ES O
F ES
WAT
INI G
OVE
RNM
ENT
STO
CKS
AND
STO
CKS
GU
ARAN
TEED
BY
GO
VERN
MEN
T AS
AT
END
JU
NE
2018
T
able
S 5
.1
OU
TSTA
ND
ING
ISSU
ES O
F ES
WA
TIN
I GO
VER
NM
ENT
STO
CKS
AN
D
ST
OCK
S G
UA
RAN
TEED
BY
GO
VER
NM
ENT
AS
AT
END
-JU
NE
2018
(
Face
Val
ue E
'000
)
Dat
e fi
rst
offe
red
Coup
onM
atur
ity
Am
ount
Issu
edIn
itia
l Pub
lic O
ffer
ing
to
the
pub
lic
Ori
gina
l Ten
orIs
suer
Rate
(%)
Dat
ean
d ou
tsta
ndin
gPr
ices
Year
s to
Mat
urit
y
30st
Aug
. 20
13 (
SG01
6)5-
Year
sSw
d G
over
nmen
t8.
2531
st A
ug.
2018
150,
000
101.
270.
0931
st O
ct.
2013
(SG
017)
7-Ye
ars
Swd
Gov
ernm
ent
8.50
31st
Oct
. 20
2010
0,00
010
1.51
2.26
29th
Nov
. 20
13 (
SG01
7 -
Reop
enin
g)7-
Year
sSw
d G
over
nmen
t8.
5031
st O
ct.
2020
100,
000
102.
132.
2628
th N
ov.
2014
(SG
017
- Re
open
ing)
7-Ye
ars
Swd
Gov
ernm
ent
8.50
31st
Oct
. 20
2051
,100
99.6
22.
2631
st J
an.
2014
(SG
018)
10-Y
ears
Swd
Gov
ernm
ent
9.25
31st
Jan
. 20
2410
0,00
110
2.87
5.51
31st
Mar
. 20
14 (
SG01
8 -
Reop
enin
g)10
-Yea
rsSw
d G
over
nmen
t9.
2531
st J
an.
2024
100,
000
103.
945.
5130
th J
an.
2015
(SG
018
- Re
open
ing)
10-Y
ears
Swd
Gov
ernm
ent
9.25
31st
Jan
. 20
2423
,440
99.2
35.
5120
th O
ct.
2014
(SG
020)
5-Ye
ars
Swd
Gov
ernm
ent
8.25
20th
Oct
. 20
1982
,200
100.
421.
2225
th S
ep.
2015
(SG
022)
7-Ye
ars
Swd
Gov
ernm
ent
(8.7
5 Pr
ime
- 50
bsp)
25th
Sep
. 20
2296
,035
99.0
04.
1625
th N
ov.
2015
(SG
023)
5-Ye
ars
Swd
Gov
ernm
ent
8.75
30 N
ov.
2020
250,
000
99.8
62.
3427
th J
an.
2016
(SG
023-
Reop
enin
g)5-
Year
sSw
d G
over
nmen
t8.
7530
Nov
. 20
2076
,390
94.5
22.
3426
th M
ay.
2016
(SG
024)
3-Ye
ars
Swd
Gov
ernm
ent
9.50
31 M
ay.
2019
200,
000
100.
030.
8420
th J
un.
2016
(SG
025)
5-Ye
ars
Swd
Gov
ernm
ent
10.0
020
Jun
. 20
2117
8,05
099
.09
2.89
31st
Aug
. 20
16 (
SG02
6)7-
Year
sSw
d G
over
nmen
t(1
0.50
Pri
me-
150
bsp)
31 A
ug.
2023
178,
650
95.2
75.
0931
st O
ct.
2016
(SG
027)
10-Y
ears
Swd
Gov
ernm
ent
10.7
531
Oct
. 20
2617
1,65
098
.55
8.26
20th
Dec
201
6 (S
G02
5-Re
open
ing)
5-Ye
ars
Swd
Gov
ernm
ent
10.0
020
Jun
. 20
2116
9,24
098
.54
2.89
28 F
eb.
2017
(SG
029)
5-Ye
ars
Swd
Gov
ernm
ent
10.5
028
Feb
. 20
2212
9,26
099
.27
3.59
30 J
un.
2017
(SG
030)
7-Ye
ars
Swd
Gov
ernm
ent
10.2
530
Jun
. 20
2413
4,49
598
.18
5.92
31 J
ul.
2017
(SG
IFB0
01)
5-Ye
ars
Swd
Gov
ernm
ent
9.75
31 J
ul.
2022
42,3
2
98.2
94.
0131
Aug
. 20
17 (
SG02
7 Re
open
ing)
10-Y
ears
Swd
Gov
ernm
ent
10.7
531
Oct
. 20
2610
0,50
101.
448.
2631
Oct
. 20
17 (
SGIF
B002
)8-
Year
sSw
d G
over
nmen
t10
.00
31 O
ct.
2025
222,
020
96.3
17.
2629
Dec
. 20
17 (
SGIF
B003
)9-
Year
sSw
d G
over
nmen
t10
.25
29 D
ec.
2026
54,4
0296
.54
8.42
31 J
an.
2018
(SG
031)
10-Y
ears
Swd
Gov
ernm
ent
10.0
031
Jan
. 20
2815
0,00
098
.51
9.51
31 M
ar.
2018
(SG
IFB0
04)
10-Y
ears
Swd
Gov
ernm
ent
(10.
00 P
rim
e -5
0 bs
p)29
Mar
.202
813
0,40
095
.54
9.67
30 A
pr.
2018
(SG
018
Reop
enin
g)10
-Yea
rsSw
d G
over
nmen
t9.
2531
Jan
. 20
2430
0,00
010
0.92
5.51
30 A
pr.
2018
(SG
027
Reop
enin
g)10
-Yea
rsSw
d G
over
nmen
t10
.25
31 O
ct.
2026
592,
548
100.
008.
2630
Apr
. 20
18 (
SG03
1 Re
open
ing)
7-Ye
ars
Swd
Gov
ernm
ent
10.0
031
Jan
. 20
2540
0,00
010
0.76
6.51
31 M
ay.
2018
(SG
IFB0
05)
8-Ye
ars
Swd
Gov
ernm
ent
9.75
31 M
ay.
2026
111,
820
95.6
47.
8429
Jun
. 20
18 (
SG03
3)5-
Year
sSw
d G
over
nmen
t9.
2529
Jun
. 20
2395
,150
98.9
54.
9229
Jun
. 20
18 (
SG03
4)7-
Year
sSw
d G
over
nmen
t9.
7529
Jun
. 20
2518
,000
94.0
16.
9229
Jun
. 20
18 (
SG03
5)10
-Yea
rsSw
d G
over
nmen
t10
.25
29 J
un.
2028
16,6
9092
.68
9.92
Sour
ce:
Cent
ral B
ank
of E
swat
ini
Cent
ral
Bank
of
Esw
atin
i (th
e Ba
nk)
is c
omm
itte
d to
the
mai
nten
ance
of
a m
arke
t in
sto
cks
issu
ed b
y th
e Ba
nk o
n be
half
of
the
Gov
ernm
ent
of E
swat
ini.

60 Central Bank of Eswatini Quarterly Review - June 2018
Table S 5.2 OWNERSHIP OF ESWATINI GOVERNMENT STOCKS AND BILLS
NOMINAL VALUE (E’000)
Amount
Issued Central Non-BankPeriod During Total Bank of Financial AmountEnded Period Outstanding Eswatini Banks Institutions Other Redeemed
2012 4,202,820 2,014,819 60,592 1,316,633 460,217 177,377 3,853,7602013 5,129,319 2,919,348 60,165 1,745,129 920,546 193,508 3,998,4102014 5,122,200 2,950,390 2,890 1,598,764 985,252 363,484 4,792,2692015 4,636,845 3,123,220 1,200 1,555,599 1,334,136 232,285 4,484,9802016 5,604,440 4,413,927 3,885 2,259,746 1,927,956 222,340 4,683,4652017 9,949,925 5,771,384 4,020 2,413,998 3,105,254 248,112 6,952,670
2012January 270,630 1,674,389 57,759 1,051,703 498,497 66,430 279,870February 302,670 1,801,039 58,179 1,135,703 541,497 65,660 176,020March 404,410 1,921,279 58,169 1,298,853 496,497 67,760 281,480April 236,940 1,867,599 57,929 1,218,353 412,517 178,800 275,620May 405,280 1,993,029 58,169 1,312,213 443,887 178,760 279,670June 507,390 2,096,009 58,579 1,403,063 454,887 179,480 404,410July 269,040 2,128,099 60,842 1,428,633 459,887 178,737 236,950August 465,320 2,095,319 60,332 1,395,683 462,517 176,787 498,100September 394,890 2,112,819 60,412 1,421,593 446,137 184,677 377,390October 239,560 2,083,339 60,312 1,390,953 454,297 177,777 269,040November 416,690 2,119,709 60,392 1,437,993 446,967 174,357 380,320December 290,000 2,014,819 60,592 1,316,633 460,217 177,377 394,890
2013January 296,090 2,097,349 58,522 1,397,583 475,397 165,847 213,560February 425,010 2,120,669 58,232 1,444,573 435,607 182,257 401,690March 775,160 2,460,829 58,492 1,754,613 462,927 184,797 435,000April 536,640 2,690,379 58,322 1,955,803 475,927 200,327 307,090May 318,180 2,643,599 58,252 1,936,413 466,427 182,507 364,960June 223,120 2,610,239 58,442 1,884,133 466,427 201,237 280,100July 360,900 2,689,499 58,142 1,881,168 629,140 121,049 281,640August 551,540 2,672,759 58,392 1,874,155 653,250 86,962 318,280September 282,010 2,653,019 58,615 1,908,255 576,490 109,659 301,750October 405,520 2,697,639 62,375 1,814,984 642,267 178,013 360,900November 581,110 2,872,319 58,535 1,720,216 902,450 191,118 406,430December 374,039 2,919,348 60,165 1,745,129 920,546 193,508 327,010
2014January 537,680 3,030,339 59,335 1,680,953 960,250 329,801 426,690February 314,850 2,936,489 58,875 1,652,749 911,924 312,941 408,700March 406,880 2,810,930 1,020 1,524,929 953,047 331,934 363,439April 339,790 2,782,270 1,260 1,473,621 969,185 338,204 368,450May 517,440 2,832,950 1,360 1,525,690 950,597 355,303 466,760June 529,970 2,783,030 1,740 1,496,437 987,599 297,254 450,000July 315,740 2,713,350 1,220 1,394,687 943,739 373,704 385,420August 337,820 2,611,470 1,170 1,250,477 987,109 372,714 439,700September 395,110 2,722,460 1,100 1,301,234 1,046,742 373,384 284,120October 613,810 2,926,450 1,780 1,450,496 1,011,880 462,294 409,820November 371,010 2,905,830 1,950 1,518,421 1,005,155 380,304 391,630December 442,100 2,950,390 2,890 1,598,764 985,252 363,484 397,540
2015January 430,470 2,991,980 2,980 1,596,793 1,014,903 377,304 412,320February 386,320 3,105,930 2,400 1,608,683 1,102,103 392,744 272,370March 316,070 3,050,210 2,610 1,580,223 1,061,709 405,668 371,790April 410,750 3,059,770 3,080 1,625,502 1,030,470 400,718 441,190May 416,200 3,104,480 3,720 1,687,332 1,005,964 407,464 331,490June 319,370 3,163,990 4,930 1,642,202 1,107,964 408,894 259,860July 324,750 3,128,290 3,660 1,605,708 1,064,278 454,644 365,450August 282,800 3,059,880 2,900 1,566,058 1,059,598 431,324 346,210September 417,925 3,238,625 2,570 1,599,567 1,401,832 234,656 239,180October 511,540 3,362,927 2,360 1,726,490 1,384,761 249,316 387,240November 484,430 3,257,030 2,330 1,640,630 1,307,501 306,569 601,970December 336,220 3,123,220 1,200 1,555,599 1,334,136 232,285 455,910
2016January 404,510 3,106,620 1,350 1,548,350 1,274,108 282,812 412,760February 339,340 3,140,151 1,650 1,574,460 1,261,365 302,676 305,810March 365,700 3,240,311 3,050 1,580,202 1,419,478 237,581 265,540April 385,690 3,125,101 2,720 1,646,602 1,336,170 139,609 500,900May 358,850 3,313,062 2,570 1,681,046 1,490,686 138,760 370,890June 446,820 3,473,446 2,680 1,765,316 1,567,566 137,884 464,485July 564,930 3,615,987 1,850 1,951,586 1,522,316 140,235 422,390August 596,550 3,945,427 3,280 2,222,826 1,562,166 157,155 267,110September 552,870 4,024,417 3,280 2,252,656 1,611,176 157,305 473,880October 482,240 4,151,877 2,490 2,182,096 1,804,876 162,415 354,780November 334,440 4,123,407 3,460 2,133,816 1,824,116 162,015 362,910December 772,500 4,413,927 3,885 2,259,746 1,927,956 222,340 482,010
2017January 513,560 4,549,927 3,295 2,309,316 1,999,506 237,810 377,530February 562,680 4,751,586 3,155 2,320,556 2,186,955 240,920 361,020March 372,230 4,790,487 3,065 2,352,875 2,197,657 236,890 333,330April 376,010 4,764,117 2,875 2,136,716 2,387,656 236,870 362,380May 412,530 4,779,837 3,185 2,162,602 2,377,570 236,480 396,810June 510,385 4,817,252 3,565 2,094,692 2,494,230 224,765 472,970July 439,850 4,932,302 2,515 2,271,842 2,414,330 243,615 324,800August 540,500 5,161,792 2,670 2,229,117 2,685,175 244,830 311,010September 500,680 5,277,292 2,850 2,395,938 2,631,874 246,630 385,180October 662,020 5,591,612 2,960 2,478,328 2,861,754 248,570 347,700November 435,960 5,646,102 3,460 2,432,458 2,960,114 250,070 381,470December 469,302 5,771,384 4,020 2,413,998 3,105,254 248,112 344,020
2018January 448,250 5,746,840 3,420 2,452,020 3,048,500 242,900 356,460February 436,270 5,781,920 3,600 2,382,080 3,137,510 258,730 416,190March 514,810 6,059,900 3,320 2,430,860 3,314,980 310,740 417,230April 1,674,708 7,327,510 1,295,020 2,376,040 3,347,260 309,190 407,100May 521,420 7,429,900 1,296,980 2,365,350 3,457,540 310,030 419,030June 558,760 7,420,220 1,296,510 2,263,060 3,548,710 311,930 538,440
Source: Central Bank of Eswatini
Table S 5.2
OWNERSHIP OF Eswatini GOVERNMENT STOCKS AND BILLSNOMINAL VALUE (E'000)
Amount Held
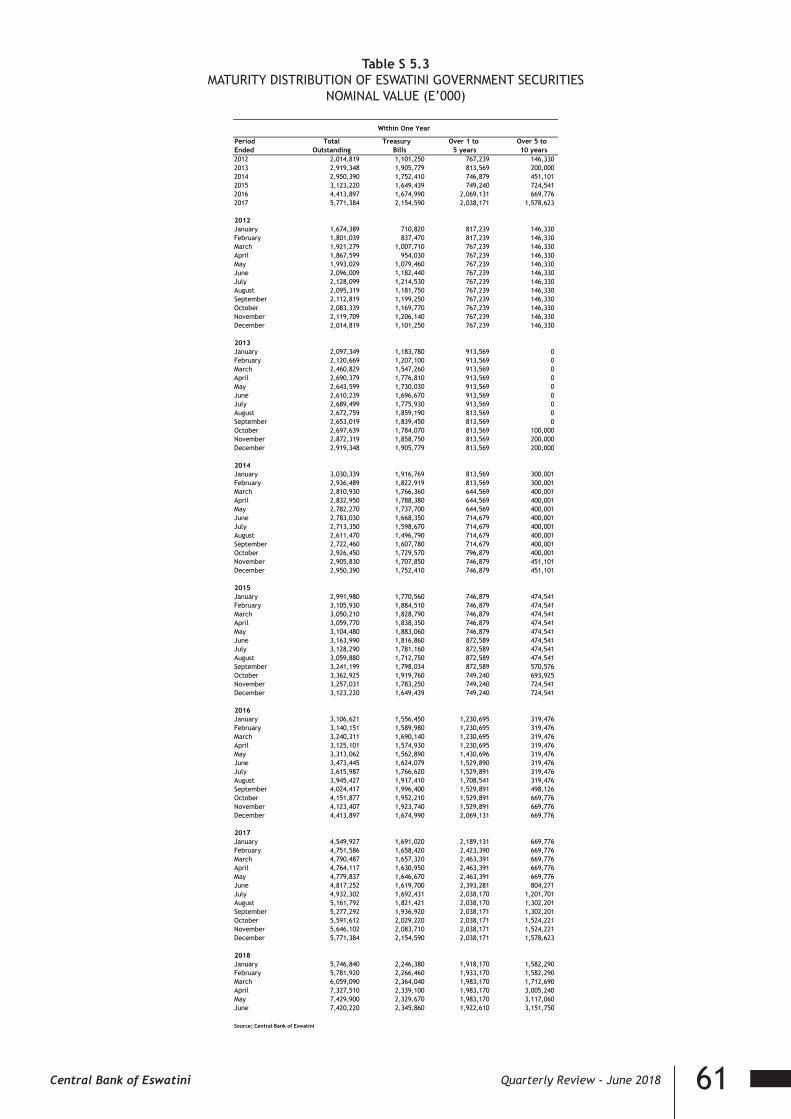
61Central Bank of Eswatini Quarterly Review - June 2018
Table S 5.3MATURITY DISTRIBUTION OF ESWATINI GOVERNMENT SECURITIES
NOMINAL VALUE (E’000)Table S 5.3
MATURITY DISTRIBUTION OF Eswatini GOVERNMENT SECURITIES NOMINAL VALUE (E'000)
Period Total Treasury Over 1 to Over 5 toEnded Outstanding Bills 5 years 10 years2012 2,014,819 1,101,250 767,239 146,3302013 2,919,348 1,905,779 813,569 200,0002014 2,950,390 1,752,410 746,879 451,1012015 3,123,220 1,649,439 749,240 724,5412016 4,413,897 1,674,990 2,069,131 669,7762017 5,771,384 2,154,590 2,038,171 1,578,623
2012January 1,674,389 710,820 817,239 146,330February 1,801,039 837,470 817,239 146,330March 1,921,279 1,007,710 767,239 146,330April 1,867,599 954,030 767,239 146,330May 1,993,029 1,079,460 767,239 146,330June 2,096,009 1,182,440 767,239 146,330July 2,128,099 1,214,530 767,239 146,330August 2,095,319 1,181,750 767,239 146,330September 2,112,819 1,199,250 767,239 146,330October 2,083,339 1,169,770 767,239 146,330November 2,119,709 1,206,140 767,239 146,330December 2,014,819 1,101,250 767,239 146,330
2013January 2,097,349 1,183,780 913,569 0February 2,120,669 1,207,100 913,569 0March 2,460,829 1,547,260 913,569 0April 2,690,379 1,776,810 913,569 0May 2,643,599 1,730,030 913,569 0June 2,610,239 1,696,670 913,569 0July 2,689,499 1,775,930 913,569 0August 2,672,759 1,859,190 813,569 0September 2,653,019 1,839,450 813,569 0October 2,697,639 1,784,070 813,569 100,000November 2,872,319 1,858,750 813,569 200,000December 2,919,348 1,905,779 813,569 200,000
2014January 3,030,339 1,916,769 813,569 300,001February 2,936,489 1,822,919 813,569 300,001March 2,810,930 1,766,360 644,569 400,001April 2,832,950 1,788,380 644,569 400,001May 2,782,270 1,737,700 644,569 400,001June 2,783,030 1,668,350 714,679 400,001July 2,713,350 1,598,670 714,679 400,001August 2,611,470 1,496,790 714,679 400,001September 2,722,460 1,607,780 714,679 400,001October 2,926,450 1,729,570 796,879 400,001November 2,905,830 1,707,850 746,879 451,101December 2,950,390 1,752,410 746,879 451,101
2015January 2,991,980 1,770,560 746,879 474,541February 3,105,930 1,884,510 746,879 474,541March 3,050,210 1,828,790 746,879 474,541April 3,059,770 1,838,350 746,879 474,541May 3,104,480 1,883,060 746,879 474,541June 3,163,990 1,816,860 872,589 474,541July 3,128,290 1,781,160 872,589 474,541August 3,059,880 1,712,750 872,589 474,541September 3,241,199 1,798,034 872,589 570,576October 3,362,925 1,919,760 749,240 693,925November 3,257,031 1,783,250 749,240 724,541December 3,123,220 1,649,439 749,240 724,541
2016January 3,106,621 1,556,450 1,230,695 319,476February 3,140,151 1,589,980 1,230,695 319,476March 3,240,311 1,690,140 1,230,695 319,476April 3,125,101 1,574,930 1,230,695 319,476May 3,313,062 1,562,890 1,430,696 319,476June 3,473,445 1,624,079 1,529,890 319,476July 3,615,987 1,766,620 1,529,891 319,476August 3,945,427 1,917,410 1,708,541 319,476September 4,024,417 1,996,400 1,529,891 498,126October 4,151,877 1,952,210 1,529,891 669,776November 4,123,407 1,923,740 1,529,891 669,776December 4,413,897 1,674,990 2,069,131 669,776
2017January 4,549,927 1,691,020 2,189,131 669,776February 4,751,586 1,658,420 2,423,390 669,776March 4,790,487 1,657,320 2,463,391 669,776April 4,764,117 1,630,950 2,463,391 669,776May 4,779,837 1,646,670 2,463,391 669,776June 4,817,252 1,619,700 2,393,281 804,271July 4,932,302 1,692,431 2,038,170 1,201,701August 5,161,792 1,821,421 2,038,170 1,302,201September 5,277,292 1,936,920 2,038,171 1,302,201October 5,591,612 2,029,220 2,038,171 1,524,221November 5,646,102 2,083,710 2,038,171 1,524,221December 5,771,384 2,154,590 2,038,171 1,578,623
2018January 5,746,840 2,246,380 1,918,170 1,582,290February 5,781,920 2,266,460 1,933,170 1,582,290March 6,059,090 2,364,040 1,983,170 1,712,690April 7,327,510 2,339,100 1,983,170 3,005,240May 7,429,900 2,329,670 1,983,170 3,117,060June 7,420,220 2,345,860 1,922,610 3,151,750
Source: Central Bank of Eswatini
Within One Year

62 Central Bank of Eswatini Quarterly Review - June 2018
Table S 5.4GOVERNMENT OF ESWATINI TREASURY BILLS
NOMINAL VALUE (E’000)Table S 5.4
GOVERNMENT OF Eswatini TREASURY BILLS NOMINAL VALUE (E'000)
Amount Held at end of Period byPeriod Amount Amount Monthly Average Outstanding at Central Non-BankEnded Issued Redeemed Discount Rate (%) End of Period Bank of Banks Financial Other
Eswatini Institutions2012January 270,630 279,870 6.98 710,820 130 596,410 77,360 36,920February 302,670 176,020 6.87 837,470 550 680,410 120,360 36,150March 404,410 281,480 6.97 1,007,710 540 843,560 125,360 38,250April 236,940 275,620 7.00 954,030 300 822,290 91,380 40,060May 405,280 279,670 7.49 1,079,460 540 916,150 122,750 40,020June 507,390 404,410 7.49 1,182,440 950 1,007,000 133,750 40,740July 269,040 236,950 7.49 1,214,530 970 1,032,570 138,750 42,240August 465,320 498,100 7.20 1,181,750 460 999,620 141,380 40,290September 394,890 377,390 7.21 1,199,250 540 1,025,530 125,000 48,180October 239,560 269,040 6.58 1,169,770 440 994,890 133,160 41,280November 416,690 380,320 7.02 1,206,140 520 1,041,930 125,830 37,860December 290,000 394,890 6.52 1,101,250 720 920,570 139,080 40,880
2013January 296,090 213,560 7.00 1,183,780 830 1,001,520 154,260 27,170February 425,010 401,690 7.30 1,207,100 540 1,048,510 114,470 43,580March 775,160 435,000 6.80 1,547,260 800 1,358,550 141,790 46,120April 536,640 307,090 6.43 1,776,810 830 1,559,740 154,790 61,450May 318,180 364,960 6.44 1,730,030 760 1,540,350 145,290 43,630June 223,120 280,100 6.41 1,696,670 950 1,488,070 145,290 62,360July 360,900 281,640 6.40 1,775,930 650 1,508,040 218,190 49,050August 401,540 318,280 6.18 1,859,190 900 1,593,090 240,340 24,860September 282,010 301,750 6.40 1,839,450 1,160 1,635,190 151,580 51,520October 305,520 360,900 6.36 1,784,070 4,920 1,531,720 201,760 45,670November 481,110 406,430 6.33 1,858,750 1,080 1,427,100 382,240 48,330December 374,039 327,010 6.29 1,905,779 2,710 1,452,013 400,336 50,720
2014January 537,680 426,690 6.34 1,916,769 1,880 1,382,131 427,758 105,000February 314,850 408,700 6.18 1,822,919 1,420 1,353,927 379,432 88,140March 529,970 450,000 6.41 1,766,360 1,020 1,251,107 449,103 65,130April 323,120 430,000 6.86 1,788,380 1,360 1,251,868 446,653 88,499May 424,850 600,000 6.37 1,737,700 1,260 1,199,799 465,241 71,400June 329,970 480,000 7.00 1,668,350 1,740 1,187,615 468,655 10,340July 315,740 385,420 6.20 1,598,670 1,220 1,085,865 424,795 86,790August 337,820 439,700 6.34 1,496,790 1,170 941,655 468,165 85,800September 395,110 284,120 6.27 1,607,780 1,100 992,412 527,798 86,470October 531,610 409,820 6.56 1,729,570 1,780 1,066,674 485,936 175,180November 319,910 341,630 6.57 1,707,850 1,950 1,084,599 529,211 92,090December 442,100 397,540 6.57 1,752,410 2,890 1,164,942 509,308 75,270
2015January 407,030 412,320 6.38 1,770,560 2,980 1,142,971 538,959 85,650February 362,880 272,370 6.38 1,884,510 2,400 1,154,861 626,159 101,090March 292,630 371,790 6.39 1,828,790 2,610 1,126,401 585,765 114,014April 410,750 441,190 6.36 1,838,350 3,080 1,171,680 554,526 109,064May 416,200 331,490 6.39 1,883,060 3,720 1,233,510 530,020 115,810June 193,660 259,860 6.44 1,816,860 4,930 1,143,380 582,020 86,530July 324,750 365,450 6.75 1,781,160 3,660 1,106,886 538,334 132,280August 282,800 346,210 6.51 1,712,750 2,900 1,067,236 533,654 108,960September 417,925 239,180 6.74 1,798,034 2,570 1,103,799 573,715 117,950October 511,540 387,240 6.52 1,919,760 2,360 1,230,808 568,840 117,752November 484,430 601,970 6.74 1,783,250 2,330 1,188,569 431,831 160,520December 336,220 455,910 6.44 1,649,439 1,200 1,103,538 435,801 108,900
2016January 404,510 412,760 6.49 1,556,450 0 1,026,289 376,801 153,360February 339,340 305,810 7.01 1,589,980 1,650 1,052,399 362,707 173,224March 365,700 265,540 6.65 1,690,140 3,050 1,058,140 520,820 108,130April 385,690 500,900 6.85 1,574,930 2,720 1,024,440 460,500 87,270May 358,850 370,890 7.00 1,562,890 2,570 1,021,988 454,082 84,250June 446,820 464,485 7.17 1,624,080 2,680 1,126,558 411,962 82,880July 564,930 422,390 7.19 1,766,620 1,850 1,312,828 366,712 85,230August 417,900 267,110 7.22 1,917,410 3,280 1,536,068 296,562 81,500September 552,870 473,880 7.35 1,996,400 3,280 1,565,898 345,572 81,650October 310,590 354,780 7.68 1,952,210 1,810 1,475,338 389,272 85,790November 334,440 362,900 7.84 1,923,740 2,770 1,427,058 408,512 85,400December 233,260 482,010 7.97 1,675,050 3,180 1,262,900 325,400 83,570
2017January 393,560 377,530 8.05 1,691,020 2,590 1,312,488 276,902 99,040February 328,420 361,020 8.11 1,658,420 2,310 1,323,728 239,002 93,380March 332,230 333,330 8.19 1,657,320 2,220 1,316,048 241,052 98,000April 336,010 362,380 8.31 1,630,950 2,030 1,279,888 251,052 97,980May 412,530 396,810 8.36 1,646,670 2,340 1,305,775 240,965 97,590June 375,890 402,860 8.26 1,619,701 2,720 1,262,865 269,626 84,490July 397,530 324,800 8.15 1,692,431 1,670 1,245,015 342,726 103,020August 440,000 311,010 8.08 1,821,421 1,790 1,372,290 343,571 103,770September 500,680 385,180 7.96 1,936,920 1,950 1,539,110 290,270 105,590October 440,000 347,700 7.86 2,029,220 2,060 1,611,500 310,150 105,510November 435,960 381,470 7.81 2,083,710 2,560 1,565,630 408,510 107,010December 414,900 344,020 7.86 2,154,590 3,120 1,547,170 500,150 104,150
2018January 448,250 356,460 7.88 2,246,380 2,530 1,595,260 550,170 98,420February 436,270 416,190 7.82 2,266,460 2,710 1,525,280 624,180 114,290March 514,810 417,230 7.79 2,364,040 2,400 1,574,060 671,650 115,930April 382,160 407,100 7.77 2,339,100 1,570 1,519,230 703,930 114,370May 409,600 419,030 7.67 2,329,670 3,530 1,498,550 713,200 114,390June 428,920 412,730 7.61 2,345,860 3,070 1,501,330 761,730 116,080
Source: Central Bank of Eswatini

63Central Bank of Eswatini Quarterly Review - June 2018
Tabl
e S
6.1
SUM
MAR
Y O
F G
OVE
RNM
ENT
OPE
RATI
ON
S(E
’000
)
T
ABL
E S
6.1
SUM
MA
RY O
F G
OVE
RNM
ENT
OPE
RATI
ON
S
(E'0
00)
2011
/12
2012
/13
2013
/14
2014
/15
2015
/16
2016
/17
2017
/18*
2018
/19*
*
Reve
nue
and
Gra
nts.
....
....
....
....
....
....
....
....
....
....
7,18
4,15
412
,034
,699
13,1
06,1
8214
,731
,125
14,4
62,4
2214
,288
,472
16,8
45,7
7517
,149
,600
Rev
enue
....
....
....
....
....
....
....
....
....
....
....
....
....
....
7,14
9,69
011
,991
,963
12,9
10,0
6913
,952
,966
14,1
33,0
1413
,788
,472
16,4
20,2
0316
,625
,643
Gra
nts
from
abr
oad.
....
....
....
....
....
....
....
....
....
...34
,464
42,7
3619
6,11
377
8,15
932
9,40
850
0,00
042
5,57
252
3,95
7
Tota
l Exp
endi
ture
and
Net
Len
ding
....
....
....
....
....
.9,
132,
334
10,5
67,4
0212
,889
,818
15,3
04,4
3416
,613
,883
18,5
77,8
7121
,779
,353
21,6
18,6
38
C
urre
nt E
xpen
ditu
re..
....
....
....
....
....
....
....
....
....
8,11
3,75
29,
140,
638
10,4
56,3
5111
,694
,013
12,8
88,6
0514
,680
,534
16,1
99,9
0916
,021
,894
o/
w S
alar
ies
& W
ages
3,82
2,43
94,
061,
567
4,59
8,46
14,
739,
005
5,67
2,94
37,
746,
000
8,38
9,76
66,
731,
817
Cap
ital
Exp
endi
ure.
....
....
....
....
....
....
....
....
....
...
1,01
8,58
21,
426,
764
2,43
3,46
73,
610,
421
3,72
5,27
83,
897,
337
5,57
9,44
45,
596,
744
Ove
rall
surp
lus/
(def
icit
)...
....
....
....
....
....
....
....
....
...
(1,9
48,1
80)
1,46
7,29
721
6,36
4(5
73,3
09)
(2,1
51,4
61)
(4,2
89,3
99)
(4,9
33,5
78)
(4,4
69,0
38)
Surp
lus/
(def
icit
) as
a %
of
GD
P...
....
....
....
....
....
....
....
...(4.9
)3.
30.
5(1
.1)
(3.9
)(7
.3)
(7.9
)(6
.7)
Fina
ncin
g...
....
....
....
....
....
....
....
....
....
....
....
....
....
....
..1,
948,
180
(1,4
67,2
97)
(216
,364
)57
3,30
92,
151,
461
4,28
9,39
94,
933,
578
4,46
9,03
8
For
eign
....
....
....
....
....
....
....
....
....
....
....
....
....
....
...
(135
,943
)(1
46,0
43)
38,6
4233
,067
607,
904
667,
856
1,65
2,41
71,
935,
642
Gro
ss B
orro
win
g...
....
....
....
....
....
....
....
....
....
61,2
4755
,755
230,
264
416,
000
939,
859
978,
000
2,15
3,41
73,
028,
442
Am
orti
sati
on..
....
....
....
....
....
....
....
....
....
....
.(197
,190
)(2
01,7
98)
(191
,622
)(3
82,9
33)
(331
,955
)(3
10,1
44)
(501
,000
)(1
,092
,800
)
Dom
esti
c...
....
....
....
....
....
....
....
....
....
....
....
....
...
2,08
4,12
3(1
,321
,254
)(2
55,0
06)
540,
242
1,54
3,55
73,
621,
543
3,28
1,16
12,
533,
396
Sour
ce:-
Min
istr
y of
Fin
ance
* Es
tim
ated
Out
turn
** B
udge
t
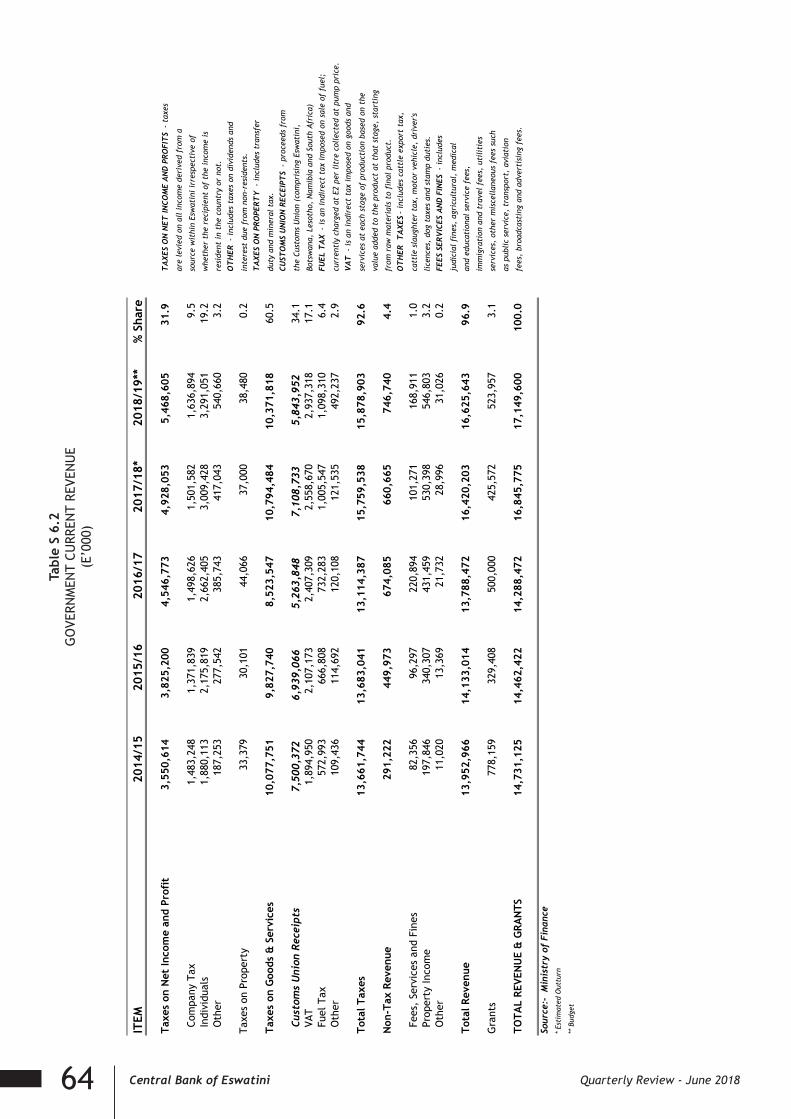
64 Central Bank of Eswatini Quarterly Review - June 2018
Tabl
e S
6.2
GO
VERN
MEN
T CU
RREN
T RE
VEN
UE
(E
’000
)TA
BLE
S 6.
2G
OV
ERN
MEN
T CU
RREN
T RE
VEN
UE
(E'
000)
ITEM
2014
/15
2015
/16
2016
/17
2017
/18*
2018
/19*
*%
Sha
re
Taxe
s on
Net
Inco
me
and
Prof
it3,
550,
614
3,82
5,20
04,
546,
773
4,92
8,05
35,
468,
605
31.9
TA
XES
ON
NET
INC
OM
E A
ND
PR
OFI
TS
- t
axes
are
levi
ed o
n al
l in
com
e de
rive
d fr
om a
Com
pany
Tax
1,48
3,24
81,
371,
839
1,49
8,62
61,
501,
582
1,63
6,89
49.
5so
urce
wit
hin
Esw
atin
i ir
resp
ecti
ve o
f
Ind
ivid
uals
1,88
0,11
32,
175,
819
2,66
2,40
53,
009,
428
3,29
1,05
119
.2w
heth
er t
he r
ecip
ient
of
the
inco
me
is
Oth
er18
7,25
327
7,54
238
5,74
341
7,04
354
0,66
03.
2re
side
nt i
n th
e co
untr
y or
not
.
OT
HER
- i
nclu
des
taxe
s on
div
iden
ds a
nd
Taxe
s on
Pro
pert
y33
,379
30,1
0144
,066
37,0
0038
,480
0.2
inte
rest
due
fro
m n
on-r
esid
ents
.
TA
XES
ON
PR
OPE
RT
Y -
inc
lude
s tr
ansf
er
Taxe
s on
Goo
ds &
Ser
vice
s10
,077
,751
9,82
7,74
08,
523,
547
10,7
94,4
8410
,371
,818
60.5
duty
and
min
eral
tax
.
CU
STO
MS
UN
ION
REC
EIPT
S -
pro
ceed
s fr
om
Cus
tom
s U
nion
Rec
eipt
s7,
500,
372
6,93
9,06
65,
263,
848
7,10
8,73
35,
843,
952
34.1
the
Cust
oms
Uni
on (
com
pris
ing
Esw
atin
i,
VAT
1,89
4,95
02,
107,
173
2,40
7,30
92,
558,
670
2,93
7,31
817
.1Bo
tsw
ana,
Les
otho
, N
amib
ia a
nd S
outh
Afr
ica)
Fue
l Tax
572,
993
666,
808
732,
283
1,00
5,54
71,
098,
310
6.4
FUEL
TA
X -
is
an i
ndir
ect
tax
impo
sed
on s
ale
of f
uel;
Oth
er10
9,43
611
4,69
212
0,10
812
1,53
549
2,23
72.
9cu
rren
tly
char
ged
at E
2 pe
r li
tre
coll
ecte
d at
pum
p pr
ice.
VA
T -
is
an i
ndir
ect
tax
impo
sed
on g
oods
and
Tota
l Tax
es13
,661
,744
13,6
83,0
4113
,114
,387
15,7
59,5
3815
,878
,903
92.6
serv
ices
at
each
sta
ge o
f pr
oduc
tion
bas
ed o
n th
e
valu
e ad
ded
to t
he p
rodu
ct a
t th
at s
tage
, st
arti
ng
Non
-Tax
Rev
enue
291,
222
449,
973
674,
085
660,
665
746,
740
4.4
from
raw
mat
eria
ls t
o fi
nal
prod
uct.
OT
HER
T
AX
ES-
incl
udes
cat
tle
expo
rt t
ax,
Fee
s, S
ervi
ces
and
Fine
s82
,356
96,2
9722
0,89
410
1,27
116
8,91
11.
0ca
ttle
sla
ught
er t
ax,
mot
or v
ehic
le,
driv
er's
Pro
pert
y In
com
e19
7,84
634
0,30
743
1,45
953
0,39
854
6,80
33.
2li
cenc
es,
dog
taxe
s an
d st
amp
duti
es.
Oth
er11
,020
13,3
6921
,732
28,9
9631
,026
0.2
FEES
SER
VIC
ES A
ND
FIN
ES -
inc
lude
s
judi
cial
fin
es,
agri
cult
ural
, m
edic
al
Tota
l Rev
enue
13,9
52,9
6614
,133
,014
13,7
88,4
7216
,420
,203
16,6
25,6
4396
.9an
d ed
ucat
iona
l se
rvic
e fe
es,
imm
igra
tion
and
tra
vel
fees
, ut
ilit
ies
Gra
nts
778,
159
329,
408
500,
000
425,
572
523,
957
3.1
serv
ices
, ot
her
mis
cell
aneo
us f
ees
such
as p
ubli
c se
rvic
e, t
rans
port
, av
iati
on
TOTA
L RE
VEN
UE
& G
RAN
TS14
,731
,125
14,4
62,4
2214
,288
,472
16,8
45,7
7517
,149
,600
100.
0fe
es,
broa
dcas
ting
and
adv
erti
sing
fee
s.
Sour
ce:-
Min
istr
y of
Fin
ance
*
Esti
mat
ed O
uttu
rn
** B
udge
t
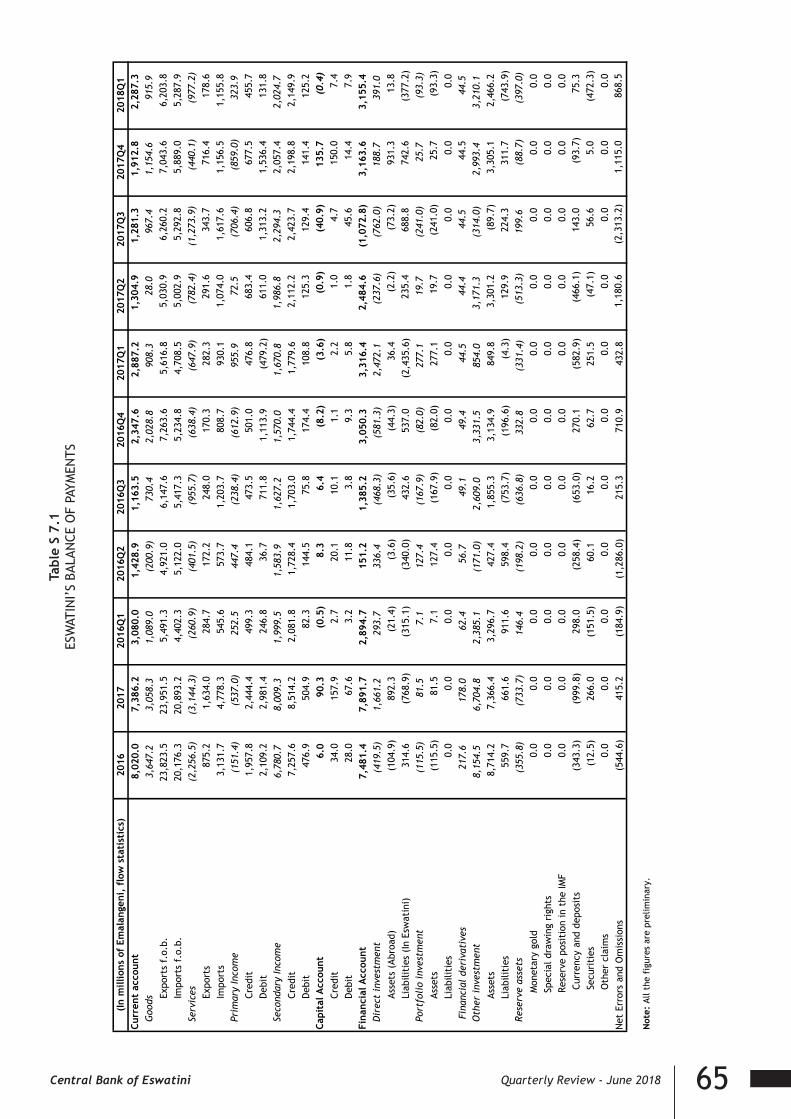
65Central Bank of Eswatini Quarterly Review - June 2018
Tabl
e S
7.1
ESW
ATIN
I’S
BALA
NCE
OF
PAYM
ENTS
Tabl
e S
7.1
ESW
ATI
NI'S
BA
LAN
CE O
F PA
YMEN
TS
2016
2017
2016
Q1
2016
Q2
2016
Q3
2016
Q4
2017
Q1
2017
Q2
2017
Q3
2017
Q4
2018
Q1
8,02
0.0
7,38
6.2
3,08
0.0
1,42
8.9
1,16
3.5
2,34
7.6
2,88
7.2
1,30
4.9
1,28
1.3
1,91
2.8
2,28
7.3
3,64
7.2
3,05
8.3
1,08
9.0
(200
.9)
730.
42,
028.
890
8.3
28.0
967.
41,
154.
691
5.9
Expo
rts
f.o.
b.23
,823
.523
,951
.55,
491.
34,
921.
06,
147.
67,
263.
65,
616.
85,
030.
96,
260.
27,
043.
66,
203.
8Im
port
s f.
o.b.
20,1
76.3
20,8
93.2
4,40
2.3
5,12
2.0
5,41
7.3
5,23
4.8
4,70
8.5
5,00
2.9
5,29
2.8
5,88
9.0
5,28
7.9
Serv
ices
(2,2
56.5
)(3
,144
.3)
(260
.9)
(401
.5)
(955
.7)
(638
.4)
(647
.9)
(782
.4)
(1,2
73.9
)(4
40.1
)(9
77.2
)Ex
port
s87
5.2
1,63
4.0
284.
717
2.2
248.
017
0.3
282.
329
1.6
343.
771
6.4
178.
6Im
port
s3,
131.
74,
778.
354
5.6
573.
71,
203.
780
8.7
930.
11,
074.
01,
617.
61,
156.
51,
155.
8(1
51.4
)(5
37.0
)25
2.5
447.
4(2
38.4
)(6
12.9
)95
5.9
72.5
(706
.4)
(859
.0)
323.
9Cr
edit
1,95
7.8
2,44
4.4
499.
348
4.1
473.
550
1.0
476.
868
3.4
606.
867
7.5
455.
7D
ebit
2,10
9.2
2,98
1.4
246.
836
.771
1.8
1,11
3.9
(479
.2)
611.
01,
313.
21,
536.
413
1.8
6,78
0.7
8,00
9.3
1,99
9.5
1,58
3.9
1,62
7.2
1,57
0.0
1,67
0.8
1,98
6.8
2,29
4.3
2,05
7.4
2,02
4.7
Cred
it7,
257.
68,
514.
22,
081.
81,
728.
41,
703.
01,
744.
41,
779.
62,
112.
22,
423.
72,
198.
82,
149.
9D
ebit
476.
950
4.9
82.3
144.
575
.817
4.4
108.
812
5.3
129.
414
1.4
125.
26.
090
.3(0
.5)
8.3
6.4
(8.2
)(3
.6)
(0.9
)(4
0.9)
135.
7(0
.4)
Cred
it34
.015
7.9
2.7
20.1
10.1
1.1
2.2
1.0
4.7
150.
07.
4D
ebit
28.0
67.6
3.2
11.8
3.8
9.3
5.8
1.8
45.6
14.4
7.9
7,48
1.4
7,89
1.7
2,89
4.7
151.
21,
385.
23,
050.
33,
316.
42,
484.
6(1
,072
.8)
3,16
3.6
3,15
5.4
(419
.5)
1,66
1.2
293.
733
6.4
(468
.3)
(581
.3)
2,47
2.1
(237
.6)
(762
.0)
188.
739
1.0
Asse
ts (
Abro
ad)
(104
.9)
892.
3(2
1.4)
(3.6
)(3
5.6)
(44.
3)36
.4(2
.2)
(73.
2)93
1.3
13.8
Liab
iliti
es (
In E
swat
ini)
314.
6(7
68.9
)(3
15.1
)(3
40.0
)43
2.6
537.
0(2
,435
.6)
235.
468
8.8
742.
6(3
77.2
)(1
15.5
)81
.57.
112
7.4
(167
.9)
(82.
0)27
7.1
19.7
(241
.0)
25.7
(93.
3)As
sets
(115
.5)
81.5
7.1
127.
4(1
67.9
)(8
2.0)
277.
119
.7(2
41.0
)25
.7(9
3.3)
Liab
iliti
es0.
00.
00.
00.
00.
00.
00.
00.
00.
00.
00.
0 F
inan
cial
der
ivat
ives
21
7.6
178.
062
.456
.749
.149
.444
.544
.444
.544
.544
.58,
154.
56,
704.
82,
385.
1(1
71.0
)2,
609.
03,
331.
585
4.0
3,17
1.3
(314
.0)
2,99
3.4
3,21
0.1
Asse
ts8,
714.
27,
366.
43,
296.
742
7.4
1,85
5.3
3,13
4.9
849.
83,
301.
2(8
9.7)
3,30
5.1
2,46
6.2
Liab
iliti
es55
9.7
661.
691
1.6
598.
4(7
53.7
)(1
96.6
)(4
.3)
129.
922
4.3
311.
7(7
43.9
)(3
55.8
)(7
33.7
)14
6.4
(198
.2)
(636
.8)
332.
8(3
31.4
)(5
13.3
)19
9.6
(88.
7)(3
97.0
)
Mon
etar
y go
ld0.
00.
00.
00.
00.
00.
00.
00.
00.
00.
00.
0
Spec
ial d
raw
ing
righ
ts0.
00.
00.
00.
00.
00.
00.
00.
00.
00.
00.
0
Rese
rve
posi
tion
in t
he IM
F0.
00.
00.
00.
00.
00.
00.
00.
00.
00.
00.
0
Cur
renc
y an
d de
posi
ts(3
43.3
)(9
99.8
)29
8.0
(258
.4)
(653
.0)
270.
1(5
82.9
)(4
66.1
)14
3.0
(93.
7)75
.3
Sec
urit
ies
(12.
5)26
6.0
(151
.5)
60.1
16.2
62.7
251.
5(4
7.1)
56.6
5.0
(472
.3)
O
ther
cla
ims
0.0
0.0
0.0
0.0
0.0
0.0
0.0
0.0
0.0
0.0
0.0
Net
Err
ors
and
Om
issi
ons
(544
.6)
415.
2(1
84.9
)(1
,286
.0)
215.
371
0.9
432.
81,
180.
6(2
,313
.2)
1,11
5.0
868.
5
Not
e: A
ll th
e fi
gure
s ar
e pr
elim
inar
y.
Fina
ncia
l Acc
ount
Dir
ect
inve
stm
ent
Port
foli
o in
vest
men
t
Oth
er i
nves
tmen
t
Rese
rve
asse
ts
Capi
tal A
ccou
nt
(In
mill
ions
of
Emal
ange
ni,
flow
sta
tist
ics)
Curr
ent
acco
unt
Goo
ds
Prim
ary
Inco
me
Seco
ndar
y In
com
e

66 Central Bank of Eswatini Quarterly Review - June 2018
Tabl
e S
7.2
BALA
NCE
OF
PAYM
ENTS
- F
INAN
CIAL
ACC
OU
NT
TABL
E S7
.2BA
LAN
CE O
F PA
YMEN
TS -
FIN
AN
CIA
L A
CCO
UN
T
(In
mill
ions
of
Emal
ange
ni,
flow
sta
tist
ics)
2016
2017
2016
Q1
2016
Q2
2016
Q3
2016
Q4
2017
Q1
2017
Q2
2017
Q3
2017
Q4
2018
Q1
Net
lend
ing
(+)/
net
borr
owin
g (-
) i.
e. B
alan
ce f
rom
Fin
anci
al A
ccou
nt6,
549.
97,
778.
52,
118.
82,
894.
715
1.2
1,38
5.2
3,05
0.3
3,31
6.4
2,48
4.6
(1,0
72.8
)3,
163.
6D
irec
t in
vest
men
t (4
25.0
)89
1.2
(586
.9)
293.
733
6.4
(468
.3)
(581
.3)
2,47
2.1
(237
.6)
(762
.0)
188.
7
Asse
ts (
Abro
ad)
(32.
7)(8
3.3)
27.8
(21.
4)(3
.6)
(35.
6)(4
4.3)
36.4
(2.2
)(7
3.2)
931.
3
Liab
iliti
es (
In E
swat
ini)
392.
3(9
74.5
)61
4.7
(315
.1)
(340
.0)
432.
653
7.0
(2,4
35.6
)23
5.4
688.
874
2.6
Port
folio
inve
stm
ent
(253
.9)
(26.
2)(2
20.4
)7.
112
7.4
(167
.9)
(82.
0)27
7.1
19.7
(241
.0)
25.7
Asse
ts(2
53.9
)(2
6.2)
(220
.4)
7.1
127.
4(1
67.9
)(8
2.0)
277.
119
.7(2
41.0
)25
.7
Liab
iliti
es0.
00.
00.
00.
00.
00.
00.
00.
00.
00.
00.
0 F
inan
cial
der
ivat
ives
26
9.3
182.
910
1.0
62.4
56.7
49.1
49.4
44.5
44.4
44.5
44.5
Asse
ts26
9.7
182.
910
1.1
62.8
56.7
49.1
49.4
44.5
44.4
44.5
44.5
Liab
iliti
es0.
40.
00.
10.
30.
00.
00.
00.
00.
00.
00.
0O
ther
inve
stm
ent
7,55
6.3
7,04
2.8
2,73
3.3
2,38
5.1
(171
.0)
2,60
9.0
3,33
1.5
854.
03,
171.
3(3
14.0
)2,
993.
4As
sets
9,19
3.3
7,19
6.2
3,61
3.9
3,29
6.7
427.
41,
855.
33,
134.
984
9.8
3,30
1.2
(89.
7)3,
305.
1
O
ther
equ
ity
0.0
0.0
0.0
0.0
0.0
0.0
0.0
0.0
0.0
0.0
0.0
Cu
rren
cy a
nd d
epos
its
5,98
5.7
4,72
9.3
2,97
0.3
1,83
5.4
(51.
9)1,
231.
92,
393.
826
8.8
2,79
3.3
(726
.5)
2,58
2.4
Lo
ans
(0.2
)0.
00.
44.
0(4
.6)
(0.0
)0.
00.
00.
00.
00.
0
Insu
ranc
e, p
ensi
on,
and
stan
dard
ized
gua
rant
ee s
chem
es0.
00.
00.
00.
00.
00.
00.
00.
00.
00.
00.
0
Trad
e cr
edit
and
adv
ance
s2,
299.
22,
417.
264
3.2
549.
149
2.1
614.
872
6.4
561.
750
3.1
626.
070
4.4
O
ther
acc
ount
s re
ceiv
able
/pay
able
8.6
49.7
0.0
8.2
(8.2
)8.
614
.719
.34.
810
.818
.4
Liab
iliti
es1,
636.
915
3.3
880.
691
1.6
598.
4(7
53.7
)(1
96.6
)(4
.3)
129.
922
4.3
311.
7
O
ther
equ
ity
0.0
0.0
0.0
0.0
0.0
0.0
0.0
0.0
0.0
0.0
0.0
Cu
rren
cy a
nd d
epos
its
252.
0(3
54.3
)50
7.4
365.
213
.0(6
33.5
)63
.2(2
03.4
)21
.9(2
36.1
)35
8.1
Lo
ans
1,30
8.4
622.
333
5.0
641.
951
3.4
(181
.9)
(190
.5)
202.
315
8.4
452.
1(2
1.0)
In
sura
nce,
pen
sion
, an
d st
anda
rdiz
ed g
uara
ntee
sch
emes
0.0
0.0
0.0
0.0
0.0
0.0
0.0
0.0
0.0
0.0
0.0
Tr
ade
cred
it a
nd a
dvan
ces
10.2
(138
.1)
38.3
(95.
5)72
.0(4
.5)
(72.
9)(7
.5)
(59.
5)1.
8(3
5.1)
O
ther
acc
ount
s re
ceiv
able
/pay
able
66.2
23.5
0.0
0.0
0.0
66.2
3.7
4.2
9.1
6.5
9.8
Rese
rve
asse
ts
(596
.8)
(312
.2)
91.8
146.
4(1
98.2
)(6
36.8
)33
2.8
(331
.4)
(513
.3)
199.
6(8
8.7)
C
urre
ncy
and
depo
sits
(528
.6)
(635
.9)
84.8
298.
0(2
58.4
)(6
53.0
)27
0.1
(582
.9)
(466
.1)
143.
0(9
3.7)
S
ecur
itie
s(6
8.3)
323.
77.
0(1
51.5
)60
.116
.262
.725
1.5
(47.
1)56
.65.
0
O
ther
cla
ims
0.0
0.0
0.0
0.0
0.0
0.0
0.0
0.0
0.0
0.0
0.0
T
otal
ass
ets
from
fin
anci
al a
ccou
nt8,
579.
56,
957.
33,
614.
23,
491.
540
9.7
1,06
4.1
3,39
0.7
876.
52,
849.
8(1
59.7
)4,
217.
9
T
otal
liab
iliti
es f
rom
fin
anci
al a
ccou
nt2,
029.
6(8
21.1
)1,
495.
559
6.8
258.
5(3
21.1
)34
0.5
(2,4
39.9
)36
5.2
913.
11,
054.
4
Bala
nce
from
fin
anci
al a
ccou
nt6,
549.
97,
778.
52,
118.
82,
894.
715
1.2
1,38
5.2
3,05
0.3
3,31
6.4
2,48
4.6
(1,0
72.8
)3,
163.
6
Not
e: A
ll th
e fi
gure
s ar
e pr
elim
inar
y.
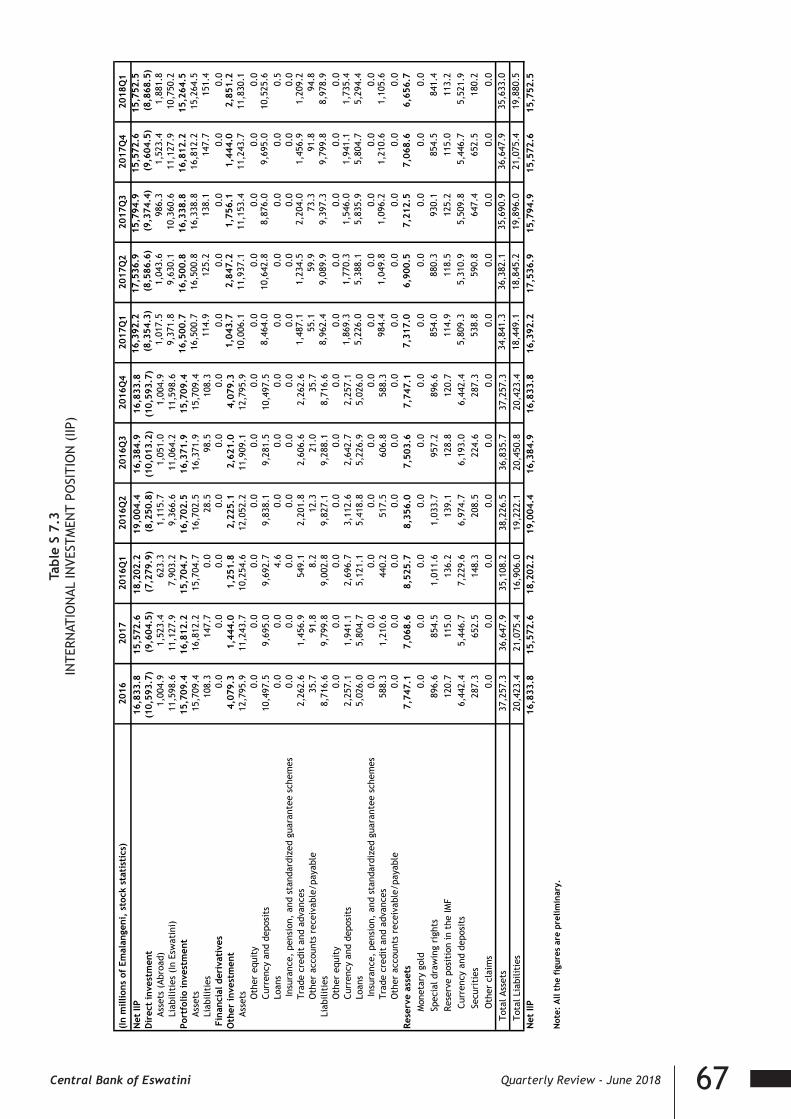
67Central Bank of Eswatini Quarterly Review - June 2018
Tabl
e S
7.3
INTE
RNAT
ION
AL IN
VEST
MEN
T PO
SITI
ON
(IIP
)TA
BLE
S7.3
INTE
RNA
TIO
NA
L IN
VEST
MEN
T PO
SITI
ON
(IIP
)
(In
mill
ions
of
Emal
ange
ni,
stoc
k st
atis
tics
)20
1620
1720
16Q
120
16Q
220
16Q
320
16Q
420
17Q
120
17Q
220
17Q
320
17Q
420
18Q
1N
et II
P16
,833
.815
,572
.618
,202
.219
,004
.416
,384
.916
,833
.816
,392
.217
,536
.915
,794
.915
,572
.615
,752
.5D
irec
t in
vest
men
t (1
0,59
3.7)
(9,6
04.5
)(7
,279
.9)
(8,2
50.8
)(1
0,01
3.2)
(10,
593.
7)(8
,354
.3)
(8,5
86.6
)(9
,374
.4)
(9,6
04.5
)(8
,868
.5)
Asse
ts (
Abro
ad)
1,00
4.9
1,52
3.4
623.
31,
115.
71,
051.
01,
004.
91,
017.
51,
043.
698
6.3
1,52
3.4
1,88
1.8
Liab
iliti
es (
In E
swat
ini)
11,5
98.6
11,1
27.9
7,90
3.2
9,36
6.6
11,0
64.2
11,5
98.6
9,37
1.8
9,63
0.1
10,3
60.6
11,1
27.9
10,7
50.2
Port
folio
inve
stm
ent
15,7
09.4
16,8
12.2
15,7
04.7
16,7
02.5
16,3
71.9
15,7
09.4
16,5
00.7
16,5
00.8
16,3
38.8
16,8
12.2
15,2
64.5
Asse
ts15
,709
.416
,812
.215
,704
.716
,702
.516
,371
.915
,709
.416
,500
.716
,500
.816
,338
.816
,812
.215
,264
.5Li
abili
ties
108.
314
7.7
0.0
28.5
98.5
108.
311
4.9
125.
213
8.1
147.
715
1.4
Fin
anci
al d
eriv
ativ
es
0.0
0.0
0.0
0.0
0.0
0.0
0.0
0.0
0.0
0.0
0.0
Oth
er in
vest
men
t4,
079.
31,
444.
01,
251.
82,
225.
12,
621.
04,
079.
31,
043.
72,
847.
21,
756.
11,
444.
02,
851.
2As
sets
12,7
95.9
11,2
43.7
10,2
54.6
12,0
52.2
11,9
09.1
12,7
95.9
10,0
06.1
11,9
37.1
11,1
53.4
11,2
43.7
11,8
30.1
Oth
er e
quit
y0.
00.
00.
00.
00.
00.
00.
00.
00.
00.
00.
0 C
urre
ncy
and
depo
sits
10,4
97.5
9,69
5.0
9,69
2.7
9,83
8.1
9,28
1.5
10,4
97.5
8,46
4.0
10,6
42.8
8,87
6.0
9,69
5.0
10,5
25.6
Loa
ns0.
00.
04.
60.
00.
00.
00.
00.
00.
00.
00.
5
Insu
ranc
e, p
ensi
on,
and
stan
dard
ized
gua
rant
ee s
chem
es0.
00.
00.
00.
00.
00.
00.
00.
00.
00.
00.
0 T
rade
cre
dit
and
adva
nces
2,26
2.6
1,45
6.9
549.
12,
201.
82,
606.
62,
262.
61,
487.
11,
234.
52,
204.
01,
456.
91,
209.
2 O
ther
acc
ount
s re
ceiv
able
/pay
able
35.7
91.8
8.2
12.3
21.0
35.7
55.1
59.9
73.3
91.8
94.8
Liab
iliti
es8,
716.
69,
799.
89,
002.
89,
827.
19,
288.
18,
716.
68,
962.
49,
089.
99,
397.
39,
799.
88,
978.
9 O
ther
equ
ity
0.0
0.0
0.0
0.0
0.0
0.0
0.0
0.0
0.0
0.0
0.0
Cur
renc
y an
d de
posi
ts2,
257.
11,
941.
12,
696.
73,
112.
62,
642.
72,
257.
11,
869.
31,
770.
31,
546.
01,
941.
11,
735.
4 L
oans
5,02
6.0
5,80
4.7
5,12
1.1
5,41
8.8
5,22
6.9
5,02
6.0
5,22
6.0
5,38
8.1
5,83
5.9
5,80
4.7
5,29
4.4
In
sura
nce,
pen
sion
, an
d st
anda
rdiz
ed g
uara
ntee
sch
emes
0.0
0.0
0.0
0.0
0.0
0.0
0.0
0.0
0.0
0.0
0.0
Tra
de c
redi
t an
d ad
vanc
es58
8.3
1,21
0.6
440.
251
7.5
606.
858
8.3
984.
41,
049.
81,
096.
21,
210.
61,
105.
6 O
ther
acc
ount
s re
ceiv
able
/pay
able
0.0
0.0
0.0
0.0
0.0
0.0
0.0
0.0
0.0
0.0
0.0
Rese
rve
asse
ts
7,74
7.1
7,06
8.6
8,52
5.7
8,35
6.0
7,50
3.6
7,74
7.1
7,31
7.0
6,90
0.5
7,21
2.5
7,06
8.6
6,65
6.7
Mon
etar
y go
ld0.
00.
00.
00.
00.
00.
00.
00.
00.
00.
00.
0 S
peci
al d
raw
ing
righ
ts89
6.6
854.
51,
011.
61,
033.
795
7.2
896.
685
4.0
880.
393
0.1
854.
584
1.4
Res
erve
pos
itio
n in
the
IMF
120.
711
5.0
136.
213
9.1
128.
812
0.7
114.
911
8.5
125.
211
5.0
113.
2
C
urre
ncy
and
depo
sits
6,44
2.4
5,44
6.7
7,22
9.6
6,97
4.7
6,19
3.0
6,44
2.4
5,80
9.3
5,31
0.9
5,50
9.8
5,44
6.7
5,52
1.9
Se
curi
ties
287.
365
2.5
148.
320
8.5
224.
628
7.3
538.
859
0.8
647.
465
2.5
180.
2
O
ther
cla
ims
0.0
0.0
0.0
0.0
0.0
0.0
0.0
0.0
0.0
0.0
0.0
To
tal A
sset
s37
,257
.336
,647
.935
,108
.238
,226
.536
,835
.737
,257
.334
,841
.336
,382
.135
,690
.936
,647
.935
,633
.0
To
tal L
iabi
litie
s20
,423
.421
,075
.416
,906
.019
,222
.120
,450
.820
,423
.418
,449
.118
,845
.219
,896
.021
,075
.419
,880
.5
Net
IIP
16,8
33.8
15,5
72.6
18,2
02.2
19,0
04.4
16,3
84.9
16,8
33.8
16,3
92.2
17,5
36.9
15,7
94.9
15,5
72.6
15,7
52.5
Not
e: A
ll th
e fi
gure
s ar
e pr
elim
inar
y.

68 Central Bank of Eswatini Quarterly Review - June 2018
Tabl
e S
7.4
EXPO
RT O
F G
OO
DS
BY C
OM
MO
DIT
Y SE
CTIO
NTA
BLE
S 7.
4EX
PORT
S O
F G
OO
DS
BY C
OM
MO
DIT
Y SE
CTIO
N
2015
Q3
2015
Q4
2016
Q1
2016
Q2
2016
Q3
2016
Q4
2017
Q1
2017
Q2
2017
Q3
2017
Q4
2018
Q1
1 L
ive
anim
als;
ani
mal
pro
duct
s35
.634
.342
.437
.950
.921
.825
.017
.529
.321
.213
.72
Veg
etab
le p
rodu
cts
72.4
32.8
29.4
58.3
71.8
24.2
25.0
48.7
80.1
36.6
36.1
3 E
dibl
e oi
ls0.0
0.2
0.2
0.2
1.0
0.2
0.1
0.3
0.1
0.1
0.0
4 P
repa
red
Food
stuf
fs;
Beve
rage
s; T
obac
co1,56
0.6
1,47
0.1
1,56
2.6
1,29
6.1
1,81
9.8
1,76
3.8
1,55
5.1
1,28
1.1
1,66
3.9
1,41
6.4
1,17
9.4
5 M
iner
al p
rodu
cts
42.7
43.5
48.8
43.9
51.6
62.5
88.4
64.2
69.7
62.7
63.6
6 P
rodu
cts
of c
hem
ical
or
allie
d in
dust
ries
2,72
8.1
3,65
4.8
2,74
9.2
2,37
8.6
2,83
5.6
3,94
7.5
2,71
1.0
2,45
5.1
3,00
2.7
4,03
1.4
2,73
3.1
7 P
last
ics,
rub
ber
and
arti
cles
the
reof
25.1
28.2
24.7
21.1
29.2
28.0
21.6
20.3
24.3
30.6
28.2
8 L
eath
er a
nd t
heir
art
icle
s2.9
1.6
2.4
3.1
2.3
1.5
3.0
2.4
2.6
1.1
1.6
9 W
ood
and
arti
cles
of
woo
d24
8.8
253.0
282.1
338.0
345.2
327.5
314.8
323.4
369.5
322.5
328.4
10 P
aper
and
the
ir a
rtic
les
218.6
156.0
61.4
19.9
48.3
116.6
65.8
11.2
39.2
78.4
50.9
11 T
exti
les
and
text
ile a
rtic
les
656.1
647.3
554.9
594.4
765.5
810.5
670.4
673.6
816.5
843.7
652.7
12 F
ootw
ear
0.5
0.4
0.1
0.2
0.2
0.3
1.0
1.2
0.2
0.5
0.3
13 A
rtic
l. o
f st
one,
cer
amic
and
gla
ss10
.59.8
8.1
9.3
10.9
9.5
7.3
9.2
11.4
9.8
7.1
14 P
earl
s, p
reci
ous
ston
es,
met
als
etc.
0.3
0.3
0.3
0.3
0.5
1.3
0.2
0.1
0.6
0.2
0.3
15 B
ase
met
als
and
arti
cles
of
base
met
al13
.09.1
13.3
12.6
14.9
18.8
18.0
19.1
17.2
29.7
14.3
16 M
achi
nery
, ap
pl.
and
elec
tric
al m
ater
ials
56.0
64.8
63.7
50.2
46.0
80.5
59.8
54.2
68.7
84.1
54.3
17 V
ehic
les
and
othe
r tr
ansp
ort
mea
ns12
.717
.810
.714
.213
.114
.711
.714
.523
.217
.017
.818
Opt
ical
, ph
oto,
mus
ical
inst
rum
ents
2.5
3.1
0.5
0.7
0.5
0.4
0.4
0.4
0.9
4.5
0.9
19 A
rms
and
amm
unit
ion
0.0
0.0
0.0
0.0
0.0
0.0
0.0
0.0
0.0
0.0
0.0
20 M
isce
llane
ous
man
ufac
ture
d ar
ticl
es27
.724
.033
.038
.436
.431
.936
.031
.942
.837
.837
.821
Wor
ks o
f ar
t, a
ntiq
ues
and
othe
r3.8
1.8
2.9
2.7
3.9
0.9
1.6
1.4
2.9
1.1
1.5
5,71
7.9
6,45
2.7
5,49
0.6
4,92
0.2
6,14
7.5
7,26
2.5
5,61
6.0
5,03
0.0
6,26
5.9
7,02
9.2
6,20
0.6
In M
illio
ns o
f Em
alan
geni
CN c
ode
and
Des
crip
tion
s
Tota
l Exp
orts
F.O
.B
Sour
ce:
Esw
atin
i Rev
enue
Aut
hori
tyN
ote:
Sum
of
trad
e fi
gure
s w
ill
not
tall
y w
ith
thos
e re
port
ed i
n BO
P du
e to
rec
lass
ific
atio
ns a
nd d
iffe
renc
es i
n tr
eatm
ent

69Central Bank of Eswatini Quarterly Review - June 2018
Tabl
e S
7.5
IMPO
RT O
F G
OO
DS
BY C
OM
MO
DIT
Y SE
CTIO
NTA
BLE
S7.5
IMPO
RTS
OF
GO
OD
S BY
CO
MM
OD
ITY
SECT
ION
2015
Q3
2015
Q4
2016
Q1
2016
Q2
2016
Q3
2016
Q4
2017
Q1
2017
Q2
2017
Q3
2017
Q4
2018
Q1
1 L
ive
anim
als;
ani
mal
pro
duct
s14
2.8
170.2
134.1
133.4
139.7
161.5
150.8
152.2
159.4
184.7
137.4
2 V
eget
able
pro
duct
s29
8.1
345.5
367.4
376.5
421.7
447.2
340.8
322.9
359.0
378.7
322.8
3 E
dibl
e oi
ls33
.342
.123
.738
.261
.943
.741
.632
.233
.646
.934
.74
Prep
ared
Foo
dstu
ffs;
Bev
erag
es;
Toba
cco
361.6
460.2
379.7
403.7
431.5
510.4
424.8
445.9
488.4
540.1
472.6
5 M
iner
al p
rodu
cts
720.4
692.4
548.1
639.2
718.0
705.0
639.6
677.8
729.9
775.6
702.6
6 P
rodu
cts
of c
hem
ical
or
allie
d in
dust
ries
755.4
803.0
595.0
793.6
755.9
803.2
703.7
596.6
743.7
878.2
840.0
7 P
last
ics,
rub
ber
and
arti
cles
the
reof
282.4
255.8
268.9
274.1
328.5
302.4
250.2
276.4
330.7
327.1
266.6
8 L
eath
er a
nd t
heir
art
icle
s7.9
14.0
9.2
8.6
10.9
14.6
12.0
9.2
11.5
15.0
13.1
9 W
ood
and
arti
cles
of
woo
d69
.563
.359
.413
5.2
104.9
62.0
53.5
68.8
70.2
69.2
71.9
10 P
aper
and
the
ir a
rtic
les
158.0
230.0
155.6
122.3
137.8
206.0
180.7
121.5
161.1
228.2
163.3
11 T
exti
les
and
text
ile a
rtic
les
396.2
386.4
384.5
487.5
434.1
411.8
444.8
568.8
529.8
536.4
543.3
12 F
ootw
ear
50.1
71.4
53.6
58.3
90.5
87.7
59.8
75.7
68.7
92.8
63.2
13 A
rtic
l. o
f st
one,
cer
amic
and
gla
ss55
.853
.565
.665
.974
.067
.151
.949
.659
.965
.160
.414
Pea
rls,
pre
ciou
s st
ones
, m
etal
s et
c.2.7
6.5
6.9
3.1
8.8
10.7
4.2
4.9
2.6
5.8
1.3
15 B
ase
met
als
and
arti
cles
of
base
met
al20
0.9
222.3
335.1
344.5
380.2
320.2
311.7
325.1
359.1
406.7
394.5
16 M
achi
nery
, ap
pl.
and
elec
tric
al m
ater
ials
423.6
532.4
576.0
553.9
601.7
568.6
502.9
674.8
584.4
699.8
612.4
17 V
ehic
les
and
othe
r tr
ansp
ort
mea
ns37
7.4
281.7
338.9
464.1
523.2
332.8
363.7
356.3
387.6
420.0
374.0
18 O
ptic
al,
phot
o, m
usic
al in
stru
men
ts33
.943
.558
.881
.776
.290
.173
.210
1.5
53.2
63.4
58.2
19 A
rms
and
amm
unit
ion
1.3
0.9
0.5
0.3
1.0
1.6
0.5
0.4
0.3
0.5
0.5
20 M
isce
llane
ous
man
ufac
ture
d ar
ticl
es10
1.6
142.5
101.1
224.1
195.2
152.6
126.4
162.4
163.4
180.7
183.3
21W
orks
of
art,
ant
ique
s an
d ot
her
50.8
55.9
49.3
40.5
55.8
65.1
88.2
103.6
127.4
120.0
102.8
4,52
3.8
4,87
3.6
4,51
1.2
5,24
8.7
5,55
1.3
5,36
4.3
4,82
5.0
5,12
6.7
5,42
3.8
6,03
4.8
5,41
8.8
(In
Mill
ions
of
Emal
ange
ni)
CN c
ode
and
Des
crip
tion
s
Tota
l Im
port
s c
.i.f
Sour
ce:
Esw
atin
i Rev
enue
Aut
hori
tyN
ote:
Sum
of
trad
e fi
gure
s w
ill
not
tall
y w
ith
thos
e re
port
ed i
n BO
P du
e to
rec
lass
ific
atio
ns a
nd d
iffe
renc
es i
n tr
eatm
ent

70 Central Bank of Eswatini Quarterly Review - June 2018
Tabl
e S
7.6
TOTA
L PU
BLIC
EXT
ERN
AL D
EBT*
(E’0
00)
2014
2015
2016
Q1
Q2
Q3
Q4
Q1
Q2
TOTA
L PU
BLIC
EXT
ERN
AL
DEB
T3,
567,
847
4,42
7,05
04,
919,
379
5,21
6,10
05,
380,
001
5,57
5,07
95,
453,
621
4,84
5,35
15,
342,
466
of w
hich
: C
entr
al G
over
nmen
t3,
412,
927
4,23
5,82
14,
756,
534
5,05
5,56
65,
222,
970
5,40
1,90
35,
293,
039
4,57
5,18
75,
038,
722
P
aras
tata
l/G
uara
ntee
d**
154,
920
191,
230
162,
845
160,
534
157,
032
173,
176
160,
582
270,
164
303,
744
M
ulti
late
ral O
rg.
2,19
4,50
22,
722,
712
2,97
6,30
33,
271,
386
3,31
3,85
13,
452,
205
3,39
5,37
63,
157,
097
3,49
9,02
1
Bila
tera
l92
1,03
898
1,54
395
5,73
296
6,22
81,
104,
952
1,13
2,80
61,
043,
196
960,
442
1,09
4,20
4
Priv
ate
Cre
dito
rs45
2,30
872
2,79
698
7,34
497
8,48
596
1,19
899
0,06
81,
015,
049
727,
812
749,
241
TOTA
L D
EBT
SERV
ICE
33,3
2838
3,17
452
6,24
586
,040
112,
875
74,1
8661
,615
82,2
0415
3,25
4
Pr
inci
pal
189,
226
248,
953
393,
796
67,9
2171
,726
50,4
4348
,711
47,7
7211
3,15
9
Inte
rest
13
3,01
211
3,25
613
0,69
717
,982
37,4
9223
,340
12,9
0434
,405
40,0
90
Com
mit
men
t fe
es0
965
1,75
213
73,
658
403
027
5
DIS
BURS
EMEN
TS24
9,84
821
3,46
51,
623,
254
468,
897
282,
426
55,5
9622
2,29
2N
/A77
,912
DEB
T RA
TIO
S:
P
ublic
Deb
t se
rvic
e:
as a
% o
f G
DP
0.66
0.73
0.96
0.59
0.77
0.50
0.42
0.53
0.98
as
a %
of
expo
rts
of g
oods
an
d se
rvic
es1.
351.
502.
111.
432.
061.
090.
781.
041.
93
T
otal
deb
t:
as a
% o
f G
DP
7.32
8.42
8.97
8.87
9.15
9.48
9.28
8.24
9.09
as
a %
of
expo
rts
of g
oods
an
d se
rvic
es14
.97
18.5
820
.65
19.9
020
.52
21.2
620
.80
18.4
820
.38
E/U
S$ (
end
of p
erio
d)11
.589
11.5
890
13.6
250
13.3
513
13.0
850
13.5
263
12.3
938
11.7
885
13.6
968
Sour
ce :
Ce
ntra
l Ban
k of
Esw
atin
i an
d M
inis
try
of F
inan
ceN
otes
:
Dat
a is
on
cale
ndar
yea
r ba
sis
:
*
Dat
a is
sub
ject
to
revi
sion
s
:
**
Par
asta
tal
refe
rs t
o Pu
blic
Ent
erpr
ises
:
n/a
Dat
a no
t ye
t av
aila
ble
2017
2018

71Central Bank of Eswatini Quarterly Review - June 2018
Table S 7.7ESWATINI’S OFFICIAL RESERVES
(E’000)Table S 7.7Eswatini'S OFFICIAL RESERVES
('000)---------------------- ------------------------ ------------------------ ------------------------ ------------------------ ------------------------ ------------------------ ------------------------
OFFICIAL RESERVES------------------------ ------------------------ ------------------------ ------------------------ ------------------------ ------------------------ ------------------------
Central GROSS LESS Official NET TOTALPeriod Bank of ------------------------ ------------------------ Liabilities ------------------------ ------------------------Ended Government Eswatini E SDR to Fund E SDR---------------------- ------------------------ ------------------------ ------------------------ ------------------------ ------------------------ ------------------------ ------------------------2005 476 1,537,750 1,538,226 170,479 1,536 1,536,690 170,3092006 35,433 2,569,125 2,604,558 247,184 1,536 2,603,022 247,0382007 1,279,613 3,885,935 5,165,548 478,045 1,536 5,164,012 477,9032008 26,191 7,038,511 7,064,702 488,883 639,363 6,425,339 444,6392009 35,345 6,444,030 6,479,374 561,169 1,115,935 5,363,440 464,5202010 39,401 4,457,197 4,496,597 434,361 1,062,705 3,433,892 334,6382011 51,552 4,179,404 4,230,956 335,711 1,071,962 3,158,994 253,7472012 58,577 5,579,673 5,638,250 426,225 1,162,134 4,476,116 341,9262013 68,378 7,911,012 7,979,390 486,646 1,384,268 6,595,122 405,6992014 77,627 7,916,084 7,993,711 472,531 1,529,855 6,463,855 385,8442015 37,411 8,484,845 8,522,256 393,726 1,779,952 6,742,304 312,8662016 27,461 7,723,035 7,750,497 418,287 2,337,114 5,413,382 293,1942017 26,243 6,932,595 6,958,838 393,788 2,161,474 4,797,364 272,5022010March 36,286 6,028,503 6,064,789 540,736 1,048,629 5,016,160 449,932June 38,234 4,977,121 5,015,355 439,504 1,036,471 3,978,884 351,355September 39,893 4,855,649 4,895,542 447,480 1,090,717 3,804,826 350,640December 39,401 4,457,197 4,496,597 434,361 1,062,705 3,433,892 334,6382011
March 40,876 4,002,549 4,043,426 373,602 1,007,409 3,036,017 283,385
June 41,497 3,738,491 3,779,988 344,231 995,138 2,784,850 256,422
September 48,565 3,957,649 4,006,213 312,769 1,081,482 2,924,731 231,138
December 51,552 4,179,404 4,230,956 335,711 1,071,962 3,158,994 253,747
2012
March 65,270 3,771,982 3,837,252 317,796 1,097,227 2,740,025 230,852
June 55,390 4,342,852 4,398,242 347,915 1,132,704 3,265,538 261,609
September 57,280 4,842,100 4,899,380 378,976 1,146,855 3,752,525 293,698
December 58,577 5,579,673 5,638,250 426,225 1,162,134 4,476,116 341,926
2013
March 60,149 6,196,262 6,256,411 447,513 1,279,904 4,976,507 359,418
June 62,387 7,016,895 7,079,281 466,741 1,325,099 5,754,183 382,750
September 65,352 7,135,296 7,200,649 462,065 1,344,778 5,855,871 379,212
December 68,378 7,911,012 7,979,390 486,646 1,384,268 6,595,122 405,699
2014January 70,247 9,179,693 9,249,940 530,214 1,435,118 7,814,822 451,379February 70,438 8,671,425 8,741,862 524,552 1,397,432 7,344,430 444,280March 70,665 8,062,100 8,132,766 493,983 1,509,067 6,623,699 405,849April 72,952 8,710,411 8,783,363 532,366 1,511,138 7,272,226 444,466May 72,895 7,912,607 7,985,503 488,445 1,503,068 6,482,435 400,160June 73,879 7,472,947 7,546,827 455,551 1,513,003 6,033,824 367,822July 75,009 8,461,901 8,536,910 515,646 1,513,347 7,023,563 427,997August 75,025 7,619,157 7,694,181 472,342 1,499,888 6,194,293 384,009September 75,931 7,183,054 7,258,985 427,471 1,532,232 5,726,753 340,805October 76,362 8,334,266 8,410,628 514,235 1,503,453 6,907,175 426,182November 76,175 8,025,389 8,101,564 497,560 1,499,738 6,601,826 409,301December 77,627 7,916,084 7,993,711 472,531 1,529,855 6,463,855 385,8442015January 80,066 8,739,641 8,819,707 535,153 1,509,418 7,310,289 447,630February 81,521 8,455,327 8,536,848 516,510 1,511,334 7,025,514 429,167March 82,570 8,109,783 8,192,352 482,682 1,553,054 6,639,299 395,161April 84,991 8,617,731 8,702,723 515,967 1,548,287 7,154,436 428,355May 85,687 8,079,788 8,165,475 478,086 1,555,440 6,610,036 391,119June 86,938 7,825,495 7,912,433 457,001 1,566,221 6,346,212 370,612July 88,425 8,554,759 8,643,184 484,552 1,591,880 7,051,304 399,394August 89,765 8,194,862 8,284,627 439,134 1,640,474 6,644,153 356,037September 88,576 8,014,433 8,103,009 411,753 1,679,237 6,423,772 330,030October 34,396 8,959,948 8,994,345 464,304 1,671,197 7,323,148 379,485November 35,074 8,852,537 8,887,610 448,321 1,692,843 7,194,767 364,366December 37,411 8,484,845 8,522,256 393,726 1,779,952 6,742,304 312,8662016January 37,191 9,674,796 9,711,987 437,127 1,808,084 7,903,903 357,114February 35,915 8,758,924 8,794,839 397,093 2,270,081 6,524,758 295,805March 34,265 8,488,976 8,523,241 409,755 2,490,858 6,032,383 291,178April 33,657 9,151,270 9,184,928 455,015 2,176,138 7,008,789 348,488May 37,426 8,516,181 8,553,607 385,001 2,513,662 6,039,945 273,055June 31,954 8,285,322 8,317,276 403,888 2,436,117 5,881,159 286,691July 29,985 8,416,752 8,446,738 431,447 2,387,557 6,059,180 310,597August 31,146 7,870,955 7,902,101 385,257 2,432,085 5,470,016 267,739September 31,146 7,455,239 7,486,385 386,346 2,377,350 5,109,035 264,761October 26,745 8,165,597 8,192,343 438,546 2,344,656 5,847,686 314,059November 28,326 7,721,490 7,749,816 407,262 2,361,063 5,388,752 284,224December 27,461 7,723,035 7,750,497 418,287 2,337,114 5,413,382 293,1942017January 27,577 8,246,298 8,273,875 451,219 2,328,042 5,945,834 325,343February 26,243 7,528,714 7,554,956 427,617 2,295,720 5,259,237 298,715March 26,243 7,325,225 7,351,468 404,351 2,320,335 5,031,132 277,718April 26,243 8,184,876 8,211,119 449,494 2,190,647 6,020,472 330,726May 26,243 7,422,628 7,448,871 407,752 2,190,391 5,258,479 288,867June 26,243 6,885,093 6,911,335 377,038 2,193,153 4,718,182 258,375July 26,243 8,189,310 8,215,553 440,954 2,208,160 6,007,393 323,469August 26,243 7,336,534 7,362,777 399,174 2,198,865 5,163,912 280,963September 26,243 7,183,709 7,209,952 377,329 2,230,685 4,979,267 261,539October 26,243 8,476,361 8,502,604 427,294 2,269,264 6,233,340 314,223November 26,243 7,879,569 7,905,812 408,086 2,243,736 5,662,075 293,241December 26,243 6,932,595 6,958,838 393,788 2,161,474 4,797,364 272,5022018January 26,243 7,605,277 7,631,520 439,739 2,146,472 5,485,048 317,146February 26,243 7,060,360 7,086,602 415,633 2,131,601 4,955,002 291,694March 26,243 6,631,873 6,658,115 383,702 2,145,974 4,512,141 261,060April 26,243 6,985,687 7,011,929 390,223 2,141,967 4,869,963 272,038May 26,243 6,608,540 6,634,783 369,417 2,175,196 4,459,587 249,291June 26,243 6,091,782 6,118,025 313,726 2,227,763 3,890,262 200,348Over 12 Months (0) (793,311) (793,311) (63,312) 34,610 (827,920) (58,027)---------------------- ------------------------ ------------------------ ------------------------ ------------------------ ------------------------ ------------------------ ------------------------Valuation of emalangeni is based on the month-end foreign exchange rates against the SDR and any currency concerned.OFFICIAL RESERVES - These include external deposit investments in foreign currencies, including rand assets and the IMF gold tranche and SDR holdings.

72 Central Bank of Eswatini Quarterly Review - June 2018
Table S 7.8ESWATINI’S FOREIGN ASSETS
(E’000)
------------------------ ------------------------- ------------------------- ------------------------- ------------------------- ------------------------- ------------------------- ------------------------- -------------------------Other Depository Corporations' Holdings Net Foreign Assets
Gross Reserves Less CBS NET ------------------------- ------------------------- ------------------------- ------------------------- -------------------------Period Less Liabilities Liabilities OFFICIAL Ended to IMF (other than IMF) ASSETS Assets Liabilities Net E SDR------------------------ ------------------------- ------------------------- ------------------------- ------------------------- ------------------------- ------------------------- ------------------------- -------------------------2005 1,536,690 16,231 1,520,459 443,975 70,644 373,331 1,893,790 329,5712006 2,603,022 70,862 2,532,160 886,728 124,189 762,539 3,294,699 329,5712007 5,164,012 104,411 5,059,601 765,570 68,027 697,543 5,757,144 532,7942008 6,425,339 82,405 6,977,955 1,503,745 325,612 1,178,133 8,156,088 564,4082009 5,363,440 44,965 5,828,103 2,229,321 294,628 1,934,693 7,762,796 672,3252010 3,433,892 46,749 3,840,067 2,196,715 406,896 1,789,819 5,629,886 548,6422011 3,158,994 53,778 3,654,710 1,620,393 1,172,142 448,251 4,102,961 329,5712012 4,476,116 71,491 4,982,433 2,101,930 767,206 1,334,724 6,317,157 482,5612013 6,595,122 101,427 7,211,213 1,847,232 1,138,156 709,076 7,920,289 487,2172014 6,463,855 106,937 7,096,344 1,427,911 792,640 635,271 7,731,615 461,5202015 6,742,304 121,704 7,571,782 2,239,692 701,932 1,537,760 9,109,542 422,7152016 5,413,382 307,501 6,434,112 2,893,587 497,288 2,396,298 8,830,410 478,2632017 4,797,364 181,190 5,882,638 2,464,704 437,845 2,026,859 7,909,497 449,2782010March 5,016,160 37,802 5,470,441 3,162,571 393,321 2,769,250 8,239,691 742,107June 3,978,884 87,765 4,390,958 2,794,992 375,925 2,419,067 6,810,025 610,425September 3,804,826 37,414 4,246,360 2,707,460 447,195 2,260,265 6,506,625 593,838December 3,433,892 46,749 3,840,067 2,196,715 406,896 1,789,819 5,629,886 548,6422011March 3,036,017 53,061 3,455,826 2,137,976 345,991 1,791,985 5,247,811 493,679June 2,784,850 54,228 3,210,472 2,361,685 1,126,618 1,235,067 4,445,539 412,181September 2,924,731 47,488 3,435,750 1,713,409 982,802 730,607 4,166,357 336,667December 3,158,994 53,778 3,654,710 1,620,393 1,172,142 448,251 4,102,961 329,5712012March 2,740,025 30,434 3,233,476 1,453,780 999,505 454,275 3,687,751 307,167June 3,265,538 65,215 3,751,278 1,828,100 635,763 1,192,337 4,943,615 396,044September 3,752,525 43,321 4,273,149 1,435,072 686,047 749,025 5,022,174 393,070December 4,476,116 71,491 4,982,433 2,101,930 767,206 1,334,724 6,317,157 482,5612013March 4,976,507 53,136 5,534,508 2,126,507 538,207 1,588,300 7,122,808 514,431June 5,754,183 75,803 6,341,944 1,530,183 1,027,486 502,697 6,844,641 455,284September 5,855,871 69,046 6,468,416 1,267,461 875,039 392,422 6,860,838 444,292December 6,595,122 101,427 7,211,213 1,847,232 1,138,156 709,076 7,920,289 487,2172014January 7,814,822 112,158 8,466,837 1,437,911 796,352 641,559 9,108,396 526,095February 7,344,430 80,796 7,993,287 1,479,389 736,422 742,967 8,736,254 528,474March 6,623,699 68,624 7,275,436 1,359,791 542,481 817,310 8,092,746 495,075April 7,272,226 63,220 7,931,181 1,729,598 660,398 1,069,200 9,000,381 550,088May 6,482,435 59,546 7,137,909 1,500,659 640,491 860,168 7,998,077 493,721June 6,033,824 107,434 6,650,441 1,694,075 507,235 1,186,840 7,837,281 477,761July 7,023,563 107,917 7,639,967 1,238,603 761,958 476,645 8,116,612 494,605August 6,194,293 83,373 6,822,896 1,550,836 1,002,636 548,200 7,371,096 456,964September 5,726,753 92,551 6,375,882 1,934,009 1,004,578 929,431 7,305,313 434,747October 6,907,175 85,312 7,537,215 2,210,324 1,213,494 996,830 8,534,045 526,562November 6,601,826 81,993 7,231,760 1,721,420 777,333 944,087 8,175,847 506,888December 6,463,855 106,937 7,096,344 1,427,911 792,640 635,271 7,731,615 461,5202015January 7,310,289 117,581 7,913,533 1,631,971 607,249 1,024,722 8,938,255 547,315February 7,025,514 92,944 7,655,116 1,376,782 590,183 786,599 8,441,715 515,679March 6,639,299 88,274 7,292,613 1,292,811 406,069 886,742 8,179,355 486,823April 7,154,436 85,957 7,805,679 2,161,529 603,325 1,558,204 9,363,883 560,641May 6,610,036 90,415 7,265,569 1,838,522 674,833 1,163,689 8,429,258 498,764June 6,346,212 100,580 7,001,436 1,342,832 683,373 659,459 7,660,895 447,388July 7,051,304 103,957 7,726,607 1,822,796 823,319 999,477 8,726,084 494,256August 6,644,153 105,689 7,362,144 2,302,517 599,843 1,702,674 9,064,818 485,752September 6,423,772 89,716 7,193,170 2,648,430 207,072 2,441,358 9,634,528 494,987October 7,323,148 81,784 8,093,129 1,947,838 493,946 1,453,892 9,547,021 494,723November 7,194,767 88,241 7,978,078 1,796,994 592,168 1,204,826 9,182,904 465,051December 6,742,304 121,704 7,571,782 2,239,692 701,932 1,537,760 9,109,542 422,7152016January 7,903,903 349,974 8,530,826 2,283,857 391,391 1,892,466 10,423,293 470,945February 6,524,758 121,708 7,989,833 2,065,001 507,250 1,557,750 9,547,584 432,848March 6,032,383 137,279 7,385,462 2,400,980 1,067,119 1,333,861 8,719,323 420,874April 7,008,789 520,887 7,934,723 2,948,340 1,525,555 1,422,785 9,357,508 465,270May 6,039,945 526,730 7,104,480 2,211,980 936,038 1,275,943 8,380,423 378,864June 5,881,159 584,646 6,772,245 2,082,150 1,067,630 1,014,519 7,786,765 379,585July 6,059,180 521,325 6,941,240 2,045,021 695,521 1,349,500 8,290,741 424,987August 5,470,016 544,617 6,395,124 2,522,300 417,870 2,104,430 8,499,554 416,025September 5,109,035 751,327 5,745,885 1,739,418 434,095 1,305,322 7,051,208 365,408October 5,847,686 518,276 6,668,878 1,773,578 753,052 1,020,525 7,689,404 412,971November 5,388,752 510,166 6,242,498 2,476,044 463,816 2,012,227 8,254,726 435,387December 5,413,382 307,501 6,434,112 2,893,587 497,288 2,396,298 8,830,410 478,2632017January 5,945,834 327,803 6,932,744 2,123,963 611,187 1,512,776 8,445,520 462,120February 5,259,237 264,948 6,260,846 1,994,989 173,549 1,821,440 8,082,286 459,059March 5,031,132 260,286 6,074,078 1,293,446 293,923 999,523 7,073,602 390,462April 6,020,472 237,632 7,092,769 1,547,386 421,122 1,126,263 8,219,033 451,370May 5,258,479 245,952 6,322,075 2,132,173 487,949 1,644,224 7,966,300 437,617June 4,718,182 131,229 5,900,616 2,861,589 315,871 2,545,718 8,446,334 462,534July 6,007,393 408,406 6,935,008 2,746,820 464,691 2,282,129 9,217,137 496,297August 5,163,912 137,135 6,348,950 2,864,474 235,639 2,628,835 8,977,785 488,473September 4,979,267 143,071 6,205,777 2,175,175 81,644 2,093,531 8,299,308 435,927October 6,233,340 172,986 7,487,413 2,413,158 218,860 2,194,298 9,681,711 488,056November 5,662,075 120,366 6,930,735 2,862,774 216,481 2,646,293 9,577,028 495,998December 4,797,364 181,190 5,882,638 2,464,704 437,845 2,026,859 7,909,497 449,2782018January 5,485,048 103,918 6,625,301 2,911,537 402,171 2,509,365 9,134,666 528,168February 4,955,002 112,648 6,064,368 2,651,003 282,736 2,368,267 8,432,635 496,417March 4,512,141 130,863 5,624,651 2,330,563 282,529 2,048,034 7,672,684 443,921April 4,869,963 130,551 6,027,235 3,046,367 433,487 2,612,880 8,640,115 482,639May 4,459,587 139,398 5,607,098 2,182,233 378,554 1,803,678 7,410,777 414,262June 3,890,262 156,780 5,133,305 2,077,937 332,178 1,745,759 6,879,064 354,271ChangeOver 12 Months (827,920) 25,550 (767,311) (783,652) 16,307 (799,959) (1,567,270) (108,263)------------------------ ------------------------- ------------------------- ------------------------- ------------------------- ------------------------- ------------------------- ------------------------- -------------------------
From December 2003, below the line,net foreign assets have been revised to include the Building Society (SBS).
Valuation of emalangeni is based on the month-end foreign exchange rates against the SDR and any other currency concerned.
OFFICIAL RESERVES - (See Table 6.5)
Other Depository Corporations' Holdings - Assets include balances maintained outside Eswatini by commercial banks and the Building Society and uncleared effects.
Liabilities comprise balances owed by local banks to non-residents including deposits in foreign currency held with depository corporations.
Table S 7.8Eswatini'S FOREIGN ASSETS
('000)

73Central Bank of Eswatini Quarterly Review - June 2018
Tabl
e S
7.9
SELE
CTED
FO
REIG
N E
XCH
ANG
E RA
TES*
TA
BLE
S 7.
9SE
LECT
ED F
ORE
IGN
EXC
HA
NG
E RA
TES*
PERI
OD
E
/$
E/
GBP
E
/EU
RO
E/
SDR
E/BW
P
CHF/
E
YE
N/E
C
AD
/E
EPA
PEP
AP
EPA
PEP
AP
EPA
PEP
AP
EPA
PEP
AP
EPA
PEP
AP
EPA
P20
118.
1546
7.26
0712
.572
011
.627
510
.556
59.
9806
12.5
150
11.4
550
1.08
501.
0558
0.11
530.
1229
9.51
2211
.080
10.
1251
0.13
6610
3.47
0499
.917
910
2.29
0699
.515
620
128.
4914
8.23
6213
.692
413
.011
011
.252
810
.552
513
.073
112
.570
31.
0916
1.07
680.
1074
0.11
4510
.176
89.
7424
0.11
710.
1220
104.
9802
103.
4568
100.
8072
99.8
722
2013
10.4
598
9.65
1717
.247
215
.108
114
.427
212
.826
816
.126
714
.672
41.
1982
1.14
810.
0849
0.09
6410
.032
210
.126
50.
1017
0.10
7011
1.60
2610
8.46
3310
7.69
1410
4.28
8220
1411
.589
010
.849
918
.028
417
.854
114
.087
014
.410
816
.780
716
.490
81.
2192
1.20
830.
0854
0.14
6410
.324
19.
7524
0.10
020.
0936
112.
9647
112.
5842
108.
0301
108.
4875
2015
15.5
383
12.7
463
23.0
393
19.4
923
16.9
825
14.1
464
21.5
575
17.8
354
1.38
291.
2569
0.06
370.
0734
7.75
039.
5473
0.08
930.
1006
120.
6548
113.
9663
115.
5284
109.
8696
2016
13.6
250
14.7
225
16.7
254
20.0
144
14.3
465
16.2
994
18.3
053
20.4
706
1.27
871.
3491
0.07
490.
0671
8.57
007.
3836
0.09
890.
0902
107.
3872
111.
3179
103.
2333
107.
0968
2017
12.3
938
13.3
294
16.6
882
17.1
784
14.8
136
15.0
537
17.6
280
18.4
835
1.25
611.
2876
0.07
900.
0741
9.09
628.
5534
0.10
140.
0972
107.
9887
107.
5807
105.
3369
103.
8513
2017
Firs
t Q
uart
er13
.351
313
.233
416
.632
416
.393
714
.264
514
.099
718
.114
517
.910
01.
2724
1.26
460.
0750
0.07
608.
3802
9.10
990.
0999
0.09
8710
5.79
6810
6.52
6910
2.30
1210
2.94
37Se
cond
Qua
rter
13.0
850
13.2
382
17.0
177
16.9
136
14.9
359
14.5
453
18.2
155
18.1
699
1.27
651.
2753
0.07
330.
0745
8.56
218.
4011
0.09
930.
1017
107.
0389
107.
2120
102.
6617
102.
6937
Thir
d Q
uart
er13
.526
313
.184
818
.129
317
.271
615
.952
915
.487
719
.098
118
.577
41.
3121
1.29
130.
0718
0.07
348.
3279
8.42
660.
0919
0.09
5110
7.82
2610
7.69
6510
4.18
9610
4.06
51Fo
urth
Qua
rter
12.3
938
13.1
980
16.6
882
17.6
972
14.8
136
15.6
146
17.6
280
18.6
738
1.25
611.
2978
0.07
900.
0750
9.09
628.
5679
0.10
140.
0970
107.
9887
108.
8874
105.
3369
105.
7026
2017
Janu
ary
13.4
975
13.5
654
16.8
679
16.7
268
14.4
336
14.4
205
18.3
033
18.3
225
1.28
021.
2805
0.07
380.
0744
8.41
658.
4722
0.09
710.
0974
107.
1644
103.
6838
Febr
uary
12.9
913
13.2
021
16.1
423
16.4
963
13.7
617
14.0
555
17.5
760
17.8
870
1.25
181.
2637
0.07
760.
0759
9.97
2810
.119
40.
1015
0.09
9310
6.61
9610
2.84
60M
arch
13.3
513
12.9
328
16.6
324
15.9
580
14.2
645
13.8
230
18.1
145
17.5
206
1.27
241.
2496
0.07
500.
0776
8.38
028.
7381
0.09
990.
0994
105.
7968
102.
3012
Apri
l13
.343
813
.527
417
.224
217
.064
314
.522
714
.480
118
.264
918
.403
01.
2790
1.28
400.
0745
0.07
418.
3391
8.15
420.
1024
0.09
9310
7.21
0910
2.63
31M
ay13
.076
313
.285
816
.763
117
.163
614
.635
014
.667
118
.070
218
.256
81.
2724
1.27
880.
0746
0.07
448.
4868
8.45
320.
1028
0.10
2510
7.38
6210
2.78
64Ju
ne13
.085
012
.901
517
.017
716
.512
914
.935
914
.488
618
.215
517
.850
01.
2765
1.26
320.
0733
0.07
518.
5621
8.59
580.
0993
0.10
3210
7.03
8910
2.66
17Ju
ly13
.050
013
.137
617
.128
117
.070
515
.303
815
.125
718
.369
518
.332
41.
2835
1.28
160.
0742
0.07
318.
4775
8.56
320.
0956
0.09
6910
7.44
4710
4.00
98Au
gust
12.9
963
13.2
446
16.7
762
17.1
779
15.4
669
15.6
443
18.3
995
18.6
955
1.28
471.
2959
0.07
420.
0739
8.49
678.
2973
0.09
730.
0952
107.
8222
103.
9959
Sept
embe
r13
.526
313
.172
318
.129
317
.566
315
.952
915
.693
019
.098
118
.704
21.
3121
1.29
630.
0718
0.07
328.
3279
8.41
930.
0919
0.09
3310
7.82
2610
4.18
96O
ctob
er14
.018
813
.691
818
.524
418
.072
016
.321
316
.092
319
.696
319
.296
91.
3346
1.31
860.
0711
0.07
178.
0682
8.25
050.
0915
0.09
1910
8.89
5810
5.28
32N
ovem
ber
13.6
588
14.0
938
18.3
806
18.6
354
16.2
178
16.5
399
19.3
587
19.8
589
1.32
221.
3406
0.07
210.
0704
8.21
358.
0093
0.09
420.
0906
109.
7776
106.
4878
Dec
embe
r12
.393
813
.198
016
.688
217
.697
214
.813
615
.614
617
.628
018
.673
81.
2561
1.29
780.
0790
0.07
509.
0962
8.56
790.
1014
0.09
7010
7.98
8710
5.33
69
2018
Janu
ary
11.9
375
12.2
038
16.9
370
16.9
189
14.8
485
14.8
842
17.3
860
17.5
575
1.24
691.
2529
0.07
810.
0788
9.10
889.
0841
0.10
310.
1019
1.89
501.
8998
105.
7399
102.
6691
Febr
uary
11.7
250
11.8
185
16.3
030
16.3
567
14.3
462
14.6
122
16.9
678
17.1
614
1.22
941.
2376
0.08
020.
8910
9.13
149.
1453
0.10
890.
1063
1.85
341.
8697
104.
5860
101.
3463
Mar
ch11
.788
511
.837
716
.567
516
.532
514
.508
714
.602
217
.124
117
.196
81.
2360
1.23
9112
.311
712
.505
49.
0457
8.95
609.
1313
9.16
071.
8744
1.87
2210
3.94
7410
0.84
11Ap
ril
12.3
355
12.1
050
16.9
819
17.0
490
14.9
652
14.8
570
17.7
584
17.5
548
1.26
011.
2536
12.4
881
12.5
066
8.84
518.
8928
9.60
049.
5043
1.94
801.
9211
104.
5920
100.
3186
May
12.4
917
12.5
434
16.6
258
16.8
866
14.5
941
14.8
195
17.7
035
17.8
515
1.24
911.
2648
12.6
387
12.5
772
8.69
338.
7491
9.70
489.
7488
1.95
101.
9674
105.
1430
100.
8171
June
13.6
968
13.3
014
17.9
571
17.6
655
15.9
382
15.5
250
19.2
308
18.8
118
1.31
081.
3011
13.7
714
13.4
330
8.07
588.
2807
10.3
535
10.1
322
2.07
032.
0575
106.
6616
102.
5385
Qua
rter
ly %
Cha
nge*
*16
.19
12.3
68.
396.
859.
856.
3212
.30
9.39
6.05
5.00
11.8
67.
42(1
0.72
)(7
.54)
13.3
810
.61
10.4
59.
902.
611.
68
Sour
ce :
Ce
ntra
l Ban
k of
Esw
atin
i and
Min
istr
y of
Fin
ance
NO
TES
:Cu
rren
cies
for
US
Dol
lar,
Pou
nd S
terl
ing,
Eur
o, S
DR
& B
otsw
ana
Pula
are
exp
ress
ed in
val
ue o
f em
alan
geni
per
a u
nit
of t
he f
orei
gn c
urre
ncy
Curr
enci
es f
or S
wis
s fr
anc,
Jap
anes
e ye
n &
Can
adia
n do
llar
are
exp
ress
ed in
val
ue o
f th
e fo
reig
n cu
rren
cy u
nits
per
lila
ngen
i up
to-
Febr
uary
201
8
*
:
Dai
ly o
peni
ng in
dica
tion
rat
es b
y Ce
ntra
l Ban
k fo
r de
alin
g w
ith
com
mer
cial
ban
ks in
Esw
atin
i (M
iddl
e Ra
tes)
**
:
Annu
al %
Cha
nges
ref
lect
cha
nges
in F
orei
gn C
urre
ncy/
Lila
ngen
i
trad
ing
part
ners
cha
nged
as
of J
anua
ry 2
016
***
: 20
10=1
00
EP :
En
d of
per
iod
rate
s
AP :
Pe
riod
ave
rage
rat
es
Real
Eff
ecti
ve
Exch
ange
Rat
e
J
apan
ese
Yen
Cana
dian
Dol
lar
Chin
ese
Yuan
Nom
inal
Eff
ecti
ve
E/CN
Y E
xcha
nge
Rate
U
S D
olla
r
Poun
d St
erlin
gEu
ro.
Curr
ency
Uni
tSp
ecia
l Dra
w.R
ight
sBo
tsw
ana
Pulla
Sw
iss
Fran
c

74 Central Bank of Eswatini Quarterly Review - June 2018
Table S 8.1CMA COMPARATIVE PRICE INDICES
EswatiniCPI CPI PPI Eswatini
Period All Groups All Groups All Groups Headline S. Africa Namibia Lesotho2007 66.6 74.0 158.2 8.1 7.1 6.7 8.02008 75.0 81.1 180.9 12.6 11.5 10.3 10.72009 80.7 86.2 84.6 7.5 7.1 8.8 7.32010 84.3 89.2 190.7 4.5 4.3 4.5 3.72011 89.5 94.6 207.7 6.1 5.0 5.1 5.02012 97.5 100.0 100.0 8.9 5.7 6.5 6.12013 103.0 103.4 105.9 5.6 5.8 5.8 5.02014 108.8 109.7 113.9 5.7 6.1 5.4 5.42015 114.2 114.7 118.0 5.0 4.6 3.4 3.22016 123.2 122.0 126.3 7.8 6.3 6.7 6.62017 132.4 104.2 103.7 6.2 5.0 5.3 5.0
Jan-12 94.1 95.2 97.1 9.3 6.3 6.6 7.5Feb-12 95.2 95.7 98.0 9.4 6.1 7.4 7.4Mar-12 95.4 96.8 98.6 8.8 6.0 6.9 7.2Apr-12 97.1 97.2 99.2 9.6 6.1 6.4 6.6May-12 97.3 97.2 100.0 9.1 5.7 6.0 6.5Jun-12 97.4 97.5 99.8 9.0 5.5 5.6 6.1Jul-12 97.4 97.8 99.8 8.7 4.9 6.0 5.7Aug-12 98.1 98.0 100.5 8.5 5.0 5.8 5.3Sep-12 98.5 98.9 100.8 8.7 5.5 6.7 5.8Oct-12 99.5 99.5 101.7 9.1 5.6 7.1 5.6Nov-12 99.8 99.8 102.4 9.1 5.6 7.6 5.4Dec-12 100.0 100.0 102.2 8.3 5.7 6.3 4.4
Jan-13 100.2 100.3 102.7 6.6 5.4 6.6 5.1Feb-13 101.6 101.3 103.3 6.7 5.9 6.2 5.1Mar-13 101.8 102.5 104.2 6.6 5.9 6.3 5.0Apr-13 102.5 102.9 104.6 5.6 5.9 6.1 5.2May-13 102.7 102.6 104.9 5.5 5.6 6.1 4.6Jun-13 102.9 102.9 105.7 5.6 5.5 6.2 4.6Jul-13 103.3 104.0 106.4 6.0 6.3 5.8 4.6Aug-13 103.8 104.3 107.2 5.9 6.4 6.0 5.3Sep-13 104.1 104.8 107.6 5.7 6.0 5.5 4.8Oct-13 104.2 105.0 107.6 4.7 5.5 4.9 5.4Nov-13 104.2 105.1 108.3 4.4 5.3 4.4 5.2Dec-13 104.4 105.4 108.8 4.4 5.4 4.9 5.1
Jan-14 104.9 106.1 109.9 4.7 5.8 4.9 5.4Feb-14 106.4 107.3 111.3 4.7 5.9 5.2 5.7Mar-14 107.0 108.7 112.7 5.1 6.0 5.9 5.6Apr-14 108.0 109.2 113.8 5.3 6.1 5.9 5.9May-14 108.3 109.4 114.0 5.5 6.6 6.1 6.7Jun-14 108.3 109.7 114.3 5.3 6.6 6.1 6.5Jul-14 109.7 110.6 114.3 6.2 6.3 5.6 6.5Aug-14 110.1 111.0 114.9 6.0 6.4 5.4 5.9Sep-14 110.6 111.0 115.0 6.2 5.9 5.3 5.4Oct-14 110.7 111.2 115.7 6.3 5.9 5.0 4.2Nov-14 111.0 111.2 116.1 6.6 5.8 5.0 3.9Dec-14 110.9 111.0 115.1 6.2 5.3 4.6 3.6
Jan-15 110.7 110.8 113.8 5.6 4.4 4.5 2.7Feb-15 111.7 111.5 114.2 5.0 3.9 3.6 2.1Mar-15 112.1 113.1 116.2 4.7 4.0 3.4 2.1Apr-15 113.3 114.1 117.2 4.9 4.5 2.9 2.0May-15 114.1 114.4 118.1 5.4 4.6 3.0 2.1Jun-15 114.6 114.9 118.5 5.7 4.7 3.0 2.9Jul-15 115.1 116.1 118.7 4.9 5.0 3.3 3.2Aug-15 115.3 116.1 118.8 4.8 4.6 3.4 3.2Sep-15 115.6 116.1 119.1 4.5 4.6 3.3 3.8Oct-15 115.8 116.4 120.2 4.6 4.7 3.4 3.8Nov-15 116.0 116.5 120.3 4.5 4.8 3.4 4.8Dec-15 116.3 116.8 120.6 4.9 5.2 3.7 5.1
Jan-16 117.0 117.7 122.5 5.6 6.2 5.3 5.8Feb-16 119.8 119.3 123.5 7.3 7.0 6.1 6.6Mar-16 120.8 120.2 124.4 7.8 6.3 6.5 7.5Apr-16 123.0 121.2 125.4 8.5 6.2 6.6 7.8May-16 123.2 121.4 125.8 8.0 6.1 6.7 8.0Jun-16 123.2 122.1 126.5 7.5 6.3 6.7 7.5Jul-16 123.6 123.1 127.5 7.4 6.0 7.0 6.9Aug-16 124.6 123.0 127.4 8.0 5.9 6.8 6.6Sep-16 125.2 123.2 127.0 8.3 6.1 6.9 6.0Oct-16 125.3 123.8 128.1 8.2 6.4 7.3 5.7Nov-16 126.1 124.2 128.6 8.6 6.6 7.3 5.7Dec-16 126.4 124.7 129.2 8.7 6.8 7.3 5.3
Jan-17 126.6 101.5 100.4 8.2 6.6 8.2 5.0Feb-17 127.9 101.7 101.0 6.8 6.3 7.8 5.2Mar-17 128.0 102.3 101.3 6.0 6.1 7.0 5.2Apr-17 131.6 102.4 101.6 7.0 5.3 6.7 4.0May-17 132.0 102.7 102.1 7.1 5.4 6.3 5.3Jun-17 131.6 102.9 101.8 6.9 5.1 6.1 5.0Jul-17 131.9 103.2 102.3 6.7 4.6 5.4 5.4Aug-17 131.9 103.3 102.7 5.9 4.8 5.4 5.4Sep-17 131.9 103.8 103.4 5.4 5.1 5.6 5.6Oct-17 132.1 104.1 104.1 5.4 4.8 5.2 5.4Nov-17 132.2 104.2 104.6 4.9 4.6 5.2 5.3Dec-17 132.3 104.7 105.2 4.7 4.7 5.2 5.7
Jan-18 132.4 105.0 105.5 4.6 4.4 3.6 5.3Feb-18 133.1 105.8 105.2 4.0 4.0 3.5 5.2Mar-18 133.1 106.2 105.0 4.0 3.8 3.5 4.8Apr-18 137.9 107.0 106.1 4.8 4.5 3.6 3.8May-18 138.3 107.2 106.8 4.8 4.4 3.8 3.8Jun-18 138.2 107.6 107.8 4.9 4.6 4.0 4.0
New weights (based on SHIES 2009/10) were adopted from January 2013
The PPI final manufacturing goods represent the headline number for PPI.
**South Africa: consumer price index: December 2012 = 100
Lesotho Consumer Price Index March 2010 = 100Sources: Eswatini Central Statistical Office, Statistics South AfricaNational Planning Commission-Namibia, Lesotho Bureau of Statistics
The base year for Eswatini CPI was changed to December 2012 and
Effective from January 2013, STATS SA releases PPI as 5-industry-specific producer price indices.
Eswatini Consumer Price index: December 2012 = 100Namibia Consumer Price Index: December 2012 = 100
Headline
Table S 8.1
CMA COMPARATIVE PRICE INDICES
South Africa
PRICE INDICES INFLATION

75Central Bank of Eswatini Quarterly Review - June 2018
Table S 8.2ESWATINI CONSUMER INFLATIONTable 8.2
Eswatini CONSUMER INFLATION
Food & Alcoholic Clothing & Housing, Water, Household Health T\port Communications Recreation Education Restuarants Miscellaneous All Index
nonalcoholic Beverages & Footwear Electricity, Gas Furniture & Care & culture & Hotels
Beverages Tobacco & Other Fuels Maintenance
Weights (Old) 37.73 0.96 6.16 14.33 11.88 3.58 8.6 1.43 4.62 5.38 0.72 4.67 100.06
Weights (New) 29.22 0.39 3.42 29.15 4.75 3.39 10.5 2.74 1.07 9.11 1.79 4.47 100
Jan-12 12.5 6.8 4.9 8.3 3.2 6.5 16.1 0.0 0.9 12.1 3.8 2.1 9.3
Feb-12 14.5 6.9 5.6 8.0 3.7 6.8 13.0 0.0 (0.4) 7.2 5.5 2.4 9.4
Mar-12 13.4 7.2 6.4 7.7 3.5 6.6 10.0 0.0 (0.8) 7.2 5.3 2.8 8.8
2012 Q1 13.5 7.0 5.6 8.0 3.5 6.6 13.0 0.0 (0.1) 8.8 4.9 2.4 9.2
Apr-12 14.1 7.6 4.8 12.3 3.8 6.3 9.3 0.0 0.2 7.2 5.3 3.3 9.6
May-12 13.1 5.7 4.9 12.2 4.2 6.7 7.1 0.0 0.3 7.2 6.8 3.7 9.1
Jun-12 12.2 4.6 4.8 12.8 4.5 6.8 7.9 0.0 1.9 7.2 7.3 3.9 9.0
2012 Q2 13.1 6.0 4.8 12.4 4.2 6.6 8.1 0.0 0.8 7.2 6.5 3.6 9.2
Jul-12 11.6 3.2 4.9 12.0 5.7 6.7 8.0 (0.1) 2.1 7.2 7.4 3.5 8.7
Aug-12 12.9 4.6 4.5 5.6 5.2 15.3 5.1 (0.1) 4.3 7.3 7.4 3.6 8.5
Sep-12 13.4 4.7 4.0 5.8 6.4 15.3 5.0 (0.0) 4.6 7.1 7.4 2.4 8.7
2012 Q3 12.6 4.2 4.5 7.8 5.8 12.4 6.0 (0.0) 3.6 7.2 7.4 3.1 8.6
Oct-12 14.0 5.5 4.2 6.0 7.0 14.8 6.7 (0.1) 6.2 6.7 6.8 0.4 9.1
Nov-12 13.7 4.4 3.2 6.1 7.2 15.3 5.8 (0.1) 7.7 6.7 4.6 0.2 9.1
Dec-12 11.9 5.8 3.2 5.9 7.4 15.3 4.7 (0.1) 6.8 6.7 3.5 0.8 8.3
2012 Q4 13.2 5.2 3.5 6.0 7.2 15.2 5.7 (0.1) 6.9 6.7 5.0 0.5 8.8
Jan-13 8.1 4.5 4.4 7.8 5.8 11.6 4.5 (1.5) 4.3 5.4 5.9 1.5 6.6
Feb-13 7.6 5.6 2.5 5.9 7.0 14.7 2.9 (0.1) 6.9 12.0 0.7 1.6 6.7
Mar-13 7.6 3.4 2.2 5.7 7.6 14.7 2.6 (0.1) 6.0 12.0 0.6 0.8 6.6
2013 Q1 7.8 4.5 3.0 6.5 6.8 13.7 3.3 (0.6) 5.7 9.8 2.4 1.3 6.6
Apr-13 4.8 1.8 2.7 5.4 6.0 14.4 2.8 (0.1) 7.6 9.0 (1.1) 0.5 5.6
May-13 4.8 3.9 3.2 5.1 6.5 14.1 2.0 0.0 8.8 9.0 (1.5) (0.3) 5.5
Jun-13 5.7 5.3 3.0 5.0 5.1 13.9 0.9 0.0 6.9 9.0 (2.1) (1.5) 5.6
2013 Q2 5.1 3.7 3.0 5.2 5.9 14.1 1.9 (0.0) 7.8 9.0 (1.6) (0.4) 5.6
Jul-13 6.8 6.7 3.2 5.4 4.1 13.7 1.8 0.0 7.4 9.0 (2.3) (0.7) 6.0
Aug-13 5.7 5.4 3.8 5.8 3.8 10.7 4.2 0.0 6.6 9.6 (2.1) (1.1) 5.9
Sep-13 5.8 4.9 4.6 5.6 2.9 10.8 4.1 0.0 6.7 9.6 (2.0) (1.1) 5.7
2013 Q3 6.1 5.7 3.9 5.6 3.6 11.7 3.4 0.0 6.9 9.4 (2.1) (1.0) 5.9
Oct-13 4.0 4.2 4.7 5.3 3.0 11.3 1.4 0.0 4.9 10.0 (1.7) 0.8 4.7
Nov-13 3.8 4.1 4.9 5.2 3.2 10.8 0.9 0.0 5.4 8.6 1.9 1.6 4.4
Dec-13 3.9 3.8 5.2 5.4 3.5 10.6 0.9 0.0 6.0 8.5 2.1 1.4 4.4
2013 Q4 3.9 4.0 4.9 5.3 3.2 10.9 1.1 0.0 5.4 9.0 0.8 1.3 4.5
Jan-14 4.6 3.7 4.8 5.4 3.9 10.6 1.0 0.0 7.7 8.5 2.0 1.8 4.7
Feb-14 4.5 3.0 5.4 5.5 3.7 10.8 1.7 0.0 7.6 7.0 1.8 1.8 4.7
Mar-14 5.0 6.6 8.2 5.7 2.9 10.2 3.6 0.0 9.5 7.1 2.7 3.1 5.1
2014 Q1 4.7 4.4 6.1 5.5 3.5 10.5 2.1 0.0 8.3 7.5 2.2 2.2 4.8
Apr-14 6.7 8.3 7.9 3.3 4.0 10.8 3.4 0.0 7.0 10.0 4.2 4.0 5.3
May-14 7.3 7.6 7.5 3.3 3.9 10.7 3.6 0.0 6.2 10.0 4.5 3.7 5.5
Jun-14 7.2 7.1 7.5 2.7 5.1 10.5 3.4 0.0 6.1 9.7 4.5 4.6 5.3
2014 Q2 7.1 7.7 7.6 3.1 4.3 10.7 3.5 0.0 6.4 9.9 4.4 4.1 5.4
Jul-14 6.8 7.5 7.3 2.8 5.4 10.5 13.0 0.0 6.2 9.7 5.5 4.2 6.2
Aug-14 7.2 7.7 7.0 2.3 5.6 2.8 13.4 0.0 7.7 10.0 4.0 4.1 6.0
Sep-14 6.6 8.1 7.6 2.6 5.9 2.5 15.9 0.0 6.8 10.0 4.0 4.7 6.2
2014 Q3 6.9 7.8 7.3 2.6 5.6 5.3 14.1 0.0 6.9 9.9 4.5 4.3 6.1
Oct-14 6.9 7.0 7.9 2.5 5.5 2.5 16.0 0.0 7.0 10.0 4.0 4.3 6.3
Nov-14 7.3 7.4 8.5 2.6 5.1 2.9 15.9 (0.9) 1.8 11.4 7.0 5.8 6.6
Dec-14 6.1 6.8 8.9 2.6 3.6 3.1 14.7 (0.9) 6.5 11.4 6.9 6.6 6.2
2014 Q4 6.8 7.1 8.4 2.6 4.7 2.8 15.5 (0.6) 5.1 10.9 6.0 5.6 6.4
Jan-15 4.7 6.3 9.5 2.6 4.1 3.1 12.9 (0.9) 5.9 11.4 7.0 5.7 5.6
Feb-15 5.2 5.7 10.7 2.3 4.4 3.5 9.9 (0.9) 7.8 5.7 11.8 5.7 5.0
Mar-15 4.3 4.4 8.1 3.0 3.9 4.0 8.1 (0.9) 7.8 4.7 11.0 9.5 4.7
2015 Q1 4.7 5.5 9.4 2.7 4.1 3.5 10.3 (0.9) 7.1 7.3 9.9 7.0 5.1
Apr-15 3.8 4.1 8.0 3.2 3.4 3.7 8.4 3.1 7.7 5.6 10.4 11.5 4.9
May-15 3.4 3.7 7.9 5.1 3.1 4.2 8.2 3.1 8.2 5.6 10.2 11.5 5.4
Jun-15 4.4 3.5 8.5 4.9 4.0 4.3 9.6 3.1 7.0 5.9 10.2 9.8 5.7
2015 Q2 3.9 3.7 8.1 4.4 3.5 4.1 8.7 3.1 7.6 5.7 10.3 11.0 5.3
Jul-15 3.4 3.1 7.8 6.0 3.6 4.2 0.5 6.6 6.8 5.9 9.3 10.2 4.9
Aug-15 3.5 2.7 7.1 5.7 3.5 1.5 0.5 6.6 4.6 6.7 10.4 10.6 4.8
Sep-15 4.1 0.7 6.7 5.4 3.7 1.7 (3.1) 6.6 6.0 6.7 10.3 12.3 4.5
2015Q3 3.7 2.2 7.2 5.7 3.6 2.5 (0.7) 6.6 5.8 6.4 10.0 11.0 4.7
Oct-15 3.8 3.9 7.0 5.7 3.8 1.6 (2.7) 6.6 7.1 6.7 10.2 11.8 4.6
Nov-15 3.9 3.6 6.5 5.6 4.3 1.2 (2.0) 7.6 10.8 6.7 5.4 9.7 4.5
Dec-15 5.2 3.1 5.7 5.5 5.4 1.1 (1.0) 7.6 5.2 6.7 5.5 9.1 4.9
2015Q4 4.3 3.5 6.4 5.6 4.5 1.3 (1.9) 7.3 7.7 6.7 7.0 10.2 4.7
Jan-16 6.6 3.3 4.5 5.7 4.5 1.0 1.6 7.6 4.7 6.7 5.3 9.7 5.6
Feb-16 10.5 3.6 4.9 5.9 5.6 0.3 11.9 7.6 2.9 3.0 0.7 9.2 7.3
Mar-16 13.4 1.8 5.6 5.0 6.4 0.3 12.2 7.6 2.4 4.0 0.3 5.1 7.8
2016Q1 10.2 2.9 5.0 5.5 5.5 0.5 8.6 7.6 3.3 4.5 2.1 8.0 6.9
Apr-16 15.3 3.4 5.5 6.4 5.9 0.2 11.6 6.0 3.5 3.1 2.2 4.2 8.5
May-16 15.1 1.9 5.9 4.7 6.4 (0.2) 11.4 6.0 4.6 3.1 2.0 3.9 8.0
Jun-16 13.9 2.4 5.6 5.0 4.7 (0.2) 10.1 6.0 5.5 3.1 2.0 4.3 7.5
2016Q2 14.8 2.6 5.7 5.4 5.7 (0.1) 11.0 6.0 4.5 3.1 2.1 4.1 8.0
Jul-16 15.5 2.4 6.5 3.7 5.8 (0.1) 8.8 2.6 5.1 3.1 1.7 3.8 7.4
Aug-16 17.4 2.9 7.3 4.0 6.2 0.3 8.7 2.6 5.3 2.4 2.0 5.1 8.0
Sep-16 17.5 5.0 9.0 4.0 6.6 0.1 10.3 2.6 4.9 2.4 2.2 4.1 8.3
2016Q3 16.8 3.4 7.6 3.9 6.2 0.1 9.3 2.6 5.1 2.6 1.9 4.3 7.9
Oct-16 17.6 4.8 8.7 3.7 5.9 0.4 9.9 2.6 4.0 2.4 2.1 6.0 8.2
Nov-16 18.7 5.4 8.9 3.7 9.0 0.4 9.1 2.6 5.4 2.4 2.5 6.2 8.6
Dec-16 19.0 5.4 9.2 3.6 8.7 0.4 9.3 2.6 5.7 2.4 1.5 6.0 8.7
2016Q4 18.4 5.2 8.9 3.7 7.9 0.4 9.4 2.6 5.0 2.4 2.0 6.1 8.5
Jan-17 17.5 5.2 9.9 3.4 9.6 0.4 8.4 2.6 7.1 2.4 1.7 6.2 8.2
Feb-17 12.8 5.3 8.8 3.7 8.0 0.9 1.9 2.6 8.1 7.6 2.8 5.6 6.8
Mar-17 10.3 5.1 7.7 3.7 7.7 0.7 2.0 2.6 7.3 7.6 2.8 5.4 6.0
2017Q1 13.5 5.2 8.8 3.6 8.5 0.7 4.1 2.6 7.5 5.9 2.4 5.7 7.0
Apr-17 9.4 3.7 7.4 8.2 7.7 0.5 2.9 1.0 7.7 7.5 0.7 4.0 7.0
May-17 9.4 7.2 7.4 8.2 7.8 0.6 3.3 1.0 5.4 7.5 2.1 4.6 7.1
Jun-17 8.5 7.0 7.3 8.0 8.4 0.6 3.5 1.0 6.1 7.5 2.0 5.5 6.9
2017Q2 9.1 6.0 7.4 8.1 8.0 0.6 3.2 1.0 6.4 7.5 1.6 4.7 7.0
Jul-17 8.0 7.4 6.2 8.0 7.9 0.4 3.8 (0.1) 6.4 7.5 2.4 5.7 6.7
Aug-17 5.9 8.0 4.3 8.1 6.8 0.3 3.5 (1.3) 7.0 7.4 4.2 3.9 5.9
Sep-17 4.9 8.3 1.6 8.1 5.4 0.6 3.4 (1.3) 6.6 7.4 4.3 3.1 5.4
2017Q3 6.2 7.9 4.0 8.1 6.7 0.4 3.6 (0.9) 6.7 7.4 3.7 4.2 6.0
Oct-17 4.7 6.6 (0.1) 8.2 6.8 0.4 4.1 (1.3) 6.5 7.4 5.5 1.7 5.4
Nov-17 3.5 6.0 (0.7) 8.2 3.5 0.6 4.4 (1.3) 6.0 7.4 5.1 1.3 4.9
Dec-17 2.6 5.9 (1.0) 8.2 2.4 0.8 5.6 (1.3) 6.2 7.4 6.1 1.3 4.7
2017Q4 3.6 6.2 (0.6) 8.2 4.3 0.6 4.7 (1.3) 6.2 7.4 5.6 1.4 5.0
Jan-18 2.5 6.3 (1.7) 8.2 1.7 1.0 5.7 (1.3) 4.9 7.4 6.1 1.0 4.6
Feb-18 1.1 6.2 (2.6) 8.0 2.3 1.0 4.6 (1.3) 3.7 7.8 5.7 1.5 4.0
Mar-18 0.9 5.7 (2.2) 8.1 3.0 1.1 3.9 (1.3) 4.1 7.8 5.8 1.2 4.0
2018Q1 1.5 6.1 (2.2) 8.1 2.3 1.0 4.7 (1.3) 4.2 7.7 5.9 1.2 4.2
Apr-18 (0.9) 4.6 (1.9) 13.3 3.9 1.1 3.3 (2.3) 3.6 7.8 6.2 1.3 4.8
May-18 (1.3) 2.8 (2.0) 13.9 3.4 1.2 3.4 (2.3) 4.2 7.8 4.9 1.1 4.8
Jun-18 (0.7) 2.8 (2.4) 13.9 2.6 1.2 3.8 (2.3) 4.1 7.8 5.0 0.3 4.9
2018Q2 (1.0) 3.4 (2.1) 13.7 3.3 1.2 3.5 (2.3) 4.0 7.8 5.4 0.9 4.8
Q: Quarterly Averages
Linking of indices was done by the Central Bank of Eswatini
Sources: Eswatini Central Statistics Office
Statistics South Africa

76 Central Bank of Eswatini Quarterly Review - June 2018
TABLE S 9.1 MINERAL PRODUCTION TABLE S 9.1
MINERAL PRODUCTION
Period Coal Quarried Stone Iron OreEnded (In Metric Tonnes) (In Cubic Metres) (In Metric Tonnes)
2007 241,283 207,5352008 174,807 240,9972009 129,647 202,3192010 145,903 304,8442011 121,050 206,341 79,5532012 152,284 308,440 1,032,2402013 257,090 292,704 1,258,5602014 177,930 310,659 603,2512015 141,733 396,046 02016 158,418 419,642 02017 202,277 291,100 0
2005: March 116,848 51,927June 69,735 97,038Sept. 0 199,546Dec. 35,118 218,260
2006: March 38,668 118,987June 43,448 161,426Sept. 118,736 103,147Dec. 109,718 151,128
2007: March 45,903 64,994June 46,080 65,218Sept. 42,518 43,306Dec. 106,782 34,017
2008: March 32,102 56,155June 54,810 68,087Sept. 46,808 71,962Dec. 41,087 44,793
2009 March 32,818 37,792June 39,879 65,966Sept. 34,118 49,568Dec. 22,832 48,993
2010 March 35,105 72,929June 30,560 83,546Sept. 43,690 88,234Dec. 36,548 60,135
2011 March 37,748 38,008June 30,131 50,753Sept 29,335 58,001Dec 23,836 59,579 79,553
2012 March 38,267 70,487 198,923June 35,368 76,590 337,116Sept 36,751 85,732 250,823Dec 41,898 75,631 245,378
2013 March 93,057 60,267 355,326June 67,875 85,176 340,212Sept 54,135 86,480 313,261Dec 42,023 60,781 249,761
2014 March 40,972 62,993 262,519June 39,701 74,903 203,233Sept 49,349 84,273 137,499Dec 47,908 88,490 0
2015 March 33,847 77,194 0June 32,763 78,532 0Sept 34,127 182,852 0Dec 40,996 57,468 0
2016 March 38,111 69,383 0June 34,266 154,525 0Sept 38,892 108,001 0Dec* 47,149 87,733 0
2017 March* 62,217 83,836 0June* 46,623 58,334 0Sept* 48,093 81,400 0Dec* 45,344 67,530 0
2018 March* 35,024 52,148 0June* 37,519 100,505 0
* Preliminary
Source: Ministry of Natural Resources & Energy, Geological Surveys, Minerals & Mines Department
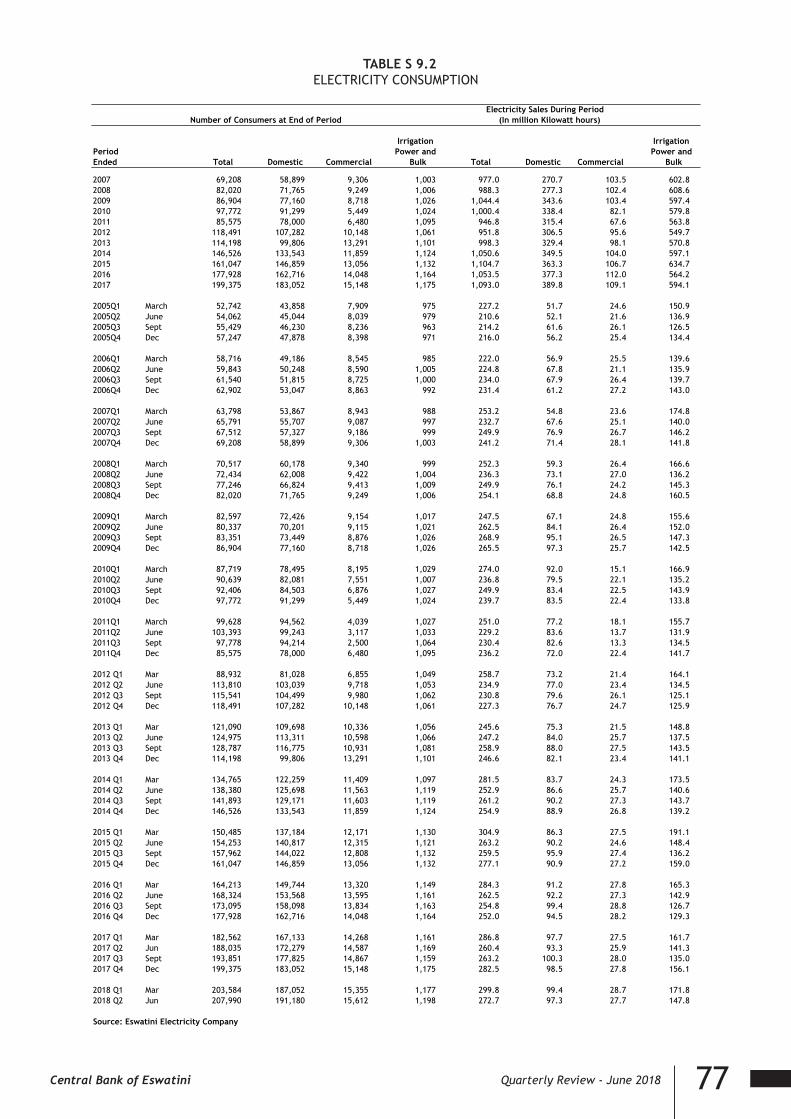
77Central Bank of Eswatini Quarterly Review - June 2018
TABLE S 9.2 ELECTRICITY CONSUMPTIONTable S 9.2 ELECTRICITY CONSUMPTION
Electricity Sales During Period
Number of Consumers at End of Period (In million Kilowatt hours)
Irrigation IrrigationPeriod Power and Power andEnded Total Domestic Commercial Bulk Total Domestic Commercial Bulk
2007 69,208 58,899 9,306 1,003 977.0 270.7 103.5 602.82008 82,020 71,765 9,249 1,006 988.3 277.3 102.4 608.62009 86,904 77,160 8,718 1,026 1,044.4 343.6 103.4 597.42010 97,772 91,299 5,449 1,024 1,000.4 338.4 82.1 579.82011 85,575 78,000 6,480 1,095 946.8 315.4 67.6 563.82012 118,491 107,282 10,148 1,061 951.8 306.5 95.6 549.72013 114,198 99,806 13,291 1,101 998.3 329.4 98.1 570.82014 146,526 133,543 11,859 1,124 1,050.6 349.5 104.0 597.12015 161,047 146,859 13,056 1,132 1,104.7 363.3 106.7 634.72016 177,928 162,716 14,048 1,164 1,053.5 377.3 112.0 564.22017 199,375 183,052 15,148 1,175 1,093.0 389.8 109.1 594.1
2005Q1 March 52,742 43,858 7,909 975 227.2 51.7 24.6 150.92005Q2 June 54,062 45,044 8,039 979 210.6 52.1 21.6 136.92005Q3 Sept 55,429 46,230 8,236 963 214.2 61.6 26.1 126.52005Q4 Dec 57,247 47,878 8,398 971 216.0 56.2 25.4 134.4
2006Q1 March 58,716 49,186 8,545 985 222.0 56.9 25.5 139.62006Q2 June 59,843 50,248 8,590 1,005 224.8 67.8 21.1 135.92006Q3 Sept 61,540 51,815 8,725 1,000 234.0 67.9 26.4 139.72006Q4 Dec 62,902 53,047 8,863 992 231.4 61.2 27.2 143.0
2007Q1 March 63,798 53,867 8,943 988 253.2 54.8 23.6 174.82007Q2 June 65,791 55,707 9,087 997 232.7 67.6 25.1 140.02007Q3 Sept 67,512 57,327 9,186 999 249.9 76.9 26.7 146.22007Q4 Dec 69,208 58,899 9,306 1,003 241.2 71.4 28.1 141.8
2008Q1 March 70,517 60,178 9,340 999 252.3 59.3 26.4 166.62008Q2 June 72,434 62,008 9,422 1,004 236.3 73.1 27.0 136.22008Q3 Sept 77,246 66,824 9,413 1,009 249.9 76.1 24.2 145.32008Q4 Dec 82,020 71,765 9,249 1,006 254.1 68.8 24.8 160.5
2009Q1 March 82,597 72,426 9,154 1,017 247.5 67.1 24.8 155.62009Q2 June 80,337 70,201 9,115 1,021 262.5 84.1 26.4 152.02009Q3 Sept 83,351 73,449 8,876 1,026 268.9 95.1 26.5 147.32009Q4 Dec 86,904 77,160 8,718 1,026 265.5 97.3 25.7 142.5
2010Q1 March 87,719 78,495 8,195 1,029 274.0 92.0 15.1 166.92010Q2 June 90,639 82,081 7,551 1,007 236.8 79.5 22.1 135.22010Q3 Sept 92,406 84,503 6,876 1,027 249.9 83.4 22.5 143.92010Q4 Dec 97,772 91,299 5,449 1,024 239.7 83.5 22.4 133.8
2011Q1 March 99,628 94,562 4,039 1,027 251.0 77.2 18.1 155.72011Q2 June 103,393 99,243 3,117 1,033 229.2 83.6 13.7 131.92011Q3 Sept 97,778 94,214 2,500 1,064 230.4 82.6 13.3 134.52011Q4 Dec 85,575 78,000 6,480 1,095 236.2 72.0 22.4 141.7
2012 Q1 Mar 88,932 81,028 6,855 1,049 258.7 73.2 21.4 164.12012 Q2 June 113,810 103,039 9,718 1,053 234.9 77.0 23.4 134.52012 Q3 Sept 115,541 104,499 9,980 1,062 230.8 79.6 26.1 125.12012 Q4 Dec 118,491 107,282 10,148 1,061 227.3 76.7 24.7 125.9
2013 Q1 Mar 121,090 109,698 10,336 1,056 245.6 75.3 21.5 148.82013 Q2 June 124,975 113,311 10,598 1,066 247.2 84.0 25.7 137.52013 Q3 Sept 128,787 116,775 10,931 1,081 258.9 88.0 27.5 143.52013 Q4 Dec 114,198 99,806 13,291 1,101 246.6 82.1 23.4 141.1
2014 Q1 Mar 134,765 122,259 11,409 1,097 281.5 83.7 24.3 173.52014 Q2 June 138,380 125,698 11,563 1,119 252.9 86.6 25.7 140.62014 Q3 Sept 141,893 129,171 11,603 1,119 261.2 90.2 27.3 143.72014 Q4 Dec 146,526 133,543 11,859 1,124 254.9 88.9 26.8 139.2
2015 Q1 Mar 150,485 137,184 12,171 1,130 304.9 86.3 27.5 191.12015 Q2 June 154,253 140,817 12,315 1,121 263.2 90.2 24.6 148.42015 Q3 Sept 157,962 144,022 12,808 1,132 259.5 95.9 27.4 136.22015 Q4 Dec 161,047 146,859 13,056 1,132 277.1 90.9 27.2 159.0
2016 Q1 Mar 164,213 149,744 13,320 1,149 284.3 91.2 27.8 165.32016 Q2 June 168,324 153,568 13,595 1,161 262.5 92.2 27.3 142.92016 Q3 Sept 173,095 158,098 13,834 1,163 254.8 99.4 28.8 126.72016 Q4 Dec 177,928 162,716 14,048 1,164 252.0 94.5 28.2 129.3
2017 Q1 Mar 182,562 167,133 14,268 1,161 286.8 97.7 27.5 161.72017 Q2 Jun 188,035 172,279 14,587 1,169 260.4 93.3 25.9 141.32017 Q3 Sept 193,851 177,825 14,867 1,159 263.2 100.3 28.0 135.02017 Q4 Dec 199,375 183,052 15,148 1,175 282.5 98.5 27.8 156.1
2018 Q1 Mar 203,584 187,052 15,355 1,177 299.8 99.4 28.7 171.82018 Q2 Jun 207,990 191,180 15,612 1,198 272.7 97.3 27.7 147.8
Source: Eswatini Electricity Company

78 Central Bank of Eswatini Quarterly Review - June 2018
TABLE S 9.3TREATED WATER CONSUMPTION
TREATED WATER CONSUMPTION
Water Sales During PeriodNumber of Connections at End of Period (In million kilolitres) M³
PeriodEnded Total Domestic Commercial Total Domestic Commercial2005 22,282 19,844 2,438 11.063 5.735 5.3282006 23,356 20,897 2,459 10.598 5.155 5.4442007 24,061 21,522 2,539 11.360 5.870 5.4902008 26,045 23,336 2,709 12.192 5.761 6.4312009 27,136 24,387 2,749 11.723 5.695 6.0282010 31,243 28,286 2,957 12.268 6.076 6.1922011 29,613 26,781 2,832 11.806 5.393 6.4142012 31,165 28,345 2,820 12.265 5.607 6.6582013 32,555 29,726 2,829 12.861 5.558 7.3032014 34,643 31,721 2,922 12.738 5.864 6.8742015 38,029 35,024 3,005 12.728 6.088 6.6412016 40,120 37,047 3,073 11.834 5.939 5.8942017 42,345 39,216 3,129 12.150 6.382 5.768
2006Q1 March 22,665 20,159 2,506 2.276 0.994 1.2832006Q2 June 22,850 20,335 2,515 2.675 1.337 1.3372006Q3 Sept 23,363 20,827 2,536 2.787 1.393 1.3932006Q4 Dec 23,356 20,897 2,459 2.860 1.430 1.430
2007Q1 March 24,527 21,890 2,637 2.782 1.515 1.2682007Q2 June 24,250 21,677 2,573 2.804 1.448 1.3562007Q3 Sept 24,300 21,694 2,606 3.009 1.545 1.4642007Q4 Dec 24,061 21,522 2,539 2.765 1.362 1.402
2008Q1 March 24,311 21,786 2,525 2.850 1.371 1.4792008Q2 June 25,499 22,785 2,714 2.872 1.437 1.4352008Q3 Sept 25,859 23,150 2,709 3.458 1.480 1.9782008Q4 Dec 26,045 23,336 2,709 3.013 1.474 1.539
2009Q1 March 26,350 23,598 2,752 2.812 1.370 1.4422009Q2 June 26,818 24,061 2,757 3.010 1.434 1.5762009Q3 Sept 27,076 24,314 2,762 2.980 1.470 1.5102009Q4 Dec 27,136 24,387 2,749 2.922 1.422 1.500
2010Q1 March 29,998 27,130 2,868 2.922 1.454 1.4682010Q2 June 30,415 27,479 2,936 3.115 1.565 1.5502010Q3 Sept 28,638 25,822 2,816 3.138 1.552 1.5862010Q4 Dec 31,243 28,286 2,957 3.092 1.504 1.588
2011Q1 March 29,486 26,626 2,860 3.016 1.320 1.6962011Q2 June 29,590 26,700 2,890 2.964 1.353 1.6112011Q3 Sept 30,009 27,092 2,917 2.903 1.361 1.5432011Q4 Dec 29,613 26,781 2,832 2.923 1.359 1.564
2012Q1 March 30,087 27,203 2,884 3.030 1.392 1.6382012Q2 June 31,439 28,493 2,946 3.120 1.420 1.7002012Q3 Sept 31,667 28,717 2,950 3.154 1.477 1.6772012Q4 Dec 31,165 28,345 2,820 2.961 1.318 1.643
2013Q1 Mar 31,391 28,558 2,833 3.141 1.379 1.7622013Q2 June 31,908 29,052 2,856 3.234 1.389 1.8442013Q3 Sept 32,602 29,756 2,846 3.282 1.436 1.8462013Q4 Dec 32,555 29,726 2,829 3.204 1.353 1.851
2014Q1 Mar 33,322 30,434 2,888 3.165 1.434 1.7312014Q2 June 34,111 31,219 2,892 3.233 1.453 1.7792014Q3 Sept 34,467 31,560 2,907 3.257 1.559 1.6982014Q4 Dec 34,643 31,721 2,922 3.085 1.418 1.666
2015Q1 Mar 35,228 32,305 2,923 3.194 1.447 1.7482015Q2 June 35,968 33,004 2,964 3.190 1.539 1.6512015Q3 Sept 37,660 34,674 2,986 3.212 1.559 1.6522015Q4 Dec 38,029 35,024 3,005 3.133 1.543 1.590
2016Q1 Mar 38,424 35,401 3,023 3.036 1.531 1.5042016Q2 June 38,854 35,785 3,069 2.966 1.487 1.4782016Q3 Sept 40,077 36,994 3,083 2.957 1.489 1.4692016Q4 Dec 40,120 37,047 3,073 2.875 1.432 1.443
2017Q1 Mar 40,308 37,229 3,079 2.925 1.546 1.3802017Q2 Jun 41,948 38,798 3,150 3.109 1.556 1.5532017Q3 Sept 42,680 39,536 3,144 3.104 1.678 1.4252017Q4 Dec 42,345 39,216 3,129 3.012 1.602 1.410
2018Q1 Mar 42,997 39,839 3,158 3.015 1.642 1.3732018Q2 Jun 44,092 40,804 3,288 3.195 1.642 1.553
Source: Eswatini Water Services Corporation
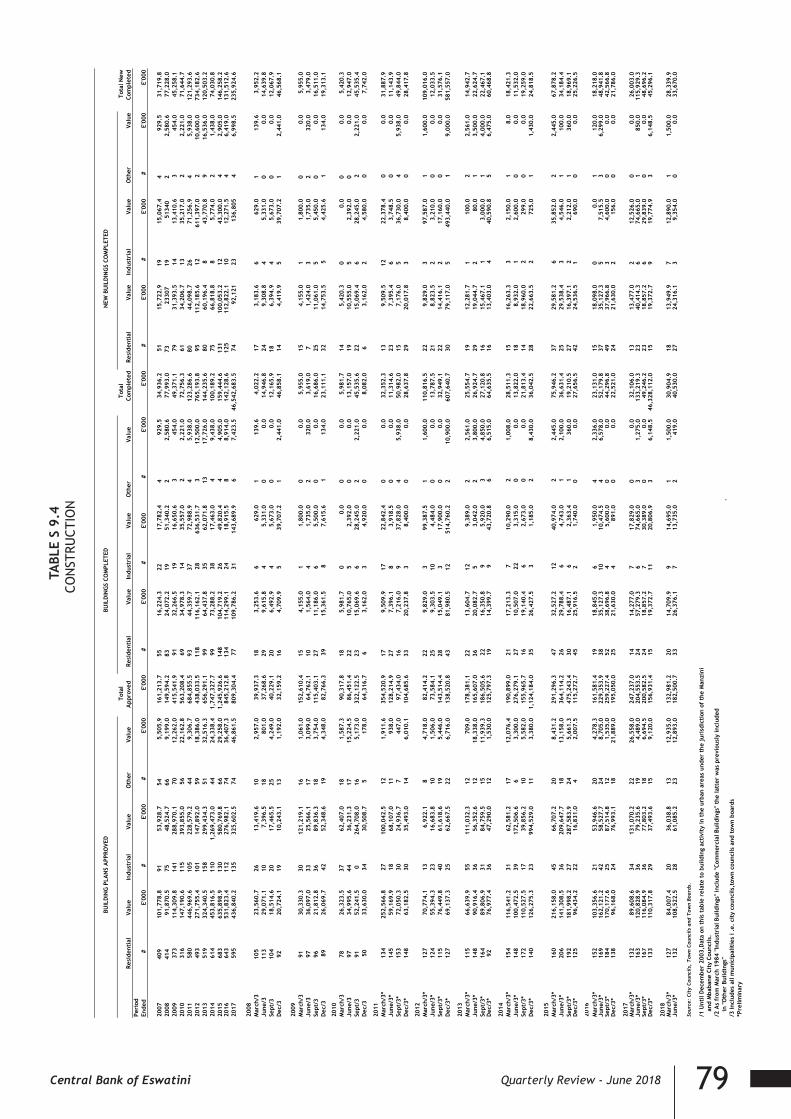
79Central Bank of Eswatini Quarterly Review - June 2018
TA
BLE
S 9.
4CO
NST
RUCT
ION
TABL
E S
9.4
CON
STRU
CTIO
N
B
UIL
DIN
G P
LAN
S A
PPRO
VED
B
UIL
DIN
GS
COM
PLET
ED
NEW
BU
ILD
ING
S CO
MPL
ETED
Tot
al
Tot
al
Tot
al N
ewRe
side
ntia
l
Valu
eIn
dust
rial
Va
lue
Oth
er
Val
ue A
ppro
ved
Res
iden
tial
Val
ueIn
dust
rial
Va
lue
Oth
er
Valu
e C
ompl
eted
Res
iden
tial
Va
lue
Indu
stri
al
Valu
e O
ther
Va
lue
Com
plet
edPe
riod
Ende
d #
E'
000
#
E'00
0
#
E'0
00
E'00
0
# E
'000
#
E'
000
#
E'
000
E'
000
#
E'
000
#
E'
000
#
E'
000
E'
000
2007
409
101,
778.
891
53,9
28.7
545,
505.
916
1,21
3.7
5516
,224
.322
17,7
82.4
492
9.5
34,9
36.2
5115
,722
.919
15,0
67.4
492
9.5
31,7
19.8
2008
414
91,8
70.5
7548
,524
.766
9,19
9.0
149,
594.
283
24,0
72.2
1951
,340
.22
2,58
0.6
77,9
93.0
7323
307
1951
340
22,
580.
677
,228
.020
0937
311
4,30
9.8
141
288,
970.
170
12,2
62.0
415,
541.
991
32,2
66.5
1916
,650
.63
454.
049
,371
.179
31,3
93.5
1413
,410
.63
454.
045
,258
.120
1031
614
7,19
0.6
115
393,
855.
056
22,1
62.8
563,
208.
469
34,9
78.3
1435
,557
.02
2,22
1.0
72,7
56.3
6134
,206
.713
35,2
17.0
22,
221.
071
,644
.720
1158
044
6,96
9.6
105
228,
579.
244
9,30
6.7
684,
855.
593
44,3
59.7
3772
,988
.94
5,93
8.0
123,
286.
680
44,0
98.7
2671
,256
.94
5,93
8.0
121,
293.
620
1249
327
1,75
5.4
101
147,
892.
059
18,3
86.0
438,
033.
511
811
6,16
2.1
2863
6,53
1.7
312
,500
.076
5,19
3.8
9511
2,18
5.6
1261
1,39
7.0
210
,600
.073
4,18
2.6
2013
519
324,
340.
515
829
9,43
4.3
5132
,516
.365
6,29
1.1
9964
,437
.835
62,0
71.8
1317
,726
.014
4,23
5.6
8060
,196
.48
43,7
70.8
916
,536
.012
0,50
3.2
2014
614
453,
816.
511
01,
269,
473.
044
24,3
38.4
1,74
7,32
7.7
9973
,288
.238
17,4
63.0
49,
438.
010
0,18
9.2
7566
,818
.88
5,77
4.0
21,
438.
074
,030
.820
1568
363
5,89
8.9
130
580,
769.
866
29,2
58.0
1,24
5,92
6.6
148
104,
719.
226
49,8
20.4
44,
905.
015
9,44
4.6
131
100,
053.
212
43,3
00.0
42,
905.
014
6,25
8.2
2016
643
531,
823.
411
227
6,98
2.1
7436
,407
.384
5,21
2.8
134
114,
299.
124
18,9
15.5
88,
914.
014
2,12
8.6
125
112,
822.
110
12,2
71.5
46,
419.
013
1,51
2.6
2017
595
436,
840.
213
532
5,60
2.5
7446
,861
.580
9,30
4.4
7710
9,78
6.2
3114
3,68
9.9
67,
423.
546
,542
,683
.574
92,1
2123
136,
805
46,
998.
523
5,92
4.6
2008
Mar
ch/3
105
23,5
60.7
2613
,419
.610
2,95
7.0
39,9
37.3
183,
253.
66
629.
01
139.
64,
022.
217
3,18
3.6
662
9.0
113
9.6
3,95
2.2
June
/311
329
,071
.110
7,39
6.5
1880
1.0
37,2
68.6
299,
615.
84
5,33
1.0
00.
014
,946
.824
9,30
8.8
45,
331.
00
0.0
14,6
39.8
Sept
/310
418
,514
.620
17,4
65.5
254,
249.
040
,229
.120
6,49
2.9
45,
673.
00
0.0
12,1
65.9
186,
394.
94
5,67
3.0
00.
012
,067
.9D
ec/3
9220
,724
.119
10,2
43.1
131,
192.
032
,159
.216
4,70
9.9
539
,707
.21
2,44
1.0
46,8
58.1
144,
419.
95
39,7
07.2
12,
441.
046
,568
.1
2009
Mar
ch/3
9130
,330
.330
121,
219.
116
1,06
1.0
152,
610.
415
4,15
5.0
11,
800.
00
0.0
5,95
5.0
154,
155.
01
1,80
0.0
00.
05,
955.
0Ju
ne/3
9736
,097
.033
25,5
66.1
173,
099.
064
,762
.110
1,56
4.0
41,
735.
02
320.
03,
619.
07
1,42
4.0
31,
735.
02
320.
03,
479.
0Se
pt/3
9621
,812
.836
89,8
36.3
183,
754.
011
5,40
3.1
2711
,186
.06
5,50
0.0
00.
016
,686
.025
11,0
61.0
55,
450.
00
0.0
16,5
11.0
Dec
/389
26,0
69.7
4252
,348
.619
4,34
8.0
82,7
66.3
3915
,361
.58
7,61
5.6
113
4.0
23,1
11.1
3214
,753
.55
4,42
5.6
113
4.0
19,3
13.1
2010
Mar
ch/3
7826
,323
.537
62,4
07.0
181,
587.
390
,317
.818
5,98
1.7
00.
00
0.0
5,98
1.7
145,
420.
30
0.0
00.
05,
420.
3Ju
ne/3
9734
,995
.644
36,2
31.3
1715
,224
.586
,451
.422
10,7
65.0
52,
392.
00
0.0
13,1
57.0
1910
,555
.05
2,39
2.0
00.
012
,947
.0Se
pt/3
9152
,241
.50
264,
708.
016
5,17
3.0
322,
122.
523
15,0
69.6
628
,245
.02
2,22
1.0
45,5
35.6
2215
,069
.46
28,2
45.0
22,
221.
045
,535
.4D
ec/3
5033
,630
.034
30,5
08.7
517
8.0
64,3
16.7
63,
162.
03
4,92
0.0
00.
08,
082.
06
3,16
2.0
24,
580.
00
0.0
7,74
2.0
2011
Mar
ch/3
*13
425
2,56
6.8
2710
0,04
2.5
121,
911.
635
4,52
0.9
179,
509.
917
22,8
42.4
00.
032
,352
.313
9,50
9.5
1222
,378
.40
0.0
31,8
87.9
June
/3*
145
59,1
69.9
1868
,107
.011
938.
012
8,21
4.9
277,
396.
18
3,91
8.5
00.
011
,314
.623
7,39
5.4
63,
748.
50
0.0
11,1
43.9
Sept
/3*
153
72,0
50.3
3024
,936
.77
447.
097
,434
.016
7,21
6.0
937
,828
.04
5,93
8.0
50,9
82.0
157,
176.
05
36,7
30.0
45,
938.
049
,844
.0D
ec/3
*14
863
,182
.530
35,4
93.0
146,
010.
110
4,68
5.6
3320
,237
.83
8,40
0.0
00.
028
,637
.829
20,0
17.8
38,
400.
00
0.0
28,4
17.8
2012
Mar
ch/3
*12
770
,774
.113
6,92
2.1
84,
718.
082
,414
.222
9,82
9.0
399
,387
.51
1,60
0.0
110,
816.
522
9,82
9.0
397
,587
.01
1,60
0.0
109,
016.
0Ju
ne/3
*12
455
,394
.323
16,6
83.8
101,
506.
073
,584
.125
9,30
3.5
104,
484.
00
0.0
13,7
87.5
218,
823.
52
3,21
0.0
00.
012
,033
.5Se
pt/3
*11
576
,449
.840
61,6
18.6
195,
446.
014
3,51
4.4
2815
,049
.13
17,9
00.0
00.
032
,949
.122
14,4
16.1
217
,160
.00
0.0
31,5
76.1
Dec
/3*
127
69,1
37.3
2562
,667
.522
6,71
6.0
138,
520.
843
81,9
80.5
1251
4,76
0.2
210
,900
.060
7,64
0.7
3079
,117
.05
493,
440.
01
9,00
0.0
581,
557.
0
2013
Mar
ch/3
*11
566
,639
.955
111,
032.
312
709.
017
8,38
1.1
2213
,604
.712
9,38
9.0
22,
561.
025
,554
.719
12,2
81.7
110
0.0
22,
561.
014
,942
.7Ju
ne/3
*14
890
,916
.436
56,3
52.6
1218
,338
.016
5,60
7.0
3620
,082
.75
3,04
2.0
23,
800.
026
,924
.729
19,0
44.7
280
.01
3,50
0.0
22,6
24.7
Sept
/3*
164
89,8
06.9
3184
,759
.515
11,9
39.3
186,
505.
622
16,3
50.8
95,
920.
03
4,85
0.0
27,1
20.8
1615
,467
.11
3,00
0.0
14,
000.
022
,467
.1D
ec/3
*92
76,9
77.4
3647
,290
.012
1,53
0.0
125,
797.
319
14,3
99.7
943
,720
.86
6,51
5.0
64,6
35.5
1613
,403
.04
40,5
90.8
56,
475.
060
,468
.8
2014
Mar
ch/3
*15
411
6,54
1.2
3162
,581
.217
12,0
76.4
190,
899.
021
17,2
13.3
710
,290
.02
1,00
8.0
28,5
11.3
1516
,263
.33
2,15
0.0
18.
018
,421
.3Ju
ne/3
*14
810
0,47
2.5
3917
2,50
6.6
63,
300.
027
6,27
9.1
2710
,507
.022
3,31
5.0
00.
013
,822
.018
8,93
2.0
12,
600.
00
0.0
11,5
32.0
Sept
/3*
172
110,
527.
517
39,8
56.2
105,
582.
015
5,96
5.7
1619
,140
.46
2,67
3.0
00.
021
,813
.414
18,9
60.0
229
9.0
00.
019
,259
.0D
ec/3
*14
012
6,27
5.3
2399
4,52
9.0
113,
380.
01,
124,
184.
035
26,4
27.5
31,
185.
02
8,43
0.0
36,0
42.5
2822
,663
.52
725.
01
1,43
0.0
24,8
18.5
2015
Mar
ch/3
*16
021
6,15
8.0
4566
,707
.220
8,43
1.2
291,
296.
347
32,5
27.2
1240
,974
.02
2,44
5.0
75,9
46.2
3729
,581
.26
35,8
52.0
22,
445.
067
,878
.2Ju
ne/3
*20
614
1,30
8.5
3620
9,64
7.7
1813
,158
.036
4,11
4.2
2629
,788
.46
4,74
3.0
12,
100.
036
,631
.425
29,5
38.4
34,
546.
01
100.
034
,184
.4Se
pt/3
*19
218
1,99
8.2
2728
7,58
3.9
245,
661.
347
5,24
3.4
3016
,487
.16
2,36
3.4
136
0.0
19,2
10.5
2716
,397
.12
2,21
2.0
136
0.0
18,9
69.1
Dec
/3*
125
96,4
34.2
2216
,831
.04
2,00
7.5
115,
272.
745
25,9
16.5
21,
740.
00
0.0
27,6
56.5
4224
,536
.51
690.
00
0.0
25,2
26.5
2016
Mar
ch/3
*15
210
3,35
6.6
2153
,946
.620
4,27
8.3
161,
581.
419
18,8
45.0
61,
950.
04
2,33
6.0
23,1
31.0
1518
,098
.00
0.0
112
0.0
18,2
18.0
June
/3*
169
162,
121.
242
58,5
27.7
248,
705.
022
9,35
3.9
3835
,127
.310
10,4
74.5
46,
578.
052
,179
.837
35,1
27.3
57,
515.
53
6,29
9.0
48,9
41.8
Sept
/3*
184
170,
177.
625
87,5
14.8
121,
535.
025
9,22
7.4
5238
,696
.84
5,60
0.0
00.
044
,296
.849
37,9
66.8
34,
600.
00
0.0
42,5
66.8
Dec
/3*
138
96,1
68.0
2476
,993
.118
21,8
89.0
195,
050.
025
21,6
30.0
489
1.0
00.
022
,521
.024
21,6
30.0
215
6.0
00.
021
,786
.0
2017
Mar
ch/3
*13
289
,608
.634
131,
070.
222
26,5
58.0
247,
237.
014
14,2
77.0
717
,829
.00
0.0
32,1
06.0
1313
,477
.02
12,5
26.0
00.
026
,003
.0Ju
ne/3
*16
312
0,82
8.9
3679
,235
.619
4,48
9.0
204,
553.
524
57,2
79.3
674
,665
.03
1,27
5.0
133,
219.
323
40,4
14.3
674
,665
.01
850.
011
5,92
9.3
Sept
/3*
167
116,
084.
936
77,8
03.2
186,
694.
520
0,58
2.5
2418
,857
.27
30,3
89.0
00.
049
,246
.223
18,8
57.2
629
,839
.00
0.0
48,6
96.2
Dec
/3*
133
110,
317.
829
37,4
93.6
159,
120.
015
6,93
1.4
1519
,372
.711
20,8
06.9
36,
148.
546
,328
,112
.015
19,3
72.7
919
,774
.93
6,14
8.5
45,2
96.1
2018
Mar
ch/3
*12
784
,007
.420
36,0
38.8
1312
,935
.013
2,98
1.2
2014
,709
.99
14,6
95.0
11,
500.
030
,904
.918
13,9
49.9
712
,890
.01
1,50
0.0
28,3
39.9
June
/3*
132
108,
522.
528
61,0
85.2
2312
,893
.018
2,50
0.7
3326
,376
.17
13,7
35.0
241
9.0
40,5
30.0
2724
,316
.13
9,35
4.0
00.
033
,670
.0
Sour
ce:
Cit
y C
ounc
ils,
Tow
n C
ounc
ils
and
Tow
n Bo
ards
.
/1 U
ntil
Dec
embe
r 20
03,D
ata
on t
his
tabl
e re
late
to
build
ing
acti
vity
in t
he u
rban
are
as u
nder
the
jur
isdi
ctio
n of
the
Man
zini
an
d M
baba
ne C
ity
Coun
cils
./2
As
from
Mar
ch 1
984
"Indu
stri
al B
uild
ings
" in
clud
e "C
omm
erci
al B
uild
ings
" th
e la
tter
was
pre
viou
sly
incl
uded
in
"O
ther
Bui
ldin
gs"
./3
Incl
udes
all
mun
icip
alit
ies
i .e.
cit
y co
unci
ls,t
own
coun
cils
and
tow
n bo
ards
*Pre
limin
ary
80 Central Bank of Eswatini Quarterly Review - June 2018
NOTES:

81Central Bank of Eswatini Quarterly Review - June 2018

82 Central Bank of Eswatini Quarterly Review - June 2018
For more information, contact:
GM, Economic Policy, Research and StatisticsCentral Bank of Eswatini
P.O. Box 546MBABANE,Eswatini
Tel: +268 2408-2243E-mail: [email protected]