Quantitative study of fluvial landscapes. Case study in Madrid, Spain
17
Landscapeand Urban Planrung, 16 (1988) 201-217 Elsevier Science Publishers B.V., Amsterdam - Printed in The Netherlands 201 QUANTITATIVE STUDY OF FLUVIAL LANDSCAPES. CASE STUDY IN MADRID, SPAIN VICTOR CASTILLO, ANTONIO DIAZ SEGOVIA and SANTIAGO GONZALEZ ALONSO C‘citedra de PlanI.ficaadn, ETS Ingenieros de Mantes. Universidad Polittknica, 28040 Madrid (Spain) ABSTRACT Castillo, I/, Segovia, A.D. and Alonso, S.G., 1988. Quantitative study of jluvial land- scapes. Case study in Madrid, Spain. Land- scape Urban Plann., 16: 201-217. The quantitative approach to landscape de- scription has been a point oj’growing concern in the area effluvial geomorphology as a tool for land-use planning. On the basis of morphometric indexes and variables commonly used to describe the geom- etry of ,fluvial landforms, a methodology has been established to study the existing relation- ships between river morphology and geo- morphic processes. Through multivariate analysis of morphometric data of 35 selected drainage basins, five basin groups are defined. These groups are described bv their specific en- vironmental elements and the processes oper- ating in each of them. Finally, this description allowed us to estab- lish the relationships which just(fy the use offlu- vial geometry as a method .for interpreting erosion, hydrology and environmental.factors of the territory, as well as evaluating the risks in- troduced by human activities on the &vial networks. INTRODUCTION The use of the morphological characteristics of a fluvial system has been considered by sev- eral authors as a method of landscape interpre- tation showing the relationship between the natural elements of direct observation (the shape of channels, the hydrographic character- istics of networks, etc.) and the internal com- ponents of the landscape (Gudilin, 1973; Spiridinov, 1973; Gonzalez Bernaldez, 198 1). Special attention has been accorded to the analysis of the drainage network of the fluvial system; not in vain does Small ( 1970) point out that “the drainage network of a fluvial sys- tem is the greatest characteristic of the physi- cal landscape. Its form, orientation and spacing determine the essential characteristics of the landscape. The study of its development will supply valuable information about the denu- dation of an area”. The procedures developed for this analysis fall into two quite different, although comple- mentary, approaches. One of them, merely de- 0169-2046/88/$03.50 0 1988 Elsevier Science Publishers B.V.
-
Upload
independent -
Category
Documents
-
view
3 -
download
0
Transcript of Quantitative study of fluvial landscapes. Case study in Madrid, Spain

Landscapeand Urban Planrung, 16 (1988) 201-217 Elsevier Science Publishers B.V., Amsterdam - Printed in The Netherlands
201
QUANTITATIVE STUDY OF FLUVIAL LANDSCAPES. CASE STUDY IN MADRID, SPAIN
VICTOR CASTILLO, ANTONIO DIAZ SEGOVIA and SANTIAGO GONZALEZ ALONSO
C‘citedra de PlanI.ficaadn, ETS Ingenieros de Mantes. Universidad Polittknica, 28040 Madrid (Spain)
ABSTRACT
Castillo, I/, Segovia, A.D. and Alonso, S.G., 1988. Quantitative study of jluvial land- scapes. Case study in Madrid, Spain. Land- scape Urban Plann., 16: 201-217.
The quantitative approach to landscape de- scription has been a point oj’growing concern in the area effluvial geomorphology as a tool for land-use planning.
On the basis of morphometric indexes and variables commonly used to describe the geom- etry of ,fluvial landforms, a methodology has been established to study the existing relation-
ships between river morphology and geo- morphic processes. Through multivariate analysis of morphometric data of 35 selected drainage basins, five basin groups are defined. These groups are described bv their specific en- vironmental elements and the processes oper- ating in each of them.
Finally, this description allowed us to estab- lish the relationships which just(fy the use offlu- vial geometry as a method .for interpreting erosion, hydrology and environmental.factors of the territory, as well as evaluating the risks in- troduced by human activities on the &vial networks.
INTRODUCTION
The use of the morphological characteristics of a fluvial system has been considered by sev- eral authors as a method of landscape interpre- tation showing the relationship between the natural elements of direct observation (the shape of channels, the hydrographic character- istics of networks, etc.) and the internal com- ponents of the landscape (Gudilin, 1973; Spiridinov, 1973; Gonzalez Bernaldez, 198 1).
Special attention has been accorded to the
analysis of the drainage network of the fluvial system; not in vain does Small ( 1970) point out that “the drainage network of a fluvial sys- tem is the greatest characteristic of the physi- cal landscape. Its form, orientation and spacing determine the essential characteristics of the landscape. The study of its development will supply valuable information about the denu- dation of an area”.
The procedures developed for this analysis fall into two quite different, although comple- mentary, approaches. One of them, merely de-
0169-2046/88/$03.50 0 1988 Elsevier Science Publishers B.V.
scriptive, makes it possible to adjust the different patterns of network to one basic type (dendritic, pinnate, rectangular networks, etc. )
which are later interpreted as descriptive fac- tors of the geology of the terrain and the asso- ciated topographical forms (Way, 1973: Lopez Vergara, 1978).
A second set of procedures was evolved to cope with the need to establish an objective criterion which would permit the comparison of one drainage network with another, and to establish the relationship between the struc- ture of the network and the processes of a hy- drological and erosive nature which take place on the terrain, i.e. the quantitative analysis of the drainage network (Horton, 1945 ).
This analysis of the network, together with the measurement of the topographical forms which make up a fluvial landscape, constitute what has come to be called fluvial morphome- try, defined in the words of Strahler ( 1974 ) as the measurement of the geometrical properties of the solid surface of a fluvial system.
The progressive increase in numbers of this type of studies since they began in the 1940s can be explained by the need felt in the geo- morphological sciences. and indeed in the en- vironmental sciences generally. of meth- odologies which would permit a quantitative description of the land. At the same time that these methods of quantitative analysis were developed. a great expansion in the systems theory has taken place within the epistemolog- ical field. It is no longer a question of describ- ing: it is more important to predict by knowing the way it functions.
Thus the landscape is studied as an open sys- tem with transfer of matter and energy to and from the outside in such a way that any future change in its geometry is entirely dependent on the net result of the effect of time on the fac- tors (or variables) of control (Strahler. 1964: Chorley. 1962; Schumm, 1977 ).
This conceptual framework implies two new approaches to the study of fluvial forms: on the one hand, the search for relationships between
morphology and processes. emphasizing the multivariable nature of the geomorphological phenomena and on the other hand the global consideration of the physical landscape in which man is just one more operator. This last approach has allowed the concept of a drain- age basin, as a territorial expression of an en- vironmental system. to transcend the field of geomorphology and geology and place itself firmly as a unit of study and management in various disciplines related to land-use planning.
In this paper. the intention is to classify the fluvial landscapes in the Province of Madrid, paying attention to their morphological char- acteristics and the subsequent use of the geo- metrical aspects of the landscape as indicators for the study of the relationships connecting forms with processes.
THE TERRITORIAL ENVIRONMENT
Situation
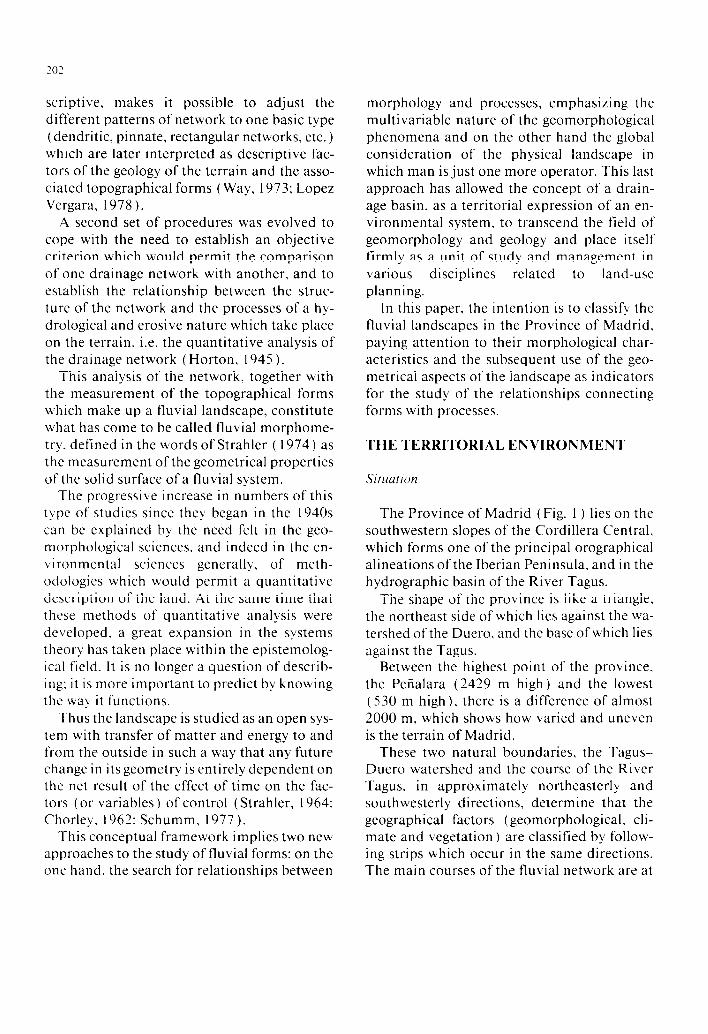
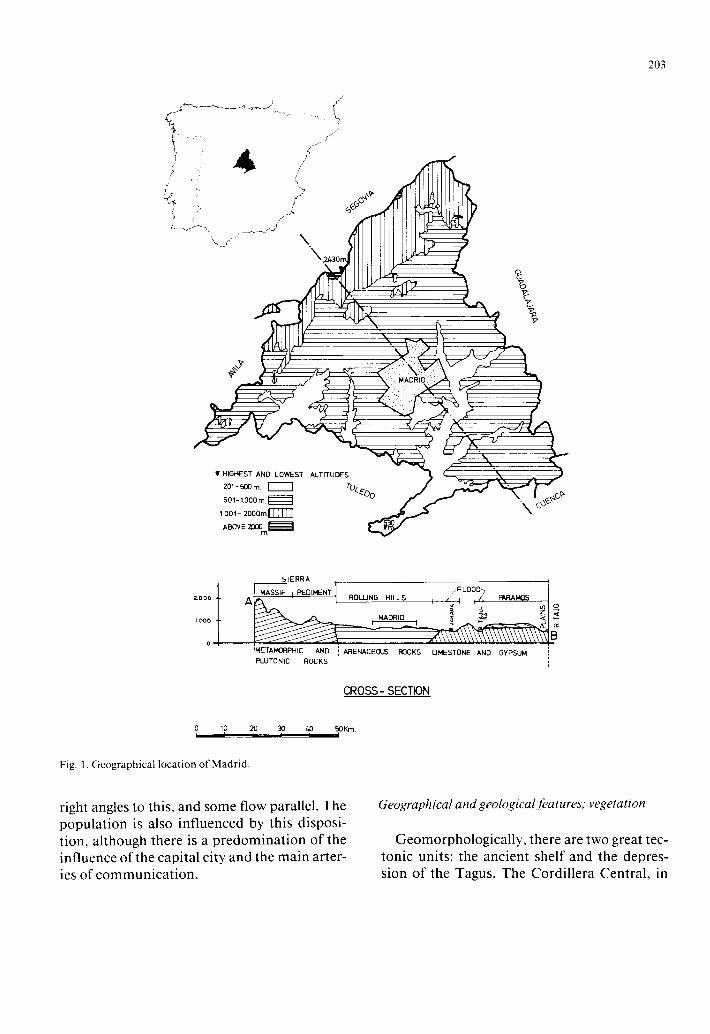
The Province of Madrid (Fig. 1 ) lies on the southwestern slopes of the Cordillera Central, which forms one of the principal orographical alineations of the Iberian Peninsula, and in the hydrographic basin of the River Tagus.
The shape of the province is like a triangle. the northeast side of which lies against the wa- tershed of the Duero, and the base of which lies against the Tagus.
Between the highest point of the province. the Peiialara (2429 m high) and the lowest (530 m high), there is a difference of almost 2000 m, which shows how varied and uneven is the terrain of Madrid.
These two natural boundaries, the Tagus- Duero watershed and the course of the River Tagus. in approximately northeasterly and southwesterly directions, determine that the geographical factors (geomorphological, cli- mate and vegetation) are classified by follow- ing strips which occur in the same directions. The main courses of the fluvial network are at
203
V HIGHEST AND LOWEST
ZOl-MOm 0
601-1000m Q
1 OOl- ZOOOmIIIIII]
ABOVE Pm,=
SIERRA 1 2oocl c A ROLLING HILLS
0
;METAMORPHIC AND / ARENACECUS ROCKS : LIIJESTONE AND GYPSUM / !PLUT~NIC ROCKS I
CROSS - SECTION
Fig. 1. Geographical location of Madrid
right angles to this, and some flow parallel. The population is also influenced by this disposi- tion, although there is a predomination of the influence of the capital city and the main arter- ies of communication.
Geographical and geological features; vegetation
Geomorphologically, there are two great tec- tonic units: the ancient shelf and the depres- sion of the Tagus. The Cordillera Central, in
303
which the shelf outcrops, consists largely of a granite mass set in a metamorphic system of gneisses, schists etc., and materials related to the Paleozoic (slates and quartzites). The morphology corresponds to a functioning of fractured blocks, the movement of which in a vertical direction gave rise to residual surfaces at various altitudes and internal trenches. The arboreal vegetation. which is more or less de- graded. is very abundant and consists of for- mations of pine forests (Pinks sylvestris), green oak ( Qwrms ih), oaks ( Qmw~~s pyrmaica )
and junipers (Jz~niperz~s o.qwdms), as one comes down from the highest points.
The Tagus Depression is a predominantly flat region, with altitudes varying between 600 m and 1 100 m. Its geological constitution is largely monotonous, and this is reflected in the morphological uniformity. The main units forming the depression are as follows.
(i ) Sands. conglomerates and clays arising from the process of erosion undergone by the Central System, which forms a surface which is more or less degraded. and which sometimes connects with the granitic or gneissic pediment although the transition from one surface to the other is normally achieved by a slope. In this area there is a predominance of dry-farming cereal crops and poor-quality pasture, occupy- ing the domains of the green oak (Qwrms i/c.\-)
and juniper (Junipcrm oqwdrus) forests which were once the characteristic vegetation of this unit.
( ii ) Approaching the centre of the Depres- sion there is a lateral. gradual change from the sandy surface to another in which predomi- nate gypsum, clays and chalks (the central fa- ties). on which are grown cereals, vines and olives, there being a preponderance also of thyme ( T~I~WIZLS sp. ) and esparto (Stipa sp. ).
( iii ) Another characteristic formation of this area consists of the p~iratnos. which are high plains formed by tabular lacustrine limestone of horizontal disposition (Tajuiia basin ). At the edges of the pdramos there is always a more
or less pronounced slope which descends to
lower surfaces in which the different strata can be observed. The limestone soils of the pdra- mm are used for dry-farming, sometimes in ro- tation with pasture, and olives. The natural vegetation of oak (Qwruu i/m) and gall oak (Qzlc~r~u.s,f~~inca) is found only in rather small woods.
(iv ) Within the Despression, the develop- ment acquired by the quaternary fluvial sedi- ments is very relevant. and forms a complex of terraces located at differing heights above river beds, and their accompanying alluvials. The soils are largely devoted to irrigation farming; the natural vegetation is relegated to narrow strips close to riverbeds: poplars (Popzd~s .sp. ).
willows (Salix sp. ). elms (Olrnrrs .‘;I,. ) etc.
Climate
The climate closely corresponds with the two principal geomorphological units described above. The coldest part is the Sierra de Gua- darrama. where the average temperature be- tween 193 1 and 1960 was 8°C. falling below 0°C in January and rising only to 18 ‘C in July. (These last two figures refer to the mean aver- ages for the months in question during the same period. )
Figures for the capital city are also repre- sentative of the climate of the Tagus Depres- sion. with an average annual temperature of 14” C. The average in the month of January is around 5 ‘C. and 24 “C in July. Hours of sun- shine vary between 2800 per year in the Depression, and 2200 in the Sierra.
Rainfall distribution also follows an analo- gous geographical pattern. Three strips of greater or lesser rainfall can be identified be- tween the watershed in the Sierra towards the south of the province. The mean annual rain- fall is more than 600 mm in the provincial area of the Central System, and does not reach 400 mm in the Vegas de Aranjuez. The highest fig-
- IIEFINITION OF STRATA
:
g
1
i
SAM
PLIN
G
1
2 1
1
:‘?
I Scales: 1:25.000 and 1:50.000
Relief
t
a
J
Description
and grouping
of drainage basins.
Select significant
morphometric
variables.
Comparison
of scales.
I
Analysis of the
degree of significance
of environmental
variables
* Chssification
of drainage
basins according
to
environmental
variables
Fig,
2. M
etho
dolo
gy.
ures are recorded in the Puerto de Navacer- rada, where a figure of 1100 mm per annum is reached. Furthermore. in the Sierra, a large part of the precipitation falls as snow, which fa- vours the natural regulation of the contribu- tions of the rivers of the Sierra.
The average rainfall over the whole province is 560 mm a year, which is lower than the lig- ure for the peninsula as a whole (around 670 mm). Nevertheless, it must be borne in mind that apart from the Vertiente Cantabrica and the Pyrenees (Wet Spain ). and if certain rela- tively damp areas such as Gredos or the Cor- dillera Penibetica are disregarded. the rainfall for the province falls neatly above that which corresponds to Dry Spain.
OBJECTIVES AND METHODOLOGY
The paper will concentrate fundamentally on the study of the morphometry of fluvial land- scapes. To do this, the first question to be tac- kled is that of determining which are the variables which define the landscape that pos- sess a greater discriminatory power in explain- ing the relationship between form, landscape and environment, thus avoiding redundant in- formation. This will reduce the time and costs in subsequent analyses.
Within this same level, which we may de- nominate as methodological, we shall attempt to study the influence of the work-scale on the behaviour of the morphometric variables and
Fig. 3. Location of sample basins.
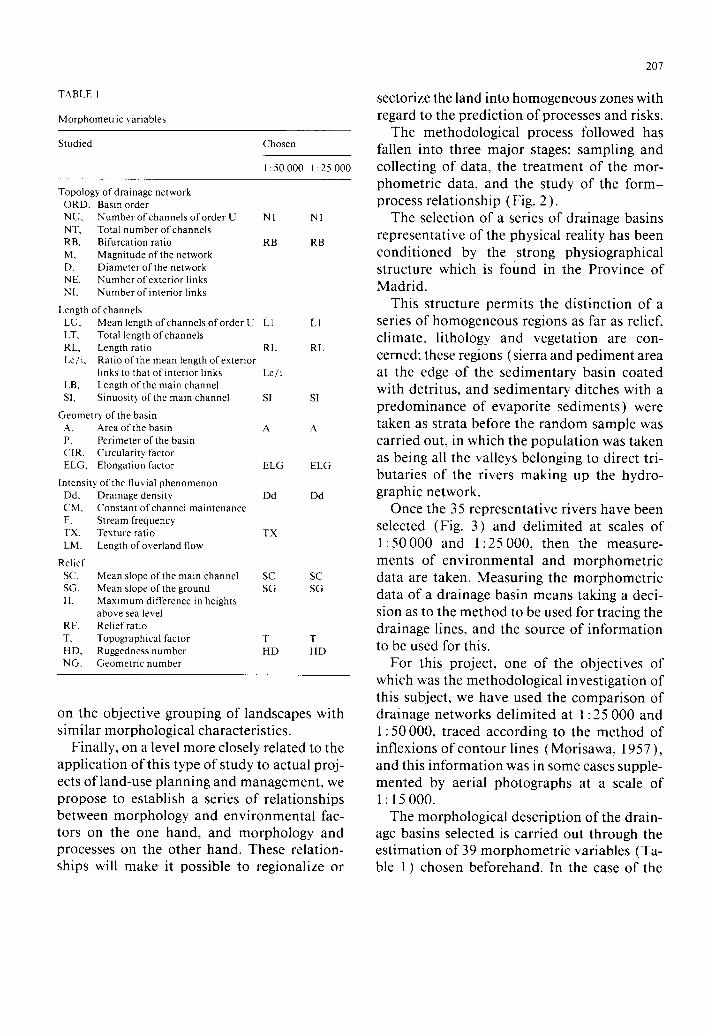
T.4BLE I
Morphometric variables
Studied Chosen
I:50000 1.25000
Topology of drainage network ORD. Basin order NU. Number of channels of order U N I NT, Total number of channels RB. Bifurcation ratio RB
M. Magnitude of the network
D. Diameter of the network
NE. Number of exterior links
NI. Number of interior lmks
Length of channels
LU. Mean length of channels of order U Ll
LT. Total length of channels
RL. Length ratio RL
Le/i. Ratio of the mean length of exterior links to that of interior links Le/i
LB. Length of the main channel
SI. Sinuosity of the main channel SI
Geometry of the basin 4. .4rea of the basin A
P. Perimeter of the basin CIR, Circularity factor ELG, Elongation factor ELG
Intensity of the fluvial phenomenon Dd. Drainage density Dd
CM. Constant of channel maintenance
F. Stream frequency
TX. Texture ratio TX
LM. Length of ov-erland flow
Relief
SC. SG. H.
RF, T.
HD. NG.
Mean slope of the main channel SC Mean slope of the ground SG Maximum difference in heights above sea level Relief ratio Topographical factor T Ruggedness number HD Geometric number
NI
RB
t1
RL
SI
A
ELG
Dd
SC SG
I- HD
on the objective grouping of landscapes with similar morphological characteristics.
Finally, on a level more closely related to the application of this type of study to actual proj- ects of land-use planning and management, we propose to establish a series of relationships between morphology and environmental fac- tors on the one hand, and morphology and processes on the other hand. These relation- ships will make it possible to regionalize or
207
sectorize the land into homogeneous zones with regard to the prediction of processes and risks.
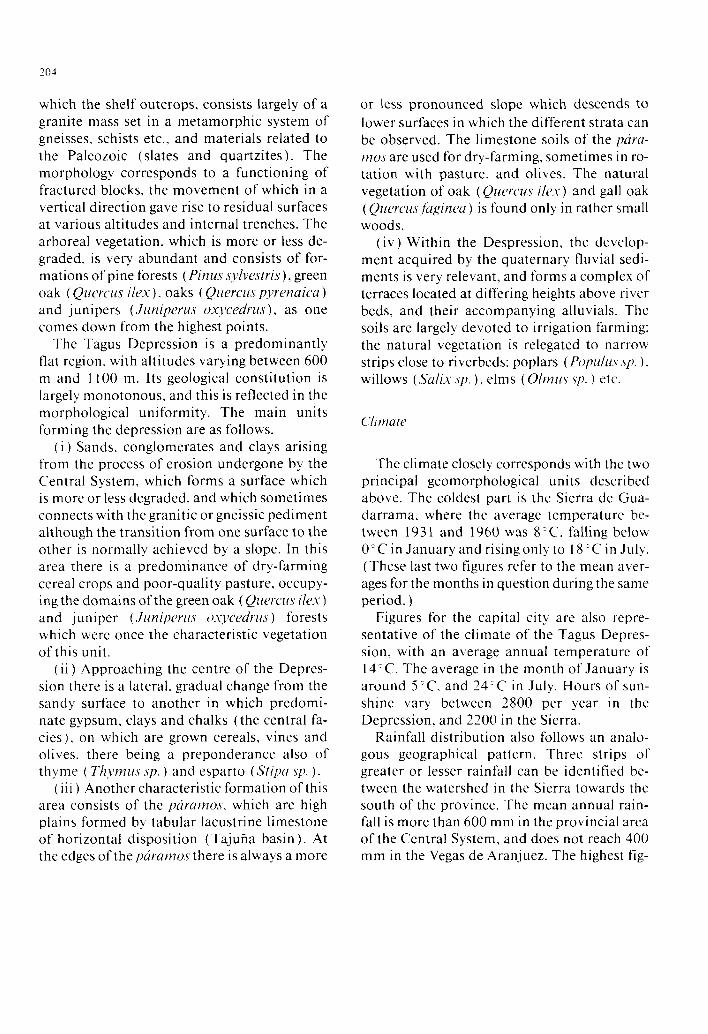
The methodological process followed has fallen into three major stages: sampling and collecting of data, the treatment of the mor- phometric data, and the study of the form- process relationship ( Fig. 2 ) .
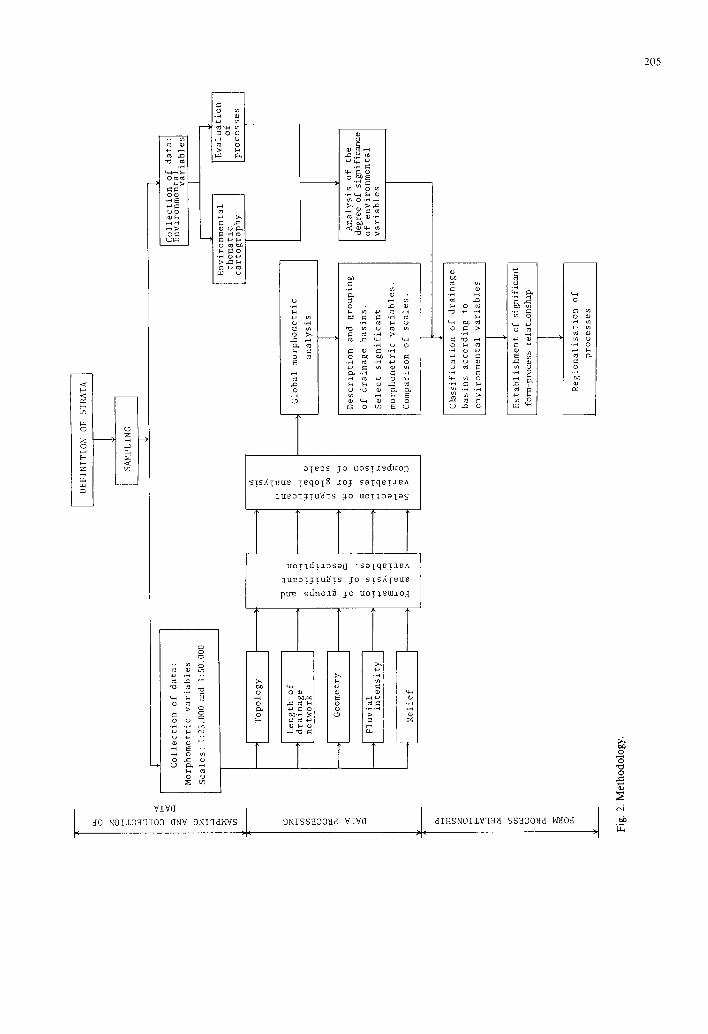
The selection of a series of drainage basins representative of the physical reality has been conditioned by the strong physiographical structure which is found in the Province of Madrid.
This structure permits the distinction of a series of homogeneous regions as far as relief, climate, lithology and vegetation are con- cerned; these regions (sierra and pediment area at the edge of the sedimentary basin coated with detritus, and sedimentary ditches with a predominance of evaporite sediments) were taken as strata before the random sample was carried out, in which the population was taken as being all the valleys belonging to direct tri- butaries of the rivers making up the hydro- graphic network.
Once the 35 representative rivers have been selected (Fig. 3) and delimited at scales of 1: 50 000 and 1:25 000, then the measure- ments of environmental and morphometric data are taken. Measuring the morphometric data of a drainage basin means taking a deci- sion as to the method to be used for tracing the drainage lines, and the source of information to be used for this.
For this project, one of the objectives of which was the methodological investigation of this subject, we have used the comparison of drainage networks delimited at 1: 25 000 and 1: 50 000, traced according to the method of inflexions of contour lines (Morisawa, 1957), and this information was in some cases supple- mented by aerial photographs at a scale of 1.15000.
The morphological description of the drain- age basins selected is carried out through the estimation of 39 morphometric variables (Ta- ble 1) chosen beforehand. In the case of the
108
is l.f--
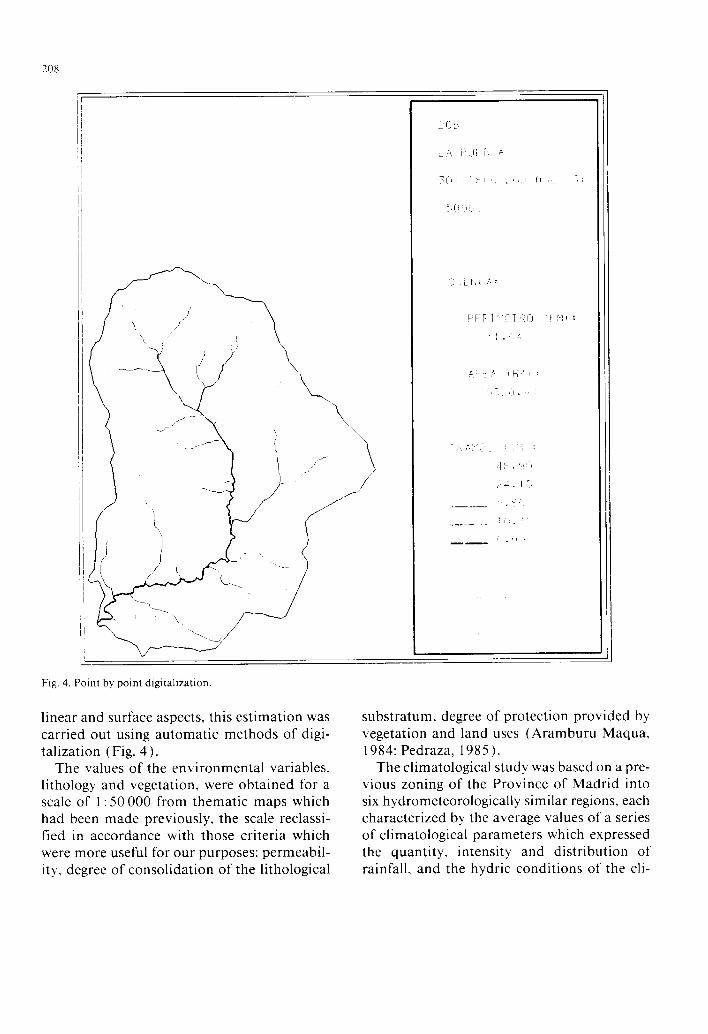
Fig. 4. Point by point digitalization.
linear and surface aspects, this estimation was carried out using automatic methods of digi- talization (Fig. 4).
The values of the environmental variables, lithology and vegetation, were obtained for a scale of 1: 50 000 from thematic maps which had been made previously, the scale reclassi- tied in accordance with those criteria which were more useful for our purposes: permeabil- ity, degree of consolidation of the lithological
substratum, degree of protection provided by vegetation and land uses (Aramburu Maqua, 1984: Pedraza, 1985 ).
The climatological study was based on a pre- vious zoning of the Province of Madrid into six hydrometeorologically similar regions, each characterized by the average values of a series of climatological parameters which expressed the quantity, intensity and distribution of rainfall, and the hydric conditions of the cli-

209
TABLE 2
Percentage of variance explained for by three principal components
Morphometric variables Scale
1:25000 1:50000
Topology of drainage network 95 95 Length of channels 74 64 Geometry of the basin 98 98 Intensity of the fluvial phenomenon 98 98 Relief 90 90
mate (Solana, 1985; Castillo, 1986). Using the thematic maps, the environmen-
tal description of the fluvial landscape was car- ried out, estimating the percentage of the area occupied by the respective types defined for the three environmental elements: lithology, veg- etation and climate.
This first stage of the project concluded with the evaluation of the acting processes. This evaluation was carried out using methods which did not require so many data to be col- lected, and the results were contrasted in stud- ies of territorial planning.
For the evaluation of soil losses due to hy- dric erosion, and the potential for erosion of the land, we used the universal equation for soil losses (Wischmeier and Smith, 1978 ), and es- timated the parameters in this equation of each of the 35 sample basins.
The hydrological characteristics of the land- scapes were studied according to a series of pa- rameters which define its hydrogramme. This hydrogramme was calculated using a hydro- logical model based on the theory of the uni- tary hydrogramme (Hymo, ARS, 1973) for two hypotheses: that of the impermeability of the basin and that of the pervious basin, reduc- ing the input of rainfall according to the US Soil Conservation Service (SCS ) method of the curve number ( McCuen, 1982 ).
ANALYSIS OF MORPHOMETRIC DATA
The morphological data, classified into five groups (Table 1) (topology of the drainage
network, length of channels, geometry of the basin, intensity of the fluvial phenomenon and relief), were processed using a multivariable statistical analysis.
By this technique, starting from an analysis of the factorial type - principal components - we identified those variables which provide the greatest amount of information for a mor- phological description of landscapes. The sub- sequent use of a technique of objective grouping (“clustering”) made it possible to define homogeneous groups of basins in ac- cordance with the variables analysed (topol- ogy, linear aspects of the network, relief, etc. ).
The application of this process to each of the five partial-variable groups reveals a high de- gree of interrelation between the morphome- tric variables within each group, made apparent by the high percentage of initial var- iability absorbed by a low number of principal axes (Table 2 ).
One conclusion that can be drawn from these partial results is that, for a global study of the geometry of fluvial landscapes, a large number of the morphological variables and indices measured here can be disregarded, since, be- cause of their high correlation with other vari- ables previously chosen, they introduce a certain redundancy into the information col- lected. This high correlation, however, makes it possible drastically to reduce the morphom- etry of the basins, from 39 to 14 in the case of the 1: 50 000 scale and to 12 in the case of the 1:25000scale (Table 1).
At a later stage, and with these variables se- lected as being significant, the morphology of the landscapes was studied to find out which variables differentiated them and how these landscapes were grouped together according to their morphology.
The interpretation of the three principal components of this analysis, the percentage of variability absorption figures for which are 65% and 69% for the 1: 50 000 and 1: 25 000 scales, respectively, make it possible to con- clude that the principal variations in the mor-

710
c E
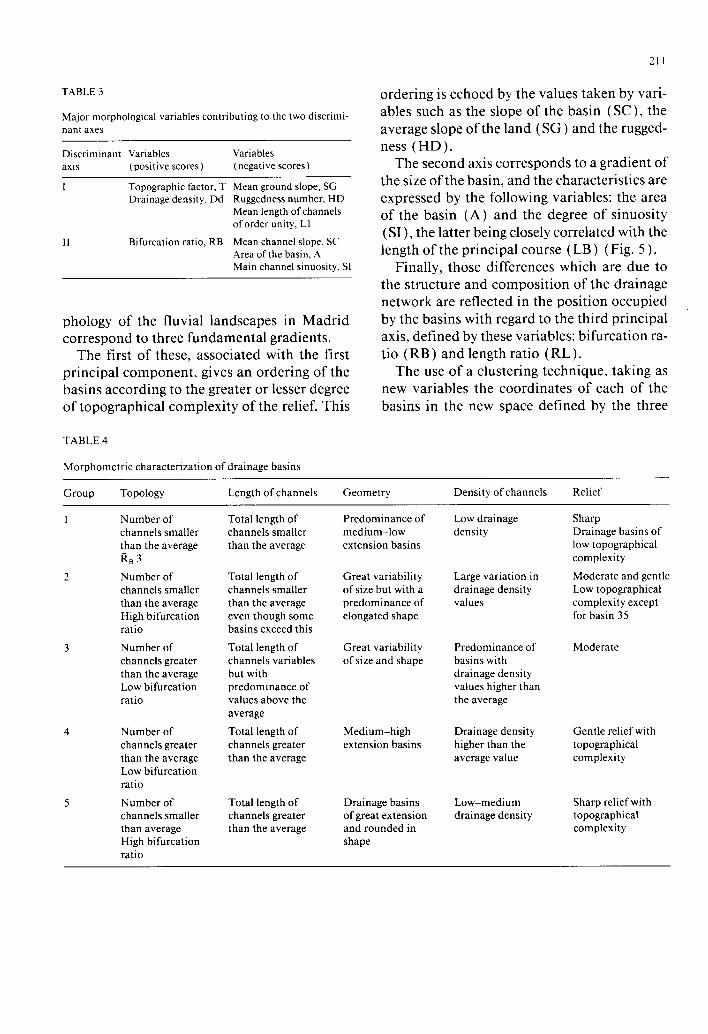
TABLE 3
Major morphological variables contributing to the two discrimi-
nant axes
Discriminant Variables Variables
axis (positive scores) (negative scores)
I Topographic factor, T Mean ground slope, SC Drainage density, Dd Ruggedness number, HD
Mean length of channels of order unity, Ll
II Bifurcation ratio, RB Mean channel slope, SC Area of the basin, A Main channel sinuosity, Sl
phology of the fluvial landscapes in Madrid correspond to three fundamental gradients.
The first of these, associated with the first principal component, gives an ordering of the basins according to the greater or lesser degree of topographical complexity of the relief. This
TABLE 4
Morphometric characterization of drainage basins
211
ordering is echoed by the values taken by vari- ables such as the slope of the basin (SC), the average slope of the land (SG) and the rugged- ness (HD).
The second axis corresponds to a gradient of the size of the basin, and the characteristics are expressed by the following variables: the area of the basin (A) and the degree of sinuosity (SI ), the latter being closely correlated with the length of the principal course ( LB ) ( Fig. 5 ) .
Finally, those differences which are due to the structure and composition of the drainage network are reflected in the position occupied by the basins with regard to the third principal axis, delined by these variables: bifurcation ra- tio (RB) and length ratio (RL).
The use of a clustering technique, taking as new variables the coordinates of each of the basins in the new space defined by the three
Group Topology Length of channels Geometry Density of channels
I Number of channels smaller than the average R, 3
2 Number of channels smaller than the average High bifurcation ratio
Number of channels greater than the average Low bifurcation ratio
Number of channels greater than the average Low bifurcation ratio
Number of channels smaller than average High bifurcation ratio
Total length of channels smaller than the average
Total length of channels smaller than the average even though some basins exceed this
Total length of channels variables but with predominance of values above the average
Total length of channels greater than the average
Total length of channels greater than the average
Predominance of medium-low extension basins
Great variability of size but with a predominance of elongated shape
Great variability of size and shape
Low drainage density
Large variation in drainage density values
Predominance of basins with drainage density values higher than the average
Medium-high extension basins
Drainage basins of great extension and rounded in shape
Drainage density higher than the average value
Low-medium drainage density
Relief
Sharp Drainage basins of low topographical complexity
Moderate and gentle Low topographical complexity except for basin 35
Moderate
Gentle relief with topographical complexity
Sharp relief with topographical complexity

Length of channels
Complexity
EXtWlSlOn
2 3 ’
,-
! Round shape 1.1 1
Elongated shape
!;I Sharp relief
Moderate gentle relief
n Number of channels - / Drmage density _+
Blfurcotlon rat10
Fig. 6. Location of the morphological groups of watersheds
on the morphometric map.
axes of variation, allows us to identify five sets of fluvial landscapes with a morphological similarity.
Lastly, and once the grouping of the drain- age basins has been defined according to their morphological characteristics, we have to check whether the morphological differences de- tected in the groups are statistically significant.
The method selected to resolve this question was the discriminant canonical analysis ( Mather, 1976: Doornkamp and King, 197 1 ). By using this method, apart from verifying the statistical validity of the previously estab- lished groups, those discriminant functions which explain the greatest variability are de- fined, as well as the contribution of the differ- ent variables to these functions as an indicator of their discriminatory power.
MORPHOLOGICAL DESCRIPTION OF THE FLUVIAL LANDSCAPES
To describe the landscape in terms of the ge- ometry of its fluvial forms - drainage basins and drainage network - it is possible to have recourse either to the quantifying of those morphometric variables which have proved to be the most discriminatory in the canonical analysis, or to a study of the characteristics of each of the groups in the partial analysis car-
ried out.
In this project both methods were used, with the aim of the second one complementing the information gleaned by the discriminant ca- nonical analysis-an analysis whose interpre- tation gives conclusions similar to those obtained in the analysis of principal compo- nents (Table 3 ).
To complete this physiographical descrip- tion of the groups of basins. we considered which of the groupings defined in the live par- tial analyses typified global groups. The results of this analysis and the morphometrical char- acterization appear in Table 4.
The morphometrical description of homo- geneous groups of fluvial landscapes makes it possible to situate them on a “morphometric map” defined by a positive gradient of the number of courses and the drainage density, corresponding inversely to a variation in the bifurcation ratio (x axis) and a gradient for the size and topographical complexity of the basin (y axis). In Fig. 6 the locations of the live groups so defined can be seen.
ENVIRONMENTAL DESCRIPTION OF THE FLUVIAL LANDSCAPES AND A STUDY OF THE ASSOCIATED PROCESSES
An environmental description of fluvial landscapes requires prior verification that the morphological differences pointed out in pre- vious analysis correspond to statistically sig- nificant environmental differences.
To this end we carried out Snedecor F test for each of the variable types which define the environmental complex of the hydrographic basin. This same procedure was used to ana- lyse whether there were any differences in the intensity and nature of the erosive and hydro- logical processes associated with each of the morphological goups of fluvial landscapes.
From the initial results of this analysis, it follows that those climatic zones having signif- icant differences in the morphometry of their fluvial landscapes are as follows.
(A. 1 ) Zones with a mean annual rainfall of
213
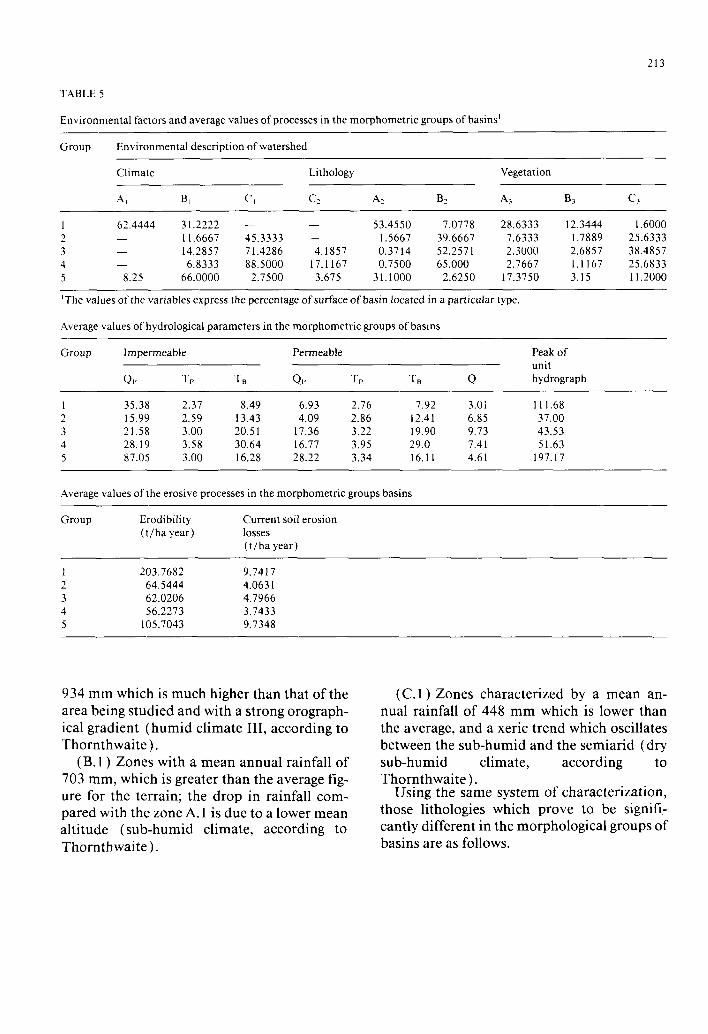
TABLE 5
Environmental factors and average values of processes in the morphometric groups of basins’
Group Environmental description of watershed
Climate Lithology Vegetation
A, B, C, CZ A1 Bz A, B3 C,
I 62.4444 31.2222 - - 53.4550 7.0778 28.6333 2 - I I .6667 45.3333 - 1.5667 39.6667 7.6333 3 - 14.2857 71.4286 4.1857 0.3714 52.2571 2.3000 4 - 6.8333 88.5000 17.1167 0.7500 65.000 2.7667 5 8.25 66.0000 2.7500 3.675 31.1000 2.6250 17.3750
‘The values of the variables express the percentage of surface of basin located in a particular type.
12.3444 I .6000 1.7889 25.6333 2.6857 38.4857 1.1167 25.6833 3.15 1 I .2000
Average values of hydrological parameters in the morphometric groups of basins
Group Impermeable Permeable Peak of unit
QP TP TB QP TP TEI Q hydrograph
1 35.38 2.37 8.49 6.93 2.76 7.92 3.Oi 1 Il.68 2 15.99 2.59 13.43 4.09 2.86 12.41 6.85 37.00 3 21.58 3.00 20.51 17.36 3.22 19.90 9.73 43.53 4 28.19 3.58 30.64 16.77 3.95 29.0 7.41 51.63 5 87.05 3.00 16.28 28.22 3.34 16.11 4.61 197.17
Average values of the erosive processes in the morphometric groups basins
Group Erodibility (t/ha year)
Current soil erosion losses (t/ha year)
1 203.7682 9.7417 2 64.5444 4.063 I 3 62.0206 4.7966 4 56.2273 3.7433 5 105.7043 9.7348
934 mm which is much higher than that of the area being studied and with a strong orograph- ical gradient (humid climate III, according to Thornthwaite).
(B. 1) Zones with a mean annual rainfall of 703 mm, which is greater than the average fig- ure for the terrain; the drop in rainfall com- pared with the zone A. 1 is due to a lower mean altitude (sub-humid climate, according to
Thornthwaite).
(C. 1) Zones characterized by a mean an- nual rainfall of 448 mm which is lower than the average, and a xeric trend which oscillates between the sub-humid and the semiarid (dry sub-humid climate, according to Thornthwaite).
Using the same system of characterization, those lithologies which prove to be sign5 cantly different in the morphological groups of basins are as follows.
214
1 VEGETATION
Degree of protection
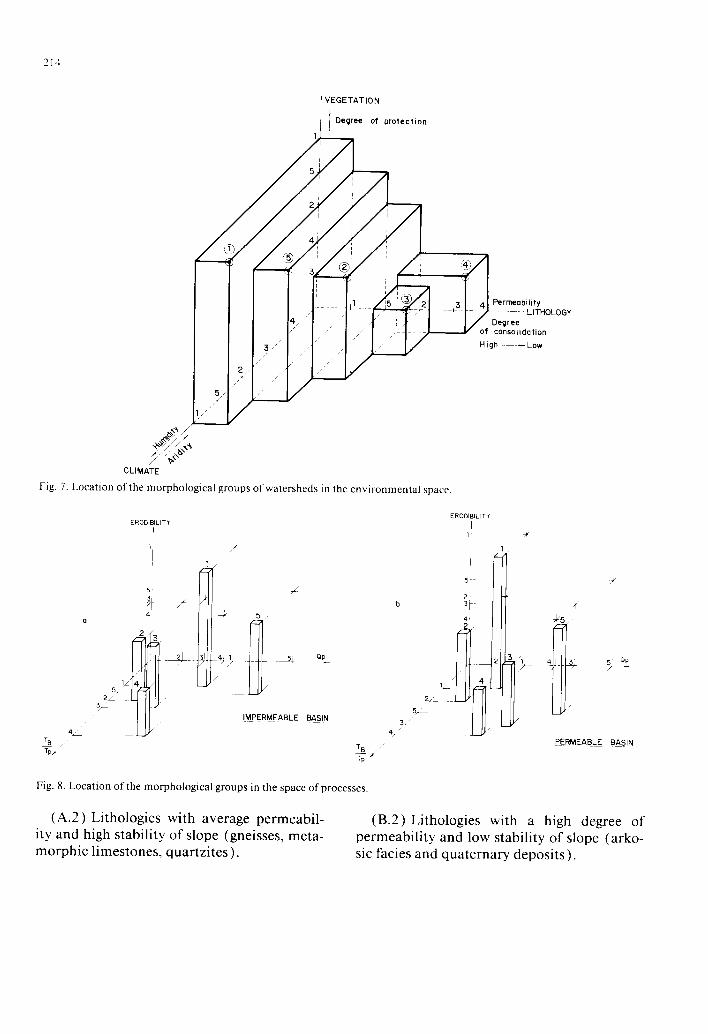
Fig. 7. Location of the morphological groups of watersheds in the environmental space
b
Fig. 8. Location of the morphological groups in the space of processes.
(A.2) Lithologies with average permeabil- (B.2) Lithologies with a high degree of ity and high stability of slope (gneisses, meta- morphic limestones, quartzites).
permeability and low stability of slope (arko- sic facies and quaternary deposits ).
(C.2) To a lesser extent too, p&amo lime- stones or cretaceous sediments, with high permeability and high stability of slope, show morphometric differences in fluvial
landscapes. Vegetation is the environmental factor which
least discriminates between morphological groups of basins; those types which have more than a 90% reliability of discrimination are as follows.
(A.3 ) densely wooded; (B. 3 ) dense scrub; (C.3 ) crops and oligotrophic pastureland. As for the erosive and hydrographic pro-
cesses, the application of the same test to ana- lyse the relationship between the groups of basins defined in accordance with their mor- phological variables, and the intensities of these processes, revealed significant differences in these intensities in such groups, differences which were attenuated only in the case of cur- rent erosion by the presence of a good covering of vegetation in those basins subject to a high degree of erosion.
The environmental description of the mor- phometrical groups of basins, as well as the evaluation of the hydrological and erosive pro- cesses associated with each of these groups, was carried out by obtaining average values of those variables which proved to have significant dif- ferences. The results are shown in Table 5.
THE FORM-PROCESS-ENVIRONMENT RELATIONSHIP
The study of the environmental variables for each of the morphological types of fluvial landscapes makes it possible for them to be lo- cated in an environmental space defined by three axes (Fig. 7): aridity/humidity of cli- mate, degree of consolidation of the lithologi- cal substratum, and degree of protection provided by vegetation.
Analogously, it is also possible to locate the five morphometric types of basin in a space of processes, in which the axes would be (Fig. 8 ) :
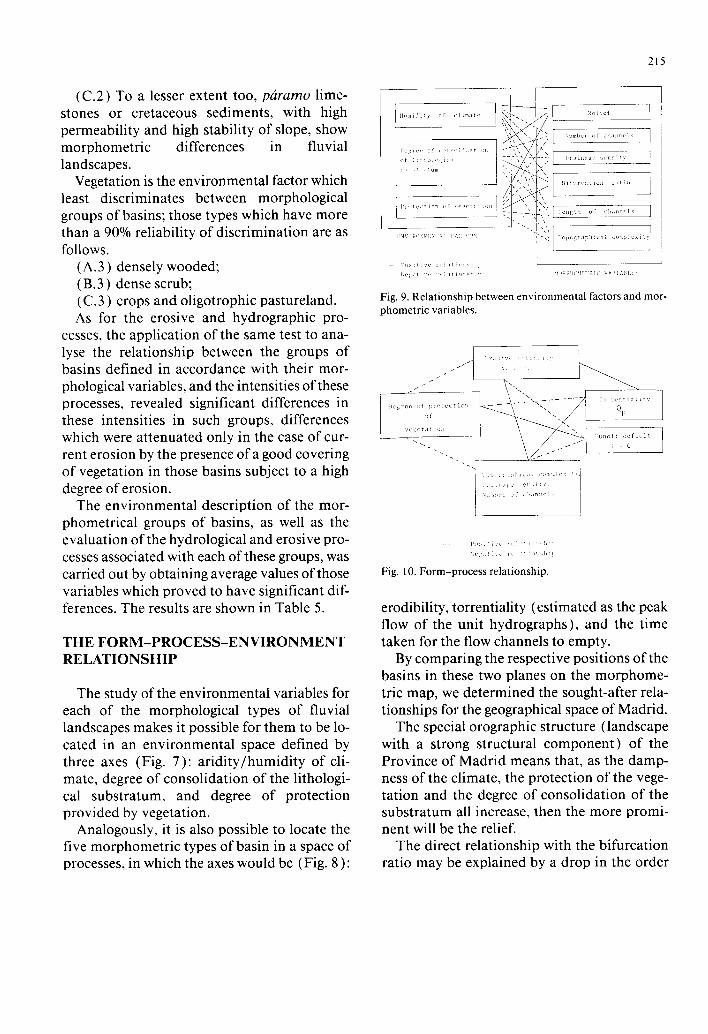
Fig. 9. Relationship between environmental factors and mor- phometric variables.
Fig. 10. Form-process relationship.
erodibility, torrentiality (estimated as the peak flow of the unit hydrographs), and the time taken for the flow channels to empty.
By comparing the respective positions of the basins in these two planes on the morphome- tric map, we determined the sought-after rela- tionships for the geographical space of Madrid.
The special orographic structure (landscape with a strong structural component) of the Province of Madrid means that, as the damp- ness of the climate, the protection of the vege- tation and the degree of consolidation of the substratum all increase, then the more promi- nent will be the relief.
The direct relationship with the bifurcation ratio may be explained by a drop in the order

216
of the basins developed in these environments, a drop which, as is studied in the analysis re- ferring to the topology of the network, is trans- lated into greater values of the bifurcation ratio.
Rather clearer, and in agreement with the re- sults set out in the references, is the negative or inverse relationship between these environ- mental characteristics and variables such as the number of channels, their total length, or the drainage density ( Fig. 9 ) .
In the same way, a direct relationship may be adduced between the torrentiality of the hy- drological phenomenon, and the topographi- cal complexity, number of channels and drainage density of the basin, a relationship which becomes negative if the hydrological pa- rameter analysed is the run-off density ( P-d ) .
For the study of the morphometry-erosion relationship, we have dispensed with the flu- vial erosion index, as its inclusion would have caused a distortion in the evaluation of soil losses. If we look at the intensity of erosion for a constant climate, the relationship to the mor- phometry of the landscape will be identical to that deduced for the peak flow (Fig. 10).
THE APPLICATION OF QUANTITATIVE ANALYSIS OF FLUVIAL LANDSCAPES TO PHYSICAL PLANNING: a few considerations
The use of geomorphology, and especially hydrogeomorphological methods, as a useful tool in evaluating risks of flooding and erosion has been propounded by a number of authors (Williams and Morgan, 1976; Dunne and Leo- pold, 1978).
Nevertheless, the lack of a general method- ology has made it difficult to use quantitative geomorphology for detecting zones which are susceptible to greater risks of geological pro- cesses in the first stage of land survey.
In accordance with the conclusions reached throughout this project, this possible zoning for the Province of Madrid would be concluded in
accordance with the following methodological criteria.
(i ) The use of the basin as a unit of study. (ii ) The measurement from cartographic
information, preferably at the scale of 1 : 25 000, of those morphometric variables of greater discriminating power (slope of the channel, the bifurcation ratio, the density of drainage, the area of the basin, etc. ).
(iii) The use of a smaller working scale ( 1 : 50 000) would mean certain discrepancies in terms of assigning some of the basins to the morphometric groups which have been de- fined, even though the behaviour of the vari- ables in both scales might be similar.
(iv) The time, and therefore the money, which would be saved by using the scale of 1 : 50 000, which for this project is estimated at one-sixth of the time necessary if we worked at a scale of 1 :25 000. and the similarity of the results obtained, mean that selecting one scale or the other will depend both on the objectives of the work, to a greater or lesser degree of pre- cision. and on the availability of resources.
(v) The assigning of each of the considered basins to one of the five morphometric groups which we have defined would be done for each scale according to the discriminant functions.
(vi) The evaluation of the environmental characteristics and of processes starting from the relationships established between mor- phology, environmental factors and processes.
REFERENCES
Aramburu Maqua, M.P. (Editor), 1984. Mapa de forma-
cioncs vegetales y uses actuales del suelo de Madrid. Es-
cala I : 50 000. Memoria y Plano. Comunidad de Madrid. Consejeria de Agricultura y Ganaderia. Madrid (No
publicado). 4gricultural Research Service, US Department of Agricul-
ture, 1973. Hymo: problem-oriented computer language
for hydrologic modelling. Texas University, TX.
Castillo. V., 1986. Estudio Cuantitativo de Paisajes Fluvi-
ales. Doctoral thesis. Universidad Politecnica de Madrid, ETS de Ingenieros de Montes. Madrid (unpublished )
Chorley. R.J.. 1962. Geomorphology and General Systems

211
Theory. US Geological Survey, Professional Paper 500-B. Washington.
Doornkamp, J.C. and King C.A.M., 197 1. Numerical Analy- sis in Geomorphology. Arnold, London.
Dunne, T. and Leopold, L.B., 1978. Water in Environmental Planning. Freeman, San Francisco, CA.
Gonzalez Bernaldez, F., 198 1. In: Blume (Editor), Ecologia y Paisaje. Madrid.
Gudilin, I.S., 1973. Interpretation of landscape as an indica- tor of geologic structure. In: A.G. Chikishev (Editor), Landscape Indicators, Consultans Bureau, New York, pp. 92-106.
Horton, R.E., 1945. Erosional development of streams and their drainage basins; hydrophysical approach to quanti- tative morphology. Bull. Geol. Sot. Am., 56: 275-370.
Lopez Vergara. M.L.. 1978. Manual de Fotogeologia. Publi- caciones cientificas de la Junta de Energia Nuclear, Madrid.
Mather, P.M.. 1976. Computational Methods of Multivar- iate Analysis in Physical Geography. Wiley, New York.
McCuen, R.M., 1982. A Guide to Hydrologic Analysis using SCS Methods. Prentice-Hall, New Jersey.
Morisawa, M.E., 1957. Accuracy of determination of stream lengths from topographic maps. Trans. Am. Geophys. Union, 38: 86-88.
Pedraza, J. (Editor), 1985. Mapa fisiografico de Madrid. Memoria y plano. Comunidad de Madrid. Consejeria de Agricultura y Ganaderia, Madrid.
Schumm, S.A., 1977. The Fluvial System. Wiley-Intersci- ence, New York.
Small, R.J., 1970. The Study of Landforms. Cambridge Uni- versity Press, Cambridge.
Solana, J. (Editor), 1985. Recopilacion y elaboration de da- tos fisicos y geomorfologicos previos al modelo de resti- tucion de aportaciones naturales de Madrid. Comunidad de Madrid. Consejeria de Obras Publicas y Transportes, Madrid (unpublished).
Spiridinov, I.S., 1973. Physiognomic landscape features as indicators of origin and development of the landscape. In: .4.G. Chikishev (Editor), Landscape Indicators. Consul- tans Bureau. New York. pp. 79-92.
Strahler, A.N., 1964. Quantitative geomorphology of drain- age basins and channel networks. In: V.T. Chow (Editor), Handbook of Applied Hydrology. McGraw Hill. New York, pp. 4.39-4.76.
Strahler, A.N., 1974. Geografia Fisica. Omega, Barcelona. Way, D.S., 1973. Terrain Analysis, Dowden. Hutchinson and
Ross, Stroudsburg, PA. Williams, A.R. and Morgan, R.P.C., 1976. Geomorphologi-
cal mapping applied to soil erosion evaluation. J. Soil Water Conserv. July-August: 164- 168.
Wischmeier, W.H. and Smith, D.D., 1978. Predicting rainfall erosion losses. A guide to conservation planning. Agricul- ture Handbook 537, US Department of Agriculture, Washington, DC.