Quantitative structure-retention relationships in affinity high-performance liquid chromatography
12
J. Serb. Chem. Soc. 76 (6) 891–902 (2011) UDC 665.52/.54:544.022:544.723.232 JSCS–4169 Original scientific paper 891 A quantitative structure–retention relationship for the prediction of retention indices of the essential oils of Ammoides atlantica PARVIZ ABEROMAND AZAR 1 , MEHDI NEKOEI 1 , SIAVASH RIAHI 2,3 * , MOHAMMAD R. GANJALI 3 and KARIM ZARE 1 1 Department of Chemistry, Faculty of Basic Sciences, Science and Research Branch, Islamic Azad University, Tehran, 2 Institute of Petroleum Engineering, College of Engineering, University of Tehran, P. O. Box 11365–4563, Tehran and 3 Center of Excellence in Electrochemistry, Faculty of Chemistry, University of Tehran, P. O. Box 14155–6455, Tehran, Iran (Received 19 October, revised 23 December 2010) Abstract: A simple, descriptive and interpretable model, based on a quantitative structure–retention relationship (QSRR), was developed using the genetic algo- rithm-multiple linear regression (GA-MLR) approach for the prediction of the retention indices (RI) of essential oil components. By molecular modeling, three significant descriptors related to the RI values of the essential oils were identified. A data set was selected consisting of the retention indices for 32 essential oil molecules with a range of more than 931 compounds. Then, a suit- able set of the molecular descriptors was calculated and the important descrip- tors were selected with the aid of the genetic algorithm and multiple regression method. A model with a low prediction error and a good correlation coefficient was obtained. This model was used for the prediction of the RI values of some essential oil components which were not used in the modeling procedure. Keywords: chemometrics; QSRR; genetic algorithms; multiple linear regres- sion; retention indices; essential oils. INTRODUCTION Essential oils are valuable natural products used as raw materials in many fields, including folk medicine, perfumes, cosmetics, aromatherapy, phytothe- rapy, spices and nutrition. They are mixtures of more than 200 compounds that can be grouped basically into two fractions, a volatile fraction, which constitutes 90–95 % of the whole oil and contains monoterpenes and sesquiterpene hydro- carbons and their oxygenated derivatives, together with aliphatic aldehydes, al- * Corresponding author. E-mail: [email protected] doi: 10.2298/JSC100219076A _________________________________________________________________________________________________________________________________________ 2011 Copyright (CC) SCS Available online at www.shd.org.rs/JSCS/
Transcript of Quantitative structure-retention relationships in affinity high-performance liquid chromatography

J. Serb. Chem. Soc. 76 (6) 891–902 (2011) UDC 665.52/.54:544.022:544.723.232 JSCS–4169 Original scientific paper
891
A quantitative structure–retention relationship for the prediction of retention indices of the essential oils
of Ammoides atlantica PARVIZ ABEROMAND AZAR1, MEHDI NEKOEI1, SIAVASH RIAHI2,3*,
MOHAMMAD R. GANJALI3 and KARIM ZARE1
1Department of Chemistry, Faculty of Basic Sciences, Science and Research Branch, Islamic Azad University, Tehran, 2Institute of Petroleum Engineering, College of Engineering,
University of Tehran, P. O. Box 11365–4563, Tehran and 3Center of Excellence in Electrochemistry, Faculty of Chemistry, University of Tehran,
P. O. Box 14155–6455, Tehran, Iran
(Received 19 October, revised 23 December 2010)
Abstract: A simple, descriptive and interpretable model, based on a quantitative structure–retention relationship (QSRR), was developed using the genetic algo-rithm-multiple linear regression (GA-MLR) approach for the prediction of the retention indices (RI) of essential oil components. By molecular modeling, three significant descriptors related to the RI values of the essential oils were identified. A data set was selected consisting of the retention indices for 32 essential oil molecules with a range of more than 931 compounds. Then, a suit-able set of the molecular descriptors was calculated and the important descrip-tors were selected with the aid of the genetic algorithm and multiple regression method. A model with a low prediction error and a good correlation coefficient was obtained. This model was used for the prediction of the RI values of some essential oil components which were not used in the modeling procedure.
Keywords: chemometrics; QSRR; genetic algorithms; multiple linear regres-sion; retention indices; essential oils.
INTRODUCTION
Essential oils are valuable natural products used as raw materials in many fields, including folk medicine, perfumes, cosmetics, aromatherapy, phytothe-rapy, spices and nutrition. They are mixtures of more than 200 compounds that can be grouped basically into two fractions, a volatile fraction, which constitutes 90–95 % of the whole oil and contains monoterpenes and sesquiterpene hydro-carbons and their oxygenated derivatives, together with aliphatic aldehydes, al-
* Corresponding author. E-mail: [email protected] doi: 10.2298/JSC100219076A
_________________________________________________________________________________________________________________________________________
2011 Copyright (CC) SCS
Available online at www.shd.org.rs/JSCS/

892 AZAR et al.
cohols and esters, and a nonvolatile residue, that constitutes 5–10% of the whole oil and contains hydrocarbons, fatty acids, sterols, carotenoids, waxes, couma-rins, psoralens and flavonoids.1
Ammoides atlantica is of the Apiaceae family. The plant is used in infusions for the treatment of headache, fever and diarrhea. It is also used in compresses, alone or soaked in alcohol or vinegarand mixed with henna, to treat children af-fected by mental debility as reported by Laouer et al.2
GC and GC–MS are the main methods for the identification of these plant oils. Seeking a quantitative relationship between the molecular structure and the gas chromatographic retention indices has been a basic task in chemistry. Corre-lations between the GC retention indices and the molecular structures can pro-vide more profound insights into the interactions between the eluents and the stationary phases from a theoretical viewpoint. In addition, they can provide very important information about the effect of the chemical structures on the retention behavior and the possible mechanism of absorption and elution.
Prediction of physico–chemical properties of materials based on their mole-cular structure has been one of the wishes of scientists and engineers for a long time. One of the best methods which has been applied for this purpose is quan-titative structure–property relationships (QSPR). QSPR analysis is now a well-established and highly respected technique to correlate diverse simple and com-plex physico–chemical properties of a compound with its molecular structure, through a variety of descriptors. The basic strategy of QSPR analysis is to find optimum quantitative relationships, which can then be used for the prediction of the properties from molecular structures. Once a reliable relation has been ob-tained, it is possible to use it to predict that same property for other structures not yet measured or even not yet prepared.3
Quantitative structure–retention relationships represent statistical models that quantify the relation between the structure of molecules and their chromate-graphic retention indices, allowing the prediction of the retention indices of novel compounds. QSRR on the retention indices have been reported for different types of organic compounds.4–8
The application of these techniques usually requires variable selection for building well-fitted models. In this work, the genetic algorithm selection method was employed for the variable selection in the MLR method. Nowadays, GA is well-known as an interesting and widely used variable selection method.9–11
The aim of this work was to search for an efficient method to build an ac-curate quantitative relationship between the molecular structure and the retention indices of A. atlantica essential oils by GA–MLR.
_________________________________________________________________________________________________________________________________________
2011 Copyright (CC) SCS
Available online at www.shd.org.rs/JSCS/

RETENTION INDICES OF ESSENTIAL OILS 893
EXPERIMENTAL
Computer hardware and software
A Pentium IV personal computer (CPU at 3.06 GHz) with the Windows XP operating system was used. The geometry optimization was performed with HyperChem (Version 7.0 Hypercube, Inc). For the calculation of the molecular descriptors, Dragon 2.1 software was used.12 SPSS software (version 11.50, SPSS, Inc.) was employed for the simple MLR ana-lysis. The GA–MLR regression and the other calculations were performed in Matlab (Version 7.0, Math works, Inc).
Data set
The data set of the GC retention indices was taken from the values reported by Laouer et al.13 The Kovats retention indices were obtained according to the following equation:
( +1)
log log 100 100
log log i z
z z
x xI N
x x
−= + −
(1)
where x refers to the adjusted retention volume or time, z is the number of carbon atoms of the n-alkane eluting before and z+1 is the number of carbon atoms of the n-alkane eluting after the peak of interest. These values were obtained after subtracting the number of the carbons in the main chain ties 100 from Kovats indices (KI).
The molecules in the data set, including the essential oils from Ammoides atlantica, are shown in Table I. The retention indices of all compounds were determined by GC and GC–MS under a single set of conditions. An apolar fused silica capillary column Perkin Elmer Elite-5 MS (5 % phenylmethylsiloxane, 30 m×0.25 mm, 0.25 µm film thickness) was used. The co-lumn oven temperature was programmed from 60–185 °C at 1.5 °C min-1, held isothermal at 185 °C for 1 min and then raised to 275 °C at 9 °C min-1.
The data set was split into a training set and a prediction set. The prediction set of 6 com-pounds was selected randomly from the original 32 of essential oil components, with the re-maining compounds constituting the training set. The training set of 26 compounds, with RI values in the range 931–1582, was used to adjust the parameters of the model, and the test set of 6 compounds, with RI in the range 954–1545, was used to evaluate its predictive ability.
Determination of molecular descriptors
Molecular descriptors are defined as numerical characteristics associated with chemical structures. The molecular descriptor is the final result of a logic and mathematical procedure which transforms chemical information encoded within a symbolic representation of a mole-cule into a useful number applied to correlate physical properties.
The Dragon software was used to calculate the descriptors in this research and a total of 1481 molecular descriptors, from 18 different types of theoretical descriptors, were calculated for each molecule. Since the values of many descriptors are related to the bonds length and bonds angles etc., the chemical structure of every molecule must be optimized before calcu-lating its molecular descriptors. For this reason, the chemical structure of the 32 studied mole-cules were drawn with Hyperchem software and saved with the HIN extension. To optimize the geometry of these molecules, the AM1 geometrical optimization was applied. After opti-mizing the chemical structures of all compounds, the molecular descriptors were calculated using Dragon. A wide variety of descriptors have been reported in the literature, having been used in QSAR analysis.14–19
_________________________________________________________________________________________________________________________________________
2011 Copyright (CC) SCS
Available online at www.shd.org.rs/JSCS/
894 AZAR et al.
Genetic algorithm for descriptor selection
In QSPR studies, after calculating the molecular descriptors from optimized chemical structures of all the components available in the data set, the problem is to find a linear equa-tion that can predict the desired property with the least number of variables as well as highest accuracy.
In other words, the problem is to find a subset of variables (most statistically effective molecular descriptors for the RI) from all the available variables (all molecular descriptors) that can predict RI with the minimum error in comparison to the experimental data.
A generally accepted method for this problem is the genetic algorithm based multivariate linear regression (GA-MLR). In this method, the genetic algorithm is applied for the selection of the best subset of variables with respect to an objective function. This algorithm was pre-sented by Leardi et al. for the first time.20
The GA is a stochastic method to solve the optimization problems defined by fitness cri-teria, applying the evolution hypothesis of Darwin and different genetic functions, i.e., cross-over and mutation.
To select the most relevant descriptors, the evolution of the population was simulated.21–23 The population of the first generation was selected randomly. Each individual member in the population, defined by a chromosome of binary values, represented a subset of descriptors. The number of the genes at each chromosome was equal to the number of the descriptors. A gene was given the value of 1, if its corresponding descriptor was included in the subset; otherwise, it was given the value of zero. The number of the genes with the value of 1 was kept relatively low to have a small subset of descriptors.24 As a result, the probability of generating 0 for a gene was set greater (at least 60 %) than the value of 1. The operators used here were crossover and mutation. The application probability of these operators was varied linearly with a generation renewal (0.0–0.1 % for mutation and 60–90 % for crossover). The population size was varied between 50 and 250 for different GA runs. For a typical run, the evolution of the generation was stopped when 90 % of the generations took the same fitness.
MLR Modeling
The general purpose of multiple regressions is to quantify the relationship between se-veral independent or predictor variables and a dependent variable. A set of coefficients defines the single linear combination of independent variables (molecular descriptors) that best des-cribes retention indices. The retention indices value for each essential oil component would then be calculated as a composite of each molecular descriptor weighted by the respective coefficients. A multi-linear model can be represented as:
0 1 2 31 2 3 ky kβ β χ β χ β χ β χ ε= + + + + + + (2)
where k is the number of independent variables, β1,…, βk the regression coefficients and y is the dependent variable. The regression coefficients represent the independent contributions of each calculated molecular descriptor. The algebraic MLR model is defined in Eq. (1) and in matrix notation:
y Xb e= + (3)
when X is of full rank, the least-squares solution is b = (XTX)-1XTy, where b is the estimator for the regression coefficients in b and XT is a transpose of X.
A single MLR model was developed for essential oil compounds using SPSS software (version 11.50, SPSS Inc., USA). The MLR model was built using a training set and validation using an external prediction set. Multiple linear regression (MLR) techniques based on least-
_________________________________________________________________________________________________________________________________________
2011 Copyright (CC) SCS
Available online at www.shd.org.rs/JSCS/

RETENTION INDICES OF ESSENTIAL OILS 895
squares procedures are very often employed for estimating the coefficients involved in a model equation.25
RESULTS AND DISCUSSION
MLR Analysis
The multiple linear regression method (MLR) is one of the most used mo-deling methods in QSRR. Thus, MLR analysis was performed to derive the best QSAR model. A small number of molecular descriptors proposed by our team were used to establish a QSRR model. The MLR technique was performed on the molecules of the training set shown in Table I. After regression analysis, a few suitable models were obtained, from which the best model was selected and is presented in Eq. (3). A small number of molecular descriptors (RDF035m, PCD and Q2) proposed were used to establish the QSRR model. Additional validation was performed on an external data set consisting of 6 essential oil compounds. MLR Analysis provided a useful equation that can be used to predict the RI of essential oil based upon these parameters. The best equation obtained for the RI of the essential oil compounds is: 590.81 20.56 035 107.41 839.37 2RI RDF m PCD Q= + + + (4)
TABLE I. The data set and the corresponding observed and predicted RI values by GA-MLR for the training and test set (E – relative error)
No. Compound RI (Exp) RI (GA-MLR) E / % Training set
1 α-Thujene 931 993.31 6.69 2 α-Pinene 941 967.82 2.85 3 Sabinene 975 976.75 0. 18 4 β-Pinene 980 968.41 –1.18 5 α-Phellandrene 1007 1051.05 4.37 6 δ-3-Carene 1013 998.54 –3.38 7 p-Cymene 1026 1112.58 8.43 8 Limonene 1030 995.12 –3.38 9 γ-Terpinene 1064 1010.16 –5.05 10 cis-Sabinene hydrate 1069 989.20 –7.46 11 Linalool 1099 1178.61 7.24 12 cis-p-Menth-2-en-1-ol 1123 1193.25 6.25 13 α-Terpineol 1186 1118.92 –5.65 14 Methyl thymol 1236 1290.56 4.41 15 Thymol 1292 1265.62 –2.04 16 Carvacrol 1297 1257.97 –3.00 17 β-Caryophyllene 1420 1394.21 –1.81 18 α-Amorphene 1486 1490.01 0.26 19 γ-Cadinene 1516 1399.89 –7.65 20 δ-Cadinene 1527 1517.06 –0.65 21 Germacrene B 1560 1572.98 0.83 22 Caryophyllene oxide 1582 1617.89 2.26
_________________________________________________________________________________________________________________________________________
2011 Copyright (CC) SCS
Available online at www.shd.org.rs/JSCS/

896 AZAR et al.
TABLE I. Continued
No. Compound RI (Exp) RI (GA-MLR) E / % Prediction set
1 Camphene 954 1039.2 8.93 2 Myrecene 993 997.8 0.48 3 α-Terpinene 1020 1012.2 –0.76 4 1,8-Cineole 1032 1082.3 4.88 5 Terpinolene 1088 985 –9.45 6 Terpinen-4-ol 1177 1119.5 –4.87 7 Methyl carvacrol 1244 1272.5 2.29 8 α-Copaene 1379 1382.8 0.28 9 α-Muurolene 1501 1482.9 –1.19 10 Selina-3,7(11)-diene 1545 1406.2 –8.98
Positive values of the regression coefficients indicate that the indicated des-criptor contributes positively to the value of RI, whereas negative values indicate that the greater the value of the descriptor, the lower is the value of RI. In other words, increasing RDF035m, PCD and Q2 will increase the extent of the RI of essential oil compounds.
For an evaluation of the predictive power of the generated MLR, the opti-mized model was applied for prediction of the RI values of 6 compounds in the prediction set, which were not used in the optimization procedure. For the cons-tructed models, the predictive ability of the MLR model was evaluated by cal-culation of statistical parameters.
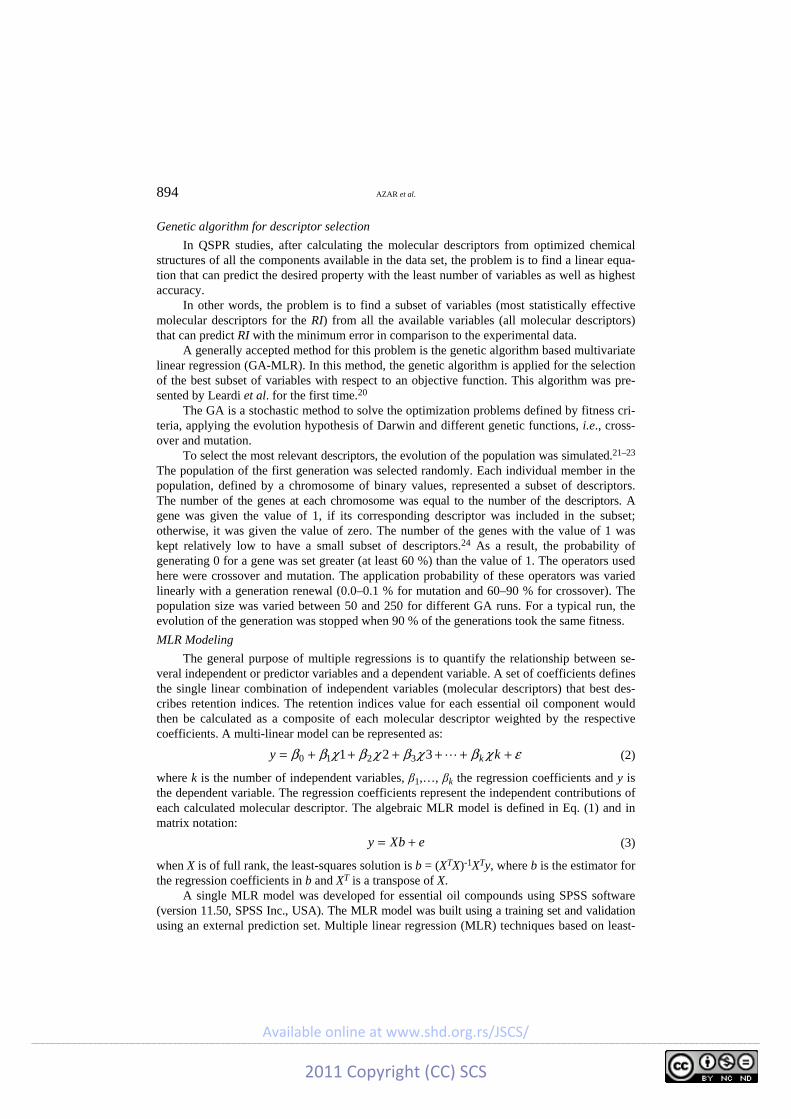
The data set and the corresponding experimental and predicted RI values of all the molecules studied in this work are summarized in Table I. Plots of the values predicted by the GA-MLR against the experimental values of the retention indices of the training and prediction sets are shown in Fig. 1. The residuals (experimental RI − predicted RI) obtained by the GA-MLR modeling versus the experimental RI values are shown in Fig. 2. The distribution of the residuals on both sides of the zero line indicates there is no systematic error in the GA-MLR model.
Statistical parameters
For an evaluation of the predictive power of the generated MLR, the opti-mized model was applied for the prediction of the RI values of the test com-pounds in the prediction set, which were not used in the optimization procedure. For the constructed models, two general statistical parameters were selected to evaluate the prediction ability of the model for RI values. For this case, the pre-dicted RI of each sample in the prediction step was compared with the experi-mental RI.
The root mean square error of prediction (RMSEP) is a measurement of the average difference between predicted and experimental values, at the prediction
_________________________________________________________________________________________________________________________________________
2011 Copyright (CC) SCS
Available online at www.shd.org.rs/JSCS/

RETENTION INDICES OF ESSENTIAL OILS 897
stage. The RMSEP can be interpreted as the average prediction error, expressed in the same units as the original response values. The RMSEP was obtained using the following formula:
0 5
21
100 1( )
.n
i ii ˆRMSEP y yy n =
= − (5)
The second statistical parameter was the relative error of prediction (REP) that shows the predictive ability of each component, and is calculated as:
0 5
21
100 1 (%) ( )
.n
iii ˆREP yyy n =
= − (6)
where yi is the experimental RI value of the essential oil in the sample i, iy represents the predicted RI value of the essential oil in the sample i, y is the mean of experimental RI values in the prediction set and n is the total number of samples used in the prediction set.
Fig. 1. The RI values predicted by the MLR modeling vs. the experimental RI values.
The statistical parameters calculated for the GA–MLR model are listed in Table II.
Topliss and Edwards26 demonstrated that the more independent variables screened, the more independent variables are available for selection in a multiple linear regression model and the more likely a model will be found by chance. These authors recommended that in order to reduce the risk of chance corre-lations, there should be a certain ratio of data points to the number of indepen-dent variables available. A solution for the detection of a chance correlation is the Y-randomization test.27 In order to assess the robustness of the model, the Y-ran-
_________________________________________________________________________________________________________________________________________
2011 Copyright (CC) SCS
Available online at www.shd.org.rs/JSCS/
898 AZAR et al.
domization test was applied in this study. The dependent variable vector (RI) was randomly shuffled and a new QSPR model was developed using the original in-dependent variable matrix. The new QSPR models (after several repetitions) are expected to have low R2 and Q2 values (Table III). If the R2 and Q2 values of these models were much lower than those of the original model, it could be con-sidered that the model was reasonable and had not been obtained by the chance.
Fig. 2. Plot of the residuals against the experimental values of the retention indices.
TABLE II. Statistical parameters obtained by application of the MLR method to the test set
Parameter Value RMSEP 66.473 REP / % 5.570 R2 0.894 Number of descriptors 3
TABLE III. R2 train and Q2LOO values after several Y-randomization tests
Iteration R2 Q2
1 0.1568 0.0031 2 0.1217 0.0013 3 0.2186 0.0122 4 0.0729 0.0096 5 0.1354 0.0197 6 0.0097 0.2751 7 0.1877 0.0026 8 0.3235 0.1193 9 0.0814 0.0506 10 0.2099 0.0059
_________________________________________________________________________________________________________________________________________
2011 Copyright (CC) SCS
Available online at www.shd.org.rs/JSCS/

RETENTION INDICES OF ESSENTIAL OILS 899
Description of the models descriptors
The retention indices in GC depend on the relative solubility of the solute in the mobile and stationary phases, which depend on the molecular structure and chemical properties of the solute. Differences between these properties govern the retention behavior through the column.
In this work, three descriptors were selected including RDF035m, PCD and Q2 for the prediction of the retention indices values. A brief description of the descriptors is presented in Table IV. The methods for the calculations of these descriptors and their meaning have been explained in the Handbook of Molecular Descriptors by Todeschini et al.14
TABLE IV. A brief description of the descriptors used in this study
No. Descriptor Definition 1 RDF035m Radial distribution function – 3.5/weighted by atomic mass 2 PCD Difference of multiple path counts to path counts 3 Q2 Total squared charge
The first descriptor is RDF035m, which is one of the radial distribution func-tion (RDF) descriptors. A RDF in this form meets all the requirements for a 3D structure descriptor. It is independent of the atom number (i.e., the size of a mole-cule), it is unique regarding the three-dimensional arrangement of the atoms and it is invariant against translation and rotation of the entire molecule.
Formally, a radial distribution function of an ensemble of N atoms can be interpreted as the probability distribution to find an atom in a spherical volume of radius r.21 The following equation represents the radial distribution function code as it was used in this investigation:
4 21
( )( )N N
B r ri j
i jg r f A A e
−− −= (7)
where f is a scaling factor and N is the number of atoms. By including charac-teristic atomic properties A of the atoms i and j, the RDF codes can be used in different tasks to fit the requirements of the information to be represented. The exponential term contains the distance rij between the atoms i and j and a smooth-ing parameter B, which defines the probability distribution of the individual dis-tances. g(r) was calculated at a number of discrete points with defined intervals. The atomic properties Ai and Aj used in this equation enable the discrimination of the atoms of a molecule for almost any property that can be attributed to an atom. Such a distribution function provides, besides information about interatomic dis-tances in the whole molecule, the opportunity to gain access to other valuable in-formation, e.g., bond distance, ring types, planar and non-planar systems and atom types. This fact is a most valuable consideration for a computer-assisted
_________________________________________________________________________________________________________________________________________
2011 Copyright (CC) SCS
Available online at www.shd.org.rs/JSCS/

900 AZAR et al.
code elucidation. The radial distribution function in this form meets the entire requirement mentioned above, especially the invariance against linear transla-tions.28
Additionally, the RDF descriptors can be restricted to specific atom types or distance ranges to represent specific information in a certain three-dimensional structure space (e.g., to describe the steric hindrance or the structure/activity pro-perties of a molecule). RDF035m displays a positive sign, which indicates that a retention index is directly related to this descriptor.
The second descriptor of this model was the difference of multiple path counts to path counts (PCD) that describes information related to bonds and dis-tances (bond orders, saturation and ratio of multiple bonds to single bonds).14 Its effect on the retention indices was positive, which indicates that the retention time is directly related to this descriptor.
The final descriptor of this model was the total squared charge (Q2)29–31 that is obtained by the following formula:
22N
ii
Q Q= (8)
where Qi is the amount of charge on atom i and N is the number of atoms of that molecule. This descriptor had a positive effect on the retention indices.
The correlation coefficient matrix for the descriptors used in this study (GA-MLR), is listed in Table V. The data indicate there is a very low correlation be-tween the descriptors used in this research. Therefore, the ability of the resulting QSRR regression models to enable accurate prediction of the retention indice is not related to co-linearity between the variables.
TABLE V. The correlation coefficient matrix for the descriptors used in this study
RDF035m Q2 PCD – – 1 PCD – 1 0.259 Q2 1 0.532 0.108 RDF035m
CONCLUSIONS
In this paper, a simple QSRR model was presented for the prediction of the RI of essential oils. This model is a multivariate linear model, which has three variables (molecular descriptors). These three molecular descriptors were se-lected using the GA-MLR technique. These variables are calculated based on the chemical structure of the molecules. The QSRR model with the simply calculated molecular descriptors could be employed to estimate the retention indices for new compounds, even in the absence of standard candidates.
_________________________________________________________________________________________________________________________________________
2011 Copyright (CC) SCS
Available online at www.shd.org.rs/JSCS/

RETENTION INDICES OF ESSENTIAL OILS 901
И З В О Д
КВАНТИТАТИВНА РЕЛАЦИЈА ИЗМЕЂУ СТРУКТУРЕ И РЕТЕНЦИЈЕ ЗА ПРЕДВИЂАЊЕ ИНДЕКСА РЕТЕНЦИЈЕ ЕСЕНЦИЈАЛНИХ УЉА
ИЗ Ammoides atlantica
PARVIZ ABEROMAND AZAR1, MEHDI NEKOEI1, SIAVASH RIAHI2,3, MOHAMAD R. GANJALI3 и KARIM ZARE1
1Department of Chemistry, Faculty of Basic Sciences, Science and Research Branch, Islamic Azad University, Tehran, 2Institute of Petroleum Engineering, College of Engineering, University of Tehran, P. O. Box 11365–4563, Tehran и 3Center of Excellence in Electrochemistry, Faculty of Chemistry, University of Tehran, Iran
Развијен је једноставан, дескриптиван и интерпретативан модел, заснован на кванти-тативној релацији између структуре и ретенције (QSRR), уз примену генетичкoг алгоритма са линеарном регресијом (A-MLR). Помоћу тог модела предвиђају се ретенциони индекси (RI) за компоненте есенциалних уља. Помоћу молекулског моделовања идентификована су три битна дескриптора за опис RI. Састављена је база података која се састоји из RI за 32 молекула који су садржани у есенцијалним уљима, од више од 931 познатих. Затим је изра-чунат погодан скуп молекулских дескриптора и најбитнији међу њима су одређени помоћу GA-MLR. Добијен је модел са ниском грешком и добрим коефицијентом корелације. Модел је онда употребљен за предвиђање RI вредности за неке компоненте есенцијалних уља које нису коришћене за добивање QSRR модела.
(Примљено 19. октобра, ревидирано 23. децембра 2010)
REFERENCES
1. N. Achak, A. Romane, M. Alifriqui, R. P. Adams, J. Essent. Oil Res. 20 (2008) 200 2. H. Laouer, M. M. Zerroug F. Sahli, A. N. Chaker, G. Valentini, G. Ferretti, M. Grande, J.
Anaya, J. Essent. Oil Res. 15 (2003) 135 3. A. R. Katritzky, D. G. Fara, Energy Fuels 19 (2005) 922 4. M. Jalali-Heravi, M. H. Fatemi, J. Chromatogr. A 915 (2001) 177 5. Z. Garakani-Nejad, M. Karlovits, W. Demuth, T. Stimpfl, W. Vycudilik, M. Jalali-Hera-
vi, K. Varmuza, J. Chromatogr. A 1028 (2004) 287 6. J. Acevedo-Martinez, J. C. Escalona-Arranz, A. Villar-Rojas, F. Tellez-Palmero, P. R.
Roses, L. Gonzalez, R. Carrasco-Velar, J. Chromatogr. A 1102 (2006) 238 7. P. Tulasamma, K. S. Reddy, J. Mol. Graphics Modell. 25 (2006) 507 8. K. Heberger, T. Kowalska, Chemom. Intell. Lab. Syst. 47 (1999) 205 9. U. Depczynski, V. J. Frost, K. Molt, Anal. Chim. Acta 420 (2000) 217
10. B. K. Alsberg, N. Marchand-Geneste, R. D. King, Chemom. Intell. Lab. Syst. 54 (2000) 75
11. D. Jouanrimbaud, D. L. Massart, R. Leardi, O. E. De Noord, Anal. Chem. 67 (1995) 4295 12. Dragon 6, R. Todeschini, V. Consonni, M. Pavana, available at http://www.talete.mi.it/
/products/dragon_description.htm 13. H. Laouer, N. Boulaacheb, S. Akkal, G. Singh, P. Marimuthu, C. De Heluani, C. Catalan,
N. Baldovini, J. Essent. Oil Res. 20 (2008) 266 14. R. Todeschini, V. Consonni, Handbook of Molecular Descriptors, Wiley-VCH, Wein-
heim, Germany, 2000. 15. L. B. Kier, L. H. Hall, Molecular Connectivity in Structure–Activity Analysis, RSP-Wiley,
Chichester, UK, 1986. 16. E. V. Kostantinova, J. Chem. Inf. Comp. Sci. 36 (1997) 54
_________________________________________________________________________________________________________________________________________
2011 Copyright (CC) SCS
Available online at www.shd.org.rs/JSCS/

902 AZAR et al.
17. G. Rucker, C. Rucker, J. Chem. Inf. Comp. Sci. 33 (1993) 683 18. J. Galvez, R. Garcia, M. T. Salabert, R. Soler, J. Chem. Inf. Comp. Sci. 34 (1994) 520 19. P. Broto, G. Moreau, C. Vandicke, J. Med. Chem. 19 (1984) 66 20. R. Leardi, R. Boggia, M. Terrile, J. Chemom. 6 (1992) 267 21. J. Hunger, G. Huttner, J. Comput. Chem. 20 (1999) 455 22. S. Ahmad, M. M. Gromiha, J. Comput. Chem. 24 (2003) 1313 23. C. L. Waller, M. P. Bradley, J. Chem. Inf. Comput. Sci. 39 (1999) 345 24. J. Aires-de-Sousa, M. C. Hemmer, J. Casteiger, Anal. Chem. 74 (2002) 80 25. J. N. Miller, J. C. Miller, Statistics and Chemometrics for Analytical Chemistry, Prentice
Hall, London, 2000 26. J. G. Topliss, R. P. Edwards, J. Med. Chem. 22 (1979) 1238 27. A. Tropsha, P. Gramatica, V. K. Gombar, QSAR Comb. Sci. 22 (2003) 69 28. M. P. Gonzalez, Z. Gandara, Y. G. Gomez, Eur. J. Med. Chem. 43 (2008) 1360 29. N. Bodor, Z. Gabanyi, C. K. Wong, J. Am. Chem. Soc. 111 (1989) 3783 30. L. Buydens, D. Massart, P. Geerlings, Anal. Chem. 55 (1983) 738 31. M. Karelson, S. Victor, Chem. Rev. 96 (1996) 1027.
_________________________________________________________________________________________________________________________________________
2011 Copyright (CC) SCS
Available online at www.shd.org.rs/JSCS/