Limited Diversity among Human Isolates of Bartonella henselae
Vol. 7(50), pp. 5613-5624, 18 December, 2013
DOI: 10.5897/AJMR2013.5791
ISSN 1996-0808 ©2013 Academic Journals
http://www.academicjournals.org/AJMR
African Journal of Microbiology Research
Full Length Research Paper
Quantitative PCR analysis of diesel degrading genes of Acinetobacter calcoaceticus isolates
Johnson Lin*, Vikas Sharma and RakshaToolsi
School of Life Sciences, University of KwaZulu-Natal (Westville), Private Bag X 54001, Durban,
Republic of South Africa.
Accepted 18 November, 2013
Acinetobacter strains LT1 and V2 were grown in Bushnell-Haas medium with 1% diesel and their expression levels of eight diesel-degrading genes were evaluated by quantitative polymerase chain reaction (PCR). LT1 and V2 isolates achieved 86.2 and 89.7% degradation respectively, after 60 days with no significant differences in expression, in comparison with 16S rRNA, rubB and lipB. LT1 showed higher expression levels of rubA, alkM, alkR and xcpR genes during the initial stages of incubation corresponding to higher level of degradation rate. Amplification of alkM, alkR and xcpR genes of V2
indicated more than one enzyme system involved in the process. Low lipB and lipA expression in LT1 and no lipA expression in V2 suggested the absence of lipases in degradation; however, estB gene was predominantly expressed in V2. Thus, isolates LT1 and V2 possessed comparable efficiency in degrading diesel; however, more complex systems have been employed by V2i n degradation process. Key words: qPCR, diesel degradation, Acinetobacter calcoaceticus, bioemulsifier, gene expression.
INTRODUCTION A wide array of studies has dealt with biodegradation and bioremediation of petroleum hydrocarbon unraveling the intricacies of degradation and generating a wealth of bacterial, genetic, biochemical, and physiological know-ledge (van Beilen and Funhoff, 2007; Rojo, 2009). Cha-racterization of bacterial communities, isolation of pros-pective degraders, monitoring their response to pollutants, and identifying functional genes and enzymes involved in biodegradation processes have been subject to extensive research (Wentzel et al., 2007; Rojo, 2010). Over the years, a multitude of bacterial species capable of degra-ding hydrocarbon, have been readily isolated from hydro-carbon-contaminated and non-contaminated sites. Acinetobacter sp. are one of the representative genera capable of utilizing n-alkanes (Tani et al., 2002; Van Hamme et al., 2003; Singh and Lin, 2008; Lee et al.,
2012; Mara et al., 2012). The pathways of alkane degradation and the enzymes
involved in it have been reviewed extensively (Coon, 2005; van Beilen and Funhoff, 2007; Wentzel et al., 2007; Rojo 2010). In majority of the cases, aerobic degradation of n-alkanes starts either by the terminal (van Beilen and Funhoff, 2007; Wentzel et al., 2007; Rojo 2010) or sub-terminal oxidation pathway (Kotani et al., 2006). In this pathway, conversion of methyl group which leaves a primary alcohol, is further oxidized to the corresponding aldehyde, fatty acid and finally processed by β–oxidation pathway to generate acetyl-CoA (Wentzel et al., 2007; Rojo 2010). In some microorganisms, both terminal and sub-terminal oxidation pathway coexists (Watkinson and Morgan, 1990).
In Acinetobacter calcoaceticus, alkane hydroxylases *Corresponding author. E-mail: [email protected]. Tel: +27-31-2607407. Fax: +27-31-2607809.

5614 Afr. J. Microbiol. Res. (encoded alkM) require two soluble electron transfer pro-teins named rubredoxin (rubA) and rubredoxinreductase (rubB) for n-alkane degradation and are obligatory for its function (Tani et al., 2001). The alkM gene expression is regulated by the alkane hydroxylase regulator (alkR) (Ratajczak et al., 1998). The participation of xcpR gene in alkane degradation was proposed in A. calcoaceticus ADP1 after the insertional inactivation of xcpR impeded the secretion of lipase and esterase that lead to the lack of growth on dodecane and slower growth on hexa-decane (Parche et al., 1997). In A. calcoaceticus ADP1, the estB gene encodes a functional esterase and is loca-lized in an operon with genes rubA, rubB and oxyR (Geißdörfer et al. 1999). The esterase activity has been reported to be involved in the sub-terminal oxidation path-way (Kotani et al., 2007). The involvement of these enzy-mes in the degradation of hydrocarbons has been pro-posed, however their exact function is unknown.
Genomes of many Acinetobacter strains have been sequenced recently, including those of Acinetobacter sp. DR1 (Jung et al., 2010), Acinetobacter oleivoran ssp. DR1(T) (Kang et al., 2011), Acinetobacter venetianusRAG-1T (Fondi et al., 2012) and Acinetobacter venetianusVE-C3 (Fondi et al., 2013). Although, momen-tous gains have been made in understanding the pro-cesses in hydrocarbon degradation, the minutiae of indi-vidual systems as well as the diversity of systems have yet to be fully articulated (Van Hamme et al., 2003). Therefore, this study investigated the proficiency of A. calcoaceticus isolates in the degradation of diesel and implementing the levels of mRNA expression of diesel degrading genes using quantitative polymerase chain reaction. MATERIALS AND METHODS Selection and identification of diesel degrading bacterial isolates
A. calcoaceticus isolates LT1and V2, were obtained from depart-mental stock cultures. LT1 (accession number JN036553) were originally isolated from diesel-contaminated soil (Singh and Lin, 2008) while V2 (accession number JN036552) was isolated from used engine oil-contaminated soil (Mandri and Lin, 2007) previously from the same laboratory Isolates were streaked on nutrient agar and incubated at 30°C for 24 h to attain pure cultures.
Growth of bacterial isolates on diesel as sole carbon and energy source To access their ability to degrade diesel, isolates were grown on Bushnell-Haas (BH) minimal medium with diesel as sole carbon source (Singh and Lin, 2008). Isolates were grown in separate 100 ml Erlenmeyer flasks with a total volume of 25 ml of liquid BH medium supplemented with 1% (vol/vol) sterilized diesel using 0.22
μm membrane filters (Whatman) as a carbon and energy source. The isolates were grown overnight at 30°C in Luria broth, washed thrice with normal saline and 1% of the washed cells were inocula-
ted in each BH medium (standardized using BH medium to OD600 of 1.0 after centrifugation). The BH medium flasks were incubated aerobically at 30°C in a rotary shaker (160 rpm) for variable time period. An abiotic control flask, with 1% (vol/vol) diesel and devoid of bacterial inoculum, was incubated under the same conditions to ascertain abiotic loss. Bacterial growth was monitored by optical density at 600 nm (OD600) at 5, 10, 15, 20, 30, 40, 50 and 60 days of incubation. The experiments were repeated in triplicate.
Carbon source utilisation patterns were determined by gravi-metric analysis (Marquez-Rocha et al., 2001). The remaining diesel in each sample was extracted using the separating funnel with 10
ml dichloromethane three times. The dichloromethane extract was funneled through filter paper containing 5 g anhydrous sodium sul-fate (Na2SO4) for the removal of cellular debris and absorption of moisture. The extract was collected in the pre-weighed glass tubes and was left overnight in a fume cupboard to facilitate evaporation of dichloromethane. The combined mass of the pre-weighed tube and diesel was recorded. The mass of the tube was subtracted to determine the mass of the diesel remaining. The mass of the diesel remaining was subtracted from the mass of diesel in the control
sample and multiplied by 100 to determine the percentage of diesel remaining. Student t-test (Microsoft Excel 2010) was used to eva-luate the differences of diesel degradation between LT1 and V2. Probability (significant level) was set at 0.05. RNA extraction and cDNA validation
The BH medium containing isolates was centrifuged at 4000 xg for 20 min resulting in a pellet and a cell-free supernatant. Pellet was re-suspended in phosphate-buffered saline (PBS), pH 7.6, and sub-jected to further centrifugation at 4000 xg for 20 min. Total RNA was extracted from each pellet using Aurum
TM Total RNA Mini Kit
(BIO-RAD) according to manufacturer’s instructions with following modifications :500 µl of lysozyme was added instead of 100 µl of 1000 µg/ml stock dissolved in TE (10 mMTris, 1mM EDTA, pH 7.5) to the bacterial suspension and incubated at room temperature for
30 min. Total RNA purity and yield was determined spectrophoto-metrically using Nanodrop ND-1000 (BIO-RAD). Purified RNA (1 μg) was used to prepare cDNA by using a first Strand iScript
TM
cDNA Synthesis Kit (BIO-RAD). The reverse transcriptase PCR was performed (GeneAmp® PCR System 9700, Applied Biosys-tems) according to manufacturer’s instructions. Purified RNA and cDNAwas also assessed electrophoretically by ethidium bromide staining on 2% (wt/vol) agarose in 1 X TAE running buffer at 80V. The OD260/280 ratio obtained ranged from 1.30 to 2.27. Samples LT1
- day 5, with ratio of 1.30, indicated poor RNA quality that resulted in no 16S rRNAPCR product detected. LT1 - day 5 sample was omitted from the real time PCR study.The PCR product of 16S rRNA gene using 63F and 1387R primers (Marchesi et al., 1998) was obtained. DNA concentrations of 16S rRNA PCR products were measured spectrophotometrically using a NanoDrop ND-1000 spectrophotometer and concentrated stock solutions of specific 16S rRNA gene fragments were prepared. These were serially diluted to generate a set of calibration pure standards with known concentra-tions of target DNA.The cDNA obtained was stored at -20°C. Real-time PCR data analysis and quantification of gene expression
The nucleotide sequences of the genes of interest were acquired from the National Center for Biotechnology Information (NCBI)
nucleotide sequence databases with the following accession num-bers: AF047691 (lipA and lipB), AJ233398 (alkM and alkR), EF524340 (16S rRNA), Y09102 (xcpR) and Z46863 (rubA, rubB,
Lin et al. 5615
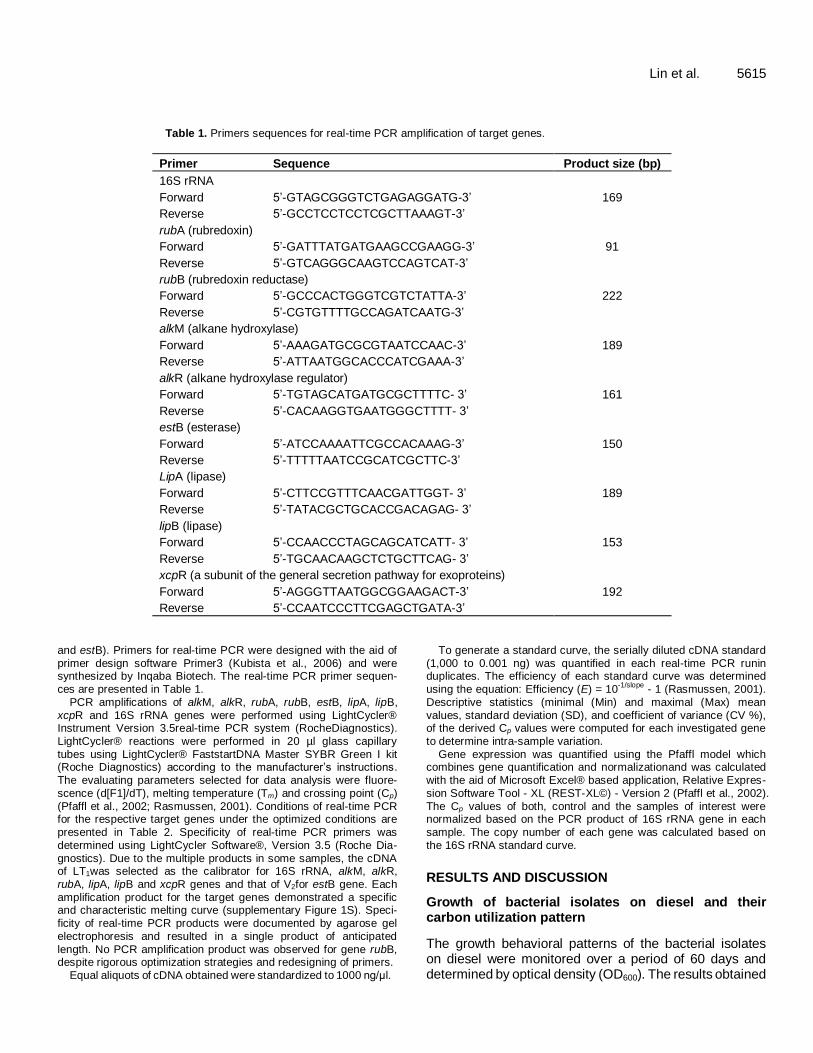
Table 1. Primers sequences for real-time PCR amplification of target genes.
Primer Sequence Product size (bp)
16S rRNA
169 Forward 5’-GTAGCGGGTCTGAGAGGATG-3’
Reverse 5’-GCCTCCTCCTCGCTTAAAGT-3’
rubA (rubredoxin)
91 Forward 5’-GATTTATGATGAAGCCGAAGG-3’
Reverse 5’-GTCAGGGCAAGTCCAGTCAT-3’
rubB (rubredoxin reductase)
222 Forward 5’-GCCCACTGGGTCGTCTATTA-3’
Reverse 5’-CGTGTTTTGCCAGATCAATG-3’
alkM (alkane hydroxylase)
189 Forward 5’-AAAGATGCGCGTAATCCAAC-3’
Reverse 5’-ATTAATGGCACCCATCGAAA-3’
alkR (alkane hydroxylase regulator)
161 Forward 5’-TGTAGCATGATGCGCTTTTC- 3’
Reverse 5’-CACAAGGTGAATGGGCTTTT- 3’
estB (esterase)
150 Forward 5’-ATCCAAAATTCGCCACAAAG-3’
Reverse 5’-TTTTTAATCCGCATCGCTTC-3’
LipA (lipase)
189 Forward 5’-CTTCCGTTTCAACGATTGGT- 3’
Reverse 5’-TATACGCTGCACCGACAGAG- 3’
lipB (lipase)
153 Forward 5’-CCAACCCTAGCAGCATCATT- 3’
Reverse 5’-TGCAACAAGCTCTGCTTCAG- 3’
xcpR (a subunit of the general secretion pathway for exoproteins)
192 Forward 5’-AGGGTTAATGGCGGAAGACT-3’
Reverse 5’-CCAATCCCTTCGAGCTGATA-3’
and estB). Primers for real-time PCR were designed with the aid of primer design software Primer3 (Kubista et al., 2006) and were synthesized by Inqaba Biotech. The real-time PCR primer sequen-ces are presented in Table 1.
PCR amplifications of alkM, alkR, rubA, rubB, estB, lipA, lipB, xcpR and 16S rRNA genes were performed using LightCycler® Instrument Version 3.5real-time PCR system (RocheDiagnostics). LightCycler® reactions were performed in 20 µl glass capillary tubes using LightCycler® FaststartDNA Master SYBR Green I kit (Roche Diagnostics) according to the manufacturer’s instructions. The evaluating parameters selected for data analysis were fluore-scence (d[F1]/dT), melting temperature (Tm) and crossing point (Cp) (Pfaffl et al., 2002; Rasmussen, 2001). Conditions of real-time PCR for the respective target genes under the optimized conditions are
presented in Table 2. Specificity of real-time PCR primers was determined using LightCycler Software®, Version 3.5 (Roche Dia-gnostics). Due to the multiple products in some samples, the cDNA of LT1was selected as the calibrator for 16S rRNA, alkM, alkR, rubA, lipA, lipB and xcpR genes and that of V2for estB gene. Each amplification product for the target genes demonstrated a specific and characteristic melting curve (supplementary Figure 1S). Speci-ficity of real-time PCR products were documented by agarose gel electrophoresis and resulted in a single product of anticipated
length. No PCR amplification product was observed for gene rubB, despite rigorous optimization strategies and redesigning of primers.
Equal aliquots of cDNA obtained were standardized to 1000 ng/μl.
To generate a standard curve, the serially diluted cDNA standard (1,000 to 0.001 ng) was quantified in each real-time PCR runin duplicates. The efficiency of each standard curve was determined using the equation: Efficiency (E) = 10
-1/slope - 1 (Rasmussen, 2001).
Descriptive statistics (minimal (Min) and maximal (Max) mean values, standard deviation (SD), and coefficient of variance (CV %), of the derived Cp values were computed for each investigated gene to determine intra-sample variation.
Gene expression was quantified using the Pfaffl model which combines gene quantification and normalizationand was calculated with the aid of Microsoft Excel® based application, Relative Expres-sion Software Tool - XL (REST-XL©) - Version 2 (Pfaffl et al., 2002). The Cp values of both, control and the samples of interest were normalized based on the PCR product of 16S rRNA gene in each
sample. The copy number of each gene was calculated based on the 16S rRNA standard curve.
RESULTS AND DISCUSSION
Growth of bacterial isolates on diesel and their carbon utilization pattern
The growth behavioral patterns of the bacterial isolates on diesel were monitored over a period of 60 days and determined by optical density (OD600). The results obtained

5616 Afr. J. Microbiol. Res.
Table 2. Composition of reaction Mastermix and amplification parameters for LightCycler®real-time PCR assays.
Target gene
Primer conc.
(pmol/µl)
Reaction components (µl)*
Amplification parameter DEPC
H2O
Forward primer
Reverse primer
MgCl2
(25 mM)
SYBR green
16S rRNA 1.25 5.8 0.5 0.5 1.2 1.0
30 cycles of 5 s at 95°C (Denaturing),
10 s at 62°C (Annealing),
5 s at 72°C (Polymerizing)
alkM 10.0 6.0 0.5 0.5 1.0 1.0
50 cycles of 5 s at 95°C,
15 s at 62°C,
5 s at 72°C
alkR 5.00 6.2 0.5 0.5 0.8 1.0
55 cycles of 5 s at 95°C,
8 s at 62°C,
5 s at 72°C
rubA 5.00 5.8 0.5 0.5 1.2 1.0
40 cycles of 5 s at 95°C,
15 s at 62°C,
5 s at 72°C
lipA 10.0 5.8 0.5 0.5 1.2 1.0
55 cycles of 5 s at 95°C,
10 s at 62°C,
5 s at 72°C
lipB 10.0 5.8 0.5 0.5 1.2 1.0
55 cycles of 5 s at 95°C,
10 s at 62°C,
5 s at 72°C
xcpR 10.0 5.8 0.5 0.5 1.2 1.0
55 cycles of 5 s at 95°C,
10 s at 62°C,
5 s at 72°C
estB 10.0 5.8 0.5 0.5 1.2 1.0
55 cycles of 5 s at 95oC,
15 s at 60oC,
5 s at 72oC
*Final reaction volume of 9 µl.
obtained are presented in Figure 1. After 60 days of incu-bation, a 9.40% mass reduction in the diesel of the abiotic control flask was detected (data not shown). Both isolates displayed comparable proficiency in the overall utilization of diesel as a sole carbon and energy source. Rapid degradation of alkanes occurred during the first 5 days of incubation with attributes to the exponential growth phase of the bacterial cells. The OD60 0increased progressively up to 15 days, and remained relatively constant until the end of the culture time. Both isolates LT1 and V2 showed diesel degrading capability. LT1 and V2 achieved 58.6 and 48.3% degradation after 5 days of incubation and 86.2and 89.7% degradation after 60 days of incubation, respectively (Figure 1). During the initial days of incubation, V2 degraded less diesel as compared to LT1. However, after a rapid increase in diesel degra-dation at day 15, V2 emerged as the most proficient diesel degrader by the end of the incubation period (Figure 1), though the diesel degradation ability between these two strains did not differ significantly (p=0.506) at the end of the experiment.
The presence of an opaque substance was observed in
the hydrocarbon and hydrocarbon - culture medium frac-tion of V2 samples throughout the incubation process. After 10 days of incubation, however, the diesel of the V2 samples no longer appeared as a confluent layer over the culture medium phase, but rather as minuscule droplets. This occurrence was not observed for LT1 samples for the duration of the culture time.
Optimizing the components of the real-time PCR master mix
LightCycler analyses of alkM, alkR, rubA, rubB, xcpR, estB, lipA, lipB and16S rRNA were performed and opti-mized. Melting temperature (Tm) of target gene amplifica-tion products ranged from 79.3°C for alkR to 91.2°C for 16 rRNA (Figure 1S). A high degree of efficiency ranging from 1.76 to 2.24 was achieved indicating a stable and reliable assay. All generated standard curves illustrated high linearity with r
2 values of 1.00 over three orders of
magnitude. An expression profile of lipA could not be created for LT1, and V2 samples due to very low expres-sion levels of lipA and therefore, ElipA could not be deter-

Lin et al. 5617
Figure 1S. Specificity of LightCycler® PCR. Amplification of target genes (A) 16S rRNA, (B) alkM, (C) alkR, (D) rubA, (E) lipA, (F) lipB, (G) xcpR, and (H) estB, as determined by melting curve analysis. Melting peaks were determined by plotting the continuous negative derivative of fluorescence emitted by each sample as PCR products were melted. The cDNA template control sample for each reaction does not show fluorescence, confirming the absence of primer-dimers.
mined. EalkR yielded an efficiency of 2.24, exceeding the maximum permissible efficiency of 2 (E = 100%), indica-
ting an inappropriately optimized assay and/or poor spe-cificity of primer pairs.
60

5618 Afr. J. Microbiol. Res.
Figure 1. Diesel degradation (%) and growth (OD600) patterns of A. calcoaceticus isolates.
The 16S rRNA gene was stably expressed in LT1 sam-ples throughout the time course and showed the lowest degree of intra-sample variation based on SD and CV% of Cp. The 16S rRNA gene of V2 was not signi-ficantly different from 16S rRNA of LT1 with p values of 0.072 demonstrating an accepted level of gene expres-sion variability. The findings also show the similar growth and diesel degradation patterns of both isolates as shown in Figure 1. Hence, the expressions of 16S rRNA of both isolates were used to normalize all other target gene expressions respectively for comparison. The target gene expressions and comparison between LT1 and V2 isolates
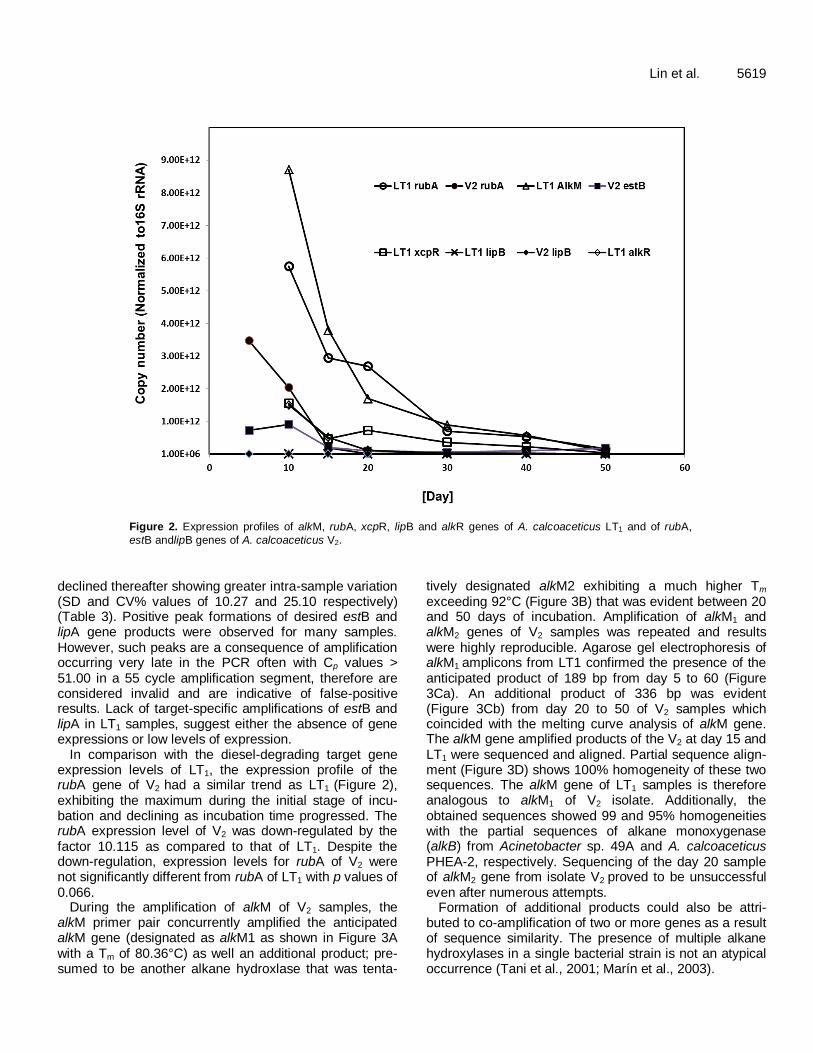
The expression levels of rubA, alkM, alkR, and xcpR genes in LT1 samples exhibited their maximums during the initial stages of incubation (Figures 2 and 3a) and with high de-grees of intra-sample variation in Cp with SD and CV% (Table 3). The higher expression (8.71 x 10
12 gene copies)
of alkM gene was observed at day 10 as compared to other genes involved and its expression declined as incu-bation time progressed. The above results revealed the involvement of these gene products of LT1 in the diesel degradation. Previous studies showed that Acinetobacter
sp. strain ADP1 requires at least five essential genes, namely rubA, rubB, alkM, alkR, and xcpR, for n-alkane utilisation (Ratajczak et al., 1998) confirming rubA, rubB, and alkM constitute a three component alkane hydro-xyase system in A. calcoaceticus (Ratajczak et al., 1998; Geißdörfer et al., 1999; van Beilen et al., 2002). The overall alkR gene expression of LT1, samples was comparatively low in relation to the alkane hydroxylase complex genes, alkM and rubA. This inference is in accordance with pre-ceding studies that found alkR to be expressed at lower levels during alkane degradation despite its indispen-sability in the degradation process (Ratajczak et al., 1998). The xcpR gene encodes a type IV pilus-related system that may not only be required for the secretion of proteins but may represent a more universal transport system for a variety of macromolecules. It may also faci-litate the alleviation of membrane stress incurred by bac-terial cells during alkane degradation (Parche et al., 1997). All genes except lipB gene demonstrated a similar pattern. The lipB gene was expressed in LT1 at all sam-pling times, however, low expression levels was observed as depicted by the high Cp values (Table 3). Unlike other target genes that were expressed in the early stage of diesel degradation, expression levels of lipB gene increased with incubation time (from 5.62x10
8 gene copies at day
10 to 2.82 x 10⁹ gene copies at day 20) for LT1 and
Lin et al. 5619
Figure 2. Expression profiles of alkM, rubA, xcpR, lipB and alkR genes of A. calcoaceticus LT1 and of rubA,
estB andlipB genes of A. calcoaceticus V2.
declined thereafter showing greater intra-sample variation (SD and CV% values of 10.27 and 25.10 respectively) (Table 3). Positive peak formations of desired estB and lipA gene products were observed for many samples. However, such peaks are a consequence of amplification occurring very late in the PCR often with Cp values > 51.00 in a 55 cycle amplification segment, therefore are considered invalid and are indicative of false-positive results. Lack of target-specific amplifications of estB and lipA in LT1 samples, suggest either the absence of gene expressions or low levels of expression.
In comparison with the diesel-degrading target gene expression levels of LT1, the expression profile of the rubA gene of V2 had a similar trend as LT1 (Figure 2), exhibiting the maximum during the initial stage of incu-bation and declining as incubation time progressed. The rubA expression level of V2 was down-regulated by the factor 10.115 as compared to that of LT1. Despite the down-regulation, expression levels for rubA of V2 were not significantly different from rubA of LT1 with p values of 0.066.
During the amplification of alkM of V2 samples, the alkM primer pair concurrently amplified the anticipated alkM gene (designated as alkM1 as shown in Figure 3A with a Tm of 80.36°C) as well an additional product; pre-sumed to be another alkane hydroxlase that was tenta-
tively designated alkM2 exhibiting a much higher Tm exceeding 92°C (Figure 3B) that was evident between 20 and 50 days of incubation. Amplification of alkM1 and alkM2 genes of V2 samples was repeated and results were highly reproducible. Agarose gel electrophoresis of alkM1 amplicons from LT1 confirmed the presence of the anticipated product of 189 bp from day 5 to 60 (Figure 3Ca). An additional product of 336 bp was evident (Figure 3Cb) from day 20 to 50 of V2 samples which coincided with the melting curve analysis of alkM gene. The alkM gene amplified products of the V2 at day 15 and LT1 were sequenced and aligned. Partial sequence align-ment (Figure 3D) shows 100% homogeneity of these two sequences. The alkM gene of LT1 samples is therefore analogous to alkM1 of V2 isolate. Additionally, the obtained sequences showed 99 and 95% homogeneities with the partial sequences of alkane monoxygenase (alkB) from Acinetobacter sp. 49A and A. calcoaceticus PHEA-2, respectively. Sequencing of the day 20 sample of alkM2 gene from isolate V2 proved to be unsuccessful even after numerous attempts.
Formation of additional products could also be attri-buted to co-amplification of two or more genes as a result of sequence similarity. The presence of multiple alkane hydroxylases in a single bacterial strain is not an atypical occurrence (Tani et al., 2001; Marín et al., 2003).

5620 Afr. J. Microbiol. Res.
Figure 3. Melting curve analysis of alkM gene of (A) LT1 and (B) V2 samples, (Ca) Electrophoresed (2%) alkM1 gene amplicons of LT1A.
Lanes 1, Molecular weight marker IV (Roche); 2, negative control (no cDNA); 3, positive control; 4 - 10, day 5 to 60, respectively. (Cb)
Electrophoresed alkM1 and alkM2 gene amplicons of V2 samples --Lanes 1, Molecular weight marker IV (Roche); 2, negative control (no cDNA); 3, positive control; 4 - 11, days 5 to 60, respectively. (D) Partial sequence alignment of alkM1 amplicons of LT1, V2 and partial sequences of alkane monooxygenase of A. calcoaceticus PHEA-2; Acinetobacter sp. 49A.
64 66 68 70 72 74 76 78 80 82 84 86 88 90 92 94
14
13
12
11
10
9
8
7
6
5
4
3
2
1
0
64 66 68 70 72 74 76 78 80 82 84 86 88 90 92 94
14
13
12
11
10
9
8
7
6
5
4
3
2
1
0
Ca
(Cb)
(D)
V2-15 5’-ATTCACGTCTTGTGAAGAGTTTTATTCCACTGCAATATGCTGCAAATGTTTATGCATGTT
LT1 5’-ATTCACGTCTTGTGAAGAGTTTTATTCCACTGCAATATGCTGCAAATGTTTATGCATGTT
49A alkB5’-ATTCACGTCTTGTGAAGAGTTTTATTCCACTGCAATATGCTGCAAATGTTTATGCATGTT
PHEA-2 5’-ATTCACGTCTTGTGAAAAGTTTTATTCCATTGCAATATGCTGCAAATGTTTATGCATGTT
V2-15 5’-ATTTAACAAGCCGTAAAACCACGTCATTCATTGATAAAATTTTGCTCGGTGTTTCGATGG
LT1 5’-ATTTAACAAGCCGTAAAACCACGTCATTCATTGATAAAATTTTGCTCGGTGTTTCGATGG
49A alkB5’-ATTTAACAAGCCGTAAAACCACGTCATTCATTGATAAAATTTTGCTCGGTGTTTCAATGG
PHEA-2 5’-ATTTAACAAGCCGTAAAACTACGTCATTCATTGATAAAATTTTGCTCGGTGTTTCAATGG
336 bp
189 bp 154 bp
220 bp
298 bp
394 bp
1 2 3 4 5 6 7 8 9 10 11
189 bp
1 2 3 4 5 6 7 8 9 10
220 bp
Time (days)
Lin et al. 5621
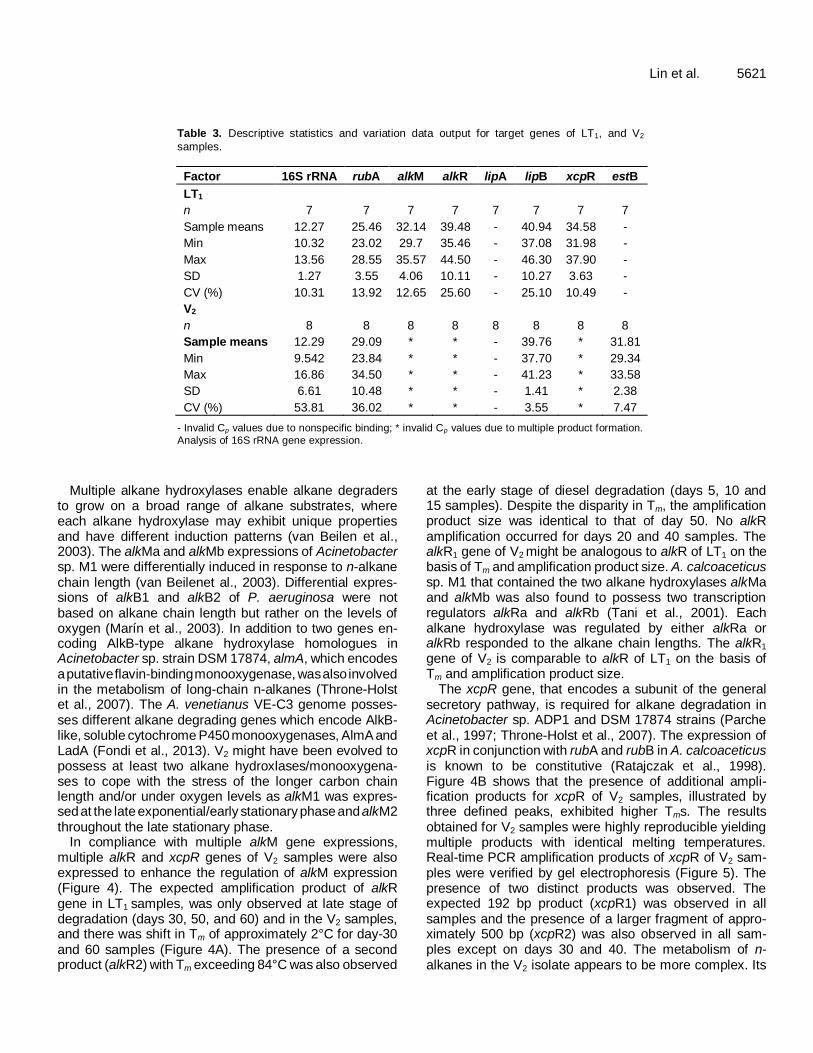
Table 3. Descriptive statistics and variation data output for target genes of LT1, and V2
samples.
Factor 16S rRNA rubA alkM alkR lipA lipB xcpR estB
LT1
n 7 7 7 7 7 7 7 7
Sample means 12.27 25.46 32.14 39.48 - 40.94 34.58 -
Min 10.32 23.02 29.7 35.46 - 37.08 31.98 -
Max 13.56 28.55 35.57 44.50 - 46.30 37.90 -
SD 1.27 3.55 4.06 10.11 - 10.27 3.63 -
CV (%) 10.31 13.92 12.65 25.60 - 25.10 10.49 -
V2
n 8 8 8 8 8 8 8 8
Sample means 12.29 29.09 * * - 39.76 * 31.81
Min 9.542 23.84 * * - 37.70 * 29.34
Max 16.86 34.50 * * - 41.23 * 33.58
SD 6.61 10.48 * * - 1.41 * 2.38
CV (%) 53.81 36.02 * * - 3.55 * 7.47
- Invalid Cp values due to nonspecific binding; * invalid Cp values due to multiple product formation.
Analysis of 16S rRNA gene expression.
Multiple alkane hydroxylases enable alkane degraders to grow on a broad range of alkane substrates, where each alkane hydroxylase may exhibit unique properties and have different induction patterns (van Beilen et al., 2003). The alkMa and alkMb expressions of Acinetobacter sp. M1 were differentially induced in response to n-alkane chain length (van Beilenet al., 2003). Differential expres-sions of alkB1 and alkB2 of P. aeruginosa were not based on alkane chain length but rather on the levels of oxygen (Marín et al., 2003). In addition to two genes en-coding AlkB-type alkane hydroxylase homologues in Acinetobacter sp. strain DSM 17874, almA, which encodes a putative flavin-binding monooxygenase, was also involved in the metabolism of long-chain n-alkanes (Throne-Holst et al., 2007). The A. venetianus VE-C3 genome posses-ses different alkane degrading genes which encode AlkB-like, soluble cytochrome P450 monooxygenases, AlmA and LadA (Fondi et al., 2013). V2 might have been evolved to possess at least two alkane hydroxlases/monooxygena-ses to cope with the stress of the longer carbon chain length and/or under oxygen levels as alkM1 was expres-sed at the late exponential/early stationary phase and alkM2 throughout the late stationary phase.
In compliance with multiple alkM gene expressions, multiple alkR and xcpR genes of V2 samples were also expressed to enhance the regulation of alkM expression (Figure 4). The expected amplification product of alkR gene in LT1 samples, was only observed at late stage of degradation (days 30, 50, and 60) and in the V2 samples, and there was shift in Tm of approximately 2°C for day-30 and 60 samples (Figure 4A). The presence of a second product (alkR2) with Tm exceeding 84°C was also observed
at the early stage of diesel degradation (days 5, 10 and 15 samples). Despite the disparity in Tm, the amplification product size was identical to that of day 50. No alkR amplification occurred for days 20 and 40 samples. The alkR1 gene of V2 might be analogous to alkR of LT1 on the basis of Tm and amplification product size. A. calcoaceticus sp. M1 that contained the two alkane hydroxylases alkMa and alkMb was also found to possess two transcription regulators alkRa and alkRb (Tani et al., 2001). Each alkane hydroxylase was regulated by either alkRa or alkRb responded to the alkane chain lengths. The alkR1 gene of V2 is comparable to alkR of LT1 on the basis of Tm and amplification product size.
The xcpR gene, that encodes a subunit of the general secretory pathway, is required for alkane degradation in Acinetobacter sp. ADP1 and DSM 17874 strains (Parche et al., 1997; Throne-Holst et al., 2007). The expression of xcpR in conjunction with rubA and rubB in A. calcoaceticus is known to be constitutive (Ratajczak et al., 1998). Figure 4B shows that the presence of additional ampli-fication products for xcpR of V2 samples, illustrated by three defined peaks, exhibited higher Tms. The results obtained for V2 samples were highly reproducible yielding multiple products with identical melting temperatures. Real-time PCR amplification products of xcpR of V2 sam-ples were verified by gel electrophoresis (Figure 5). The presence of two distinct products was observed. The expected 192 bp product (xcpR1) was observed in all samples and the presence of a larger fragment of appro-ximately 500 bp (xcpR2) was also observed in all sam-ples except on days 30 and 40. The metabolism of n- alkanes in the V2 isolate appears to be more complex. Its

5622 Afr. J. Microbiol. Res.
Figure 4. Melting peak analysis of (A)alkR gene,(B) xcpR and (C) lipB gene of V2 samples
determined by plotting the negative derivative of fluorescence [-d(F1)/dT].
broad substrate range, diversity and functions of the en-zymes involved in alkane degradation, and its contrasting regulation of both constitutive and differential gene expression may be reminiscent of the fact that two and perhaps more xcpR genes are required to provide an adequate transport system during alkane degradation.
Rubredoxin (rubA) activity was detected in all investi-gated samples of LT1 and V2 isolates. LT1 and V2 sam-
ples exhibited similar rubA expression trends and the dif-ferences in expression levels were not significant. How-ever, rubredoxinreductase (rubB) activity was not detected in any of the isolates despite rigorous optimising strate-gies and redesigning of primers. Plausible reasons for the inability to detect rubB activity could be attributed to very low expression levels, or poor primer design.
Theoretically, rubB would have exhibited a similar
Fig. 4
Fig. 5
1 2 3 4 5 6 7 8 9 10 11
A
68 70 72 74 76 78 80 82 84 86 88 90 92
3.0
2.8
2.6
2.4
2.2
2.0
1.8
1.6
1.4
1.2
1.0
0.8
0.6
0.4
0.2
0.0
-0.2
-0.4
B
66 68 70 72 74 76 78 80 82 84 86 88 90 92
2.82.6
2.4
2.2
2.0
1.8
1.6
1.4
1.2
1.0
0.8
0.6
0.4
0.2
0.0
68 70 72 74 76 78 80 82 84 86 88 90 92
C
2.8
2.6
2.4
2.2
2.0
1.8
1.6
1.4
1.2
1.0
0.8
0.6
0.4
0.2
0.0

Lin et al. 5623
Figure 5. Electrophoresed xcpR amplicons of V2 samples. Lanes 1- molecular weight
marker VI (Roche); 2- negative control (no cDNA template); 3- positive control (calibrator); 4 to 11- xcpR amplicons of 5 to 60 days samples, respectively.
expression trend to that of rubA due to their synergistic association (Geißdörfer et al., 1999). Interestingly, novel genes encoding AlkB-Rubredoxin fusion proteins were used in the hydroxylation of long-chain alkanes by Gram positive bacteria (Nie et al., 2011). In addition, rubredoxin-rubredoxin reductase systems are present in many other organisms that are unable to degrade alkanes, where they serve other functions such as rapid transport of reducing equivalents to the final receptor (Hagelueken et al., 2007).
Although, rubA, rubB and estB constitute an operon in Acinetobacter sp. ADP1, it was established that no association could be ascertained between the expression of rubA and estB in accordance with the findings by Geißdörfer et al. (1999). The expression of estB was predominantly observed in V2 samples and either non-expression or extremely low expression of the estB gene in LT1 samples (Figure 3). During the diesel degradation phase of V2 inocula, an opaque, waxy material was observed, probably due to bioemulsifiers in the hydro-carbon and hydrocarbon-culture medium fraction, but not in flasks containing LT1 inocula. These findings are suggestive that the involvement of estB in the release of the bioemulsifier may be plausible (Shabtai and Gutnick, 1985).
Low expression of lipA in LT1 and lack of expression in V2 (Table 3) is an indication of its non-involvement in the degradation of diesel. The lipB gene was expressed in all samples in this study. Expression of lipB amongst V2 samples was moderately constant exhibiting lower SD and CV% values of 1.41 and 3.55, respectively (Table 3). The expression profile of lipB gene in V2 (Figure 4C) was found in low level, depicted by the high Cp values exhi-biting maximum expression at day 15. Thereafter, ex-pression levels declined fairly constantly. In comparison to LT1, lipB of V2 was up-regulated by the factor 1.976 with no significant difference (p= 0.436). In this study, the
expression trends of lipA and lipB were incongruent, and expression of lipB was still evident in the absence of lipA expression amongst V2 samples. The lipB gene encodes a lipase chaperone that prevents the complete folding of the lipase before it traverses the outer cell membrane (Kim et al., 2008). Alternatively, steric chaperones may have other functions such as the autotransporter protein that can be used to direct a variety of proteins to the cell surface in addition to LipA folding (Wilhelm et al., 2007). Kim et al. (2008) also reported that there are 3 different lipaA genes present in Acinetobacter sp. DYL 129. The involvement of lipA and lipB in alkane degradation is still unknown.
The findings of this study confirm the importance of rubA, alkM, alkR, and xcpR genes in the process of alkane degradation. The results are also suggestive that different members of the alkane degraders, such as Acinetobacter LT1 and V2 strains in this study employ a variety of alkane degrading pathways for alkane oxida-tion, albeit both isolates achieved comparable levels of diesel degradation. It is apparent that alkane oxidation in V2 appears to be complex due to its diverse regulations of multiple alkane hydroxylases, alkane hydroxylase trans-cription regulators and the secretory pathways. However, involvement of other alkane degrading proteins such as cytochrome P450 alkane hydroxylases, Lad and AlmA cannot be ruled out.
Conclusions
We concluded that both Acinetobacter strains LT1 and V2 in this study showed comparable diesel degrading ability, however real-time PCR experiments revealed more than one enzyme system involved by V2 indicating its diverse regulations of multiple alkane hydroxylases, its transcrip-tion regulators and the secretory pathways. Low or no expression of lipB and lipA genes suggested the absence
1 2 3 4 5 6 7 8 9 10 11
500 bp
192 bp
517 bp
653 bp
453 bp
220 bp

5624 Afr. J. Microbiol. Res. of lipases in degradation. This study also confirms the importance of rubA, alkM, alkR and xcpR genes in the process of alkane degradation, although, future experi-ments would be necessary to elucidate the involvement of other proteins such as cytochrome P450 alkane hydro-xylases, Lad and AlmA in alkane degradation.
ACKNOWLEDGEMENTS
This research was funded by the National Research Foundation of South Africa. The authors are grateful to the NRF for the award of doctoral bursary.
REFERENCES Coon MJ (2005). Omega oxygenases: nonheme-iron enzymes and
P450 cytochromes. Biochem. Biophys. Res. Commun. 338: 378–385. Fondi M, Orlandini V, Emiliani G, Papaleo MC, Maida I, Perrin E,
Vaneechoutte M, Dijkshoorn L, Fani R (2012). Draft genome
sequence of the hydrocarbon-degrading and emulsan-producing strain Acinetobacter venetianus RAG-1T. J. Bacteriol. 194(17): 4771-
4772. Doi: 10.1128/JB.01019-12.
Fondi M, Rizzi E, Emiliani G, Orlandini V, Berna L, Papaleo MC, Perrin E, Maida I, Corti G, De Bellis G, Baldi F, Dijkshoorn L, Vaneechoutte M, Fani R (2013). The genome sequence of the hydrocarbon-degrading Acinetobacter venetianus VE-C3. Res. Microbiol. 164(5):
439-449. Geißdörfer W, Kok RG, Ratajczak A, Hellingwerf KJ, Hillen W (1999)
The genes rubAand rubBfor alkane degradation in Acinetobactersp.
strain ADP1 are in an operon with estB, encoding an esterase, and oxyR. J. Bacteriol.181(14): 4292-4298.
Hagelueken G, Wiehlmann L, Adams TM, Kolmar H, Heinz DW,
Tümmler B, Schubert W-D (2007). Crystal structure of the electron transfer complex rubredoxin–rubredoxinreductase of Pseudomonas aeruginosa. PNAS 104(30): 12276-12281.
Jung J, Baek JH, Park W (2010). Complete genome sequence of the diesel-degrading Acinetobacter sp. strain DR1. J. Bacteriol. 192(18):
4794-4795. Kang YS, Jung J, Jeon CO, Park W (2011). Acinetobacteroleivorans sp.
nov. is capable of adhering to and growing on dieseleoil. J. Microbiol. 49: 29-34.
Kim S-H, Park I-H, Lee S-C, Lee Y-S, Zhou Y, Kim C-M, Ahn S-C, Choi Y-L (2008). Discovery of three novel lipase (lipA1, lipA2, and lipA3) and lipase-specific chaperone (lipB) genes present in Acinetobacter
sp. DYL129. Appl. Genet. Mol. Biotechnol. 77(5): 1041-1051. Kotani T, Kawashima Y, Yurimoto H, Kato N, Sakai Y (2006). Gene
structure and regulation of alkane monooxygenases in propane-utilizing Mycobacterium sp. TY-6 and Pseudonocardia sp. TY-7. J.
Biosci. Bioeng. 102: 184–192. Kotani T, Yurimoto H, Kato N, Sakai Y (2007). Novel acetone metabo-
lism in a propane-utilizing bacterium, Gordonia sp. strain TY-5. J.
Bacteriol. 189: 886–893. Kubista M, Andrade JM, Bengtsson M, Forootan A, Jonák J, Lind K,
Sindelka R, Sjöback R, Sjögreen B, Strömbom L, Ståhlberg A, ZoricN (2006) The real-time polymerase chain reaction. Mol. Aspects Med. 27: 95-125.
Lee M, Woo S-G, Ten LN (2012). Characterization of novel diesel-degrading strains Acinetobacterhaemolyticus MJ01 and Acinetobacter johnsonii MJ4 isolated from oil-contaminated soil.
World J. Microbiol. Biotechnol. 28: 2057–2067. Mandri T, Lin J (2007). Isolation and characterization of engine oil
degrading indigenous microorganisms in KwaZulu-Natal, South
Africa. Afr. J. Biotechnol. 6(1): 23-27. Mara K, Decorosi F, Viti C, Giovannetti L, Papaleo MC, Maida I, Perrin
E, Fondi M, Vaneechoutte M, Nemec A, van den Barselaar M,
Dijkshoorn L, Fani R (2012) Molecular and phenotypic characteriza-
tion of Acinetobacter strains able to degrade diesel fuel. Res.
Microbiol. 163: 161-172.
Marchesi JR, Sato T, Weightman AJ, Martin TA, Fry JC, Hiom SH, Wade WG (1998). Design and evaluation of useful bacterium-specific PCR primers that amplify genes coding for bacterial 16S rRNA. Appl.
Environ. Microbiol. 64: 795-799. Marín M, Yuste L, RojoF (2003) Differential expression of the compo-
nents of the two alkane hydroxylases from Pseudomonas aeruginosa.
J. Bacteriol. 185(10): 3232-3237. Marquez-Rocha FJ, Hernandez-Rodriguez V, Lamela MT (2001). Bio-
degradation of diesel oil in soil by a microbial consortium. Water Air
Soil Pollut. 128: 313-320. Nie Y, Liang J, Fang H, Tang Y-Q, Wu X-L (2011). Two novel alkane
hydroxylase-rubredoxin fusion genes isolated from a Dietzia bacte-
rium and the functions of fused rubredoxin domains in long-chain n-alkane degradation. Appl. Environ. Microbiol. 77(20): 7279–7288.
Parche S, Geißdörfer W, Hillen W (1997) Identification and characteri-zation of xcpRencoding a subunit of the general secretory pathway necessary for dodecane degradation in Acinetobacter calcoaceticus
ADP1. J. Bacteriol. 179(14): 4631-4634.
Pfaffl MW, Horgan GW, Dempfle L (2002). Relative Expression Software Tool (REST-XL ©) for group-wise comparison and statistical analysis of relative expression results in real-time PCR. Nucleic Acids
Res. 30(9): e36 Rasmussen RP (2001). Quantification on the LightCycler. In: Meuer S,
Wittwer C, Nakagawara K (eds). RapidCycle Real-time PCR,
Methods and Applications. Springer Press, Heidelberg. pp. 21-34. Ratajczak A, Geißdörfer W, HillenW (1998) Expression of alkane hydro-
xylase from Acinetobactersp. strain ADP1 is induced by a broad
range of n-alkanes and requires the transcriptional activator AlkR. J.
Bacteriol.180(22): 5822-5827. Rojo F (2009). Degradation of alkanes by bacteria. Environ. Microbiol.
11: 2477-2490. Rojo F (2010). Enzymes for aerobic degradation of alkanes. In: Timmis
KN (ed) Handbook of hydrocarbon and lipid microbiology. Springer,
Germany, Vol 2, pp. 781–797. Shabtai Y, GutnickDL (1985). Exocellular esterase and emulsan release
from the cell surface of Acinetobactercalcoaceticus. J. Bacteriol.
161(3):1176-1181. Singh C, Lin J (2008) Isolation and characterization of diesel oil degra-
ding indigenous microorganisms in Kwazulu-Natal, South Africa. Afr.
J. Biotechnol. 7(2): 1927-1932. Tani A, Ishige T, Sakai Y, Kato N (2001). Gene structures and regula-
tion of the alkane hydroxylase complex in Acinetobacter sp. strain M-
1. J. Bacteriol. 183: 1819-1823. Tani A, Ishige T, Sakai Y, KatoN (2002). Two acyl-CoA dehydro-
genases of Acinetobacter sp. strain M- 1 that uses very long-chain n-
alkanes. J. Biosci. Bioeng. 94(4): 326-329. Throne-Holst M, Wentzel A, Ellingsen TE, Kotlar H-K, Zotchev SB
(2007). Identification of novel genes involved in long-chain n-alkane degradation by Acinetobacter sp. Strain DSM 17874. Appl. Environ.
Microbiol. 73(10): 3327–3332. van Beilen JB, Funhoff EG (2007). Alkane hydroxylases involved in
microbial alkane degradation. Appl. Microbiol. Biotechnol. 74: 13-21. van Beilen JB, Li Z, Duetz WA, Smits THM, Witholt B (2003). Diversity
of alkane hydroxylase systems in the environment. Oil Gas Sci.
Technol. 58: 427-440. van Beilen JB, Neuwenschwander M, Smits THM, Roth C, Balada SB,
Witholt B (2002). Rubredoxins involved in alkane oxidation. J.
Bacteriol. 184: 1722-1732. van Hamme JD, Singh A, Ward OP (2003). Recent advances in petro-
leum microbiology. Microbiol. Mol. Biol. Rev. 60(4): 503-549.
Watkinson RJ, Morgan P (1990). Physiology of aliphatic hydrocarbon-degrading microorganisms. Biodegradation 1(2-3): 79-92.
Wentzel A, Ellingsen TE, Kotlar HK, Zotchev SB, Throne-Holst M
(2007). Bacterial metabolism of long-chain n-alkanes. Appl. Microbiol. Biotechnol. 76: 1209–1221.
Wilhelm S, Rosenau F, Becker S, Buest S, Hausmann S, Kolmar H,
Jaeger K-E (2007). Functional Cell-Surface Display of a Lipase-Specific Chaperone. Chem. BioChem. 8(1): 55-60.
Copyright © 2022 FDOKUMEN


![[Distribution of blaOXA genes in Acinetobacter baumannii strains: a multicenter study]](https://static.fdokumen.com/doc/165x107/6337b5c66f78ac31240eb601/distribution-of-blaoxa-genes-in-acinetobacter-baumannii-strains-a-multicenter.jpg)