Quantitative hyperspectral analysis for characterization of the coastal water from Damietta to Port...
17
This article appeared in a journal published by Elsevier. The attached copy is furnished to the author for internal non-commercial research and education use, including for instruction at the authors institution and sharing with colleagues. Other uses, including reproduction and distribution, or selling or licensing copies, or posting to personal, institutional or third party websites are prohibited. In most cases authors are permitted to post their version of the article (e.g. in Word or Tex form) to their personal website or institutional repository. Authors requiring further information regarding Elsevier’s archiving and manuscript policies are encouraged to visit: http://www.elsevier.com/authorsrights
Transcript of Quantitative hyperspectral analysis for characterization of the coastal water from Damietta to Port...

This article appeared in a journal published by Elsevier. The attachedcopy is furnished to the author for internal non-commercial researchand education use, including for instruction at the authors institution
and sharing with colleagues.
Other uses, including reproduction and distribution, or selling orlicensing copies, or posting to personal, institutional or third party
websites are prohibited.
In most cases authors are permitted to post their version of thearticle (e.g. in Word or Tex form) to their personal website orinstitutional repository. Authors requiring further information
regarding Elsevier’s archiving and manuscript policies areencouraged to visit:
http://www.elsevier.com/authorsrights

Author's personal copy
RESEARCH PAPER
Quantitative hyperspectral analysis for
characterization of the coastal water
from Damietta to Port Said, Egypt
Islam Abou El-Magd, Ahmed El-Zeiny *
National Authority for Remote Sensing and Space Sciences, Environment Department, 23 Josef Tito St., El-NozahaEl-Gedida, Cairo, Egypt
Received 27 August 2013; revised 15 January 2014; accepted 16 February 2014
Available online 12 March 2014
KEYWORDS
Hyperspectral remote
sensing;
Coastal water quality;
Nile Delta;
Egypt
Abstract The coastal zone of the Nile Delta is wealthy of natural resources that currently accom-
modate and support not less than one third of the population. However, it is still a promising area
for energy resources and industrial activities that initiated the country to develop new action plans
for industrial estates and services; it is under extreme environmental pressure. The newly developed
techniques of remote sensing offer effective tool to monitor such environment on a near-real time
basis at minimum in situ sampling. Detection of water quality conditions and parameters is one of
the major advantages of hyperspectral remote sensing technologies; which has been widely used to
assess water quality conditions of many open water mass and aquatic ecosystems. This research
looked at characterization of the water quality using the different functions of in situ measurements
of hyperspectral sensors in conjunction with water quality multi-probe sensor. The spectral behav-
iour of the water at the outlets is quite different from the other sampling sites of the coastal water.
Turbidity was recorded at high level of 65 (NTU) and chlorophyll was up to 147 mg/l at the outlets,
which were positively correlated with the hyperspectral curve of the spectroradiometer and Hype-
rion data. The archived Hyperion data showed some similarities and differences with the in situ data
that were mostly due to the timing differences between both datasets; it, however, enabled for
understanding of the hyperspectral application in water quality.� 2014 Production and hosting by Elsevier B.V. on behalf of National Authority for Remote Sensing and
Space Sciences.
1. Introduction
The Nile Delta of Egypt represents about 2.3% of the Egyptianterritory; however, it supports 63%of the country’s agriculturalland (Hereher, 2009) andaccommodates about 45%ofEgyptianpopulation. Ecologically, it includes about 25% of the total
Mediterraneanwetlands (Sestini, 1992), which supports the eco-logical balance and fishing production. The coastal zone of the
* Corresponding author. Tel.: +20 1007737052.E-mail address: [email protected] (A. El-Zeiny).
Peer review under responsibility of National Authority for Remote
Sensing and Space Sciences.
Production and hosting by Elsevier
The Egyptian Journal of Remote Sensing and Space Sciences (2014) 17, 61–76
National Authority for Remote Sensing and Space Sciences
The Egyptian Journal of Remote Sensing and Space
Sciences
www.elsevier.com/locate/ejrswww.sciencedirect.com
1110-9823 � 2014 Production and hosting by Elsevier B.V. on behalf of National Authority for Remote Sensing and Space Sciences.
http://dx.doi.org/10.1016/j.ejrs.2014.02.001
Author's personal copy
Nile Delta is wealthy of natural resources that currently accom-modate and support not less than one third of the population(Abou El-Magd and Hermas, 2010). However, it is still a prom-
ising area for energy resources and industrial activities that ini-tiated the country to develop new action plans for industrialand services estates.Unfortunately, due to theun-planneddevel-
opment activities the coastal zone and coastal water resource arefacing unprecedented pollution from human activities includingagriculture discharge, industrial discharge as well as sewage dis-
charge. Simply, all kinds of pollutants that are carried by riversand drainage systems ultimately end up into these coastal waterresources (El-Zeiny, 2010).
To monitor the quality of such dynamic environment the
conventional methodologies are required to regularly obtainwater samples for laboratory analysis. However, these method-ologies are accurate and help in proposing mitigation and
rehabilitation mechanisms, they have some shortcomings.These include the localized sampling location that could notbe generalized, does not consider the other surrounding envi-
ronment that influences the water quality as well as time con-suming and very costly. Therefore, new techniques of earthobservations including the availability of repetitive, synoptic
and multi-spectral data from various satellite sensors are pow-erful in monitoring the coastal and marine environment(Nayak, 2002). Such remote sensing tools provide near-realtime monitoring of such dynamic environment.
Hyperspectral remote and proximal sensing is currentlyextensively and successfully used to study the state of the envi-ronment and to track changes that occur over time. It acquires
intensive, very narrow and contiguous spectral bands through-out the visible, near-infrared and mid-infrared portions of theelectromagnetic spectrum (Song et al., 2012). Hyperspectral
sensors typically collect 200 or more bands enabling the con-struction of an almost continuous reflectance spectrum forevery pixel in the scene. Contiguous, narrow bandwidths char-
acteristic of hyperspectral data allow for in-depth examinationof earth surface features which would otherwise be ‘lost’ withinthe relatively coarse bandwidths acquired with multispectralscanners (Smith, 2001b).
Hyperspectral remote sensing has shown high potential indetecting the conditions of the water quality and its parameters.This is actually based on the interaction between the electromag-
netic radiation and the water contents. The shorter the wave-length the higher is the penetration of the water content, whichreflects the water column, therefore both wavelength and water
characteristics are key in this process. In fact, the reflectance ofthewater surface is the result of complex processes of absorptionand reflection of sunlight by phytoplankton, inorganic particlesin suspension, dissolved humus, water plants and water (Mal-
thus and Dekker, 1994). In this context, the narrow intervalsof hyperspectral channels enable a wide range of reflectance thatis useful in assessing water quality conditions of many open
water aquatic ecosystems like our area of study. Unfortunately,thismight not be the case in all environmentswhere there are sur-rounding land use and land cover that influence the water char-
acteristics and thereafter the interaction with electromagneticradiation. In some places where there is complexity of land useand land cover categories, such as our area of study, always cre-
ate problem in precise identification or characterization of thewater parameters. Therefore, in these cases, there is a need tointegrate various datasets to precisely characterize the waterquality.
The content of chlorophyll-a is proportional to the amountof biomass present in the body, while there is a relationship be-tween reflectance and total suspended solids (Li et al., 2010;
Moses et al., 2012). This includes classifying the trophic statusof lakes (Koponen et al., 2002; Thiemann and Kaufmann,2002) and estuaries (Froidefond et al., 2002) characterizing al-
gal blooms and chlorophyll-a (Stumpf, 2001; Gitelson, 1992;Polliainen et al., 2001; Gons et al., 2008) and assessment ofammonia dynamics based on signatures of macrophytes (Tilley
et al., 2003). This would enable cumulatively to determine thetotal suspended matters (Hakvoort et al., 2002; Vos et al.,2003; Nechad et al., 2010) and total phosphorus (Koponenet al., 2002).
The main objective of this research paper is to characterizethe water quality of a portion of the coastal zone of the NileDelta using the different functions of in situ measurements of
hyperspectral sensors in conjunction with water quality mul-ti-probe sensor and remotely sensed data.
2. Materials and methods
2.1. Area of study
The chosen area of study is an elongated coastal zone area thatextends from Damietta to Port Said. It represents a vital part
of the Nile Delta region as a resource for fish production, en-ergy and some of the industrial activities. It witnessed lots ofchanges during the last few decades and greatly affected by dif-
ferent types of man-made activities and changing of the landuse and land cover of the surrounding area. This boosts thedischarge of pollutants from various types and sources ofwastes, which negatively affect the region (Fig. 1).
The climatic condition of the area is typical Mediterraneanenvironment with moderate temperature most of the year. Theobtained meteorological data are from the nearest climatic sta-
tion at El Gamil station in 2011 (Table 1). The predominantwind direction in the area of study is almost northwest direc-tion most of the year, which creates a general eastward-flowing
long shore current (El-Asmar and Hereher, 2010). Statistically,it was found that 81% of these waves originate from the north-west direction, 14% from the northeast and just 5% fromsouthwest (Frihy et al., 2003). Winter season almost records
the maximum wave height of 4.2 m which is predominantlyfrom the west-north-west wave direction; whereas spring sea-son records the minimum wave height of 1.16 m which origi-
nates from the northwest direction (El-Banna 2007). A tidaldifference is semi-diurnal and ranges between 25 and 30 cmalong the delta coast.
2.2. In situ measurements
Two systems of in situ measurements were carried out, which
include measuring the physico-chemical parameters of coastalwater using the AQUA metre water quality device and thespectral characteristics of the coastal water using theFieldSpec� 3 ASD spectroradiometer device. The AQUA
metre device measures nearly 9 parameters including watertemperature, pH, oxidation reduction potentials, specific con-ductivity, turbidity, chlorophyll, dissolved oxygen, crude oil
contamination as well as the depth of the measured parameters(Table 2). However, the spectroradiometer is an optical device
62 I. Abou El-Magd, A. El-Zeiny

Author's personal copy
that uses detectors other than photographic film to measurethe distribution of radiation in a particular wavelength region;
which measures the radiant energy (radiance and irradiance).It measures the spectral behaviour in the visible, near-infrared(VNIR) and short-wave infrared (SWIR) spectra between 350
and 2500 nm in a precision of 1 nm. Two field trips were con-ducted by both devices at specific locations of the coastal waterand other fresh water of Lake Manzala. Fig. 2 shows the loca-
tion of the in situ measurements using both devices.
2.3. Remotely sensed data
2.3.1. Satellite sensors
SPOT 5 satellite imagery dated 2011 was used to map the exist-ing land use and land cover of the study area as well as to
determine the water quality of the area of study. The imagewas geometrically corroded to the UTM grid system Zone 36North and radiometrically corrected to remove all the haze
and aerosol effects. Then digital image processing of enhance-ment was used to differentiate the different tone of water in re-sponse to the water quality or/and characteristics. It was also
classified to determine and map the existing land use and landcover categories of the study area that has a direct or indirectimpact on the water quality.
Archived Hyperion hyperspectral images dated 2002 and
2003 were used for hyperspectral analysis and compared withthe in situ hyperspectral data. However, they are at two differ-ent dates with nearly 10 year time gap but it helps to under-
stand the hyperspectral behaviour of the water quality. The
spectral profile of both data sets was overlaid to compare thespectral interactions between the water and hyperspectral.
2.3.2. Geographical information systems (GIS)
For spatial analysis and spatial correlation all the obtainedgeographic and satellite data are transformed into a GIS Sys-
tem to map the environmental status, conditions and forecastthe environmental degradation of the study area. This systemwas developed to be a dynamic interface for mapping and gen-
erating environmental scenarios. This was based on the Arc-GIS package.
3. Results
3.1. Land use and land covers
Recent high resolution satellite image of SPOT 5 dated 2011was used to characterize the coastal water and mapping the
surrounding land use and land cover. The important categoriesof land use and land cover of the study area that influences thewater characteristics and quality were determined and mappedfrom the supervised classification of the SPOT 5 image and
digitization of the key features (Fig. 3). The accuracy level ofthis classification was 84% based on the maximum likelihoodclassifier, which was based on the accuracy of the training sam-
ples together with the actual reflectance of the image.Key class is the international coastal road, which intersects
the wetland of Lake Manzala and divides the area of study.
Such infrastructures of roads had accelerated the development
Figure 1 The area of study – coastal zone from Damietta to Port Said (source SPOT5, 2011).
Table 1 Average climatic data in the area of study in 2011.
Variable Units Jan Feb Mar Apr May Jun Jul Aug Sep Oct Nov Dec Average
Maximum temperature (mean daily value) �C 17.4 17.9 19.4 22.5 25.1 28.2 30.0 30.3 28.8 26.7 23.0 19.4 24.06
Minimum temperature (mean daily value) �C 11.1 11.7 13.4 16.3 18.8 22.1 23.7 24.2 23.3 21.3 17.5 12.8 18.02
Precipitation (mean monthly value) mm 18.0 12.0 10.0 5.0 4.0 0.0 0.0 0.0 3.0 8.0 7.0 16.0 6.92
Relative humidity (mean value) % 68.0 66.0 65.0 64.0 66.0 67.0 68.0 68.0 68.0 65.0 67.0 69.0 66.75
Hyperspectral analysis for characterization of the coastal water 63

Author's personal copy
of fish farms that play a key role of point discharge of chem-icals and contamination to the coastal water of the Mediterra-nean Sea. The urban settlements were mapped at Port Saeid,
Damietta, new Damietta city and Ras El-Bar cities along withother small urbanized areas and rural urban. These urban andhuman communities are very close to the coastal water and
influence the water quality by continuous discharge of humanwastes to the water. Irrigation canals and drainage were alsomapped where most of the irrigation pesticides and agricul-
tural wastes end with the coastal water or to the wetland ofLake Maznala that also go to the sea via the outlets. Finally,the natural vegetation class is found to be flourished and in-creased in size that has negatively converted the water mass
of Lake Manzala into semi-closed basins.The land use and land cover categories played a role as
point source of pollution and contamination of the coastal
water as well as the wetland of Lake Manzala. The spectralchannels of SPOT 5 (visible and near infrared) were digitallyprocessed to categorize the marine water mass into three dif-
ferent categories (Fig. 4-Left):
(1) deep water, which is shown in green colour,
(2) continental or transitional water, which is shown inorange reddish colour, and
(3) coastal water, which is shown in yellow colour.
The deep water is merely shown in one category due to thehigh absorption of the infrared radiation. This might be dueto probably of being far from the human activities and low af-
fected by the turbulence that induce exchanging process be-tween bottom sediment and its waters. While, continentalwaters, are more dynamic than deep water and more affected
by actions of waves and human activities.However, the lateral coastal water is highly influenced by
the currents and the turbidity as well as shallow depth that
enabled for radiation reflection from the bottom sedimentand suspended matters. It is clearly shown that natural andanthropogenic factors are influencing this zone. Furthermore,action of waves causes moving of sediment particles from bot-
tom to up in the process of turbulence, raising the value ofturbidity in these waters. Thus, there are continuous ex-changes of different constituents between sediment and water.
Fig. 3-Right shows the two plume fans at the mouth of theoutlet connection between Lake Manzala and the Mediterra-nean Sea. This is probably a function of the water character-
istics and quality moving from the Lake into the sea. Thismight be attributed to the difference in water temperature,concentration of nutrient or/and phosphorus load or other al-gal occurrence.
The transitional category of water between both deepwater and lateral coastal water is a mixture of water proper-ties and quality that are mostly influenced by the lateral coast-
al water in some areas (Fig. 4-Left).
3.2. In situ measurements
3.2.1. Aqua metre water quality measurements
To examine the potential characterization of water properties
from optical remote sensing (e.g. SPOT 5 data); in situ mea-surements of water quality parameters were obtained. Table 2shows example of the measured parameters by the Manta2T
able
2In
situ
measurements
ofAquametre
waterquality
device.
Actual
Water
temperature
(�C)
pH
Oxidation
reduction
potential(m
V)
Depth
(meter)
Specific
conductivity
(lS/cm)
Turbidity
(NTU)
Chlorophyll
(lg/l)
Dissolved
oxygen
(%Sat)
Crudeoil
(rfu)
Marine-El-GamileOutlet-1
17.17
8.94
160
0.41
30,410
65.4
57.07
151
�10,030
BogazEl-GamileOutlet-1
15.28
8.72
174
0.4
6619
27.65
147.1
176.75
�24,760
Marine-El-GamileOutlet-2
16.51
8.91
182
0.45
21,960
41.7
68.21
137.4
�14,101
BogazEl-GamileOutlet-2
15.42
9.22
130
0.48
6071
18.3
121.6
209.5
�15,147
BogazEl-GamileOutlet-3
16.42
9.01
150
0.49
8607
17.9
9.37
133.5
�28,244
Marine-El-GamileOutlet-3
15.78
9.02
194
0.51
23,420
27
136.8
145.6
�28,910
DeibaTriangle
16.48
8.65
147
0.49
30,260
7.5
0.08
169.3
�5098
AlLessan(m
outh
oftheNileRiver
withtheSea)
16.725
8.505
174
0.195
31,343
57.35
1.145
109.6
5368
BogazEzbetBorg
16.92
8.5
160
0.31
57,780
27.2
1.65
109.9
4098
Marinewater(D
amiettaHarbour)
17.6
8.42
139
0.18
29,200
12.6
7.61
109.4
�5374
Abbreviations:
M=
Marine;
B=
Bogaz;
G=
El-GamileOutlet;AlLessan=
AlLessan(i.e.mouth
oftheNileRiver
withtheSea).
64 I. Abou El-Magd, A. El-Zeiny

Author's personal copy
Aqua metre sensor. Indeed, there is a clear spatial variability inthe water quality at the sampling locations, which is mainlysubjected to changes in water constituents and the water dis-
charge from the Nile Delta. This is also attributed to the influ-ence of man-made activities including changes of the land useand land cover within the study area as well as the drainagesystem.
The sampling locations of the in situ measurements werechosen to be at three different environments:
1. Point at the outlets that connect the fresh water from LakeManzala with the marine water (sometimes called Bogaz),
2. Points on the coast representing the coastal marine water
3. Points at the fresh water of Lake Manzala.
This enabled for drawing picture of comparison betweenthe water characteristics at both environments. Bogaz El-Ga-
mile Outlet-1 recorded the lowest value of temperature, whilethe coastal marine water near Damietta harbour recordedthe highest value of temperature (17.6 �C) that was probably
due to the time of measurements during the day, since the low-est value was taken in the morning, while the highest one wasrecorded at mid-day; or probably due to the mixing of fresh
water and marine water at the Bogaz Outlet. DO (dissolvedoxygen) creates good environment for algal growth via theprocess of photosynthesis; therefore, it is highly recorded in
the fresh water of Lake Manzala and the Bogaz Outlets thanmarine water. However, in some cases the over growth of algae
creates depletion of the dissolved oxygen and creates eutrophicenvironment. Chlorophyll-a concentration is varied based onthe sampling location, which showed high values of chloro-
phyll-a in the fresh water of Lake Manzala and at the BogazOutlets. The highest recorded value was 147 lgl/l at BogazEl-Gamile Outlet-2. Conversely, the marine sea water showedvery low chlorophyll concentrations (Fig. 5).
Turbidity mainly indicates the amount of suspended parti-cles in water; these particles may be algae, plant remains andsediments. The turbulence of the suspended particles in the
coastal marine water was the main factor of getting turbidityin the study area reaching up to 65%. El Gamil Outlet-1 andAl lessan (mouth of the Nile River with the Sea) sampling sites
showed the highest recorded turbidity, however the fresh waterof Lake Manzala showed calm water with low level of turbid-ity (Fig. 6). Electric conductivity is function of the total dis-solved solids (TDS); the highest EC values were recorded in
the coastal marine water (Saline water). However, the lowestvalues were in the fresh water of the Nile River and the mod-erate values were in the Lake Manzala water (partially brack-
ish). Unfortunately, pH exhibited no significant spatialvariations in the area of study, which showed weak alkaline.The highest pH value was recorded at Bogaz El Gamile Out-
let-2 that is mainly attributed to the man-made activities of fishfarming at this area, which likely use ammonia loaded ChickenManure for fish feed that increases the pH in this region.
Although ORP (the process of oxidation and reductionpotential) showed nearly no significant difference between
Figure 2 Sampling locations (top = second field samples, bottom = first field samples).
Hyperspectral analysis for characterization of the coastal water 65

Author's personal copy
the sampling sites (i.e. both fresh and marine water environ-ments); the coastal marine water showed the highest values
above 150 mV. The fresh water from Boghazes shows also highvalue above 100 mV but less than the marine water. Finally,crude oil contamination was not significantly recorded in all
sampling locations except at Al lessan (mouth of the Nile Riverwith the Sea) and BoGaz Ezbet El-Borg sites that recordednoticeable concentrations. It is probably subjected to crude
oil pollution in these sites due to the oil leakages from shipsthat found all time for trade purposes, or/and human activities
for recreational purposes (Fig. 7).
3.2.2. Spectroradiometer
The second in situ measurement was hyperspectral behaviour
of the water using the spectroradiometer for the first time inthis area of study. This kind of measurements enabled to
Figure 3 Important units of land use/cover from on screen digitizing.
Figure 4 Classified SPOT 5 image of the coastal water in the area of study.
66 I. Abou El-Magd, A. El-Zeiny

Author's personal copy
understand and investigated the characterization of the watercolumn within the region. The wide range of the spectral re-
sponse with narrow interval is possibly a function of the prop-erties of the water column. The sampling sites were nearly atthe same geographic location of the sampling sites using theAqua metre for water quality. For simplicity in the analysis
the spectral response of some geographically closed samplingsites was averaged. These merged locations were categorizedinto Coastal marine water and fresh water at Bogaz outlets
or/and Lake Manzala.Fig. 8 represents the spectral reflectance of the coastal mar-
ine sampling locations from Damietta to Port Said. The re-
corded reflectance was categorized into three spectral regionsaccording to the width of the wavelengths; which includesthe visible spectra, near infrared spectra and middle infrared
spectrum. The most significant spectral response was fromthe visible and red edge spectral region. This is due to the
penetration of this short wavelength to the water columnand reflecting the properties of the water contents.
The area of study is subjected to different types of pollu-tants, resulted from different industries, including fertilizers,pesticides, plastics and heavy industries of the New Damiettaindustrial zone. The discharged wastewater into the marine
environment increases the spectral reflectance of the water invisible and near IR portions of the light (Farooq, 2011). Theinteraction of these pollutants with the spectrum is different
based on the concentration and the width of the wavelength.This is why the short wave length of the visible light and thered edge of visible and near infrared spectrum interact with
the pollutants in the water column (Farooq, 2011). For exam-ple the sampling site of the New Damietta city showed highspectral reflectance in visible and Near IR regions. This area
is an industrial estate that discharges loads of wastewater intothe Mediterranean Sea close to the sampling site.
Figure 5 Spatial variations of water temperature, chlorophyll and dissolved oxygen.
Figure 6 Spatial variations of turbidity, pH and specific conductivity.
Hyperspectral analysis for characterization of the coastal water 67

Author's personal copy
Indeed, waves, currents and man-made activities are notice-ably playing a key role in the level of turbidity in the area of
study, which is described as dynamic environment. This is to-gether with the land use and land cover that showed varioushuman activities of fish farming that always impact negatively
on the water quality. The high level of agricultural wastes fromthe drains also plays a main role in the water quality of thearea of study. Therefore, the outflow of fresh water that is
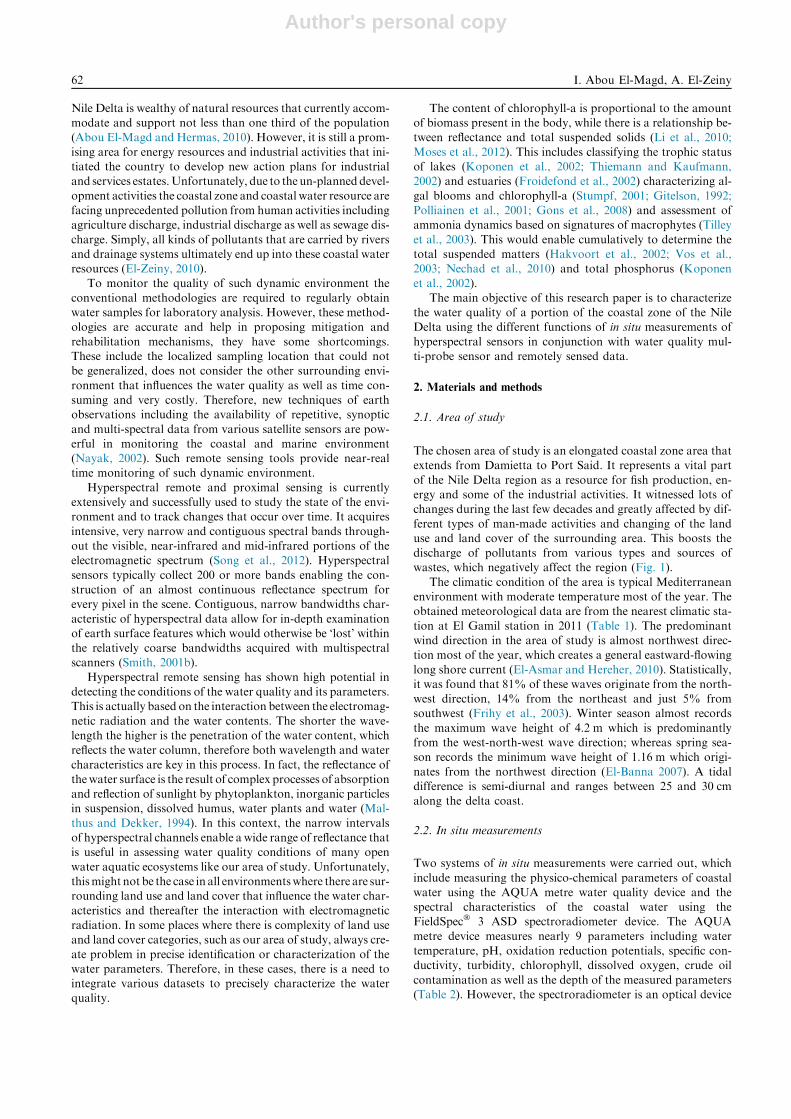
highly concentrated with pesticides and fertilizers is almostchanging the characteristics of the coastal marine water. Thisis almost reflect in the spectral behaviour of the sampling sites.Fig. 9 shows the spatial variations of reflectance in the area of
study especially in visible and in near IR regions. El GamileOutlet-1 showed higher level of total suspended solids thanEl Gamile Outlet-2, which is reflected in the high spectral
reflectance observed in the outlet-1 than the outlet-2 particu-larly in the visible region.
Some sampling sites showed high level of chlorophyll that is
almost from algae. This is clearly shown in the spectral curve
with windows of absorption and reflection that is correlatedwith the algae. Fresh water of Lake Manzala and the Outlets
showed this high level of chlorophyll, which is probably dueto the high level of wastewater that is rich with nutrients (i.e.nitrogen and phosphorus) that are important for growing up
of algae. El Gamile Outlet-1 at the outlet and even at the coast-al marine water of the Mediterranean Sea contains high levelsof total suspended solids and algae content, which might be
sourced from the fresh water coming from Lake Manzala.However, this was not the case at El Gamile Outlet-2 facingthe Sea, which might reflect that the loads of discharge at thisoutlet is less than the observed one at the Outlet-1.
3.2.3. Integration between in situ spectroradiometer and Aqua
Meter results
Integration of the in situ measurements from the spectroradi-ometer and the Aqua metre devices enabled to correlate the re-sults from both systems. However, there was little time gap
Figure 7 Spatial variations of crude oil and oxidation reduction potential.
Figure 8 Spectral reflectance signature of coastal samples.
68 I. Abou El-Magd, A. El-Zeiny
Author's personal copy
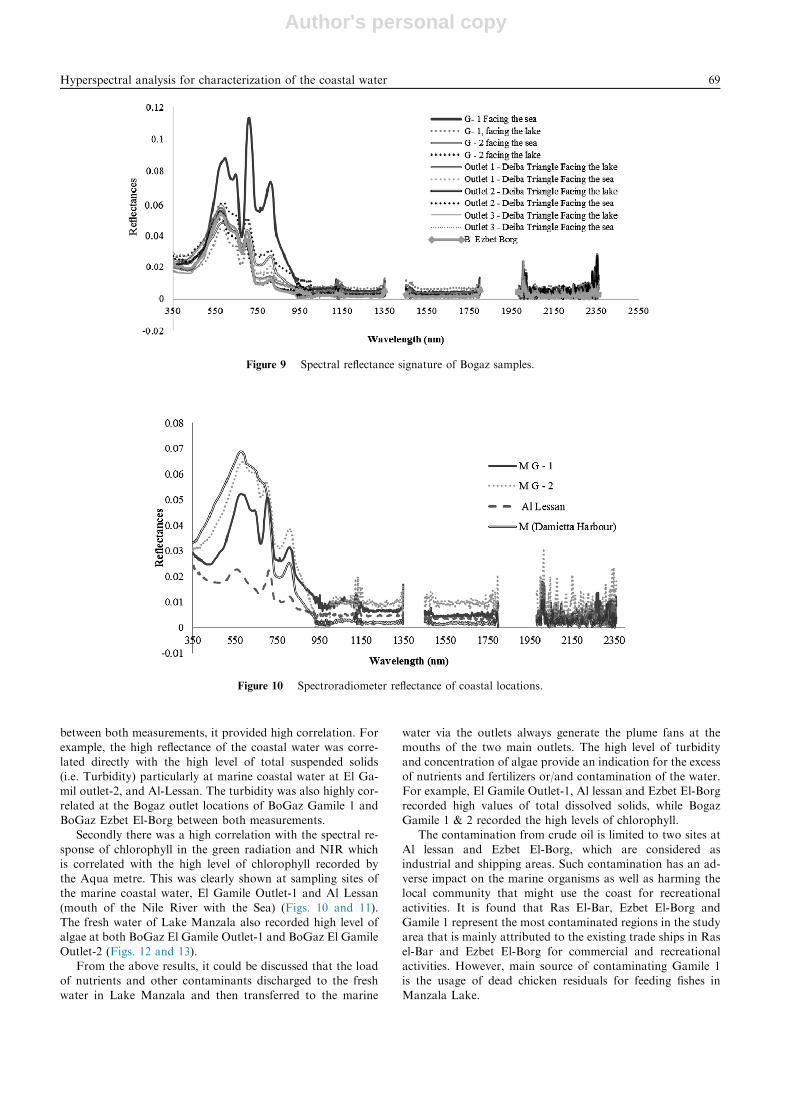
between both measurements, it provided high correlation. Forexample, the high reflectance of the coastal water was corre-
lated directly with the high level of total suspended solids(i.e. Turbidity) particularly at marine coastal water at El Ga-mil outlet-2, and Al-Lessan. The turbidity was also highly cor-
related at the Bogaz outlet locations of BoGaz Gamile 1 andBoGaz Ezbet El-Borg between both measurements.
Secondly there was a high correlation with the spectral re-
sponse of chlorophyll in the green radiation and NIR whichis correlated with the high level of chlorophyll recorded bythe Aqua metre. This was clearly shown at sampling sites ofthe marine coastal water, El Gamile Outlet-1 and Al Lessan
(mouth of the Nile River with the Sea) (Figs. 10 and 11).The fresh water of Lake Manzala also recorded high level ofalgae at both BoGaz El Gamile Outlet-1 and BoGaz El Gamile
Outlet-2 (Figs. 12 and 13).From the above results, it could be discussed that the load
of nutrients and other contaminants discharged to the fresh
water in Lake Manzala and then transferred to the marine
water via the outlets always generate the plume fans at themouths of the two main outlets. The high level of turbidity
and concentration of algae provide an indication for the excessof nutrients and fertilizers or/and contamination of the water.For example, El Gamile Outlet-1, Al lessan and Ezbet El-Borg
recorded high values of total dissolved solids, while BogazGamile 1 & 2 recorded the high levels of chlorophyll.
The contamination from crude oil is limited to two sites at
Al lessan and Ezbet El-Borg, which are considered asindustrial and shipping areas. Such contamination has an ad-verse impact on the marine organisms as well as harming thelocal community that might use the coast for recreational
activities. It is found that Ras El-Bar, Ezbet El-Borg andGamile 1 represent the most contaminated regions in the studyarea that is mainly attributed to the existing trade ships in Ras
el-Bar and Ezbet El-Borg for commercial and recreationalactivities. However, main source of contaminating Gamile 1is the usage of dead chicken residuals for feeding fishes in
Manzala Lake.
Figure 9 Spectral reflectance signature of Bogaz samples.
Figure 10 Spectroradiometer reflectance of coastal locations.
Hyperspectral analysis for characterization of the coastal water 69

Author's personal copy
Figure 11 Aqua metre measurements at the coastal sampling locations.
Figure 12 Spectroradiometer reflectance of Bogaz outlet sampling locations.
Figure 13 Aqua metre measurements at Bogaz outlet sampling locations.
70 I. Abou El-Magd, A. El-Zeiny
Author's personal copy
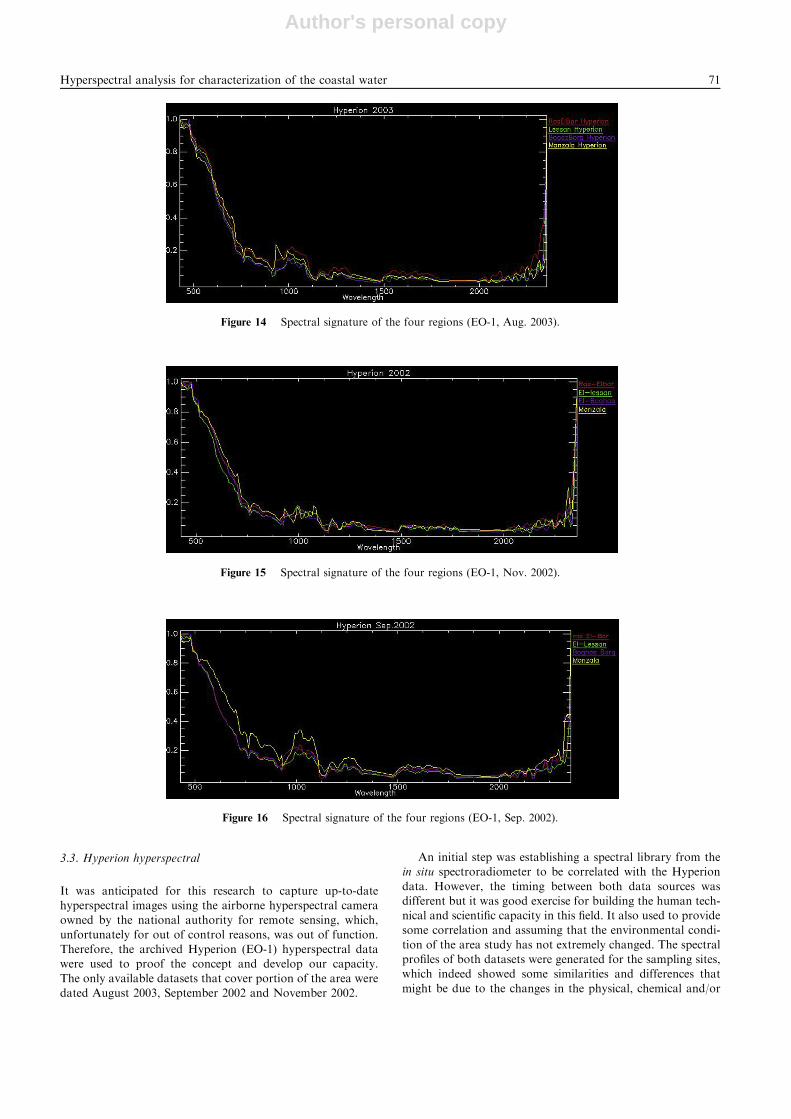
3.3. Hyperion hyperspectral
It was anticipated for this research to capture up-to-datehyperspectral images using the airborne hyperspectral cameraowned by the national authority for remote sensing, which,
unfortunately for out of control reasons, was out of function.Therefore, the archived Hyperion (EO-1) hyperspectral datawere used to proof the concept and develop our capacity.
The only available datasets that cover portion of the area weredated August 2003, September 2002 and November 2002.
An initial step was establishing a spectral library from thein situ spectroradiometer to be correlated with the Hyperion
data. However, the timing between both data sources wasdifferent but it was good exercise for building the human tech-nical and scientific capacity in this field. It also used to providesome correlation and assuming that the environmental condi-
tion of the area study has not extremely changed. The spectralprofiles of both datasets were generated for the sampling sites,which indeed showed some similarities and differences that
might be due to the changes in the physical, chemical and/or
Figure 14 Spectral signature of the four regions (EO-1, Aug. 2003).
Figure 15 Spectral signature of the four regions (EO-1, Nov. 2002).
Figure 16 Spectral signature of the four regions (EO-1, Sep. 2002).
Hyperspectral analysis for characterization of the coastal water 71
Author's personal copy
biological characteristics because of the difference in the tim-
ing of both datasets.Figs. 14–16 show the spectral profile of four sampling sites
from the Hyperion data, which represent three differentdates August 2003, November 2002, and September 2002,
respectively. The correlation between these three profilesshows little similarities between August and November,
however September shows difference between both. This might
be due to the difference in the season and flow of agriculturalwastes or/and fertilizers. It is also shown that the red edge andnear infrared spectrum is the more significant reflectance thatprovides indication of the water quality. It is also clearly
shown that the reflectance from the fresh water in LakeManzala has the highest response in all dates, which might
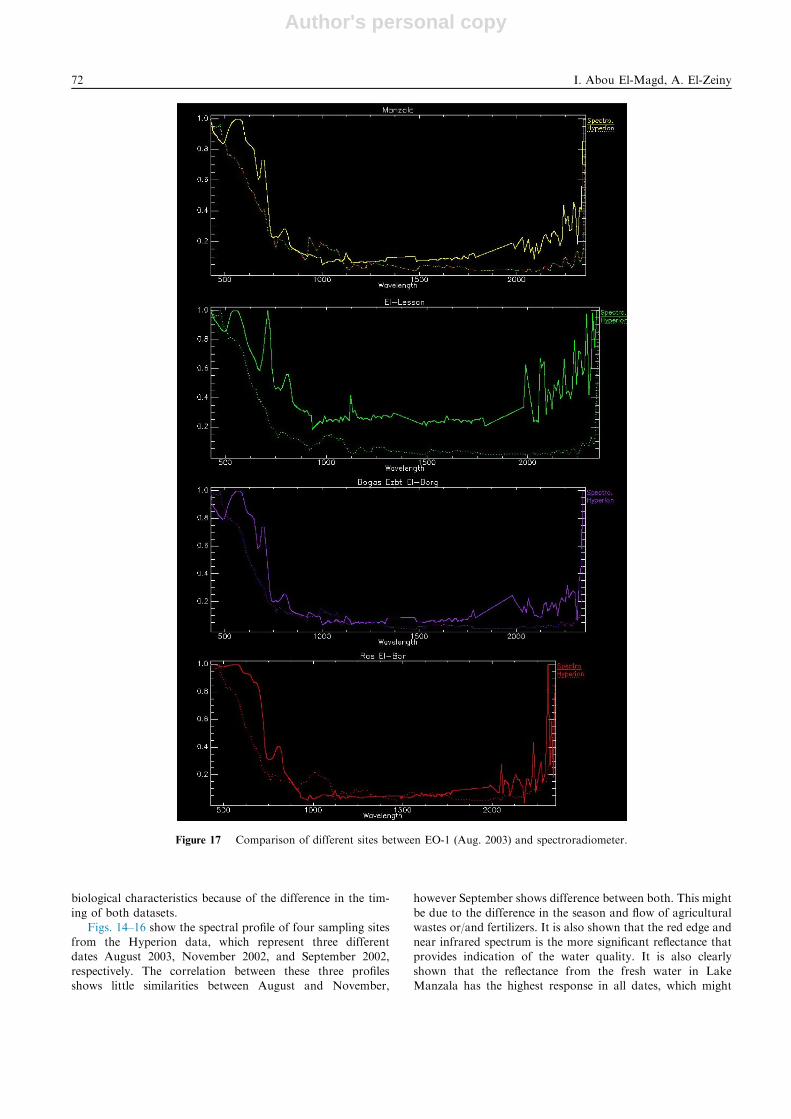
Figure 17 Comparison of different sites between EO-1 (Aug. 2003) and spectroradiometer.
72 I. Abou El-Magd, A. El-Zeiny

Author's personal copy
be attributed to the high level of algae, nutrients and phospho-
rous. The second highest level of reflectance is the sampling siteof Ras El Bar which has high level of turbidity.
Figs. 17–19 show the comparison between the in situ spect-roradiometer library and the Hyperion data of August 2003,
November 2002 and September 2002 respectively at the same
four sampling sites of Lake Manzala, Al Lessan, Bogaz EzbetElborg, and Ras El Bar. The in situ spectroradiometer reflec-tance shows higher reflectance in all sites rather than the Hype-rion data and differences in the pattern in some wavelength
Figure 18 Comparison of different sites between EO-1 (Nov. 2002) and spectroradiometer.
Hyperspectral analysis for characterization of the coastal water 73

Author's personal copy
range. The visible spectrum shows a higher difference in the
magnitude of reflectance between the in situ spectroradiometerand the Hyperion data, where the in situ spectroradiometer re-sponse is much higher than the Hyperion. Even the pattern ofresponse is not highly correlated. The red edge and near infra-
red spectrum shows differences in the magnitude between bothprofiles, however there is some correlation in the pattern. Inthe middle infrared there is a high correlation in the pattern
with differences in the magnitude. This proves the efficiency
of conducting the in situ measurements at the same time ofthe sensor imaging; which allow for calibration and correla-tion. Such differences in the magnitude and pattern are mainlyattributed to the time of taking the samples and as well as the
characteristics of the water. The pattern of the Hyperion re-sponse is maintained with differences in the season; howeverit is also the same with the in situ spectroradiometer.
Figure 19 Comparison of different sites between EO-1 (Sep. 2002) and spectroradiometer.
74 I. Abou El-Magd, A. El-Zeiny

Author's personal copy
4. Discussion
Hyperspectral remote sensing is currently showing high poten-tial in studying water quality. This has challenged us for using
such technology to characterize the coastal water betweenDamietta and Port Saeid in the Mediterranean Sea. It wasanticipated to use an airborne hyperspectral data for this re-
search using the local HySpx camera, however, the lack ofobtaining this dataset limited the complete synergy betweenthe in situ measurements and the airborne hyperspectral. Thisleads to rely on using the archived hyperspectral data of Hype-
rion. Both in situ measurements using spectroradiometer andwater quality multi-probe sensor (Manta2) were integrated tomap and characterize the water quality of the study area.
The dynamic interaction between the fresh water flow fromLake Manzala to the marine Coastal water of the Mediterra-nean Sea via the outlets was clearly recognized via plumes at
the mouths of these outlets. These plumes are reflecting andsubjected to the changes in the water characteristics or/andquality including turbidity, total nitrogen, total phosphorus
as well as phytoplankton content. The spectral response ofthe water at the outlets is quite different from other samplingsites showing high level of turbidity reaching up to 65 (NTU)and high level of phytoplankton reaching up to 147 lg/l. Forexample, the turbidity level and the conductivity were higherin the marine coastal water particularly at Ras El Bar siterather than the fresh water of Lake Manzala. At the same time
chlorophyll-a reached up to 147 mg/l given high reflectance inthe visible and near infrared radiation.
The in situ spectroradiometer measurements enabled gener-
ation of spectral library of the water characteristics in the areaof study. When overlaid on the Hyperion data, however it isarchived, it showed some similarities and differences in both
magnitude and pattern of reflectance curve. This is due tomany factors including the difference in the timing of captur-ing both datasets and the environmental conditions at the timeof collecting both datasets. Nevertheless, some similar pattern
was recognized in the red edge and near infrared spectrumregion. This research enabled to build baseline of technicaland scientific capacity in this area of research that aimed to
be strengthened via the continuation of a similar research.There are few learning lessons that are supposed to guide usin planning of data collection as well as obtaining precise
outcomes.
5. Conclusion
Coastal water is a dynamic environment that requires regularmonitoring for precise assessment. The dynamic changes ofland use and land cover in this area, indeed, influence the char-acteristics of water. For example the large development of fish
farms, that reached up 182 km2 in the area of study, that usechemical food to increase the growth of fish, indeed, createspressure on the coastal water by inflow of water highly concen-
trated with total phosphorus and nitrogen. The same of thehuge fertilizers waste from the agriculture drains influencethe water quality which shown in high flourish of phytoplank-
ton. The area of study, as part of the coastal zone, is attractinglocal inhabitants for urbanization that reach up to 76 km2,which discharge the human waste that also create pressure
on the coastal water quality.
To monitor this area earth observation of remote sensing isshowing potential for regular monitoring and assessment.Hyperspectral images are showing high potential in such re-
search with limited calibration from in situ measurements.However, the hyperspectral data were not up-to-date, theknowledge and capacity of using such dataset were developed
for future research and implementation. For further consolida-tion, there is a need for an accurate plan to capture airbornehyperspectral data at the same time of in situ measurements
to precisely validate the data and establish the model for waterquality monitoring.
Acknowledgments
The authors acknowledge the national authority for remote
sensing and space sciences (NARSS) for sponsoring this re-search under the umbrella of research and development frame-work of the fiscal year 2011–2012.
References
Abou El-Magd, I., Hermas, E., 2010. Human impact on the coastal
landforms in the area between Gamasa and Kitchner Drains,
Northern Nile Delta, Egypt. J. Coastal Res. 26, 3.
El Banna, M., 2007. Erosion and accretion rates and their associated
sediment characters along as El Bar coast, northeast Nile Delta,
Egypt. Environ. Geol. 52, 41–49.
El-Asmar, H., Hereher, M., 2010. Change detection of the coastal
zone east of the Nile Delta using remote sensing. Environ. Earth
Sci.. http://dx.doi.org/10.1007/s12665-010-0564-9.
El-Zeiny, A., 2010. Monitoring and Evaluation of some Pollutants at
New Damietta – Damietta – Egypt (M.Sc. thesis). Damietta, Fac.
Of Sci. Mans. Univ.
Farooq, S., 2011. Spectral reflectance of land covers, Department of
Geology, Aligahr Muslim University. <http://www.cps-amu.org/
sf/notes/m1r-1-8.htm>.
Frihy, O., Debes, A.E., El Sayed, W.R., 2003. Processes reshaping the
Nile delta promontories of Egypt: pre- and post-protection.
Geomorphology 53, 263–279.
Froidefond, J., Gardel, L., Guiral, D., Parra, M., Ternon, J., 2002.
Spectral remote sensing reflectances of coastal waters in French
Guiana under the Amazon influence. Remote Sens. Environ. 80,
225–232.
Gitelson, A.A., 1992. The peak near 700 nm on radiance spectra of
algae and water: relationships of its magnitude and position with
chlorophyll concentration. Int. J. Remote Sens. 13, 3367–3373.
Gons, H.J., Auer, M.T., Effler, S.W., 2008. MERIS satellite
chlorophyll mapping of oligotrophic and eutrophic waters in the
Laurentian Great Lakes. Remote Sens. Environ. 112, 4098–4106.
Hakvoort, H., deHaan, J., Jordans, R., Vos, R., Peters, S., Rijkeboer,
M., 2002. Towards airborne remote sensing of water quality in the
Netherlands-validation and error analysis. J. Photogr. Remote
Sens. 57, 171–183.
Hereher, M., 2009. Inventory of agricultural land area of Egypt using
MODIS data. Egypt. J. Remote Sens. Space Sci. 12.
Koponen, S., Pulliainen, J., Kallio, K., Hallikainen, M., 2002. Lake
water quality classification with airborne hyperspectral spectrom-
eter and simulated MERIS data. Remote Sens. Environ. 79, 51–59.
Li, L., Sengpiel, R.E., Pascual, D.L., Tedesco, L.P., Wilson, J.S.,
Soyeux, E., 2010. Using hyperspectral remote sensing to estimate
chlorophyll-a and phycocyanin in a mesotrophic reservoir. Int. J.
Remote Sens. 31 (15), 4147–4162.
Malthus, T.J., Dekker, A.G., 1994. First derivative indices for
the remote sensing of inland water quality using high spectral
Hyperspectral analysis for characterization of the coastal water 75

Author's personal copy
resolution reflectance. Environ. Int. Photogrammetric Eng. Remote
Sens. 49, 219–229.
Moses, W.J., Gitelson, A.A., Berdnikov, S., Saprygin, V., Povazhnyi,
V., 2012. Operational MERIS based NIR-red algorithms for
estimating chlorophyll-a concentrations in coastal waters––the
Azov Sea case study. Remote Sens. Environ. 121, 118–124.
Nayak, 2002. Use of satellite data in coastal mapping. Indian
Cartographer 22, 147–156.
Nechad, B., Ruddick, K.G., Park, Y., 2010. Calibration and validation
of a generic multisensory algorithm for mapping of total suspended
matter in turbid waters. Remote Sens. Environ. 114, 854–866.
Polliainen, J., Kallio, K., Eloheimo, K., Koponen, S., Servomaa, H.,
Hannonen, T., 2001. A semioperational approach to water quality
retrieval from remote sensing data. Sci. Total Environ. 268, 79–93.
Sestini, G., 1992. Implications of climatic changes for the Nile Delta.
In: Jeftic, L., Milliman, D., Sestini, G. (Eds.), Climatic Change and
the Mediterranean, vol. 1. Arnold, London, pp. 535-601.
Smith, R.B., 2001b. Introduction to remote sensing of the environ-
ment. <www.microimages.com> (accessed 24.03.2006).
Song, K., Li, Lin, Tedesco, Lenore P., Li, Shuai, Clercin, Nicolas A.,
Hall, Bob E., Li, Zuchuan, Shi, Kun, 2012. Hyperspectral
determination of eutrophication for a water supply source via
genetic algorithm-partial least squares (GA–PLS) modeling. Sci.
Total Environ. 426, 220–232.
Stumpf, R.P., 2001. Applications of satellite ocean color sensors for
monitoring and predicting harmful algal blooms. Hum. Ecol. Risk
Assess. 7, 1363–1368.
Thiemann, S., Kaufmann, H., 2002. Lake water quality moni-toring
using hyperspectral airborn data – a semiempirical multisen-sor
and multitemporal approach for the Mecklenburg Lake District,
Germany. Remote Sens. Environ. 81, 228–237.
Tilley, D.R., Ahmed, M., Son, J.H., Badrinarayanan, H., 2003.
Hyperspectral reflectance of emergent macrophytes as an indicator
of water column ammonia in an oligohaline, subtropical marsh.
Eco. Eng. 21, 153–163.
Vos, R., Hakvoort, J., Jordans, R., Ibelings, B., 2003. Multiplatform
optical monitoring of eutrophication in tempo-rally and spatially
variable lakes. Sci. Total Environ. 312, 221–243.
76 I. Abou El-Magd, A. El-Zeiny