
Quantitative assessment of the shelf life of ozonated apple juice
27
Dublin Institute of Technology ARROW@DIT Articles School of Food Science and Environmental Health 3-1-2011 Quantitative Assessment of the Shelf-Life of Ozonated Apple Juice S. Patil Dublin Institute of Technology Vasilis Valdramidis University College Dublin, [email protected] Brijesh Tiwari Manchester Metropolitan University P J. Cullen Dublin Institute of Technology, [email protected] Paula Bourke Dublin Institute of Technology, [email protected] This Article is brought to you for free and open access by the School of Food Science and Environmental Health at ARROW@DIT. It has been accepted for inclusion in Articles by an authorized administrator of ARROW@DIT. For more information, please contact [email protected]. Recommended Citation Patil S., Valdramidis V.P., Tiwari, B.K., Cullen P.J., Bourke P. (2011). Quantitative assessment of the shelf-life of ozonated apple juice. European Food Research and Technology, 232(3), 469-477.
-
Upload
independent -
Category
Documents
-
view
2 -
download
0
Transcript of Quantitative assessment of the shelf life of ozonated apple juice
Dublin Institute of TechnologyARROW@DIT
Articles School of Food Science and EnvironmentalHealth
3-1-2011
Quantitative Assessment of the Shelf-Life ofOzonated Apple JuiceS. PatilDublin Institute of Technology
Vasilis ValdramidisUniversity College Dublin, [email protected]
Brijesh TiwariManchester Metropolitan University
P J. CullenDublin Institute of Technology, [email protected]
Paula BourkeDublin Institute of Technology, [email protected]
This Article is brought to you for free and open access by the School ofFood Science and Environmental Health at ARROW@DIT. It has beenaccepted for inclusion in Articles by an authorized administrator ofARROW@DIT. For more information, please [email protected].
Recommended CitationPatil S., Valdramidis V.P., Tiwari, B.K., Cullen P.J., Bourke P. (2011). Quantitative assessment of the shelf-life of ozonated apple juice.European Food Research and Technology, 232(3), 469-477.
Antenna & High Frequency Research Centre
Articles
Dublin Institute of Technology Year
Quantitative assessment of the shelf-life
of ozonated apple juice
Sonal Patil Vasilis Valdramidis Brijesh K. [email protected]
PJ Cullen Paula Bourke
This paper is posted at ARROW@DIT.
http://arrow.dit.ie/ahfrcart/1
— Use Licence —
Attribution-NonCommercial-ShareAlike 1.0
You are free:
• to copy, distribute, display, and perform the work
• to make derivative works
Under the following conditions:
• Attribution.You must give the original author credit.
• Non-Commercial.You may not use this work for commercial purposes.
• Share Alike.If you alter, transform, or build upon this work, you may distribute theresulting work only under a license identical to this one.
For any reuse or distribution, you must make clear to others the license termsof this work. Any of these conditions can be waived if you get permission fromthe author.
Your fair use and other rights are in no way affected by the above.
This work is licensed under the Creative Commons Attribution-NonCommercial-ShareAlike License. To view a copy of this license, visit:
• URL (human-readable summary):http://creativecommons.org/licenses/by-nc-sa/1.0/
• URL (legal code):http://creativecommons.org/worldwide/uk/translated-license

Quantitative assessment of the shelf-life of ozonated apple juice 1
2
3
4
5
6
7
8
9
10
11
12
13
14
15
16
17
18
19
20
21
22
23
24
S. Patil1, V.P. Valdramidis2*, B.K. Tiwari3, P.J. Cullen1, P. Bourke1
1School of Food Science and Environmental Health, Dublin Institute of Technology,
Cathal Brugha Street, Dublin 1, Ireland
2 Biosystems Engineering UCD School of Agriculture, Food Science and Veterinary Medicine University
College Dublin Belfield, Dublin 4, IRELAND
3Department of Food & Tourism Management, Manchester Metropolitan University, Manchester, M14
6HR, UK
25
26
27
* Corresponding author. Tel: +353-876331281; E-mail: [email protected]
1

Abstract 28
29
30
31
32
33
34
35
36
37
38
39
40
41
42
43
44
45
46
47
48
49
50
Sterile apple juice inoculated with S. cerevisiae ATCC 9763 (103 CFU/mL) was
processed in a bubble column with gaseous ozone of flow rate of 0.12 L/min and
concentration of 33-40 µg/mL for 8 min. The growth kinetics of S. cerevisiae as an
indicator of juice spoilage was monitored at 4, 8, 12 and 16 ºC for up to 30 days. The
kinetics were quantitatively described by the primary model of Baranyi and Robert’s and
the maximum specific growth rate was further modeled as a function of temperature by
the Ratkowsky type model. The developed model was successfully validated for the
microbial growth of control and ozonated samples during dynamic storage temperature of
periodic changes from 4 to 16 °C. Two more characteristic parameters were also
evaluated, the time of spoilage of the product under static temperature conditions and the
temperature quotient, Q10. At lower static storage temperature (4 ºC) no spoilage occurred
either for unprocessed or ozone processed apple juice. In the case of ozone processed
apple juice, the shelf life was increased when compared with the controls and the Q10 was
found to be 7.17, which appear much higher than that of the controls, indicating the
effectiveness of ozonation for the extension of shelf-life of apple juice.
Keywords: yeast, ozone, apple juice, shelf-life, dynamic modeling
2

1. Introduction 51
52
53
54
55
56
57
58
59
60
61
62
63
64
65
66
67
68
69
70
71
72
73
Acidic products such as fruit juices contain substantial amounts of fermentable sugars.
Spoilage of fruit and vegetable juices is primarily due to the proliferation of its natural
acid tolerant and osmophilic micro flora [1]. Yeasts, lactic acid bacteria and moulds may
account for the fermented taste, production of the carbon dioxide and the buttermilk off-
flavour production, as well as the spoilage of juices [2]. Yeasts predominate in spoilage
of acid food products as they have the ability to grow at low pH, high sugar concentration
and low water activity conditions and resist inactivation by heat processing which enables
them to survive or grow in fruit or fruit products [3, 4]. Fruit juices are generally rich in
simple carbohydrates and complex nitrogen sources, and hence are ideal substrates for
yeasts. More than 110 species of yeasts have been listed as associated with food and food
products, of which large proportions occur on fruits, and more than 40 are associated with
soft drinks [5]. The contamination of fruit juices with yeasts is normally indicative of
highly contaminated raw materials, failure in fruit juice pasteurization, in sanitation
practices or the presence of preservative resistant yeasts [6].
Saccharomyces cerevisiae is one of the most important yeasts causing spoilage of fruit
juices and soft drinks [5, 7-9] and can be considered as shelf-life indicator [10, 11].
Several authors reported that fruit juice concentrates, fruit pulps, packaged fruit juices
and soft drinks are particularly prone to fermentative spoilage with S. cerevisiae, S.
bayanus and to a lesser extent S. pastoranious [4, 12-18]. Therefore, numerous heat
inactivation studies have been conducted with S. cerevisiae because of its significance in
the spoilage of heat pasteurized fruit juices and carbonated beverages [8, 17, 19].
Fermentation of sugars such as glucose, fructose, and sucrose is the principal spoilage
3

reaction of Saccharomyces species. Growth of yeasts is usually accompanied by
formation of carbon dioxide and alcohol. Carbon dioxide gives the product a gassy,
frothy appearance and causes a packaged product to swell and explode. In addition, the
products develop a distinctive alcoholic, fermentative smell and taste [20]. Spoilage of
fruit juice makes it unacceptable for human consumption.
74
75
76
77
78
79
80
81
82
83
84
85
86
87
88
89
90
91
92
93
94
95
96
Heat treatment is the most widely used method for preservation of fruit and vegetable
juices due to its effectiveness in microbial inactivation [21] although it has certain
disadvantages for nutritional and organoleptic values [22, 23]. There is consumer demand
for a wider range of less heavily processed foods of improved quality with longer shelf-
life and negligible changes in the organoleptic and nutritional values. This has enhanced
interest in non-thermal technologies which could be effective on the inactivation of the
undesired microorganisms [24].
Alternatives to thermal pasteurization such as ozone treatment are under investigation for
potential application in fruit juice preservation. Apple juice (or apple cider in North
America) is one of these products which is consumed by people of all ages for its sensory
and nutritional qualities. The FDA’s approval of ozone as a direct additive to food in
2001 triggered interest in ozone applications development, and industry guidelines for
apple juice and cider were published by the USFDA in 2004, which also highlighted gaps
in the scientific knowledge [25].
Ozone is a powerful antimicrobial agent due to its potential oxidizing capacity and it
appears to be active against bacteria, fungi, viruses, protozoa, as well as bacterial and
fungal spores [26, 27]. Ozone destroys microorganisms by progressive oxidation of vital
cellular components. Oxidation reactions are caused by either dissolved molecular ozone
4
97
98
99
100
101
102
103
104
105
106
107
108
109
110
111
112
113
114
115
116
117
118
119
or free radical species formed during auto-decomposition of ozone [28]. Activated
oxygen species resulting from ozone decomposition include singlet oxygen, hydroxyl
radical, superoxide anion (perhydroxyl radical at low pH) and hydrogen peroxide which
elicit potent cidal activity against a broad-spectrum of microorganisms [29].
The objective of this study was to investigate the effect of ozone as a non-thermal
treatment to extend the shelf life of an apple juice system. Modeling approaches that
describe the growth dynamics of S. cerevisiae in previously inoculated ozone processed
apple juice under static (isothermal) and dynamic storage temperature conditions are also
developed in order to quantitatively assess the effect of ozonation on the shelf life of the
product.
2 Materials and Methods
2.1 Yeast strain and growth conditions
S. cerevisiae ATCC 9763 was obtained from microbiology stock culture of the School of
Food Science and Environmental Health of the Dublin Institute of Technology, Dublin,
Ireland. This strain was maintained as frozen stock at -70 ºC in the form of protective
beads, which were plated onto potato dextrose agar (PDA, Scharlau Chemie) and
incubated at 30 ºC for 48 h to obtain single colonies before storage at 4 ºC. Working
cultures were prepared by inoculating a single colony into malt extract broth (MEB,
Scharlau Chemie) and incubating at 30 ºC for 24 h.
2.2 Apple juice inoculation
S. cerevisiae cells grown for 24 h were harvested by centrifugation (SIGMA 2K15,
Bench Top Refrigerated Ultracentrifuge, AGB scientific LTD) at 10,000 rpm for 10min
at 4 ºC. The cell pellet was suspended in sterile phosphate buffered saline (PBS, Oxoid
5
120
121
122
123
124
125
126
127
128
129
130
131
132
133
134
135
136
137
138
139
140
141
142
LTD, UK) re-centrifuged twice as described above. Finally, after two washes with PBS,
the cell pellet was re-suspended in PBS and the yeast density was determined by
measuring absorbance at 550 nm using McFarland standard (BioMérieux, Marcy -
l'Etoile, France).
Sterile, commercially prepared apple juice was obtained from a local retailer. This juice
was chosen as a food system that could serve for performing controlled microbial
experiments (e.g., [10, 30, 31]). The inoculum was then diluted in the juice to obtain
approximately 106 CFU/mL. For each investigation, the cell concentration was further
diluted in apple juice to yield a final working concentration of 103 CFU/mL. The
inoculated apple juice with S. cerevisiae sample was then processed with ozone.
Soluble solids content of untreated apple juice was measured using a hand held
refractometer (Bellingham and Stanley Ltd., UK). One drop of the juice was placed on
the refractometer glass prism and soluble solid content was obtained as Brix. The
measured °Brix was 11 ± 0.001. The pH of untreated product was measured using a pH
meter with a glass electrode (Orion Model, England) and was 3.23 ± 0.015. Titratable
acidity was determined by titrating 20 mL of the untreated apple juice sample diluted in
80 mL distilled water with 0.1N NaOH using phenolphthalein as an indicator. The
volume of NaOH was converted to g malic acid per 100 mL of juice. The measured
titratable acidity was 0.45 ± 0.009.
2.3 Ozone treatment
Ozone gas was generated using an ozone generator (Model OL80, Ozone services,
Canada, Fig. 1). Ozone was produced by a corona discharge generator. Pure oxygen was
supplied via an oxygen cylinder (Air Products Ltd., Dublin, Ireland) and the flow rate
6

143
144
145
146
147
148
149
150
151
152
153
154
155
156
157
158
159
160
161
162
163
164
165
was controlled using an oxygen flow regulator. Apple juice samples (90 mL) inoculated
with S. cerevisiae (103 CFU/mL) were processed in a 100 mL ozone bubble column with
a diameter of approximately 3.7 cm and height of around 21.7 cm. A previously
determined optimum flow rate of 0.12 L/min [32] with an ozone concentration of 33-40
µg/mL was applied for each treatment for 8 min at ambient temperature (15-18ºC) [33].
In that study quality (color, phenolic content) and microbial parameters (E. coli strains
ATCC 25922 and NCTC 12900) during ozone processing were assessed [33]. The ozone
concentration was recorded using an ozone analyzer. Excess ozone was destroyed by an
ozone destroyer unit. It should be mentioned that the apple juice contains large amount of
organic matter which does not permit measurement of dissolved ozone in the liquid phase
but also there was not any residual ozone effects as all ozone not targeting on the
microbial cells is consumed by the organic matter. All experiments were carried out in
duplicate.
2.4 Storage study
Storage studies were performed for the following three types of samples. Apple juice
inoculated with 103 CFU/mL served as an unprocessed control 1. The second sample was
the ozonated apple juice. Subsequently an unprocessed control 2 was prepared by
inoculating S. cerevisiae cells with an inoculum level of 101 CFU/mL in order to start
with a similar inoculum level that was attained after 8 min of ozone treatment.
2.4.1 Static storage temperature study (SST)
Unprocessed control samples of apple juice and ozone processed apple juice samples (45
mL each) were stored at constant temperatures of 4, 8, 12, and 16 °C respectively in
incubators (LMS cooled incubators, Lennox Laboratory Supplies, Dublin, Ireland) for a
7
166
167
168
169
170
171
172
173
174
175
176
177
178
179
180
181
182
183
184
185
186
187
period up to 30 days. Aliquots of unprocessed and processed samples were taken daily for
analysis.
2.4.2 Dynamic storage temperature study (DST)
For the DST study, unprocessed and processed apple juice samples were stored in an
incubator where the lowest and the highest temperatures were set to 4 and 16 °C. The
temperature was programmed to fluctuate according to a profile consisting of 4 °C for 12
h, followed by an increase of temperature from 4 to 16 °C and maintained at 16 °C for a
further 12 h. The actual temperature profiles were recorded every 10 min using a
temperature sensor connected to a data logger (Grant 1000 series Squirrel meter/data
logger, UK). This specific profile was chosen in order to create a scenario of temperature
abuse enhancing the microbial growth on which the developed modeling approaches
could be validated.
2.5 Microbiological analysis
Yeast populations were determined by plating onto PDA. Aliquots (1mL) were
withdrawn every day from ozone processed and unprocessed juice stored at each different
temperature, serially diluted in MRD and 0.1mL of appropriate dilutions were surface
plated on PDA in duplicate. Plates were incubated at 30 ºC for 48 h and colony forming
units were counted. Results were reported as Log10CFU/mL.
2.6 Microbial modeling
2.6.1 Parameter identification under static conditions
S. cerevisiae growth data in ozone processed apple juice stored under SST conditions
were fitted to the explicit version of the Baranyi, and Roberts [34] model (Eq.1-3).
8
Regression was performed by using the DMFit Excel add-in software, version
2.1(
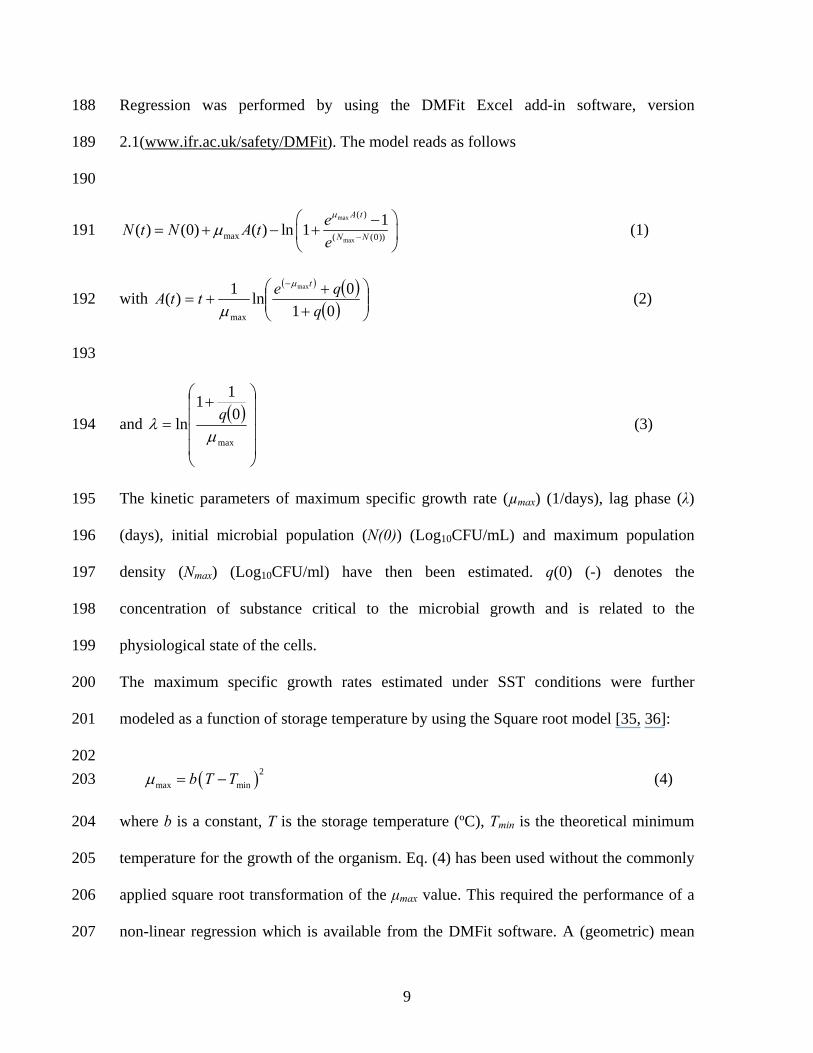
188
www.ifr.ac.uk/safety/DMFit). The model reads as follows 189
190
max
max
( )
max ( (0))
1( ) (0) ( ) ln 1A t
N N
eN t N A te
μ
μ −
⎛ ⎞−= + − +⎜
⎝ ⎠⎟191 (1)
with ( ) ( )
( ) ⎟⎟⎠
⎞⎜⎜⎝
⎛+
++=
−
010ln1)(
max
max qqettA
tμ
μ (2) 192
193
and ( )
⎟⎟⎟⎟
⎠
⎞
⎜⎜⎜⎜
⎝
⎛ +=
max
011
lnμ
λ q (3) 194
195
196
197
198
199
200
201
202 203
204
205
206
207
The kinetic parameters of maximum specific growth rate (µmax) (1/days), lag phase (λ)
(days), initial microbial population (N(0)) (Log10CFU/mL) and maximum population
density (Nmax) (Log10CFU/ml) have then been estimated. q(0) (-) denotes the
concentration of substance critical to the microbial growth and is related to the
physiological state of the cells.
The maximum specific growth rates estimated under SST conditions were further
modeled as a function of storage temperature by using the Square root model [35, 36]:
( )2
max minb T Tμ = − (4)
where b is a constant, T is the storage temperature (ºC), Tmin is the theoretical minimum
temperature for the growth of the organism. Eq. (4) has been used without the commonly
applied square root transformation of the μmax value. This required the performance of a
non-linear regression which is available from the DMFit software. A (geometric) mean
9

value for max0 *μλ=h for each of the experimental set-ups (Control 1, Control 2,
Ozonated) was estimated from the individual growth curves, considering that the
parameter is constant, independent of the storage temperature [34, 37, 38] and the fact
that the resulting ho was derived from the 3 levels of temperatures (refer to results). q(0)
is related to the parameter by the following equation [34]:
208
209
210
211
212
213
0h
( )0
0
10h
h
eqe
−
−
−= (5) 214
215
216
217
218
219
220
221
2.6.2 Model validation under dynamic storage temperature (DST) conditions
The validation of the yeast growth model was performed under DST conditions based on
the time temperature profile of apple juice samples during storage (control and ozone
processed), in conjunction with the square root model Eq. (4). The predictions were
performed with the differential equation of Baranyi and Roberts model (Eq. (6), (7)) in
which the Runge-Kutta method (ode23s, Matlab, The Mathworks) was applied for the
approximation of solutions of these ordinary differential equations:
( )( )( )2min
max
( ) ( ) ( )1( ) 1
dN t q t N tb T t T N tdt q t N
⎛ ⎞⎛ ⎞= − −⎜ ⎟⎜ ⎟+⎝ ⎠⎝ ⎠
( )222 (6)
( )( )( )2min
( ) ( )dq t b T t T q tdt
= − (7) 223
224
225
226
The root mean squared error (Eq. 8) [39] was used for evaluating the model fitting while
the accuracy and the bias factors presented by Baranyi et al. [40](Eq. 9, 10) were
considered in order to assess the prediction capability of the developed model.
RMSE = ( )
∑= −
−tn
i pt
prei
nnyy
1
2exp (8) 227
10

228
229
Where yexpi are experimental observations, ypre are model predictions, nt are number of
data points and np are number of estimated model parameters.
2
101
log log10
n
i ii
f
N NA
n
∧
=
⎛ ⎞−⎜ ⎟⎝ ⎠=
∑ (9) 230
10 101
log log10
n
i ii
f
N NB
n
∧
=
⎛ ⎞−⎜ ⎟⎝ ⎠=
∑ (10) 231
232
233
234
235
236
237
238
Where log10 is the predicted microbial load and n is the number of the experimental
measurements.
iN∧
2.6.3 Calculation of the Q10 value
The temperature quotient (Q10) was also calculated from the information obtained in
Section 2.6.1 (parameter identification under static conditions). Q10 shows the effect of
temperature on the shelf-life and it is given as follows [41, 42]:
0
10 0
shelf life at Cshelf life at ( 10 C)
TQT
=+
(11) 239
240
241
242
243
244
245
246
247
248
Observe that this parameter was developed for a zero order reaction when the influence
of temperature on the reaction rate is described by using the Arrhenius relationship [43].
Nevertheless this approach is proposed and applied for the current microbial kinetic study
as an alternative method to assess the efficacy of the ozonated juice.
This Q10 value can be easily calculated by performing a regression between the ln shelf
life (days) versus the temperature which yields a straight line. Consequently, Q10=exp
(10.k) with k the slope of the regression line. The estimation of the time of the shelf-life
(ts) was calculated considering that a microbial level > 106 CFU/mL resulted in a failure
11

249
250
251
252
253
254
255
256
257
258
259
260
261
262
263
264
265
266
267
268
269
270
271
(spoilage) of the product (see for similar examples in other products: Al-Kadamany, et al.
[44]). The shelf-life time, ts, was obtained by solving Eq. (1-3) (solve command in
Matlab, The Mathworks) for the estimated parameters of the two controls and the
ozonated growth kinetics when log N(ts) = 6 log(CFU/mL).
3 Results
The growth of S. cerevisiae in unprocessed and ozone processed apple juice was assessed
at SST conditions from 4 °C to 16 °C. Representative growth curves of the yeast
population are shown in Fig. 2. The initial inoculum of control 1 was similar to
previously reported levels of 103 CFU/mL [30, 45], while this level has also been
reported in sound apples [46]. Finally, Kisko et al. [47] recorded ca. 103 CFU/mL level of
S. cerevisiae in unprocessed apple juice. In the case of the unprocessed control samples 1
and 2 (i.e., initial inoculum level of 3.0 and 1.30 log CFU/mL, respectively) the lag phase
was not obvious when the juice was stored under high SST (12 °C and 16 °C) (Fig. 2a
and 2b). However, a typical growth pattern of S. cerevisiae was observed in the ozone
processed apple juice stored under SST of 12 °C and 16 °C, consisting of an initial lag
phase, an exponential growth phase followed by a stationary phase (Fig.2c).
The estimated kinetic parameters and statistical indices resulting from the regression of
the microbial data by the Baranyi and Roberts model are shown in Table 1. The values of
µmax and λ varied according to the storage temperature. The µmax of the unprocessed
control samples increased from 0. 35 log CFU /day to 1.23 log CFU /day and for ozone
processed apple juice increased from 0.275 log CFU /day to 1.270 log CFU /day with
increase of the temperature from 8 to 16 °C. However, the lag phase for ozone processed
apple juice was decreased from 15.07 days at 8 °C to 2.84 days at 16 °C. For both
12

unprocessed and ozone processed apple juice, the maximum population density (Nmax)
was found to be unaffected when stored under high SST (12 °C and 16 °C). The effect of
storage temperature on µmax was further modeled as a function of temperature by using
the secondary square root model. The estimated parameters of the model are shown in
Table 2. The model described satisfactorily the effect of temperature on the growth of S.
cerevisiae. The calculated value for the theoretical minimum temperature of growth in
ozone processed apple juice was 0.28 °C. The h0 values obtained for the static
environments studied were 0.336, 0.671 and 3.417 for unprocessed control 1,
unprocessed control 2 and ozone processed apple juice samples, respectively.
272
273
274
275
276
277
278
279
280
281
282
283
284
285
286
287
288
289
290
291
292
293
The model developed under SST conditions was validated under DST conditions by
using a periodically changing temperature profile and performing predictions with Eq. (6)
and (7). As the maximum population density was independent of the applied storage
temperature it was fixed at 7.5 logs CFU/mL (average of Nmax estimated during
isothermal conditions for which microbial stationary phase was reached). For the initial
concentration N(0), a nominal value was taken from the measured plate count result, i.e.,
3.02 (for control 1), 1.32 (for control 2), 1.24 (for ozonated) log (CFU/mL). Finally, the
nominal values for q(0) were 2.49, 1.05 and 0.03 for control 1, control 2 and ozonated
apple juice respectively, calculated using Eq.(5) and after estimation of the ho from the
parameters derived under static environmental conditions. The comparison between the
predicted and observed growth of S. cerevisiae in unprocessed apple juice and ozone
processed apple juice samples are shown in Fig. 3. The performance of the model was
evaluated statistically by the calculation of the bias (Bf) and accuracy (Af) factors.
13

Two more characteristic parameters were evaluated, the Q10 and the time of spoilage of
the product under SST conditions (Fig. 4). At the lowest SST (4 ºC) no spoilage occurred
either for unprocessed or ozone processed apple juice. However, with the higher SST’s
used product spoilage was observed in 9.45, 3.78, and 2.35 days for unprocessed control
1 at 8, 12 and 16 ºC, respectively. For unprocessed control 2, the spoilage occured after
15.08, 6.30 and 4.29 days at 8, 12 and 16 ºC respectively. In the case of ozone processed
apple juice, the shelf life was increased when compared with both type of controls and
resulted in 34.26, 10.34 and 7.08 days at 8, 12 and 16 ºC, respectively. Finally the Q10
was found to be 7.17 in the case of ozonated juice. This was much higher than that
obtained for the controls, i.e., 5.68, 4.81, indicating the effectiveness of ozonation for
extension of the shelf-life of apple juice.
294
295
296
297
298
299
300
301
302
303
304
305
306
307
308
309
310
311
312
313
314
315
316
4. Discussion
The results of the present study showed that S. cerevisiae ATCC 9763 is able to grow in
apple juice stored within a temperature range of 8 to 16 ºC. The Baranyi, and Roberts
model as well as the square root model described the growth of yeast populations in
unprocessed and ozone processed apple juice. Based on the static data, a new model was
developed that described the growth of S. cerevisiae population well in unprocessed and
ozone processed apple juice under dynamic conditions that simulated a storage
temperature abuse. At the lower SST’s (4 and 8 ºC), the longer lag phase indicates that
the yeast population needed longer time to adapt to the environment. However, at higher
storage temperatures this effect was not evident, indicating the ability of yeasts to grow at
these temperatures with a reduced or seemingly absent lag time. By comparison, in the
case of ozone processed apple juice stored at 8, 12 or 16 ºC, the lag phase (λ) was
14
increased, indicating the effect of temperature and applied ozone stress on growth of S.
cerevisiae populations. Panagou et al. [10] reported a very short lag phase in different
pasteurized fruit juices even at the lowest storage temperatures, suggesting that
inoculated yeasts’ adaptation time was unaffected by these temperatures (4, 8, 12 and16
ºC) . However, in this study a lag phase was observed for all ozone processed samples.
This could be due to the oxidizing action of the applied ozone treatment, which may exert
additional stress prior to allowing growth. Ozone has been reported to inactivate cytosolic
enzymes, with the most drastic inactivation for glyceraldehyde 3 phosphate
dehydrogenase and to lesser extent to other cytosolic enzymes. It also affects the quantity
of ATP and other nucleoside triphosphates, reducing to about 50% of its initial level [48].
317
318
319
320
321
322
323
324
325
326
327
328
329
330
331
332
333
334
335
336
337
338
The performance of the developed model was validated under dynamic conditions. Ross
et al. [49] reported that predictive models should ideally have an Af and Bf = 1.00,
indicating a perfect model fit where the predicted and actual response values are equal
and satisfactory. Bf limits are more difficult to define because limits of acceptability are
related to the specific application of the model. Ranges of 0.6-3.99 have been reported for
the growth pathogen and spoilage microorganisms when compared with independent
published data [49]. The values of Bf and Af indicated good agreement between observed
data and predicted data points. Nevertheless, in the case of Control 2 some discrepancy
was evident (Table 3). This could be attributed to the effect of the inoculum size on the
microbial adaptation phenomena. This observation may require further evaluation of the
inoculum size effects which could elucidate if different values of h0 should be considered
for each of the performed microbial predictions.
15
339
340
341
342
343
344
345
346
347
348
349
350
351
352
353
354
355
356
357
358
359
360
361
Different technologies have been applied for inhibiting the growth of spoilage
microorganism in fruit juices. Patrignani et al. [30] evaluated the potential of high
pressure homogenization (HPH) for inactivation of S. cerevisiae 635 inoculated in apricot
and carrot juice and its shelf life extension. Four or more repeated passes at 100 MPa of
HPH to the apricot juice samples inoculated at a level of 3 log10 CFU/mL showed that S.
cerevisiae population remained under the detection limit at least up to 144 h at 25 ºC. For
carrot juice samples subjected to five or more repeated HPH passes, the S. cerevisiae cell
load was lower than 5 log10 CFU/mL after 144 h at 25 ºC. However, refrigerated storage
(4 ºC) indicated satisfactory extension of shelf life of HPH processed juices. Qin et al.
[50] reported over 3 weeks extension of standard shelf life of pulsed electric field (PEF)
processed apple juice when stored at 4 ºC and 25 ºC. Ferrentino et al. [51] concluded that
high pressure carbon dioxide (HPCD) treatment proved to be a promising alternative
technique yielding juices with fresh-like characteristics and extension of shelf life with
safety. Suarez-Jacobo et al. [52] reported the efficacy of ultra high pressure
homogenization to develop fresh apple juice with an equivalent shelf life to pasteurized
apple juice with respect to the microbiological characteristics. Valdramidis et al. [53]
observed that no spoilage of apple juice was evident at storage temperatures of 4, 8 and
12 ºC for 36 days after treatment with high hydrostatic pressure at 500 MPa and 550
MPa. From the present work it is evident that ozone is another non thermal technology
which can be employed for extending the shelf life of apple juice. The present results
proved an increase of the shelf-life of the ozonated product that varied between 2.79 to
24.81 days depending on the storage temperatures when compared with the control
samples.
16
362
363
364
365
366
367
368
369
370
371
372
373
374
375
376
377
378
379
380
381
382
Validation of the developed modeling approaches will be expanded based on the
suggestions by Pin et al. [54]. More specifically, kinetic data that come from competition
of inoculated S. cerevisiae, pathogenic microorganism with a naturally occurring
microflora of fresh apple juice will be incorporated in future model developments while
comparative studies between ozonated and other treated technologies will be applied.
This will permit the application of this model to apple juice products with different
properties. Further studies will focus on defining the failure (spoilage) of processed apple
juice based on the effect of ozone on additional to previously reported quality parameters
(e.g., color, phenolic content) [33] including volatiles responsible for flavor, odour and
sensory evaluation. Effect of the different inoculums levels on the microbial adaptation
phenomena will also be assessed to interpret possible modeling discrepancies.
Acknowledgement
Funding for this research was provided under the National Development Plan 2000-2006,
through the Food Institutional Research Measure, administered by the Department of
Agriculture, Fisheries & Food, Ireland.
References
1. Tahiri I, Makhlouf J, Paquin P, Fliss I (2006) Inactivation of food spoilage bacteria and
Escherichia coli O157:H7 in phosphate buffer and orange juice using dynamic high
pressure. Food Res Int 39:98–105
2. Tournas VH, Heeres J, Burgess L (2006) Moulds and yeasts in fruit salads and fruit
juices. Food Microbiol 23:684–688
17

383
384
385
386
387
388
389
390
391
392
393
394
395
396
397
398
399
400
401
402
403
404
405
3. Put HMC, De Jong J (1980) The heat resistance of selected yeast causing spoilage of
canned soft drinks and fruit products In: Skinner FA, Passmore SM, Davenport RR (eds.),
Biology and Activities of Yeasts (pp 181-214). Academic Press, London
4. Stratford M, Hofman PD, Cole MB (2000) Fruit juice, fruit drinks and soft drinks In:
Lund BM, Baird-Parker TC, Gould GW (eds.), The Microbiological Safety and Quality
of Food (pp 836-869). Aspen publishers, Gaithersberg, MD
5. Barnett JA, Payne RW, Yarrow D (2000) Yeast Characteristics and identification (3rd
ed.) Cambridge University Press, Cambridge
6. Lima Tribst AA, de Souza Sant’Ana A, de Massaguer PR (2009) Review:
Microbiological quality and safety of fruit juices- past, present and future perspectives.
Crit Rev Microbiol 35(4):310-339
7. Deak T, Beuchat LR (1996). Handbook of food spoilage yeasts. CRC press Boca
Raton FL
8. Fleet GH (1992) Spoilage yeasts. Crit rev Biotechnol 12:1-44
9. Pitt JI, Hocking AD (1997) Fungi and food spoilage, 2nd edn. Aspen Publishers,
Gaithersburg, MD
10. Panagou EZ, Karathanassi S, Le Marc Y, Nychas, GJE (2009) Development of a
product specific model for spoilage of pasteurized fruit juices by Saccharomyces
cerevisiae and validation under dynamic temperature conditions. Predictive Modelling in
Foods. September 8–12, Washington DC, USA (2009), (CDROM)
11. Valverde MT, Marín-Iniesta F, Calvo L (2010) Inactivation of Saccharomyces
cerevisiae in conference pear with high pressure carbon dioxide and effects on pear
quality. J Food Eng 98:421-428
18

406
407
408
409
410
411
412
413
414
415
416
417
418
419
420
421
422
423
424
425
426
427
12. Arias CR, Burns JK, Friedrich LM, Goodrich RH, Parish ME (2002) Yeast species
associated with orange juice: evaluation of identification methods. Appl Environ
Microbiol 68:1955-1961
13. Deak T, Beuchat LR (1993a) Yeasts associated with fruit juice concentrates. J Food
Prot 56: 777-782
14. Deak T, Beuchat LR (1993b) Comparison of SIM API 20C and ID32C systems for
identification of yeasts from fruit juice concentrates and beverages. J Food Prot 56:585-
592
15. Las Heras-Vazquez FJL, Mingorance-Cazorla L, Clemente-Jimenez, JF, Rodriguez-
Vico F (2003) Identification of yeast species from orange fruit and juice by RFLP and
sequence analysis of the 58S r RNA gene and two internal transcribed spacers. FEMS
Yeast Res 3:3-9
16. Sancho T, Gimenez-Jurado G, Malfeito-Ferreira M, Loureiro V (2000) Zymological
indicators: a new concept applied to the detection of potential spoilage yeast species
associated with fruit pulps and concentrates. Food Microbiol 17:613-624
17. Thomas S (1993) Yeasts as spoilage organisms in beverages In: Rose AH, Harrison
JS (eds.), The Yeasts, volume 5, 2nd edition, (pp 517-561). Academic press, London
18. Torok T, King AD (1991) Comparative study on the identification of foodborne
yeasts. Appl Environ Microbiol 57:1207-1212
19. Stratford M, James SA (2003) Non-alcoholic beverages and yeasts In: Boekhout T,
Robert V (eds.), Yeasts in Food: Beneficial and Detrimental Aspects, (pp 309-345).
Behr’s-Verlag, Germany
19
20. Fleet GH (2006) Saccharomyces and related genera In: Clive de W Blackburn (ed),
Food Spoilage Microorganisms (pp. 306-335). CRC press, England
428
429
430
431
432
433
434
435
436
437
438
439
440
441
442
443
444
445
446
447
448
21. Tribst AAL, Franchi MA, Cristianini M (2008) Ultra-high pressure homogenization
treatment combined with lysozyme for controlling Lactobacillus brevis contamination in
model system. Innov Food Sci Emerg Technol 9:265–271
22. Pathanibul P, Taylor TM, Davidson PM, Harte F (2009) Inactivation of Escherichia
coli and Listeria innocua in apple and carrot juices using high pressure homogenization
and nisin. Int J Food Microbiol 129:316–320
23. Vachon JF, Kheadr EE, Giasson J, Paquin P, Fliss I (2002) Inactivation of foodborne
pathogens in milk using dynamic high pressure. Journal of Food Prot 65:345–352
24. Diels AMJ, Callewaert L, Wuytack EY, Masschalck B, Michiels CW (2005)
Inactivation of Escherichia coli by high-pressure homogenisation is influenced by fluid
viscosity but not by water activity and product composition. Int J Food Microbiol
101:281–291
25. US Food and Drug Administration (USFDA) (2004) FDA Guidance to Industry,
2004: Recommendations to Processors of Apple Juice or Cider on the Use of Ozone for
Pathogen Reduction Purposes. Available online:
http://www.fda.gov/Food/GuidanceComplianceRegulatoryInformation/GuidanceDocume
nts/Juice/ucm072524.htm (Accessed 5 July 2010)
26. Khadre MA, Yousef AE, Kim JG (2001) Microbiological aspects of ozone
applications in food: A review. J Food Sci 66(9):1241-1252
20

27. Cullen PJ, Valdramidis VP, Tiwari BK, Patil S, Bourke, P, O'Donnell CP (2010)
Ozone Processing For Food Preservation: An Overview on Fruit Juice Treatments.
Ozone: Sci Eng 32(3):166-179
449
450
451
452
453
454
455
456
457
458
459
460
461
462
463
464
465
466
467
468
469
470
28. Hunt NK, Marinas BJ (1997) Kinetics of Escherichia coli inactivation with ozone.
Water Res 31:1355-1362
29. Korycka-Dahl M, Richardson T (1978) Activated oxygen species and oxidation of
food constituents. Crit Rev Food Sci Nutr 10:209-241
30. Patrignani F, Vannini L, Kamdem SLS, Lanciotti R, Guerzoni ME (2009) Effect of
high pressure homogenization on Saccharomyces cerevisiae inactivation and physico-
chemical features in apricot and carrot juices. Int J Food Microbiol 136(1):26-31
31. Mosqueda-Melgar J, Raybaudi-Massilia RM, Martín-Belloso O (2008) Combination
of high-intensity pulsed electric fields with natural antimicrobials to inactivate pathogenic
microorganisms and extend the shelf-life of melon and watermelon juices. Food
Microbiology 25:479-491
32. Patil S, Cullen PJ, Kelly B, Frias JM, Bourke P (2009) Extrinsic control parameters
for ozone inactivation of Escherichia coli using ozone bubble column. J Appl Microbiol
107(3):830-837
33. Patil S, Torres B, Tiwari BK, Wijngaard HH, Bourke P, Cullen PJ, O’Donnell CP,
Valdarmidis VP (2010) Safety and quality assessment during the ozonation of cloudy
apple juice. J Food Sci 75(7):M437-M443
34. Baranyi J, Roberts TA (1994) A dynamic approach to predicting bacterial growth in
food. Int J Food Microbiol 23:277-294
21

471
472
473
474
475
476
477
478
479
480
481
482
483
484
485
486
487
488
489
490
491
492
493
35. Ratkowsky DA, Olley J, McMeekin TA, Ball A (1982) Relationship between
temperature and growth-rate of bacterial cultures. J Bacteriol 149:1-5
36. Ratkowsky DA, Lowry RK, McMeekin TA, Stokes AN, Chandler RE (1983) Model
for bacterial cultures growth rate throughout the entire biokinetic temperature range. J
Bacteriol 154:1222-1226
37. Fu B, Taoukis PS, Labuza TP (1991) Predictive microbiology for monitoring
spoilage of dairy products with time-temeprature indicators. J Food Sci 56:1209-1215
38. Le Marc Y, Valik L, Medved’ova A (2009) Modelling the effect of the starting
culture on the growth of Staphylococcus aureus in milk. Int J Food Microbiol 129:306-
311
39. Neter, Wasserman, Whitmore (1992) Applied statistics, 4th edn. (pp. 1-989). Prentice
hall, Englewood cliffs, NJ
40. Baranyi J, Pin C, Ross T (1999) Validating and comparing predictive models. Int J
Food Microbiol 48:159-166
41. Duyvesteyn WS, Shimoni E, Labuza TP (2001) Determination of end of shelf-life for
milk using Weibull hazard method. Lebensm Wiss Technol 34:143-148
42. Labuza TP (1982) Shelf-life dating of foods pp 54-58, 223, Food and Nutrition Press
Inc., Westport, Connecticut
43. Man D, Jones (2000) Shelf-life evaluation of foods In: Singh RP (ed) Scientific
principles of shelf-life evaluation Aspen Publication, Gaithersburg, Maryland
44. Al-kadamany E, Toufelli I, Khattar M., Abou-Jawdeh Y, Harakeh S, Haddad T
(2002) Determination of shelf life of concentrated yogurt (Labneh) produced by in-bag
straining of set yogurt using hazard analysis J Dairy Sci 85:1023-1030
22

494
495
496
497
498
499
500
501
502
503
504
505
506
507
508
509
510
511
512
513
514
515
45. Thomas LV, Ingrama RE, Yub S, Delves-Broughtona J (2004) Investigation of the
effectiveness of Ascopyrone P as a food preservative. Int J Food Microbiol 93:319–323
46. Brackett RE (1994) Microbiological spoilage and pathogens in minimally processed
refrigerated fruits and vegetables. In: Wiley RC (ed), Minimally Processed Refrigerated
Fruits and Vegetables (pp. 269-312). Chapman & Hall, New York, London
47. Kisko G, Sharp R, Roller S (2005) Chitosan inactivates spoilage yeasts but enhances
survival of Escherichia coli O157:H7 in apple juice. J Appl Microbiol 98: 872-880
48. Hinze H, Prakash D, Holzer H (1987) Effect of ozone on ATP, cytosolic enzymes and
permeability of Saccharomyces cerevisiae. Arch Microbiol 147:105-108
49. Ross T, Dalgaard P, Tienungoon S (2000) Predictive modeling of the growth and
survival of Listeria in fishery products. Int J Food Microbiol 62:231-245
50. Qin BL, Chang FJ, Barbosa-Canovas GV, Swanson BG (1995) Nonthermal
inactivation of Saccharomyces cerevisiae in apple juice using pulsed electric fields.
Lebensmm Wiss Technol 28:564-568
51. Ferrentino G, Bruno M, Ferrari G, Poletto M, Balaban MO (2009) Microbial
inactivation and shelf life of apple juice treated with high pressure carbon dioxide. J Biol
Eng 3:3
52. Suarez-Jacobo A, Gervilla R, Guamis B, Roig-Sagues AX, Saldo J (2009) Effect of
UHPH on indigenous microbiota of apple juice: a preliminary study of microbial shelf
life. Int J Food Microbiol 136(3):261-267
53. Valdramidis VP, Graham WD, Beattie A, Linton M, McKay A, Fearon AM,
Patterson M F (2009) Defining the stability interfaces of apple juice: implications on the
23

24
516
517
518
519
520
521
522
optimisation and design of high hydrostatic pressure treatment. Innov Food Sci Emerg
Technol 10(4): 396-404
54. Pin C, Sutherland JP, Baranyi J (1999) Validating predictive models of food spoilage
organisms. J Appl Microbiol 87:491-499