
Quantitative analysis of performability in voice and data networks
8
Quantitative Analysis of Performability in Voice and Data Networks Almir Pereira Guimaes* t , Paulo Romero Martins Maciel t and Rivalino Matias Jr. + * Campus Arapiraca, Federal University of Alagoas, Arapiraca, AL, Brazil Email: [email protected] t Center of Informatics, Federal University of Peambuco, Recife, PE, Brazil Email: apg2.prmm@cin.ufpe.br + School of Computing Science, Federal University of Uberlandia, Uberlflndia, MG, Brazil Email: [email protected] Abstract-In this paper, we investigate the performance and dependability modeling of voice and data services in computer networks. We use Stochastic Petri Net as an enabling modeling approach for analytical evaluation of complex scenarios. Our goal is to analyze the performability of a network infrastructure, by considering the influence of queuing policies and network topologies on the quality of voice and data services. We apply our proposed modeling approach in a case study to evaluate the dependability and performability of an enterprise network. Index Terms-Dependability; Performability; Stochastic Petri Net; VoIP; Queuing Policies; I. INTRODUCTION Over the last few years, the use of voice and data net- works has significantly increased. This considerable growth is somewhat related to the interoperability offered by voice and data services and their low costs. These services should be continuously provided even when unexpected hardware or software failures happen. The design, deployment and manage- ment of communication network infrastructure ought to meet such requirements. Their correct operation has a significant impact on both business integration and quality of service provided to customers. In the last few years, much has been done to deal with issues relating to performance and dependability of real-time applications, such as Voice over Inteet Protocol (VoIP) services in communication networks. Researchers have used different approaches to deal with these problems. Conceing performance, [6] proposes a realistic distri- bution model for VoIP traffic from different applications, based on real traffic traces. In particular, this model cap- tures the features of the inter-packet time of VoIP traffic. Additionally, an algorithm for resource allocation in TDMA networks was proposed. Similarly, [10] conducts controlled experiments considering VoIP traffic with different parameters (e.g., codec type and packet size). [6] and [10] rely on traffic characterization and measurement, which are obtained directly from controlled sources for performance analysis. In [3], a systematic approach for quantifying the reliability of enterise VoIP networks is presented. It identifies two key challenges for designing enterise VoIP service infrastructure: i) there are no universally accepted objectives or standards for the reliability of the enterise VoIP services; ii) there is no well-known 978-1-4244-6588-0/10/$25.00 ©2010 IEEE common set of reliability metrics to be used in enterise VoIP service planning. [3] presents an enhanced method and procedure of reliability calculation, using a network matrix representation and RBD (Reliability Block Diagram) [21]. In this paper we focus on performance including depend- ability aspects of voice and data services. Several scenarios are evaluated through Stochastic Petri Net (SPN) models [7]. The model parameters used were obtained from a system through performance measurement. We also used values provided by manufacturers of network elements. We identify traffic thresholds to avoid performance degradation in the investigated network. Regarding dependability, we evaluate the impact over the voice and data traffics when faults occur in network components that lead to failure scenarios. The rest of the paper is organized as follows: Section II presents some concepts of dependability for voice and data networks. Section III presents fundamental concepts of SPN. Section IV describes the proposed abstract and refined per- formance models along with the dependability model. Section V presents the evaluation of performance, dependability and performability metrics for a range of voice and data traffic pattes. Finally, Section VI discusses the results of this study and introduces further ideas for future research. II. DEPENDABILITY REQUI REMENTS FOR VorCE AND DATA NETWORKS Standard IP applications traffic is characterized by bursti- ness. However, such applications are not highly sensitive to delay and jitter. On the other hand, voice applications run continuously and steady. They could thus be strongly affected by long delays and jitter [4]. Providing high quality voice service on IP networks is one of the most pressing issues faced by the VoIP research community [9]. Critical services as VoIP have strict QoS requirements for both performance tolerance and service dependability. Depend- ability of a computer system must be understood as the ability to avoid service failures that are more frequent and more severe than is acceptable [2]. Dependability requirements encompass the concepts of availability, reliability, safety, integrity and maintainability [2]. Hence, either in normal operation or in case of network failure, VoIP services should be preserved. 761
-
Upload
independent -
Category
Documents
-
view
0 -
download
0
Transcript of Quantitative analysis of performability in voice and data networks
Quantitative Analysis of Performability in Voice and
Data Networks
Almir Pereira Guimaraes*t, Paulo Romero Martins Macielt and Rivalino Matias Jr.+
* Campus Arapiraca, Federal University of Alagoas, Arapiraca, AL, Brazil
Email: [email protected] t Center of Informatics, Federal University of Pernambuco, Recife, PE, Brazil
Email: [email protected] + School of Computing Science, Federal University of Uberlandia, Uberlflndia, MG, Brazil
Email: [email protected]
Abstract-In this paper, we investigate the performance and dependability modeling of voice and data services in computer networks. We use Stochastic Petri Net as an enabling modeling approach for analytical evaluation of complex scenarios. Our goal is to analyze the performability of a network infrastructure, by considering the influence of queuing policies and network topologies on the quality of voice and data services. We apply our proposed modeling approach in a case study to evaluate the dependability and performability of an enterprise network.
Index Terms-Dependability; Performability; Stochastic Petri Net; VoIP; Queuing Policies;
I. INTRODUCTION
Over the last few years, the use of voice and data networks has significantly increased. This considerable growth is somewhat related to the interoperability offered by voice and data services and their low costs. These services should be continuously provided even when unexpected hardware or software failures happen. The design, deployment and management of communication network infrastructure ought to meet such requirements. Their correct operation has a significant impact on both business integration and quality of service provided to customers.
In the last few years, much has been done to deal with issues relating to performance and dependability of real-time applications, such as Voice over Internet Protocol (VoIP) services in communication networks. Researchers have used different approaches to deal with these problems.
Concerning performance, [6] proposes a realistic distribution model for VoIP traffic from different applications, based on real traffic traces. In particular, this model captures the features of the inter-packet time of VoIP traffic.
Additionally, an algorithm for resource allocation in TDMA networks was proposed. Similarly, [10] conducts controlled experiments considering VoIP traffic with different parameters (e.g., codec type and packet size). [6] and [10] rely on traffic characterization and measurement, which are obtained directly from controlled sources for performance analysis. In [3], a systematic approach for quantifying the reliability of enterprise VoIP networks is presented. It identifies two key challenges for designing enterprise VoIP service infrastructure: i) there are no universally accepted objectives or standards for the reliability of the enterprise VoIP services; ii) there is no well-known
978-1-4244-6588-0/10/$25.00 ©201 0 IEEE
common set of reliability metrics to be used in enterprise VoIP service planning. [3] presents an enhanced method and procedure of reliability calculation, using a network matrix representation and RBD (Reliability Block Diagram) [21].
In this paper we focus on performance including dependability aspects of voice and data services. Several scenarios are evaluated through Stochastic Petri Net (SPN) models [7]. The model parameters used were obtained from a system through performance measurement. We also used values provided by manufacturers of network elements. We identify traffic thresholds to avoid performance degradation in the investigated network. Regarding dependability, we evaluate the impact over the voice and data traffics when faults occur in network components that lead to failure scenarios.
The rest of the paper is organized as follows: Section II presents some concepts of dependability for voice and data networks. Section III presents fundamental concepts of SPN. Section IV describes the proposed abstract and refined performance models along with the dependability model. Section V presents the evaluation of performance, dependability and performability metrics for a range of voice and data traffic patterns. Finally, Section VI discusses the results of this study and introduces further ideas for future research.
II. DEPENDABILITY REQUIREMENTS FOR VorCE AND
DATA NETWORKS
Standard IP applications traffic is characterized by burstiness. However, such applications are not highly sensitive to delay and jitter. On the other hand, voice applications run continuously and steady. They could thus be strongly affected
by long delays and jitter [4]. Providing high quality voice service on IP networks is one of the most pressing issues faced by the VoIP research community [9].
Critical services as VoIP have strict QoS requirements for both performance tolerance and service dependability. Dependability of a computer system must be understood as the ability to avoid service failures that are more frequent and more severe than is acceptable [2]. Dependability requirements encompass the concepts of availability, reliability, safety, integrity and maintainability [2]. Hence, either in normal operation or in case of network failure, VoIP services should be preserved.
761
Inputs to dependability include component Mean Times to Failure (MTTF) models and Mean Times To Repair (MTTR). The hardware component MTTFs are supplied by the manufacturer and represent the mean time for a component failure. The MTTRs are tightly related to the maintenance policy adopted by the organization.
III. STOCHASTIC PETRI NETS
Petri Nets is a family of graphic formalisms for modeling, analysis and simulation of many types of systems [24]. Petri Nets incorporate a notion of local state and a rule for state change (transition firing) that allow them to capturate both the static and the dynamic characteristics of a real system without expliciting time considerations.
The introduction of timing concepts into Petri Nets models were proposed later by [5], [22] and [16] under distinct point of views. Molloy [20] as well as Florin [8] proposed Petri Nets models in which stochastic timing were considered. These works open the possibility of connecting Petri Net theory and stochastic modeling. Nowadays, these models as well as their extensions are generically named SPN.
There are many different ways of representing SPNs. This work adopts a generic definition given in [23], in which a SPN is a 9-tuple:
Definition 1 Let SPN = (P, T, /,0, H, II, G, Mo, Atts) be a stochastic Petri net, where:
• p = {PI,P2, ...... 'Pn} is the set of places,
• T = {tl, t2, ...... , tn} is the set of transitions,
• / E (Nn ---+ N)nxm is a matrix of marking dependent multiplicities of input arcs, where ijk entry of / gives the possible marking dependent arc multiplicity of input arcs from place Pj to transition tk [ A � (PXT) U (TXP) - set of arcs]
• 0 E (Nn ---+ N)nxm is a matrix of marking dependent multiplicities of output arcs, where Ojk entry of 0 gives the possible marking dependent arc multiplicity of output arcs from transition tj to place Pk,
• H E (Nn ---+ N) nxm is a matrix of marking dependent multiplicities of inhibitor arcs, where hjk entry of H gives the possible marking dependent arc multiplicity of inhibitor arcs from place Pj to transition tk,
• II E Nm is a vector that assigns a priority level to each
transition,
• G E (Nn ---+ {true, Jalse})m is a vector that assigns a guard condition related to place markings to each transition,
• Mo E Nn is a vector that assigns the initial marking of each place (initial state),
• Atts = (Dist, W, Markdep, Policy, Concurrency)m comprise the set of attributes for transitions where
Dist E Nm ---+ :F is a possibly marking dependent firing distribution function (the domain of:F is [0, (0));
. W E Nm ---+ 1R+ is a possibly marking dependent weight;
·Markdep E {constant, enabdep}, where the transition firing timing distribution could be marking independent (constant) or enabling dependent (enabdep - the distribution depends on the actual enabling condition),
. Policy E {prd, prs} is the preemption policy (prd -preemptive repeat different means that when a preempted transition becomes enabled again the previous elapsed firing time is lost; prs - preemptive resume, in which the firing time related to a preempted transition is resumed when the transition becomes enabled again),
·Concurrency E {ss, is} is the concurrency degree of transitions, where ss represents single server semantics and is depicts infinity server semantics.
In many circumstances, it may be suitable representing the initial marking as a mapping from the set of places to natural numbers (mo : P ---+ N), where mO(Pi) denotes a reachable marking (reachable state) of place Pi. In this work, the notation #P;, has also been adopted for representing m(pi).
A. Refinement
Many studies have provided means of adapting Markovian models (approximations) [1] [7] to allow numerical evaluation aiming at trading off the complexity cost. Goodness-of-fit tests might be applied to find out the theoretical distribution that best fits the data sample. Unfortunately, this probability distribution may be too complex, and when considering the number of simultaneous stochastic variables that are taken into account at once, it could lead to a very complex stochastic process.
A common approach for representing general distribution random variables, including those obtained by real measurement (empirical distributions), is to represent them using a combination of exponential random variables (expolynomial distribution) [7] [23]. A well-established method that considers expolynomial distribution random variables is based on distribution moment-matching. The moment matching process presented in [1] takes into account that Hypoexponential and Erlangian distributions have the average delay (f-l) greater than the standard-deviation (u) - f-l > u, and Hyperexponential distributions have f-l < u, in order to represent an activity with a generally distributed delay as an Erlangian or a Hyperexponential subnet referred to as s-transition. One should
note that in cases where these distributions have f-l = u,
they are, indeed, equivalent to an exponential distribution with parameter equal to 1/ f-l. Therefore, according to the coefficient of variation (CV) associated to the activity's delay, an appropriate s-transition implementation model could be chosen. For each s-transition implementation model (see Figure 1), a set of parameters should be configured for matching their first and second moments. In other words, associated delay distribution (it might have been obtained by a measuring process) of the original activity is matched with the first and second moments of s-transition (expolynomial distribution).
762
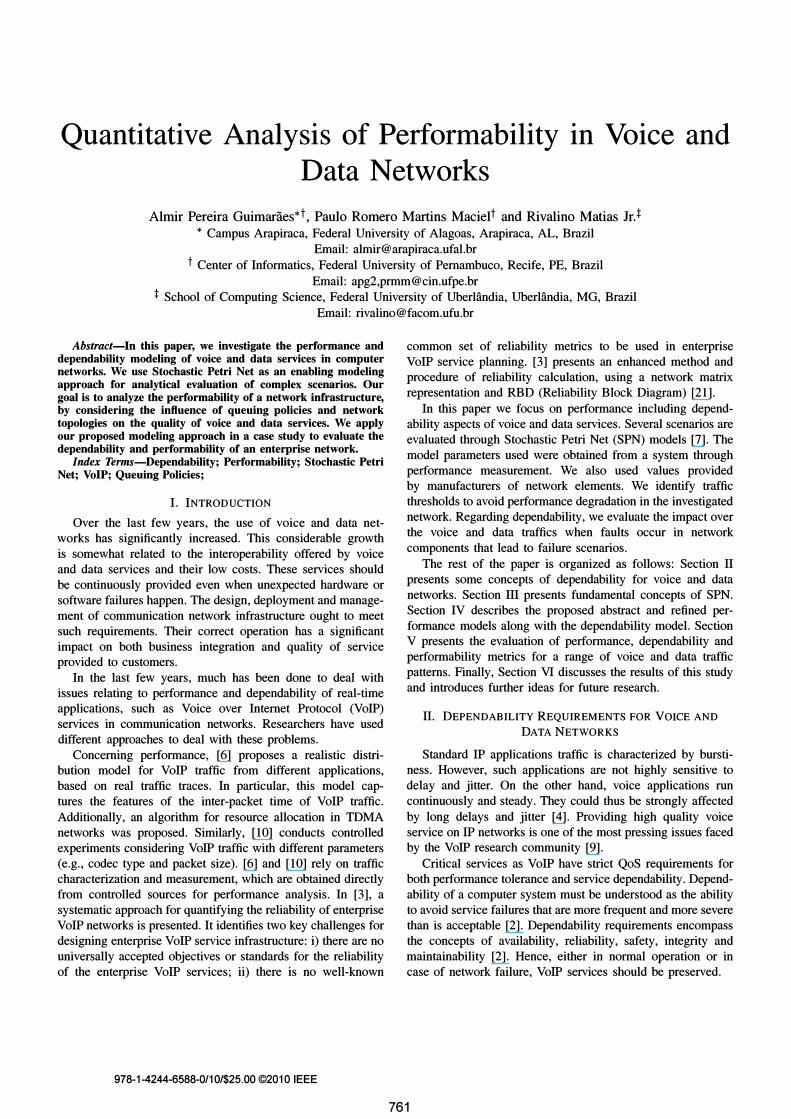
According to the aforementioned method, an activity with /-l < U is approximated by a two-phase Hyperexponential distribution with parameters:
2/-l2 (1) rl = (/-l2 + (2)
r2 = 1- rl (2)
A = 2/-l (3) /-l2 + u2
where A is the rate associated to phase 1, r1 is the probability of related to this phase, and r2 is the probability assigned to phase 2. In this particular model, the rate assigned to phase 2 is assumed to be infinity, that is, the related average delay is zero.
P1
--
"-
'\ r1
" \
---' ,/' ----
Fig. 1: Hyperexponential Model.
P2
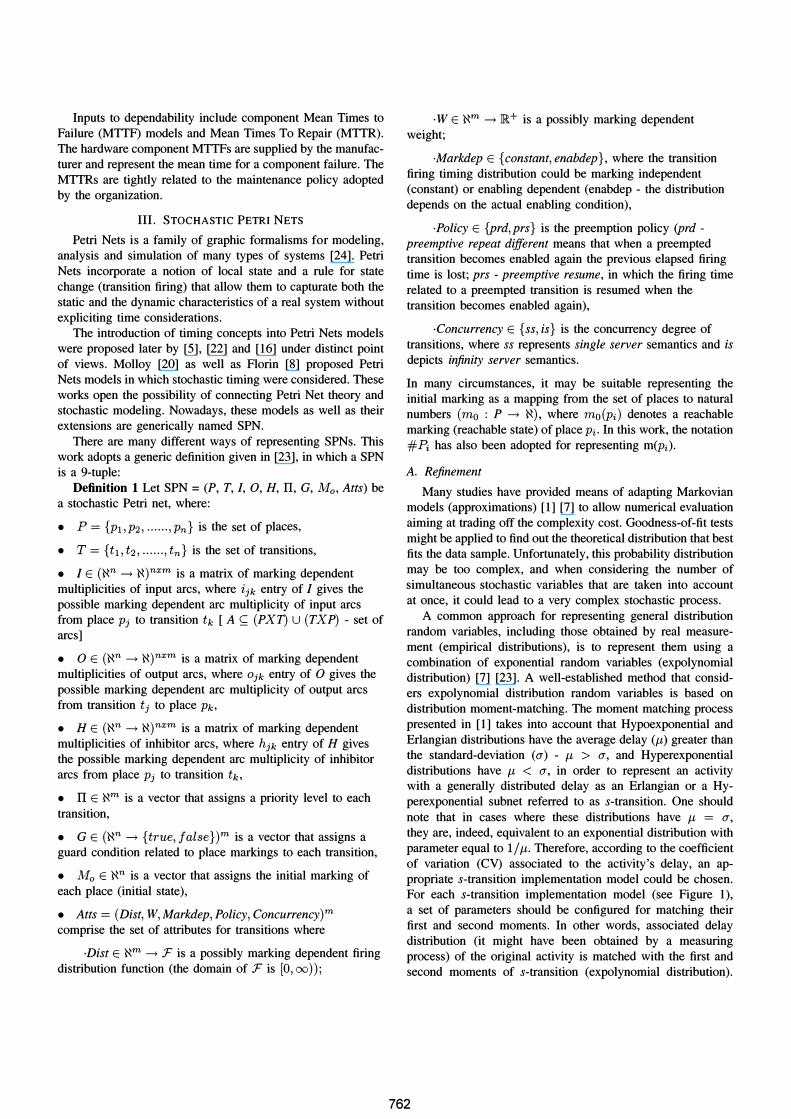
Activities with CVs smaller than one might be mapped either to Hypoexponential or Erlangian s-transitions. If /-l/ u tj 'N,/-l/u =I- 1, (/-l,U =I- 0), the respective activity is represented by a Hypoexponential distribution with parameters AI, A2 (exponential rates); and 'Y, the integer representing the number of phases with rate equal to A2, whereas the number of phases with rate equal to Al is one. In other words, the s-transition is represented by a subnet composed by two exponential and one immediate transitions. The average delay assigned to the exponential transition t1 is equal to /-l1(AI = 1/ /-l1) and the respective average delay assigned to the exponential transition t2 is /-l2(A2 = 1/ /-l2). The value of 'Y is considered as the weight assigned to the output arc of transition t1 as well as the input arc weight value of the immediate transition t3 (see Figure 2). These parameters are calculated by the following expressions:
(4)
(5)
(6)
where
(7)
(8)
763
If /-l/ U E 'N, /-l/ U =I- 1, (/-l, U =I- 0), an Erlangian s-transitions with two parameters, 'Y = (/-l/u)2 is an integer representing the number of phases of this distribution; and /-l1 = /-lh, where /-l1(1/ AI) is average delay value of each phase. The Erlangian model is a particular case of a Hypoexponential model, in which each individual phase rate has the same value.
The main problem concerning some state-based models is known as the state-space explosion [25], when the size of the state-space grows too large and memory resources are not sufficient to solve the model. Indeed, in such cases, simulation might also be the most suited approach. Given that simulation models are built to run and not to be numerically (or symbolically) solved, they can incorporate more details than analytical ones. So, simulation models may be more flexible and come closer to reality [19].
P1 \ \A1 A2
" ---' -----
Fig. 2: Hypoexponential Model.
IV. PROPOSED MODELS
P2
The models can be evaluated using tools as SPNP (http://people.ee.duke.eduJ), SHARPE (http://people.ee.duke.edul) and TimeNet (http://www.tuilmenau.de/fakia/8086.htrnl).
A. Platform Description
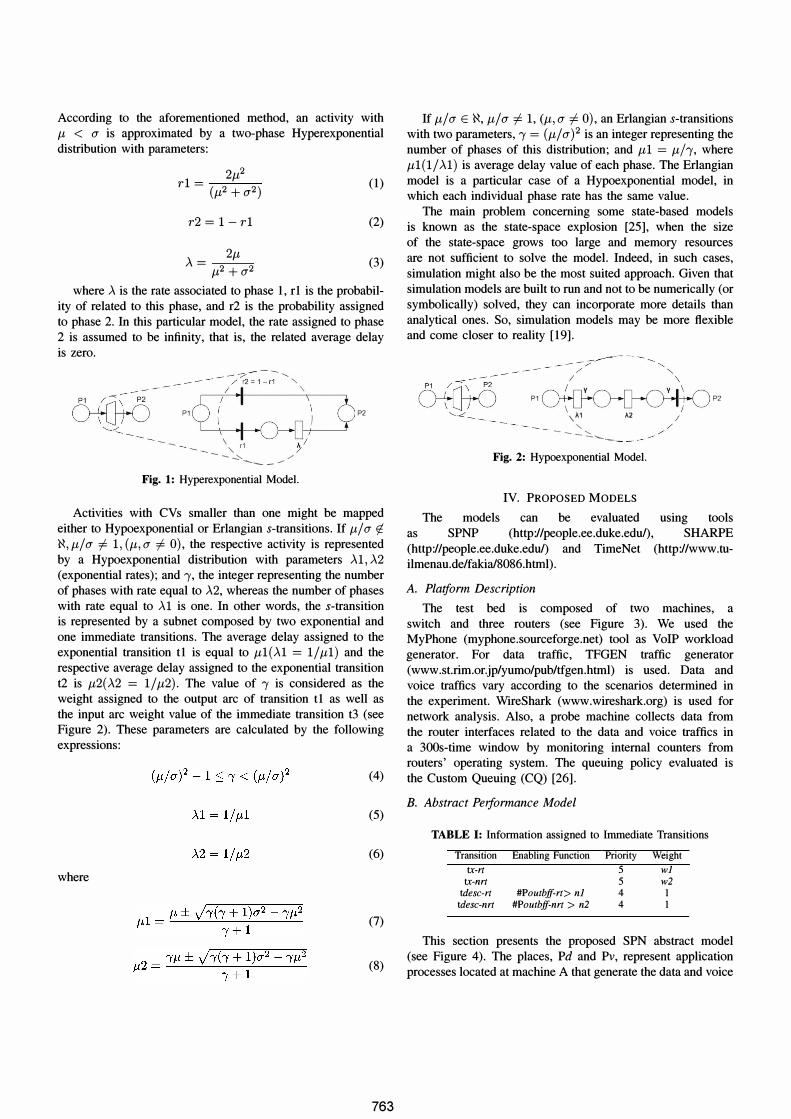
The test bed is composed of two machines, a switch and three routers (see Figure 3). We used the MyPhone (myphone.sourceforge.net) tool as VoIP workload generator. For data traffic, TFGEN traffic generator (www.st.rim.or.jp/yumo/pub/tfgen.html) is used. Data and voice traffics vary according to the scenarios determined in the experiment. WireShark (www.wireshark.org) is used for network analysis. Also, a probe machine collects data from the router interfaces related to the data and voice traffics in a 300s-time window by monitoring internal counters from routers' operating system. The queuing policy evaluated is the Custom Queuing (CQ) [26].
B. Abstract Performance Model
TABLE I: Information assigned to Immediate Transitions
Transition Enabling Function Priority Weight
tx-rt 5 wI tx-nrt 5 w2
tdesc-rt #Poutbff-rt> nI 4 1 tdesc-nrt #Poutbff-nrt > n2 4 1
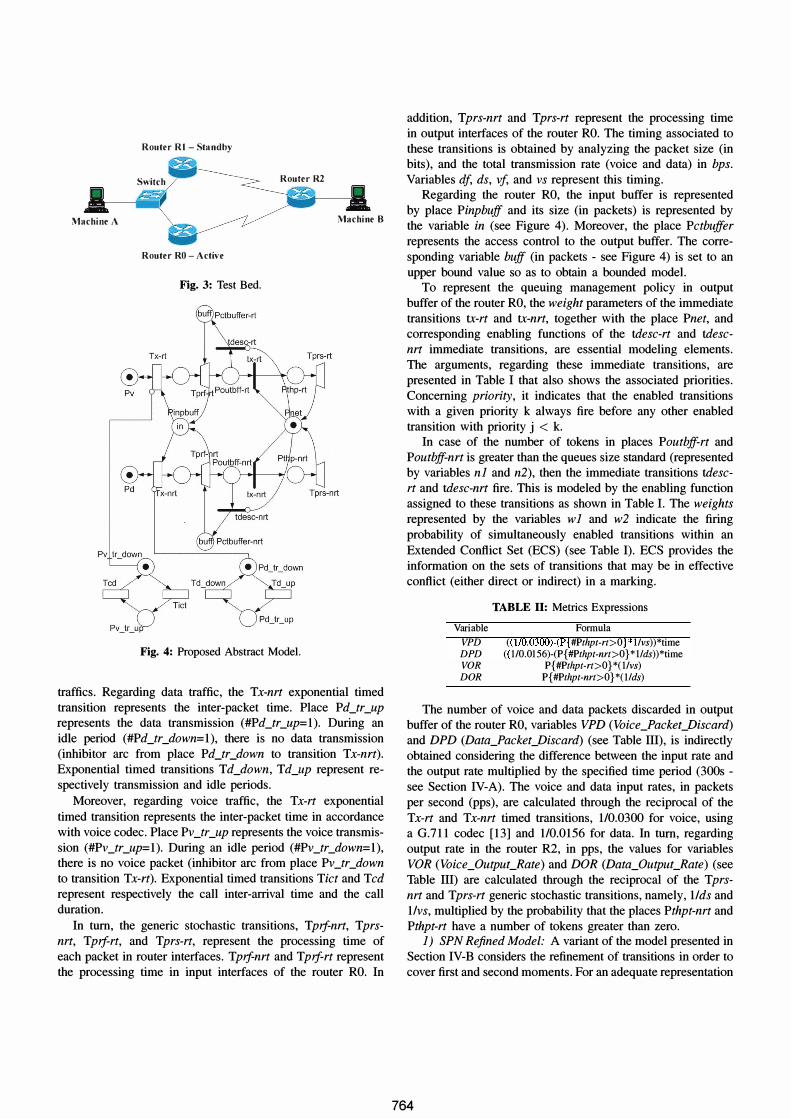
This section presents the proposed SPN abstract model (see Figure 4). The places, Pd and Pv, represent application processes located at machine A that generate the data and voice
Router RI - Standby
Switch Router R2
Machine A Machine B
Router RO - Active
Fig. 3: Test Bed.
Fig. 4: Proposed Abstract Model.
traffics. Regarding data traffic, the Tx-nrt exponential timed transition represents the inter-packet time. Place Pd_tr _up represents the data transmission (#Pd_tr _up=I). During an idle period (#Pd_tr_down=l), there is no data transmission (inhibitor arc from place Pd_tr _down to transition Tx-nrt). Exponential timed transitions Td_down, Td_up represent respectively transmission and idle periods.
Moreover, regarding voice traffic, the Tx-rt exponential
timed transition represents the inter-packet time in accordance with voice codec. Place Pv _tr _up represents the voice transmission (#Pv_tr_up=l). During an idle period (#Pv_tr_down=I), there is no voice packet (inhibitor arc from place Pv _tr _down to transition Tx-rt). Exponential timed transitions Tict and Tcd represent respectively the call inter-arrival time and the call duration.
In turn, the generic stochastic transitions, Tpif-nrt, Tprsnrt, Tpif-rt, and Tprs-rt, represent the processing time of each packet in router interfaces. Tpif-nrt and Tpif-rt represent the processing time in input interfaces of the router RO. In
addition, Tprs-nrt and Tprs-rt represent the processing time in output interfaces of the router RO. The timing associated to these transitions is obtained by analyzing the packet size (in bits), and the total transmission rate (voice and data) in bps. Variables df, ds, vf, and vs represent this timing.
Regarding the router RO, the input buffer is represented by place Pinpbuff and its size (in packets) is represented by the variable in (see Figure 4). Moreover, the place Pctbuffer represents the access control to the output buffer. The corresponding variable buff (in packets - see Figure 4) is set to an upper bound value so as to obtain a bounded model.
To represent the queuing management policy in output buffer of the router RO, the weight parameters of the immediate transitions tx-rt and tx-nrt, together with the place Pnet, and corresponding enabling functions of the tdesc-rt and tdescnrt immediate transitions, are essential modeling elements. The arguments, regarding these immediate transitions, are presented in Table I that also shows the associated priorities. Concerning priority, it indicates that the enabled transitions with a given priority k always fire before any other enabled transition with priority j < k.
In case of the number of tokens in places Poutbff-rt and Poutbff-nrt is greater than the queues size standard (represented by variables nl and n2), then the immediate transitions tdescrt and tdesc-nrt fire. This is modeled by the enabling function assigned to these transitions as shown in Table I. The weights represented by the variables w 1 and w2 indicate the firing probability of simultaneously enabled transitions within an
Extended Conflict Set (ECS) (see Table I). ECS provides the information on the sets of transitions that may be in effective conflict (either direct or indirect) in a marking.
Variable VPD DPD VOR DOR
TABLE II: Metrics Expressions
Fonnula « 1 I0.0300)-(P{ #Pthpt-rt>O }* lIvs) )*time
«1 10.0156)-(P{ #Pthpt-nrt>O}*lIds))*time P{ #Pthpt-rt>O}*( lIvs)
P{ #Pthpt-nrt>O }*(1 lds)
The number of voice and data packets discarded in output buffer of the router RO, variables VPD (Voice_PackeCDiscard) and DPD (Data_PackeCDiscard) (see Table III), is indirectly obtained considering the difference between the input rate and the output rate multiplied by the specified time period (300s -see Section IV-A). The voice and data input rates, in packets per second (pps), are calculated through the reciprocal of the Tx-rt and Tx-nrt timed transitions, 1/0.0300 for voice, using a G.711 codec [13] and 1/0.0156 for data. In tum, regarding output rate in the router R2, in pps, the values for variables VOR (Voice_OutpucRate) and DOR (Data_OutpucRate) (see Table III) are calculated through the reciprocal of the Tprsnrt and Tprs-rt generic stochastic transitions, namely, 1/ds and lIvs, multiplied by the probability that the places Pthpt-nrt and Pthpt-rt have a number of tokens greater than zero.
1) SPN Refined Model: A variant of the model presented in Section IV-B considers the refinement of transitions in order to cover first and second moments. For an adequate representation
764
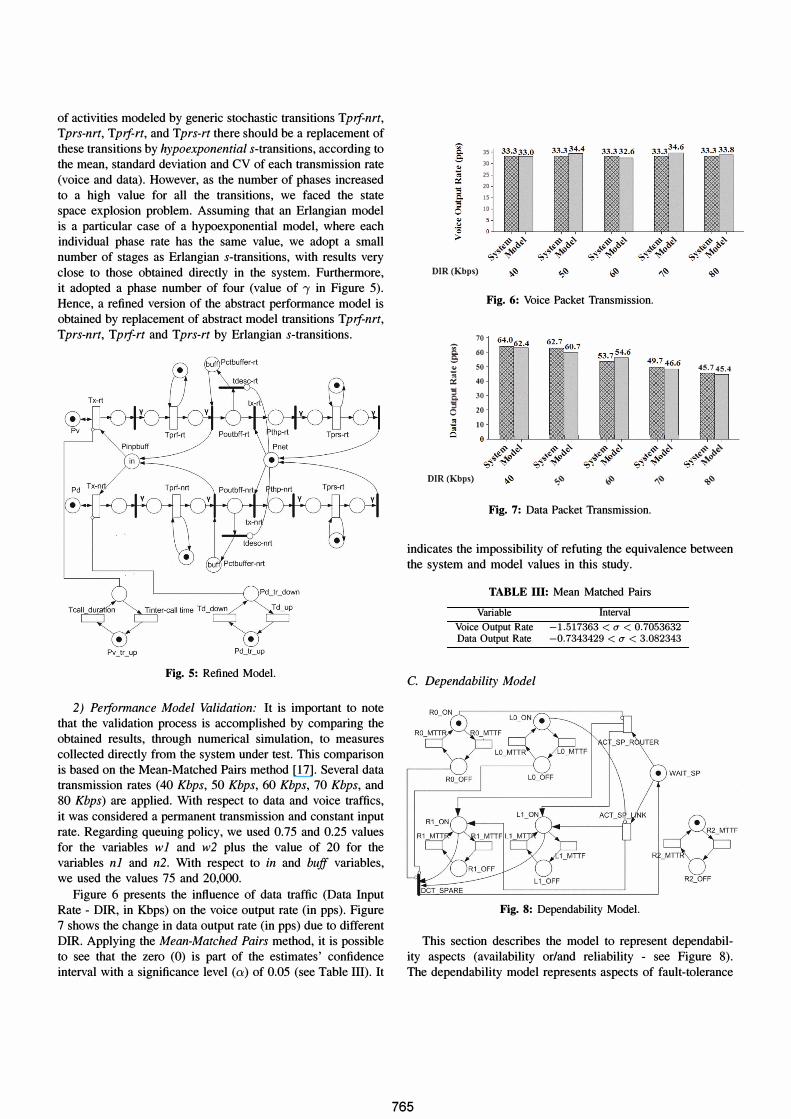
of activities modeled by generic stochastic transitions Tpif-nrt, Tprs-nrt, Tpif-rt, and Tprs-rt there should be a replacement of these transitions by hypoexponential s-transitions, according to the mean, standard deviation and CV of each transmission rate (voice and data). However, as the number of phases increased to a high value for all the transitions, we faced the state space explosion problem. Assuming that an Erlangian model is a particular case of a hypoexponential model, where each individual phase rate has the same value, we adopt a small number of stages as Erlangian s-transitions, with results very close to those obtained directly in the system. Furthermore, it adopted a phase number of four (value of'Y in Figure 5). Hence, a refined version of the abstract performance model is obtained by replacement of abstract model transitions Tpif-nrt, Tprs-nrt, Tpif-rt and Tprs-rt by Erlangian s-transitions.
Fig. 5: Refined Model.
2) Peiformance Model Validation: It is important to note that the validation process is accomplished by comparing the obtained results, through numerical simulation, to measures collected directly from the system under test. This comparison is based on the Mean-Matched Pairs method [17]. Several data transmission rates (40 Kbps, 50 Kbps, 60 Kbps, 70 Kbps, and 80 Kbps) are applied. With respect to data and voice traffics, it was considered a permanent transmission and constant input rate. Regarding queuing policy, we used 0.75 and 0.25 values for the variables wl and w2 plus the value of 20 for the variables nl and n2. With respect to in and buff variables, we used the values 75 and 20,000.
Figure 6 presents the influence of data traffic (Data Input Rate - DIR, in Kbps) on the voice output rate (in pps). Figure 7 shows the change in data output rate (in pps) due to different DIR. Applying the Mean-Matched Pairs method, it is possible to see that the zero (0) is part of the estimates' confidence interval with a significance level (a) of 0.05 (see Table III). It
3S 30 25 20 15 10
DIR (Kbps)
70 � 60 � 50 .. IX 40
i 30 o 20
10
Fig. 6: Voice Packet Transmission.
45.745.4
O ���L--X�� __ ��� __ ��L-���_
DIR (Kbps)
� �;;. � �;;. � �;;. � �;;. ,,"''''_� ,,"''''_� l;''''_� �"'_N,.\) �"i �' �"i �- �� �' �"i �' ,,� '<>� ,,�
Fig. 7: Data Packet Transmission.
��;;. �...,,, ...
�\)
'+>�
indicates the impossibility of refuting the equivalence between the system and model values in this study.
TABLE III: Mean Matched Pairs
Variable Interval
Voice Output Rate -1.517363 < (J < 0.7053632 Data Output Rate -0.7343429 < (J < 3.082343
C. Dependability Model
Fig. 8: Dependability Model.
This section describes the model to represent dependability aspects (availability orland reliability - see Figure 8). The dependability model represents aspects of fault-tolerance
765

based on the so-called cold-standby redundancy approach. This approach is characterized by fault detection and recovering mechanisms. The model includes ten relevant places, which are RO_ON, RO_OFF, with corresponding places of Rl, R2, LO and L1 components. Places RO_ON and RO_OFF, along with their corresponding pairs, model component's activity and inactivity states, respectively. These components have two parameters, namely MTTF and MTTR, which represent delays associated to corresponding exponential transitions X_MTTF and X_MTTR respectively (Label "x" must be instantiated according to the component name). Exponential transitions ACT_SP _ROUTER and ACT_SP _LINK represent the spare components starting operation. This time period (delay), in hours, is named Mean Time to Activate (MTA). As the main components fail, the transitions ACT_SP _ROUTER or ACT_SP _LINK are fired. These transitions firing represents the spare component taking over the failed one. In tum, immediate transition DCT_SP represents the return to normal operation.
This model can compute the availability of the system through SA (System Availability) variable (SA = P{«#RO_ON=1 AND #LinkO_ON=I) OR (#RLON=1 AND #Linkl_0N=I» AND #R2_0N=I}). This expression represents the probability that the system is up. Moreover, most modelers kept performance and dependability models separated. Thus, it is essential that methods for the combined evaluation of performance and dependability be developed, allowing the performability evaluation. [15] defines performability as a measure to assess the system's ability to perform when performance degrades as a consequence of faults. Section V shows the use of performance and dependability models for obtaining system performability.
TeA
V. CASE STUDY
2.0 1.5 1.0 0.5
2.01 2.01
1.47 1.47
0.0 .L...!.....-"'I'''----'-r-
2.02
Fig. 9: Availability and Downtime for different TeAs.
1.47
We consider the studied system as an enterprise network. Our goal is to compute the network performance, dependability and performability using the proposed models (see Section IV-B and Section IV-C). The components MTTF and Total Cost of Acquisition (TCA) used in this work are respectively: Component 1, 131,000 hours and US$ 8,390; Component 2, 105,000 hours and US$ 895; Component 3, 68,000 hours and US$ 1,095.
Initially, we calculate the corresponding availability and downtime to a period of one year, according to various scenarios. Each evaluated scenario assumes different topologies and devices. The value of MITR of twelve hours and a link availability of 0.99 are used. For MTA, a value of 0.0416 hours is used.
A non-redundant scenario, RO (Component 1) router in series along with R2 (Component 2) router, shows a downtime of 89.38 hours and TCA of $ 9,285. Regarding redundant scenarios (see Figure 9), it is worth observing scenario 7, where it has a TCA of $2,685 and an availability of 0.9998 and scenario 4, that has a TCA of $17,875 and an availability of 0.9997. On the other hand, for the same availability, scenarios 1, 2, 6 and 7 show the lower TCA. In particular, scenario 7 presents the lowest TCA. These scenarios have values very close to downtime, so they are similar scenarios in relation to availability. Additional analysis (e.g., performance) must be taken into consideration in a network design. In practical terms, the redundant scenarios have less downtime in relation to the non-redundant scenario. This fact is directly related to the parallelism of the RO and Rl routers.
Also, as the router failures occur much less frequently than link failures, the link availability is an important point for the whole system availability. Another important aspect of system availability refers to the MITR. For a redundant topology, Figures 10 and 11 show the system availability as a function of the link availability as well as the MTTR.
Then, we analyze combined performance and dependability. The services performance considering the traffic variation is analyzed. This variation occurs in terms of transitions Tcd, Tict, Td_up and Td_down. Weights of 0.75 and 0.25 to the txrt and tx-nrt immediate transitions (variables wl and w2) and a system availability of 0.9897, corresponding a downtime of 89.38 hours with a non-redundant topology, were considered.
Regarding voice, we based on samples of Call Detail Records (CDR), obtained from a real Brazilian Telco operator database. For call duration (hold time) we consider 90 seconds, and 101 seconds for call inter-arrival time (scenarios 1, 2, 3, 4 and 5 - see Tables IV and V). Regarding data traffic, we consider two hypothetical scenarios, with variable input rate, that consist of alternating transmission and idle periods (scenarios 1 and 2, transmission of 50Kbps - see Tables IV and V). Further, three real scenarios were created whose purpose was to show the behavior of SNMP (Simple Network Management Protocol) [14], according to different settings
(scenarios 3, 4 and 5 - see Tables IV and V), with results very close to those measured directly in the system. These scenarios have periodic updates of 15, 30, and 60 seconds, respectively. The results show that the scenario 5 has the lowest throughput due to its update time.
In order to assess the financial impact of outages to a period of one month, suppose that a WAN services provider pays a fine of $ 50.00 per each group of 1,000 Voice Packets not Transmitted (VPNT) over WAN networks. According to voice traffic, the Total Fine Cost (TFC) will vary (see Table V). We see that a lower rate of voice usage (scenario 3) will result in
766
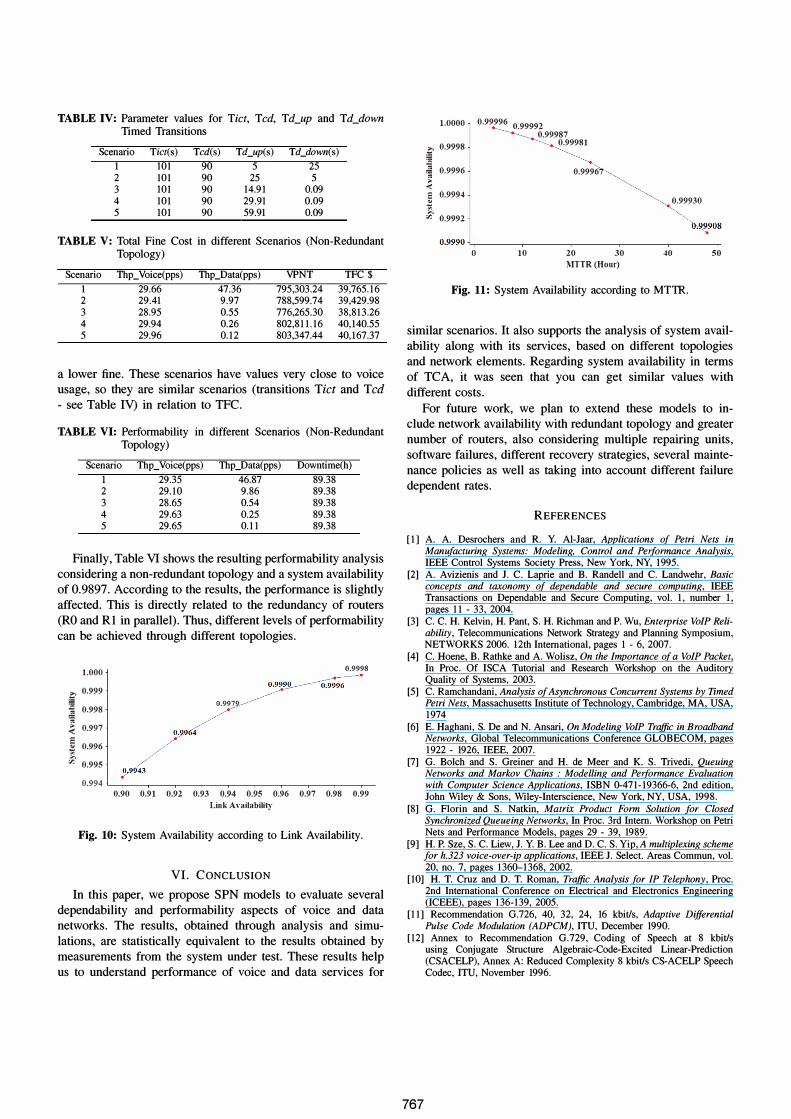
TABLE IV: Parameter values for Tiel, Ted, Td_up and Td_down Timed Transitions
Scenario Tict(s) Tcd(s) Td_up(s) Td_down(s) I 101 90 5 25 2 101 90 25 5 3 101 90 14.91 0.09 4 101 90 29.91 0.09 5 101 90 59.91 0.09
TABLE V: Total Fine Cost in different Scenarios (Non- Redundant Topology)
Scenario Thp_ Voice(pps) Thp_Data(pps) VPNT TFC $ I 29.66 47.36 795,303.24 39,765.16 2 29.41 9.97 788,599.74 39,429.98 3 28.95 0.55 776,265.30 38,813.26 4 29.94 0.26 802,81 1 . 16 40, 140.55 5 29.96 0.12 803,347.44 40, 167.37
a lower fine. These scenarios have values very close to voice usage, so they are similar scenarios (transitions Tiet and Ted - see Table IV) in relation to TFC.
TABLE VI: Performability in different Scenarios (Non- Redundant Topology)
Scenario Thp_ Voice(pps) Thp_Data(pps) Downtime(h)
I 29.35 46.87 89.38 2 29.10 9.86 89.38 3 28.65 0.54 89.38 4 29.63 0.25 89.38 5 29.65 0.1 1 89.38
Finally, Table VI shows the resulting performability analysis considering a non-redundant topology and a system availability of 0.9897. According to the results, the performance is slightly affected. This is directly related to the redundancy of routers (RO and Rl in parallel). Thus, different levels of performability can be achieved through different topologies.
1.000
£ 0.999
:s 0.998 .g .; -< 0.997
B 0.996
� 0.995
7 4 p�
0.9972
0.9998
0.994 '--�-�-�-�-�-�-�-�-��-� 0.90 0.91 0.92 0.93 0.94 0.95 0.96 0.97 0.98 0.99
Link Availability
Fig. 10: System Availability according to Link Availability.
V I. CONCLUSION
In this paper, we propose SPN models to evaluate several dependability and performability aspects of voice and data networks. The results, obtained through analysis and simulations, are statistically equivalent to the results obtained by measurements from the system under test. These results help us to understand performance of voice and data services for
1.0000
.f' 0.9998
:s ,g 0.9996 � <: E 0.9994 .:l � 0.9992
0.99996 0.99992 0.99987
0.99981
0.9996
0.99930
0.9990 '-,-___ �---�--�---�---� o 10 20 30 40 50
MTTR(Hour)
Fig. 11: System Availability according to MITR.
similar scenarios. It also supports the analysis of system availability along with its services, based on different topologies and network elements. Regarding system availability in terms of TCA, it was seen that you can get similar values with different costs.
For future work, we plan to extend these models to include network availability with redundant topology and greater number of routers, also considering multiple repairing units, software failures, different recovery strategies, several maintenance policies as well as taking into account different failure dependent rates.
REFERENCES
[I] A. A. Desrochers and R. Y. Al-Jaar, Applications of Petri Nets in Manufacturing Systems: Modeling, Control and Performance Analysis, IEEE Control Systems Society Press, New York, NY, 1995.
[2] A. Avizienis and J. C. Laprie and B. Randell and C. Landwehr, Basic concepts and taxonomy of dependable and secure computing, IEEE Transactions on Dependable and Secure Computing, vol. I, number I, pages II - 33, 2004.
[3] C. C. H. Kelvin, H. Pant, S. H. Richman and P. Wu, Enterprise VolP Reliability, Telecommunications Network Strategy and Planning Symposium, NETWORKS 2006. 12th International, pages I - 6, 2007.
[4] C. Hoene, B. Rathke and A. Wolisz, On the Importance of a VolP Packet, In Proc. Of ISCA Tutorial and Research Workshop on the Auditory Quality of Systems, 2003.
[5] C. Ramchandani, Analysis of Asynchronous Concurrent Systems by Timed Petri Nets, Massachusetts Institute of Technology, Cambridge, MA, USA, 1974
[6] E. Haghani, S. De and N. Ansari, On Modeling VoIP Traffic in Broadband Networks, Global Telecommunications Conference GLOBECOM, pages 1922 - 1926, IEEE, 2007.
[7] G. Bolch and S. Greiner and H. de Meer and K. S. Trivedi, Queuing Networks and Markov Chains : Modelling and Performance Evaluation with Computer Science Applications, ISBN 0-471- 19366-6, 2nd edition, John Wiley & Sons, Wiley-Interscience, New York, NY, USA, 1998.
[8] G. Florin and S. Natkin, Matrix Product Form Solution for Closed Synchronized Queueing Networks, In Proc. 3rd Intern. Workshop on Petri Nets and Performance Models, pages 29 - 39, 1989.
[9] H. P. Sze, S. C. Liew, J. Y. B. Lee and D. C. S. Yip, A multiplexing scheme for h.323 voice-over-ip applications, IEEE J. Select. Areas Commun, vol. 20, no. 7, pages 1360-1368, 2002.
[10] H. T. Cruz and D. T. Roman, Traffic Analysis for IP Telephony, Proc. 2nd International Conference on Electrical and Electronics Engineering (ICEEE), pages 136-139, 2005.
[II] Recommendation G.726, 40, 32, 24, 16 kbitls, Adaptive Differential Pulse Code Modulation (ADPCM), lTV, December 1990.
[12] Annex to Recommendation G.729, Coding of Speech at 8 kbitls using Conjugate Structure Algebraic-Code-Excited Linear-Prediction (CSACELP), Annex A: Reduced Complexity 8 kbitls CS-ACELP Speech Codec, ITU, November 1996.
767
[ 13] Recommendation G.71 1 , Pulse Code Modulation (PCM) of Voice Frequencies, ITU, November 1988.
[14] J. Case and M. Fedor and M. SchoffstaIII and J. Davin, A Simple Network Management Protocol (SNMP), IETF - RFC 1 157, May, 1990.
[15] J. F. Meye, On Evaluating the Performability of Degradable Computing Systems, IEEE Trans. Comput., vol. 29, number 8, pages 720 - 731 , Washington, DC, USA, 1980.
[16] J. Sifakis, Petri nets for Performance Evaluation, In 3rd Intern. Symp. IFIP, pages 75 - 93, 1978.
[17] J. W. Tukey, Exploratory Data Analysis, Princeton University, AddisonWesley, 1977.
[ 18] K. S. Trivedi, Probability and Statistics with Reliability, Queuing, and Computer Science Applications, ISBN 0-471 -33341 -7, John Wiley and Sons, New York, 2001.
[19] M. A. Marsan, G. Balbo, G. Conte, S. Donatelli and G. Franceschinis,Modelling with Generalized Stochastic Petri Nets, SIGMETRICS Perform. Eval. Rev., vol. 26, number 2, New York, NY, USA, 1995.
[20] M. K. Molloy, On the Integration of Delay and Throughput Measures in Distributed Processing Models, PhD thesis, UCLA, Los Angeles, CA, 1981
[21 ] M. Malhotra, and K. S. Trivedi, Power-Hierarchy of DependabilityModel Types, IEEE Trans. Reliability, vol. 43(3), pages 493 - 502, 1994.
[22] P. M. Merlin and D. J. Farber, Recoverability of Communication Protocols: Implications of a Theoretical Study, IEEE Transactions on Communications, pages 1036 - 1043, 1976.
[23] R. German,Performance Analysis of Communicating Systems - Modeling with Non-Markovian Stochastic Petri Nets, John Wiley & Sons, Inc., New York, NY, USA, June, 2000.
[24] T. Murata, Petri Nets: Properties, Analysis and Applications, Proc. IEEE, volume 77, number 4, pages 541 - 580, April, 1989.
[25] v. Antti, The State Explosion Problem, Lectures on Petri Nets I: Basic Models, Advances in Petri Nets, the volumes are based on the Advanced Course on Petri Nets, pages 429 - 528, Springer-Verlag, London, UK, 1998.
[26] X. Chen, C. Wang, D. Xuan, Z. Li, Y. Min and W. Zhao, Survey on QoS management of VoIP, Proc. International Conference on Computer Networks and Mobile Computing, ICCNMC, p. 69, 2003.
[27] W. Zou and M. Janie and R. Kooij and F. Kuipers, On the availability of networks, in BroadBand Europe 2007, Antwerp, Belgium, 3-6 December 2007.
768