Quantitative analysis of fluid inclusion study vis-à-vis mantle evolution using Laser Raman...
11
Proceedings of the National conference on Advances in Lasers and Spectroscopy (ALS-2012) 01-03 November, 2012, pp.123-130, ISM Dhanbad, India Paper Code. No. TP-xx TP-xx-1 QUANTITATIVE ANALYSIS OF FLUID INCLUSION STUDY VIS-À-VIS MANTLE EVOLUTION USING LASER RAMAN SPECTROSCOPIC (LRS) TECHNIQUE. Javid Ahmad Dar and R.K.Dubey Department of Applied Geology, Indian School of Mines, Dhanbad 826 004, (Jharkhand) India. E-mail:[email protected] and [email protected] Abstract The Laser Raman Spectroscopy (LRS) in geological perspective works on the basis of inelastic scattering of monochromatic light from a laser in visible, near-infrared, and near ultraviolet ranges through the fluid inclusions of various chronological orders. By measuring the peak positions relative to the incident light it is possible to measure the energy of the normal modes of vibration and identify the symmetry and chemical structure of the examined molecules as per symmetry and selection rules. The present study incorporates the use of LRS technique for the study of different kinds of inclusions present in the various minerals. The inclusions reveals the spectral shifts (Raman shift) from an excited laser waves, which has resulted from the molecular vibrations of chemical bonds in the different immiscible phases (meltfluid, fluid-fluid, fluid-gas). The identification of these fluid phases based on the peaks of spectrum and quantified values of their relative intensities obtained from Raman microprobes was utilised to define the dissimilarity of scattering patterns as the function of temperature, pressure, fluid composition and their phases of formation. The various scattering patterns analysed for different kinds of inclusions present in minerals reveals the higher stretch of materials (Olivine) and compression decompression phenomena enhancement towards the shallow depth of the mantle and lower crust. Besides, these the pattern delineated in pyroxene suggest the higher concentration of metallic component at higher temperatures and pressures conditions. Hence, the mantle of the Earth appears to be comprised of different layers of specific temperatures, pressures and viscosities. Introduction The fluid inclusions are the principle components that can be used to analyse different types and phases of minerals. Fluid inclusions are the small amounts of relict fluids trapped in the minerals that provide the evidence regarding the active participation of fluids in geological processes. They provide an estimate of fluid trapping temperatures and pressures and fluid densities. In the
-
Upload
ismdhanbad -
Category
Documents
-
view
1 -
download
0
Transcript of Quantitative analysis of fluid inclusion study vis-à-vis mantle evolution using Laser Raman...

Proceedings of the National conference on Advances in Lasers and Spectroscopy (ALS-2012) 01-03 November,
2012, pp.123-130, ISM Dhanbad, India
Paper Code. No. TP-xx
TP-xx-1
QUANTITATIVE ANALYSIS OF FLUID INCLUSION STUDY
VIS-À-VIS MANTLE EVOLUTION USING LASER RAMAN
SPECTROSCOPIC (LRS) TECHNIQUE.
Javid Ahmad Dar and R.K.Dubey
Department of Applied Geology, Indian School of Mines, Dhanbad 826 004, (Jharkhand) India.
E-mail:[email protected] and [email protected]
Abstract
The Laser Raman Spectroscopy (LRS) in geological perspective works on the basis of inelastic
scattering of monochromatic light from a laser in visible, near-infrared, and near
ultraviolet ranges through the fluid inclusions of various chronological orders. By measuring the
peak positions relative to the incident light it is possible to measure the energy of the normal
modes of vibration and identify the symmetry and chemical structure of the examined molecules
as per symmetry and selection rules. The present study incorporates the use of LRS technique for
the study of different kinds of inclusions present in the various minerals. The inclusions reveals
the spectral shifts (Raman shift) from an excited laser waves, which has resulted from the
molecular vibrations of chemical bonds in the different immiscible phases (meltfluid, fluid-fluid,
fluid-gas).
The identification of these fluid phases based on the peaks of spectrum and quantified values of
their relative intensities obtained from Raman microprobes was utilised to define the
dissimilarity of scattering patterns as the function of temperature, pressure, fluid composition and
their phases of formation. The various scattering patterns analysed for different kinds of
inclusions present in minerals reveals the higher stretch of materials (Olivine) and compression
decompression phenomena enhancement towards the shallow depth of the mantle and lower
crust. Besides, these the pattern delineated in pyroxene suggest the higher concentration of
metallic component at higher temperatures and pressures conditions. Hence, the mantle of the
Earth appears to be comprised of different layers of specific temperatures, pressures and
viscosities.
Introduction
The fluid inclusions are the principle components that can be used to analyse different types and
phases of minerals. Fluid inclusions are the small amounts of relict fluids trapped in the minerals
that provide the evidence regarding the active participation of fluids in geological processes.
They provide an estimate of fluid trapping temperatures and pressures and fluid densities. In the

Proceedings of the National conference on Advances in Lasers and Spectroscopy (ALS-2012) 01-03 November,
2012, pp.123-130, ISM Dhanbad, India
Paper Code. No. TP-xx
TP-xx-2
process of cooling and crystallization of magma, one or several events of the exsolution separate
immiscible fluid phases. The processes of magmatic immiscibility (meltfluid, fluid-fluid, fluid-
gas) are well recorded in minerals in the form of fluid inclusions [1].These also provides the
evidences hypersaline fluid phase evolutions from the heterogeneous melt containing variable
proportions of fluids [1,2]. Moreover, the immiscible phase separation during cooling and
crystallization of the magma is an inherently fugitive phenomenon which provides the remaining
evidence of such processes. In addition, the information allied to these fluid inclusions at
variable temperature (T), pressure (P) and composition (C) is a useful tool in mineral exploration
due to proper understanding of the ore forming fluids and petrogenetic history of late
hydrothermal fluids. The application of Laser Raman Spectroscopy (LRS) offers the exciting
opportunity to interrogate rocks in their natural geological context due to the ability of the
method to collect the information related to constituents, textures and morphological features of
mineral/rocks [3, 4]. Besides, this technique is found to be useful for extra-terrestrial exploration
programmes such as in situ exploration on Mars, Venus, and the Moon,
In view of wide applicability and relevance of the LRS method the present study is attempted to
analyse the number of minerals based on the different fluid inclusions categorization. For the
purpose, the various databases (fingerprints) obtained from LRS were used to identify the
different minerals.
Methodology
The LRS technique scrutinizes the roughly polished surfaces in which most of the spectra is
taken by using an objective with a low numerical aperture (20´, NA = 0.4, long working
distance) by using an automated scanning procedure. The diameter of the laser beam ranged
from ~1 to ~5 mm depending on the precision of the focus, which varies along the traverses. The
spectral quality for mineral identification is essentially the same on the rough surface as on the
polished surface [5]. The schematic set up of LRS is shown in the Fig.1. The setup works on the
basis of inelastic scattering of monochromatic light from a laser in the visible, near-infrared, and
or near ultraviolet range through the minerals and fluid inclusions of various chronological
orders (Fig.2). The LRS observes the spectral shifts (Raman shift) from an excitation laser
wavelength caused by the molecular vibrations of chemical bonds in a material.

Proceedings of the National conference on Advances in Lasers and Spectroscopy (ALS-2012) 01-03 November,
2012, pp.123-130, ISM Dhanbad, India
Paper Code. No. TP-xx
TP-xx-3
Fig.1. Schematic representation of Laser Raman Spectrometer for the study of
various inclusions.
Laser Mirror
Interference
Polarization rotator
Mineral Sample
Collecting lens
Polaroid
Spherical Mirror
Double Grating Spectrometer
CCD
Detector
Focusing lens Amplifier
PC
Ray
leig
h
scat
teri
ng
Sto
kes
scat
teri
ng
An
ti-S
tokes
scat
teri
ng
Ground
state
Virtual Energy
level
Ener
gy
V0
V1 V1
V0
V1
V0
Fig.2. Principle of Laser Raman inelastic scattering and change of energy states.

Proceedings of the National conference on Advances in Lasers and Spectroscopy (ALS-2012) 01-03 November,
2012, pp.123-130, ISM Dhanbad, India
Paper Code. No. TP-xx
TP-xx-4
Spectral Variations and Fluid Inclusions
The Raman spectra for the different mineral inclusions like silicates, oxides, hydroxides,
carbonates etc., with associated liquid and gaseous phases shows the sharp and mostly non-
overlapping spectra in the particular range. These different spectral patterns occur in relation to
their different structures (monomers, chains, layers, frameworks) and different crystal structures
(e.g., monoclinic versus orthorhombic crystal systems) Fig.3.
The various peaks for other groups are easily distinguishable from those of the silicates, which
are important for identifying sedimentary minerals (e.g., carbonates, sulphates, clays). Some
peak frequencies within a given oxy-anion group depend on cation proportions (e.g., Fe2+
and
Mg2+
in olivine, and Fe2+
, Mg2+
, and Ca2+
in carbonates and pyroxenes [6]. Therefore, on the
basis of LRS technique the examination of dominant minerals inclusions showing different
spectra is studied below.
(C-C) Sulphates Carbonates (C-H)
Oxides
Hydroxides
Silicates (C-C)
(C=O)
H20 O-H
Laser Raman Spectra of various inclusions
Fig.3. Characteristic Laser Raman Spectra of various inclusions.

Proceedings of the National conference on Advances in Lasers and Spectroscopy (ALS-2012) 01-03 November,
2012, pp.123-130, ISM Dhanbad, India
Paper Code. No. TP-xx
TP-xx-5
Pyroxene
The Raman spectral pattern of pyroxene in various inclusions shows the three spectral regions:
(1) near 1000 cm-1, (2) near 670 cm-1, and (3) 400 to 200 cm-1. The frequencies of these Raman
peaks in these regions shift systematically with Mg/Fe content of the pyroxenes. The Spectra
shows the different patterns for the three structural types orthorhombic, monoclinic and triclinic
pyroxenes [7, 8].
Olivine
Raman spectroscopy is highly sensitive to olivine, which does not give the specific pattern in the
various minerals and rock samples [7, 9]. The two major peaks observed (815 cm-1and 847 cm-
1) belong to the SiO4-streching mode are visible. The observation for the fayalite shows a change
in the intensity of these bands, which might be the result from iron in olivine where the magnetic
interactions can take place.
500
1000
200 400 600 800 1000 1200 1400
335
67
8
10
06
660
Raman Shift (cm-1
)
Ram
an I
nte
nsi
ty (
arb
.un
its)
700
1400
200 400 600 800 1000 1200
287
57
6
81
5
84
7
94
6
SiO2 stretch
Raman Shift (cm-1
)
Ram
an I
nte
nsi
ty (
arb
.un
its)

Proceedings of the National conference on Advances in Lasers and Spectroscopy (ALS-2012) 01-03 November,
2012, pp.123-130, ISM Dhanbad, India
Paper Code. No. TP-xx
TP-xx-6
Magnetite
The spectrum of Magnetite shows the broad pattern with only one major peak near 670 cm-1
and in the 387 cm-1 region.
Pyrrhotite
Pyrrhotite has more than one structural form therefore the examined Raman spectral patterns
gave different positions. The Raman spectra have a main broad band centered near 430 cm-1,
which is similar to the spectrum of magnetic pyrrhotite [7, 8].
Tremolite (amphibole)
Tremolite presents the only one large shift at 548 cm-1, which belongs to the Al–O deformation
mode. The very small shift only in vacuum at the 674 cm-1 band fits to the symmetrical Si–O–Si
and Si–O vibrations [8, 9].
500
1000
200 400 600 800 1000 1200 1400
67
0
38
7
Raman Shift (cm-1
)
Ram
an I
nte
nsi
ty (
arb
.un
its)
500
1000
200 400 600 800 1000 1200 1400
430
Raman Shift (cm-1
)
Ram
an I
nte
nsi
ty (
arb.u
nit
s)

Proceedings of the National conference on Advances in Lasers and Spectroscopy (ALS-2012) 01-03 November,
2012, pp.123-130, ISM Dhanbad, India
Paper Code. No. TP-xx
TP-xx-7
Plagioclase Feldspar
Feldspar is generally associated with the aluminosilicate magmas and the resulting minerals. The
feldspar shows the large shifts in the region of 200 cm-1 to 600 cm-1 with dominant peak in
309cm-1 and 503 cm-1 [9, 8].
Gypsum (hydrous sulfate)
The strongest Raman shift of gypsum is visible in the translational modes H2O-Ca at 316 cm-1.
Minor shifts are visible for the stretching vibration mode of water at the characteristic band of
941 cm-1 and at the symmetric bending of the SO4-tetrahedra at 594 cm-1 [7, 10 ].
210
230
300 500 700 900 1100 1300 1500 6
74
220
13
40
310
54
8
Si-O-Si, Si-O
Al-O
Raman Shift (cm-1
)
Ram
an I
nte
nsi
ty (
arb
.un
its)
900
1800
200 400 600 800 1000 1200 1400
430
503
390
197
280
559
1096
Raman Shift (cm-1
)
Ram
an I
nte
nsi
ty (
arb.u
nit
s)
Proceedings of the National conference on Advances in Lasers and Spectroscopy (ALS-2012) 01-03 November,
2012, pp.123-130, ISM Dhanbad, India
Paper Code. No. TP-xx
TP-xx-8
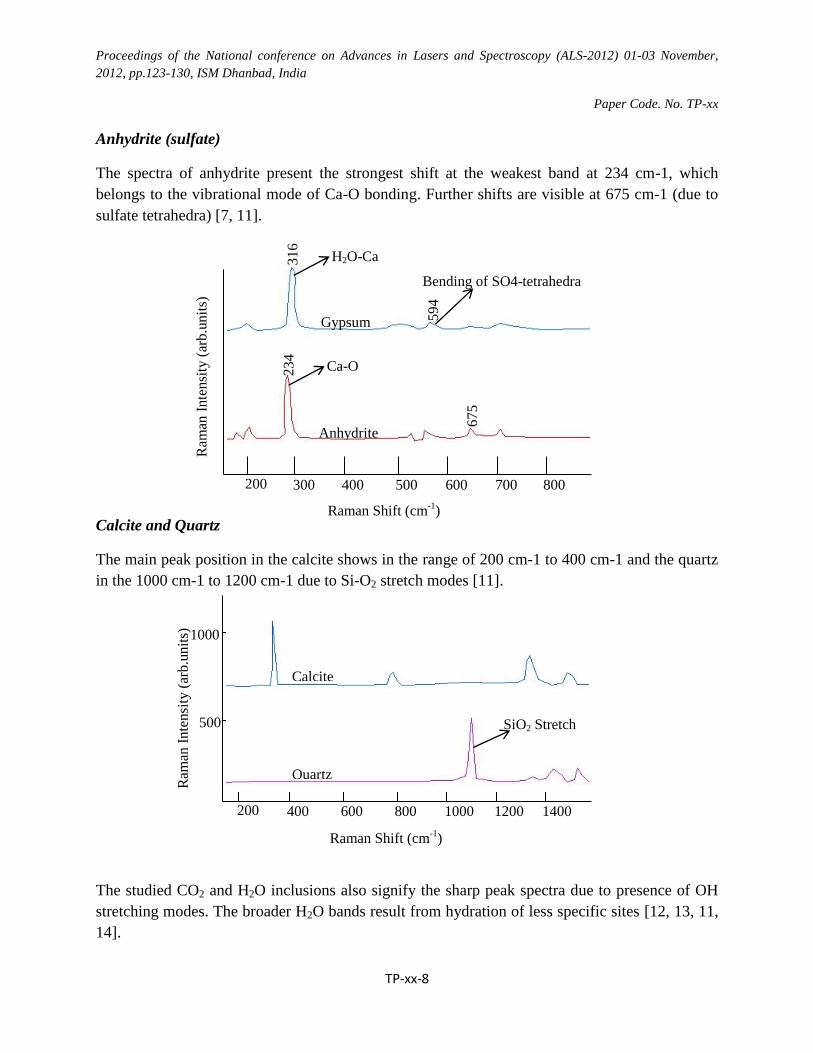
Anhydrite (sulfate)
The spectra of anhydrite present the strongest shift at the weakest band at 234 cm-1, which
belongs to the vibrational mode of Ca-O bonding. Further shifts are visible at 675 cm-1 (due to
sulfate tetrahedra) [7, 11].
Calcite and Quartz
The main peak position in the calcite shows in the range of 200 cm-1 to 400 cm-1 and the quartz
in the 1000 cm-1 to 1200 cm-1 due to Si-O2 stretch modes [11].
The studied CO2 and H2O inclusions also signify the sharp peak spectra due to presence of OH
stretching modes. The broader H2O bands result from hydration of less specific sites [12, 13, 11,
14].
200 300 400 500 600 700 800
23
4
31
6
59
4
675
Gypsum
Anhydrite
H2O-Ca
Bending of SO4-tetrahedra
Ca-O
Raman Shift (cm-1
)
Ram
an I
nte
nsi
ty (
arb
.un
its)
500
1000
200 400 600 800 1000 1200 1400
670
38
7
SiO2 Stretch
Calcite
Quartz
Raman Shift (cm-1
)
Ram
an I
nte
nsi
ty (
arb.u
nit
s)

Proceedings of the National conference on Advances in Lasers and Spectroscopy (ALS-2012) 01-03 November,
2012, pp.123-130, ISM Dhanbad, India
Paper Code. No. TP-xx
TP-xx-9
Fluid Inclusions and Mantle Evolution
Fluid inclusions entrapped in various minerals provide the direct information of the mantle
processes. They are important for the understanding the nature of the mantle and the varieties of
processes such as metasomatism, partial melting, fuid/melt percolation melt and fluid inclusions
in minerals as a sample for the study of the nature and evolution of the mantle fluids. The
enrichment of the clinopyroxenes in Al2O3, TiO2, Na2O, and Zr, and the presence of fluid
inclusions in the xenoliths provide strong evidence for fluid-related cryptic metasomatism of the
minerals/rocks [15]. The presence of magnesite and quartz in various inclusions are the products
of a post entrapment carbonation reaction, whereby the reactants are the CO2-richfluid and the
host orthopyroxenes. The lack of water, observed in several fluid inclusions shows the evidences
for dry conditions in upper mantle sources. However, due to the rapid rate of diffusion of water-
derived species in olivine the low hydrogen concentration within fluid inclusions in olivine is not
indicative of low water content in the mantle [16].
The study of the above mentioned inclusions with the use of LRS technique also provides an
estimate of the pressure of trapping. If the temperature of trapping is known, then the pressure of
trapping is given by the intersection of the fluid inclusion isochore (line that represent the range
of P-T conditions over which a fluid of that density was trapped) with the isotherm, [17]. In
upper mantle xenoliths the co-genetic relationship between fluid and melt inclusions allows to
constrain the P-T trapping conditions. Therefore, the homogenization temperature of the melt
inclusions is genetically related to the fluid inclusions and is considered as being close to the
trapping temperature. This assumption and the estimated density at the time of trapping allow an
estimation of the pressure prevailing at the time of trapping.
Conclusion
The study concludes the importance of Raman spectra for identification of minerals and history
of their formations in the interior of the Earth. It suggest the different layers of mantle with
defined set of temperatures, pressures and fluids responsible for the different surface and
subsurface geological activities with the subsequent mineral genesis. The study also reveals the
information related to existence of metastable phases during the crystallization of the melt.
Acknowledgement
The authors thankfully acknowledge the financial assistance provided by the University Grants
Commission under the CSIR-UGC (NET-JRF) and Research Project Scheme to carry out this
work. Further, the authors are also thankful to Prof.D.C.Panigrahi (Director) Indian School of
Mines, Dhanbad-826 004, India for their inspirations and administrative supports.

Proceedings of the National conference on Advances in Lasers and Spectroscopy (ALS-2012) 01-03 November,
2012, pp.123-130, ISM Dhanbad, India
Paper Code. No. TP-xx
TP-xx-10
References
[1] E. Roedder, Fluid inclusion evidence of mantle fluids, Pub. by Virginia Tech, pp.288-295,
(1994).
[2] M.L. Frezzotti and T. Andersenb, Carbonatite melt–CO2 fluid inclusions in mantle xenoliths
from Tenerife, Canary Islands: a story of trapping, immiscibility and fluid–rock interaction in the
upper mantle, Lithos, Vol.64 77–96, (2002).
[3] J. Blacksberg and G.R.Rossman, On-Surface Planetary Mineralogy Using Time Resolved
Raman and Fluorescence Spectroscopy, 42nd Lunar and Planetary Science Conference (2011).
[4] J.L. Pasteris, C.A.Kuehn and R.J.Bodnar Applications of Laser Raman Microprobe
RAMANOR U-1000 to Hydrothermal ore deposits: Carlin as an example. Economic Geology,
Vol.81, pp. 915-930, (1986).
[5] K. Clark, Raman Spectroscopy of Colossal Magneto-resistive Perovskite Material, REU
Summer, National Science Foundation (2001).
[6] L. J Bradley, W. Alian, and L. A.Haskin., Identification of Minerals in Several Martian
Surface Analog Materials by Raman Spectroscopy, Lunar and Planetary Science, XXVIII
(2011).
[7] W. Alian , L. J. Bradley and L. A. Haskin, Raman spectroscopy as a method for mineral
identification on lunar robotic exploration missions, Journal Of Geophysical Research, Vol.
100, No. El0, pp.189-21, (1995).
[8] Weber, U. Bottger and E.K. Jessberger, Raman Spectroscopy of Mars Relevant Minerals for
Planetary Exploration, 43rd
Lunar and Planetary Science Conference (2012).
[9] E. Roedder, Fluid Inclusions. Geol. Soc. Am. Rev. Mineral, Vol.12, pp.644 (1984).
[10] W. R. C. Somerville, E. C. Le Ru, P. T. Northcote, and P. G. Etchegoin, High performance
Raman spectroscopy with simple optical components, Am. J. Phys.Vol.78, (2010).
[11] D. S. Gregory, J.H Robin., Raman microscopy in archaeological science, Journal of
Archaeological Science, Vol.31, pp. 1137–1160 (2004).
[12] M. Berkesi, K. Hidas, T.Guzmics, J. Dubessy, Detection of small amounts of H2O inCO2-
richfluid inclusions using Raman spectroscopy, J. Raman Spectrosc., Vol.40, pp.1461–
1463,(2009).

Proceedings of the National conference on Advances in Lasers and Spectroscopy (ALS-2012) 01-03 November,
2012, pp.123-130, ISM Dhanbad, India
Paper Code. No. TP-xx
TP-xx-11
[13] R. Kaldos, M. Berkesi, , K. Hidas, CO2-SO2-H2O fluid inclusions in peridotite xenoliths
from Jeju Island (South Korea) European Current Research on Fluid Inclusions (ECROFI-
XXI),pp. 112, (2011).
[14] J. Dubessy, Abstacts of the 12th meeting of International Mineralogical Association, France
(1980).
[15] E.V Maria, Fluid and melt inclusions in upper mantle xenoliths, Mitt. Österr. Miner. Ges.
Vol.142 (1997).
[16] S.J. Mackwell and L. Kohlstedt, Diffusion of hydrogen in olivine: Implication for water in
the mantle, J. Geophys. Res., Vol.95, pp. 5079-5088, (1990).
[17] R.C. Burrus, Analysis of phase equilibria in C-O-H-S, fluid inclusions. Mineralogical
Association of Canada. Short Course in Fluid Inclusions: Application to Petrology. Ed., L.S.
Hollister, and M.L.Crawford, pp. 39-69. (1981).