Quantifying greenhouse gases from the production, transportation and utilization of charcoal in...
10
WOOD AND OTHER RENEWABLE RESOURCES Quantifying greenhouse gases from the production, transportation and utilization of charcoal in developing countries: a case study of Kampala, Uganda Obinna Ekeh & Andreas Fangmeier & Joachim Müller Received: 12 August 2013 /Accepted: 30 May 2014 # Springer-Verlag Berlin Heidelberg 2014 Abstract Purpose This study aims to quantify greenhouse gases (GHGs) from the production, transportation and utilization of charcoal and to assess the possibilities of decreasing green- house gases (GHGs) from the charcoal industry in general in Uganda. It also aims to assess the emission intensity of the Ugandan “charcoal production” sector compared to that of some other major charcoal producing nations. Methods This work was done in accordance with ISO 14040 methodology for life-cycle assessment (LCA), using GABi 4.0—a software for life-cycle assessment. A cradle-to-grave study was conducted, excluding emissions arising from ma- chinery use during biomass cultivation and harvesting. The distance from charcoal production locations to Kampala was estimated using ArcGIS 10.0 software and a GPS tool. Emis- sion data from a modern charcoal production process (PYREG methane-free charcoal production equipment), which complies with the German air quality standards (TA- Luft), was compared with emissions from a traditional char- coal production process. Four coupled scenarios were modelled to account for differences in the quantity of green- house gases emitted from the “traditional charcoal production phase”, “improved charcoal production phase (biomass feed- stock sourced sustainably and unsustainably)”, “transportation phase” and “utilization phase”. Data for this study was obtain- ed via literature review and onsite measurements. Results and discussion The results showed that greenhouse gases emitted due to charcoal supply and use of traditional production technique in Kampala was 1,554,699 tCO 2 eq, with the transportation phase accounting for approximately 0.15 % of total greenhouse gases emitted. The utilization phase (char- coal cookstoves) emitted 723,985 tCO 2 eq (46.6 %), while the charcoal production phase emitted 828,316 tCO 2 eq (53.3 %). Changing the charcoal production technology from a tradi- tional method to an improved production method (PYREG charcoal process) resulted in greenhouse gases reductions for the city of 230,747 tCO 2 eq; however, by using sustainably sourced biomass, this resulted in reductions of 801,817 tCO 2 eq. Conclusions This study showcased and quantified possible GHG emission reduction scenarios for the charcoal industry in Uganda. The result of 3 tCO 2 eq emitted per tonne of charcoal produced, using earth mound method, can be applied to other countries in Eastern Africa where similar charcoal production methods are used; this will allow for somewhat better regional estimates of the inventory of greenhouse gas emissions from the production of charcoal. The results of this study also suggests that the primary use of charcoal for cooking will lead to increases in GHG emis- sions and increases in deforestation on the long term, if legal frameworks are not made to ensure that biomass used for charcoal production is obtained via sustainable sources or if alternative cheap energy-generating technologies for cooking are not developed and deployed to the masses. Keywords Charcoal production . Earth mound kiln . Greenhouse gases . Life-cycle assessment . Methane-free charcoal equipment Responsible editor: Christian Bauer O. Ekeh (*) : A. Fangmeier : J. Müller Department of Conversion Technology and Life-cycle Assessment of Renewable Resources, University of Hohenheim, Garbenstraße 9, 70599 Stuttgart, Germany e-mail: [email protected] O. Ekeh e-mail: [email protected] Int J Life Cycle Assess DOI 10.1007/s11367-014-0765-7
-
Upload
uni-hohenheim -
Category
Documents
-
view
1 -
download
0
Transcript of Quantifying greenhouse gases from the production, transportation and utilization of charcoal in...

WOOD AND OTHER RENEWABLE RESOURCES
Quantifying greenhouse gases from the production,transportation and utilization of charcoal in developing countries:a case study of Kampala, Uganda
Obinna Ekeh & Andreas Fangmeier & Joachim Müller
Received: 12 August 2013 /Accepted: 30 May 2014# Springer-Verlag Berlin Heidelberg 2014
AbstractPurpose This study aims to quantify greenhouse gases(GHGs) from the production, transportation and utilizationof charcoal and to assess the possibilities of decreasing green-house gases (GHGs) from the charcoal industry in general inUganda. It also aims to assess the emission intensity of theUgandan “charcoal production” sector compared to that ofsome other major charcoal producing nations.Methods This work was done in accordance with ISO 14040methodology for life-cycle assessment (LCA), using GABi4.0—a software for life-cycle assessment. A cradle-to-gravestudy was conducted, excluding emissions arising from ma-chinery use during biomass cultivation and harvesting. Thedistance from charcoal production locations to Kampala wasestimated using ArcGIS 10.0 software and a GPS tool. Emis-sion data from a modern charcoal production process(PYREG methane-free charcoal production equipment),which complies with the German air quality standards (TA-Luft), was compared with emissions from a traditional char-coal production process. Four coupled scenarios weremodelled to account for differences in the quantity of green-house gases emitted from the “traditional charcoal productionphase”, “improved charcoal production phase (biomass feed-stock sourced sustainably and unsustainably)”, “transportation
phase” and “utilization phase”. Data for this study was obtain-ed via literature review and onsite measurements.Results and discussion The results showed that greenhousegases emitted due to charcoal supply and use of traditionalproduction technique inKampala was 1,554,699 tCO2eq, withthe transportation phase accounting for approximately 0.15 %of total greenhouse gases emitted. The utilization phase (char-coal cookstoves) emitted 723,985 tCO2eq (46.6 %), while thecharcoal production phase emitted 828,316 tCO2eq (53.3 %).Changing the charcoal production technology from a tradi-tional method to an improved production method (PYREGcharcoal process) resulted in greenhouse gases reductions forthe city of 230,747 tCO2eq; however, by using sustainablysourced biomass, this resul ted in reduct ions of801,817 tCO2eq.Conclusions This study showcased and quantified possibleGHG emission reduction scenarios for the charcoal industryin Uganda. The result of 3 tCO2eq emitted per tonne ofcharcoal produced, using earth mound method, can be appliedto other countries in Eastern Africa where similar charcoalproduction methods are used; this will allow for somewhatbetter regional estimates of the inventory of greenhouse gasemissions from the production of charcoal.
The results of this study also suggests that the primary useof charcoal for cooking will lead to increases in GHG emis-sions and increases in deforestation on the long term, if legalframeworks are not made to ensure that biomass used forcharcoal production is obtained via sustainable sources or ifalternative cheap energy-generating technologies for cookingare not developed and deployed to the masses.
Keywords Charcoal production . Earthmound kiln .
Greenhouse gases . Life-cycle assessment . Methane-freecharcoal equipment
Responsible editor: Christian Bauer
O. Ekeh (*) :A. Fangmeier : J. MüllerDepartment of Conversion Technology and Life-cycle Assessment ofRenewable Resources, University of Hohenheim, Garbenstraße 9,70599 Stuttgart, Germanye-mail: [email protected]
O. Ekehe-mail: [email protected]
Int J Life Cycle AssessDOI 10.1007/s11367-014-0765-7

1 Introduction
1.1 Background
Uganda is a land-locked country situated in East-CentralAfrica with an area covering 241,038 km2, with an estimatedpopulation of 34 million in 2012 and a population growth rateof 3.58 per annum, which is the fourth fastest in the world(Central Intelligence Agency 2012). The Ugandan economyhas been experiencing high growth rates in the last decade,with 7.2 %, 5.2 % and 6.4 % real growth rates for the years2009, 2010 and 2012, respectively (Central IntelligenceAgency 2012). A growing population combined with a grow-ing economy leads to higher energy demand.
Biomass accounts for more than one half of national energyand as much as 95 % of domestic energy in some developingcountries (Reddy 1996). In Uganda, it even contributes over90 % of the total energy consumed and provides almost all theenergy used to meet basic energy needs for cooking and waterheating in rural areas, most urban households, institutions andcommercial buildings. Biomass is themain source of energy forrural industries. Limited availability of electricity and highprices of petroleum products, constitute barriers to a reductionin the demand for biomass. Trading in biomass especiallycharcoal contributes to the rural economy, in terms of ruralincomes, tax revenue and employment. Fuelwood requirementshave contributed to the degradation of forests as wood reservesare depleted at a rapid rate in many regions (MEMD 2007).
In Uganda, like in any other country, the energy sector playsa central role in the economy. Energy is the engine for eco-nomic growth and development and a vital input into all theproductive and social sectors of the economy. Energy issourced basically from firewood, charcoal, petroleum productsand electricity, with contributions of 88 %, 5 %, 6 % and 1 %,respectively (Kisakye 2004). Considering that electrificationaccess in Uganda is still very low, at approximately 9 % na-tionally and 3 % in rural areas (MEMD 2007), this has lead to asteadily increasing demand for biomass for energy generation.
Kampala is the capital of Uganda and also the largest urbansettlement in the country. Data from the last national censusconducted in 2002 shows that the total urban population in thecounty was approximately three million (12.4 % of the coun-try population), and Kampala had a population of 1.2 million(40 % of the entire urban population in the country); thesecond most populous city is Lira, with a population of120,000 (Ugandan Bureau of Statistics 2006).
The Food and Agriculture Organization of the UnitedNations report about 46 million and 47 million tonnes (Mt)of wood charcoal were produced worldwide in 2005 and2010, respectively. Africa produced about 24 million tonnes(Mt) and 28 million tonnes (Mt), while East-Africa producednine million tonnes (Mt) and 11 million tonnes (Mt), in 2005and 2010, respectively (FAO 2012). This implies that East-
Africa accounted for about 20 % and 23 % of the globalproduction of wood charcoal for 2005 and 2010, respectively.
The consumption of charcoal in Uganda has a distinctivepattern, with its consumption mainly in urban settlements,while the urban poor and rural dwellers consume mainlyfuelwood. A study conducted by the Ugandan Ministry ofEnergy and Mineral Development showed that charcoal con-sumption increases at a rate close to the urban growth rate of6 % per annum, clearly establishing the pattern of urbanconsumption (MEMD 2007). With mounting urbanization,the Ugandan populace is increasingly shifting from fuelwoodto charcoal for domestic cooking and heating (Girard 2002).
1.2 Objective
The objective of this study is the assessment of GHG from theproduction, transportation and utilization of charcoal in Kam-pala, Uganda. A cradle-to-grave study was conducted, exclud-ing emissions arising from machinery use during biomasscultivation and harvesting.
No study has been conducted to quantify the emissions thatresults from the operations of the charcoal industry—produc-tion, supply and consumption—for Kampala City and theentire country at large. Greenhouse gas (GHG) emissionsfrom charcoal result from three distinct processes: land-usechange (LUC) processes induced by wood harvest; pyrolysisof woody feedstock and combustion of charcoal. This studyincludes emissions resulting from the transportation of fin-ished charcoal. It is important to distinguish this type ofemission study from health-focused assessments. Air pollu-tion studies evaluate the concentrations of particulate matter,carbon monoxide or other pollutants in a room or wherepeople are exposed and pollutants in the outdoor environment.Emission studies assess the quantity or rate of pollutantsemitted from a process. It is also important to understand theterms, sustainably and unsustainably obtained biomass:
Biomass feedstock is said to have been obtained sustain-ably, thus defined as renewable, if,
(1) the land remains a forest;(2) sustainable management practices are in place to ensure
that the level of carbon stocks does not systematicallydecrease over time (stocks may temporarily decrease dueto harvesting); and
(3) all national or regional forestry and nature conservationregulations are complied with. Biomass that fails tomeet all three conditions is “non-renewable biomass”(NRB) by default, thus unsustainably obtained (CDM-EB 2006).
Under optimal conditions, biomass combustion results al-most entirely in the emission of water vapour and carbondioxide (CO2). Water vapour, the most prevalent GHG in the
Int J Life Cycle Assess
atmosphere, is quickly incorporated in the hydrologic cyclewith no measurable warming effect, and CO2, the most com-mon anthropogenic GHG, can be absorbed by new plantgrowth through photosynthesis. Therefore, if biomass is har-vested in a sustainable way so that its long-term stocks are notdepleted and burned under ideal combustion conditions, it iseffectively GHG neutral (Bailis et al. 2003).
The production, transportation and utilization of charcoalconstitute a critical energy and economic cycle in the economyof the country. Intertwined in “charcoal production” are its globalwarming effects because much of the feedstock used for pro-duction are sourced from unsustainably managed plantations,leading to net carbon dioxide emissions. In addition, the pyrol-ysis of biomass also produces products of incomplete combus-tion (PICs), such as methane and non-methane volatile organicsubstances (NMVOCs), which have a higher GWP than carbondioxide. The “transportation phase” also contributes to globalwarming by greenhouse gases emitted from the combustion offuel in diesel/gasoline powered trucks. The “utilization phase”(cookstove) emits greenhouse gases when charcoal is burnt forenergy, also, products of incomplete combustion (PICs) emittedwhen charcoal is burnt constitute a major source of in-door airpollution, with its negative multiplier effects on human health.
1.3 Procedure
To quantify the emissions, the ISO 14040 methodology forlife-cycle assessments (LCA) has been applied. The sections 1,2, 3 and 3.4 of this work represent the “Goal and scopedefinition”, “Inventory analysis”, “Impact assessment” and“Interpretation”, respectively, according to the ISO 14040methodology for LCAs. Four scenarios were modelled. Sce-narios 1–3 and 4 assessed GHG-related emissions for Kam-pala city and the entire country, Uganda, respectively.
i. Scenario 1: The first scenario will quantify emissions froman “Earth mound charcoal production process” coupled toemissions from transportation phase and coupled to “uti-lization phase (charcoal burning)” of charcoal. For thisscenario, its assumed biomass feedstock is obtainedunsustainably. The summation of emissions from the threephases represents total emissions for scenario 1.
ii. Scenario 2: The second scenario will quantify emissionsfrom a “methane-free pyrolysis charcoal plant” coupled toemissions from the transportation phase and coupled toemissions from the utilization phase (charcoal burning).For the second scenario, it was assumed that the biomassfeedstock is obtained unsustainably. The methane-freecharcoal equipment used in the entire study is called“PYREG process equipment” manufactured by PYREGGmBH, a German equipment manufacturer. The equip-ment complies with the German technical instructions on
air quality control—TA Luft, which is amongst thestrictest in the world.
iii. Scenario 3: The third scenario will quantify emissionsfrom a methane-free pyrolysis charcoal plant coupled tothe emissions from the transportation phase and theemissions from utilization phase (charcoal burning). Forthe third scenario, it was assumed that the biomass feed-stock is obtained from a sustainably managed plantation,thus biogenic CO2 emission is excluded from inventory.This scenario will assess GHG-related emissions for thecity of Kampala alone.
iv. Scenario 4: The fourth scenario will quantify emissionsfrom an Earth mound charcoal production processcoupled to emissions from the utilization phase (charcoalburning) and assume the biomass feedstock is obtainedunsustainably.
The result from the first scenario modelled would provide anestimate of the total greenhouse gases emitted due to demand ofcharcoal in Kampala. By decoupling the model, the utilizationphase provides estimates of emissions from charcoal cookstovesin Kampala alone. These results would be useful when compil-ing a national greenhouse gas (GHG) inventory. By comparingtotal emissions in scenario 1 and scenario 2, the result wouldprovide an estimate of possible GHG emission reductions fromchanges in charcoal production technology. Also, by comparingtotal emissions from scenario 1 and scenario 3, the results wouldprovide an estimate of possible emission reductions from chang-es in charcoal production technology and changeswhen biomassfeedstock is sourced sustainably. The result from the fourthscenario would provide an estimate of emissions from charcoalproduction and utilization for the entire country.
2 Materials and methods
2.1 Materials
Hardware’s used: a personal computer and a handheld GPS.
2.2 Data sources
The sources of data are grouped into the three unit operationsthat make up the life cycle of charcoal, namely, production,transportation and utilization.
1) Production data
a) Improved charcoal production:
& Quantitative data on input-output flows (amount of bio-mass required and corresponding amount of charcoal
Int J Life Cycle Assess

produced) of PYREG charcoal production plant were ob-tained from the manufacturer, PYREG GmbH,Trinkbornstrasse 15–17, 56281, Dörth, Germany.
& Non-CO2 emissions were derived using the German Tech-nical instructions on Air Quality Control—TA Luft, sec-tion 5.2.
& Carbon dioxide emissions were derived using the IPCC2006 Guidelines for National Greenhouse Gases Invento-ry, volume 5, Waste, Chapters 2 and 5.
& Emission factors from electricity generationwere obtainedfrom the US Department of Energy, Energy InformationAdministration.b) Earth mound charcoal production:
& Data was obtained from a study conducted by Pennise et al2001, “Emissions of greenhouse gases and other airbornepollutants from charcoal making in Kenya and Brazil”.
2) Transportation data and data on amount of charcoal con-sumed in Kampala
& GPS coordinates of Owino market, charcoal section,Kampala, were obtained with a handheld GPS device,on site.
& Data on supply of charcoal to Kampala in 2004,showing quantitative amounts of charcoal comingfrom different districts in the country to Kampala,was obtained from a German Society for Interna-tional Cooperation (GIZ)-sponsored project in2004, titled “A study on charcoal supply inKampala”.
& Administrative and road vector data, used to estimatethe total distance travelled, was obtained from“AFRICOVER” an FAO multipurpose database onenvironmental resources.
3) Data on emission factors from charcoal burning
& Data was obtained from literature “Emission factorsfor open and domestic biomass burning for use inatmospheric models” (Akagi et al. 2011).
4) Amount of charcoal produced in Uganda from 1965 to2011 was obtained from FAOSTAT.
2.3 Methods
The system boundaries of the work covered the produc-tion of charcoal, the transportation of charcoal and itsutilization.
A functional unit of 1 kg of charcoal was the basis of theanalysis; this was chosen for easy comparability with previous
related studies in literature and comparability of differentscenarios modelled in this study.
GaBi 4.0 software was used to calculate the total amount ofgreenhouse gases for the charcoal production and utilizationphase, using the CML December 7, 2001, global warmingpotential impact assessment characterization factors.
Figure 1 shows a flow diagram showing the procedurefollowed in this study:
Step 1 Preparing input-output inventory of unit processes ofcharcoal life cycle in GaBi 4.0 sustainabilitysoftware.
Step 2 Excel-based assessment to derive Ugandan charcoalproduction data for the years 2010, 2015 and 2020.
The yearly charcoal production data for 1965–2011 was plotted against time (year), this gave anR2 value of 99.5 %, on the basis of the high correla-tion between yearly production amount and time;trend analysis in Microsoft Excel 2007 was used toderive data for 2012–2023.
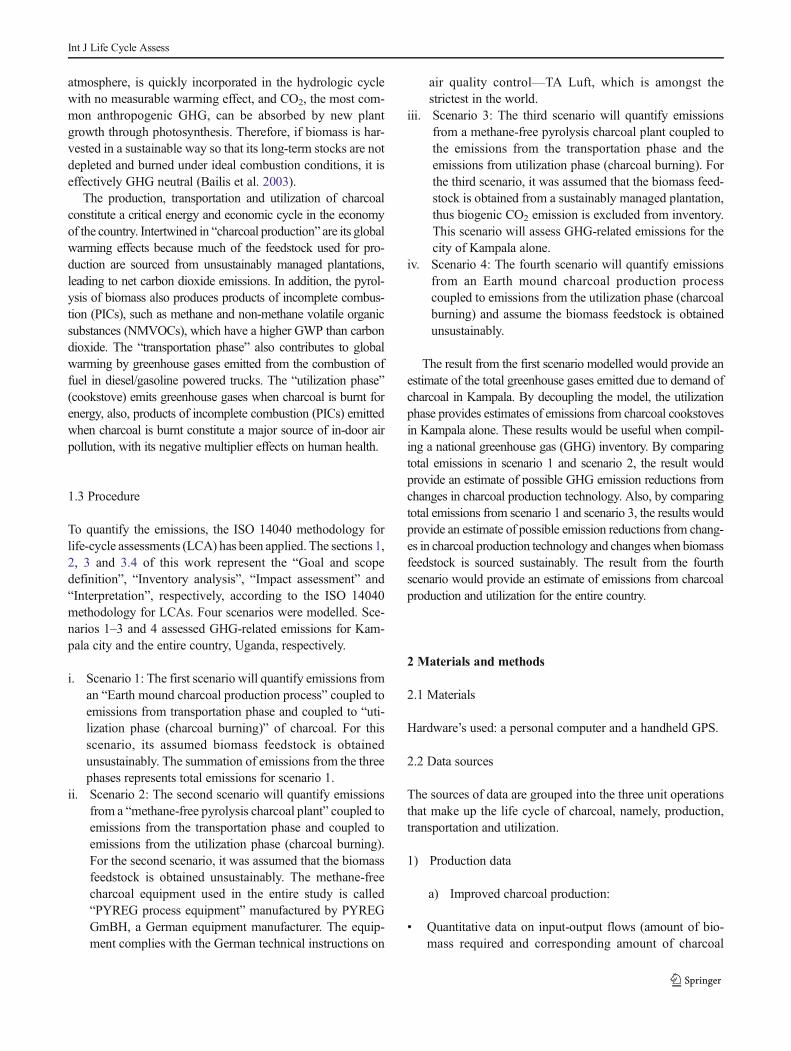
Step 3 A GIS-based assessment using the “Network Ana-lyst” extension in ArcGIS 10.0 was used to estimatethe total distance covered in the supply chain, fromproduction locations to Kampala main charcoal mar-ket. Figure 2 shows a measured distance form onecharcoal production location—Masindi—toKampala.
Step 4 Transportation modelThe World resource Institute GHG Protocol
Excel-based tool for calculating greenhouse gasesfrom mobile combustion sources was used (WorldResource Institute 2012). IPCC default emission fac-tors, characterization factors and estimate of totaldistance travelled from charcoal production sites toKampala served as input data.
Step 5 Modelling of scenarios using the GaBi 4.0 soft-ware. The software was used to calculate charcoalproduction- and “charcoal utilization-” related GHGemissions of scenarios 1–4 stated in section 1.3.
(1) Scenarios 1–3: Computation was done based on afunctional unit of 1 kg of charcoal produced and uti-lized; this was then extrapolated to—279,664 tonnes—the total amount of charcoal supplied to Kampala, forthe year of study—2004.
(2) Scenario 4: This scenario assessed GHG emis-sions for the entire country. Computation wasdone based on a functional unit of 1 kg of char-coal produced and utilized; this was extrapolatedto—792,417 tonnes—the total amount of char-coal produced in Uganda, for—2004—the yearof study. Three additional sub-scenarios weremodelled for the years 2011, 2015 and 2020 to
Int J Life Cycle Assess

calculate annual greenhouse gases in CO2 equiv-alence emitted, respectively.
3 Results and discussion
3.1 Greenhouse gases from the transportation phase
Using the input data derived from the GIS-based analysiscarried out, the World Resource Institute’s (WRI) excel-based model for calculating greenhouse gases from mobilesources gave a result of 2,397.5 tCO2eq.
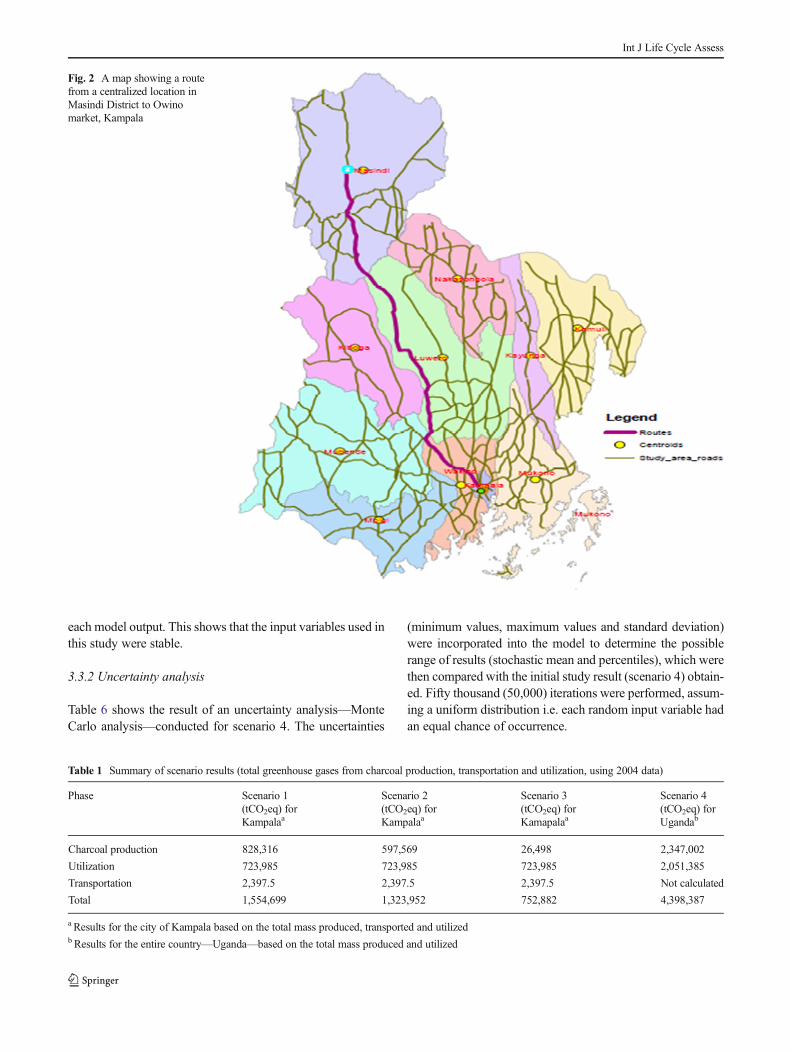
3.2 Summary of results
Tables 1, 2, and 3 show the results of the four scenariosmodelled including the transportation phase, using 2004 data;future projections of greenhouse gases emissions from char-coal and annual amount of biomass consumed and biomassconsumption projections for charcoal production in Uganda,respectively. In Table 1, we observe that the results of scenar-ios 1–3 for the utilization phase and the “transportationsphase” are the same for each respective scenario.
Figure 3 shows the results for the different “charcoal pro-duction phase” scenarios.
3.2.1 Issues related to the transportation phase
The distance computed from charcoal production locations toKampala had some shortcomings. Charcoal is sold at differentrandom temporary locations in small scale in the districts. Tomeasure the distance from these locations, a centralized loca-tion for each district was computed using ArcGIS 10.0 soft-ware, thus, the resulting distance from districts to Kampala,which was used to compute the resulting greenhouse gases,was underestimated. However, when we consider that mosttrucks upon delivery of charcoal to Kampala return to produc-tion locations empty, that means computing for a two-way triprather than a one-way trip would result in an increase ingreenhouse gases from the transportation phase by a factorof 2.
3.3 Sensitivity and uncertainty analysis
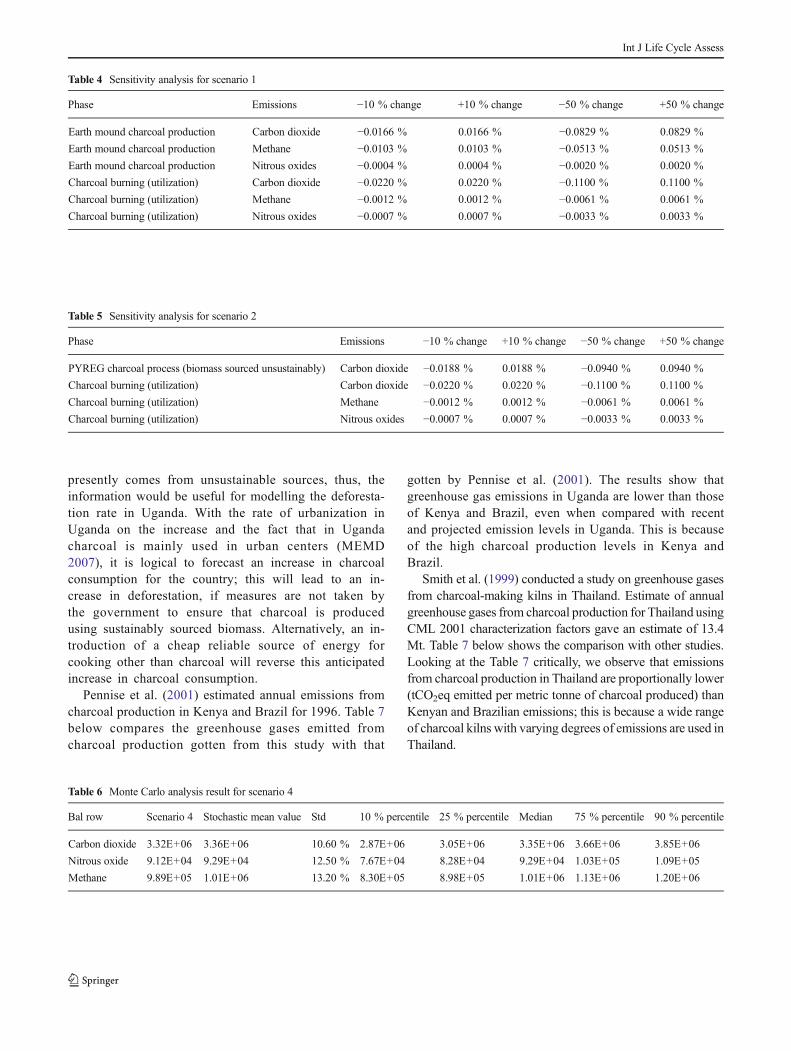
3.3.1 Sensitivity analysis
Tables 4 and 5 show the results for sensitivity analysis con-ducted for scenario 1 and scenario 2, respectively. The resultsof the one-way sensitivity analysis (Tables 4 and 5) show thatfor each greenhouse gas (carbon dioxide, nitrous oxide andmethane) which served as a parameterized input in themodels, a change of 10 and 50 % in its value resulted in amaximum deviation of ±0.022 and ±0.11 %, respectively, for
Preparing the various unit processes of a charcoal lifecycle and modeling the inventory data using GaBi 4.0 so�ware
A GIS-based assessment to es�mate the total distance covered in the supply chain
Excel based assessment to derive data for 2015 & 2020 total charcoal consump�on in Uganda, using trend analysis
Modeling different scenarios using GaBi 4.0 so�ware
Goal se�ng and scope defini�on
Literature review
Input data
Field data
Results calculated using GaBi 4.0 so�ware and presented using JMP sta�s�cal so�ware
Sensi�vity analysis and Uncertainty analysis
Es�mate of greenhouse gases from the transporta�on phase calculated using WRI GHG Protocol tool for mobile combus�on
Fig. 1 Procedure flow diagram
Int J Life Cycle Assess
each model output. This shows that the input variables used inthis study were stable.
3.3.2 Uncertainty analysis
Table 6 shows the result of an uncertainty analysis—MonteCarlo analysis—conducted for scenario 4. The uncertainties
(minimum values, maximum values and standard deviation)were incorporated into the model to determine the possiblerange of results (stochastic mean and percentiles), which werethen compared with the initial study result (scenario 4) obtain-ed. Fifty thousand (50,000) iterations were performed, assum-ing a uniform distribution i.e. each random input variable hadan equal chance of occurrence.
Fig. 2 A map showing a routefrom a centralized location inMasindi District to Owinomarket, Kampala
Table 1 Summary of scenario results (total greenhouse gases from charcoal production, transportation and utilization, using 2004 data)
Phase Scenario 1(tCO2eq) forKampalaa
Scenario 2(tCO2eq) forKampalaa
Scenario 3(tCO2eq) forKamapalaa
Scenario 4(tCO2eq) forUgandab
Charcoal production 828,316 597,569 26,498 2,347,002
Utilization 723,985 723,985 723,985 2,051,385
Transportation 2,397.5 2,397.5 2,397.5 Not calculated
Total 1,554,699 1,323,952 752,882 4,398,387
a Results for the city of Kampala based on the total mass produced, transported and utilizedb Results for the entire country—Uganda—based on the total mass produced and utilized
Int J Life Cycle Assess

To determine the reliability of the study results, an un-certainty analysis (Monte Carlo simulation) was conductedfor scenario 4. Comparing the results of the 10th percentile,the 90th percentile and the study result (see Table 6), weobserve all results of the simulation are of the same order ofmagnitude and the study result specifically falls in betweenthe 10th and 90th percentile values. This confirms that theestimates gotten in this study are reliable, thus validating thestudy conducted. Parameters tested were literature-sourcedcarbon dioxide, nitrous oxide and methane data used inmodelling scenario 4.
3.4 Discussion
3.4.1 Discussion of results
The result of scenario 1 showed emissions of 1,554,699 tCO2eq.This value represents the total amount of greenhouses gases
(GHGs) emitted due to demand of charcoal in Kampala. Theutilization phase in this scenario gave a result of723,985 tCO2eq; this value represents an estimate ofgreenhouse gases emitted from charcoal cookstoves inKampala. It is worthy to note that data used for theutilization phase, i.e. charcoal burning, represents emis-sions for both traditional and improved cookstoves.
The result of scenario 2 had emissions of 1,323,952 tCO2eq;this value represents the total amount of greenhouse gasesemitted due to demand of charcoal in Kampala, when biomassis sourced unsustainably and charcoal is produced using im-proved production technologies. By decoupling the model andcomparing only greenhouse gases from charcoal productionphases for scenarios 1 and 2, scenario 2 had a reduction(savings) of 230,747 tCO2eq (27.9 % decrease). This emissionreduction was due to the use of a “methane-free” charcoalproduction process in scenario 2.
The result of scenario 3 had emissions of 752,882 tCO2eq.This value represents the total amount of greenhouse gasesemitted due to demand of charcoal in Kampala, when bio-mass is sourced sustainably and charcoal is produced usingimproved production technologies. By decoupling the modeland comparing greenhouses gases from charcoal productionphases for scenarios 1 and 3, scenario 3 had a reduction(savings) of 801,817 tCO2eq (96.8 % decrease). GHG emis-sions of scenario 3 are lower than those of scenarios 1 and 2because biomass used in the charcoal production process wasassumed to be sourced sustainably, thus CO2 neutral and amethane-free charcoal production process was used in sce-nario 3. The share of the utilization phase and the transporta-tion phase on the overall emissions increases if productionemissions decrease.
The result of scenario 4 shows estimates for green-house gases from charcoal production and its utilizationfor the entire country. By decoupling the model, thecharcoal production phase shows the amount of biomasswhich was/will be used for the production of charcoal inthe country for the years 2004, 2011, 2015 and 2020,respectively. This piece of data is quite important becausebiomass (wood), used for charcoal production in Uganda,
Table 2 Future projections of greenhouse gases emissions from charcoalproduction (earth mound production process) and utilization in Uganda
Year tCO2eq emittedd
2004a 4,398,387.58
2011b 5,173,918.44
2015 projectionc 5,384,927.46
2020 projectionc 5,830,158.39
a Calculated using FAO estimate of charcoal produced for 2004b Calculated using FAO estimate of charcoal produced for 2011c Calculated using FAO estimates of charcoal produced for 1965–2011 toderive input data for 2015 and 2020d Results based on total mass of charcoal produced and utilized inUganda.
Table 3 Annual amount of biomass consumed and biomass consump-tion projections for charcoal production in Uganda
Biomass consumed Metric tonned (t)
2004a 2,852,701
2011b 3,353,278
2015c 3,492,550
2020c 3,781,317
Charcoal production process and efficiency of biomass conversion tocharcoal are based on a study conducted by Pennise et al. 2001, “Emis-sions of greenhouse gases and other airborne pollutants from charcoalmaking in Kenya and Brazil”a Calculated using FAO estimate of charcoal produced for 2004b Calculated using FAO estimate of charcoal produced for 2011c Calculated using FAO estimates of charcoal produced for 1965–2011 toderive input data for 2015 and 2020d Results based on total mass of charcoal produced and utilized in Uganda
0 1,000,000 2,000,000 3,000,000
Scenario 1 (tCO2eq) forKampala
Scenario 2 (tCO2eq) forKampala
Scenario 3 (tCO2eq) forKamapala
Scenario 4 (tCO2eq) forUganda
Charcoal produc�on
Fig. 3 Charcoal production scenarios
Int J Life Cycle Assess
presently comes from unsustainable sources, thus, theinformation would be useful for modelling the deforesta-tion rate in Uganda. With the rate of urbanization inUganda on the increase and the fact that in Ugandacharcoal is mainly used in urban centers (MEMD2007), it is logical to forecast an increase in charcoalconsumption for the country; this will lead to an in-crease in deforestation, if measures are not taken bythe government to ensure that charcoal is producedusing sustainably sourced biomass. Alternatively, an in-troduction of a cheap reliable source of energy forcooking other than charcoal will reverse this anticipatedincrease in charcoal consumption.
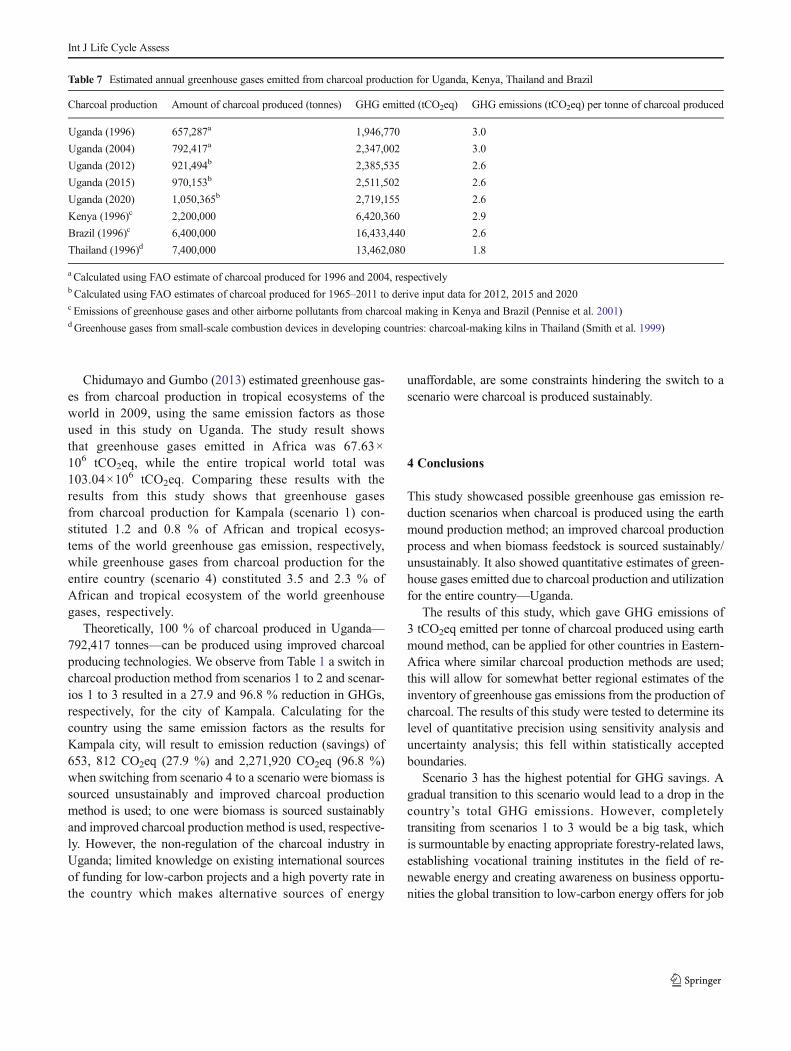
Pennise et al. (2001) estimated annual emissions fromcharcoal production in Kenya and Brazil for 1996. Table 7below compares the greenhouse gases emitted fromcharcoal production gotten from this study with that
gotten by Pennise et al. (2001). The results show thatgreenhouse gas emissions in Uganda are lower than thoseof Kenya and Brazil, even when compared with recentand projected emission levels in Uganda. This is becauseof the high charcoal production levels in Kenya andBrazil.
Smith et al. (1999) conducted a study on greenhouse gasesfrom charcoal-making kilns in Thailand. Estimate of annualgreenhouse gases from charcoal production for Thailand usingCML 2001 characterization factors gave an estimate of 13.4Mt. Table 7 below shows the comparison with other studies.Looking at the Table 7 critically, we observe that emissionsfrom charcoal production in Thailand are proportionally lower(tCO2eq emitted per metric tonne of charcoal produced) thanKenyan and Brazilian emissions; this is because a wide rangeof charcoal kilns with varying degrees of emissions are used inThailand.
Table 4 Sensitivity analysis for scenario 1
Phase Emissions −10 % change +10 % change −50 % change +50 % change
Earth mound charcoal production Carbon dioxide −0.0166 % 0.0166 % −0.0829 % 0.0829 %
Earth mound charcoal production Methane −0.0103 % 0.0103 % −0.0513 % 0.0513 %
Earth mound charcoal production Nitrous oxides −0.0004 % 0.0004 % −0.0020 % 0.0020 %
Charcoal burning (utilization) Carbon dioxide −0.0220 % 0.0220 % −0.1100 % 0.1100 %
Charcoal burning (utilization) Methane −0.0012 % 0.0012 % −0.0061 % 0.0061 %
Charcoal burning (utilization) Nitrous oxides −0.0007 % 0.0007 % −0.0033 % 0.0033 %
Table 5 Sensitivity analysis for scenario 2
Phase Emissions −10 % change +10 % change −50 % change +50 % change
PYREG charcoal process (biomass sourced unsustainably) Carbon dioxide −0.0188 % 0.0188 % −0.0940 % 0.0940 %
Charcoal burning (utilization) Carbon dioxide −0.0220 % 0.0220 % −0.1100 % 0.1100 %
Charcoal burning (utilization) Methane −0.0012 % 0.0012 % −0.0061 % 0.0061 %
Charcoal burning (utilization) Nitrous oxides −0.0007 % 0.0007 % −0.0033 % 0.0033 %
Table 6 Monte Carlo analysis result for scenario 4
Bal row Scenario 4 Stochastic mean value Std 10 % percentile 25 % percentile Median 75 % percentile 90 % percentile
Carbon dioxide 3.32E+06 3.36E+06 10.60 % 2.87E+06 3.05E+06 3.35E+06 3.66E+06 3.85E+06
Nitrous oxide 9.12E+04 9.29E+04 12.50 % 7.67E+04 8.28E+04 9.29E+04 1.03E+05 1.09E+05
Methane 9.89E+05 1.01E+06 13.20 % 8.30E+05 8.98E+05 1.01E+06 1.13E+06 1.20E+06
Int J Life Cycle Assess
Chidumayo and Gumbo (2013) estimated greenhouse gas-es from charcoal production in tropical ecosystems of theworld in 2009, using the same emission factors as thoseused in this study on Uganda. The study result showsthat greenhouse gases emitted in Africa was 67.63×10⁶ tCO2eq, while the entire tropical world total was103.04×106 tCO2eq. Comparing these results with theresults from this study shows that greenhouse gasesfrom charcoal production for Kampala (scenario 1) con-stituted 1.2 and 0.8 % of African and tropical ecosys-tems of the world greenhouse gas emission, respectively,while greenhouse gases from charcoal production for theentire country (scenario 4) constituted 3.5 and 2.3 % ofAfrican and tropical ecosystem of the world greenhousegases, respectively.
Theoretically, 100 % of charcoal produced in Uganda—792,417 tonnes—can be produced using improved charcoalproducing technologies. We observe from Table 1 a switch incharcoal production method from scenarios 1 to 2 and scenar-ios 1 to 3 resulted in a 27.9 and 96.8 % reduction in GHGs,respectively, for the city of Kampala. Calculating for thecountry using the same emission factors as the results forKampala city, will result to emission reduction (savings) of653, 812 CO2eq (27.9 %) and 2,271,920 CO2eq (96.8 %)when switching from scenario 4 to a scenario were biomass issourced unsustainably and improved charcoal productionmethod is used; to one were biomass is sourced sustainablyand improved charcoal production method is used, respective-ly. However, the non-regulation of the charcoal industry inUganda; limited knowledge on existing international sourcesof funding for low-carbon projects and a high poverty rate inthe country which makes alternative sources of energy
unaffordable, are some constraints hindering the switch to ascenario were charcoal is produced sustainably.
4 Conclusions
This study showcased possible greenhouse gas emission re-duction scenarios when charcoal is produced using the earthmound production method; an improved charcoal productionprocess and when biomass feedstock is sourced sustainably/unsustainably. It also showed quantitative estimates of green-house gases emitted due to charcoal production and utilizationfor the entire country—Uganda.
The results of this study, which gave GHG emissions of3 tCO2eq emitted per tonne of charcoal produced using earthmound method, can be applied for other countries in Eastern-Africa where similar charcoal production methods are used;this will allow for somewhat better regional estimates of theinventory of greenhouse gas emissions from the production ofcharcoal. The results of this study were tested to determine itslevel of quantitative precision using sensitivity analysis anduncertainty analysis; this fell within statistically acceptedboundaries.
Scenario 3 has the highest potential for GHG savings. Agradual transition to this scenario would lead to a drop in thecountry’s total GHG emissions. However, completelytransiting from scenarios 1 to 3 would be a big task, whichis surmountable by enacting appropriate forestry-related laws,establishing vocational training institutes in the field of re-newable energy and creating awareness on business opportu-nities the global transition to low-carbon energy offers for job
Table 7 Estimated annual greenhouse gases emitted from charcoal production for Uganda, Kenya, Thailand and Brazil
Charcoal production Amount of charcoal produced (tonnes) GHG emitted (tCO2eq) GHG emissions (tCO2eq) per tonne of charcoal produced
Uganda (1996) 657,287a 1,946,770 3.0
Uganda (2004) 792,417a 2,347,002 3.0
Uganda (2012) 921,494b 2,385,535 2.6
Uganda (2015) 970,153b 2,511,502 2.6
Uganda (2020) 1,050,365b 2,719,155 2.6
Kenya (1996)c 2,200,000 6,420,360 2.9
Brazil (1996)c 6,400,000 16,433,440 2.6
Thailand (1996)d 7,400,000 13,462,080 1.8
a Calculated using FAO estimate of charcoal produced for 1996 and 2004, respectivelyb Calculated using FAO estimates of charcoal produced for 1965–2011 to derive input data for 2012, 2015 and 2020c Emissions of greenhouse gases and other airborne pollutants from charcoal making in Kenya and Brazil (Pennise et al. 2001)d Greenhouse gases from small-scale combustion devices in developing countries: charcoal-making kilns in Thailand (Smith et al. 1999)
Int J Life Cycle Assess
creation, especially in developing countries. The results of thisstudy also suggest that the primary use of charcoal for cookingwill lead to increases in GHG emissions and increases indeforestation on the long term, if alternative cheap energy-generating technologies for cooking are not developed anddeployed to the masses.
References
Akagi SK, Yokelson RJ, Wiedinmyer C, Alvarado MJ, Reid JS, Karl T,Crounse JD, Wennberg PO (2011) Emission factors for open anddomestic biomass burning for use in atmospheric models. AtmosChem Phys 11:4039–4072
Bailis R, Ezzati M, Kammen DM (2003) Greenhouse gas implications ofhousehold energy technology in Kenya. Environ Sci Technol 37:2051–2059
CDM-EB (2006) Definition of renewable biomass, UNFCCC, EB reportannex 18. UNFCCC
Central Intelligence Agency (2012) The World Factbook, Uganda. In:Library (ed)
Chidumayo EN, Gumbo DJ (2013) The environmental impacts of char-coal production in tropical ecosystems of the world: a synthesis.Energy Sustain Dev 17:86–94
FAO (2012) FAOSTAT. Food and Agriculture Organization of the UnitedNations
Girard P (2002) Charcoal production and use in Africa: what future? FAOCorporate Document Repository
IPCC (2006) International panel on climate change, 2006. Guidelines forGHG inventories, vol 5, Waste
Kisakye R (2004) Study on the establishment of quantity of charcoalproduced per parish and recommended reserve prices for MasindiDistrict, Final Report
MEMD (2007) Renewable energy policy for Uganda. In: Development,M.o.E.a.M. (ed), Uganda
Pennise DM, Smith KR, Kithinji JP, Rezende ME, Raad TJ, Zhang J, FanC (2001) Emissions of greenhouse gases and other airborne pollut-ants from charcoal making in Kenya and Brazil. J Geophys Res 106:24143–24155
Reddy AKN (1996) Energy after Rio: prospects and challenges. UnitedNations Publications, New York
Smith KR, Pennise DM, Khummongkol P, Chaiwong V, Ritgeen K,Zhang J, Panyathanya W, Rasmussen RA, Khalil MAK (1999)Greenhouse gases from small-scale combustion devices in de-veloping countries: charcoal-making kilns in Thailand. In:United States Environmental Protection Agency (ed) ResearchTriangle Park, NC
Ugandan Bureau of Statistics (2006) 2002 Ugandan population andhousing census, population and size distribution
World Resource Institute (2012) Greenhouse gas protocol GHG protocoltool for calculating emissions from mobile combustion sources,version 2.2, Washington DC
Int J Life Cycle Assess