
Quality attributes of twenty-nine brands of ciprofloxacin
26
https://dx.doi.org/10.4314/jpb.v17i2.15 Journal of Vol. 17 no. 2, pp. 208-233 (September 2020) PHARMACY AND http://ajol.info/index.php/jpb BIORESOURCES Quality attributes of twenty-nine brands of ciprofloxacin: post-marketing in vitro analyses, microbiological assay and in vivo simulation Hashiya S. Muhammad 1 , Patience O. Okpe 1 , Patrick O. Olorunfemi 1 , Nelson A. Ochekpe 1 , Wale R. Hamza 2 and Ndidi C. Ngwuluka 1* 1 Biomaterials and Drug Delivery Unit, Faculty of Pharmaceutical Sciences; 2 Department of Physiology, College of Health Sciences, University of Jos, 930001 Jos, Plateau State, Nigeria. Received 12 th June 2020; Accepted 24 th August 2020 ______________________________________________________________________________ Abstract Ciprofloxacin is a fluoroquinolone antibiotic employed to treat infections. There are over three hundred registered generic brands of ciprofloxacin in Nigeria. There has been an observed marked variation in therapeutic or clinical outcome with change in brands by health professionals and patients. In a previous study of six (6) brands we had reported a high degree of inequivalence. In this study, twenty-nine (29) brands of ciprofloxacin were extensively evaluated against compendia requirements. Microbial sensitivity against two test organisms was conducted. In-vitro drug release and in-vivo simulation were established. Analysis of the data generated indicated that all brands passed qualitative test using TLC and disintegration test, six failed hardness test, one failed friability, nine failed antimicrobial assay and six failed percentage content assay. Conclusions drawn from the study for evidence-based clinical decision would include the fact that three brands only were found to be bioequivalent to the innovator brand, Ciproxin; while eight brands were bio-inequivalent using the three models of similarity factor (f2), and difference factor (f1) in two media and dissolution efficiency (DE) in pH 4.5. The three brands (Cipro-All, Cifran And Ciprogem) may confidently be used interchangeably with the innovator brand Keywords: Bioequivalence; Ciprofloxacin Drug quality; Generic substitution; Post-marketing surveillance ______________________________________________________________________________ INTRODUCTION Poor quality medicines such as substandard, counterfeit or falsified and degraded products are a global challenge. Poor quality medicines could lead to treatment failure, drug resistance, morbidity and mortality in extreme cases and eventual distrust in the health care system. In Nigeria, poor quality medicines are both locally produced and imported from countries such as China and India. While the regulatory body, * Correspondence. E-mail: [email protected] Tel: +234-8100331517. ISSN 0189-8442 2020. Published by Faculty of Pharmaceutical Sciences, University of Jos, Nigeria. Under Creative Commons Attribution-NonCommercial 4.0 International License. https://creativecommons.org/licenses/by-nc/4.0/ National Agency for Food and Drug Administration and Control (NAFDAC) try to mitigate against poor quality medicines, such medicines still flood the market mainly due to limited resources of the agency, porosity of the borders and corruption. Consequently, quality assurance of medicines from raw materials to administration, requires the involvement of all stakeholders from suppliers to end users. Poor quality medicines should be reported to the National Pharmacovigilance Centre (NPC) at
-
Upload
khangminh22 -
Category
Documents
-
view
0 -
download
0
Transcript of Quality attributes of twenty-nine brands of ciprofloxacin

https://dx.doi.org/10.4314/jpb.v17i2.15 Journal of Vol. 17 no. 2, pp. 208-233 (September 2020) PHARMACY AND
http://ajol.info/index.php/jpb BIORESOURCES
Quality attributes of twenty-nine brands of ciprofloxacin:
post-marketing in vitro analyses, microbiological assay and
in vivo simulation
Hashiya S. Muhammad1, Patience O. Okpe1, Patrick O. Olorunfemi1, Nelson A. Ochekpe1,
Wale R. Hamza2 and Ndidi C. Ngwuluka1*
1Biomaterials and Drug Delivery Unit, Faculty of Pharmaceutical Sciences; 2Department of Physiology,
College of Health Sciences, University of Jos, 930001 Jos, Plateau State, Nigeria.
Received 12th June 2020; Accepted 24th August 2020
______________________________________________________________________________ Abstract
Ciprofloxacin is a fluoroquinolone antibiotic employed to treat infections. There are over three hundred registered
generic brands of ciprofloxacin in Nigeria. There has been an observed marked variation in therapeutic or clinical
outcome with change in brands by health professionals and patients. In a previous study of six (6) brands we had
reported a high degree of inequivalence. In this study, twenty-nine (29) brands of ciprofloxacin were extensively
evaluated against compendia requirements. Microbial sensitivity against two test organisms was conducted. In-vitro
drug release and in-vivo simulation were established. Analysis of the data generated indicated that all brands passed
qualitative test using TLC and disintegration test, six failed hardness test, one failed friability, nine failed antimicrobial
assay and six failed percentage content assay. Conclusions drawn from the study for evidence-based clinical decision
would include the fact that three brands only were found to be bioequivalent to the innovator brand, Ciproxin; while
eight brands were bio-inequivalent using the three models of similarity factor (f2), and difference factor (f1) in two
media and dissolution efficiency (DE) in pH 4.5. The three brands (Cipro-All, Cifran And Ciprogem) may confidently
be used interchangeably with the innovator brand
Keywords: Bioequivalence; Ciprofloxacin Drug quality; Generic substitution; Post-marketing surveillance
______________________________________________________________________________
INTRODUCTION
Poor quality medicines such as
substandard, counterfeit or falsified and
degraded products are a global challenge. Poor
quality medicines could lead to treatment
failure, drug resistance, morbidity and
mortality in extreme cases and eventual
distrust in the health care system. In Nigeria,
poor quality medicines are both locally
produced and imported from countries such as
China and India. While the regulatory body,
*Correspondence. E-mail: [email protected] Tel: +234-8100331517. ISSN 0189-8442
2020. Published by Faculty of Pharmaceutical Sciences, University of Jos, Nigeria. Under Creative
Commons Attribution-NonCommercial 4.0 International License. https://creativecommons.org/licenses/by-nc/4.0/
National Agency for Food and Drug
Administration and Control (NAFDAC) try to
mitigate against poor quality medicines, such
medicines still flood the market mainly due to
limited resources of the agency, porosity of the
borders and corruption. Consequently, quality
assurance of medicines from raw materials to
administration, requires the involvement of all
stakeholders from suppliers to end users. Poor
quality medicines should be reported to the
National Pharmacovigilance Centre (NPC) at

209
H.S. Muhammad et al. / J. Pharmacy & Bioresources 17(2), 208-233 (2020)
NAFDAC, with offices in some health
facilities. Drug quality reporting involves all
stakeholders especially the health care
professionals who observe these medicines
when procured and administered. Quality
assessments of medicines are usually
undertaken by regulatory bodies, designated
laboratories, and those in academia. However,
availability of data is necessary to ensure
public enlightenment and control of
procurement and administration of poor-
quality drugs. Collation of data by the
Pharmacovigilance Centre will facilitate
appropriate dissemination to health facilities.
A comprehensive assessment of a solid
dose antimicrobial pharmaceutical product
should include the evaluation of its attributes
such as visual inspection of labelling and
packaging, physicochemical properties of
uniformity of weight, disintegration and
dissolution rates; chemical assays of purity and
content of Active Pharmaceutical Ingredient
(API); and a compulsory microbiological
evaluation. Where interchangeability of
products is intended, a dissolution study (in-
vitro and/or in-vivo) becomes necessary.
These product attributes have been the
focus of several product evaluations after
release into the market [1-4]. Chemical
analysis and visual assessment have been used
to identify poor-quality drugs prevalent in
Asian and sub-Saharan African countries [5,
6]. Nayyar and co-workers [7] reviewed 21
surveys on antimalarial drugs from six classes
and from 21 countries in sub-Saharan Africa.
The review of the surveys indicated that 35 %
of the drugs failed chemical analysis, 36 %
failed packaging analysis and 20 % were
classified as falsified. WHO [8] states that a
drug is said to be falsified when the product is
found to be a deliberate or fraudulent
misrepresentation of its identity, composition,
source or record keeping for traceability, and
pretend to have marketing authorization.
Those involved in falsified products are in it
for profit having a total disregard for public
health and safety. The effects of poor-quality
drugs include adverse drug events, treatment
failure, prolonged illness, increased cost of
treatment, antimicrobial resistance and
increased morbidity and mortality. Nigeria has
cases of deaths due to poor quality medicines.
About four years ago (2016), an estimate of
41.96 % of under-five malaria deaths was
associated with administration of poor quality
antimalarials [9]. Details on deaths caused by
poorly compounded chloroquine,
unintentional use of ethylene glycol in
paracetamol syrup, fake meningitis vaccines,
fake adrenaline, contaminated infusions,
diethylene glycol in paracetamol and
chlorpheniramine-based teething mixture (My
Pikin) are in the public domain.
One underutilized approach to assist in the
fight against poor quality of medicines is drug
quality reporting. Pharmacovigilance reports
regarding quality issues excluding issues
relating to adverse drug reactions and
medication errors are described as drug quality
reporting. A drug quality reporting system
(DQRS) receives reports submitted by health
professionals and marketing authorization
holders voluntarily on observed or suspected
defects or quality issues related to marketed
drug products [10]. Reporting poor quality
drug products may protect the public from
treatment failure, antimicrobial resistance, and
adverse drug reactions. Such reports should
lead to prompt inspections and laboratory
analysis.
Ciprofloxacin is one of the most prescribed
antibiotics. In Nigeria, it can be obtained
without prescription and due to the demand,
there are over 300 registered ciprofloxacin
brands [11]. Registered medicines must be
monitored to ensure they are not re-introduced
into the market as substandard or falsified
products over time. Antibiotics are one of the
targeted classes of medicines for manufacture,
importation and distribution of their
substandard products and counterfeits due to
their high volume of use. As a result, post-
210
H.S. Muhammad et al. / J. Pharmacy & Bioresources 17(2), 208-233 (2020)
marketing surveillance is vital to sanitize the
drug market and protect public health.
Although several studies on ciprofloxacin
have been undertaken [1, 12-18], this study
was prompted by several observations and
reports from some hospitals in North-Eastern
Nigeria of varying clinical/therapeutic
responses of different brands of Ciprofloxacin
500 mg tablets/caplets. Therapeutic failure
often occurred with some brands of
Ciprofloxacin 500 mg tablets/caplets making
physicians and patients insist on specific
brands without a known scientific evidence.
Consequently, the study was undertaken to
assist the prescribers and pharmacists make
evidenced-based choices regarding
interchangeability of available generic
ciprofloxacin products.
EXPERIMENTAL
Test Products. Twenty-nine (29) different
brands of ciprofloxacin 500 mg tablets/caplets
available at the time of sampling were
procured from Yola and Jos metropolis, capital
cities of Adamawa and Plateau states, Nigeria.
All test products procured for the study were
registered with National Agency for Food
Drug Administration and Control (NAFDAC)
except the innovator brand, Ciproxin (Bayer,
Pakistan, Batch No TRTOE8N) which was
sourced abroad. The USP ciprofloxacin
standard powder and standard tablets were
gifts from a fellow scientist. Details of the
twenty-nine (29) brands of ciprofloxacin
tablets/caplets were as shown in Table 1. The
methods were executed according to USP [19]
with slight modifications as indicated in the
methods.
Physicochemical tests
Visual inspection. This was undertaken in
search of defects on labeling, packaging, and
dosage forms. Required information on the
package such as shelf-life, manufacturing date,
dosage strength, dosage form and dosage
description were assessed and documented.
Size, shape, and color were also observed and
documented.
Uniformity tests. Laboratory tests such as
weight variation and uniformity of thickness
and diameter were executed as detailed in the
USP [19].
Friability test. Resistance to abrasions and
handling was determined as described in the
USP [19] using a friabilator (Erweka, JM0004-
MG-001, Germany).
Hardness. To assess the tablet hardness, six
tablets from each brand were employed using
a hardness tester (Monsanto Tablet hardness
tester, USA) to obtain the force required to
break each tablet.
Disintegration. Six tablets from each brand in
900 mL of 0.1 HCl at 37±0.5oC were also used
for the disintegration test (Erweka ZT 720
disintegration tester, Germany). The time at
which no particle remained on the mesh was
recorded and the average time it took for the
six tablets of each brand to disintegrate was
determined.
Content assay. Ascertaining the quantity of
ciprofloxacin in the tablets of the different
brands was undertaken by crushing pre-
weighed twenty tablets from each brand.
Thereafter, an equivalent weight of 25 mg of
ciprofloxacin was dissolved in 25 mL of
deionized water. This was further diluted to
obtain a stock solution of 100 µg/mL.
Subsequently, 4 µg/mL was withdrawn from
the stock and the absorbance was determined
at 275 nm. The percentage content in each
brand was calculated after obtaining the
equation of best line fit from calibrations
carried out with the reference standard of
ciprofloxacin.
In vitro drug release. The dissolution
apparatus II (LOGANS dissolution system
UDT-804, Thailand) was used at 50 rpm in
three different media (0.1 N HCl – pH 1.2;
acetate buffer pH 4.5 and phosphate buffer pH
6.8). The volume used for each medium was
211
H.S. Muhammad et al. / J. Pharmacy & Bioresources 17(2), 208-233 (2020)
900 mL equilibrated to 37±0.5oC. Six tablets
were tested from each brand in the different
media. Samples (5 mL) were withdrawn at
intervals of 5, 10, 15, 20, 25, 30, 45, 60 min
and same volumes were replaced with fresh
medium to maintain sink conditions. The
samples were filtered and assayed
spectrophotometrically at 275 nm.
Impurity profiling of ciprofloxacin brands.
The procedure employed was according to the
operation manual of Global Pharma Health
Fund (GPHF) Minilab. Thin layer
chromatography (TLC) was employed to
determine the purity of the ciprofloxacin
brands. The mobile phase was prepared
comprising 10 mL methanol, 5 mL acetone, 2.5
mL toluene, 5 mL concentrated ammonia
solution (25 %), pipetted into the TLC
developing chamber. The chamber was tightly
closed, and the content mixed thoroughly. The
chamber wall was lined with filter paper and
left for 5 min; thus, ensuring saturation of the
chamber with the solvent vapour. Standard
stock solution of ciprofloxacin yielding 5
mg/mL was prepared in water with
ciprofloxacin 250 mg standard tablet.
Thereafter, 1 mL each was withdrawn from the
stock solution to prepare 0.625 mg/mL and 0.5
mg/mL and made up to 10 mL with methanol.
Stock sample solutions were prepared with 500
mg tablets from each brand to yield 5 mg/mL.
From the stock solutions, 0.625 mg/mL was
prepared for each brand. Thereafter, employing
a micropipette, 2 µL of working standard and
sample solution were spotted at different
points (origin line) on the TLC plate. The TLC
plates were carefully loaded into the already
saturated developing chamber containing the
mobile phase. The jar was closed and the
chromatoplate was left until the solvent front
had moved to three quarter of the length of the
plate. The developing time was 22 minutes.
The plate was carefully removed, and the
solvent front marked, excess solvent was left
to evaporate and the chromatoplate was
observed under UV light of 254 nm using a
battery driven lamp and the Rf values deduced.
Microbiological assay of ciprofloxacin
brands. Mueller Hinton broth was prepared
according to manufacturer’s directives and 5
mL of the broth was dispensed into bijou
bottles and sterilized in an autoclave at 121oC
for 15 min. Similarly, Mueller Hinton agar was
prepared according to manufacturer’s
directives and 20 mL each was dispensed into
clean and dried bijou bottles, covered, and
sterilized by autoclaving at 121oC for 15 min.
The test organisms, S. aureus and P.
aeruginosa were inoculated into the broth,
incubated overnight at 37oC. The overnight
culture was diluted to 0.5 McFarland standard.
The molten sterile agar was cooled to about 40-
45oC and 0.1 mL of standardized inoculum was
inoculated into the 20 mL of agar, mixed and
poured into a Petri-dish and allowed to
solidify. Thereafter, wells were punched into
the agar with No 5 cork borer and the wells
filled with 0.1 mL solutions of each of the
brands and standard. Tests and standards were
compared at three concentrations levels - 60,
30, 15 µg/mL. The plates were left on the
bench for about one hour for pre-diffusion and
were incubated for 24 h at 37oC. The zones of
inhibition were measured, the log potency ratio
was calculated and the percentage content in
each brand was determined.
Data analyses and in vivo simulation. Basic
statistics such as standard deviation was
employed to analyse the data obtained.
DDSolver as an add-in to Microsoft excel was
used to determine difference factor, f1,
similarity factor f2 and dissolution efficiency.
Microsoft excel and PKSolver were used for
simulation of in vivo absorption and
determination of pharmacokinetic parameters,
respectively.
RESULTS AND DISCUSSION
Physicochemical evaluation. Tablets of all
the brands were white except those of zibatab
(yellow) and ciprotab (one side yellow and the

212
H.S. Muhammad et al. / J. Pharmacy & Bioresources 17(2), 208-233 (2020)
other white). The tablets of the different brands
were of three shape types – round, oval and
oblong. Some of the brands had the brand
names engraved on the tablets. Table 2
indicates the documented visual inspection of
the brands of ciprofloxacin. There was no
indication of any degraded tablets on visual
inspection.
The outcomes of the physical parameters
tested were as shown in Table 3. All brands
passed weight variation test except siprosan,
cipro-superior and zindocip with percentage
deviations of 5.4, 6.6 and 20.1% respectively.
These deviations were more than the USP
specification for tablets weighing more than
342 mg (not more than 5%). Six brands,
ciproheal, rumaxine, ciproall, zindocip,
siprosan, and corflox failed hardness test with
kilogram force below the required 4 kgF. Of
concern may be the handling and
transportation of these brands which may lead
to fracture or chipping.
All brands passed the friability test except
ciprogem with a percentage friability of
10.8±0.23. The specification for friability is
that tablets should be less than 1% friable. In
our previous study, the batch of ciprogem
purchased then passed friability test [1]. The
manufacturer of ciprogem used to have the
franchise and licence agreement to produce
ciproxin until 2002. Consequently, one would
expect consistency from them. Search for other
publications on ciprofloxacin to monitor
ciprogem’s previous performances yielded
limited results as some authors coded the
brands [17, 20, 21] while those who did not
code did not sample ciprogem [12, 15].
Table 1: Product information of the different brands of Ciprofloxacin
S/N BRAND BATCH NO NAFDAC NO MFD. DATE *EXP. DATE
COUNTRY
OF ORIGIN
1 Prox G014020 04─3565 2014/APR 2017/MAR INDIA
2 Rapidflox E508 04─3221 2015/MAR 2019/MAR INDIA
3 Ciproheal CF4030 04─7436 2014/AUG 2017/JUL INDIA
4 Rumaxine O15 A4─9152 2014/APR 2017/MAR PAKISTAN
5 Cipro-all 5EO25 B4─1551 2015/MAY 2018/APR INDIA
6 Ciprofax 140615 A4─0482 2014/JUN 2017/JUN CHINA
7 Cipro-superior 1506020 A4─4889 2015/JUN 2018/JUN NIGERIA
8 Cipad 4T66004 04─6926 2014/FEB 2017/JAN INDIA
9 Cipro-Kriss KP15173 B4─0293 2015/AUG 2016/JUL NIGERIA
10 Zindocip 60429 B4─2565 2014/JUN 2019/JUN CYRUS
11 Vitapro 5640626 04─2170 2014/JUL 2017/JUN NIGERIA
12 Pemcipro 141221 B4─3485 2014/DEC 2017/DEC CHINA
13 Siprosan SPS013A 04─2107 2014/AUG 2017/JUL NIGERIA
14 Cenox CNXH0160 04─3002 2014/JAN 2017/NOV INDIA
15 Zyprox 129 04─9612 2015/JUL 2018/JUN NIGERIA
16 Cyplox 640029 04─3202 2014/JAN 2016/DEC INDIA
17 Gecip 141112 04─5856 2014/NOV 2017/NOV CHINA
18 Cipromaxfort 14042001 04─4950 2014/AUG 2017/AUG CHINA
19 Ciflaxin 100EO1 04─9097 2014/MAY 2018/APR NIGERIA
20 VPL 140727 B4─0053 2014/JUL 2017/JUL CHINA
21 Ciprof GT15010 04─4772 2015/FEB 2019/JAN INDIA
22 Zibatab ZXU011402 B4─2220 2014/JUN 2017/MAY INDIA
23 Corflox 4385 B4─3322 2014/DEC 2017/NOV INDIA
24 Cifran 2662288 04─4673 2014/DEC 2017/NOV INDIA
25 Grakkoflox GK14001 B4─0121 2014/FEB 2017/JAN INDIA
26 Cipronol 150102 04─6340 2015/FEB 2017/DEC CHINA
27 Ciproxin TRTOE8N NIL NIL 2019/JUN PAKISTAN
28 Ciprogem 3641H 04─4699 2015/MAR 2020/FEB NIGERIA
29 Ciprotab VG1329 04─0723 2014/JAN 2016/DEC INDIA
*The study was undertaken from late 2015 to 2016 before the expiry dates of the products.
All brands were within their shelf lives at the time of the study.

213
H.S. Muhammad et al. / J. Pharmacy & Bioresources 17(2), 208-233 (2020)
Table 2: Visual assessment of the different brands of ciprofloxacin
S/N BRAND Pack size PACKAGE DOSAGE FORM DESCRIPTION
1 Prox 2 x7 Alu/Alu blister* Film coated caplet White/ Oblong/ Scored on one side
2 Rapidflox 2 x7 Alu/Alu blister Film coated caplet White/ Oblong/ Scored on one side and
"Rapidflox" engraved on the other side
3 Ciproheal 1 x10 Alu/Pvc blister** Film coated caplet White/ Oval/ "Maxheal" engraved on one side
and "Ciprof 500" on the other side
4 Rumaxine 2 x7 Alu/Alu blister Film coated tablet White/ Round
5 Cipro-all 1 x10 Alu/Alu blister Film coated caplet White/ Oblong/ Scored on one side
6 Ciprofax 1 x10 Alu/Alu blister Film coated caplet White/ Oblong/ Scored on one side and
"Ciprofax 500" engraved on the other side
7 Cipro-sup 1 x10 Alu/Alu blister Film coated caplet White/ Oblong/ Scored on one side
8 Cipad 1 x10 Alu/Pvc blister Film coated caplet White/ Oblong/ Scored on one side and "AD"
engraved on the other side
9 Cipro-Kriss 1 x10 Alu/Pvc blister Film coated caplet White /Oval/ "Cipro 500" engraved on one side
10 Zindocip 1 x10 Alu/Pvc blister Film coated caplet White/ Oblong/ Scored on one side with "Zin"
and "2' engraved on that side and "500" on the
other side
11 Vitapro 1 x10 Alu/Pvc blister Film coated caplet White/ Oblong/ "Vitapro" engraved on one side
12 Pemcipro 1 x10 Alu/Alu blister Film coated caplet White/ Oblong/ Scored on one side and
"Pemcipro 500" engraved on the other side
13 Siprosan 2 x7 Alu/Pvc blister Film coated caplet White/ Oblong/ Scored on one side and
"Tyonex" engraved on the other side
14 Cenox 1 x10 Alu/Alu blister Film coated caplet White/ Oblong/ White/ Oblong/ "Cenox"
engraved on one side
15 Zyprox 2 x7 Alu/Alu blister Film coated caplet White/ Oblong/ "500" engraved on one side and
"Zyprox" on the other side
16 Cyplox 1 x10 Alu/Alu blister Film coated caplet White/ Oblong/ "Cyplox 500" engraved on one
side
17 Gecip 1 x10 Alu/Alu blister Film coated caplet White/ Oblong/ Scored and "CP-500" engraved
on that side
18 Cipromaxfort 1 x10 Alu/Pvc blister Film coated caplet White/ Oval/ "Cipro 500" engraved on one side
19 Ciflaxin 1 x10 Alu/Pvc blister Film coated caplet White/ Oblong/ "Drugfield" engraved on one
side
20 VPL-Cipro 1 x10 Alu/Alu blister Film coated caplet White/ Oblong/ Scored on one side and "VPL-
C" engraved on the other side
21 Ciprof 1 x10 Alu/Alu blister Film coated caplet White /Oblong/ "Ciprof 500" engraved on one
side
22 Zibatab 2 x7 Alu/Alu blister Film coated caplet Yellow/ Oblong/ Scored on one side
23 Corflox 2 x7 Alu/Alu blister Film coated caplet White/ Oblong/ Plain
24 Cifran 1 x10 Alu/Pvc blister Film coated tablet White/ Round/ "CFT" engraved on one side and
500 engraved on the other side
25 Grakkoflox 1 x10 Alu/Alu blister Film coated caplet White/ Oblong/ Scored on one side
26 Cipronol 1 x10 Alu/Pvc blister Film coated caplet White /Oval/ "Cipro 500" engraved on one side
27 Ciproxin 1 x10 Alu/Pvc blister Film coated caplet White/ Oblong/ Scored on one side with "Cip -
500" engraved on that side and "BAYER" on the
other side
28 Ciprogem 1 x10 Alu/Pvc blister Film coated caplet White/ Oblong/ Scored on one side with "CIP-
500" on that side and "Gemini" engraved on the
other side
29 Ciprotab 1 x14 Alu/Pvc blister Film coated caplet Yellow on one side and "Ciprotab" written on
one side and milky colour on the other side
* Tablets packed with aluminium blister all through. **Tablets packed with aluminium blister on one side and
polyvinyl chloride (pvc) plastic on the other side.

214
H.S. Muhammad et al. / J. Pharmacy & Bioresources 17(2), 208-233 (2020)
Table 3: Physical attributes of ciprofloxacin brands S/N Brands Weight
(mg)±SD
%
Dev.
Hardness
(KgF)±SD
Friability
(%)
Disintegration
(min) ±SD
Thickness
(mm) ±SD
Diameter
(mm) ±SD
1 Prox 661±0.007 1.1 8.2±1.1 0.015 9.0±0.6 5.7±0.07 6.6±0.01
2 Rapidflox 631±0.008 1.3 4.5±1.0 0.159 4.0±0.2 5.4±0.08 7.7±0.03
3 Ciproheal 754±0.009 1.2 3.4±0.4 0.108 6.6±0.7 5.8±0.06 9.1±0.02
4 Rumaxine 679±0.018 2.6 3.5±0.3 0.319 4.7±0.5 5.6±0.05 13±0.1
5 Ciproall 659±0.014 2.1 3.8±0.3 0.227 2.9±0.3 5.1±0.02 8.2±0.04
6 Ciprofax 898±0.015 1.7 4.0±0.4 0.232 3.5±0.6 5.4±0.05 9.1±0.01
7 Cipro-Superior 864±0.057 6.6 4.5±0.2 0.106 7.5±2.0 5.3±0.04 9.2±0.01
8 Cipad 721±0.009 1.3 4.7±0.3 0.125 2.9±0.3 5.6±0.04 8.2±0.02
9 Cipro-Kriss 771±0.162 20.1 4.5±0.3 0.063 3.8±0.3 5.3±0.12 9.3±0.02
10 Zindocip 801±0.012 1.5 3.4±0.5 0.137 4.4±0.2 6.4±0.05 8.1±0.02
11 Vitapro 919±0.015 1.7 4.0±0.3 0.032 1.1±0.3 5.3±0.09 9.4±0.02
12 Pemcipro 885±0.027 3.1 4.9±0.7 0.033 11.6±0.9 5.3±0.05 9.2±0.02
13 Siprosan 614±0.033 5.4 3.7±0.3 0.016 3.2±0.2 4.9±0.14 7.6±0.01
14 Cenox 798±0.006 0.7 4.7±0.8 0.012 3.1±0.4 6.3±0.02 8.2±0.03
15 Zyprox 674±0.016 2.3 5.0±1.0 0.084 4.8±1.2 5.5±0.19 9.1±0.07
16 Cyplox 1034±0.02 1.9 6.8±1.5 0.087 2.0±0.3 6.9±0.02 9.8±0.03
17 Gecip 716±0.011 1.5 8.9±1.9 0.015 22.2±1.7 5.9±0.15 8.2±0.01
18 Cipromaxfort 802±0.008 1 11.1±0.3 0.113 4.0±0.3 5.5±0.02 9.2±0.01
19 Ciflaxin 734±0.015 2.1 9.0±0.9 0.082 10.3±0.4 6.3±0.08 7.3±0.04
20 Vpl-Cipro 733±0.004 0.6 10.4±0.9 0.068 3.7±0.4 4.9±0.12 9.1±0.02
21 Ciprof-500 787±0.012 1.6 6.9±1.4 0.405 1.6±0.4 4.9±0.07 9.2±0.09
22 Zibatab 775±0.008 1.1 8.0±1.9 0.065 6.4±0.1 5.9±0.05 8.6±0.01
23 Corflox 707±0.009 1.3 3.6±0.4 0.154 2.1±0.7 4.8±0.09 8.3±0.03
24 Cifran 767±0.007 0.9 7.4±0.8 0 1.3±0.2 4.5±0.05 13.2±0.01
25 Grakkoflox 626±0.011 1.8 6.4±1.0 0.063 10.5±0.4 5.1±0.03 8.4±0.01
26 Cipronol 741±0.007 0.9 9.8±0.2 0.027 2.5±0.5 5.4±0.02 9.1±0.02
27 Ciproxin 759±0.006 0.8 12.2±1.0 0.039 2.5±0.3 5.6±0.07 8.4±0.03
28 Ciprogem 778±0.006 0.8 5.1±1.1 10.8 1.4±0.7 5.5±0.13 8.2±0.02
29 Ciprotab 794±0.012 1.5 SOFTLET 0.025 17.5±1.5 5.9±0.04 7.8±0.05
Fig. 1. Percentage content of ciprofloxacin in the various brands of ciprofloxacin hydrochloride.
111.5
97.7 108.8
113
81.4
106.8
96.3 104.7
74.2
100.7
95.4
87.6 98.3
93.1 102.3
95.2
100.9
99.5
96.5
92.5
96.8
95.1
100.6
91.1 99.6
87.9 1
03.4
103.8
103.2
PR
OX
*
RA
PID
FL
OX
CIP
RO
HE
AL
RU
MA
XIN
E*
CIP
RO
AL
L*
CIP
RO
FA
X
CIP
RO
-…
CIP
AD
CIP
RO
-KR
ISS
*
ZIN
DO
CIP
VIT
AP
RO
PE
MC
IPR
O*
SIP
RO
SA
N
CE
NO
X
ZY
PR
OX
CY
PL
OX
GE
CIP
CIP
RO
MA
XF
O…
CIF
LA
XIN
VP
L
CIP
RO
F
ZIB
AT
AB
CO
RF
LO
X
CIF
RA
N
GR
AK
KO
FL
OX
CIP
RO
NO
L*
CIP
RO
XIN
CIP
RO
GE
M
CIP
RO
TA
B
% CONTENT

215
H.S. Muhammad et al. / J. Pharmacy & Bioresources 17(2), 208-233 (2020)
Fig. 2. Percentage potencies of the various brands of ciprofloxacin hydrochloride
Fig. 3. Sample plates of the impurity testing using TLC
While coding the brands may protect the
manufacturers, it does not provide the
prescribers, pharmacists, and patients the
opportunity to make informed decision on
generic substitution. If the failure of the
friability test of ciprogem is batch related,
then it can be taken as an indication of failure
of internal quality control mechanism.
In a previous study, all the brands of
ciprofloxacin sampled passed the hardness
and only one brand failed friability test [21]
while a reverse was observed in another study
where all brands passed friability test and two
failed hardness test [17]. The degree of
hardness of a tablet influences friability,
disintegration, and drug release. It is
expected that the harder the tablet, the less
friable, the slower the disintegration and rate
of drug release. It should not be surprising to
see harder tablets disintegrate faster since the
intrinsic property of a disintegrant influences
rate of disintegration. All brands in this study,
passed disintegration time test as the times
for disintegration were within 30 min.
Vitapro had the least disintegration time of
1.1±0.3 min while Gecip had the longest
disintegration time of 22.2±1.7 min. All
brands passed the thickness and diameter
tests (12.5mm to be +5% and tablets with
diameter up to 15mm to be +3%).
93.5
93.3
74.9
93.4
91.6
92.4
93.4
89.2
58.9
90.1 95.4
91.1
83.5 90.2
90.1 95.4
65
93.2
90.6
92.2
92.4
66.4
62.6
73.3 78.5
90.1 95.4
95.4
92.4
93.3
93.1
85.8 93
91 91.9
93.3
88.7
65.9
90 9
5.4
91.1
87 9
1.1
91.8
95.4
76.8
95.4
90.8
94.3
93.3
89
76.7
66.1
79.6
93.3
95.4
95.4
95.4
% P
OT
EN
CY
CIPROFLOXACIN BRANDS
Pseudomonas…Staphylococcus aureus…

216
H.S. Muhammad et al. / J. Pharmacy & Bioresources 17(2), 208-233 (2020)
Time (min)
0 10 20 30 40 50 60
Pe
rce
nta
ge
Dru
g R
ele
ase
d (
%)
0
20
40
60
80
100
PROX
RAPIDCLOX
CIPROHEAL
RUMAXINE
CIPRO-ALL
CIPROXIN
Fig. 4. Percentage Drug Release Profiles of Brands Prox, Rapidflox, Ciproheal, Rumaxine and Cipro-all in 0.1N
HCl in comparision with ciproxin
Time (min)
0 10 20 30 40 50 60
Perc
enta
ge D
rug R
ele
ase
d (
%)
0
20
40
60
80
100
CIPROFAX
CIROFLOXACIN SUPERIOR
CIPAD
CIPROKRISS
ZINDOCIP
CIPROXIN
Fig. 5. Percentage Drug Release Profiles of Brands Ciprofax, Ciprofloxacin superior, Cipad, Ciprokriss and
Zindocip in 0.1N HCl in comparision with ciproxin

217
H.S. Muhammad et al. / J. Pharmacy & Bioresources 17(2), 208-233 (2020)
Time (min)
0 10 20 30 40 50 60
Perc
enta
ge D
rug R
ele
ase
d
0
20
40
60
80
100
VITAPRO
PEMCIPRO
SIPROSAN
CENOX
ZYPROX
CIPROXIN
Fig. 6. Percentage Drug Release Profiles of Brands Vitapro, Pemcipro, Siprosan, Cenox and Zyprox in 0.1N HCl in
comparision with ciproxin
Time (min)
0 10 20 30 40 50 60
Pe
rce
nta
ge
Dru
g R
ele
ase
d (
%)
0
20
40
60
80
100
CYPLOX
GECIP
CIPROMAX FORT
CIFLAXIN
VPL-CIPROFLOXACIN
CIPROXIN
Fig. 7. Percentage Drug Release Profiles of Brands Cyplox, Gecip, Cipromax fort, Ciflaxin and VPL-Ciprofloxacin
in 0.1N HCl in comparision with ciproxin

218
H.S. Muhammad et al. / J. Pharmacy & Bioresources 17(2), 208-233 (2020)
Time (min)
0 10 20 30 40 50 60
Perc
en
tag
e D
rug
Rele
ase
d
0
20
40
60
80
100
CIPROF
ZIBATAB
CORFLOX
CIFRAN
GRAKKOFLOX
CIPROXIN
Fig. 8. Percentage Drug Release Profiles of Brands Ciprof, Zibatab, Corflox, Cifran and Grakkoflox in 0.1N HCl in
comparision with ciproxin
Time (min)
0 10 20 30 40 50 60
Perc
enta
ge D
rug R
ele
ased
0
20
40
60
80
100
CIPRONOL
CIPROXIN
CIPROGEM
CIPROTAB
Fig. 9. Percentage Drug Release Profiles of Brands Cipronol, Ciproxin, Ciprogem and Ciprotab in 0.1N HCl in
comparision with ciproxin

219
H.S. Muhammad et al. / J. Pharmacy & Bioresources 17(2), 208-233 (2020)
Fig. 10. Percentage Drug Release Profiles with Time of Brands Prox, Rapidflox, Ciproheal, Rumaxine and Cipro-all
in Acetate Buffer pH 4.5 in comparision with ciproxin
Time (min)
0 10 20 30 40 50 60
Perc
enta
ge D
rug R
ele
ase
d (
%)
0
20
40
60
80
100
CIPROFAX
CIROFLOXACIN SUPERIOR
CIPAD
CIPROKRISS
ZINDOCIP
CIPROXIN
Fig. 11. Percentage Drug Release Profiles of Brands Ciprofax, Ciprofloxacin superior, Cipad, Ciprokriss and
Zindocip in Acetate Buffer pH 4.5 in comparision with ciproxin
Time (min)
0 10 20 30 40 50 60
Perc
enta
ge D
rug R
ele
ase
d (
%)
0
20
40
60
80
100
PROX
RAPIDCLOX
CIPROHEAL
RUMAXINE
CIPRO-ALL
CIPROXIN

220
H.S. Muhammad et al. / J. Pharmacy & Bioresources 17(2), 208-233 (2020)
Time (min)
0 10 20 30 40 50 60
Perc
enta
ge D
rug R
ele
ase
d
0
20
40
60
80
100
VITAPRO
PEMCIPRO
SIPROSAN
CENOX
ZYPROX
CIPROXIN
Fig. 12. Percentage Drug Release Profiles of Brands Vitapro, Pemcipro, Siprosan, Cenox and Zyprox in Acetate
Buffer pH 4.5 in comparision with ciproxin
Time (min)
0 10 20 30 40 50 60
Pe
rce
nta
ge
Dru
g R
ele
ase
d (
%)
0
20
40
60
80
100
CYPLOX
GECIP
CIPROMAX FORT
CIFLAXIN
VPL-CIPROFLOXACIN
CIPROXIN
Fig. 13. Percentage Drug Release Profiles of Brands Cyplox, Gecip, Cipromax Fort, Ciflaxin and VPL-
Ciprofloxacin in Acetate Buffer pH 4.5 in comparision with ciproxin

221
H.S. Muhammad et al. / J. Pharmacy & Bioresources 17(2), 208-233 (2020)
Time (hr)
0 5 10 15 20 25
Pla
sm
a C
once
ntr
atio
n (
ng
/mL)
0
200
400
600
800
1000
1200
1400
1600
1800
Prox
Rapidflox
Ciproheal
Rumaxine
Cipro-all
Ciproxin
Fig. 16. Predicted plasma concentration time profiles of brands Prox, Rapidflox, Ciproheal, Rumaxine and Cipro-all
in in comparision with ciproxin
Time (hr)
0 5 10 15 20 25
Pla
sma C
once
ntr
atio
n (
ng/m
L)
0
200
400
600
800
1000
1200
1400
1600
1800
Ciprofax
Cipro-Superior
Cipad
Ciprokriss
Zindocip
Ciproxin
Fig. 17. Predicted plasma concentration time profiles of Brands Ciprofax, Ciprofloxacin superior, Cipad, Ciprokriss
and Zindocip in comparision with ciproxin
Time (hr)
0.0 0.5 1.0 1.5 2.0
Pla
sm
a C
on
ce
ntr
atio
n (
ng
/mL
)
0
200
400
600
800
1000
1200
1400
1600
1800
Prox
Rapidflox
Ciproheal
Rumaxine
Cipro-all
Ciproxin
Time (hr)
0.0 0.5 1.0 1.5 2.0
Pla
sm
a C
on
ce
ntr
atio
n (
ng
/mL
)
0
200
400
600
800
1000
1200
1400
1600
1800
Ciprofax
Cipro-Superior
Cipad
Ciprokriss
Zindocip
Ciproxin

222
H.S. Muhammad et al. / J. Pharmacy & Bioresources 17(2), 208-233 (2020)
Time (hr)
0 5 10 15 20 25
Pla
sm
a C
on
ce
ntr
atio
n (
ng
/mL
)
0
200
400
600
800
1000
1200
1400
1600
1800
Vitapro
Pemcipro
Siprosan
Cenox
Zyprox
Ciproxin
Fig. 18. Predicted plasma concentration time profiles of Brands Vitapro, Pemcipro, Siprosan, Cenox and Zyprox in
comparision with ciproxin
Time (hr)
0 5 10 15 20 25
Pla
sma C
once
ntr
atio
n (
ng/m
L)
0
200
400
600
800
1000
1200
1400
1600
1800
Cyplox
Gecip
Cipromax fort
Ciflaxin
VPL-Ciprofloxacin
Ciproxin
Fig. 19. Predicted plasma concentration time profiles of Brands Cyplox, Gecip, Cipromax Fort, Ciflaxin and VPL-
Ciprofloxacin in comparision with ciproxin
Time (hr)
0.0 0.5 1.0 1.5 2.0
Pla
sm
a C
on
ce
ntr
atio
n (
ng
/mL
)
0
200
400
600
800
1000
1200
1400
1600
1800
Vitapro
Pemcipro
Siprosan
Cenox
Zyprox
Ciproxin
Time (hr)
0.0 0.5 1.0 1.5 2.0
Pla
sm
a C
on
ce
ntr
atio
n (
ng
/mL
)
0
200
400
600
800
1000
1200
1400
1600
1800
Cyplox
Gecip
Cipromax fort
Ciflaxin
VPL-Ciprofloxacin
Ciproxin

223
H.S. Muhammad et al. / J. Pharmacy & Bioresources 17(2), 208-233 (2020)
Time (hr)
0 5 10 15 20 25
Pla
sma C
once
ntr
atio
n (
ng/m
L)
0
200
400
600
800
1000
1200
1400
1600
1800
Ciprof
Zibatab
Corflox
Cifran
Grakkoflox
Ciproxin
Fig. 20. Predicted plasma concentration time profiles of Brands Ciprof, Zibatab, Corflox, Cifran and Grakkoflox in
comparision with ciproxin
Time (hr)
0 5 10 15 20 25
Pla
sm
a C
oncentr
ation (
ng/m
L)
0
200
400
600
800
1000
1200
1400
1600
1800
Cipronol
Ciprogem
Ciprotab
Ciproxin
Fig. 21. Predicted plasma concentration time profiles of Brands Cipronol, Ciproxin, Ciprogem and Ciprotab in
comparision with ciproxin
Time (hr)
0.0 0.5 1.0 1.5 2.0
Pla
sm
a C
on
ce
ntr
atio
n (
ng
/mL
)
0
200
400
600
800
1000
1200
1400
1600
1800
Ciprof
Zibatab
Corflox
Cifran
Grakkoflox
Ciproxin
Time (hr)
0.0 0.5 1.0 1.5 2.0
Pla
sm
a C
oncentr
ation (
ng/m
L)
0
200
400
600
800
1000
1200
1400
1600
1800
Cipronol
Ciprogem
Ciprotab
Ciproxin

224
H.S. Muhammad et al. / J. Pharmacy & Bioresources 17(2), 208-233 (2020)
Table 4: Similarity Factor f2 and Difference Factor f1 for Ciprofloxacin Brands using Ciproxin as the reference
brand (0.1N HCl) S/No Brands Similarity factor f2
(50-100)
Difference factor f1
(0-15)
1 Prox 29.28 24.08
2 Rapidflox 53.07 9.00
3 Ciproheal 47.44 9.62
4 Rumaxine 39.15 16.26
5 Cipro-All 52.09 8.57
6 Ciprofax 37.02 17.86
7 Cirofloxacin Superior 35.71 22.73
8 Cipad 45.53 12.15
9 Ciprokriss 23.37 41.92
10 Zindocip 16.38 56.95
11 Vitapro 33.24 26.14
12 Pemcipro 50.55 9.47
13 Siprosan 15.39 60.00
14 Cenox 38.64 14.53
15 Zyprox 68.77 4.62
16 Cyplox 45.25 11.36
17 Gecip 25.63 33.72
18 Cipromax Fort 63.49 5.22
19 Ciflaxin 18.30 48.68
20 Vpl-Ciprofloxacin 49.92 9.98
21 Ciprof 45.48 12.40
22 Zibatab 37.89 16.29
23 Corflox 43.38 15.61
24 Cifran 51.75 8.85
25 Grakkoflox 22.94 41.85
26 Cipronol 36.02 21.03
27 Ciproxin Ref Ref
28 Ciprogem 67.81 3.80
29 Ciprotab 11.52 70.19
f2= Brands in bold failed the f2 test. f1= Brands in bold failed the f1 test.
Table 5: Similarity Factor f2 and Difference Factor f1 for Ciprofloxacin Brands using Ciproxin as the Reference
Brand (Acetate Buffer pH 4.5) S/No Brands Similarity factor f2
(50-100)
Difference factor f1
(0-15)
1 Prox 28.01 19.64
2 Rapidflox 24.65 28.09
3 Ciproheal 32.46 19.04
4 Rumaxine 48.23 11.49
5 Cipro-All 57.26 8.17
6 Ciprofax 60.83 7.27
7 Cirofloxacin Superior 34.34 17.34
8 Cipad 58.17 7.45
9 Ciprokriss 32.22 19.44
10 Zindocip 54.86 7.63
11 Vitapro 30.72 28.39
12 Pemcipro 31.66 18.11
13 Siprosan 49.27 10.31
14 Cenox 49.79 11.39
15 Zyprox 42.85 13.45
16 Cyplox 57.20 7.56
17 Gecip 30.61 21.66
18 Cipromax Fort 40.36 13.07
19 Ciflaxin 16.70 49.89
20 Vpl-Ciprofloxacin 67.22 4.11
21 Ciprof 58.76 6.57
22 Zibatab 30.08 20.34

225
H.S. Muhammad et al. / J. Pharmacy & Bioresources 17(2), 208-233 (2020)
23 Corflox 49.38 9.96
24 Cifran 55.95 8.74
25 Grakkoflox 23.53 35.17
26 Cipronol 25.28 30.29
27 Ciproxin Ref Ref
28 Ciprogem 88.50 1.15
29 Ciprotab 13.66 62.65
Table 6: Dissolution Efficiency for Ciprofloxacin Brands using Ciproxin as the Reference Brand (Acetate Buffer
pH 4.5) S/No Brands DE (%) Difference between DEs of reference and test products*
1 Prox 72.6 9.2
2 Rapidflox 65.7 16.1
3 Ciproheal 76.3 5.5
4 Rumaxine 88.1 - 6.3
5 Cipro-All 86.8 - 5
6 Ciprofax 83.7 - 1.9
7 Cirofloxacin Superior 83.4 - 1.6
8 Cipad 84.0 - 2.2
9 Ciprokriss 68.4 13.4
10 Zindocip 77.4 4.4
11 Vitapro 61.1 20.7
12 Pemcipro 79.1 2.7
13 Siprosan 74.0 7.8
14 Cenox 88.5 - 6.7
15 Zyprox 73.9 7.9
16 Cyplox 84.1 - 2.3
17 Gecip 69.6 12.2
18 Cipromax Fort 79.3 2.5
19 Ciflaxin 54.7 27.1
20 Vpl-Ciprofloxacin 80.4 1.4
21 Ciprof 80.3 1.5
22 Zibatab 69.3 12.5
23 Corflox 81.3 0.5
24 Cifran 87.2 - 5.4
25 Grakkoflox 60.7 21.1
26 Cipronol 62.8 19
27 Ciproxin 81.8 0.0
28 Ciprogem 82.1 -0.3
29 Ciprotab 37.8 44
*The numbers in bold indicate bio-inequivalence
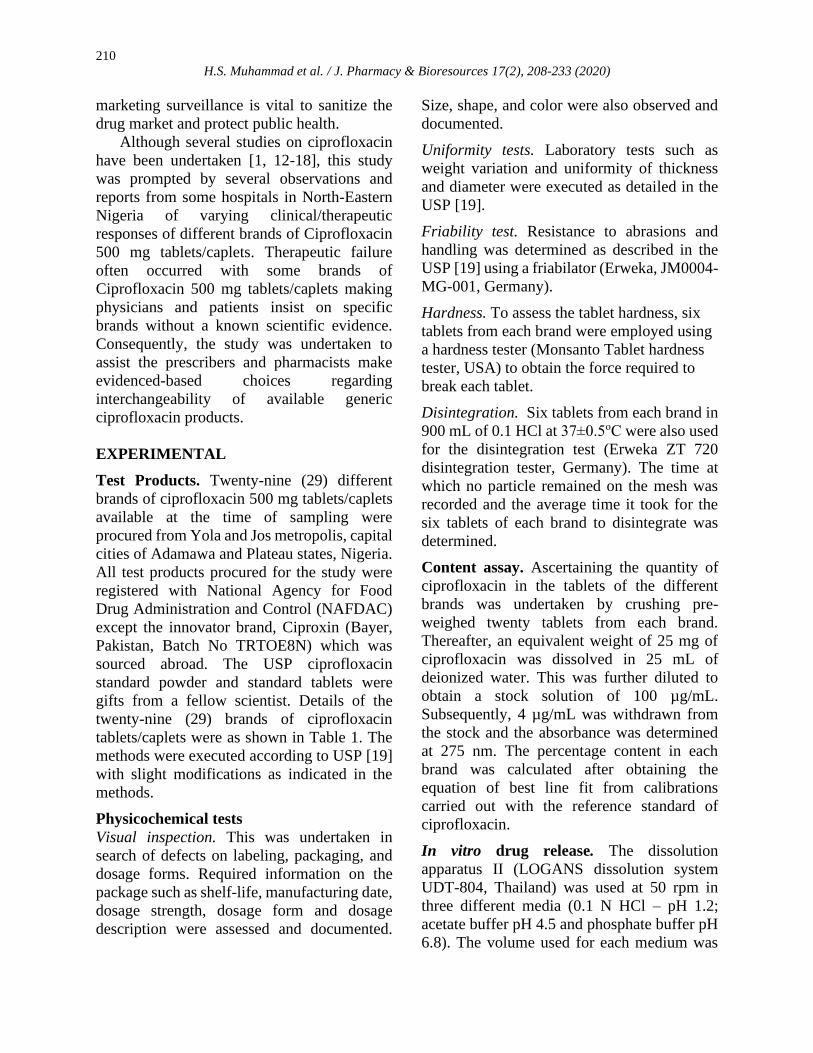
Content assay. Content assay provides an
insight into the identity and quality of drug
product when specific analytical methods are
employed. Concentration of active ingredient
below the specification may predispose
patients to treatment failure and when above
the specification, may lead to adverse drug
events. The USP specification for
ciprofloxacin tablets is that the tablets should
contain ciprofloxacin hydrochloride
equivalent to not less than 90 % and not more
than 110 % of the labelled amount of
ciprofloxacin (500 mg) [19]. Six (6) brands of
ciprofloxacin failed the content assay test as
shown in Figure 1. These brands are prox,
rumaxine, cipro-all, cipro-kriss, pemcipro and
cipronol.
Regarding antibiotics, the challenge of drug
content being outside specification is not just
about treatment failure and adverse drug
events but also about development of
antimicrobial resistance. Providing sub-
inhibitory doses of antimicrobial agents
facilitate the ability of microorganisms to
develop resistance to the antimicrobial agents.
Sub-inhibitory concentrations provide an
environmental condition that play a vital role
in the development and spread of antimicrobial
resistance [22].

226
H.S. Muhammad et al. / J. Pharmacy & Bioresources 17(2), 208-233 (2020)
Table 7: Predicted pharmacokinetic parameters of the brands of ciprofloxacin S/N Brands Cmax
(ng/mL)
Tmax
(h)
T1/2
(h)
AUC
(ng/mL*h)
MRT
(h)
Vz/F
(mg)/(mg/mL)
Cl/F
(mg)/(ng/mL)/h
1 Prox 1455.48 0.42 4.0 8030.84 5.83 0.35 0.0613
2 Rapidflox 1361.79 0.75 4.0 8275.08 5.92 0.34 0.0595
3 Ciproheal 1530.90 0.33 4.0 8561.01 5.84 0.33 0.0575
4 Rumaxine 1663.83 0.25 4.0 8707.59 5.73 0.33 0.0565
5 Ciproall 1481.22 0.75 4.0 8745.65 5.74 0.33 0.0563
6 Ciprofax 1443.81 0.33 4.0 8810.74 5.78 0.33 0.0559
7 Cipro-Superior 1572.18 0.50 4.0 9418.34 5.85 0.30 0.0522
8 Cipad 1532.78 0.50 4.0 8952.72 5.78 0.32 0.0559
9 Cipro-Kriss 1332.41 0.33 4.0 7577.98 5.83 0.37 0.0649
10 Zindocip 1392.97 0.50 4.0 7788.38 5.74 0.37 0.0632
11 Vitapro 1079.16 1.00 4.0 7119.19 5.87 0.40 0.0691
12 Pemcipro 1595.86 0.50 4.0 8259.30 5.78 0.34 0.0596
13 Siprosan 1324.33 0.33 4.0 7642.62 5.75 0.38 0.0654
14 Cenox 1555.60 0.33 4.0 8900.00 5.74 0.32 0.0553
15 Zyprox 1324.82 0.50 4.0 8434.76 5.85 0.34 0.0583
16 Cyplox 1528.51 0.42 4.0 8916.56 5.79 0.32 0.0552
17 Gecip 1487.66 0.50 4.0 9014.19 5.89 0.32 0.0546
18 Cipromax fort 1460.44 0.75 4.0 8432.90 5.79 0.34 0.0584
19 Ciflaxin 1463.02 0.75 4.0 9050.30 6.11 0.31 0.0543
20 Vpl-Cipro 1387.07 0.42 4.0 8176.68 5.75 0.35 0.0602
21 Ciprof-500 1457.32 0.25 4.0 8344.63 5.77 0.34 0.0589
22 Zibatab 1429.72 0.42 4.0 8056.59 5.87 0.35 0.0610
23 Corflox 1509.99 0.50 4.0 8512.54 5.77 0.33 0.0578
24 Cifran 1485.17 0.75 4.0 8824.43 5.75 0.32 0.0557
25 Grakkoflox 1318.74 1.00 4.0 8491.37 6.00 0.33 0.0579
26 Cipronol 1302.9 0.75 4.0 8260.74 5.96 0.34 0.0595
27 Ciproxin 1572.70 0.42 4.0 8220.19 5.74 0.35 0.0599
28 Ciprogem 1554.69 0.42 4.0 8560.00 5.77 0.33 0.0575
29 Ciprotab 1008.83 0.75 4.0 6270.71 6.10 0.45 0.0784
When microorganisms are exposed to sub-
inhibitory concentrations, these have effects on
their bacterial physiology and morphology
leading to modulation of fitness and
pathogenicity traits. The mechanisms of
fluoroquinolone resistance include modulation
of target, increased efflux (export of a drug out
of the microorganism), fluoroquinolone
inactivation (by an aminoglycoside N-
acetyltransferase), and protection of the target
by DNA-binding proteins (known as Qnr) [23].
Assuring quality of antimicrobial agents is one
of the strategies that can reduce antimicrobial
resistance. Other strategies include patient
adherence, removing antimicrobial selective
pressure, health promotion and regulation to
restrict antimicrobial agents to prescription
only drugs.
Microbiological evaluation. A biological or
microbiological assay is employed to evaluate
both potency and bioactivity of an
antimicrobial agent [24]. Quality control of
antimicrobial formulations must therefore
include antimicrobial potency assay. Agar well
diffusion method is a practical and economical
method to use. In this study, nine (9) brands of
ciprofloxacin failed the potency test (Figure 2)
as they were outside the USP specification of
content assay (90-110%). These brands were
Ciproheal (74.9% and 85.8%), Cipad (89.2%
and 88.7%), Cipro-Kriss (58.9% and 65.9%),
Siprosan (88.5% and 87.0%), Gecip (65% and
76.8%), Zibatab (66.4% and 89.0%), Corflox
(62.6% and 76.7%), Cifran (73.3% and 66.1%)
and Grakkoflox (78.5% and 79.6%) indicating
% potency against P. aeruginosa and S. aureus

227
H.S. Muhammad et al. / J. Pharmacy & Bioresources 17(2), 208-233 (2020)
respectively. This microbiological evaluation
provides insight to the antimicrobial activity of
these brands of ciprofloxacin. This may
confirm the clinical observations of the health
professionals in hospitals in North-eastern
Nigeria. As the brands varied in % potencies
so will their therapeutic efficacies. Indeed, this
data may be a guide for the health
professionals to make evidence-based
decisions on procurement and prescribing. The
disparity between the % potency for some
brands for the two test organisms as found in
brands ciproheal, cipro-kriss, gecip, zibatab,
corflox and cifran ought not to be. The
mechanism of action of ciprofloxacin is the
same for gram-positive and gram-negative
organisms and so the % potency should be
same for both organisms. The disparity may be
due to actives/metabolites/impurities which
may have affected one organism more than the
other, giving exaggerated response.
Test for impurities. Any substance in a
formulation other than the API and excipients
is an impurity. Limiting the quantity of
impurities if not ensuring none is a regulatory
requirement as some impurities may be toxic
and some may affect the efficacy of APIs. As a
result, test for purity and impurity profiling are
mandatory to establish biological safety [25].
Impurities may emanate from the API as by-
products of synthesis, excipients, during
formulation process and packaging or
degraded products on storage. Figure 3
displayed two images as samples of the
outcome of test for impurities using TLC.
Singles spots were observed in all plates for all
brands. All brands had the same Rf values of
0.73 indicating the presence of ciprofloxacin in
all the brands. The single spots implied that
there were no impurities. While this study
indicated no impurities, Kyriacos and co-
workers [26] found impurities –
ethylenediamine, desfluorociprofloxacin and
fluoroquinolonic acid – which were not more
than 0.2% and were therefore within limits.
This study employed TLC while Kyriacos and
co-workers utilized HPLC. It is worthy to note
that HPLC has better sensitivity, selectivity,
and resolution. In another study, Trefi and
colleagues [27] used 19F and 1H nuclear
magnetic resonance (NMR) and Diffusion-
Ordered 1H NMR Spectroscopy (1H NMR
DOSY) for impurity profiling of generic
ciprofloxacin tablets. Four to twelve
fluorinated impurities were detected in all
brands tested, two non-fluorinated were
detected in seven formulations and degradation
product of ciprofloxacin was found in all the
formulations tested. Consequently, absence of
impurities in this study may suggest that there
may be no co-active ingredient which may
interfere with the efficacy of ciprofloxacin
hydrochloride or be toxic to the patient. It may
also suggest that a more sensitive and selective
instrument should be used to test for
impurities.
In vitro drug release. Aesthetic formulations
may appeal to the senses of touch, sight, and
taste; however, if they are not able to release
the drugs to produce the desired therapeutic
effects, they are as good as placebo. The rate of
liberation from tablet matrix and rate of release
determines the rate and extent of absorption.
The rate and extent of absorption determine the
minimum inhibitory concentrations (MICs)
and minimum bactericidal concentrations
(MBCs) which influence therapeutic efficacy
of antibiotics. Consequently, dissolution
testing which assesses the rate of drug release
over time can be employed as a surrogate for
bioavailability studies. In vitro drug release
studies can be used to predict in vivo
absorption giving insight into the liberation
and absorption patterns of the formulation. For
antibiotics, the optimal dosing should be equal
to or greater than the MICs for bacteriostatic
drugs and equal to or greater than the MBCs of
bactericidal drugs. However, to prevent
antimicrobial resistance, bactericidal drugs are
preferred. Ciprofloxacin exhibits both
bacteriostatic and bactericidal activities
depending on concentration the organisms are

228
H.S. Muhammad et al. / J. Pharmacy & Bioresources 17(2), 208-233 (2020)
exposed to [28]. The study of release of
ciprofloxacin from the formulations gives
insight into the rate of liberation from tablet
matrices, amount released and invariably,
plasma concentration that will be expected
from each brand.
In this study, employing dissolution
medium, 0.1 N HCl, 9 of 29 brands released ≥
85 % of the labelled amount in 15 min. These
brands are ciproall (88.8%), ciprofax (88.8%),
ciprofloxacin-superior (106%), pemcipro
(87%), cenox (89.7%), cyplox (88.2%), ciprof
(99.8%), cifran (91%) and ciproxin (85%)
while 20 brands that released ≥ 80 % of the
labelled amount in 30 min are rapidflox
(96.9%), prox (92.2%), ciproheal (97.1%),
rumaxine (82.8%), ciproall (88.5%), ciprofax
(88.5%), ciprofloxacin-superior (85.2%),
cipad (83.2%), pemcipro (80%), cenox
(99.4%), zyprox (99.9%), cyplox (99.3%),
cipromax fort (96.2%), vpl-ciprofloxacin
(92.4%), ciprof (99.8%), zibatab (92%),
corflox (82.4%), cifran (88.3%), ciproxin
(93.1%) and ciprogem (92.8%). However, 9
brands, ciprokriss (64%), zindocip (39%),
vitapro (78%), siprosan (37%), gecip (74.9%),
ciflaxin (64.9%), grakkoflox (60.9%), cipronol
(60.9%), and ciprotab (27.6%) failed to release
80 % of the labelled amount in 30 min.
When acetate buffer pH 4.5 was used, 9
brands, ciproall (86.9%), ciprofax (86.3%),
ciproheal (86.9%), rumaxine (101.1%), cipad
(85%), ciprofloxacin-superior (87.7%), cenox
(86.5%), ciprof (88.8%), and cifran (88%)
released ≥ 85 % of the labelled amount in 15
min. Then, 20 brands, prox (85.8%), ciproheal
(92%), rumaxine (96%), ciproall (86%),
ciprofloxacin- superior (97.2%), cipad
(95.3%), zindocip (86.8%), pemcipro (98%),
cenox (87%), zyprox (82%), cyplox (94%),
gecip (91%), cipromax fort (90.1%), vpl-
ciprofloxacin (85%), ciprof (82%), zibatab
(85%), corflox (93%), cifran (86%), ciproxin
(83%) and ciprogem (83%) released ≥ 80 % of
the labelled amount in 30 min. However,
ciprokriss (75.3%), rapidflox (77.2%),
ciprofax (78%), vitapro (66%), siprosan
(75%), ciflaxin (60.1%), grakkoflox (72%),
cipronol (68%), and ciprotab (40.3%) failed to
release 80 % in 30 min. It may be worthy to
note that some brands such as zindocip
performed significantly better at higher pH
indicating that some formulations may be pH
sensitive thereby slightly or significanlty
modulating the rate of release of ciprofloxacin.
Excipients can affect the rate of drug release
and invariably, the rate and extent of
absorption.
For high solubility active pharmaceutical
ingredient formulated as immediate release
oral dosage forms, the dissolution criterion is
Q (quantity) = 80 % in 30 min [29]. In each
medium (pH 1.2 and 4.5), 20 brands met this
criterion, however, 7 brands, ciprokriss,
vitapro, siprosan, ciflaxin, grakkoflox,
cipronol and ciprotab failed to meet the
dissolution criterion in both media.
FDA Guidance for Industry, Waiver of In
Vivo Bioavailability and Bioequivalence
Studies for Immediate-Release (IR) Solid Oral
Dosage Forms states that a product is rapidly
dissolving when ≥ 85 % of the labelled active
pharmaceutical ingredient dissolves in 0.1 N
HCl, pH 4.5 and pH 6.8 media within 30 min
[30]. Eighteen (18) brands (prox, ciproheal,
rumaxine, cipro-all, ciprofax, cipro-superior,
cipad, pemcipro, cenox, cyplox, cipromax fort,
vpl-ciprofloxacin, ciprof, zibtab, corflox,
cifran, ciprogem and ciproxin) suggest they are
rapidly dissolving as ≥ 85 % of the labelled
API dissolved in both 0.1 N HCl and pH 4.5 in
30 min. In addition, an IR solid dosage form is
very rapidly dissolving when ≥ 85 % of the
labelled active pharmaceutical ingredient
dissolves in 0.1 N HCl, pH 4.5 and pH 6.8
within 15 min. Six (6) brands, rumaxine, cipro-
all, ciprofax, cenox, ciprof and cifran suggest
rapid dissolution as ≥ 85 % of the labelled API
dissolved in both 0.1 N HCl and pH 4.5 media
in 15 min.
The dissolution profiles in pH 6.8 was not
presented as the dissolution of ciprofloxacin in

229
H.S. Muhammad et al. / J. Pharmacy & Bioresources 17(2), 208-233 (2020)
pH 6.8 was ≤ 35 %. Oishi and co-workers [31]
obtained similar lower drug release (37.17%)
in pH 6.8. Fluoroquinolones such as
ciprofloxacin are zwitterionic comprising two
proton-binding sites and displays a U-shaped
pH solubility profile [32]. Ciprofloxacin is
highly soluble at pH less than 5 and above 10
with limited solubility close to neutral (pH 7).
Ciprofloxacin has been classified into the 4
classes of Biopharmaceutical Classification
System (BCS) by various studies [26, 32-39].
The common class ciprofloxacin is attributed
to is Class III (high solubility, low
permeability). However, Hansmann and co-
workers [37] suggest that ciprofloxacin
behaves like a Class I (high solubility, high
permeability) drug in vivo. The BCS class
changes could be due to the sensitivity of the
drug to the excipients used in formulation [39].
Consequently, the FDA biowaiver guidelines
advocates that for class III, the test product
must contain the same excipients as the
reference for a biowaiver to be scientifically
justified [30]. This was not the case for all
brands.
Mathematical models, similarity and
difference factors were employed to determine
the bioequivalence between the generic brands
and innovator brand, ciproxin. The similarity
factor (f2) is a logarithmic reciprocal square
root transformation of the sum of squared error
and measures the similarity in the percent
dissolution between the two curves while the
difference factor (f1) is the difference in
percentage between two curves at each point
and measures the relative error between the
two curves [1]. Similarity factor (f2) is
recommended by US Food Drug and
Administration, and European Medicines
Agency (EMA) for comparing similarity
between two or more dissolution profiles and
invariably for determining bioequivalence.
Tables 4 and 5 show the data for similarity
factor (f2) and difference factor (f1) in 0.1 N
HCl and pH 4.5, respectively. For a test
product to be said to be bioequivalent to the
reference or innovator product, similarity
factor (f2) should be between 50 and 100 and
difference factor (f1) should be between 0 and
15. Dissolution efficiency (DE) was also used
to compare similarity and determine
bioequivalence in order to have at least three
comparison approaches. Dissolution efficiency
is described as the area under the dissolution-
time curve expressed as a percentage of the
dissolution curve at maximum dissolution y100
over the same time range. The innovator brand
and the generic product can be said to be
bioequivalent if the difference between their
DEs is within appropriate limits (±10 %) [1].
Dissolution efficiency was only calculated
using dissolution profiles obtained in medium
pH 4.5 because this is the pH closer to the
absorption window/site of ciprofloxacin.
In 0.1 N HCl, seven brands, rapidflox,
cipro-all, pemcipro, zyprox, cipromax fort,
cifran and ciprogem were bioequivalent to the
innovator brand, ciproxin using f1 and f2 (Table
4). Six brands, ciproheal, cipad, cenox, cyplox,
vpl-ciprofloxacin and ciprof were
bioequivalent with f1 and bio-inequivalent with
f2. In pH 4.5, nine brands, cipro-all, ciprofax,
cipad, zindocip, cyplox, vpl-ciprofloxacin,
ciprof, cifran and ciprogem were bioequivalent
using f1 and f2 (Table 5). Six brands, rumaxine,
siprosan, cenox, zyprox, cipromax fort and
corflox were bioequivalent with f1 and bio-
inequivalent with f2. Nineteen brands were
bioequivalent to ciproxin using DE alone while
rapidflox, ciprokriss, vitapro, gecip, ciflaxin,
zibatab, grakkoflox, cipronol and ciprotab
were not bioequivalent (Table 6). Eight brands,
ciprokriss, vitapro, gecip, ciflaxin, zibatab,
grakkoflox, cipronol and ciprotab were bio-
inequivalent using the three models, similarity
factor (f2), and difference factor (f1) in the two
media and dissolution efficiency (DE) in pH
4.5. Only three brands, cipro-all, cifran and
ciprogem were found to be bioequivalent to the
innovator brand, ciproxin using the three
models, similarity factor (f2), and difference
factor (f1) in the two media and dissolution

230
H.S. Muhammad et al. / J. Pharmacy & Bioresources 17(2), 208-233 (2020)
efficiency in pH 4.5. These three brands may
confidently be used interchangeably with the
innovator brand, ciproxin. Bio-inequivalence
may be caused by excipients or manufacturing
process/variables.
Predicted in vivo absorption. Dissolution pH
data chosen for convolution to determine
plasma concentration-time curve (Figures 16 –
21) and pharmacokinetic data was those of pH
4.5 as the main absorption site for
ciprofloxacin is the duodenum and jejunum.
pH range observed in the duodenum is from
4.20 to 8.20.
The predicted pharmacokinetic parameters
for the various brands of ciprofloxacin are
shown in Table 7. Maximum plasma
concentration, Cmax for the various brands was
from 1008 (ciprotab) to 1663.88 ng/mL
(rumaxine); time to maximum plasma
concentration, tmax was from 0.25 (ciprof-500,
rumaxine) to 1 h (grakkoflo, vitapro); t1/2 was
4 h for all; area under the concentration time
curve, AUC was from 6270.71 (ciprotab) to
9418.34 ng/mL*h and apparent volume of
distribution, Vz/F, was from 0.30 (cipro-
superior) to 0.45 mg/(mg/mL) (ciprotab). The
predicted Cmax, tmax, AUC and Vz/F of
innovator brand, ciproxin were 1572.7 ng/mL,
0.4 h, 8220.19 ng/mL*h and 0.35 mg/(mg/mL)
respectively. The pharmacokinetic data of
some brands indicate that absorption will be
rapid, ciprofloxacin will be liberated from the
tablets and achieve maximum plasma
concentration in ≤ 1 h. Brands such as ciprotab,
vitapro, cipronol, grakkflox amongst other
may need to be reformulated to produce
pharmacokinetic data comparable to that of the
innovator brand, ciproxin to ensure
bactericidal action.
The in vivo studies on ciprofloxacin
collaborates with the predicted data in this
study such as t1/2 range from 3 – 6 h and tmax ≤
1 h [40-42]. Lubasch and co-workers’ [43] in
vivo study on ciprofloxacin (Cmax, - 1500 ± 430
ng/mL; tmax, - 0.78 ± 0.33 h and MRT – 5.8 ±
0.94) and newer generation quinolones
collaborates with some of the predicted
pharmacokinetic data in this study. These in
vivo studies confirm that pharmacokinetics of
drugs can be simulated using in vitro drug
release data. Predicting in vivo absorption
(plasma drug concentration-time profiles)
from in vitro drug release data required
inputting known ciprofloxacin parameters –
volume of distribution (3 L/Kg), half-life (4 h)
and oral bioavailability (0.70) obtained from
FDA published data [44]. These parameters are
inherent in the drug and are not influenced by
the formulation. Predicting in vivo absorption
from in vitro drug release can be used to avert
clinical failure as the product developer can
have a prior insight into the liberation and
absorption of the formulation. Should the
formulation not produce the desired plasma
concentration and area under the time curve
that can elicit therapeutic response, the product
developer can reformulate. Consequently, in
vivo simulation does not only validate the in
vitro drug release data but also provides some
ethical and economic benefits such reduction
in cost of product development [45]. The
pharmacokinetic parameters were obtained
from the non-compartmental analysis of the
predicted plasma drug concentration-time
profiles using PKsolver, an add-in to Microsoft
excel.
Ciprofloxacin is a widely used
fluoroquinolones in clinical settings displaying
varying clinical success against organisms.
The MICs for broad spectrum clinical success
against bacteria are from 0.08 to 1.0 ug/mL;
higher MICs (0.5 – 1.0 ug/mL) are for species
such as Pseudomonas, staphylococcus and
susceptible S. pneumoniae [46]. It is envisaged
that 500 mg dose should achieve the MIC
range. Clinical failure to antibiotics includes
factors such as host defences, the bacterium
and its susceptibility and the concentration
profile of the antibiotic. However, most
treatment failures are due to antibiotic
concentration dependent outcomes such as
MIC and AUC.

231
H.S. Muhammad et al. / J. Pharmacy & Bioresources 17(2), 208-233 (2020)
The manufacturer or the marketer who
receives marketing authorization is responsible
for continuous monitoring of the safety of her
product(s) in the market, for informing the
authorities of possible changes that may affect
the marketing authorization and for ensuring
the updating of product information in their
territories of operation [47]. The clinical
pharmacist should report not just adverse drug
reactions and medication errors, but also
quality issues relating to medicines. Poor
quality medicines are a threat to the patients
and the health systems. Giving attention to
quality issues can prevent adverse drug
reactions associated with poor quality
medicines and some drug-related problems.
Conclusion. The pharmaceutical integrity of
all drugs is of utmost importance, to ensure
safe and effective drug therapy. As a result,
standardization is necessary to ensure
uniformity with compendia such as British
pharmacopoeia (B.P), and United States
pharmacopoeia (U.S.P) as guides.
Pharmaceutical quality assessment of twenty-
nine (29) different brands of ciprofloxacin
were undertaken. The inability of some of the
brands not to meet the specifications of
compendia makes the concerns for the study
very germane. The varied potencies of the
various brands translate to different therapeutic
results, hence making generic substitutions
inappropriate. The effects of poor
pharmaceutical quality ciprofloxacin in the
market cannot be over emphasized, as it is one
of the most widely used antibiotics capable of
decreasing both morbidity and mortality rates
in Africa. There is an urgent need to scale up
quality control monitoring at the points of
manufacturing and importation, as well as
post-market surveys. The post-market survey
scale-up can be achieved through partnerships
with universities and other tertiary institutions,
by equipping their laboratories to standards,
where these assays can be carried out. In
addition, hospitals in the country can be
encouraged to create mini pharmaceutical
laboratories within the pharmacy departments
for quick quality assessment. This study is a
clarion call for all stakeholders to get involved
and ensure the safety and potency of drugs in
the market.
REFERENCES
1. Ngwuluka NC, Lawal K, Olorunfemi PO, Ochekpe
NA. Post-market in vitro bioequivalence study of six
brands of ciprofloxacin tablets/caplets in Jos, Nigeria.
Scientific Research and Essays. 2009; 4(4):298-305.
2. Ochekpe N, Bello C, Ngwuluka N, Abubakar M,
Mustapha B, Adegoke O. An assessment of the
compliance of some essential drugs in Nigeria to
pharmacopoeial specifications. Journal of Pharmacy
& Bioresources. 2006; 3(1):7-11.
3. Ochekpe N, Ngwuluka N, Owolayo H, Fashedemi T.
Dissolution profiles of three brands of Lamivudine
and Zidovudine combinations in the Nigerian market.
Dissolution Technologies. 2006; 13(4):12-17.
4. Ochekpe N, Ngwuluka N, Agbowuro A, Obodozie O.
Dissolution profiles of twelve brands of sulphadoxine
pyrimethamine in the Nigerian market. Dissolution
Technologies 2012; 19(1):59-64.
5. Kovacs S, Hawes SE, Maley SN, Mosites E, Wong L,
Stergachis A. Technologies for detecting falsified
and substandard drugs in low and middle-income
countries. PLoS One. 2014; 9(3):e90601.
6. Glass BD. Counterfeit drugs and medical devices in
developing countries. Research and Reports in
Tropical Medicine. 2014; 201411-22.
7. Nayyar GM, Breman JG, Newton PN, Herrington J.
Poor-quality antimalarial drugs in southeast Asia and
sub-Saharan Africa. The Lancet infectious diseases.
2012; 12(6):488-496.
8. WHO (2011) Substandard/Spurious/Falsely-
Labelled/ Falsified/Counterfeit Medical Products.
Available via
https://apps.who.int/gb/sf/pdf_files/A64_16-en.pdf
Accessed 11/11/2019.
9. Renschler JP, Walters KM, Newton PN,
Laxminarayan R. Estimated Under-Five Deaths
Associated with Poor-Quality Antimalarials in Sub-
Saharan Africa. The American Journal of Tropical
Medicine and Hygiene. 2015;92(6_Suppl):119-126.
10. Alomi YA, Kamal E. National Drug Quality
Reporting System at Ministry of Health in Saudi
Arabia. J Pharmacovigilance. 2016; 4(3):208.

232
H.S. Muhammad et al. / J. Pharmacy & Bioresources 17(2), 208-233 (2020)
11. NAFDAC (2020) NAFDAC Registered Products
Database: Ciprofloxacin. Available via
https://www.nafdac.gov.ng/our-services/registered-
products/ Accessed 13/05/2020.
12. Osadebe PO, Esimone OC, Akabogu IC. An
empirical assessment of the possibility of
interchangeability between multisource ciprofloxacin
hydrochloride tablets marketed in Nigeria. Boll Chim
Farm. 2003; 142(8):352-356.
13. Adegbolagun O, Olalade O, Osumah S. Comparative
evaluation of the biopharmaceutical and chemical
equivalence of some commercially available brands
of ciprofloxacin hydrochloride tablets. Tropical
journal of pharmaceutical research. 2007; 6(3):737-
745.
14. Okonkwo TJ, Afieroho EO, Odigwe A, Osadebe PO.
Assessment of the quality control parameters of five
brands of ciprofloxacin hydrochloride caplets in
Nigeria. J Pharm Biores. 2009; 3(2):83-88.
15. Akpabio E, Jackson C, Ugwu C, Etim M, Udofia M.
Quality control and in vitro bioequivalence studies on
four brands of ciprofloxacin tablets commonly sold in
Uyo Metropolis, Nigeria. J Chem Pharm Res. 2011;
3(3):734-741.
16. Osonwa Uduma E, Agboke Ayodeji A, Amadi
Rosemary C, Okorie O, Opurum Christian C.
Bioequivalence studies on some selected brands of
ciprofloxacin hydrochloride tablets in the Nigerian
market with ciproflox® as innovator brand. Journal of
applied pharmaceutical science. 2011; 1(06):80-84.
17. Osonwa UE, Abali SO, Chukwu KI, Udensi KE.
Quality Assessment of Fifteen Different Brands of
Ciprofloxacin Hydrochloride Tablets Marketed in
Anambra. African Journal of Pharmaceutical
Research & Development. 2016; 8(1):1-8.
18. Joda A, Tayo F, Aina B. Quality assessment of
ciprofloxacin tablets obtained from community
pharmacies in Lagos, Nigeria. Ife Journal of Science.
2018; 20(1):155-168.
19. The United States Pharmacopeia, USP 29/The
National Formulary, NF 24;2006. United States
Pharmacopeial Convention. Rockville, MD.
20. Mu’az J, Gazali L, Sadiq G, Tom G. Comparative in
vitro evaluation of the pharmaceutical and chemical
equivalence of multi-source generic ciprofloxacin
hydrochloride tablets around Maiduguri metropolitan
area. Nigerian Journal of Pharmaceutical Sciences.
2009; 8(2):102-106.
21. Anah VU, Ebong AS, Charles GE, Esenam FD,
Ukpanah II, Essien AA, et al. Quantitative and
qualitative analysis of some brands of ciprofloxacin
tablets sold in Uyo metropolis, Akwa Ibom State,
Nigeria. Nigerian Journal of Pharmaceutical and
Applied Science Research. 2019; 8(3):15-22.
22. Sinel C, Cacaci M, Meignen P, Guerin F, Davies BW,
Sanguinetti M, et al. Subinhibitory Concentrations of
Ciprofloxacin Enhance Antimicrobial Resistance and
Pathogenicity of Enterococcus faecium. Antimicrob
Agents Chemother. 2017;
61(5):10.1128/AAC.02763-16.
23. Holmes AH, Moore LS, Sundsfjord A, Steinbakk M,
Regmi S, Karkey A, et al. Understanding the
mechanisms and drivers of antimicrobial resistance.
The Lancet. 2016; 387(10014):176-187.
24. Dafale NA, Semwal UP, Rajput RK, Singh G.
Selection of appropriate analytical tools to determine
the potency and bioactivity of antibiotics and
antibiotic resistance. Journal of pharmaceutical
analysis. 2016; 6(4):207-213.
25. Pilaniya K, Chandrawanshi HK, Pilaniya U,
Manchandani P, Jain P, Singh N. Recent trends in the
impurity profile of pharmaceuticals. J Adv Pharm
Technol Res. 2010; 1(3):302-310.
26. Kyriacos SB, Boukarim C, Safi W, Mroueh M,
Maroun AB, El-Khoury G, et al. In vitro testing of
ciprofloxacin formulations and preliminary study on
BCS biowaiver. J Food Drug Anal. 2009; 17(2):78-
84.
27. Trefi S, Gilard V, Malet-Martino M, Martino R.
Generic ciprofloxacin tablets contain the stated
amount of drug and different impurity profiles: A 19F,
1H and DOSY NMR analysis. J Pharm Biomed Anal.
2007; 44(3):743-754.
28. Silva F, Lourenço O, Queiroz JA, Domingues FC.
Bacteriostatic versus bactericidal activity of
ciprofloxacin in Escherichia coli assessed by flow
cytometry using a novel far-red dye. J Antibiot. 2011;
64(4):321-325.
29. US Food and Drug Administration. Guidance for
industry, Dissolution Testing and Acceptance Criteria
for Immediate-Release Solid Oral Dosage Form Drug
Products Containing High Solubility Drug
Substances. 2018. Available via
https://www.fda.gov/media/92988/download
Accessed 11/11 2019.
30. US Food and Drug Administration. Guidance for
Industry, Waiver of in vivo bioavailability and
bioequivalence studies for immediate release solid
oral dosage forms based on a biopharmaceutics
classification system. 2017. Available via
https://www.fda.gov/media/70963/download
Accessed 11/11 2019.

233
H.S. Muhammad et al. / J. Pharmacy & Bioresources 17(2), 208-233 (2020)
31. Oishi TS, Haque MA, Dewan I, Islam SA.
Comparative in vitro dissolution study of some
ciprofloxacin generic tablets under biowaiver
conditions by RP-HPLC. Int.J.Pharm.Sci.Res. 2011;
2(12):3129-3135.
32. Olivera M, Manzo R, Junginger H, Midha K, Shah V,
Stavchansky S, et al. Biowaiver monographs for
immediate release solid oral dosage forms:
Ciprofloxacin hydrochloride. J Pharm Sci. 2011;
100(1):22-33.
33. WHO. Proposal to waive in vivo bioequivalence
requirements for WHO Model List of Essential
Medicines immediate-release, solid oral dosage
forms. WHO Tech Rep Ser. 2006;(937):391-437.
34. Hanafy AF. In-vitro bioequivalence,
physicochemical and economic benefits study for
marketed innovator and generic ciprofloxacin
hydrochloride tablets in Saudi Arabia. Journal of
Applied Pharmaceutical Science. 2016; 6(09):063-
068.
35. Fahmy S, Abu-Gharbieh E. In vitro dissolution and
in vivo bioavailability of six brands of ciprofloxacin
tablets administered in rabbits and their
pharmacokinetic modeling. Biomed Res Int. 2014;
2014:590848.
36. Kasim NA, Whitehouse M, Ramachandran C,
Bermejo M, Lennernäs H, Hussain AS, et al.
Molecular properties of WHO essential drugs and
provisional biopharmaceutical classification.
Molecular pharmaceutics. 2004; 1(1):85-96.
37. Hansmann S, Miyaji Y, Dressman J. An in silico
approach to determine challenges in the
bioavailability of ciprofloxacin, a poorly soluble weak
base with borderline solubility and permeability
characteristics. European Journal of Pharmaceutics
and Biopharmaceutics. 2018; 122:186-196.
38. Bhattacharya S, Prajapati BG. Formulation, design
and development of ciprofloxacin hydrochloride
floating bioadhesive tablet. e-Journal of Science &
Technology. 2017; 12(3):55-76.
39. delMoral-Sanchez J, Gonzalez-Alvarez I, Gonzalez-
Alvarez M, Navarro A, Bermejo M. Classification of
WHO Essential Oral Medicines for Children
Applying a Provisional Pediatric Biopharmaceutics
Classification System. Pharmaceutics. 2019;
11(11):567.
40. Hoffken G, Lode H, Prinzing C, Borner K, Koeppe P.
Pharmacokinetics of ciprofloxacin after oral and
parenteral administration. Antimicrob Agents
Chemother. 1985; 27(3):375-379.
41. Bergan T, Thorsteinsson SB, Solberg R, Bjornskau L,
Kolstad IM, Johnsen S. Pharmacokinetics of
ciprofloxacin: intravenous and increasing oral doses.
Am J Med. 1987; 82(4A):97-102.
42. Lettieri JT, Rogge MC, Kaiser L, Echols RM, Heller
AH. Pharmacokinetic profiles of ciprofloxacin after
single intravenous and oral doses. Antimicrob Agents
Chemother. 1992; 36(5):993-996.
43. Lubasch A, Keller I, Borner K, Koeppe P, Lode H.
Comparative pharmacokinetics of ciprofloxacin,
gatifloxacin, grepafloxacin, levofloxacin,
trovafloxacin, and moxifloxacin after single oral
administration in healthy volunteers. Antimicrob
Agents Chemother. 2000; 44(10):2600-2603.
44. Drug@FDA (2020) CIPRO® (ciprofloxacin
hydrochloride) TABLETS. Available via
https://www.accessdata.fda.gov/drugsatfda_docs/lab
el/2020/019537s090,020780s047lbl.pdf Accessed
13/04/2020.
45. Ngwuluka NC, Nep EI, Ochekpe NA, Odumosu PO,
Olorunfemi PO. Eudragit E100 and polysaccharide
polymer blends as matrices for modified-release drug
delivery II: Swelling and release studies. Tropical
Journal of Pharmaceutical Research. 2015;
14(12):2163-2170.
46. Forrest A, Nix DE, Ballow CH, Goss TF,
Birmingham MC, Schentag JJ. Pharmacodynamics of
intravenous ciprofloxacin in seriously ill patients.
Antimicrob Agents Chemother. 1993; 37(5):1073-
1081.
47. Nwaiwu O, Oyelade O, Eze C. Evaluation of
Pharmacovigilance Practice in Pharmaceutical
Companies in Nigeria. Pharm Med. 2016; 30(5):291-
295.