Quality assurance methods for performance-based assessments
22
Advances in Health Sciences Education 8: 27–47, 2003. © 2003 Kluwer Academic Publishers. Printed in the Netherlands. 27 Quality Assurance Methods for Performance-Based Assessments JOHN R. BOULET 1∗ , DANETTE W. MCKINLEY 1 , GERALD P. WHELAN 1 and RONALD K. HAMBLETON 2 1 Research and Evaluation, Educational Commission for Foreign Medical Graduates (ECFMG), 3624 Market Street, Philadelphia, PA 19104-2685, USA; 2 University of Massachusetts, MA, USA ( ∗ author for correspondence, e-mail: [email protected]) Abstract. Performance assessments are subject to many potential error sources. For performance- based assessments, including standardized patient (SP) examinations, these error sources, if left unchecked, can compromise the validity and reliability of scores. Quality assurance (QA) measures, both quantitative and qualitative, can be used to ensure that candidate scores are accurate and reason- ably free from measurement error. The purpose of this paper is to outline several QA strategies that can be used to identify potential content- and score-related problems with SP assessments. These approaches include case analyses and various comparisons of primary and observer scores. Specific examples from the ECFMG Clinical Skills Assessment (CSA ) are used to educate the reader concerning appropriate statistical methods and legitimate data interpretations. The results presented in this investigation highlight the need for well-defined training regimes, regular feedback to those involved in rating/scoring performances, and detailed statistical analyses of all scores. Key words: clinical skills, performance assessment, psychometrics, quality assurance, standardized patients Background The use of scores from performance assessments as part of certification and licen- sure decisions is now widespread (Dauphinee and Norcini, 1999; Grand’Maison et al., 1997; Whelan, 1999). In medicine, standardized patients (SPs) and other simulation modalities are now being used to assess the clinical skills of students and residents (Carraccio and Englander, 2000; Klass, 1994; Swanson et al., 1995; Vu and Barrows, 1994). Although there is significant variation in the content, administration, and scoring of these types of performance assessments, the use of checklists and/or rating scales is generally incorporated in one form or another. The scoring can be done by the performing SP in the encounter, a SP or other individual observing from outside the examination room, a physician within the encounter, via videotape, or some combination. Post-encounter exercises, which are often incorporated as part of these SP assessments, can be machine-scored or evaluated by various trained professionals, including physicians (Friedman Ben
-
Upload
independent -
Category
Documents
-
view
2 -
download
0
Transcript of Quality assurance methods for performance-based assessments

Advances in Health Sciences Education 8: 27–47, 2003.© 2003 Kluwer Academic Publishers. Printed in the Netherlands.
27
Quality Assurance Methods for Performance-BasedAssessments
JOHN R. BOULET1∗, DANETTE W. MCKINLEY1, GERALD P. WHELAN1
and RONALD K. HAMBLETON2
1Research and Evaluation, Educational Commission for Foreign Medical Graduates (ECFMG),3624 Market Street, Philadelphia, PA 19104-2685, USA; 2University of Massachusetts, MA, USA(∗author for correspondence, e-mail: [email protected])
Abstract. Performance assessments are subject to many potential error sources. For performance-based assessments, including standardized patient (SP) examinations, these error sources, if leftunchecked, can compromise the validity and reliability of scores. Quality assurance (QA) measures,both quantitative and qualitative, can be used to ensure that candidate scores are accurate and reason-ably free from measurement error. The purpose of this paper is to outline several QA strategies thatcan be used to identify potential content- and score-related problems with SP assessments. Theseapproaches include case analyses and various comparisons of primary and observer scores. Specificexamples from the ECFMG Clinical Skills Assessment (CSA�) are used to educate the readerconcerning appropriate statistical methods and legitimate data interpretations. The results presentedin this investigation highlight the need for well-defined training regimes, regular feedback to thoseinvolved in rating/scoring performances, and detailed statistical analyses of all scores.
Key words: clinical skills, performance assessment, psychometrics, quality assurance, standardizedpatients
Background
The use of scores from performance assessments as part of certification and licen-sure decisions is now widespread (Dauphinee and Norcini, 1999; Grand’Maisonet al., 1997; Whelan, 1999). In medicine, standardized patients (SPs) and othersimulation modalities are now being used to assess the clinical skills of studentsand residents (Carraccio and Englander, 2000; Klass, 1994; Swanson et al., 1995;Vu and Barrows, 1994). Although there is significant variation in the content,administration, and scoring of these types of performance assessments, the useof checklists and/or rating scales is generally incorporated in one form or another.The scoring can be done by the performing SP in the encounter, a SP or otherindividual observing from outside the examination room, a physician within theencounter, via videotape, or some combination. Post-encounter exercises, whichare often incorporated as part of these SP assessments, can be machine-scored orevaluated by various trained professionals, including physicians (Friedman Ben

28 JOHN R. BOULET ET AL.
David et al., 1997). Here, the choice of scoring model will depend on the format ofthe exercise and the required precision of scores.
Unlike standard paper-and-pencil tests, performance assessments are subjectto a much wider array of potential measurement errors. Depending on the sourceand magnitude of these errors, the validity of the scores can be compromised.Recall, favoritism, carelessness, and the misinterpretation of scoring rubrics couldall potentially yield inconsistent scores. This can be especially problematic giventhe relatively small number of performance samples typically used in these typesof assessments. Issues such as bias or misinterpretation of scoring rubrics, whilelikely systematic at the case level, can potentially be mitigated by having suffi-cient numbers of performance samples and raters. For example, in a standardizedpatient assessment that uses only a few cases it is more likely that a candidatecould encounter a subset of more stringent scorers, thereby receiving a score thatunderestimated his true ability. As the number of encounters increases it becomesmore probable that these sources of error will even out, and that the candidatewill neither be advantaged nor disadvantaged by a particular set of SPs or raters.Unfortunately, the time required to interview and examine a patient limits thenumber of encounters that can be used in these assessments, thereby constrainingthe reliability of scores. As a result, significant efforts must be made to identify andmitigate potential sources of error.
In high-stakes assessments minimization of measurement errors is paramount.The most efficient methods of dealing with error in performance-based assessmentsare through proper case (or task) development and rater training. For SP-basedassessments, case development can be quite varied but should involve the assimil-ation of expert opinion, pilot testing, and regular feedback to the test developers.Once cases are developed, the SPs must be trained to portray the patients in arealistic and systematic fashion. If the SP can interact with the examinee in a meth-odical fashion, use well-defined scoring rules, and eliminate extraneous factorswhen scoring, one can be reasonably assured that valid scores can be obtained.Similarly, if a post-encounter exercise is incorporated in the assessment, any indi-viduals scoring this exercise must be well trained and consistent in their use of thescoring rubrics. If the training is poor, and raters are left to use personal judgmentsin the assignment of scores, measurement errors can be significant. Training ofSPs and other raters for high-stakes assessments can be both time consuming andexpensive. Nevertheless, efforts spent in this area, combined with those made toensure that content is adequate, can have a major impact on the defensibility of theresulting scores.
There are a number of quality assurance (QA) mechanisms, both qualitativeand quantitative, that can be incorporated in performance assessments (Pangaro etal., 1997; Sinacore et al., 2000). For SP-based assessments, where the performingSP typically provides scores as well, these procedures can be used to monitorperformance and make any necessary changes in the assessment, where necessary(De Champlain et al., 1997). For simulated clinical encounters the most efficacious
QUALITY ASSURANCE METHODS FOR PERFORMANCE-BASED ASSESSMENTS 29
procedure is to have trained experts watch the interaction and provide immediatefeedback regarding portrayal and scoring issues. These individuals (e.g., observerSPs, SP trainers, and physicians) can also provide QA scores that can later be usedto identify specific problems with the case and/or SP. Observation and secondaryscoring can be done during pilot testing or during actual assessment administra-tions. Proper feedback will promote the standardization of portrayal and increasethe likelihood of obtaining accurate, unbiased scores and/or ratings (Wallace et al.,1999).
Once scores are obtained, several quantitative procedures can be used to identifydiscrepant scoring patterns. First, observer scoring of select performance samplescan be done. Comparing initial and observer scores can provide evidence forthe consistency of candidate ratings over SPs or raters. Here, generalizabilitytheory can also be used to decompose the various sources of measurement errorand inform test developers where improvements to the assessment would be themost efficacious. Second, various statistical analyses can be performed to identifyspecific SPs or cases that may be problematic. For skills that are not overlydependent on the content of the case, one would not expect that, over the same setof candidates, one SP’s average ratings would be significantly different from thoseof his peers. Similarly, where there are two or more SPs playing the same role, onewould not expect that, controlling for overall candidate ability, the mean scores fora representative candidate pool would be significantly different. A variety of otherstatistical analyses can be used to investigate case score drift over time, poten-tial halo effects, improper interpretation of checklist scoring rubrics, and checklistitems or cases that are not functioning properly.
Purpose
The purpose of this paper is to outline some of the many quality assurance proce-dures that can be used to help ensure that the scores from performance-basedexaminations are consistent and accurate. For this investigation data is taken froma high-stakes standardized patient assessment. Although the examples providedwill be specific to this particular type of examination, the methods described aregenerally applicable to many other types of performance assessments.
Case (task) development and rater training are very important facets of theQA process. However, this document will limit discussion to the quantitativeprocedures that can be used once scores are obtained. Specific reference to theEducational Commission for Foreign Medical Graduates (ECFMG�) ClinicalSkills Assessment (CSA�) will be made to provide the reader with a frameworkfor interpreting the results from QA statistical analyses that are regularly performedfor this high-stakes performance assessment. The utility of these procedures, evenfor more formative assessments such as those commonly performed in medicalschools, will be emphasized.
30 JOHN R. BOULET ET AL.
The paper is organized in several sections. First, a description of the ECFMGCSA is provided, including scoring rubrics and available data. Next, the sourcesof error in SP assessments are described. These are broadly categorized into (a)errors attributable to examination content and (b) errors due to scoring. In each ofthese two subsections various QA techniques are described. In addition, data fromthe ECFMG CSA is used to show the benefits of particular analysis strategies andinterpretive frameworks. Although the post-encounter patient note exercise is animportant part of the CSA, and QA methods are well developed for this part of theassessment, the present manuscript focuses on the scores and ratings obtained inthe patient encounter.
ECFMG CSA Prototype
The choice of QA procedures will, to some extent, depend on the formal structureof the assessment. Therefore, it is important to describe the ECFMG prototypein detail and describe how it may differ from other SP- or performance-basedassessments.
STRUCTURE
The ECFMG CSA consists of 11 standardized patient encounters, 10 of which areused to generate candidate scores. The remaining station is used for calibration ofnew cases and is not scored. The candidates have up to 15 minutes to interviewand examine each SP. This time frame has been shown to be adequate (Cham-bers et al., 2000), and is typical of that commonly encountered for other clinicalskills assessments that employ SPs. Following the patient encounter, candidateswrite a patient note that summarizes the pertinent positive and negative historyand physical examination findings, provides a list of up to five possible differen-tial diagnoses, and outlines a diagnostic workup plan. The time allotted for thispost-encounter exercise is 10 minutes, but individual candidates who leave thepatient encounter before the end of the 15-minutes may begin composing the noteimmediately and hence have that additional time.
SCORING
The SPs document each candidate’s data gathering ability in each patientencounter. Like most SP-based assessments, this is done via case-specific check-lists. For CSA, the checklist items reflect the relevant history taking (Hx) questionsand physical examination (PE) maneuvers that a graduating medical student wouldbe expected to ask or perform. If the candidate asks the specific question (ora reasonable facsimile) or performs a relevant PE maneuver correctly, credit isawarded. There are generally 15–25 checklist items for each case (mean = 17.3,SD = 3.4). The candidate data gathering (DG) score for a case is simply the

QUALITY ASSURANCE METHODS FOR PERFORMANCE-BASED ASSESSMENTS 31
percentage of Hx and PE items credited. Checklist items are not weighted andcount equally in the derivation of a case score.
The SPs also evaluate each candidate’s doctor-patient communication skillsin each encounter. For some SP-based assessments this is done via checklistswhere specific candidate actions (e.g., introduces self, maintains eye contact) aredocumented and summed to form a score. For CSA, the assessment of doctor-patient communication (COM) is done with the aid of behaviorally anchored Likertscales. Candidates are rated on a 1(unsatisfactory) to 4(excellent) scale across 5dimensions: interviewing and collecting information, counseling and deliveringinformation, personal manner, rapport, and spoken English proficiency. Stand-ardized patients complete an extensive 8–10 hour training program before theyare considered ready to evaluate doctor-patient communication skills. The doctor-patient communication score for a case is simply the sum of the 5 ratings, and canrange on the raw score scale from 5 to 20. These ratings, averaged over 10 patientencounters, have been shown to be reliable and valid (Boulet et al., 1998a).
The patient note (PN) exercise is used to assess a candidate’s ability to commu-nicate in writing the history and physical examination data collected, and todemonstrate interpretation of that data in the form of a differential diagnosis anddiagnostic workup plan. Physician patient note raters (PNRs) score the writtensummaries holistically. A more thorough description of the PN exercise is providedelsewhere (Boulet et al., 1998b; Boulet et al., 2000).
Averaging the data gathering scores over the 10 encounters generates a totalscore. This score is adjusted to take into account the relative difficulty of the setof cases that was encountered. Likewise, a patient note total score is derived fromaveraging the 10 physician ratings. This score is also adjusted so that candidatesare neither advantaged nor disadvantaged by seeing different sets of cases. Thedata gathering and patient note scores are combined to form an integrated clinicalencounter (ICE) composite. A candidate must meet or surpass defined standardson the ICE composite to pass CSA. A final doctor-patient communication score isalso calculated as the average of the 10 encounter COM scores. A candidate mustalso meet or surpass defined standards on COM to pass CSA.
DATA
Data for examples used in this paper was taken from candidates who took CSAin the 2001 calendar year. Over 7000 graduates of international medical schools(IMGs) took CSA in this time frame. Data (checklists, doctor-patient communi-cation ratings) were available for over 74,000 encounters. Observer scores or QAratings were available for approximately 10% of this sample (n = 7162), dependingon the assessment component studied.

32 JOHN R. BOULET ET AL.
Sources of Error in SP Assessments
For SP-based assessments there are a number of sources of error that may impactcandidate scores. These sources can be broadly classified into (a) those attribut-able to examination content or task sampling, and (b) those attributable to scoringinconsistencies or errors. The magnitude and consequences of these errors will varywith the structure of the assessment, the scoring model chosen and nature of thetest population.
There are a number of quantitative methods that can be used to provide evidencethat scores from performance assessments such as SP examinations are reasonablyfree from measurement error. These methods can also be used to identify poten-tial problems that can be rectified through training, case modification or deletion,or revisions to test administration procedures. These QA routines, including theuse and interpretation of a number of relatively simple statistical indices, will beoutlined in the remainder of the paper. Specific examples from the ECFMG CSAwill also be provided. The reader should note that although specific examples fromCSA are provided for most techniques described, they could also be applied withsuitable modification to other performance-based assessments.
EXAMINATION CONTENT
Unlike multiple-choice examinations, performance assessments generally involvea very limited set of tasks or exercises. For CSA, the time required to interviewand assess each standardized patient severely restricts the number of candidateencounters that can be administered. This, combined with the fact that high-stakesdecisions are made based on test scores, demands that particular attention be paidto case sampling and case content. Typically, cases are used as a vehicle to measurespecific candidate skills (e.g., communication, physical examination). If the casesmeasure these skills inadequately, the skills are too specific to the content of thecase, or there are insufficient numbers of measures of any particular skill, candidatescores may not be reproducible or valid.
When properly implemented, the case development process should result inadequate content and skills coverage. Here, the knowledge and expertise of profes-sionals is used to define the content of the case and the associated questionsand maneuvers that a candidate needs to ask or perform to receive credit. If oneassumes that this process is adequate, then the choice and number of cases will bea major factor in the precision of candidate scores. Measurement errors can alsobe minimized by standardized training and examination administration, adherenceto examination design specification (e.g., number of encounters or measures of agiven skill, scoring rubrics), and by controlling for differences in examination diffi-culty through score equating. Once the examination is administered and scores areavailable, there are a number of statistical techniques that can be used to investigatethe adequacy of case development, including the appropriateness of case samplingand case content.

QUALITY ASSURANCE METHODS FOR PERFORMANCE-BASED ASSESSMENTS 33
Table I. Variance components for data gathering (DG) scores
Source Data gathering
VAR %
Person 22.2 9.9%
Case 52.7 23.4%
SP(Case) 24.6 10.9%
Residual 125.4 55.7%
Reliability 0.64
SEM 3.5
GENERALIZABILITY STUDIES
For SP-based assessments, measurement error may be introduced in a number ofways, including the choice of cases, the choice of SP to portray the case, andthe selection of specific cases to be used in the clinical examination. Generaliz-ability theory can and has been used to decompose the various sources of errorcommonly associated with SP or other performance-based examinations (Brennanand Johnson, 1995; Clauser et al., 1996; Swanson et al., 1999). For CSA, variancecomponents are estimated for various facets associated with the scored compo-nents. Based on the magnitude of these estimates and the reproducibility of thescores, sources of error that may require further investigation can be determinedand steps taken to minimize them.
The variance component estimates for the CSA data gathering (DG) scores arepresented in Table I. The large CASE variance component indicates that the casesare not of equal difficulty. This is to be expected given the differences in patientcomplaints and associated medical work-up requirements. The non-zero variancecomponent for SP(CASE) suggests that there will be differences in candidates’scores resulting from the choice of SP who portrays the case. The relatively largeRESIDUAL component, which includes all other sources of measurement error,suggests that candidate scores can fluctuate as a function of the interaction betweenthe particular cases they encounter and the SPs who portray the cases. These find-ings are typical of those found in the SP literature and indicate that, to achievereproducible history taking or physical examination scores, a reasonably largenumber of cases must be used (van der Vleuten et al., 1991). In addition, sincethe choice of SP portraying the case may have influence on the final score, case-SP pairs must be treated as the unit of analysis. This is especially important forestablishing the equivalency of candidate scores when both cases and SPs mayvary from one administration of the assessment to the next.
34 JOHN R. BOULET ET AL.
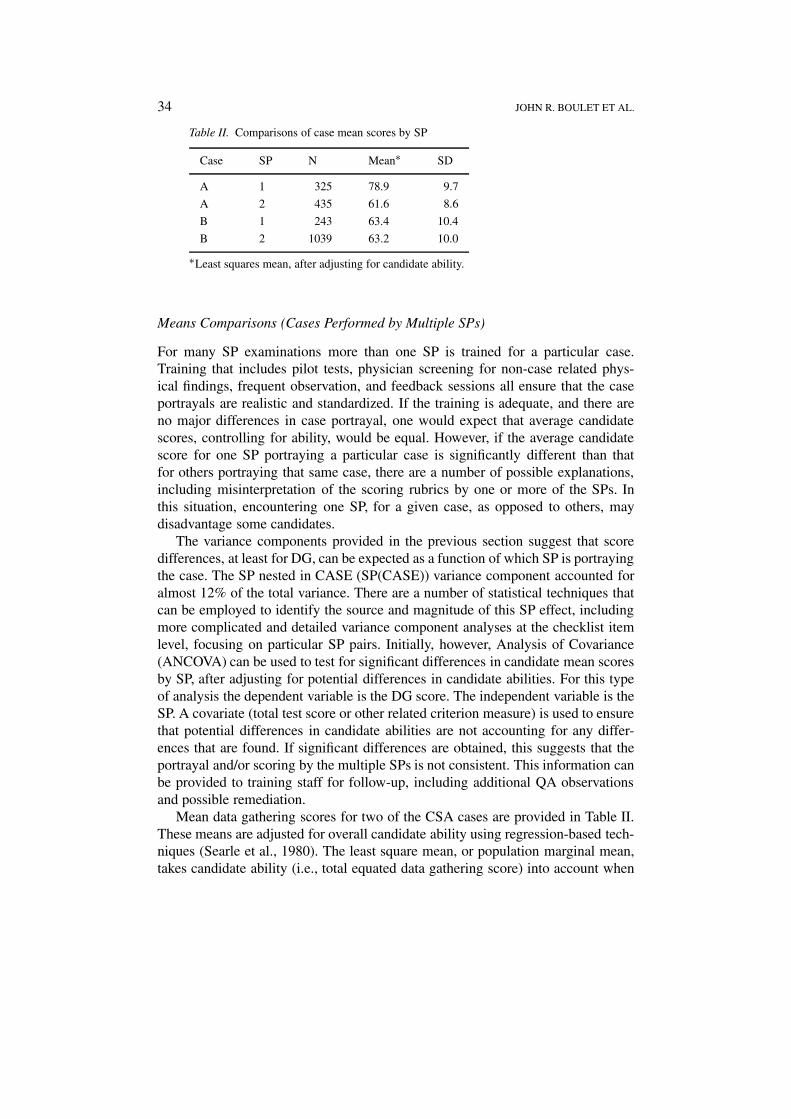
Table II. Comparisons of case mean scores by SP
Case SP N Mean∗ SD
A 1 325 78.9 9.7
A 2 435 61.6 8.6
B 1 243 63.4 10.4
B 2 1039 63.2 10.0
∗Least squares mean, after adjusting for candidate ability.
Means Comparisons (Cases Performed by Multiple SPs)
For many SP examinations more than one SP is trained for a particular case.Training that includes pilot tests, physician screening for non-case related phys-ical findings, frequent observation, and feedback sessions all ensure that the caseportrayals are realistic and standardized. If the training is adequate, and there areno major differences in case portrayal, one would expect that average candidatescores, controlling for ability, would be equal. However, if the average candidatescore for one SP portraying a particular case is significantly different than thatfor others portraying that same case, there are a number of possible explanations,including misinterpretation of the scoring rubrics by one or more of the SPs. Inthis situation, encountering one SP, for a given case, as opposed to others, maydisadvantage some candidates.
The variance components provided in the previous section suggest that scoredifferences, at least for DG, can be expected as a function of which SP is portrayingthe case. The SP nested in CASE (SP(CASE)) variance component accounted foralmost 12% of the total variance. There are a number of statistical techniques thatcan be employed to identify the source and magnitude of this SP effect, includingmore complicated and detailed variance component analyses at the checklist itemlevel, focusing on particular SP pairs. Initially, however, Analysis of Covariance(ANCOVA) can be used to test for significant differences in candidate mean scoresby SP, after adjusting for potential differences in candidate abilities. For this typeof analysis the dependent variable is the DG score. The independent variable is theSP. A covariate (total test score or other related criterion measure) is used to ensurethat potential differences in candidate abilities are not accounting for any differ-ences that are found. If significant differences are obtained, this suggests that theportrayal and/or scoring by the multiple SPs is not consistent. This information canbe provided to training staff for follow-up, including additional QA observationsand possible remediation.
Mean data gathering scores for two of the CSA cases are provided in Table II.These means are adjusted for overall candidate ability using regression-based tech-niques (Searle et al., 1980). The least square mean, or population marginal mean,takes candidate ability (i.e., total equated data gathering score) into account when

QUALITY ASSURANCE METHODS FOR PERFORMANCE-BASED ASSESSMENTS 35
estimating the case means for each SP. This is necessary in that one SP performingthe case may, on average, have seen candidates of slightly lower, or higher, ability,potentially confounding any true differences in case performance. For case A therewas a significant difference in candidate mean scores as a function of which SPwas portraying the case. Encounters for these two SPs were observed and it wasdetermined that one of the SPs was being too liberal in her interpretation of thescoring criteria. As a result, remedial training was prescribed. For case B, noappreciable differences in mean scores, or case portrayal, were noted. For assess-ments that involve multiple SPs per case, this simple comparison of adjusted meanscan easily be used to identify potential scoring and portrayal problems. Also, ifa single examination form (mix of cases) is used, and candidates are randomlyassigned to case-SP pairs, the comparison of raw, or unadjusted, means would alsobe appropriate.
Item or Case Analysis
The use of item or case analysis is also appropriate for SP-based examinations.At the checklist item level it is informative to know the proportion of individualswho receive credit for a given history taking question or physical examinationmaneuver. This information, commonly referred to as item difficulty, can be usedin conjunction with content considerations to modify the case or provide additionalSP training. For example, if all or nearly all candidates are not receiving credit fora particular physical examination checklist item, performing the maneuver maynot be appropriate for a graduating medical student, the SP-portrayal may notbe correct, or the interpretation of scoring criteria may be flawed. All of thesepossibilities can be investigated though direct observation or videotape review, andcorrections made where necessary.
Item discrimination indices (biserial or point biserial correlations) arecommonly calculated for multiple choice test items (Downing and Haladyna,1997). These correlations provide information regarding the ability of particularitems to discriminate between low and high ability students. Unfortunately, the useof discrimination indices for checklists (e.g., biserial or point-biserial correlationsbetween the checklist score and the case total score) may be misleading or inappro-priate. This is because checklist items tend to be conditionally dependent, meaningthat the previous question or questions asked can influence the choice of subsequentquestions. As such, an item may be poorly discriminating (i.e., candidates withlow case scores tend to get credit whereas candidates with high case scores do not)simply as a function of question sequencing and clustering that is normal in thehistory taking process. Likewise, depending on the proficiency of the candidates,some items on SP examinations may typically be achieved by all or nearly all exam-inees. These items will not discriminate between low and high ability candidates.It may, however, still be important to include these items as part of case scoring.This will ensure, from a validity perspective, that an adequate workup of the patienthas occurred. For most SP examinations it seems appropriate to treat the case, or
36 JOHN R. BOULET ET AL.
well-defined subset of items within a case, as the unit of analysis. One can thencalculate summary scores, within a case, and use these in subsequent psychometricanalyses.
Case (or task) analysis is an effective means of identifying poorly functioningperformance scenarios. For SP assessments the case is treated as an item and a totalscore is computed. For example, in maintaining standardized patient programs itis important to have an idea of the relative difficulty of the cases. The difficulty ofthe cases should be geared to the ability of the students being assessed. If the casesare too difficult, or too easy, for the target population then measurement precisionwill be sacrificed. Likewise, if the difficulty of the case changes appreciably overthe course of several assessment administrations, test materials may have beenexposed, potentially compromising the validity of candidate scores. Knowledgeof case difficulty is particularly useful when the set of cases differs with eachadministration. If the difficulty of the cases administered is not taken into accountthen differences between candidate scores may be attributable to complexity ofthe performance tasks required as opposed to ability. Adjusting scores for therelative difficulty of the cases administered (equating) allows for valid comparisonsof candidate scores. Reliably estimating the difficulty of each particular case is aprerequisite to making these adjustments.
The relationship of the item (case score) to the total component score (averagescore over all cases or average score over remaining cases) can also be established.For SP-based assessments where a fixed form is used this is a relatively simpletask. The Pearson correlation between the case score and the average of the othern-1 cases in the assessment will provide an indication of how well the case isfunctioning. A negative value for this analysis would indicate that low abilitystudents (based on the average score over cases) tended to get high scores on thecase whereas candidates with high ability tended to get low scores. Although thenegative, or close to 0, value may be a function of the multidimensionality of whatthe case is attempting to measure, such a finding is generally unacceptable and willnegatively impact the overall reliability of the assessment.
For the ECFMG CSA a different form (mix of cases) is used for each assess-ment session. Therefore, the use of case-total correlations can be problematic. Eachsession of 10 candidates will see a different mix of cases. As a result, the criterionmeasure (total score), although equated for differences in form difficulty, will bebased on different sets of cases with somewhat different measurement properties.However, for situations where the form is constantly changing, factor analytic tech-niques can be used to determine the strength of association between a particularcase score and an estimate of latent ability (Bollen, 1989; Kline, 1998). The latentability (e.g., data gathering) is a weighted function of the observed variables (casescores) and is estimated based on the cases that the candidate encountered. The useof factor analysis with structured means and missing data is limited to situationswhere there are sufficient numbers of scores for a given case. The analysis is basedon a matrix of m candidate by n case scores, where each candidate only encounters

QUALITY ASSURANCE METHODS FOR PERFORMANCE-BASED ASSESSMENTS 37
10 of the n cases. The remaining data is missing. To estimate “factor loadings”,which serve as an indicator of the strength of the relationship between the casescores and the ability of the candidates, approximately 50 to 100 case scores arerequired. For the ECFMG CSA, where thousands of candidates are tested yearly,sufficient case data is almost always available. This would likely not be the casefor a typical medical school SP program, unless a fixed form (identical set of casesfor all examinees) was used. In these situations, the previously outlined Pearsoncase-total correlations would suffice to identify cases that are not functioningproperly.
The case analysis techniques outlined above will yield information on how aparticular case is functioning within a set of cases that purportedly measure thesame construct. Specifically, do the scores derived from a particular case suffi-ciently discriminate between low and high ability candidates? A case may notdiscriminate because it is measuring something different from the other cases,because the content is confusing (e.g., some checklist items are not appropriate1),because the SP portrayal is poor (or systematically different between two SPsportraying the same case), or some combination of these factors. In these situations,especially where the discrimination index is negative, expert review of case contentand SP portrayal should provide knowledge as to why the case is functioningpoorly. This, in turn, can lead to informed decisions regarding case revisions orelimination of a case from the available pool.
Since the implemenation of CSA in 1998 discrimination indices have been usedto ensure that the available cases, and case-SP pairs, are adequate for distinguishingbetween low- and high-ability candidates. Overall, approximately 3% of the caseshave been retired based on poor measurement properties. In the current ECFMGmodel, performance data can be obtained in unscored (11th station) encountersand, where appropriate, cases can be modified or eliminated prior to their use forcredit. This data may indicate that the case is too easy (or difficult), or is inef-fective in discriminating between candidates of markedly different abilities. Thepsychometric screening of case, or case-SP, data will ensure that form construc-tion (i.e., selection of 10 cases from the available pool) will yield an assessmentwith adequate measurement properties. For programs where the availability of pre-assessement performance data is limited, post-hoc analyses may suggest changesto the scoring model (e.g., eliminating a case, or items within a case), modificationsto the curriculum (e.g., if students perform extremely poorly on a specified task) orprovide other useful information that can be used for future test development andevaluation.
SCORING ERRORS
Scoring and rating errors can also have an impact on candidate scores. The natureand magnitude of these errors is generally estimated by obtaining observer scoresand analyzing differences either at the case level, the SP level or some combi-

38 JOHN R. BOULET ET AL.
nation. In this section, various approaches to identifying potential scoring errorswill be outlined. While numerous analytical approaches are available, the use andinterpretation of relatively simple statistical indices will be highlighted.
Most SP examinations incorporate checklists in some form or another. Thesechecklists can be scored by the SP performing the case, by an observer, or both.The observer can be a second observer SP or other trained health professional.Typically, both the SP in the room and the observer document the history questionsasked and physical examination maneuvers performed. For some examinations,final scores are based on some form of reconciliation between the two scorers.Holistic scoring is also used in some assessments. The accuracy of these globalscores can also be ascertained through the use of second ratings.
Comparisons of Multiple Checklist Scores
As part of ongoing quality assurance a minimum of 5 percent of the CSA sessionsare observed and scored by SPs outside the examination rooms. Since QA observa-tions are done frequently, checklist discrepancies can be summarized for individualcases, SPs, and candidates.
Checklist discrepancies can be summarized in a number of ways. First, scoringdifferences, at the case level (or case by SP level), can be computed by calcu-lating the case score for both the portraying SP and the observer, calculating thedifference, and averaging this value over the candidates seen. The mean difference(MDiff), expressed as a percentage, is calculated as∑k
1
[∑n1 SPi/n − ∑n
1 Oi/n]
k× 100
where,
SP = standardized patient in the encounter
O = observer
n = number of checklist items
k = number of observed encounters.
The mean difference (MDiff) measure will provide some indication of theexpected score differences when one SP, as opposed to the other, is used forscoring. Generalizability theory, albeit somewhat more complex, could also beused to derive an estimate of the magnitude of mean differences between SPsand observers. Here, the variation in candidate scores can be partitioned intoencounters, rater type (SP, observer) and the associated interaction. The variancecomponent for rater type will provide similar information to MDiff. Caution must,however, be exercised when interpreting this coefficient. The mean score, at thecase level, does not account for individual item discrepancies by the 2 scorers. Forexample, on a 20-item checklist a candidate could hypothetically achieve identical

QUALITY ASSURANCE METHODS FOR PERFORMANCE-BASED ASSESSMENTS 39
Table III. Checklist discrepancies
Case Freq N items Sum of errors |Sum of errors| MDIFF (%) MACD (%)
A 104 13 1.2 3.0 9.0 23.2
B 157 16 0.5 1.6 2.9 9.9
.
.
Overall 7162 17.3 0.5 2.8 2.8 16.1
scores (say 50%) from the SP portraying the case and the observer yet, at theitem level, have total disagreement at the checklist level between the two scorers.Also, because scores are averaged over candidates, both scorers may provide forsimilar mean scores yet still have significant disagreements for individual candid-ates. Scoring differences compiled at the case level can, however, provide someevidence to suggest where systematic discrepancies are occurring. For example, ifthe SP portraying the case is consistently providing higher or lower mean scoresthan the observer, then it is likely that the two individuals are using somewhatdifferent criteria for providing credit on the checklist items.
The mean absolute difference between the observer and SP over all scoredchecklist items can also be used as a discrepancy measure. The values obtainedcan then be averaged over the number of encounters observed, and converted to apercentage. Hence, for each encounter (or SP, or SP-case combination) observed, ameasure of checklist disagreement at the item level is available. The mean absolutechecklist difference (MACD) is calculated as
∑k1
[∑n1 |SPi − Oi|/n
]k
× 100
where,
SP = standardized patient in the encounter
O = observer
n = number of checklist items
k = number of observed encounters.
The MACD can be used to identify cases, SPs or case-SP combinations wherescoring problems may exist. On the percent score metric the value represents thepercentage of checklist items, on average (by case, SP, or SP-case), where theobserver and SP disagree. The higher the value, the greater the disagreement oncandidate questions or actions. Checklist discrepancies for select CSA cases, andoverall, are presented in Table III.

40 JOHN R. BOULET ET AL.
The data for Table III was taken from QA sessions over the one-year testingperiod indicated previously. Summary statistics for two cases, and the overalltotal, are presented. For case A the MDiff statistic was 9.0. This indicates that,on average, the SP portraying the case provided scores that were 9% higher thanthe observer. The MCAD value was 23.2 indicating that, across the 13 scoreditems, the two scorers were in disagreement approximately 23% of the time (or anaverage of approximately 3 items on the 13-item checklist). This case was flaggedfor review and remediation of the performing SP was indicated. The second case(B) was not as problematic. There were, averaged over the 157 observations, only1.6 disagreements for the 16 item checklist. The overall total for the yearly periodis also presented. Here, there was an average of 2.8 discrepancies per average 17.3-item checklist resulting in a mean absolute checklist discrepancy of approximately16.1%. However, because discrepancies tend to be bi-directional, observer scoreswere only 2.8% lower than those for the SPs portraying the cases.
Comparison of Ratings (Communication Skills)
Global or holistic ratings are often used in SP examinations (Boulet et al., 1998a;Hodges et al., 1999). As part of CSA the SPs provide holistic ratings for inter-personal skills and spoken English proficiency. The case score for doctor-patientcommunication (COM) is derived along 5 dimensions (interviewing and collectinginformation, counseling and delivering information, personal manner, rapport,spoken English proficiency). The sum of these ratings, averaged over 10 clin-ical encounters, results in a total doctor-patient communication composite score.Although these evaluations are based on well-defined scoring rubrics, factors suchas SP fatigue, SP bias, halo effects, etc. may have some systematic impact oncandidate scores. Therefore, measures to identify potentially discrepant raters areessential.
There are a number of statistical techniques that can be used to identify SPswho may not be providing accurate or reliable IPS or spoken English proficiencyratings. For situations where there are observer scores the difference statistics orgeneralizability analyses described above for checklists can be applied. The meanof the unsigned differences (MuD), similar to the MDiff statistic described previ-ously, can also be calculated. Data can be summarized at the case, the SP, or thecase by SP level. This index is simply the average difference in ratings between theSP performing the case and the observer, averaged over the chosen level of interest.This statistic will provide some indication of the average stringency, or leniency, ofparticular raters (SPs). Similar to the analyses outlined for checklist scores, gener-alizability theory could also be used to estimate the magnitude of mean differencesin doctor-patient communication ratings between SPs and observers.
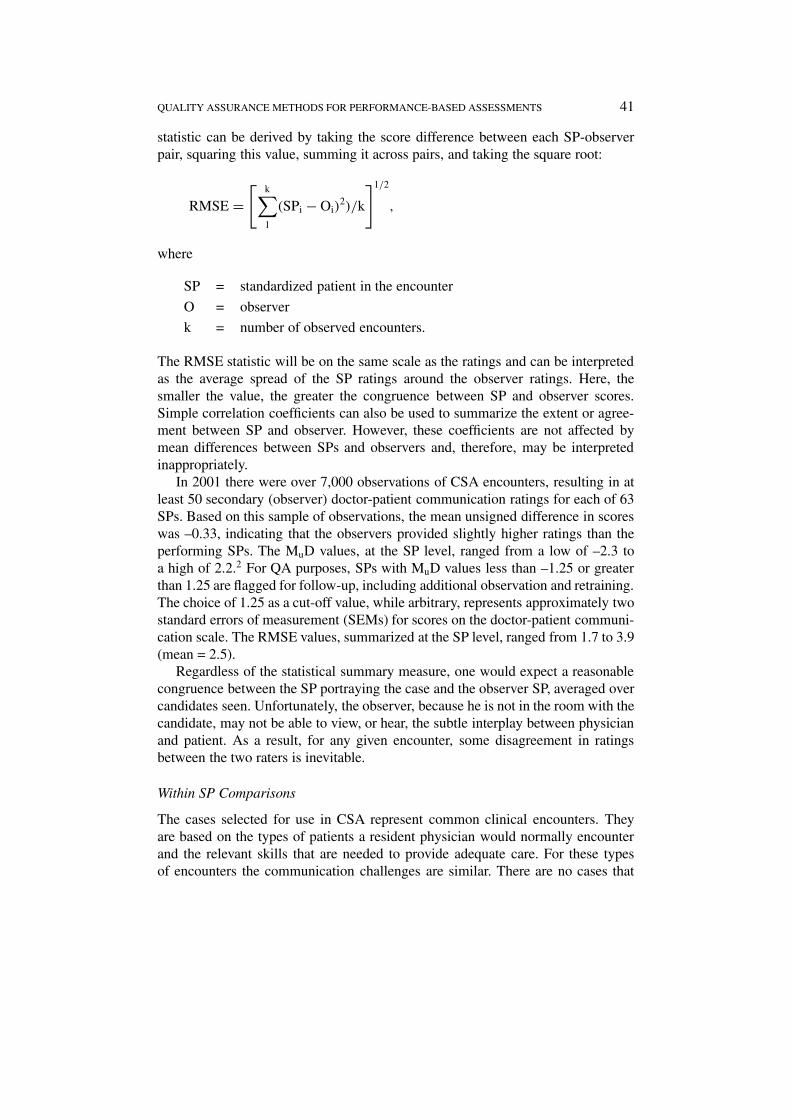
The average dispersion of SP ratings may also provide useful informationregarding improper use of the scoring rubric. A root mean square error (RMSE)
QUALITY ASSURANCE METHODS FOR PERFORMANCE-BASED ASSESSMENTS 41
statistic can be derived by taking the score difference between each SP-observerpair, squaring this value, summing it across pairs, and taking the square root:
RMSE =[
k∑1
(SPi − Oi)2)/k
]1/2
,
where
SP = standardized patient in the encounter
O = observer
k = number of observed encounters.
The RMSE statistic will be on the same scale as the ratings and can be interpretedas the average spread of the SP ratings around the observer ratings. Here, thesmaller the value, the greater the congruence between SP and observer scores.Simple correlation coefficients can also be used to summarize the extent or agree-ment between SP and observer. However, these coefficients are not affected bymean differences between SPs and observers and, therefore, may be interpretedinappropriately.
In 2001 there were over 7,000 observations of CSA encounters, resulting in atleast 50 secondary (observer) doctor-patient communication ratings for each of 63SPs. Based on this sample of observations, the mean unsigned difference in scoreswas –0.33, indicating that the observers provided slightly higher ratings than theperforming SPs. The MuD values, at the SP level, ranged from a low of –2.3 toa high of 2.2.2 For QA purposes, SPs with MuD values less than –1.25 or greaterthan 1.25 are flagged for follow-up, including additional observation and retraining.The choice of 1.25 as a cut-off value, while arbitrary, represents approximately twostandard errors of measurement (SEMs) for scores on the doctor-patient communi-cation scale. The RMSE values, summarized at the SP level, ranged from 1.7 to 3.9(mean = 2.5).
Regardless of the statistical summary measure, one would expect a reasonablecongruence between the SP portraying the case and the observer SP, averaged overcandidates seen. Unfortunately, the observer, because he is not in the room with thecandidate, may not be able to view, or hear, the subtle interplay between physicianand patient. As a result, for any given encounter, some disagreement in ratingsbetween the two raters is inevitable.
Within SP Comparisons
The cases selected for use in CSA represent common clinical encounters. Theyare based on the types of patients a resident physician would normally encounterand the relevant skills that are needed to provide adequate care. For these typesof encounters the communication challenges are similar. There are no cases that
42 JOHN R. BOULET ET AL.
specifically target advanced communication skills (e.g., breaking bad news, inter-viewing a psychotic patient). Therefore, it would not be expected that a candidate’scommunication ability would vary substantially from one patient encounter toanother. For SP assessments that have specific communication encounters (i.e.,cases that focus directly on communication skills) this may not be the case (Hodgeset al., 1995). Here, an examinee’s communication ability may fluctuate dramati-cally as a function of the case-specific communication skills that are required tointeract with the patient.
For situations where communication, or other, skills can be considered case-invariant, a comparison of one SP’s ratings to his peers (over the same set ofcandidates in a given session) will provide data to identify potential rating prob-lems. For CSA, communication scores for individual SPs are compared to theaverage score assigned by the remaining SPs for the same group of candidates.That is, one SP’s averaged ratings, over 10 candidates, is compared to the averageof the other nine active SPs used on the CSA form. If the discrepancy is large thenthere is some indication that the individual SP may be using the rating guidelinesinappropriately. For the CSA, average absolute discrepancies that are greater than1.25 are flagged. The fact that a given SP provided communication ratings thatwere, on average, greater or less than 2 SEMs from his peers, over the samecandidates, is considered problematic.
In the 1-year period for which data was collected only 6 (of 85) SPs (7.1%)provided ratings, based on the criteria outlined above, that were inconsistentwith their peers. These individuals were observed more frequently and receivedremedial training. Their ratings are monitored to ensure that the interventions resultin more consistent, accurate, ratings.
Variability of Ratings
As mentioned previously, the doctor-patient communication score is based onfive separate ratings, averaged over 10 patient encounters. Therefore, for a givenencounter, various dimension-level statistical analyses can be performed. Calcu-lation of the variability of the doctor-patient communication dimension scores(interviewing and collecting information, counseling and delivering information,personal manner, rapport, spoken English), as well as the summary interpersonalskills score, yields information on how the SPs are using the score scale. Forexample, if the variability of these five ratings is very low, the SP has a tendencyto assign the same score across all dimensions for a given candidate. This couldindicate some form of halo effect (e.g., if spoken English is adequate then inter-personal skills are assumed to also be adequate) or an inability or unwillingness todiscriminate amongst the measured dimensions.

QUALITY ASSURANCE METHODS FOR PERFORMANCE-BASED ASSESSMENTS 43
Table IV. Variance components for doctor-patientcommunication (COM)
Source Communication
VAR %
Person 2.22 32.2%
Case 0.24 3.4%
SP(CASE) 1.08 15.6%
Residual 3.38 48.8%
Reliability 0.87
SEM 0.58
∗COM scores can range from 5–20.
Means Comparison (Multiple SPs per Case)
The potential impact of scoring differences between two or more SPs portraying thesame case can also be investigated using generalizability theory. For the communi-cation element of the CSA there will be variance due to the candidate, the case,the SP performing the particular case (SP(CASE)), and a number of other sourcesthat are unaccounted for. When there are two or more SPs portraying a case, themagnitude of the SP(CASE) component provides an indication of how much, onaverage, a candidate’s score is likely to vary as a function of the choice of SP.
The variance component estimates for the CSA doctor-patient communica-tion composite are presented in Table IV. The relatively small CASE variancecomponent indicates that the mean difference in candidate communication scoresover cases is minimal. That is, mean scores for communication skills tend to besimilar across cases. The non-zero variance component for SP(CASE) suggests thatsome differences in candidate scores (for a given encounter) will result from thechoice of SP who portrays the case. The particular cases affected can be identifiedthrough comparative analyses outlined previously in this document.
Discussion
Standardized patient assessments are currently being used to make high-stakescertification and licensure decisions regarding clinical skills competency (ECFMG,1999; Reznick et al., 1996). As a result, it is extremely important to recognizethat ability measures derived from these types of performance assessments canbe imprecise, especially if care is not taken to identify and minimize potentialerror sources. A number of relevant QA procedures and statistical analyses werepresented in this document. It is clear that standardized patient assessments canbe modified and improved by systematically investigating, analyzing, and tracking

44 JOHN R. BOULET ET AL.
candidate scores. This will ensure that a candidate’s scores reflect his true ability,and subsequent competency decisions are reasonably free from error.
Perhaps the greatest measurement limitation of performance assessments is thetesting time required to obtain reliable and valid scores. For performance assess-ments, including SP examinations such as CSA, this effectively constrains thenumber of tasks that a candidate can do, resulting in a limited sampling of thecontent domain. It therefore becomes very important to develop tasks, or cases,with acceptable measurement properties. If subject matter experts can adequatelydefine individual case content and associated scoring mechanisms, then itemanalysis, case analysis and generalizability studies can all be used to ensure that themeasurement properties of the resulting scores are maximized. For SP assessments,item analysis, i.e., difficulty, can be used to identify specific history questions orphysical examination maneuvers that may not be appropriate for the case. Caseanalyses, i.e., difficulty and discrimination, can be used to determine whetherscores for a particular encounter can be used to infer clinical skills proficiency.If cases are too difficult or too easy for the target population, or result in scores thatdo not discriminate between low- and high-ability candidates, then they shouldbe modified or eliminated. Finally, generalizability studies can be performed toinvestigate the effects of task (case) and SP sampling. These analyses will guidethe length of the assessment, the choice of scoring models, and the necessity andchoice of equating methods used to maintain the comparability of scores acrossdifferent test forms.
Unlike traditional multiple choice or other selection-type examinations, scoreson performance assessments such as CSA are subject to a much wider array of errorsources. In effect, the standardized patients are the items. While the items can bestandardized to a certain degree, they are subject to factors such as fatigue (Rutalaet al., 1990; Wang et al., 1996), memory lapses, and personal biases (Cooper-Patrick et al., 1999; Tamblyn et al., 1991). Unfortunately, the influence of thesefactors on candidate scores is complex and multidimensional. For most SP-basedassessments these sources of error are effectively ignored. An assumption is oftenmade that if there are sufficient numbers of encounters, any effects will be averagedout. It is also often assumed that two individuals can be totally standardized in boththeir portrayal of a specific condition and their use of the scoring rubrics. However,subtle differences in portrayal, existing physical conditions, and personality differ-ences can all lead the examinee to choose to pursue one line of questioning asopposed to another. As a result, ECFMG decided to treat each case-SP pair asa unique case. For the purposes of establishing the dependability of scores, thiseffectively minimizes any variance attributable to the choice of SP performing thecase. Although the estimates of case difficulty and SP stringency may be somewhatimprecise due to limited sample sizes, this procedure provides for a more equitablescore equating process by recognizing that some cases are easier, or more difficult,depending on which SP is involved.
QUALITY ASSURANCE METHODS FOR PERFORMANCE-BASED ASSESSMENTS 45
The high-stakes nature of CSA demands that observed scores (i.e., what the SPdocuments) reflect, as much as is possible, “true” ability. Here, quality assuranceallows for the identification of capricious scoring or rating patterns. Unfortunately,there is often no “gold standard”, making it difficult to decide which of the multipleraters, or both, is providing inaccurate scores. For data gathering and doctor-patientcommunication, ECFMG is currently developing benchmark videotapes for allcases. These performance samples can be used in conjunction with regular obser-vations to identify individuals who are not using the scoring rubrics as defined.Overall, QA scoring can be used to identify where errors may be occurring. Morein depth observation of SPs will often be necessary to understand the causes ofthese discrepancies and, potentially, the nature of remediation required.
Our detailed analysis of QA data also provided valuable data concerning somepotential problems with QA observations. We found that observers, at least forchecklist documentation, provided scores that were approximately 3% lower thanthose provided by the SP portraying the case. Here, the observer provided scoresin “real time”, whereas the SP portraying the case did not document performanceuntil the encounter was completed. Furthermore, the portraying SPs are trained togive the examinee credit if they are unsure if a question was asked or a maneuverwas completed. Therefore, it was not surprising that the SPs portraying the caseprovided higher scores overall. Benchmark videotapes, mentioned previously, canbe used to address the problem of whether the SP portraying the case or theobserver is providing the more valid score. These recorded encounters can bescored by experts and used as part of the QA process. For future QA it may also beuseful to have the observer outside the room, or reviewing videotapes, only scoreonce the encounter is complete. This will help control for discrepancies attributableto memory lapses.
The QA procedures described here ensure the validity of the test scores. Theaccuracy of SP documentation, the absence of statistical bias in test scores, and thereproducibility of candidate decisions all help support the usefulness and appropri-ateness of test score interpretations. If any, or all, of these elements were lackingit would be difficult to attach any meaning to the test scores. ECFMG, as part ofongoing efforts to enhance the validity of CSA scores, and subsequent pass/faildecisions, will continue to monitor SP and case performance. If problems exist,enhanced SP training, combined with directed case modifications, can be used tomaintain and improve the psychometric adequacy of CSA scores and associatedassessment decisions.
Providing evidence that test scores are reasonably free from error is a funda-mental requirement for any assessment program. While the examples provided inthis paper were based on data from the ECFMG CSA, the techniques described,with suitable modification, could be applied to scores for many types of assess-ments. If properly implemented, these QA strategies will allow for the iden-tification of measurement problems, and guide subsequent modifications of theperformance tasks, training procedures and scoring rubrics. Overall, the devel-
46 JOHN R. BOULET ET AL.
opment and implementation of a well-structured QA process for performanceassessments will help ensure that any inferences based on test scores are valid andreproducible.
Notes1 For these situations it may be useful to calculate case discrimination statistics separately for eachSP who portrays the case.2 COM scores can range from 5 to 20.
References
Bollen, K.A. (1989). Structural Equations with Latent Variables. New York: John Wiley & Sons.Boulet, J.R., Friedman Ben-David, M. et al. (1998a). Using standardized patients to assess the
interpersonal skills of physicians. Academic Medicine 73: S94–S96.Boulet, J.R., Friedman Ben-David, M. et al. (1998b). An investigation of the sources of measurement
error in the post-encounter written scores from standardized patient examinations. Advances inHealth Sciences Education 3: 89–100.
Boulet, J.R., Friedman Ben-David, M. et al. (2000). The use of holistic scoring for post-encounterwritten exercises. In D. Melnick (ed.), Proceedings of the Eighth Ottawa Conference on MedicalEducation and Assessment, pp. 254–260. Philadelphia: National Board of Medical Examiners.
Brennan, R.L. & Johnson, E.G. (1995). Generalizability of performance assessments. EducationalMeasurement: Issues and Practice Winter: 9–12.
Carraccio, C. & Englander, R. (2000). The objective structured clinical examination: A step in thedirection of competency-based evaluation. Archives of Pediatric Adolescent Medicine 154: 736–741.
Chambers, K.A., Boulet, J.R. & Gary, N.E. (2000). The management of patient encounter time in ahigh-stakes assessment using standardized patients. Medical Education 34: 813–817.
Clauser, B.E., Swanson, D.B. & Clyman, S.G. (1996). The generalizability of scores from aperformance assessment of physicians’ patient management skills. Academic Medicine 71:S109–S111.
Cooper-Patrick, L., Gallo, J.J. et al. (1999). Race, gender, and partnership in the patient-physicianrelationship. Journal of the American Medical Association 282: 583–589.
Dauphinee, D. & Norcini, J.J. (1999). Assessing health care professionals in the new millenium.Advances in Health Sciences Education 4: 3–7.
De Champlain, A.F., Margolis, M.J. et al. (1997). Standardized patients’ accuracy in recordingexaminees’ behaviors using checklists. Academic Medicine 72: S85–S87.
Downing, S.M. & Haladyna, T.M. (1997). Test item development: Validity evidence from qualityassurance procedures. Applied Measurement in Education 10: 61–82.
ECFMG (1999). Clinical Skills Assessment (CSA) Candidate Orientation Manual. Philadelphia,Pennsylvania: Educational Commission for Foreign Medical Graduates (ECFMG).
Friedman Ben-David, M., Boulet, J.R. et al. (1997). Issues of validity and reliability concerning whoshould score the post-encounter patient-progress note. Academic Medicine 72: S79–S81.
Grand’Maison, P., Brailovsky, C.A. et al. (1997). Using standardized patients in licensing /certification examinations: Comparison of two tests in Canada. Family Medicine 29: 27–32.
Hodges, B., Turnbull, J. et al. (1995). Assessment of communication skills with complex cases usingOSCE format. In A.I. Rothman & R. Cohen (eds.), Proceedings of the Sixth Ottawa Conferenceon Medical Education, pp. 269–272. Toronto: University of Toronto Bookstore.
Hodges, B., Regehr, G. et al. (1999). OSCE checklists do not capture increasing levels of expertise.Academic Medicine 74: 1129–1134.

QUALITY ASSURANCE METHODS FOR PERFORMANCE-BASED ASSESSMENTS 47
Klass, D.J. (1994). “High-stakes” testing of medical students using standardized patients. Teachingand Learning in Medicine 6: 28–32.
Kline, R.B. (1998). Principles and Practice of Structural Equation Modeling. New York: TheGuilford Press.
Pangaro, L.N., Worth-Dickstein, H. et al. (1997). Performance of “standardized examinees” in astandardized-patient examination of clinical skills. Academic Medicine 72: 1008–1011.
Reznick, R., Blackmore, D. et al. (1996). Large-scale high-stakes testing with an OSCE: Report fromthe Medical College of Canada. Academic Medicine 71: S19–S21.
Rutala, P.J., Witzke, D.B. et al. (1990). Student fatigue as a variable affecting performance in anobjective structured clinical examination. Academic Medicine 65: S53–S54.
Searle, S.R., Speed, F.M. & Milliken, G.A. (1980). Population marginal means in the linear model:An alternative to least squares means. The American Statistician 34: 216–221.
Sinacore, J.M., Connell, K.J. et al. (2000). A method for measuring interrater agreement onchecklists. Evaluation & the Health Professions 22: 221–234.
Swanson, D.B., Clauser, B.E. & Case, S.M. (1999). Clinical skills assessment with standardizedpatients in high-stakes tests: A framework for thinking about score precision, equating, andsecurity. Advances in Health Sciences Education 4: 67–106.
Swanson, D.B., Norman, G.R. & Linn, R.L. (1995). Performance-based assessment: Lessons fromthe health professions. Educational Researcher 24: 5–11.
Tamblyn, R.M., Klass, D.J. et al. (1991). Sources of unreliability and bias in standardized-patientrating. Teaching and Learning in Medicine 3: 74–85.
van der Vleuten, C., Norman, G.R. & De Graaff, E. (1991). Pitfalls in the pursuit of objectivity:Issues of reliability. Medical Education 25: 110–118.
Vu, N.V. & Barrows, H.S. (1994). Use of standardized patients in clinical assessments: recentdevelopments and measurement findings. Educational Researcher 23: 23–30.
Wallace, P., Garman, K. et al. (1999). Effect of varying amounts of feedback on standardized patientchecklist accuracy in clinical practice examinations. Teaching and Learning in Medicine 11:148–152.
Wang, Y., Stillman, P.L. et al. (1996). The effect of fatigue on the accuracy of standardized patients’checklist recording. Teaching & Learning in Medicine 8: 148–151.
Whelan, G.P. (1999). Educational Commission for Foreign Medical Graduates: Clinical skillsassessment prototype. Medical Teacher 21: 156–160.