Quality Assessment of Stereoscopic 360-degree Images from ...
6
Quality Assessment of Stereoscopic 360-degree Images from Multi-viewports Jiahua Xu * , Ziyuan Luo * , Wei Zhou, Wenyuan Zhang and Zhibo Chen CAS Key Laboratory of Technology in Geo-Spatial Information Processing and Application System University of Science and Technology of China Hefei 230027, China [email protected] Abstract—Objective quality assessment of stereoscopic panoramic images becomes a challenging problem owing to the rapid growth of 360-degree contents. Different from traditional 2D image quality assessment (IQA), more complex aspects are involved in 3D omnidirectional IQA, especially unlimited field of view (FoV) and extra depth perception, which brings difficulty to evaluate the quality of experience (QoE) of 3D omnidirectional images. In this paper, we propose a multi- viewport based full-reference stereo 360 IQA model. Due to the freely changeable viewports when browsing in the head-mounted display, our proposed approach processes the image inside FoV rather than the projected one such as equirectangular projection (ERP). In addition, since overall QoE depends on both image quality and depth perception, we utilize the features estimated by the difference map between left and right views which can reflect disparity. The depth perception features along with binocular image qualities are employed to further predict the overall QoE of 3D 360 images. The experimental results on our public Stereoscopic OmnidirectionaL Image quality assessment Database (SOLID) show that the proposed method achieves a significant improvement over some well-known IQA metrics and can accurately reflect the overall QoE of perceived images. Index Terms—stereoscopic omnidirectional image, multi- viewport, image quality assessment, quality of experience I. I NTRODUCTION Immersive media data such as stereoscopic omnidirectional images and videos suffer from diverse quality degradations ranging from acquisition, compression, transmission to display [1], thus it is of great importance for automatically predicting the perceptual quality of 3D 360-degree contents to optimize the coding and processing technologies and maximize the user quality of experience (QoE) [2], [3]. Compared with conventional 2D image quality assessment (IQA), it is more challenging to evaluate the quality of stereoscopic panoramic images due to the unlimited field of view (FoV) and extra dimension of depth perception [4]. Although IQA has been researched in recent years [5]–[7], a few works have been done to predict the perceptual quality of stereo 360 images which remains an intractable research problem. Image quality assessment is mainly divided into two cate- gories: subjective IQA and objective IQA [8] and it is the same for stereoscopic omnidirectional image quality assessment (SOIQA) [9]. Though subjective SOIQA can generate the mean opinion scores (MOSs) of all the subjects as the most * Equal contribution. accurate quality evaluation [10], it is usually unpractical in real applications due to the time-consuming and labor-intensive attributes. Hence, the objective metrics designed for SOIQA are in great demand. Up to now, several algorithms have been proposed for stereoscopic image quality assessment (SIQA) and omnidi- rectional image quality assessment (OIQA). To deal with SIQA, traditional 2D IQA methods such as peak signal-to- noise ratio (PSNR), structural similarity (SSIM) [11], multi- scale structural similarity (MS-SSIM) [12] were performed on the left and right view images separately in the early stage [13]. Later, disparity map between two views was employed to make an improvement [14]. The models mentioned above show good performance on symmetrical distortion while their correlations with subjective scores are rather low for asym- metrical distortion. Then, binocular vision properties of the human visual system (HVS) were investigated and binocular fusion, rivalry, suppression models were widely used in 3D IQA [15]–[18]. In terms of OIQA, several PSNR based metrics includ- ing spherical PSNR (S-PSNR) [19], weighted-to-spherically- uniform PSNR (WS-PSNR) [20], craster parabolic projection PSNR (CPP-PSNR) [21] were proposed by considering the characteristics of 360-degree images. They are efficient and easy to be integrated into codecs but the prediction accuracy is far from satisfactory. Then, some perception-driven IQA metrics for 360 contents were designed via machine learning [22], [23] and deep learning [24], [25]. Chen et al. further incorporated SIQA and OIQA and developed a predictive coding based model for 3D 360 image quality assessment [26]. Compared with [26], our proposed model not only predicts the perceptual image quality, but also estimates the overall QoE which is not mentioned previously. Note that overall QoE is a measure of the overall level of customer satisfaction with the perceived image, it considers not only image quality but also other factors such as depth perception, visual comfort, etc. In this paper, motivated by the free FoV characteristic and binocular properties of stereoscopic omnidirectional images, we propose a novel multi-viewport based algorithm for SOIQA which considers the image quality inside FoV and the HVS mechanism. Moreover, the viewpoints are specially selected instead of uniform sampling. To predict the overall QoE of 3D 360-degree images, depth perception related features are arXiv:1908.10079v2 [eess.IV] 4 Sep 2019
-
Upload
khangminh22 -
Category
Documents
-
view
4 -
download
0
Transcript of Quality Assessment of Stereoscopic 360-degree Images from ...

Quality Assessment of Stereoscopic 360-degreeImages from Multi-viewports
Jiahua Xu*, Ziyuan Luo*, Wei Zhou, Wenyuan Zhang and Zhibo ChenCAS Key Laboratory of Technology in Geo-Spatial Information Processing and Application System
University of Science and Technology of ChinaHefei 230027, China
Abstract—Objective quality assessment of stereoscopicpanoramic images becomes a challenging problem owing to therapid growth of 360-degree contents. Different from traditional2D image quality assessment (IQA), more complex aspectsare involved in 3D omnidirectional IQA, especially unlimitedfield of view (FoV) and extra depth perception, which bringsdifficulty to evaluate the quality of experience (QoE) of 3Domnidirectional images. In this paper, we propose a multi-viewport based full-reference stereo 360 IQA model. Due to thefreely changeable viewports when browsing in the head-mounteddisplay, our proposed approach processes the image inside FoVrather than the projected one such as equirectangular projection(ERP). In addition, since overall QoE depends on both imagequality and depth perception, we utilize the features estimatedby the difference map between left and right views whichcan reflect disparity. The depth perception features along withbinocular image qualities are employed to further predict theoverall QoE of 3D 360 images. The experimental results on ourpublic Stereoscopic OmnidirectionaL Image quality assessmentDatabase (SOLID) show that the proposed method achieves asignificant improvement over some well-known IQA metrics andcan accurately reflect the overall QoE of perceived images.
Index Terms—stereoscopic omnidirectional image, multi-viewport, image quality assessment, quality of experience
I. INTRODUCTION
Immersive media data such as stereoscopic omnidirectionalimages and videos suffer from diverse quality degradationsranging from acquisition, compression, transmission to display[1], thus it is of great importance for automatically predictingthe perceptual quality of 3D 360-degree contents to optimizethe coding and processing technologies and maximize theuser quality of experience (QoE) [2], [3]. Compared withconventional 2D image quality assessment (IQA), it is morechallenging to evaluate the quality of stereoscopic panoramicimages due to the unlimited field of view (FoV) and extradimension of depth perception [4]. Although IQA has beenresearched in recent years [5]–[7], a few works have beendone to predict the perceptual quality of stereo 360 imageswhich remains an intractable research problem.
Image quality assessment is mainly divided into two cate-gories: subjective IQA and objective IQA [8] and it is the samefor stereoscopic omnidirectional image quality assessment(SOIQA) [9]. Though subjective SOIQA can generate themean opinion scores (MOSs) of all the subjects as the most
* Equal contribution.
accurate quality evaluation [10], it is usually unpractical in realapplications due to the time-consuming and labor-intensiveattributes. Hence, the objective metrics designed for SOIQAare in great demand.
Up to now, several algorithms have been proposed forstereoscopic image quality assessment (SIQA) and omnidi-rectional image quality assessment (OIQA). To deal withSIQA, traditional 2D IQA methods such as peak signal-to-noise ratio (PSNR), structural similarity (SSIM) [11], multi-scale structural similarity (MS-SSIM) [12] were performed onthe left and right view images separately in the early stage[13]. Later, disparity map between two views was employedto make an improvement [14]. The models mentioned aboveshow good performance on symmetrical distortion while theircorrelations with subjective scores are rather low for asym-metrical distortion. Then, binocular vision properties of thehuman visual system (HVS) were investigated and binocularfusion, rivalry, suppression models were widely used in 3DIQA [15]–[18].
In terms of OIQA, several PSNR based metrics includ-ing spherical PSNR (S-PSNR) [19], weighted-to-spherically-uniform PSNR (WS-PSNR) [20], craster parabolic projectionPSNR (CPP-PSNR) [21] were proposed by considering thecharacteristics of 360-degree images. They are efficient andeasy to be integrated into codecs but the prediction accuracyis far from satisfactory. Then, some perception-driven IQAmetrics for 360 contents were designed via machine learning[22], [23] and deep learning [24], [25]. Chen et al. furtherincorporated SIQA and OIQA and developed a predictivecoding based model for 3D 360 image quality assessment [26].Compared with [26], our proposed model not only predicts theperceptual image quality, but also estimates the overall QoEwhich is not mentioned previously. Note that overall QoE is ameasure of the overall level of customer satisfaction with theperceived image, it considers not only image quality but alsoother factors such as depth perception, visual comfort, etc.
In this paper, motivated by the free FoV characteristic andbinocular properties of stereoscopic omnidirectional images,we propose a novel multi-viewport based algorithm for SOIQAwhich considers the image quality inside FoV and the HVSmechanism. Moreover, the viewpoints are specially selectedinstead of uniform sampling. To predict the overall QoE of3D 360-degree images, depth perception related features are
arX
iv:1
908.
1007
9v2
[ee
ss.I
V]
4 S
ep 2
019
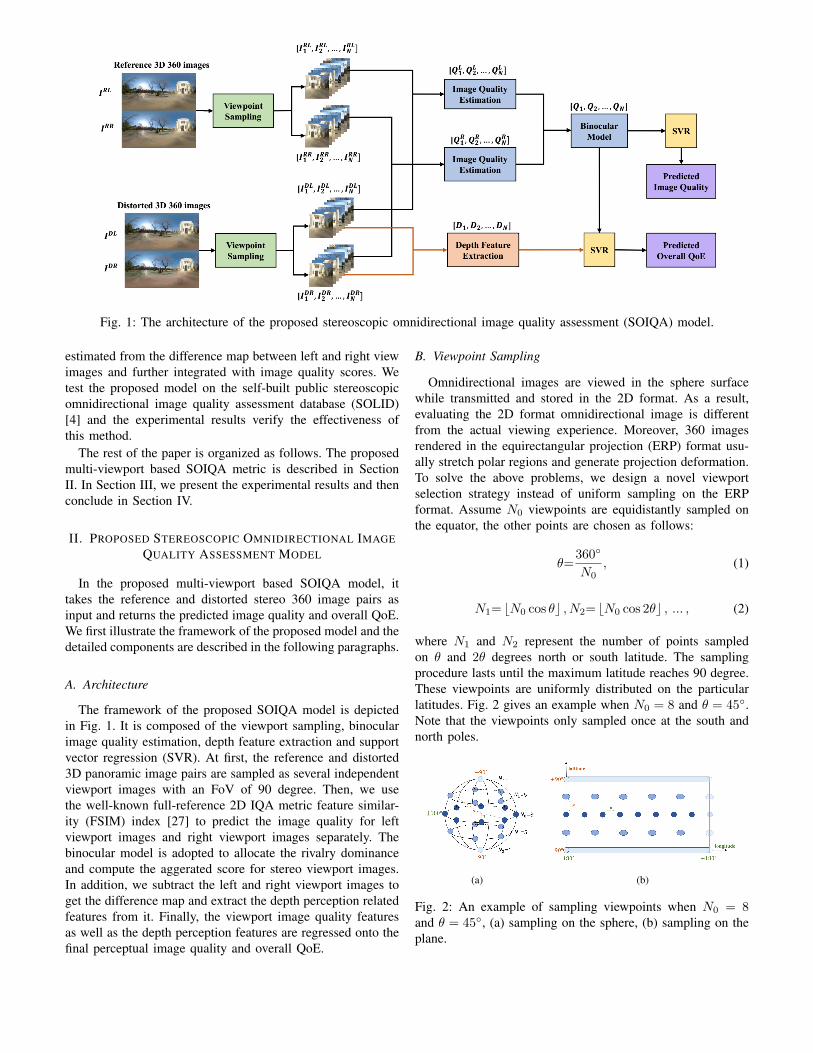
Fig. 1: The architecture of the proposed stereoscopic omnidirectional image quality assessment (SOIQA) model.
estimated from the difference map between left and right viewimages and further integrated with image quality scores. Wetest the proposed model on the self-built public stereoscopicomnidirectional image quality assessment database (SOLID)[4] and the experimental results verify the effectiveness ofthis method.
The rest of the paper is organized as follows. The proposedmulti-viewport based SOIQA metric is described in SectionII. In Section III, we present the experimental results and thenconclude in Section IV.
II. PROPOSED STEREOSCOPIC OMNIDIRECTIONAL IMAGEQUALITY ASSESSMENT MODEL
In the proposed multi-viewport based SOIQA model, ittakes the reference and distorted stereo 360 image pairs asinput and returns the predicted image quality and overall QoE.We first illustrate the framework of the proposed model and thedetailed components are described in the following paragraphs.
A. Architecture
The framework of the proposed SOIQA model is depictedin Fig. 1. It is composed of the viewport sampling, binocularimage quality estimation, depth feature extraction and supportvector regression (SVR). At first, the reference and distorted3D panoramic image pairs are sampled as several independentviewport images with an FoV of 90 degree. Then, we usethe well-known full-reference 2D IQA metric feature similar-ity (FSIM) index [27] to predict the image quality for leftviewport images and right viewport images separately. Thebinocular model is adopted to allocate the rivalry dominanceand compute the aggerated score for stereo viewport images.In addition, we subtract the left and right viewport images toget the difference map and extract the depth perception relatedfeatures from it. Finally, the viewport image quality featuresas well as the depth perception features are regressed onto thefinal perceptual image quality and overall QoE.
B. Viewpoint Sampling
Omnidirectional images are viewed in the sphere surfacewhile transmitted and stored in the 2D format. As a result,evaluating the 2D format omnidirectional image is differentfrom the actual viewing experience. Moreover, 360 imagesrendered in the equirectangular projection (ERP) format usu-ally stretch polar regions and generate projection deformation.To solve the above problems, we design a novel viewportselection strategy instead of uniform sampling on the ERPformat. Assume N0 viewpoints are equidistantly sampled onthe equator, the other points are chosen as follows:
θ=360◦
N0, (1)
N1= bN0 cos θc , N2= bN0 cos 2θc , ... , (2)
where N1 and N2 represent the number of points sampledon θ and 2θ degrees north or south latitude. The samplingprocedure lasts until the maximum latitude reaches 90 degree.These viewpoints are uniformly distributed on the particularlatitudes. Fig. 2 gives an example when N0 = 8 and θ = 45◦.Note that the viewpoints only sampled once at the south andnorth poles.
(a) (b)
Fig. 2: An example of sampling viewpoints when N0 = 8and θ = 45◦, (a) sampling on the sphere, (b) sampling on theplane.

C. Image Quality Estimation
In this module, we process the 3D viewport images astraditional stereoscopic images covering the 90◦ FoV rangeand compute the perceptual viewport image quality accordingto the binocular rivalry model [28]. For stereo image pairs,the left and right view images tend to share different weightswhich are related to binocular energies. Therefore, we adoptthe local variances to compute the energy maps of both viewsas done in [29]. Then, the local energy ratio maps RL
n andRR
n of the n-th left and right viewport images can be denotedas:
RLn =
EDLn
ERLn
and RRn =
EDRn
ERRn
, (3)
where EDLn , ERL
n , EDRn and ERR
n indicate the energy mapsof distorted and reference images for the n-th viewports.Since the HVS prefer high-energy regions which involvemore information and are easier to attract visual attention, weemploy the energy weighted pooling method [28] to stresssignificance on high-energy image regions in binocular rivalryas follows:
gLn =
∑i,j E
DLn (i, j)RL
n(i, j)∑i,j E
DLn (i, j)
, (4)
gRn =
∑i,j E
DRn (i, j)RR
n (i, j)∑i,j E
DRn (i, j)
, (5)
where gLn and gRn are calculated by summation on the fullenergy and ratio maps. Hence, they denote the level of domi-nance for the n-th left and right viewport images. After that,we compute the weights for left and right views as follows:
wLn =
gLn2
gLn2+ gRn
2 and wRn =
gRn2
gLn2+ gRn
2 . (6)
Finally, the binocular image quality (feature similarity) Qn
for the n-th viewport image is calculated by a weightedaverage of both views:
Qn = wLnQ
Ln + wR
nQRn , (7)
QLn = FSIM(IRL
n , IDLn ) and QR
n = FSIM(IRRn , IDR
n ),(8)
where image quality QLn and QR
n for left and right view imagesare obtained through FSIM [27] which can accurately predictthe quality of 2D images. IRL
n , IDLn , IRR
n and IDRn represent
the n-th reference and distorted viewport images.
D. Depth Feature Extraction
As analyzed in [26], depth perception is dominated bydisparity, so we subtract the left and right viewport imagesto show the discrepancy between them. To some extent, thedifference map also reflects the disparity which is illustratedin Fig. 3. As we can observe from Fig. 3, the difference mapof zero disparity is a totally black image. When the disparityis larger, more information is contained in the difference map.Thus, we compute the entropy of the difference map for the
n-th viewport as a depth perception related feature Dn asfollows:
S−n =
∣∣IDLn − IDR
n
∣∣ (9)
Dn = −∑i
pi log pi (10)
where IDLn and IDR
n represent the grayscale distorted stereopairs for the n-th viewport since humans are more sensitiveto luminance. pi denotes the probability of i-th gray levelappearing in the difference map S−
n . Note that depth featureextraction is only performed in the distorted images becausedistortion has little effect on the depth perception and thedistorted images are actually observed by the subjects [4].
(a) (b) (c)
Fig. 3: The difference map for viewport images with (a) zerodisparity, (b) medium disparity, (c) large disparity.
E. Quality Regression
After computing binocular feature similarities and extractingdepth features from N viewport images, SVR is adoptedto map them onto the final perceptual image quality andoverall QoE. Note that the LibSVM package is utilized in ourexperiment to implement the SVR with a radial basis functionkernel.
III. EXPERIMENTAL RESULTS AND ANALYSIS
In this section, we test the proposed model on the self-builtpublic database SOLID [4]. The experimental results demon-strate the effectiveness of our algorithm and it outperformsseveral classic IQA metrics. In our experiment settings, N0
equals 8 which means 20 viewpoints are selected as shown inFig. 2. Moreover, each viewport image covers a 90◦ FoV toavoid heavy projection deformation.
A. Database and Performance Measure
To our best knowledge, the SOLID database is the only pub-licly available database built for stereoscopic omnidirectionalimage quality assessment which consists of 84 symmetricallyand 192 asymmetrically distorted images. They originate from6 reference images with two distortion types (JPEG and BPGcompression) and three depth levels (zero, medium and largedisparity). The detail configrations can be found in the web-page 1. The reference images in the SOLID database are shownin Fig. 4. Each pristine and degraded image are equipped withthe MOS values of image quality, depth perception and overallQoE in the range of 1 to 5, where higher subjective scoremeans better quality.
1http://staff.ustc.edu.cn/∼chenzhibo/resources.html

(a) (b) (c) (d) (e) (f)
Fig. 4: Reference images in SOLID database.
Three commonly used criteria are utilized for performanceevaluation in our experiment, namely Spearman’s rank ordercorrelation coefficient (SROCC), Pearson’s linear correlationcoefficient (PLCC) and root mean squared error (RMSE).SROCC measures prediction monotonicity while PLCC andRMSE measure the prediction accuracy. Higher SROCC,PLCC and lower RMSE indicate good correlation with sub-jective judgments. Before computing PLCC and RMSE, afive-parameter logistic function is applied to maximize thecorrelations between objective metrics and subjective scores[5].
B. Performance Comparison
There are six reference images in the SOLID database, werandomly split the database into 67% training and 33% testingset according to the reference content as done in [24]. Thecross validation is performed 1000 times and we calculate themedian SROCC, PLCC and RMSE as performance measure-ment.
TABLE I: PERFORMANCE EVALUATION ON THE SOLIDDATABASE [4].
Image Quality Overall QoE
Type Metric PLCC SROCC RMSE PLCC SROCC RMSE
2D IQA
PSNR 0.629 0.603 0.789 0.546 0.506 0.696SSIM [11] 0.882 0.888 0.478 0.738 0.748 0.561
MS-SSIM [12] 0.773 0.755 0.643 0.645 0.620 0.635FSIM [27] 0.889 0.883 0.465 0.747 0.748 0.552
2D OIQAS-PSNR [19] 0.593 0.567 0.816 0.507 0.475 0.716
WS-PSNR [20] 0.585 0.559 0.823 0.499 0.470 0.720CPP-PSNR [21] 0.593 0.566 0.817 0.506 0.475 0.716
3D IQAChen [30] 0.853 0.827 0.530 0.661 0.636 0.623
W-SSIM [28] 0.893 0.891 0.457 0.743 0.748 0.556W-FSIM [28] 0.889 0.885 0.464 0.746 0.750 0.553
3D OIQA SOIQE [26] 0.927 0.924 0.383 0.803 0.805 0.495Proposed 0.939 0.928 0.351 0.935 0.925 0.294
We compare the proposed model with several parametric2D/3D/360 IQA metrics and the PLCC, SROCC and RMSEperformance values are listed in Table I. For 2D metrics suchas PSNR, SSIM [11], MS-SSIM [12], FSIM [27], S-PSNR[19], WS-PSNR [20], CPP-PSNR [21], the qualities of left andright view images are averaged to obtain the final perceptualscore. The simple averaging operation cannot consider thebinocular properties of the HVS, thus their correlations withhuman judgements are not very high. When taking binocularmodel into consideration, some open source 3D metrics Chen[30], W-SSIM [28], W-FSIM [28] are tested on the SOLIDdatabase, but they also fail to predict the perceptual score of3D 360 image because the characteristics of omnidirectionalimages such as FoV and projection deformation are neglected.We further compare our proposed model with stereoscopic
omnidirectional image quality evaluator (SOIQE) [26] whichis designed for SOIQA. The proposed model shows superiorprediction ability to SOIQE. The possible explanation is thatour proposed metric adopt a different binocular model andutilize the powerful nonlinearity of SVR to map the qualities ofdifferent viewports into a scalar value. Moreover, our proposedmethod for QoE prediction outperforms the state-of-the-artmetrics by a large margin owing to the depth perception relatedfeature extraction. The scatter plots of MOS values versus thepredicted scores of the proposed model are drawn in Fig. 5 forimage quality and overall QoE to give clear and direct results.
1 2 3 4 5
Proposed Model
1
2
3
4
5
Imag
e Q
uality
MO
S
SOLID Database
JPEG
BPG
(a)
1 2 3 4 5
Proposed Model
1
2
3
4
5
Overa
ll Q
oE
MO
S
SOLID Database
JPEG
BPG
(b)
Fig. 5: Scatter plots of MOS against predictions by proposedmodel on the SOLID database. (a) Image quality, (b) OverallQoE.C. Performance Evaluation for Symmetrical/AsymmetricalDistortion
Symmetrically and asymmetrically distorted images bothexist in the SOLID database. The performance on asym-metrical distortion are generally lower than those of sym-metrical distortion as shown in Table II, since the binocularfusion, rivalry and suppression may happen in asymmetricallydistorted images [1]. The proposed method performs beston both symmetrically and asymmetrically distorted imageswhich demonstrates the effectiveness of the binocular modelin our algorithm.
TABLE II: PERFORMANCE EVALUATION FOR SYMMETRI-CALLY AND ASYMMETRICALLY DISTORTED IMAGES ONTHE SOLID DATABASE [4].
Symmetrical Distortion Asymmetrical Distortion
Metric Image Quality Overall QoE Image Quality Overall QoE
PLCC SROCC PLCC SROCC PLCC SROCC PLCC SROCC
PSNR 0.791 0.789 0.705 0.707 0.394 0.354 0.312 0.257SSIM [11] 0.944 0.902 0.840 0.813 0.821 0.814 0.642 0.630
MS-SSIM [12] 0.869 0.836 0.761 0.736 0.631 0.615 0.477 0.460FSIM [27] 0.930 0.890 0.833 0.805 0.853 0.847 0.662 0.659
S-PSNR [19] 0.805 0.766 0.681 0.682 0.364 0.313 0.361 0.222WS-PSNR [20] 0.807 0.762 0.699 0.681 0.325 0.302 0.354 0.213CPP-PSNR [21] 0.806 0.766 0.681 0.682 0.334 0.310 0.364 0.220
Chen [30] 0.944 0.890 0.814 0.743 0.767 0.700 0.522 0.434W-SSIM [28] 0.944 0.902 0.840 0.813 0.834 0.832 0.643 0.638W-FSIM [28] 0.930 0.890 0.833 0.805 0.845 0.842 0.652 0.658
SOIQE [26] 0.970 0.931 0.863 0.828 0.867 0.866 0.718 0.717Proposed 0.977 0.914 0.962 0.953 0.920 0.879 0.916 0.902
D. Ablation Study
To verify the effectiveness of each part in our model, weconduct the ablation study as demonstrated in Table III. Fromthis table, we can see that viewport sampling brings huge

improvement to the performance. Moreover, weighted aver-aging according to the binocular model outperforms simplyconcatenating or averaging the quality scores for both views.In addition, we have tried several methods for computingdepth perception features, namely mean, standard deviationand entropy of difference maps. Adopting entropy of theviewport difference map shows the best result for overall QoEprediction.
TABLE III: PERFORMANCE EVALUATION OF ABLATIONSTUDY.
Image Quality Overall QoE
Methods PLCC SROCC RMSE Methods PLCC SROCC RMSE
w/o VS 0.889 0.885 0.464 VS+WQA 0.803 0.796 0.490VS+QC 0.929 0.917 0.365 VS+WQA+DM 0.920 0.914 0.315VS+QA 0.921 0.910 0.382 VS+WQA+DS 0.905 0.897 0.341
VS+WQA 0.939 0.928 0.351 VS+WQA+DH 0.935 0.925 0.2941 VS denotes viewport sampling.2 w/o VS denotes the 360-degree stereo image in ERP format.3 QC, QA and WQA denote viewport quality concatenation, averaging
and weighted quality averaging.4 DM, DS and DH denote the mean, standard deviation and entropy
of the viewport difference map.
IV. CONCLUSION
We propose a novel multi-viewport based stereoscopic om-nidirectional image quality assessment metric by consideringthe FoV and binocular characteristics of 3D 360 images.It consists of the viewport sampling, binocular quality es-timation, depth feature extraction and SVR regression. Theexperimental results on the public SOLID database provethe effectiveness of our method and it also outperformsseveral state-of-the-art 2D/3D/360 IQA metrics. In addition,it is shown that the proposed model is able to handle bothsymmetrical and asymmetrical distortion since we take thebinocular properties of the HVS into consideration. Finally,ablation study is conducted to verify the validity of eachcomponent in our architecture.
ACKNOWLEDGMENT
This work was supported in part by NSFC under Grant61571413, 61632001.
REFERENCES
[1] Z. Chen, W. Zhou, and W. Li, “Blind stereoscopic video quality assess-ment: From depth perception to overall experience,” IEEE Transactionson Image Processing, vol. 27, no. 2, pp. 721–734, 2018.
[2] T. Ebrahimi, “Quality of multimedia experience: past, present andfuture,” in MM’09: Proceedings of the seventeen ACM internationalconference on Multimedia. ACM, 2009, pp. 3–4.
[3] A.-F. N. M. Perrin, H. Xu, E. Kroupi, M. Rerabek, and T. Ebrahimi,“Multimodal dataset for assessment of quality of experience in im-mersive multimedia,” in Proceedings of the 23rd ACM internationalconference on Multimedia. ACM, 2015, pp. 1007–1010.
[4] J. Xu, C. Lin, W. Zhou, and Z. Chen, “Subjective quality assessmentof stereoscopic omnidirectional image,” in Pacific Rim Conference onMultimedia. Springer, 2018, pp. 589–599.
[5] H. R. Sheikh, M. F. Sabir, and A. C. Bovik, “A statistical evaluationof recent full reference image quality assessment algorithms,” IEEETransactions on image processing, vol. 15, no. 11, pp. 3440–3451, 2006.
[6] G. Zhai, A. Kaup, J. Wang, and X. Yang, “A dual-model approachto blind quality assessment of noisy images,” APSIPA Transactions onSignal and Information Processing, vol. 4, 2015.
[7] I. F. Nizami, M. Majid, W. Manzoor, K. Khurshid, and B. Jeon,“Distortion-specific feature selection algorithm for universal blind imagequality assessment,” EURASIP Journal on Image and Video Processing,vol. 2019, no. 1, p. 19, 2019.
[8] K. Seshadrinathan, R. Soundararajan, A. C. Bovik, and L. K. Cormack,“Study of subjective and objective quality assessment of video,” IEEEtransactions on Image Processing, vol. 19, no. 6, pp. 1427–1441, 2010.
[9] B. Zhang, J. Zhao, S. Yang, Y. Zhang, J. Wang, and Z. Fei, “Subjectiveand objective quality assessment of panoramic videos in virtual realityenvironments,” in 2017 IEEE International Conference on Multimedia& Expo Workshops (ICMEW). IEEE, 2017, pp. 163–168.
[10] K. Yamagishi, T. Kawano, T. Hayashi, and J. Katto, “Subjective qualitymetric for 3d video services,” IEICE transactions on communications,vol. 96, no. 2, pp. 410–418, 2013.
[11] Z. Wang, A. C. Bovik, H. R. Sheikh, E. P. Simoncelli et al., “Imagequality assessment: from error visibility to structural similarity,” IEEEtransactions on image processing, vol. 13, no. 4, pp. 600–612, 2004.
[12] Z. Wang, E. P. Simoncelli, and A. C. Bovik, “Multiscale structuralsimilarity for image quality assessment,” in The Thirty-Seventh AsilomarConference on Signals, Systems & Computers, 2003, vol. 2. Ieee, 2003,pp. 1398–1402.
[13] S. Yasakethu, C. T. Hewage, W. A. C. Fernando, and A. M. Kondoz,“Quality analysis for 3D video using 2D video quality models,” IEEETransactions on Consumer Electronics, vol. 54, no. 4, pp. 1969–1976,2008.
[14] A. Benoit, P. Le Callet, P. Campisi, and R. Cousseau, “Quality assess-ment of stereoscopic images,” EURASIP journal on image and videoprocessing, vol. 2008, no. 1, p. 659024, 2009.
[15] W. Zhou and L. Yu, “Binocular responses for no-reference 3d imagequality assessment,” IEEE Transactions on Multimedia, vol. 18, no. 6,pp. 1077–1084, 2016.
[16] G. Saygılı, C. G. Gurler, and A. M. Tekalp, “Quality assessment ofasymmetric stereo video coding,” in 2010 IEEE International Confer-ence on Image Processing. IEEE, 2010, pp. 4009–4012.
[17] F. Shao, W. Lin, S. Gu, G. Jiang, and T. Srikanthan, “Perceptual full-reference quality assessment of stereoscopic images by consideringbinocular visual characteristics,” IEEE Transactions on Image Process-ing, vol. 22, no. 5, pp. 1940–1953, 2013.
[18] Y.-H. Lin and J.-L. Wu, “Quality assessment of stereoscopic 3d imagecompression by binocular integration behaviors,” IEEE transactions onImage Processing, vol. 23, no. 4, pp. 1527–1542, 2014.
[19] M. Yu, H. Lakshman, and B. Girod, “A framework to evaluate omnidi-rectional video coding schemes,” in 2015 IEEE International Symposiumon Mixed and Augmented Reality. IEEE, 2015, pp. 31–36.
[20] Y. Sun, A. Lu, and L. Yu, “Weighted-to-spherically-uniform qualityevaluation for omnidirectional video,” IEEE signal processing letters,vol. 24, no. 9, pp. 1408–1412, 2017.
[21] V. Zakharchenko, K. P. Choi, and J. H. Park, “Quality metric forspherical panoramic video,” in Optics and Photonics for InformationProcessing X, vol. 9970. International Society for Optics and Photonics,2016, p. 99700C.
[22] M. Xu, C. Li, Z. Chen, Z. Wang, and Z. Guan, “Assessing visual qualityof omnidirectional videos,” IEEE Transactions on Circuits and Systemsfor Video Technology, 2018.
[23] S. Yang, J. Zhao, T. Jiang, J. W. T. Rahim, B. Zhang, Z. Xu, andZ. Fei, “An objective assessment method based on multi-level factorsfor panoramic videos,” in 2017 IEEE Visual Communications and ImageProcessing (VCIP). IEEE, 2017, pp. 1–4.
[24] H. G. Kim, H.-t. Lim, and Y. M. Ro, “Deep virtual reality image qualityassessment with human perception guider for omnidirectional image,”IEEE Transactions on Circuits and Systems for Video Technology, 2019.
[25] J. Yang, T. Liu, B. Jiang, H. Song, and W. Lu, “3D panoramic virtualreality video quality assessment based on 3D convolutional neuralnetworks,” IEEE Access, vol. 6, pp. 38 669–38 682, 2018.
[26] Z. Chen, J. Xu, C. Lin, and W. Zhou, “Stereoscopic omnidirectionalimage quality assessment based on predictive coding theory,” arXivpreprint arXiv:1906.05165, 2019.
[27] L. Zhang, L. Zhang, X. Mou, and D. Zhang, “FSIM: A feature similarityindex for image quality assessment,” IEEE transactions on ImageProcessing, vol. 20, no. 8, pp. 2378–2386, 2011.
[28] J. Wang, A. Rehman, K. Zeng, S. Wang, and Z. Wang, “Qualityprediction of asymmetrically distorted stereoscopic 3D images,” IEEETransactions on Image Processing, vol. 24, no. 11, pp. 3400–3414, 2015.

[29] Z. Wang and X. Shang, “Spatial pooling strategies for perceptualimage quality assessment,” in 2006 International Conference on ImageProcessing. IEEE, 2006, pp. 2945–2948.
[30] M.-J. Chen, C.-C. Su, D.-K. Kwon, L. K. Cormack, and A. C. Bovik,“Full-reference quality assessment of stereopairs accounting for rivalry,”Signal Processing: Image Communication, vol. 28, no. 9, pp. 1143–1155, 2013.