Quality assessment of marketed food supplements and herbal ...
11
Journal of Research in Pharmacy Research Article www.jrespharm.com How to cite this article: Güzelmeriç E, Çevik D, Yeşilada E. Quality assessment of marketed food supplements and herbal tea products of olive leaf in Turkey. 2020; 24(1): 159-169. © 2020 Marmara University Press ISSN: 2630-6344 https://doi.org/10.35333/jrp.2020.123 159 Quality assessment of marketed food supplements and herbal tea products of olive leaf in Turkey Etil GÜZELMERİÇ 1 * , Dicle ÇEVİK 1 , Erdem YEŞİLADA 1 1 Department of Pharmacognosy, Faculty of Pharmacy, Yeditepe University, 34755, İstanbul, Turkey. * Corresponding Author. E-mail: [email protected] (E.G.); Tel. +90 216 578 00 00. Received: 16 August 2019/ Revised: 24 October 2019 / Accepted: 17 November 2019 ABSTRACT: In this study, qualitative and quantitative analysis of commercially available food supplements composed of olive leaf extract and herbal tea products containing olive leaf were evaluated by High-Performance Thin-Layer Chromatography (HPTLC) and a newly developed and validated High-Performance Liquid Chromatographic (HPLC) method for their quality assessment. In addition, leaves of two varieties of Olea europaea L. (var. europaea and var. sylvestris) grown in Turkey which were assigned as reference plant materials and their chemical compositions were also comparatively analyzed by HPTLC. Then HPTLC fingerprints of reference plant materials were compared to the marketed olive leaf samples. For quantification of oleuropein and luteolin 7-O-glucoside (L7G) contents in the samples, a simple and fast HPLC method was developed and validated. Consequently, in water and hydroalcoholic extracts of O. europaea var. europaea leaves, oleuropein contents were found to be 15.89% (w/w) and 15.84% (w/w), while L7G contents were 0.75% and 1.23%, respectively. For the reference materials, oleuropein in O. europaea L. var. sylvestris leaves was found to be 12.77% (w/w, in water extract) and 12.36%(w/w, in hydroalcoholic extract), while the concentration of L7G was 0.51% (w/w) and 0.83% (w/w) in water and hydroalcoholic extracts, respectively. Qualitative analysis of the commercial products revealed that fraud was detected in three of eight olive leaf herbal tea bag brands and two of ten olive leaf food supplements. These samples were found either devoid of oleuropein or they had different HPTLC fingerprint profiles than the reference samples. KEYWORDS: Olea europaea; oleuropein; luteolin 7-O-glucoside; high-performance thin-layer chromatography (HPTLC); high-performance liquid chromatography (HPLC); quality control. 1. INTRODUCTION Olive (Olea europaea L., Oleaceae family) which is an evergreen and small tree is native to Mediterranean region and some parts of Asia Minor [1]. Its by-products (leaf, bark, seed etc.) are used for their nutritional value and health benefits to treat various ailments including malaria, hyperglycemia, hypertension, gallstones, rheumatism, pyrexia, urinary infections, constipation and diarrhea since ancient times [2,3]. In Flora of Turkey, O. europaea L. is represented by two varieties including var. europaea and var. sylvestris [4]. Olive leaf which contains rich phenolic compounds is marketed as tea or food supplements for its medicinal purposes. The phytochemical studies conducted so far demonstrated that it comprises secoiridoids most importantly oleuropein, flavonoids such as luteolin 7-O-glucoside (L7G) and apigenin-7-O-glucoside as well as some triterpenoids and lignan derivatives [2]. Previous bioactivity studies on olive leaf extracts and some of the isolated secondary metabolites revealed their antidiabetic [5], anticancer [6,7], antimicrobial [8], antioxidant [9], antihypertensive [10], antiinflammatory [11], antinociceptive [3], gastroprotective [12], wound healing [13] and neuroprotective activities [14]. The bitter compound oleuropein is a secoiridoid glycoside and the major bioactive component of olive leaf, has gained much attention in recent years due to its various beneficial and health promoting properties such as antioxidant, anti-atherogenic, anti-inflammatory, anticancer, antimicrobial and antiviral effects [15]. Furthermore, it is used for chemical standardization of the olive leaf extracts and supplements [2,16,17]. According to the European Pharmacopoeia (Phar. Eur.), oleuropein is an identification marker for olive leaf and its minimum amount should be at least 5% in dried olive leaf, while 16% in dry extract produced from olive leaf (E.P. 7.0) [18]. On the other hand, L7G is a flavone glycoside which is commonly distributed in many medicinal plants. It is one of the most abundant compounds in olive leaf after oleuropein and possesses various bioactivities including antioxidant, hepatoprotective and anti-inflammatory properties [19-21]. İD İD İD
-
Upload
khangminh22 -
Category
Documents
-
view
2 -
download
0
Transcript of Quality assessment of marketed food supplements and herbal ...

Journal of
Research in Pharmacy
Research Article
www.jrespharm.com
How to cite this article: Güzelmeriç E, Çevik D, Yeşilada E. Quality assessment of marketed food supplements and herbal tea products of olive leaf in Turkey. 2020; 24(1): 159-169.
© 2020 Marmara University Press ISSN: 2630-6344
https://doi.org/10.35333/jrp.2020.123
159
Quality assessment of marketed food supplements and herbal tea products of olive leaf in Turkey Etil GÜZELMERİÇ 1 * , Dicle ÇEVİK 1 , Erdem YEŞİLADA 1
1 Department of Pharmacognosy, Faculty of Pharmacy, Yeditepe University, 34755, İstanbul, Turkey.
* Corresponding Author. E-mail: [email protected] (E.G.); Tel. +90 216 578 00 00.
Received: 16 August 2019/ Revised: 24 October 2019 / Accepted: 17 November 2019
ABSTRACT: In this study, qualitative and quantitative analysis of commercially available food supplements composed of olive leaf extract and herbal tea products containing olive leaf were evaluated by High-Performance Thin-Layer Chromatography (HPTLC) and a newly developed and validated High-Performance Liquid Chromatographic (HPLC) method for their quality assessment. In addition, leaves of two varieties of Olea europaea L. (var. europaea and var. sylvestris) grown in Turkey which were assigned as reference plant materials and their chemical compositions were also comparatively analyzed by HPTLC. Then HPTLC fingerprints of reference plant materials were compared to the marketed olive leaf samples. For quantification of oleuropein and luteolin 7-O-glucoside (L7G) contents in the samples, a simple and fast HPLC method was developed and validated. Consequently, in water and hydroalcoholic extracts of O. europaea var. europaea leaves, oleuropein contents were found to be 15.89% (w/w) and 15.84% (w/w), while L7G contents were 0.75% and 1.23%, respectively. For the reference materials, oleuropein in O. europaea L. var. sylvestris leaves was found to be 12.77% (w/w, in water extract) and 12.36%(w/w, in hydroalcoholic extract), while the concentration of L7G was 0.51% (w/w) and 0.83% (w/w) in water and hydroalcoholic extracts, respectively. Qualitative analysis of the commercial products revealed that fraud was detected in three of eight olive leaf herbal tea bag brands and two of ten olive leaf food supplements. These samples were found either devoid of oleuropein or they had different HPTLC fingerprint profiles than the reference samples.
KEYWORDS: Olea europaea; oleuropein; luteolin 7-O-glucoside; high-performance thin-layer chromatography (HPTLC); high-performance liquid chromatography (HPLC); quality control.
1. INTRODUCTION
Olive (Olea europaea L., Oleaceae family) which is an evergreen and small tree is native to Mediterranean region and some parts of Asia Minor [1]. Its by-products (leaf, bark, seed etc.) are used for their nutritional value and health benefits to treat various ailments including malaria, hyperglycemia, hypertension, gallstones, rheumatism, pyrexia, urinary infections, constipation and diarrhea since ancient times [2,3]. In Flora of Turkey, O. europaea L. is represented by two varieties including var. europaea and var. sylvestris [4].
Olive leaf which contains rich phenolic compounds is marketed as tea or food supplements for its medicinal purposes. The phytochemical studies conducted so far demonstrated that it comprises secoiridoids most importantly oleuropein, flavonoids such as luteolin 7-O-glucoside (L7G) and apigenin-7-O-glucoside as well as some triterpenoids and lignan derivatives [2]. Previous bioactivity studies on olive leaf extracts and some of the isolated secondary metabolites revealed their antidiabetic [5], anticancer [6,7], antimicrobial [8], antioxidant [9], antihypertensive [10], antiinflammatory [11], antinociceptive [3], gastroprotective [12], wound healing [13] and neuroprotective activities [14].
The bitter compound oleuropein is a secoiridoid glycoside and the major bioactive component of olive leaf, has gained much attention in recent years due to its various beneficial and health promoting properties such as antioxidant, anti-atherogenic, anti-inflammatory, anticancer, antimicrobial and antiviral effects [15]. Furthermore, it is used for chemical standardization of the olive leaf extracts and supplements [2,16,17]. According to the European Pharmacopoeia (Phar. Eur.), oleuropein is an identification marker for olive leaf and its minimum amount should be at least 5% in dried olive leaf, while 16% in dry extract produced from olive leaf (E.P. 7.0) [18]. On the other hand, L7G is a flavone glycoside which is commonly distributed in many medicinal plants. It is one of the most abundant compounds in olive leaf after oleuropein and possesses various bioactivities including antioxidant, hepatoprotective and anti-inflammatory properties [19-21].
İD
İD
İD

Güzelmeriç et al. Quality assessment of marketed olive leaf products
Journal of Research in Pharmacy
Research Article
https://doi.org/10.35333/jrp.2020.123 J Res Pharm 2020; 24(1): 159-169
160
Adulteration is replacing of original plant with another inaccurate plant material or deliberately adding
any foreign substance into plant material in order to decrease its costs, which is a common problem in
marketted food supplements. Therefore, quality and quantity assessments of chemical constituents are very
important task for the standardization and thus therapeutic efficacy and safety of medicinal plants [22]. The
aim of this study was to comparatively investigate the qualitative and quantitative specifications of the
marketed olive leaf products (herbal tea and food supplements) by a High-Performance Thin-Layer
Chromatography (HPTLC) and a validated High-Performance Liquid Chromatography (HPLC) techniques
for their quality assessment.
2. RESULTS AND DISCUSSION
2.1. HPTLC analysis
A standard mixture was composed of equal volumes of rutin, chlorogenic acid (ChA), L7G, oleuropein
and caffeic acid was co-chromatographed with reference plant extracts and marketed olive leaf products.
Derivatization of HPTLC plates with different reagents were performed to figure out chemical composition of
the investigated plant material samples and to get wide range of information about their constituents.
Moreover, HPTLC plates were investigated under different wavelenghts by capturing their photos at 254 or
366 nm and under white light. Thus, the identity of rutin, ChA, L7G, oleuropein and caffeic acid in olive leaf
extracts and its marketed products were confirmed not only by using RF values but also with band colors, as
shown in Table 1.
Results have shown that aqueous (OL1 and OL2) and hydroalcoholic (OLE1 and OLE2) extracts of both
olive leaf varieties [var. europaea and var. sylvestris] which were used as reference plant materials were found
to contain L7G and oleuropein (Figures 1-9). While rutin, chlorogenic acid and caffeic acid were not detected
in these extracts (Figures 1-6). When HPTLC fingerprinting profiles of reference materials were compared with
both water (OLT1-8) and hydroalcoholic (OLTE1-8) extracts of olive leaf herbal tea products, OLT/OLTE 3
and OLT/OLTE4 showed completely different chemical profiles than the reference olive leaf samples. Blue
zones which were not found in reference olive leaf samples were detected at RF ≈ 0.7 and RF ≈ 0.8 (after
derivatization with NP captured at 366 nm) in OLT/OLTE4 and OLT/OLTE3, respectively (Figures 1, 2, 4 and
5). Consequently, it is evident that the specifications of these samples were not matching with that of reference
olive leaf and possibly they were adulterated. Additionally, fade zones were seen on the HPTLC
chromatogram of OLT/OLTE1 which indicates the low quality of this product.
On the other hand, ten food supplement formulations in capsule forms sold in the market (encoded
OLC1-10) were also investigated by HPTLC and their chromatograms were compared with the hydroalcoholic
extracts of reference olive leaf samples (OLE1 and OLE2). As a result, L7G, and oleuropein were detected in
all samples except for OLC1 and OLC6. Additionally, HPTLC chromatograms of OLC1 and OLC6 were found
to be completely different than the HPTLC chromatograms of reference olive leaf samples (Figures 3, 6 and 9).
Table 1. RF values and band colors of investigated compounds by HPTLC after derivatization.
Compound RF
Band colors
NP at 366 nm NP/anisaldehyd
e at 366 nm NP/anisaldehyde under white light
Caffeic acid ≈ 0.85 Blue Blue nd Oleuropein ≈ 0.55 nd Red Purple
L7G ≈ 0.50 Yellow Blue nd ChA ≈ 0.35 Blue Pale blue nd Rutin ≈ 0.25 Yellow Blue nd
nd = Not detected

Güzelmeriç et al. Quality assessment of marketed olive leaf products
Journal of Research in Pharmacy
Research Article
https://doi.org/10.35333/jrp.2020.123 J Res Pharm 2020; 24(1): 159-169
161
Figure 1. HPTLC chromatogram of water extracts of olive leaf and its herbal tea products sold on the market captured at 366 nm after derivatization with NP reagent.
Figure 2. HPTLC chromatogram of hydroalcoholic extracts of olive leaf and its herbal tea products sold on the market captured at 366 nm after derivatization with NP reagent.
Figure 3. HPTLC chromatogram of hydroalcoholic extracts of olive leaf and olive leaf capsules sold on the market captured at 366 nm after derivatization with NP reagent.
Figure 4. HPTLC chromatogram of water extracts of olive leaf and its herbal tea products sold on the market captured at 366 nm after derivatization with NP and anisaldehyde reagents, respectively.

Güzelmeriç et al. Quality assessment of marketed olive leaf products
Journal of Research in Pharmacy
Research Article
https://doi.org/10.35333/jrp.2020.123 J Res Pharm 2020; 24(1): 159-169
162
Figure 5. HPTLC chromatogram of hydroalcoholic extracts of olive leaf and its herbal tea products sold on the market captured at 366 nm after derivatization with NP and anisaldehyde reagents, respectively.
Figure 6. HPTLC chromatogram of hydroalcoholic extracts of olive leaf and olive leaf capsules sold on the market captured at 366 nm after derivatization with NP and anisaldehyde reagents, respectively.
Figure 7. HPTLC chromatogram of water extracts of olive leaf and its herbal tea products sold on the market captured under white light after derivatization with NP and anisaldehyde reagents, respectively.
Figure 8. HPTLC chromatogram of hydroalcoholic extracts of olive leaf and its herbal tea products sold on the market captured under white light after derivatization with NP and anisaldehyde reagents, respectively.

Güzelmeriç et al. Quality assessment of marketed olive leaf products
Journal of Research in Pharmacy
Research Article
https://doi.org/10.35333/jrp.2020.123 J Res Pharm 2020; 24(1): 159-169
163
Figure 9. HPTLC chromatogram of hydroalcoholic extracts of olive leaf and olive leaf capsules sold on the market captured under white light after derivatization with NP and anisaldehyde reagents, respectively.
2.2. HPLC analysis
2.2.1. HPLC method validation
The newly developed HPLC method for quantification of oleuropein and L7G was validated according to International Conference on Harmonisation (ICH) rules using specificity, linearity (r2), detection and determination limits (LOD and LOQ), intraday and inter-days precision, accuracy (recovery) parameters [23].
Figure 10. HPLC chromatogram of standart mixture (1: L7G; 2: Oleuropein) and olive leaf (a: L7G; b: Oleuropein) at 254 nm.
Figure 11. HPLC chromatogram of standart solution (1: L7G) and olive leaf (a: L7G) at 350 nm.
The least concentration of the standard solutions belonging L7G and oleuropein, respectively and the blank solution were analyzed for determination of the specificity of the HPLC method. The analyzed compounds which were L7G (retention time (tR)= 4.05 ± 0.01) and oleuropein (tR = 6.70 ± 0.01) were not detected on the blank chromatogram. In addition, the chromatograms of the standard mixture solution containing L7G and oleuropein and the sample test solutions were overlaid and tR values were compared

Güzelmeriç et al. Quality assessment of marketed olive leaf products
Journal of Research in Pharmacy
Research Article
https://doi.org/10.35333/jrp.2020.123 J Res Pharm 2020; 24(1): 159-169
164
(Figures 10 and 11). Moreover, UV spectrums of oleuropein and L7G obtained from chromatograms of standard test solutions and sample test solutions were matched.
To examine the linearity, standard solutions belonging 7 different concentration levels were analyzed in three times. The calibration curve area versus concentration (mg/mL) was found to be linear in the range of 0.5-40 mg/mL with r2 = 0.9997 for L7G and 5–400 mgmL with r2 = 0.9995 for oleuropein as shown in Table 2.
LOD and LOQ values of the developed method were determined from the equation as 3.3 x (SD/S) and 10 x (SD/S), respectively. Accordingly, LOD and LOQ were calculated as 0.02 µg/mL and 0.06 µg/mL, respectively for L7G and 0.55 µg/mL and 2 µg/mL, respectively for oleuropein.
Table 2. Linearity parameters for calibration curves belong to L7G and oleuropein.
Parameter L7G Oleuropein
Linearity range 0.5-40 µg/mL 5-400 µg/mL
R2 0.9997 0.9995
S 29.5 6.671
Intercept 8.0357 23.697
SD 0.19 1.23
LOD 0.02 µg/mL 0.55 µg/mL
LOQ 0.06 µg/mL 2 µg/mL
Table 3. Repeatability and intermediate precision results of olive leaf.
Repeatability and intermediate precision
Intra/ inter-days
L7G (mg/g±SD) Oleuropein (mg/g±SD)
1. Prepared n=3
2. Prepared n=3
1. Prepared n=3
2. Prepared n=3
Intraday 12.31±0.05 12.63±0.02 158.38±0.03 161.69±0.44
RSD 0.40 0.17 0.02 0.27
Interday 12.74±0.10 12.75±0.02 163.53±0.33 165.69±0.69
RSD 0.81 0.17 0.20 0.42
Interday 12.87±0.12 13.05±0.01 167.99±0.31 171.58±0.15
RSD 0.90 0.08 0.19 0.09
Results are expressed as mean ± Standart deviation (SD) RSD: Relative standart deviation
Table 4. Recovery results for L7G and oleuropein in olive leaf.
Analyte Amount spiked (µg/mL)
n=3
Amount Found (µg/mL±SDa)
n=3
Recovery (%) n=3
RSDb
L7G
3.75 3.85±0.01 102.70±0.29 0.28
12.5 13.04±0.02 104.34±0.24 0.23
25 25.15±0.30 100.59±1.21 1.21
Oleuropein
37.5 39.71±0.05 105.89±0.14 0.14
125 126.03±0.80 100.83±0.64 0.63
250 237.87±0.68 95.15±0.27 0.29
Results are expressed as mean ± Standart deviation (SD) RSD: Relative standart deviation

Güzelmeriç et al. Quality assessment of marketed olive leaf products
Journal of Research in Pharmacy
Research Article
https://doi.org/10.35333/jrp.2020.123 J Res Pharm 2020; 24(1): 159-169
165
The intraday precision of the method was determined by repeating the assay in three times by evaluating the amounts of L7G and oleuropein in 2 times freshly prepared samples during the day. Additionally, the intermediate precision of the developed method was achieved by calculation of the L7G and oleuropein amounts in sample test solutions in three consecutive days in three times. The results were depicted in Table 3.
Recovery was represented as the proportion in percent between the known spiked amount of the compound and the experimentally found result. The three different concentrations of L7G (3.75, 12.5 and 25 µg/mL) and oleuropein (37.5, 125 and 250 µg/mL) were added into the formerly examined sample test solution. The results have showed that the recovery results were found in between 100.59-104.34% for L7G and 95.15-105.89% for oleuropein, showed in Table 4. 2.2.2. Oleuropein and L7G analysis
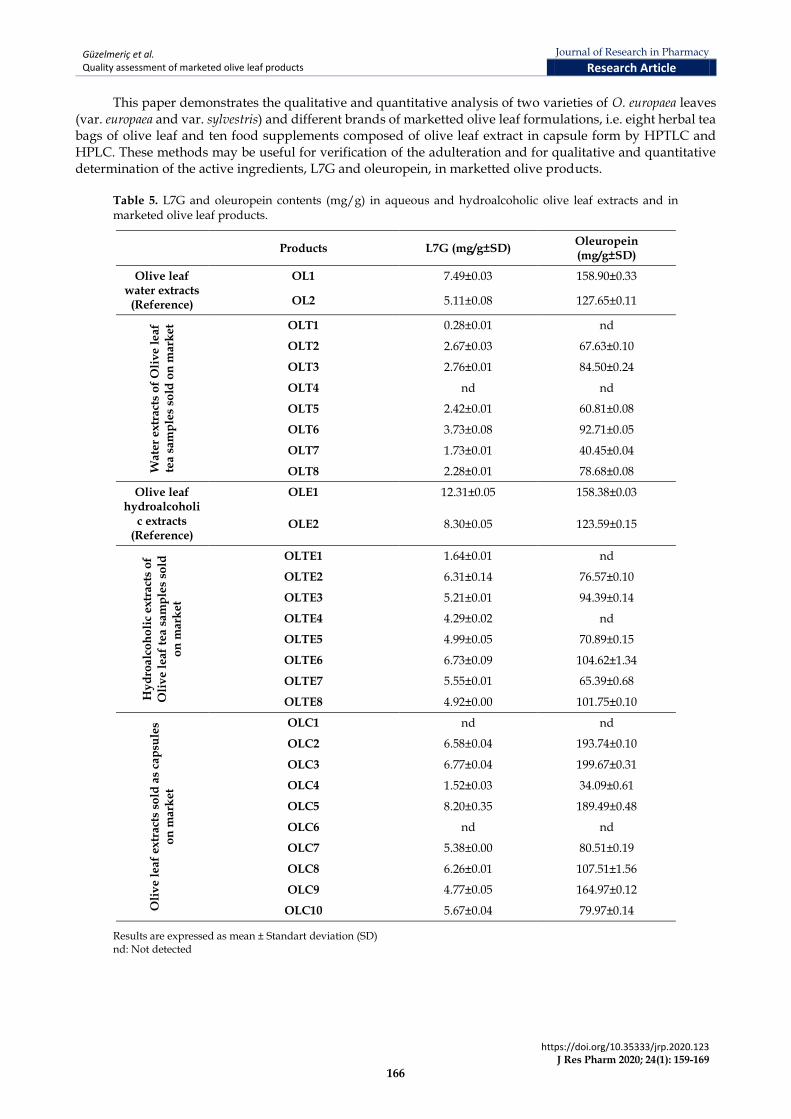
Oleuropein and L7G contents (mg/g) in reference olive leaf samples and its marketed products were quantitatively analyzed by HPLC (Table 5). Regarding to the obtained results as depicted in Table 5, neither the water nor the hydroalcoholic extracts of OLT1 and OLT4 were found to contain oleuropein. Furthermore, OLC1 and OLC6 samples were totally devoid of oleuropein or L7G.
Comparing the water and hydroalcoholic extracts of olive leaf herbal tea samples as well as reference leaves demonstrated that there was a remarkable increase of L7G content in hydroalcoholic extracts (1.64±0.01 to 6.73±0.09 mg/g for OLTE1-8, 12.31±0.05 mg/g for OLE1 and 8.30±0.05 mg/g for OLE2) than water extracts (0.28±0.01 to 3.73±0.08 mg/g for OLT1-3,5-8, 7.49±0.03 mg/g for OL1 and 5.11±0.08 mg/g for OL2). Furhermore, while L7G was not detected in water extract of OLT4, it was found to be 4.29±0.02 mg/g in hydroalcoholic extract of the same tea sample (OLTE4). Based on these findings, it is noteworthy to mention that as regards L7G content, its yield in ethanol-water (8:2, v/v) extract is higher than in hot water extract.
Among the investigated herbal tea bag samples, OLT/OLTE6 were found to be the best in quality comparing to the other tea bag brands regarding detected oleuropein [92.71±0.05 (OLT6) and 104.62±1.34 (OLTE6) mg/g] and L7G [3.73±0.08 (OLT6) and 6.73±0.09 (OLTE6) mg/g] contents, respectively.
Oleuropein and L7G contents as well as other phenolic compounds in olive leaves may have variations depending upon several factors including climatic and geographical conditions, fertilization and collection period of the year as well as drying method and extraction procedures [24]. In previous studies, oleuropein and L7G contents in its ethanolic extract were determined to be 24.54 % (w/w) and 1.38% (w/w) [19], while in methanolic extract were 19% (w/w) and 0.8% (w/w), respectively [25]. On the other hand, aqueous methanol (60%) extract of leaves of several O. europaea varieties were reported to contain 9.04-14.19% (w/w) oleuropein and 0.28-0.57% (w/w) L7G [26]. Lee-Huang et al. reported 12.8 % (w/w) oleuropein in aqueous extract of O. europaea leaves [27]. In another study by Altınyay and Altun, oleuropein values in methanolic extracts of O. europaea var. europaea and O. europaea var. sylvestris were found as 3.506-4.020% and 5.197% (w/w), respectively [28]. In our present study, in water and hydroalcoholic extracts of O. europaea L. var. europaea leaves, 15.89% (w/w) and 15.84% (w/w) oleuropein as well as 0.75% and 1.23% L7G were calculated, respectively. While amount of oleuropein content were found to be 12.77% (w/w, water extract, OL2) and 12.36% (w/w, hydroalcoholic extract, OLE2), L7G was determined to be 0.51% (w/w, OL2) and 0.83% (w/w, OLE2) in O. europaea L. var. sylvestris. Taken together, our results were consistent with the previous studies based on published literature.
Consequently, the developed and validated HPLC method in this study might be useful for routine analysis of olive leaf formulations. The developed method has superior features than the previous published papers such as short analysis time. In the Phar. Eur., the retention time of oleuropein was mentioned as 9 minutes by using gradient elution with methanol and acetic acid in water as mobile phase A and B [18]. However, in the present method, the retention time of oleuropein was shortened rougly to 6.70 minutes by using isocratic elution with acetic acid in water and methanol (60:40, v/v, respectively) as a mobile phase. Al-Rimavi also developed and validated an HPLC method for quantification of oleuropein in olive leaf. However, oleuropein was detected with a retention time of about 16 minutes [29].
3. CONCLUSION
Recently, there is an increasing demand for natural products including herbal teas and food supplements for their healing benefits. However, due to insufficient control of the authority the quality of marketed products may occasionally arise severe health risks, particularly due to fraud. Therefore, quality analysis of such marketed products is extremely important before and post marketing.
Güzelmeriç et al. Quality assessment of marketed olive leaf products
Journal of Research in Pharmacy
Research Article
https://doi.org/10.35333/jrp.2020.123 J Res Pharm 2020; 24(1): 159-169
166
This paper demonstrates the qualitative and quantitative analysis of two varieties of O. europaea leaves (var. europaea and var. sylvestris) and different brands of marketted olive leaf formulations, i.e. eight herbal tea bags of olive leaf and ten food supplements composed of olive leaf extract in capsule form by HPTLC and HPLC. These methods may be useful for verification of the adulteration and for qualitative and quantitative determination of the active ingredients, L7G and oleuropein, in marketted olive products.
Table 5. L7G and oleuropein contents (mg/g) in aqueous and hydroalcoholic olive leaf extracts and in marketed olive leaf products.
Products L7G (mg/g±SD) Oleuropein (mg/g±SD)
Olive leaf water extracts
(Reference)
OL1 7.49±0.03 158.90±0.33
OL2 5.11±0.08 127.65±0.11
Wa
ter
ex
tra
cts
of
Oli
ve
le
af
tea
sam
ple
s so
ld o
n m
ark
et OLT1 0.28±0.01 nd
OLT2 2.67±0.03 67.63±0.10
OLT3 2.76±0.01 84.50±0.24
OLT4 nd nd
OLT5 2.42±0.01 60.81±0.08
OLT6 3.73±0.08 92.71±0.05
OLT7 1.73±0.01 40.45±0.04
OLT8 2.28±0.01 78.68±0.08
Olive leaf hydroalcoholi
c extracts (Reference)
OLE1 12.31±0.05 158.38±0.03
OLE2 8.30±0.05 123.59±0.15
Hy
dro
alc
oh
oli
c e
xtr
act
s o
f
Oli
ve
lea
f te
a s
am
ple
s so
ld
on
ma
rke
t
OLTE1 1.64±0.01 nd
OLTE2 6.31±0.14 76.57±0.10
OLTE3 5.21±0.01 94.39±0.14
OLTE4 4.29±0.02 nd
OLTE5 4.99±0.05 70.89±0.15
OLTE6 6.73±0.09 104.62±1.34
OLTE7 5.55±0.01 65.39±0.68
OLTE8 4.92±0.00 101.75±0.10
Oli
ve
lea
f ex
tra
cts
sold
as
cap
sule
s o
n m
ark
et
OLC1 nd nd
OLC2 6.58±0.04 193.74±0.10
OLC3 6.77±0.04 199.67±0.31
OLC4 1.52±0.03 34.09±0.61
OLC5 8.20±0.35 189.49±0.48
OLC6 nd nd
OLC7 5.38±0.00 80.51±0.19
OLC8 6.26±0.01 107.51±1.56
OLC9 4.77±0.05 164.97±0.12
OLC10 5.67±0.04 79.97±0.14
Results are expressed as mean ± Standart deviation (SD) nd: Not detected

Güzelmeriç et al. Quality assessment of marketed olive leaf products
Journal of Research in Pharmacy
Research Article
https://doi.org/10.35333/jrp.2020.123 J Res Pharm 2020; 24(1): 159-169
167
4. MATERIALS AND METHODS
4.1. Chemicals and solvents
HPLC grade methanol was obtained from Sigma-Aldrich (Steinheim, Germany). Analytical grade solvents were used during the analysis. Ethanol, ethyl formate, toluene, formic acid and acetic acid were purchased from Sigma-Aldrich (Steinheim, Germany). 2-aminoethyl diphenylborinate was from Fluka (Steinheim, Germany). Polyethylene glycol 400 was obtained from Merck (Darmstadt, Germany). The ultrapure water was obtained from Millipore, Simplicity UV (Darmstadt, Germany).
Standard references of rutin, ChA, L7G, oleuropein and caffeic acid were purchased from Sigma-Aldrich (Steinheim, Germany).
4.2. Plant materials and marketed olive leaf samples
Olea europaea L. var. europaea and O. europaea L. var. sylvestris leaves were gathered from İzmir in September-October (2017) and identified by Prof. Dr. Erdem Yesilada and used as reference plant materials. The voucher specimens (YEF 17017 and YEF 17018) have been deposited in the Herbarium of the Department of Pharmacognosy, Faculty of Pharmacy, Yeditepe University, Istanbul, Turkey.
Different brands of marketed olive leaf food supplements and olive leaf tea bag samples were purchased from internet shops or local markets in Turkey.
4.3. Preparation of standard solutions
4.3.1. Standard solutions for HPTLC analysis
Standard mixture (0.04 mg/mL) containing equal volumes of rutin, ChA, L7G, oleuropein and caffeic acid was prepared in methanol and encoded as STD MIX.
4.3.2. Standard solutions for HPLC analysis
Oleuropein and L7G stock solutions 2000 µg/mL and 200 µg/mL, respectively were prepared in methanol. Stock solutions were further diluted and used to obtain calibration curve and perform recovery studies.
4.4. Preparation of sample test solutions
4.4.1. Extraction of olive leaves as a reference plant material
Both water and hydroalcoholic extracts O. europaea L. var. europaea (OL1 and OLE1, respectively) and O. europaea L. var. sylvestris (OL2 and OLE2, respectively) leaves were used as reference plant materials in this study. Water extract of olive leaves (OL1 and 2) were prepared by infusion techique. 100 mL of boiling water was added to accurately weighed 2 g of powdered olive leaf and brewed for 15 minutes. Then, it was filtered through Whatman paper and lyophilized.
Hydroalcoholic extracts (OLE1-2) were prepared by refluxing 2 g of accurately weighed powdered olive leaf with 50 mL of ethanol-water (8:2, v/v) mixture for 15 minutes. Then, it was filtered and ethanol was evaporated by rotary evaporator. Lastly, the residual aqueous extract was lyophilized.
4.4.2. Extraction of marketed olive leaf products sold as herbal tea
For homogenous sampling, olive leaf samples were randomly selected from eight different brands of olive leaf tea bags were weighed precisely. Then, each sample was infused to prepare 2% infusion according to the described procedure in section 4.4.1. and encoded as OLT1-8. Hydroalcoholic extracts of these samples were also prepared in a similar way as described in section 4.4.1. and named as OLTE1-8.
4.4.3. Sample preparation for olive leaf supplements
Since the purchased food supplement formulations contain olive leaf extract further processing for extraction was not performed. Final concentration of each sample test solutions was adjusted to 10 mg/mL in methanol.
4.5. HPTLC method
Each sample test solutions of water and hydroalcoholic extracts obtained from herbal tea samples and capsules (5 µL) and standard mixture solution (2 µL) were spotted as bands using a Linomat V semi-automatic sample applicator (Camag, Muttenz, Switzerland) equipped with microliter Hamilton syringe (100 µL)

Güzelmeriç et al. Quality assessment of marketed olive leaf products
Journal of Research in Pharmacy
Research Article
https://doi.org/10.35333/jrp.2020.123 J Res Pharm 2020; 24(1): 159-169
168
(Bonaduz, Switzerland) on precoated HPTLC silica gel 60 F254 glass plates (20 x 10 cm). The plates were developed by using a developing solvent system containing ethyl formate-formic acid-
toluene-water (60:8:3:6, v/v/v/v) up to 7 cm in the Automatic Developing Chamber 2 (ADC2, Camag) with 20 minutes chamber saturation with a filter paper. The relative humidity (33%) was adjusted by using saturated magnesium chloride solution.
For derivatization, each plate was heated at 100˚C on the Camag TLC plate heater for 3 min and dipped into Natural Product reagent (NP reagent) solution which was prepared by dissolving 1 g of 2-aminoethyl diphenylborinate in 200 mL of ethyl acetate. Then, the plate photos were captured at UV-366 nm by using the Camag TLC visualizer. Finally, the plates were dipped into anisaldehyde solution and documented at UV-366 nm and under white light by Camag TLC visualizer [30].
All these instruments were conducted by winCATS program (version 1.4.8, Camag).
4.6. HPLC method
HPLC analyses were carried out by using the following equipments; Agilent 1260 Infinity HPLC system (Darmstadt, Germany) consisting of an Agilent ChemStation software, quaternary pump (G1311B), auto-sampler (G1329B), thermostated column compartment (G1316A), and diode array detector (G4212B).
The chromatographic separations were performed on an Agilent Pursuit 5 RP18 Column (3.9 mm x 150 mm, 5-µm particle size) and the column temperature was maintained at 25 ˚C. The isocratic elution with a flow rate 1 mL/min was used to separate investigated analytes. The mobile phase A was water-acetic acid (9:1, v/v) and mobile phase B was methanol. The mobile phase A and B were mixed in the proportion of 60:40 (v/v), respectively. The working standard solutions and sample test solutions were injected into the system as 10 µL. Oleuropein and L7G were detected at 254 nm and 350 nm, respectively.
Acknowledgements: Etil Guzelmeric expresses her sincere thanks to Pharm. Elçin İrem Akçakoyunlu and Pharm. Zeynep Leblebici for their contributions to the study.
Author contributions: Concept – E.G.; Design – E.G., D.Ç.; Supervision – E.Y.; Resources – E.G., E.Y.; Materials – E.Y.; Data Collection and/or Processing – E.G., D.Ç.; Analysis and/or Interpretation – E.G., D.Ç.; Literature Search – D.Ç.; Writing – E.G., D.Ç.; Critical Reviews – E.G., D.Ç., E.Y.
Conflict of interest statement: The authors declared no conflict of interest.
REFERENCES
[1] Salem M Ben, Affes H, Ksouda K, Sahnoun Z, Zeghal KM, Hammami S. Pharmacological activities of Olea europaea leaves. J Food Process Preserv. 2015; 39(6): 3128–3136. [CrossRef]
[2] Hashmi MA, Khan A, Hanif M, Farooq U, Perveen S. Traditional uses, phytochemistry, and pharmacology of Olea europaea (olive). Evidence-Based Complement Altern Med. 2015; 2015: 541591. [CrossRef]
[3] Esmaeili-Mahani S, Rezaeezadeh-Roukerd M, Esmaeilpour K, Abbasnejad M, Rasoulian B, Sheibani V, Kaeidi A, Hajializadeh Z. Olive (Olea europaea L.) leaf extract elicits antinociceptive activity, potentiates morphine analgesia and suppresses morphine hyperalgesia in rats. J Ethnopharmacol. 2010; 132(1): 200–205. [CrossRef]
[4] Yaltırık F, Olea L. In: Davis PH. (Ed). Flora of Turkey and the East Aegean Islands Vol. 6. Edinburgh University Press, Edinburgh 1978, pp.155-156.
[5] Eidi A, Eidi M, Darzi R. Antidiabetic effect of Olea europaea L. in normal and diabetic rats. Phytother Res. 2009; 23(3): 347–350. [CrossRef]
[6] Allouche Y, Warleta F, Campos M, Sánchez-Quesada C, Uceda M, Beltrán G, Gaforio JJ. Antioxidant, antiproliferative, and pro-apoptotic capacities of pentacyclic triterpenes found in the skin of olives on MCF-7 human breast cancer cells and their effects on DNA damage. J Agric Food Chem. 2011; 59(1): 121–130. [CrossRef]
[7] Fares R, Bazzi S, Baydoun SE, Abdel-Massih RM. The antioxidant and anti-proliferative activity of the Lebanese Olea europaea extract. Plant Foods Hum Nutr. 2011; 66(1): 58–63. [CrossRef]
[8] Pereira AP, Ferreira ICFR, Marcelino F, Valentão P, Andrade PB, Seabra R, Estevinho L, Bento A, Pereira JA. Phenolic compounds and antimicrobial activity of olive (Olea europaea L. Cv. Cobrançosa) leaves. Molecules. 2007; 12(5): 1153–1162. [CrossRef]
[9] Lee O-H, Lee B-Y. Antioxidant and antimicrobial activities of individual and combined phenolics in Olea europaea leaf extract. Bioresour Technol. 2010; 101(10): 3751–3754. [CrossRef]

Güzelmeriç et al. Quality assessment of marketed olive leaf products
Journal of Research in Pharmacy
Research Article
https://doi.org/10.35333/jrp.2020.123 J Res Pharm 2020; 24(1): 159-169
169
[10] Susalit E, Agus N, Effendi I, Tjandrawinata RR, Nofiarny D, Perrinjaquet-Moccetti T, Verbruggen M. Olive (Olea europaea) leaf extract effective in patients with stage-1 hypertension: Comparison with captopril. Phytomedicine. 2011; 18(4): 251–258. [CrossRef]
[11] Ikeda Y, Murakami A, Ohigashi H. Ursolic acid: An anti- and pro-inflammatory triterpenoid. Mol Nutr Food Res. 2008; 52(1): 26–42. [CrossRef]
[12] Dekanski D, Janićijević-Hudomal S, Tadić V, Marković G, Arsić I, Mitrović DM. Phytochemical analysis and gastroprotective activity of an olive leaf extract. J Serbian Chem Soc. 2009; 74(4): 367–377. [CrossRef]
[13] Koca U, Süntar I, Akkol EK, Yılmazer D, Alper M. Wound repair potential of Olea europaea L. leaf extracts revealed by in vivo experimental models and comparative evaluation of the extracts’ antioxidant activity. J Med Food. 2010; 14(1–2): 140–146. [CrossRef]
[14] Kaeidi A, Esmaeili-Mahani S, Sheibani V, Abbasnejad M, Rasoulian B, Hajializadeh Z, Afrazi S. Olive (Olea europaea L.) leaf extract attenuates early diabetic neuropathic pain through prevention of high glucose-induced apoptosis: In vitro and in vivo studies. J Ethnopharmacol. 2011; 136(1): 188–196. [CrossRef]
[15] Hassen I, Casabianca H, Hosni K. Biological activities of the natural antioxidant oleuropein: Exceeding the expectation - A mini-review. J Funct Foods. 2015; 18: 926–940. [CrossRef]
[16] Boka V-I, Argyropoulou A, Gikas E, Angelis A, Aligiannis N, Skaltsounis AL. Employment of High-Performance Thin-Layer Chromatography for the quantification of oleuropein in olive leaves and the selection of a suitable solvent system for its isolation with Centrifugal Partition Chromatography. Planta Med. 2015; 81(17): 1628–1635. [CrossRef]
[17] Gamlı ÖF. The health effects of oleuropein, one of the major phenolic compounds of olives, Olea europaea L. Ital J Food Sci. 2016; 28: 178–190. [CrossRef]
[18] European Pharmacopoeia (Ph. Eur.), Seventh ed., Council of Europe, Strasbourg, France, 2010.
[19] Benavente-García O, Castillo J, Lorente J, Ortuño A, Del Rio JA. Antioxidant activity of phenolics extracted from Olea europaea L. leaves. Food Chem. 2000; 68(4): 457–462. [CrossRef]
[20] Aziz N, Kim M-Y, Cho JY. Anti-inflammatory effects of luteolin: A review of in vitro, in vivo, and in silico studies. J Ethnopharmacol. 2018; 225: 342–358. [CrossRef]
[21] Qiusheng Z, Xiling S, Xubo, Gang L, Meng S, Changhai W. Protective effects of luteolin-7-glucoside against liver injury caused by carbon tetrachloride in rats. Pharmazie. 2004; 59(4): 286–289.
[22] Chanda S. Importance of pharmacognostic study of medicinal plants: An overview. J Pharmacogn Phytochem. 2014; 2(5): 69–73.
[23] ICH Harmonised Tripartite Guideline Validation of Analytical Procedures: Text and Methodology Q2 (R1). https://www.ich.org/fileadmin/Public_Web_Site/ICH_Products/Guidelines/Quality/Q2_R1/Step4/Q2_R1__Guideline.pdf (accessed on 8 August 2019)
[24] Özcan MM, Matthäus B. A review : Benefit and bioactive properties of olive (Olea europaea L.) leaves. Eur Food Res Technol. 2017; 243(1): 89–99. [CrossRef]
[25] Tutour BL, Guedon D. Antioxidative activities of Olea europaea leaves and related phenolic compounds. Phytochemistry. 1992; 31(4): 1173–1178. [CrossRef]
[26] Savournin C, Baghdikian B, Elias R, Dargouth-Kesraoui F, Boukef K, Balansard G. Rapid High-performance liquid chromatography analysis for the quantitative determination of oleuropein in Olea europaea leaves. J. Agric. Food Chem. 2001; 49: 618–621. [CrossRef]
[27] Lee-Huang S, Zhang L, Lin Huang P, Chang Y-T, Huang PL. Anti-HIV activity of olive leaf extract (OLE) and modulation of host cell gene expression by HIV-1 infection and OLE treatment. Biochem Biophys Res Commun. 2003; 307(4): 1029–1037. [CrossRef]
[28] Altınyay Ç, Altun ML. HPLC analysis of oleuropein in Olea europaea L. J Fac Pharm Ankara Univ. 2006; 35(1): 1–11.
[29] Al-Rimawi F. Development and validation of a simple reversed-phase HPLC-UV method for determination of oleuropein in olive leaves. J Food Drug Anal. 2014; 22: 285–289. [CrossRef]
[30] International Association for the Advancement of High Performance Thin Layer Chromatography. https://www.hptlc-association.org/methods/methods.cfm (accessed on 8 August 2019)
This is an open access article which is publicly available on our journal’s website under Institutional Repository at http://dspace.marmara.edu.tr.