A demographic comparison of two southern elephant seal populations
Upload
coloradocollegeCategory
view
1download
0
Fax +41 61 306 12 34E-Mail [email protected]
Original Paper
Brain Behav Evol DOI: 10.1159/000345565
Qualitative and QuantitativeAspects of the Microanatomy of the African Elephant Cerebellar Cortex
Busisiwe C. Maseko a Bob Jacobs b Muhammad A. Spocter a, c, d
Chet C. Sherwood d Patrick R. Hof e Paul R. Manger a
a School of Anatomical Sciences, Faculty of Health Sciences, University of the Witwatersrand,
Johannesburg , Republic of South Africa; b Laboratory of Quantitative Neuromorphology, Psychology,
Colorado College, Colorado Springs, Colo. , c Department of Anatomy, Des Moines University, Des Moines, Iowa ,
d Department of Anthropology, The George Washington University, Washington, D.C. , and e
Fishberg Department of Neuroscience and Friedman Brain Institute, Mount Sinai School of Medicine, New York, N.Y. , USA
of the different interneuron types was higher in elephants than other mammals. Expression of parvalbumin in the par-allel fibers and calbindin expressed in the stellate and basket cells also suggested changes in the elephant cerebellar neu-ronal circuitry. The stereologic analysis confirmed and ex-tended previous observations by demonstrating that neuro-nal density is low in the elephant cerebellar cortex, providing for a larger volume fraction of the neuropil. With previous results indicating that the elephants have the largest relative cerebellar size amongst mammals, and one of the absolute-ly largest mammalian cerebella, the current observations suggest that the elephants have a greater volume of a poten-tially more complexly organized cerebellar cortex compared to other mammals. This quantitatively larger and more com-plex cerebellar cortex likely represents part of the neural ma-chinery required to control the complex motor patterns in-volved in movement of the trunk and the production of in-frasonic vocalizations. Copyright © 2012 S. Karger AG, Basel
Key Words
Elephant � Cerebellum � Cerebellar cortex � Proboscidae � Brain evolution � Mammalia
Abstract
The current study provides a number of novel observations on the organization and structure of the cerebellar cortex of the African elephant by using a combination of basic neuro-anatomical and immunohistochemical stains with Golgi and stereologic analysis. While the majority of our observations indicate that the cerebellar cortex of the African elephant is comparable to other mammalian species, several features were unique to the elephant. The three-layered organization of the cerebellar cortex, the neuronal types and some as-pects of the expression of calcium-binding proteins were common to a broad range of mammalian species. The Luga-ro neurons observed in the elephant were greatly enlarged in comparison to those of other large-brained mammals, suggesting a possible alteration in the processing of neural information in the elephant cerebellar cortex. Analysis of Golgi impregnations indicated that the dendritic complexity
Received: August 20, 2012 Returned for revision: September 14, 2012 Accepted after revision: October 25, 2012 Published online: December 29, 2012
Paul Manger School of Anatomical Sciences, Faculty of Health Sciences University of the Witwatersrand 7 York Road, Parktown, Johannesburg 2193 (Republic of South Africa) E-Mail Paul.Manger @ wits.ac.za
© 2012 S. Karger AG, Basel 0006–8977/12/0000–0000$38.00/0
Accessible online at: www.karger.com/bbe

Maseko /Jacobs /Spocter /Sherwood /Hof /Manger
Brain Behav Evol2
Introduction
In their review of the structure of the elephant brain, Cozzi et al. [2001] indicate that the cerebellar cortex in elephants possesses the same basic structure as that of other mammals, being divided into three main layers: the molecular layer, the Purkinje cell layer and the granule cell layer [Obersteiner, 1913; Lange, 1971, 1975; Mann and Yates, 1979]. In all mammals studied to date, the molecu-lar layer is the most superficial and consists of Purkinje cell dendrites, myelinated and unmyelinated axons, stel-late cells and basket cells [Dvergsten et al., 1984]. The Purkinje cell layer lies deep to the molecular layer and is comprised of one layer of large, pear-shaped Purkinje cell somata with very extensive spiny dendritic arborizations, reaching into the molecular layer [Palay and Chan-Palay, 1974]. Deep to the Purkinje cell layer is the granule cell layer, which contains densely packed granule cells, Luga-ro cells, Golgi cells and unipolar brush cells [Palay and Chan-Palay, 1974; Lainé and Axelrad, 2002]. The under-lying white matter contains the axons of Purkinje cells, mossy fibers, climbing fibers and the deep cerebellar nu-clei [Palay and Chan-Palay, 1974].
The density of cells in the cerebellar cortical layers has been shown to differ across species such that brains with smaller mass tend to possess a greater density of cells per unit volume [Lange, 1975]. For instance, in one study the granule layer of the elephant was reported to have the lowest neuronal density (807 cells per 0.001 mm 3 ), fol-lowed by the rhesus monkey (2,099 cells per 0.001 mm 3 ), and the highest neuronal density reported in the rat (3,216 cells per 0.001 mm 3 ) [Lange, 1975]. In the Purkinje layer, with respect to sizes of individual Purkinje cell soma, el-ephants had the largest somas, followed by rhesus mon-keys, with rats having the smallest somas; however, the granule cell layer showed no significant species differ-ences in soma size [Lange, 1975].
It is thus clear that the elephant cerebellar cortex is typically mammalian in general laminar architecture; however, prior studies have not examined neuronal morphology or neurochemical phenotypes of cells in any detail. Due to the fact that tissue suitable for immu-nohistochemical analysis is now available [Manger et al., 2009] and that elephants possess the largest relative cerebellar size of all mammals [Maseko et al., 2012] ( fig. 1 ), the present study explores the fine structure of the African elephant (Loxodonta africana) cerebellar cortex by using immunohistochemistry and Golgi stain-ing to characterize its anatomy more fully. Moreover, given the seemingly uniform structure of the cerebellar
circuitry, the question arises as to whether the mammal with the largest relative cerebellum studied to date shows any concomitant changes in the structure of this cortex to add to the putative functional advantage of a large cerebellum [Maseko et al., 2012]. To this end, we used immunohistochemistry for parvalbumin, calbin-din and calretinin (EF-hand calcium binding proteins), in conjunction with Nissl and myelin stains, and rapid Golgi impregnations to provide a more detailed descrip-tion of the structure of the cerebellar cortex of the Afri-can elephant.
a
b
Fig. 1. MRI sections of the elephant brain showing the size and relationships of the cerebellum in a horizontal plane ( a ) and a coronal plane ( b ). Note the relatively large size of the elephant cerebellum. Scale bar = 5 cm. 3V = Third ventricle; 4V = fourth ventricle; C = head of caudate nucleus; CN = deep cerebellar nu-clei; DT = dorsal thalamus; IC = inferior colliculus; LV = lateral ventricle; P = putamen nucleus; SC = superior colliculus.

Elephant Cerebellar Cortex Brain Behav Evol 3
Materials and Methods
Two free-ranging, solitary male African elephants ( L. afri-cana ; LA1 and LA3, approximate age 20–30 years) scheduled for culling were euthanized as described in Manger et al. [2009]. Per-mission to sacrifice the animals was granted by the Zimbabwe Parks and Wildlife Management Authority, and ethical permis-sion was obtained from the University of the Witwatersrand An-imal Ethics Committee. The animals were treated and used ac-cording to the guidelines of this committee, which parallel those set down by the NIH for use of animals in scientific experiments. In situ perfusion-fixation of the brains was conducted by remov-al of the head, flushing of the cranium with cold saline, and in-tracarotid perfusion with 4% paraformaldehyde in 0.1 M phos-phate buffer (PB), resulting in relatively short autolysis times (LA1: 160 min, LA3: 110 min). The brains were then removed from the skull, placed in the same cold fixative, weighed (LA1: 5,145 g, LA3: 4,835 g) and stored in 4% paraformaldehyde in0.1 M PB for 72 h. In order to study the cerebellar cortex of theelephant in more detail, blocks of tissue were excised from the dorsal surfaces of the anterior and posterior portions of the cer-ebellar hemispheres and the anterior and posterior portions of the vermis of 2 elephants ( fig. 2 ). These tissue blocks were stored in 0.1% sodium azide in 0.1 M PB in cold storage for 8 months before staining. Tissue was not taken from the flocculonodular lobe due to the location of this lobe deep within the cerebellum in the roof of the fourth ventricle [Shoshani et al., 2006] and the damage that accessing this region would have caused to the specimens. Tissue blocks were subdivided and processed in different ways to prepare sections appropriate for neuron counting, calculation of neuron density, and also for the structural description of the various neu-rons located within the different layers of the cerebellar cortex using the Golgi stain.
Golgi Staining Blocks of tissue were trimmed to 3–5 mm in thickness and
coded to prevent experimenter bias. These blocks were then pro-cessed according to the modified rapid Golgi technique of Schei-bel and Scheibel [1978]. Consistent with previous research [Jacobs et al., 1997, 2001, 2011], processed tissue was serially sectioned at 120 � m with a vibratome.
Describing and Quantifying Neuronal Morphology from Golgi-Stained Material Prior to quantification, all Golgi-stained sections were exam-
ined to determine cell types. Golgi-stained neurons were identi-fied according to their differing morphologies and location with-in the cerebellar cortex. The neurons of interest in the current study included the basket cells, stellate cells, Golgi type II cells and Lugaro cells. Purkinje cells were not traced due to the extent of their dendritic branching and density of dendritic spines, mak-ing them too complex to quantify accurately with a Golgi prepa-ration. Granule cells did not stain in the current preparation. Five neurons of each type were chosen and traced to record their mor-phology in three dimensions. A Neurolucida system (MBF Biosci-ence, Williston, Vt., USA) coupled to an Olympus BH-2 micro-scope and using a Planachromat 40 ! (N.A. 0.70) dry objective was used to quantify the neurons in three dimensions along their x-, y- and z-coordinates. First, the soma was traced at its largest point without changing the z-coordinate to give an estimate of its
cross-sectional area [Jacobs et al., 2001]. The dendrites were then traced from their origin at the soma and followed as they tapered and branched all the way to their termination. Several aspects of the neurons were measured to analyze the sizes and proportions of the different cell types; these include soma size, soma depth from the pial surface, dendritic length and dendritic tortuosity. The diameter of the dendrites was also quantified, along with the number of branches for each dendrite. Broken tips were labeled as incomplete endings. The tortuosity index was calculated by divid-ing the total length of dendritic segments from the origin point on the cell body to the end point, by the length of a vector from the dendritic origin point on the soma to the dendritic end. A tor-tuosity index of 1 would indicate a straight line, whereas a tortu-osity index greater than 1 indicates that the path of the dendrites is more complex than a straight line [Foster and Peterson, 1986; Wen et al., 2009].
Nissl, Myelin and Immunohistochemical Staining A one-in-five series of sections was stained for Nissl substance
with cresyl violet, silver staining for myelin and immunohisto-chemically with antibodies to calbindin, calretinin and parvalbu-min from each block of tissue. Sections (50 � m thick) used for the Nissl series were mounted on 0.5% gelatin-coated glass slides, cleared in a solution of 1: 1 chloroform and absolute alcohol, then stained with 1% cresyl violet. Sections for the myelin series were stored in 5% formalin at 4 ° C for 2 weeks, mounted on 1% gelatin-coated slides and stained with a modified silver method [Gallyas, 1978]. For immunohistochemical staining, the sections were first treated for 30 min with an endogenous peroxidase inhibitor (49.2% methanol: 49.2% 0.1 M PB: 1.6% of 30% H 2 O 2 ) followed by
Fig. 2. Drawing of the dorsal view of the African elephant brain showing the approximate location and size of the tissue blocks taken for use in the current study.

Maseko /Jacobs /Spocter /Sherwood /Hof /Manger
Brain Behav Evol4
three 10-min rinses in 0.1 M PB. This was followed by a 2-hour pre-incubation at room temperature, in a solution (blockingbuffer) containing 3% normal goat serum (Chemicon), 2% bovine serum albumin (Sigma) and 0.25% Triton X-100 (Merck) in 0.1 M PB. The sections were then placed in a primary antibody solution containing the appropriately diluted antibody in blocking buffer for 48 h at 4 ° C. To reveal calbindin immunoreactivity (CB+) we used anti-calbindin antibody (CB-300, SWANT, raised in rabbit) at a dilution of 1: 10,000. To reveal calretinin immunoreactivity (CR+), we used anti-calretinin antibody (7699/4, SWANT, raised in rabbit) at a dilution of 1: 10,000. To reveal parvalbumin immu-noreactivity (PV+), we used anti-parvalbumin antibody (PV-28, SWANT, raised in rabbit) at a dilution of 1: 20,000. This step was followed by three 10-min rinses in 0.1 M PB, after which the sec-tions were incubated in a secondary antibody for 2 h. The second-ary antibody solution contained a 1: 1,000 dilution of biotinylated anti-rabbit IgG (BA-100 Vector) in blocking buffer containing 3% normal goat serum and 2% bovine serum albumin in 0.1 M PB. After three 10-min rinses in 0.1 M PB, the sections were incubated for 1 h in AB solution (Vector Labs) and rinsed again. The sections were then treated in a solution of 0.05% 3,3 � -diaminobenzidine in 0.1 M PB for 5 min, following which 3 � l of 30% H 2 O 2 was added to each 1 ml of solution in which each section was immersed. De-velopment was monitored visually under a low-power stereomi-croscope and allowed to continue until the background staining was at a level at which it could assist reconstruction without ob-scuring the immunoreactive structures. To arrest development, sections were placed in 0.1 M PB, and then rinsed twice more in the same solution. Sections were mounted on glass slides coated with 0.5% gelatin and left to dry overnight. They were then dehy-drated in a graded series of alcohols, cleared in xylene and cover-slipped with Depex. The observed immunostaining patterns sup-port the specificity of the antibody for the antigens in the African elephant as they are compatible with observations made in other species [Rogers, 1989; Celio, 1990; Résibois and Rogers, 1992; For-
tin et al., 1998; Ashwell et al., 2007; Kalinichenko and Pushchin, 2008]. It was not feasible to undertake Western blot control testing in the elephant materials.
Quantification of Neuron Density Utilizing a design-based stereologic approach, the density of
total neurons from a series of Nissl-stained sections was estimat-ed. For quantification, three sections spaced 400 � m apart were used. Within each region of interest, the molecular layer, the Pur-kinje cell layer and granule cell layer were outlined from two folia in StereoInvestigator software (MBF Bioscience) using a 2.5 ! ob-jective. The optical dissector combined with fractionator sam-pling was used [Mouton, 2002] to obtain estimates of neuronal density following the methods of Sherwood et al. [2007]. Neuro-nal counts were performed using a 63 ! oil-immersion objective when the nucleolus was encountered within the permitted bound-aries of the dissector frame. A pilot study determined the optimal sampling parameters and grid dimensions to place dissector frames (65 ! 65 ! 4 � m) in a systematic-random manner. Counting frames and sampling grid sizes were optimized to achieve a mean coefficient of error of 10% or less [Gundersen and Jensen, 1987], while a guard distance of 1 � m was used during neuron counting to avoid introduction of errors due to sectioning artifacts [West et al., 1991] ( table 1 ).
The stereologic analyses resulted in sampling an average of 177 counting frames per region for each neuron type, with a total of 5,665 counting frames investigated and a total of 3,860 neurons sampled. We categorized each neuron that fell within the optical dissectors according to its morphological type (i.e. Purkinje, Lugaro, Golgi, stellate, basket or unipolar brush). Following a pre-vious study of the cellular composition of the cerebellar cortex in humans [Whitney et al., 2009], we defined the upper 2/3 of the molecular layer as the location of stellate cells and the lower 1/3 as the region containing basket cells. This was consistent with the distribution of calretinin immunoreactive basket cells that we ob-
Table 1. S tereological parameters used for counting in the different cerebellar cortical regions in the African elephant
Cerebellar region
Layer Counting frame size �m
Vertical guard zones (top and bottom), �m
Cut thick- ness, �m
Average mounted thickness, �m
Corrected section thickness, �m
Sampling sites, n
Average coefficient of error
AH Upper molecular 65!65 4 50 7.1 28.2 282 0.12 AH Lower molecular 65!65 4 50 7.6 26.3 206 0.11 AH Purkinje 65!65 4 50 8.4 23.8 255 0.09 AV Upper molecular 65!65 4 50 7.1 28.2 190 0.11 AV Lower molecular 65!65 4 50 6.8 29.4 163 0.12 AV Purkinje 65!65 4 50 7.9 25.3 230 0.09 PH Upper molecular 65!65 4 50 7.6 26.3 236 0.10 PH Lower molecular 65!65 4 50 8.7 23.0 197 0.11 PH Purkinje 65!65 4 50 8.9 22.5 235 0.08 PV Upper molecular 65!65 4 50 8.4 23.8 216 0.11 PV Lower molecular 65!65 4 50 8.6 23.2 161 0.12 PV Purkinje 65!65 4 50 9.6 20.8 205 0.09
A H = Anterior cerebellar hemisphere; AV = anterior cerebellar vermis; PH = posterior cerebellar hemisphere; PV = posterior cer-ebellar vermis.

Elephant Cerebellar Cortex Brain Behav Evol 5
served in the lower portion of the molecular layer in elephant sec-tions. We did not attempt to estimate the density of granule cells. In addition, the volume of the neuron types was estimated using the optical rotator technique, with four sampling rays.
Results
The African elephant possesses three cell layers as is typical of other mammals and as reported previously for the elephant [for review see Cozzi et al., 2001]. The layers include the outermost molecular layer, in which the in-
hibitory interneurons classified as basket cells and stel-late cells were located, the Purkinje cell layer with large cell bodies forming a lamina of a single cell’s width, un-derneath which a cell-sparse lamina was observed, and the innermost granule cell layer that contained densely packed granule cells, Golgi type II cells, Lugaro cells and unipolar brush cells ( fig. 3 ).
The Molecular Layer This outermost layer contained stellate cells and bas-
ket cells ( fig. 3–5 ). The stellate cells, as previously ob-
a b
c d
Nissl parvalbumin
calbindin calretinin
Fig. 3. Low-power photomicrographs of stained sections through the African ele-phant cerebellar cortex showing the vari-ous layers and neuronal elements revealed with the immunohistochemical stains. a Nissl stain. b Parvalbumin immuno-staining. c Calbindin immunostaining. d Calretinin immunostaining. Scale bar = 500 � m and applies to all.

Maseko /Jacobs /Spocter /Sherwood /Hof /Manger
Brain Behav Evol6
served to be typical for mammalian cerebellar cortices [Whitney et al., 2009], were in the upper two-thirds of the molecular layer, while the basket cells were found in the lower third of the molecular layer. Horizontally oriented PV+ fibers were abundant in the lower half of the mo-lecular layer, in the region of the secondary and tertiary branches of the Purkinje cells, and less abundant in the upper half of this layer ( fig. 3 ). These fibers most likely represent the parallel fibers that emerge from granule cells. CB+ boutons were observed through the full depth of the molecular layer and appeared to be lying adjacent to the dendritic spines of the Purkinje cells ( fig. 6 ). CR+ axons and boutons, which we presume to be the climbing fibers, were observed to outline the extensive dendritic arborizations of the Purkinje cells through to the upper parts of the molecular layer along the entire extent of the Purkinje cell dendrites ( fig. 3 ).
Stellate Cells Similar to other mammals, the somata of the stellate
cells in elephants resemble the shape of a star ( fig. 4 ). From the soma, several long, tortuous, extensively branching dendrites radiate to provide the soma with its particular shape ( fig. 4 ). The primary dendrites appear to extend in all directions. The dendrites were observed to bifurcate between two and five times along their length, and while no clear dendritic spines were evident, small varicosities in the dendrites may represent regions where synaptic contacts are made. The stellate cells were observed to be PV+ and CB+ throughout the cytoplasm of the soma and in the thicker parts of the primary and secondary den-dritic branches. Our quantitative analysis of the Golgi-stained materials revealed that the stellate cells had an av-erage soma profile area of 183.49 � m 2 (the smallest of the cells analyzed using the Golgi stain), an average total den-
a b
c d
e f
Fig. 4. Images demonstrating the mor-phology of the stellate cells observed in the upper portions of the molecular layer of the African elephant cerebellar cortex. a Neurolucida tracing of a stellate cell. Scale bar = 100 � m. b Photomicrographof calbindin-immunostained stellate cell. Scale bar = 100 � m. c–e Photomicro-graphs of Golgi-stained stellate cells. Mag-nification ! 20 ( c , d ), ! 10 ( e ). f Photomi-crograph of Golgi-stained parallel fibers in the upper portions of the molecular layer. Magnification ! 40.

Elephant Cerebellar Cortex Brain Behav Evol 7
dritic length of 5,515.40 � m and a tortuosity index of 1.18 ( table 2 ). Stereological analysis of the Nissl-stained mate-rial revealed that the average somal volume of the stellate cells ranged between 356 and 450 � m 3 in the different re-gions examined, and showed that the stellate cell somata from the posterior hemisphere and vermis were signifi-cantly larger than the somata observed in the blocks of tissue from the anterior hemisphere and vermis (Mann-Whitney U test, p same = 0.0004; table 3 ). The posterior hemisphere and vermis also had higher stellate cell densi-ties (up to 6,857 cells/mm 3 ) than the anterior hemisphere and vermis (as low as 4,245 cells/mm 3 ; table 3 ). Despite this marked trend towards greater cell densities in the poste-rior regions of the cerebellum, non-parametric signifi-cance testing was unable to detect significant differences in stellate cell densities, likely a result of the small sample sizes (Mann-Whitney U test, z 3 = –1.59, p same = 0.25).
Basket Cells Basket cells were located within the lower third of the
molecular layer, with the soma and primary and second-
ary dendritic branches being PV+ and CB+, but were less intensely stained than the stellate cells ( fig. 3 , 5 ). Some of these neurons were located between the superficial as-pects of the Purkinje cell bodies and primary dendrites that intrude into the molecular layer. The somata of the basket cells had a somewhat foreshortened fusiform shape with the longest plane of the cell oriented in a hor-izontal direction. Three to four primary dendrites were observed to emerge from the horizontal edges of the cell body and extended in the horizontal plane, branching be-tween two and three times ( fig. 5 ). From these primary dendrites, several secondary dendritic branches ramified and extended superficially through the entire molecular layer to the surface of the cerebellar cortex. Clear den-dritic spines were not observed on the basket cells; how-ever, as with the stellate cells, small varicosities were ob-served, potentially representing regions where synaptic contacts could be made ( fig. 5 ).
Quantitative analysis of the Golgi-stained materials showed that the average somal profile area of the basket cells (444.55 � m 2 ) was over twice as large as the stellate
Table 2. A verage soma areas, total dendritic lengths and dendritic tortuosity based on the analysis of the Golgi-stained materials in the African elephant cerebellar cortex
Neuron type n Average soma area �m2 8 SD
Average total dendritic length, �m 8 SD
Average dendritic tortuosity 8 SD
Stellate 5 183.49847.61 5,515.4081,562.77 1.1880.03 Basket 5 444.558189.07 6,345.7882,415.67 1.1680.05 Golgi 5 736.318132.01 5,664.208878.91 1.1980.02 Lugaro 5 1,353.578394.78 3,019.148883.97 1.1280.05
Table 3. C ell densities and soma volumes in the four regions examined stereologically for Nissl-stained materials in the African ele-phant cerebellar cortex
Region Average cellular number/mm3 8 SD A verage somal volume, �m3 8 SD
AH AV PH PV AH AV PH PV
Neuron type Stellate 4,52981,290 4,245850 6,32681,126 6,85780.76 3568151 3708111 4508114 4268141 Basket 4,6728108 4,0488150 5,38382,244 5,31081,672 7358266 7378112 7648111 7188168 Purkinje 6,27683,270 5,8948585 8,33683,110 8,81282,961 8,18682,744 8,9038150 8,631857 8,31181,728 Golgi 4980.15 47833 44831 54838 2,0478818 2,939858 1,816851 2,0428582 Lugaro 26885 18874 20853 17828 15,9308638 17,410873 18,620887 15,5308582 Unipolar brush 180.84 180.42 281.17 281.13 – – – 2,238
AH = Anterior cerebellar hemisphere; AV = anterior cerebellar vermis; PH = posterior cerebellar hemisphere; PV = posterior cerebellar vermis.

Maseko /Jacobs /Spocter /Sherwood /Hof /Manger
Brain Behav Evol8
cell ( table 2 ). This two-fold difference in size was con-firmed in the stereologic analysis of cell volume, where basket cells had average volumes ranging between 718 and 764 � m 3 in the various blocks of tissue examined ( table 3 ); however, unlike stellate cells, there was no clear difference in average cell volumes in the different regions of the cerebellar cortex studied (Mann-Whitney U test, p same = 0.3257). This distinct size difference allowed the laminar differentiation of the basket cells from the stel-late cells. The Golgi-stained basket cells had an average total dendritic length of 6,345.78 � m and an average den-dritic tortuosity of 1.16, having a greater dendritic length but less branching and bending than the stellate cells studied ( table 2 ). Stereologic analysis revealed an average cell density ranging from 4,048 to 5,383 cells/mm 2 de-pending on the region and, as seen for the stellate cells, the density of basket cells in the posterior hemisphere and
vermis were higher than in the anterior hemisphere and vermis ( table 3 ); however, we were unable to detect any significant differences in basket cell densities between the anterior and posterior regions of the cerebellum, a result which would likely approach significance with greater sample sizes (Mann-Whitney U test, z 3 = –1.16, p same = 0.25).
The Purkinje Cell Layer The Purkinje cell layer consisted of one layer of Pur-
kinje cells that were arranged adjacent to each other ( fig. 3 , 6 ). In the spaces between the large cell bodies of the Purkinje cells, we noted intense parvalbumin immu-noreactivity of what appear to be axons outlining the Purkinje cell body ( fig. 6 ). These PV+ axons were seen to pass around the Purkinje cell bodies and appeared to form the typical T-shaped branches of the parallel fibers
a b
c d
e f
Fig. 5. Images demonstrating the mor-phology of the basket cells observed in the lower portions of the molecular layer of the African elephant cerebellar cortex. a Pho-tomicrograph of calbindin-immuno-stained basket cell. Scale bar = 100 � m. b Neurolucida tracing of a basket cell. Scale bar = 100 � m. c–f Photomicrographs of Golgi-stained basket cells. Magnifica-tion ! 20 ( c ), ! 10 ( d–f ).
Elephant Cerebellar Cortex Brain Behav Evol 9
arising from the granule cells in the molecular layer of the cerebellar cortex. CR+ axons, the climbing fibers, were also seen to outline the somata of the Purkinje cells ( fig. 6 ). Beneath the monolayer of the Purkinje cells, a dis-tinct cell sparse region was observed, separating the Pur-kinje cells from the granule cells. Within this cell-sparse lamina, many horizontally oriented PV+ axons were present, as well as distinct bundles of CB+ axons ( fig. 3 ).
Purkinje Cells The somata of the Purkinje cells exhibited the typical
piriform shape with extensive fan-shaped branching of the dendrites in the molecular layer ( fig. 6 ). Stereologic analysis revealed that the volume of the somata of the Purkinje cells averaged between 8,186 and 8,903 � m 3 across the regions ( table 3 ), with no significant regional differences (Mann-Whitney U test, p same = 0.7256). From
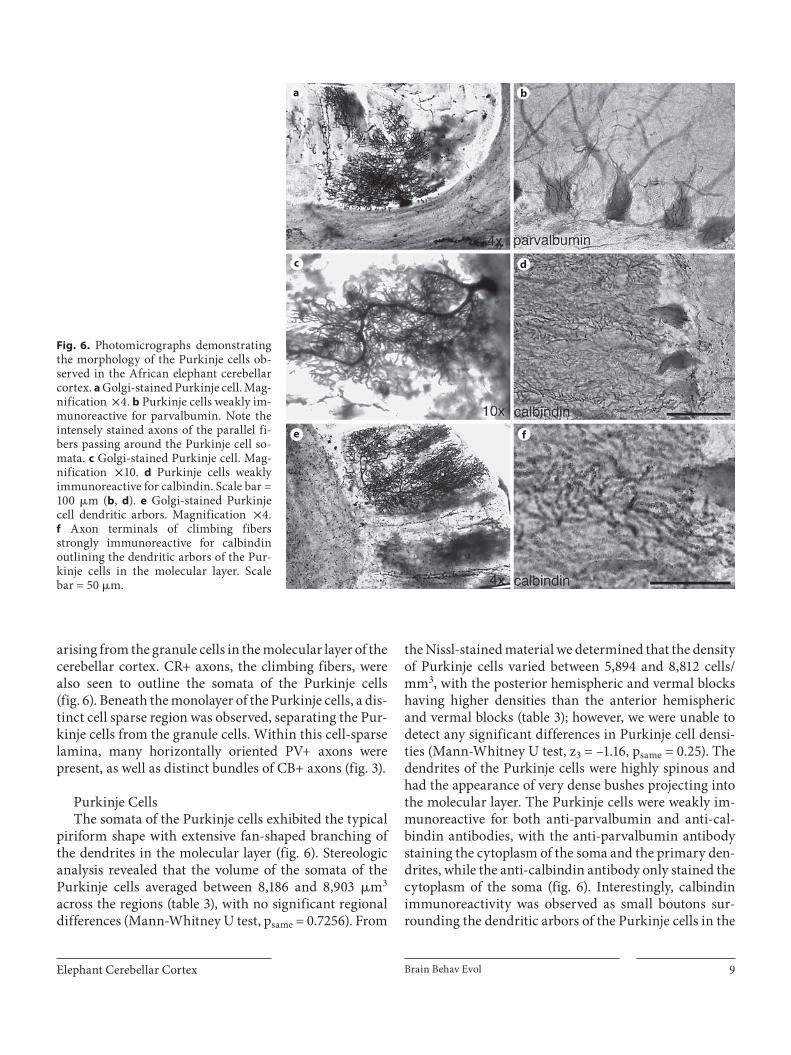
the Nissl-stained material we determined that the density of Purkinje cells varied between 5,894 and 8,812 cells/mm 3 , with the posterior hemispheric and vermal blocks having higher densities than the anterior hemispheric and vermal blocks ( table 3 ); however, we were unable to detect any significant differences in Purkinje cell densi-ties (Mann-Whitney U test, z 3 = –1.16, p same = 0.25). The dendrites of the Purkinje cells were highly spinous and had the appearance of very dense bushes projecting into the molecular layer. The Purkinje cells were weakly im-munoreactive for both anti-parvalbumin and anti-cal-bindin antibodies, with the anti-parvalbumin antibody staining the cytoplasm of the soma and the primary den-drites, while the anti-calbindin antibody only stained the cytoplasm of the soma ( fig. 6 ). Interestingly, calbindin immunoreactivity was observed as small boutons sur-rounding the dendritic arbors of the Purkinje cells in the
a b
c d
e f
Fig. 6. Photomicrographs demonstrating the morphology of the Purkinje cells ob-served in the African elephant cerebellar cortex. a Golgi-stained Purkinje cell. Mag-nification ! 4. b Purkinje cells weakly im-munoreactive for parvalbumin. Note the intensely stained axons of the parallel fi-bers passing around the Purkinje cell so-mata. c Golgi-stained Purkinje cell. Mag-nification ! 10. d Purkinje cells weakly immunoreactive for calbindin. Scale bar = 100 � m ( b , d ). e Golgi-stained Purkinje cell dendritic arbors. Magnification ! 4. f Axon terminals of climbing fibersstrongly immunoreactive for calbindin outlining the dendritic arbors of the Pur-kinje cells in the molecular layer. Scalebar = 50 � m.

Maseko /Jacobs /Spocter /Sherwood /Hof /Manger
Brain Behav Evol10
molecular layer. These boutons, presumably axonal ter-minals of climbing fibers, appear to have an almost one to one correspondence with the dendritic spines of the Purkinje cells and form clear outlines of the Purkinje cell dendrites ( fig. 6 ).
The Granule Cell Layer The granule cell layer formed the innermost layer of
the cerebellar cortex and was observed to contain four cell types: the granule cells, Lugaro cells, Golgi type II cells and unipolar brush cells ( fig. 3 ). This layer was the most cell-dense of the cortical layers, mainly due to the granule cells which, although relatively small in soma volume, are the most numerous of the cells and account for approximately half the cells in the entire mammalian central nervous system [Ito, 2006]. Thin PV+ axons were observed traversing the granule cell layer, presumably arising from the granule cells and extending into the Pur-kinje cell layer, or descending from the Purkinje cells on their path to the deep cerebellar nuclei ( fig. 3 ). CB+ axons were also observed to cross through the granule cell layer and these are also likely to be descending axons arising from the Purkinje cells ( fig. 3 ).
Granule Cells Granule cells were very numerous, exhibited a high
density and had relatively small soma sizes, which ap-
peared spherical in shape ( fig. 3 ). No granule cells were stained with the Golgi technique and, while the parallel fibers that presumably emerge from these cells were ob-served to be PV+ ( fig. 3 , 4 ), the somata of the granule cells did not evince any immunoreactivity for parvalbumin, calbindin or calretinin. We did not undertake any stereo-logic assessment of the size or density of the granule cells; however, a previous report [Lange, 1975] indicated that there were approximately 807 granule cells per 0.001 mm 3 , or to make the comparison to the values deter-mined for other cells in the current study, there would be approximately 807,000 granule cells per mm 3 in the ele-phant cerebellar cortex – more than 2 orders of magni-tude greater than that observed for the other neurons for which cell density was estimated.
Golgi Type II Cells Golgi type II cells were observed within the upper half
of the granule cell layer and were weakly immunoreactive for calbindin. They were readily distinguishable from other neurons in the same layer on the basis of having a much larger soma size than the surrounding granule cells and much smaller soma than the Lugaro neurons ( fig. 3 , 7 ). The somata of the Golgi type II cells were observed to be elongated and spherical in shape and Golgi-stained material indicated that they had an average soma profile area of 736.31 � m 2 ( table 2 ), while our stereologic inves-
a b
c d
Fig. 7. Images demonstrating the mor-phology of the Golgi cells observed in the granule cell layer of the African elephant cerebellar cortex. a Photomicrograph of weakly calretinin-immunostained Golgi cell. Scale bar = 100 � m. b Neurolucida tracing of a Golgi cell. Scale bar = 100 � m. c , d Photomicrographs of Golgi-stained Golgi cells. Magnification ! 10 ( c ), ! 20 ( d ).
Elephant Cerebellar Cortex Brain Behav Evol 11
tigation indicate average soma volumes of between 1,816 and 2,939 � m 3 in the various regions investigated ( ta-ble 3 ). Between 4 and 7 thick dendrites were observed to emerge from the elongated edges of the soma, but the thickness of these dendrites tapered rapidly within 50 � m of the soma and became relatively thin ( fig. 7 ). The dendrites branched extensively and, while the full den-dritic field showed a slight trend towards a preferred ori-entation in the horizontal plane, this was not marked. Our analysis of the Golgi-stained material provided an average dendritic length of 5,664.2 � m and an average dendritic tortuosity of 1.19 ( table 2 ). The Golgi type II cells thus had the most complex arrangement of dendrit-ic arbors among all the cells analyzed with the Golgi method in the current study. Our stereologic analysis of the Golgi type II cells indicated that they were not very numerous compared to the other cell types and had den-sities ranging between 44 and 54 cells/mm 3 and no sig-nificant variation among cerebellar cortical regions ( ta-ble 3 ; Mann-Whitney U test, z 3 = 0.39, p same = 0.70)
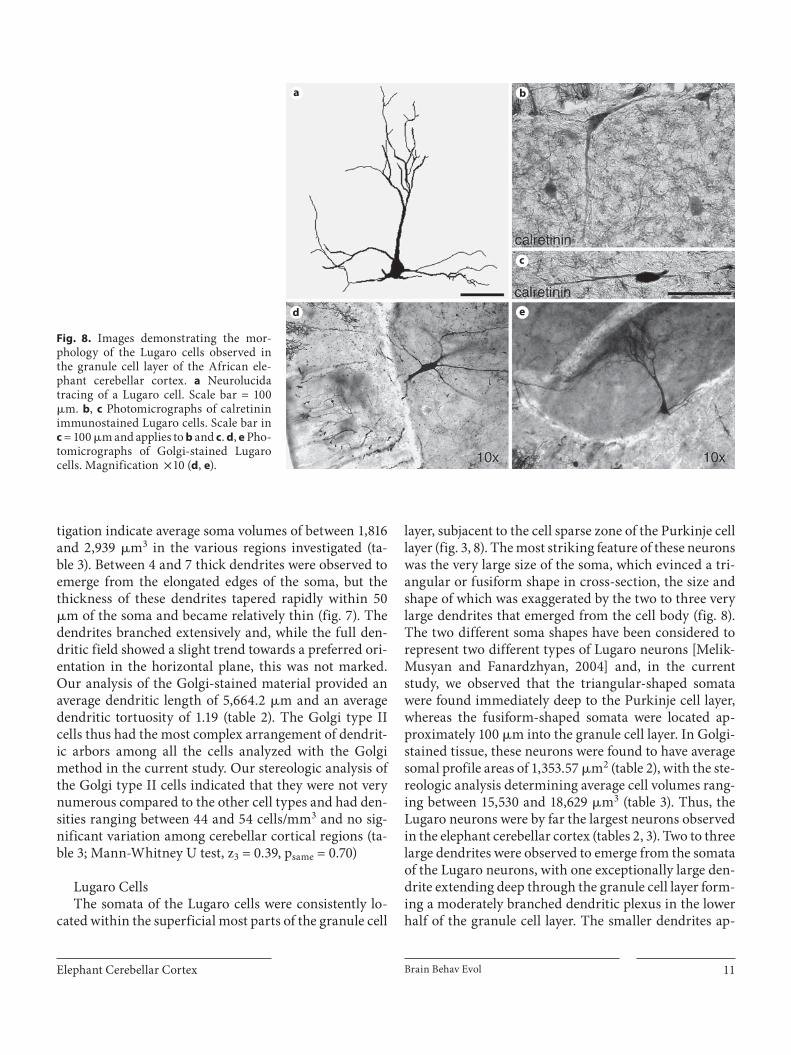
Lugaro Cells The somata of the Lugaro cells were consistently lo-
cated within the superficial most parts of the granule cell
layer, subjacent to the cell sparse zone of the Purkinje cell layer ( fig. 3 , 8 ). The most striking feature of these neurons was the very large size of the soma, which evinced a tri-angular or fusiform shape in cross-section, the size and shape of which was exaggerated by the two to three very large dendrites that emerged from the cell body ( fig. 8 ). The two different soma shapes have been considered to represent two different types of Lugaro neurons [Melik-Musyan and Fanardzhyan, 2004] and, in the current study, we observed that the triangular-shaped somata were found immediately deep to the Purkinje cell layer, whereas the fusiform-shaped somata were located ap-proximately 100 � m into the granule cell layer. In Golgi-stained tissue, these neurons were found to have average somal profile areas of 1,353.57 � m 2 ( table 2 ), with the ste-reologic analysis determining average cell volumes rang-ing between 15,530 and 18,629 � m 3 ( table 3 ). Thus, the Lugaro neurons were by far the largest neurons observed in the elephant cerebellar cortex ( tables 2 , 3 ). Two to three large dendrites were observed to emerge from the somata of the Lugaro neurons, with one exceptionally large den-drite extending deep through the granule cell layer form-ing a moderately branched dendritic plexus in the lower half of the granule cell layer. The smaller dendrites ap-
a b
c
d e
Fig. 8. Images demonstrating the mor-phology of the Lugaro cells observed inthe granule cell layer of the African ele-phant cerebellar cortex. a Neurolucida tracing of a Lugaro cell. Scale bar = 100 � m. b , c Photomicrographs of calretinin immuno stained Lugaro cells. Scale bar in c = 100 � m and applies to b and c . d , e Pho-tomicrographs of Golgi-stained Lugaro cells. Magnification ! 10 ( d , e ).

Maseko /Jacobs /Spocter /Sherwood /Hof /Manger
Brain Behav Evol12
peared to be more horizontally oriented, arborizing mostly within the cell-sparse sublayer of the Purkinje cell layer. Golgi-stained material revealed an average dendrit-ic length of 3,019.14 � m and an average dendritic tortuos-ity of 1.12 ( table 2 ); thus, although the somata of these neurons were large, the extent of the dendritic arboriza-tion and its complexity were among the lowest of those analyzed in the current study. It should be noted here that these dendritic measures probably greatly underestimate the extent of the Lugaro dendritic system; due to the fact that these cells were so large, it is likely that the complete dendritic system was not contained within the 120- � m-thick sections [see Jacobs et al., 1997]. The soma and pri-mary dendrites of the Lugaro neurons were immunoreac-tive for the calretinin antibody ( fig. 8 ). Stereologic analy-sis of the Nissl-stained materials revealed that the density of these neurons was not high, ranging between 17 and 26 neurons/mm 3 in the different regions of the elephant cerebellar cortex and showed no significant regional vari-ation ( table 3 ; Mann-Whitney U test, z 3 = –0.39, p same = 0.70).
Unipolar Brush Cells Only a small number of unipolar brush cells were ob-
served in the current study, and they evinced the mor-phology typical of these neurons as described in other mammals, having small, oval somata (average soma vol-ume of 2,238 � m 2 ; table 3 ), with a single short dendrite leading to a small dendritic arbor. The stereologic inves-tigation revealed an average density of unipolar brush neurons of between 1 and 2 neurons/mm 3 ( table 3 ). No unipolar brush cells were stained in the Golgi materials and we failed to observe any of these neurons with im-munohistochemistry for the calcium-binding proteins.
Discussion
The current study contributes substantial qualitative and quantitative information to previous observations on the histological appearance of the cerebellar cortex of el-ephants [reviewed in Cozzi et al., 2001]. As elephants have the largest relative cerebellar size of all mammals studied to date [Maseko et al., 2012], it was of interest to deter-mine whether any associated changes in the microstruc-ture of the cerebellar cortex were apparent. In addition, elephants have one of the largest cerebella in absolute terms among mammals (averaging 924 ml). If one were to extrapolate from known cetacean cerebellar allometry [Maseko et al., 2012], the volume of the elephant cerebel-
lum is only exceeded by the predicted cerebellar volumes of the sperm whale, Physeter macrocephalus (brainmass = 7,818 g, predicted cerebellar volume = 1,140ml), the fin whale, Balaenoptera physalis (brain mass = 7,111.43 g, predicted cerebellar volume = 1,037 ml) and the humpback whale, Megaptera novaeangliae (brain mass = 6,439 g, predicted cerebellar volume = 938 ml) [brain mass data from Manger, 2006].
We found that the elephant cerebellar cortex exhibited a range of features that are typical among mammals in terms of both the laminar and cellular organization. The three-layered cerebellar cortex observed in the elephant is common to all mammals, and indeed the vast majority of vertebrates [Palay and Chan-Palay, 1974]. Moreover, the neuronal types and their general morphology (stellate cells, basket cells, Purkinje cells, granule cells, Golgi type II cells, Lugaro neurons and unipolar brush neurons) are also typical, with no novel neuronal types being observed in the African elephant, although we did not identify any neurons that could be considered candelabrum neurons [Lainé and Axelrad, 1994]. The apparent circuitry (paral-lel fibers, climbing fibers and mossy fibers) and neuro-chemistry of some aspects of the cell types and circuitry also reveal a phenotype that did not show any majordeparture compared to previous observations in other mammals.
Certain differences from other species were noted, and these are of interest to discuss in more detail. These include such features as the size and morphology of the individual neurons examined under Golgi staining, espe-cially the Lugaro neurons, the overall densities of the neurons in the cerebellar cortex and the variance related to the patterns of staining for the calcium-binding pro-teins examined. These are detailed here, compared with data obtained across other mammalian species, and then contextualized in terms of the functional aspects of the relative and absolute size of the elephant cerebellum.
Neuronal Morphology as Revealed with Golgi Impregnations and Immunostaining As mentioned above, the general morphology of the
neurons stained with both the Golgi and immunohisto-chemical methods revealed that for the most part, the identity of neurons could be readily assessed and the neu-rons assigned to a particular type as described previously for the mammalian cerebellar cortex. Notably, the Luga-ro neurons of elephants have a particularly large size, with an average volume of approximately 17,000 � m 3 ( ta-ble 3 ). This specific enlargement in size of the Lugaro neurons, as compared to other neurons within the cere-

Elephant Cerebellar Cortex Brain Behav Evol 13
bellar cortex, especially the functionally similar Golgi type II neurons, has not been reported in other mamma-lian species studied, including laboratory rat [Rogers, 1989; Celio, 1990; Résibois and Rogers, 1992], squirrel monkey [Fortin et al., 1998], cat [Melik-Musyan and Fa-nardzhyan, 2004], echidna [Ashwell et al., 2007], and bot-tlenose dolphin and harbor porpoise [Kalinichenko and Pushchin, 2008]. Melik-Musyan and Fanardzhyan [2004] propose that the Lugaro neurons should be considered as a distinct neuronal type, rather than being grouped with the Golgi type II neurons, and the current observations in the African elephant support this notion due to the specific enlargement of the Lugaro neurons. While the exact function of the Lugaro neurons in cerebellar corti-cal circuitry remains elusive, it appears that they play an important role in the mechanism of long-term depression of neuronal activity [Melik-Musyan and Fanardzhyan, 2004].
Although the cerebellum has been widely studied, particularly in terms of gross anatomy, neuronal types and their connectivity, little is known regarding the quantitative and qualitative aspects of neuronal variation across species. The analysis of the Golgi-stained material in the current study has provided quantitative informa-tion related to specific neuronal morphologies in one of the largest cerebella of all mammals. Unfortunately, sim-ilar comparative data have not yet been published, but our unpublished observations on a range of different mam-malian species [e.g. Wahl et al., 2012] suggests that scal-ing occurs, in terms of neuronal size and dendritic com-plexity, with larger cerebella having larger neurons and greater dendritic complexity. Lange [1975] has already in-dicated that for certain cell types in the cerebellar cortex the species with larger cerebella have neurons with larger somata, and our results concur with these findings. In addition to this, our ongoing, unpublished studies on manatees, giraffes, humpback whales, Siberian tigers, clouded leopards, chimpanzees and humans indicate that the dendritic complexity of neurons increases in associa-tion with absolutely larger cerebellum size. This greater dendritic complexity in the species with larger cerebella would allow the neurons to receive information from a wider source of inputs, thus increasing the information available to the neuron prior to the cellular activity pro-ducing an action potential. The larger neurons may also possess larger and more ramifying axons, allowing the neurons to exert a broader influence within the circuit by making more contacts (with individual cells and/or ag-gregations of cells). This increase in dendritic complexity appears to be related to allometric scaling concomitant
with absolute cerebellar size; thus, it would appear that due to scaling the larger brained mammals would have more complex cerebellar circuitry, potentially allowing for greater control over the force, extent and duration of muscular contractions. Such differences are apparent in the primate cerebral cortex, where neurons in the frontal or higher-order cortical areas show a greater dendritic complexity than those in primary or lower-order cortical areas [e.g. Jacobs et al., 2001; Elston et al., 2005a–c; Bian-chi et al., 2012], and this correlates well with the complex-ity of neuronal information processing in these different cortical regions. Across species, in homologous cortical areas, those species with the larger cerebral cortices have neurons that exhibit greater dendritic complexity [Elston et al., 2006]. This, as with our unpublished observations on cerebellar cortical neurons, appears to be related to al-lometric scaling, and will allow for more complex neuro-nal processing to occur, thereby providing a facility for the emergence of greater behavioral sophistication with-out the need to resort to adaptationist rationale.
Neuronal Densities in the Elephant Compared with Other Mammals Our stereologic assessment of neuronal densities in
the cerebellum of the African elephant provided data that can be directly compared with findings reported by Lange [1975]. In his comparative assessment of cellular density across a range of mammalian species, Lange [1975] demonstrated that cell density in the cerebellar cortex of the African elephant was lower than that found in the other, smaller brained species he examined. Lange reported a density of 7,810 Purkinje cells/mm 3 in the Af-rican elephant, which compares well with our results which ranged between 5,894 and 8,812 cells/mm 3 ; how-ever, his estimate of 28,880 cells/mm 3 in the molecular layer is approximately 3–4 times higher than we observed ( table 3 ). This difference is likely to be a methodological variance and indeed Lange [1975] mentions that due to the long period between death and fixation of the tissue used for the elephant, aquatic mammals and humans, that ‘it was not always possible to differentiate neurons from glial cells and pericytes in the molecular layer in these brains’. The better-preserved tissue used in the cur-rent study [Manger et al., 2009] leads us to believe that the current results are likely to be more accurate than those of Lange [1975]. Nevertheless, it would appear that the conclusions reached by Lange are valid, even if the exact quantification is somewhat imprecise.
Haug [1967] and Lange [1975] both consider that the elephant will have a greater volume fraction of neuropil

Maseko /Jacobs /Spocter /Sherwood /Hof /Manger
Brain Behav Evol14
in the cerebellar cortex than the smaller brained mam-mals. This observation dovetails nicely with our observa-tions of greater dendritic complexity of individual neu-rons when examined with Golgi staining (see above); however, due to changes in glia:neuron ratios (larger brains have more glia per neuron) [Sherwood et al., 2006], this is not an exact fit. Therefore, the increased numbers of glia must be taken into account when theorizing on the potential advantages that having a greater volume frac-tion of neuropil will afford the processing of neural in-formation. Despite this caveat, the stereologic assessment provides additional supporting data indicating that the elephant has a greater volume of a more complex cerebel-lar cortex to control and coordinate movement compared to many other mammalian species.
Variations in Calcium-Binding Protein Expression in Mammalian Cerebellar Cortex As with other aspects of the elephant cerebellum, the
expression of the calcium-binding proteins (parvalbu-min, calbindin and calretinin) exhibited a mixture of patterns similar to those seen in other mammals, and which contrasted with some other mammals. A short survey of the expression of the three calcium-binding proteins in five mammalian species is provided in table 4 : bottlenose dolphin and harbor porpoise [Kalinichenko and Pushchin, 2008], echidna [Ashwell et al., 2007],
squirrel monkey [Fortin et al., 1998] and laboratory rat [Rogers, 1989; Celio, 1990; Résibois and Rogers, 1992]. The presence of parvalbumin in stellate and basket cells is a feature common to the eutherian mammals surveyed, while parvalbumin is present in the Purkinje cells of all eutherian mammals plus the prototherian echidna. The presence of calbindin in the Purkinje cells of all mammal species surveyed is also a common feature; however, it is at this point that the commonalities end.
In contrast to the other mammals surveyed, the ele-phant is unique in showing parvalbumin expression in the parallel fibers and calbindin expression in the stellate and basket cells. The remaining structures in which the calcium binding proteins were expressed showed a great deal of variance among the species surveyed. Parvalbu-min acts as a slow buffer of calcium dynamics; calbindin shows a similar, but somewhat faster buffering action of calcium dynamics while calretinin appears to act moreas a calcium modulator, showing dual kinetic properties, rather than acting as a buffer [Billing-Marczak and Kuznicki, 1999; Schmidt et al., 2003; Barinka and Druga, 2010]. These calcium transients provide short-lived and highly compartmentalized signals within the dendrites and spines of the neurons in which they are present. Thus, the differential expression pattern of the calcium-bind-ing proteins may alter the action of the neurons forming the cerebellar cortical circuit. In the case of the elephant,
Table 4. C omparative summary of the distribution of calcium-binding protein immunoreactivity in the various structures of the cer-ebellar cortex across a small sample of mammalian species previously studied
Species: Elephant1 Cetaceans2 Echidna3 Squirrel monkey4 L aboratory rat 5
Structure: PV CB CR PV CB CR PV CB CR PV CB CR PV CB CR
Stellate cells +++ +++ – +++ – – – – + +++ – – +++ – – Basket cells ++ ++ – +++ – – – – – +++ – – ++ – – Parallel fibers +++ – – – ? – – – – – – +++ – – +++ Climbing fibers – +++ +++ – ? +++ – ++ ++ ++ – – – – - Purkinje cells ++ ++ – +/– +++ – +++ +/– – +++/– +++ ++/– +++ +++ - Granule cells – – – – – +++ – – – – – +++ – – +++ Mossy fibers – – – – – ++ – – – +++ – +++ – – ++ Golgi type II cells – ++ – +++ ++ – – – – +++ +++ +++ – – ++ Lugaro neurons – – ++ – – – – – – – – +++ – – + Unipolar brush neurons – – – – – +++ – – – – – +++ – – ?
Sym bols provide a qualitative impression of staining intensity, – indicates no staining, +/– indicates a mixture of positive and neg-ative staining in the same individual. PV = Parvalbumin; CB = calbindin; CR = calretinin.
1 This study. 2 Kalinichenko and Pushchin, 2008, bottlenose dolphin and harbor porpoise. 3 Ashwell et al., 2007. 4 Fortin et al., 1998. 5 Rogers, 1989; Celio, 1990; Résibois and Rogers, 1992.

Elephant Cerebellar Cortex Brain Behav Evol 15
the presence of calbindin in the stellate and basket cells may increase their excitability, whereas the presence of parvalbumin in the parallel fibers may depress repeated excitation. Although the exact effects the expressional complement of calcium-binding proteins may have on the cerebellar circuitry in the elephant or other mammals is unknown, the effects are likely to be significant. It would be of interest to undertake a broad comparative study of the expression of these proteins across mamma-lian species, both within and between orders, to deter-mine whether there is phylogenetic signal in their expres-sion within the circuitry (i.e., is the expression of these proteins similar in all rodents or all primates?), and if the differences between species provide some predictability of motor outcomes (i.e., do the differences between ro-dents and primates account for differences in order-typ-ical behavioral pattern expressions?). Further data on the expression of the calcium-binding proteins across arange of species, perhaps within the context of phyloge-netic analysis, may provide interesting insights into the common expression of motor patterns within closely re-lated species.
The Cerebellum and Life-History of the African Elephant Three aspects of central importance regarding the Af-
rican elephant cerebellum and how it relates to the life of these animals have emerged from the current and previ-ous [Maseko et al., 2012] studies: (1) the elephants have a very large cerebellum in absolute size; (2) they have the largest relative cerebellar size of all mammals examined to date, and (3) the cerebellar cortical circuitry of the el-ephant is likely to be more complex than in most other mammals. There are at least two aspects of sensorimotor coordination undertaken by the elephant where a large
cerebellum with unique circuitry may play a crucial role. The first is in control of the trunk, an unpaired append-age that, while only consisting of a few muscles is made up of over 100,000 distinct muscle bundles [Endo et al., 2001], requires extensive learning to use effectively for environmental manipulation [Lee and Moss, 1999], is used in coordination with the eyes [Pettigrew et al., 2010] and is used for social interaction [Lee and Moss, 1999]. The second is in the control and production of infrason-ic vocalizations [e.g. Garstang, 2004], for which current thinking suggests that control of the laryngeal region is of importance [Herbst et al., 2012]. These two central as-pects of the behavioral biology of elephants would clear-ly benefit from evolutionary modifications of the cere-bellum to support sophisticated output for motor con-trol.
One question of importance that cannot be addressed here regards the evolution of the elephant cerebellum. The absolute size of the elephant cerebellum can, for the most part, be explained by allometric scaling regularities that operate across mammals [e.g. Finlay and Darlington, 1995], but the increased relative size [Maseko et al., 2012] requires a different explanation. It would be of interest to track the evolution of cerebellar size in the Proboscid an-cestors of modern elephants to determine whether in-creased cerebellar volume appeared at a particular stage in their evolution. For example, did the relative size of the cerebellum increase when the trunk began to evolve,or when the capacity to create infrasonic vocalization evolved, or is the increased relative cerebellar size of the extant elephants an ancestral condition? Paleoneurologi-cal studies of the Proboscid brain may provide interesting and significant insights into the mechanisms and associ-ated somatic adaptations related to the evolution of abso-lute and relative cerebellar volumes.
References
Ashwell KW, Paxinos G, Watson CR (2007): Cyto- and chemoarchitecture of the cerebel-lum of the short-beaked echidna (Tachyglos-sus aculeatus) . Brain Behav Evol 70: 71–89.
Barinka F, Druga R (2010): Calretinin expression in the mammalian neocortex: a review. Physiol Rev 59: 665–677.
Bianchi S, Stimpson CD, Bauernfeind AL, Scha-piro SJ, Baze WB, McArthur MJ, Bronson E, Hopkins WD, Semendeferi K, Jacobs B, Hof PR, Sherwood CC (2012): Dendritic mor-phology of pyramidal neurons in the chim-panzee neocortex: regional specializations
and comparison to humans. Cereb Cortex, E-pub ahead of print.
Billing-Marczak K, Kuznicki J (1999): Calreti - nin – sensor or buffer – function still un-clear. Pol J Pharmacol 51: 173–178.
Celio MR (1990): Calbindin D-28k and parval-bumin in the rat nervous system. Neurosci-ence 35: 375–475.
Cozzi B, Spagnoli S, Bruno L (2001): An overview of the central nervous system of the elephant through a critical appraisal of the literature published in the XIX and XX centuries. Brain Res Bull 54: 219–227.
Dvergsten CL, Fosmire GJ, Ollerich DA, Sand-stead HH (1984): Alterations in the postnatal development of the cerebellar cortex due to zinc deficiency. II. Impaired maturation of Purkinje cells. Brain Res 318: 11–20.
Elston GN, Benavides-Piccione R, Elston A, De-Filipe J, Manger PR (2005a): Specialization in pyramidal cell structure in the cingulate cortex of the Chacma baboon ( Papio ursi-nus ): an intracellular injection study of the posterior and anterior cingulate gyrus with comparative notes on the macaque and ver-vet monkeys. Neurosci Lett 387: 130–135.

Maseko /Jacobs /Spocter /Sherwood /Hof /Manger
Brain Behav Evol16
Elston GN, Benavides-Piccione R, Elston A, De-Filipe J, Manger PR (2005b): Pyramidal cell specialization in the occipitotemporal cortex of the Chacma baboon (Papio ursinus) . Exp Brain Res 167: 496–503.
Elston GN, Benavides-Piccione R, Elston A, Manger PR, DeFilipe J (2005c): Specializa-tion in pyramidal structure in the sensory-motor cortex of the Chacma baboon (Papio ursinus) with comparative notes on macaque and vervet monkeys. Anat Rec A 286A:854–865.
Elston GN, Benavides-Piccione R, Elston A, Zeitsch B, DeFelipe J, Manger PR, Casa-grande V, Kaas JH (2006): Specializations of the granular prefrontal cortex of primates: implications for cognitive processing. Anat Rec A 288A:26–35.
Endo H, Hayashi Y, Komiya T, Narushima E, Sa-sako M (2001): Muscle architecture of the elongated nose in the Asian elephant (Ele-phas maximus) . J Vet Med Sci 63: 533–537.
Finlay BL, Darlington RB (1995): Linked regu-larities in the development and evolution of mammalian brains. Science 268: 1578–1584.
Fortin M, Marchand R, Parent A (1998): Calci-um-binding proteins in primate cerebellum. Neurosci Res 30: 155–168.
Foster RE, Peterson BE (1986): The inferior oli-vary complex of guinea pig: cytoarchitecture and cellular morphology. Brain Res Bull 17: 785–800.
Gallyas F (1979): Silver staining of myelin by means of physical development. Neurol Res 1:203–209.
Garstang M (2004): Long-distance, low-frequen-cy elephant communication. J Comp Physiol A Neuroethol Sens Neural Behav Physiol 190: 791–805.
Haug H (1967): Zytoarchitektonische Untersu-chungen an der Hirnrinde des Elefanten. Anat Anz Erg-H 120: 331–337.
Herbst CT, Stoeger AS, Frey R, Lohscheller J,Titze IR, Gumpenberger M, Fitch WT (2012): How low can you go? Physical production mechanism of elephant infrasonic vocaliza-tions. Science 337: 595–599.
Ito M (2006): Cerebellar circuitry as a neuronal machine. Prog Neurobiol 78:272–303.
Jacobs B, Driscoll L, Schall M (1997): Life-span dendritic and spine changes in areas 10 and 18 of human cortex: a quantitative Golgi study. J Comp Neurol 386: 661–680.
Jacobs B, Lubs J, Hannan M, Anderson K, Butti C, Sherwood C, Hof PR, Manger PR (2011): Neuronal morphology in the African ele-phant (Loxodonta africana) neocortex. Brain Struct Funct 215: 273–298.
Jacobs B, Schall M, Prather M, Kapler E, Driscoll L, Baca S (2001): Regional dendritic and spine variation in human cerebral cortex: a quantitative Golgi study. Cereb Cortex 11: 558–571.
Kalinichenko SG, Pushchin II (2008): Calcium-binding proteins in the cerebellar cortex of the bottlenose dolphin and harbor porpoise. J Chem Neuroanat 35: 364–370.
Lainé J, Axelrad H (1994): The candelabrum cell: a new interneuron in the cerebellar cortex.J Comp Neurol 339: 159–173.
Lainé J, Axelrad H (2002): Extending the cere-bellar Lugaro cell class. Neuroscience 115: 363–374.
Lange W (1971): Vergleichende Untersuchungen am Kleinhirn des Menschen, des Elefanten und einiger Zahnwale. Verh Anat Ges 65: 137–138.
Lange W (1975): Cell number and cell density in the cerebellar cortex of man and some other mammals. Cell Tiss Res 157: 115–124.
Lee PC, Moss CJ (1999): The social context for learning and behavioral development among wild African elephants; in Box HO, Gibson KR (eds): Mammalian Social Learning: Comparative and Ecological Perspectives. Cambridge, Cambridge University Press, pp 102–125.
Manger PR (2006): An examination of cetacean brain structure with a novel hypothesis cor-relating thermogenesis to the evolution of a big brain. Biol Rev Camb Philos Soc 81: 293–338.
Manger PR, Pillay P, Maseko BC, Bhagwandin A, Gravett N, Moon D, Jillani NE, Heming-way J (2009): Acquisition of the brain of the African elephant (Loxodonta africana) : per-fusion-fixation and dissection. J Neurosci Methods 179: 16–21.
Mann DM, Yates PO (1979): A quantitative study of the glia of the Purkinje cell layer of the cerebellum in mammals. Neuropathol Appl Neurobiol 5: 71–76.
Maseko BC, Spocter M, Haagensen M, Manger PR (2012): Elephants have relatively the larg-est cerebellum size of mammals. Anat Rec 295: 661–672.
Melik-Musyan AB, Fanardzhyan VV (2004): Morphological characteristics of Lugaro cells in the cerebellar cortex. Neurosci Behav Physiol 34: 633–638.
Mouton PR (2002): Principles and Practices of Unbiased Stereology: An Introduction for Bioscientists. Baltimore, Johns Hopkins University Press.
Obersteiner H (1913): Die Kleinhirnrinde von Elephas und Balaenoptera . Arb Neurol Inst Wien 20: 145–154.
Palay S, Chan-Palay V (1974): Cerebellar Cortex, Cytology and Organization. Berlin, Sprin-ger.
Pettigrew JD, Bhagwandin A, Haagensen M, Manger PR (2010): Visual acuity and hetero-geneities of retinal ganglion cell densities and the tapetum lucidum of the African el-ephant (Loxodonta africana) . Brain Behav Evol 75: 251–261.
Résibois A, Rogers JH (1992): Calretinin in rat brain: an immunohistochemical study. Neu-roscience 46: 101–134.
Rogers JH (1989): Immunoreactivity for cal-retinin and other calcium-binding proteins in cerebellum. Neuroscience 31: 711–721.
Scheibel ME, Scheibel AB (1978): The methods of Golgi; in Robertson RT (ed): Neuroana-tomical Research Techniques. New York, Ac-ademic Press, pp 89–114.
Schmidt H, Stiefel KM, Racay P, Schwaller B, Ei-lers J (2003): Mutational analysis of dendritic Ca 2+ kinetics in rodent Purkinje cells: role of parvalbumin and calbindin D 28k . J Physiol 551: 13–32.
Sherwood CC, Stimpson CD, Raghanti MA, Wildman DE, Uddin M, Grossman LI, Goodman M, Redmond RC, Bonar CJ, Er-win JM, Hof PR (2006): Evolution of in-creased glia-neuron ratios in the human frontal cortex. Proc Natl Acad Sci USA 103: 13606–13611.
Sherwood CC, Wahl E, Erwin JM, Hof PR, Hop-kins WD (2007): Histological asymmetries of primary motor cortex predict handedness in chimpanzees (Pan troglodytes) . J Comp Neurol 503: 525–537.
Shoshani J, Kupsky WJ, Marchant GH (2006): Elephant brain – part 1: gross morphology, functions, comparative anatomy, and evolu-tion. Brain Res Bull 70: 124–157.
Wahl D, Hof PR, Sherwood CC, Maseko BC, Manger PR, Jacobs B (2012): Comparative neuromorphology of Florida manatee, gi-raffe, human, and African Elephant cerebel-lar cortex. Poster Presentation at Rocky Mountain Regional Neuroscience Group, Aurora, Colorado.
Wen Q, Stepanyants A, Elston GN, Grosberg AY, Chklovskii DB (2009): Maximization of the connectivity repertoire as a statistical prin-ciple governing the shapes of dendritic ar-bors. Proc Natl Acad Sci USA 106: 12536–12541.
West MJ, Slomianka L, Gundersen, HJG (1991): Unbiased stereological estimation of the to-tal number of neurons in the subdivisions of the rat hippocampus using the optical frac-tionator. Anat Rec 231: 482–497.
Whitney ER, Kemper TL, Rosene DL, Bauman ML, Blatt GJ (2009): Density of cerebellar basket and stellate cells in autism: evidence for a late developmental loss of Purkinje cells. J Neurosci Res 87: 2245–2254.
Copyright © 2022 FDOKUMEN