
QSAR studies of disperse azo dyes. Towards the negation of the pharmacophore theory of dye-fiber...
24
Dyes and Pigmenfs. Vol 17. No. I. pp. 41 -64, 1997 Coovrieht i‘ 1997 Elsevier Science Ltd ELSEVIER Printed’; Grea; Britain. All rights reserved PII: SO143-7208(96)00025-3 0143.7208:97 $17.00 + 0.00 QSAR Studies of Disperse Azo Dyes. Towards the Negation of The Pharmacophore Theory of Dye-Fiber Interaction? Tudor Ionel Oprea,“* Ludovic Kuruncz$’ & Simona Timofeih “Theoretical Biology and Biophysics Group (T-IO), Mail Stop K710, Los Alamos National Laboratory, Los Alamos, NM 87545, USA %stitute of Chemistry, Romanian Academy, B-dul M. Viteazu nr. 24: Timisoara RO-1900, Romania (Received 26 February 1996; accepted 27 March 1996) ABSTRACT Twenty-seven disperseazo dyes were analyzed using Quantitative Structure- Activity Relationship (QSA R) methods by correlating variations in the chemical structure with -Ap”, the afJinity to cellulose fiber. Classical QSAR results, r2 of 0.32 for CLogP (the calculated octanol-water partition coejicientj and r2 qf‘0.924for MTD (minimum topological difference), suggest that steric, but not hydrophobic, efects are important. For Comparative Molecular Field Analysis (CoMFA), a three-dimensional QSAR (3D-QSAR) method, r’ ulas 0.925, while q2 (cross-validated r2) alas0.776for 2 PCs (principal components). CoMFA results imply that the pharmacophore theory of dye-fiber interaction holds true. Howlever, CoMFA was insensitiveto the alignment rules. PCA (Principal Component Analysis) shows that PC1 is related to chemical substituents, tchereas PC2 is related to molecular length (h). The correlation between- Ap” and h (a 1 D descriptor) is similar to the CoA4FA results. We therefore question the validity of the pharmacophore theory of dye-jiber interaction, and illus- trate a caseof overfitting in QSAR. Features that could improve disperse azo dye binding to celluloseare proposed. Copyright 0 1997 Elsevier Science Ltd Keywords: 3D-QSAR methodology, CoMFA, GOLPE, CLOGP, disperse azo dyes, pharmacophore. INTRODUCTION Effective dye adsorption by textile fibers has economical and even ecological implications. In recent years, several QSAR models have been developed, *Corresponding author at: Medicinal Chemistry, ASTRA Hassle AB, S-431 83 Molndal, Sweden. 41
-
Upload
independent -
Category
Documents
-
view
0 -
download
0
Transcript of QSAR studies of disperse azo dyes. Towards the negation of the pharmacophore theory of dye-fiber...

Dyes and Pigmenfs. Vol 17. No. I. pp. 41 -64, 1997 Coovrieht i‘ 1997 Elsevier Science Ltd
ELSEVIER
Printed’; Grea; Britain. All rights reserved PII: SO143-7208(96)00025-3 0143.7208:97 $17.00 + 0.00
QSAR Studies of Disperse Azo Dyes. Towards the Negation of The Pharmacophore Theory of Dye-Fiber Interaction?
Tudor Ionel Oprea,“* Ludovic Kuruncz$’ & Simona Timofeih
“Theoretical Biology and Biophysics Group (T-IO), Mail Stop K710, Los Alamos National Laboratory, Los Alamos, NM 87545, USA
%stitute of Chemistry, Romanian Academy, B-dul M. Viteazu nr. 24: Timisoara RO-1900, Romania
(Received 26 February 1996; accepted 27 March 1996)
ABSTRACT
Twenty-seven disperse azo dyes were analyzed using Quantitative Structure- Activity Relationship (QSA R) methods by correlating variations in the chemical structure with -Ap”, the afJinity to cellulose fiber. Classical QSAR results, r2 of 0.32 for CLogP (the calculated octanol-water partition coejicientj and r2 qf‘0.924 for MTD (minimum topological difference), suggest that steric, but not hydrophobic, efects are important. For Comparative Molecular Field Analysis (CoMFA), a three-dimensional QSAR (3D-QSAR) method, r’ ulas 0.925, while q2 (cross-validated r2) alas 0.776for 2 PCs (principal components). CoMFA results imply that the pharmacophore theory of dye-fiber interaction holds true. Howlever, CoMFA was insensitive to the alignment rules. PCA (Principal Component Analysis) shows that PC1 is related to chemical substituents, tchereas PC2 is related to molecular length (h). The correlation between - Ap” and h (a 1 D descriptor) is similar to the CoA4FA results. We therefore question the validity of the pharmacophore theory of dye-jiber interaction, and illus- trate a case of overfitting in QSAR. Features that could improve disperse azo dye binding to cellulose are proposed. Copyright 0 1997 Elsevier Science Ltd
Keywords: 3D-QSAR methodology, CoMFA, GOLPE, CLOGP, disperse azo dyes, pharmacophore.
INTRODUCTION
Effective dye adsorption by textile fibers has economical and even ecological implications. In recent years, several QSAR models have been developed, *Corresponding author at: Medicinal Chemistry, ASTRA Hassle AB, S-431 83 Molndal, Sweden.
41
42 T. I. Oprea et al
correlating dye technical properties (light-fastness, fastness to washing, affinity for fibers) with dye structure. ‘-’ Langmuir isotherms describe with reasonable approximation the dyeing of cellulose fibres.8 Different saturation values, obtained for various dye structures, suggest a “quantitative cor- relation between cellulose morphology and the dyeing equilibrium”.9 A predominantly parallel orientation to the fiber axis of the dye molecules was found by electro-optical methods. lo The above facts suggest the existence of specific sites for the dyes. The putative binding site for the dye molecule would be on the crystalline region of the cellulose, in the cavities formed by the supermolecular structure. ” The dimensions of these sites, between the 0 micro- and macrofibrils, are of the order of a few Angstroms or more.‘*
Based on this theory, classical Hansch,13 MTD13~14 and COMFA’~,‘~ QSAR studies have described the dye affinity for anthraquinone vat dyes and symmetrical bisazo dyes-both adsorbed as anions. In the case of disperse (neutral) dyes the adsorption on cellulose is well approximated by a Nernst isotherm.16 However, the adsorption mechanism on cellulose seems to be more indistinct. Experimental evidence suggested hydrogen-n: electron (carbohydrate&ye), dipole-dipole and hydrophobic interactions.“,” It was proposed that these dyes are adsorbed on a water-free area in cellulose, and no hydrogen bonds were observed.18
To gain further insight in the molecular aspects of dye-fiber interaction, we have now studied the affinity of disperse dyes for cellulose using molecular modeling and QSAR techniques. We report traditional Hansch, MTD and CoMFA results for a series of 27 disperse azo dyes (see Fig. 1 and Table 1). Based on hydrophobicity QSARs, we exclude hydrophobic forces as the main driving force in this interaction and we also show that CoMFA does not depend on the alignment rule, i.e. on the optimization procedure, the superimposition criteria and the partial charge density. This observation prompted us to question the validity of the pharmacophore hypothesis, since CoMFA is based on a receptor-ligand paradigm. MTD results do not con- tradict the observation that both CoMFA and MTD are well approximated by using a one-dimensional QSAR descriptor, namely molecular length (h). Based on the combined QSAR results, molecular features that could improve disperse azo dye binding to cellulose are proposed.
COMPUTATIONAL METHODS
Traditional descriptors: CLogP and MTD
The most important single parameterI in traditional QSAR relates to the hydrophobicity of a compound. For example, a descriptor related to hydro-

QSAR studies 43
Compounds
Fig. 1. Structure of the studied disperse azo dyes (see also Table 1).
phobicity (e.g. 7c or LogP) is present in 80% of the 3000 biological QSARs included in the Pomona QSAR database.20 We have, therefore, included LogP2’ calculations for the azo derivatives in our QSAR analysis. LogP measures the partition of a compound between the aqueous and 1-octanol phases-which, in turn, estimates the propensity of a given compound to transport through membranes. This descriptor can be used to rationalize if the target system has significant hydrophobic compartments involved in the binding process. LogP also correlates with the difficulty of removing the ligand from its aqueous cavity (salvation shell), as it docks into the receptor binding site-and was used to test the hypothesis that disperse dyes are adsorbed on a water-free (hydrophobic) area in cellulose.‘*
We calculated LogP (CLogP) using the MacLogP22 program. This pro- gram compiles a list of fragments encountered in the molecule, then looks for those fragments in a database, to see if LogP was measured in the adequate environment. Electronic effects are considered via the Hammett equation, looking for cr values. CLogP values are listed in Table 1.

TABL
E 1
Fibe
r A
ffini
ty
and
Cal
cula
ted
Phys
ico-
chem
ical
Pr
oper
ties
for
the
Azo
Dis
pers
e D
yes”
NO
2 H
H
R4 H
R5
GH
s
& -A
$ Cl
ogP
DpM
”
C2H
z,0H
11
.06
3.86
7.
06
(8.4
2)
Eff‘
-8.8
4 -1
.47
I.2
I.3
1.4
I.5
I.6
I.7
1.8
I.9
1.10
I.11
1.12
NO
2 H
H
NO
2 H
H
Br
H
H
NO
2 H
H
Cl
H
H
H
Cl
H
H
H
H
H
H
H
CN
H
H
H
NO
2 H
OC
H,
H
H
CH3
C2H
40H
C
2H40
H
10.8
9 3.
02
5.85
H
H
H
9.73
3.
13
8.41
(7
.44)
H
C
2H40
H
C2H
40H
9.
32
3.61
2.
72
H
C2H
40H
C
2H40
H
8.15
2.
52
5.47
H
CrH
40H
C
rH40
H
8.15
3.
46
2.69
H
C
2H40
H
C2H
40H
7.
83
3.46
3.
76
-9.2
5 -1
.69
-8.7
7 -1
.49
-8.9
4 -1
.05
-9.3
7 -1
.70
~-8.
92
-1.0
0 -9
.09
-1.0
4
H
C2H5
C
2H40
H
7.27
4.
07
2.27
-8
.76
-0.7
4
CH3
C2H
40H
C
zH40
H
6.48
3.
25
52
-8.9
0 -0
.85
H
C2H
40H
C
2H40
H
6.46
2.
18
3.54
-9
.04
-1.2
8
H
C2H
40H
C
2H40
H
6.37
2.
52
7.38
-9
.28
-1.4
4
H
C2H
40H
C
2H40
H
6.14
2.
78
3.78
-8
.98
-0.9
7
I.13
H
H
H
H
H
C2H
40H
6.
03
3.37
1.
64
-8.4
6 -0
.70
1.14
-8
.95
--OX6
1.15
H
CH
I H
H
C
2H40
H
C2H
40H
5.
94
3.25
3.
02
CH
3 H
H
H
C
2H40
H
C2H
40H
5.
93
3.25
3.
35
-8.7
9 a.
79
h (4
j(X
ii =
l)d
MTD
,
14.6
2 1,
8,9
, 13
,27,
13
36
33;
1,8,
9,
13,
29-3
3 14
.80
1, 8
,9,
13, 2
5,
13
27,2
9%33
13
.40
I, 8,
9,
13
14
14.3
1 I,
8, 2
7, 2
9-30
16
14
.89
I. 8,
9.
13. 2
7.
14
29-3
3 14
.14
I, 8,
27,
29-3
3 16
7
13.7
2 I,
11,2
7,
16
4
29-3
3;
2 1,
2,2
7,29
%33
2
13.3
2 1,
27,
3@
-33;
16
E o
1, 2
9-33
P
13.5
1 1,
25,2
7,29
-33
16
r 14
.98
1, 8
, 14
,27,
16
29
-33
14.5
9 I,
l&12
,27,
16
29
-33:
14
,27:
29-3
3 15
.44
1,8,
9,27
,29-
33;
15
1, 8
, 13
,27,
29
-33
12.0
8 1,
27,
30,
31;
16
1,
29,
32,
33
14.3
9 1,
11,
27,2
9%33
; 16
I,
2, 2
7, 2
9-33
13
.92
I, 8,
27,
29-3
3 16

I.16
1.17
I.1
8
H
H
H
C;,
H
H
H
H
C2H
40H
C
2Hz,
OH
5.
69
C2H
40H
C
2H40
H
5.69
H
H
5.
29
2.89
2.
68
3.25
2.
81
3.35
2.
04
(2.4
8)
2.75
3.
14
2.52
7.
58
-8.9
1 a.
99
-8.8
2 4.
80
-8.4
2 -0
.63
I.19
H
H
H
4.61
-8
.86
-0.8
2 1.
20
H
NO
2 H
3.
14
-9.0
9 -1
.35
11.1
-
- H
4.
95
1.67
3.
34
-9.3
0 m
l.48
II.2
H
12.7
1 2.
72
4.25
-9
.01
-1.4
1 II.
3 H
16
.58
3.26
3.
15
-9.1
0 -1
.57
II.4
- H
14
.23
2.96
4.
25
-9.0
8 -1
.46
H
H
OC
H-(
II.5
CH3
H
C2H
40H
&H
z,O
H
15.2
6 3.
21
4.47
-8
.94
-I .3
8
II.6
- -
- H
C
2H40
H
C2H
40H
18
.87
3.89
4.
00
-8.3
8 -1
.49
II.7
- -
H
C2H
40H
C
2H40
H
21.0
1 5.
29
4.21
-8
.75
-1.2
9
-
TABL
E l-c
onG
nu&
R2
R.3
R4
R5
R6
-A$
Clo
gP
DpM
h E/
f<
El.’
.~
h (4
j(-Uij
= 1)”
M
TD,
13.8
2 1,
8,2
7,
29
33
16
13.5
7 I,
5. 2
7, 2
9933
17
12
.13
I 17
13.5
8 1,
27,2
9-33
17
13
.57
1, 5
-7,
27,
18
29
33
13.7
0 26
33
16
15.6
1 8%
11,2
7,29
-33
12
15.9
4 88
II,26
33
12
17.2
9 8-
11,
17,
18,
IO
27,2
9-33
; 8-
1 I,
18,
19,
27,2
9-33
; (0
8-
l I,
15,
16,
2 27
, 29
.-33;
a oi
8-
11,
15,2
0,
s 27
,29-
33
B 16
.59
8-11
, 18
, II
2
27,2
9-33
; 8-
I 1,
15,
27,
29
933
17.9
8 88
11,1
5-
18,
8 27
,29-
33
19.5
6 1,
8, 9
, 13
, 15
, 7
16, 2
0-24
, 27
, 29
-33
“The
af
finity
va
lues
(-A
u”
in
kJ/m
ole)
, fro
m
refs
17
and
I8
(th
e va
lues
fro
m
ref.
18 a
re c
alcu
late
d by
us
from
th
e eq
uilib
rium
co
nsta
nt
valu
es).
hDpM
(d
ipol
e m
omen
t) va
lues
ar
e in
D
ebye
un
its,
calc
ulat
ed
usin
g th
e M
OPA
C 6.
0 pa
ckag
e (A
M1
Ham
iltoni
an).
In
brac
kets
th
e ex
perim
enta
l va
lues
ar
e gi
ven
from
re
f. 18
. “E
H
and
EL
are
the
ener
gies
of
Hig
hest
O
ccup
ied
and
Low
est
Uno
ccup
ied
Mol
ecul
ar
Orb
itals
, re
spec
tivel
y,
as r
esul
ted
from
M
OPA
C 6.
0 (A
M
1 H
amilto
nian
). “T
he
.j va
lues
(fo
r th
e M
TD
hype
rmol
ecul
e)
in w
hich
Xi
i= 1.
e

46 T. I. Oprea et al.
In the Minimum Topologic Difference (MTD) method,23 the molecular structure is described using the hypermolecule concept: a 3D network is obtained by approximate atomic superimposition of the molecules i (i = 1,. . ., hJ) of the QSAR series. Hydrogen atoms are neglected. A 2D hypermolecule can often be constructed ‘by hand’, using structural organic chemistry. The hyper- molecule is treated as a topological network, where vertices correspond to positions of the ligand molecule atoms (in the receptor cavity) and edges correspond to valence bonds between atoms. Molecule i is described by the occupancy (xii= 1) or non-occupancy (x~ = 0) of the j= 1,. . ., M vertices of the hypermolecule. The j vertices are attributed to three regions: receptor cavity (beneficial, Ej= -1) receptor walls (detrimental, ci= + 1) or exterior (neutral, Ej= 0). The MTDi d escriptor of molecule i equals the number of occupied detrimental vertices plus the number of unoccupied beneficial ones (s represents the number of cavity vertices in the hypermolecule):
MTDi = 5 Ej . .Xij. (1) j=l
The j values are established through an optimization procedure, which max- imizes the fit of the correlation equation (2) for the model (cc-other QSAR descriptors, Y,-biological activity).
Ya,j = a0 + al . ali + a2 .a2i + . . . - /I. MTDi. (4
The procedure is started with an initial set of j attribution, biased by the user’s ‘chemical intuition’ about the quality of the vertices. If a molecule can adopt several low energy conformations (or can be superposed in several ways in the hypermolecule), in the binding site it will adopt the one that fits best into the receptor (i.e. with the lowest MTD value).24 MTD values are listed in Table 1, while the hypermolecule is shown in Fig. 9.
The CoMFA Method
The following assumptions form the basis of the CoMFA method:25T26 (i) structural d e al s of the common receptor binding site are not known for t ‘1 the compounds in the studied series; (ii) modeling physico-chemical aspects of ligand-receptor interaction, e.g. force-field parameterization and solvent effects, have a degree of uncertainty; (iii) observed variations in experimental activity among different compounds may be explained with calculated physico-chemical properties within a given series. The receptor-bound conformations of the modeled compounds, as used in the CoMFA models, can be supplied from experimental determinations,27,28 or can be modeled using an initial hypothesis.29

QSA R s&dies 47
In CoMFA, non-covalent ligand-receptor interactions are replaced by steric (Lennard-Jones 6-12 potentials) and electrostatic (monopole Cou- lombic) interactions of the ligand with regularly spaced probe atoms (lattice). The steric and electrostatic interactions of probe atoms with the ligand are calculated at grid points, then tabulated for each molecule (row) in the series. The resulting matrix is analyzed with multivariate statistics (Partial Least Squares30 or PLS), yielding an equation that relates CoMFA field values to activity. This process highlights those features of the receptor that are investigated by the given structure-activity data set. The resulting QSAR coefficients (fields) are then graphically examined as contours in 3D space,31 and suggest areas for improvement in ligand design.
We used the following specifications for CoMFA runs: 2 A spaced grid (29x 19x 15 A, 1200 grid points); probe atom: Csp3+ 1; dielectric constant of 1.0; cutoff + 20 kcal/mol, with no electrostatic interactions at steric over- lap points (i.e. electrostatic field values are not considered at grid points overlapping with ligand atoms).
We used the Sybyl implementation32 of the PLS algorithm3’ for regression analyses, initially with cross-validation (leave-one-out model; LOO), and five principal components. From the analysis with the highest cross-validated r2 value (q*), we chose the optimal number of components. For similar or identical q* values, we chose the model with the smallest standard error of prediction (SEP). We used a 0.5 kcal/mol energy column filter (minimum sigma) for all CoMFA (not GOLPE) calculations, to improve the signal-to- noise ratio.
The measure of robustness,26 q2, is defined as:
PRESS = k[Yp - Ya)’ i=l
SD = e(Ya - Y,)* (5) i=l
where PRESS is the sum of squared deviations between predicted (Y,) and measured (actual, Y,) biological activity values for all N molecules in the set, and SD is the sum of the squared deviations between measured biological activity values of the molecules in the test set and the mean (Y,) activity value for all N molecules in the training set. From its definition, the ideal model yields a q2 of 1, but values can go to zero (or below) for models that predict values equal to (or worse than) Y,. Negative values imply that the
48 T. I. Oprea et al.
width of the model distribution is larger than the standard deviation of the actual activities distribution.
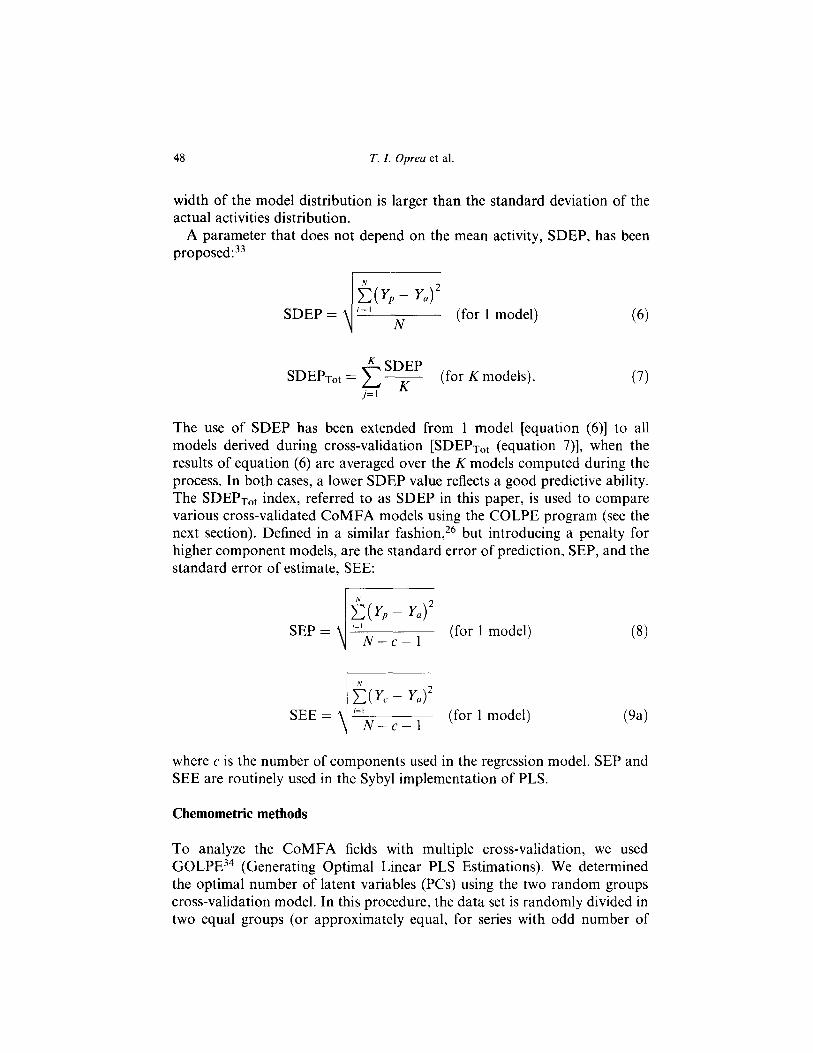
A parameter that does not depend on the mean activity, SDEP, has been proposed:33
SDEP = d N (for 1 model)
K SDEP SDEPTot = c K (for K models).
j=I (7)
The use of SDEP has been extended from 1 model [equation (6)] to all models derived during cross-validation [SDEPr,, (equation 7)], when the results of equation (6) are averaged over the K models computed during the process. In both cases, a lower SDEP value reflects a good predictive ability. The SDEProt index, referred to as SDEP in this paper, is used to compare various cross-validated CoMFA models using the COLPE program (see the next section). Defined in a similar fashion, 26 but introducing a penalty for higher component models, are the standard error of prediction, SEP, and the standard error of estimate, SEE:
C(r, - Ya)?
SEP = ,=I N-c-l
(for 1 model) (8)
5( Y, - Ya)2
SEE = !=I N-c-l
(for 1 model)
where c is the number of components used in the regression model. SEP and SEE are routinely used in the Sybyl implementation of PLS.
Chemometric methods
To analyze the CoMFA fields with multiple cross-validation, we used GOLPE34 (Generating Optimal Linear PLS Estimations). We determined the optimal number of latent variables (PCs) using the two random groups cross-validation model. In this procedure, the data set is randomly divided in two equal groups (or approximately equal, for series with odd number of

QSAR studies 49
compounds), and one set is used to derive the CoMFA/PLS model. The remaining group is used for prediction. This process was repeated 25 times. We compared these results with the leave-one-out cross-validation model. In this procedure, one of the compounds is excluded from the data set once and only once. The remaining compounds are used to derive a model, later used to predict the excluded compound. This process is repeated for as many times as compounds, with recalculation of weights. In what follows, the labels CV2 and LOO are used to identify results from the two random groups and the leave-one-out cross-validation models.
In this work, the X-distribution for both steric and electrostatic fields was studied in GOLPE, and a standard deviation (SDEV) filter was applied to each field: 0.117 kcal for steric field values, and 0.810 kcal for electrostatic field values. CoMFA/PLS results were recalculated using the GOLPE implementation of the PLS algorithm. These latter results are reported for CV2 models only, since they are similar with LOO results from the CoMFA PLS.
Molecular modeling. Additional QSAR descriptors
CoMFA model systems are based on defined molecular geometries and on atom-centered partial charges. Molecular geometries were determined starting from crystallographic information: the -N=N- moiety is in the tram config- uration in azo derivatives,35,36 and the molecule is nearly planar, with slight deviations (3-10”) between the phenyl ring planes. In a para dimethylamino substituent, a nonpyramidal nitrogen (i.e. sum of bond angles 360”) was detec- ted. The alkyl carbons from the same substituent were roughly in the phenyl ring plane. 36 However, the geometry optimization programs (Tripos Force Field, and closed shell MOPAC-AMl) systematically placed the N-substituted groups out of plane.
For Alignment 1, structures were built and optimized empirically using the Tripos 5.2 force field. 37 Partial charges were determined using the Gasteiger- Huckel electronegativity-based method, as implemented in Sybyl 6.0. N-Alkyl and N-hydroxy-alkyl chains were modeled in the all-trans (exten- ded) conformation. This criterion was maintained in all four alignments, for consistency. For Alignments 224, the structures were optimized using MOPAC38 6.0 (AM1 Hamiltonian, using the Eigenvector Following mini- mizer), a semi-empirical quantum-mechanical program. Partial atomic charges from the semi-empirical AM1 method were used for alignments 2 and 3, whereas potential-fitted charges (from the ESP method39) were used in Alignment 4. Criteria for each alignment are summarized in Table 2.
The molecular length (h) descriptor is the measured distance between the farthest atom on the substituted phenyl (‘A’) side and the last atom in the

50 T. I. Oprea et al.
TABLE 2 Summary of CoMFA (LOO) Results
PCS I 2 3 4
q2 0.516 0.714 0.763 0.719 F 4.471 10.473 13.528 10.739
SEP 3.279 2.572 2.391 2.663
9* 0.630 0.683 0.717 0.690 F 7.138 9.066 10.622 9.354
SEP 2.867 2.705 2.615 2.796
4* 0.675 0.754 0.746 0.733 F 8.737 12.840 12.339 11.555
SEP 2.684 2.387 2.475 2.593
q2 0.717 0.776 0.747 0.755 F 10.665 14.543 12.371 12.957
SEP 2.504 2.276 2.473 2.485
5 Observations
0.665 Alignment 1: Tripos 8.337 Force Field & charges 2.975 from Gasteiger-Huckel
0.658 Alignment 2: geometry & 8.097 charges from AM I, 3.004 linear atoms fit only
0.721 Alignment 3: geometry & 10.875 charges from AM I, 2.713 all-rings atoms fit
0.750 Alignment 4: geometry 12.590 from AM I, ESP charges 2.571 all-rings atoms fit
substituted amine moiety (‘B’) side. For molecules with the same A and/or B substituents, the same atoms were considered. If no substituents were present on the B side, the amine nitrogen atom was used. The h values given in Table 1 are calculated for the AM1 optimized geometry. This descriptor was improvised because it is suitable for linear molecules such as the flat azo derivatives. In a previous work 4o for compounds 1.1-1.20 among other parameters, molecular shape descriptors (e.g. Verloop’s STERIMOL, Char- ton’s steric) were tested in a Multiple Linear Regression analysis. After variable selection, only hydrophobicity (Hansch) and electronic (Hammett) parameters were kept.
RESULTS AND DISCUSSIONS
Discussion of CoMFA results
Four different alignment rules have been used in CoMFA, as explained in Table 2. Cross-validation results (LOO) are presented in Table 2. Regression results from the optimal LOO models show that statistically significant correlations have been obtained (Table 3). Only two or three PCs are required to establish a robust QSAR model, regardless of the alignment rule.
This insensitivity was surprising, since significant geometric and elec- trostatic differences exist between the four alignments. For example, the dihedral angle between side A (e.g. halophenyl) and side B (e.g. p-bis-

QSAR studies 51
TABLE 3 Summary of CoMFA Regression Results
Alignment model I 2 3 4
l-2 F SEE Relative Contributions (CoMFA) Steric Electrostatic
0.920(3) 0.915(3) 0.912(2) 0.925(2) 88.713 82.270 123.888 147.533
1.385 1.434 1.429 1.319
0.675 0.555 0.566 0.573 0.325 0.445 0.434 0.427
P-hydroxyethylamino-phenyl) in compound I.4 is 23.86” in the AMl- minimized geometry, compared to 5.44” in the Tripos force field minimized geometry. With respect to the electrostatic description, we point out just the differences in the partial charge of the sulfur atom from compound 11.7, which has three different values: -0.0013 in the Gasteiger-Huckel approximation, 0.4187 using the AM1 method, and 0.2962 using potential-fitted charges (ESP). We do not discuss other differences, since we further show that comparable correlations are obtained with a one-dimensional descriptor, h.
The CoMFA steric field yields a better model compared to the CoMFA electrostatic field: in the CV2 model (Table 5), the latter has less predictive ability and stability: it has the highest SDEV(sdep)-i.e. large intra-model variations among CV2 cross-validation models, and it is also insensitive to the level of description (empirical vs AM1 vs ESP charges). Because the optimal electrostatic field model is at 3 PCs, and the steric field model is optimal at 2 PCs, the combination of steric and electrostatic fields yields a model that is worse than the steric, but better than the electrostatic field model.
Graphical analysis of CoMFA fields is useful in explaining activityxon- tribution relationships (visualized with the GOLPE program). We discuss the most active (11.7) and one of the most inactive compounds (1.13) as examples. Graphic results of the activity-contribution plots are presented in Fig. 2. We have used the 0.8 contribution level for both negative and positive contributions. From the steric contours, it is apparent that the poor activity of compound I.13 is explained by the lack of perpendicular sub- stituents at the amino nitrogen. This negative contribution considerably reduces the binding affinity, when compared to the electrostatic contribu- tions. Positive steric contributions for compound II.7 are explained by the presence of the A’ ring (substituted at the A ring), as well as the A-A’ junction (see also Fig. 11). Compared to compound 1.13, the beneficial area has higher contribution, since more points are distributed in the surrounding region. For compound 11.7, a similar pattern is observed in the electrostatic

52 T. I. Oprea et al.
Stmic Field
Eledroetatic Field
Fig. 2. CoMFA fields activity-zontribution for the most active (11.7) and inactive (1.13) compounds of this series. Dark and light gray spheres represent beneficial and detrimental
contribution regions, respectively. Stereo plots.
field, as the two beneficial contributions overlap in space. For compound 1.13, the steric effect seems dominant, as positive electrostatic contributions located around the A ring do not have a significant effect on the activity. Negative contributions in the electrostatic field of compound I.13 are due to a shorter length of the N+hydroxyethyl moiety (e.g. N-l!l-cyanoethyl substituents are also active).
The relative insensitivity of the alignment rules prompted us to further analyze the nature of the latent variables. The PCA score plots are presented for the steric (Fig. 3) electrostatic (Fig. 4) and combined CoMFA fields (Fig. 5) for the first two latent variables. We have chosen Alignment 4 for this analysis, since it has the highest q2 in the LOO procedure. The actual vs predicted affinity plots for the above CoMFA models using CV2 results are shown in Figs 68.
In the score plots of the CoMFA steric field (Fig. 3) the second series of compounds, namely compounds 11.2-11.7, is clustered in the negative region of PC1 (which explains 27.07% of the variance). Compounds lacking any substituents (1.3, I.13 and 1.18) are located at the far positive end of PCl. The second latent variable, which explains 20.77% of the variance, has a

QSA R studies 53
PCA scores (Stem only)
Fig. 3. PCA score plot-CoMFA steric field.
different clustering scheme: compounds that have ortho substituents at the A or B rings-I.17 and 1.20 and 1.9, respectively-are located at the positive end of PC2, whereas mostly linear molecules like II.7 and I.3 are located at the negative end of PC2. These observations prompted us to conclude that PC1 is mostly related to the length of these compounds, whereas PC2 explains the width of the compounds (i.e. deviations from co-planarity at the azo moiety or in the substituents).
Electrostatic field PC score plots (Fig. 4) show a different clustering scheme, probably related to the chemical nature of the substituents. For example, in PC1 (which explains 45.85% of the variance), all paua-nitro substituted compounds (at ring A) are clustered in the positive end (com- pounds 1.1, 1.2, I.3 and 1.5) while the meta-nitro compound is closer to the median (I.ll), and the outho-nitro compound (1.20) is located at the negative end. By contrast, compounds lacking a para substituent (1.9, I.17 and 1.19) almost overlap. Compounds that have pat-a-halogen0 substituents at ring A (1.4, I.6 and 1.16) are centered around the zero value of PCl, with the meta-chloro compound (1.7) nearby. Compounds from the II series are either centered around the zero value (11.7), or clustered in the negative region

54 T. I. Oprea et al.
60 - 60 - 11 11
so - so -
20 20
‘lo - ‘lo - 21 21
70 - 70 -
23 23 20 - 20 - 2. 2.
2522 26 2522 26 2 2
10- 10- 27 27 3 3
o- o- 1 1 3 3
I 7 10 10
~,,I- ~,,I- 9 12 9 12
6’ 6’ l6 l6
-*o - -*o - 15 19 15 19
Ml’8 Ml’8 18 18
-?O - -?O - 13 13
40 1 -68 -51 -34 -17 0 17 34 51 68 85 IEcO?
PC1
Fig. 4. PCA score plot-CoMFA electrostatic field.
(11.1-11.6). Thus PC1 seems to measure the electron rvitlzdmwing ability of the substituents of the A phenyl ring, when part of the conjugated system. The second latent variable, explaining 15.51% of the variance, is less easy to interpret: compounds 11.2, II.5 and II.6 have the same positive PC2 score, while compounds I&1.14, I.17 are in a similar situation in the negative region.
In the combined steric and electrostatic field (Fig. 5) PC1 (explaining 28.12% of the variance) displays a similar clustering scheme to the first latent variable in the electrostatic field, while PC2 (explaining 24.14% of the var- iance) is similar to the first steric latent variable. Both have been discussed above. Since the steric field gives better results in the CV2 procedure (see Table 5), we decided to correlate -Ap’ with h. These results, as well as other traditional QSAR results, are discussed in the next section.
Discussion of traditional QSAR results
Prior to the quantum-mechanical and CoMFA computations, a MTD analysis was performed. The hypermolecule (numbering of the vertices is given in Fig. 9) was constructed ‘by hand’ based on molecular similarity.

QSAR studies 55
PCA scores (Both Fields)
26 27
24
25
42
L2 21
15 A
7 6
13 18
-6” 4” -20 0
Fig. 5. PCA score plot-both CoMFA fields.
Compounds 1.1, 1.7, 1.8, 1.11-1.14, II.4 and II.5 were placed in more than one position in the hypermolecule (see the j values in Table 1). The start hypermolecule, So (initial E, attributions) was constructed inspecting the occupancy of the vertices in the series. Beneficial vertices were considered those occupied mostly in compounds with high affinity, while detrimental ones were those involved in the inactive ones. After the optimization process the final ‘receptor map’, S* was obtained. The vertex attributions are in agreement with those resulted from an earlier MTD study4’ on compounds 1.1-1.20.
j(Ej=-1): 9-11, 13, 15-24 so j(E; = 0) : 1 - 4, 8, 14, 2.5 - 33
( j(Ej=+l) 1 5-7
S
I
j(Ej=-1) 1 8-l ,j(Ej = 0) 1 2 - 4, j(Ej IX +l) 1 1373
(10) 1, 13, 15 - 18, 20- 25, 33 5 - 6, 14, 26, 28 - 32 12, 19, 27

56 T. I. Oprea et al.
Fig. 6. Actual vs predicted activities-CoMFA (steric field) model.
The QSAR equation and the corresponding statistical parameters are given in Table 4. The LOO q2 value (calculated here starting for the training sets with So) is 0.848. An MTD run starting from a hypermolecule in which all the initial cj values were zero gives similar results (not shown). The inter- pretation of vertices attribution roughly gives the same results as CoMFA. The beneficial region is located near the longest molecular axis. The uncer- tainty concerning vertices 26-33 is due to a relatively uniform occupancy in the whole series (see Table 1).
Hydrophobic transferability does not play an important role in the binding process, since CLogP does not correlate with -Ap’ for this series. This is not surprising, since hydrophobic cavities are rarely present in cellulose fibers, and since no membrane barriers have to be crossed during binding.
Using descriptors generated from quantum mechanical calculations (dipole moment, heat of formation, HOMO/LUMO energies), as well as h, generates a good model. However, MOPAC descriptors add little to the model, judged by the weighted regression-coefhcients: although dipole- dipole interactions were proposed I8 for 1.1-1.20, here the dipole moment was excluded based on reduced contribution to the QSAR model. It was

QSAR studies 51
1 3 36 s‘l 72 9 II 13 L4 16 18 20 22
ACk4 Electrostatic only
Fig. 7. Actual vs predicted activities-CoMFA (electrostatic field) model.
observed that HOMO and LUMO have a smaller contribution than h alone. HOMO/LUMO orbital densities, when used as CoMFA fields, failed to correlate with -Ap’ (data not shown).
The molecular length descriptor (h) generates the simplest predictive model (see Fig. 10 for predicted versus actual affinities), and confirms the impor- tance of steric over electrostatic factors, as noted in CoMFA. Unlike disperse dyes (present study), for anthraquinone vat dyes and symmetrical bisazo dyes we observed that electrostatic effects are dominant in COMFA.‘~,‘~ MTD results concerning vertex attribution can be interpreted as the requirement for longer planar structures when the affinity increases. The importance of molecular length alone prompted us to question the validity of the pharmacophore theory in the dye-fiber interaction.
Since it is based on the ligand-receptor paradigm, CoMFA fields can be mapped to the receptor binding-site, as previously shown.42 However, when CoMFA results are insensitive to the alignment rule, it is useful to question either (i) the validity of the alignment rules or (ii) the validity of using CoMFA and its underlying hypothesis, the pharmacophore concept, for the system of interest.

T. I. Oprea et al
ACtd Both fields
Fig. 8. Actual vs predicted activities-CoMFA (both fields) model.
For the azo series, the validity of the alignment leaves little room for doubt: the chromophore moiety -N= N- overlaps, and the general directionality of the molecules is conserved. This points to the second possibility: In this case, CoMFA does not model a receptor-ligand type of interaction. The fact that h, a much simpler descriptor, leads to comparable statistical results, implies that the dye-fiber interaction is less specific than a receptor-binding type of interaction.
Such a pharmacophore would probably include hydrogen-bond donors and acceptors. In that case, compounds which completely lack the p-N-/3-hydroxy- ethyl substituents (1.3), or which havep-N-P-cyanoethyl moieties (11.3), would not display moderate or good affinity, respectively. The fact that compound 11.2, which has the p-N-P-hydroxyethyl instead of p-N+-cyanoethyl, has smaller affinity further substantiates the absence of a hydrogen bond-based pharmacophore. The lower -Au0 is probably due to an increased preference for the aqueous environment, when comparing CLogP values (Table 1).
These results prompt us to another important aspect of QSAR analysis: the qualities of a good QSAR model, which include simplicity, as opposed to the risk of overfitting the data. We briefly present these qualities for the disperse azo dyes QSAR:

QSAR studies 59
26
Fig. 9. MTD hypermolecule for the studied compounds with the numbering of vertices. Beneficial vertices (j== -1) are marked by open circles, detrimental vertices (j= + 1) by black
filled circles, irrelevant vertices (j= 0) by dots.
TABLE 4 Summary of Traditional QSAR Results
MTD ClogP EH&EL h L EH & EL
r2 0.924 0.322 0.541 0.748 0.852 F 305.185 I 1.865 14.143 74.175 69.173 SEE 1.296 3.880 3.258 2.365 1.849 Relative contributions 0.421 En 0.259 En
0.579 EL 0.218 EL 0.523 h
Regression equations -Au’ = -1.575.MTD + 31.783 -Au’ = 3.871CLogP - 3.226 -Au- = 11.70.E,, ~ 12.046,EL + 99.313 -Au’ = 2.369.h - 25.669 -A/l= = 2.020.h +6.818.E, - 4.302.EL + 35.251
l robustness-as suggested by cross-validation (LOO) and regression results, which show that the MTD, CoMFA and h QSARs are statisti- cally significant (Tables 24);
l predictive pokver-in the absence of a test set, predictivity was tested with the CV2 model; except for the electrostatic field, all QSARs have

60 T. I. Oprea et al.
Fig. 10. Actual vs predicted activities--h QSAR model.
good predictivity (Table 5); the smallest SDEV(sdep) is observed in the monoparametric (h) QSAR;
l explanatory power-based on these QSARs, we have inferred molecular features that could enhance -Ap3; the suggested improvements are given in the conclusion;
simplicity-in this case, the h QSAR is extremely simple; contrasting with the 1200-variables CoMFA model, this points out that QSARs should not be overfitted (i.e. the unwary investigator might have stopped after obtaining good CoMFA results);
uniqueness-the fact that several CoMFA models were significant prompted us to further investigate the nature of this correlation; after PCA, we have derived a unique, structurally related descriptor (h).
Conclusions
We analyzed the nature of the dye-fiber interaction for 27 disperse azo dyes

QSAR studies 61
TABLE 5 Summary of CV2 Cross-validation Results
Descriptor(s) PCS SDEP SDEV(sdep) q2
Steric field 2 2.516 0.302 0.692 Electrostatic field 3 2.902 0.603 0.590 Both CoMFA fields 2 2.603 0.363 0.670 h 2.537 0.197 0.687 L En 8~ EL I 2.541 0.272 0.684
using several QSAR methods. Hydrophobic effects were excluded because CLogP gave a limited correlation, y2 = 0.32. MTD (r2 = 0.924) and CoMFA (r2 = 0.925 and q2 = 0.776, LOO) results emphasized the importance of steric contributions for enhancing -Ap", the affinity to cellulose fiber. CoMFA results apparently confirm the validity of the pharmacophore theory of dye- fiber interaction. However, CoMFA was insensitive to alterations in the alignment rules (Table 2). PCA score plots for both CoMFA fields (Fig. 5) showed that PC1 is related to chemical substituents (mostly electrostatic), while PC2 is related to molecular length, h (largely steric). The correlation between -APO and h shows that a one-dimensional descriptor is capable to explain the data as well as CoMFA (1200 variables), illustrating a case of overfitting a QSAR model. Therefore, we have questioned the validity of the pharmacophore theory of dye-fiber interaction.
Figure 11 summarizes the useful features for high affinity: long linear struc- tures and substituents that maintain linearity are favored. We propose two possibilities for novel chemical structures, aimed to improve azo dye affinity: (i) symmetric dyes [P(HOC2H4)2N-C6H4-N]2 or [P-(NCC2H4)2N-C6H4-N2 and derivatives--this would double the presumed ‘cellulose binding sites’ capacity via the N(CH&H& moiety and would experimentally address the question of pharmacophoric patterns in cellulose fibers; (ii) multiple phenyl linear dyes-to address the question of the optimum length for linear molecules.
Our results suggest that this binding process is not optimally modeled in a receptor binding site paradigm (CoMFA). Steric fields are well approximated by molecular length, while electrostatic interactions appear less important using the current level of theory. Moreover, the affinity of binding is less specific in terms of pharmacophoric constraints. These observations suggest that higher affinity is not paralleled by an increase in specificity.
ACKNOWLEDGEMENTS
We thank Professor Sergio Clementi (Perugia, Italy) for GOLPETM, Professor Al Leo (Pomona, CA) for MacLogPTM, and Tripos Inc. (St. Louis, MO) for

62 T. I. Oprea et al.
Top view
h (no optimum found)
Side view
Ml
flat molecule
Fig. 11. Summary of useful features for higher cellulose affinity in the case of the studied disperse azo dyes.
SYBYLTM. Part of this work was supported by the US Department of Energy via an LDRD-CD grant for the Los Alamos National Laboratory (T.I.O.).
REFERENCES
1. Grecu, R., Pieroni, M. & Carpignano, R., Quantitative relationships between chemical structure and technical properties of arylazoindole suphonic acid dyes. Dyes and Pigments, 2 (1981) 308318.
2. Carpignano, R., Bani, E., Di Modica, G., Grecu, R. & Bottaccio, G., Quanti- tative relationships between chemical structure and technical properties of 4-aminoazobenzene sulphonic acid dyes. Dyes and Pigments, 4 (1983) 195-2 11.
3. Carpignano, R., Savarino, P., Di Modica, G. & Scavia, G.: Relazioni quanti- tative tra structura e proprieta technologiche in una serie di azocoloranti dell’acido 4-alcchilamidosalicilico. Tinctoriu, 4 (1984) 977110.
4. Carpignano, R., Savarino, P., Barni, E.. Di Modica, G. & Papa, S. S.. Devel- opments in the application of quantitative structure-property relationships of Dyes. J. SK. DJters Colour., 101 (1985) 270-276.
5. Carpignano, R., Savarino, P., Barni. E., Clementi, S. & Giulietti, G., Quanti- tative structure-property relationships study of azo dyes using partial least squares analysis in latent variables (PLS). Dyes and Pigments, 6 (1985) 189-212.
6. Carpignano, R., Savarino, P., Barni, E., Viscardi, G., Clementi, S. & Giulietti, G.. Partial least-squares modelling of dye fastness to light. Anulq,tica Chimica Acta, 191 (1986) 445-450.

QSAR studies 63
7. Carpignano, R., Savarino, P., Viscardi, G., Barni, E., Clementi, S. & Cruciani, G., QSAR-Untersuchungen an Azofarbstoffen durch partielle Fehlerquadrat- Analyse bei latenten Variablen (PLS). Melliund Textiiber., 70 (1989) 276278.
8. Peters, R. H., Textile Chemistry. The Physical Chemistry of Dyeing. Elsevier Science Publ. Co., Amsterdam, 1975, pp. 402412.
9. Porter, J. J. & Perkins, W. S., A study of the thermodynamics of sorption of three direct dyes on cellophane film. Text. Res. J., 40 (1970) 81-88.
10. Trotman, E. R., Dyeing and Chemical Technology of Textile Fibres, 4th Ed. Griffin, London, 1970, p. 410.
11. French, A. D., Battista, 0. A., Cuculo, J. A. & Gray D. G., Kirk-Othmer Encyclopedia of Chemical Technology. J. Wiley and Sons, 4th Ed., Vol 5, 1993, pp. 476-496.
12. Nugmanov, 0. K., Pertsin, A. I., Zabelin, L. V. & Marchenko, C. N., Molekul- yarno-kristalicheskaya struktura tselyulozy. Usp. Khim., 56 (1987) 1339-1359.
13. Timofei, S., Schmidt, W., Kurunczi, L., Simon, Z. & Sallo, A., A QSAR study of the adsorption by cellulose fibre of anthraquinone vat dyes. Dyes and Pigments, 24 (1994) 267-279.
14. Fabian, W. M. F., Timofei, S. & Kurunczi, L., Comparative molecular field analysis (CoMFA), semiempirical (AM 1) molecular orbital and multi- conformational minimal steric difference (MTD) calculations of anthraquinone dye-fibre affinities. J. Mol. Struct. (Theochem), 340 (1995) 73-81.
15. Fabian, W. M. F. & Timofei, S., Comparative Molecular Field Analysis (CoMFA) of Dye-Fibre Affinities. II: Symmetrical Bisazo Dyes. J. Mol. Struct. (Theochem), 362 (1996) 155-162.
16. Rattee, J. D. & Breuer M. M., The Physical Chemistry of Dye Adsorption. Academic Press, London, 1974, pp. 221-243.
17. Seu, G. & Mura, L., Adsorption of Heterocyclic Disperse Azo Dyes by Cotton. Am. Dyest. Rep., 1984, pp. 4344.
18. Shibusawa, T. & Uchida, T., Relation between heats of adsorption and dipole moments for 4-aminoazobenzenes on cellulose. Sen’i Gakkaishi, 42 (1986) T84T9 1.
19. Hansch, C., Quantitative structure activity relationships and the unnamed science. Act. Chem. Res., 26 (1993) 1477153.
20. Hansch, C., Hoekman D. & Leo, A., MedchemlBiobyte QSAR Database, 1995, Available from Biobyte Corp., 201 W. Fourth St., Suite #204, Claremont CA 91711. World Wide Web address (URL) http://fox.pomona.claremont.edu/ chem/qsar-db.
21. Leo, A. J., Calculating log Pact from structures. Chemical Reviews, 93 (1993) 1281-1306.
22. Hoekman, D., MacLogP, v.l.O.3., 1995, Available from Biobyte Corp., 201 W. Fourth St., Suite #204, Claremont, CA 91711.
23. Simon, Z., Chiriac, A., Holban, S., Ciubotariu D. & Mihalas, G. I., Minimum Steric Dtxerence. The MTD-Methodfor QSAR Studies. Research Studies Press, Letchworth, 1980.
24. Ciubotariu, D., Deretey, E., Oprea, T. I., Sulea, T., Simon, Z., Kurunczi, L. & Chiriac, A., Multiconformational minimal steric difference. Structure acetyl- cholinesterase hydrolysis rate relations for acetic acid esters. Quant. Struct. Act. Relat., 12 (1993) 3677372.
25. Cramer III, R. D. & Bunce, J. D., The DYLOMMS method: Initial results from a comparative study of approaches to 3D QSAR. In QSAR in Drug Design

64 T. I. Oprea et al.
and Toxicology, eds D. Hadzi & B. Jerman-Blazic. Elsevier, Amsterdam, 1987, pp. 3-12.
26. Cramer III, R. D., Patterson, D. E. & Bunce, J. D., Comparative molecular field analysis (CoMFA). 1. Effect of shape on binding of steroids to carrier proteins. J. Am. Chem. Sot., 110 (1988) 5959-5967.
27. Waller, C. L., Oprea, T. I., Giolitti, A. & Marshall, G. R., 3-D QSAR of human immunodeficiency virus (I) protease inhibitors. I. A CoMFA study employing experimentally determined alignment rules. J. Med. Chem., 36 (1993) 41524160.
28. Cruciani, G. & Watson, K. A., Comparative molecular field analysis using GRID force-field and GOLPE variable selection methods in a study of inhibitors of glycogen phosphorylase b. J. Med. Chem., 37 (1994) 2589-2601.
29. Waller, C. L. & Marshall, G. R., 3-D QSAR of angiotensin-converting enzyme and thermolysin inhibitors. II. A comparison of CoMFA models incorporating molecular orbital fields and desolvation free energies based on active analog and complementary-receptor-field alignment rules. J. Med. Chem., 36 (1993) 239&2403.
30. Weld, S., Johansson, E. & Cocchi, M., PLS-Partial Least-Squares Projections to Latent Structures. In 3D-QSAR in Drug Design, ed. H. Kubinyi. ESCOM: Leiden, 1993, pp. 523-550.
31. Cramer III, R. D., DePriest, S. A., Patterson, D. E. & Hecht, P., The developing practice of Comparative Molecular Field Analysis. In SD-QSAR in Drug Design, ed. H. Kubinyi. ESCOM: Leiden, 1993, pp. 443485.
32. Cramer III, R. D., Bunce, J., Patterson, D. & Frank, I., Crossvalidation, bootstrapping, and partial least squares compared with multiple regression in conventional QSAR studies. Quant. Struct.-Act. Relut., 7 (1988) 18-25.
33. Cruciani, G., Baroni, M., Clementi, S., Costantino, G., Riganelli, D. & Skageberg, B., Predictive ability of regression models. Part I: Standard devi- ation of prediction errors (SDEP). J. Chemometrics, 6 (1992) 335-346.
34. Baroni, M., Costantino, G., Cruciani, G., Riganelli, D., Valigi, R. & Clementi, S., Generating optimal linear PLS estimations (GOLPE): An advanced chemo- metric tool for handling 3D-QSAR problems. @ant. Struct.-Act. Refat., 12 (1993) 9-20.
35. Gilardi, R. D. & Karle, I. L., The crystal structure of 4-phenylazoazobenzene. Acta Cvyst., B, 28 (1972) 1635-1638.
36. Hanson, A. W., The crystal structure of methyl orange monohydrate monoethanolate. Acta Cryst., B, 29 (1973) 454460.
37. Clark, M., Cramer III, R. D. & Van Opdenbosch. N., Validation of the general purpose Tripos 5.2 force field. J. Comp. Chem., 10 (1989) 982-1012.
38. Stewart, J. J. P., MOPAC: a semiempirical molecular orbital program. J. Comput. Aided Mol. Design, 4 (1990) l-105.
39. Besler, B. H., Merz, K. M., Jr & Kollman, P. A., Atomic charges derived from semiempirical methods. J. Comp. Chem., 11 (1990) 431439.
40. Timofei, S., Kurunczi, L., Schmidt, W. & Simon, Z., Lipophilicity in dye-cellulose fibre binding. Dyes and Pigments, 32 (1996) 2542.
41. Timofei, S., Kurunczi, L., Schmidt, W. & Simon, Z., Structure-affinity binding relationships of some 4-aminoazobenzene derivatives for cellulose fibre. Dyes and Pigments, 29 (1995) 251-258.
42. Oprea, T. I., Waller, C. L. & Marshall, G. R., 3D-QSAR of Human Immuno- deficiency Virus (I) protease inhibitors. III. Interpretation of CoMFA results.