QPS Enrollment Statistics October 1, 2012-2021 - Quincy ...
15
Presented to School Committee on October 13, 2021 1
-
Upload
khangminh22 -
Category
Documents
-
view
0 -
download
0
Transcript of QPS Enrollment Statistics October 1, 2012-2021 - Quincy ...

Presented to School Committee on October 13, 2021
1
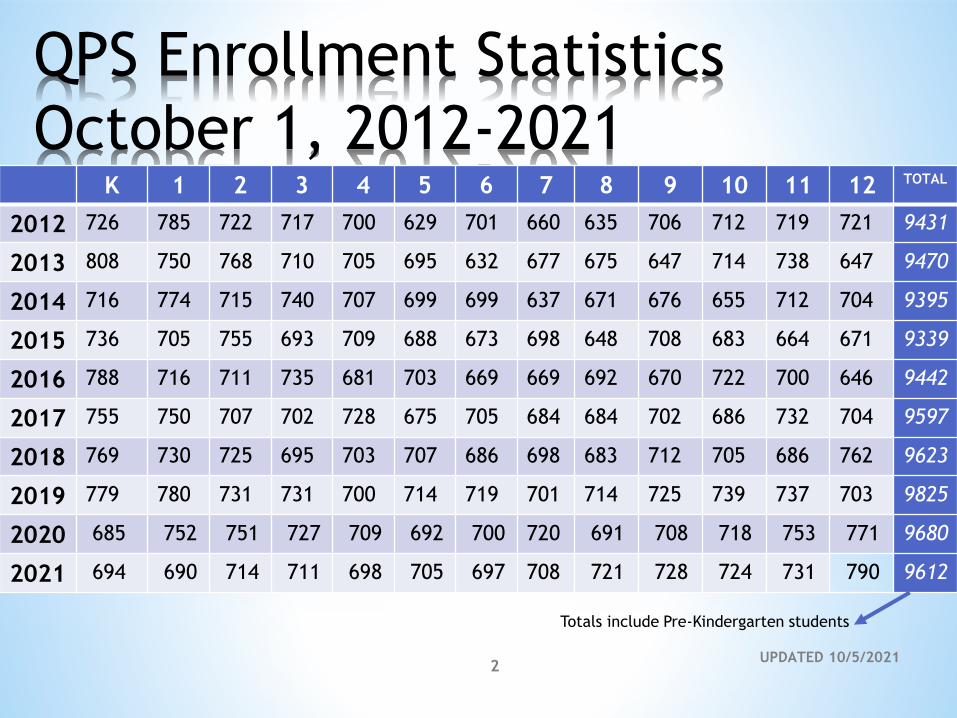
QPS Enrollment Statistics
October 1, 2012-2021K 1 2 3 4 5 6 7 8 9 10 11 12 TOTAL
2012 726 785 722 717 700 629 701 660 635 706 712 719 721 9431
2013 808 750 768 710 705 695 632 677 675 647 714 738 647 9470
2014 716 774 715 740 707 699 699 637 671 676 655 712 704 9395
2015 736 705 755 693 709 688 673 698 648 708 683 664 671 9339
2016 788 716 711 735 681 703 669 669 692 670 722 700 646 9442
2017 755 750 707 702 728 675 705 684 684 702 686 732 704 9597
2018 769 730 725 695 703 707 686 698 683 712 705 686 762 9623
2019 779 780 731 731 700 714 719 701 714 725 739 737 703 9825
2020 685 752 751 727 709 692 700 720 691 708 718 753 771 9680
2021 694 690 714 711 698 705 697 708 721 728 724 731 790 9612
UPDATED 10/5/20212
Totals include Pre-Kindergarten students

10/13/2021
3
PK K 1 2 3 4 5 6 7 8 9 10 11 12+ TOTAL +/-
ECC 143 143 - 6
AH 33 47 42 40 39 54 255 -19
BKS 55 55 56 55 64 60 345 - 7
BERN 65 52 58 59 57 48 339 +16
LH 132 107 105 89 92 525 -19
CM 86 108 102 93 82 471 -54
MMT 56 51 48 68 58 44 325 -11
MONT 60 70 73 83 75 73 434 - 3
PKR 47 56 43 58 51 53 308 + 2
SH 91 49 43 59 43 56 46 387 -10
SQ 59 46 65 62 61 69 362 23
WOLL 51 54 58 55 56 56 330 - 5
AMS 176 169 181 526 -20
BMMS 113 114 100 327 -11
CMS 220 203 219 642 +26
PWMS 62 90 73 99 84 408 - 9
SWMS 97 104 113 122 436 +45
GOALS 1 5 4 6 4 20
NQHS 351 365 328 363 1407 +51
QHS 355 342 379 373 1449 -50
QEHS 4 12 16
Out of D 5 1 1 5 6 7 15 11 10 14 17 13 14 38 157 - 8
TOTAL 301 694 690 714 711 698 705 697 708 721 728 724 731 790 9612 -69
Difference between
Oct 2020~Oct 2021
10/5/2021
4
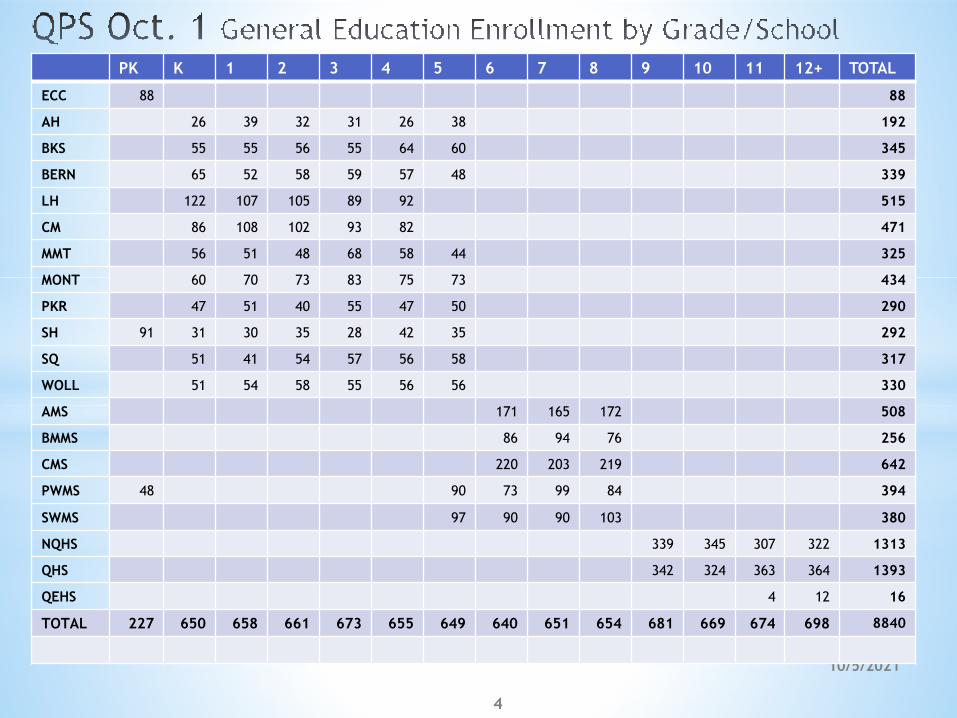
PK K 1 2 3 4 5 6 7 8 9 10 11 12+ TOTAL
ECC 88 88
AH 26 39 32 31 26 38 192
BKS 55 55 56 55 64 60 345
BERN 65 52 58 59 57 48 339
LH 122 107 105 89 92 515
CM 86 108 102 93 82 471
MMT 56 51 48 68 58 44 325
MONT 60 70 73 83 75 73 434
PKR 47 51 40 55 47 50 290
SH 91 31 30 35 28 42 35 292
SQ 51 41 54 57 56 58 317
WOLL 51 54 58 55 56 56 330
AMS 171 165 172 508
BMMS 86 94 76 256
CMS 220 203 219 642
PWMS 48 90 73 99 84 394
SWMS 97 90 90 103 380
NQHS 339 345 307 322 1313
QHS 342 324 363 364 1393
QEHS 4 12 16
TOTAL 227 650 658 661 673 655 649 640 651 654 681 669 674 698 8840
10/13/2021
5
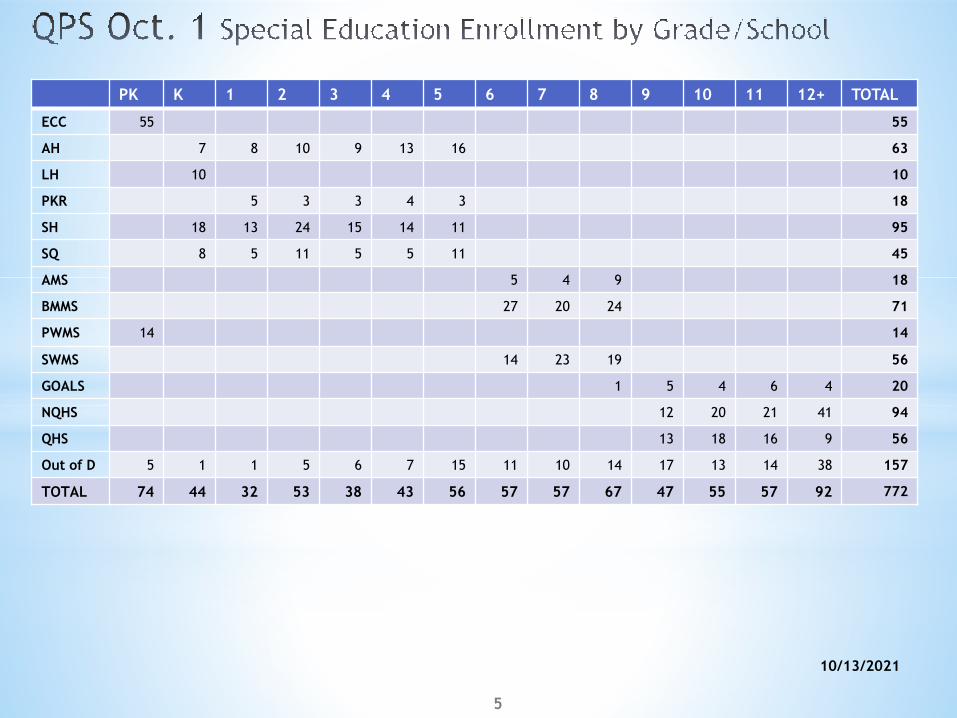
PK K 1 2 3 4 5 6 7 8 9 10 11 12+ TOTAL
ECC 55 55
AH 7 8 10 9 13 16 63
LH 10 10
PKR 5 3 3 4 3 18
SH 18 13 24 15 14 11 95
SQ 8 5 11 5 5 11 45
AMS 5 4 9 18
BMMS 27 20 24 71
PWMS 14 14
SWMS 14 23 19 56
GOALS 1 5 4 6 4 20
NQHS 12 20 21 41 94
QHS 13 18 16 9 56
Out of D 5 1 1 5 6 7 15 11 10 14 17 13 14 38 157
TOTAL 74 44 32 53 38 43 56 57 57 67 47 55 57 92 772
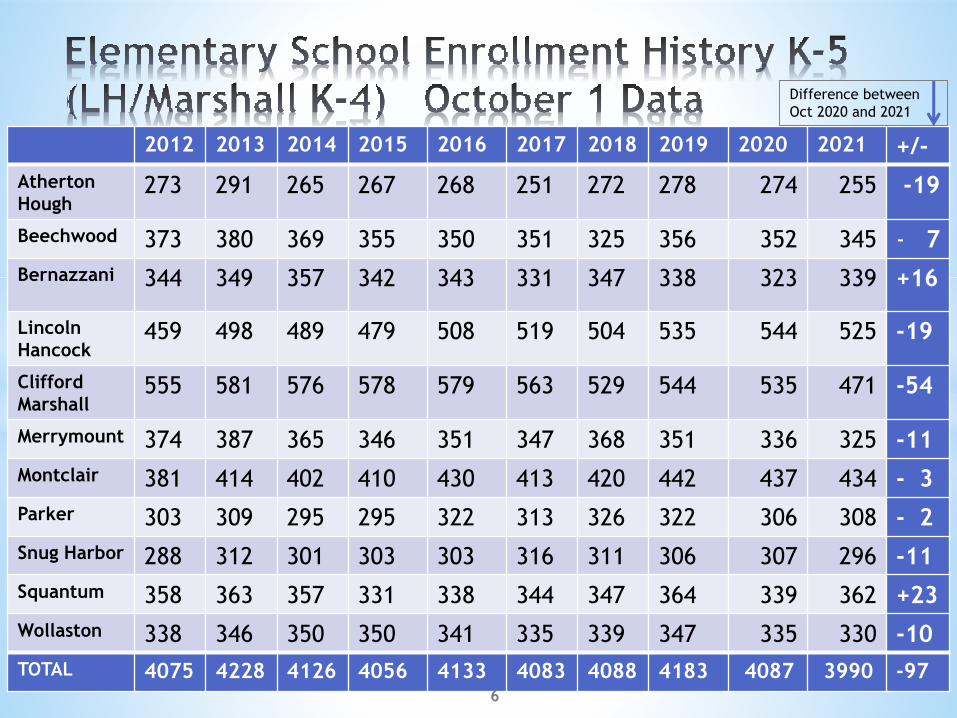
2012 2013 2014 2015 2016 2017 2018 2019 2020 2021 +/-
Atherton
Hough273 291 265 267 268 251 272 278 274 255 -19
Beechwood 373 380 369 355 350 351 325 356 352 345 - 7
Bernazzani 344 349 357 342 343 331 347 338 323 339 +16
Lincoln
Hancock459 498 489 479 508 519 504 535 544 525 -19
Clifford
Marshall555 581 576 578 579 563 529 544 535 471 -54
Merrymount 374 387 365 346 351 347 368 351 336 325 -11
Montclair 381 414 402 410 430 413 420 442 437 434 - 3
Parker 303 309 295 295 322 313 326 322 306 308 - 2
Snug Harbor 288 312 301 303 303 316 311 306 307 296 -11
Squantum 358 363 357 331 338 344 347 364 339 362 +23
Wollaston 338 346 350 350 341 335 339 347 335 330 -10
TOTAL 4075 4228 4126 4056 4133 4083 4088 4183 4087 3990 -976
Difference between
Oct 2020 and 2021
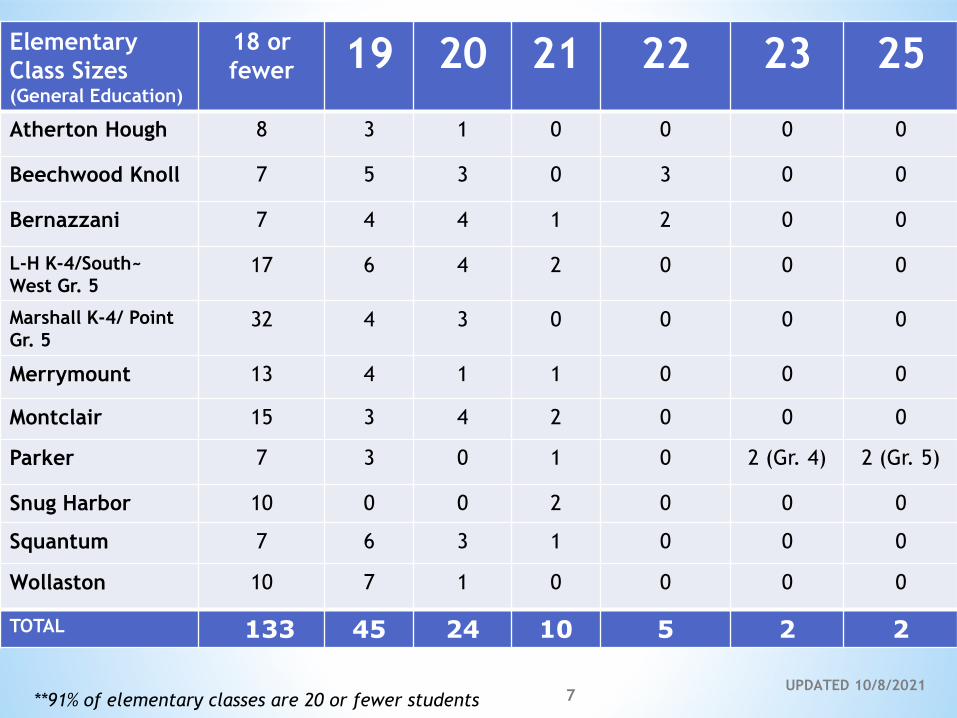
Elementary
Class Sizes (General Education)
18 or
fewer 19 20 21 22 23 25
Atherton Hough 8 3 1 0 0 0 0
Beechwood Knoll 7 5 3 0 3 0 0
Bernazzani 7 4 4 1 2 0 0
L-H K-4/South~
West Gr. 517 6 4 2 0 0 0
Marshall K-4/ Point
Gr. 532 4 3 0 0 0 0
Merrymount 13 4 1 1 0 0 0
Montclair 15 3 4 2 0 0 0
Parker 7 3 0 1 0 2 (Gr. 4) 2 (Gr. 5)
Snug Harbor 10 0 0 2 0 0 0
Squantum 7 6 3 1 0 0 0
Wollaston 10 7 1 0 0 0 0
TOTAL 133 45 24 10 5 2 2
UPDATED 10/8/20217**91% of elementary classes are 20 or fewer students
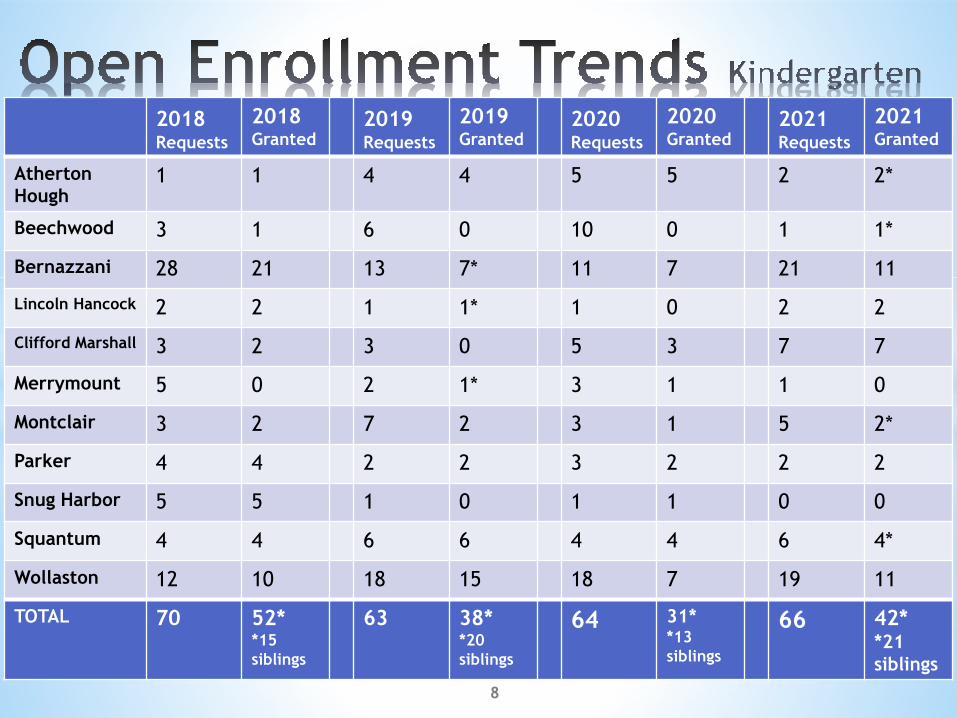
2018Requests
2018 Granted
2019Requests
2019 Granted
2020Requests
2020 Granted
2021Requests
2021 Granted
Atherton
Hough1 1 4 4 5 5 2 2*
Beechwood 3 1 6 0 10 0 1 1*
Bernazzani 28 21 13 7* 11 7 21 11
Lincoln Hancock 2 2 1 1* 1 0 2 2
Clifford Marshall 3 2 3 0 5 3 7 7
Merrymount 5 0 2 1* 3 1 1 0
Montclair 3 2 7 2 3 1 5 2*
Parker 4 4 2 2 3 2 2 2
Snug Harbor 5 5 1 0 1 1 0 0
Squantum 4 4 6 6 4 4 6 4*
Wollaston 12 10 18 15 18 7 19 11
TOTAL 70 52**15
siblings
63 38**20
siblings
64 31**13
siblings
66 42* *21
siblings
8
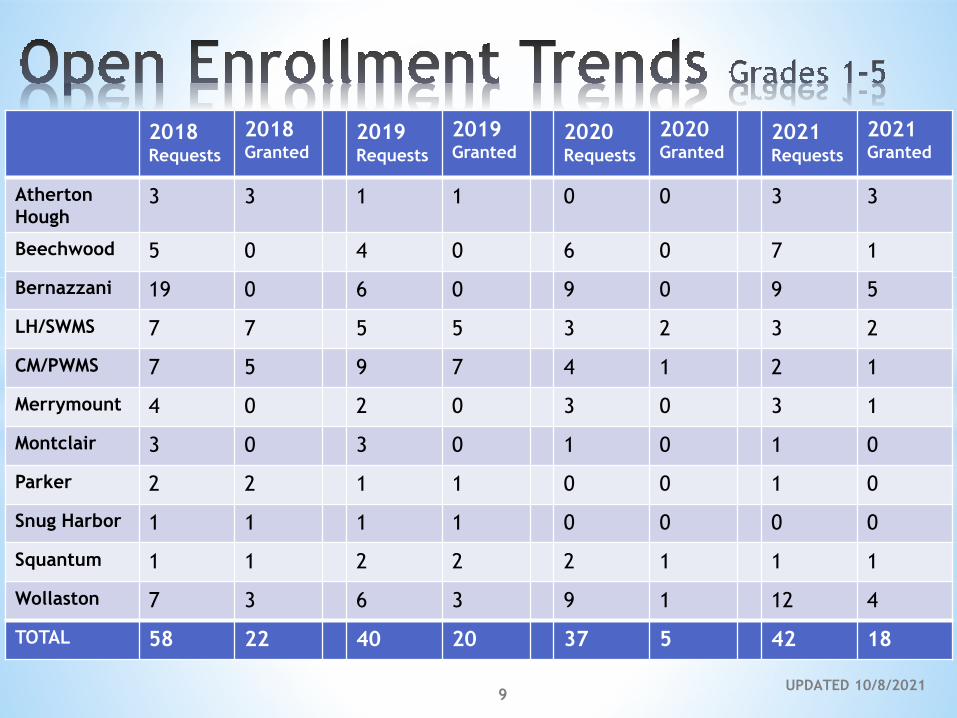
2018Requests
2018 Granted
2019Requests
2019 Granted
2020Requests
2020 Granted
2021Requests
2021 Granted
Atherton
Hough3 3 1 1 0 0 3 3
Beechwood 5 0 4 0 6 0 7 1
Bernazzani 19 0 6 0 9 0 9 5
LH/SWMS 7 7 5 5 3 2 3 2
CM/PWMS 7 5 9 7 4 1 2 1
Merrymount 4 0 2 0 3 0 3 1
Montclair 3 0 3 0 1 0 1 0
Parker 2 2 1 1 0 0 1 0
Snug Harbor 1 1 1 1 0 0 0 0
Squantum 1 1 2 2 2 1 1 1
Wollaston 7 3 6 3 9 1 12 4
TOTAL 58 22 40 20 37 5 42 18
9UPDATED 10/8/2021
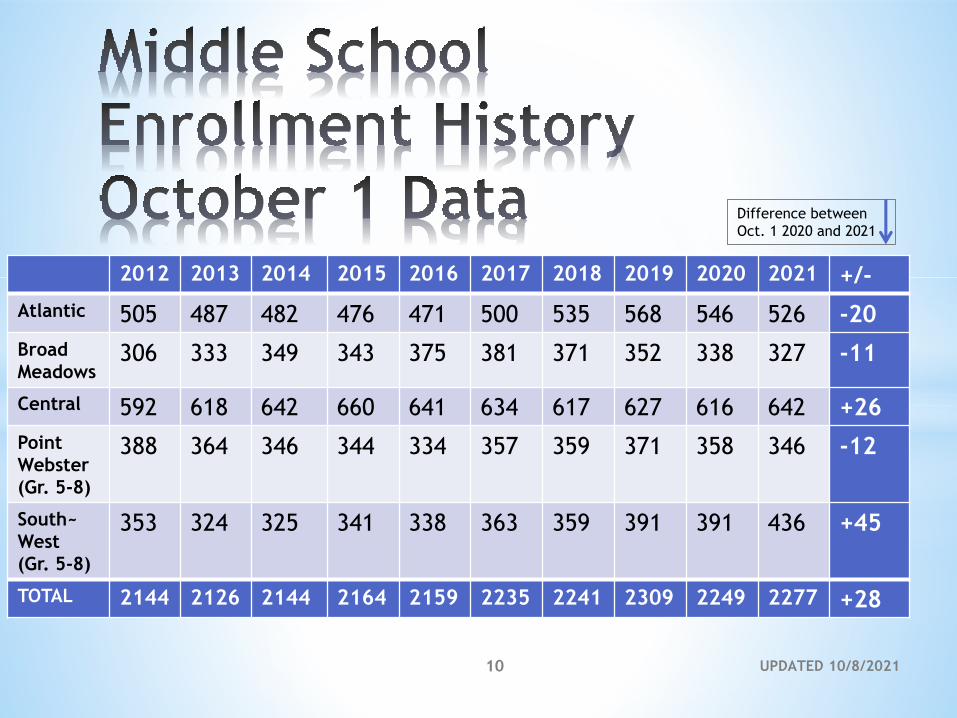
2012 2013 2014 2015 2016 2017 2018 2019 2020 2021 +/-
Atlantic 505 487 482 476 471 500 535 568 546 526 -20
Broad
Meadows306 333 349 343 375 381 371 352 338 327 -11
Central 592 618 642 660 641 634 617 627 616 642 +26
Point
Webster
(Gr. 5-8)
388 364 346 344 334 357 359 371 358 346 -12
South~
West
(Gr. 5-8)
353 324 325 341 338 363 359 391 391 436 +45
TOTAL 2144 2126 2144 2164 2159 2235 2241 2309 2249 2277 +28
UPDATED 10/8/202110
Difference between
Oct. 1 2020 and 2021
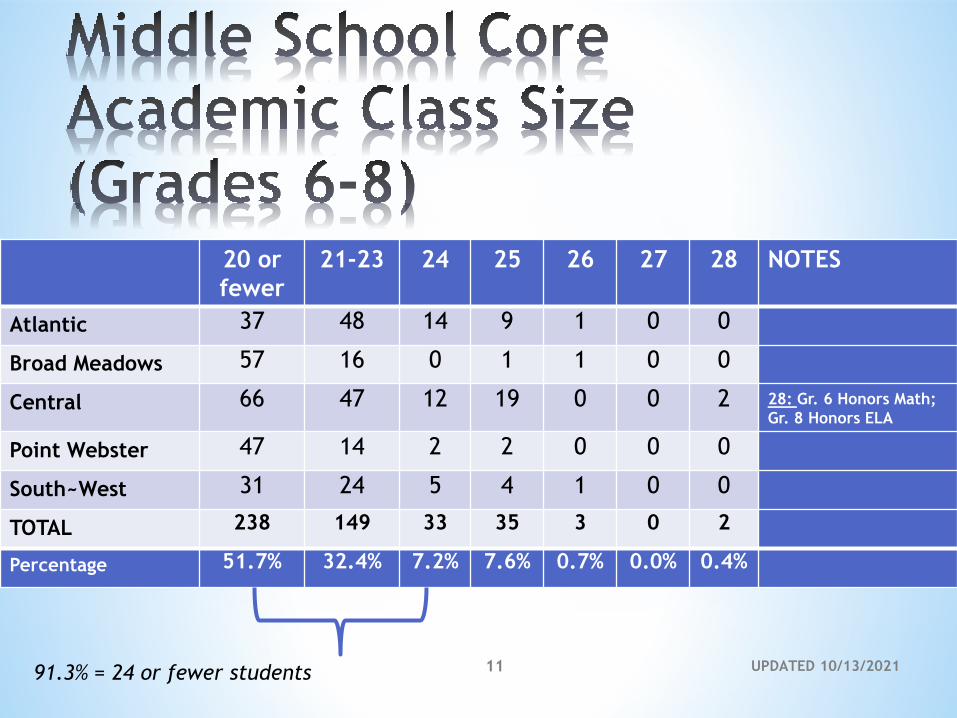
20 or
fewer
21-23 24 25 26 27 28 NOTES
Atlantic 37 48 14 9 1 0 0
Broad Meadows 57 16 0 1 1 0 0
Central 66 47 12 19 0 0 2 28: Gr. 6 Honors Math;
Gr. 8 Honors ELA
Point Webster 47 14 2 2 0 0 0
South~West 31 24 5 4 1 0 0
TOTAL 238 149 33 35 3 0 2
Percentage 51.7% 32.4% 7.2% 7.6% 0.7% 0.0% 0.4%
UPDATED 10/13/20211191.3% = 24 or fewer students
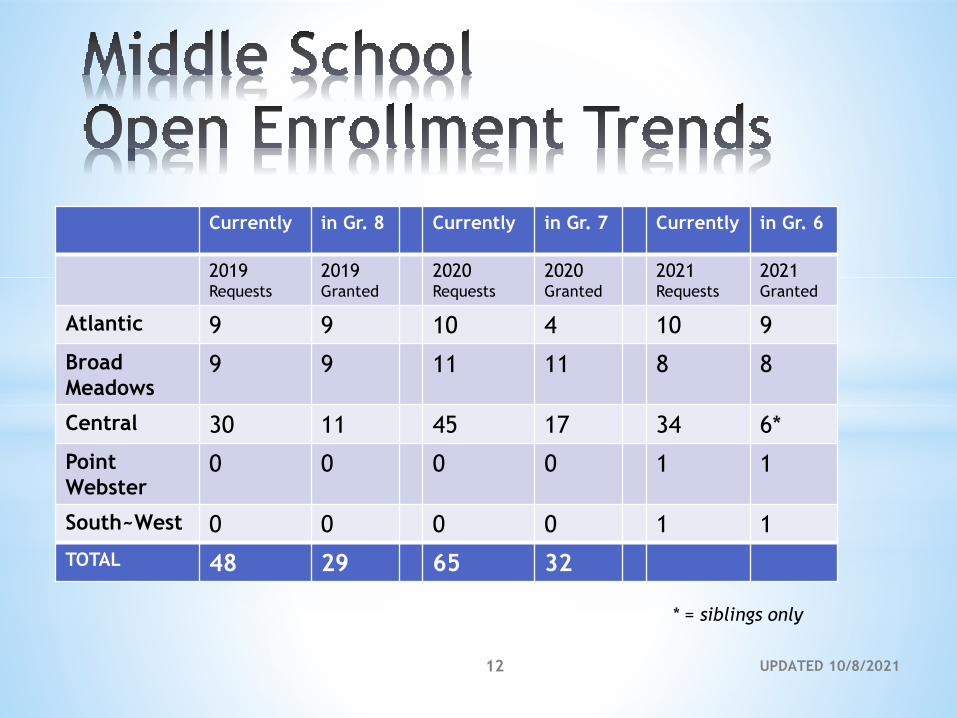
Currently in Gr. 8 Currently in Gr. 7 Currently in Gr. 6
2019 Requests
2019Granted
2020 Requests
2020Granted
2021 Requests
2021Granted
Atlantic 9 9 10 4 10 9
Broad
Meadows9 9 11 11 8 8
Central 30 11 45 17 34 6*
Point
Webster0 0 0 0 1 1
South~West 0 0 0 0 1 1
TOTAL 48 29 65 32
UPDATED 10/8/202112
* = siblings only
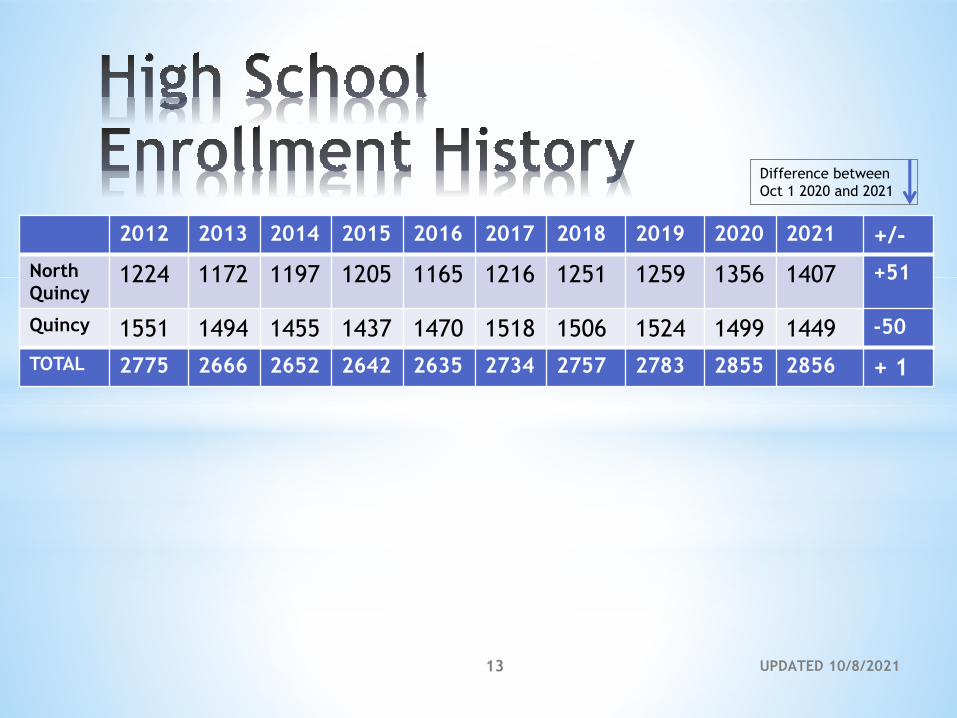
2012 2013 2014 2015 2016 2017 2018 2019 2020 2021 +/-
North
Quincy1224 1172 1197 1205 1165 1216 1251 1259 1356 1407 +51
Quincy 1551 1494 1455 1437 1470 1518 1506 1524 1499 1449 -50
TOTAL 2775 2666 2652 2642 2635 2734 2757 2783 2855 2856 + 1
UPDATED 10/8/202113
Difference between
Oct 1 2020 and 2021
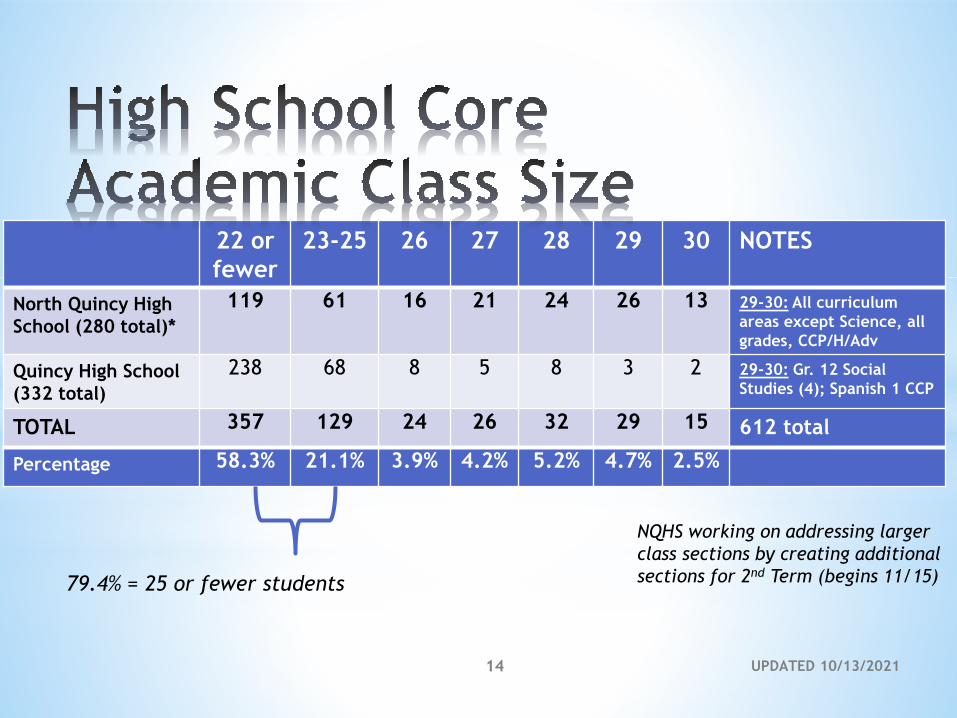
22 or
fewer
23-25 26 27 28 29 30 NOTES
North Quincy High
School (280 total)*
119 61 16 21 24 26 13 29-30: All curriculum
areas except Science, all
grades, CCP/H/Adv
Quincy High School
(332 total)
238 68 8 5 8 3 2 29-30: Gr. 12 Social
Studies (4); Spanish 1 CCP
TOTAL 357 129 24 26 32 29 15 612 total
Percentage 58.3% 21.1% 3.9% 4.2% 5.2% 4.7% 2.5%
UPDATED 10/13/202114
79.4% = 25 or fewer students
NQHS working on addressing larger
class sections by creating additional
sections for 2nd Term (begins 11/15)
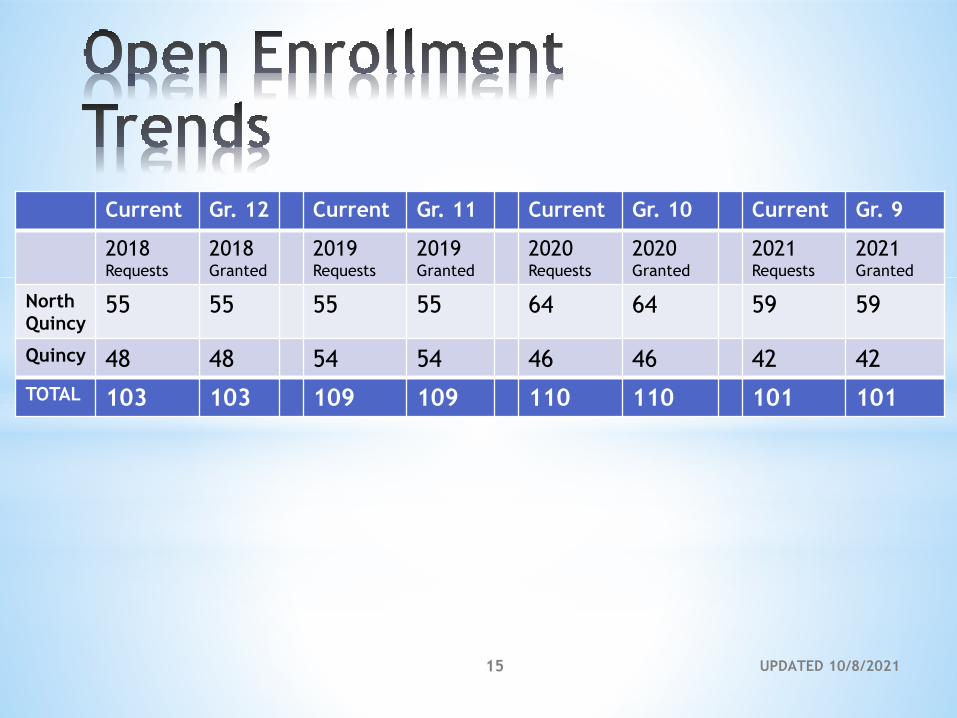
Current Gr. 12 Current Gr. 11 Current Gr. 10 Current Gr. 9
2018 Requests
2018Granted
2019 Requests
2019Granted
2020 Requests
2020Granted
2021 Requests
2021Granted
North
Quincy55 55 55 55 64 64 59 59
Quincy 48 48 54 54 46 46 42 42
TOTAL 103 103 109 109 110 110 101 101
UPDATED 10/8/202115